GI1 – General sessions on geoscience instrumentation
EGU22-1625 | Presentations | GI1.1
A stand-alone, modular Sensorbox to exploit the potential of automotive lidar for geoscientific applicationsStefan Muckenhuber, Birgit Schlager, Thomas Gölles, Tobias Hammer, Christian Bauer, Victor Exposito Jimenez, Wolfgang Schöner, Markus Schratter, Benjamin Schrei, and Kim Senger
Today, the automotive industry is a leading technology driver for lidar systems, because the largest challenge for achieving the next level of vehicle automation is to improve the reliability of the vehicles’ perception system. High costs of mechanically spinning lidars are still a limiting factor, but prices have already dropped significantly during the last decade and are expected to drop by another order of magnitude in the upcoming years thanks to new technologies like micro-electro-mechanical systems (MEMS) based mirrors, optical phased arrays, and vertical-cavity surface-emitting laser (VCSEL) sources. To exploit the potential of these newly emerging cost-effective technologies for geoscientific applications, we developed a novel stand-alone, modular Sensorbox that allows the use of automotive lidar sensors without the necessity of a complete vehicle setup. The novel Sensorbox includes a real-time kinematic differential global positioning system (RTK DGPS) and an inertial measurement unit (IMU) for georeferenced positioning and orientation. This setup enables measuring geoscientific processes and landforms reliably, at any remote location, with very high spatial and temporal resolution, and at relatively low costs. The current setup of the Sensorbox has a 360° field of view with 45° vertical angle, a range of 120m, a spatial resolution of a few cm and a temporal resolution of 20Hz. Compared to terrestrial laser scanners (TLS), such as the Riegl VZ-6000, automotive lidar sensors provide advantages in terms of size (40cm vs. 10cm), weight (20kg vs. 1kg), price (150k€ vs. 10k€), robustness (IP64 vs. IP68), acquisition time/frame rate (1h vs. 20Hz) and eye safety (class 3 vs. class 1). They can therefore provide a very useful complement to currently used TLS systems that have their strengths in range (6000m vs. 100m) and accuracy (1cm vs 5cm) performance. Automotive lidar sensors record high-resolution point clouds with very high acquisition frequencies, resulting in a data stream with order 10^6 points per second. To efficiently work with such large point cloud datasets, the open-source python package ‘pointcloudset’ was developed for handling, analysing, and visualizing large datasets that consists of multiple point clouds recorded over time.
How to cite: Muckenhuber, S., Schlager, B., Gölles, T., Hammer, T., Bauer, C., Exposito Jimenez, V., Schöner, W., Schratter, M., Schrei, B., and Senger, K.: A stand-alone, modular Sensorbox to exploit the potential of automotive lidar for geoscientific applications, EGU General Assembly 2022, Vienna, Austria, 23–27 May 2022, EGU22-1625, https://doi.org/10.5194/egusphere-egu22-1625, 2022.
EGU22-2035 | Presentations | GI1.1
Topographic and photogrametric techniques applied to the study of the morphology of ravines in Campana city, Buenos Aires, ArgentinaLeandro Serraiocco, Diego Barbero, Melina Santomauro, Sandra Peyrot, and Andrea Maroni
Abstract
The comprehensive study of the stability of ravines includes various aspects to be considered. One of them, interesting in this case, is the characterization of the morphology of the slopes, which due to their high inclination, presence of vegetation and irregularity in the surface, making it difficult to achieve this objective.
In the present study, we proceeded to study a ravine, located on the right bank of the Paraná de las Palmas river, in the town of Campana, northeast of the province of Buenos Aires. This work was focused on the surroundings of the coordinates 39º9'30.40 ”S 58º57'14.60” where lays a slope with structural conditions of interest. The morphology of the ravine in this area was studied in order to obtain a more precise assessment of the exposed surface and therefore a correct geometric and mass estimation of the slope.
For this propuse, an analysis of elevation models obtained from topographic surveys carried out with Drone and Total Station and, georeferenced with GPS equipment along the slope, was carried out. From there, the reliability of the applied methods and the results obtained could be evaluated comparatively.
All this information was complemented with a photographic record and available information on the environment to achieve a complete evaluation of the condition of the ravine in this area.
The importance of this work lies in the possibility of testing different methods and contrasting the results obtained using topographic and photogrammetric equipment and a combination of them. This will allow the characterization of slopes to be scaled over larger portions considering that this is part of a larger study along the Paraná river ravine. The greater reliability in the morphological results obtained is considered to be of significant utility for estimating the stability of the slopes, an aspect of interest to evaluate the geological danger and evaluate different engineering solutions.
Key Words: Ravine, Slope, Río Paraná, Argentina, Geological Risk, Drone.
How to cite: Serraiocco, L., Barbero, D., Santomauro, M., Peyrot, S., and Maroni, A.: Topographic and photogrametric techniques applied to the study of the morphology of ravines in Campana city, Buenos Aires, Argentina, EGU General Assembly 2022, Vienna, Austria, 23–27 May 2022, EGU22-2035, https://doi.org/10.5194/egusphere-egu22-2035, 2022.
EGU22-4278 | Presentations | GI1.1
Performances of express mode vs standard mode for d18O, dD and 17O-excess with a Picarro analyzerAmaelle Landais, Benedicte Minster, Alexandra Zuhr, Magdalena Hoffmann, and Elise Fourré
The recent development of optical spectroscopy enabled the development of the use of water isotopes in climate, environment and hydrological studies. An increasing number of studies also includes the most recent parameter 17O-excess as an indicator for kinetic fractionation effects in the water cycle. However, for some applications such as ice core science, the 17O-excess signal to be measured is very small, of the order of 10 – 20 ppm and it is a big analytical challenge to obtain the requested precision.
Here, we present results of performance of the new express mode and the standard mode developed for d18O, dD and now also 17O-excess for a Picarro analyzer. In the standard mode, there is a new injection of water vapor lasting 4.5 minutes every 10 minutes. To get rid of memory effect, the first injections are discarded or a correction is applied which depends on the difference in water isotopic composition between the measured sample and the previous one. For each new sample measured with the express mode, the sequence begins with 6 injections of water vapor in the cavity of 40 secondes each to get rid of the memory effect. It is followed by injections of water vapor lasting 2 minutes every 4 minutes. The advantage of the express mode is to avoid the memory correction and to decrease the measurement time. It thus permits to run more replicates which is important to improve the accuracy of the measurements, especially 17O-excess. We present here results of several series of samples and standards of different water isotopic composition (d18O ranging from -54 to 0 ‰) ran three times with both the standard and the express modes and compare the performances of the two modes.
How to cite: Landais, A., Minster, B., Zuhr, A., Hoffmann, M., and Fourré, E.: Performances of express mode vs standard mode for d18O, dD and 17O-excess with a Picarro analyzer, EGU General Assembly 2022, Vienna, Austria, 23–27 May 2022, EGU22-4278, https://doi.org/10.5194/egusphere-egu22-4278, 2022.
EGU22-7123 | Presentations | GI1.1
SIOS’s Earth observation and remote sensing activities toward building an efficient regional observing system in SvalbardAnn Mari Fjæraa, Shridhar D. Jawak, William Harcourt, Sara Aparício, Veijo Pohjola, Bo Andersen, Christiane Hübner, Inger Jennings, Ilkka Matero, Øystein Godøy, and Heikki Lihavainen
This study provides an overview of the Earth observation and remote sensing activities of Svalbard Integrated Arctic Earth Observing System (SIOS) undertaken when building an observing system for sustained measurements in and around Svalbard to address Earth System Science (ESS) questions. SIOS research infrastructures are distributed across and around Svalbard for acquiring long-term in situ observations. These in situ measurements are not only useful for various ground-based studies, but also applicable for calibration and validation (Cal/Val) of current and future satellite missions e.g. Copernicus Imaging Microwave Radiometer (CIMR), Radar Observing System for Europe - L-Band (ROSE-L ) or Sentinel-1,2, Copernicus Polar Ice and Snow Topography Altimeter (CRISTAL), Sentinel-5 Precursor, and Copernicus Hyperspectral Imaging Mission for Environment (CHIME). Better integration of in situ and satellite-based measurements is crucial for building a coherent network of observations to fill observational gaps. Additionally. complementing in situ measurements with satellite data is a prime necessity to generate operational reliable geoinformation products using traditional and advanced methods, for example, mapping vegetation extent in Svalbard using Sentinel-2 data complemented with in situ measurements of spectral reflectance collected by SIOS infrastructure. SIOS’s remote sensing activities are developed in SIOS knowledge centre (SIOS-KC) under the direction of the remote sensing working group (RSWG). This study highlights our current activities, goals for the next five years (2022-2026) and future activities with the intention of attracting potential collaborations to support achieving these goals. The study discusses SIOS’s present activities, including (1) capacity building e.g., webinar series, online conference, and training courses on EO and RS studies in Svalbard to train the next generation of polar scientists, (2) infrastructure development (like the current infrastructure investment programme SIOS-InfraNor) that can attract Cal/Val activities to Svalbard (3) SIOS’s airborne remote sensing activities, and (4) SIOS remote sensing service tools for field scientists. Ongoing and future activities include (1) the development of unified platform for satellite data availability for Svalbard, (2) establishing an EO and RS researcher’s forum on SIOS website, (3) community-based observations e.g. developing a citizen science project model for supporting satellite cal/val activities in Svalbard, (4) ongoing surveys on user requirements, product inventory and citizen science project, and (5) the ‘Satellite image of the week campaign’ on social media for outreach. The sustained and coordinated efforts by SIOS to develop a long-term monitoring system are expected to contribute to integrated monitoring, modelling and supporting decision making in Svalbard in the coming decades.
How to cite: Fjæraa, A. M., Jawak, S. D., Harcourt, W., Aparício, S., Pohjola, V., Andersen, B., Hübner, C., Jennings, I., Matero, I., Godøy, Ø., and Lihavainen, H.: SIOS’s Earth observation and remote sensing activities toward building an efficient regional observing system in Svalbard, EGU General Assembly 2022, Vienna, Austria, 23–27 May 2022, EGU22-7123, https://doi.org/10.5194/egusphere-egu22-7123, 2022.
Please decide on your access
Please use the buttons below to download the presentation materials or to visit the external website where the presentation is linked. Regarding the external link, please note that Copernicus Meetings cannot accept any liability for the content and the website you will visit.
Forward to presentation link
You are going to open an external link to the presentation as indicated by the authors. Copernicus Meetings cannot accept any liability for the content and the website you will visit.
We are sorry, but presentations are only available for users who registered for the conference. Thank you.
EGU22-7588 | Presentations | GI1.1
The low-power, user-configurable, digital broadband seismometer, analogue iteration: Güralp CertisSally Mohr, Will Reis, Rui Barbara, Marcella Cilia, Neil Watkiss, and Phil Hill
Seismic monitoring systems are continuously reducing in size and power consumption to facilitate larger scale and more remote experiments.
Güralp have been leading the way to develop a portable, user-friendly broadband seismometer that is robust, omnidirectional in its operation and maintains excellent low-noise performance. The Certimus, released in 2020, incorporates this omnidirectional sensor technology with the Minimus digitizer to provide a proven broadband station. Now, the analogue sensor component has been packaged into a robust and compact stainless-steel housing that is suitable for post-hole and surface deployments, known as the Certis.
Certis enables users to deploy in dynamic environments, without the need for cement bases or precise levelling, as the sensor will automatically adjust to tilt up to +/- 90 degrees. Due to its small size, low weight and low power consumption, Certis significantly reduces the logistical requirements for broadband posthole deployments. In addition, the lack of levelling required allows for Certis to be easily deployed down hole without the need to manually adjust the sensor’s orientation.
Certis has a wide frequency range of 120s to 100Hz with a remote, user-selectable long period corner. The Certis design is compatible with any commercially available broadband digitizer, however increased functionality is available with the Minimus digitizer, including access to advanced state-of-health parameters.
Güralp has developed a range of accompanying accessories that expand on the functionality of Certis and Certimus. The Portable Power Module offers a compact power solution that can power offline stations for up to 6 weeks. Due to portability of both Certis and Certimus, custom-designed backpacks and smart cases allow for users to easily transport multiple systems into the field. After installation of a buried Certimus, users can easily access data from the microSD card without disturbing the sensor using a Surface Storage Module in line with the GNSS receiver.
How to cite: Mohr, S., Reis, W., Barbara, R., Cilia, M., Watkiss, N., and Hill, P.: The low-power, user-configurable, digital broadband seismometer, analogue iteration: Güralp Certis, EGU General Assembly 2022, Vienna, Austria, 23–27 May 2022, EGU22-7588, https://doi.org/10.5194/egusphere-egu22-7588, 2022.
EGU22-9283 | Presentations | GI1.1
Performance assessment of the mobile G4301 Cavity Ring-Down Spectroscopy analyzer for atmospheric CO2, CH4 and H2O measurementsLuc Lienhardt, Olivier Laurent, and Magdalena E. G. Hofmann
Carbon dioxide (CO2) and methane (CH4) are the most important greenhouse gases, and there is an increasing need to measure these greenhouse gases with mobile measurement devices. Picarro’s G4301 Cavity Ring-Down Spectroscopy (CRDS) analyzer is a high-performance, light-weight, portable, battery-powered gas concentration analyzer that has enabled real-time measurements of CO2 and CH4 in challenging environments in the field of ecosystem [1]–[3], soil science [4] , glaciology [5], limnology [6] and indoor air quality [7]. Here we evaluate the performance of this portable greenhouse gas analyzer for atmospheric measurements, and discuss data obtained with this analyzer during balloon flights.
The performance of the G4301 analyzer was assessed at the Metrology Laboratory (MLab) that is part of the Atmospheric Thematic Center of ICOS. The MLab regularly tests greenhouse gas analyzers that are used within the European monitoring network ICOS (Integrated Carbon Observation System). We will present CO2 and CH4 performance data on the continuous measurement repeatability (CMR), the short-term repeatability (STR), the long-term repeatability (LTR), the ambient temperature sensitivity, the inlet pressure sensitivity, and the built-in water vapor correction. We will discuss these findings in light of measurement requirements for different atmospheric applications.
To assess the performance of the analyzer in mobile field measurements, the G4301 was deployed at several balloon flights over Paris.
References
[1] J. H. Matthes, A. K. Lang, F. V. Jevon, and S. J. Russell, “Tree stress and mortality from emerald ash borer does not systematically alter short-term soil carbon flux in a mixed northeastern U.S. forest,” Forests, vol. 9, no. 1, pp. 1–16, 2018.
[2] L. Kohl et al., “Technical note: Interferences of volatile organic compounds (VOCs) on methane concentration measurements,” Biogeosciences, vol. 16, no. 17, pp. 3319–3332, 2019.
[3] L. Jeffrey et al., “Are methane emissions from mangrove stems a cryptic carbon loss pathway? Insights from a catastrophic forest mortality,” no. June, 2019.
[4] L. L. Chai et al., “A methane sink in the Central American high elevation páramo: Topographic, soil moisture and vegetation effects,” Geoderma, vol. 362, no. April 2019, p. 114092, 2020.
[5] J. R. Christiansen and C. J. Jørgensen, “First observation of direct methane emission to the atmosphere from the subglacial domain of the Greenland Ice Sheet,” Sci. Rep., vol. 8, no. 1, p. 16623, Dec. 2018.
[6] J. A. Villa et al., “Methane and nitrous oxide porewater concentrations and surface fluxes of a regulated river,” Sci. Total Environ., vol. 715, p. 136920, 2020.
[7] Z. Merrin and P. W. Francisco, “Unburned Methane Emissions from Residential Natural Gas Appliances,” Environ. Sci. Technol., vol. 53, no. 9, pp. 5473–5482, May 2019.
How to cite: Lienhardt, L., Laurent, O., and E. G. Hofmann, M.: Performance assessment of the mobile G4301 Cavity Ring-Down Spectroscopy analyzer for atmospheric CO2, CH4 and H2O measurements, EGU General Assembly 2022, Vienna, Austria, 23–27 May 2022, EGU22-9283, https://doi.org/10.5194/egusphere-egu22-9283, 2022.
EGU22-9939 | Presentations | GI1.1
Integrated remote sensing technologies for multi-depth seabed and coastal cultural resources: the case of the submerged Roman site of Baia (Naples, Italy).Crescenzo Violante, Nicola Masini, and Nicodemo Abate
Among new technologies that enable representation of the submarine cultural landscapes, marine geophysical surveys provide fast and cost-effective tools now widely applied to the reconnaissance and management of underwater cultural and natural resources. In addition, passive and active sensors such as LiDAR and optical one mounted on Unmanned Aircraft Systems (UAS) represent very effective tools for coastal remote sensing applications that require high spatial resolutions. In this work we use ultra-high resolution acoustic and LiDAR-derived data to characterize and map the marine and coastal area in the Baia archeological site (Naples, Italy). This area belongs to the Campi Flegrei volcanic field, which is affected by vertical ground movement called “Bradyseism” that strongly influenced the morphology of the coast over the last 2 Ka. As a consequence, Roman artifacts and structures dating from 1st Century BC to 4st Century AC, including Villas, luxury buildings and landing ports are now below the sea water surface, and partly buried within the marine sediments. Marine geophysical investigations included ultra-high resolution swath-bathymetry and parametric sub-bottom profiler surveys that allowed to characterize and map cultural and natural resources at seabed and in the shallow subseafloor. At same time optical (both visible and multispectral) images and LiDAR-derived elevation provided detailed information of the archaeological features and their natural setting along the adjacent coast. The main aim of this approach was to implement non-destructive geophysical methods for investigating and reconstruct the interrelationships between cultural and natural heritage at sea-land interface in the Baia archeological site. Such approach is now crucial for the evaluation of future trends induced by climate change and for a number of policy and management issues.
References
Masini N., Soldovieri F. (Eds) (2017). Sensing the Past. From artifact to historical site. Series: Geotechnologies and the Environment, Vol. 16. Springer International Publishing, ISBN: 978-3-319-50516-9, doi: 10.1007/978-3-319-50518-3, pp. 575
Violante C., Gallocchio E., Pagano F. (2022) Marine archaeological investigation in the submerged Roman site of Baiae using parametric sub-bottom profiler system. Phlegrean Fields Archaeological Park (Naples, Italy). Proceedings of the 2021 IEEE International Conference on Metrology for Archaeology and Cultural Heritage. Journal of Physics Conference Series, in press.
Violante C. (2020) Acoustic remote sensing for seabed archaeology. Proceedings of the International Conference on Metrology for Archaeology and Cultural Heritage. Trento, Italy, October 22-24, 2020, 21-26. ISBN: 978-92-990084-9-2.
Violante C., (2018) A geophysical approach to the fruition and protection of underwater cultural landscapes. Examples from the Bay of Napoli, southern Italy. In: Aveta, A., Marino, B.G., Amore R. (eds.), La Baia di Napoli. Strategie per la conservazione e la fruizione del paesaggio culturale. V. 1, 66-70. Artstudiopaparo, ISBN: 978-88-99130.
How to cite: Violante, C., Masini, N., and Abate, N.: Integrated remote sensing technologies for multi-depth seabed and coastal cultural resources: the case of the submerged Roman site of Baia (Naples, Italy)., EGU General Assembly 2022, Vienna, Austria, 23–27 May 2022, EGU22-9939, https://doi.org/10.5194/egusphere-egu22-9939, 2022.
EGU22-11398 | Presentations | GI1.1
Insights on the tectonic styles across Estonia using satellite potential fields derived from WGM-2012 gravity data and EMAG2 magnetic data.Juan David Solano Acosta, Rutt Hints, and Alvar Soesoo
The nature of the Estonian crust was studied using global topography, magnetic data, and gravity data to estimate its tectonic regime. The Estonian Precambrian crystalline basement, composed of Paleo- to MesoProterozoic metamorphic and igneous rocks, is covered by a Paleozoic sedimentary rock deposit 100–780 m thick. To visualize crustal sources of the Estonian basement, we employed spectrum analysis of magnetic and gravity data, as well as two-dimensional (2D) forward modeling of gravity data. The gravimetric data was also evaluated to identify the depth of the Moho and Conrad discontinuities in Estonia. The magnetic data has also been evaluated to calculate the Curie point depth, which was then utilized to predict heat flow values inside the research zone. The subsurface of Estonia is divided into six petrological-structural zones: Tallinn, Alutaguse, Johvi, West-Estonian, Tapa and South-Estonian. To assess the structural variations of the crust at these locations, profiles of topographic, gravity, magnetic and heat flow data were constructed in each of the petrological-structural zones. The spectrum analysis and 2D gravity forward models yielded residual and regional gravity anomaly maps that show a significant amplitude potential maximum across the precambrian Rapakivi granitoid plutons and the Paldiski-Pskov tectonic zone. The Curie point depth reveals values ranging from 7 to 26 km, whereas the Moho depth suggests values ranging from 48 to 72 km and the Conrad depth values ranging from 14 to 20 km.
How to cite: Solano Acosta, J. D., Hints, R., and Soesoo, A.: Insights on the tectonic styles across Estonia using satellite potential fields derived from WGM-2012 gravity data and EMAG2 magnetic data., EGU General Assembly 2022, Vienna, Austria, 23–27 May 2022, EGU22-11398, https://doi.org/10.5194/egusphere-egu22-11398, 2022.
Please decide on your access
Please use the buttons below to download the presentation materials or to visit the external website where the presentation is linked. Regarding the external link, please note that Copernicus Meetings cannot accept any liability for the content and the website you will visit.
Forward to presentation link
You are going to open an external link to the presentation as indicated by the authors. Copernicus Meetings cannot accept any liability for the content and the website you will visit.
We are sorry, but presentations are only available for users who registered for the conference. Thank you.
EGU22-12392 | Presentations | GI1.1
Semi-automatic production of highly detailed cave maps from LiDAR point cloudsMichaela Nováková, Jozef Šupinský, Ján Kaňuk, and Michal Gallay
Remote sensing technology based on laser scanning (LiDAR) has found a wide range of applications in cave mapping for a high degree of accuracy, level of detail, and time efficiency of this method. Besides the multidisciplinary research, the acquired data representing the cave morphology in a form of a dense point cloud became an essential part of the exploration for understanding the cave speleogenesis alongside capturing the current state that is of great importance in natural and cultural heritage documentation. Traditional cave cartography can benefit from using the LiDAR point clouds by a highly detailed 3D cave model enabling the creation of contours, shaded relief, or geomorphometric parameters, and a practically unlimited number of cross-sections. Compared to the passive remote sensing methods, such as photogrammetry, limited by the light conditions and cave dimensions, laser scanning is an active light-independent method that records additional attributes for each captured point in addition to its 3D coordinates. The recorded intensity of the backscattered laser pulse is very applicable for mapping purposes as it reveals spectral properties of the surface material bringing new aspects not only for the point cloud visualization but also for material differentiation, identification, and spatial localization of the cave paintings. The presented study introduces innovation in the methodology of creating a high-detail cave map from the acquired LiDAR data by combining derived cave floor model and semi-automatic procedure for identification of surface type based on the geomorphometric analysis and recorded intensity. The main benefit of the proposed approach is in the reduction of the author´s subjectivity and cave geometry generalization. By further automatization of this process, maps for large cave systems can be produced in a high level of detail.
How to cite: Nováková, M., Šupinský, J., Kaňuk, J., and Gallay, M.: Semi-automatic production of highly detailed cave maps from LiDAR point clouds, EGU General Assembly 2022, Vienna, Austria, 23–27 May 2022, EGU22-12392, https://doi.org/10.5194/egusphere-egu22-12392, 2022.
EGU22-13132 | Presentations | GI1.1
New development of a small customizable system for the measurement of volcanic gas concentrations with LTE data transferKonradin Weber, Christian Fischer, and Detlef Amend
Volcanic areas frequently have diffuse gas emission of CO2, SO2, H2S and even more. Normally these diffuse emissions do not vary only by time but also with location. Therefore, the spatial variation of concentrations cannot be monitored with one measurement system alone. On the other hand, the strength of gaseous volcanic emissions is often correlated with volcanic activity and can potentially endanger population in the vicinity.
For this reason, we developed a light new low-cost unit for the parallel measurement of various gases like CO2, SO2 and H2S, which has the remarkable advantage of being able to transmit the measured data and GPS position with LTE to a remote server. Moreover, it can operate in an unattended way for days or even weeks, depending on the customizable operation modus of the unit and the capacity of the attached rechargeable battery. A solar-powered version is currently in development. The evaluation of the received data can be performed online on the server and the results are displayed continuously. The software is programmed by us in a way that alarms can be started in case that concentrations exceed predefined alarm thresholds also via email.
The electronic hardware unit is designed in a way that it can be equipped with low-cost NDIR sensors, electrochemical sensors or photoacoustic sensors (e.g. for CO2: Sensirion SCD41). There are 4 analog ports (selectable voltage or current).
The operation procedure of the sensors electronics is customizable as well: The operation can be changed from continuous running to following mode:
- Measurement period,
- low power sleep period,
- sensor warm up-period,
- measurement period etc.
The length of all these time periods of the operation procedure can be varied depending on the measurement needs. That means for long runtime of the measurement a long sleeping time between the measurement periods can be chosen. On the other hand, if low power consumption and long runtime are not necessary, short sleeping periods or even the continuous running mode can be chosen. The operation configuration, e.g. sleeping time, can be changed by remote firmware update.
How to cite: Weber, K., Fischer, C., and Amend, D.: New development of a small customizable system for the measurement of volcanic gas concentrations with LTE data transfer, EGU General Assembly 2022, Vienna, Austria, 23–27 May 2022, EGU22-13132, https://doi.org/10.5194/egusphere-egu22-13132, 2022.
Please decide on your access
Please use the buttons below to download the presentation materials or to visit the external website where the presentation is linked. Regarding the external link, please note that Copernicus Meetings cannot accept any liability for the content and the website you will visit.
Forward to presentation link
You are going to open an external link to the presentation as indicated by the authors. Copernicus Meetings cannot accept any liability for the content and the website you will visit.
We are sorry, but presentations are only available for users who registered for the conference. Thank you.
EGU22-1375 | Presentations | GI1.2
Evaluation of the influence of Structure-from-Motion software processing parameters on the quality of digital elevation models and orthomosaics in the context of earth surface dynamics.Szymon Śledź and Marek Ewertowski
The Structure-from-Motion (SfM) approach for developing digital elevation models and orthomosaics has been known and used in photogrammetry for several decades. Using appropriate algorithms, SfM software combines images taken from different angles and distances based on the characteristic points determined in each image. Years of practice and experience have allowed researchers to provide a solid description of the applicability and limitations of this method, but still the impact of input processing parameters in software on the quality of photogrammetric products has not been fully recognized. This study aimed to identify the most advantageous processing workflow to fill this research gap by testing 375 different setup variations in the Agisoft Metashape software for the same set of images acquired with an unmanned aerial vehicle in a proglacial area. The purpose of the experiment was to determine three workflows: 1) with the shortest calculations time; 2) as accurate as possible, regardless of the time taken for the calculations; 3) the optimum, which is a compromise between accuracy and computation time.
Each of the 375 processing setup variations was assessed based on final product accuracy, i.e., orthomosaics and digital elevation models. Three workflows were selected based on calculating the height differences between the digital elevation models and the control points that did not participate in their georeferencing. The analysis of root mean square errors (RMSE) and standard deviations indicate that excluding some of the optimization parameters during the camera optimization stage results in high RMSE and an increase in values of errors’ standard deviation. Furthermore, it has been shown that increasing the detail of individual processing steps in software does not always positively affect the accuracy of the resulting models. The experiment resulted in the development of three different workflows in the form of Python scripts for Agisoft Metashape software, which will help users to process image sets efficiently in the context of earth surface dynamics studies.
The research was funded by the National Science Center OPUS project number 2019/35/B/ST10/03928.
How to cite: Śledź, S. and Ewertowski, M.: Evaluation of the influence of Structure-from-Motion software processing parameters on the quality of digital elevation models and orthomosaics in the context of earth surface dynamics., EGU General Assembly 2022, Vienna, Austria, 23–27 May 2022, EGU22-1375, https://doi.org/10.5194/egusphere-egu22-1375, 2022.
EGU22-1610 | Presentations | GI1.2
Study on the Influence of Slope Shape on the Development of Ephemeral Gully Based on UAVHaiyu Wang, Guowei Pang, Chunmei Wang, Lei Wang, and Yongqing Long
In order to explore the influence of slope shape on the development of ephemeral gully, 225 ephemeral gullies were obtained by visual interpretation based on the unmanned aerial photography of Langerzigou in Jingbian County, Shaanxi Province. The number and length of ephemeral gullies, the distance from the gully head to the watershed and the gully density were calculated. The original slope DEM was obtained by interpolating the elevation points on the ephemeral gully watershed, and the DEM was used to extract the terrain curvature to describe the hillslope shape, and then analyze the relationship between the slope shape and the ephemeral gully index. The results showed that: (1) the DEM after the elevation point interpolation on the ephemeral gully watershed was used to synthesize the ephemeral gully, which can well describe the original slope topographic features before the development of the ephemeral gully. (2) From the point of view of single slope shape, the gully density of the transverse concave slope was the highest, and the number of ephemeral gullies, the average distance from the gully head to the watershed of the longitudinal concave slope were the largest. the average length of the ephemeral gully and the number of the longitudinal convex slope were the largest. From the point of view of the combined slope shape, the average length of the ephemeral gully and the average distance from the gully head to the watershed on the biconvex slope and the convex slope were larger than those on the biconvex slope and the concave-convex slope. The ephemeral gully length of double concave slope was significantly different from that of double convex slope and convex concave slope (P<0.05); The ephemeral gully length of concave convex slope was significantly different from that of double convex slope and convex concave slope (P<0.05); There was a significant difference in the distance from the trench head to the watershed between the concave convex slope and the concave convex slope (P<0.1). (3) The curvature distribution characteristics of different forms of slope shallow ditch development were analyzed.
How to cite: Wang, H., Pang, G., Wang, C., Wang, L., and Long, Y.: Study on the Influence of Slope Shape on the Development of Ephemeral Gully Based on UAV, EGU General Assembly 2022, Vienna, Austria, 23–27 May 2022, EGU22-1610, https://doi.org/10.5194/egusphere-egu22-1610, 2022.
EGU22-5278 | Presentations | GI1.2 | Highlight
Improvements of a low-cost CO2 commercial NDIR sensor for UAV atmospheric mapping applicationsYunsong Liu, Jean-Daniel Paris, Mihalis Vrekoussis, Panayiota Antoniou, Christos Constantinides, Maximilien Desservettaz, Christos Keleshis, Olivier Laurent, Andreas Leonidou, Carole Philippon, Panagiotis Vouterakos, Pierre-Yves Quéhé, Philippe Bousquet, and Jean Sciare
Unmanned Aerial Vehicles (UAVs) have provided a cost-effective way to fill in gaps between in-situ (ground-based) and remote-sensing observations. In this study, a lightweight CO2 sensor system suitable for operations on board small UAVs has been developed and validated. The CO2 system autonomously performs in situ measurements, allowing for its integration into various platforms. It is based on a low-cost commercial nondispersive near-infrared (NDIR) CO2 sensor (Senseair AB, Sweden), with a total weight of 1058 g, including batteries. A series of accuracy and linearity tests showed that the precision is within ±1 ppm for 1σ at 1 Hz. Variability due to temperature and pressure changes was derived from environmental chamber experiments. Additionally, the system has been validated onboard a manned aircraft against a reference instrument (Picarro, USA), revealing an accuracy of ±2 ppm (1σ) at 1 Hz and ±1 ppm (1σ) at 1 min (0.02 Hz). Integration on a quad-copter led to improvements in the calibration strategy for practical applications. The developed system has been deployed in an intensive flight campaign (a total of 16 flights per day), with horizontal flights performed at a low altitude (100 m AGL). The designed system highlights the capacity to detect CO2 concentration changes at 1 Hz and spatial gradients and to provide accurate plume dispersion maps. It proved to be a good complementary measurement tool to the ground-based co-located observations performed by the Picarro G2401. This study gives a practical example of the process to be followed for the integration of a lightweight atmospheric sensor into a mobile (UAV) platform. Details of the measurement system and field implementations are described in this study to support future UAV platform applications for atmospheric trace gas measurements and closing the gaps in the monitoring of the current carbon cycle.
How to cite: Liu, Y., Paris, J.-D., Vrekoussis, M., Antoniou, P., Constantinides, C., Desservettaz, M., Keleshis, C., Laurent, O., Leonidou, A., Philippon, C., Vouterakos, P., Quéhé, P.-Y., Bousquet, P., and Sciare, J.: Improvements of a low-cost CO2 commercial NDIR sensor for UAV atmospheric mapping applications, EGU General Assembly 2022, Vienna, Austria, 23–27 May 2022, EGU22-5278, https://doi.org/10.5194/egusphere-egu22-5278, 2022.
EGU22-5354 | Presentations | GI1.2
Chemical characterization of volcanic plumes with multifunction UAVs and extra-lightweight drones: Concepts and first applicationsNiklas Karbach, Bastien Geil, Xochilt Gutiérrez, Peter Hoor, Anselm Dötterl, Nicole Bobrowski, and Thorsten Hoffmann
Investigating the chemical composition of volcanic plumes is an important method for obtaining geochemical information of volcanic systems, determining the environmental impact of volcanic outgassing and providing indications of impending activity of the volcano under investigation. However, sampling is not easy, particularly because of immediate meteorological influences on volcanic plume dispersion, but also, of course, because of potential hazards associated with sampling immediately at the rim of volcanic craters.
When remote sensing methods are not available, UAVs offer the possibility of bringing measurement systems to the scene. Standard parameters that are commonly measured are SO2 and CO2, as well as a number of atmospheric state parameters such as pressure, temperature, and relative humidity. In flight data transmission via radio telemetry plays a significant role, as of course both orography and current meteorology make it otherwise difficult to locate the volcanic plume from several kilometers away. In addition to key components such as SO2, CO2, and water, there are also a number of other components of interest to geoscientists, such as H2S, CO, H2, and halogen compounds. Larger drones, such as the DJI Matrice M210 or the DJI M300, can be used to fly those research based measurement systems in parallel. This allows for the chemical characterization of highly transient plume structures simultaneously at two locations or at large distances from the source including the free troposphere. Results of such measurements carried out at Mt Etna and Vulcano Island, Italy during the last two years are presented in this contribution. Larger drone systems (with the DJI Matrice M210, DJI M300) have the disadvantage that they have a comparatively high weight and therefore make it difficult to bring to the sampling site which might not be accessible by car. Smaller drones like the DJI Mavic 3 significantly reduce the weight one has to carry. In addition, the relatively high cost of the larger drone systems prevents their use for daily monitoring tasks. Therefore, we have equipped a comparatively small drone (DJI Mavic 3) with suitable radio telemetry and sensors to gather basic chemical information in volcanic plumes with an extra-lightweight system. We will introduce this new miniaturized instrumentation and present first results of measurements with the new setup.
How to cite: Karbach, N., Geil, B., Gutiérrez, X., Hoor, P., Dötterl, A., Bobrowski, N., and Hoffmann, T.: Chemical characterization of volcanic plumes with multifunction UAVs and extra-lightweight drones: Concepts and first applications, EGU General Assembly 2022, Vienna, Austria, 23–27 May 2022, EGU22-5354, https://doi.org/10.5194/egusphere-egu22-5354, 2022.
EGU22-5661 | Presentations | GI1.2
Estimating canopy and stand structure in hybrid poplar plantations from multispectral UAV imageryElio Romano, Massimo Brambilla, Carlo Bisaglia, Francesca Giannetti, Clara Tattoni, Nicola Puletti, and Francesco Chianucci
Accurate estimates of canopy cover (CC),tree and stand structure are required to manage poplar plantations effectively. However, traditional measurements are limited by the cost and time-consuming nature of field methods, which inherently have limited the large scale adoption of in situ approaches. Satellite remote sensing has the advantage of broader geographical coverage, but its spatial and temporal resolution is often not suited for tree- to stand-scale applications as required in precision plantation forestry. Recently, unmanned aerial vehicles (UAVs) have become very popular in forestry. In this contribution, we tested the use of UAVs for retrieving plot-level canopy and stand attributes in hybrid poplar plantations, which were sampled in Northern Italy. A multispectral camera sensor was equipped to a multi-rotor UAV, and was used to acquire orthorectified images of 50 poplar plantations, each 0.25 ha in size, with varying age and plant density. In addition, field optical measurements of canopy structure made by digital cover photography and mensurational attributes derived from tree inventory were also performed and used as ground truth data.
The very high resolution of UAV imagery (<10 cm) allowed to efficiently perform a Simple Linear Iterative Clustering (SLIC) algorithm for superpixels generation, which was used to delineate individual poplar crowns automatically. The segmented images were then processed using Gray-Level Co-occurrence Matrices (GLCM) to calculate specific texture attributes, which were benchmarked against ground truth measurements.
Results indicated that multispectral UAVs can estimate canopy and stand structure attributes in poplar plantations reliably and accurately. Based on model performance indicators, the best model is that relating stand features to image dissimilarity. Its RMSE is in line with the standard deviations of the observed values, meaning that the error associated with the prediction is in line with the uncertainty of the calibration dataset.
The basal area, the volume of the trunk and the crown volume were the most correlated attributes with image dissimilarity valued from GLCM.By contrast, crown cover (CC) and leaf area index (LAI) were the model's attributes that could fit the worse following the clustering effect of plants’ age and the leverage occurring in some stands that results in ground truth data overestimation.
We concluded that use of UAVs can be considered an efficient tool in poplar plantation forestry. Considering the multi-scale nature of poplar plantation interventions, UAVs are particularly relevant as they can bridge between field and satellite measurements. Regarding the latter, the high resolution of UAV imagery also allows calibrating metrics from coarser scale satellite products, avoiding or reducing the need for field calibration efforts.
How to cite: Romano, E., Brambilla, M., Bisaglia, C., Giannetti, F., Tattoni, C., Puletti, N., and Chianucci, F.: Estimating canopy and stand structure in hybrid poplar plantations from multispectral UAV imagery, EGU General Assembly 2022, Vienna, Austria, 23–27 May 2022, EGU22-5661, https://doi.org/10.5194/egusphere-egu22-5661, 2022.
EGU22-10511 | Presentations | GI1.2 | Highlight
UAV-based precision mapping techniques for disease and pest identificationAbraham Mejia-Aguilar, Dana Barthel, Ekaterina Chuprikova, Ben Alexander McLeod, Massimiliano Trenti, Christine Kerschbamer, Ulrich Prechsl, and Katrin Janik
Mountain agriculture is a vital social-economic activity in Europe, including the alpine Province of South Tyrol, Italy. Here, apple orchards and vineyards are extensively cultivated. Besides the difficulty to cultivate in mountain terrain (steep slopes, difficult accessibility, extreme weather conditions), the plants are exposed to a combination of biotic and abiotic stresses that can result in diseases caused by pathogens. It results in the loss of the yield and quality of products, economic losses, reducing food security with severe ecological impacts, and affects many ecosystem services (such as agrotourism).
This work presents a proximal sensing technique based on an unmanned aerial platform with a payload consisting of multi and hyperspectral optical cameras. Such platforms are suitable to access rugged terrains in a short time to map the presence of diseases and pests, as well they provide imagery for the optimal management of farms. We study three different experiments: apple orchard, vineyard, and forestry, observing Apple proliferation, Flavescence dorée, and Pine processionary, respectively. We aim at a non-invasive and non-destructive method to monitor plant diseases in the direction of high-precision mapping agriculture applications by exploring supervised classification methods based on ground data to distinguish healthy and unhealthy trees.
How to cite: Mejia-Aguilar, A., Barthel, D., Chuprikova, E., McLeod, B. A., Trenti, M., Kerschbamer, C., Prechsl, U., and Janik, K.: UAV-based precision mapping techniques for disease and pest identification, EGU General Assembly 2022, Vienna, Austria, 23–27 May 2022, EGU22-10511, https://doi.org/10.5194/egusphere-egu22-10511, 2022.
Please decide on your access
Please use the buttons below to download the presentation materials or to visit the external website where the presentation is linked. Regarding the external link, please note that Copernicus Meetings cannot accept any liability for the content and the website you will visit.
Forward to presentation link
You are going to open an external link to the presentation as indicated by the authors. Copernicus Meetings cannot accept any liability for the content and the website you will visit.
We are sorry, but presentations are only available for users who registered for the conference. Thank you.
EGU22-11912 | Presentations | GI1.2
Discovery and characterization of environmental hazards by means of dynamic coordination of drones driven by satellite detection mapsLuca Cicala, Donato Amitrano, Angelino Cesario Vincenzo, Francesco Gargiulo, Gabriella Gigante, Francesco Nebula, Roberto Palumbo, Sara Parrilli, Domenico Pascarella, and Francesco Tufano
In some environmental applications, satellite acquisitions could not be able to provide all the information necessary to characterize the problem at hand due, for example, to limited spatial resolution or inadequate revisit time. However, in these cases, they can be used for preliminary investigation of the area of interest with the purpose to guide subsequent acquisitions with higher spatial resolution made by means of aerial sensing. This work presents an innovative application combining both satellite acquisitions and aerial close-range sensing implemented via drones in autonomous and coordinated flight. The case study concerns the discovery of illegal micro-dumps and other environmental hazards in Campania Region (Italy). The envisioned workflow includes the detection of target environmental criticalities in very high-resolution optical satellite images and a methodology to plan and adaptively re-plan a survey mission of a team of drones aimed at confirming the presence of a micro-dump and at its characterization. The processing of satellite images is validated on real data in a significative application context, while the performance of the acquisition strategy performed by the drone team are characterized trough simulations on a pre-analysed geographical area.
How to cite: Cicala, L., Amitrano, D., Cesario Vincenzo, A., Gargiulo, F., Gigante, G., Nebula, F., Palumbo, R., Parrilli, S., Pascarella, D., and Tufano, F.: Discovery and characterization of environmental hazards by means of dynamic coordination of drones driven by satellite detection maps, EGU General Assembly 2022, Vienna, Austria, 23–27 May 2022, EGU22-11912, https://doi.org/10.5194/egusphere-egu22-11912, 2022.
EGU22-12130 | Presentations | GI1.2
Concept for open-path gas measurements between a drone and a base stationTim Dunker, Asbjørn Berge, Karl H. Haugholt, Richard J. D. Moore, and Håvard Tørring
We present a platform for open-path tunable diode laser absorption spectroscopy between a drone and a base station. This is a step towards an open-path measurement between two collaborating drones, which to our knowledge has not yet been achieved. Such a system enables mapping of remote (permafrost tundra, e.g.) or hazardous areas (landfills, e.g.) and localization of emissions. We use a commercially available quad-copter drone that carries a reflector and a LED for being tracked. The base station consists of a self-made pan-tilt unit that carries a camera to track the drone, and the optical measurement system. The base station is controlled through a field--programmable gate array. We decided to built the base station ourselves to ensure a fast response, enabling tracking of the drone. To demonstrate the concept, our tunable diode laser absorption setup is tailored towards the detection of ammonia (NH3) because of its fairly strong absorption, and thus comparatively easy detectability. The distributed feedback laser operates at a centre wavelength of 1512 nm, with a bandwidth of approximately 2 nm (full width at half maximum), and a typical output power of 10 mW. We characterize the stability of the drone, the reflector, and the laser system. We aim to further develop this concept such that it (a) can be implemented on two collaborating drones, without the need for a base station, and (b) to measure other greenhouse gases or pollutants, such as methane or hydrogen sulphide.
How to cite: Dunker, T., Berge, A., Haugholt, K. H., Moore, R. J. D., and Tørring, H.: Concept for open-path gas measurements between a drone and a base station, EGU General Assembly 2022, Vienna, Austria, 23–27 May 2022, EGU22-12130, https://doi.org/10.5194/egusphere-egu22-12130, 2022.
EGU22-753 | Presentations | CR2.9
3D sequential data assimilation in Elmer/Ice with StokesSamuel Cook and Fabien Gillet-Chaulet
Providing suitable initial states is a long-standing problem in numerical modelling of glaciers and ice sheets, as well as in other areas of the geosciences, due to the frequent lack of observations. This is particularly acute in glaciology, where important parameters such as the underlying bed may be only very sparsely observed or even completely unobserved. Glaciological models also often require lengthy relaxation periods to dissipate incompatibilities between input datasets gathered over different timeframes, which may lead to the modelled initial state diverging significantly from the real state of the glacier, with consequent effects on the accuracy of the simulation. Sequential data assimilation using an ensemble offers one possibility for resolving both these issues: by running the model over a period for which various observational datasets are available and loading observations into the model at the time they were gathered, the model state can be brought into good agreement with the real glacier state at the end of the observational window. The mean values of the ensemble for unknown parameters, such as the bed, then also represent best guesses for the true parameter values. This assimilated model state can then be used to initialise prognostic runs without introducing model artefacts or a distorted picture of the actual glacier.
In this study, we present a framework for conducting sequential data assimilation and retrieving the bed of a glacier in a 3D setting of the open-source, finite-element glacier flow model, Elmer/Ice, and solving the Stokes equations rather than using the shallow shelf approximation. Assimilation is undertaken using the open-source PDAF library developed at the Alfred Wegener Institute. We demonstrate that the set-up allows us to accurately retrieve the bed of a synthetic glacier and present our plans to extend it to a real-world example.
How to cite: Cook, S. and Gillet-Chaulet, F.: 3D sequential data assimilation in Elmer/Ice with Stokes, EGU General Assembly 2022, Vienna, Austria, 23–27 May 2022, EGU22-753, https://doi.org/10.5194/egusphere-egu22-753, 2022.
EGU22-896 | Presentations | CR2.9
Uncertainty quantification for melt rate parameters in ice shelves using simulation-based inferenceGuy Moss, Vjeran Višnjević, Cornelius Schröder, Jakob Macke, and Reinhard Drews
Mass loss from the Antarctic ice sheet is dominated by the integrity of the ice shelves that buttress it. The evolution and stability of ice shelves is dependent on a variety of parameters that cannot be directly observed, such as basal melt and ice rheology. Constraining these parameters is of great importance in making predictions of the future changes in ice shelves that have a quantifiable uncertainty. This inference task is difficult in practice as the number of unknown parameters is large, observations are often sparse, and the computational cost of ice flow models is high.
We aim to develop a framework for inferring joint distributions of mass balance and rheological parameters of ice shelves from observations such as ice geometry, surface velocities, and radar isochrones. Here, we begin by inferring a posterior distribution over basal melt parameters in along-flow sections of synthetic and real world ice shelves (Roi Baudouin). We use the technique of simulation-based inference (SBI), a machine learning framework for performing Bayesian inference when the likelihood function is intractable. The inference procedure relies on the availability of a simulator to model the dynamics of the ice shelves. For this we use the Shallow Shelf Approximation (SSA) implemented in the Python library Icepack. First, we show that by combining these two tools we can recover the underlying parameters of synthetic 2D data with meaningful uncertainty estimates. In a second step, we apply our method to real observations and get estimates for the basal melt rates which are coherent with the data when running the forward model over a centennial timescale.
How to cite: Moss, G., Višnjević, V., Schröder, C., Macke, J., and Drews, R.: Uncertainty quantification for melt rate parameters in ice shelves using simulation-based inference, EGU General Assembly 2022, Vienna, Austria, 23–27 May 2022, EGU22-896, https://doi.org/10.5194/egusphere-egu22-896, 2022.
EGU22-2061 | Presentations | CR2.9
Assimilation of CryoSat-2 radar Freeboard data in a global ocean-sea ice modelling system.Aliette Chenal, Charles-Emmanuel Testut, Florent Garnier, Parent Laurent, and Garric Gilles
Sea ice is a key element in our climate system, and it is very sensitive to the current observed climate change. Sea ice volume is a sensitive indicator of the health of Arctic although very challenging to estimate precisely since it is a combination of sea ice area and sea ice thickness. Arctic sea ice volume has decreased by as much as 75% at the end of the summer season if compared with the conditions 40 years ago. The ongoing decline of Arctic sea ice exposes the ocean to anomalous surface heat and freshwater fluxes that can have potential implication for the Arctic region and beyond, for the general oceanic circulation itself.
For more than a decade, Mercator Ocean International develops and produces Global Ocean Reanalysis with a 1/4° resolution system. Based on the NEMO modelling platform, observations are assimilated by a reduced-order Kalman filter. In-situ CORA database, altimetric data, sea surface temperature, and sea ice concentration are jointly assimilated to constrain the ocean and sea ice model.
In previous reanalysis, long-term sea ice volume drift has been observed in the Arctic. To obtain a better constraint on the sea ice thickness, Cryosat-2 radar Freeboard data are assimilated jointly with the sea ice concentration in a multidata/multivariate sea ice analysis. The coupled ocean and ice assimilation system runs on a 7-day cycle, using IAU (Incremental Analysis Update) and a 4D increment. The “white ocean” is modelled with the multi-categories LIM3.6 sea ice numerical model. The aim of this study is to initiate the development of the future operational multi-variate and multi-data sea ice analysis system with freeboard radar assimilation.
After describing this global sea ice reanalysis system, we present results on the abilities of this configuration to reproduce sea ice extent and volume interannual variability in both hemispheres. Comparisons between experiments with and without assimilation show that the joint assimilation of CryoSat-2 radar freeboard and sea ice concentration reduces most of model biases of sea ice thickness, e.g., in the north of the Canadian Arctic Archipelago and in the Beaufort Sea in the Arctic. Moreover, radar freeboard assimilation does not hinder the good results in simulating sea ice extent previously obtained with the assimilation of only sea ice concentration. Validation with non-assimilated satellite data and in-situ data supports these findings. Lastly, snow depth significantly influences the Freeboard measurement: this study also reveals the importance of including snow information on freeboard retrieval and on the ice volume assimilation methodology.
These experiments take place in a context of increasing interest in polar regions and prepare the launch of Copernicus Sentinel expansion satellite missions.
How to cite: Chenal, A., Testut, C.-E., Garnier, F., Laurent, P., and Gilles, G.: Assimilation of CryoSat-2 radar Freeboard data in a global ocean-sea ice modelling system., EGU General Assembly 2022, Vienna, Austria, 23–27 May 2022, EGU22-2061, https://doi.org/10.5194/egusphere-egu22-2061, 2022.
Please decide on your access
Please use the buttons below to download the presentation materials or to visit the external website where the presentation is linked. Regarding the external link, please note that Copernicus Meetings cannot accept any liability for the content and the website you will visit.
Forward to presentation link
You are going to open an external link to the presentation as indicated by the authors. Copernicus Meetings cannot accept any liability for the content and the website you will visit.
We are sorry, but presentations are only available for users who registered for the conference. Thank you.
EGU22-2535 | Presentations | CR2.9
Quantifying Holocene Accumulation Rates from Ice-Core Dated Internal Layers from Ice-Penetrating Radar Data over the West Antarctic Ice SheetJulien Bodart, Robert Bingham, Duncan Young, Donald Blankenship, and David Vaughan
Modelling the past and future evolution of the West Antarctic Ice Sheet (WAIS) to climate and ocean forcing is challenged by the availability and quality of observed palaeo boundary conditions. Aside from point-based geochronological measurements, the only available proxy to query past ice-sheet processes on large spatial scales is Internal Reflecting Horizons (IRHs) as sounded by ice-penetrating radar. When isochronal, IRHs can be used to determine palaeo-accumulation rates and patterns, as previously demonstrated using shallow, centennially dated layers. Whilst similar efforts using deeper IRHs have previously been conducted over the East Antarctic Plateau where ice-flow is slow and ice thickness has been stable through time, much less is known of millennial-scale accumulation rates over the West Antarctic plateau due to challenging ice dynamical conditions in the downstream section of the ice sheet. Using deep and spatially extensive ice-core dated IRHs over Pine Island and Thwaites glaciers and a local layer approximation model, we quantify Holocene accumulation rates over the slow-flowing parts of these sensitive catchments. The results from the one-dimensional model are also compared with modern accumulation rates from observational and modelled datasets to investigate changes in accumulation rates and patterns between the Holocene and the present. The outcome of this work is that together with present and centennial-scale accumulation rates, our results can help determine whether a trend in accumulation rates exists between the Holocene and the present and thus test to what extent these glaciers are controlled by ice dynamics rather than changes in accumulation rates.
How to cite: Bodart, J., Bingham, R., Young, D., Blankenship, D., and Vaughan, D.: Quantifying Holocene Accumulation Rates from Ice-Core Dated Internal Layers from Ice-Penetrating Radar Data over the West Antarctic Ice Sheet, EGU General Assembly 2022, Vienna, Austria, 23–27 May 2022, EGU22-2535, https://doi.org/10.5194/egusphere-egu22-2535, 2022.
EGU22-3743 | Presentations | CR2.9
Numerical modelling of ice stream fabrics: Implications for recrystallization processes and basal slip conditionsDaniel Richards, Sam Pegler, and Sandra Piazolo
Accurately predicting ice crystal fabrics is key to understanding the processes and deformation in ice-sheets. Here we use SpecCAF, a continuum fabric evolution model validated against laboratory experiments, to predict the fabric evolution with an active ice stream. This is done by predicting the fabrics at the East Greenland Ice core Project (EGRIP) site. We do this using satellite data and inferred particle paths, combined with the shallow ice approximation (with basal slip) to infer a leading order approximation for the deformation through the ice sheet. We find that SpecCAF is able to predict the patterns observed at EGRIP - a girdle/horizontal maxima fabric perpendicular to the flow direction. By reducing the rate of rotational recrystallization in the model we are also able to predict the fabric strength at EGRIP. This suggests the effect of rotational recrystallization on the fabric may be primarily strain-rate/stress dependent. These results show SpecCAF can be applied to real-world conditions and provide insights into the deformation and basal-conditions of the ice sheet. As the model only considers deformation and recrystallization through dislocation creep, the results imply that - for the ice stream modelled - no other process is significantly influencing both the produced ice fabric and the deformation. We find that the model gives best results for full slip at the base of the ice sheet, implying that the level of sliding at the base of the ice sheet in the North Greenland Ice stream may be very high. The methodology used here can be extended to other ice core locations in Greenland and Antarctica.
How to cite: Richards, D., Pegler, S., and Piazolo, S.: Numerical modelling of ice stream fabrics: Implications for recrystallization processes and basal slip conditions, EGU General Assembly 2022, Vienna, Austria, 23–27 May 2022, EGU22-3743, https://doi.org/10.5194/egusphere-egu22-3743, 2022.
EGU22-4027 | Presentations | CR2.9
Basal Properties of the Filchner-Ronne Sector of Antarctica from Inverse Modeling and Comparison with Ice-Penetrating Radar DataMichael Wolovick, Lea-Sophie Höyns, Thomas Kleiner, Niklas Nickel, Veit Helm, and Angelika Humbert
Lubrication by subglacial water or saturated subglacial sediments is crucial to controlling the movement of fast-flowing outlet glaciers and ice streams. However, the subglacial environment is difficult to observe directly. Here, we combine inverse modeling with ice-penetrating radar observations to characterize the ice sheet bed in the Filchner-Ronne sector of Antarctica, with a specific focus on the Recovery Glacier catchment. First, we use the Ice Sheet System Model (ISSM; Larour et al., 2012) to assimilate satellite observations of ice sheet surface velocity (Mouginot et al., 2019) in order to solve for basal drag and ice rheology across the Filchner-Ronne sector of Antarctica. Next, we compare these results with ice-penetrating radar observations sensitive to the presence of ponded water at the ice sheet base (Humbert et al., 2018; Langley et al., 2011), along with remotely sensed observations of active lakes (Smith et al., 2009) and putative large subglacial lakes inferred from the ice sheet surface slope (Bell et al., 2007). We find that the main fast-flowing region of Recovery Glacier is mostly low-drag, with the exception of localized sticky spots and bands. The boundary between rugged subglacial highlands and a deep subglacial basin near the onset of the ice stream is associated with a sharp reduction in basal drag, although surface velocity changes smoothly rather than abruptly across this transition. An upstream shear margin, visible in satellite radar images of the ice surface, is associated with low basal drag. The putative large lakes have low drag but are not strongly distinguished from their surroundings, and radar evidence for ponded subglacial water within them is weak. The active lakes identified from satellite altimetry are similarly situated in areas of low basal drag, but have limited radar evidence for ponded subglacial water. An L-curve analysis indicates that our inverse model results are robust against changes in regularization, yet the radar-identified lake candidates do not have a clear relationship with low-drag areas in the fast-flowing ice stream. We conclude that the deep-bedded regions of Recovery Glacier are underlain by saturated subglacial sediments, but classic ponded subglacial lakes are much more rare. Isolated sticky spots and bands within the ice stream are either due to protrusions of bedrock out of the sediments or to localized areas of frozen and/or compacted sediments.
How to cite: Wolovick, M., Höyns, L.-S., Kleiner, T., Nickel, N., Helm, V., and Humbert, A.: Basal Properties of the Filchner-Ronne Sector of Antarctica from Inverse Modeling and Comparison with Ice-Penetrating Radar Data, EGU General Assembly 2022, Vienna, Austria, 23–27 May 2022, EGU22-4027, https://doi.org/10.5194/egusphere-egu22-4027, 2022.
EGU22-5113 | Presentations | CR2.9
Estimating large scale dynamic mountain glacier states with numerical modelling and data assimilationPatrick Schmitt, Fabien Maussion, and Philipp Gregor
Ongoing global glacier retreat leads to sea-level rise and changes in regional freshwater availability. For an adequate adaptation to these changes, knowledge about the ice volume and the current dynamic state of glaciers is crucial. At regional to global scales, sparse observations made the dynamic state of glaciers very difficult to assess. Thanks to recent advances in global geodetic mass-balance and velocity assessments, new ways to initialize numerical models and ice thickness estimation emerge. In this contribution, we present the COst Minimization Bed INvErsion model (COMBINE), which aims to be a cheap, flexible global data assimilation and inversion method. COMBINE uses an existing numerical model of glacier evolution (the Open Global Glacier Model, OGGM) rewritten in the machine learning framework PyTorch. This makes the model fully differentiable and allows to iteratively minimize a cost function penalizing mismatch to observations. Thanks to the flexible nature of automatic differentiation, various observational sources distributed in time can be considered (e.g. surface elevation and area changes, ice velocities). No assumption about the dynamic glacier state is needed, releasing the equilibrium assumption often required for large scale ice volume computations. In this contribution, we will demonstrate the capabilities of COMBINE in several idealized and real-world applications, and discuss its added value and upcoming challenges for operational application.
How to cite: Schmitt, P., Maussion, F., and Gregor, P.: Estimating large scale dynamic mountain glacier states with numerical modelling and data assimilation, EGU General Assembly 2022, Vienna, Austria, 23–27 May 2022, EGU22-5113, https://doi.org/10.5194/egusphere-egu22-5113, 2022.
Please decide on your access
Please use the buttons below to download the presentation materials or to visit the external website where the presentation is linked. Regarding the external link, please note that Copernicus Meetings cannot accept any liability for the content and the website you will visit.
Forward to presentation link
You are going to open an external link to the presentation as indicated by the authors. Copernicus Meetings cannot accept any liability for the content and the website you will visit.
We are sorry, but presentations are only available for users who registered for the conference. Thank you.

EGU22-5425 | Presentations | CR2.9
Modeling the Greenland englacial stratigraphyAndreas Born, Alexander Robinson, and Alexios Theofilopoulos
Radar reflections from the interior of the Greenland ice sheet contain a comprehensive archive of past accumulation rates, ice dynamics, and basal melting. Combining these data with dynamic ice sheet models may greatly aid model calibration, improve past and future sea level estimates, and enable insights into past ice sheet dynamics that neither models nor data could achieve alone.
In this study, we present the first three-dimensional ice sheet model that explicitly simulates the Greenland englacial stratigraphy. Individual layers of accumulation are represented on a grid whose vertical axis is time so that they do not exchange mass with each other as the flow of ice deforms them. This isochronal advection scheme does not influence the ice dynamics and only requires modest input data from a host thermomechanical ice sheet model.
Using an ensemble of simulations, we show that direct comparison with the dated radiostratigraphy data yields notably more accurate results than calibrating simulations based on total ice thickness. We show that the isochronal scheme produces a more reliable simulation of the englacial age profile than Eulerian age tracers. Lastly, we outline how the isochronal model can be linearized as a foundation for inverse modeling and data assimilation.
How to cite: Born, A., Robinson, A., and Theofilopoulos, A.: Modeling the Greenland englacial stratigraphy, EGU General Assembly 2022, Vienna, Austria, 23–27 May 2022, EGU22-5425, https://doi.org/10.5194/egusphere-egu22-5425, 2022.
EGU22-8605 | Presentations | CR2.9
Coupling modelling and satellite observations to constrain subglacial melt rates and hydrologyMartin Wearing, Daniel Goldberg, Christine Dow, Anna Hogg, and Noel Gourmelen
Meltwater forms at the base of the Antarctic Ice Sheet due to geothermal heat flux (GHF) and basal frictional dissipation. Despite the relatively small volume, this meltwater has a profound effect on ice-sheet stability, controlling the dynamics of the ice sheet and the interaction of the ice sheet with the ocean. However, observations of subglacial melting and hydrology in Antarctica are limited. Here we use numerical modelling to assess subglacial melt rates and hydrology beneath the Antarctic Ice Sheet. Our case study, focused on the Amery Ice Shelf catchment, shows that total subglacial melting in the catchment is 6.5 Gt yr-1, over 50% larger than previous estimates. Uncertainty in estimates of GHF leads to a variation in total melt of ±7%. The meltwater provides an extra 8% flux of freshwater to the ocean in addition to contributions from iceberg calving and melting of the ice shelf. GHF and basal dissipation contribute equally to the total melt rate, but basal dissipation is an order of magnitude larger beneath ice streams. Remote-sensing observations, from CryoSat-2, indicating active subglacial lakes and ice-shelf basal melting constrain subglacial hydrology modelling. We observe a network of subglacial channels that link subglacial lakes and trigger isolated areas of sub-ice-shelf melting close to the grounding line. Building upon this Amery case study, we expand our analysis to quantify subglacial melt rates and hydrology beneath the entire Antarctic Ice Sheet.
How to cite: Wearing, M., Goldberg, D., Dow, C., Hogg, A., and Gourmelen, N.: Coupling modelling and satellite observations to constrain subglacial melt rates and hydrology, EGU General Assembly 2022, Vienna, Austria, 23–27 May 2022, EGU22-8605, https://doi.org/10.5194/egusphere-egu22-8605, 2022.
Please decide on your access
Please use the buttons below to download the presentation materials or to visit the external website where the presentation is linked. Regarding the external link, please note that Copernicus Meetings cannot accept any liability for the content and the website you will visit.
Forward to presentation link
You are going to open an external link to the presentation as indicated by the authors. Copernicus Meetings cannot accept any liability for the content and the website you will visit.
We are sorry, but presentations are only available for users who registered for the conference. Thank you.
EGU22-8938 | Presentations | CR2.9
Constraining Soil Freezing Models using Observed Soil Freezing Characteristic CurvesÉlise Devoie, Stephan Gruber, and Jeffrey McKenzie
Objective: Estimate Soil Freezing Characteristic Curves (SFCCs) and uncertainty bounds based on a compilation of existing measured SFCCs.
Key Findings
- Uncertainty in measured SFCCs is estimated based on measurement technique, water content, and soil disturbance
- An open-source tool for estimating and constraining SFCCs is developed for use in parameterizing freeze/thaw models
Abstract
Cold-regions landscapes are undergoing rapid change due to a warming climate. This change is impacting many elements of the landscape and is often controlled by soil freeze/thaw processes. Soil freeze/thaw is governed by the Soil Freezing Characteristic Curve (SFCC) that relates the soil temperature to its unfrozen water content. This relation is needed in all physically based numerical models including soil freeze/thaw processes. A repository of all collected SFCC data and an R package for accessing and processing this data was presented in "A Repository of 100+ Years of Measured Soil Freezing Characteristic Curves".
This rich SFCC dataset is synthesized with a focus on potential sources of error due to the combination of measurement technique, data interpretation, and physical freeze-thaw process in a specific soil. Particular attention is given to combining sources of error and working with datasets given incomplete and missing metadata. A tool is developed to extract an SFCC for a soil with specified properties alongside its uncertainty bounds. This tool is intended for use in freeze/thaw models to improve freeze/thaw estimates, and better represent the ice and liquid water content of freezing soils. As phase change accounts for a vast majority of the energy budget in freezing soils, accurately representing the process is essential for realistic predictions. In addition, SFCC type curves are provided for the common sand, silt, clay, and organic soil textures when additional data is unavailable to define the SFCC more precisely.
How to cite: Devoie, É., Gruber, S., and McKenzie, J.: Constraining Soil Freezing Models using Observed Soil Freezing Characteristic Curves, EGU General Assembly 2022, Vienna, Austria, 23–27 May 2022, EGU22-8938, https://doi.org/10.5194/egusphere-egu22-8938, 2022.
EGU22-9143 | Presentations | CR2.9
Assessing the continuity of englacial layers across the Lambert Glacier catchment.Rebecca Sanderson, Neil Ross, Louise Callard, Kate Winter, Felipe Napoleoni, Robert Bingham, and Tom Jordan
The analysis of englacial layers using ice penetrating radar enables the characterisation and reconstruction of current and past ice sheet flow. To date, little research has been undertaken on the ice flow and englacial stratigraphy of the upper catchment of the Lambert Glacier. The Lambert Glacier catchment is one of the largest in East Antarctica, discharging ~16% of East Antarctica’s ice. Quantitative analysis of the continuity of englacial stratigraphy and ice flow has the potential to provide insight into the present-day and past flow regimes of the upper catchment of Lambert Glacier. Radar data from the British Antarctic Survey Antarctica’s Gamburtsev Province Project North (AGAP-N) aerogeophysical survey was analysed using the Internal Layer Continuity Index (ILCI). This approach identified, and characterised, a range of englacial structures and stratigraphy, including buckled layers in areas of increased ice velocity (>20ma-1) and continuous layering across subglacial highlands with low ice velocity adjacent to the central Lambert Glacier trunk. Overall, the analysis is consistent with the present-day ice-flow velocity field and long-term stability of ice flow across the Lambert catchment. However, disrupted layer geometry at the onset of the Lambert Glacier suggests a past shift in the position of the onset of ice flow. These results have implications for the future evolution of this major ice flow catchment, and East Antarctica, under a changing climate. The ILCI method represents a valuable tool for rapidly characterising englacial stratigraphy, and the study demonstrates the transferability of the method across Antarctica. The use of quantitative tools such as ILCI for the analysis of large radar datasets will be critical for projects such as AntArchitecture (https://www.scar.org/science/antarchitecture/home/) which aims to investigate the long-term stability of the Antarctic ice sheets directly from the internal architecture of the ice sheet.
How to cite: Sanderson, R., Ross, N., Callard, L., Winter, K., Napoleoni, F., Bingham, R., and Jordan, T.: Assessing the continuity of englacial layers across the Lambert Glacier catchment., EGU General Assembly 2022, Vienna, Austria, 23–27 May 2022, EGU22-9143, https://doi.org/10.5194/egusphere-egu22-9143, 2022.
EGU22-9262 | Presentations | CR2.9
Assimilating Cyrosat2 freeboard into a coupled ice-ocean modelImke Sievers, Lars Stenseng, and Till Rasmussen
How to cite: Sievers, I., Stenseng, L., and Rasmussen, T.: Assimilating Cyrosat2 freeboard into a coupled ice-ocean model , EGU General Assembly 2022, Vienna, Austria, 23–27 May 2022, EGU22-9262, https://doi.org/10.5194/egusphere-egu22-9262, 2022.
Please decide on your access
Please use the buttons below to download the presentation materials or to visit the external website where the presentation is linked. Regarding the external link, please note that Copernicus Meetings cannot accept any liability for the content and the website you will visit.
Forward to presentation link
You are going to open an external link to the presentation as indicated by the authors. Copernicus Meetings cannot accept any liability for the content and the website you will visit.
We are sorry, but presentations are only available for users who registered for the conference. Thank you.
EGU22-9886 | Presentations | CR2.9
Automated Tracking of Glacial Lake Outburst Floods in NorwayJogscha Abderhalden and Irina Rogozhina
No continuously updated glacier and glacial lake inventories exist for Norway. Previous inventories have been developed for the time periods of 1947-1985, 1988-1997 and 1999-2006 for glaciers and 1988-1997, 1999-2006, 2014 and 2018 for glacial lakes, by manual digitization, and semi-automated mapping. However, these methods are both time consuming and do not allow for an analysis of glacial lake behaviour on shorter timescales or on a seasonal basis. Therefore, one aim of this study is to present consistent inventories for glaciers and glacial lakes in Norway using semi-automated mapping and machine learning techniques applied on satellite imagery of different spatial and temporal resolution (Landsat 30m, 16 days, and Sentinel 10m, 5 days). An automated method that allows frequent monitoring of glacier variables can provide essential knowledge for the understanding of glacial lake dynamics in a changing climate.
In addition to glacial lake inventories, smaller ice caps with active glacial lakes are investigated more closely, aiming at following the development of glacial lakes throughout seasons. Here we are also analyzing the suitability of PlanetScope imagery compared to the Sentinel and Landsat imagery to detect the known glacial lake outburst flood events and identify currently unrecognized hazard-prone glacial lakes. Since the field-based investigations of glacial lake changes (especially of the ice-dammed lakes) are sparse in Norway, developing methods for remote-sensed, automated monitoring of glacial lake changes and glacial lake outburst floods is essential in order to develop early warning systems, detect potentially hazardous lakes and prevent human losses and damages to infrastructure and local businesses.
How to cite: Abderhalden, J. and Rogozhina, I.: Automated Tracking of Glacial Lake Outburst Floods in Norway, EGU General Assembly 2022, Vienna, Austria, 23–27 May 2022, EGU22-9886, https://doi.org/10.5194/egusphere-egu22-9886, 2022.
Please decide on your access
Please use the buttons below to download the presentation materials or to visit the external website where the presentation is linked. Regarding the external link, please note that Copernicus Meetings cannot accept any liability for the content and the website you will visit.
Forward to presentation link
You are going to open an external link to the presentation as indicated by the authors. Copernicus Meetings cannot accept any liability for the content and the website you will visit.
We are sorry, but presentations are only available for users who registered for the conference. Thank you.
EGU22-10509 | Presentations | CR2.9
A probabilistic analysis of permafrost temperature trends with ensemble modeling of heat transferBrian Groenke, Moritz Langer, Guillermo Gallego, and Julia Boike
Over the past few decades, polar research teams around the world have deployed long-term measurement sites to monitor changes in permafrost environments. Many of these sites include borehole sensor arrays which provide measurements of ground temperature as deep as 50 meters or more below the surface. Recent studies have attempted to leverage these borehole data from the Global Terrestrial Network of Permafrost to quantify changes in permafrost temperatures at a global scale. However, temperature measurements provide an incomplete picture of the Earth's subsurface thermal regime. It is well known that regions with warmer permafrost, i.e. where mean annual ground temperatures are close to zero, often show little to no long-term change in ground temperature due to the latent heat effect. Thus, regions where the least warming is observed may also be the most vulnerable to rapid permafrost thaw. Since direct measurements of soil moisture in the permafrost layer are not widely available, thermal modeling of the subsurface plays a crucial role in understanding how permafrost responds to changes in the local energy balance. In this work, we explore a new probabilistic method to link observed annual temperatures in boreholes to permafrost thaw via Bayesian parameter estimation and Monte Carlo simulation with a transient heat model. We apply our approach to several sites across the Arctic and demonstrate the impact of local landscape variability on the relationship between long term changes in temperature and latent heat.
How to cite: Groenke, B., Langer, M., Gallego, G., and Boike, J.: A probabilistic analysis of permafrost temperature trends with ensemble modeling of heat transfer, EGU General Assembly 2022, Vienna, Austria, 23–27 May 2022, EGU22-10509, https://doi.org/10.5194/egusphere-egu22-10509, 2022.
EGU22-11310 | Presentations | CR2.9
Layer geometry as a constraint on the physics of sliding onsetElisa Mantelli, Marnie Bryant, Helene Seroussi, Ludovic Raess, Davide Castelletti, Dustin Schroeder, Jenny Suckale, and Martin Siegert
Transitions from basal no slip to basal sliding are a common feature of ice sheets, yet one that has remained difficult to observe. In this study we leverage recent advances in the processing of radar sounding data to study these transitions through their signature in englacial layers. Englacial layers encode information about strain and velocity, and the relation between their geometry and the onset of basal sliding has been demonstrated in ice flow models (the so-called "Weertman effect"). Here we leverage this relation to test the long-standing hypothesis that sliding onset takes the form of an abrupt no slip/sliding transition. By comparing the modeled signature of an abrupt sliding onset in englacial layer slopes against slope observations from the onset region of a West Antarctic ice stream (Institute Ice Stream), we conclude that observed layer geometry does not support an abrupt no slip/sliding transition. Our findings instead suggest a much smoother sliding onset, as would be consistent with temperature-dependent friction between ice and bed. Direct measurements of basal temperature at the catchment scale would allow us to confirm this hypothesis.
How to cite: Mantelli, E., Bryant, M., Seroussi, H., Raess, L., Castelletti, D., Schroeder, D., Suckale, J., and Siegert, M.: Layer geometry as a constraint on the physics of sliding onset, EGU General Assembly 2022, Vienna, Austria, 23–27 May 2022, EGU22-11310, https://doi.org/10.5194/egusphere-egu22-11310, 2022.
EGU22-13501 | Presentations | CR2.9
Investigating basal thaw as a driver of mass loss from the Antarctic ice sheetEliza Dawson, Dustin Schroeder, Winni Chu, Elisa Mantelli, and Hélène Seroussi
Contemporary mass loss from the Antarctic ice sheet primarily originates from the discharge of
marine-terminating glaciers and ice streams. The rate of mass loss is influenced by warming ocean
and atmospheric conditions, which lead to subsequent thinning or disintegration of ice shelves and
increased outflow of upstream grounded ice. It is currently unclear how the basal thermal state of
grounded ice could evolve in the future - for example as a result of accelerated ice flow or changes
in the ice sheet geometry - but a change in the basal thermal state could impact rates of mass loss
from Antarctica. Here, we use a combination of numerical simulations and ice-penetrating radar
analysis to investigate the influence of basal thawing on 100yr simulations of the Antarctic ice
sheet’s evolution. Using the Ice-sheet and Sea-level System Model, we find that thawing patches
of frozen bed near the ice sheet margin could drive mass loss extending into the continental
interior, with the highest rates of loss coming from the George V - Adélie - Wilkes Land coast and
the Enderby - Kemp Land regions of East Antarctica. This suggests that the thawing of localized
frozen bed patches is sufficient to cause these East Antarctic regions to transition to an unstable
mass loss regime. We constrain model estimates of the basal thermal state using ice-penetrating
radar surveys and analyze radar characteristics including bed reflectivity and attenuation. In
combination, our work identifies critical regions of Antarctica where the ice-bed interface could
be close to thawing and where basal thaw could most impact mass loss.
How to cite: Dawson, E., Schroeder, D., Chu, W., Mantelli, E., and Seroussi, H.: Investigating basal thaw as a driver of mass loss from the Antarctic ice sheet, EGU General Assembly 2022, Vienna, Austria, 23–27 May 2022, EGU22-13501, https://doi.org/10.5194/egusphere-egu22-13501, 2022.
Please decide on your access
Please use the buttons below to download the presentation materials or to visit the external website where the presentation is linked. Regarding the external link, please note that Copernicus Meetings cannot accept any liability for the content and the website you will visit.
Forward to presentation link
You are going to open an external link to the presentation as indicated by the authors. Copernicus Meetings cannot accept any liability for the content and the website you will visit.
We are sorry, but presentations are only available for users who registered for the conference. Thank you.
EGU22-135 | Presentations | NH9.2
Characterizing social vulnerability for climate impact assessment at global scaleLena Reimann, Elco Koks, Hans de Moel, and Jeroen Aerts
Every year, extreme events caused by climate-related hazards result in severe impacts globally. These impacts are expected to increase in the future due to both climate change and population growth in exposed locations. However, impacts are not only driven by exposure to extreme events, but also by the population’s vulnerability to these hazards, determined by individual characteristics such as age, gender, and income. Thus far, global-scale climate risk assessments account for social vulnerability to a limited degree. To address this gap, we produce spatially explicit global datasets of variables that can be used for characterizing social vulnerability. We further combine these data into a globally consistent and spatially explicit Social Vulnerability Index (SoVI), which will be made publicly available along with the input variables. To explore the value of the SoVI in characterizing social vulnerability, we validate it with the observed impacts (e.g., fatalities, damages) of past extreme events. To do so, we overlay the spatial vulnerability characteristics with recently published flood maps of observed flooding events across the globe, also testing how each vulnerability variable performs individually in explaining the observed impacts. Our analysis helps to develop a more in-depth understanding of the characteristics that drive social vulnerability globally, along with their spatial distribution. Therefore, our results can support decision-making in developing strategies that reduce social vulnerability to climate-related hazards, for instance related to spatial planning, socioeconomic development, and adaptation.
How to cite: Reimann, L., Koks, E., de Moel, H., and Aerts, J.: Characterizing social vulnerability for climate impact assessment at global scale, EGU General Assembly 2022, Vienna, Austria, 23–27 May 2022, EGU22-135, https://doi.org/10.5194/egusphere-egu22-135, 2022.
EGU22-1073 | Presentations | NH9.2
Scenarios of social-environmental extremesGabriele Messori, Maria Rusca, and Giuliano Di Baldassarre
In a rapidly changing world, what is today an unprecedented environmental extreme event may soon become the norm. Such unprecedented events, and the related disasters, will likely have highly unequal socio-economic impacts. We investigate the relation between genesis of unprecedented events, accumulation and distribution of risk, and recovery trajectories across different societal groups, thus conceptualising the events as social-environmental extremes. We specifically propose an analytical approach to unravel the complexity of future extremes and multiscalar societal responses-from households to national governments and from immediate impacts to longer term recovery. This combines the physical characteristics of the extremes with examinations of how culture, politics, power and policy visions shape societal responses to unprecedented events. As end result, we build scenarios of how different societal groups may be affected by, and recover from, plausible future unprecedented extreme events. This new approach, at the nexus between social and natural sciences, has the concrete advantage of providing an impact-focused vision of future social-environmental risks, beyond what is achievable within conventional disciplinary boundaries. In this presentation I will illustrate an application to a future extreme flooding event in Houston. However, the approach is flexible and applicable to a wide range of extreme events.
How to cite: Messori, G., Rusca, M., and Di Baldassarre, G.: Scenarios of social-environmental extremes, EGU General Assembly 2022, Vienna, Austria, 23–27 May 2022, EGU22-1073, https://doi.org/10.5194/egusphere-egu22-1073, 2022.
Please decide on your access
Please use the buttons below to download the presentation materials or to visit the external website where the presentation is linked. Regarding the external link, please note that Copernicus Meetings cannot accept any liability for the content and the website you will visit.
Forward to presentation link
You are going to open an external link to the presentation as indicated by the authors. Copernicus Meetings cannot accept any liability for the content and the website you will visit.
We are sorry, but presentations are only available for users who registered for the conference. Thank you.
EGU22-2691 | Presentations | NH9.2
Public perceptions of flood and drought risk: Gender differences in Italy and SwedenElena Mondino, Elena Raffetti, and Giuliano Di Baldassarre
Hydrological extremes still cause severe damage worldwide. Understanding people’s perceptions of drought and flood risk, and their changes over time, can help researchers, practitioners, and policymakers assist communities at risk. In particular, identifying and highlighting gender differences in the perception of hydrological risk is fundamental to promote fair disaster risk reduction policies which take such differences into account. To this end, we collected national survey data three times over a year on risk perception, knowledge, and preparedness in regard to floods and droughts in Italy and Sweden. Preliminary results show that: i) the perceptions of drought and flood risk are heavily intertwined; and ii) women show a higher fluctuation in perception over time compared to men, especially when it comes to floods. These results and their implications show how important it is to integrate gender into the management of floods and drought and into risk communication, as well as to promote policies that simultaneously address flood and drought risk.
How to cite: Mondino, E., Raffetti, E., and Di Baldassarre, G.: Public perceptions of flood and drought risk: Gender differences in Italy and Sweden, EGU General Assembly 2022, Vienna, Austria, 23–27 May 2022, EGU22-2691, https://doi.org/10.5194/egusphere-egu22-2691, 2022.
EGU22-5347 | Presentations | NH9.2
Typologies of community risk to climate change: fostering climate adaption networksNils Riach and Rüdiger Glaser
Adapting to the effects of climate change will increasingly become a task of municipal planning and implementation in the coming years. This ranges from the consideration of increasing heat days to the retention of heavy rainfall. Climate related hazards, together with their dynamic interplay of exposure and vulnerability pose considerable adverse consequences for municipalities and need to be addressed through risk management plans. While this is understood in research and is increasingly being implemented in cities, it is found that particularly small and medium-sized municipalities often lack (1) the necessary evidence base for planning, (2) adequate capacities to engage in adaptation, and (3) practical analytical tools and informal planning instruments for adapting to the unavoidable consequences of climate change. Identifying communities that are similarly impacted and thus show comparable adaption needs can help local stakeholders in forming climate adaption networks. Here they can pool resources, develop solutions and exchange knowledge on the highly contextual challenges of climate change adaptation.
We derive cluster based typologies of communities in the German state of Baden-Württemberg, which show assimilable characteristics in climatic hazards, exposure and vulnerability. While cluster analysis is often used to differentiate patterns of climate change, few assessments have included societal variables. We therefore couple a ten-member regional climate model ensemble (RCP8.5, 1971-2000, 2021-2050, 2071-2100) with socio-economic data in so-called bivariate climate impact maps. This allows for statewide community specific conclusions on climate related risks. Statistical cluster analysis enables grouping of communities based on similar risks and adaption needs. Our approach provides a data driven basis for so-called climate adaption networks, which may foster the implementation of communal adaption efforts.
How to cite: Riach, N. and Glaser, R.: Typologies of community risk to climate change: fostering climate adaption networks, EGU General Assembly 2022, Vienna, Austria, 23–27 May 2022, EGU22-5347, https://doi.org/10.5194/egusphere-egu22-5347, 2022.
Please decide on your access
Please use the buttons below to download the presentation materials or to visit the external website where the presentation is linked. Regarding the external link, please note that Copernicus Meetings cannot accept any liability for the content and the website you will visit.
Forward to presentation link
You are going to open an external link to the presentation as indicated by the authors. Copernicus Meetings cannot accept any liability for the content and the website you will visit.
We are sorry, but presentations are only available for users who registered for the conference. Thank you.

EGU22-5537 | Presentations | NH9.2
Gender and social inclusion in disaster risk reduction and management: Key learning and effective practicesAlison Sneddon, Mirianna Budimir, Sarah Brown, and Issy Nelder
Resilience to natural hazards varies widely within and between populations. People living in the same area affected by the same hazard event will experience it differently depending on their specific vulnerabilities and capacities. The social inequalities which drive differential resilience vary based on the norms of a given context, but result in resources being harder for some people to reach and use than others.
These inequalities are often invisible in traditional data, and therefore the needs of the most vulnerable are not addressed in disaster risk reduction and management policy and practice. The impacts of disasters therefore reinforce and worsen existing inequalities as already vulnerable people are left further and further behind.
This presentation will focus on new learning about the relationship between gender and social vulnerabilities and resilience to natural hazard-related disasters in a range of contexts with three key aims:
- To share key learning about differential disaster resilience and requirements of early warning and disaster risk management implementation
- To explore key tools which have been piloted, tested, and developed to improve knowledge and understanding of resilience
- To discuss effective and practical ways to apply these tools going forward in research, policy, and practice.
The presentation will draw on experiences and findings from projects conducted in the Philippines, Bangladesh, Malawi, Nepal, and Dominica to research gender and social inclusion in relation to early warning systems, disaster preparedness and response, and disaster risk financing.
The session will examine the drivers of social inequalities and their impacts relating to risk knowledge, monitoring and warning, communication and dissemination, and response capability, sharing examples of the different needs, considerations, and priorities relating to early warning and disaster risk management within communities.
We’ll then explore approaches to data layering and our Missing Voices methodology as key tools to identify and understand factors, including intersectional factors, influencing social and economic resilience to natural hazards.
How to cite: Sneddon, A., Budimir, M., Brown, S., and Nelder, I.: Gender and social inclusion in disaster risk reduction and management: Key learning and effective practices, EGU General Assembly 2022, Vienna, Austria, 23–27 May 2022, EGU22-5537, https://doi.org/10.5194/egusphere-egu22-5537, 2022.
EGU22-6022 | Presentations | NH9.2
Forensic disaster analysis of the 2021 summer floods in Western Germany, Belgium and the Netherlands – Findings from the PERC studyViktor Rözer, Jonathan Ulrich, Michael Szönyi, Francisco Ianni, Finn Laurien, Teresa Deubelli, Karen MacClune, and Rachel Norton
Severe flooding in Western Germany, Belgium and the Netherlands in July 2021, particularly along the rivers Erft, Ahr and Meuse rivers has led to more than 240 causalities and an estimated damage of 29,2 billion EUR in Germany alone. The high human and economic costs of the event brought systemic problems in the flood risk management system to light and raised questions about the limits of disaster risk management and climate change adaptation. Using a forensic disaster analysis approach, the Post Event Review Capability (PERC), we systematically analyse the strengths and weaknesses of the flood risk management systems in the affected regions, the emergency response and recovery to draw lessons for future disaster risk management and climate change adaptation strategies. For that, PERC synthesizes existing information about the event from the hydro-meteorological characteristics of the physical impact and combines it with qualitative interviews with first responders, flood risk managers and other directly affected stakeholders. We will present key findings from the PERC study on the 2021 floods including the main drivers behind the high casualties and potential shortcomings in the emergency response and recovery as well as recommendations and opportunities for improvement.
How to cite: Rözer, V., Ulrich, J., Szönyi, M., Ianni, F., Laurien, F., Deubelli, T., MacClune, K., and Norton, R.: Forensic disaster analysis of the 2021 summer floods in Western Germany, Belgium and the Netherlands – Findings from the PERC study, EGU General Assembly 2022, Vienna, Austria, 23–27 May 2022, EGU22-6022, https://doi.org/10.5194/egusphere-egu22-6022, 2022.
EGU22-6341 | Presentations | NH9.2
Comparative Analysis of Indicators for Sustainable Urban Development and Coastal Adaptation - Uncovering Barriers and Potentials of Integrated AssessmentsAnna Eggert, Karsten Arnbjerg-Nielsen, and Roland Löwe
Denmark is one of the most vulnerable countries in Europe with respect to increasing risk of sea surges. A two hundred year paradigm of land reclamation close to the sea must therefore be revisited with the intent of retaining flexibility and avoiding lock-ins while recognizing the unintended consequences of new adaptation strategies. Potential solutions continue to face considerable structural, spatial, temporal and definitional challenges requiring collaboration between communities, local actors and scientists. In the “Cities and rising sea levels” project scientists from different research disciplines including (landscape) architecture, regional and local planning, and hydrology collaborate with local actors in order to tackle these challenges. The aim is to establish a common terminology and identify common scenarios, strategies, and indicators of successful and less successful urban developments in coastal areas over space and time.
One of the objectives in the project is to establish a coherent, spatially explicit framework for assessing strategies for sustainable urban development (SUD) of coastal communities to facilitate mediation and decision-making for stakeholders involved in adaptation and urban planning processes. As a starting point, our study identified a total of >2200 indicators across 50 references on SUD and respective additional >1600 indicators across 28 references on coastal adaptation. By means of systemic reviews and analyses, the study builds upon previous reviews on indicators and expands beyond by laying a clear focus on sustainable adaptation in coastal areas.
Extracted indicators sets of SUD and coastal adaptation are compared and similarities as well as differences are pointed out and analysed. Interestingly none of the identified indicators of SUD include a direct representation of climate risks or determinants of risk i.e. vulnerability and exposure, neither as conceptual variables driving risk, nor the assessment of adaptive capacity. At the same time, indicators of coastal adaptation disregard liveability and human wellbeing as crucial aspects of urban planning, in contrast to SUD indicators where they represent guiding principles. This illustrates a clear gap between adaptation practices and other professions involved in urban planning processes.
In order to uncover sustainable pathways to adapt, adaptation must be an integral part of sustainable development. The study aims at understanding differences in performance assessments and to suggest steps forward to better integrate SUD and coastal adaptation. Here, the study will proceed by operationalizing a combined and integrated indicator framework in the form of spatio-temporal assessments. The first results of these assessments will be presented and synergies and tradeoffs between a risk lens and SUD will be highlighted.
How to cite: Eggert, A., Arnbjerg-Nielsen, K., and Löwe, R.: Comparative Analysis of Indicators for Sustainable Urban Development and Coastal Adaptation - Uncovering Barriers and Potentials of Integrated Assessments, EGU General Assembly 2022, Vienna, Austria, 23–27 May 2022, EGU22-6341, https://doi.org/10.5194/egusphere-egu22-6341, 2022.
EGU22-6600 | Presentations | NH9.2
Psychosocial response to risk mitigation measures in IcelandStephanie Matti, Helga Ögmundardottír, Guðfinna Aðalgeirsdóttir, and Uta Reichardt
Land use planning has been espoused as a key measure to decrease the risk of climate change-relatd disasters including landslides, however there is a dearth of research on how it affects the psychosocial wellbeing of affected people. This ethnographic study examines the risk management of the Svínafellsheiði fracture in south-east Iceland, where 60 to 100 million cubic metres of debris is predicted to fall onto the glacier below, and cause flooding from or a tsunami in the proglacial lake. A no-build zone was put in place between 2018 and 2020 to prevent a further increase in the number of people exposed to the hazard. Our results indicate that the no-build zone had both direct and indirect adverse effects on the psychosocial wellbeing of those affected. It caused frustration about a perceived inability to make changes to home and businesses, people feeling that their future was in limbo or on hold, and people questioning their future in the area. These direct psychosocial effects also had the knock-on effect of causing people to talk more about the risk, thereby undermining a key coping mechanism.
How to cite: Matti, S., Ögmundardottír, H., Aðalgeirsdóttir, G., and Reichardt, U.: Psychosocial response to risk mitigation measures in Iceland, EGU General Assembly 2022, Vienna, Austria, 23–27 May 2022, EGU22-6600, https://doi.org/10.5194/egusphere-egu22-6600, 2022.
EGU22-10272 | Presentations | NH9.2
Structuring citizens’ risk perception and knowledge of flooding events for planning purposes: The case study of Brindisi, ItalyStefania Santoro, Vincenzo Totaro, Ruggiero Lovreglio, Domenico Camarda, Vito Iacobellis, and Umberto Fratino
The effects of flooding on urban environment and social vulnerability are challenging issues in flood risk management and long-term planning. Flood risk is among the main causes of social crisis, as it can drastically affect the socioeconomic status of a community and an increase in flood events can significantly inhibit the political system of land and emergency management, social security, human welfare, and the economy.
In recent decades, several studies have illustrated how the probability of occurrence of a flood event can be modified by human-dependent factors, such as, among others, climate and land-use changes.
For this reason, flood risk management policies are evolving to redirect the actions of policymakers from purely physical defensive measures toward integrated management and planning strategies, placing greater emphasis on the complexity of the interaction between social and physical processes.
The complexity of physical processes lies in the wide variety of underlying phenomena that produce different types of flooding, while that of social processes can be reconducted to their characterization, given by human-related factors such as risk perception, emotions, bonds, context, and behaviors. Structuring the complexity of these two systems could support flood risk to define the elements/classes of citizens that make a social system vulnerable.
Based on these premises, the present work aims in modelling the relationship between flood risk and community, starting from an analysis of social perception and knowledge of protective measures, and exploiting a methodology based on an online survey used to collect data, and on Mann-Whitney and Kruskal-Wallis tests used for their analysis.
The methodology was experimentally applied to the city of Brindisi (Puglia region, Southern Italy), which is potentially subject to floods of different nature, as fluvial, coastal and pluvial floods and dam overflows.
The results suggest that perceptions of flood risk depend on intrinsic components of individuals, primarily related to dimensions of perception such as trust in public strategies and risk communication. Slightly higher perception emerged for those living in risk areas, but the results of the remainder show that there is a non-negligible perception even where there is apparently no source of risk. This is reflected in the varying nature of the flooding that has affected the city. The presence of disabled persons in the household does not act in any way neither in the perception nor in the knowledge of the measures; the previous experience seems to have little weight in reference to the perception and almost null on the knowledge of the measures. This element is probably linked to the temporal distance from the last event that caused serious damage to the community. Knowledge of protective measures appears to be uniformly low for each category of citizens and territorial area, in particular for adolescents, a recurring category also on other investigated dimensions.
This work represents the first step for the development of a multi-agent model, as developed by the science of intelligent systems, able to analyze more deeply the relationships between natural and social systems and to bring out elements to support flood risk management.
How to cite: Santoro, S., Totaro, V., Lovreglio, R., Camarda, D., Iacobellis, V., and Fratino, U.: Structuring citizens’ risk perception and knowledge of flooding events for planning purposes: The case study of Brindisi, Italy, EGU General Assembly 2022, Vienna, Austria, 23–27 May 2022, EGU22-10272, https://doi.org/10.5194/egusphere-egu22-10272, 2022.
EGU22-11200 | Presentations | NH9.2
Inspecting the link between climate and human displacement with Explainable AI and Causal inferenceJosé María Tárraga Habas, Michele Ronco, Maria Teresa Miranda, Eva Sevillano Marco, Qiang Wang, María Piles, Jordi Muñoz, and Gustau Camps-Valls
On average, more than 21 million forced human displacements were reported as result of weather-related events between 2008 and 2020 worldwide. This is a major concern due to the increment trend in intensity and frequency of weather hazards. Breaking down the figures, the impact is more severe in low-middle income countries, where most of the natural hazards take place and adaptation strategies are lacking. Implementing efficient and operational policy responses requires a quantitative analysis of the nexus between climate-induced displacement. So far the study of this phenomenon has been often limited to qualitative assessments or to correlation measures from regression linear models, not accounting for the inherent complexity of the problem. The multicausal nature of human mobility and data availability present significant research challenges. We apply two methodological approaches that use machine-learning to close these gaps, namely addressing both rapid-onset (e.g. floods) and slow-onset (e.g. droughts) disaster types. The former uses the Internal Displacement Monitoring Centre (IDMC) global database of displacements triggered by floods and storms at disaster level, socioeconomic (RWI Meta Data4Good, Global Human Modification Layer, Education Expenditure), and Earth-Observation variables: meteorological (CHIRPS, ERA5) and environmental (NASA ASTER SRTM DEM, MODIS NDVI vegetation index). Explainable AI techniques enable to open the black box of random forest models and were applied at the global scale: Shapley values are used to investigate the contributions of the main drivers thereby quantitatively addressing the climate-displacement nexus. Results are consistent with the hazard, exposure and vulnerability concept discussed in literature and findings reveal that socioeconomic factors greatly mediate displacement magnitudes. The slow-onset study is being explored at the local scale at district level, currently focused on the effects of droughts on displaced populations in Somalia using UNCHR PRMN displacement dataset, remote sensing variables (CHIRPS, MODIS LST), conflict (ACLED) and market prices time-series (FSNAU, WFP VAM Unit). Beyond correlations analysis, causation alongside time-lag effects for the drivers of drought-induced displacement are assessed using the PCMCI algorithm. Results in specific districts indicate that decreases in vegetation in conjunction with cattle price drops are driving drought displacement, revealing these factors are in need for targeted intervention. Albeit the same method applied to other districts in Somalia returns no causal link among considered variables, taking these findings into account, we are able to propose district-wise recommendations on how to improve the quality of the data: eg. field data collection guidelines, what other data input is required, and where sampling efforts should be directed.
How to cite: Tárraga Habas, J. M., Ronco, M., Miranda, M. T., Sevillano Marco, E., Wang, Q., Piles, M., Muñoz, J., and Camps-Valls, G.: Inspecting the link between climate and human displacement with Explainable AI and Causal inference, EGU General Assembly 2022, Vienna, Austria, 23–27 May 2022, EGU22-11200, https://doi.org/10.5194/egusphere-egu22-11200, 2022.
EGU22-11251 | Presentations | NH9.2
The use of impact chains and Bayesian Network Analysis to assess flood risk dynamics in the Lower Mono River Basin, BeninMario Wetzel, Lorina Schudel, Adrian Almoradie, Kossi Komi, Julien Adounkpe, Yvonne Walz, and Michael Hagenlocher
River floods are a common and often devastating environmental hazard causing severe damages, loss of lives and livelihoods, notably for the most vulnerable. Understanding the root causes, drivers, patterns and dynamics of flood risks and associated uncertainties is important to inform adequate risk management. Yet, a lack of understanding the highly dynamic processes, interactions, uncertainties, and the inclusion of participatory methods and transdisciplinary approaches in risk assessments remains a limiting factor. In many flood-prone regions of the world, data scarcity poses another serious challenge for risk assessments. Addressing the above, we developed an impact chain via desk study and expert consultation to reveal key drivers of flood risk for agricultural livelihoods in the Lower Mono River Basin of Benin and their interlinkages – a region that is both highly prone to flooding and can be considered data-scarce. Particularly, the dynamic formation of vulnerability and its interplay with hazard and exposure components is highlighted.
Based on a simplified version of the impact chain which was validated in a participatory manner during a virtual expert workshop, an alpha-level Bayesian Network was created to further explore these interactions. The model was applied to an exemplary what-if scenario for the study area in Benin. Based on the above, this study critically evaluates the benefits and limitations of integrating the two methodological approaches to better understand and simulate risk dynamics in data scarce environments. The study finds that impact chains are a useful approach to conceptualize interactions of risk drivers. Particularly in combination with a Bayesian Network approach the method enables an improved understanding of how different risk drivers interact within the system and allows for dynamic assessments of what-if scenarios, for example, to inform resilience building strategies.
How to cite: Wetzel, M., Schudel, L., Almoradie, A., Komi, K., Adounkpe, J., Walz, Y., and Hagenlocher, M.: The use of impact chains and Bayesian Network Analysis to assess flood risk dynamics in the Lower Mono River Basin, Benin, EGU General Assembly 2022, Vienna, Austria, 23–27 May 2022, EGU22-11251, https://doi.org/10.5194/egusphere-egu22-11251, 2022.
EGU22-12884 | Presentations | NH9.2
What can we learn from previous generations? Álftaver’s experience of the 1918 Katla eruptionGuðrún Gísladóttir, Deanne Bird, and Emmanuel Pagneux
Residents in Álftaver, south Iceland, are very familiar with the 1918 Katla volcanic eruption, which caused rapid and catastrophic glacial outburst flooding of the area. Descriptions of the 1918 events, passed down by older generations, have become an important part of the collective memory. Based on oral and written history, this paper provides a vivid account, including detailed maps, of what people experienced and felt during the 1918 Katla eruption. It also considers how these experiences influence current-day perceptions and the impact this may have on behavior in relation to emergency response strategies. Until now, much of this history has only been accessible in Icelandic text and through oral stories. The aim of this paper is to unlock these stories for an international audience in an effort to advance understanding of volcanic eruptions and their impacts and, inform future emergency planning. Importantly, these descriptions tell us about the nature of the glacial outburst flood, with a ‘pre-flood’ devoid of ice and travelling at a much faster rate than the ice-laden main flood. As a future eruption of Katla may impact Álftaver, emergency response plans for glacial outburst floods were developed, and in March 2006 preliminary plans were tested in a full-scale evacuation exercise involving residents and emergency response groups. But Álftaver residents questioned the plans and were reluctant to follow evacuation orders during the exercise, as they felt their knowledge and the experience of their relatives during the 1918 Katla eruption, had not been taken into consideration. Residents were concerned that flood hazards, as well as tephra and lightning, were not appropriately accounted for by officials. In response to residents’ concerns, officials developed an alternative evacuation plan (Plan B) that builds on some of the experience and knowledge of Álftaver residents. However, residents were not involved in the development of ‘Plan B’ and they are not aware of what it constitutes or when it is to be implemented. This paper argues that more needs to be done to promote inclusive dialogue and the co-production of knowledge to ensure emergency response strategies adequately reflect and accommodate local knowledge, perspectives and planned behavior.
How to cite: Gísladóttir, G., Bird, D., and Pagneux, E.: What can we learn from previous generations? Álftaver’s experience of the 1918 Katla eruption, EGU General Assembly 2022, Vienna, Austria, 23–27 May 2022, EGU22-12884, https://doi.org/10.5194/egusphere-egu22-12884, 2022.
EGU22-13432 | Presentations | NH9.2
Revisiting risk in a multi-hazard setting: the case of Cyclone Amphan occurring within the COVID-19 pandemic in the Indian SundarbansSumana Banerjee, Himanshu Shekhar, Davide Cotti, Edward Sparkes, Saskia Werners, and Michael Hagenlocher
Amidst a period of complete lockdown due to COVID-19, the severe cyclonic storm Amphan made landfall in the Indian Sundarbans on 20 May 2020. The occurrence of a cyclone during the pandemic warranted investigation of interconnected risks and impacts in this climate hotspot and eco-critical region. Based on a desk study, field observations, key informant interviews and expert consultations, this research focussed on better understanding direct and cascading risks and the associated impacts from the concurrence of the two hazards occurring simultaneously. Our analysis reveals that although the region has not experienced a high number of COVID-cases between March and August 2020, the presence of underlying vulnerabilities exposed the population to cascading effects caused by the pandemic-induced lockdown along with the compounding effect of the Cyclone Amphan. In the Indian Sundarbans, COVID-19 acted as an exogenous shock, but its interplay with interconnected vulnerabilities resulted in the emergence of disruptions of a systemic nature. This was particularly the case in the economic domain, with cascading impacts observed across the welfare, education, and employment sectors. Cyclone Amphan, led to additional cascading impacts on these sectors, and affected other sectors such as health and infrastructure as well as biodiversity. Interventions such as introduction of new social protection schemes and community participation in cyclone preparedness measures have helped the system from facing a total collapse. However, some interventions that were implemented to mitigate impacts of these two concurring hazards somewhat counteracted one another. For example, while stringent COVID-19 interventions stressed on safety norms (including social distancing and stay at home orders), the hazard response protocol for Cyclone Amphan directed communities to evacuate their homes and move to communal shelters which were being used as quarantine units for returning migrant workers till before the cyclone. This caused concerns among the evacuated population, thus undermining the efficacy of the response effort. This case study underpins the need for moving from hazard-by-hazard approaches of understanding and managing risks towards integrated approaches that consider interconnected vulnerabilities, risks and impacts based on a systems perspective. Further, it also provides lessons for risk management in a multi-hazard and multi-risk setting besides sharing recommendations for better risk management in the Indian Sundarbans.
How to cite: Banerjee, S., Shekhar, H., Cotti, D., Sparkes, E., Werners, S., and Hagenlocher, M.: Revisiting risk in a multi-hazard setting: the case of Cyclone Amphan occurring within the COVID-19 pandemic in the Indian Sundarbans, EGU General Assembly 2022, Vienna, Austria, 23–27 May 2022, EGU22-13432, https://doi.org/10.5194/egusphere-egu22-13432, 2022.
EGU22-461 | Presentations | SSS7.2 | Highlight
Metal Pollution And Ecological Risk Assessment In Surface Soil Of An Emerging Industrial Cluster Near New Delhi, IndiaAnju Verma and Sudesh Yadav
Metal pollution in surface soils of industrial and urban areas is of concern owing to risk to human health and ecosystem and to its transport via winds and water. This study was aimed to determine total concentrations, contamination levels and source identification of metals in surface soil (n=37) from the Bhiwadi Industrial Cluster (BIC; a satellite industrial township to New Delhi). Average metal concentrations in surface soil exceeded their corresponding values in Upper Continental Crust (UCC, taken as background here) and varied depending upon metal(s) and sampling sites(s). Intensive industrial emissions/activities in BIC lead to high contamination factors (CFs > 6) and high pollution load indices (PLI > 1) for metals in surface soil. Average CFs followed the order Cr > Cd > Ni > Cu > Zn > Pb > Mn > V > Fe. Geo-accumulation index (Igeo) of metals in surface soils fall under unpolluted to extremely polluted for Cd, Cr, Cu, Ni and Zn, unpolluted to heavily polluted for Mn and Pb and unpolluted to moderately polluted for Fe and V. Ecological risk assessment in surface soil samples showed low to extremely high potential ecological risk for Cr, Cu and Ni, considerable to extremely high ecological risk for Cd, low to considerable ecological risk for Pb and low ecological risk for Mn, V and Zn. Risk (RI) values indicated that 37.8% of surface soil samples carried very high risk (RI > 600) of metal contamination in this industrial cluster. Findings suggested that proper waste collection and disposal techniques should be employed to safeguard human health and ecological risk in the region.
How to cite: Verma, A. and Yadav, S.: Metal Pollution And Ecological Risk Assessment In Surface Soil Of An Emerging Industrial Cluster Near New Delhi, India, EGU General Assembly 2022, Vienna, Austria, 23–27 May 2022, EGU22-461, https://doi.org/10.5194/egusphere-egu22-461, 2022.
Please decide on your access
Please use the buttons below to download the presentation materials or to visit the external website where the presentation is linked. Regarding the external link, please note that Copernicus Meetings cannot accept any liability for the content and the website you will visit.
Forward to presentation link
You are going to open an external link to the presentation as indicated by the authors. Copernicus Meetings cannot accept any liability for the content and the website you will visit.
We are sorry, but presentations are only available for users who registered for the conference. Thank you.

EGU22-464 | Presentations | SSS7.2
Metal Leaching from Surface Dust of an Informal E-Waste Recycling area in New Delhi, IndiaHina Kumari and Sudesh Yadav
Recycling and disposal of e-waste by informal sector in developing nations raise concerns due to its environmental consequences and human health hazards. In this study, metal toxicity and leaching behaviour of 13 metals (Ag, As, Ba, Cd, Co, Cr, Cu, Fe, Mn, Ni, Pb, V, Zn). were investigated in surface dust samples (n=20) of informal e-waste recycling area in New Delhi by using Waste Extraction Test (WET) and Toxicity Characteristic Leaching Procedure (TCLP). The WET and TCLP tests were developed by California’s Department of Toxic Substances Control (CDTSC) and the United States Environmental Protection Agency (USEPA) respectively to simulate landfill conditions for metal leaching under laboratory conditions. All metals were leached more in WET compared to TCLP. In WET test, Cd, Cr, Cu, Ni, Pb and Zn exceeded the prescribed threshold limits of CDTSC and failed the test whereas Cd and Pb exceeded the threshold limits of USEPA in TCLP. Though Cu, Ni and Zn are not regulatory metals in TCLP, but their leaching concentrations exceeded the threshold limits of CDTSC. In both the tests, Fe, Mn and Sn were also leached in considerable amounts. In WET, Sn (37.7) leached in maximum percentage followed by Cd (28.7), Zn (27.9), Pb (27.7), Co (21.1), Mn (14.8), Ni (11.4), Fe (8.5), V (7.6), Cu (7.5), Ba (3.5), Cr (2.9) and As (0.4) respectively; whereas in TCLP Co (20.7) leached maximum followed by Cd (17.1), Zn (12.8), Mn (7.1), Ni (6.7), Sn (4.9), Cu (3.1), Pb (2.2), Ba (1.1), Fe (0.4), V (0.3), Cr (0.2) and As (0.1) respectively. The WET test was found to be more aggressive in leaching of metals when compared to TCLP due to citrate ion chelation property. Leaching of metals higher than the threshold limits can cause contamination of soil, surface water and ground water in nearby areas and can affect the human health and environment. Therefore, there is needs to regulate policies and environmentally sound new technologies for e-waste recycling to safeguard the human health and environment.
How to cite: Kumari, H. and Yadav, S.: Metal Leaching from Surface Dust of an Informal E-Waste Recycling area in New Delhi, India, EGU General Assembly 2022, Vienna, Austria, 23–27 May 2022, EGU22-464, https://doi.org/10.5194/egusphere-egu22-464, 2022.
Please decide on your access
Please use the buttons below to download the presentation materials or to visit the external website where the presentation is linked. Regarding the external link, please note that Copernicus Meetings cannot accept any liability for the content and the website you will visit.
Forward to presentation link
You are going to open an external link to the presentation as indicated by the authors. Copernicus Meetings cannot accept any liability for the content and the website you will visit.
We are sorry, but presentations are only available for users who registered for the conference. Thank you.

EGU22-2348 | Presentations | SSS7.2
Ca and Sr in the technozem of various ore deposits of Eastern TransbaikaliaGuliaeva Uliana, Kuzmina Tatyana, and Ermakov Vadim
In the Urov sub-region of the biosphere (Eastern Transbaikalia), a local increased content of Sr in soils and plants was found due to high concentrations of Sr in soil-forming rocks (carbonated granites). The purpose of this study is to assess the concentrations of Ca and Sr in the technozem of dumps and quarries of seven developed deposits (W-Mo, Mo-Cu, Pb-Zn, Au). The fraction of technozem (< 1 mm) was ground to a grain size of 150-200 mesh and analyzed by XRF. The content of Ca and Sr in plant mowing was determined by the flame variant of AAS. It was found that the content of Ca and Sr in 25 samples of technozem varied between 4970-37200 mg/kg (Ca) and 100-620 mg/kg (Sr). The average content of Sr is 308 ± 122 mg/kg. The increased Sr content was characteristic of carbonate technozems with an increased level of Ca (Mo-Cu ore occurrence). Increased accumulation of Ca and Sr in mowing plants was found in the technozems of the Zhireken Mo-Cu deposit: 35100 mg/kg (Ca) and 397 mg/kg (Sr). In general, the concentrations of Ca and Sr in technozem approach to their content in conditionally background soils and do not significantly contribute to the pollution of natural landscapes within the Urov-region of the biosphere.
How to cite: Uliana, G., Tatyana, K., and Vadim, E.: Ca and Sr in the technozem of various ore deposits of Eastern Transbaikalia, EGU General Assembly 2022, Vienna, Austria, 23–27 May 2022, EGU22-2348, https://doi.org/10.5194/egusphere-egu22-2348, 2022.
EGU22-2506 | Presentations | SSS7.2
Database for geochemical assessment of the urban environments: a spatially oriented approachOlga Chernitsova, Natalia Kosheleva, Olga Popovicheva, Dmitry Vlasov, and Oxana Erina
Environmental geochemical studies of urban territories involve heterogeneous information that can be most effectively processed within a unified database (DB). Since a significant portion of the accumulated data is georeferenced, geographic information technologies should be used at all stages of the researches. The purpose of this work is to consider the structure of the DB for information support of ecological and geochemical studies of different urban environments in Moscow within the framework of the Russian Science Foundation project No. 19-77-30004 "Integrated technology for environmental assessment of Moscow megacity based on chemical analysis of microparticle composition in the "atmosphere - snow - road dust - soil - surface water" system (Megacity)".
The project aims to develop technologies for the chemical analysis of the urban environments impacted by the pollutants coming from vehicles, industry, and construction sites, as well as the assessment of the environmental state of the megacity. Various components of the environment are analyzed at several spatial scales: for the entire Moscow city, for administrative districts, for drainage basins of two urban rivers (Moskva and its tributary Setun). The composition of pollutant emissions is characterized using monitoring aerosol data at the Meteorological Observatory of Lomonosov Moscow State University. Microparticles PM10 and PM2.5 are analyzed for the content of elemental carbon, ionic and organic compounds, as well as potentially toxic elements, under different meteorological conditions and seasonal variations. The fallout of aerosols during winter is determined by the chemical analysis of dissolved and solid fractions of snow samples and its comparison with a natural background. Water migration of pollutants is assessed by analyzing river flows (water and suspended/bottom sediments) at reference stations in the Moskva River basin. The ecological state of road dust and soils that accumulate pollutants is estimated in geochemical surveying. Finally, source apportionment is quantified using statistical methods of multivariate analysis.
The development of a DB with the integrated geographic information system (GIS) allows systematizing the spatial and non-spatial information accumulated in field works, chemical and analytical studies, and organizing effective data storage and processing along with providing geoinformation support for DB users. We created four DB subsystems designed for: (1) processing georeferenced data (GIS); (2) working with time series; (3) handling regulatory and reference information; (4) assessing pollution and environmental hazard with computational models. For Moscow megacity, GIS brings together two large blocks of information: spatial layers stored within the geodatabase and spreadsheets with the results of field studies and chemical analyses. The main functions of the GIS are geoprocessing, execution of non-spatial and spatial queries, data analysis (including exploratory spatial data analysis and modeling), visualization of the results.
The report will present subsystems of the DB and the interrelationships between them. The use of the database in practice will be considered on the example of assessing the pollution of road dust with benzo(a)pyrene, accounting for anthropogenic and natural factors.
How to cite: Chernitsova, O., Kosheleva, N., Popovicheva, O., Vlasov, D., and Erina, O.: Database for geochemical assessment of the urban environments: a spatially oriented approach, EGU General Assembly 2022, Vienna, Austria, 23–27 May 2022, EGU22-2506, https://doi.org/10.5194/egusphere-egu22-2506, 2022.
EGU22-2770 | Presentations | SSS7.2
Insights into biochar and metals tolerant bacteria in alleviating ZnO nanoparticles toxicity in plantTatiana Bauer, Vishnu D. Rajput, Tatiana Minkina, Chernikova Natalya, Vladimir Beschetnikov, Aleksei Fedorenko, Svetlana Sushkova, and Saglara Mandzhieva
The application of nanoparticles (NPs) is increasing drastically, especially in crop production. The repeated inputs of metal-based NPs in agri-field could increase their concentration in soil, and cause a threat to sustainable crop production. Thus, the present study was designed to determine the role of spore-forming metal tolerant bacteria (MTB) and biochar (B) to alleviate the toxic effects of high dose of ZnO NPs (2000 mg kg-1) on plants (Hordeum sativum L.) spiked to the soil. For detailed evaluation, the five treatments were used such as 1) clean soil, 2) soil+NPs, 3) soil+NPs+MTB, 4) soil+NPs+B and 5) soil+NPs+B+MTB in plastic vessels in triplicate. The addition of MTB and B showed a promising impact on H. sativum growth in combination and individual inputs. The application of MTB to the contaminated soil reduced the mobility of Zn by 7%, mainly due to exchangeable compounds, and B reduced mobility up to 33%, because of a decrease in equally exchangeable, complex, and specifically sorbed forms. The combined introduction of MTB and B reduced most effectively the actual and potential content of Zn compounds in soil. The content of Zn in H. sativum tissues was increased drastically, especially in ZnO NPs contaminated soil. MTB and B in the contaminated soil reduced Zn accumulation in H. sativum roots by 20% and 63%, and in the aboveground tissues by 11% and 68%, respectively, compared to ZnO NPs polluted soil without amendments. The combined application of MTB and B showed the greatest decrease in Zn accumulation in H. sativum tissues. The root length and H. sativum height was decreased by 52% and 40% in contaminated soil. However, the addition of B, both separately and in combination with MTB reduced root length by 48% and 85%, and plant height by 53% and 40%, respectively, compared to polluted control. The anatomical results also showed an improvement in cellular- sub-cellular organelles, especially in chloroplast by B and in combination with MTB. The results indicate that metal-tolerant bacteria and biochar could be an effective soil amendment to decrease metal toxicity enhance crop growth, and improve soil health.
The research was financially supported by the Russian Foundation for Basic Research, project no. 19-34-60041.
How to cite: Bauer, T., Rajput, V. D., Minkina, T., Natalya, C., Beschetnikov, V., Fedorenko, A., Sushkova, S., and Mandzhieva, S.: Insights into biochar and metals tolerant bacteria in alleviating ZnO nanoparticles toxicity in plant, EGU General Assembly 2022, Vienna, Austria, 23–27 May 2022, EGU22-2770, https://doi.org/10.5194/egusphere-egu22-2770, 2022.
EGU22-4373 | Presentations | SSS7.2
Is thallium in peat a good indicator of anthropogenic contamination? Examples from Czech sites with contrasting pollution histories.Martin Mihaljevic, Vojtech Ettler, and Ales Vanek
The purpose of this study is to describe the Tl distribution and accumulation rates in Czech peat soils with contrasting anthropogenic loads. Nine peat cores were sampled in the mountain areas of the Czech Republic (6 cores in the northern part affected by emissions from coal-burning power plants and 3 in the pristine southern part). In addition, 3 cores were collected close to the Pb mining and smelting area of Pribram. Cores were 210-Pb dated and trace metals/metalloids were measured in the digests by ICP-MS. Maximum Tl concentrations in peat were significantly higher in the polluted northern areas (1.16 mg/kg) and close to the Pb smelter (0.83 mg/kg) than in the pristine area (0.45 mg/kg). Thallium distribution well correlated with other metals (Pb, Hg) and metalloids (As, Sb). Thallium enrichment factors (EFs) calculated against Sc reached the maximum value of 17 indicating significant input of anthropogenic Tl. Thallium accumulation rates in peat varied between 20 and 50 µg/m2/y until 1930s, followed by a significant increase related to industrial activities in the northern part of the Czech Republic (up to 290 µg/m2/y in 1980s). In contrast, maximum Tl accumulation rate at the pristine site was 88 µg/m2/y. Data from the vicinity of Pb mines/smelter indicated higher accumulation rates even in the second half of the 19th century (between 50 and 200 µg/m2/y) followed by a significant decrease in late 1970s as a result of more efficient flue gas cleaning technology installed in the smelter during this period.
How to cite: Mihaljevic, M., Ettler, V., and Vanek, A.: Is thallium in peat a good indicator of anthropogenic contamination? Examples from Czech sites with contrasting pollution histories., EGU General Assembly 2022, Vienna, Austria, 23–27 May 2022, EGU22-4373, https://doi.org/10.5194/egusphere-egu22-4373, 2022.
EGU22-4773 | Presentations | SSS7.2
Trace elements accumulation in cryoconites and periglacial soils of the Central CaucasusRustam Tembotov, Ivan Kushnov, Evgeny Abakumov, and Sebastian Zubrzycki
The problem of retreating glaciers is pronounced in almost all high-altitude and high-latitude landscapes. Black carbon is considered as one of the most important pollutants that contributes to global climate change and the melting of glaciers, especially in polar and mountainous regions due to formation of cryoconite. It is a supraglacial sediment which represents a mixture of black carbon, mineral particles and organic matter. Cryoconites are considered as accumulators of various pollutants such as polycyclic aromatic hydrocarbons, trace elements and radionuclides, which can be transported by aeolian and water flows to the downstream ecosystems and affect the safety of the region both directly and indirectly, through the cultivation of crops and grazing. Moreover, cryoconites considerably reduce the albedo of the glacier and take part in formation of primary soils after its retreat which is especially important in the context of global climate change.
The main purpose of this research is to study the pollution of cryoconites, other sediments and soils by trace elements at the Central Caucasus mountainous region, Russia. Cryoconite, moraines and mudflows were sampled from the biggest valley glacier at the Caucasus mountains, Bezengi Glacier; cryoconite derived soils were collected from the Khulamo-Bezengi Gorge. Chernozems and fresh mudflow samples were collected at Baksan Gorge. Trace elements content was determined by flame and electrothermal atomic absorption spectrometric method according to the standard ISO 11047-1998 at Atomic absorption spectrophotometer. We determined concentrations of Cu, Pb, Zn, Ni, Cd due to the facts that they are the most toxic for human health as well as they are mostly accumulated in a black carbon.
High concentrations of Zn (70.9 mg/kg) and Pb (30.0 mg/kg) in cryoconites have been determined on the Bezengi Glacier, which may be due to both local human activities and allochthonous pollution associated with the arrival of contaminated air masses from other regions. The content of Cu (max. 17.4 mg*kg), Ni (max. 19.0 mg*kg) and Cd (max. 0.052 mg*kg) was relatively low. However, concentrations of Zn (max. 89.2 mg*kg) and Cd (max. 0.313 mg*kg) in cryoconite derived soils were higher than in cryoconite which indicates high input of polluted material from the glacier into downstream ecosystems. The highest level of pollution with some trace elements has been determined in fresh mudflow: Cu = 40.7 mg*kg, Zn = 89.3 mg*kg, Ni = 42.0 mg*kg which also indicates that sediments act as a source of pollutants for mountain ecosystems. Pollution of Chernozems with trace elements was higher than in moraine sediments, however, it was lower than in cryoconites which shows possible impact of these sediments on pollution status of soils in mountainous region.
This work was supported by Russian Foundation for Basic Research, project No 19-05-50107 “The role of microparticles of organic carbon in degradation of ice cover of polar regions of the Earth”.
How to cite: Tembotov, R., Kushnov, I., Abakumov, E., and Zubrzycki, S.: Trace elements accumulation in cryoconites and periglacial soils of the Central Caucasus, EGU General Assembly 2022, Vienna, Austria, 23–27 May 2022, EGU22-4773, https://doi.org/10.5194/egusphere-egu22-4773, 2022.
EGU22-5308 | Presentations | SSS7.2
Activity concentration of radionuclides of natural and anthropogenic-transformed soils in Rostov regionDenis Kozyrev, Sergey Gorbov, Elena Buraeva, and Nadezhda Salnik
Topsoil is a filter that can absorb all wastes of production and anthropogenic activities. During the last 35 years, following several large industrial disasters and artificial radionuclides entering ecosystems, the ways of their migration and impact on living and biosphere systems are attracting close attention. As a result, the determination of both artificial and natural radionuclides in the soil seems relevant and is part of the radiation monitoring of the soil cover in Russia and the world. The purpose of the work was to carry out ecological monitoring of park-recreational, residential areas, as well as specially protected natural areas of the South of European Russia.
The maximum average value of activity for the artificial radionuclide 137Cs was revealed in the soils of specially protected natural territories, there is a maximum variation of values. Significant variation of the obtained activity results relates to large sampling and wide geography of studied objects and proximity to the place of the Chernobyl accident (April 26, 1986). Specific activity of natural radionuclides is at the level of average values typical for the Rostov region, which are confirmed by the previously conducted data. The specific activity in recreational areas and specially protected natural territories is approximately at the same level and has a similar distribution pattern. The arithmetic average of specific activity of the studied radionuclides for the inhabited zones is:137Cs - 13,5 ± 1,3 Bq/kg, 226Ra - 19,0 ± 1,1 Bq/kg, 232Th - 20,6 ± 0,8 Bq/kg, 334 ± 13,3 Bq/kg - 40K; for recreational:15,8 ± 0,9 Bq/kg - 137Cs, 226Ra – 24,0 ± 0,4 Bq/kg, 232Th – 31,5 ± 0,4 Bq/kg, 436 ± 6 Bq/kg - 40K and for specially protected natural areas: 25,6 ± 3,6 Bq/kg - 137Cs, 226Ra – 23,8 ± 0,7 Bq/kg, 232Th – 26,4 ± 0,8 Bq/kg, 365,8 ± 13,1 Bq/kg - 40K.
This study was performed with financially supported by the Ministry of Science and Higher Education of the Russian Federation within the framework of the state task in the field of scientific activity (no. 0852-2020-0029)
How to cite: Kozyrev, D., Gorbov, S., Buraeva, E., and Salnik, N.: Activity concentration of radionuclides of natural and anthropogenic-transformed soils in Rostov region, EGU General Assembly 2022, Vienna, Austria, 23–27 May 2022, EGU22-5308, https://doi.org/10.5194/egusphere-egu22-5308, 2022.
EGU22-5779 | Presentations | SSS7.2
Effect of benzo(a)pyrene on the morphometric characteristics of tomato plants (Solanum Lycopersicum) under the conditions of a model experimentAndrey Barbashev, Tamara Dudnikova, Tatiana Minkina, Svetlana Sushkova, Gulnora Bakoeva, Elena Tikhonenko, Natalya Chernikova, Md Mahfuzur Rahman, and Hazrat Amin
Polycyclic aromatic hydrocarbons (PAHs) are organic compounds of the benzene series, which differ in the number of benzene rings. Due to their carcinogenic and mutagenic properties, they have been included in the list of priority pollutants by the US Environmental Protection Agency and the European Community. Among all PAHs, there is a mutagen and a carcinogen of the 1st hazard class - benzo (a) pyrene (BaP), which is most often used as a marker of environmental pollution with PAHs. Up to 95% of the emitted pollutants are accumulated by the soil in various chemical forms. Since plants are inextricably linked with the soil, it becomes necessary to study the behaviour of PAHs in the formed plant-soil system. The aim of the study was to evaluate the effect of BaP on the morphometric characteristics of tomato plants under the conditions of a model experiment.
The studies were carried out under the conditions of a vegetation experiment. The soil was sifted through a sieve with a diameter of 1 mm and placed in 2 kg pots in 4 L pots. A BaP solution in acetonitrile was added to the soil surface based on the creation of a pollutant concentration in the soil of 400 and 1200 ng / g, which corresponds to 20 and 60 MPC of BaP. The original uncontaminated soil was used as a control. The soil was sown with tomato plants (Solánum lycopérsicum) of the early maturing variety White filling 241. The experiment was repeated three times. We analyzed such morphometric parameters as root length and stem height, as well as dry biomass of plants.
The root length and stem height in the control sample is set at 32 and 63 cm, respectively. In the samples contaminated with 20 MPC BaP, these indicators were lower, so the root length was 19 cm, and the stem height was 40 cm. In the samples with the introduction of 60 MPC BaP, the root length decreased to 14 cm and the stem height - to 27 cm.
In the control sample, the dry biomass of the roots was 10.3 g and the vegetative part was 80.2 g. When 20 MPC BaP was applied, these parameters decreased to 6.8 g of roots and 67 g of the vegetative part. In the samples with the introduction of 60 MPC BaP, the biomass of the roots was 3.1 g and the biomass of the vegetative part was 44 g, which is lower than the control values.
Thus, a decrease in the length of roots and the height of plant stems, as well as a decrease in their biomass relative to the control values, was established, which indicates that tomato plants are quite susceptible to soil pollution with BaP.
The research was financially supported by the Ministry of Science and Higher Education of the Russian Federation project on the development of the Young Scientist Laboratory (no. LabNOTs-21-01AB).
How to cite: Barbashev, A., Dudnikova, T., Minkina, T., Sushkova, S., Bakoeva, G., Tikhonenko, E., Chernikova, N., Rahman, M. M., and Amin, H.: Effect of benzo(a)pyrene on the morphometric characteristics of tomato plants (Solanum Lycopersicum) under the conditions of a model experiment, EGU General Assembly 2022, Vienna, Austria, 23–27 May 2022, EGU22-5779, https://doi.org/10.5194/egusphere-egu22-5779, 2022.
EGU22-8325 | Presentations | SSS7.2
Comparison of the Spatial Distribution of Thyroid Cancer Morbidity and Geochemical Factors in Areas of the Bryansk Region (Russia)Vladimir Baranchukov, Elena Korobova, Sergey Romanov, and Irina Kurnosova
Bryansk region is only Russian, where total radionuclide contamination exceeding 1480 kBq/m2 was detected after the Chernobyl accident. At the same time, a definite increase in the incidence of thyroid cancer (ICD-10 code C73) was recorded in this area. From 1990 to 2020, thyroid cancer morbidity in the region increased up to 18.7 cases per 100 000 population compared to the mean value of this parameter for Russia is 6.2 (Kaprin et al., 2020) and 6.0 global (Deng et al., 2020).
To study the geochemical factors responsible for the distribution of thyroid gland diseases, we applied some specialized geographic information system methods. Our approach is based on the idea of a two-layers spatial structure of the modern noosphere (Korobova, 2017). According to the developed approach, the natural geochemical background presented by the soil cover structure is overlain by technogenic contamination fields. In this case, we hypothesize that revealing the causes of the diseases is possible by evaluating the correlation between the two structures: the geochemical and the diseases'.
To analyze the spatial distribution of morbidity, we used the method of kernel density (Silverman, 1986) and the analysis of the obtained maps of thyroid cancer allowed us to identify five territories (with an area of 100-200 km2) characterized by high morbidity (18.0-55.7 cases) and four territories with low morbidity (2.7-10.6 cases). Spatial evaluation of the difference between the original experimental data on iodine content in soils, drinking water, and 137Cs deposition in settlements located in areas with high and low thyroid mobidity was performed to estimate natural and anthropogenic geochemical factors contributing to the spread of thyroid diseases. Non-parametric Mann-Whitney U test showed significantly higher iodine content in centralized water supply (Z=1.46, p=0.06), pasture soils (Z=2.10, p=0.03), local milk (Z=1.71, p=0.08), and lower 137Cs deposition, which is used to the restoration of 131I contamination of the territory (Z=-4.43, p<0.001) in areas with low thyroid morbidity). In our opinion, this witnesses a definite contribution of geochemical factors (iodine deficiency and radioiodine contamination) to the specific spatial distribution of thyroid gland diseases.
The study was partly funded by RFBR (project #20-55-00012) and BRFBR (project #X20P-386).
References:
Kaprin, A., Starinsky, V., Prteova, G. (Eds.) (2021). Malignant neoplasms in Russia in 2020 (morbidity and mortality). National Medical Research Radiological Centre of the Ministry of Health of the Russian Federation, Moscow (in Russian)
Deng, Y. et al. (2020). Global Burden of Thyroid Cancer From 1990 to 2017. JAMA Network Open, 3(6), e208759. https://doi.org/10.1001/jamanetworkopen.2020.8759
Korobova, E.M. (2017). Principles of spatial organization and evolution of the biosphere and the noosphere. Geochem. Int. 55, 1205–1282 (2017) doi:10.1134/S001670291713002X
Silverman, B.W. (1986). Density estimation for statistics and data analysis: Monographs on statistics and applied probability. London; New York: Chapman and Hall
How to cite: Baranchukov, V., Korobova, E., Romanov, S., and Kurnosova, I.: Comparison of the Spatial Distribution of Thyroid Cancer Morbidity and Geochemical Factors in Areas of the Bryansk Region (Russia), EGU General Assembly 2022, Vienna, Austria, 23–27 May 2022, EGU22-8325, https://doi.org/10.5194/egusphere-egu22-8325, 2022.
Please decide on your access
Please use the buttons below to download the presentation materials or to visit the external website where the presentation is linked. Regarding the external link, please note that Copernicus Meetings cannot accept any liability for the content and the website you will visit.
Forward to presentation link
You are going to open an external link to the presentation as indicated by the authors. Copernicus Meetings cannot accept any liability for the content and the website you will visit.
We are sorry, but presentations are only available for users who registered for the conference. Thank you.
EGU22-8951 | Presentations | SSS7.2
Preliminary risk assessment of metal contamination of urban soils in Taganrog, RussiaElizaveta Konstantinova, Anatoliy Barakhov, Natal’ya Chernikova, Tamara Dudnikova, Andrey Barbashev, and Iliya Lobzenko
Long-term anthropogenic impact as a result of urbanization leads to environmental pollution by potentially toxic elements (PTEs). Soil metal contamination poses significant risks for the conjugated landscape components and for the public health. Taganrog is the second largest city in the Rostov Oblast with a population of 248,600 people, with a developed metallurgy and mechanical engineering. The aim of the study is to evaluate possible ecological and human health risks related to PTEs in urban topsoils of Taganrog.
Topsoil samples (0–20 cm deep) were collected in summer 2021. The total concentrations of Cr, Mn, Ni, Cu, Zn, Cd, and Pb were determined by X-ray fluorescence analysis using a Spectroscan MAX-GV spectrometer (Spectron, Russia). Individual environmental risks were assessed using the potential ecological risk factors (Er and MEr), integral risks were identified using the potential ecological risk indices (RI and MRI). Human health risk assessment was based on the US EPA model (1989). The noncarcinogenic risk, expressed as a hazard quotient (HQ), was evaluated by comparing the average daily dose of pollutant with a reference dose. To assess the cumulative noncarcinogenic risk, a total hazard index (HI) was used. The carcinogenic risk (CR) was calculated as lifetime average daily dose of a pollutant multiplied by the corresponding carcinogen slope factor. The total carcinogenic risk (TCR) of exposure to elements along all routes of intake was calculated as sum of CR.
The individual ecological risks of all elements were low (Er and MEr <40), with the exception of Cd. The environmental risk due to Cd pollution, assessed by Er, was moderate (55.8–70.1) in 27.3% of the samples and considerable (89.4–106.6) in 18.2% of the samples. In 36.4% of the samples was moderate Cd risk (MEr 41.6–71.1). According to RI, moderate risk was detected only in 9.1% of samples; the rest of the samples are characterized by a low risk. Values of RI ranged from 20.6 to 197.1 with a mean of 84.0. The integral environmental risk, assessed by MRI, was low in all studied samples and ranged from 13.7 to 131.4.
Noncarcinogenic risks were more likely caused by intake of As and Pb (HQ>1). For both children and adults, the risk associated with the oral intake of pollutants was the greatest. The HI values for children varied from 0.9 to 5.6, on average 2.3, for adults - from 0.1 to 0.7, on average 0.3. Most of the territory was characterized by a medium non-carcinogenic risk for children (90.9% of samples) and a low risk for adults (100%). Significant CR (>1 × 10⁻⁶) was associated with long-term exposure to As and Pb. The TCR values under the combined effect of PTEs ranged from 2.1 × 10⁻⁵ to 1.5 × 10⁻⁴, on average 5.5 × 10⁻⁵. In general, the level of carcinogenic risk in the city was assessed as moderate in 81.8% of samples and as unacceptable in 18.2% of samples.
This work was funded by the Council for Grants of the President of the Russian Federation, grant no. MK-4654.2022.1.5.
How to cite: Konstantinova, E., Barakhov, A., Chernikova, N., Dudnikova, T., Barbashev, A., and Lobzenko, I.: Preliminary risk assessment of metal contamination of urban soils in Taganrog, Russia, EGU General Assembly 2022, Vienna, Austria, 23–27 May 2022, EGU22-8951, https://doi.org/10.5194/egusphere-egu22-8951, 2022.
EGU22-9123 | Presentations | SSS7.2
Global pollutant concentrations in coal mine soils: Discussing an approach to the meta-studyJaume Bech, Alexey Alekseenko, Maria Machevariani, and Daniel Karthe
The extraction of solid fossil fuels results in the accumulation of overburden and host rocks stored on the Earth's surface. Coal mining sites are among the most disturbed and polluted areas. Soils are affected by these transformations in multiple ways, including structural changes, the loss or suppression of vegetation cover, and the migration and accumulation of chemical elements in soils and water. To assess the global concentrations of chemical elements in the coal mine soils, we discussed and developed a meta-study on pollutants in Technosols and altered natural soils. For this, we collected data from papers published in peer-reviewed journals between 2000 and 2022, covering 25 major coal-producing countries of Eurasia, Africa, Australia, and the Americas. To understand better the patterns of soil pollution driven by coal extraction itself, we gathered the concentrations measured in soils, spoils, and dumps near open-cut and underground coal mines. For the same reason, the data on pollutants in remediated or reclaimed soils, as well as in soils near coal power plants (or other pollution sources) were excluded. Likewise, we did not consider other abiotic (e.g., coal ash, mine water) or biotic media (e.g., grasses, trees, and plants in general) even though they are undoubtedly interlinked. Moreover, the data on soil pollution are far more abundant and thus statistically significant.
The typical set of keywords used for searching in databases included “coal mine”, “soil/dumps”, “pollution/contamination”, and “elements/metals”. Obviously, other terms like “colliery”, or “wasterock”, or “geochemical transformation” were applied too but gave fewer search results. To harmonize measurement units, we recalculated all data to mg/kg or ppm. When necessary, concentrations were recalculated from oxides into elemental forms. To confirm the representativeness of the figures, we checked the number of specimens analyzed in each research. The total number of samples used in the meta-study was over 7,000. For the standard statistical processing, the mean concentrations were collected alongside the minimum and maximum contents, and standard deviation values; when not provided in a paper, they were calculated from the raw data. After that, we obtained the average contents of chemical elements that characterize each coalfield separately.
The preliminary results reveal that priority pollutants are inherited from the world averages for trace element contents in coals rather than the natural background. In other words, concentrations of priority pollutants are predominantly determined by coal extraction and the release of related pollutants. The research outcomes indicate that the oxidation-reduction and alkaline-acid milieu, water and temperature regimes, sorption capacity, and other landscape-geochemical conditions are being ambiguously transformed in new ecosystems and can be derived from both natural conditions and the man-inflicted damage. The geochemical cycles in biocenoses are altered and the tasks for their restoration may vary significantly. The established global concentrations of chemical elements in coal mine soils can be used for comparative assessments and the management of legacy contamination and soil/landscape rehabilitation in post-mining regions. However, remediation efforts will also need to consider site-specific geological, hydrological, and climatic characteristics as well as socio-economic conditions and other regional development objectives.
How to cite: Bech, J., Alekseenko, A., Machevariani, M., and Karthe, D.: Global pollutant concentrations in coal mine soils: Discussing an approach to the meta-study, EGU General Assembly 2022, Vienna, Austria, 23–27 May 2022, EGU22-9123, https://doi.org/10.5194/egusphere-egu22-9123, 2022.
EGU22-9248 | Presentations | SSS7.2 | Highlight
Ecological risks of PTEs pollution in soils of the Lower Don floodplain and the Taganrog Bay coastTatiana Minkina, Elizaveta Konstantinova, Nevidomskaya Dina, Tatiana Bauer, Saglara Mandzhieva, Vishnu Rajput, Irina Deryabkina, Vladimir Beschetnikov, Iliya Lobzenko, Svetlana Sushkova, and Muhammad Tukur Bayero
The Lower Don basin and the adjacent coastal zone of the Azov Sea are considered one of the most economically developed and anthropogenically transformed regions within Southern Russia. This territory is characterized by a high degree of urbanization, intensive agriculture, and diverse transport infrastructure facilities. Long-term anthropogenic activities have resulted in a strong transformation of the natural environment of the Lower Don floodplain, the Don Delta and Taganrog Bay coast. One of the main consequences of human activities is related to the degradation of vegetation and soil cover of subaquatic landscapes caused by pollution of potentially toxic elements (PTEs). The main aim of this study was to assess potential environmental risks of Cr, Mn, Ni, Cu, Zn, As, Cd, and Pb in soils of the Lower Don floodplain and the Taganrog Bay coast.
The floodplain and coastal landscapes of the study area are dominated by Eutric and Calcaric Gleyic Fluvisols, Gleyic Fluvisols (Humic), Gleyic Phaeozems and Haplic Chernozems which are background soils of the region are less common. Soil samples were collected in summer 2020 from the surface soil horizon (0–20 cm deep). The total concentrations of Cr, Mn, Ni, Cu, Zn, Cd, and Pb were determined in air-dried powder samples by X-ray fluorescence analysis using a Spectroscan MAX-GV spectrometer (Spectron, Russia). Environmental risks were assessed using potential ecological risk factor (Er) and the potential ecological risk index (RI) based on the single pollution index (PI) and modified potential ecological risk factor (MEr) and the modified potential ecological risk index (MRI) based on the Müller geoaccumulation index (Igeo).
The obtained results showed that Er and MEr indicated a low ecological risk for most of the PTEs studied, with the exception of Cd, which was found to be moderate in 8% and 3.5% of the samples, respectively. The highest values of both Er and MEr for Cd were detected in the soils of the Don Delta. Integral ecological risk assessed using RI and MRI, based on the sum of all Er and MEr, respectively, was low in all samples studied. Values of RI ranged from 10.52 to 86.87 with a mean of 32.2. Similar results were observed for MRI, which ranged from 7.01 to 57.91 with a mean of 21.46. The highest values of both RI and MRI were observed in soils of the Don Delta in the vicinity of urbanized territories, which indicates an additional supply of PTEs due to more significant anthropogenic pressure. Thus, according to the results of the study, the risk of a potential negative impact of soil pollution on adjacent components of the landscapes of the Lower Don and Taganrog Bay does not cause serious concerns. Apparently, a relatively favourable land-use regime with a predominance of agriculture has developed in the region.
This work was funded by the Russian Science Foundation, grant no. 20-14-00317.
How to cite: Minkina, T., Konstantinova, E., Dina, N., Bauer, T., Mandzhieva, S., Rajput, V., Deryabkina, I., Beschetnikov, V., Lobzenko, I., Sushkova, S., and Tukur Bayero, M.: Ecological risks of PTEs pollution in soils of the Lower Don floodplain and the Taganrog Bay coast, EGU General Assembly 2022, Vienna, Austria, 23–27 May 2022, EGU22-9248, https://doi.org/10.5194/egusphere-egu22-9248, 2022.
EGU22-9523 | Presentations | SSS7.2
Concentrations and migration forms of strontium in groundwater used for drinking within the Moscow artesian basin (Russia, Bryansk region)Liudmila Kolmykova and Elena Korobova
The geochemical features of stable strontium distribution in groundwater of the Upper Devonian hydrogeological complex within the southwestern flank of the Moscow artesian basin used for centralized drinking water supply in the northeastern part of the Bryansk region were considered in order to detail the potential influence of additional geochemical factors on the manifestation of endemic decease caused by natural iodine deficiency.
Strontium concentration in water samples varied from 0.21 to 28.8 mg/l (median (Me) = 1.03 mg/l, n=34). The analysis of strontium distribution with considering the genetic features of water-bearing rocks showed no significant differences in the content of this element in the waters of depositions of the Frasnian (Me=0.86 mg/l, n=25) and Famennian stages (Me=1.09 mg/l, n=9) (p<0.01). The main sources of strontium in investigated groundwater are strontium-containing minerals (celestine) or strontium impurities in limestones of varying degrees of gypsification associated with the Upper Devonian carbonate rocks (Sr correlation with SO4: r<0.05=0.78). The maximum levels of strontium, which significantly exceed the Russian hygienic standard for drinking waters (7 mg/l), were detect in groundwater of Famennian sediments of the Rognedinsky district of the Bryansk region (>20 mg/l). Given the lack of significant correlation between strontium content and water salinity, which is usually observed for strontium-enriched artesian waters of regional hydrogeochemical provinces (Kraynov et al., 2012) it can be explained by the existence of natural local strontium anomaly in this area (Сa/Sr <7).
Membrane filtration of water samples allowed suggesting that strontium migrate in fresh and low-salinity waters mainly within dissolved fraction of groundwater (divalent cation and complexes with sulfate, chloride and hydrocarbonate) with sizes not exceeding 0.45 µm.
The presence of a local anomaly of strontium-containing waters within the Moscow artesian basin, which impair the quality of drinking water in this area, can be a factor of potential risk to the health of the local population living under conditions of iodine deficiency.
The reported study was funded by the Vernadsky Institute federal budget (research task #0137-2019-0006). The Field work was partly funded by RFBR and BRFBR project #20-55-00012 and BRFBR project # Х20Р-386.
How to cite: Kolmykova, L. and Korobova, E.: Concentrations and migration forms of strontium in groundwater used for drinking within the Moscow artesian basin (Russia, Bryansk region), EGU General Assembly 2022, Vienna, Austria, 23–27 May 2022, EGU22-9523, https://doi.org/10.5194/egusphere-egu22-9523, 2022.
Please decide on your access
Please use the buttons below to download the presentation materials or to visit the external website where the presentation is linked. Regarding the external link, please note that Copernicus Meetings cannot accept any liability for the content and the website you will visit.
Forward to presentation link
You are going to open an external link to the presentation as indicated by the authors. Copernicus Meetings cannot accept any liability for the content and the website you will visit.
We are sorry, but presentations are only available for users who registered for the conference. Thank you.
EGU22-10028 | Presentations | SSS7.2
A study of iodine concentration in soils and drinking waters of the Mountainous CrimeaVictor Berezkin, Victor Glebov, Elena Kayukova, and Elena Korobova
Iodine deficiency is the most common cause of endemic goiter and other diseases, largely due to the geographical features of the regions. Iodine deficiency diseases can occur not only in inland regions and high-altitude areas, but also in those regions where iodine is poorly involved in the food chains of the local population. Thus, for some territories, an important factor of iodine deficiency may be the diversity of rocks and the difference in soils and aquifers caused by them.
The purpose of the article is to identify the contrast in the concentration of iodine content in the soil cover and natural drinking waters in the Mountainous Crimea, on different rocks. Soil and water samples collected in several regions of the Mountainous Crimea, mostly in Bakhchisarai, were examined.
Samples of natural drinking water (n=34) were taken in three districts of the Mountainous Crimea (Bakhchisarai, Alushta and Simferopol) from various sources (rivers, wells, ponds, aqueduct) in 2017. Soil samples (n=23) were taken in the Bodrak River valley (Bakhchisarai district) from the upper horizons (sampling depth up to 20 cm) in 2019. Iodine was determined by kinetic thiocyanate-nitrite method in the laboratory of the Institute of Geochemistry of the Russian Academy of Sciences.
The iodine content in the surveyed drinking water sources corresponds to the existing standards (2-10 μg/l), however, for some sources, extremely low values of iodine content are observed (both for wells 0.89 μg/l and for private pumps and aqueduct 1.11 μg/L), which can be determined primarily by the composition of the water-bearing rocks. The highest median values are marked for springs (Me=5.34 μg/L; n=8) and rivers (Me=6.77 μg/L; n=8), the lowest for aqueduct (Me=1.74 μg/L; n=7). The high variability of iodine in the soils of the automorphic landscapes of the Crimean Mountains was established from 0.43 mg/kg (mountain cambisols) to 15.4 mg/kg (regosols), depending on the humus content and the pH. The highest median values are marked for regosols (Me=5.6 mg/kg; n=13) and cambisols (Me=1.7 mg/kg; n=6), the lowest for fluvisols (Me=1.1 mg/kg; n=4).
The dependence of the iodine content in the upper horizons of different types of soils, primarily on the content of humus and soil pH-water, has been established. It has been confirmed that the content of iodine in natural waters is primarily determined by the difference in aquifers. The study was carried out without financial support, with the partial support of the Laboratory of Biogeochemistry of the Russian Academy of Sciences, which provided equipment for measuring iodine.
How to cite: Berezkin, V., Glebov, V., Kayukova, E., and Korobova, E.: A study of iodine concentration in soils and drinking waters of the Mountainous Crimea, EGU General Assembly 2022, Vienna, Austria, 23–27 May 2022, EGU22-10028, https://doi.org/10.5194/egusphere-egu22-10028, 2022.
Please decide on your access
Please use the buttons below to download the presentation materials or to visit the external website where the presentation is linked. Regarding the external link, please note that Copernicus Meetings cannot accept any liability for the content and the website you will visit.
Forward to presentation link
You are going to open an external link to the presentation as indicated by the authors. Copernicus Meetings cannot accept any liability for the content and the website you will visit.
We are sorry, but presentations are only available for users who registered for the conference. Thank you.
EGU22-10054 | Presentations | SSS7.2
Analysis and comparison of the composition, functional groups, sorption characteristics and surface structure of biochar affected by biomass feedstockIlia Lobzenko, Tatiana Bauer, Marina Burachevskaya, Tatiana Minkina, Alexey Fedorenko, Mahmoud Mazarji, Svetlana Sushkova, Saglara Mandzhieva, Vishnu Rajput, Inna Zamulina, Alexey Scherbakov, and Viktoria Severina
Biochar is the perfect solution to reduce the adverse effects of climate change by adopting viable solutions inspired by nature. Since biochar can be made from a variety of different sources, the paper aims to compare the properties of biochar made from different sources, including wood, sunflower, and rice husk. The results obtained from the elemental analysis showed that there are no exceeding the maximum permissible concentrations of trace elements in any of the samples. Moreover, it was found silicon oxide is presented in rice husk. IR spectroscopy of wood biochar and sunflower husk biochar showed the presence of hydroxyl functional groups and aliphatic C-H groups of cellulose, as well as phenolic functional groups and esters. In addition, the total surface area of the wood biochar and rice husk biochar is found to be highest and lowest, respectively. It was found that the total volume of pores in the following descending order rice husk>wood>sunflower. The SEM and 3D confocal microscopy results indicate that wood biochar contains the surface with the most upside-down as compared to other samples. The XRD demonstrated that wood and sunflower husk biochar samples take crystallinity from cellulose compared to rice husk biochar. TGA results manifested that the wood biochar is more stable, and the new step as the decomposition of lignin part results by increasing the temperature up to 500 °C. The addition of all the biochars to the soil (Сalcaric Fluvic Arenosols) increases the sorption capacity of the soil under mono- and polyelement contamination by copper, zinc, and lead.
This study was supported by RFBR project no. 19-05-50097, Grant of the President of Russian Federation project no. МК-6137.2021.1.5 and by the Strategic Academic Leadership Program of the Southern Federal University ("Priority 2030").
How to cite: Lobzenko, I., Bauer, T., Burachevskaya, M., Minkina, T., Fedorenko, A., Mazarji, M., Sushkova, S., Mandzhieva, S., Rajput, V., Zamulina, I., Scherbakov, A., and Severina, V.: Analysis and comparison of the composition, functional groups, sorption characteristics and surface structure of biochar affected by biomass feedstock, EGU General Assembly 2022, Vienna, Austria, 23–27 May 2022, EGU22-10054, https://doi.org/10.5194/egusphere-egu22-10054, 2022.
EGU22-10118 | Presentations | SSS7.2 | Highlight
Spatial analysis of cancer distribution in Gomel and Mogilev oblasts of Belarus as a preliminary stage for revealing the provoking local factorsSergey Romanov, Aleksander Chervan, and Elena Korobova
A series of maps using different GIS spatial analysis techniques were constructed to perform spatial analysis of the distribution of oncological diseases in Belorussia. Mapping was based on the data of the national cancer register, which contains considerable information of all cancer cases of different localization and allows separation of different sex and age groups of the population. Preliminary data verification showed a high variation of cancer cases in different areas. The second step of the research confirmed the high spatial heterogeneity of medical data when the maps characterizing different variation levels of cancer cases were made using a specialized GIS. After that, the regional zoning was carried out for the Gomel and Mogilev regions most subjected to the Chernobyl radionuclides fallout in Belarus and the areas with a significant difference in the level of general and localized cancer rates were separated. The general picture showed that the actual risk level of the oncological diseases (including those of different localization) spatially varies by four times or even more. Such a significant change in the frequency of occurrence of cancer cases of mans and women within limited areas univocally showed on the local factors that can provoke such an increase in morbidity. Considerable radioactive contamination after the Chernobyl accident within this area obvious could be such a factor. However, the obtained maps showed a high level of differentiation before the Chernobyl catastrophe and no definite correlation with radionuclide fallout maps. In any case, in our opinion, the revealed zones of enhanced cancer morbidity and those where the morbidity appeared to be minimal should become the objects of priority study. Those which represent the highest density of cancer cases need priority examination and prevention.
The study was partly funded by RFBR and BRFBR project #20-55-00012 and BRFBR project # Х20Р-386.
How to cite: Romanov, S., Chervan, A., and Korobova, E.: Spatial analysis of cancer distribution in Gomel and Mogilev oblasts of Belarus as a preliminary stage for revealing the provoking local factors, EGU General Assembly 2022, Vienna, Austria, 23–27 May 2022, EGU22-10118, https://doi.org/10.5194/egusphere-egu22-10118, 2022.
Please decide on your access
Please use the buttons below to download the presentation materials or to visit the external website where the presentation is linked. Regarding the external link, please note that Copernicus Meetings cannot accept any liability for the content and the website you will visit.
Forward to presentation link
You are going to open an external link to the presentation as indicated by the authors. Copernicus Meetings cannot accept any liability for the content and the website you will visit.
We are sorry, but presentations are only available for users who registered for the conference. Thank you.
EGU22-10220 | Presentations | SSS7.2 | Highlight
An approach for evaluating the level of plastic residues in agricultural soilsManuel Hernandez, Rosa Peñalver, Natalia Arroyo-Manzanares, Natalia Campillo, Ignacio López-García, and Pilar Viñas
There is a continuous increase of the use of plastic materials globally, which makes difficult to manage their waste, constituting an important source of pollution for the different environmental areas. Specifically, the long-term quality and productivity of agricultural soils is affected by the contamination of these plastic residues, being these pollutants mainly present as microplastics coming from the degradation of the larger initial plastic contaminants. In addition, plastics contain different additives to improve their properties which are normally toxic organic compounds which may have a negative impact to the agricultural environment.
The purpose of this research is to develop and validate an analytical method based in a solid-liquid extraction stage followed by gas chromatography coupled to mass spectrometry (GC-MC) to determine volatile organic compounds related to plastics (monomers, additives, and degradation products) in soil samples of agricultural areas. For this purpose, a number of samples were collected in a wide zone located in the Rambla del Beal (Cartagena, Spain).
The optimized method has allowed the quantification of 14 volatile compounds, such as styrene, phthalates or bisphenol A that may be released from plastic residues, because they are monomeric species or additives. Other species associated to the degradation (environmental conditions over time) of the plastic residues such as 2,4-diterbutylphenol have been also found in the samples.
In addition, a non-targeted approach has been developed for the identification of other pollutants present in the soil samples without the use of standards. This goal was achieved by the use of the mass spectrometer detector working in the full scan mode and the application of MS database libraries (NIST and Wiley).
This analytical methodology represents a basis for a reliable evaluation of the presence of plastic pollutants in soils through the determination of their additives, monomers and degradation compounds.
The authors are grateful to the Spanish MICINN (Project PGC2018-098363-B-100) for financial support
How to cite: Hernandez, M., Peñalver, R., Arroyo-Manzanares, N., Campillo, N., López-García, I., and Viñas, P.: An approach for evaluating the level of plastic residues in agricultural soils, EGU General Assembly 2022, Vienna, Austria, 23–27 May 2022, EGU22-10220, https://doi.org/10.5194/egusphere-egu22-10220, 2022.
EGU22-10446 | Presentations | SSS7.2 | Highlight
Arsenic dynamics in soils placed near old mining sites in SE SpainCarmen Pérez-Sirvent, Maria Jose Martínez Sánchez, Salvadora Martínez López, Lucia Belén Martínez Martínez, Carmen Hernández Pérez, Carmen Gomez Martinez, Manuel Hernández-Córdoba, and Jaume Bech
Arsenic is a Potentially Toxic Element (PTE), which is present in the soils/sediments of abandoned mining areas, such as the Sierra Minera de Cartagena La-Unión and the mining site of Mazarron (SE Spain) and its areas of influence. In order to assess the risk to human health and the ecosystem, it is necessary to know the nature of the materials that contain this PTE, their alterability and their speciation.
On the one hand, there is a geogenic relationship between this element and materials rich in phyllosilicates and Fe minerals. These minerals can constitute primary mineralisation such as sulphide veins (pyrite, arsenopyrite, etc.) or secondary mineralisation such as haematite, goethite, siderite, jarosite, etc., and can even be found as a mineral phase forming various arsenates. Another very important aspect is the climatology of the area, which coincides with a semi-arid Mediterranean climate with infrequent but very heavy rainfall.
The As concentration range in the studied areas is very wide (5000 -70 mg.Kg-1), with an average value of 150 mg.Kg-1, being As (V) the predominant species. Only soils located in wetland areas with permanent waterlogging can show significant concentrations of As(III).
The As content in surface waters, such as runoff water, is low, only reaching significant values (>2 mg.L-1) when these waters are acid mine drainage and have pH values <2, coinciding in these cases with the presence of reduced As forms.
Particulate As is associated both with Fe oxides and hydroxides, through surface adsorption processes on Fe(OH)3 particles, and with carbonates, through precipitation reactions as calcium arsenate. These reactions are evident in some places such as wadis that transport particulate and dissolved materials from areas affected by mining, and mainly take place both in the riverbed and in flooding areas when rainfall events occur.
For an appropriate understanding of the main processes involved, a detailed scheme is given. It should be noted that the dynamics of this PTE is of a particular interest in the zones studied due to the proximity of urban sites.
How to cite: Pérez-Sirvent, C., Martínez Sánchez, M. J., Martínez López, S., Martínez Martínez, L. B., Hernández Pérez, C., Gomez Martinez, C., Hernández-Córdoba, M., and Bech, J.: Arsenic dynamics in soils placed near old mining sites in SE Spain, EGU General Assembly 2022, Vienna, Austria, 23–27 May 2022, EGU22-10446, https://doi.org/10.5194/egusphere-egu22-10446, 2022.
EGU22-11146 | Presentations | SSS7.2
Cytotoxic and genotoxic effects of macro- and nano-form of heavy metals in Pisum sativum L. grown in soilNatalia Chernikova, Arpna Kumari, Vasiliy Chokheli, Vishnu Rajput, Saglara Mandzhieva, Viktoria Shuvaeva, Viktoria Tsitsuashvili, Anatoly Barakhov, Dina Nevidomskaya, Michael Kirichkov, and Alena Timoshenko
Improper dumps are one of the most common indicators of accumulated harm and are a source of a wide range of pollutants entering the environment. The waste of packaging materials, household chemicals, agrochemicals, used industrial catalysts, ash from thermal waste disposal, and other contaminants have been identified as sources of their introduction into soils from dumps. The accelerated applications of nano-forms of metals are one of the emerging concerns. Like other contaminants, the soil is the main sink for nanoparticles (NPs). Undoubtedly, in the last decade, metal NPs have been recognized for their numerous roles in research and development but due to their increasing amount in the environment, these emerging issues cannot be ignored. Therefore, with this background, the current work was proposed, in which, Pisum sativum L. was exposed to nano-disperse (30-50 nm) and macro-disperse (3-5 μm) forms of metal oxide viz., Cu, Zn, Cr, Mn, Cd, Ti, Ni, and Pb at the doses of 3, 30, and 90 background contamination (in mg/kg). After 3-4 days of exposure, the emerged roots were harvested, cleaned with distilled water, and fixed in Clark’s fluid (aceto-alcohol) for further analyses. For microscopic observations, slides were prepared using the squash technique. In this work, the mitotic index and frequency of chromosomal aberrations were recorded to depict the extent of cytotoxic and genotoxic effects, respectively. The experimental outcomes revealed that the maximal genotoxicity was found in all soil samples at the level of 90 background contamination, regardless of the macro- or nano-state of the metals. Besides, the commonly observed chromosomal aberrations were bridges and fragments. Also, cell ruptures at the metaphase stage, forming a metaphase plate was found but rarely. Thus, the current observation depicted the cytotoxicity and genotoxicity of different nano- and macro-disperse forms of metals, however further studies are needed to explore the responsible mechanisms for these toxicological vulnerabilities.
This study was supported by Russian Science Foundation project no. 21-77-20089.
How to cite: Chernikova, N., Kumari, A., Chokheli, V., Rajput, V., Mandzhieva, S., Shuvaeva, V., Tsitsuashvili, V., Barakhov, A., Nevidomskaya, D., Kirichkov, M., and Timoshenko, A.: Cytotoxic and genotoxic effects of macro- and nano-form of heavy metals in Pisum sativum L. grown in soil, EGU General Assembly 2022, Vienna, Austria, 23–27 May 2022, EGU22-11146, https://doi.org/10.5194/egusphere-egu22-11146, 2022.
EGU22-12209 | Presentations | SSS7.2
Geochemical transformations in liquid and solid phases of forest-steppe soils in the affected area of Moscow brown coal basin (Russia)Alexander Kostin, Pavel Krechetov, Olga Chernitsova, and Elena Terskaya
Long-term coal mining (more than 50 years) in the Moscow basin has a complex negative effect on soils. Because of underground mining at coal fields spoil heaps with a high content of iron sulfides, aluminosilicates and organic carbon of coal origin were formed. Oxidation of sulfides and acid hydrolysis of aluminosilicates in waste dumps results in the producing of toxic sulfuric acid, Al and Fe sulfates (Nordstrom and Alpers 1999). Acid mine drainage (AMD) entering from eroded spoil heaps, leads to physico-chemical and morphological changes in soil characteristics. On foreslopes around spoil heaps technogenically transformed soils are common. Our study aimed at evaluation of post-mining geochemical evolution of chemical composition and properties of solid and liquid soil phases.
We examined two key sites within abandoned coal mine fields in the central part of the Moscow basin. Predominant natural soils are Greyic Phaeozems and Haplic Chernozems (WRB 2014) (Grey forest and Leached Chernozems in Russian classification).
Soil samples and displaced soil solutions (by ethanol) were analysed for acid-base properties, content and composition of readily soluble salts, content of Fe2+ and Fe3+, H+ and Al3+, composition of exchangeable cations, heavy metals (HM) and organic carbon) by standard methods. The composition of clay minerals in soils were determined by X-ray diffractometry. The saturation degree of soil solutions by gypsum, iron and aluminum hydroxides was estimated.
Properties of technogenic soils differ significantly from natural soils. We observed the transformation of the composition of soil solutions. Key geochemical processes at mine sites in contaminated soils were: (1) acidification and Fe-Al-SO4 salinization of entire soil profile along with the increment in H+ and Al3+ ions content; (2) cation exchange, leading to displacement of Cа2+ and Mg2+ ions by Al3+, H+ and, probably, by Fe2+ and Fe3+ in soil cation-exchange complex (CEC); (3) alteration of radial differentiation of organic carbon and carbonates in soils; (4) clay mineral transformations.
Topsoil features a high content of technogenic organic carbon (reaches 12%) due to the inflow of coal material particles from the dump. Ca2+ and Mg2+ ions predominate (for 70 to 90%) in CEC of natural soils. Exchangeable Al3+ accounts for more than 75% of the acidity formation in transformed soils. The share of exchangeable Ca2+ and Mg2+ in CEC of contaminated soils depletes on 22-38%.
Extracted soil solutions from polluted soils are heavily oversaturated by Al hydroxides. Even though the activity of Ca2+ and SO42- ions in some samples reaches the gypsum saturation level, gypsum neoformations are not distinguished morphologically.
The content of Co, Сu, Ni and Zn in displaced solutions of transformed soils in tens or even hundreds times exceeds the background values. The clay minerals of natural soils are represented by kaolinite, illite, vermiculite and mixed-layer minerals. The sharp increase in smectite fraction (up to 75-80%) and slightly in chlorite fraction was revealed in transformed soils.
Post-technogenic soils have no analogues in natural forest-steppe landscapes of the Russian Plain.
How to cite: Kostin, A., Krechetov, P., Chernitsova, O., and Terskaya, E.: Geochemical transformations in liquid and solid phases of forest-steppe soils in the affected area of Moscow brown coal basin (Russia), EGU General Assembly 2022, Vienna, Austria, 23–27 May 2022, EGU22-12209, https://doi.org/10.5194/egusphere-egu22-12209, 2022.
EGU22-13164 | Presentations | SSS7.2 | Highlight
Potentially Toxic Metals and high resolution monitoring at regional and local scale of Persistent Organic Pollutants in the soil, air, and bulk deposition of the Campania Region, southern Italy: Sources and environmental processesBenedetto De Vivo, Annamaria Lima, Domenico Cicchella, Chengkai Qu, Dave Hope, Pellegrino Cerino, Mauro Esposito, Antonio Pizzolante, Stefano Albanese, and Elena Korobova
Campania Region, Southern Italy, in the last 10 years was facing potential environmental issues which needed to be addressed, with the proper scientific approach, to alleviate pressure from public opinion, based more on emotions than on scientific data. Such pressure indicated an increase of oncological incidence, not supported by scientific data on the presence of anomalous pollutants in different natural media (soil, water, air, agricultural products). To face environmental/health alarm, the Campania Regional Government in 2015 funded a large, multidisciplinary, environmental project known as Campania Trasparente, to Istituto Zooprofilattico del Mezzogiorno (IZSM), to get a deeper and scientific knowledge of the Campania territory carrying out geochemical investigations, to: 1) characterize the geochemical composition of agricultural soil, air and groundwater at regional and local scale; 2) define the level of bio-availability of the toxic elements; 3) try to demonstrate a direct relationship between the presence of contaminants in the environmental matrices, in agricultural products and finally in the human matrices (hair, urine, blood). Within this project we got data on the presence of the potentially toxic metals (PTMs) and hazardous persistent organic pollutants (POPs: OCPs, PCBs, PAHs, PAEs, PBDEs) in different media of the entire Region. The new large dataset complemented our research and monitoring activities, which before 2015, were focused mostly on PTMs in soils, both at regional and local scale. In Campania Trasparente project, samples (9,000) of top and bottom soils, air and bulk deposition (150 passive air samplers, over 7 seasons), waters (1,200), vegetation (2,500) and biological (4,200) media, were collected to characterize the status of PTMs and POPs. The results obtained showed that: a) most of these elements and compounds, in higher concentrations, occur predominantly in critical areas of Napoli Urban and Metropolitan Area (NMA) and in the Sarno river basin; b) the infamous area, in the Caserta and Napoli provincial territory, known as Terra dei Fuochi (Land of Fires), is only marginally interested by anomalous occurrence of PTMs and POPs in some spot areas, not justifying the emotional alarms calling for an increase of oncological cases due to diffuse illegal practice of wastes disposal in the area; c) the agricultural crops of the Terra dei Fuochi are not affected by anomalous PTM. Specifically, the ecological risk conditions for PAHs and some OCPs (Endosulfan) occur, mostly in NMA; PCBs are sourced mostly in urban areas, being dissipated in rural areas, whereas PAEs and PBDEs occur, in general, in concentrations similar to those in other Italian regions, with some higher hot spot values in NMA and south of Salerno town. The interactional complexity between metropolitan and the surrounding rural areas is also confirmed, as it is the role that urban areas play in the migration and transformation process of POPs. High urban-rural gradients for atmospheric PAHs, PCBs and OCPs are observed mostly in the NMA and the urban areas, identified as the main emission source of POPs. Only OCPs, originating from the nearby agricultural areas, experienced long-term soil re-emission, continuously influencing conterminous urban environment via atmospheric transport processes.
How to cite: De Vivo, B., Lima, A., Cicchella, D., Qu, C., Hope, D., Cerino, P., Esposito, M., Pizzolante, A., Albanese, S., and Korobova, E.: Potentially Toxic Metals and high resolution monitoring at regional and local scale of Persistent Organic Pollutants in the soil, air, and bulk deposition of the Campania Region, southern Italy: Sources and environmental processes, EGU General Assembly 2022, Vienna, Austria, 23–27 May 2022, EGU22-13164, https://doi.org/10.5194/egusphere-egu22-13164, 2022.
Please decide on your access
Please use the buttons below to download the presentation materials or to visit the external website where the presentation is linked. Regarding the external link, please note that Copernicus Meetings cannot accept any liability for the content and the website you will visit.
Forward to presentation link
You are going to open an external link to the presentation as indicated by the authors. Copernicus Meetings cannot accept any liability for the content and the website you will visit.
We are sorry, but presentations are only available for users who registered for the conference. Thank you.
EGU22-1024 | Presentations | ITS3.5/NP3.1
Efficiency and synergy of simple protective measures against COVID-19: Masks, ventilation and moreUlrich Pöschl, Yafang Cheng, Frank Helleis, Thomas Klimach, and Hang Su
The public and scientific discourse on how to mitigate the COVID-19 pandemic is often focused on the impact of individual protective measures, in particular on vaccination. In view of changing virus variants and conditions, however, it seems not clear if vaccination or any other protective measure alone may suffice to contain the transmission of SARS-CoV-2. Accounting for both droplet and aerosol transmission, we investigated the effectiveness and synergies of vaccination and non-pharmaceutical interventions like masking, distancing & ventilation, testing & isolation, and contact reduction as a function of compliance in the population. For realistic conditions, we find that it would be difficult to contain highly contagious SARS-CoV-2 variants by any individual measure. Instead, we show how multiple synergetic measures have to be combined to reduce the effective reproduction number (Re) below unity for different basic reproduction numbers ranging from the SARS-CoV-2 ancestral strain up to measles-like values (R0 = 3 to 18).
Face masks are well-established and effective preventive measures against the transmission of respiratory viruses and diseases, but their effectiveness for mitigating SARS-CoV-2 transmission is still under debate. We show that variations in mask efficacy can be explained by different regimes of virus abundance (virus-limited vs. virus-rich) and are related to population-average infection probability and reproduction number. Under virus-limited conditions, both surgical and FFP2/N95 masks are effective at reducing the virus spread, and universal masking with correctly applied FFP2/N95 masks can reduce infection probabilities by factors up to 100 or more (source control and wearer protection).
Masks are particularly effective in combination with synergetic measures like ventilation and distancing, which can reduce the viral load in breathing air by factors up to 10 or more and help maintaining virus-limited conditions. Extensive experimental studies, measurement data, numerical calculations, and practical experience show that window ventilation supported by exhaust fans (i.e. mechanical extract ventilation) is a simple and highly effective measure to increase air quality in classrooms. This approach can be used against the aerosol transmission of SARS-CoV-2. Mechanical extract ventilation (MEV) is very well suited not only for combating the COVID19 pandemic but also for sustainably ventilating schools in an energy-saving, resource-efficient, and climate-friendly manner. Distributed extract ducts or hoods can be flexibly reused, removed and stored, or combined with other devices (e.g. CO2 sensors), which is easy due to the modular approach and low-cost materials (www.ventilationmainz.de).
The scientific findings and approaches outlined above can be used to design, communicate, and implement efficient strategies for mitigating the COVID-19 pandemic.
References:
Cheng et al., Face masks effectively limit the probability of SARS-CoV-2 transmission, Science, 372, 1439, 2021, https://doi.org/10.1126/science.abg6296
Klimach et al., The Max Planck Institute for Chemistry mechanical extract ventilation (MPIC-MEV) system against aerosol transmission of COVID-19, Zenodo, 2021, https://doi.org/10.5281/zenodo.5802048
Su et al., Synergetic measures to contain highly transmissible variants of SARS-CoV-2, medRxiv, 2021, https://doi.org/10.1101/2021.11.24.21266824
How to cite: Pöschl, U., Cheng, Y., Helleis, F., Klimach, T., and Su, H.: Efficiency and synergy of simple protective measures against COVID-19: Masks, ventilation and more, EGU General Assembly 2022, Vienna, Austria, 23–27 May 2022, EGU22-1024, https://doi.org/10.5194/egusphere-egu22-1024, 2022.
Please decide on your access
Please use the buttons below to download the presentation materials or to visit the external website where the presentation is linked. Regarding the external link, please note that Copernicus Meetings cannot accept any liability for the content and the website you will visit.
Forward to presentation link
You are going to open an external link to the presentation as indicated by the authors. Copernicus Meetings cannot accept any liability for the content and the website you will visit.
We are sorry, but presentations are only available for users who registered for the conference. Thank you.
EGU22-1890 | Presentations | ITS3.5/NP3.1
Possible effect of the particulate matter (PM) pollution on the Covid-19 spread in southern EuropeJean-Baptiste Renard, Gilles Delaunay, Eric Poincelet, and Jérémy Surcin
The time evolution of the Covid-19 death cases exhibits several distinct episodes since the start of the pandemic early in 2020. We propose an analysis of several Southern Europe regions that highlights how the beginning of each episode correlates with a strong increase in the concentrations level of pollution particulate matter smaller than 2.5 µm (PM2.5). Following the original PM2.5 spike, the evolution of the Covid-19 spread depends on the (partial) lockdowns and vaccinate races, thus the highest level of confidence in correlation can only be achieved when considering the beginning of each episode. The analysis is conducted for the 2020-2022 period at different locations: the Lombardy region (Italy), where we consider the mass concentrations measurements obtained by air quality monitoring stations (µg.m-3), and the cities of Paris (France), Lisbon (Portugal) and Madrid (Spain) using in-situ measurements counting particles (cm-3) in the 0.5-2.5 µm size range obtained with hundreds of mobile aerosol counters. The particle counting methodology is more suitable to evaluate the possible correlation between PM pollution and Covid-19 spread because we can better estimate the concentration of the submicronic particles compared with a mass concentration measurement methodology which would result in skewed results due to larger particles. Very fine particles of lesser than one micron go deeper inside the body and can even cross the alveolar-capillary barrier, subsequently attacking most of the organs through the bloodstream, potentially triggering a pejorative systemic inflammatory reaction. The rapidly increasing number of deaths attributed to the covid-19 starts between 2 weeks and one month after PM events that often occur in winter, which is coherent with the virus incubation time and its lethal outcome. We suggest that the pollution by the submicronic particles alters the pulmonary alveoli status and thus significantly increase the lungs susceptibility to the virus.
How to cite: Renard, J.-B., Delaunay, G., Poincelet, E., and Surcin, J.: Possible effect of the particulate matter (PM) pollution on the Covid-19 spread in southern Europe, EGU General Assembly 2022, Vienna, Austria, 23–27 May 2022, EGU22-1890, https://doi.org/10.5194/egusphere-egu22-1890, 2022.
EGU22-2801 | Presentations | ITS3.5/NP3.1
How concepts and ideas from Statistical and Climate physics improve epidemiological modelling of the COVID 19 pandemicsDavide Faranda
In the past two years, numerous advances have been made in the ability to predict the progress of COVID19 epidemics. Basic forecasting of the health state of a population with respect to a given disease is based on the well-known family of SIR models (Susceptible Infected Recovered). The models used in epidemiology were based on deterministic behavior, so the epidemiological picture tomorrow depends exclusively on the numbers recorded today. The forecasting shortcomings of the deterministic SEIR models previously used in epidemiology were difficult to highlight before the advent of COVID19 because epidemiology was mostly not concerned with real-time forecasting. From the first wave of COVID19 infections, the limitations of using deterministic models were immediately evident: to use them, one should know the exact status of the population and this knowledge was limited by the ability to process swabs. Futhermore, there is an intrinsic variability of the dynamics which depends on age, sex, characteristics of the virus, variants and vaccination status.
Our main contribution was to define a SEIR model that assumes these parameters as constants could not be used for reliable predictions of COVID19 pandemis and that more realistic forecasts can be obtained by adding fluctuations in the model. The fluctuations in the dynamics of the virus induced by these factors do not just add variaiblity around the deterministic solution of the SIR models, the also introduce another timing of the pandemics which influence the epidemic peak. With our model we have found that even with a basic reprdocution number Rt less than 1 local epidemic peaks can occur that resume over a certain period of time.
Introducing noise and uncertainty allows to define a range of possible scenarios, instead of making a single prediction. This is what happens when we replace the deterministic approach, with a probabilistic approach. The probabilistic models used to predict the progress of the Covid-19 epidemic are conceptually very similar to those used by climatologists, to imagine future environmental scenarios based on the actions taken in the present. As human beings we can intervene in both systems. Based on the choices we will make and the fluctuations of the systems, we can predict different responses. In the context of the emergency that we faced, the collaboration between different scientific fields was therefore fundamental, which, by comparing themselves, were able to provide more accurate answers. Furthermore, a close collaboration has arisen between epidemiologists and climatologists. A beautiful synergy that can give a great help to society in a difficult moment.
References
-Faranda, Castillo, Hulme, Jezequel, Lamb, Sato & Thompson (2020). Chaos: An Interdisciplinary Journal of Nonlinear Science, 30(5), 051107.
-Alberti & Faranda (2020). Communications in Nonlinear Science and Numerical Simulation, 90, 105372.
-Faranda & Alberti (2020). Chaos: An Interdisciplinary Journal of Nonlinear Science, 30(11), 111101.
-Faranda, Alberti, Arutkin, Lembo, Lucarini. (2021). Chaos: An Interdisciplinary Journal of Nonlinear Science, 31(4), 041105.
-Arutkin, Faranda, Alberti, & Vallée. (2021). Chaos: An Interdisciplinary Journal of Nonlinear Science, 31(10), 101107.
How to cite: Faranda, D.: How concepts and ideas from Statistical and Climate physics improve epidemiological modelling of the COVID 19 pandemics, EGU General Assembly 2022, Vienna, Austria, 23–27 May 2022, EGU22-2801, https://doi.org/10.5194/egusphere-egu22-2801, 2022.
EGU22-3690 | Presentations | ITS3.5/NP3.1
Improving the conservation of virus infectivity during airborne exposure experimentsGhislain Motos, Kalliopi Violaki, Aline Schaub, Shannon David, Tamar Kohn, and Athanasios Nenes
Recurrent epidemic outbreaks such as the seasonal flu and the ongoing COVID-19 are disastrous events to our societies both in terms of fatalities, social and educational structures, and financial losses. The difficulty to control COVID-19 spread in the last two years has brought evidence that basic mechanisms of transmission for such pathogens are still poorly understood.
Three different routes of virus transmission are known: direct contact (e.g. through handshakes) and indirect contact through fomites; ballistic droplets produced by speaking, sneezing or coughing; and airborne transmission through aerosols which can also be produced by normal breathing. The latter route, which has long been ignored, even by the World Health Organization during the COVID-19 pandemics, now appears to play the predominant role in the spread of airborne diseases (e.g. Chen et al., 2020).
Further scientific research thus needs to be conducted to better understand the mechanistic processes that lead to inactivate airborne viruses, as well as the environmental conditions which favour these processes. In addition to modelling and epidemiological studies, chamber experiments, where viruses are exposed to various types of humidity, temperature and/or UV dose, offer to simulate everyday life conditions for virus transmission. However, the current standard instrumental solutions for virus aerosolization to the chamber and sampling from it use high fluid forces and recirculation which can cause infectivity losses (Alsved et al., 2020) and also do not compare to the relevant production of airborne aerosol in the respiratory tract.
In this study, we utilized two of the softest aerosolization and sampling techniques: the sparging liquid aerosol generator (SLAG, CH Technologies Inc., Westwood, NJ, USA), which forms aerosol from a liquid suspension by bubble bursting, thus mimicking natural aerosol formation in wet environments (e.g. the respiratory system but also lakes, sea, toilets, etc…); and the viable virus aerosol sampler (BioSpot-VIVAS, Aerosol Devices Inc., Fort Collins, CO, USA), which grows particle via water vapour condensation to gently collect them down to a few nanometres in size. We characterized these systems with particle sizers and biological analysers using non-pathogenic viruses such as bacteriophages suspended in surrogate lung fluid and artificial saliva. We compared the size distribution of produced aerosol from these suspensions against similar distributions generated with standard nebulizers, and assess the ability of these devices to produce aerosol that much more resembles that produced in human exhaled air. We also assess the conservation of viral infectivity with the VIVAS vs. conventional biosamplers.
Acknowledgment
We acknowledge the IVEA project in the framework of SINERGIA grant (Swiss National Science Foundation)
References
Alsved, M., Bourouiba, L., Duchaine, C., Löndahl, J., Marr, L. C., Parker, S. T., Prussin, A. J., and Thomas, R. J. (2020): Natural sources and experimental generation of bioaerosols: Challenges and perspectives, Aerosol Science and Technology, 54, 547–571.
Chen, W., Zhang, N., Wei, J., Yen, H.-L., and Li, Y. (2020): Short-range airborne route dominates exposure of respiratory infection during close contact, Building and Environment, 176, 106859.
How to cite: Motos, G., Violaki, K., Schaub, A., David, S., Kohn, T., and Nenes, A.: Improving the conservation of virus infectivity during airborne exposure experiments, EGU General Assembly 2022, Vienna, Austria, 23–27 May 2022, EGU22-3690, https://doi.org/10.5194/egusphere-egu22-3690, 2022.
EGU22-3936 | Presentations | ITS3.5/NP3.1
COVID-19 effects on measurements of the Earth Magnetic Field in the urbanized area of BrestJean-Francois Oehler, Alexandre Leon, Sylvain Lucas, André Lusven, and Gildas Delachienne
COVID-19 effects on measurements of the Earth Magnetic Field in the urbanized area of Brest (Brittany, France)
Jean-François OEHLER1, Sylvain LUCAS1, Alexandre LEON1, André LUSVEN1, Gildas DELACHIENNE1
1Shom (Service Hydrographique et Océanographique de la Marine), Brest, France
Since September 2019, Shom’s Magnetic Station (SMS) has been deployed in the north neighbourhoods of the medium-sized city of Brest (Brittany, France, about 210,000 inhabitants). SMS continuously measures the intensity of the Earth Magnetic Field (EMF) with an absolute Overhauser sensor. The main goal of SMS is to derive local external variations of the EMF mainly due to solar activity. These variations consist of low and high parasitic frequencies in magnetic data and need to be corrected. Magnetic mobile stations or permanent observatories are usually installed in isolated areas, far from human activities and electromagnetic effects. It is clearly not the case for SMS, mainly for practical reasons of security, maintenance and data accessibility. However, despite its location in an urbanized area, SMS stays the far western reference station for processing marine magnetic data collected along the Atlantic and Channel coasts of France.
The corona pandemic has had unexpected consequences on the quality of measurements collected by SMS. For example, during the French first lockdown between March and May 2020, the noise level significantly decreased of about 50%. Average standard deviations computed on 1 Hz-time series over 1 min. periods fell from about 1.5 nT to 0.8 nT. This more stable behavior of SMS is clearly correlated with the drop of human activities and traffic in the city of Brest.
Keywords: Shom’s Magnetic Station (SMS), Earth Magnetic Field, COVID19.
How to cite: Oehler, J.-F., Leon, A., Lucas, S., Lusven, A., and Delachienne, G.: COVID-19 effects on measurements of the Earth Magnetic Field in the urbanized area of Brest, EGU General Assembly 2022, Vienna, Austria, 23–27 May 2022, EGU22-3936, https://doi.org/10.5194/egusphere-egu22-3936, 2022.
EGU22-4170 | Presentations | ITS3.5/NP3.1
Comprehensive Insights Into O3 Changes During the COVID-19 From O3 Formation Regime and Atmospheric Oxidation CapacityPeng Wang, Shengqiang Zhu, and Hongliang Zhang
Economic activities and the associated emissions have significantly declined during the 2019 novel coronavirus (COVID-19) pandemic, which has created a natural experiment to assess the impact of the emitted precursor control policy on ozone (O3) pollution. In this study, we utilized comprehensive satellite, ground-level observations, and source-oriented chemical transport modeling to investigate the O3 variations during the COVID-19 pandemic in China. Here, we found that the significant elevated O3 in the North China Plain (40%) and Yangtze River Delta (35%) were mainly attributed to the enhanced atmospheric oxidation capacity (AOC) in these regions, associated with the meteorology and emission reduction during lockdown. Besides, O3 formation regimes shifted from VOC-limited regimes to NOx-limited and transition regimes with the decline of NOx during lockdown. We suggest that future O3 control policies should comprehensively consider the effects of AOC on the O3 elevation and coordinated regulations of the O3 precursor emissions.
How to cite: Wang, P., Zhu, S., and Zhang, H.: Comprehensive Insights Into O3 Changes During the COVID-19 From O3 Formation Regime and Atmospheric Oxidation Capacity, EGU General Assembly 2022, Vienna, Austria, 23–27 May 2022, EGU22-4170, https://doi.org/10.5194/egusphere-egu22-4170, 2022.
Please decide on your access
Please use the buttons below to download the presentation materials or to visit the external website where the presentation is linked. Regarding the external link, please note that Copernicus Meetings cannot accept any liability for the content and the website you will visit.
Forward to presentation link
You are going to open an external link to the presentation as indicated by the authors. Copernicus Meetings cannot accept any liability for the content and the website you will visit.
We are sorry, but presentations are only available for users who registered for the conference. Thank you.
EGU22-5126 | Presentations | ITS3.5/NP3.1
Nature-based Solutions in actions: improving landscape connectivity during the COVID-19Yangzi Qiu, Ioulia Tchiguirinskaia, and Daniel Schertzer
In the last few decades, Nature-based Solutions (NBS) has become widely considered a sustainable development strategy for the development of urban environments. Assessing the performances of NBS is significant for understanding their efficiency in addressing a large range of natural and societal challenges, such as climate change, ecosystem services and human health. With the rapid onset of the COVID-19 pandemic, the inner relationship between humans and nature becomes apparent. However, the current catchment management mainly focuses on reducing hydro-meteorological and/or climatological risks and improving urban climate resilience. This single-dimensional management seems insufficient when facing epidemics, and multi-dimensional management (e.g., reduce zoonosis) is necessary. With this respect, policymakers pay more attention to NBS. Hence, it is significant to increase the connectivity of the landscape to improve the ecosystem services and reduce the health risks from COVID-19 with the help of NBS.
This study takes the Guyancourt catchment as an example. The selected catchment is located in the Southwest suburb of Paris, with a total area of around 5.2 km2. The ArcGIS software is used to assess the patterns of structural landscape connectivity, and the heterogeneous spatial distribution of current green spaces over the catchment is quantified with the help of the scale-independent indicator of fractal dimension. To quantify opportunities to increase landscape connectivity over the catchment, a least-cost path approach to map potential NBS links urban green spaces through vacant parcels, alleys, and smaller green spaces. Finally, to prioritise these potential NBS in multiscale, a new scale-independent indicator within the Universal Multifractal framework is proposed in this study.
The results indicated that NBS can effectively improve the connectivity of the landscape and has the potential to reduce the physical and mental risks caused by COVID-19. Overall, this study proposed a scale-independent approach for enhancing the multiscale connectivity of the NBS network in urban areas and providing quantitative suggestions for on-site redevelopment.
How to cite: Qiu, Y., Tchiguirinskaia, I., and Schertzer, D.: Nature-based Solutions in actions: improving landscape connectivity during the COVID-19, EGU General Assembly 2022, Vienna, Austria, 23–27 May 2022, EGU22-5126, https://doi.org/10.5194/egusphere-egu22-5126, 2022.
EGU22-5150 | Presentations | ITS3.5/NP3.1
The associations between environmental factors and COVID-19: early evidence from ChinaXia Meng, Ye Yao, Weibing Wang, and Haidong Kan
The Coronavirus (COVID-19) epidemic, which was first reported in December 2019 in Wuhan, China, has been becoming one of the most important public health issues worldwide. Previous studies have shown the importance of weather variables and air pollution in the transmission or prognosis of infectious diseases, including, but not limited to, influenza and severe acute respiratory syndrome (SARS). In the early stage of the COVID-19 epidemic, there was intense debate and inconsistent results on whether environmental factors were associated with the spread and prognosis of COVID-19. Therefore, our team conducted a series studies to explore the associations between atmospheric parameters (temperature, humidity, UV radiation, particulate matters and nitrogen dioxygen) and the COVID-19 (transmission ability and prognosis) at the early stage of the COVID-19 epidemic with data in early 2020 in China and worldwide. Our results showed that meteorological conditions (temperature, humidity and UV radiation) had no significant associations with cumulative incidence rate or R0 of COVID-19 based on data from 224 Chinese cities, or based on data of 202 locations of 8 countries before March 9, 2020, suggesting that the spread ability of COVID-19 among public population would not significantly change with increasing temperature or UV radiation or changes of humidity. Moreover, we found that particulate matter pollution significantly associated with case fatality rate (CFR) of COVID-19 in 49 Chinese cities based on data before April 12, 2020, indicating that air pollution might exacerbate negative prognosis of COVID-19. Our studies provided an environmental perspective for the prevention and treatment of COVID-19.
How to cite: Meng, X., Yao, Y., Wang, W., and Kan, H.: The associations between environmental factors and COVID-19: early evidence from China, EGU General Assembly 2022, Vienna, Austria, 23–27 May 2022, EGU22-5150, https://doi.org/10.5194/egusphere-egu22-5150, 2022.
EGU22-9213 | Presentations | ITS3.5/NP3.1
The Effects of COVID-19 Lockdown on Air Quality and Health in India and FinlandShubham Sharma, Behzad Heibati, Jagriti Suneja, and Sri Harsha Kota
The COVID-19 lockdowns worldwide provided a prospect to evaluate the impacts of restricted movements and emissions on air quality. In this study, we analyze the data obtained from the ground-based observation stations for six air pollutants (PM10, PM2.5, CO, NO2, O3 and SO2) and meteorological parameters from March 25th to May 31st in 22 cities representative of five regions of India and from March 16th to May 14th in 21 districts of Finland from 2017 to 2020. The NO2 concentrations dropped significantly during all phases apart from East India's exception during phase 1. O3 concentrations for all four phases in West India reduced significantly, with the highest during Phase 2 (~38%). The PM2.5 concentration nearly halved across India during all phases except South India, where a very marginal reduction (2%) was observed during Phase 4. SO2 (~31%) and CO (~41%) concentrations also reduced noticeably in South India and North India during all the phases. The air temperature rose by ~10% (average) during all the phases across India when compared to 2017-2019. In Finland, NO2 concentration reduced substantially in 2020. Apart from Phase 1, the concentrations of PM10 and PM2.5 reduced markedly in all the Phases across Finland. Also, O3 and SO2 concentrations stayed within the permissible limits in the study period for all four years but were highest in 2017 in Finland, while the sulfurous compounds (OSCs) levels increased during all the phases across Finland. The changes in the mobility patterns were also assessed and were observed to have reduced significantly during the lockdown. The benefits in the overall mortality due to the reduction in the concentrations of PM2.5 have also been estimated for India and Finland. Therefore, this research illustrates the effectiveness of lockdown and provides timely policy suggestions to the regulators to implement interventions to improve air quality.
How to cite: Sharma, S., Heibati, B., Suneja, J., and Kota, S. H.: The Effects of COVID-19 Lockdown on Air Quality and Health in India and Finland, EGU General Assembly 2022, Vienna, Austria, 23–27 May 2022, EGU22-9213, https://doi.org/10.5194/egusphere-egu22-9213, 2022.
EGU22-9812 | Presentations | ITS3.5/NP3.1
Changes in Global Urban Air Quality due to Large Scale Disruptions of ActivityWill Drysdale, Charlotte Stapleton, and James Lee
Since 2020, countries around the world have implemented various interventions in response to a global public health crisis. The interventions included restrictions on mobility, promotion of working from home and the limiting of local and international travel. These, along with other behavioural changes from people in response to the crisis affected various sources of air pollution, not least the transport sector. Whilst the method through which these changes were implemented is not something to be repeated, understanding the effects of the changes will help direct policy for further improving air quality.
We analysed NOx, O3 and PM2.5 data from many 100s of air quality monitoring sites in urban areas around the world, and examined 2020 in relation to the previous 5 years. The data were examined alongside mobility metrics to contextualise the magnitude of changes and were viewed through the lens of World Health Organisation guidelines as a metric to link air quality changes with human health. Interestingly, reductions in polluting activities did not lead to wholesale improvements in air quality by all metrics due to the more complex processes involved with tropospheric O3 production.
How to cite: Drysdale, W., Stapleton, C., and Lee, J.: Changes in Global Urban Air Quality due to Large Scale Disruptions of Activity, EGU General Assembly 2022, Vienna, Austria, 23–27 May 2022, EGU22-9812, https://doi.org/10.5194/egusphere-egu22-9812, 2022.
EGU22-11475 | Presentations | ITS3.5/NP3.1
Scaling Dynamics of Growth Phenomena: from Epidemics to the Resilience of Urban SystemsIoulia Tchiguirinskaia and Daniel Schertzer
Defining optimal COVID-19 mitigation strategies remains at the top of public health agendas around the world. It requires a better understanding and refined modeling of the intrinsic dynamics of the epidemic. The common root of most models of epidemics is a cascade paradigm that dates to their emergence with Bernoulli and d’Alembert, which predated Richardson’s famous quatrain on the cascade of atmospheric dynamics. However, unlike other cascade processes, the characteristic times of a cascade of contacts that spread infection and the corresponding rates are believed to be independent on the cascade level. This assumption prevents having cascades of scaling contamination.
In this presentation, we theoretically argue and empirically demonstrate that the intrinsic dynamics of the COVID-19 epidemic during the phases of growth and decline, is a cascade with a rather universal scaling, the statistics of which differ significantly from those of an exponential process. This result first confirms the possibility of having a higher prevalence of intrinsic dynamics, resulting in slower but potentially longer phases of growth and decline. It also shows that a fairly simple transformation connects the two phases. It thus explains the frequent deviations of epidemic models rather aligned with exponential growth and it makes it possible to distinguish an epidemic decline from a change of scaling in the observed growth rates. The resulting variability across spatiotemporal scales is a major feature that requires alternative approaches with practical consequences for data analysis and modelling. We illustrate some of these consequences using the now famous database from the Johns Hopkins University Center for Systems Science and Engineering.
Due to the significant increase over time of available data, we are no longer limited to deterministic calculus. The non-negligible fluctuations with respect to a power-law can be easily explained within the framework of stochastic multiplicative cascades. These processes are exponentials of a stochastic generators Γ(t), whose stochastic differentiation remains quite close to the deterministic one, basically adding a supplementary term σdt to the differential of the generator. When the generator Γ(t) is Gaussian, σ is the “quadratic variation”. Extensions to Lévy stable generators, which are strongly non-Gaussian, have also been considered. To study the stochastic nature of the cascade generator, as well as how it respects the above-mentioned symmetry between the phases of growth and decline, we use the universal multifractals. They provide the appropriate framework for joint scaling analysis of vector-valued time series and for introducing location and other dependencies. This corresponds to enlarging the domain, on which the process and its generator are defined, as well as their co-domain, on which they are valued. These clarifications should make it possible to improve epidemic models and their statistical analysis.
More fundamentally, this study points out to a new class of stochastic multiplicative cascade models of epidemics in space and time, therefore not limited to compartments. By their generality, these results pave the way for a renewed approach to epidemics, and more generally growth phenomena, towards more resilient development and management of our urban systems.
How to cite: Tchiguirinskaia, I. and Schertzer, D.: Scaling Dynamics of Growth Phenomena: from Epidemics to the Resilience of Urban Systems, EGU General Assembly 2022, Vienna, Austria, 23–27 May 2022, EGU22-11475, https://doi.org/10.5194/egusphere-egu22-11475, 2022.
EGU22-11584 | Presentations | ITS3.5/NP3.1
Geophysicists facing Covid-19Daniel Schertzer, Vijay Dimri, and Klaus Fraedrich
There have been a series of sessions on the generic theme of “Covid-19 and Geosciences” on the occasion of AGU, AOGS and EGU conferences, since 2020 including during the first lockdown that required a very fast adaptation to unprecedented health measures. We think it is interesting and useful to have an overview of these sessions and try to capture what could be the lessons to learn.
To our knowledge, the very first such session was the Great e-Debate “Epidemics, Urban Systems and Geosciences” (https://hmco.enpc.fr/news-and-events/great-e-debate-epidemics-urban-systems-and-geosciences-invitations-and-replays/). It was virtually organised with the help of the UNESCO UniTwin CS-DC (Complex Systems Digital Campus) thanks to its expertise in organising e-conferences long before the pandemic and the first health measures. This would not have been possible without the strong personal involvement of its chair Paul Bourgine. It was held on Monday 4th May on the occasion of the 2020 EGU conference, which became virtual under the title “EGU2020: Sharing Geoscience Online” (4-8 May 2020). The Great e-Debate did not succeed in being granted as an official session of this conference, despite the fact that the technology used (Blue Button) by the Great e-Debate was much more advanced. Nevertheless, it was clearly an extension of the EGU session ITS2.10 / NP3.3: “Urban Geoscience Complexity: Transdisciplinarity for the Urban Transition”.
Thanks to a later venue (7-11 December 2020) and the existence of a GeoHealth section of the AGU, the organisation of several regular sessions for the 2020 Fall Meeting was easier. For EGU 2021 (19-30 April 2021), a sub-part of the inter- transdisciplinary sessions ITS1 “Geosciences and health during the Covid pandemic”, a Union Session US “Post-Covid Geosciences” and a Townhall meeting TM10 “Covid-19 and other epidemics: engagement of the geoscience communities” were organised. A brief of the special session SS02 “Covid-19 and Geoscience” of the (virtual) 18th Annual Meeting of AOGS (1-6 August 2021) is included in the proceedings of this conference (in press).
We will review materials generated by these sessions that rather show a shift from a focus on the broad range of scientific responses to the pandemic, to which geoscientists could contribute with their specific expertise (from data collection to theoretical modelling), to an expression of concerns about the broad impacts on the geophysical communities that appear to be increasingly long-term and constitute a major transformation of community functioning (e.g., again data collection, knowledge transfer).
How to cite: Schertzer, D., Dimri, V., and Fraedrich, K.: Geophysicists facing Covid-19, EGU General Assembly 2022, Vienna, Austria, 23–27 May 2022, EGU22-11584, https://doi.org/10.5194/egusphere-egu22-11584, 2022.
EGU22-11747 | Presentations | ITS3.5/NP3.1
To act or not to act. Predictability of intervention and non-intervention in health and environmentMichalis Chiotinis, Panayiotis Dimitriadis, Theano Illiopoulou, Nikos Mamassis, and Demetris Koutsoyiannis
The COVID-19 pandemic has brought forth the question of the need for draconian interventions before concrete evidence for their need and efficacy is presented. Such interventions could be critical if necessary for avoiding threats, or a threat in themselves if harms caused by the intervention are significant.
The interdisciplinary nature of such issues as well as the unpredictability of various local responses considering their potential for global impact further complicate the question.
The study aims to review the available evidence and discuss the problem of weighting the predictability of interventions vis-à-vis their intended results against the limits of knowability regarding complex non-linear systems and thus the predictability in non-interventionist approaches.
How to cite: Chiotinis, M., Dimitriadis, P., Illiopoulou, T., Mamassis, N., and Koutsoyiannis, D.: To act or not to act. Predictability of intervention and non-intervention in health and environment, EGU General Assembly 2022, Vienna, Austria, 23–27 May 2022, EGU22-11747, https://doi.org/10.5194/egusphere-egu22-11747, 2022.
Please decide on your access
Please use the buttons below to download the presentation materials or to visit the external website where the presentation is linked. Regarding the external link, please note that Copernicus Meetings cannot accept any liability for the content and the website you will visit.
Forward to presentation link
You are going to open an external link to the presentation as indicated by the authors. Copernicus Meetings cannot accept any liability for the content and the website you will visit.
We are sorry, but presentations are only available for users who registered for the conference. Thank you.

EGU22-12302 | Presentations | ITS3.5/NP3.1
COVID-19 waves: intrinsic and extrinsic spatio-temporal dynamics over ItalyTommaso Alberti and Davide Faranda
COVID-19 waves, mostly due to variants, still require timely efforts from governments based on real-time forecasts of the epidemics via dynamical and statistical models. Nevertheless, less attention has been paid in investigating and characterizing the intrinsic and extrinsic spatio-temporal dynamics of the epidemic spread. The large amount of data, both in terms of data points and observables, allows us to perform a detailed characteristic of the epidemic waves and their relation with different sources as testing capabilities, vaccination policies, and restriction measures.
By taking as a case-study the epidemic evolution of COVID-19 across Italian regions we perform the Hilbert-Huang Transform (HHT) analysis to investigate its spatio-temporal dynamics. We identified a similar number of temporal components within all Italian regions that can be linked to both intrisic and extrinsic source mechanisms as the efficiency of restriction measures, testing strategies and performances, and vaccination policies. We also identified mutual scale-dependent relations within different regions, thus suggesting an additional source mechanisms related to the delayed spread of the epidemics due to travels and movements of people. Our results are also extremely helpful for providing long term extrapolation of epidemics counts by taking into account both the intrinsically and the extrinsically non-linear nature of the underlying dynamics.
How to cite: Alberti, T. and Faranda, D.: COVID-19 waves: intrinsic and extrinsic spatio-temporal dynamics over Italy, EGU General Assembly 2022, Vienna, Austria, 23–27 May 2022, EGU22-12302, https://doi.org/10.5194/egusphere-egu22-12302, 2022.
EGU22-12907 | Presentations | ITS3.5/NP3.1
Responses of concentration and sources of black carbon in a megacity during the COVID-19 pandemicWeijun Li and Liang Xu
Black carbon (BC) not only warms the atmosphere but also affects human health. The nationwide lockdown due to the COVID-19 pandemic led to a major reduction in human activity during the past thirty years. Here, the concentration of BC in the urban, urban-industry, suburb, and rural areas of a megacity Hangzhou were monitored using a multi-wavelength Aethalometer to estimate the impact of the COVID-19 lockdown on BC emissions. The citywide BC decreased by 44% from 2.30 μg/m3 to 1.29 μg/m3 following the COVID-19 lockdown period. The source apportionment based on the Aethalometer model shows that vehicle emission reduction responded to BC decline in the urban area and biomass burning in rural areas around the megacity had a regional contribution of BC. We highlight that the emission controls of vehicles in urban areas and biomass burning in rural areas should be more efficient in reducing BC in the megacity Hangzhou.
How to cite: Li, W. and Xu, L.: Responses of concentration and sources of black carbon in a megacity during the COVID-19 pandemic, EGU General Assembly 2022, Vienna, Austria, 23–27 May 2022, EGU22-12907, https://doi.org/10.5194/egusphere-egu22-12907, 2022.
Please decide on your access
Please use the buttons below to download the presentation materials or to visit the external website where the presentation is linked. Regarding the external link, please note that Copernicus Meetings cannot accept any liability for the content and the website you will visit.
Forward to presentation link
You are going to open an external link to the presentation as indicated by the authors. Copernicus Meetings cannot accept any liability for the content and the website you will visit.
We are sorry, but presentations are only available for users who registered for the conference. Thank you.
EGU22-13522 | Presentations | ITS3.5/NP3.1
Time-dependent forcing in the geosciences and in epidemiologyMichael Ghil
For many of us, the Covid-19 pandemic brought long-time scientific interest in epidemiology to the point of involvement. An important aspect of the evolution of acute respiratory epidemics is their seasonal character. Our toolkit for handling seasonal phenomena in the geosciences has increased in the last dozen years or so with the development and application of concepts and methods from the theory of nonautonomous and random dynamical systems (NDSs and RDSs). In this talk, I will briefly:
-
Introduce some elements of these two closely related theories.
-
Illustrate the two with an application to seasonal effects within a chaotic model of the El
Niño–Southern Oscillation (ENSO).
-
Introduce to a geoscientific audience a simple epidemiological “box” model of the
Susceptible–Exposed–Infectious–Recovered (SEIR) type.
-
Summarize NDS results for a chaotic SEIR model with seasonal effects.
-
Mention the utility of data assimilation (DA) tools in the parameter identification and
prediction of an epidemic’s evolution
References- Chekroun, M D, Ghil M, Neelin J D (2018) Pullback attractor crisis in a delay differential ENSO model, in Nonlinear Advances in Geosciences, A. Tsonis (Ed.), Springer, pp. 1–33, doi: 10.1007/978-3-319-58895-7
- Crisan D, Ghil, M (2022) Asymptotic behavior of the forecast–assimilation process with unstable dynamics, Chaos, in preparation
- Faranda D, Castillo I P, Hulme O, Jezequel A, Lamb J S, Sato Y, Thompson E L (2020) Asymptotic estimates of SARS-CoV-2 infection counts and their sensitivity to stochastic perturbation<? Chaos, 30(5): 051107, doi: 10.1063/5.0009454
- Ghil, M (2019) A century of nonlinearity in the geosciences. Earth & Space Science 6:1007–1042, doi:10.1029/2019EA000599
- Kovács, T (2020) How can contemporary climate research help understand epidemic dynamics? Ensemble approach and snapshot attractors. J. Roy. Soc. Interface, 17(173):20200648, doi: 10.1098/rsif.2020.0648
How to cite: Ghil, M.: Time-dependent forcing in the geosciences and in epidemiology, EGU General Assembly 2022, Vienna, Austria, 23–27 May 2022, EGU22-13522, https://doi.org/10.5194/egusphere-egu22-13522, 2022.
EGU22-13534 | Presentations | ITS3.5/NP3.1
How can contemporary climate research help understand epidemic dynamics? -- Ensemble approach and snapshot attractorsTamás Kovács
Standard epidemic models based on compartmental differential equations are investigated under continuous parameter change as external forcing. We show that seasonal modulation of the contact parameter superimposed upon a monotonic decay needs a different description from that of the standard chaotic dynamics. The concept of snapshot attractors and their natural distribution has been adopted from the field of the latest climate change research. This shows the importance of the finite-time chaotic effect and ensemble interpretation while investigating the spread of a disease. By defining statistical measures over the ensemble, we can interpret the internal variability of the
epidemic as the onset of complex dynamics—even for those values of contact parameters where originally regular behaviour is expected. We argue that anomalous outbreaks of the infectious class cannot die out until transient chaos is presented in the system. Nevertheless, this fact becomes apparent by using an ensemble approach rather than a single trajectory representation. These findings are applicable generally in explicitly time-dependent epidemic systems regardless of parameter values and time scales.
How to cite: Kovács, T.: How can contemporary climate research help understand epidemic dynamics? -- Ensemble approach and snapshot attractors, EGU General Assembly 2022, Vienna, Austria, 23–27 May 2022, EGU22-13534, https://doi.org/10.5194/egusphere-egu22-13534, 2022.
Please decide on your access
Please use the buttons below to download the presentation materials or to visit the external website where the presentation is linked. Regarding the external link, please note that Copernicus Meetings cannot accept any liability for the content and the website you will visit.
Forward to presentation link
You are going to open an external link to the presentation as indicated by the authors. Copernicus Meetings cannot accept any liability for the content and the website you will visit.
We are sorry, but presentations are only available for users who registered for the conference. Thank you.
EGU22-693 | Presentations | GM2.8
An open-source Python package for DEM generation and landslide volume estimation based on Sentinel-1 imageryLorena Abad, Daniel Hölbling, Zahra Dabiri, and Benjamin Robson
Landslide assessments require timely, accurate and comprehensive information, where Earth observation (EO) data such as optical and radar satellite imagery has played an important role. Volume estimates are important to understand landslide characteristics and (post-failure) behaviour. Pre- and post-event digital elevation model (DEM) differencing is a suitable method to estimate landslide volumes remotely, leveraging EO techniques. However, high costs for commercial DEM products, limited temporal and spatial coverage and resolution, or insufficient accuracy hamper the potential of this method. Sentinel-1 synthetic aperture radar (SAR) data from the European Union's Earth observation programme Copernicus opens the opportunity to leverage free EO data to generate multi-temporal topographic datasets.
With the project SliDEM (Assessing the suitability of DEMs derived from Sentinel-1 for landslide volume estimation) we explore the potential of Sentinel-1 for the generation of DEMs for landslide assessment. Therefore, we develop a semi-automated and transferable workflow available through an open-source Python package. The package consists of different modules to 1) query Sentinel-1 image pairs that match a given geographical and temporal extent, and based on perpendicular and temporal baseline thresholds; 2) download and archive only suitable Sentinel-1 image pairs; 3) produce DEMs using interferometric SAR (InSAR) techniques available in the open-source Sentinel Application Platform (SNAP), as well as performing necessary post-processing such as terrain correction and co-registration; 4) perform DEM differencing of pre- and post-event DEMs to quantify landslide volumes; and 5) assess the accuracy and validate the DEMs and volume estimates against reference data.
We evaluate and validate our workflow in terms of reliability, performance, reproducibility, and transferability over several major landslides in Austria and Norway. We distribute our work within a Docker container, which allows the usage of the SliDEM python package along with all its software dependencies in a structured and convenient way, reducing usability problems related to software versioning. The SliDEM workflow represents an important contribution to the field of natural hazard research by developing an open-source, low-cost, transferable, and semi-automated method for DEM generation and landslide volume estimation.
How to cite: Abad, L., Hölbling, D., Dabiri, Z., and Robson, B.: An open-source Python package for DEM generation and landslide volume estimation based on Sentinel-1 imagery, EGU General Assembly 2022, Vienna, Austria, 23–27 May 2022, EGU22-693, https://doi.org/10.5194/egusphere-egu22-693, 2022.
Please decide on your access
Please use the buttons below to download the presentation materials or to visit the external website where the presentation is linked. Regarding the external link, please note that Copernicus Meetings cannot accept any liability for the content and the website you will visit.
Forward to presentation link
You are going to open an external link to the presentation as indicated by the authors. Copernicus Meetings cannot accept any liability for the content and the website you will visit.
We are sorry, but presentations are only available for users who registered for the conference. Thank you.

EGU22-1191 | Presentations | GM2.8
DEM quality assessment and improvement in noise quantification for geomorphic application in steep mountainous terrainBenjamin Purinton and Bodo Bookhagen
Spaceborne digital elevation models (DEMs) are fundamental data for mapping and analyzing geomorphic features at regional and continental scale, but are limited by both their spatial resolution and accuracy. Typically, accuracy is measured using point- or profile-based geodetic measurements (e.g., sparse GNSS). We develop new methods to quantify the vertical uncertainty in spaceborne DEMs relevant to geomorphic analysis, focusing on the pixel-to-pixel variability internal to a given DEM, which we term the inter-pixel consistency. Importantly, the methods we develop are not based on external, geodetic measurements. Our codes are published open-source (https://github.com/UP-RS-ESP/DEM-Consistency-Metrics), and we particularly highlight a novel sun-angle rotation and hillshade-filtering approach that is based on the visual, qualitative assessment of DEM hillshades. Since our study area is in the arid Central Andes and contains diverse steep (volcano) and flat (salar) features, the environment is ideal for vegetation-free assessments of DEM quality across a range of topographic settings. We compare global 1 arcsec (~30 m) resolution DEMs (SRTM, ASTER, ALOS, TanDEM-X, Copernicus), and find high quality (high inter-pixel consistency) of the newest Copernicus DEM. At higher spatial resolution, we also seek to improve the stereo-processing of 3 m SPOT6 optical DEMs using the open-source AMES Stereo-Pipeline. This includes optimizing key parameters and processing steps, as well as developing metrics for DEM uncertainty masks based on the underlying image texture of the optical satellite scenes used to triangulate elevations. Although higher resolution spaceborne DEMs like SPOT6 are only available for limited spatial areas (depending on funds and processing power), the improvement in geomorphic feature identification and quantification at the hillslope scale is significant compared to 30 m datasets. Improved DEM quality metrics provide useful constraints on hazard assessment and geomorphic analysis for the Earth and other planetary bodies.
How to cite: Purinton, B. and Bookhagen, B.: DEM quality assessment and improvement in noise quantification for geomorphic application in steep mountainous terrain, EGU General Assembly 2022, Vienna, Austria, 23–27 May 2022, EGU22-1191, https://doi.org/10.5194/egusphere-egu22-1191, 2022.
Please decide on your access
Please use the buttons below to download the presentation materials or to visit the external website where the presentation is linked. Regarding the external link, please note that Copernicus Meetings cannot accept any liability for the content and the website you will visit.
Forward to presentation link
You are going to open an external link to the presentation as indicated by the authors. Copernicus Meetings cannot accept any liability for the content and the website you will visit.
We are sorry, but presentations are only available for users who registered for the conference. Thank you.
EGU22-2000 | Presentations | GM2.8
Assessment of soil erosion induced by different tillage practices through multi-temporal geomorphometric analysesSara Cucchiaro, Laura Carretta, Paolo Nasta, Federico Cazorzi, Roberta Masin, Nunzio Romano, and Paolo Tarolli
One of the main environmental threats to sustainability and crop productivity in the agricultural sector is soil erosion. For the mitigation of this problem in agricultural fields, no-till management is considered a key approach. The measurement of soil erosion is particularly challenging, especially when surficial morphological changes are relatively small. Conventional experiments are commonly time-consuming and labour-intensive in terms of both field surveys and laboratory methods. However, the Structure from Motion (SfM) photogrammetry technique has enhanced the experimental activities by enabling the temporal evolution of soil erosion to be assessed through detailed micro-topography. This work presents a multitemporal quantification of soil erosion, using SfM through Uncrewed Aerial Vehicles (UAV) survey for understanding the evolution of no-till (NT) and conventional tillage (CT) in experimental plots. Considering that plot-scale soil surface (mm grid size) by several orders of magnitude, it was necessary to minimise SfM errors (e.g., co-registration and interpolation) in volumetric estimates to reduce noise as much as possible. Therefore, a methodological workflow was developed to analyse and identify the effectiveness of multi-temporal SfM-derived products, e.g. the conventional Difference of Digital Terrain Models (DoDs) and the less used Differences of Meshes (DoMs), for soil volume computations. To recognise the most suitable estimation method, the research validated the erosion volumetric changes calculated from the SfM outputs with the amount of soil directly collected through conventional runoff and sediment measurements in the field. This study presents a novel approach for using DoMs instead of DoDs to accurately describe the micro-topography changes and sediment dynamics. Another key and innovative aspect of this research, often overlooked in soil erosion studies, was to identify the contributing sediment surface, by delineating the channels potentially routing runoff directly to water collectors. The sediment paths and connected areas inside the plots were identified using a multi-temporal analysis of the sediment connectivity index for achieving the volumetric estimates. The DoM volume estimates showed better results with respect to DoDs and a mild overestimation compared to in-situ measurements. This difference was attributable to other factors (e.g., the soil compaction processes) or variables rather than to photogrammetric or geometric ones. The developed workflow enabled a very detailed quantification of soil erosion dynamics for assessing the mitigation effects of no-till management that can also be extended in the future to different scales with low-costs, based on SfM and UAV technologies.
How to cite: Cucchiaro, S., Carretta, L., Nasta, P., Cazorzi, F., Masin, R., Romano, N., and Tarolli, P.: Assessment of soil erosion induced by different tillage practices through multi-temporal geomorphometric analyses, EGU General Assembly 2022, Vienna, Austria, 23–27 May 2022, EGU22-2000, https://doi.org/10.5194/egusphere-egu22-2000, 2022.
Please decide on your access
Please use the buttons below to download the presentation materials or to visit the external website where the presentation is linked. Regarding the external link, please note that Copernicus Meetings cannot accept any liability for the content and the website you will visit.
Forward to presentation link
You are going to open an external link to the presentation as indicated by the authors. Copernicus Meetings cannot accept any liability for the content and the website you will visit.
We are sorry, but presentations are only available for users who registered for the conference. Thank you.
EGU22-2877 | Presentations | GM2.8
Coastal erosion: an overlooked source of sediments to the ocean. Europe as an exampleVincent Regard, Mélody Prémaillon, Thomas Dewez, Sébastien Carretier, Catherine Jeandel, Yves Godderis, Stéphane Bonnet, Jacques Schott, Kevin Pedoja, Joseph Martinod, Jérôme Viers, and Sébastien Fabre
The eroding rocky coasts export sediment to the ocean, the amount of which is poorly known. At the global scale it could amounts 0.15-0.4 Gt/a (1). Recent evaluations of large retreat rates on monitored sections of sea cliffs indicate it can be comparable to the sediment input from medium to large rivers. We quantify rocky coast input to the ocean sediment budget at the European scale, the continent characterized by the best dataset.
The sediment budget from European rocky coasts has been computed from cliff lengths, heights and retreat rates. For that, we first compiled a large number of well-documented retreat rates; the analysis of whom showed that the retreat rates are at first order explained by cliff lithology (GlobR2C2, 2). Median erosion rates are 2.9 cm/a for hard rocks, 10 cm/a for medium rocks and 23 cm/a for weak rocks. These retreat rates were then applied to the European coast classification (EMODnet), giving the relative coast length for cliffs of various lithology types. Finally the cliff height comes from the EU-DEM (https://ec.europa.eu/eurostat/web/gisco/geodata/reference-data/elevation).
Due to data availability, we only worked on ~70% of the whole Europe, corresponding to a 127,000 km-long coastline (65,000 km of rocky coast). We calculated it originates 111±65 Mt/a, corresponding to 0.38 times the sediment input from rivers from the equivalent area (3.56 106 km2), calculated after Milliman and Farnsworth (3)’s database (290 Gt/a). A crude extrapolation to the 1.5 106 km-long Earth’s coastline reaches an amount of 0.6-2.4 Gt/a, an order of magnitude less that the sediment discharge from rivers (11-21 Gt/a, e.g., 3).
This up-to-now overlooked sedimentary source must further be explored for: (i) its effects on the geochemical ocean budget; (ii) the rising sea level control on the cliff retreat rates; and (iii) the characteristics and location of sediment deposition on ocean margins.
References
(1) Mahowald NM, Baker AR, Bergametti G, Brooks N, Duce RA, Jickells TD, Kubilay N, Prospero JM, Tegen I (2005). Atmospheric global dust cycle and iron inputs to the ocean: ATMOSPHERIC IRON DEPOSITION. Global Biogeochemical Cycles 19. DOI: 10.1029/2004GB002402
(2) Prémaillon M, Regard V, Dewez TJB, Auda Y (2018). How to explain variations in sea cliff erosion rates? Insights from a literature synthesis. Earth Surface Dynamics Discussions:1–29. DOI: https://doi.org/10.5194/esurf-2018-12
(3) Milliman J, Farnsworth K (2011). River Discharge to the Coastal Ocean: A Global Synthesis. Cambridge University Press
How to cite: Regard, V., Prémaillon, M., Dewez, T., Carretier, S., Jeandel, C., Godderis, Y., Bonnet, S., Schott, J., Pedoja, K., Martinod, J., Viers, J., and Fabre, S.: Coastal erosion: an overlooked source of sediments to the ocean. Europe as an example, EGU General Assembly 2022, Vienna, Austria, 23–27 May 2022, EGU22-2877, https://doi.org/10.5194/egusphere-egu22-2877, 2022.
EGU22-3002 | Presentations | GM2.8
Prototype of a deep learning workflow to map dunes in the KalahariMaike Nowatzki, Richard Bailey, and David Thomas
Linear dunes show a wide variety of morphometrical patterns; their sizes, spacing, defect density, and orientations differ not only between but also within dunefields (Thomas 1986; Bullard et al. 1995; Hesse 2011; Hugenholtz et al. 2012). The first step towards characterising dune patterning is to accurately and precisely map dunefields, which is challenging, especially when dunefields are too large to be mapped manually. Thus, (semi-)automatic approaches have been brought forward (Telfer et al. 2015; Shumack et al. 2020; Bryant & Baddock 2021). Here, we are presenting the prototype of a deep learning workflow that allows for the automated mapping of large linear dunefields through semantic segmentation.
The algorithm includes the following components: 1) the download of satellite imagery; 2) pre-processing of training and prediction data; 3) training of a Neural Network; and 4) applying the trained Neural Network to classify satellite imagery into dune and non-dune pixels. The workflow is python-based and uses the deep learning API keras as well as a variety of spatial analysis libraries such as earthengine and rasterio.
A case study to apply and test the algorithm’s performance was conducted on Sentinel-2 satellite imagery (10 m spatial resolution) of the southwest Kalahari Desert. The resulting predictions are promising, despite the small amount of data the model was trained on.
The presented prototype is work in progress. Further developments will include parameter optimisation, exploring ways to improve the objectiveness of training data, and the conduction of case studies applying the algorithm to digital elevation rasters.
How to cite: Nowatzki, M., Bailey, R., and Thomas, D.: Prototype of a deep learning workflow to map dunes in the Kalahari, EGU General Assembly 2022, Vienna, Austria, 23–27 May 2022, EGU22-3002, https://doi.org/10.5194/egusphere-egu22-3002, 2022.
EGU22-3781 | Presentations | GM2.8
Automatic detection of pit-mound topography from LiDAR based DEMsJanusz Godziek and Łukasz Pawlik
Pit-and-mound (treethrow, windthrow) topography is a result of tree uprooting caused by the impact of hurricane-speed wind events. Analyzing its location and morphometric features can improve our knowledge about the influence of winds on forest ecosystem dynamics and on changes in the forest floor microrelief. This is important in terms of hillslope denudation and soil evolution.
The occurrence and evolution of pit-mound topography can be studied with the use of high-resolution elevation data. Such data can be obtained from LiDAR (Light Detection and Ranging) surveys. Polish Institute of Geodesy and Cartography carried the LiDAR survey in the years 2010-2015. Point cloud data for the entire area of Poland with the minimal density of 4 points per m2 is currently available on the Internet.
Under the present project, we have analyzed Digital Elevation Models (DEMs) produced from the above-mentioned LiDAR data in order to develop and test a new method for automatic detection of pit-mound topography. As far as we know, no such method exists at the moment. We generated DEMs with 0.5 m spatial resolution for three study sites with the confirmed occurrence of pit-mound topography, located in Southern Poland. A script with the method was written in the R programming language.
The proposed method is based on contour lines. We found that the detection of pit and mound topography formed on gentle hillslopes is possible when closed contours are delineated. Detected forms can be classified into “pits” and “mounds” by investigating point positions with the highest and the lowest elevation within the closed contour. On the other hand, for steep surfaces pit-mound topography can be detected by calculating distances between contours and selecting slope segments with between-contours distances above a certain threshold value. This leads to the identification of gently-sloped areas within the study site. With a high probability, such areas indicate places, where pit-mound topography was formed. To validate our methods, we performed the on-screen assessment of DEMs for the presence of forms that could be interpreted as pit-mound topography.
The study has been supported by the Polish National Science Centre (project no 2019/35/O/ST10/00032).
How to cite: Godziek, J. and Pawlik, Ł.: Automatic detection of pit-mound topography from LiDAR based DEMs, EGU General Assembly 2022, Vienna, Austria, 23–27 May 2022, EGU22-3781, https://doi.org/10.5194/egusphere-egu22-3781, 2022.
EGU22-4765 | Presentations | GM2.8
A new, multi-scale mapping approach for reconstructing the flow evolution of the Fennoscandian Ice Sheet using high-resolution digital elevation models.Frances E. G. Butcher, Anna L. C. Hughes, Jeremy C. Ely, Christopher D. Clark, Emma L. M. Lewington, Benjamin M. Boyes, Alex C. Scoffield, Stephen Howcutt, and Thomas P. F. Dowling
Data-driven reconstructions of palaeo-ice sheets based on their landform records are required for validation and improvement of numerical ice sheet models. In turn, such models can be used to better predict the future responses of the Antarctic and Greenland ice sheets to climate change. We are exploiting the recent expansion in availability and coverage of very-high-resolution (1–2 m) digital elevation models (DEMs) within the domain of the former Fennoscandian Ice Sheet to reconstruct its flow pattern evolution from the glacial landform record.
The Fennoscandian Ice Sheet reached its maximum extent at 21–20 ka. Previous data-driven reconstructions over the whole ice sheet domain (encompassing Fennoscandia, northern continental Europe and western Russia) have necessarily relied upon landform mapping from relatively coarse-resolution (decametre-scale) data, predominantly from satellite images and aerial photographs. However, high-resolution (1–2 m/pixel resolution) LiDAR DEMs have recently become available over a large portion of the ice sheet domain above contemporary sea level. This reveals previously unobserved assemblages of landforms which record past ice sheet flow, including fine-scale cross-cutting and superposition relationships between landforms. These observations are likely to reveal previously unidentified complexity in the flow evolution of the ice sheet. However, the richness of the data available over such a large area amplifies labour-intensity challenges of data-driven whole-ice-sheet reconstructions; it is not possible to map every flow-related landform (or even a majority of the landforms) manually in a timely manner. We therefore present a new multi-scale sampling approach for systematic and comprehensive ice-sheet-scale mapping, which aims to overcome the data-richness challenge while maintaining rigor and providing informative data products for model-data comparisons.
We present in-progress mapping products covering Finland, Norway and Sweden produced using our new multi-scale sampling approach. The products include mapping of >200 000 subglacial bedforms and bedform fields, and a summary map of ‘landform linkages’. Landform linkages summarise the detailed landform mapping but do not extrapolate over large distances between observed landforms. Thus, they provide a reduced data product that is useful for regional-scale flow reconstruction and model-data comparisons and remains closely tied to landform observations. The landform linkages will be reduced further into longer interpretative flowlines, which we will then use to generate ‘flowsets’ describing discrete ice flow patterns within the ice sheet. We will use cross-cutting relationships observed in the detailed landform mapping to ascribe a relative chronology to overlapping flowsets where relevant. We will then combine the flowsets into a new reconstruction of the flow pattern evolution of the ice sheet.
How to cite: Butcher, F. E. G., Hughes, A. L. C., Ely, J. C., Clark, C. D., Lewington, E. L. M., Boyes, B. M., Scoffield, A. C., Howcutt, S., and Dowling, T. P. F.: A new, multi-scale mapping approach for reconstructing the flow evolution of the Fennoscandian Ice Sheet using high-resolution digital elevation models., EGU General Assembly 2022, Vienna, Austria, 23–27 May 2022, EGU22-4765, https://doi.org/10.5194/egusphere-egu22-4765, 2022.
EGU22-5872 | Presentations | GM2.8 | Highlight
Kinematic patterns of tectonic displacements in the Blue Clay outcrops along the eastern border of the Bradanic Trough (Southern Italy) from DTM data processingGiuseppe Spilotro, Gioacchino Francesco Andriani, Giuseppe Di Prizio, Katia Decaro, Alessandro Parisi, and Maria Dolores Fidelibus
The Bradanic Trough (Southern Italy) is the Pliocene-present-day south Apennines foredeep. It is filled by a thick Pliocene to Pleistocene sedimentary succession constituted by hemipelagites (Blue Clay Fm.) in the lower part, and coarse grained deposits (sands and conglomerates) in the upper part, shaped in marine or continental terraced environment.
On the eastern border of the Bradanic Trough along the Murgian Plateau (Apulia, Italy) numerous morphological lineaments are associated with sequential lowering and rotation of the surface, aligned with the carbonate substrate dip direction.
These morphologies have been interpreted so far as erosion products; their association with medium-deep water circulations and surface phenomena, like mud volcanoes, now allows their interpretation as a lumped mass, detached and tilted along shear surfaces.
The surface patterns of such surfaces may be easily detected for the presence, at some distance, of a quite similar twin track, which overlaps with good agreement.
The numerical analysis of the tracks extracted from accurate DTMs allows us to reconstruct the kinematic patterns of the tectonic displacement (distance of the detachment; rotation; angle of the shear plane). This type of analysis might reveal very useful in some fields of engineering geology, such as underground works, and for interpreting many hydrogeological phenomena within the study area. Finally, the correct 3D representation of the detached masses helps to identify the true causes of the direct faulting, which is not always linked to the tectonics, not active in the concerned regions.
How to cite: Spilotro, G., Andriani, G. F., Di Prizio, G., Decaro, K., Parisi, A., and Fidelibus, M. D.: Kinematic patterns of tectonic displacements in the Blue Clay outcrops along the eastern border of the Bradanic Trough (Southern Italy) from DTM data processing, EGU General Assembly 2022, Vienna, Austria, 23–27 May 2022, EGU22-5872, https://doi.org/10.5194/egusphere-egu22-5872, 2022.
The Gulf of Mexico is characterized by a high geodiversity that influences hydrodynamics patterns and drives biological and human uses of the seafloor. In 2017, the United States Bureau of Ocean Energy Management released a 1.4-billion-pixel bathymetric dataset of the deep northern Gulf of Mexico, with a pixel size of about 12m. The computational power required to analyze this dataset has limited its use so far. Here, geomorphometry was used to characterize the seafloor of the deep northern Gulf of Mexico at multiple spatial resolutions. Flat areas and slopes cover more than 70% of the studied area, yet thousands of smaller morphological features like peaks and pits were identified. Spatial comparisons confirmed that analyses at different spatial scales capture different features. A composite product combining seafloor classification at multiple scales helped highlight the dominant seafloor features and the scale at which they are best captured.
How to cite: Lecours, V.: Geomorphometry of the deep Gulf of Mexico, EGU General Assembly 2022, Vienna, Austria, 23–27 May 2022, EGU22-5990, https://doi.org/10.5194/egusphere-egu22-5990, 2022.
EGU22-6152 | Presentations | GM2.8 | Highlight
Quantifying the morphometry and drainage patterns of composite volcanoes: A comparison of the Japanese and Indonesian volcanic arcsRoos M. J. van Wees, Daniel O'Hara, Pablo Grosse, Gabor Kereszturi, Pierre Lahitte, and Matthieu Kervyn
The long-term (ka to ma) degradation of a volcanic edifice is controlled by both regional (e.g., climate, tectonics) and local factors (e.g., original morphology, lithology), resulting in both long-lasting weathering and river incision and short-term hazardous events, such as flank collapses and lahars. Trends among the morphometry of stratovolcanoes, their drainage network, denudation, and regional factors were recently characterised for composite volcanoes along the Indonesian arc. Denudation was shown to be negatively correlated with drainage density; the across-arc variations expose a tectonic control on the level of denudation and volcanoes’ irregularity. This study applies the same method on age-constrained volcanoes in Japan to find coherent trends between arcs despite the different local and regional factors. We aim to better understand the factors that control erosion rates and patterns, and the evolutionary phases of volcano degradation.
We first compile a dataset of 35 singular, non-complex composite volcanoes with known eruption ages and spatially spread throughout the Japanese Island arc system. Using 30m TanDEM-X Digital Elevation Models, morphologies, and drainage metrics (e.g., volume, height, slopes, irregularity index, Hack’s Law exponent, and drainage density) are extracted for each volcano, using the MORVOLC algorithm adapted in MATLAB as well as the newly developed DrainageVolc algorithm. Correlations between the morphometric parameters and potential controlling factors (e.g., age, climate, lithology, and tectonics) are analysed to determine quantitative relationships of edifice degradation throughout the arc. Finally, we compare relationships and correlation values of the Japanese Arc system to those from the Indonesian Arc.
The analysis shows that volcano age is positively correlated with irregularity and negatively correlated with height and volume. From the drainage parameters, we find that basins become wider and merge, resulting in lower drainage densities. The variation in erosion rates along the Japanese arc provides evidence for the degree of climatic control on the volcano degradation. The between-arc comparison shows which trends are susceptible to arc-scale variations and highlights consistent trends that have the potential to be extrapolated to other volcanic arcs and be used as a relative age determination tool for composite volcanoes.
How to cite: van Wees, R. M. J., O'Hara, D., Grosse, P., Kereszturi, G., Lahitte, P., and Kervyn, M.: Quantifying the morphometry and drainage patterns of composite volcanoes: A comparison of the Japanese and Indonesian volcanic arcs , EGU General Assembly 2022, Vienna, Austria, 23–27 May 2022, EGU22-6152, https://doi.org/10.5194/egusphere-egu22-6152, 2022.
Please decide on your access
Please use the buttons below to download the presentation materials or to visit the external website where the presentation is linked. Regarding the external link, please note that Copernicus Meetings cannot accept any liability for the content and the website you will visit.
Forward to presentation link
You are going to open an external link to the presentation as indicated by the authors. Copernicus Meetings cannot accept any liability for the content and the website you will visit.
We are sorry, but presentations are only available for users who registered for the conference. Thank you.
EGU22-6177 | Presentations | GM2.8
Identification, GIS-based mapping and morphometric analysis of river terraces from airborne LiDAR data in the Augšdaugava spillway valley, South-eastern LatviaJuris Soms and Valdis Vorslavs
The Augšdaugava spillway valley located in SE Latvia has a system of river terraces formed by both glacio-fluvial and fluvial processes. The flight of terraces forms a staircase-like relief in the riverine landscape and represents the evidence of valley evolution during the transition from glacial to post-glacial conditions in this region. Hence terraces are substantial ‘archives’ of paleoenvironmental data and their geomorphometry could provide key information for untangling geomorphological history of the spillway valley. Hence the need for precise identification and mapping of terraces is obvious. However, these landforms, particularly upper terraces commonly are poorly preserved. It is a result of the interplay of many geological processes – channel incision, lateral erosion in the course of the river Daugava meandering, mass wasting etc., leaving discontinuous remnants of terraces along to the present-day long profile of the river. Previously, mapping of these features was performed via extensive field surveys and to some extent by interpretation of aerial images or topographic maps, because the presence of tree cover hinders the identification of terraces by conventional geomorphological techniques. Thereby due to the poor preservation of fluvial landforms and the abundant vegetation cover, the previously mapped terrace surfaces and inferred levels may be questionable.
Yet the now available high-resolution LiDAR data in Latvia and application of modern GIS-based techniques offer an opportunity to resolve these problems. Hence the main goal of the study was to apply a methodology based on using LiDAR-derived DEM and combining different semi-automated GIS analysis tools for the identification, mapping and morphometric analysis of fluvial terraces in the valley. In this study, LiDAR data coverage (courtesy of the Latvian Geospatial Information Agency) was used to generate a DEM. LiDAR coverage consists of 317 data folders in *.LAS format, each one of 1 km2 extent. DEM with 0.5 x 0.5 m pixel resolution and <15 cm vertical accuracy was created by ArcGIS PRO tool ‘LAS Dataset to Raster’ following the standard procedure of the IDW interpolation. After the construction of DEM, the TerEx toolbox integrated into the ArcGIS environment was used for the extraction and delineation of terrace surfaces. After the completion of GIS works, the ground-truthing of the obtained data on the location of fluvial terraces was performed during field geomorphological reconnaissance.
DEM analysis allowed to identify the terrace sequence in the Augšdaugava spillway valley consisting of eight different terrace levels – T1 to T8. From the applied methodology, authors were able to delineate surfaces of river terraces in those parts of the valley, where in the course of previous research terraces were interpreted incorrectly or even not identified at all. However, only terraces T1 and T2 can only be unambiguously identified by GIS-based extraction. Upper terraces with smoothened edges due to mass wasting and surfaces dissected by gullies are not easily recognizable. Hence, the presence of minor landforms which increase the topographical roughness of the surface directly influences the quality of extracted data, thus leading to the necessity of an extensive amount of manual editing.
How to cite: Soms, J. and Vorslavs, V.: Identification, GIS-based mapping and morphometric analysis of river terraces from airborne LiDAR data in the Augšdaugava spillway valley, South-eastern Latvia, EGU General Assembly 2022, Vienna, Austria, 23–27 May 2022, EGU22-6177, https://doi.org/10.5194/egusphere-egu22-6177, 2022.
EGU22-6681 | Presentations | GM2.8
Automated tools for identifying bankfull river channel extents: developing and comparing objective and machine-learning methodsKathryn Russell, Jonathan Garber, Karen Thompson, Jasper Kunapo, Matthew Burns, and Geordie Zhang
Bankfull channel dimensions are of fundamental importance in fluvial geomorphology, to describe the geomorphic character of a river, as inputs to models which explain variations in morphology through time and space, and as initial processing steps in more detailed morphometric techniques. With ever-increasing availability of high-resolution elevation data (e.g. LiDAR), manual delineation of channel extents is a bottleneck which limits the geomorphic insights that can be gained from that data.
We developed and tested two automated channel delineation methods that define bankfull according to different criteria and thus reflect different conceptualisations of bankfull extent: (1) a cross-sectional method (termed HydXS) that identified the elevation which maximises hydraulic depth (cross-section area/wetted width); and (2) a neural network image segmentation model trained on images derived from a LiDAR digital elevation model.
HydXS outperformed the neural network method overall, but the two methods were comparable in larger streams (> 20 m bankfull width; Dice coefficient ~0.85). Prediction accuracy of HydXS was generally high (overall precision 89%; recall 81%), performing well even in small streams (bankfull width ~ 10 m). HydXS performed worst in incised and recovering stream sections (precision 93%; recall 64%) where the choice between macro-channel and inset channel was somewhat arbitrary (both for the algorithm and manual delineation). The neural network outperformed HydXS where an inset channel was present. The neural network method performed worst in small streams and where other features (e.g. road embankments, small ditches) were misclassified as channels. Neural network performance was improved markedly by trimming the area of interest to a 100-m wide buffer along the stream, eliminating many areas prone to misclassification.
The two methods provide different ways to effectively leverage high-resolution LiDAR datasets to gain information about channel morphology. These methods are a significant step forward as they can delineate bankfull elevation, as well as bankfull width, and operate using morphology alone. HydXS is an objective method that doesn’t require training, can be run on consumer-level hardware, and can perform well in small streams, but requires manual work to develop the necessary spatial framework of an accurate channel centerline. The neural network model is a promising method to delineate larger channels (>20 m wide) without requiring detailed centerline or cross-section data, given adequate training data for the stream type of interest (i.e. expert-delineated bankfull channel extents). We envisage that further improvement of the neural network method is possible by scaling the input image extents to catchment area, and training on a larger dataset from multiple regions to increase generalizability.
How to cite: Russell, K., Garber, J., Thompson, K., Kunapo, J., Burns, M., and Zhang, G.: Automated tools for identifying bankfull river channel extents: developing and comparing objective and machine-learning methods, EGU General Assembly 2022, Vienna, Austria, 23–27 May 2022, EGU22-6681, https://doi.org/10.5194/egusphere-egu22-6681, 2022.
EGU22-6924 | Presentations | GM2.8
Returning to geostatistical-based analysis of image/surface texture: from generalization to a basic one-click short-range surface roughness algorithmSebastiano Trevisani
Despite the long record of applications and the well-known theoretical framework, geostatistical based image/surface texture tools have still not gained a wide diffusion in the context of geomorphometric analysis, even for the evaluation of surface roughness. Many geomorphometric studies dealing with various aspect of surface roughness use well-known approaches based on vector dispersion of normals to surface or even the popular Topographic Ruggedness Index. In many comparative studies on roughness metrics, geostatistical approaches are cited but not tested; in other studies, geostatistical approaches are tested using algorithms not adapted to the analysis of morphometric data. In remote sensing, geostatistical approaches are more popular, even if there is not a consensus on which are the most suited metrics for computing image texture indices. In metrology of manufactured surfaces, equipped by various industrial standards for surface texture measurements, approaches based on autocorrelation are widely adopted. However, “natural” surfaces and related morphogenetic factors are much more complex than manufactured surfaces and ad-hoc concepts and algorithms should be devised. This presentation is mainly focused on topographic surface analysis, but the considerations and results are applicable also in the context of image analysis. This presentation aims to clarify some aspects of the geostatistical methodologies, highlighting the effectiveness and flexibility in the context of multiscale and directional evaluation of surface texture. In doing this, the connections with other methodologies and concepts related to spatial data analysis are highlighted. Finally, it is introduced a simplified algorithm for computing surface roughness indices, which does not require the preliminary detrending of the input DEM.
References
ATKINSON, P.M. and LEWIS, P., 2000. Geostatistical classification for remote sensing: An introduction. Computers and Geosciences, 26(4), pp. 361-371.
BALAGUER, A., RUIZ, L.A., HERMOSILLA, T. and RECIO, J.A., 2010. Definition of a comprehensive set of texture semivariogram features and their evaluation for object-oriented image classification. Computers and Geosciences, 36(2), pp. 231-240.
GUTH, P.L., 2001. Quantifying terrain fabric in digital elevation models. GSA Reviews in Engineering Geology, 14, pp. 13-25.
HERZFELD, U.C. and HIGGINSON, C.A., 1996. Automated geostatistical seafloor classification - Principles, parameters, feature vectors, and discrimination criteria. Computers and Geosciences, 22(1), pp. 35-41.
TREVISANI, S., CAVALLI, M. and MARCHI, L., 2009. Variogram maps from LiDAR data as fingerprints of surface morphology on scree slopes. Natural Hazards and Earth System Science, 9(1), pp. 129-133.
TREVISANI, S., CAVALLI, M. and MARCHI, L., 2012. Surface texture analysis of a high-resolution DTM: Interpreting an alpine basin. Geomorphology, 161-162, pp. 26-39.
TREVISANI, S. and ROCCA, M., 2015. MAD: Robust image texture analysis for applications in high resolution geomorphometry. Computers and Geosciences, 81, pp. 78-92.
TREVISANI, S. and CAVALLI, M., 2016. Topography-based flow-directional roughness: Potential and challenges. Earth Surface Dynamics, 4(2), pp. 343-358.
How to cite: Trevisani, S.: Returning to geostatistical-based analysis of image/surface texture: from generalization to a basic one-click short-range surface roughness algorithm, EGU General Assembly 2022, Vienna, Austria, 23–27 May 2022, EGU22-6924, https://doi.org/10.5194/egusphere-egu22-6924, 2022.
EGU22-7860 | Presentations | GM2.8
The Application of Relief Models for Environmental Solutions: ReviewLinda Grinberga, Armands Celms, Krisjanis Sietins, Toms Lidumnieks, Miks Brinkmanis-Brimanis, and Jolanta Luksa
With the development of remote sensing technologies the application of different geospatial models in research has become increasingly important. Terrain relief is the difference in elevation between the high and low points of a land surface, that is, the change in the height of the ground over the area. Terrain relative relief (or elevation) is the relative difference in elevation between a morphological feature and those features surrounding it (e.g. height difference between a peak and surrounding peaks, a depression and surrounding depressions etc.). Together with terrain morphology, ppland other terrain attributes, it is useful for describing how the terrain affects intertidal and subtidal processes.
Appropriate decision-making tools are required for urban and rural planning, design and management. The usage of DEM (Digital Elevation Model), DSM (Digital Surface Model) and DTM (Digital Terrain Model) helps researchers and designers to analyse issues connected with drainage, geology, earth crust movements, sound and radio-wave distribution, wind effects, exposure to sun, etc. Analysis of the future scenarios of geospatial models has an essential role in the field of water management and various environmental topics. This research aims to focus on the environmental issues in a context of water quality and hydrology.
How to cite: Grinberga, L., Celms, A., Sietins, K., Lidumnieks, T., Brinkmanis-Brimanis, M., and Luksa, J.: The Application of Relief Models for Environmental Solutions: Review, EGU General Assembly 2022, Vienna, Austria, 23–27 May 2022, EGU22-7860, https://doi.org/10.5194/egusphere-egu22-7860, 2022.
EGU22-8728 | Presentations | GM2.8
Mapping of natural and artificial channel networks in forested landscapes using LiDAR data to guide effective ecosystem managementSiddhartho Shekhar Paul, Eliza M. Hasselquist, William Lidberg, and Anneli M. Ågren
High-resolution Light Detection and Ranging (LiDAR) data provide unique opportunities for landscape-scale mapping of hydrological features. LiDAR-derived digital elevation models are particularly valuable for identifying channel networks in densely forested landscapes, where satellite imagery-based mapping approaches are challenged by forest canopies. Artificial drainage practices have caused widespread alteration of northern landscapes of Europe and North America which likely have had significant impacts on hydrological connectivity and ecosystem functioning. However, these artificial channels are rarely considered in ecosystem management and poorly represented in existing geomorphological datasets. In this study, we conducted a landscape-scale analysis across 11 selected study regions in Sweden using LiDAR data for the virtual reconstruction of artificial drainage ditches to understand the extent of their ecological impacts.
We utilized a 0.5 m resolution digital elevation model for mapping natural channel heads and artificial ditches across the study regions. We also implemented a unique approach by back-filling ditches in the current digital elevation model to recreate the prehistoric landscape. This enabled us to map and model the channel networks of prehistoric (natural) and current (drained) landscapes. We found that 58% of the prehistoric natural channels had been converted to ditches. Moreover, the average channel density increased from 1.33 km km‑2 in the prehistoric landscape to 4.66 km km-2 in the current landscape, indicating substantial ditching activities in the study regions.
Our study highlights the need for accurate delineation of natural and artificial channel networks in northern landscapes for effective ecosystem restoration and management. We presented an innovative technique for comparing the channel networks between the prehistoric natural landscape and current modified landscape by integrating advanced LiDAR data, extensive manual digitization, and modeling; a highly suitable combination for channel network mapping in dense forest landscapes. The developed methodology can be implemented in any landscape for understanding the extent of human modification of natural channel networks to guide future environmental management activities and policy formulation.
How to cite: Paul, S. S., Hasselquist, E. M., Lidberg, W., and Ågren, A. M.: Mapping of natural and artificial channel networks in forested landscapes using LiDAR data to guide effective ecosystem management, EGU General Assembly 2022, Vienna, Austria, 23–27 May 2022, EGU22-8728, https://doi.org/10.5194/egusphere-egu22-8728, 2022.
EGU22-9650 | Presentations | GM2.8
Geodiversity as a key component for the evaluation of urban biodiversityMartina Burnelli, Massimiliano Alvioli, Laura Melelli, and Alessia Pica
Ecodiversity stems from the interaction between the biosphere and the geosphere, and it is one of the necessary conditions for achieving a sustainable planet. Thus, the relationship between geodiversity and biodiversity should be clearly defined. The relationship between climate and topography in roughened mountain areas at low-latitudes, as constrains for the high values of biodiversity, has already been established. As a consequence, topography is the first and most important input parameter for investigating the connections between abiotic and biotic variety. Spatial analysis in a GIS framework is the key approach to better understand the role of topographic and hydrographic variables in evaluating geodiversity (geomorphodiversity) .
In this paper we focused on analyzing urban areas, where in 2030 60% of the world's population is expected to live. A science of cities is the future challenge for Earth Sciences: urban geomorphology could be the key to have a complete overview on the abiotic and biotic parameters in sustainable cities. To achieve this aim, the conservation of urban biodiversity is fundamental. Analysing the correlation between substantial geodiversity and biodiversity may be a guideline for science of cities and for designing and managing sustainable urban areas.
These ideas, if transposed in an urban context, should go beyond morphometric analysis of topography and take into account anthropogenic features and natural landforms modified by humans in time. To this end, geomorphological mapping is fundamental to calibrate the quantitative models in a truly multidisciplinary approach to a science of cities and urban biodiversity. We consider our contribution as a new model for the analysis of geodiversity in urban areas.
How to cite: Burnelli, M., Alvioli, M., Melelli, L., and Pica, A.: Geodiversity as a key component for the evaluation of urban biodiversity, EGU General Assembly 2022, Vienna, Austria, 23–27 May 2022, EGU22-9650, https://doi.org/10.5194/egusphere-egu22-9650, 2022.
Please decide on your access
Please use the buttons below to download the presentation materials or to visit the external website where the presentation is linked. Regarding the external link, please note that Copernicus Meetings cannot accept any liability for the content and the website you will visit.
Forward to presentation link
You are going to open an external link to the presentation as indicated by the authors. Copernicus Meetings cannot accept any liability for the content and the website you will visit.
We are sorry, but presentations are only available for users who registered for the conference. Thank you.
EGU22-10469 | Presentations | GM2.8
Automatic detection of rock outcrops on vegetated and moderately cultivated areasRéka Pogácsás and Gáspár Albert
State-of-the-art applications in various earth science domains shows that different classification methods are playing an increasingly important role in mapping due to their improving accuracy. However, in the field of geological mapping, the exclusive use of morphometric and spectral indices in classification models are still often considered as subsidiary mapping tools. This is particularly true in areas where the surface is covered by vegetation and the soil layer is relatively thick, since in such places geological structures can only be observed at first hand at rock outcrops. The aim of our research is to investigate the automatic mapping of rock outcrops in the Dorog Basin in Hungary, where outdated geological maps are currently being updated. In this research, we applied the random forest classification combined with a wider range of input data including satellite imagery and ecosystem information.
The Dorog Basin, located in northern central Hungary, has a medium-density settlement network, with built-up and cultivated areas alternating with areas of wooded or scrub-covered terrain with rugged topography. The region is tectonically fragmented, where former fluvial erosion is of great importance. In several cases the Mesozoic carbonates, Paleogene limestones or limnic coal sequences outcrop the Quaternary sediments resulting a diverse, although a well identifiable surface. In the 86.86 km2 study area, the input of the model included 14 morphometrical raster layers derived from SRTM-1, six raster layers with mineral indices derived from Sentinel II, and one ecosystem layer [1], all set to a uniform ~25m resolution. To test the performance of random forest classification in modelling pre-Quaternary formations, we applied two different approaches. In the first one, we used conventional training areas to model pre-Quaternary outcrops, as well as we modelled the physical characteristics of the surface formations. Whereas in the second one, we modelled the pre-Quaternary outcrops and physical characteristics of the surface formations by using randomly selected zones on the study area with around 6000-10000 random training polygons. The randomly generated training polygons were circles of about 1-2 pixels in size around points. The training areas were derived from the former geological map of the Dorog Basin [2]. The importance of input parameters were also observed for further use. A six-fold cross-validation of the selected training areas showed that the two methods were equally accurate, but the automatic processing of randomly selected training areas was faster.
Based on the modelling results, the pre-Quaternary rock outcrops of the area can be determined with at least 80% confidence using random forest classification. These results will be used in future field mapping, which will also provide a field validation of the method.
From the part of G.A. financial support was provided from the NRDI Fund of Hungary, Thematic Excellence Programme no. TKP2020-NKA-06 (National Challenges Subprogramme) funding scheme.
[1] Ecosystem Map of Hungary. DOI: 10.34811/osz.alapterkep
[2] Gidai, L., Nagy, G., & Sipass, S. (1981). Geological map of the Dorog Basin 1: 25 000. [in Hungarian] Geological Institute of Hungary, Budapest.
How to cite: Pogácsás, R. and Albert, G.: Automatic detection of rock outcrops on vegetated and moderately cultivated areas, EGU General Assembly 2022, Vienna, Austria, 23–27 May 2022, EGU22-10469, https://doi.org/10.5194/egusphere-egu22-10469, 2022.
Please decide on your access
Please use the buttons below to download the presentation materials or to visit the external website where the presentation is linked. Regarding the external link, please note that Copernicus Meetings cannot accept any liability for the content and the website you will visit.
Forward to presentation link
You are going to open an external link to the presentation as indicated by the authors. Copernicus Meetings cannot accept any liability for the content and the website you will visit.
We are sorry, but presentations are only available for users who registered for the conference. Thank you.
EGU22-10675 | Presentations | GM2.8
Response of a small mountain river to a sediment pulse tracked using sub-canopy UAV surveysConor McDowell, Helm Carina, Reid David A., and Hassan Marwan
Remotely piloted aircrafts (UAVs) and Structure-from-Motion photogrammetry (SfM) have become a widely used approach for producing high-resolution topographical measurements of river systems. This approach has the benefit of capturing data over large spatial scales while requiring little time in the field. In small, forested rivers, the dense canopy has hindered the use of remote sensing techniques, limiting topographic data collection to more time-consuming and lower-resolution methods. This complicates monitoring the response of these systems to individual floods, as in many situations there is not enough time to complete more time-consuming surveys between events.
In this study, we pilot the use of sub-canopy UAV surveys (flown at 1-3 m altitude) to monitor the response of a small mountain stream (1-3 m wide) in British Columbia to a sediment pulse generated by the removal of an upstream culvert. Using eleven surveys flown over a three-year period, we track the downstream propagation of the pulse and the subsequent responses in bed topography and roughness along the 240 m reach. We observe a “build-and-carve” response of the channel, where some channel segments aggrade during the first floods after pulse generation, whereas others undergo little morphologic activity. In subsequent floods, these aggradational segments rework through the carving of well-defined channels that release this aggraded sediment downstream. These “build-and-carve” segments serve as temporary storage reservoirs that caused the pulse to fragment as it progressed downstream. The locations of these storage reservoirs were set by the initial channel morphology and the movement of in-stream wood and debris. This study highlights the importance of temporary sediment storage reservoirs for fluvial morphodynamics and provides some insights and suggestions for the future monitoring of forested river systems using sub-canopy drone surveys.
How to cite: McDowell, C., Carina, H., David A., R., and Marwan, H.: Response of a small mountain river to a sediment pulse tracked using sub-canopy UAV surveys, EGU General Assembly 2022, Vienna, Austria, 23–27 May 2022, EGU22-10675, https://doi.org/10.5194/egusphere-egu22-10675, 2022.
Please decide on your access
Please use the buttons below to download the presentation materials or to visit the external website where the presentation is linked. Regarding the external link, please note that Copernicus Meetings cannot accept any liability for the content and the website you will visit.
Forward to presentation link
You are going to open an external link to the presentation as indicated by the authors. Copernicus Meetings cannot accept any liability for the content and the website you will visit.
We are sorry, but presentations are only available for users who registered for the conference. Thank you.
EGU22-11010 | Presentations | GM2.8
InSAR phase unwrapping using Graph neural networksAnshita Srivastava, Ashutosh Tiwari, Avadh Bihari Narayan, and Onkar Dikshit
Advancements in processing strategies of time series interferometric synthetic aperture radar (InSAR) has resulted in improved deformation monitoring and DEM generation. Both of the applications use phase unwrapping, which involves finding and adding the unknown correct number of phase cycles to the wrapped phase. It is an inverse process of recovering the absolute phase from the wrapped phase, and the objective is to remove the 2π-multiple ambiguity. Ideally, it could be achieved by addition or subtraction of 2π at each pixel depending on the phase difference between the neighboring pixels. The problem appears effortless but brings challenges due to noise and inconsistencies. The conventional methods require improvements in terms of accurately estimating the unknown number of phase cycles and dealing with phase jumps. Recently, deep learning methods have been used extensively in the domain of remote sensing to solve complex image processing problems such as object detection and localization, image classification, etc. Since all the pixels in a stack of interferograms are not used in unwrapping, and the pixels used are scattered irregularly, modeling the unwrapping problem as an image classification problem is infeasible. In this work, we deploy Graph Neural Networks (GNNs), a class of deep learning methods designed to infer information from input graphs to solve the unwrapping problem. Phase unwrapping can be posed as a node classification problem using GNN, where each pixel is treated as a node. The method is aimed to exploit the capability of GNNs in correctly predicting the phase count of each pixel. The proposed work aims to improve the computational efficiency and accuracy of the unwrapping process, resulting in reliable estimation of displacement.
How to cite: Srivastava, A., Tiwari, A., Narayan, A. B., and Dikshit, O.: InSAR phase unwrapping using Graph neural networks, EGU General Assembly 2022, Vienna, Austria, 23–27 May 2022, EGU22-11010, https://doi.org/10.5194/egusphere-egu22-11010, 2022.
EGU22-11152 | Presentations | GM2.8
Source parameters of the 2021 Hovsgol earthquake (Mw 6.7) in Mongolia estimated by using Sentinel-1 and ALOS-2 DInSARTaewook Kim and Hyangsun Han
Understanding the mechanism of fault rupture is important to minimize earthquake damage and to estimate the impacts of future earthquakes. In this study, we observed surface displacements caused by the Hovsgol earthquake (Mw 6.7) in January 2021 using three Differential Interferometric SAR (DInSAR) pairs of Sentinel-1B at descending node and ALOS-2 at ascending and descending nodes, and then estimated the source parameters of the earthquake by the inversion of the observed displacement fields. The maximum surface displacement in the radar look direction was 21 cm at the Sentinel-1 descending node, and 32 cm and 26 cm at the ALOS-2 ascending and descending node, respectively. All differential interferograms showed three fringe patterns near the epicenter, which suggests that there were three rupture planes with different slips. We performed the inversion modeling of the DInSAR-observed surface displacements assuming three rupture planes with different slip magnitudes and directions. The values of normalized root mean square error (NRMSE) between the modelled and observed displacements were smaller than 4% for all DInSAR observations. The spatial distribution of modelled displacements was matched to the observed one. The source parameters of fault estimated by the inversion were closely consistent with the measurements by United States Geological Survey and Global Centroid Moment Tensor. The inversion results demonstrated that the assumption of our inversion modeling (three rupture planes) is reasonable.
How to cite: Kim, T. and Han, H.: Source parameters of the 2021 Hovsgol earthquake (Mw 6.7) in Mongolia estimated by using Sentinel-1 and ALOS-2 DInSAR, EGU General Assembly 2022, Vienna, Austria, 23–27 May 2022, EGU22-11152, https://doi.org/10.5194/egusphere-egu22-11152, 2022.
EGU22-11764 | Presentations | GM2.8
Application of Deep Learning Model to LULCC Monitoring using Remote Sensing Images-A case study in suburban areas of central TaiwanZhong-Han Zhuang and Hui Ping Tsai
1. INTRODUCTION
Monitoring land use and land cover change (LULCC) is one of the best methods to understand the interactive changes of agriculture, climate change, and ecological dynamics. In eastern Asia, Taiwan is characterized by high population density, rich biodiversity, and complex terrain. However, recent climate change has impacted the people and ecosystems in Taiwan. Therefore, we applied landscape metrics and the deep learning U-net semantic segmentation model to enhance the remote sensing images based LULCC monitoring efficiency and take a case study in suburban areas of central Taiwan, a place that plays an important economic role in Taiwan occupied with intensive agricultural activities.
2. METHOD
This study focuses on six townships in Nantou County in Central Taiwan, where the major agricultural products are rice, tea, and fruit. We obtained four dates of Sentinel-2 images in February for 2018 and 2021 and classified the landscape into five classes: agricultural, forest, built-up, free water bodies, and bare land. The spectral bands information (Blue, Green, Red, NIR), the normalized difference vegetation index (NDVI), and soil-adjusted vegetation index (SAVI) were obtained for establishing the deep learning U-net semantic segmentation model. The accuracy and the loss function of the training model results are 0.89 and 0.02, respectively. In addition, the ground truth data was consulted with the official land-use classification information and the high spatial resolution imagery in Google Earth Pro. Finally, we analysed the classified images' results to detail the study area's changing trajectory to explore the complex spatiotemporal landscape patterns.
3. RESULTS AND DISCUSSIONS
According to the result, the forest area on the eastern side accounts for more than 70% of the study area. The construction area and the agricultural area have an upward trend during the research period (16% and 5%); in addition, except for the number of patches in free water bodies decreased, all other categories had an upward trend, especially the construction and agricultural area are the largest. The Shannon's Evenness Index reflects that all patches are evenly distributed in space and the area-weighted average fractal dimension index decreases reflecting possible influences of anthropogenic activities. Thus, the results indicate an increasing level of fragmentation, supported by the decrease of the area-weighted average fractal dimension index. In conclusion, using satellite imagery with the deep learning U-net semantic segmentation model can sufficiently discern a detailed LULCC. Furthermore, with the combination of landscape matrix information, the interactions between humans and the environment can be understood better quantitatively.
References
Huete, A. R., Hua, G., Qi, J., Chehbouni, A., & Van Leeuwen, W. J. D., 1992: Normalization of multidirectional red and NIR reflectances with the SAVI. Remote Sensing of Environment, 41(2-3), 143-154.
Ronneberger, O., Fischer, P., & Brox, T., 2015: U-net: Convolutional networks for biomedical image segmentation. In International Conference on Medical image computing and computer-assisted intervention (pp. 234-241). Springer, Cham.
Rouse, J. W., Haas, R. H., Schell, J. A., Deering, D., Deering, W. 1973: Monitoring vegetation systems in the Great Plains with ERTS, ERTS Third Symposium, NASA SP-351 I, pp. 309-317.
How to cite: Zhuang, Z.-H. and Tsai, H. P.: Application of Deep Learning Model to LULCC Monitoring using Remote Sensing Images-A case study in suburban areas of central Taiwan, EGU General Assembly 2022, Vienna, Austria, 23–27 May 2022, EGU22-11764, https://doi.org/10.5194/egusphere-egu22-11764, 2022.
Please decide on your access
Please use the buttons below to download the presentation materials or to visit the external website where the presentation is linked. Regarding the external link, please note that Copernicus Meetings cannot accept any liability for the content and the website you will visit.
Forward to presentation link
You are going to open an external link to the presentation as indicated by the authors. Copernicus Meetings cannot accept any liability for the content and the website you will visit.
We are sorry, but presentations are only available for users who registered for the conference. Thank you.

EGU22-12041 | Presentations | GM2.8
Newly-Born Sand Dunes of Lake Urmia: Assessing Migration Rate and Morphodynamic Changes Using Remote Sensing Techniques and Field StudiesHesam Ahmady-Birgani, Parisa Ravan, Zhengyi Yao, and Gabriela Mihaela Afrasinei
To enhance the understanding of aeolian landforms and their processes, the assessment of origin, migration and evolution of newly-born sand dunes is vital. In this regard, Lake Urmia, in NW Iran, was considered as a representative case study, given that it has lost approximately two-thirds of its water volume in the past two decades and, consequently, the newly-born sand ridges and sand dunes on its western shores were formed. The emerging sand dunes are located close to the villages, adjacent to the agricultural and farmlands, international transit road, and industrial zone, encompassing the whole area. The present study aims to assess the sand dunes’ origin and their migration both in speed and direction in the past decade.
To understand the questions above, remote sensing techniques and in-field studies were coupled. Therefore, wind data from the closest meteorological station were employed to calculate the wind rose, drift potential (DP), the resultant drift potential (RDP), and the resultant drift direction (RDD) across the region. Change detection techniques using high-resolution satellite images were chosen to detect the migration rate and morpho-dynamic changes of Lake Urmia sand dunes. To classify the geomorphological features and land uses in the region, a hybrid supervised classification approach including a customised decision tree classifier was used to distinguish sand dune units from other signatures. Using the minimum bounding geometry method, feature classes were created. These feature classes represent the length, width, and orientation of sand dunes, retrieved after the image classification process. Also, fieldwork surveying was carried out on the sixteen sand dunes in different periods to measure the morphological and evolutionary changes.
As the wind results show, the trend of DP parameters between the years 2006-2009 and the years 2015-2020, the percentage of wind speeds above the threshold velocity (V>Vt%) to DP has significant gaps, suggestive of weaker winds in those periods. However, between the years 2009-2015, the V>Vt% and DP values are corresponding and coequal. This indicates that the most erosive and shifting winds are between 2009-2015, with the weakest wind power in tails. Moreover, the annual variability of DPt is well correlated with Lake Urmia water level changes; but there is no correlation between the DPt and precipitation amount. The evaluation of image processing results depicted that after 2003, the area of sand dunes had dramatically increased. On average, the smallest area belongs to 2010 (287.3 m2), and the largest area is for years 2019 (775.96 m2), 2018 (739.08 m2), and 2017 (739.74 m2). In addition, between the years 2010 and 2014, a significant increase in area of the sand dunes from 287.25 to 662.8 m2 was observed. The migration rate is the highest between 2010 and 2015, with the lowest values before 2010 and after 2015.
The results of this study have broad implications in the context of sustainable development and climate-related challenges, ecosystem management and policy-making for regions with sand dune challenges, hence crucial insights can be gained by coupling remote sensing techniques and in-situ studies.
How to cite: Ahmady-Birgani, H., Ravan, P., Yao, Z., and Afrasinei, G. M.: Newly-Born Sand Dunes of Lake Urmia: Assessing Migration Rate and Morphodynamic Changes Using Remote Sensing Techniques and Field Studies, EGU General Assembly 2022, Vienna, Austria, 23–27 May 2022, EGU22-12041, https://doi.org/10.5194/egusphere-egu22-12041, 2022.
EGU22-12383 | Presentations | GM2.8
Medium-scale unsupervised landform mapping of the Yamal Peninsula (Russia) using 2D Fourier decomposition of the ArcticDEMSergey Kharchenko
The supervised mapping of landforms last years got high levels based on classic classification methods and new artificial intelligence techniques. However, it is often difficult to create train data for large and diverse areas, and we can face up with differences between expert-to-expert landforms interpretation. It can be solve using unsupervised classification - a less effective in general case, but more objective. The way to make more effective classification - to create special input variables (to account local specificity of landforms) aimed to show real terrain structure. Study region - Yamal Peninsula (Arctic coast of Russia), covered sea accumulative and erosional plains, reshaped by some cryogenic processes, especially thermokarst, with many lake hollows. We used ArcticDEM 32m and decomposition of DEM with 2D FFT by moving windows with sequence of sizes from 1.5 to 3 km (by the interval of 0.3 km) and with lag around 150 m (overlapping - 90-95 %). The 9 variables were computed: 1) magnitude of the main wave in the height field, 2) wavelength of the main wave, 3) importance (share of the height variation) of the fix pool of biggest harmonic waves, 4-6) orthogonal (N-S and W-E) components of the general direction of the height fluctuations (and the significance of the direction), 7-9) coefficients of the exponential trend equation for approximation wave's frequencies/magnitudes distribution. We then trained the model of landforms clustering for the study area using Kohonen network and the hierarchic clustering was used for additional generalization. The medium-scale (750 m / pix, it is matched to maps at the scale 1:500 000 - 1:1 000 000) map of Yamal Peninsula landforms was created. Seven classes of landforms were recognized. The study was supported by Russian Science Foundation (project no. 19-77-10036).
How to cite: Kharchenko, S.: Medium-scale unsupervised landform mapping of the Yamal Peninsula (Russia) using 2D Fourier decomposition of the ArcticDEM, EGU General Assembly 2022, Vienna, Austria, 23–27 May 2022, EGU22-12383, https://doi.org/10.5194/egusphere-egu22-12383, 2022.
GI2 – Data networks and analysis
EGU22-74 | Presentations | GI2.2
Experimental assessment of corrosion influence in reinforced concrete by GPRSalih Artagan, Vladislav Borecky, Özgür Yurdakul, and Miroslav Luňák
Corrosion is one of the most critical issues leading to damage in reinforced concrete structures. In most cases, the detection of corrosion damage is performed by visual inspection. Other techniques (drilling cores with petrography or chemical examination, potential measurements, and resistivity measurements) require minimum destruction since they can be utilized by reaching the reinforcement bar [1]. Recently, there has been an increasing trend to use Ground Penetrating Radar (GPR) as one of the emerging non-destructive testing (NDT) techniques in the diagnosis of corrosion [2].
This paper focuses on a series of GPR tests on specimens constructed from poor-quality concrete and plain round bar. These specimens were subjected to accelerated corrosion tests under laboratory conditions. The corrosion intensity of those specimens is non-destructively assessed with GPR, by collecting data before and after corrosion tests. For GPR tests, the IDS Aladdin system was used with a double polarized 2 GHz antenna. Based on GPR measurement, Relative Dielectric Permittivity (RDP) values of concrete, are calculated based on the known dimension of specimens and two-way travel time (twt) values obtained from A-scans. The change in RDP values of specimens before and after exposure to corrosion is then computed. Moreover, amplitude change and variation in frequency spectrum before and after corrosion exposure are analyzed.
The results of this experimental study thus indicate that corrosion damage in reinforced concrete can be determined by using several GPR signal attributes. More laboratory tests are required for better quantification of the impact of the corrosion phenomenon in reinforced concrete.
All GPR tests were conducted in Educational and Research Centre in Transport; Faculty of Transport Engineering; University of Pardubice. This work is supported by the University of Pardubice (Project No: CZ.02.2.69/0.0/0.0/18_053/0016969).
[1] V. Sossa, V. Pérez-Gracia, R. González-Drigo, M. A. Rasol, Lab Non Destructive Test to Analyze the Effect of Corrosion on Ground Penetrating Radar Scans, Remote Sensing. 11 (2019) 2814. https://doi.org/10.3390/rs11232814.
[2] K. Tešić, A. Baričević, M. Serdar, Non-Destructive Corrosion Inspection of Reinforced Concrete Using Ground-Penetrating Radar: A Review, Materials. 14 (2021) 975. https://doi.org/10.3390/ma14040975.
How to cite: Artagan, S., Borecky, V., Yurdakul, Ö., and Luňák, M.: Experimental assessment of corrosion influence in reinforced concrete by GPR, EGU General Assembly 2022, Vienna, Austria, 23–27 May 2022, EGU22-74, https://doi.org/10.5194/egusphere-egu22-74, 2022.
EGU22-1544 | Presentations | GI2.2
Dielectric Constant Estimation through Alpha Angle with a Polarimetric GPR SystemLilong Zou, Fabio Tosti, and Amir M. Alani
As a recognised non-destructive testing (NDT) tool, Ground Penetrating Radar (GPR) is becoming increasingly common in the field of environmental engineering [1]-[3]. GPR uses electromagnetic (EM) waves which travel at specific velocity determined by the permittivity of the material. With the development of new GPR signal processing methodologies, finding information on the physical properties of hidden targets has become a key target. Currently, only three types of approach could be applied for the quantitative estimation of permittivity from GPR data, i.e., hyperbola curve fitting, common middle point (CMP) velocity analysis and full-waveform inversion. However, the main challenges for the estimation of permittivity from GPR backscattered signals are to provide effective and accurate strategy for prediction.
In this research, we used a dual-polarimetric GPR system to estimate the dielectric constant of targets. The system is equipped with two 2GHz antennas polarised perpendicularly each to one another (HH and VV). The dual polarisation enables deeper surveying, providing images of both shallow and deeper subsurface features. Polarimetry is a property of EM waves that generally refers to the orientation of the electric field vector, which plays here an important role as it allows either direct or parameterisation permittivity effects within the scattering problem in the remote sensing [4].
The aim of this research is to provide a novel and more robust approach for dielectric constant prediction using a dual-polarimetric GPR system. To this extent, the relationship between the relative permittivity and the polarimetric alpha angle have been investigated based on data collected by a GPR system with dual-polarised antennas. The approach was then assessed by laboratory experiments where different moisture sand targets (simulating the effect of different relative permittivity targets) were measured. After signal processing, a clear relationship between the alpha angle and the relative permittivity was obtained, proving the viability of the proposed method.
Acknowledgements
The authors would like to express their sincere thanks and gratitude to the following trusts, charities, organisations and individuals for their generosity in supporting this project: Lord Faringdon Charitable Trust, The Schroder Foundation, Cazenove Charitable Trust, Ernest Cook Trust, Sir Henry Keswick, Ian Bond, P. F. Charitable Trust, Prospect Investment Management Limited, The Adrian Swire Charitable Trust, The John Swire 1989 Charitable Trust, The Sackler Trust, The Tanlaw Foundation, and The Wyfold Charitable Trust.
References
[1] Zou, L. et al., 2020. Mapping and Assessment of Tree Roots using Ground Penetrating Radar with Low-Cost GPS. Remote Sensing, vol.12, no.8, pp:1300.
[2] Zou, L. et al., 2020. On the Use of Lateral Wave for the Interlayer Debonding Detecting in an Asphalt Airport Pavement Using a Multistatic GPR System. IEEE Transactions on Geoscience and Remote Sensing, vol. 58, no. 6, pp. 4215-4224.
[3] Zou, L. et al., 2021. Study on Wavelet Entropy for Airport Pavement Debonded Layer Inspection by using a Multi-Static GPR System. Geophysics, vol. 86, no. 3, pp. WB69-WB78.
[4] J. Lee and E. Pottier, Polarimetric Imaging: From Basics to Applications, FL, Boca Raton: CRC Press, 2009.
How to cite: Zou, L., Tosti, F., and Alani, A. M.: Dielectric Constant Estimation through Alpha Angle with a Polarimetric GPR System, EGU General Assembly 2022, Vienna, Austria, 23–27 May 2022, EGU22-1544, https://doi.org/10.5194/egusphere-egu22-1544, 2022.
EGU22-1849 | Presentations | GI2.2
On the use of Artificial Intelligence for classification of road pavements based on mechanical properties using ground-penetrating radar and deflection-based non-destructive testing dataFateme Dinmohammadi, Luca Bianchini Ciampoli, Fabio Tosti, Andrea Benedetto, and Amir M. Alani
Road pavements play a crucial role in the development of any construction as they provide safe surface on which vehicles can travel comfortably [1]. Pavements are multi-layered structures of processed and compacted materials in different thicknesses and in both unbound and bound forms with the function of supporting vehicle loads as well as providing a smooth riding quality. The condition of road pavement structures is susceptible to the impact of uncertain environmental factors and traffic loads, resulting in pavement deterioration over time. Therefore, the mechanical properties of pavements (such as strength, stiffness, etc.) need to be monitored on a regular basis to make sure that the pavement condition meets its prescribed threshold. The ground-penetrating radar (GPR) and deflection-based methods (e.g., the falling weight deflectometer (FWD)) are the most popular non-destructive testing (NDT) methods in pavement engineering science that are often used in combination to evaluate the damage and strength of pavements [2-4]. The layer thickness data from GPR scans are used as an input for deflection-based measurements to back-calculate the elastic moduli of the layers [2]. During the recent years, problems concerning the automatic interpretation of data from NDTs have received good attention and have simulated peer to peer interests in many industries like transportation. The use of Artificial Intelligence (AI) and Machine Learning (ML) techniques for the interpretation of NDT data can offer many advantages such as the improved speed and accuracy of analysis, especially for large-volume datasets. This study aims to train a dataset collected from GPR (2 GHz horn antenna) and the Curviameter deflection-based equipment using AI and ML algorithms to classify road flexible pavements based on their mechanical properties. Curviameter data are used as ground-truth measurements of pavement stiffness, whereas the GPR data provide geometric and physical attributes of the pavement structure. Several methods such as support vector machine (SVM), artificial neural network (ANN), and k nearest neighbours (KNN) are proposed and their performance in terms of accuracy of estimation of the strength and deformation properties of pavement layers are compared with each other as well as with the classical statistical methods. The results of this study can help road maintenance officials to identify and prioritise pavements at risk and make cost-effective and informed decisions for maintenance.
References
[1] Tosti, F., Bianchini Ciampoli, L., D’Amico, F. and Alani, A.M. (2019). Advances in the prediction of the bearing capacity of road flexible pavements using GPR. In: 10th International Workshop on Advanced GPR, European Association of Geoscientists & Engineers, pages 1-5.
[2] Plati, C., Loizos, A. & Gkyrtis, K. Assessment of Modern Roadways Using Non-destructive Geophysical Surveying Techniques. Surv Geophys 41, 395–430 (2020).
[3] A. Benedetto, F. Tosti, Inferring bearing ratio of unbound materials from dielectric properties using GPR, in: Proceedings of the 2013 Airfield and Highway Pavement Conference: Sustainable and Efficient Pavements, June 2013, pp. 1336–1347.
[4] Tosti, F., Bianchini Ciampoli, L., D’Amico, F., Alani, A.M., Benedetto, A. (2018). An experimental-based model for the assessment of the mechanical properties of road pavements using GPR. Construction and Building Materials, Volume 165, pp. 966-974.
How to cite: Dinmohammadi, F., Bianchini Ciampoli, L., Tosti, F., Benedetto, A., and Alani, A. M.: On the use of Artificial Intelligence for classification of road pavements based on mechanical properties using ground-penetrating radar and deflection-based non-destructive testing data, EGU General Assembly 2022, Vienna, Austria, 23–27 May 2022, EGU22-1849, https://doi.org/10.5194/egusphere-egu22-1849, 2022.
EGU22-2166 | Presentations | GI2.2
Attenuation-compensated reverse-time migration of waterborne GPR based on attenuation coefficient estimationRuiqing Shen, Yonghui Zhao, Hui Cheng, and Shuangcheng Ge
To the waterborne ground-penetrating radar detection, reverse-time migration (RTM) method can image the structure of the bottom of the water and locate the buried bodies. However, the image quality is limited by the attenuation of electromagnetic waves. How to compensate the attenuation becomes a critical problem. Some RTM methods related to the attenuation-compensated have been developed in recent years. We use the attenuation-compensated RTM based on the minus conductivity. However, the method is limited by the estimation of the attenuation coefficient. Here, we propose an attenuation-coefficient estimation method based on the centroid frequency downshift method (CFDS). In EM attenuation tomography, the centroid frequency downshift method works for attenuation estimation. Compared with the CFDS method in tomography, our proposal is based on the centroid frequency of the bottom-interface of water instead of the source wavelet. Thus, we can avoid the problem of the unknown source wavelet. The method is based on two assumptions: 1) GPR data can be regarded as zero-offset records. 2) Reflections from underwater interfaces are independent of frequency. In addition, the formula about the attenuation coefficient shows when the ratio between the conductivity and the product of the dielectric constant and the angular frequency is greater than one, the attenuation coefficient tends to be a constant. This does not meet the assumption that the attenuation coefficient is linearly related to frequency. We will select a proper frequency range to meet the linear relation by the spectral ratio method. Because the ratio of the signal spectrum of the bottom interface to the spectrum of the underwater interface is consistent with the change of the attenuation coefficient with frequency. Then, the CFDS method will acquire a linear attenuation coefficient with the frequency. Finally, we choose half of the central frequency to acquire the estimated attenuation coefficient. We design a layered waterborne GPR detection model, the conductivity of the silt layer varies between 0.1 and 0.01. The error of the conductivity estimation is below 10%. After acquiring the attenuation coefficient, the attenuation-compensated RTM works correctly and effectively.
How to cite: Shen, R., Zhao, Y., Cheng, H., and Ge, S.: Attenuation-compensated reverse-time migration of waterborne GPR based on attenuation coefficient estimation, EGU General Assembly 2022, Vienna, Austria, 23–27 May 2022, EGU22-2166, https://doi.org/10.5194/egusphere-egu22-2166, 2022.
EGU22-2253 | Presentations | GI2.2
An approach to integrate GPR thickness variability and roughness level into pavement performance evaluationChristina Plati, Andreas Loizos, and Konstantina Georgouli
It is a truism that pavements deteriorate due to the combined effects of traffic loads and environmental conditions. The manner or ability of a road to meet the demands of traffic and the environment and to provide at least an acceptable level of performance to road users throughout its life is referred to as pavement performance. An important indicator of pavement performance is ride quality. This is a rather subjective measure of performance that depends on (i) the physical properties of the pavement surface, (ii) the mechanical properties of the vehicle, and (iii) the acceptance of the perceived ride quality by road users. Due to the subjectivity of ride quality assessment, many researchers have worked in the past to develop an objective indicator of pavement quality. The International Roughness Index (IRI) is considered a good indicator of pavement performance in terms of road roughness. It was developed to be linear, transferable, and stable over time and is based on the concept of a true longitudinal profile. Following the identification and quantification of ride quality by the IRI, pavement activities include the systematic collection of roughness data in the form of the IRI using advanced laser profilers, either to "accept" an as-built pavement or to monitor and evaluate the functional condition of an in-service pavement.
On the other hand, pavement performance can vary significantly due to variations in layer thickness, primarily due to the construction process and quality control methods used. Even if a uniform design thickness is specified for a road section, the actual thickness may vary. It is expected that the layer thickness will have some probability distribution, with the highest density being around the target thickness. Information on layer thickness is usually obtained from as-built records, from coring or from Ground Penetrating Radar (GPR) surveys. GPR is a powerful measurement system that provides pavement thickness estimates with excellent data coverage at travel speeds. It can significantly improve pavement structure estimates compared to data from as-built plans. In addition, GPR surveys are fast, cost effective, and non-destructive compared to coring.
The present research developed a sensing approach that extends the capability of GPR beyond its ability to estimate pavement thickness. Specifically, the approach links GPR thickness to IRI based on the principle that a GPR system and a laser profiler are independent sensors that can be combined to provide a more complete image of pavement performance. To this end, field data collected by a GPR system and a laser profiler along highway sections are analyzed to evaluate pavement performance and predict future condition. The results show that thickness variations are related to roughness levels and specify the deterioration of the pavement throughout its lifetime.
How to cite: Plati, C., Loizos, A., and Georgouli, K.: An approach to integrate GPR thickness variability and roughness level into pavement performance evaluation, EGU General Assembly 2022, Vienna, Austria, 23–27 May 2022, EGU22-2253, https://doi.org/10.5194/egusphere-egu22-2253, 2022.
EGU22-2341 | Presentations | GI2.2 | Highlight
Monitoring of Bridges by Satellite Remote Sensing Using Multi-Source and Multi-Resolution Data Integration Techniques: a Case Study of the Rochester BridgeValerio Gagliardi, Luca Bianchini Ciampoli, Fabrizio D’Amico, Maria Libera Battagliere, Sue Threader, Amir M. Alani, Andrea Benedetto, and Fabio Tosti
Monitoring of bridges and viaducts has become a priority for asset owners due to progressive infrastructure ageing and its impact on safety and management costs. Advancement in data processing and interpretation methods and the accessibility of Synthetic Aperture Radar (SAR) datasets from different satellite missions have contributed to raise interest for use of near-real-time bridge assessment methods. In this context, the Multi-temporal Interferometric Synthetic Aperture Radar (MT-InSAR) space-borne monitoring technique has proven to be effective for detection of cumulative surface displacements with a millimetre accuracy [1-3].
This research aims to investigate the viability of using satellite remote sensing for structural assessment of the Rochester Bridge in Rochester, Kent, UK. To this purpose, high-resolution SAR datasets are used as the reference information and complemented by additional data from different sensing technologies (e.g., medium-resolution SAR datasets and ground-based (GB) non-destructive testing (NDT)). In detail, high-resolution SAR products of the COSMO-SkyMed (CSK) mission (2017-2019) provided by the Italian Space Agency (ASI) in the framework of the Project “Motib - ID 742”, approved by ASI, are processed using a MT-InSAR approach.
The method allowed to identify several Persistent Scatterers (PSs) – which have been associated to different structural elements (e.g., the bridges piers) over the four main bridge decks – and monitor bridge displacements during the observation time. The outcomes of this study demonstrate that information from the use of high-resolution InSAR data can be successfully integrated to datasets of different resolution, scale and source technology. Compared to stand-alone technologies, a main advantage of the proposed approach is in the provision of a fully-comprehensive (i.e., surface and subsurface) and dense array of information with a larger spatial coverage and a higher time acquisition frequency. This results in a more effective identification and monitoring of decays at reduced costs, paving the way for implementation into next generation Bridge Management Systems (BMSs).
Acknowledgements: This research is supported by the Italian Ministry of Education, University and Research under the National Project “EXTRA TN”, PRIN2017, Prot. 20179BP4SM. Funding from MIUR, in the frame of the“Departments of Excellence Initiative 2018–2022”,attributed to the Department of Engineering of Roma Tre University, is acknowledged.Authors would also like to acknowledge the Rochester Bridge Trust for supporting research discussed in this paper. The COSMO-SkyMed (CSK) products - ©ASI- are provided by the Italian Space Agency (ASI) under a license to use in the framework of the Project “ASI Open-Call - Motib (ID 742)” approved by ASI.
References
[1] Gagliardi V., Bianchini Ciampoli L., D'Amico F., Alani A. M., Tosti F., Battagliere M. L., Benedetto A., “Bridge monitoring and assessment by high-resolution satellite remote sensing technologies”, Proc. SPIE 11525, SPIE Future Sensing Technologies. 2020. doi: 1117/12.2579700
[2] Jung, J.; Kim, D.-j.; Palanisamy Vadivel, S.K.; Yun, S.-H. "Long-Term Deflection Monitoring for Bridges Using X and C-Band Time-Series SAR Interferometry". Remote Sens. 2019
[3] Gagliardi V., Bianchini Ciampoli L., D'Amico F., Tosti F., Alani A. and Benedetto A. “A Novel Geo-Statistical Approach for Transport Infrastructure Network Monitoring by Persistent Scatterer Interferometry (PSI)”. In: 2020 IEEE Radar Conference, Florence, Italy, 2020, pp. 1-6, doi: 10.1109/RadarConf2043947.2020.9266336
How to cite: Gagliardi, V., Bianchini Ciampoli, L., D’Amico, F., Battagliere, M. L., Threader, S., Alani, A. M., Benedetto, A., and Tosti, F.: Monitoring of Bridges by Satellite Remote Sensing Using Multi-Source and Multi-Resolution Data Integration Techniques: a Case Study of the Rochester Bridge, EGU General Assembly 2022, Vienna, Austria, 23–27 May 2022, EGU22-2341, https://doi.org/10.5194/egusphere-egu22-2341, 2022.
EGU22-2533 | Presentations | GI2.2
Monitoring of Airport Runways by Satellite-based Remote Sensing Techniques: a Geostatistical Analysis on Sentinel 1 SAR DataValerio Gagliardi, Sebastiano Trevisani, Luca Bianchini Ciampoli, Fabrizio D’Amico, Amir M. Alani, Andrea Benedetto, and Fabio Tosti
Maintenance of airport runways is crucial to comply with strict safety requirements for airport operations and air traffic management [1]. Therefore, monitoring pavement surface defects and irregularities with a high temporal frequency, accuracy and spatial density of information becomes strategic in airport asset management [2-3]. In this context, Multi-Temporal Interferometric Synthetic Aperture Radar (MT-InSAR) techniques are gaining momentum in the assessment and health monitoring of infrastructure assets, proving their viability for the long-term evaluation of ground scatterers. However, the implementation of C-band SAR data as a routine tool in Airport Pavement Management Systems (APMSs) for the accurate measurement of differential displacements on runways is still an open challenge [4]. This research aims to demonstrate the viability of using medium-resolution (C-band) SAR products and their contribution to improve current maintenance strategies in case of localised foundation settlements in airport runways. To this purpose, Sentinel-1A SAR products, available through the European Space Agency (ESA) Copernicus Program, were acquired and processed to monitor displacements on “Runway n.3” of the “L. Da Vinci International Airport” in Fiumicino, Rome, Italy.A geostatistical study is performed for exploring the spatial data structure and for the interpolation of the Sentinel-1A SAR data in correspondence of ground control points.The analysis provided ample information on the spatial continuity of the Sentinel 1 data, also in comparison with the high-resolution COSMO-SkyMed and the ground-based topographic levelling data, taken as the benchmark.Furthermore, a comparison between the MT-InSAR outcomes from the Sentinel-1A SAR data, interpolated by means of Ordinary Kriging, and the ground-truth topographic levelling data demonstrated the accuracy of the Sentinel 1 data. Results support the effectiveness of using medium-resolution InSAR data as a continuous and long-term routine monitoring tool for millimetre-scale displacements in airport runways. Outcomes of this study can pave the way for the development of more efficient and sustainable maintenance strategies for inclusion in next-generation APMSs.
Acknowledgments and fundings: The authors acknowledge the European Space Agency (ESA), for providing the Sentinel 1 SAR products for the development of this research. The COSMO-SkyMed Products—©ASI (Italian Space Agency)- are delivered by ASI under the license to use.This research falls within the National Project “EXTRA TN”, PRIN 2017, supported by MIUR. The authors acknowledge funding from the MIUR, in the frame of the “Departments of Excellence Initiative 2018–2022”, attributed to the Department of Engineering of Roma Tre University
References
[1]Gagliardi V., Bianchini Ciampoli L., D'Amico F., Tosti F., Alani A. and Benedetto A. “A Novel Geo-Statistical Approach for Transport Infrastructure Network Monitoring by Persistent Scatterer Interferometry (PSI)”. In: 2020 IEEE Radar Conference, Florence, Italy, 2020, pp. 1-6
[2]Gagliardi V, Bianchini Ciampoli L, Trevisani S, D’Amico F, Alani AM, Benedetto A, Tosti F. "Testing Sentinel-1 SAR Interferometry Data for Airport Runway Monitoring: A Geostatistical Analysis". 2021; 21(17):5769. https://doi.org/10.3390/s21175769
[3]Gao, M.; Gong, H.; Chen, B.; Zhou, C.; Chen, W.; Liang, Y.; Shi, M.; Si, Y. "InSAR time-series investigation of long-term ground displacement at Beijing Capital International Airport, China". Tectonophysics 2016, 691, 271–281.
[4]Department of Transportation Federal Aviation Administration (FAA), Advisory Circular 150/5320-6F, Airport Pavement Design and Evaluation, 2016
How to cite: Gagliardi, V., Trevisani, S., Bianchini Ciampoli, L., D’Amico, F., Alani, A. M., Benedetto, A., and Tosti, F.: Monitoring of Airport Runways by Satellite-based Remote Sensing Techniques: a Geostatistical Analysis on Sentinel 1 SAR Data, EGU General Assembly 2022, Vienna, Austria, 23–27 May 2022, EGU22-2533, https://doi.org/10.5194/egusphere-egu22-2533, 2022.
EGU22-2712 | Presentations | GI2.2
Quality assessment in railway ballast by integration of NDT methods and remote sensing techniques: a study case in Salerno, Southern ItalyLuca Bianchini Ciampoli, Valerio Gagliardi, Fabrizio D'Amico, Chiara Clementini, Daniele Latini, and Andrea Benedetto
Maintenance and rehabilitation policies represent a task of paramount importance for managers and administrators of railway networks to maintain the highest standards of transport safety while limiting as much as possible the costs of maintenance operations.
To this effect, high-productivity survey methods become crucial as they allow for timely recognition of the quality of the asset elements, among which the ballast layers are the most likely to undergo rapid deterioration processes. Particularly, Ground Penetrating Radar (GPR) has received positive feedback from researchers and professionals due to the capability of detecting signs of deterioration within ballasted trackbeds that are not recognizable by a visual inspection at the surface, through high-productivity surveys. On the other hand, satellite-based surveys are nowadays being increasingly applied to the monitoring of transport assets. Techniques such as Multi-temporal Interferometric Synthetic Aperture Radar (MT-InSAR) allows evaluating potential deformations suffered by railway sections and their surroundings by analyzing phase changes between multiple images of the same area acquired at progressive times.
For both of these techniques, despite the wide recognition by the field-related scientific literature, survey protocols and data processing standards for the detection and classification of the quality of ballast layers are still missing. In addition, procedures of integration and data fusion between GPR and InSAR datasets are still very rare.
The present study aims at demonstrating the viability of the integration between these two survey methodologies for a more comprehensive assessment of the condition of ballasted track-beds over a railway stretch. Particularly, a traditional railway section going from Cava de’ Tirreni to Salerno, Campania (Italy), was subject to both GPR and MT-InSAR inspections. An ad hoc experimental setup was realized to fix horn antennas with different central frequencies to an actual inspection convoy that surveyed the railway stretch in both the travel directions. Time-frequency methods were applied to the data to detect subsections of the railway affected by the poor quality of ballast (i.e. high rate of fouling). In parallel, a two-years MT-InSAR analysis was conducted to evaluate possible deformations that occurred to the railway line in the period before the GPR test. In addition, results from both the analyses were compared to the reports from visual inspections as provided by the railway manager.
The results of the surveys confirm the high potential of GPR in detecting the fouling condition of the ballast layers at various stages of severity. The integration of this information to the outcomes of InSAR analysis allows for identifying whether the deterioration of the track-beds is related to poorly bearing subgrades or rather to excessive stresses between the aggregates resulting in their fragmentation.
Acknowledgments
This research is supported by the Italian Ministry of Education, University, and Research under the National Project “EXTRA TN”, PRIN2017, Prot. 20179BP4SM. Funding from MIUR, in the frame of the“Departments of Excellence Initiative 2018–2022”, attributed to the Department of Engineering of Roma Tre University, is acknowledged. The authors would also like to express their gratitude to RFI S.p.a. in the person of Eng. Pasquale Ferraro for the valuable support to the tests.
How to cite: Bianchini Ciampoli, L., Gagliardi, V., D'Amico, F., Clementini, C., Latini, D., and Benedetto, A.: Quality assessment in railway ballast by integration of NDT methods and remote sensing techniques: a study case in Salerno, Southern Italy, EGU General Assembly 2022, Vienna, Austria, 23–27 May 2022, EGU22-2712, https://doi.org/10.5194/egusphere-egu22-2712, 2022.
EGU22-3247 | Presentations | GI2.2
Low-cost scanning of tree trunks for analysis and visualization in augmented reality using smartphone LiDAR and digital twinsStephen Uzor, Fabio Tosti, and Amir M. Alani
Detecting decay in tree trunks is essential in considering tree health and safety. Continual monitoring of tree trunks is possible using a digital model, which can contain incremental assessment data on tree health. Researchers have previously employed non-destructive techniques, for instance, laser scanning, acoustics, and Ground Penetrating Radar (GPR) to study both the external and internal physical dimensions of objects and structures [1], including tree trunks [2]. Light Detection and Ranging (LiDAR) technology is also continually employed in infrastructure and asset management to generate models and to detect surface displacements with millimeter accuracy [3]. Nevertheless, the scanning of structures using these existing state-of-the-art technologies can be time consuming, technical, and expensive.
This work investigates the design and implementation of a smartphone app for scanning tree trunks to generate a 3D digital model for later visualization and assessment. The app uses LiDAR technology, which has recently become available in smart devices, for instance, the Apple iPhone 12+ and the iPad Pro. With the prevalence of internet-of-things (IoT) sensors, digital twins are being increasingly used in a variety of industries, for example, architecture and manufacturing. A digital twin is a digital representation of an existing physical object or structure. With our app, a digital twin of a tree can be developed and maintained by continually updating data on its dimensions and internal state of decay. Further, we can situate and visualize tree trunks as digital objects in the real world using augmented reality, which is also possible in modern smart devices. We previously investigated tree trunks using GPR [2] to generate tomographic maps, to denote level of decay. We aim to adopt a data integration and fusion approach, using such existing (and incremental GPR data) and an external LiDAR scan to gain a full 3D ‘picture’ of tree trunks.
We intend to validate our app against state-of-the-art techniques, i.e., laser scanning and photogrammetry. With the ability to scan tree trunks within reasonable parameters of accuracy, the app can provide a relatively low-cost environmental modelling and assessment solution for researchers and experts.
Acknowledgments: Sincere thanks to the following for their support: Lord Faringdon Charitable Trust, The Schroder Foundation, Cazenove Charitable Trust, Ernest Cook Trust, Sir Henry Keswick, Ian Bond, P. F. Charitable Trust, Prospect Investment Management Limited, The Adrian Swire Charitable Trust, The John Swire 1989 Charitable Trust, The Sackler Trust, The Tanlaw Foundation, and The Wyfold Charitable Trust.
References
[1] Alani A. et al., Non-destructive assessment of a historic masonry arch bridge using ground penetrating radar and 3D laser scanner. IMEKO International Conference on Metrology for Archaeology and Cultural Heritage Lecce, Italy, October 23-25, 2017.
[2] Tosti et al., "The Use of GPR and Microwave Tomography for the Assessment of the Internal Structure of Hollow Trees," in IEEE Transactions on Geoscience and Remote Sensing, Doi: 10.1109/TGRS.2021.3115408.
[3] Lee, J et al., Long-term displacement measurement of bridges using a LiDAR system. Struct Control Health Monit. 2019; 26:e2428.
How to cite: Uzor, S., Tosti, F., and Alani, A. M.: Low-cost scanning of tree trunks for analysis and visualization in augmented reality using smartphone LiDAR and digital twins, EGU General Assembly 2022, Vienna, Austria, 23–27 May 2022, EGU22-3247, https://doi.org/10.5194/egusphere-egu22-3247, 2022.
EGU22-3799 | Presentations | GI2.2
A strategy of territorial control: from the standard comparison techniques to the Advanced Unsupervised Deep Learning Change Detection in high resolution SAR imagesIlaria Pennino
The need to monitor and evaluate the impact of natural phenomena on structures, infrastructures, as well as on the natural environment, in recent years, plays a role of considerable importance for society also due to the continuous occurrence of "catastrophic events" which recently faster change our Planet.
Innovation and research have allowed a profound change in the data acquisition and acquisitions methodology coming to develop increasingly complex and innovative technologies. From an application point of view, remote sensing gives the possibility to easily manage the layer information which is indispensable for the best characterization of the environment from a numerical and a chemical-physical point of view.
NeMeA Sistemi srl, observant to the environment and its protection for years, began to study it using RADAR / SAR (Synthetic Aperture RADAR) data thanks to the opportunity to use in the best way the COSMO-SkyMed data through the tender Open Call for SMEs (Small and Medium Enterprises) of the Italian Space Agency in 2015.
Since then, NeMeA Sistemi srl has started a highly focused and innovative training that led us to observe the Earth in a new way. The path undertaken in NeMeA Sistemi srl is constantly growing and allowed us to know the RADAR / SAR data and the enormous potential.
The COSMO-SkyMed data provided is treated, processed and transformed by providing various information, allows you to identify changes, classify objects and artifacts measuring them.
In this context, NeMeA Sistemi srl in 2016 proposed a first project for the monitoring of illegal buildings in the Municipality of Ventimiglia (Liguria), with positive results. In this context, the final product was obtained with classic standard classification techniques of the SAR data.
Following this positive experience, NeMeA Sistemi srl applied also to the regional call issued by Sardegna Ricerche for the Sardinia Region where the source of funding is the European Regional Development Fund (ERDF) 2014-2020.
The SardOS project (Sardinia Observed from Space), proposed by NeMeA Sistemi srl, aims to monitor and safeguard environmental and anthropogenic health in the territory of 4 Sardinian municipalities (Alghero, Capoterra, Quartu and Arzachena), also identifying the coast profiles, the evolutionary trend of sediments in the riverbed and buildings not present in the land registry. For environmental monitoring purposes, COSMO-SkyMed data are exploited and combined with bathymetric measurements acquired using the Hydra aquatic drone owned by NeMeA Sistemi srl. SAR data were processed using innovative specific territorial analysis algorithms in urban environment.
After these successful cases studies, which allowed the development of new services for the territorial monitoring and control, NeMeA Sistemi srl is working on a new project, 3xA (Creation of Machine Learning and Deep Learning algorithms dedicated to pattern recognition in SAR data). By exploiting Artificial Intelligence, the implemented algorithms use innovative unsupervised techniques to identify any changes.
The objective of this document is to provide an overview of the experience gained in NeMeA Sistemi srl, the value-added products and innovative services developed in the company aimed at environmental monitoring, the prevention of dangers and natural risks.
How to cite: Pennino, I.: A strategy of territorial control: from the standard comparison techniques to the Advanced Unsupervised Deep Learning Change Detection in high resolution SAR images, EGU General Assembly 2022, Vienna, Austria, 23–27 May 2022, EGU22-3799, https://doi.org/10.5194/egusphere-egu22-3799, 2022.
Please decide on your access
Please use the buttons below to download the presentation materials or to visit the external website where the presentation is linked. Regarding the external link, please note that Copernicus Meetings cannot accept any liability for the content and the website you will visit.
Forward to presentation link
You are going to open an external link to the presentation as indicated by the authors. Copernicus Meetings cannot accept any liability for the content and the website you will visit.
We are sorry, but presentations are only available for users who registered for the conference. Thank you.
EGU22-4437 | Presentations | GI2.2
Rebar corrosion monitoring with a multisensor non-destructive geophysical techniques.Enzo Rizzo, Giacomo Fornasari, Luigi Capozzoli, Gregory De Martino, and Valeria Giampaolo
Rebar Corrosion is one of the main causes of deterioration of engineering reinforced structure. This degradation reduces the service life and durability of the structures. Such degradation can result in the collapse of engineering structures. When the first cracks are noticed on the concrete surface, corrosion has generally reached an advanced stage and maintenance action is required. The early detection of rebar corrosion of bridges, tunnel, buildings and other civil engineering structures is important to reduce the expensive cost to repair the deteriorated structure. Several techniques have been developed for understanding the mechanism and kinetics of the corrosion of rebar, but the paper defines the interest of combining several NDT for field inspection to overcome the limitation of measuring instantaneous corrosion rates and to improve the estimation of the service life of RC structures. Non-destructive testing and evaluation of the rebar corrosion is a major issue for predicting the service life of reinforced concrete structures.
This paper introduces a laboratory test, that was performed at Geophysical Laboratory of Ferrara University. The test consisted in a multisensor application concerning rebar corrosion monitoring using different geophysical methods on a concrete sample of about 50 x 30 cm with one steel rebar of 10 mm diameter. An accelerating reinforcement bar corrosion using direct current (DC) power supply with 5% sodium chloride (NaCl) solution was used to induce rebar corrosion. The 2GHz GPR antenna by IDS, the ERT with Abem Terrameter and Self-Potential with Keithley multivoltmeter at high impedance were used for rebar corrosion monitoring. A multisensor approach should reduce the errors resulting from measurements, and improve synergistically the estimation of service life of the RC.
Each technique provided specific information, but a data integration method used in the operating system will further improve the overall quality of diagnosis. The collected data were used for an integration approach to obtain an evolution of the phenomenon of corrosion of the reinforcement bar. All the three methods were able to detect the physical parameter variation during the corrosion phenomena, but more attention is necessary on natural corrosion, that is a slow process and the properties of the experimental steel–concrete interface may not be representative of natural corrosion. However, each of these geophysical methods possesses certain advantages and limitations, therefore a combination of these geophysical techniques, with an multisensor approach is recommended to use to obtain the corrosion condition of steel and the condition of concrete cover. Moreover, extrapolating laboratory results performed with a single rebar to a large structure with interconnected rebars thus remains challenging. Therefore, during the next experiments, special care must be taken regarding the design and preparation of the samples to obtain meaningful information for field application.
How to cite: Rizzo, E., Fornasari, G., Capozzoli, L., De Martino, G., and Giampaolo, V.: Rebar corrosion monitoring with a multisensor non-destructive geophysical techniques., EGU General Assembly 2022, Vienna, Austria, 23–27 May 2022, EGU22-4437, https://doi.org/10.5194/egusphere-egu22-4437, 2022.
EGU22-4826 | Presentations | GI2.2
A 24 GHz MIMO radar for the autonomous navigation of unmanned surface vehiclesGiovanni Ludeno, Gianluca Gennarelli, Carlo Noviello, Giuseppe Esposito, Ilaria Catapano, and Francesco Soldovieri
In the last years, unmanned surface vehicles (USVs) in marine environment have attracted considerable interest since they are flexible observation platforms suitable to operate in remote areas on demand. Accordingly, their usage has been proposed in several contexts such as research activities, military operations, environmental monitoring and oil exploration [1]. However, most of current USV remote control techniques are based on human-assisted technology thus a fully autonomous USV system is still an open issue [2].
The safety of the vehicle and the ability to complete the mission depends crucially on the capability of detecting objects on the sea surface, which is necessary for collision avoidance. Anti-collision systems for USVs typically require measurements collected from multiple sensors (e.g. Lidar, cameras, etc.), where each sensor has its own advantages and disadvantages in terms of resolution, field of view (FoV), operative range and so on [3].
Among the available sensing technologies, radar is capable of operating regardless of weather and visibility conditions, has moderate costs and can be easily adapted to operate within the marine environment. Furthermore, radar is characterized by an excellent coverage and high resolution along the range coordinate and it is also able to guarantee a 360° FoV in the horizontal plane.
Nautical radars are the most popular solutions to detect floating targets on the sea surface; however, they are bulky and not always effective in detecting small objects located very close to the radar.
This contribution investigates the applicability of a compact and lightweight 24 GHz multiple-input multiple-output (MIMO) radar originally developed for automotive applications to localize floating targets at short ranges (from tens to few hundreds of meters). In this frame, we propose an ad-hoc signal processing strategy combining MIMO technology, detection, and tracking algorithms to achieve target localization and tracking in a real-time mode. A validation of the proposed signal processing chain is firstly performed thanks to numerical simulations. After, preliminary field tests carried out in the marine environment are presented to assess the performance of the radar prototype and of the related signal processing.
References
- [1] Zhixiang et al. "Unmanned surface vehicles: An overview of developments and challenges", Annual Reviews in Control, vol. 41, pp. 71-93, 2016
- [2] Caccia, M. Bibuli, R. Bono, G. Bruzzone, “Basic navigation, guidance and control of an unmanned surface vehicle”, Autonomous Robots, vol. 25, no. 4, pp. 349-365, 2008
- [3] Robinette, M. Sacarny, M. DeFilippo, M. Novitzky, M. R. Benjamin, “Sensor evaluation for autonomous surface vehicles in inland waterways”, Proc. IEEE OCEANS 2019, pp. 1-8, 2019.
How to cite: Ludeno, G., Gennarelli, G., Noviello, C., Esposito, G., Catapano, I., and Soldovieri, F.: A 24 GHz MIMO radar for the autonomous navigation of unmanned surface vehicles, EGU General Assembly 2022, Vienna, Austria, 23–27 May 2022, EGU22-4826, https://doi.org/10.5194/egusphere-egu22-4826, 2022.
EGU22-4912 | Presentations | GI2.2
Multiples suppression scheme of waterborne GPR dataYonghui Zhao, Ruiqing Shen, and Hui Cheng
Ground penetrating radar (GPR) is a geophysical method that uses high frequency electromagnetic waves to detect underground or internal structures of objects. It has been widely used in the Geo-engineering and environment detection. In recent years, GPR has played an increasingly important role in shallow underwater structure survey due to its advantages of economy, high efficiency and high accuracy. However, due to the strong reflection coefficients of water surface and bottom for electromagnetic waves, there are multiples in the GPR profile acquired in waters, which will reduce the signal-to-noise ratio of the data and even lead to false imaging, finally seriously affect the reliability of the interpretation result. With the increasing requirement of high-precise GPR detection in waters, multiple suppression has become an essential issue in expanding the application fields of GPR. In order to suppress multiple waves in waterborne GPR profile, a novel multiple wave suppression method based on the combination scheme of the predictive deconvolution and free surface multiple wave suppression (SRME). Based on the validity test of one-dimensional data, the adaptive optimizations of these two methods are carried out according to the characteristics of GPR data in waters. First, the prediction step of predictive deconvolution can be determined by picking up the bottom reflection signal. Second, the water layer information provided by the bottom reflection is used in continuation from the surface to the bottom to suppress the internal multiples. The numerical model and real data test results show that each single method can suppress most of the multiples of the bottom interface and the combination strategy can further remove the additional residues. The research provides a basis for the precise interpretation of GPR data in hydro-detection.
How to cite: Zhao, Y., Shen, R., and Cheng, H.: Multiples suppression scheme of waterborne GPR data, EGU General Assembly 2022, Vienna, Austria, 23–27 May 2022, EGU22-4912, https://doi.org/10.5194/egusphere-egu22-4912, 2022.
Please decide on your access
Please use the buttons below to download the presentation materials or to visit the external website where the presentation is linked. Regarding the external link, please note that Copernicus Meetings cannot accept any liability for the content and the website you will visit.
Forward to presentation link
You are going to open an external link to the presentation as indicated by the authors. Copernicus Meetings cannot accept any liability for the content and the website you will visit.
We are sorry, but presentations are only available for users who registered for the conference. Thank you.
EGU22-4914 | Presentations | GI2.2
Sensing roadway surfaces for a non-destructive assessment of pavement damage potentialKonstantinos Gkyrtis, Andreas Loizos, and Christina Plati
Modern roadways provide road users with both a comfortable and safe ride to their destinations. Increases in traffic demands and maximum allowable loads imply that roadway authorities should also care for the structural soundness of pavements. In parallel, budgetary limitations and frequent road closures for rehabilitation activities, especially in heavy-duty motorways, might guide the related authorities to focus their strategies on the preservation of pavements functional performance. However, structural issues concerning pavement damage remain on the forefront, as pavement’s service life extends beyond its design life; thus structural condition assessment is required to ensure pavement sustainability in the long-term.
Non-Destructive Testing (NDT) has played a major role during condition monitoring and evaluation of rehabilitation needs. Together with input from visual inspections and/or sample destructive testing (e.g. coring), NDT data help to define indicators and threshold values that assist the related decision-making for pavement condition assessment. The most indicative tool for structural evaluation is the Falling Weight Deflectometer (FWD) that senses roadway surfaces through geophones recording load-induced deflections at various locations. Additional geophysical inspection data with the Ground Penetrating Radar (GRP) is used to estimate pavement’s stratigraphy. Integrating the above sensing data enables the estimation of pavement’s performance and its damage potential.
To this end, a major challenge that pavement engineers face, concerns the assumptions made about the mechanical characterization of pavement materials. Asphalt mixtures, located on the upper pavement layers, behave in a viscoelastic mode because of temperature- and loading frequency- dependency, whereas in the contrary, simplified assumptions for linear elastic materials are most commonly made during the conventional NDT analysis. In this research, an integration of mainly NDT data and sample data from cores extracted in-situ is followed to comparatively estimate the long-term pavement performance through internationally calibrated damage models considering different assumptions for asphalt materials. Two damage modes are considered including bottom-up and top-down fatigue cracks that are conceptually perceived as alligator cracks and longitudinal cracks respectively alongside a roadway’s surface. As part of an ongoing research for the long-term pavement condition monitoring, data from a new pavement was considered at this stage indicating a promising capability of NDT data towards damage assessment.
Overall, this study aims to demonstrate the power of pavement sensing data towards structural health monitoring of roadways pinpointing the significance of database development for a rational management throughout a roadway’s service life. Furthermore, data from limited destructive testing enriches the pavement evaluation processes with purely mechanistic perspectives thereby paving the way for developing integrated protocols with improved accuracy for site investigations, especially at project-level analysis, where rehabilitation design becomes critical.
How to cite: Gkyrtis, K., Loizos, A., and Plati, C.: Sensing roadway surfaces for a non-destructive assessment of pavement damage potential, EGU General Assembly 2022, Vienna, Austria, 23–27 May 2022, EGU22-4914, https://doi.org/10.5194/egusphere-egu22-4914, 2022.
EGU22-5731 | Presentations | GI2.2
Ultrasonic Scattering and Absorption Imaging for the Reinforced Concrete using Adjoint Envelope TomographyTuo Zhang, Christoph Sens-Schönfelder, Niklas Epple, and Ernst Niederleithinger
Seismic and ultrasound tomography can provide rich information about spatial variations of elastic properties inside a material rendering this method ideal for non-destructive testing. These tomographic methods primarily use direct and reflected waves, but are also strongly affected by waves scattering at small-scale structures below the resolution limit. As a consequence, conventional tomography has the ability to unveil the deterministic large-scale structure only, rendering scattered waves imaging noise. To image scattering and absorption properties, we presented the adjoint envelope tomography (AET) method that is based on a forward simulation of wave envelopes using Radiative Transfer Theory and an adjoint (backward) simulation of the envelope misfit, in full analogy to full-waveform inversion (FWI). In this algorithm, the forward problem is solved by modelling the 2-D multiple nonisotropic scattering in an acoustic medium with spatially variable heterogeneity and attenuation using the Monte-Carlo method. The fluctuation strength ε and intrinsic quality factor Q-1 in the random medium are used to describe the spatial variability of scattering and absorption, respectively. The misfit function is defined as the differences between the full squared observed and modelled envelopes. We derive the sensitivity kernels corresponding to this misfit function that is minimized during the iterative adjoint inversion with the L-BFGS method. This algorithm has been applied in some numerical tests (Zhang et al., 2021). In the present work, we show real data results from an ultrasonic experiment conducted in a reinforced concrete specimen. The later coda waves of the envelope processed from the 60 KHz ultrasonic signal are individually used for intrinsic attenuation inversion whose distribution has similarity to the temperature distribution of the concrete block. Based on the inversion result of intrinsic attenuation, scattering strength is inverted from early coda waves separately, which successfully provides the structure of the small-scale heterogeneity in the material. The resolution test shows that we recover the distribution of heterogeneity reasonably well.
How to cite: Zhang, T., Sens-Schönfelder, C., Epple, N., and Niederleithinger, E.: Ultrasonic Scattering and Absorption Imaging for the Reinforced Concrete using Adjoint Envelope Tomography, EGU General Assembly 2022, Vienna, Austria, 23–27 May 2022, EGU22-5731, https://doi.org/10.5194/egusphere-egu22-5731, 2022.
EGU22-6168 | Presentations | GI2.2
An investigation into road trees’ root systems through geostatistical analysis of GPR dataLivia Lantini, Sebastiano Trevisani, Valerio Gagliardi, Fabio Tosti, and Amir M. Alani
Street trees are a critical asset for the urban environment due to the variety of environmental and social benefits provided [1]. However, the conflicting coexistence of tree root systems with the built environment, especially with road infrastructure, frequently results in extensive damage, such as the uplifting and cracking of sidewalks and curbs, endangering pedestrians, cyclists, and road drivers’ safety.
Within this context, ground penetrating radar (GPR) is gaining recognition as an accurate non-destructive testing (NDT) method for tree roots’ assessment and mapping [2]. Nevertheless, the investigation methods developed so far are often inadequate for application on street trees, as these are often difficult to access. Recent studies have focused on implementing new survey and processing techniques for rapid tree root assessment based on combined time-frequency analyses of GPR data [3].
This research also explores the adoption of a geostatistical approach for the spatial data analysis and interpolation of GPR data. The radial development of roots and the complexity of root network constitute a challenging setting for the spatial data analysis and the recognition of specific spatial features.
Preliminary results are therefore presented based on a geostatistical analysis of GPR data. To this end, 2-D GPR outputs (i.e., B-scans and C-scans) were analysed to quantify the spatial correlation amongst radar amplitude reflection features and their anisotropy, leading to a more reliable detection and mapping of tree roots. The proposed processing system could be employed for investigating trees difficult to access, such as road trees, where more comprehensive analyses are difficult to implement. Results' interpretation has shown the viability of the proposed analysis and will pave the way to further investigations.
Acknowledgements
The authors would like to express their sincere thanks and gratitude to the following trusts, charities, organisations and individuals for their generosity in supporting this project: Lord Faringdon Charitable Trust, The Schroder Foundation, Cazenove Charitable Trust, Ernest Cook Trust, Sir Henry Keswick, Ian Bond, P. F. Charitable Trust, Prospect Investment Management Limited, The Adrian Swire Charitable Trust, The John Swire 1989 Charitable Trust, The Sackler Trust, The Tanlaw Foundation, and The Wyfold Charitable Trust.
References
[1] Tyrväinen, L., Pauleit, S., Seeland, K., & de Vries, S., 2005. "Benefits and uses of urban forests and trees". In: Urban Forests and Trees. Springer, Berlin, Heidelberg.
[2] Lantini, L., Tosti, F., Giannakis, I., Zou, L., Benedetto, A. and Alani, A. M., 2020. "An Enhanced Data Processing Framework for Mapping Tree Root Systems Using Ground Penetrating Radar," Remote Sensing 12(20), 3417.
[3] Lantini, L., Tosti, F., Zou, L., Ciampoli, L. B., & Alani, A. M., 2021. "Advances in the use of the Short-Time Fourier Transform for assessing urban trees’ root systems." Earth Resources and Environmental Remote Sensing/GIS Applications XII. Vol. 11863. SPIE, 2021.
How to cite: Lantini, L., Trevisani, S., Gagliardi, V., Tosti, F., and Alani, A. M.: An investigation into road trees’ root systems through geostatistical analysis of GPR data, EGU General Assembly 2022, Vienna, Austria, 23–27 May 2022, EGU22-6168, https://doi.org/10.5194/egusphere-egu22-6168, 2022.
EGU22-6251 | Presentations | GI2.2
Algorithms fusion for near-surface geophysical surveyYih Jeng, Chih-Sung Chen, and Hung-Ming Yu
The near-surface geophysical methods have been widely applied to investigations of shallow targets for scientific and engineering research. Various data processing algorithms are available to help visualize targets, data interpretation, and finally, achieve research goals.
Most of the available algorithms are Fourier-based with linear stationary assumptions. However, the real data are rarely the case and should be treated as nonlinear and non-stationary. In recent decades, a few newer algorithms are proposed for processing non-stationary, or nonlinear and non-stationary data, for instance, wavelet transform, curvelet transform, full-waveform inversion, Hilbert-Huang transform, etc. This progress is encouraging, but conventional algorithms still have many advantages, like strong theoretical bases, fast, and easy to apply, which the newer algorithms are short of.
In this study, we try to fuse both conventional and contemporary algorithms in near-surface geophysical methods. A cost-effective ground-penetrating radar (GPR) data processing scheme is introduced in shallow depth structure mapping as an example. The method integrates a nonlinear filtering technique, natural logarithmic transformed ensemble empirical mode decomposition (NLT EEMD), with the conventional pseudo-3D GPR data processing methods including background removal and migration to map the subsurface targets in 2D profile. The finalized pseudo-3D data volume is constructed by conventional linear interpolation. This study shows that the proposed technique could be successfully employed to locate the buried targets with minimal survey effort and affordable computation cost. Furthermore, the application of the proposed method is not limited to GPR data processing, any geophysical/engineering data with the similar data structure are applicable.
How to cite: Jeng, Y., Chen, C.-S., and Yu, H.-M.: Algorithms fusion for near-surface geophysical survey, EGU General Assembly 2022, Vienna, Austria, 23–27 May 2022, EGU22-6251, https://doi.org/10.5194/egusphere-egu22-6251, 2022.
EGU22-7009 | Presentations | GI2.2
Geoelectric data modeling using Mimetic Finite Difference MethodDeepak Suryavanshi and Rahul Dehiya
Nondestructive imaging and monitoring of the earth's subsurface using the geoelectric method require reliable and versatile numerical techniques for solving differential equation that govern the method's physic. The discrete operator should encompass fundamental properties of the original continuum model and differential operator for a robust numerical algorithm. In geoelectric modeling, critical model properties are anisotropy, irregular geometry, and discontinuous physical properties, whereas vital continuum operator properties are symmetry, the positivity of solutions, duality, and self-adjointness of differential operators and exact mathematical identities of the vector and tensor calculus. In this study, to simulate the response, we use the Mimetic Finite Difference Method (MFDM), where the discrete operator is constructed based on the support operator [1]. The MFDM operator mimics the properties mentioned above for structured and unstructured grids [2]. It is achieved by enforcing the integral identities of the continuum divergence and gradient operator to satisfy the integral identities by discrete analogs.
The developed algorithm's accuracy is benchmarked using the analytical responses of dyke models of various conductivity contrasts for pole-pole configuration. After verifying the accuracy of the scheme, further tests are conducted to check the robustness of the algorithm involving the non-orthogonality of the grids, which is essential for simulating response for rugged topography. The surface potential is simulated using structured grids for a three-layer model. Subsequently, the orthogonal girds are distorted using pseudo-random numbers, which follow a uniform distribution. To quantify the distortion, we calculated the angles at all grid nodes. The node angles emulate a Gaussian distribution. We characterize those grids as highly distorted, for which the angle at the grid node is outside 20 to 160 degrees interval. The numerical tests are conducted by varying degrees of grid distortion, such that the highly distorted cells are from 1% to 10% of the total cells. The maximum error in surface potential stays below 1.5% in all cases. Hence, the algorithm is very stable with grid distortion and consequently can model the response of a very complex model. Thus, the developed algorithm can be used to analyze geoelectrical data of complex geological scenarios such as rugged topography and anisotropic subsurface.
[1] Winters, Andrew R., and Mikhail J. Shashkov. Support Operators Method for the Diffusion Equation in Multiple Materials. No. LA-UR-12-24117. Los Alamos National Lab.(LANL), Los Alamos, NM (United States), 2012.
[2] Lipnikov, Konstantin, Gianmarco Manzini, and Mikhail Shashkov. "Mimetic finite difference method." Journal of Computational Physics 257 (2014): 1163-1227.
How to cite: Suryavanshi, D. and Dehiya, R.: Geoelectric data modeling using Mimetic Finite Difference Method, EGU General Assembly 2022, Vienna, Austria, 23–27 May 2022, EGU22-7009, https://doi.org/10.5194/egusphere-egu22-7009, 2022.
EGU22-7547 | Presentations | GI2.2
Assessing Deformation Monitoring Systems For Supporting Structural Rehabilitation under Harsh ConditionsHans Neuner, Victoria Kostjak, Finn Linzer, Walter Loderer, Christian Seywald, Alfred Strauss, Matthias Rigler, and Markus Polt
This paper deals with the evaluation of four measuring systems for the detection of potential deformations that can occur during structural rehabilitation measures. For this purpose, a test object resembling the shape of a tunnel structure was constructed. The structural properties of this test object are discussed in the related paper by Strauss et. al submitted for the same session.
In the paper, the installed measuring systems are presented first. These are a lamella system based on fibre optics, an array of accelerometers, a digital image correlation system and a profile laser scanner based system. The operating principles of the systems are briefly introduced.
A long-term measurement on the object in an unloaded state, which extended over several weeks, enables statements about the capturing of temperature-related deformations, the temperature dependence of the measured values and drift effects of the investigated systems. Selective loading of the test object was generated via four screw rods and applied both in the elastic as well as in the plastic deformation range. This enabled knowledge gain regarding the precision and the sensitivity of the analysed measuring systems.
Environmental conditions may have a strong influence on the measurement values. The former can be determined by permanent installations on the structure and its operating conditions as well as by the undertaken rehabilitation measures. Representative for the first category we investigated the influence of magnetic fields and light conditions on the measuring systems. For the second category, strong dust formation and increased humidity were generated during a test procedure.
An assessment regarding data handling, including storage, transfer and processing, completes the investigation of the four measuring systems. A summarising evaluation concludes the article.
How to cite: Neuner, H., Kostjak, V., Linzer, F., Loderer, W., Seywald, C., Strauss, A., Rigler, M., and Polt, M.: Assessing Deformation Monitoring Systems For Supporting Structural Rehabilitation under Harsh Conditions, EGU General Assembly 2022, Vienna, Austria, 23–27 May 2022, EGU22-7547, https://doi.org/10.5194/egusphere-egu22-7547, 2022.
EGU22-8512 | Presentations | GI2.2
Verification of the performance of reinforced concrete profiles of alpine infrastructure systems assisted by innovative monitoringAlfred Strauss, Hans Neuner, Matthias Rigler, Markus Polt, Christian Seywald, Victoria Kostjak, Finn Linzer, and Walter Loderer
The verification of the structural behaviour of existing structures and its materials characteristics requires the application of tests and monitoring to gather information about the actual response. The comparison of the actual performance and the designed performance enables the verification of the design assumptions in terms of implied loads and materials resistance. In case of non-compliance of the designed with the current performance, the design assumptions need to be updated. The objective of this contribution is to provide a guidance for the verification of the performance of reinforced concrete profiles of alpine infrastructure systems like tunnels assisted by monitoring, testing and material testing.
The application of defined loads to a structure to verify its load carrying capacity is a powerful tool for evaluating existing structures. In particular, in this research different types of load tests are employed depending on the limit state which is being investigated on tunnel profiles, on the other hand, the system responses to validate the structural performance are recorded with monitoring systems innovative in tunnel systems, such as accelerometer arrays, fibre optic sensors, laser distance sensors and digital image correlation system, see also the related paper by Neuner et. al. In these studies we also pay special attention to the capabilities of Digital Image Correlation and Nonlinear Finite Element Analysis. Digital Image Correlation (often referred to as "DIC") is an easy-to-use optical method for measuring deformations on the surface of an object. The method tracks changes in the grayscale pattern in small areas called subsets) during deformation.
Finally, we will present the process for the implementation and validation of proof loading concepts based on the mentioned monitoring information in order to derive the existing safety level by using advanced digital twin models.
How to cite: Strauss, A., Neuner, H., Rigler, M., Polt, M., Seywald, C., Kostjak, V., Linzer, F., and Loderer, W.: Verification of the performance of reinforced concrete profiles of alpine infrastructure systems assisted by innovative monitoring, EGU General Assembly 2022, Vienna, Austria, 23–27 May 2022, EGU22-8512, https://doi.org/10.5194/egusphere-egu22-8512, 2022.
Please decide on your access
Please use the buttons below to download the presentation materials or to visit the external website where the presentation is linked. Regarding the external link, please note that Copernicus Meetings cannot accept any liability for the content and the website you will visit.
Forward to presentation link
You are going to open an external link to the presentation as indicated by the authors. Copernicus Meetings cannot accept any liability for the content and the website you will visit.
We are sorry, but presentations are only available for users who registered for the conference. Thank you.
EGU22-8594 | Presentations | GI2.2
Analysis of low-frequency drone-borne GPR for soil surface electrical conductivity mappingKaijun Wu and Sébastien Lambot
In the VHF frequencies, the sensitivity of the reflection coefficient at the air-soil interface with respect to the soil electromagnetic properties, i.e., the dielectric permittivity and electrical conductivity, varies with frequency. The lower the frequency is, the lower the sensitivity to permittivity is and the larger the sensitivity to conductivity is. In this study, we investigated low-frequency drone-borne ground-penetrating radar (GPR) and full-wave inversion for soil surface electrical conductivity characterization. In order to have a good sensitivity to electrical conductivity, we operated in the 15-45 MHz frequency range. We conducted both numerical and field experiments, under the assumptions that the soil magnetic permeability is equal to the magnetic permeability of free space, and that the soil permittivity and conductivity are frequency-independent. Through the numerical experiments, we analyzed the sensitivity of the soil permittivity and electrical conductivity by plotting the objective function in the inverse problem. In addition, we analyzed the effects of modelling errors on the retrieval of the permittivity and conductivity. The results show that the soil electrical conductivity is sensitive enough to be characterized by the low-frequency drone-borne GPR. The depth of sensitivity was found to be around 0.5-1 m in the 15-45 MHz frequency range. Yet, the effects of permittivity cannot be neglected totally, especially for relatively wet soils. For validating our approach, we conducted field measurements with the drone-borne GPR and we compared results with electromagnetic induction (EMI) measurements considering two different offsets, i.e., 0.5 and 1 m, respectively. The lightweight GPR system consists of a handheld vector network analyzer (VNA), a 5-meter half-wave dipole antenna, a micro-computer stick, a GPS receiver, and a power bank. The good agreement in terms of absolute values and field structures between the GPR and EMI maps demonstrated the feasibility of the proposed low-frequency drone-borne GPR method, which appears thereby to be promising for precision agriculture applications.
How to cite: Wu, K. and Lambot, S.: Analysis of low-frequency drone-borne GPR for soil surface electrical conductivity mapping, EGU General Assembly 2022, Vienna, Austria, 23–27 May 2022, EGU22-8594, https://doi.org/10.5194/egusphere-egu22-8594, 2022.
EGU22-8712 | Presentations | GI2.2
Estimation of point spread function for unmixing geological spectral mixturesMaitreya Mohan Sahoo, Arun Pattathal Vijayakumar, Ittai Herrmann, Shibu K. Mathew, and Alok Porwal
Geological materials are mixtures of different endmember constituents with most of them having particles smaller in size than the path length of incident light. The obtained spectral response (reflectance) from such mixtures is nonlinear which can be attributed to multiple scattering of light and the receiver sensor’s height from the incident surface. Assuming a sensor’s fixed instantaneous field of view (IFOV), variation in its field of view (FOV) by shifting its height affects the spatial resolution of acquired spectra. We propose to estimate the point spread function (PSF) for which the spectral responses of fine-resolution pixels acquired by a sensor are mixed to produce a coarse-resolution pixel obtained by the same. Our approach is based on the sensor’s unchanged IFOV obtaining spectral information from a smaller ground resolution cell (GRC) at a lower FOV and a larger GRC with an increased sensor’s FOV. The larger GRC producing a coarse resolution pixel can be modeled as a gaussian PSF of its corresponding center and neighboring fine-resolution subpixels with the center exerting the maximum influence. Extensive experiments performed using a point-based sensor and a push broom scanner revealed such variational effects in PSF that are dependent on the sensor’s FOV, the spatial interval of acquisition, and optical properties. The coarse-resolution pixels’ spectra were regressed with their corresponding fine-resolution subpixels to provide estimates of the PSF values that assumed the shape of a two-dimensional Gaussian function. Constraining these values as sum-to-one introduced sparsity and explained variability in the spectral acquisition by different sensors. The estimated PSFs were further validated through the linear spectral unmixing technique. It was observed that the fractional abundances obtained for the fine-resolution subpixels convolved with our estimated PSF to produce its corresponding coarse-resolution counterpart with minimal error. The obtained PSFs using different sensors also explained spectral mixing at different scales of observation and provided a basis for nonlinear unmixing integrating spatial as well as spectral effects and addressing endmember variability. We performed our experiments with various coarse-grained and fine-grained igneous and sedimentary rocks under laboratory conditions to validate our results which were compared with available literature.
How to cite: Sahoo, M. M., Pattathal Vijayakumar, A., Herrmann, I., Mathew, S. K., and Porwal, A.: Estimation of point spread function for unmixing geological spectral mixtures, EGU General Assembly 2022, Vienna, Austria, 23–27 May 2022, EGU22-8712, https://doi.org/10.5194/egusphere-egu22-8712, 2022.
Please decide on your access
Please use the buttons below to download the presentation materials or to visit the external website where the presentation is linked. Regarding the external link, please note that Copernicus Meetings cannot accept any liability for the content and the website you will visit.
Forward to presentation link
You are going to open an external link to the presentation as indicated by the authors. Copernicus Meetings cannot accept any liability for the content and the website you will visit.
We are sorry, but presentations are only available for users who registered for the conference. Thank you.
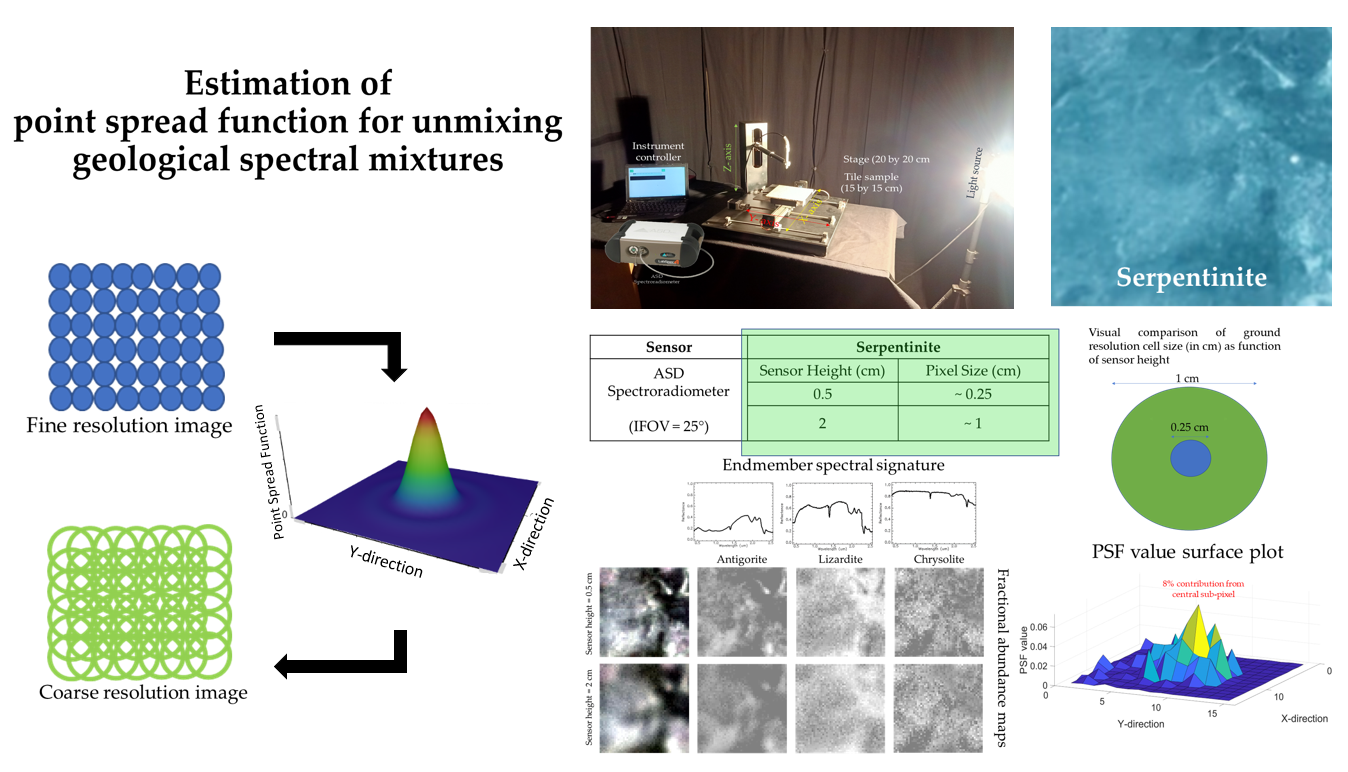
EGU22-9441 | Presentations | GI2.2
Water use efficiency (WUE) Modeling at Leaf level of Cotton (Gossypium hirsutum L.) in Telangana, IndiaShreedevi Moharana and Phanindra BVN Kambhammettu
Water use efficiency (WUE) plays a vital role in planning and management of irrigation strategies. Considering the spatial scale, WUE can be quantified at scales ranging from leaf to whole-plant to ecosystem to region. However, the inter-relation and their associate is poorly understood. This study is aimed at stimulating WUE of irrigated cotton at leaf () and further investigate the role of environmental and biophysical conditions on WUE dynamics. This study was conducted in an agricultural croplands located in Sangareddy district, about 70 km west of Hyderabad, the capital city of southern state Telangana, India. Ground based observation were made such as soil moisture, photosynthetic parameters and meteorological parameters. Modelling leaf water use efficiency has been established. The stomatal conductance and of cotton leaves exposed to ambient CO2 were simulated using Ball-Berry (mBB) model. Moreover, the stomatal conductance and of Cotton leaves exposed to ambient CO2 is simulated using modified Ball-Berry model, with instantaneous gas exchanges measured around noon used to parameterize and validate the model. We observed a large diurnal (4.3±1.9 mmolCO2 mol-1H2O) and seasonal (5.16±1.51 mmolCO2 mol-1H2O) variations in during the crop period. Model simulated and are in agreement with the measurements (R2>0.5, RMSE<0.3). Our results conclude that WUEL is ruled by climatic as well as vegetative factors respectively, and are largely controlled by changes in transpiration over photosynthesis. This needs further investigation with extensive analysis by building library of in-situ measurements.
Keywords: Cotton, WUE, Irrigation, Stomatal conductance, Ball Berry Model
How to cite: Moharana, S. and Kambhammettu, P. B.: Water use efficiency (WUE) Modeling at Leaf level of Cotton (Gossypium hirsutum L.) in Telangana, India, EGU General Assembly 2022, Vienna, Austria, 23–27 May 2022, EGU22-9441, https://doi.org/10.5194/egusphere-egu22-9441, 2022.
EGU22-9845 | Presentations | GI2.2
Implementation of an interoperable platform integrating BIM and GIS information for network-level monitoring and assessment of bridgesLuca Bertolini, Antonio Napolitano, Jhon Diezmos Manalo, Valerio Gagliardi, Luca Bianchini Ciampoli, and Fabrizio D'Amico
Monitoring of critical civil engineering infrastructures, and especially viaducts and bridges, has become a priority nowadays as the ageing of construction materials may cause damages and collapses with dramatic consequences. Following recent bridge collapses, specific guidelines on risk classification and management, safety assessment and monitoring of existing bridges have been issued in Italy, by the Minister of Infrastructure as a mandatory code [1]. Accordingly, several laws and regulations have been issued on the same topic, emphasizing the crucial role of BIM-based procedures for the design and management of civil infrastructures [2, 3]. Within this context, monitoring operations are generally conducted by on-site inspections and specialized operators, and rarely by high-frequency ground-based Non-Destructive Testing methods (NDTs). Furthermore, the implementation of satellite-based remote sensing techniques, have been increasingly and effectively used for the monitoring of bridges in the last few years [4]. Generally, these crucial pieces of information are analyzed separately, and the implementation of a multi-scale and multi-source interoperable BIM platform is still an open challenge [5].
This study aims at investigating the potential of an interoperable and upgradeable BIM platform supplemented by non-destructive survey data, such as Mobile Laser Scanner (MLS), Ground Penetrating Radar (GPR) and Satellite Remote Sensing Information (i.e. InSAR). The main goal of the research is to contribute to the state-of-the-art knowledge on BIM applications, by testing an infrastructure management platform aiming at reducing the limits typically associated to the separate observation of these assessments, to the advantage of an integrated analysis including both the design information and the routinely updated results of monitoring activities.
The activities were conducted in the framework of the Project “M.LAZIO”, approved by the Lazio Region, with the aim to develop an informative BIM platform of the investigated bridges interoperable within a Geographic Information System (GIS). As on-site surveys are carried out , a preliminary multi-source database of information is created, to be operated as the starting point for the integration process and the development of the infrastructure management platform. Preliminary results have shown promising viability of the data management model for supporting asset managers in the various management phases, thereby proving this methodology to be worthy for implementation in infrastructure integrated monitoring plans.
Acknowledgements
This research is supported by the Project “M.LAZIO”, accepted and funded by the Lazio Region, Italy. Funding from MIUR, in the frame of the “Departments of Excellence Initiative 2018–2022”, attributed to the Department of Engineering of Roma Tre University, is acknowledged.
References
[1] MIT, 2020. Ministero delle Infrastrutture e dei Trasporti, DM 578/2020
[2] EU, 2014. Directive 2014/24/EU of the European Parliament and of the Council of 26 February 2014 on public procurement and repealing Directive 2004/18/EC.
[3] MIMS, 2021. Ministero delle Infrastrutture e della Mobilità Sostenibile, DM 312/2021
[4] Gagliardi, V. et al., “Bridge monitoring and assessment by high-resolution satellite remote sensing technologies”. In SPIE Future Sensing Technologies; https://doi.org/10.1117/12.2579700
[5] D'Amico F. et al., "A novel BIM approach for supporting technical decision-making process in transport infrastructure management", Proc. SPIE 11863; https://doi.org/10.1117/12.2600140
How to cite: Bertolini, L., Napolitano, A., Diezmos Manalo, J., Gagliardi, V., Bianchini Ciampoli, L., and D'Amico, F.: Implementation of an interoperable platform integrating BIM and GIS information for network-level monitoring and assessment of bridges, EGU General Assembly 2022, Vienna, Austria, 23–27 May 2022, EGU22-9845, https://doi.org/10.5194/egusphere-egu22-9845, 2022.
EGU22-10538 | Presentations | GI2.2
VR/AR based approach for the diagnosis of the state of conservation of the architectural heritage. The case of the Convento do Carmo in LisbonNicola Masini, Francesco Gabellone, and Javier Ortega
Knowledge of the monument for its conservation is the result of a multidisciplinary work based on the integration of different data sources obtainable from historical research, architectural survey, the use of different imaging technologies. The latter are increasingly within the reach of conservators, architects and restoration companies thanks to the reduction of costs and to the effort to produce increasingly user-friendly imaging technologies both in terms of data acquisition and processing. The critical element is the interpretation of the results on which depends the effectiveness of these technologies in answering various questions that the restoration poses. Scientific literature suggests different approaches aimed at making the interpretation of imaging diagnostics easier, particularly by means of : i) the comparison between direct data (carrots, visual inspection) and results from non-invasive tests; ii) the use of specimens or laboratory test beds; iii) Virtual and Augmented reality (VR/AR) to be used as a work environment to facilitate the interpretation of non invasive imaging investigations. In particular, the reading and visualization of multiparametric information using VR/AR contents increases the standard modes for the transmission of knowledge of physical characteristics and state of conservation of the architectural heritage. This approach represents an effective system for storing and analysing heterogeneous data derived from a number of diverse non invasive imaging techniques, including Ground Penetrating radar (GPR) at high frequency, Infrared Thermography (IRT), Seismic tomography and other diagnostics techniques. In the context of Heritage Within Project, a VR/AR platform to interrelate heterogeneous data derived from GPR, IRT, Ultrasonic and sonic measurements along with results finite element computations has been developed and applied to the Convent of Our Lady of Mount Carmel in Lisbon to understand cause-and-effect mechanisms between the constructive characteristics, degradation pathologies and stress/deformation maps.
References
Gabellone F., Leucci G., Masini N., Persico R., Quarta G., Grasso F. 2013. Non-destructive prospecting and virtual reconstruction of the chapel of the Holy Spirit in Lecce, Italy. Near Surface Geophysics, doi: 10.3997/1873-0604.2012030
Gabellone F., Chiffi M., “Linguaggi digitali per la valorizzazione”, in F. Gabellone, M. T. Giannotta, M. F. Stifani, L. Donateo (a cura di), Soleto Ritrovata. Ricerche archeologiche e linguaggi digitali per la fruizione. Editrice Salentina, 2015. ISBN 978-88-98289-50-9
Masini N., Nuzzo L., Rizzo E., GPR investigations for the study and the restoration of the Rose Window of Troia Cathedral (Southern Italy), Near Surface Geophysics, 5 (5)(2007), pp. 287-300, ISSN: 1569-4445; doi: 10.3997/1873-0604.2007010
Masini N., Soldovieri F. (Eds) (2017). Sensing the Past. From artifact to historical site. Series: Geotechnologies and the Environment, Vol. 16. Springer International Publishing, ISBN: 978-3-319-50516-9, doi: 10.1007/978-3-319-50518-3, pp. 575
Javier Ortega, Margarita González Hernández, Miguel Ángel García Izquierdo, Nicola Masini, et al. (2021). Heritage Within. European Research Project, ISBN: 978-989-54496-6-8, Braga 2021.
How to cite: Masini, N., Gabellone, F., and Ortega, J.: VR/AR based approach for the diagnosis of the state of conservation of the architectural heritage. The case of the Convento do Carmo in Lisbon, EGU General Assembly 2022, Vienna, Austria, 23–27 May 2022, EGU22-10538, https://doi.org/10.5194/egusphere-egu22-10538, 2022.
EGU22-11201 | Presentations | GI2.2
DIARITSup: a framework to supervise live measurements, Digital Twins modelscomputations and predictions for structures monitoring.Jean Dumoulin, Thibaud Toullier, Mathieu Simon, and Guillermo Andrade-Barroso
DIARITSup is a chain of various softwares following the concept of ”system of systems”. It interconnects hardware and software layers dedicated to in-situ monitoring of structures or critical components. It embeds data assimilation capabilities combined with specific Physical or Statistical models like inverse thermal and/or mechanical ones up to the predictive ones. It aims at extracting and providing key parameters of interest for decision making tools. Its framework natively integrates data collection from local sources but also from external systems [1, 2]. DIARITSup is a milestone in our roadmap for SHM Digital Twins research framework. Furthermore, it intends providing some useful information for maintenance operations not only for surveyed targets but also for deployed sensors.
Thanks to its Model-view-controller (MVC) design pattern, DIARITSup can be extended, customized and connected to existing applications. Its core component is made of a supervisor task that handles the gathering of data from local sensors and external sources like the open source meteorological data (observations and forecasts) from Météo-France Geoservice [4] for instance. Meanwhile, a recorder manage the recording of all data and metadata in the Hierarchical Data Format (HDF5) [6]. HDF5 is used to its full potential with its Single-Writer-Multiple-Readers feature that enables a graphical user interface to represent the saved data in real-time, or the live computation of SHM Digital Twins models [3] for example. Furthermore, the flexibility of HDF5 data storage allows the recording of various type of sensors such as punctual sensors or full field ones. Finally, DIARITSup is able to handle massive deployment thanks to Ansible [5] automation tool and a Gitlab synchronization for automatic updates. An overview of the developed software with a real application case will be presented. Perspectives towards improvements on the software with more component integrations (Copernicus Climate Data Store, etc.) and a more generic way to configure the acquisition and model configuration will be finally discussed.
References
[1] Nicolas Le Touz, Thibaud Toullier, and Jean Dumoulin. “Infrared thermography applied to the study of heated and solar pavement: from numerical modeling to small scale laboratory experiments”. In: SPIE - Thermosense: Thermal Infrared Applications XXXIX. Anaheim, United States, Apr. 2017. url: https://hal.inria.fr/hal-01563851.
[2] Thibaud Toullier, Jean Dumoulin, and Laurent Mevel. “Study of measurements bias due to environmental and spatial discretization in long term thermal monitoring of structures by infrared thermography”. In: QIRT 2018 - 14th Quantitative InfraRed Thermography Conference. Berlin, Germany, June 2018. url: https://hal.inria.fr/hal-01890292.
[3] Nicolas Le Touz, Thibaud Toullier, and Jean Dumoulin. “Study of an optimal heating command law for structures with non-negligible thermal inertia in varying outdoor conditions”. In: Smart Structures and Systems 27.2 (2021), pp. 379–386. doi: 10.12989/sss.2021.27.2.379. url: https://hal.inria.fr/hal-03145348.
[4] Météo France. Données publiques Météo France. 2022. url: https://donneespubliques.meteofrance.fr.
[5] Red Hat & Ansible. Ansible is Simple IT Automation. 2022. url: https://www.ansible.com/.
[6] The HDF Group. Hierarchical Data Format, version 5. 1997-2022. url: https://www.hdfgroup.org/HDF5/.
How to cite: Dumoulin, J., Toullier, T., Simon, M., and Andrade-Barroso, G.: DIARITSup: a framework to supervise live measurements, Digital Twins modelscomputations and predictions for structures monitoring., EGU General Assembly 2022, Vienna, Austria, 23–27 May 2022, EGU22-11201, https://doi.org/10.5194/egusphere-egu22-11201, 2022.
EGU22-12743 | Presentations | GI2.2
Integrating Remote Sensing data to assess the protective effect of forests on rockfall:The case study of Monte San Liberatore (Campania, Italy)Alessandro Di Benedetto, Antonella Ambrosino, and Margherita Fiani
In recent years, great interest has been paid to the risk that hydrogeological instability causes to the territory, especially in densely populated and geologically fragile areas.
The forests, exerting a natural restraint, play an important protective function for the infrastructures and settlements underneath from the danger of falling rocks that fall from the rocky walls. This protective action is influenced not only by issues related to the vegetation itself but also by the morphology of the terrain, as a steeply sloping land surface can significantly increase the momentum of the rolling rock.
The aim of our work is to design a methodology based on the integration of remote sensing data, in detail optical satellite images and LiDAR data acquired by UAVs, to identify areas most prone to natural rockfall retention [1]. The results could then be used to identify areas that need to be reinforced artificially (rockfall nets) and naturally (protective forests).
The test area is located near Monte San Liberatore in the Campania region (Italy), which was affected in 1954 by a disastrous flood, in which heavy rains induced the triggering of a few complex landslides in a region that was almost geomorphologically susceptible. Indeed, there are several areas subject to high risk of rockfalls, whose exposed value is represented by a complex infrastructural network of viaducts, tunnels, and galleries along the north-west slope of the mountain, which is partly covered by thick vegetation, which reduces the rolling velocity of rocks detaching from the ridge.
According to the Carta della Natura, the vegetation most present in the area is the holm oak (Quercus Ilex), an evergreen, long-lived, medium-sized tree. Its taproot makes it resistant and stable, able to survive in extremely severe environments such as rocky soils or vertical walls, so it is ideal for slope protection.
The first processing step involved the multispectral analysis on Pleiades 1A four-band (RGB +NIR) high-resolution satellite images (HRSI). The computed vegetation indices (NDVI, RVI and NDWI) were used to assess the vegetation health status and its presumed age; thus, the most resilient areas of the natural compartment in terms of robustness and vigor were identified. The average plant height was determined using the normalized digital surface model (nDSM).
Next, starting from the Digital Terrain Model (DTM), we derived the morphometric features suitable for the description of the slope dynamics: slope gradient, exposure with respect to the North direction, plane, and convexity profile. The DTM and the DSM were created by interpolating on a grid the LiDAR point cloud acquired via UAV. Classification of areas having similar characteristics was made using SOM (Self-Organizing Maps), based on unsupervised learning.
The classified maps obtained delimit the similar areas from a morphological and vegetation point of view; in this way, all those areas that tend to have a higher propensity for rock roll reduction were identified.
[1] Fanos, Ali Mutar, and Biswajeet Pradhan. "Laser scanning systems and techniques in rockfall source identification and risk assessment: a critical review." Earth Systems and Environment 2.2 (2018): 163-182.
How to cite: Di Benedetto, A., Ambrosino, A., and Fiani, M.: Integrating Remote Sensing data to assess the protective effect of forests on rockfall:The case study of Monte San Liberatore (Campania, Italy), EGU General Assembly 2022, Vienna, Austria, 23–27 May 2022, EGU22-12743, https://doi.org/10.5194/egusphere-egu22-12743, 2022.
EGU22-13153 | Presentations | GI2.2
Integration of multiple geoscientific investigation methods for a better understanding of a water system: the example of Chimborazo glaciers melting effects on the Chambo aquifer, EcuadorAndrea Scozzari, Paolo Catelan, Francesco Chidichimo, Michele de Biase, Benito G. Mendoza Trujillo, Pedro A. Carrettero Poblete, and Salvatore Straface
The identification of the processes underlining natural systems often requires the adoption of multiple investigation techniques for the assessment of the sites under study. In this work, the combination of information derived from non-invasive sensing techniques, such as geophysics, remote sensing and hydrogeochemistry, highlights the possible influence of global climate change on the future water availability related to an aquifer in a peculiar glacier context, located in central Ecuador. In particular, we show that the Chambo aquifer, which supplies potable water to the region, does not contain fossil water, and it’s instead recharged over time. Indeed, the whole Chambo river basin is affected by the Chimborazo volcano, which is a glacerised mountain located in the inner tropics, one of the most critical places to be observed in the frame of climate impact on water resources. Thanks to the infomation gathered by the various surveying techniques, numerical modelling permitted an estimate of the recharge, which can be fully originated by the runoff from Chimborazo melting glaciers. Actually, the retreat of the glaciers on top of the Chimborazo is an ongoing process presumably related to global climate change.
How to cite: Scozzari, A., Catelan, P., Chidichimo, F., de Biase, M., Mendoza Trujillo, B. G., Carrettero Poblete, P. A., and Straface, S.: Integration of multiple geoscientific investigation methods for a better understanding of a water system: the example of Chimborazo glaciers melting effects on the Chambo aquifer, Ecuador, EGU General Assembly 2022, Vienna, Austria, 23–27 May 2022, EGU22-13153, https://doi.org/10.5194/egusphere-egu22-13153, 2022.
EGU22-13401 | Presentations | GI2.2
Tunnel deformation rate analysis based on PS-InSAR technique and stress-area methodLong Chai, Xiongyao Xie, Pan Li, Biao Zhou, and Li Zeng
The permanent scatterer synthetic aperture radar interferometry (PS-InSAR) technique can detect the permanent scatterers(PSs) on the ground. But the deformation of PSs can’t be used to analyze the deformation of underground buildings below the ground surface directly, such as tunnels. In this paper, the process of tunnel deformation analysis using PSs data and stress-area method is proposed. The deformation data of PSs are used to fit the surface deformation of tunnel by kriging interpolation method. The stress area method is used to calculate the deformation of the soil above the tunnel, then the deformation of tunnel can be acquired. This process was applied to calculate the deformation of a tunnel in Shanghai, China. The results show that the fitted surface deformation rate data are accurate, with the maximum absolute difference of 1.45mm/y and the minimum difference of 0.11mm/y compared with the level monitoring data. The tunnel deformation rate calculated by this process is close to the measured deformation rate of the tunnel with error level in millimeters. The surface and tunnel deformation rate curves are similar in the tunnel extension direction. PS-InSAR technique has the advantages of acquiring large area, historical data of surface deformation. Combined with the process proposed in this paper, Large-scale tunnel deformation analysis can be achieved.
How to cite: Chai, L., Xie, X., Li, P., Zhou, B., and Zeng, L.: Tunnel deformation rate analysis based on PS-InSAR technique and stress-area method , EGU General Assembly 2022, Vienna, Austria, 23–27 May 2022, EGU22-13401, https://doi.org/10.5194/egusphere-egu22-13401, 2022.
EGU22-13441 | Presentations | GI2.2
Collaborative use of ground monitoring and GPR data for the control of ground settlement in shield tunnel in soft soilKang Li, Xiongyao Xie, Xiaobin Zhang, Biao Zhou, Tenfei Qu, and Li Zeng
In recent years, China's construction demand for shield tunnel in soft soil continues to increase, and the control of ground settlement in tunnel boring process affects the safety of the tunnel itself and its superstructure directly. Paying close attention to controlling the strata loss and the ground settlement by multiple means is important to ensure construction safety. In this paper, the intelligent real-time monitoring system with dual-frequency ground penetrating radar (GPR) is used to detect the quality of back-fill grouting of shield tunnel, while monitoring points are arranged on the ground surface to acquire the settlement values in real time. The collaborative analysis of ground and underground monitoring results reveals the relationship between grouting and settlement values, and realizes the dynamic guidance on grouting operation, which helps to achieve the purpose of controlling ground settlement better. Last but not least, this paper proposes an outlook on a multiple-data fusion system based on cloud computing platform to adapt to more complex and multiple data in the future, so as to achieve the higher accuracy, efficiency and intelligence of monitoring data analysis.
How to cite: Li, K., Xie, X., Zhang, X., Zhou, B., Qu, T., and Zeng, L.: Collaborative use of ground monitoring and GPR data for the control of ground settlement in shield tunnel in soft soil, EGU General Assembly 2022, Vienna, Austria, 23–27 May 2022, EGU22-13441, https://doi.org/10.5194/egusphere-egu22-13441, 2022.
EGU22-13515 | Presentations | GI2.2
Application of ground penetrating radar (GPR) in look-ahead detection of slurry balance shield machineWeiwei Duan, Xiongyao Xie, Yong Yang, Kun Zeng, Huiming Wu, Li Zeng, and Kang Li
The shield machine has become the mainstream of subway tunnels construction because of its safety and efficiency. But with the continuous development of urban construction, the environment of subway tunnel construction is becoming more and more complex. In the process of shield tunnels construction in southern cities of China, slurry balance shield machines often encounter various obstacles, such as large diameter boulders and concrete pile foundations, which result in accidents of shield machine sticking. Therefore, it is necessary to quickly and accurately detect the distribution of obstacles in front of shield excavation face in advance so that operators can in time take measures to reduce the occurrence of such accidents. Ground penetrating radar (GPR) is a method widely used in engineering geological exploration. It has advantages of small working space, high efficiency and no damage compared with other detecting methods. When the GPR antenna is mounted on the cutter head of the shield machine, the obstacles in the stratum ahead of the shield machine can be detected in real time. Under this condition the GPR antenna’s real work mode is that it will rotate with the cutter head to form a circumferential survey line. Based on Finite-Difference-Time-Domain-Method (FDTD), authors use the common numerical simulation software (GPRMAX) to make simulations of GPR circumferential detection under the antenna array rotating with the cutter head, which verifies the theoretical feasibility of this method. By simulating radar emission and reflection pattern of electromagnetic wave, we study the propagation pattern of the reflect wave after encountering the obstacles and conclude the image pattern to establish the foundation for image recognition of obstacles. Due to the radar wave being susceptible to electromagnetic interference, GPR is still lack of engineering practice in shield advanced detection. To reduce the interference of the surrounding metal cutter head, a new strip radar antenna with a shielding shutter is designed to improve the directivity of electromagnetic wave propagation. Several antennas are fixed at several slurry openings of the cutter head of slurry balance shield machine to form radar antenna array and improve detection efficiency and accuracy.
How to cite: Duan, W., Xie, X., Yang, Y., Zeng, K., Wu, H., Zeng, L., and Li, K.: Application of ground penetrating radar (GPR) in look-ahead detection of slurry balance shield machine, EGU General Assembly 2022, Vienna, Austria, 23–27 May 2022, EGU22-13515, https://doi.org/10.5194/egusphere-egu22-13515, 2022.
EGU22-177 | Presentations | GI2.3
Sensitivity analysis on the wet deposition parameterization for 137Cs transport modeling following the Fukushima Daiichi Nuclear Power Plant accidentShuhan Zhuang, Xinwen Dong, and Sheng Fang
Wet deposition has been identified as a critical impactor for the modelling of 137Cs in the Fukushima Daiichi Nuclear power plant (FDNPP) accident. However, it is difficult to simulate due to the involvement of close interaction between various complicated meteorological and physical processes during the wet deposition process. The limitation of measurement of the in-cloud and below-cloud scavenging also contribute to the uncertainty in wet deposition modeling, leading to the great variation of 137Cs wet deposition parameterization. These variations can be amplified further by inaccurate meteorological input, making simulation of radionuclide transport sensitive to the choice of wet scavenging parameterization. Moreover, simulations can also be influenced by differences between radionuclide transport models, even if they adopt similar parameterization for wet scavenging. Although intensively investigated, wet deposition simulation is still subject to uncertainties of meteorological inputs and wet scavenging modeling, leading to biased 137Cs transport prediction.
To improve modeling of 137Cs transport, both in- and below-cloud wet scavenging schemes were integrated into the Weather Research and Forecasting-Chemistry (WRF-Chem) model, yielding online coupled modeling of meteorology and the two wet scavenging processes. Overall, 25 combinations of different in- and below-cloud scavenging schemes of 137Cs, covering most wet scavenging schemes reported in the literature, were integrated into WRF-Chem. Additionally, two microphysics schemes were compared to improve the simulation of precipitation. These 25 models and the ensemble mean of 9 representative models were systematically compared with a previous below-cloud-only WRF-Chem model, using the cumulative deposition and atmospheric concentrations of 137Cs measurements. The findings could elucidate the range of variation among these schemes both within and across the five in-cloud groups, reveal the behaviors and sensitivities of different schemes in different scenarios.
The results revealed that the Morrison's double moment cloud microphysics scheme improves the simulation of rainfall and deposition pattern. Furthermore, the integration of the in-cloud schemes in WRF-Chem substantially reduces the bias in the cumulative deposition simulation, especially in the Nakadori and Tochigi regions where light rain dominated. For atmospheric concentration of 137Cs, those models with in-cloud schemes that consider cloud parameters showed better and more stable performance, among which Hertel-Bakla performed best for atmospheric concentration and Roselle-Apsimon performed best for both deposition and atmospheric concentration. In contrast, the in-cloud schemes that rely solely on rain intensity were found sensitive to the meteorological conditions and showed varied performance in relation to the plume events examined. The analysis based on the spatial pattern shows that the Roselle scheme, which considers cloud liquid water content and depth, can achieve a more balanced allocation of 137Cs between the air and the ground in these two cases than that achieved by the empirical power function scheme Environ. The ensemble mean achieves satisfactory performance except for one plume event, but still outperforms most models. The range of variation of the 25 models covered most of the measurements, reflecting the reasonable capability of WRF-Chem for modeling 137Cs transport.
How to cite: Zhuang, S., Dong, X., and Fang, S.: Sensitivity analysis on the wet deposition parameterization for 137Cs transport modeling following the Fukushima Daiichi Nuclear Power Plant accident, EGU General Assembly 2022, Vienna, Austria, 23–27 May 2022, EGU22-177, https://doi.org/10.5194/egusphere-egu22-177, 2022.
Please decide on your access
Please use the buttons below to download the presentation materials or to visit the external website where the presentation is linked. Regarding the external link, please note that Copernicus Meetings cannot accept any liability for the content and the website you will visit.
Forward to presentation link
You are going to open an external link to the presentation as indicated by the authors. Copernicus Meetings cannot accept any liability for the content and the website you will visit.
We are sorry, but presentations are only available for users who registered for the conference. Thank you.
EGU22-190 | Presentations | GI2.3
Micro-SWIFT SPRAY modeling of atmospheric dispersion around a nuclear power plant site with complex topographyXinwen Dong, Shuhan Zhuang, and Sheng Fang
The nuclear emergency response for accidental release around the nuclear power plant site (NPPs) requires a fast and accurate estimate of the influence caused by gaseous hazardous pollutants spreading, which is critical for and preventing protecting lives, creatures, and the environment. However, as usual, the NPPs is consist of dense buildings and multi-type terrain, e.g. river and mountain, which poses challenges to atmospheric dispersion calculation for response tasks. Micro-SWIFT SPRAY (MSS) comprises both the diagnostic wind model and the dispersion model, which enables the airflows and atmospheric dispersion simulation with the meteorological and other inputs. For a small-scale scenario, especially, the separate module for obstacles influence modeling provides the potential capability of precise atmospheric dispersion. But the error behavior of such a scenario around a nuclear power plant site with complex topography remains to be further demonstrated. In this study, MSS is comprehensively evaluated against a wind tunnel experiment with a 1:600 scale for the small-scale (3 km × 3km) atmospheric dispersion modeling. Tens of buildings located in this scenario of a NPPs surrounded by a mountain and river. The evaluations for diagnostic wind modeling include the speed, direction, and distribution of horizontal airflows and vertical profile of speed at a representative site. And for the concentration calculation, horizontal distribution, axis profile, and vertical profile at a representative site. The results demonstrate the MSS can reproduce fine airflows near the buildings but overestimate the wind speed. The maximum deviation of vertical speed is around 2.09 m/s at the representative site. The simulated plume of concentration reproduces the highest concentration place and matches the observations well. The axis profile of concentration is underestimated and the vertical profile displays an increasing deviation with the height increase. Compared with the observations, the FAC5 and FAC2 of concentration simulation reach 0.945 and 0.891 in the entire calculation domain, which convinces the performance of MSS in small-scale modeling.
How to cite: Dong, X., Zhuang, S., and Fang, S.: Micro-SWIFT SPRAY modeling of atmospheric dispersion around a nuclear power plant site with complex topography, EGU General Assembly 2022, Vienna, Austria, 23–27 May 2022, EGU22-190, https://doi.org/10.5194/egusphere-egu22-190, 2022.
Please decide on your access
Please use the buttons below to download the presentation materials or to visit the external website where the presentation is linked. Regarding the external link, please note that Copernicus Meetings cannot accept any liability for the content and the website you will visit.
Forward to presentation link
You are going to open an external link to the presentation as indicated by the authors. Copernicus Meetings cannot accept any liability for the content and the website you will visit.
We are sorry, but presentations are only available for users who registered for the conference. Thank you.

EGU22-666 | Presentations | GI2.3
Dry deposition velocity of chlorine 36 on grasslandSourabie Deo, Didier Hebert, Lucilla Benedetti, Elsa Vitorge, Beatriz Lourino Cabana, Valery Guillou, and Denis Maro
Chlorine 36 (36Cl, T1/2 = 301,000 years) is a radionuclide with natural and anthropogenic origin that can be rejected accidentally during decommissioning of nuclear power plants or chronically during recycling of nuclear waste. Once emitted into the atmosphere, 36Cl (gas and particles) can be transferred to the soil and vegetal cover by dry and wet deposition. However, knowledge of these deposits is very scarce. Because of its relatively high mobility in the geosphere and its high bioavailability, 36Cl fate in the environment should be studied for environmental and human impact assessments. So, the objective of this work is to determine the dry deposition rates of chlorine 36 on grassland. Grass is studied, as it is a link in the human food chain via cow's milk.
In order to achieve this objective, a method for extracting the chlorine contained in plant leaves has been developed. This method consists in heating the dried and grounded plant sample in presence of sodium hydroxide. A temperature gradient up to 450°C allows the extraction to be carried out in two stages: (i) The chlorides with a strong affinity for alkaline environments are first extracted from the plant and preserved in sodium hydroxide; (ii) The organic matter is then destroyed by combustion and the sodium hydroxide crystallised. Brought out from the oven, the dry residue is dissolved in ultrapure water and chemically prepared for the measurement of chlorine 36. This extraction method was validated by its application to NIST standards of peach and apple leaves. The average extraction efficiency of chlorides was 83 ± 3%.
For the determination of dry deposition rates, 1m2 of grass was exposed every 2 weeks at the IRSN La Hague technical platform (PTILH) located 2 km downwind from Orano la Hague, a chronic source of low-level chlorine 36 emissions. A mobile shelter with automatic humidity detection covered the grass during rainy episodes. In proximity to the grass, atmospheric chlorine was also sampled at the same frequency as the grass. Gaseous chlorine was sampled by bubbling in sodium hydroxide and by an AS3000 sampler containing activated carbon cartridge. Particulate chlorine was collected on a composite (teflon and glass fibre) filter. Chlorine 36 was measured by accelerated mass spectrometry ASTER (Accelerator for Earth Sciences, Environment and Risks) at CEREGE, Aix-en-Provence, France. All samples were subjected to a succession of chemical preparations in order to remove the sulphur 36 (an isobaric interferent) and to collect the chlorides in the form of AgCl pastilles. The results show a chlorine 36 deposition flux on the grass of 2.94.102 at/m2.s with a deposition velocity in dry weather vd(gas+particles) = 8.10-4 m/s for a contribution of 65.5% of particulate chlorine 36 and 34.5% of gaseous chlorine 36. Based on these experimental results, a modelling of the dry and wet deposits will be carried out considering the parameters related to the canopy and the atmospheric turbulence.
How to cite: Deo, S., Hebert, D., Benedetti, L., Vitorge, E., Lourino Cabana, B., Guillou, V., and Maro, D.: Dry deposition velocity of chlorine 36 on grassland, EGU General Assembly 2022, Vienna, Austria, 23–27 May 2022, EGU22-666, https://doi.org/10.5194/egusphere-egu22-666, 2022.
EGU22-1235 | Presentations | GI2.3
Modeling the depth dependence of Cs-137 concentration in Lake OnumaYuko Hatano, Kentaro Akasaki, Eiichi Suetomi, Yukiko Okada, Kyuma Suzuki, and Shun Watanabe
Lake Onuma on Mt. Akagi (Gunma Prefecture, Japan) is a closed lake with an average water residence time of 2.3 years. The activity concentration of radioactive cesium in the lake was high shortly after the Fukushima accident. According to Suzuki et al. [1] and Watanabe [2], after a filtration process, Cs-137 are separated into two groups: particulate form and dissolved form. These two forms appears to have very different concentration profiles with each other, when the Cs-137 concentration plotted against the sampled water depths. In the present study, we are going to model those behavior of particulate/dissolved forms with an emphasis on the depth dependency.
We consider a creation-annihilation process of plankton for the model of the particulate form, since diatom shells are found to be a major constituent of the particulate Cs-137 [2]. We set ∂P/∂t = f(x,t) and f(x,t) = χ(x) cos(ωt) (0 ≤ x ≤ L(water column height), t > 0), where P=P(x,t) is the activity concentration of the particulate form. The term f(x,t) is the rate of the net production of the plankton at a specific location x at a specific time t. Seasonal cycle is also taken into account by the cosine function (we neglect the phase shift here). The function χ(x), depends solely on water depth x, is responsible for dynamics or inhomogeneity of lake water, such as circulation, stratification or a thermocline. We assume that such a water structure relates to the production rate of plankton through the function χ(x). Thus, we may obtain the concentration of particulate Cs-137. For the dissolved concentration S(x,t), we use the classical diffusion equation with the diffusivity K being dependent on both space and time (i.e. K(x,t)), namely ∂S/∂t = ∇•(K(x,t) ∇S). Here S=S(x,t) is the activity concentration of the dissolved form. The total activity concentration C(x,t) is the sum of P(x,t) and S(x,t). Using the pair of the equations, we can reproduce the followings. (1) depth profiles of each of the soluble- and particulate activity concentration and (2) depth profiles of the total Cs-137 concentration.
[1] Suzuki, K. et al., Sci. Tot. Env. (2018)
[2] Watanabe, S. et al., Proc. 20th Workshop on Environmental Radioactivity (2019)
How to cite: Hatano, Y., Akasaki, K., Suetomi, E., Okada, Y., Suzuki, K., and Watanabe, S.: Modeling the depth dependence of Cs-137 concentration in Lake Onuma, EGU General Assembly 2022, Vienna, Austria, 23–27 May 2022, EGU22-1235, https://doi.org/10.5194/egusphere-egu22-1235, 2022.
Please decide on your access
Please use the buttons below to download the presentation materials or to visit the external website where the presentation is linked. Regarding the external link, please note that Copernicus Meetings cannot accept any liability for the content and the website you will visit.
Forward to presentation link
You are going to open an external link to the presentation as indicated by the authors. Copernicus Meetings cannot accept any liability for the content and the website you will visit.
We are sorry, but presentations are only available for users who registered for the conference. Thank you.
EGU22-3340 | Presentations | GI2.3
Factors controlling the dissolved 137Cs seasonal fluctuations in the Abukuma River under the influence of the Fukushima Nuclear Power Plant accidentYasunori Igarashi, Nanb Kenji, Toshihiro Wada, Yoshifumi Wakiyama, Yuichi Onda, and Shota Moritaka
The 2011 Fukushima Daiichi Nuclear Power Plant (FDNPP) accident released large amounts of radioactive materials into the environment. River systems play an important role in the terrestrial redistribution of FDNPP-derived 137Cs in association with water and sediment movement. We examined the seasonal fluctuations in dissolved and particulate 137Cs activity concentrations and clarified the biological and physicochemical factors controlling 137Cs in the Abukuma River’s middle course in the region affected by the FDNPP accident. The results showed the water temperature and K+ concentration dominated the seasonality of the dissolved 137Cs activity concentration. We concluded that the 137Cs in organic matter is not a source of dissolved 137Cs in river water. The study also revealed the temperature dependence of Kd in riverine environments from a Van ’t Hoff equation. The standard reaction enthalpy of 137Cs in the Abukuma River was calculated to be approximately −19.3 kJ/mol. This was the first study to clearly reveal the mechanisms by which the dissolved 137Cs activity concentration and Kd are influenced by chemical and thermodynamic processes in the middle course of a large river, and it is expected to lead to an improved model of 137Cs dynamics in rivers.
How to cite: Igarashi, Y., Kenji, N., Wada, T., Wakiyama, Y., Onda, Y., and Moritaka, S.: Factors controlling the dissolved 137Cs seasonal fluctuations in the Abukuma River under the influence of the Fukushima Nuclear Power Plant accident, EGU General Assembly 2022, Vienna, Austria, 23–27 May 2022, EGU22-3340, https://doi.org/10.5194/egusphere-egu22-3340, 2022.
EGU22-3442 | Presentations | GI2.3
A comparative study of riverine 137Cs dynamics during high-flow events at three contaminated river catchments in FukushimaYoshifumi Wakiyama, Takuya Niida, Hyoe Takata, Keisuke Taniguchi, Honoka Kurosawa, Kazuki Fujita, and Alexei Konoplev
This study presents the temporal variations in riverine 137Cs concentrations and fluxes to the ocean during high-flow events in three coastal river catchments contaminated by the Fukushima Daiichi Nuclear Power Plant accident. River water samples were collected at points downstream in the Niida, Ukedo, and Takase Rivers during three high-flow events that occurred in 2019–2020. Variations in both the dissolved 137Cs concentration and 137Cs concentration in suspended solids appeared to reflect the spatial pattern of the 137Cs inventory in the catchments, rather than variations in physico-chemical properties. Negative relationships between the 137Cs concentration and δ15N in suspended sediment were found in all rivers during the intense rainfall events, suggesting an increased contribution of sediment from forested areas to the elevated 137Cs concentration. The 137Cs flux ranged from 0.33 to 18 GBq, depending on the rainfall erosivity. The particulate 137Cs fluxes from the Ukedo River were relatively low compared with the other two rivers and were attributed to the effect of the Ogaki Dam reservoir upstream. The ratio of 137Cs desorbed in seawater to 137Cs in suspended solids ranged from 2.8% to 6.6% and tended to be higher with a higher fraction of exchangeable 137Cs. The estimated potential release of 137Cs from suspended solids to the ocean was 0.048–0.57 GBq, or 0.8–6.2 times higher than the direct flux of dissolved 137Cs from the river. Episodic sampling during high-flow events demonstrated that the particulate 137Cs flux depends on catchment characteristics and controls 137Cs transfer to the ocean.
How to cite: Wakiyama, Y., Niida, T., Takata, H., Taniguchi, K., Kurosawa, H., Fujita, K., and Konoplev, A.: A comparative study of riverine 137Cs dynamics during high-flow events at three contaminated river catchments in Fukushima, EGU General Assembly 2022, Vienna, Austria, 23–27 May 2022, EGU22-3442, https://doi.org/10.5194/egusphere-egu22-3442, 2022.
Please decide on your access
Please use the buttons below to download the presentation materials or to visit the external website where the presentation is linked. Regarding the external link, please note that Copernicus Meetings cannot accept any liability for the content and the website you will visit.
Forward to presentation link
You are going to open an external link to the presentation as indicated by the authors. Copernicus Meetings cannot accept any liability for the content and the website you will visit.
We are sorry, but presentations are only available for users who registered for the conference. Thank you.
EGU22-5397 | Presentations | GI2.3
Integrating measurement representativeness and release temporal variability to improve the Fukushima-Daiichi 137Cs source reconstructionJoffrey Dumont Le Brazidec, Marc Bocquet, Olivier Saunier, and Yelva Roustan
The Fukushima-Daiichi accident involved massive and complex releases of radionuclides in the atmosphere. The releases assessment is a key issue and can be achieved by advanced inverse modelling techniques combined with a relevant dataset of measurements. A Bayesian inversion is particularly suitable to deal with this case. Indeed, it allows for rigorous statistical modelling and enables easy incorporation of informations of different natures into the reconstruction of the source and the associated uncertainties.
We propose several methods to better quantify the Fukushima-Daiichi 137Cs source and the associated uncertainties. Firstly, we implement the Reversible-Jump MCMC algorithm, a sampling technique able to reconstruct the distributions of the 137Cs source magnitude together with its temporal discretisation. Secondly, we develop methods to (i) mix both air concentration and deposition measurements, and to (ii) take into account the spatial and temporal information from the air concentration measurements in the error covariance matrix determination.
Using these methods, we obtain distributions of hourly 137Cs release rates from 11 to 24 March and assess the performance of our techniques by carrying out a model-to-data comparison. Furthermore, we demonstrate that this comparison is very sensitive to the statistical modelling of the inverse problem.
How to cite: Dumont Le Brazidec, J., Bocquet, M., Saunier, O., and Roustan, Y.: Integrating measurement representativeness and release temporal variability to improve the Fukushima-Daiichi 137Cs source reconstruction, EGU General Assembly 2022, Vienna, Austria, 23–27 May 2022, EGU22-5397, https://doi.org/10.5194/egusphere-egu22-5397, 2022.
EGU22-6698 | Presentations | GI2.3
Vertical distribution of 137Cs in bottom sediments as representing the time changes of water contamination: Chernobyl and FukushimaAleksei Konoplev, Yoshifumi Wakiyama, Toshihiro Wada, Yasunori Igarashi, Gennady Laptev, Valentin Golosov, Maxim Ivanov, Mikhail Komissarov, and Kenji Nanba
Bottom sediments of lakes and dam reservoirs can provide an insight into understanding the dynamics of 137Cs strongly bound to sediment particles. On this premise, a number of cores of bottom sediments were collected in deep parts of lakes Glubokoe, Azbuchin, and Cooling Pond in close vicinity of the Chernobyl NPP in Ukraine, in Schekino reservoir (Upa River) in the Tula region of Russia (2018) and in Ogaki reservoir (Ukedo River) in Fukushima contaminated area (2019). Each layer of bottom sediments can be attributed to a certain time of suspended particles sedimentation. With 137Cs activity concentration in a given layer of bottom sediments corresponding to 137Cs concentration on suspended matter at that point in time, we were able to reconstruct the post-accidental dynamics of particulate 137Cs activity concentrations. Using experimental values of the distribution coefficient Kd, changes in the dissolved 137Cs activity concentrations were estimated. The annual mean particulate and dissolved 137Cs wash-off ratios were also calculated for the period after the accidents. Interestingly, the particulate 137Cs wash-off ratios for the Ukedo River at Ogaki dam were found to be similar to those for the Pripyat River at Chernobyl in the same time period after the accident, while the dissolved 137Cs wash-off ratios in the Ukedo River were an order of magnitude lower than the corresponding values in the Pripyat River. The estimates of particulate and dissolved 137Cs concentrations in Chernobyl cases were in reasonable agreement with monitoring data and predictions using the semi-empirical diffusional model. However, both the particulate and dissolved 137Cs activity concentrations and wash-off ratios in the Ukedo River declined faster during the first eight years after the FDNPP accident than predicted by the diffusional model, most likely, due to greater natural attenuation and, to some extent, remediation measures implemented on the catchments in Fukushima.
This research was supported by Science and Technology Research Partnership for Sustainable Development (SATREPS), Japan Science and Technology Agency (JST)/Japan International Cooperation Agency (JICA) (JPMJSA1603), by bilateral project No. 18-55-50002 of Russian Foundation for Basic Research (RFBR) and Japan Society for the Promotion of Science (JSPS), and JSPS Project KAKENHI (B) 18H03389.
How to cite: Konoplev, A., Wakiyama, Y., Wada, T., Igarashi, Y., Laptev, G., Golosov, V., Ivanov, M., Komissarov, M., and Nanba, K.: Vertical distribution of 137Cs in bottom sediments as representing the time changes of water contamination: Chernobyl and Fukushima, EGU General Assembly 2022, Vienna, Austria, 23–27 May 2022, EGU22-6698, https://doi.org/10.5194/egusphere-egu22-6698, 2022.
Please decide on your access
Please use the buttons below to download the presentation materials or to visit the external website where the presentation is linked. Regarding the external link, please note that Copernicus Meetings cannot accept any liability for the content and the website you will visit.
Forward to presentation link
You are going to open an external link to the presentation as indicated by the authors. Copernicus Meetings cannot accept any liability for the content and the website you will visit.
We are sorry, but presentations are only available for users who registered for the conference. Thank you.
EGU22-7068 | Presentations | GI2.3
Seasonal variation of dissolved Cs-137 concentrations in headwater catchments in Yamakiya district, Fukushima PrefectureTaichi Kawano, Yuichi Onda, Junko Takahishi, Fumiaki Makino, and Sho Iwagami
The Fukushima Daiichi Nuclear Power Plant (FDNPP) accident occurred on March 11, 2011, and a large amount of Cs-137 was released into the environment. It is important to clarify the behavior of radioactive cesium-137 in headwater catchments because most of the Cs-137 falls and is deposited in forest areas and is transported in the environment through river systems.
The purpose of this study was to clarify the influence of water quality composition and organic matter on the seasonal variation of dissolved Cs-137 concentrations in stream water based on long-term monitoring since 2011 at four headwaters catchments in Yamakiya district, Fukushima Prefecture (Iboishiyama, Ishidairayama, Koutaishiyama, Setohachiyama), located about 35 km northwest of FDNPP.
Water temperature, pH, and EC were measured in the field, and SS and coarse organic matter were collected using a time-integrated SS (suspended sediments) sampler and organic matter net. The Cs-137 concentrations was measured in the laboratory using a germanium detector. Concentrations of cations (Na⁺,K⁺,Ca²⁺,Mg²⁺,NH₄⁺) and anions (Cl⁻,SO₄²⁻,NO₃⁻,NO₂⁻,PO₄²⁻) were measured by ion chromatography after 0.45μm filtration. In addition, dissolved organic carbon (DOC) concentrations was measured using a total organic carbon analyzer.
The results showed that K⁺, which is highly competitive with Cs-137, was detected at Iboisiyama, Ishidairayama, and Koutaishiyama, while NH₄⁺ was only detected in some samples at Iboishiyama. There was no obvious relationship between dissolved ion concentration and water temperature, and between dissolved ion concentration and dissolved ¹³⁷Cs concentration at all sites. However, a positive correlation between dissolved cesium concentration and water temperature and DOC and water temperature was observed at all sites regardless of the presence of K⁺ and NH₄⁺. On the other hand, there was no clear relationship between the cesium concentrations in SS and organic matter and water temperature. These results suggest that the seasonal variation in dissolved Cs-137 concentrations in stream water with water temperature could be caused by the seasonality of microbial decomposition of organic matter.
How to cite: Kawano, T., Onda, Y., Takahishi, J., Makino, F., and Iwagami, S.: Seasonal variation of dissolved Cs-137 concentrations in headwater catchments in Yamakiya district, Fukushima Prefecture, EGU General Assembly 2022, Vienna, Austria, 23–27 May 2022, EGU22-7068, https://doi.org/10.5194/egusphere-egu22-7068, 2022.
EGU22-8178 | Presentations | GI2.3
Regularities of the 137Cs secondary distribution in the soil-moss cover of elementary landscape-geochemical systems and its dynamics within 6 years on the test site in the Chernobyl abandoned zone, RussiaDenis Dolgushin and Elena Korobova
A study of 137Cs distribution in a landscape cross-section characterizing the ELGS system (top-slope-closing depression) in the “Vyshkov-2” test site located in the Chernobyl abandoned zone, the Bryansk region, Russia, has been performed in 2015 and 2021. The test site (70×100 m) is located on the Iput’ river terrace in a pine forest characterized by the undisturbed soil-plant cover. Sod-podzolic sandy illuvial-ferruginous soils present the soil cover. The initial level of 137Cs contamination of the area varied from 1480 kBq/m2 to 1850 kBq/m2. Up to now, 89-99 % of the total 137Cs is fixed in the upper 20 cm soil layer with 70-96 % in the upper 8 cm. It allows field spectrometry data to study the structure of the 137Cs contamination field. The 137Cs activity was measured in the soil and moss cover along cross-sections with 1 m step by adapted gamma-spectrometer Violinist-III (USA). Cs-137 content in the soil cores’ and plant samples was determined in the laboratory by Canberra gamma-spectrometer with HPGe detector. It was shown that there is no unidirectional movement of 137Cs both in the soil and in the vegetation cover of the ELGS from the top to the closing depression. On the contrary, the data obtained allow us to state a pronounced cyclical variation of the 137Cs activity in ELGS, which can be traced in the soil and the vegetation. The variation appeared to be rather stable in space 29 and 35 years after the primary pollution. Cyclic fluctuation (variation) of 137Cs activity was described mathematically using Fourier-analysis, which was used to model the observed changes by the revealed three main harmonics. High and significant correlation coefficients obtained between the variation of 137Cs activity and the model for the soil-vegetation cover (r0,01= 0,868; n=17 - 2015; r0,01= 0,675; n=17 - 2021), soils (r0,01= 0,503-0,859; n=17) and moss samples (r0,01= 0,883; n=17 - 2015; r0,01= 0,678; n=17 - 2021) proved satisfactory fitting of models. The character of 137Cs variability in moss cover was generally similar to surface soil contamination, but the level of contamination and amplitude was specific.
The performed study confirmed specific features of 137Cs secondary migration in ELGS, which periodic functions describe. We infer that the observed cyclicity reflects elements’ migration in the ELGS system with water.
The reported study was funded by the Vernadsky Institute federal budget (research task #0137-2019-0006). The field works were supported partly by RFBR No 19-05-00816.
How to cite: Dolgushin, D. and Korobova, E.: Regularities of the 137Cs secondary distribution in the soil-moss cover of elementary landscape-geochemical systems and its dynamics within 6 years on the test site in the Chernobyl abandoned zone, Russia, EGU General Assembly 2022, Vienna, Austria, 23–27 May 2022, EGU22-8178, https://doi.org/10.5194/egusphere-egu22-8178, 2022.
EGU22-9022 | Presentations | GI2.3
Ten-year long-range transport of radiocaesium in the surface layer in the Pacific Ocean and its marginal seasMichio Aoyama, Yuichiro Kumamoto, and Yayoi Inomata
Radiocaesium derived from the Fukushima Dai-ichi Nuclear Power Plant (FNPP1) accident was observed across a wide area of the North Pacific, not only in surface seawater, but also in the ocean interior. In this presentation, we summarized the time scale of Lagrangian transport of the FNPP1 derived radiocaesium in surface water during the period from the time of the accident to March 2021 in the North Pacific and the Arctic Oceans and its marginal seas as shown below.
Initial observation results until December 2012 in the surface layer in the North Pacific Ocean by the global observations revealed that a typical feature within one year after the accident was a westward movement across the North Pacific Ocean, speed of which was reported at 7 km day-1 until August 2011. After that, the main body of FNPP1-derived radiocaesium moved east as 3 km day-1 and is separated from Japan in 2013. The arrival of the FNPP1 signal at the west coast of the American continent was reported in 2014. The elevation in the FNPP1 derived radiocaesium concentration in the Bering Sea in 2017 and in the Arctic Ocean in 2019 was reported. The northward bifurcation of the Kuroshio Extension made these obvious transport of the FNPP1 derived radiocaesium to the subarctic and arctic region while the transport by southward bifurcation was not observed. At Hawaii Islands in the subtropical gyre, there was no signal of the FNPP1 derived radiocaesium during the period from March 2011 and February 2017. At Yonaguni Island where the Kuroshio enters the East China Sea, the FNPP1 signal arrived at Yonaguni Islands eight years after the time of the accident, and these might be transported mainly from the subtropical gyre.
At the marginal seas of the North Pacific Ocean, the elevation in the FNPP1 derived radiocaesium concentration in the northern East China Sea in 2014, in the Sea of Japan in 2014/2015 were observed.
We also briefly summarize study results on nuclides other than radiocaesium (e.g., 90Sr, 239240Pu, and 129I).
How to cite: Aoyama, M., Kumamoto, Y., and Inomata, Y.: Ten-year long-range transport of radiocaesium in the surface layer in the Pacific Ocean and its marginal seas, EGU General Assembly 2022, Vienna, Austria, 23–27 May 2022, EGU22-9022, https://doi.org/10.5194/egusphere-egu22-9022, 2022.
EGU22-9055 | Presentations | GI2.3
Determining sources of the 137Cs concentration in seawater at Fukushima Daiichi Nuclear Power Plant using Antecedent Precipitation IndexHikaru Sato and Yuichi Onda
Radiocesium (137Cs) was one of the radioactive materials released from the Fukushima Dai-ichi Nuclear Power Plant (FDNPP) accident in March 2011. Highly 137Cs contaminated water from groundwater to the sea was reduced after installation of the sea-side impermeable wall as a countermeasure against contaminated water in October 2015. As a result, 137Cs contamination in water from other sources became more prominent and the levels of 137Cs concentration in seawater was correlated with rainfall fluctuation. To determine the source of contamination, we estimated the fluctuation patterns of 137Cs concentration in seawater, groundwater level, and discharge from the channels using the Antecedent Precipitation Index (Rw) method.
The results indicated that the fluctuation in seawater collected near the 1-4 Units had strong agreement with the 3 day half-life of Rw. The half-life is shorter than that estimated by groundwater level (7 to 30 day). Therefore, the 137Cs concentration in seawater was influenced by relatively faster runoff than the deep groundwater flow. We also made the spatial distribution map of 137Cs concentration in seawater to determine the sources of contamination. It showed that the 137Cs contaminated area was the highest at “south- inside the intake of 1-4 Units” where the outlets of the K and BC discharge channels are located. In particular, the concentration of 137Cs in the channel K was found to correlate with the concentration of 137Cs in seawater near the 1-4 Units (average of R2 = 0.5). These results indicate that the concentration of 137Cs in seawater inside the FDNPP port can be estimated by the Rw method and that the source of the contamination could be determined using the half-life.
How to cite: Sato, H. and Onda, Y.: Determining sources of the 137Cs concentration in seawater at Fukushima Daiichi Nuclear Power Plant using Antecedent Precipitation Index, EGU General Assembly 2022, Vienna, Austria, 23–27 May 2022, EGU22-9055, https://doi.org/10.5194/egusphere-egu22-9055, 2022.
EGU22-10644 | Presentations | GI2.3
Temporal trends of radio-cesium concentration in the marine environment after the Chernobyl and Fukushima Dai-ichi Nuclear Power Plant accidentsHyoe Takata
European seas such as, Baltic, North, and Norwegian Seas are mostly affected areas by the accident at the Chernobyl nuclear power plant (CNPP) in 1986. Since Fukushima Daiichi nuclear power plant (FDNPP) is located on the coast of the North Pacific Ocean in east Japan, its accident resulted in the release of large amounts of radiocesium to the surrounding coastal marine environment (i.e. the waters off Fukushima and neighboring prefectures). The temporal change of radiocaesium concentration in seawater after both accidents was largely dependent on their submarine topography: The Baltic Sea is a semi-closed basin, while Norwegian and North Seas, and the waters off Fukushima and neighboring prefectures is directly connected to open-water. Although concentration of radioacesium (137Cs) in the surface water of the Baltic Sea (central part) continuously decreased, the values in 1996, ten years after the accident, were even higher than pre-accident level in 1985. On the other hand, in the waters off Fukushima and neighboring prefectures 137Cs concentrations in 2020, nine years after the accident, are approaching the pre-accident levels of 2010. The quick decrease is attributable to the intrusion or mixing of water masses with low 137Cs.
How to cite: Takata, H.: Temporal trends of radio-cesium concentration in the marine environment after the Chernobyl and Fukushima Dai-ichi Nuclear Power Plant accidents, EGU General Assembly 2022, Vienna, Austria, 23–27 May 2022, EGU22-10644, https://doi.org/10.5194/egusphere-egu22-10644, 2022.
Please decide on your access
Please use the buttons below to download the presentation materials or to visit the external website where the presentation is linked. Regarding the external link, please note that Copernicus Meetings cannot accept any liability for the content and the website you will visit.
Forward to presentation link
You are going to open an external link to the presentation as indicated by the authors. Copernicus Meetings cannot accept any liability for the content and the website you will visit.
We are sorry, but presentations are only available for users who registered for the conference. Thank you.
EGU22-10713 | Presentations | GI2.3 | Highlight
Decontamination and subsequent natural restoration processes impact on terrestrial systems in Niida River Catchment in FukushimaYuichi Onda, Feng Bin, Yoshifumi Wakiyama, Keisuke Taniguchi, Asahi Hashimoto, and Yupan Zhang
For the Fukushima region in Japan, the large-scale decontamination in the catchments needed to require more attention because of their possible consequence in altering particulate Cs-137 flux from the terrestrial environment to the ocean. Here, combining the high-resolution satellite dataset and concurrent river monitoring results, we quantitively assess the impacts of land cover changes in large-area decontaminated regions on river suspended sediment (SS) and particulate Cs-137 dynamics during 2013-2018. We find that the decontaminated regions’ erodibility dramatically enhanced during the decontamination stage but rapidly declined in the subsequent natural-restoration stage. River SS dynamics show linear response to these land cover changes, where annual SS load (normalized by water discharge) at the end of decontamination increased by over 300% than pre-decontamination and decreased about 48% at the beginning of natural restoration. Fluctuations in particulate Cs-137 concentrations well reflect the process of sediment source alternation due to land cover changes in decontaminated regions. The “Fukushima decontamination experiment” can reveal the dramatic impact of decontamination-natural restoration processes, which highlights the need for quantitatively assessing human impacts on land use and resultant alternation in sediment transfer patterns in large scale catchments.
How to cite: Onda, Y., Bin, F., Wakiyama, Y., Taniguchi, K., Hashimoto, A., and Zhang, Y.: Decontamination and subsequent natural restoration processes impact on terrestrial systems in Niida River Catchment in Fukushima, EGU General Assembly 2022, Vienna, Austria, 23–27 May 2022, EGU22-10713, https://doi.org/10.5194/egusphere-egu22-10713, 2022.
EGU22-10817 | Presentations | GI2.3
Effects of stemflow on radiocesium infiltration into the forest soilHiroaki Kato, Hikaru Iida, Tomoki Shinozuka, Yuma Niwano, and Yuichi Onda
Radiocesium deposited in the forest canopy is transferred to the forest floor by rainwater and litterfall. Among them, stemflow likely increases the radiocesium inventory by concentrating rainwater around the trunk. However, the effects of stemflow on the influx of radiocesium into forest soil have not been evaluated quantitatively. In this study, the fluxes of rainwater via stemflow, throughfall, and soil infiltration water were observed. The concentration of dissolved 137Cs was measured in a cedar forest in Fukushima Prefecture, Japan. Soil infiltration water was collected at 5 cm and 20 cm depths at the distant point from the tree trunk (Bt), and the base of the tree trunk (Rd), where the influence of stemflow was strong. The observations were conducted during the period from September 2019 to November 2021. During the observation period, an experiment was conducted to intercept the inflow of rainwater via the throughfall or stemflow, and the change in soil infiltration water was observed. The observation results showed that the infiltration flux of radiocesium into the forest soil was significantly higher at the Rd site and about three times larger than at the Bt site. Particularly at the 20 cm depth at the Rd site, the soil infiltration water flux increased with the stemflow. The stemflow exclusion resulted in the dcrease of radiocesium flux by about 70% at all depths at the Rd site. These results suggest that the stemflow increases the input of radiocesium to the base of the tree trunk and facilitates its transfer to the deeper soil layers.
How to cite: Kato, H., Iida, H., Shinozuka, T., Niwano, Y., and Onda, Y.: Effects of stemflow on radiocesium infiltration into the forest soil, EGU General Assembly 2022, Vienna, Austria, 23–27 May 2022, EGU22-10817, https://doi.org/10.5194/egusphere-egu22-10817, 2022.
Please decide on your access
Please use the buttons below to download the presentation materials or to visit the external website where the presentation is linked. Regarding the external link, please note that Copernicus Meetings cannot accept any liability for the content and the website you will visit.
Forward to presentation link
You are going to open an external link to the presentation as indicated by the authors. Copernicus Meetings cannot accept any liability for the content and the website you will visit.
We are sorry, but presentations are only available for users who registered for the conference. Thank you.
EGU22-11022 | Presentations | GI2.3
Estimation of 137Cs inventories in each ocean basin by a global ocean general circulation model for the global database interpolationDaisuke Tsumune, Frank Bryan, Keith Lindsay, Kazuhiro Misumi, Takaki Tsubono, and Michio Aoyama
Radioactive cesium (137Cs) is distributed in the global ocean due to global fallout by atmospheric nuclear weapons tests, releases from reprocessing plants in Europe, and supplied to the ocean by the Fukushima Daiichi Nuclear Power Plant (1F NPP) accident. In order to detect future contamination by radionuclides, it is necessary to understand the global distribution of radionuclides such as 137Cs. For this purpose, observed data have been summarized in a historical database (MARIS) by IAEA. The spatio-temporal density of the observations varies widely, therefore simulation by an ocean general circulation model (OGCM) can be helpful in the interpretation of these observations.
In order to clarify the behavior of 137Cs in the global ocean, OGSM simulations were conducted. Parallel Ocean Program version 2 (POP2) of the Community Earth System Model version 2 (CESM2) is employed. The horizontal resolution is 1.125 degree of longitude, and from 0.28 degree to 0.54 degree of latitude. There are 60 vertical levels with a minimum spacing of 10 m near the ocean surface, and increased spacing with depth to a maximum of 250 m. The simulated period was from 1945 to 2030 with the circulation forced by repeating (“Normal Year”) atmospheric conditions. As input sources of 137Cs to the model, global fallout from atmospheric nuclear tests, releases from reprocessing plants in Europe, and input from the 1F NPP accident were considered. It was assumed that the input conditions in 2020 would continue after 2020.
The simulated 137Cs activity agrees well with the observed data in the database, especially in the Atlantic and Pacific Oceans where the observation density is large. Since 137Cs undergoes radioactive decay with a half-life of 30 years, the inventory for each basin is the difference between the decay corrected cumulative input and flux. In the North Pacific, the inventory reached its maximum in 1966 due to the global fallout by atmospheric nuclear weapons tests. Fluxes from the North Pacific to the Indian Ocean, Arctic Ocean, and Central Pacific were positive, and the North Pacific was a source of supply for other ocean basins. The 1F NPP accident caused a 20% increase in the inventory in 2011. In the North Atlantic, the inventory reaches its maximum in the late 1970s, due to the releases from the reprocessing plant. The outflow flux from the North Atlantic to the Greenland Sea is larger than the other fluxes and is a source of supply to other ocean basins. After 2000, the inflow flux to the North Pacific from the Labrador Sea and the South Atlantic is larger than the outflow flux.
The time series of 137Cs inventory in each ocean basin and the fluxes among ocean basins were quantitatively analyzed by OGCM simulations, and the predictions for the next 10 years were made. The 137Cs activity concentrations by global fallout can be detected in the global ocean after 2030. The OGCM simulations will be useful in planning future observations to fill the gaps in the database.
How to cite: Tsumune, D., Bryan, F., Lindsay, K., Misumi, K., Tsubono, T., and Aoyama, M.: Estimation of 137Cs inventories in each ocean basin by a global ocean general circulation model for the global database interpolation, EGU General Assembly 2022, Vienna, Austria, 23–27 May 2022, EGU22-11022, https://doi.org/10.5194/egusphere-egu22-11022, 2022.
Please decide on your access
Please use the buttons below to download the presentation materials or to visit the external website where the presentation is linked. Regarding the external link, please note that Copernicus Meetings cannot accept any liability for the content and the website you will visit.
Forward to presentation link
You are going to open an external link to the presentation as indicated by the authors. Copernicus Meetings cannot accept any liability for the content and the website you will visit.
We are sorry, but presentations are only available for users who registered for the conference. Thank you.
EGU22-11502 | Presentations | GI2.3
Retrospective assessment of 14C aquatic and atmospheric releases from Ignalina Nuclear Power Plant due to exploitation of two RBMK-1500 type reactorsEvaldas Maceika, Rūta Barisevičiūtė, Laurynas Juodis, Algirdas Pabedinskas, Žilvinas Ežerinskis, Justina Šapolaitė, Laurynas Butkus, and Vidmantas Remeikis
Considerable amounts of 14C in the nuclear reactor are generated by neutrons. It accumulates in reactor components, coolant, and cleaning systems, and partly is released into the environment as gaseous releases and as liquid effluents. Two RBMK-1500 type reactors were exploited at Ignalina NPP (Lithuania) 1983-2009. Releases from NPP radiocarbon accumulated in local biosphere by photosynthesis, including terrestrial and aquatic media, as INPP used Lake Drūkšiai as a cooling pond
Temporal variation of 14C in lake ecosystem was examined by analyzing measured radiocarbon concentration of the organic compounds (Alkali soluble-AS) and alkali insoluble-AIS) derived from the layers of the Drūkšiai lake bottom sediments. The lake sediment cores were sampled in 2013 and 2019, sliced to 1 cm layers and 14C concentration was measured of every layer. AS and AIS organic fractions of sediment samples were extracted by using the acid-base-acid method.
Tree ring cores were collected from Pinus Sylvestris pines around the Ignalina NPP site at different directions and distances. Cellulose extraction was performed with BABAB (base-acid-base-acid-bleach) procedure, and all samples were graphitized and measured by a single state accelerator mass spectrometry at Vilnius Radiocarbon facility. Tree rings 14C concentration analysis provides atmospheric radiocarbon concentration in locations around the nuclear object. This analysis provides an opportunity to evaluate the impact of a nuclear object on water and terrestrial ecosystems.
The results showed a pronounced increase of 14C above background up to 17.8 pMC in the tree rings during INPP exploitation as well during decommission (since 2010) periods. According to the recorded data in 2004-2017 of the local Ignalina NPP meteorological station, the prevailing wind direction was towards the North and East during warm and light time periods. The radiocarbon released from the INPP stack dilutes when it travels in a downwind direction from the INPP. However, even 6.6 km away from the INPP, the impact of the power plant is still clearly visible. By using our created Gaussian dispersion model, the estimated annual emissions of 14C activity from the Ignalina NPP to the air vary from year to year. When only the 1st INPP reactor Unit was operating in 1985-1987, average emissions were 1.2 TBq/year. Emissions almost doubled to 2.1 TBq/year in 1988, when the 2nd Unit became operational. Later, emission levels increased. It could be explained by the large amount of 14C accumulating in the graphite of the RBMK reactor and its gradual release.
14C concentration profile analysis of the lake bottom sediments core revealed a significant impact of the Ignalina NPP on the Drūkšiai lake ecosystem. An increase of 14C concentration in the layers of bottom sediments by 80 pMC in the AS fraction and only by 9 pMC in the AIS fraction was observed, corresponding to the period about years of 1998-2003. The maximum peak in AS of 189 pMC was reached approximately in 2001, followed by gradual lake recovery. This radiocarbon peak in the lake represents a large single one-time pollution release. The critical period was in 2000s when maintenance works of the reactors were performed.
How to cite: Maceika, E., Barisevičiūtė, R., Juodis, L., Pabedinskas, A., Ežerinskis, Ž., Šapolaitė, J., Butkus, L., and Remeikis, V.: Retrospective assessment of 14C aquatic and atmospheric releases from Ignalina Nuclear Power Plant due to exploitation of two RBMK-1500 type reactors, EGU General Assembly 2022, Vienna, Austria, 23–27 May 2022, EGU22-11502, https://doi.org/10.5194/egusphere-egu22-11502, 2022.
EGU22-11571 | Presentations | GI2.3
Mapping of Post-Disaster Environments using 3D Backprojection and Iterative Inversion Methods Optimised for Limited-Pixel Gamma Spectrometers on Unoccupied Aerial Systems (UAS).Dean Connor, David Megson-Smith, Kieran Wood, Robbie Mackenzie, Euan Connolly, Sam White, Freddie Russell-Pavier, Matthew Ryan-Tucker, Peter Martin, Yannick Verbelen, Thomas Richardson, Nick Smith, and Thomas Scott
All radiological measurements acquired from airborne detectors suffer from the issues of geometrical signal dilution, signal attenuation and a complex interaction of the effective sampling area of the detector system with the 3D structure of the surrounding environment. Understanding and accounting for these variables is essential in recovering accurate dose rate maps that can help protect responding workforces in radiologically contaminated environments.
Two types of terrain-cognisant methods of improving source localisation and the contrast of airborne radiation maps are presented in this work, comprising of ‘Point Cloud Constrained 3D Backprojection’ and ‘Point Cloud Constrained Randomised Kaczmarz Inversion’. Each algorithm uses a combination of airborne gamma-spectrometry and 3D scene information collected by UAS platforms and have been applied to data collected with lightweight, simple (non-imaging) detector payloads at numerous locations across the Chornobyl Exclusion Zone (CEZ).
Common to both the algorithms is the projection of the photopeak intensity onto a point cloud representation of the environment, taking into account the position and orientation of the UAS in addition to the 3D response of the spectrometer. The 3D Backprojection method can be considered a relatively fast method of mapping of through proximity, in which the measured photopeak intensity is split over the point cloud according to the above factors. It is an additive technique, with each measurement increasing the overall magnitude of the radiation field assigned to the survey area, meaning that more measurements continues to increase the total radiation of the site. The total measured intensity of the solution is then normalised according to the time spent in proximity to each point in the scene, determined by splitting and projecting the nominal measurement time at each survey point over the point cloud according to the distance from the survey position. Thus accounting for sampling biases during the survey.
The inversion approach adapts algorithms routinely used in medical imaging for the unconstrained world in which the detector is no longer completely surrounding the subject/target. A forward projection model, based on the contribution of distant point sources to the detector intensity, is used to determine the relationship between the full set of measurements and the 3D scene. This results in a hypercube of linear equations where it is assumed every point in the scene contributes to the measured intensity. The algorithm randomly adds measurements from within the aerial set and back-projects this onto the point cloud, with the initial state of the solution set to emit no radiation. After a given number of iterations, the fit of the current solution to the original measurements is assessed though a least squares method and updated when this produces a fit better than the current best estimate. This continues to happen until a minimum value is reached before the divergence of the system, representing the most confident solution. Based on examples from both simulations and real world data, the improvement in contrast of airborne maps using this inversion method can make them equivalent to ground-based surveys, even when operating at 20 m AGL and above.
How to cite: Connor, D., Megson-Smith, D., Wood, K., Mackenzie, R., Connolly, E., White, S., Russell-Pavier, F., Ryan-Tucker, M., Martin, P., Verbelen, Y., Richardson, T., Smith, N., and Scott, T.: Mapping of Post-Disaster Environments using 3D Backprojection and Iterative Inversion Methods Optimised for Limited-Pixel Gamma Spectrometers on Unoccupied Aerial Systems (UAS)., EGU General Assembly 2022, Vienna, Austria, 23–27 May 2022, EGU22-11571, https://doi.org/10.5194/egusphere-egu22-11571, 2022.
Please decide on your access
Please use the buttons below to download the presentation materials or to visit the external website where the presentation is linked. Regarding the external link, please note that Copernicus Meetings cannot accept any liability for the content and the website you will visit.
Forward to presentation link
You are going to open an external link to the presentation as indicated by the authors. Copernicus Meetings cannot accept any liability for the content and the website you will visit.
We are sorry, but presentations are only available for users who registered for the conference. Thank you.
EGU22-11620 | Presentations | GI2.3
Methodology for estimating the emission of radionuclides into the atmosphere from wildfires in the Chernobyl Exclusion ZoneValentyn Protsak, Gennady Laptev, Oleg Voitsekhovych, Taras Hinchuk, and Kyrylo Korychenskyi
Most of the territory of the Chernobyl Exclusion Zone (CEZ) is covered by forest. Forest of CEZ have accumulated a significant part of the radioactive release and for many years have served as a barrier to the non spreading of the radionuclide contamination outside the CEZ.
According to the classification of wildfire danger, the forests of CEZ belong to high, above average and medium classes, making cases of wildfires as quite common.
Poor, sod-podzolic soils of Ukrainian Polesye contribute to the entry the activity of 90Sr and 137Cs in plant biomass. During wildfires some of the radionuclides contained in combustion products of biomass are emitted into the atmosphere. Biologically important radionuclides such as 90Sr, 137Cs, plutonium isotopes and 241Am bound to fine aerosols - combustion products - can be transported with atmospheric flows over the long range, causing secondary radioactive fallout and forming additional inhalation dose loads on the population.
Lack of the actual information on the source term (rate of emission of radionuclides) does not allow reliable modeling of the radiological impact of wildfires. To address this issue, we have proposed a methodology that allows for operational assessments of the dynamics of radionuclide emissions into the atmosphere from wildfires in the CEZ.
The basic parameters for the calculations are
- cartographic data on the density of radionuclide contamination of the territory of the CEZ;
- classification of the territory of the CEZ according to the distributive features of forests and meadows;
- classification of CEZ forests according to taxa characteristics to estimate amount of stored fuel biomass (kg/m2);
- experimental data on the transfer of radionuclides from soil to the main components of biomass for the calculation of radionuclide inventory in fuel biomass (Bq/m2). Thus, for meadows the main fuel component is grass turf, while for forest these are litter, wood, bark and pine needles.
- experimental data on emission factors of radionuclides from fuel biomass.
Implementation of the proposed algorithm in the form of GIS application makes it possible to assess the dynamics of radionuclide emission into the atmosphere by delineation the fire areas on the CEZ map. The NASA WorldView interactive mapping web application can be used to estimate the temporal and spatial characteristics of the wildfire while it is being developed. The contouring of the area affected by fire is carried out according to the analysis of the cluster of thermal points. Also, operational contouring of wildfire can be carried out using data delivered from unmanned aerial vehicles.
The application of the proposed algorithm for the analysis of the dynamics of 137Cs emissions into the atmosphere from the April 2020 wildfire showed a good agreement with the data reported by various authors who used the method of inverse simulation. Improving the accuracy of calculations according to the proposed algorithm can be done by rectifying radionuclide emission factors and taking into account fire intensity data, which in turn can affect both the radionuclide emission factor and the degree of burnout of plant biomass.
How to cite: Protsak, V., Laptev, G., Voitsekhovych, O., Hinchuk, T., and Korychenskyi, K.: Methodology for estimating the emission of radionuclides into the atmosphere from wildfires in the Chernobyl Exclusion Zone, EGU General Assembly 2022, Vienna, Austria, 23–27 May 2022, EGU22-11620, https://doi.org/10.5194/egusphere-egu22-11620, 2022.
Please decide on your access
Please use the buttons below to download the presentation materials or to visit the external website where the presentation is linked. Regarding the external link, please note that Copernicus Meetings cannot accept any liability for the content and the website you will visit.
Forward to presentation link
You are going to open an external link to the presentation as indicated by the authors. Copernicus Meetings cannot accept any liability for the content and the website you will visit.
We are sorry, but presentations are only available for users who registered for the conference. Thank you.
EGU22-11669 | Presentations | GI2.3
In-situ measurements of natural radioactivity levels in the gold mine tailings dams of the West Rand District, South Africa.Paballo Moshupya, Tamiru Abiye, and Ian Korir
Human activities such as mining and processing of naturally occurring radioactive materials have a potential to result in enhanced radioactivity levels in the environment. In South Africa, there has been extensive mining of gold and uranium which produced large mine tailings dams that are highly concentrated with radioactive elements. The purpose of this study was to carry out a preliminary survey on a large scale to assess the activity concentrations of 238U, 232Th and 40K in mine tailings, soils and outcropping rocks in the West Rand District in South Africa. This was done to better understand the impact of the abandoned mine tailings on the surrounding soil. This study employed in-situ gamma spectrometry technique to measure the activity concentrations of 238U, 232Th and 40K. The portable BGO SUPER-SPEC (RS-230) spectrometer, with a 6.3 cubic inches Bismuth Germanate Oxide (BGO) detector was used for in-situ measurements. In mine tailings the activity concentrations for 238U, 232Th and 40K were found to range from 209.95 to 2578.68 Bq/kg, 19.49 to 108.00 Bq/kg and 31.30 to 626.00 Bq/kg, respectively. In surface soil, the activity concentration of 238U for all measurements ranged between 12.35 and 941.07 Bq/kg, with an average value of 59.15 Bq/kg. 232Th levels ranged between 12.59 and 78.36 Bq/kg, with an average of 34.91 Bq/kg. For 40K the average activity concentration was found to be 245.64 Bq/kg, in a range of 31.30 - 1345.90 Bq/kg. For the rock samples analyzed, average activity concentrations were 32.97 Bq/kg, 32.26 Bq/kg and 351.52 Bg/kg for 238U, 232Th and 40K, respectively. The results indicate that higher radioactivity levels are found in mine tailings than in rocks and soils. 238U was found to contribute significantly to the overall activity concentration in tailings dams as compared to 232Th and 40K. It has been observed that the mine tailings have a potential to impact on the activity concentration of 238U in soil in the immediate vicinity. However, on a regional scale it was found that the radioactivity levels in surface soil mainly depend on the radioelement concentration of the underlying rocks. The contamination is only confined to areas where mine tailings materials are washed off and deposited on surface soils in close proximity to tailings sources. This serves as an indication that the migration of uranium from tailings dams is localized and occurs within short distances. It is recommended that further radiological monitoring be conducted in areas found to have elevated concentration of uranium-238.
Keywords-In-situ gamma-ray spectrometry, Mine tailings, Radioactivity, Soil.
How to cite: Moshupya, P., Abiye, T., and Korir, I.: In-situ measurements of natural radioactivity levels in the gold mine tailings dams of the West Rand District, South Africa., EGU General Assembly 2022, Vienna, Austria, 23–27 May 2022, EGU22-11669, https://doi.org/10.5194/egusphere-egu22-11669, 2022.
EGU22-1294 | Presentations | CR2.8
What determines the location of Antarctic blue ice areas? A deep learning approachVeronica Tollenaar, Harry Zekollari, Devis Tuia, Benjamin Kellenberger, Marc Rußwurm, Stef Lhermitte, and Frank Pattyn
The vast majority of the Antarctic ice sheet is covered with snow that compacts under its own weight and transforms into ice below the surface. However, in some areas, this typically blue-colored ice is directly exposed at the surface. These so-called "blue ice areas" represent islands of negative surface mass balance through sublimation and/or melt. Moreover, blue ice areas expose old ice that is easily accessible in large quantities at the surface, and some areas contain ice that extends beyond the time scales of classic deep-drilling ice cores.
Observation and modeling efforts suggest that the location of blue ice areas is related to a specific combination of topographic and meteorological factors. In the literature, these factors are described as (i) enhanced katabatic winds that erode snow, due to an increase of the surface slope or a tunneling effect of topography, (ii) the increased albedo of blue ice (with respect to snow), which enhances ablative processes, and (iii) the presence of nunataks (mountains protruding the ice) that act as barriers to the ice flow upstream, and prevent deposition of blowing snow on the lee side of the mountain. However, it remains largely unknown which role the physical processes play in creating and/or maintaining blue ice at the surface of the ice sheet.
Here, we study how a combination of environmental and topographic factors lead to the observation of blue ice. We also quantify the relevance of the single processes and build an interpretable model aiming at not only predicting blue ice presence, but also explaining why it is there. To do so, data is fed into a convolutional neural network, a machine learning algorithm which uses the spatial context of the data to generate a prediction on the presence of blue ice areas. More specifically, we use a U-Net architecture that through convolutions and linked up-convolutions allows to obtain a semantic segmentation (i.e., a pixel-level map) of the input data. Ground reference data is obtained from existing products of blue ice area outlines that are based on multispectral observations. These products contain considerable uncertainties, as (i) the horizontal change from snow to ice is gradual and a single threshold in this transition is not applicable uniformly over the continent, and (ii) the blue ice area extent is known to vary seasonally. Therefore, we train our deep learning model with a loss function with increasing weight towards the center of blue ice areas.
Our first results indicate that the neural network predicts the location of blue ice relatively well, and that surface elevation data plays an important role in determining the location of blue ice. In our ongoing work, we analyze both the predictions and the neural network itself to quantify which factors posses predictive capacity to explain the location of blue ice. Eventually this information may allow us to answer the simple yet important question of why blue ice areas are located where they are, with potentially important implications for their role as paleoclimate archives and for their evolution under changing climatic conditions.
How to cite: Tollenaar, V., Zekollari, H., Tuia, D., Kellenberger, B., Rußwurm, M., Lhermitte, S., and Pattyn, F.: What determines the location of Antarctic blue ice areas? A deep learning approach, EGU General Assembly 2022, Vienna, Austria, 23–27 May 2022, EGU22-1294, https://doi.org/10.5194/egusphere-egu22-1294, 2022.
Please decide on your access
Please use the buttons below to download the presentation materials or to visit the external website where the presentation is linked. Regarding the external link, please note that Copernicus Meetings cannot accept any liability for the content and the website you will visit.
Forward to presentation link
You are going to open an external link to the presentation as indicated by the authors. Copernicus Meetings cannot accept any liability for the content and the website you will visit.
We are sorry, but presentations are only available for users who registered for the conference. Thank you.
EGU22-2726 | Presentations | CR2.8 | Highlight
Dissecting Glaciers - Can an Automated Bio-Medical Image Segmentation Tool also Segment Glaciers?Nora Gourmelon, Thorsten Seehaus, Matthias Braun, Andreas Maier, and Vincent Christlein
The temporal variability of glacier calving front positions provides essential information about the state of marine-terminating glaciers. These positions can be extracted from Synthetic Aperture Radar (SAR) images throughout the year. To automate this extraction, we apply deep learning techniques that segment the SAR images into different classes: glacier; ocean including ice-melange and sea-ice covered ocean; rock outcrop; and regions with no information like areas outside the SAR swath, layover regions and SAR shadow. The calving front position can be derived from these regions during post-processing.
A downside of deep learning is that hyper-parameters need to be tuned manually. For this tuning, expert knowledge and experience in deep learning are required. Furthermore, the fine-tuning process takes up much time, and the researcher needs to have programming skills.
In the biomedical imaging domain, a deep learning framework [1] has become increasingly popular for image segmentation. The nnU-Net can be used out-of-the-box. It automatically adapts the U-Net, the state-of-the-art architecture for image segmentation, to different datasets and segmentation tasks. Hence, no more manual tuning is required. The framework outperforms specialized deep learning pipelines in a multitude of public biomedical segmentation competitions.
We apply the nnU-Net to the task of glacier segmentation, investigating whether the framework is also beneficial in the domain of remote sensing. Therefore, we train and test the nnU-Net on CaFFe (https://github.com/Nora-Go/CaFFe), a benchmark dataset for automatic calving front detection on SAR images. CaFFe comprises geocoded, orthorectified imagery acquired by the satellite missions RADARSAT-1, ERS-1/2, ALOS PALSAR, TerraSAR-X, TanDEM-X, Envisat, and Sentinel-1, covering the period 1995 - 2020. The ground range resolution varies between 7 and 20 m2. The nnU-Net learns from the multi-class "zones" labels provided with the dataset. We adopt the post-processing scheme from Gourmelon et al. [2] to extract the front from the segmented landscape regions. The test set includes images from the Mapple Glacier located on the Antarctic Peninsula and the Columbia Glacier in Alaska. The nnU-Net's calving front predictions for the Mapple Glacier lie close to the ground truth with just 125 m mean distance error. As the Columbia Glacier shows several calving front sections, its segmentation is more difficult than that of the laterally constrained Mapple Glacier. This complexity of the calving fronts is also reflected in the results: Predictions for the Columbia Glacier show a mean distance error of 635 m. Concludingly, the results demonstrate that the nnU-Net holds considerable potential for the remote sensing domain, especially for glacier segmentation.
[1] Isensee, F., Jaeger, P.F., Kohl, S.A.A. et al. nnU-Net: a self-configuring method for deep learning-based biomedical image segmentation. Nat Methods 18, 203–211 (2021). https://doi.org/10.1038/s41592-020-01008-z
[2] Gourmelon, N., Seehaus, T., Braun, M., Maier, A., Christlein, V.: Calving Fronts and Where to Find Them: A Benchmark Dataset and Methodology for Automatic Glacier Calving Front Extraction from SAR Imagery, In Prep.
How to cite: Gourmelon, N., Seehaus, T., Braun, M., Maier, A., and Christlein, V.: Dissecting Glaciers - Can an Automated Bio-Medical Image Segmentation Tool also Segment Glaciers?, EGU General Assembly 2022, Vienna, Austria, 23–27 May 2022, EGU22-2726, https://doi.org/10.5194/egusphere-egu22-2726, 2022.
Please decide on your access
Please use the buttons below to download the presentation materials or to visit the external website where the presentation is linked. Regarding the external link, please note that Copernicus Meetings cannot accept any liability for the content and the website you will visit.
Forward to presentation link
You are going to open an external link to the presentation as indicated by the authors. Copernicus Meetings cannot accept any liability for the content and the website you will visit.
We are sorry, but presentations are only available for users who registered for the conference. Thank you.
EGU22-2904 | Presentations | CR2.8
Automated mapping of Eastern Himalayan glacial lakes using deep learning and multisource remote sensing dataSaurabh Kaushik, Tejpal Singh, Pawan Kumar Joshi, and Andreas J Dietz
The Himalayan glacierized region has experienced a substantial rise in number and area of glacial lakes in the past two decades. These glacial lakes directly influence glacier melt, velocity, geometry, and thus overall response of the glacier to climate change. The sudden release of water from these glacial lakes poses a severe threat to downstream communities and infrastructure. Thereby, regular monitoring and modelling of these lakes bear significance in order to understand regional climate change, and mitigating the anticipated impact of glacial lake outburst flood. Here, we proposed an automated scheme for Himalayan glacial lake extent mapping using multisource remote sensing data and a state-of-the-art deep learning technique. A combination of multisource remote sensing data [Synthetic Aperture Radar (SAR) coherence, thermal, visible, near-infrared, shortwave infrared, Advanced Land Observing Satellite (ALOS) DEM, surface slope and Normalised Difference Water Index (NDWI)] is used as input to a fully connected feed-forward Convolutional Neural Network (CNN). The CNN is trained on 660 images (300×300×10) collected from 11 sites spread across Himalaya. The CNN architecture is designed for choosing optimum size, number of hidden layers, convolutional layers, filters, and other hypermeters using hit and trial method. The model performance is evaluated over 3 different sites of Eastern Himalaya, representing heterogenous landscapes. The novelty of the presented automated scheme lies in its spatio-temporal transferability over the large geographical region (~8477, 10336 and 6013 km2). The future work involves Intra-annual lake extent mapping across High-Mountain Asian region in an automated fashion.
Keywords: Glacial Lake, convolutional neural network, semantic segmentation, remote sensing, Himalaya, SAR and climate change
How to cite: Kaushik, S., Singh, T., Joshi, P. K., and Dietz, A. J.: Automated mapping of Eastern Himalayan glacial lakes using deep learning and multisource remote sensing data, EGU General Assembly 2022, Vienna, Austria, 23–27 May 2022, EGU22-2904, https://doi.org/10.5194/egusphere-egu22-2904, 2022.
EGU22-3446 | Presentations | CR2.8
The AI-CORE Project - Artificial Intelligence for Cold RegionsAndreas Dietz and Celia Baumhoer and the AI-CORE Team
Artificial Intelligence for Cold Regions (AI-CORE) is a collaborative approach for applying Artificial Intelligence (AI) methods in the field of remote sensing of the cryosphere. Several research institutes (German Aerospace Center, Alfred-Wegener-Institute, Technical University Dresden) bundled their expertise to jointly develop AI-based solutions for pressing geoscientific questions in cryosphere research. The project addresses four geoscientific use cases such as the change pattern identification of outlet glaciers in Greenland, the object identification in permafrost areas, the detection of calving fronts in Antarctica and the firn-line detection on glaciers. Within this presentation, the four AI-based final approaches for each addressed use case will be presented and exemplary results will be shown. Further on, the implementation of all developed AI-methods in three different computer centers was realized and the lessons learned from implementing several ready-to-use AI-tools in different processing infrastructures will be discussed. Finally, a best-practice example for sharing AI-implementations between different institutes is provided along with opportunities and challenges faced during the present project duration.
How to cite: Dietz, A. and Baumhoer, C. and the AI-CORE Team: The AI-CORE Project - Artificial Intelligence for Cold Regions, EGU General Assembly 2022, Vienna, Austria, 23–27 May 2022, EGU22-3446, https://doi.org/10.5194/egusphere-egu22-3446, 2022.
EGU22-3701 | Presentations | CR2.8 | Highlight
Snow accumulation over the world's glaciers (1981-2021) inferred from climate reanalyses and machine learningMatteo Guidicelli, Marco Gabella, Matthias Huss, and Nadine Salzmann
The scarcity and limited accuracy of snow and precipitation observation and estimation in high-mountain regions reduce our understanding of climatic-cryospheric processes. Thus, we compared the snow water equivalent (SWE) from winter mass balance observations of 95 glaciers distributed over the Alps, Canada, Central Asia and Scandinavia, with the cumulative gridded precipitation data from the ERA-5 and the MERRA-2 reanalysis products. We propose a machine learning model to downscale the gridded precipitation from the reanalyses to the altitude of the glaciers. The machine learning model is a gradient boosting regressor (GBR), which combines several meteorological variables from the reanalyses (air temperature and relative humidity are also downscaled to the altitude of the glaciers) and topographical parameters. Among the most important variables selected by the GBR model, are the downscaled relative humidity and the downscaled air temperature. These GBR-derived estimates are evaluated against the winter mass balance observations by means of a leave-one-glacier-out cross-validation (site-independent GBR) and a leave-one-season-out cross-validation (season-independent GBR). The estimates downscaled by the GBR show lower biases and higher correlations with the winter mass balance observations than downscaled estimates derived with a lapse-rate-based approach. Finally, the GBR estimates are used to derive SWE trends between 1981 and 2021 at high-altitudes. The trends obtained from the GBRs are more enhanced than those obtained from the gridded precipitation of the reanalyses. When the data is regrouped regionwide, significant trends are only observed for the Alps (positive) and for Scandinavia (negative), while significant positive or negative trends are observed in all the regions when looking locally at single glaciers and specific elevations. Positive (negative) SWE trends are typically observed at higher (lower) elevations, where the impact of rising temperatures is less (more) dominating.
How to cite: Guidicelli, M., Gabella, M., Huss, M., and Salzmann, N.: Snow accumulation over the world's glaciers (1981-2021) inferred from climate reanalyses and machine learning, EGU General Assembly 2022, Vienna, Austria, 23–27 May 2022, EGU22-3701, https://doi.org/10.5194/egusphere-egu22-3701, 2022.
Please decide on your access
Please use the buttons below to download the presentation materials or to visit the external website where the presentation is linked. Regarding the external link, please note that Copernicus Meetings cannot accept any liability for the content and the website you will visit.
Forward to presentation link
You are going to open an external link to the presentation as indicated by the authors. Copernicus Meetings cannot accept any liability for the content and the website you will visit.
We are sorry, but presentations are only available for users who registered for the conference. Thank you.

EGU22-5317 | Presentations | CR2.8
Point Mass Balance Regression using Deep Neural Networks: A Transfer Learning ApproachRitu Anilkumar, Rishikesh Bharti, and Dibyajyoti Chutia
The last few years have seen an increasing number of studies modeling glacier evolution using deep learning. Most of these techniques have focussed on artificial neural networks (ANN) that are capable of providing a regressed value of mass balance using topographic and meteorological input features. The large number of parameters in an ANN demands a large dataset for training the parameter values. This is relatively difficult to achieve for regions with a sparse in-situ data measurement set up such as the Himalayas. For example, of the 14326 point mass balance measurements obtained from the Fluctuations of Glaciers database for the period of 1950-2020 for glaciers between 60S and 60N, a mere 362 points over four glaciers exist for the Himalayan region. These are insufficient to train complex neural network architectures over the region. We attempt to overcome this data hurdle by using transfer learning. Here, the parameters are first trained over the 9584 points in the Alps following which the weights were used for retraining for the Himalayan data points. Fourteen meteorological from the ERA5Land monthly averaged reanalysis data were used as input features for the study. A 70-30 split of the training and testing set was maintained to ensure the authenticity of the accuracy estimates via independent testing. Estimates are assessed on a glacier scale in the temporal domain to assess the feasibility of using deep learning to fill temporal gaps in data. Our method is also compared with other machine learning algorithms such as random forest-based regression and support vector-based regression and we observe that the complexity of the dataset is better represented by the neural network architecture. With an overall normalized root mean squared loss consistently less than 0.09, our results suggest the capability of deep learning to fill the temporal data gaps over the glaciers and potentially reduce the spatial gap on a regional scale.
How to cite: Anilkumar, R., Bharti, R., and Chutia, D.: Point Mass Balance Regression using Deep Neural Networks: A Transfer Learning Approach, EGU General Assembly 2022, Vienna, Austria, 23–27 May 2022, EGU22-5317, https://doi.org/10.5194/egusphere-egu22-5317, 2022.
Please decide on your access
Please use the buttons below to download the presentation materials or to visit the external website where the presentation is linked. Regarding the external link, please note that Copernicus Meetings cannot accept any liability for the content and the website you will visit.
Forward to presentation link
You are going to open an external link to the presentation as indicated by the authors. Copernicus Meetings cannot accept any liability for the content and the website you will visit.
We are sorry, but presentations are only available for users who registered for the conference. Thank you.
EGU22-5612 | Presentations | CR2.8
Retrieving freeze/thaw-cycles using Machine Learning approach in Nunavik (Québec, Canada)Yueli Chen, Lingxiao Wang, Monique Bernier, and Ralf Ludwig
In the terrestrial cryosphere, freeze/thaw (FT) state transition plays an important and measurable role for climatic, hydrological, ecological, and biogeochemical processes in permafrost landscapes.
Satellite active and passive microwave remote sensing has shown its principal capacity to provide effective monitoring of landscape FT dynamics. Many algorithms have been developed and evaluated over time in this scope. With the advancement of data science and artificial intelligence methods, the potential of better understanding the cryosphere is emerging.
This work is dedicated to exploring an effective approach to retrieve FT state based on microwave remote sensing data using machine learning methods, which is expected to fill in some hidden blind spots in the deterministic algorithms. Time series of remote sensing data will be created as training data. In the initial stage, the work aims to test the feasibility and establish the basic neural network based on fewer training factors. In the advanced stage, we will improve the model in terms of structure, such as adding more complex dense layers and testing optimizers, and in terms of discipline, such as introducing more influencing factors for training. Related parameters, for example, land cover types, will be included in the analysis to improve the method and understanding of FT-related processes.
How to cite: Chen, Y., Wang, L., Bernier, M., and Ludwig, R.: Retrieving freeze/thaw-cycles using Machine Learning approach in Nunavik (Québec, Canada), EGU General Assembly 2022, Vienna, Austria, 23–27 May 2022, EGU22-5612, https://doi.org/10.5194/egusphere-egu22-5612, 2022.
EGU22-5910 | Presentations | CR2.8
Learning and screening of neural networks architectures for sub-grid-scale parametrizations of sea-ice dynamics from idealised twin experimentsTobias Finn, Charlotte Durand, Alban Farchi, Marc Bocquet, Yumeng Chen, Alberto Carrassi, and Veronique Dansereau
In this talk, we propose to use neural networks in a hybrid modelling setup to learn sub-grid-scale dynamics of sea-ice that cannot be resolved by geophysical models. The multifractal and stochastic nature of the sea-ice dynamics create significant obstacles to represent such dynamics with neural networks. Here, we will introduce and screen specific neural network architectures that might be suited for this kind of task. To prove our concept, we perform idealised twin experiments in a simplified Maxwell-Elasto-Brittle sea-ice model which includes only sea-ice dynamics within a channel-like setup. In our experiments, we use high-resolution runs as proxy for the reality, and we train neural networks to correct errors of low-resolution forecast runs.
Since we perform the two kind of runs on different grids, we need to define a projection operator from high- to low-resolution. In practice, we compare the low-resolution forecasted state at a given time to the projected state of the high resolution run at the same time. Using a catalogue of these forecasted and projected states, we will learn and screen different neural network architectures with supervised training in an offline learning setting. Together with this simplified training, the screening helps us to select appropriate architectures for the representation of multifractality and stochasticity within the sea-ice dynamics. As a next step, these screened architectures have to be scaled to larger and more complex sea-ice models like neXtSIM.
How to cite: Finn, T., Durand, C., Farchi, A., Bocquet, M., Chen, Y., Carrassi, A., and Dansereau, V.: Learning and screening of neural networks architectures for sub-grid-scale parametrizations of sea-ice dynamics from idealised twin experiments, EGU General Assembly 2022, Vienna, Austria, 23–27 May 2022, EGU22-5910, https://doi.org/10.5194/egusphere-egu22-5910, 2022.
Please decide on your access
Please use the buttons below to download the presentation materials or to visit the external website where the presentation is linked. Regarding the external link, please note that Copernicus Meetings cannot accept any liability for the content and the website you will visit.
Forward to presentation link
You are going to open an external link to the presentation as indicated by the authors. Copernicus Meetings cannot accept any liability for the content and the website you will visit.
We are sorry, but presentations are only available for users who registered for the conference. Thank you.

EGU22-6948 | Presentations | CR2.8
Mapping Glacier Basal Sliding with Beamforming and Artificial IntelligenceJosefine Umlauft, Philippe Roux, Albanne Lecointre, Florent Gimbert, Ugo Nanni, Andrea Walpersdorf, Bertrand Rouet-LeDuc, Claudia Hulbert, Daniel Trugman, and Paul Johnson
The cryosphere is a highly active and dynamic environment that rapidly responds to changing climatic conditions. In particular, the physical processes behind glacial dynamics are poorly understood because they remain challenging to observe. Glacial dynamics are strongly intermittent in time and heterogeneous in space. Thus, monitoring with high spatio-temporal resolution is essential.
In course of the RESOLVE (‘High-resolution imaging in subsurface geophysics : development of a multi-instrument platform for interdisciplinary research’) project, continuous seismic observations were obtained using a dense seismic network (100 nodes, Ø 700 m) installed on Glacier d’Argentière (French Alpes) during May in 2018. This unique data set offers the chance to study targeted processes and dynamics within the cryosphere on a local scale in detail.
To identify seismic signatures of ice beds in the presence of melt-induced microseismic noise, we applied the supervised ML technique gradient tree boosting. The approach has been proven suitable to directly observe the physical state of a tectonic fault. Transferred to glacial settings, seismic surface records could therefore reveal frictional properties of the ice bed, offering completely new means to study the subglacial environment and basal sliding, which is difficult to access with conventional approaches.
We built our ML model as follows: Statistical properties of the continuous seismic records (variance, kurtosis and quantile ranges), meteorological data and a seismic source catalogue obtained using beamforming (matched field processing) serve as features which we fit to measures of the GPS displacement rate of Glacier d’Argentière (labels). Our preliminary results suggest that seismic source activity at the bottom of the glacier strongly correlates with surface displacement rates and hence, is directly linked to basal motion. By ranking the importance of our input features, we have learned that other than for reasonably long monitoring time series along tectonic faults, statistical properties of seismic observations only do not suffice in glacial environments to estimate surface displacement. Additional beamforming features however, are a rich archive that enhance the ML model performance considerably and allow to directly observe ice dynamics.
How to cite: Umlauft, J., Roux, P., Lecointre, A., Gimbert, F., Nanni, U., Walpersdorf, A., Rouet-LeDuc, B., Hulbert, C., Trugman, D., and Johnson, P.: Mapping Glacier Basal Sliding with Beamforming and Artificial Intelligence, EGU General Assembly 2022, Vienna, Austria, 23–27 May 2022, EGU22-6948, https://doi.org/10.5194/egusphere-egu22-6948, 2022.
Please decide on your access
Please use the buttons below to download the presentation materials or to visit the external website where the presentation is linked. Regarding the external link, please note that Copernicus Meetings cannot accept any liability for the content and the website you will visit.
Forward to presentation link
You are going to open an external link to the presentation as indicated by the authors. Copernicus Meetings cannot accept any liability for the content and the website you will visit.
We are sorry, but presentations are only available for users who registered for the conference. Thank you.
EGU22-8945 | Presentations | CR2.8
Ice Lead Network AnalysisJulia Kaltenborn, Venkatesh Ramesh, and Thomas Wright
Ice lead analysis is an essential task for evaluating climate change processes in the Arctic. Ice leads are narrow cracks in the sea-ice, which build a complex network. While detecting and modeling ice leads has been performed in numerous ways based on airborne images, the dynamics of ice leads over time remain hidden and largely unexplored. These dynamics could be analyzed by interpreting the ice leads as more than just airborne images, but as what they really are: a dynamic network. The lead’s start, end, and intersection points can be considered nodes, and the leads themselves as edges of a network. As the nodes and edges change over time, the ice lead network is constantly evolving. This new network perspective on ice leads could be of great interest for the cryospheric science community since it opens the door to new methods. For example, adapting common link prediction methods might make data-driven ice lead forecasting and tracking feasible.
To reveal the hidden dynamics of ice leads, we performed a spatio-temporal and network analysis of ice lead networks. The networks used and presented here are based on daily ice lead observations from Moderate Resolution Imaging Spectroradiometer (MODIS) between 2002 and 2020 by Hoffman et al. [1].
The spatio-temporal analysis of the ice leads exhibits seasonal, annual, and overall trends in the ice lead dynamics. We found that the number of ice leads is decreasing, and the number of width and length outliers is increasing overall. The network analysis of the ice lead graphs reveals unique network characteristics that diverge from those present in common real-world networks. Most notably, current network science methods (1) exploit the information that is embedded into the connections of the network, e.g., in connection clusters, while (2) nodes remain relatively fixed over time. Ice lead networks, however, (1) embed their relevant information spatially, e.g., in spatial clusters, and (2) shift and change drastically. These differences require improvements and modifications on common graph classification and link prediction methods such as Preferential Attachment and EvolveGCN on the domain of ice lead dynamic networks.
This work is a call for extending existing network analysis toolkits to include a new class of real-world dynamic networks. Utilizing network science techniques will hopefully further our understanding of ice leads and thus of Arctic processes that are key to climate change mitigation and adaptation.
Acknowledgments
We would like to thank Prof. Gunnar Spreen, who provided us insights into ice lead detection and possible challenges connected to the project idea. Furthermore, we would like to thank Shenyang Huang and Asst. Prof. David Rolnick for their valuable feedback and support. J.K. was supported in part by the DeepMind scholarship, the Mitacs Globalink Graduate Fellowship, and the German Academic Scholarship Foundation.
References
[1] Jay P Hoffman, Steven A Ackerman, Yinghui Liu, and Jeffrey R Key. 2019. The detection and characterization of Arctic sea ice leads with satellite imagers. Remote Sensing 11, 5 (2019), 521.
How to cite: Kaltenborn, J., Ramesh, V., and Wright, T.: Ice Lead Network Analysis, EGU General Assembly 2022, Vienna, Austria, 23–27 May 2022, EGU22-8945, https://doi.org/10.5194/egusphere-egu22-8945, 2022.
Please decide on your access
Please use the buttons below to download the presentation materials or to visit the external website where the presentation is linked. Regarding the external link, please note that Copernicus Meetings cannot accept any liability for the content and the website you will visit.
Forward to presentation link
You are going to open an external link to the presentation as indicated by the authors. Copernicus Meetings cannot accept any liability for the content and the website you will visit.
We are sorry, but presentations are only available for users who registered for the conference. Thank you.
EGU22-9753 | Presentations | CR2.8
Using LSTM on surface data to reconstruct 3D Temperature & Salinity profiles in the Arctic OceanMathias Jensen, Casper Bang-Hansen, Ole Baltazar Andersen, Carsten Bjerre Ludwigsen, and Mads Ehrhorn
In recent years, the importance of dynamics in the Arctic Ocean have proven itself with respect to climate monitoring and modelling. Data used for creating models often include temperature & salinity profiles. Such profiles in the Arctic region are sparse and acquiring new data is expensive and time-consuming. Thus, efficient methods of interpolation are necessary to expand regional data. In this project, 3D temperature & salinity profiles are reconstructed using 2D surface measurements from ships, floats and satellites. The technique is based on a stacked Long Short-Term Memory (LSTM) neural network. The goal is to be able to reconstruct the profiles using remotely sensed data.
How to cite: Jensen, M., Bang-Hansen, C., Andersen, O. B., Ludwigsen, C. B., and Ehrhorn, M.: Using LSTM on surface data to reconstruct 3D Temperature & Salinity profiles in the Arctic Ocean, EGU General Assembly 2022, Vienna, Austria, 23–27 May 2022, EGU22-9753, https://doi.org/10.5194/egusphere-egu22-9753, 2022.
EGU22-10386 | Presentations | CR2.8
Arctic sea ice dynamics forecasting through interpretable machine learningMatteo Sangiorgio, Elena Bianco, Doroteaciro Iovino, Stefano Materia, and Andrea Castelletti
Machine Learning (ML) has become an increasingly popular tool to model the evolution of sea ice in the Arctic region. ML tools produce highly accurate and computationally efficient forecasts on specific tasks. Yet, they generally lack physical interpretability and do not support the understanding of system dynamics and interdependencies among target variables and driving factors.
Here, we present a 2-step framework to model Arctic sea ice dynamics with the aim of balancing high performance and accuracy typical of ML and result interpretability. We first use time series clustering to obtain homogeneous subregions of sea ice spatiotemporal variability. Then, we run an advanced feature selection algorithm, called Wrapper for Quasi Equally Informative Subset Selection (W-QEISS), to process the sea ice time series barycentric of each cluster. W-QEISS identifies neural predictors (i.e., extreme learning machines) of the future evolution of the sea ice based on past values and returns the most relevant set of input variables to describe such evolution.
Monthly output from the Pan-Arctic Ice-Ocean Modeling and Assimilation System (PIOMAS) from 1978 to 2020 is used for the entire Arctic region. Sea ice thickness represents the target of our analysis, while sea ice concentration, snow depth, sea surface temperature and salinity are considered as candidate drivers.
Results show that autoregressive terms have a key role in the short term (with lag time 1 and 2 months) as well as the long term (i.e., in the previous year); salinity along the Siberian coast is frequently selected as a key driver, especially with a one-year lag; the effect of sea surface temperature is stronger in the clusters with thinner ice; snow depth is relevant only in the short term.
The proposed framework is an efficient support tool to better understand the physical process driving the evolution of sea ice in the Arctic region.
How to cite: Sangiorgio, M., Bianco, E., Iovino, D., Materia, S., and Castelletti, A.: Arctic sea ice dynamics forecasting through interpretable machine learning, EGU General Assembly 2022, Vienna, Austria, 23–27 May 2022, EGU22-10386, https://doi.org/10.5194/egusphere-egu22-10386, 2022.
EGU22-10637 | Presentations | CR2.8
A deep learning approach for mapping and monitoring glacial lakes from spaceManu Tom, Holger Frey, and Daniel Odermatt
Climate change intensifies glacier melt which effectively leads to the formation of numerous new glacial lakes in the overdeepenings of former glacier beds. Additionally, the area of many existing glacial lakes is increasing. More than one thousand glacial lakes have emerged in Switzerland since the Little Ice Age, and hundreds of lakes are expected to form in the 21st century. Rapid deglaciation and formation of new lakes severely affect downstream ecosystem services, hydropower production and high-alpine hazard situations. Day by day, glacier lake inventories for high-alpine terrains are increasingly becoming available to the research community. However, a high-frequency mapping and monitoring of these lakes are necessary to assess hazards and to estimate Glacial Lake Outburst Flood (GLOF) risks, especially for lakes with high seasonal variations. One way to achieve this goal is to leverage the possibilities of satellite-based remote sensing, using optical and Synthetic Aperture Radar (SAR) satellite sensors and deep learning.
There are several challenges to be tackled. Mapping glacial lakes using satellite sensors is difficult, due to the very small area of a great majority of these lakes. The inability of the optical sensors (e.g. Sentinel-2) to sense through clouds creates another bottleneck. Further challenges include cast and cloud shadows, and increased levels of lake and atmospheric turbidity. Radar sensors (e.g. Sentinel-1 SAR) are unaffected by cloud obstruction. However, handling cast shadows and natural backscattering variations from water surfaces are hurdles in SAR-based monitoring. Due to these sensor-specific limitations, optical sensors provide generally less ambiguous but temporally irregular information, while SAR data provides lower classification accuracy but without cloud gaps.
We propose a deep learning-based SAR-optical satellite data fusion pipeline that merges the complementary information from both sensors. We put forward to use Sentinel-1 SAR and Sentinel-2 L2A imagery as input to a deep network with a Convolutional Neural Network (CNN) backbone. The proposed pipeline performs a fusion of information from the two input branches that feed heterogeneous satellite data. A shared block learns embeddings (feature representation) invariant to the input satellite type, which are then fused to guide the identification of glacial lakes. Our ultimate aim is to produce geolocated maps of the target regions where the proposed bottom-up, data-driven methodology will classify each pixel either as lake or background.
This work is part of two major projects: ESA AlpGlacier project that targets mapping and monitoring of the glacial lakes in the Swiss (and European) Alps, and the UNESCO (Adaptation Fund) GLOFCA project that aims to reduce the vulnerabilities of populations in the Central Asian countries (Kazakhstan, Tajikistan, Uzbekistan, and Kyrgyzstan) from GLOFs in a changing climate. As part of the GLOFCA project, we are developing a python-based analytical toolbox for the local authorities, which incorporates the proposed deep learning-based pipeline for mapping and monitoring the glacial lakes in the target regions in Central Asia.
How to cite: Tom, M., Frey, H., and Odermatt, D.: A deep learning approach for mapping and monitoring glacial lakes from space, EGU General Assembly 2022, Vienna, Austria, 23–27 May 2022, EGU22-10637, https://doi.org/10.5194/egusphere-egu22-10637, 2022.
EGU22-12785 | Presentations | CR2.8
Machine learning tools for pattern recognition in polar climate scienceWilliam Gregory
Over the past four decades, the inexorable growth in technology and subsequently the availability of Earth-observation and model data has been unprecedented. Hidden within these data are the fingerprints of the physical processes that govern climate variability over a wide range of spatial and temporal scales, and it is the task of the climate scientist to separate these patterns from noise. Given the wealth of data now at our disposal, machine learning methods are becoming the tools of choice in climate science for a variety of applications ranging from data assimilation, to sea ice feature detection from space. This talk summarises recent developments in the application of machine learning methods to the study of polar climate, with particular focus on Arctic sea ice. Supervised learning techniques including Gaussian process regression, and unsupervised learning techniques including cluster analysis and complex networks, are applied to various problems facing the polar climate community at present, where each application can be considered an individual component of the larger sea ice prediction problem. These applications include: seasonal sea ice forecasting, improving spatio-temporal data coverage in the presence of sparse satellite observations, and illuminating the spatio-temporal connectivity between climatological processes.
How to cite: Gregory, W.: Machine learning tools for pattern recognition in polar climate science, EGU General Assembly 2022, Vienna, Austria, 23–27 May 2022, EGU22-12785, https://doi.org/10.5194/egusphere-egu22-12785, 2022.
EGU22-12882 | Presentations | CR2.8
Inverse modelling techniques for snow and ice thickness retrievals from satellite altimetryJoel Perez Ferrer, Michel Tsamados, Matthew Fox, Tudor Suciu, Harry Heorton, and Carmen Nab
We have recently applied an objective mapping type approach to merge observations from multiple altimeters, both for enhancing the temporal/spatial resolution of freeboard samples and for analyzing crossovers between satellites (Gregory et al, 2021). This mapping provides optimal interpolation of proximal observations to a location in space and time based on the covariance of the observations and a priori understanding of their spatiotemporal correlation length scales. This offers a best linear estimator and error field for the observation (radar freeboard or snow depth), which can be used to better constrain pan-Arctic uncertainties.
In addition we will explore here a newly developed inverse modelling framework to synchronously retrieve the snow and ice thickness from bias corrected or calibrated radar freeboards from multiple satellite retrievals. The radar equations expressed in section can be rearranged to formulate the joint forward model at gridded level relating measured radar freeboards from multiple satellites (and airborne data) to the underlying snow and ice thickness. In doing so we have also introduced a penetration factor correction term for OIB radar freeboard measurements. To solve this inverse model problem for and we use the following two methodologies inspired from Earth Sciences applications (i.e. seismology):
Space ‘uncorrelated’ inverse modelling. The method is called `space uncorrelated' inverse modelling as the algorithm is applied locally, for small distinct regions in the Arctic Ocean, multiple times, until the entire Arctic ocean is covered. To sample the parameter space we use the publicly available Neighbourhoud Algorithm (NA) developed originally for seismic tomography of Earth’s interior and recently by us to a sea ice dynamic inversion problem (Hoerton et al, 2019).
Space ‘correlated inverse modelling. For the second method of inverse modelling, we used what we call a `space correlated' approach. Here the main algorithm is applied over the entire Arctic region, aiming to retrieve the desired parameters at once. In contrast with the previous approach, in this method we take into account positional correlations for the physical parameters when we are solving the inverse problem, the output being a map of the Arctic composed of a dynamically generated a tiling in terms of Voronoi cells. In that way, regions with less accurate observations will be more coarsely resolved while highly sampled regions will be provided on a finer grid with a smaller uncertainty. The main algorithm used here to calculate the posterior solution is called `reverse jump Monte Carlo Markov Chain' (hereafter referred to as rj-MCMC) and its concept was designed by Peter Green in 1999 (Green, 1995). Bodin and Sambridge (2009) adapted this algorithm for seismic inversion, which is the basis of the algorithm used in this study.
How to cite: Perez Ferrer, J., Tsamados, M., Fox, M., Suciu, T., Heorton, H., and Nab, C.: Inverse modelling techniques for snow and ice thickness retrievals from satellite altimetry , EGU General Assembly 2022, Vienna, Austria, 23–27 May 2022, EGU22-12882, https://doi.org/10.5194/egusphere-egu22-12882, 2022.
EGU22-1388 | Presentations | GD9.2
A high-resolution record of vertically-resolved seawater salinity in the Caribbean Sea mixed layer since 1700 AD.Amos Winter, Davide Zanchettin, Malcolm McCulloch, Manuel Rigo, Clark Sherman, and Angelo Rubino
The Caribbean Sea in the tropical Atlantic is one of the major heat engines of the Earth and a sensitive area for monitoring climate variability. Salinity changes in the Caribbean Sea record changes in ocean currents and can provide information about variations in ocean heat transport. Seawater salinity in the Caribbean Sea has been monitored in recent decades, nevertheless, of all oceanographic environmental parameters salinity information before the instrumental period remains limited, due to the difficulty of reconstructing salinity, arguably the most difficult natural archives to recreate. We were able to reconstruct salinity changes in the Caribbean Sea from 1700 to the present from southwest Puerto Rico using slowly growing and long-lived scelerosponges from southwest Puerto Rico. These well-dated sponges are known to precipitate their skeletons in isotopic equilibrium (i.e., their record is not affected much by vital effects) and were retrieved from various depths in the mixed layer, from the surface to 90 m depth. We were able to establish salinity changes by deconvoluting stable isotopes (d18O) and trace element (Sr/Ca) proxies taken from the sponges at regular intervals. In this contribution, we will present the salinity record and illustrate the process for salinity reconstruction. We will also discuss how we determine how salinity changes in our record relate to radiative forcing as well as connect them with dominant mechanisms operating in the region, including changes in the position of the InterTtropical Convergence Zone and intensity of the Atlantic meridional Overturning Circulation over time.
How to cite: Winter, A., Zanchettin, D., McCulloch, M., Rigo, M., Sherman, C., and Rubino, A.: A high-resolution record of vertically-resolved seawater salinity in the Caribbean Sea mixed layer since 1700 AD., EGU General Assembly 2022, Vienna, Austria, 23–27 May 2022, EGU22-1388, https://doi.org/10.5194/egusphere-egu22-1388, 2022.
EGU22-3134 | Presentations | GD9.2
Reconstructing the climate of the Extremadura region (SW Spain) from documentary sourcesJosé M. Vaquero, María C. Gallego, Nieves Bravo-Paredes, Víctor M.S. Carrasco, and Irene Tovar
In recent years, our research group has tried to improve the knowledge of the historical climate of the Extremadura region, located in the interior of the southwest of the Iberian Peninsula. Some results can be highlighted:
- Temperature and precipitation indices were constructed for the period 1750-1840 from the correspondence of the Duke of Feria (Fernández-Fernández et al., 2014, 2015, 2017).
- We have recovered many “pro pluvia” rogation dates (Domínguez-Castro et al., 2021) and we have seen their relationship with the North Atlantic Oscillation (Bravo-Paredes et al., 2020).
- We have studied the catastrophic floods of the Guadiana River since AD1500 (Bravo-Paredes et al., 2021).
- We have recovered more than 700,000 meteorological data from the Extremadura region taken in the 19th and early 20th centuries (Vaquero et al., 2022), including some uncommon series (Bravo-Paredes et al., 2019).
In recent months, we have started a study of the meteorological information published by the regional press of Extremadura in the last 150 years and here we will present some preliminary results.
References
Bravo-Paredes, N. et al. (2019) Tellus B 71, 1663597.
Bravo-Paredes, N. et al. (2020) Atmosphere 11(3), 282.
Bravo-Paredes, N. et al. (2021) Science of the Total Environment 797, 149141.
Domínguez-Castro, F. et al. (2021) Scientific Data 8, 186.
Fernández-Fernández, M.I. et al. (2014) Climatic Change 126, 107.
Fernández-Fernández, M.I. et al. (2015) Climatic Change 129, 267.
Fernández-Fernández, M.I. et al. (2017) Climatic Change 141, 671.
Vaquero, J.M. et al. (2022) Geoscience Data Journal. https://doi.org/10.1002/gdj3.131
How to cite: Vaquero, J. M., Gallego, M. C., Bravo-Paredes, N., Carrasco, V. M. S., and Tovar, I.: Reconstructing the climate of the Extremadura region (SW Spain) from documentary sources, EGU General Assembly 2022, Vienna, Austria, 23–27 May 2022, EGU22-3134, https://doi.org/10.5194/egusphere-egu22-3134, 2022.
EGU22-3906 | Presentations | GD9.2
Earthquake detection in time-series of laser strainmeter measurements as a first step towards automatic signal classification.Valentin Kasburg, Alexander Breuer, Martin Bücker, and Nina Kukowski
Geophysical observatories around the world collect data on various natural phenomena within the Earth and on its surface. Many of these measurements are made automatically, sometimes at high sampling rates, so that enormous amounts of data accumulate over the years. Continuous analysis is important to classify current phenomena and decide which data are important and which can be downsampled later.
At Moxa Geodynamic Observatory, located in central Germany, several laser strainmeters have been installed in subsurface galleries in order to measure strain of the Earth's crust. These instruments run in north-south, east-west, and northwest-southeast directions. Nano-strain rates are determined with a sampling rate of 0.1 Hz almost continuously over distances of 26 and 38 m, respectively, since summer 2011.
Signals of tectonically induced crustal deformation are superimposed by other signals of greater amplitude, e.g., tides, changes in atmospheric pressure, hydrologic events such as heavy rainfall, and earthquakes. Classification of these events is important to better associate jumps in the temporal vicinity and to distinguish anomalies from instrument failures. To avoid time-consuming pattern recognition by hand, algorithms are required to do most of the work automatically. Due to recent advances in the field of artificial intelligence, it is possible to implement time series algorithms that are capable of unifying and automating many steps of data analysis. Although artificial intelligence applications are increasingly used to support data analysis, their use for time series of geophysical origin so far is not widespread outside of seismology.
In this contribution, an approach to automatically detect earthquakes in the strain data using 1D Convolutional Neural Networks is presented, including the generation of artificial training data with time series data augmentation. Also the training process and generation of new training data, based on classification by hand and false predictions of the trained model is described. The 1D Convolutional Neural Networks are able to identify almost all earthquakes in the strain data and have F1 values > 0.99, showing that their application has the potential to significantly reduce the time required in signal classification of observatory time series data.
How to cite: Kasburg, V., Breuer, A., Bücker, M., and Kukowski, N.: Earthquake detection in time-series of laser strainmeter measurements as a first step towards automatic signal classification., EGU General Assembly 2022, Vienna, Austria, 23–27 May 2022, EGU22-3906, https://doi.org/10.5194/egusphere-egu22-3906, 2022.
EGU22-6814 | Presentations | GD9.2
Long term deformation and seismic observations at the Mont Terri rock laboratoryDorothee Rebscher, Senecio Schefer, Finnegan Reichertz, Yves Guglielmi, William Foxall, Inma Gutiérrez, and Edi Meier
The Mont Terri rock laboratory, located in the Swiss Jura Mountains, is dedicated to research on argillaceous rocks. Since its founding in 1996, the objective is the hydrogeological, geochemical, and geotechnical characterisation of Opalinus Clay in the context of nuclear waste repositories. More recently, the work has broadened to additional fields, covering potential uses of the deep geological subsurface such as geological storage of carbon dioxide and geothermal energy. With the excellent infrastructure, a comprehensive database, and the broad scientific and technological expertise, knowledge is enhanced e.g. through the advancement and comparison of approaches as well as the development and testing of novel investigation methods. These, as well as studies on feasibility and risk assessment, are of benefit also for underground laboratories in general and in situ explorations in different rock types worldwide. Due to the long-term commitment and the available gallery space of the research facility, elaborate as well as decade-long experiments can be implemented.
In order to detect, quantify, and understand short- and long-term deformations in the Mont Terri rock laboratory, quasi continuous time series are established employing various monitoring techniques. The latter complement each other in regard to their spatial dimensions, operational frequency optima, and their point or integral information. The approach combines
- a 50 m long uniaxial hydrostatic levelling system (HLS, Type “PSI”, positioned along a gallery wall, measuring principle: electrical plate capacitors),
- four mini-arrays of very-broad-band triaxial seismometers, installed in the rock laboratory (one under the HLS) as well as outside the rock laboratory at the surface,
- and an array of high resolution, biaxial platform tiltmeters, with instruments situated close to the HLS and in various parts of the rock laboratory, integrated in other in situ experiments.
The observed signals and their analysis differ in space and time. They range from the detection of local nanoseismic as well as large tele seismic events, to the determination of earth tides, and to the identification of seasonal trends versus other long term geodetic movements. Besides the mutual comparison of the three deformation measurements, the time series provide valuable input for numerous scientific questions such as the stability of the rock laboratory as a whole or in its parts, the influence of excavation, ventilation, or fluid injection on rock matrix and faults. Long data series of ambient parameters, essential for interpretation of the deformation records, such as temperature, pressure, and humidity, are recorded by sensors integrated in the above listed instruments and are also of interest in further experiments performed by the Mont Terri Consortium.
How to cite: Rebscher, D., Schefer, S., Reichertz, F., Guglielmi, Y., Foxall, W., Gutiérrez, I., and Meier, E.: Long term deformation and seismic observations at the Mont Terri rock laboratory, EGU General Assembly 2022, Vienna, Austria, 23–27 May 2022, EGU22-6814, https://doi.org/10.5194/egusphere-egu22-6814, 2022.
EGU22-8343 | Presentations | GD9.2 | Highlight
Variations of the Earth magnetic field: From geomagnetic storms to field reversalRoman Leonhardt
The geomagnetic field, the Earth’s primary barrier against charged particles from the sun, varies on time scales from million years to sub-second fluctuations. In the past decades significant advances in measurement techniques, both ground and space based, paleo- and rock magnetic methods, as well as numerical and analytical simulations, improved our understanding of underlying processes and their consequences on our planet and on our society. Geomagnetic storms, often related to coronal mass ejections on the sun and their interaction with the Earth‘s magnetic field, pose a threat to our modern society as they affect satellites, disturb radio communication, and, in particular, damage power grids and cause electrical blackouts on a massive scale. Ground based measurements, which are used together with satellite data to investigate these events, point towards the occurrence of global scale major storms once every 100 years. When further looking at such observatory data, which is existing for the last few hundred years, it is also striking that the global Earth‘s magnetic field is gradually weakening, by more the 10% in the past 200 years. Paleo- and archeomagnetic investigations are used to extend our observational range into the past in order to clarify the significance and reasons of this field reduction. When looking even further into the past, complete flips of the geomagnetic field are recorded in geological archives like volcanic rocks and sediments. These geomagnetic field reversals, the last one happening about 770kyrs ago, are accompanied by strong reductions of the geomagnetic field strength and complex field behavior on the Earths surface, effects which are sometimes brought into connection with our modern observation of field reduction. This presentation will provide a comprehensive overview about geomagnetic field variations, and the necessity of using long timeseries for interpretation of its current state and future evolution.
How to cite: Leonhardt, R.: Variations of the Earth magnetic field: From geomagnetic storms to field reversal, EGU General Assembly 2022, Vienna, Austria, 23–27 May 2022, EGU22-8343, https://doi.org/10.5194/egusphere-egu22-8343, 2022.
EGU22-11079 | Presentations | GD9.2
Impact of the geological setting of the overburden on long-time series recorded at underground geophysical observatories: case study from the FSU Jena Geodynamic Observatory Moxa (Thuringia, central GermanyNina Kukowski, Valentin Kasburg, Andreas Goepel, Cornelius Schwarze, Thomas Jahr, and Ronny Stolz
To achieve very low ambient noise and thus very good conditions for long-term geophysical observations at a high level of instrumental accuracy in order to decipher also faint signals from Earth and environmental processes, sensors often are installed in the subsurface in galleries or in boreholes. This however, makes it necessary to consider the potential influence of the geological setting and properties of the surrounding rock formations and overburden.
Moxa Geodynamic observatory, located in a remote part of the Thuringian slate mountains, approximately 30 km south of Jena, provides an ideal setting to address this topic as it comprises two galleries, which are running perpendicular to each other. As the observatory is built at the toe of a relatively steep slope, coverage of the galleries varies along them. Further, the tectonic structure and hydrological settings of the overburden is rather complex.
Instruments sensitive to deformation, which include three laser strain meters measuring nano-strain, borehole tiltmeters and a superconducting gravimeter CD-034, together with other instruments, e.g. a node for the Global Network of Optical Magnetometers for Exotic physics (GNOME), are installed in various positions in the building of the observatory, close to the building, and in the galleries. The laser strainmeters record along three galleries in north-south, east-west and NW-SE directions. Further, information on fluid flow is gained from downhole temperature measurements employing an optical fiber and several groundwater level indicators, some of them installed in shallow boreholes. Additionally, information on environmental parameters is coming from a climate station and on the subsurface tectonic structure from various near surface geophysical data sets.
Here, we present first results of an ongoing project which combines actual deformation recordings, structural and drillhole information to decipher how the tectonic structure of the and groundwater movement within the overlying slope on top of the observatory’s galleries may impact on the various instrumental recordings.
How to cite: Kukowski, N., Kasburg, V., Goepel, A., Schwarze, C., Jahr, T., and Stolz, R.: Impact of the geological setting of the overburden on long-time series recorded at underground geophysical observatories: case study from the FSU Jena Geodynamic Observatory Moxa (Thuringia, central Germany, EGU General Assembly 2022, Vienna, Austria, 23–27 May 2022, EGU22-11079, https://doi.org/10.5194/egusphere-egu22-11079, 2022.
EGU22-11916 | Presentations | GD9.2
Downscaling to high-resolution and correcting air temperature from the ERA5-Land over EthiopiaMosisa Tujuba Wakjira, Nadav Peleg, and Peter Molnar
Climate information from in-situ observation networks can be used to significantly improve the accuracy of gridded climate datasets, even in data-scarce regions. We applied a bias correction and spatial disaggregation method on daily maximum and minimum ERA5-Land (ERA5L) 2-m air temperature dataset covering Ethiopia. Due to large gaps in the observed temperature data, the bias correction is based on the statistics rather than the complete time series. First, long-term daily, monthly and annual temperature statistics (mean and variance) were summarized for the time series obtained from 155 stations covering the period 1981-2010. Second, the temperature statistics were interpolated onto a 0.05° x 0.05° grid using an inverse non-Euclidean distance weighting approach. This method accounts for the effects of elevation, thus enabling downscaling of the temperature to a higher spatial resolution. Next, the ERA5L maximum and minimum temperature were bias-corrected using quantile mapping assuming a Gaussian distribution transfer function. The quantile mapping was performed at daily, monthly and annual time steps to reproduce the climatology, seasonality, and interannual variability of the data. The performance of the bias correction was evaluated using the leave-out-one cross-validation method. The cross-validation shows that the bias-corrected maximum (minimum) daily temperature has an improved mean absolute error value of 68% (52%) in comparison to the original ERA5L reanalysis air temperature bias. The bias-corrected dataset is therefore suggested as an alternative for the ERA5L and can be used in a wide range of applications in Ethiopia.
How to cite: Wakjira, M. T., Peleg, N., and Molnar, P.: Downscaling to high-resolution and correcting air temperature from the ERA5-Land over Ethiopia, EGU General Assembly 2022, Vienna, Austria, 23–27 May 2022, EGU22-11916, https://doi.org/10.5194/egusphere-egu22-11916, 2022.
Please decide on your access
Please use the buttons below to download the presentation materials or to visit the external website where the presentation is linked. Regarding the external link, please note that Copernicus Meetings cannot accept any liability for the content and the website you will visit.
Forward to presentation link
You are going to open an external link to the presentation as indicated by the authors. Copernicus Meetings cannot accept any liability for the content and the website you will visit.
We are sorry, but presentations are only available for users who registered for the conference. Thank you.
EGU22-12745 | Presentations | GD9.2
Long-term geomagnetic activity: Comparison and analysis of geomagnetic activity indices during the last 90 yearsKalevi Mursula
Geomagnetic activity is a measure aimed to quantify the effect of solar wind upon the Earth's magnetic environment. The main structures in solar wind driving geomagnetic activity are the coronal mass ejections (CME) and the high-speed solar wind streams together with related co-rotating interaction regions (HSS/CIR). While CMEs are closely related to sunspots and other active regions on solar surface, the HSSs are related to solar coronal holes, forming a proxy of solar polar magnetic fields. This gives an interesting possibility to obtain versatile information on solar activity and solar magnetic fields from geomagnetic activity.
Various indices have been developed to quantify and monitor global geomagnetic activity. The most often used indices of overall geomagnetic activity are the aa index, developed by P. Mayaud and running already since 1868, and the Kp/Ap index, developed by J. Bartels and running since 1932. Both aa and Kp/Ap depict the increase of geomagnetic activity during the first half of the 20th century, and a steep decline in the 2000s. However, although the two indices are constructed from midlatitude observations using roughly the same recipe, they depict notable differences during the 90-year overlapping interval. While the Kp/Ap index reaches a centennial maximum in the late 1950s, at the same time as sunspots, the aa index has its maximum only in 2003. Also, the Kp/Ap is systematically relatively more active in the first decades until 1960s, while aa is more active thereafter. The Dst index was developed to monitor geomagnetic storms and the ring current since 1957. We have corrected some early errors in the Dst index and extended its time interval to 1932. This extended storm index is called the Dxt index. Here we study these long-term geomagnetic indices and their differences. We also use their different dependences on the main solar wind drivers in order to obtain new information on the centennial evolution of solar activity and solar magnetic fields.
How to cite: Mursula, K.: Long-term geomagnetic activity: Comparison and analysis of geomagnetic activity indices during the last 90 years, EGU General Assembly 2022, Vienna, Austria, 23–27 May 2022, EGU22-12745, https://doi.org/10.5194/egusphere-egu22-12745, 2022.
EGU22-121 | Presentations | SSS7.4 | Highlight
Development capacity of a biodiverse pasture on Technosols for the rehabilitation of marginal lands (saline soils and mining waste)Antonio Aguilar-Garrido, Patrícia Vidigal, Ana Delaunay Caperta, and Maria Manuela Abreu
In the coming years, food demand will increase sharply in line with population growth. So, production will have to increase mostly by area expansion, which could lead to biodiversity loss and an increase in greenhouse gas emissions. Furthermore, both land and water resources are limited and already under severe pressure, making it imperative to ensure a more productive but also sustainable agricultural system. A possible solution to this could be the reclamation of marginal lands, such as saline and drought-prone lands, or even abandoned mining areas. In this sense, phytostabilisation is considered a suitable method for their rehabilitation and reconversion to agricultural and livestock activities while protecting the food chain. Some pasture plants can tolerate adverse growth conditions, such as mine waste or soil conditions (e.g. high concentrations of potentially hazardous elements (PHE) and EC, low pH, organic C and nutrients, and poor structure and water holding capacity). However, low and slow plant growth can limit environmental rehabilitation success. The combined use of Technosols and pastures may be an effective green technology towards reclaiming these marginal areas for food production. To verify this hypothesis, we studied the development of a biodiverse pasture in two biogeochemically distinct Technosols. The pasture is composed of leguminous plants of the genus Trifolium sp. (T. michelianum var. paradana Savi, T. vesiculosum var. cefala Savi, T. resupinatum var. nitrofolus L., and T. squarrosum L.) and Medicago sp., and gramineous plants such as Lolium multiflorum Lam. Two Technosols have been built using a saline Fluvisol collected in the Tagus Estuary and a gossan waste from the São Domingos mine together with a mixture of organic and inorganic amendments. The microcosm assay consisted of four treatments set up in pots of 1.5 dm3 volume (four replicates): (i) Fluvisol (VF), control of salinity affection (EC: 7.9 dS/m; exchangeable sodium 25%); (ii) Technosol-Fluvisol (TVF); (iii) gossan waste (G), control of PHE contamination (g/kg As: 9.1; Pb: 29.6) ; and (iv) Technosol-Gossan (TG). One month after sowing (5 g seeds per pot), the pasture biomass generated so far was mowed to simulate livestock grazing. Pasture in FV showed no seed germination, thus no plant growth. In contrast, in G (10 cm stem length and 1.41 g DW), was observed seed germination followed by plant growth, with gramineous dominating over leguminous plants. In the Technosols, pasture growth improved extraordinarily, with plants reaching more than 15 cm stem length and higher biomass with 2.59 g DW on TVF and 3.8 g DW on TG. Moreover, the pasture was more biodiverse, with the presence of as many leguminous as gramineous. Upon the first cut, the pasture was left for another month for the plants to regrow, and then mowed for the last time. During this time, L. multiflorum has kept growing to similar sizes to the first mowing, while the leguminous have not regrown as effectively. Thus, an integrated biotechnological approach involving Technosols and pastures could be a useful green technology to convert marginal lands into food production areas (grazing or foraging).
How to cite: Aguilar-Garrido, A., Vidigal, P., Caperta, A. D., and Abreu, M. M.: Development capacity of a biodiverse pasture on Technosols for the rehabilitation of marginal lands (saline soils and mining waste), EGU General Assembly 2022, Vienna, Austria, 23–27 May 2022, EGU22-121, https://doi.org/10.5194/egusphere-egu22-121, 2022.
EGU22-2063 | Presentations | SSS7.4
Method of isolation of soil microorganisms - destructors of biopolymersNataliia Chupakhina, Nadezda Nikolaeva, Dmitriy Nechaev, Nadezda Medjalo, Anastasija Novichkova, Valerija Lobanova, and Galina Chupakhina
Method of isolation of soil microorganisms - destructors of biopolymers
Nataliia Chupakhina, Nadezda Nikolaeva, Dmitriy Nechaev, Nadezda Medjalo, Anastasija Novichkova, Valerija Lobanova and Galina Chupakhina
School of Life Sciences, Immanuel Kant Baltic Federal University, Universitetskaya str. 2, 236040 Kaliningrad, Russian Federation
Biological degradation of plastic by microorganisms and their enzymes is one of the ways to eliminate the waste resulting from mass production of plastic (Carr C. M., Clarke D. J., 2020).
We analyzed the soil microflora in the presence of fragments of oxo-biodegradable polyethylene with the addition of d2w. The experiment was conducted in the historical center of the city with medium-rise buildings and mass landscaping. We took soil samples at a depth of 10 cm in accordance with GOST 17.4.4.02-84. The soil was classified as heavy sandy loam with the pH of 7.4. Soil suspension (1 g of dry soil per 100 ml of sterile water) in an amount of 100 ml was distributed on solid nutrient media Nutrient dry agar, Nutrient broth with agar addition, GMF broth with agar addition (pH 7.3), sterilized in an autoclave for 20 min at 121 °C. The cultivation regime consisted of keeping the Petri dishes in a thermostat at a temperature of 37 ° C in the range from 1 to 7 days. When using dry soil, bacteria could not be isolated. We repeated the experiment using raw soil. The highest number of diverse colonies had grown on the Nutrient Dry agar medium. After the growth of a large number of microorganisms on Petri dishes, 20 non-repeating colonies of bacteria were isolated.
Next, we placed 5-7 polyethylene discs with the diameter of 7 mm on Petri dishes with 20 isolated colonies. We washed the discs with soap, soaked them in alcohol and rinsed them with autoclaved water. The bacteria were cultured in a thermostat at 37°C for 1 - 7 days. The maximum reliable biofouling of the polymer was recorded on day 7 in 50% of the cups with a double complete repetition of the experiment.
We can conclude that in order to isolate the soil bacteria aiming to find out their destructive activity against biodegradable plastic, it is effective to use a soil from a depth of 10 cm in suspension with sterile water (1g per 100ml) and cultivate it on Nutrient dry agar (pH 7.3) at 37 ° C for 7 days.
How to cite: Chupakhina, N., Nikolaeva, N., Nechaev, D., Medjalo, N., Novichkova, A., Lobanova, V., and Chupakhina, G.: Method of isolation of soil microorganisms - destructors of biopolymers, EGU General Assembly 2022, Vienna, Austria, 23–27 May 2022, EGU22-2063, https://doi.org/10.5194/egusphere-egu22-2063, 2022.
EGU22-4921 | Presentations | SSS7.4
Evaluation of the root system and phyto-management potential of Sesbania cannabina grown in hexavalent chromium contaminated soils utilizing modified rhizobox systems.Abdul Kadir Ibne Kamal, Lesley Batty, and Rebecca Bartlett
This study aimed to assess how the root system of Sesbania cannabina behaves under various concentrations of Cr (VI) and whether it could be a suitable species for the phyto-management of Cr (VI) contaminated soils. The experiment was conducted in rhizoboxes under greenhouse conditions using a sandy loam soil dosed with potassium dichromate giving eight different Cr (VI) concentrations (0 ppm, 5 ppm, 10 ppm, 20 ppm, 40 ppm, 80 ppm, 160 ppm, and 360 ppm). Plant roots were photographed with a Canon 60D (18-megapixel) camera with a 50 mm prime lens and analysed with Image J image processing software.
At 360 ppm concentration, seeds of S. cannabina germinated but were unable to grow further. However, under concentrations of 0-80ppm there was no significant change observed in the root growth (Length) . At 160 ppm root growth was reduced by about 55±0.65% at 25 days and 35±0.25 % at 60 days compared to plants grown at 0 ppm. After 60 days no chromium (VI) was detected in the soil for (0 to 160 ppm) in comparison with the control (with no plants) where no changes in Cr (VI) were observed.
The absence of Cr (VI) in soil after 60 days suggests that S. cannabina can be considered as a candidate for phyto-management of soils containing up to 160 ppm Cr (VI).
How to cite: Ibne Kamal, A. K., Batty, L., and Bartlett, R.: Evaluation of the root system and phyto-management potential of Sesbania cannabina grown in hexavalent chromium contaminated soils utilizing modified rhizobox systems., EGU General Assembly 2022, Vienna, Austria, 23–27 May 2022, EGU22-4921, https://doi.org/10.5194/egusphere-egu22-4921, 2022.
EGU22-7788 | Presentations | SSS7.4
Lab and modelling tests to develop a geoelectric monitoring system for municipal solid waste landfillsLorenzo Panzeri, Monica Papini, Luca Formaggia, Anna Scotti, Alessio Fumagalli, Diego Arosio, and Laura Longoni
Although the indications contained in the European New Green Deal aim to inhibit the opening of new waste disposal sites through a circular economy of waste materials, the management of an extremely large number of municipal solid waste landfills (MSWLF) at different stages of their life cycle is a highly topical issue. Recent national regulations in Italy require the operators to monitor subsoil conditions for 30 years, but do not define clear and unambiguous guidelines.
According to analyses carried out at various landfill sites in northern Italy, monitoring activities were often found to be set up with wells equipped with piezometers. This approach is not optimal because when any contaminants are intercepted by the wells, the conditions of the subsoil may already be compromised. Therefore, the goal of our work is to develop methodologies to test and define an effective monitoring protocol that allows to mitigate the environmental and ecological risks associated with the subsurface propagation of pollutants at MSWLF sites.
The analysis of the subsoil conditions involves the design of monitoring methodologies and the interpretation of the obtained results, exploiting geological, hydrogeological and geophysical knowledge and skills. Accordingly, we rely on a research methodology based on the mutual and continuous exchange between the involved disciplines, starting from the initial geological assumptions that will be used to define a physical model of the subsurface. We mainly resort to indirect non-invasive techniques, in particular to the direct current (DC) electrical resistivity tomography (ERT) that on the one hand is indicated for identifying conductive anomalies associated with the propagation of pollutants, but on the other hand constitutes a complex ill-posed numerical problem. The major issues are related to the spatial resolution and the penetration depth of the technique that in turn control the capability to detect presence and the conditions of the extremely thin high-density polyethylene (HDPE) membrane used to isolate the landfill waste from the surroundings.
To tackle the abovementioned issues, we decided to perform properly downscaled laboratory experiments in order to test the effectiveness of DC methodology in controlled and well-known settings. Processing and interpretation of the collected geoelectrical data are supported by a new modelling code in Python programming language that is being developed.
We deem that the integration of lab and modelling tests is necessary to propose a sound standard approach to address complex and multidisciplinary problems related to landfill risk management.
How to cite: Panzeri, L., Papini, M., Formaggia, L., Scotti, A., Fumagalli, A., Arosio, D., and Longoni, L.: Lab and modelling tests to develop a geoelectric monitoring system for municipal solid waste landfills, EGU General Assembly 2022, Vienna, Austria, 23–27 May 2022, EGU22-7788, https://doi.org/10.5194/egusphere-egu22-7788, 2022.
Please decide on your access
Please use the buttons below to download the presentation materials or to visit the external website where the presentation is linked. Regarding the external link, please note that Copernicus Meetings cannot accept any liability for the content and the website you will visit.
Forward to presentation link
You are going to open an external link to the presentation as indicated by the authors. Copernicus Meetings cannot accept any liability for the content and the website you will visit.
We are sorry, but presentations are only available for users who registered for the conference. Thank you.
EGU22-8337 | Presentations | SSS7.4
Changes in the solubility and potential toxicity of metal(loid)s in soils treated with TechnosolsAntonio Aguilar-Garrido, Ana Romero-Freire, Mario Paniagua-López, Francisco Javier Martínez Garzón, and Francisco José Martín-Peinado
The influence of six different Technosols on solubility and potential toxicity of metal(loid)s from polluted soils was studied. Technosols were made with a soil affected by residual pollution coming from the Guadiamar Green Corridor and different combinations of three organic wastes [solid olive-mill (T1 and T4), sewage sludge (T2 and T5), and gardening vermicompost (T3 and T6)]. In addition, carbonate-rich material from a peatbog was applied to T1, T2, and T3; while marble sludge was added to T4, T5, and T6; iron-rich sludge (2%) was also applied to all Technosols. The comparison with a non-polluted soil from the study area is also included. Main soil properties (pH, EC, and OC) and solubility of potentially harmful elements (PHEs) in a soil:water extract (1:10) was measured both in Technosols as in soils after two months of incubation period. Potential toxicity was estimated by a germination bioassay with Trifolium pratense L.
The different Technosols showed changes in the solubility of PHEs with significant differences between elements. Cu and Zn strongly reduced the solubility in T3 and T6 in relation to the polluted soil; Cd was reduced in all cases without significant differences between Technosols; and Pb increased in Technosols treated with solid olive-mill (T1 and T4) and sewage sludge (T2 and T5). A significant increase in the solubility of As and Sb was detected in all cases. Likewise, soil treated with Technosols showed differences in solubility of PHEs. Cu and Zn were strongly reduced in the soil treated with T6, and Cd and Pb was reduced in all cases. Arsenic was reduced in all treated soils, although the soluble concentration remained slightly above the values of non-polluted soil. While Sb solubility increased in soils treated with Technosols made with carbonate-rich material from a peatbog (T1, T2, and T3), and maintained at the same level as in polluted soils for soils treated with Technosols made with marble sludge (T4, T5, and T6). These behaviours are mainly related to the increase in calcium carbonate content and the rise in pH in Technosols compared to the polluted soil. The germination bioassay with T. pratense showed very high toxicity (no germination) in soils treated with sewage sludge (T2 and T5), high toxicity (>75% reduction in germination in relation to non-polluted soil) in soils treated with solid olive-mill (T1 and T4), and low toxicity (15% reduction in germination in relation to non-polluted soil) in soils treated with gardening vermicompost (T3 and T6).
Our results indicate that the Technosol composed of gardening vermicompost were the most effective in the reduction of PHEs solubility and toxicity; however, additional studies should be made to assess the increase of mobility in As and Sb after Technosol treatment.
How to cite: Aguilar-Garrido, A., Romero-Freire, A., Paniagua-López, M., Martínez Garzón, F. J., and Martín-Peinado, F. J.: Changes in the solubility and potential toxicity of metal(loid)s in soils treated with Technosols, EGU General Assembly 2022, Vienna, Austria, 23–27 May 2022, EGU22-8337, https://doi.org/10.5194/egusphere-egu22-8337, 2022.
EGU22-8381 | Presentations | SSS7.4
About the character of variation of 90Sr concentration in plants within elementary landscape geochemical systemElena Korobova, Vladimir Baranchukov, Denis Dolgushin, Oleg Tarasov, and Lyudmila Mikhailovskaya
A detailed study of 90Sr distribution in the overground vegetation cover within an elementary landscape geochemical system (top-slope-closing depression, ELGS) was performed in several forested and meadow test sites located in the Eastern Urals Radioactive Trace highly contaminated with this technogenic radionuclide during its release in the Kyshtym accident in 1957 (INES level 6). After selecting the suitable test sites, they were crossed by several lateral profiles along which relative altitude with a step of 1 m and precision of 1 cm was measured using theodolite Boif-DJD10. Averaged plant samples were taken at each point within a standard steel ring (14 cm diameter) later separated into the groups of cereals, legumes and other different herbs. Particular species were also collected if present at no less than seven consequent points. Strontium-90 activity was measured by the portable complex ”Colibri” (SKS-08P) developed in the Kurchatov Institute (Potapov et al., 2021). It allowed the measurement of radionuclide activity in field conditions. The determination error did not exceed 15%. Analysis of data obtained revealed the ordered variation of 90Sr in all groups of plants. This order was presented by the cyclic (periodic) change of 90Sr activity downslope without definite radionuclide accumulation at the foot of the slope and in depression as usually expected. A similar cyclic pattern was found for 137Cs variation in moss cover studied in the Chernobyl zone (Dolgushin & Korobova, 2021). We consider it reflects peculiarities of water migration in the soil-plant system at the ELGS scale. Specific 90Sr activity in forest grasses correlated with biomass volume while plant groups and species with the different activity of radionuclides significantly differed in 90Sr variation amplitude and its maximum values. The revealed features of variation likely reflect the peculiarities of 90Sr water migration in soils, the structure of root system, and the plants' ecological demands, such as their hydrophilicity.
References
Potapov, V.N., Ivanov, O.P., Luk’yanov, V.V. et al. Portable β-Spectrometer for 90Sr Activity Field-Measurements in Radioecology and Rehabilitation of Nuclear Energy Facilities. At Energy 129, 155–162 (2021). https://doi.org/10.1007/s10512-021-00728-5
Dolgushin, D. and Korobova, E.: New data on the character of 137Cs lateral and vertical migration in soil-litter-moss cover within undisturbed elementary landscape geochemical systems on the test site in the Chernobyl abandoned zone, Russia, EGU General Assembly 2021, online, 19–30 Apr 2021, EGU21-7691, https://doi.org/10.5194/egusphere-egu21-7691, 2021.
How to cite: Korobova, E., Baranchukov, V., Dolgushin, D., Tarasov, O., and Mikhailovskaya, L.: About the character of variation of 90Sr concentration in plants within elementary landscape geochemical system, EGU General Assembly 2022, Vienna, Austria, 23–27 May 2022, EGU22-8381, https://doi.org/10.5194/egusphere-egu22-8381, 2022.
Please decide on your access
Please use the buttons below to download the presentation materials or to visit the external website where the presentation is linked. Regarding the external link, please note that Copernicus Meetings cannot accept any liability for the content and the website you will visit.
Forward to presentation link
You are going to open an external link to the presentation as indicated by the authors. Copernicus Meetings cannot accept any liability for the content and the website you will visit.
We are sorry, but presentations are only available for users who registered for the conference. Thank you.
EGU22-9882 | Presentations | SSS7.4 | Highlight
Environmental and human health risks due to mining activity in the soils and plants of the Remance mine, PanamaAna Cristina González-Valoys, José María Esbrí, José Ulises Jiménez Salgado, Rita Rodríguez, Eva María García-Noguero, Tisla Monteza-Destro, Miguel Vargas-Lombardo, Efrén Garcia-Ordiales, Jonatha Arrocha, Ernesto Martínez, Juan Antonio Campos, Eric Gutierréz, Rosario García-Giménez, Raimundo Jiménez-Ballesta, Francisco Jesús García-Navarro, and Pablo Higueras
Abstract
The Remance gold mine, in Veraguas (central Panama), had its last mining operation in 1999, using the cyanidation process for Au separation. As a result of this activity, three waste tailings were exposed to the weather, in addition to mine dumps and the open pit mining areas. Currently the area is inhabited by peasants who develop subsistence agriculture and livestock. Therefore, the objective of this study has been to evaluate the environmental and human health risks that this area represents. The total concentrations of potentially toxic elements (PTEs) such as As, Cu, Zn, Ba, Sb and Hg were determined in mining process areas, surrounding soils and edible and inedible plants in the area; in addition to the cyanide species and the enzymatic activity by dehydrogenase (DHA) in soils. The accumulated contamination index (PLI) and potential ecological risk (RI) were calculated, the carcinogenic (CR) and non-carcinogenic (HQ) risk to human health represented by soils and edible plants was estimated.
Regarding the degree of contamination, it is observed that the contamination is considerable in the tailings and the sediments of the pithead, and it spreads to the surroundings mainly in the sediments of the streams and their terraces, and, to a lesser degree, to the soils around it, showing that the main route of dissemination is through runoff; the same trend is followed by the potential ecological risk, being extreme in the sediments of the pithead, serious in the tailings and terrace sediments, high in the stream sediments and medium in the surrounding soils. The enzymatic activity by DHA tells us that the health of the surrounding soils is better than that of the stream sediments and terrace sediments, but less than in other sites affected by mining activity in Spain. Cyanide species are linked to DHA and this in turn is favoured by organic matter (OM). On the other hand, it was observed that cyanide elutes from the tailing’s piles in a complex cyanide way, favouring the transport of PTEs associated with it to the stream sediments.
Regarding the risks to human health in soils, As and Cu concentrations exceed the limits for non-carcinogenic and carcinogenic risk in both children and adults, with the residential scenario being the worst scenario, and for adults also the agricultural scenario. In edible plants such as rice, corn, cassava and tea leaves, Sb exceeds the limit for non-carcinogenic risk, and Cu and As for carcinogenic risk. Due to the potential ecological and human health risks that the area represents, actions must be taken to reduce them.
Keywords: potentially toxic elements (PTEs), gold mine, risk assessment, edible plants, human health.
How to cite: González-Valoys, A. C., Esbrí, J. M., Jiménez Salgado, J. U., Rodríguez, R., García-Noguero, E. M., Monteza-Destro, T., Vargas-Lombardo, M., Garcia-Ordiales, E., Arrocha, J., Martínez, E., Campos, J. A., Gutierréz, E., García-Giménez, R., Jiménez-Ballesta, R., García-Navarro, F. J., and Higueras, P.: Environmental and human health risks due to mining activity in the soils and plants of the Remance mine, Panama, EGU General Assembly 2022, Vienna, Austria, 23–27 May 2022, EGU22-9882, https://doi.org/10.5194/egusphere-egu22-9882, 2022.
EGU22-10121 | Presentations | SSS7.4
Biochar and metal-organic framework nanocomposite: Application for immobilization of Cu in polluted industrial soilMuhammad Tukur Bayero, Mahmoud Mazarji, Tatiana Bauer, Tatiana Minkina, Svetlana Sushkova, Saglara Mandzhieva, Anna Timofeeva, Rıdvan Kızılkaya, and Coşkun Gülser
Mobilization of heavy metal ions has increasingly become a serious environmental issue globally, in the contaminated soils, calling for an urgent need to find environmentally friendly materials. With the continuing maturation of research on using biochar (BC) for the remediation of contaminated soil, compositing metal-organic framework (MOF), which is a highly crystalline porous material, has gradually attracted increasing attention. Compared with BC, BC-MOF has unique underexplored potential as an amendment for immobilization of heavy metal ions, including a high specific surface area and a large number of individual functional groups. The efficacy of BC-MOF for immobilization of toxic heavy metal contaminants in soil systems was investigated in the small leaching columns. The amendments (except BC) decreased the water-soluble and exchangeable content of Cu in Technosol compared to the unpolluted soil. The presence of MOF on the BC surface contributed to the higher immobilization efficacy, which was probably due to the synergistic effects among them. The mechanism of the immobilization process on BC-MOF was proposed. The obtained results highlight the promise of utilizing BC-MOF as a remediation material for Cu immobilization in the soil.
The research was financially supported by the Ministry of Science and Higher Education of the Russian Federation project on the development of the Young Scientist Laboratory (no. LabNOTs-21-01AB) and the Russian Foundation for Basic Research, project no. 19-34-60041 and 19-29-05265.
How to cite: Bayero, M. T., Mazarji, M., Bauer, T., Minkina, T., Sushkova, S., Mandzhieva, S., Timofeeva, A., Kızılkaya, R., and Gülser, C.: Biochar and metal-organic framework nanocomposite: Application for immobilization of Cu in polluted industrial soil, EGU General Assembly 2022, Vienna, Austria, 23–27 May 2022, EGU22-10121, https://doi.org/10.5194/egusphere-egu22-10121, 2022.
EGU22-10520 | Presentations | SSS7.4
Tools for the adaptation to climate change and monitoring of soil environmental quality.Maria Jose Martínez-Sanchez, Carmen Perez-Sirvent, Salvadora Martínez-López, Lucía Martínez-Martínez, Carmen Gómez-Martínez, Jaume Bech, and Manuel Hernández-Córdoba
The use of indicators for soil monitoring is a long-established methodology that can be applied in the context of climate change. It makes it possible to establish the state of the variable to be measured and to obtain an objective signal of the changes that occur over time. Obtaining a climate adaptation indicator (CAI) for Mediterranean rainfed soils is a very useful monitoring tool for decision-making and for the incorporation of mitigation measures.
Within the LIFE AMDRYC4 project, a framework has been outlined in which a) environmental indicators of the chemical degradation of soils (salinity, alkalinity, fertility, phytotoxicity) and the erosion indicator, b) biodiversity indicators (vegetation indices, Shannon-Weaver indices, Simpson, ...) and c) organic carbon indicator have been used. These primary indicators can be summarized resulting in a higher rank one represented by the soil ecosystem services indicator (SESI) which reflects the soil global condition obtained from the base data for each established monitoring point. By combining the SESI with a transformative indicator such as the one calculated on the basis of the increase of organic C in the soil (mitigation indicator, MI), the indicator of climate adaptation is obtained, using a procedure based on fuzzy methodology.
In the calculation of the phytotoxicity indicator, the assimilable values of selected trace elements that can cause phytotoxicity are determined and their variation over time is monitored. The selected trace elements, in this case Pb, Cd and B, may vary from one area to another depending on the geochemical background of the soil.
The results obtained for several soil plots that have been subjected to organic matter incorporation treatments (sewage sludge, manure from different animals, composted plant remains) and their untreated counterparts (blank) clearly show an improvement of the soil characteristics after the application of the mentioned soil treatment strategies. The soils are not affected by the polluting processes, both in terms of potentially toxic elements and other emerging pollutants. The experimental data obtained indicate that the remediated soils can be useful to reduce the concentration of greenhouse gases in the atmosphere and represent a good tool for combating climate change.
The authors are grateful to LIFE16 CCA/ES/000123-LIFE AMDRYC4 Project for the financial support
How to cite: Martínez-Sanchez, M. J., Perez-Sirvent, C., Martínez-López, S., Martínez-Martínez, L., Gómez-Martínez, C., Bech, J., and Hernández-Córdoba, M.: Tools for the adaptation to climate change and monitoring of soil environmental quality., EGU General Assembly 2022, Vienna, Austria, 23–27 May 2022, EGU22-10520, https://doi.org/10.5194/egusphere-egu22-10520, 2022.
EGU22-10530 | Presentations | SSS7.4 | Highlight
Planning for a healthy landscape to provide healthy soils. Restoring the Headwater SystemSelma B. Pena, Manuela R. Magalhães, and Maria Manuela Abreu
Land use and management practices are the primary cause of land degradation, including soil loss, soil pollution, and biodiversity loss. The goal of achieving a healthy soil capable of providing a wide range of ecosystem services should be guaranteed by integrating these goals in the landscape planning system.
Landscape planning methodologies should integrate a perspective of understanding the ecological suitability for different activities to avoid the risk of taking land degradation to a level of difficulty to recover. Those methodologies also need to involve the landowners, define the best management practices, and inform about landowners' financial returns. In Portugal, municipal plans (PDM) are defined at a scale of 1:25000, binding private parties. However, they are very superficial in informing landowners about land potentiality and management practices, and they do not identify where ecosystem restoration should occur.
This work aims to show how priority areas for restoration can be identified and included in municipal landscape plans to provide a good chemical, biological and physical condition of soils. The methodology is defined in Geographic Information System (GIS), and it is based on ecological-based principles. In particular, it is shown how the headwater system's restoration could be planned. The Headwater System is located between the beginning of the water network and the ridgeline and plays an essential role in regulating water and returning quality to the soil. The best suitable land use in the headwater system is a mixed forest consisting of species of potential natural vegetation that will return nutrients to the soil, maximize organic matter, reduce the risk of erosion and regulate the water cycle, while being an essential tool for controlling human activities, also preventing actions that lead to soil pollution.
The headwaters were mapped in GIS considering a drainage area of 0.05 km2, for the study area, which comprises 55 thousand hectares. The present study evaluates the current land uses in the headwaters, identifying Hotspots for ecological restoration and identifying opportunities for improving the landscape planning system.
The results show that about one-third of the study area is made up of headwaters located in a very hilly relief with very thin soils. The dominant land uses are eucalyptus forest, shrubs, and old areas of maritime pine that burned in the 2017 mega-fires. The potential natural vegetation shows that these sites are suitable for Quercus pyrenaica, Quercus suber, Quercus robur, and Castanea sativa.
The adequate land use of the headwater system will significantly impact the ecological function of its river basin. The restoration of these areas will provide better ecosystem services by avoiding soil loss and reducing floods downstream, improving water infiltration and its quality, and increasing biodiversity. The integration of headwater restoration in the landscape planning system can be a crucial tool for attaining healthy soils.
How to cite: Pena, S. B., Magalhães, M. R., and Abreu, M. M.: Planning for a healthy landscape to provide healthy soils. Restoring the Headwater System, EGU General Assembly 2022, Vienna, Austria, 23–27 May 2022, EGU22-10530, https://doi.org/10.5194/egusphere-egu22-10530, 2022.
EGU22-11920 | Presentations | SSS7.4
Integrating methods to discriminate the soil historical pollution sources and assess the degree of contamination and related health risks in an urban environment: the Commune of Santiago (Chile) case study.Stefano Albanese, Antonio Aruta, Linda Daniele, Claudia Cannatelli, Jamie T. Buscher, Benedetto De Vivo, Attila Petrik, Domenico Cicchella, and Annamaria Lima
The Commune of Santiago is an administrative unit belonging to Chile's capital city. It is the central hub for local transportation services and the centre of most national government functions. In 2017, a geochemical survey was carried out focusing on the topsoils of the commune. A total of 121 samples were homogeneously collected across an area of 22.4 sqkm to determine the spatial distribution of potentially toxic elements (PTE) and discover their primary and secondary sources. In the aim of the work, the assessment of human health risk for the local population was also included considering both the direct contact with soils and the breathing of airborne particles as relevant exposure pathways.
The geochemical baseline maps of 15 PTEs were generated using the Multifractal IDW (MIDW) interpolation, and map intervals were determined using a Concentration-Area plot considering the fractal structure of the geochemical data.
The contamination degree of the urban soil and its pattern was also calculated and mapped after developing a new index, named as Cumulative Contamination Degree (CCD), which integrate information about the severity of contamination and its spatial complexity.
A robust multivariate statistical analysis based on Principal Components (RPCA) was carried out considering the compositional nature of the geochemical data. In addition, to highlight the presence and the geochemical patterns depending on different contamination sources, a Sequential Binary Partition (SBP) was used to generate contrasts among those elements considered as proxies of specific processes (Urban traffic, productive settlements, etc.).
A probabilistic approach was chosen to assess the risk due to exposure to soils for the local population. It was based on Monte Carlo simulation to include uncertainty due to spatial variation of data and the relative mobility of people within the borders of the study area.
The results obtained show that the innovation proposed to assess contamination and discriminate its sources, even when they are of secondary relevance, can generate positive feedback. Using a probabilistic approach in a non-site specific framework can even be considered a more reliable method to assess risks if we want to not underestimate the burden of uncertainty that substantially influences the results.
How to cite: Albanese, S., Aruta, A., Daniele, L., Cannatelli, C., Buscher, J. T., De Vivo, B., Petrik, A., Cicchella, D., and Lima, A.: Integrating methods to discriminate the soil historical pollution sources and assess the degree of contamination and related health risks in an urban environment: the Commune of Santiago (Chile) case study., EGU General Assembly 2022, Vienna, Austria, 23–27 May 2022, EGU22-11920, https://doi.org/10.5194/egusphere-egu22-11920, 2022.
EGU22-12397 | Presentations | SSS7.4
Ecotoxicological risk assessment of the Guadiamar Green Corridor soils 20 years after the Aznalcóllar mining accidentMario Paniagua-López, Rocío Pastor-Jáuregui, Antonio Aguilar-Garrido, Ana Romero-Freire, and Manuel Sierra-Aragón
The present study evaluates the potential toxicity of the soils of the Guadiamar Green Corridor (GGC) (Seville, SW Spain) affected by the Aznalcóllar mine spill, one of the most important mining accidents in Europe in recent decades. Twenty years after the accident, soils affected by residual contamination are still present in the area, for which their potential toxicity was assessed by carrying out bioassays with lettuce (Latuca sativa L.), earthworms (Eisenia andrei) and determining the microbial activity by measuring the basal respiration and the microbial metabolic quotient (qCO2) of these soils at surface level (0-10 cm). A total of 84 soil samples were taken along the GGC, which were divided into four types (SS1-SS4) according to their physicochemical properties. Soils SS1 and SS2 showed a higher environmental toxicity risk, with a reduction in root elongation of lettuce seeds of 57% and 34% compared to the control, as well as a higher metabolic quotient (23.9 and 18.1 ng CcO2 µg Cmicrob-1 h-1), significantly higher than those measured in SS3 and SS4.
The potential risk to humans of these soils through ingestion, inhalation, and skin exposure routes for the main potentially toxic elements (PTEs) present in the GGC (Pb, and As) was also evaluated based on EPA empirical models, in which the total exposure through each of the three routes was considered. The results obtained indicate that there is no potential risk for human health throughout the GGC considering the exposure for both adults and children, although there are areas of the corridor where the Guideline values for both Pb and As are exceeded. This, together with the potential toxicity of the soils to the ecosystem shown by the bioassays, indicate the need to monitor over time the human and environmental risks in the area to guarantee the safety and enjoyment of this natural area.
How to cite: Paniagua-López, M., Pastor-Jáuregui, R., Aguilar-Garrido, A., Romero-Freire, A., and Sierra-Aragón, M.: Ecotoxicological risk assessment of the Guadiamar Green Corridor soils 20 years after the Aznalcóllar mining accident, EGU General Assembly 2022, Vienna, Austria, 23–27 May 2022, EGU22-12397, https://doi.org/10.5194/egusphere-egu22-12397, 2022.
EGU22-12578 | Presentations | SSS7.4 | Highlight
Recovering abandoned mine area under semi-arid conditions with Technosols: a pilot assay in São Domingos legacy siteDiego Aran, Maria Manuela Abreu, Catarina Diamantino, Edgar Carvalho, and Erika S. Santos
In Portugal, there are numerous abandoned mines, many of them derived from an intense activity in massive sulfides. These areas have several environmental problems associated to extreme physicochemical characteristics of their wastes and leachates.
In São Domingos mine, there is an additional environmental problem derived from the percolation of acid mine drainage over the slopes. This measure, used in environmental management of waters, contributed to the total degradation of the edaphic system and enrichment of bedrock in potentially toxic elements (PTE). A sustainable strategy for environmental recovery using Technosols, designed specifically for each contaminated or degraded material, has been evaluated in this scenario. A pilot area, with 1.5 ha, was rehabilitated by applying a 40 cm layer of Technosol with alkaline and eutrophic properties. A biodiverse plant system with herbaceous and shrubs was applied. The efficiency of the Technosol was evaluated at short-medium term by: a)several indicators associated to plant development (visual signs of phytotoxicity or nutritional deficiency, percentage of plant cover and height) after 15 days, 1, 3 and 6 months, and b)the maintenance of soil properties after 6 months. An area without Technosol application was used as control.
In Control area, plant cover was low, with maximum values of 8.8% in the third month and height <10 cm. However this vegetation cover was not with the sown plants but only native species, like Spergularia purpurea (dominant species identified) that already existed in the area.
In the area with Technosol application, the plants did not show visible signs of phytotoxicity or nutritional deficiency. The percentage of plant cover increases rapidly. After 15 days plant cover was 10–30% and between first and third month, when there were warmer and dry conditions, the coverage increased to 70% and 90%, respectively. After 6 months, coinciding with a change in the vegetative cycle and very dry and hot period from summer, the vegetation only decrease ≈10%. The height varied between 40 to 60 cm, reaching these maximum values in the third month. The plant development remained during the monitoring period. This plant evolution shows the significant water-holding capacity and fertility of the Technosol.
After 6 months, Technosol samples maintained the alkaline and eutrophic properties and physico-chemical characteristics (pH 7.5–7.8, 85 g C/kg, 6 g N/kg, Capacity of cation change 54.3–73 cmol+/kg). In the Technosol was not verified an enrichment by PTE, due to its direct contact with acidic and contaminated material. In Control area, the substrate maintained acidic reaction conditions (pH 3.5–3.6), very low fertility and high concentration of several elements.
Application of the Technosol contributed to the environmental recovery of mine areas, with very acid material with multielementar contamination where it is inexistent an edaphic system. This green technology is an effective solution to the conversion non-productive areas to productive areas.
Acknowledgment: This work was executed by EDM under a concession contract for environmental remediation of legacy mines in Portugal, in collaboration with ISA-ULisboa, LEAF and Inproyen, and was financed by POSEUR EC Cohesion Funds (145/POSEUR/2020). This research is into the scope of the project UID/AGR/04129/2020.
How to cite: Aran, D., Abreu, M. M., Diamantino, C., Carvalho, E., and S. Santos, E.: Recovering abandoned mine area under semi-arid conditions with Technosols: a pilot assay in São Domingos legacy site, EGU General Assembly 2022, Vienna, Austria, 23–27 May 2022, EGU22-12578, https://doi.org/10.5194/egusphere-egu22-12578, 2022.
Please decide on your access
Please use the buttons below to download the presentation materials or to visit the external website where the presentation is linked. Regarding the external link, please note that Copernicus Meetings cannot accept any liability for the content and the website you will visit.
Forward to presentation link
You are going to open an external link to the presentation as indicated by the authors. Copernicus Meetings cannot accept any liability for the content and the website you will visit.
We are sorry, but presentations are only available for users who registered for the conference. Thank you.
EGU22-12756 | Presentations | SSS7.4
Effect of Technosol application way on chemical quality of percolated leachates from sulfide-rich tailingErika S. Santos, Adelaida Pastrac Lungu, and Diego Arán
Sulfide mine tailings present particular challenges in terms of risks of environmental recovery due to the acid lixiviation rich in several metal(oids) and sulfates. The conventional closure systems of these tailings have very high cost of implementation and, especially, maintenance of plant cover and continuous leachates treatment. Therefore, the improvement of the chemical characteristics of the tailings and their leachates is a more cost-effective strategy, especially if sustainable technologies are used. The use of designed Technosols is an option. The current study advances past field and laboratory findings by integrating a circular-economy approach into the chemical and soil science-based treatment of such tailings.
A column assay under controlled conditions was set up in order to evaluate the efficiency of a designed Technosol, applied into two ways, on the chemical improvement of the leachates from sulfide-rich tailing. A designed Technosol with alkaline and eutrophic properties was mixed with tailing material (TEC1) or applied as a superficial and distinct layer (TEC2). Tailing without treatment was used as control. The evolution of pH, Electrical conductivity (EC), Fe and sulfates levels was evaluated during 6 weeks in percolated leachates.
The tailing material was previously assessed as having pH ≈2.5 and total concentrations of 104-110 g Fe/kg and 60.0-67.5 g S/kg. Percolated leachates had a pH values between 1.73 and 2.68 and high EC (≈10 mS/cm) that indicate the high amount of several elements and, consequently, their environmental risk.
The first week’s pH increased to ≈6.5 for the TEC1 while in TEC2 was ≈2.5. Following weeks, the pH stabilized at around 7.3 in the TEC1 and 2.6 in the TEC2.. The EC decreased in the first week 73% in the TEC1 and 81% in the TEC2, compared to control. In control, EC presented upwards spikes within the first two weeks, reaching almost 14 mS/cm, and then more stable values. . Notably, the EC for TEC 1 was low (<1.6 mS/cm) and rather stable throughout the experiment, for TEC2 it presented large, gradual drops in the first two weeks, followed by rather stable value and slightly lower than control. Fe concentrations largely mirrored these EC patterns. Iron concentrations in control were high varying 60 and 7546 mg/L during the assay. Technosol application was effective in the diminution of Fe concentrations in the leachates (TEC1 > 1000-fold and TEC2 2-100 fold lower than control).
Overall, both application mode of the Tecnhosol contribute to improvements in the leachates quality. Nonetheless, these results showed that TEC1 approach might result in more stable and better chemical quality of the leachates. Importantly, these findings also suggest the improvement in the tailing structure of TEC1 compared to TEC2, contributing to lower risk of lixiviation into the lower layers.
Acknowledgment: This research was supported by Fundação para a Ciência e Tecnologia, within the scope of the project UID/AGR/04129/2020 (Project Non-foodCropMine).
How to cite: S. Santos, E., Pastrac Lungu, A., and Arán, D.: Effect of Technosol application way on chemical quality of percolated leachates from sulfide-rich tailing, EGU General Assembly 2022, Vienna, Austria, 23–27 May 2022, EGU22-12756, https://doi.org/10.5194/egusphere-egu22-12756, 2022.
Please decide on your access
Please use the buttons below to download the presentation materials or to visit the external website where the presentation is linked. Regarding the external link, please note that Copernicus Meetings cannot accept any liability for the content and the website you will visit.
Forward to presentation link
You are going to open an external link to the presentation as indicated by the authors. Copernicus Meetings cannot accept any liability for the content and the website you will visit.
We are sorry, but presentations are only available for users who registered for the conference. Thank you.
EGU22-732 | Presentations | OS4.7
Sea-level modelling in the Mediterranean Sea using data assimilationChristian Ferrarin, Marco Bajo, and Georg Umgiesser
The correct reproduction of sea-level dynamics is crucial for forecasting floods and managing the associated risk. On the other hand, sea-level monitoring through observations can provide a description only of past events and it is challenging and costly, both of time and money. In this context, oceanographic models are increasingly used to describe the sea dynamics, providing a spatial/temporal extension to the observations. The best solution, which merges the observation accuracy and the model spatial/temporal resolution, is the data assimilation analysis, which is particularly important in coastal regions with scarce monitoring resources. In this study, we investigate the benefits of assimilating sparse observations from tide gauges in an unstructured hydrodynamic model for simulating the sea level in the Mediterranean Sea. We use the Ensemble Kalman filter, both to obtain an analysis of the past and to produce accurate forecasts. In the analysis we tested the assimilation in storm-surge simulations, only-tide simulations, and total-level simulations, using the observations in the stations. The results of storm-surge simulations were compared with those of total-level simulations, by adding the tide obtained from harmonic analysis of the observations. RMSE and correlation show improvements for all the components of the sea level and all the stations considered (not assimilated). The averaged-over-station RMSE reduces from 9.1 to 3.4 cm for the total level. The greatest improvements happen when the model without assimilation, due to an error of the wind-pressure forcing, did not reproduce some barotropic free modes of oscillation triggered by an initial surge. The preliminary forecast simulations of storm surge show improvements due to the data assimilation extending up to 5 days of forecasting. Even in this case, the longer improvements seem to happen when a free mode of oscillation is triggered. The results of this study will be used to improve the sea level forecasting system in the Adriatic Sea, developed within the framework of the Interreg Italy-Croatia STREAM project (Strategic development of flood management, project ID 10249186).
How to cite: Ferrarin, C., Bajo, M., and Umgiesser, G.: Sea-level modelling in the Mediterranean Sea using data assimilation, EGU General Assembly 2022, Vienna, Austria, 23–27 May 2022, EGU22-732, https://doi.org/10.5194/egusphere-egu22-732, 2022.
Please decide on your access
Please use the buttons below to download the presentation materials or to visit the external website where the presentation is linked. Regarding the external link, please note that Copernicus Meetings cannot accept any liability for the content and the website you will visit.
Forward to presentation link
You are going to open an external link to the presentation as indicated by the authors. Copernicus Meetings cannot accept any liability for the content and the website you will visit.
We are sorry, but presentations are only available for users who registered for the conference. Thank you.
EGU22-923 | Presentations | OS4.7
TOPAZ4b: a new version of the ocean and sea-ice Arctic reanalysisJiping Xie and Laurent Bertino
The second version of the Arctic ocean and sea ice reanalysis is based on the coupled ensemble data assimilation system (TOPAZ4b). Compared to its predecessor (Xie et al. 2017) it has benefited from enhancements to observation, model vertical resolution, and forcing datasets. TOPAZ4 relies on version 2.2 of the HYCOM ocean model and the ensemble Kalman filter data assimilation using 100 dynamical members. A 30-years reanalysis of the Arctic ocean and sea ice has been completed starting in 1991, and made available as the multi-year physical product by the Arctic Marine Forecasting Center (ARC MFC) under the Copernicus Marine Environment Monitoring Service. Contrary to the previous version of the Arctic reanalysis, the systematic errors due to fragmented time series of assimilated observations have been removed by using consistent ESA CCI data. The comparison to in situ profiles shows that the temperature and salinity stratification has been considerably improved by the increased vertical resolution in HYCOM, for example in the East Greenland Sea, the temperature root mean square error (RMSE) from surface to 1400 m has been reduced by 50%. These improvements encourage the use of this Arctic reanalysis for climate studies.
How to cite: Xie, J. and Bertino, L.: TOPAZ4b: a new version of the ocean and sea-ice Arctic reanalysis, EGU General Assembly 2022, Vienna, Austria, 23–27 May 2022, EGU22-923, https://doi.org/10.5194/egusphere-egu22-923, 2022.
Please decide on your access
Please use the buttons below to download the presentation materials or to visit the external website where the presentation is linked. Regarding the external link, please note that Copernicus Meetings cannot accept any liability for the content and the website you will visit.
Forward to presentation link
You are going to open an external link to the presentation as indicated by the authors. Copernicus Meetings cannot accept any liability for the content and the website you will visit.
We are sorry, but presentations are only available for users who registered for the conference. Thank you.

EGU22-2107 | Presentations | OS4.7
Projecting Three-dimensional Ocean Thermohaline Structure in the North Indian Ocean from the Satellite Sea Surface Data Based on a Variational MethodZikang He, Xidong Wang, Xinrong Wu, and Jian Chen
This study uses a variational method combined with satellite observations to reconstruct three-dimensional temperature and salinity profiles for the Northern Indian Ocean (NIO). Sensitivity experiments show that sea surface temperature (SST) dominantly improve the temperature reconstruction of upper 100 m; sea surface salinity (SSS) determines salinity estimation in the upper 100 m; sea surface height anomaly (SSHA) dominates the reconstruction of thermocline. The reconstructed temperature fields can be greatly improved in the thermocline by removing barotropic signal from the altimeter SSH data through a linear regression method. Ocean reanalysis and in situ temperature and salinity data are used to evaluate the results of reconstruction. Comparing with Simple Ocean Data Assimilation (SODA) in 2016, the spectral correlation between the reconstruction and the SODA density anomalies show that the reconstruction fields can retrieve mesoscale and large-scale signals better. Moreover, the reconstruction salinity is much more accurate than SODA salinity in the upper ocean over the Bay of Bengal (BoB). Compared with CTD section observations, the reconstruction fields can capture the mesoscale eddy structure in the Arabian Sea (AS) and BoB well, respectively. The long time series of reconstruction along Argo trajectory shows that the reconstruction fields can better reproduce the observed intraseasonal oscillations of thermocline/halocline in the BoB. Compared with the World Ocean Atlas 2013 (WOA13) climatology, the reconstruction fields can better characterize upper ocean water mass variability.
How to cite: He, Z., Wang, X., Wu, X., and Chen, J.: Projecting Three-dimensional Ocean Thermohaline Structure in the North Indian Ocean from the Satellite Sea Surface Data Based on a Variational Method, EGU General Assembly 2022, Vienna, Austria, 23–27 May 2022, EGU22-2107, https://doi.org/10.5194/egusphere-egu22-2107, 2022.
EGU22-2555 | Presentations | OS4.7
Assimilating the remote sensing ocean color data into a biogeochemical model of the Baltic SeaYe Liu and Lars Arneborg
The objective of this study is to investigate if the assimilation of ocean color data into a complex marine ecosystem model can improve the hindcast of key biogeochemical variables in coastal seas. A localized Singular Evolutive Interpolated Kalman filter was used to make assimilation of the daily fully reprocessed product of Multi-Satellite chlorophyll observations into a three-dimensional ecosystem model of the Baltic Sea. Twin experiments are performed to evaluate the performance of the assimilation with respect to both satellite and in situ observations. Compared to the reference run, the assimilation was found to immediately and considerably reduce the bias, root mean square error, and increase the correlation with the spatial distributions of the assimilated chlorophyll data while this improvement is limited to the upper layer of the water column. This feature is explained by the weak correlation taken into account by the assimilation between the surface and deep phytoplankton. The assimilation scheme used is multivariate, updating all biogeochemical model state variables. The other variables were not degraded by the assimilation. More significantly, the skill metrics for non assimilated variables indicate that the hindcast of the mean data values at L4 was improved; however, improvements in the short-term forecast were not discernable. Our results provide general recommendations for the successful application of ocean color assimilation to hindcast key biogeochemical variables in coastal seas.
How to cite: Liu, Y. and Arneborg, L.: Assimilating the remote sensing ocean color data into a biogeochemical model of the Baltic Sea, EGU General Assembly 2022, Vienna, Austria, 23–27 May 2022, EGU22-2555, https://doi.org/10.5194/egusphere-egu22-2555, 2022.
EGU22-2731 | Presentations | OS4.7
Improving the Surface Currents from the Merging of Altimetry and Sea Surface Temperature Image in the South Indian OceanZhiqiang Chen, Xidong Wang, and Jian Chen
Accurate knowledge of ocean surface currents is crucial for a gamut of applications. In this study, the way in which merging altimeters composited two-dimensional sea surface height (SSH, 1/4°) with remote sensing combined sea surface temperature (SST, 9km) image improves the surface current estimates is investigated. Based on the surface quasigeostrophic (SQG) theory, we reconstruct the surface current by resolving the large scale motions, the mesoscale dynamics, and the oceanic smaller processes. Its feasibility is validated using the altimeter-derived geostrophic current (GC) and drogued drifters in the South Indian Ocean (SIO) during 2011–2015. Results of the two cases show that the effective resolution of the reconstructed surface current (RSC) has improved to 30 km after merging the high-resolution SST information, compared to 70 km of the GC. Moreover, the RSC outperforms the altimeter-derived GC in reproducing the practical dynamical processes. Over the analyzed period, compared with 841 drifters, the statistical results indicate that the RSC reduces the reconstruction errors of zonal velocity, meridional velocity, and velocity phase by about 14.6%, 45.7%, 27.0% in the SIO relative to the GC, respectively. Our method particularly improves the meridional velocity and velocity phase along the Antarctic Circumpolar Current, Agulhas Retroflection, Greater Agulhas System, and South Equatorial Current. In addition, the lower Lagrangian separation distance and higher skill score of the RSC given by Lagrangian analysis also demonstrate that the proposed method is more promising to provide essential information on ocean surface currents applications, such as water property transports, search and rescue, etc.
How to cite: Chen, Z., Wang, X., and Chen, J.: Improving the Surface Currents from the Merging of Altimetry and Sea Surface Temperature Image in the South Indian Ocean, EGU General Assembly 2022, Vienna, Austria, 23–27 May 2022, EGU22-2731, https://doi.org/10.5194/egusphere-egu22-2731, 2022.
EGU22-4313 | Presentations | OS4.7
Improving High Resolution Ocean Reanalyses Using a Smoother AlgorithmBo Dong, Keith Haines, and Matthew Martin
We present a post-hoc smoothing algorithm for use with sequentially generated reanalysis products, utilizing the archive of “future” assimilation increments to update the “current” analysis. This is applied to the Lorenz 1963 model and then to the Met Office GloSea5 Global ¼° ocean reanalysis during 2016. A decay time parameter is applied to the sequential increments which assumes that background error covariances remain spatially unchanged but decay exponentially away from analysis times. Only increments are smoothed so the reanalysis product retains modelled high-frequency variability, e.g., from atmospheric forcing. Results show significant improvement over the original reanalysis in the 3D temperature and salinity variability, as well as in the sea surface height (SSH) and ocean currents. Spatial gap filling from future data is particularly beneficial. The impact on the time variability of ocean heat and salt content, as well as kinetic energy and the Atlantic Meridional Overturning Circulation (AMOC), is demonstrated.
How to cite: Dong, B., Haines, K., and Martin, M.: Improving High Resolution Ocean Reanalyses Using a Smoother Algorithm, EGU General Assembly 2022, Vienna, Austria, 23–27 May 2022, EGU22-4313, https://doi.org/10.5194/egusphere-egu22-4313, 2022.
Please decide on your access
Please use the buttons below to download the presentation materials or to visit the external website where the presentation is linked. Regarding the external link, please note that Copernicus Meetings cannot accept any liability for the content and the website you will visit.
Forward to presentation link
You are going to open an external link to the presentation as indicated by the authors. Copernicus Meetings cannot accept any liability for the content and the website you will visit.
We are sorry, but presentations are only available for users who registered for the conference. Thank you.
EGU22-4741 | Presentations | OS4.7
Variational data assimilation for advanced cross-scale ocean modelling.Marco Stefanelli, Eric Jansen, Ali Aydogdu, Ivan Federico, Giovanni Coppini, and Nadia Pinardi
Eight of the top ten most populated cities in the world are located by the coast. The improvement of the coastal ocean representation is a key topic to understand the present and near-future ocean state and predict its evolution under climate change conditions.
The coastal ocean is difficult to model due to the presence of complex coastlines, interaction with inland waters, rapid changes in topography and highly space-time variability of the phenomena involved. Unstructured-grid models are used to partially attenuate this source of errors in cross-scale (from open sea to coastal regions) oceanographic modelling. On the other hand, the data assimilation methodologies to improve the unstructured-grid models in the coastal seas is being developed only recently (e.g., Aydogdu et al., 2018; Bajo et al., 2019) and needs more advancements.
Here, we show preliminary results from the coastal ocean forecasting system SANIFS (Southern Adriatic Northern Ionian coastal Forecasting System, Federico et al., 2017) based on SHYFEM fully-baroclinic unstructured-grid model (Umgiesser et al., 2004) interfaced with OceanVar (Dobricic and Pinardi, 2008; Storto et al., 2014), a state-of-art variational data assimilation scheme, adopted for several systems based on structured grid (e.g. regional CMEMS for Mediterranean and Black Seas, marine.cmems.eu).
In OceanVar, Empirical Orthogonal Functions (EOFs) method is used to reduce the dimensionality of computation removing the statistically less significant modes and to correlate observations and model background in the water column; while the increments are spread horizontally using the recursive filter method. While this method is typically only used to model covariances between neighbouring points in a structured grid, the algorithm has now been generalised and successfully implemented also for unstructured grids.
Preliminary results show that temperature and salinity observations from Argo profilers improve the ocean state. Future steps will also include sea level assimilation.
This work is a starting point in order to improve our forecast of local extreme events (e.g. heat waves and storm surge) which are statistically increasing in number and intensity in the Mediterranean region due to climate change.
How to cite: Stefanelli, M., Jansen, E., Aydogdu, A., Federico, I., Coppini, G., and Pinardi, N.: Variational data assimilation for advanced cross-scale ocean modelling., EGU General Assembly 2022, Vienna, Austria, 23–27 May 2022, EGU22-4741, https://doi.org/10.5194/egusphere-egu22-4741, 2022.
Please decide on your access
Please use the buttons below to download the presentation materials or to visit the external website where the presentation is linked. Regarding the external link, please note that Copernicus Meetings cannot accept any liability for the content and the website you will visit.
Forward to presentation link
You are going to open an external link to the presentation as indicated by the authors. Copernicus Meetings cannot accept any liability for the content and the website you will visit.
We are sorry, but presentations are only available for users who registered for the conference. Thank you.

EGU22-5698 | Presentations | OS4.7
Bivariate sea-ice assimilation for Global Ocean Analysis/ReanalysisAndrea Cipollone, Deep Sankar Banerjee, Ali Aydogdu, Doroteaciro Iovino, and Simona Masina
Recent intercomparison studies among ocean/sea-ice Reanalyses (such as ORA-IP) have shown large discrepancies in many sea-ice-related fields, despite a rather general agreement in the sea-ice extension. The low accuracy of sea-ice thickness measurements together with the highly non-gaussian distributions of related uncertainty, made multivariate sea-ice data assimilation (DA) strategies still at an early stage, although nearly twenty years of thickness observations are now available. In a standard multivariate scheme, the break of Gaussianity can generate un-realistic corrections due to the poor linear relationship driven by the B matrix.
One approach to solve the problem is the implementation of anamorphous transformations that modify the probability density functions of ice anomalies into Gaussian ones (Brankart et al. 2012). In this study, a 3DVar DA scheme (called OceanVar), employed in the routinely production of global/regional ocean reanalysis CGLORS (Storto et al, 2016), has been recently extended to ingest sea-ice concentration (SIC) and thickness (SIT) data. An anamorphous operator, firstly developed and made freely available within the SANGOMA project (http://www.data-assimilation.net/), has been updated and adapted for the bivariate assimilation of SIC/SIT within the OceanVar framework.
We present the comparison among several sensitivity experiments that were performed assimilating different observation datasets and using different DA configurations at 1/4 degree global resolution. Specifically, we assess the impact of ingesting different SIT products, such as SMOS and CRYOSAT-2 data or the merged product CS2SMOS.
We show that the sole assimilation of SIC improves the spatial representation of SIT with respect to a free run. The inclusion of thickness correction, determined by empirical relations, appears to improve the sea ice characteristics in the Atlantic sector and degrade them in the Siberian region; therefore a refined tuning could probably be beneficial. The spatial error reduces sharply only once CRYOSAT-2 data are assimilated jointly with SIC data. In the present set up, all the experiments generally tend to overestimate the sea-ice volume in the case SMOS data are not assimilated. However, observational errors associated with SMOS data are generally too small, leading to jumps in the volume time series at the beginning of the accretion period if not calibrated correctly.
The proposed approach is suitable to be used for covarying ocean/sea-ice variables in future coupled ocean/sea-ice DA.
Storto, A. and Masina, S. (2016), Earth Syst. Sci. Data, 8, 679, doi: 0.5194/essd-8-679-2016
Brankart, et al. (2012), Ocean Sci., 8, 121, doi: 10.5194/os-8-121-2012
How to cite: Cipollone, A., Banerjee, D. S., Aydogdu, A., Iovino, D., and Masina, S.: Bivariate sea-ice assimilation for Global Ocean Analysis/Reanalysis, EGU General Assembly 2022, Vienna, Austria, 23–27 May 2022, EGU22-5698, https://doi.org/10.5194/egusphere-egu22-5698, 2022.
EGU22-6451 | Presentations | OS4.7
Measurement and modeling of small-scale to mesoscale ocean circulation in the Straits of FloridaBreanna Vanderplow, John Kluge, Alexander Soloviev, Richard Dodge, Jon Wood, Johanna Evans, William Venezia, and Michael Ferrar
Predicting ocean circulation in strong currents remains challenging because of limits in modelling capabilities such as resolution. Coastal ocean circulation models typically have horizontal resolution starting from 1 km. To address this matter, we have developed a high resolution three-dimensional computational fluid dynamics (CFD) model for strong ocean currents such as the Gulf Stream. Our model domain contains three inlets and an outlet and has been verified with field data from the Straits of Florida. For model verification, a 6 ADCP mooring array in a rectangular shape was deployed 8 miles offshore on the Miami Terrace. The data from 5 ADCP moorings were used to produce the inlet boundary conditions, which were updated every 1 minute. The sixth ADCP in the center of the outlet was used for model verification. This approach has demonstrated good predictive ability for ocean circulation in the challenging environment of a strong western boundary current. We anticipate our work to be a starting point for the development of sophisticated prediction models applicable to western boundary currents in the range from small-scales to sub-mesoscales, based on advanced data assimilation techniques.
How to cite: Vanderplow, B., Kluge, J., Soloviev, A., Dodge, R., Wood, J., Evans, J., Venezia, W., and Ferrar, M.: Measurement and modeling of small-scale to mesoscale ocean circulation in the Straits of Florida, EGU General Assembly 2022, Vienna, Austria, 23–27 May 2022, EGU22-6451, https://doi.org/10.5194/egusphere-egu22-6451, 2022.
Please decide on your access
Please use the buttons below to download the presentation materials or to visit the external website where the presentation is linked. Regarding the external link, please note that Copernicus Meetings cannot accept any liability for the content and the website you will visit.
Forward to presentation link
You are going to open an external link to the presentation as indicated by the authors. Copernicus Meetings cannot accept any liability for the content and the website you will visit.
We are sorry, but presentations are only available for users who registered for the conference. Thank you.
EGU22-6848 | Presentations | OS4.7
Effects of inclusion of adjoint sea ice rheology on estimating ocean-sea ice stateGuokun Lyu and Meng Zhou
As part of the ongoing development of a data assimilation system for reconstructing the Arctic ocean-sea ice state, we incorporated an adjoint of sea ice rheology, which was approximated by free drift assumption due to stability problem, into an adjoint model of a coupled ocean-sea ice model. The adjoint sensitivity experiments show that the internal stress effect, represented by the adjoint rheology, induced remarkable differences in the sensitivities to ice drift and wind stress in the central Arctic Ocean. In contrast, ice is mostly free drift in the marginal ice zone. The assimilation experiments reveal that including the adjoint of ice rheology helps extract observational information, especially the ice drift observations, which improves the estimation of the sea ice decline process in 2012. The results suggested great potentials for further improving the Arctic ocean-ice state estimation in the framework of the adjoint method with the adjoint sea ice rheology included.
How to cite: Lyu, G. and Zhou, M.: Effects of inclusion of adjoint sea ice rheology on estimating ocean-sea ice state, EGU General Assembly 2022, Vienna, Austria, 23–27 May 2022, EGU22-6848, https://doi.org/10.5194/egusphere-egu22-6848, 2022.
EGU22-1346 | Presentations | ESSI1.2
Enhance pluvial flood risk assessment using spatio-temporal machine learning modelsAndrea Critto, Marco Zanetti, Elena Allegri, Anna Sperotto, and Silvia Torresan
Extreme weather events (e.g., heavy rainfall) are natural hazards that pose increasing threats to many sectors and across sub-regions worldwide (IPCC, 2014), exposing people and assets to damaging effects. In order to predict pluvial flood risks under different spatio-temporal conditions, three generalized Machine Learning models were developed and applied to the Metropolitan City of Venice: Logistic Regression, Neural Networks and Random Forest. The models considered 60 historical pluvial flood events, occurred in the timeframe 1995-2020. The historical events helped to identify and prioritize sub-areas that are more likely to be affected by pluvial flood risk due to heavy precipitation. In addition, while developing the model, 13 triggering factors have been selected and assessed: aspect, curvature, distance to river, distance to road, distance to sea, elevation, land use, NDVI, permeability, precipitation, slope, soil and texture. A forward features selection method was applied to understand which features better face spatio-temporal overfitting in pluvial flood prediction based on AUC score. Results of the analysis showed that the most accurate models were obtained with the Logistic Regression approach, which was used to provide pluvial flood risk maps for each of the 60 major historical events occurred in the case study area. The model showed high accuracy and most of the occured events in the Metropolitan City of Venice have been properly predicted, demostrating that Machine Learning could substantially improve and speed up disaster risk assessment and mapping helping in overcoming most common bottlenecks of physically-based simulations such as the computational complexity and the need of large datasets of high-resolution information.
How to cite: Critto, A., Zanetti, M., Allegri, E., Sperotto, A., and Torresan, S.: Enhance pluvial flood risk assessment using spatio-temporal machine learning models, EGU General Assembly 2022, Vienna, Austria, 23–27 May 2022, EGU22-1346, https://doi.org/10.5194/egusphere-egu22-1346, 2022.
EGU22-3131 | Presentations | ESSI1.2
Language model for Earth science for semantic searchRahul Ramachandran, Muthukumaran Muthukumaran Ramasubramanian, Prasanna Koirala, Iksha Gurung, and Manil Maskey
Recent advances in technology have transformed the Natural Language Technology (NLT) landscape, specifically, the use of transformers to build language models such as BERT and GPT3. Furthermore, it has been shown that the quality and the domain-specificity of input corpus to language models can improve downstream application results. However, Earth science research has minimal efforts focused on building and using a domain-specific language model.
We utilize a transfer learning solution that uses an existing language model trained for general science (SciBERT) and fine-tune it using abstracts and full text extracted from various Earth science journals to create BERT-E (BERT for Earth Science). The training process utilized the input of 270k+ Earth science articles with almost 6 million paragraphs. We used Masked Language Modeling (MLM) to train the transformer model. MLM works by masking random words in the paragraph and optimizing the model for predicting the right masked word. BERT-E was evaluated by performing a downstream keyword classification task, and the performance was compared against classification results using the original SciBERT Language Model. The SciBERT-based model attained an accuracy of 89.99, whereas the BERT-E-based model attained an accuracy of 92.18, showing an improvement in overall performance.
We investigate employing language models to provide new semantic search capabilities for unstructured text such as papers. This search capability requires utilizing a knowledge graph generated from Earth science corpora with a language model and convolutions to surface latent and related sentences for a natural language query. The sentences in the papers are modeled in the graph as nodes, and these nodes are connected through entities. The language model is used to give sentences a numeric representation. Graph convolutions are then applied to sentence embeddings to obtain a vector representation of the sentence along with combined representation of the surrounding graph structure. This approach utilizes both the power of adjacency inherently encoded in graph structures and latent knowledge captured in the language model. Our initial proof of concept prototype used SIMCSE training algorithm (and the tinyBERT architecture) as the embedding model. This framework has demonstrated an improved ability to surface relevant, latent information based on the input query. We plan to show new results using the domain-specific BERT-E model.
How to cite: Ramachandran, R., Muthukumaran Ramasubramanian, M., Koirala, P., Gurung, I., and Maskey, M.: Language model for Earth science for semantic search, EGU General Assembly 2022, Vienna, Austria, 23–27 May 2022, EGU22-3131, https://doi.org/10.5194/egusphere-egu22-3131, 2022.
EGU22-3855 | Presentations | ESSI1.2
CGC: an open-source Python module for geospatial data clusteringOu Ku, Francesco Nattino, Meiert Grootes, Emma Izquierdo-Verdiguier, Serkan Girgin, and Raul Zurita-Milla
With the growing ubiquity of large multi-dimensional geodata cubes, clustering techniques have become essential to extracting patterns and creating insights from data cubes. Aiming to meet this increasing need, we present Clustering Geodata Cubes (CGC): an open-source Python package designed for partitional clustering of geospatial data. CGC provides efficient clustering methods to identify groups of similar data. In contrast to traditional techniques, which act on a single dimension, CGC is able to perform both co-clustering (clustering across two dimensions e.g., spatial and temporal) and tri-clustering (clustering across three dimensions e.g., spatial, temporal, and thematic), as well as of subsequently refining the identified clusters. CGC also entails scalable approaches that suit both small and big datasets. It can be efficiently deployed on a range of computational infrastructures, from single machines to computing clusters. As a case study, we present an analysis of spring onset indicator datasets at continental scale.
How to cite: Ku, O., Nattino, F., Grootes, M., Izquierdo-Verdiguier, E., Girgin, S., and Zurita-Milla, R.: CGC: an open-source Python module for geospatial data clustering, EGU General Assembly 2022, Vienna, Austria, 23–27 May 2022, EGU22-3855, https://doi.org/10.5194/egusphere-egu22-3855, 2022.
EGU22-3940 | Presentations | ESSI1.2
The Analysis of the Aftershock Sequence of the Recent Mainshock in Arkalochori, Crete Island GreeceAlexandra Moshou, Antonios Konstantaras, and Panagiotis Argyrakis
Forecasting the evolution of natural hazards is a critical problem in natural sciences. Earthquake forecasting is one such example and is a difficult task due to the complexity of the occurrence of earthquakes. Until today, earthquake prediction is based on the time before the occurrence of the main earthquake and is based mainly on empirical methods and specifically on the seismic history of a given area. Τhe analysis and processing of its seismicity play a critical role in modern statistical seismology. In this work, a first attempt is made to study and draw safe conclusions regarding the prediction for the seismic sequence, specifically using appropriate statistical methods like Bayesian predictive, taking into account the uncertainties of the model parameters. The above theory was applied in the recent seismic sequence in the area of Arkalochori in Crete Island, Greece (2021, Mw 6.0). Τhe rich seismic sequence that took place immediately after the main 5.6R earthquake with a total of events for the next three months, approximately 4,000 events of magnitude ML > 1 allowed calculating the probability of having the most significant expected earthquake during a given time as well as calculating the probability that the most significant aftershock is expected to be above a certain magnitude after a major earthquake.
References:
- Ganas, A., Fassoulas, C., Moshou, A., Bozionelos, G., Papathanassiou, G., Tsimi, C., & Valkaniotis, S. (2017). Geological and seismological evidence for NW-SE crustal extension at the southern margin of Heraklion basin, Crete. Bulletin of the Geological Society of Greece, 51, 52-75. doi: https://doi.org/10.12681/bgsg.15004
- Konstantaras, A.J. (2016). Expert knowledge-based algorithm for the dynamic discrimination of interactive natural clusters. Earth Science Informatics. 9 (1), 95-100.
- Konstantaras, A. (2020). Deep learning and parallel processing spatio-temporal clustering unveil new Ionian distinct seismic zone. Informatics. 7 (4), 39.
- Moshou, A., Papadimitriou, E., Drakatos, G., Evangelidis, C., Karakostas, V., Vallianatos, F., & Makropoulos, K. (2014, May). Focal Mechanisms at the convergent plate boundary in Southern Aegean, Greece. In EGU General Assembly Conference Abstracts (p. 12185)
- Moshou, A., Argyrakis, P., Konstantaras, A., Daverona, A.C. & Sagias, N.C. (2021). Characteristics of Recent Aftershocks Sequences (2014, 2015, 2018) Derived from New Seismological and Geodetic Data on the Ionian Islands, Greece. 6 (2), 8.
- C.B., Nolet. G., 1997. P and S velocity structure of the Hellenic area obtained by robust nonlinear inversion of travel times. J. Geophys. Res. 102 (8). 349–367
How to cite: Moshou, A., Konstantaras, A., and Argyrakis, P.: The Analysis of the Aftershock Sequence of the Recent Mainshock in Arkalochori, Crete Island Greece, EGU General Assembly 2022, Vienna, Austria, 23–27 May 2022, EGU22-3940, https://doi.org/10.5194/egusphere-egu22-3940, 2022.
Please decide on your access
Please use the buttons below to download the presentation materials or to visit the external website where the presentation is linked. Regarding the external link, please note that Copernicus Meetings cannot accept any liability for the content and the website you will visit.
Forward to presentation link
You are going to open an external link to the presentation as indicated by the authors. Copernicus Meetings cannot accept any liability for the content and the website you will visit.
We are sorry, but presentations are only available for users who registered for the conference. Thank you.
EGU22-5487 | Presentations | ESSI1.2
3D Mapping of Active Underground Faults Enabled by Heterogeneous Parallel Processing Spatio-Temporal Proximity and Clustering AlgorithmsAlexandra Moshou, Antonios Konstantaras, Nikitas Menounos, and Panagiotis Argyrakis
Underground faults cast energy storage elements of the accumulated strain energy in border areas of active tectonic plates. Particularly in the southern front of the Hellenic seismic arc, a steady yearly flow in the accumulation of strain energy is being due to the constant rate of motion at which the African plate sub-sinks beneath the Eurasian plate. Partial release of the stored energy from a particular underground fold manifests in the form of an earthquake once reaching the surface of the Earth’s crust. The information obtained for each recorded earthquake includes among others the surface location and the estimated hypocentre depth. Considering that hundreds of thousands earthquakes have been recorded in that particular area, the accumulated hypocentre depths provide a most valuable source of information regarding the in-depth extent of the seismically active parts of the underground faults. This research work applies expert knowledge spatio-temporal clustering in previously reported distinct seismic cluster zones, aiming to associate each individual main earthquake along with its recoded foreshocks and aftershocks to a single underground fault in existing two-dimensional mappings. This process is being enabled by heterogeneous parallel processing algorithms encompassing both proximity and agglomerative density-based clustering algorithms upon main seismic events only to mapped. Once a main earthquake is being associated to a particular known underground fault, then the underground fault’s point with maximum proximity to the earthquake’s hypocentre appends its location parameters, additionally incorporating the dimension of depth to the initial planar dimensions of latitude and longitude. The ranges of depth variations provide a notable indication of the in-depth extent of the seismically active part(s) of underground faults enabling their 3D model mapping.
Indexing terms: spatio-temporal proximity and clustering algorithms, heterogeneous parallel processing, Cuda, 3D underground faults’ mapping
References
Axaridou A., I. Chrysakis, C. Georgis, M. Theodoridou, M. Doerr, A. Konstantaras, and E. Maravelakis. 3D-SYSTEK: Recording and exploiting the production workflow of 3D-models in cultural heritage. IISA 2014 - 5th International Conference on Information, Intelligence, Systems and Applications, 51-56, 2014.
Konstantaras A. Deep learning and parallel processing spatio-temporal clustering unveil new Ionian distinct seismic zone. Informatics. 7 (4), 39, 2020.
Konstantaras A.J. Expert knowledge-based algorithm for the dynamic discrimination of interactive natural clusters. Earth Science Informatics. 9 (1), 95-100, 2016.
Konstantaras A.J., E. Katsifarakis, E. Maravelakis, E. Skounakis, E. Kokkinos and E. Karapidakis. Intelligent spatial-clustering of seismicity in the vicinity of the Hellenic Seismic Arc. Earth Science Research 1 (2), 1-10, 2012.
Konstantaras A., F. Valianatos, M.R. Varley, J.P. Makris. Soft-Computing modelling of seismicity in the southern Hellenic Arc. IEEE Geoscience and Remote Sensing Letters, 5 (3), 323-327, 2008.
Konstantaras A., M.R. Varley, F. Valianatos, G. Collins and P. Holifield. Recognition of electric earthquake precursors using neuro-fuzzy methods: methodology and simulation results. Proc. IASTED Int. Conf. Signal Processing, Pattern Recognition and Applications (SPPRA 2002), Crete, Greece, 303-308, 2002.
Maravelakis E., A. Konstantaras, K. Kabassi, I. Chrysakis, C. Georgis and A. Axaridou. 3DSYSTEK web-based point cloud viewer. IISA 2014 - 5th International Conference on Information, Intelligence, Systems and Applications, 262-266, 2014.
How to cite: Moshou, A., Konstantaras, A., Menounos, N., and Argyrakis, P.: 3D Mapping of Active Underground Faults Enabled by Heterogeneous Parallel Processing Spatio-Temporal Proximity and Clustering Algorithms, EGU General Assembly 2022, Vienna, Austria, 23–27 May 2022, EGU22-5487, https://doi.org/10.5194/egusphere-egu22-5487, 2022.
Please decide on your access
Please use the buttons below to download the presentation materials or to visit the external website where the presentation is linked. Regarding the external link, please note that Copernicus Meetings cannot accept any liability for the content and the website you will visit.
Forward to presentation link
You are going to open an external link to the presentation as indicated by the authors. Copernicus Meetings cannot accept any liability for the content and the website you will visit.
We are sorry, but presentations are only available for users who registered for the conference. Thank you.

EGU22-6955 | Presentations | ESSI1.2
Novel approaches to model assessment and interpretation in geospatial machine learningAlexander Brenning
As the interpretability and explainability of artificial intelligence decisions has been gaining attention, novel approaches are needed to develop diagnostic tools that account for the unique challenges of geospatial and environmental data, including spatial dependence and high dimensionality, which are addressed in this contribution. Building upon the geostatistical tradition of distance-based measures, spatial prediction error profiles (SPEPs) and spatial variable importance proles (SVIPs) are introduced as novel model-agnostic assessment and interpretation tools that explore the behavior of models at different prediction horizons. Moreover, to address the challenges of interpreting the joint effects of strongly correlated or high-dimensional features, often found in environmental modeling and remote sensing, a model-agnostic approach is developed that distills aggregated relationships from complex models. The utility of these techniques is demonstrated in two case studies representing a regionalization task in an environmental-science context, and a classification task from multitemporal remote sensing of land use. In these case studies, SPEPs and SVIPs successfully highlight differences and surprising similarities of geostatistical methods, linear models, random forest, and hybrid algorithms. With 64 correlated features in the remote-sensing case study, the transformation-based interpretation approach successfully summarizes high-dimensional relationships in a small number of diagrams.
The novel diagnostic tools enrich the toolkit of geospatial data science, and may improve machine-learning model interpretation, selection, and design.
How to cite: Brenning, A.: Novel approaches to model assessment and interpretation in geospatial machine learning, EGU General Assembly 2022, Vienna, Austria, 23–27 May 2022, EGU22-6955, https://doi.org/10.5194/egusphere-egu22-6955, 2022.
EGU22-7529 | Presentations | ESSI1.2
Global maps from local data: Towards globally applicable spatial prediction modelsMarvin Ludwig, Álvaro Moreno Martínez, Norbert Hölzel, Edzer Pebesma, and Hanna Meyer
Global-scale maps are an important tool to provide ecologically relevant environmental variables to researchers and decision makers. Usually, these maps are created by training a machine learning algorithm on field-sampled reference data and the application of the resulting model to associated information from satellite imagery or globally available environmental predictors. However, field samples are often sparse and clustered in geographic space, representing only parts of the global environment. Machine learning models are therefore prone to overfit to the specific environments they are trained on - especially when a large set of predictor variables is utilized. Consequently, model validations have to include an analysis of the models transferability to regions where no training samples are available e.g. by computing the Area of Applicability (AOA, Meyer and Pebesma 2021) of the prediction models.
Here we reproduce three recently published global environmental maps (soil nematode abundances, potential tree cover and specific leaf area) and assess their AOA. We then present a workflow to increase the AOA (i.e. transferability) of the machine learning models. The workflow utilizes spatial variable selection in order to train generalized models which include only predictors that are most suitable for predictions in regions without training samples. We compared the results to the three original studies in terms of prediction performance and AOA. Results indicate that reducing predictors to those relevant for spatial prediction, leads to a significant increase of model transferability without significant decrease of the prediction quality in areas with high sampling density.
Meyer, H. & Pebesma, E. Predicting into unknown space? Estimating the area of applicability of spatial prediction models. Methods in Ecology and Evolution 2041–210X.13650 (2021) doi:10.1111/2041-210X.13650.
How to cite: Ludwig, M., Moreno Martínez, Á., Hölzel, N., Pebesma, E., and Meyer, H.: Global maps from local data: Towards globally applicable spatial prediction models, EGU General Assembly 2022, Vienna, Austria, 23–27 May 2022, EGU22-7529, https://doi.org/10.5194/egusphere-egu22-7529, 2022.
EGU22-8323 | Presentations | ESSI1.2
Multi-attribute geolocation inference from tweetsUmair Qazi, Ferda Ofli, and Muhammad Imran
Geotagged social media messages, especially from Twitter, can have a substantial impact on decision-making processes during natural hazards and disasters. For example, such geolocation information can be used to enhance natural hazard detection systems where real-time geolocated tweets can help identify the critical human-centric hotspots of an emergency where urgent help is required.
Our work can extract geolocation information from tweets by making use of five meta-data attributes provided by Twitter. Three of these are free-form text, namely tweet text, user profile description, and user location. The other two attributes are GPS coordinates and place tags.
Tweet text may or may not have relevant information to extract geolocation. In the cases where location information is available within tweet text, we follow toponym extraction from the text using Named Entity Recognition and Classification (NERC). The extracted toponyms are then used to obtain geolocation information using Nominatim (which is open-source geocoding software that powers OpenStreetMap) at various levels such as country, state, county, city.
Similar process is followed for user profile description where only location toponyms identified by NERC are stored and then geocoded using Nominatim at various levels.
User location field, which is also a free form text, can have mentions of multiple locations such as USA, UK. To extract location from this field a heuristic algorithm is adopted based on a ranking mechanism that allows it to be resolved to a single point of location which can be then mapped at various levels such as country, state, county, city.
GPS coordinates provide the exact longitude and latitude of the device's location. We perform reverse geocoding to obtain additional location details, e.g., street, city, or country the GPS coordinates belong to. For this purpose, we use Nominatim’s reverse API endpoint to extract city, county, state, and country information.
Place tag provides a bounding box or an exact longitude and latitude or name information of location-tagged by the user. The place field data contains several location attributes. We extract location information from different location attributes within the place using different algorithms. Nominatim’s search API endpoint to extract city, county, state, and country names from the Nominatim response if available.
Our geo-inference pipeline is designed to be used as a plug-in component. The system spans an elasticsearch cluster with six nodes for efficient and fast querying and insertion of records. It has already been tested on geolocating more than two billion covid-related tweets. The system is able to handle high insertion and query load. We have implemented smart caching mechanisms to avoid repetitive Nominatim calls since it is an expensive operation. The caches are available both for free-form text (Nominatim’s search API) and exact latitude and longitude (Nominatim’s reverse API). These caches help reduce the load on Nominatim and give quick access to the most commonly queried terms.
With this effort, we hope to provide the necessary means for researchers and practitioners who intend to explore social media data for geo-applications.
How to cite: Qazi, U., Ofli, F., and Imran, M.: Multi-attribute geolocation inference from tweets, EGU General Assembly 2022, Vienna, Austria, 23–27 May 2022, EGU22-8323, https://doi.org/10.5194/egusphere-egu22-8323, 2022.
EGU22-8648 | Presentations | ESSI1.2
A graph-based fractality index to characterize complexity of urban form using deep graph convolutional neural networksLei Ma, Stefan Seipel, S. Anders Brandt, and Ding Ma
Inspection of the complexity of urban morphology facilitates understanding of human behaviors in urban space, leading to better conditions for the sustainable design of future cities. Fractal indicators, such as fractal dimension, ht-index, and cumulative rate of growth (CRG) index, have been proposed as measures of such complexity. However, these major fractal indicators are statistical rather than spatial, which leads to failure of characterizing the spatial complexity of urban morphology, such as building footprints. To overcome this problem, in this paper a graph-based fractality index (GFI), based on a hybrid of fractal theories and deep learning techniques, is proposed. To quantify the spatial complexity, several fractal variants were synthesized to train a deep graph convolutional neural network. Building footprints of London were used to test the method and the results show that the proposed framework performs better than traditional indices. Moreover, the possibility of bridging fractal theories and deep learning techniques on complexity issues opens up new possibilities of data-driven GIScience.
How to cite: Ma, L., Seipel, S., Brandt, S. A., and Ma, D.: A graph-based fractality index to characterize complexity of urban form using deep graph convolutional neural networks, EGU General Assembly 2022, Vienna, Austria, 23–27 May 2022, EGU22-8648, https://doi.org/10.5194/egusphere-egu22-8648, 2022.
Please decide on your access
Please use the buttons below to download the presentation materials or to visit the external website where the presentation is linked. Regarding the external link, please note that Copernicus Meetings cannot accept any liability for the content and the website you will visit.
Forward to presentation link
You are going to open an external link to the presentation as indicated by the authors. Copernicus Meetings cannot accept any liability for the content and the website you will visit.
We are sorry, but presentations are only available for users who registered for the conference. Thank you.

EGU22-8891 | Presentations | ESSI1.2
Infilling Spatial Precipitation Recordings with a Memory-Assisted CNNJohannes Meuer, Laurens Bouwer, Étienne Plésiat, Roman Lehmann, Markus Hoffmann, Thomas Ludwig, Wolfgang Karl, and Christopher Kadow
Missing climate data is a widespread problem in climate science and leads to uncertainty of prediction models that rely on these data resources. So far, existing approaches for infilling missing precipitation data are mostly numerical or statistical techniques that require considerable computational resources and are not suitable for large regions with missing data. Most recently, there have been several approaches to infill missing climate data with machine learning methods such as convolutional neural networks or generative adversarial networks. They have proven to perform well on infilling missing temperature or satellite data. However, these techniques consider only spatial variability in the data whereas precipitation data is much more variable in both space and time. Rainfall extremes with high amplitudes play an important role. We propose a convolutional inpainting network that additionally considers a memory module. One approach investigates the temporal variability in the missing data regions using a long-short term memory. An attention-based module has also been added to the technology to consider further atmospheric variables provided by reanalysis data. The model was trained and evaluated on the RADOLAN data set which is based on radar precipitation recordings and weather station measurements. With the method we are able to complete gaps in this high quality, highly resolved spatial precipitation data set over Germany. In conclusion, we compare our approach to statistical techniques for infilling precipitation data as well as other state-of-the-art machine learning techniques. This well-combined technology of computer and atmospheric research components will be presented as a dedicated climate service component and data set.
How to cite: Meuer, J., Bouwer, L., Plésiat, É., Lehmann, R., Hoffmann, M., Ludwig, T., Karl, W., and Kadow, C.: Infilling Spatial Precipitation Recordings with a Memory-Assisted CNN, EGU General Assembly 2022, Vienna, Austria, 23–27 May 2022, EGU22-8891, https://doi.org/10.5194/egusphere-egu22-8891, 2022.
EGU22-10799 | Presentations | ESSI1.2
Design Considerations for the 3rd Spatial Dimension of the Spatiotemporal Adaptive Resolution Encoding (STARE)Michael Rilee and Kwo-Sen Kuo
The real world does not live on a regular grid. The observations with the best spatiotemporal resolution are generally irregularly distributed over space and time, even though as data they are generally stored in arrays in files. Storing the diverse data types of Earth science, including grid, swath, and point based spatiotemporal distributions, in separate files leads to computer-native array layouts on disk or working memory having little or no connection with the spatiotemporal layout of the observations themselves. For integrative analysis, data must be co-aligned both spatiotemporally and in computer memory, a process called data harmonization. For data harmonization to be scalable in both diversity and volume, data movement must be minimized. The SpatioTemporal Adaptive Resolution Encoding (STARE) is a hierarchical, recursively subdivided indexing scheme for harmonizing diverse data at scale.
STARE indices are integers embedded with spatiotemporal attributes key to efficient spatiotemporal analysis. As a more computationally efficient alternative to conventional floating-point spatiotemporal references, STARE indices apply uniformly to all spatiotemporal data regardless of their geometric layouts. Through this unified reference, STARE harmonizes diverse data in their native states to enable integrative analysis without requiring homogenization of the data by interpolating them to a common grid first.
The current implementation of STARE supports solid angle indexing, i.e. longitude-latitude, and time. To fully support Earth science applications, STARE must be extended to indexing the radial dimension for a full 4D spatiotemporal indexing. As STARE’s scalability is based on having a universal encoding scheme mapping spatiotemporal volumes to integers, the variety of existing approaches to encoding the radial dimension arising in Earth science raises complex design issues for applying STARE’s principles. For example, the radial dimension can be usefully expressed via length (altitude) or pressure coordinates. Both length and pressure raise the question as to what reference surface should be used. As STARE’s goal is to harmonize different kinds of data, we must determine whether it is better to have separate radial scale encodings for length and pressure, or should we have a single radial encoding, for which we provide tools for translating between various (radial) coordinate systems. The questions become more complex when we consider the wide range of Earth science data and applications, including, for example, model simulation output, lidar point clouds, spacecraft swath data, aircraft in-situ measurements, vertical or oblique parameter retrievals, and earthquake-induced movement detection.
In this work, we will review STARE’s unifying principle and the unique nature of the radial dimension. We will discuss the challenges of enabling scalable Earth science data harmonization in both diversity and volume, particularly in the context of detection, cataloging, and statistical study of fully 4D hierarchical phenomena events such as extratropical cyclones. With the twin challenges of exascale computing and increasing model simulation resolutions opening new views into physical processes, scalable methods for bringing best-resolution observations and simulations together, like STARE, are becoming increasingly important.
How to cite: Rilee, M. and Kuo, K.-S.: Design Considerations for the 3rd Spatial Dimension of the Spatiotemporal Adaptive Resolution Encoding (STARE), EGU General Assembly 2022, Vienna, Austria, 23–27 May 2022, EGU22-10799, https://doi.org/10.5194/egusphere-egu22-10799, 2022.
Please decide on your access
Please use the buttons below to download the presentation materials or to visit the external website where the presentation is linked. Regarding the external link, please note that Copernicus Meetings cannot accept any liability for the content and the website you will visit.
Forward to presentation link
You are going to open an external link to the presentation as indicated by the authors. Copernicus Meetings cannot accept any liability for the content and the website you will visit.
We are sorry, but presentations are only available for users who registered for the conference. Thank you.
EGU22-10823 | Presentations | ESSI1.2
Scalable Feature Extraction and Tracking (SCAFET): A general framework for feature extraction from large climate datasetsArjun Nellikkattil, June-Yi Lee, and Axel Timmermann
The study describes a generalized framework to extract and track features from large climate datasets. Unlike other feature extraction algorithms, Scalable Feature Extraction and Tracking (SCAFET) is independent of any physical thresholds making it more suitable for comparing features from different datasets. Features of interest are extracted by segmenting the data on the basis of a scale-independent bounded variable called shape index (Si). Si gives a quantitative measurement of the local shape of the field with respect to its surroundings. To illustrate the capabilities of the method, we have employed it in the extraction of different types of features. Cyclones and atmospheric rivers are extracted from the ERA5 reanalysis dataset to show how the algorithm extracts points as well as surfaces from climate datasets. Extraction of sea surface temperature fronts depicts how SCAFET handles unstructured grids. Lastly, the 3D structures of jetstreams is extracted to demonstrate that the algorithm can extract 3D features too. The detection algorithm is implemented as a jupyter notebook[https://colab.research.google.com/drive/1D0rWNQZrIfLEmeUYshzqyqiR7QNS0Hm-?usp=sharing] accessible to anyone to test out the algorithm.
How to cite: Nellikkattil, A., Lee, J.-Y., and Timmermann, A.: Scalable Feature Extraction and Tracking (SCAFET): A general framework for feature extraction from large climate datasets, EGU General Assembly 2022, Vienna, Austria, 23–27 May 2022, EGU22-10823, https://doi.org/10.5194/egusphere-egu22-10823, 2022.
EGU22-13102 | Presentations | ESSI1.2
Reading Between the (Shore)Lines: Real-Time Analytical Processing to Monitor Coastal ErosionZach Anthis
With the far-reaching impact of Artificial Intelligence (AI) becoming more acknowledgeable across various dimensions and industries, the Geomatics scientific community has reasonably turned to automated (in some cases, autonomous) solutions while looking to efficiently extract and communicate patterns in high-dimensional geographic data. This, in turn, has led to a range of AI platforms providing grounds for cutting-edge technologies such as data mining, image processing and predictive/prescriptive modelling. Meanwhile, coastal management bodies around the world, are striving to harness the power of AI and Machine Learning (ML) applications to act upon the wealth of coastal information, emanating from disparate data sources (e.g., geodesy, hydrography, bathymetry, mapping, remote sensing, and photogrammetry). The cross-disciplinarity of stakeholder engagement calls for thorough risk assessment and coastal defence strategies (e.g., erosion/flooding control), consistent with the emerging need for participatory and integrated policy analyses. This paper addresses the issue of seeking techno-centric solutions in human-understandable language, for holistic knowledge engineering (from acquisition to dissemination) in a spatiotemporal context; namely, the benefits of setting up a unified Visual Analytics (VA) system, which allows for real-time monitoring and Online Analytical Processing (OLAP) operations on-demand, via role-based access. Working from an all-encompassing data model could form seamlessly collaborative workspaces that support multiple programming languages (packaging ML libraries designed to interoperate) and enable heterogeneous user communities to visualize Big Data at different granularities, as well as perform task-specific queries with little, or no, programming skill. The proposed solution is an integrated coastal management dashboard, built natively for the cloud (aka leveraging batch and stream processing), to dynamically host live Key Performance Indicators (KPIs) whilst ensuring wide adoption and sustainable operation. The results reflect the value of effectively collecting and consolidating coastal (meta-)data into open repositories, to jointly produce actionable insight in an efficient manner.
How to cite: Anthis, Z.: Reading Between the (Shore)Lines: Real-Time Analytical Processing to Monitor Coastal Erosion, EGU General Assembly 2022, Vienna, Austria, 23–27 May 2022, EGU22-13102, https://doi.org/10.5194/egusphere-egu22-13102, 2022.
EGU22-6332 | Presentations | ESSI3.2
Implementation of a FAIR Compliant Automated Workflow for InfrastructuresUlrich Bundke, Marcel Kennert, Christoph Mahnke, Susanne Rohs, and Andreas Petzold
The European infrastructure In-service Aircraft for a Global Observing System (IAGOS) (www.IAOGS.org) has implemented an automatic workflow for data management organizing the dataflow starting at the sensor towards the central data-portal located in Toulouse. The workflow is realized and documented using the web-based Django framework with a model-based approach using Python.
This workflow performs all necessary data processing and QA/QC tests to automated upload NRT processed data and serves the PI as basis for approval decisions. This includes repeated cycles for different stages of data maturity. The PI can monitor the status of all tasks by web-based reports produced by the Task Manager. An automated reprocessing is possible by storing metadata on all steps as well as decisions of the PI. The implementation of the workflow is one big step to make IAGOS data handling compliant with the FAIR principles (findable, accessible, interoperable, reusable).
The workflow is easy adaptable to manage the workflow of other Infrastructures or research institutes. Thus, we will open the development under MIT license and invite other datacenters to contribute to the development.
Acknowledgments:
This work was supported by European Union's Horizon 2020 research and innovation programme under grant agreement No 824068 and by Helmholtz STSM Grant “DIGITAL EARTH”
How to cite: Bundke, U., Kennert, M., Mahnke, C., Rohs, S., and Petzold, A.: Implementation of a FAIR Compliant Automated Workflow for Infrastructures, EGU General Assembly 2022, Vienna, Austria, 23–27 May 2022, EGU22-6332, https://doi.org/10.5194/egusphere-egu22-6332, 2022.
EGU22-7228 | Presentations | ESSI3.2
French feedback from urban soil geochemical data archive to data sharing: state of mind and intentCecile Le Guern, Jean-François Brunet, Philippe Négrel, Sandrine Lemal, Etienne Taffoureau, Sylvain Grellet, Mickael Beaufils, Clément Lattelais, Christine Le Bas, and Hélène Roussel
Urban territories collect many types of geochemical and physico-chemical data relative to, e.g., soil quality or soil functions. Such data may serve for various purposes like verifying the compatibility with current or future uses, defining (pedo)geochemical backgrounds, establishing levels of exposure to soil pollutants, identifying management options for polluted sites or for excavated soils, verifying the evolution of infiltration ponds, assessing carbon storage, etc. They may also serve to prioritize soil functions and associated ecosystem services such as, e.g., soil fertility, surface and groundwater storage or supply, purification of infiltrated rainwater, etc. Gathering such data in national databases and making them available to stakeholders raises many issues that are technical, legal and social. Should all of the data be made available or only selected portions? How can access and reuse of the data be ensured in a legal fashion? Are statistical and geostatistical methods able to deal with data from heterogeneous origins, allowing their reuse for other purposes than the initial one? In this context, it is necessary to take into account scientific as well as practical considerations and to collect the societal needs of end-users like urban planners.
To illustrate the complexity of these issues and ways to address them, we propose to share the French experience:
- on gathering urban soil geochemical data in the French national database BDSolU. We will present how this database was created, the choices made in relation with the national context, the difficulties encountered, and the questions that are still open.
- on a new interrogation system linking agricultural and urban soil databases (DoneSol and BDSolU), which have different requirements, and the corresponding standards. Such linkage based on interoperability is important in the context of changes of soil use, with for example agricultural soils becoming urbanised soils, or soils from brownfields intended for gardening. It is also necessary to ensure a territorial continuity for users.
The objective is to define a robust and standardised methodology for database conceptualisation, sharing and final use by stakeholders including scientists
How to cite: Le Guern, C., Brunet, J.-F., Négrel, P., Lemal, S., Taffoureau, E., Grellet, S., Beaufils, M., Lattelais, C., Le Bas, C., and Roussel, H.: French feedback from urban soil geochemical data archive to data sharing: state of mind and intent, EGU General Assembly 2022, Vienna, Austria, 23–27 May 2022, EGU22-7228, https://doi.org/10.5194/egusphere-egu22-7228, 2022.
EGU22-8262 | Presentations | ESSI3.2
Data Access Made Easy: flexible, on the fly data standardization and processingMathias Bavay, Charles Fierz, and Rodica Nitu
Automatic Weather Stations (AWS) deployed in the context of research projects provide very valuable data thanks to the flexibility they offer in term of measured meteorological parameters, choice of sensors and quick deployment and redeployment. However this flexibility is a challenge in terms of metadata and data management. Traditional approaches based on networks of standard stations can not accommodate these needs and often no tools are available to manage these research AWS, leading to wasted data periods because of difficult data reuse, low reactivity in identifying potential measurement problems, and lack of metadata to document what happened.
The Data Access Made Easy (DAME) effort is our answer to these challenges. At its core, it relies on the mature and flexible open source MeteoIO meteorological pre-processing library. It was originally developed as a flexible data processing engine for the needs of numerical models consuming meteorological data and further developed as a data standardization engine for the Global Cryosphere Watch (GCW) of the World Meteorological Organization (WMO). For each AWS, a single configuration file describes how to read and parse the data, defines a mapping between the available fields and a set of standardized names and provides relevant Attribute Conventions Dataset Discovery (ACDD) metadata fields, if necessary on a per input file basis. Low level data editing is also available, such as excluding a given sensor, swapping sensors or merging data from another AWS, for any given time period. Moreover an arbitrary number of filters can be applied on each meteorological parameter, restricted to specific time periods if required. This allows to describe the whole history of an AWS within a single configuration file and to deliver a single, consistent, standardized output file possibly spanning many years, many input data files and many changes both in format and available sensors. Finally, all configuration files are kept in a git repository in order to document their history.
A basic email-based interface has been developed that allows to create new configuration files, modify an existing configuration file or request data on-demand for any time period. Every hour, the data for all available configuration files is regenerated for the last 13 months and stored on a shared drive so all are able to access the current data without even having to submit a request. A table is generated showing all warnings or errors produced during the data generation along with some metadata such as the data owner email in order for the data owner to quickly spot troublesome AWS.
How to cite: Bavay, M., Fierz, C., and Nitu, R.: Data Access Made Easy: flexible, on the fly data standardization and processing, EGU General Assembly 2022, Vienna, Austria, 23–27 May 2022, EGU22-8262, https://doi.org/10.5194/egusphere-egu22-8262, 2022.
Please decide on your access
Please use the buttons below to download the presentation materials or to visit the external website where the presentation is linked. Regarding the external link, please note that Copernicus Meetings cannot accept any liability for the content and the website you will visit.
Forward to presentation link
You are going to open an external link to the presentation as indicated by the authors. Copernicus Meetings cannot accept any liability for the content and the website you will visit.
We are sorry, but presentations are only available for users who registered for the conference. Thank you.
EGU22-9960 | Presentations | ESSI3.2
The TRR170-DB Data Repository: The Life Cycle of FAIR Planetary Data from Archive to PublicationElfrun Lehmann and Harry Becker
The TRR170-DB data repository (https://planetary-data-portal.org/) is a Re3data (r3data.org) referenced repository that manages new machine-readable data and resources from the collaborative research center ‘Late Accretion onto Terrestrial Planets’ (TRR 170) and from other institutions in in the planetary science community. Data in the repository reflect the diverse methods and approaches applied in the planetary sciences, including astromaterials data, experimental studies, remote sensing data, images and geophysical modeling data. The TRR170-DB repository follows a data policy and practice that supports Open Science and the FAIR principles (Wilkinson et al., 2016) as promoted by the German National Research Data Infrastructure (www.nfdi.de) and various national and international funding agencies and initiatives. The TRR170-DB framework supports users to align their data storage with the data life cycle of data sharing, persistent data citation, and data publishing. The permanent host of the TRR170-DB is Freie Universität Berlin. This long-term preservation and access of TRR170-DB’s published data ensures them being reused by researchers and the interested public.
The TRR170-DB repository is operated on the open source data management software Dataverse (dataverse.org). A web portal provides access to the storage environment of the datasets. The web portal guides users through the process of data storage and publication. It also informs about legal conditions and embargo periods to safeguard the data publication process. Additional information is available informing the user about data management and data publication related news and training events.
A user can search metadata information to find specific published data collections and files without logging in to TRR170-DB. A recently integrated new tool, the data explorer, assists the user in advanced searches to browse and find published data content. Data suppliers receive data curation services, a permanent archive and a digital object identifier (DOI) to make the dataset unique and findable. We encourage TRR 170 members and other users to store replication datasets by implementing publishing workflows to link publications to data. These replication datasets are freely available, and no permission is required for reuse and verification of a study. TRR170-DB has a flexible data-driven metadata system that uses tailored metadata blocks for specific data communities. Once a dataset has been published, its metadata and files can be exported in various open metadata standards and file formats. This ensures that all data published in the repository are generally accessible for other external databases and repositories (“interoperability”).
We are currently expanding metadata templates to improve interoperability, findability, preservation, and reuse of geochemical data in TRR170-DB. New geochemical metadata templates will incorporate additional standardized information on samples and materials, analytical methods and additional experimental data. Advancing metadata templates will be an ongoing process in which the international scientific community and various initiatives (OneGeochemistry, Astromaterials Data System, etc.) need to interact and discuss what is required.
How to cite: Lehmann, E. and Becker, H.: The TRR170-DB Data Repository: The Life Cycle of FAIR Planetary Data from Archive to Publication, EGU General Assembly 2022, Vienna, Austria, 23–27 May 2022, EGU22-9960, https://doi.org/10.5194/egusphere-egu22-9960, 2022.
EGU22-10726 | Presentations | ESSI3.2
Global Data Standards for Geochemistry: Not the ‘One Ring to Rule Them All’, but a set of ‘Olympic Rings’ that Link and Integrate across ContinentsKerstin Lehnert and Lesley Wyborn
As volumes of geoanalytical data grow, research in geochemistry, volcanology, petrology, and other disciplines working with geoanalytical data is evolving to data-driven and computational approaches that have enormous potential to lead to new scientific discoveries. Application of advanced methods for data mining and analysis including Machine Learning, and Artificial Intelligence, as well as the generation of models for simulating natural processes all require seamless machine-readable access to large interoperable stores of consistently structured and documented geochemical data. Standard protocols, formats, and vocabularies are also critical in order to process, manage, and publish these growing data volumes efficiently with seamless workflows that are supported by interoperable tools.
Today, easy integration of data into Analysis Ready Data stores and the successful and efficient application of new research methodologies to these data stores is hindered by the fragmentation of the international geochemical data landscape that lacks the technical and semantic standards for interoperability; organizational structures to guide and govern these standards; and a scientific culture that supports and prioritizes a global sustainable data infrastructure. In order to harness the scientific treasures hidden in BIG volumes of geochemical data, the science community, geochemistry data providers, publishers, funders, and other stakeholders need to come together to develop, implement, and maintain standards and best practices for geochemical data, and commit to changing the current data culture in geochemistry. The benefits will be wide-ranging and increase the relevance of the discipline.
Although many research data initiatives today focus on the implementation of the FAIR principles for Findable, Accessible, Interoperable, and Reusable data, most data is only human-readable, even though the original purpose of the FAIR principles has been to make data machine-actionable. The development of standards today should not focus on spreadsheet templates used to format and compile project-centric databases that are hard to re-purpose. These methods are not scalable. The focus should be on global solutions where any digital data are born connected to agreed machine readable standards so that researchers can utilize the latest AI and ML techniques.
Global standards for geochemical data should not be perceived as ‘one ring to rule them all’, but rather as a series of interoperable ‘rings’ of data, which like the Olympic rings will integrate data from the all continents and nations.
How to cite: Lehnert, K. and Wyborn, L.: Global Data Standards for Geochemistry: Not the ‘One Ring to Rule Them All’, but a set of ‘Olympic Rings’ that Link and Integrate across Continents, EGU General Assembly 2022, Vienna, Austria, 23–27 May 2022, EGU22-10726, https://doi.org/10.5194/egusphere-egu22-10726, 2022.
Please decide on your access
Please use the buttons below to download the presentation materials or to visit the external website where the presentation is linked. Regarding the external link, please note that Copernicus Meetings cannot accept any liability for the content and the website you will visit.
Forward to presentation link
You are going to open an external link to the presentation as indicated by the authors. Copernicus Meetings cannot accept any liability for the content and the website you will visit.
We are sorry, but presentations are only available for users who registered for the conference. Thank you.
EGU22-11103 | Presentations | ESSI3.2
Data amounts and reproducibility: How FAIR Digital Objects can revolutionise Research WorkflowsIvonne Anders, Karsten Peters-von Gehlen, Hannes Thiemann, Martin Bergemann, Merret Buurman, Andrej Fast, Christopher Kadow, Marco Kulüke, and Fabian Wachsmann
Some disciplines, especially those that look at the Earth system, work with large to very large amounts of data. Storing this data, but also processing it, places completely new demands on scientific work itself.
Let's take the example of climate research and specifically climate modelling. In addition to long-term meteorological measurements in the recent past, results from climate models form the main basis for research and statements on past and possible future global, regional and local climate. Climate models are very complex numerical models that require high-performance computing. However, with the current and future increasing spatial and temporal resolution of the models, the demand for computing resources and storage space is also increasing. Previous working methods and processes no longer hold up and need to be rethought.
Taking the German Climate Computing Centre (DKRZ) as an example, we analysed the users, their goals and working methods. DKRZ provides the climate science community with resources such as high-performance computing (HPC), data storage and specialised services and hosts the World Data Center for Climate (WDCC). In analysing users, we distinguish between two groups: those who need the HPC system to run resource-intensive simulations and then analyse them, and those who reuse, build on and analyse existing data. Each group subdivides into subgroups. We have analysed the workflows for each identified user and found identical parts in an abstracted form and derived Canonical Workflow Modules.
In the process, we critically examined the possible use of so-called FAIR Digital Objects (FDOs) and checked to what extent the derived workflows and workflow modules are actually future-proof.
The vision is that the global integrated data space is formed by standardised, independent and persistent entities that contain all information about diverse data objects (data, documents, metadata, software, etc.) so that human and, above all, machine agents can find, access, interpret and reuse (FAIR) them in an efficient and cost-saving way. At the same time, these units become independent of technologies and heterogeneous organisation of data, and will contain a built-in mechanism that supports data sovereignty. This will make the handling of data sustainable and secure.
So, each step in a research workflow can be a FDO. In this case, the research is fully reproducible, but parts can also be exchanged and, e.g. experiments can be varied transparently. FDOs can easily be linked to others. The redundancy of data is minimised and thus also the susceptibility to errors is reduced. FDOs open up the possibility of combining data, software or whole parts of workflows in a new and simple but at all times comprehensible way. FDOs will make an important contribution to the reproducibility of research results, but they are also crucial for saving storage space. There are already data that are FDOs, but also self-contained frameworks that store data via tracking workflows. Similar to the TCP/IP standard, DO interface protocols are already developed. However, there are still some open points that are currently being worked on and defined with regard to FDOs in order to make them a globally functioning system.
How to cite: Anders, I., Peters-von Gehlen, K., Thiemann, H., Bergemann, M., Buurman, M., Fast, A., Kadow, C., Kulüke, M., and Wachsmann, F.: Data amounts and reproducibility: How FAIR Digital Objects can revolutionise Research Workflows, EGU General Assembly 2022, Vienna, Austria, 23–27 May 2022, EGU22-11103, https://doi.org/10.5194/egusphere-egu22-11103, 2022.
EGU22-11348 | Presentations | ESSI3.2
GEOROC and EarthChem: Optimizing Data Services for Geochemistry through CollaborationMarthe Klöcking, Kerstin Lehnert, Lucia Profeta, Bärbel Sarbas, Jan Brase, Sean Cao, Juan David Figueroa, Wolfram Horstmann, Peng Ji, Annika Johansson, Leander Kallas, Stefan Möller-McNett, Mariyam Mukhumova, Jens Nieschulze, Adrian Sturm, Hannah Sweets, Matthias Willbold, and Gerhard Wörner
Geochemical data are fundamental to understanding many planetary and environmental processes – yet in the absence of a community-endorsed data culture that adheres to common data standards, the geochemical data landscape is highly fragmented. The GEOROC and PetDB databases are leading, open-access resources for geochemical and isotopic rock and mineral data that have collaborated for nearly 25 years to provide researchers with access to large volumes of curated and harmonized data collections. PetDB is a global synthesis of published chemical, isotopic and mineralogical data for rocks, minerals and melt inclusions with a focus on data for igneous and metamorphic rocks from the ocean floor, ophiolites, xenolith samples from the Earth's mantle and lower crust and tephra, operated by the EarthChem data facility. Its counterpart, GEOROC hosts a collection of published analyses of volcanic and plutonic rocks, minerals and mantle xenoliths, predominantly derived from ocean islands and continental settings. These curated, domain-specific databases are increasingly valuable to data-driven and interdisciplinary research and form the basis of hundreds of new research articles each year across numerous earth data disciplines.
Over the last two decades, both GEOROC and EarthChem have invested great efforts into operating data infrastructures for findable, accessible, interoperable and reusable data, while working together to develop and maintain the EarthChem Portal (ECP) as a global open data service to the geochemical, petrological, mineralogical and related communities. The ECP provides a single point of access to >30 million analytical values for >1 million samples, aggregated from independently operated databases (PetDB, NAVDAT, GEOROC, USGS, MetPetDB, DARWIN). Yet one crucial element of FAIR data is still largely missing: interoperability across different data systems, that allows data in separately curated databases, such as GEOROC and PetDB, to be integrated into comprehensive, global geochemical datasets.
Both EarthChem and GEOROC have recently embarked on major new developments and upgrades to their systems to improve the interoperability of their data systems. The new Digital Geochemical Data Infrastructure (DIGIS) initiative for GEOROC 2.0 aims to develop a connected platform to meet future challenges of digital data-based research and provide advanced services to the community. EarthChem has been developing an API-driven architecture to align with growing demands for machine-readable, Analysis Ready Data (ARD). This has presented an opportunity to make the two data infrastructures more interoperable and complementary. EarthChem and DIGIS have committed to cooperation on system architecture design, data models, data curation, methodologies, best practices and standards for geochemistry. This cooperation will include: (a) joint research projects; (b) optimized coordination and alignment of technologies, procedures and community engagement; and (c) exchange of personnel, data, technology and information. The EarthChem-DIGIS collaboration integrates with the international OneGeochemistry initiative to create a global geochemical data network that facilitates and promotes discovery and access of geochemical data through coordination and collaboration among international geochemical data providers, in close dialogue with the scientific community and with journal publishers.
How to cite: Klöcking, M., Lehnert, K., Profeta, L., Sarbas, B., Brase, J., Cao, S., Figueroa, J. D., Horstmann, W., Ji, P., Johansson, A., Kallas, L., Möller-McNett, S., Mukhumova, M., Nieschulze, J., Sturm, A., Sweets, H., Willbold, M., and Wörner, G.: GEOROC and EarthChem: Optimizing Data Services for Geochemistry through Collaboration, EGU General Assembly 2022, Vienna, Austria, 23–27 May 2022, EGU22-11348, https://doi.org/10.5194/egusphere-egu22-11348, 2022.
Please decide on your access
Please use the buttons below to download the presentation materials or to visit the external website where the presentation is linked. Regarding the external link, please note that Copernicus Meetings cannot accept any liability for the content and the website you will visit.
Forward to presentation link
You are going to open an external link to the presentation as indicated by the authors. Copernicus Meetings cannot accept any liability for the content and the website you will visit.
We are sorry, but presentations are only available for users who registered for the conference. Thank you.
EGU22-11766 | Presentations | ESSI3.2
Implementing semantic data management for bridging empirical and simulative approaches in marine biogeochemistryAlexander Schlemmer, Julian Merder, Thorsten Dittmar, Ulrike Feudel, Bernd Blasius, Stefan Luther, Ulrich Parlitz, Jan Freund, and Sinikka T. Lennartz
CaosDB is a flexible semantic research data management system, released as open source software. Its versatile data model and data integration toolkit allows for applications in complex and very heterogeneous scientific workflows and different scientific domains. Successful implementations include biomedical physics [1] and glaciology [2]. Here, we present a recent implementation of a use case in marine biogeochemistry which has a special focus on bridging between experimental work and numerical ocean modelling. CaosDB is used to store, index and link data during different stages of research on the marine carbon cycle: Data from experiments and field campaigns is integrated and mapped onto semantic data structures. This data is then linked to data from numerical ocean simulations. The ocean model, here with a specific focus on natural marine carbon sequestration of dissolved organic carbon (DOC), uses the georeferenced data to evaluate model performance. By simultaneously linking empirical data and the sampled model parameter space together with the model output, CaosDB enhances the efficiency of model development. In the current implementation simulated data is linked to georeferenced DOC concentration data. We plan to expand it to complex data sets including thousands of dissolved organic matter molecular formulae and metagenomes of pelagic microbial communities. The combined management of these heterogeneous data structures with semantic models allows us to perform complex searches and seamlessly connect to automated data analysis pipelines.
[1] Fitschen, T.; Schlemmer, A.; Hornung, D.; tom Wörden, H.; Parlitz, U.; Luther, S. CaosDB—Research Data Management for Complex, Changing, and Automated Research Workflows. Data 2019, 4, 83. https://doi.org/10.3390/data4020083
[2] Schlemmer, A.; tom Wörden, H.; Freitag, J.; Fitschen, T.; Kerch, J.; Schlomann, Y.; ... & Luther, S. Evaluation of the semantic research data management system CaosDB in glaciology. deRSE 2019. https://doi.org/10.5446/42478
How to cite: Schlemmer, A., Merder, J., Dittmar, T., Feudel, U., Blasius, B., Luther, S., Parlitz, U., Freund, J., and Lennartz, S. T.: Implementing semantic data management for bridging empirical and simulative approaches in marine biogeochemistry, EGU General Assembly 2022, Vienna, Austria, 23–27 May 2022, EGU22-11766, https://doi.org/10.5194/egusphere-egu22-11766, 2022.
EGU22-11980 | Presentations | ESSI3.2
From Field Application to Publication: An end-to-end Solution for FAIR Geoscience DataMoritz Theile, Wayne Noble, Romain Beucher, Malcolm McMillan, Samuel Boone, and Fabian Kohlmann
In this abstract we introduce a suite of free applications to produce FAIR consistent, clean and easily available geoscience data for research and industry alike.
Creation of data starts with sample collection in the field and the assigning of an unique global IGSN sample identifier to samples, these samples are stored along with any subsequent analytical data in our fine-grained and detailed geochemical data models allowing visualising and publishing acquired datasets. This unique solution has been developed by Lithodat Pty Ltd in conjunction with the AuScope Geochemical Network (AGN), Australian geochemical laboratories and can be accessed by the public on the AusGeochem web platform.
Using our fully integrated field application users can enter and store all sample details on-the-fly during field collection, the data will be stored in the user's private data collection. Once the researchers return from the field they can log into their account on the browser-based AusGeochem platform and view or edit all collected samples. After running subsequent geochemical analyses on the sample those results, including all metadata, can be stored in the database and attached to the sample. Once uploaded, data can be visualised within AusGeochem, using simple data analytics via technique-specific dashboards and graphs. The data can be shared with collaborators, downloaded in multiple formats and made public enabling FAIR data for the research community.
Here we show a complete sample workflow example, from collection in the field to the final result as a thermochronology study. Sample analysis using fission track and (U-Th)/He and all associated data will be uploaded and stored in the AusGeochem platform. Once all analyses are complete, the data will be shared with collaborators and made available to the public. An important step during this process is by having an integrated IGSN minting option which will give the sample a unique global sample identifier, making the sample globally discoverable.
Having all data stored in a clean and curated relational database with very detailed and fine-grained data models gives researchers free access to large amounts of structured and normalised data, helping them develop new technologies using machine learning and automated data integration in numerical models. Having all data in one place including all metadata such as ORCIDs from involved researchers, funding sources, grant numbers and laboratories enables the quantification and quality assessment of research projects over time.
How to cite: Theile, M., Noble, W., Beucher, R., McMillan, M., Boone, S., and Kohlmann, F.: From Field Application to Publication: An end-to-end Solution for FAIR Geoscience Data, EGU General Assembly 2022, Vienna, Austria, 23–27 May 2022, EGU22-11980, https://doi.org/10.5194/egusphere-egu22-11980, 2022.
EGU22-12096 | Presentations | ESSI3.2
Identification and Long-lasting Citability of Dynamic Data Queries on EMSO ERIC Harmonized DataIvan Rodero, Andreu Fornós, Raul Bardaji, Stefano Chiappini, and Juanjo Dañobeitia
The European Multidisciplinary Seafloor and water-column Observatory (EMSO) European Research Infrastructure Consortium (ERIC) is a large-scale European Strategy Forum on Research Infrastructure (ESFRI) member with strategically placed sea observatories with the essential scientific objective of real-time, long-term monitoring of environmental processes related to the interaction between the geosphere, biosphere, and hydrosphere. EMSO ERIC collects, curates, and provides high-quality oceanographic measurements from surface to deep seafloor to assess long-term time series and oceanographic modeling. In addition, EMSO ERIC has developed a set of data services that harmonize its regional facilities’ data workflows, enhancing efficiency and productivity, supporting innovation, and enabling data- and knowledge-based discovery and decision-making. These services are developed in connection with the ESFRI cluster of Environmental Research Infrastructures (ENVRI) through the adoption of FAIR data principles (findability, accessibility, interoperability, and reusability) and supported by the ENVRI-FAIR H2020 project.
EMSO ERIC’s efforts in adopting FAIR principles include the use of globally unique and resolvable persistent identifiers (PIDs) in alignment with the ENVRI-FAIR task forces. We present a service for the identification and long-lasting citability of dynamic data queries on harmonized data sets generated by EMSO ERIC users. The service is aligned with the Research Data Alliance (RDA) working group on data citation and has been integrated into the EMSO ERIC data portal. User-built queries on the data portal are served by the EMSO ERIC Application Programming Interface (API), which retrieves the user requested data and provides a Uniform Resource Identifier (URI) to the query, visualizations, and data sets in CSV and NetCDF formats. The data portal allows users to request a PID to the data query by providing mandatory and optional metadata information through an online form. The mandatory metadata consists of the description of the data and specific information about the creators, personal or organizational, including their identifiers and affiliations. The optional metadata consists of different types of titles and descriptions that the user finds compelling. The service provides a permalink to a web page maintained within the data portal with the PID reference, metadata information, and the URI to the data query. The web pages associated with PIDs also provide the option to request a Digital Object Identifier (DOI) if users are authorized via the EMSO ERIC Authorization and Authentication Infrastructure (AAI) system.
How to cite: Rodero, I., Fornós, A., Bardaji, R., Chiappini, S., and Dañobeitia, J.: Identification and Long-lasting Citability of Dynamic Data Queries on EMSO ERIC Harmonized Data, EGU General Assembly 2022, Vienna, Austria, 23–27 May 2022, EGU22-12096, https://doi.org/10.5194/egusphere-egu22-12096, 2022.
EGU22-13188 | Presentations | ESSI3.2
The UCLA Cosmochemistry DatabaseBidong Zhang, Paul H. Warren, Alan E. Rubin, Kerstin Lehnert, Lucia Profeta, Annika Johansson, Peng Ji, Juan David Figueroa-Solazar, and Jennifer Mays
The UCLA Cosmochemistry Database was initiated as a data rescue project aiming to archive a variety of cosmochemical data acquired at the University of California, Los Angeles. The database will ensure that future studies can use and reference these data in the examination, analysis and classification of new extraterrestrial samples.
The database is developed in collaboration with the Astromaterials Data System (AstroMat) that will provide persistent access to and archiving of the database. The database is a project in progress. We will continue to make additions, updates, and improvements to the database.
The database includes elemental compositions of extraterrestrial materials (including iron meteorites, chondrites, Apollo samples, and achondrites) analyzed by John T. Wasson, Paul H. Warren and their coworkers using atomic absorption spectrometry (AAS), neutron activation analysis (NAA), and electron microprobe analysis (EMPA) at UCLA over the last six decades. The team started to use INAA to analyze iron meteorites, lunar samples, and stony meteorites starting from the late 1970s [1]. Some achondrites and lunar samples were analyzed by EMPA. Some of the UCLA data have been published, but most of the data were neither digitized nor stored in a single repository.
Compositional data have been compiled by the UCLA team from publications, unpublished files, and laboratory records into datasets using Astromat spreadsheet templates. These datasets are submitted to the Astromat repository. Astromat curators review the datasets for metadata completeness and correctness, register them with DataCite to obtain a DOI and make them citeable, and package them for long-term archiving. To date, we have compiled data from 52 journal articles; each article has its own separate dataset. Data and metadata of these datasets are then incorporated into the Astromat Synthesis database.
The UCLA datasets are publicly accessible at the Astromat Repository, where individual datasets can be searched and downloaded. The UCLA cosmochemical data can also be accessed as part of the Astromat Synthesis database, where they are identified as a special ‘collection’. Users may search, filter, extract, and download customized datasets via the user interface of the Astromat Synthesis database (AstroSearch). Users will be able to access the UCLA Cosmochemistry Database directly from the home page of AstroMat (https://www.astromat.org/).
We plan to include EMPA data of lunar samples and achondrites, and add scanned PDF files of laboratory notebooks and datasheet binders that are not commonly published in journals. These PDF files contain information on irradiation date, mass, elemental concentrations, and classification for each iron specimen, and John Wasson’s personal notes on meteorites. We will also add backscattered-electron (BSE) images, energy dispersive spectroscopy (EDS) images, and optical microscopy images.
The Astromat team is currently working to develop plotting tools for the interactive tables.
Acknowledgments: We thank John Wasson and his coworkers for collecting the cosmochemical data for the last 60 years. Astromat acknowledges funding from NASA (grant no. 80NSSC19K1102).
References: [1] Scott E.R.D et al. (1977) Meteoritics, 12, 425–436.
How to cite: Zhang, B., Warren, P. H., Rubin, A. E., Lehnert, K., Profeta, L., Johansson, A., Ji, P., Figueroa-Solazar, J. D., and Mays, J.: The UCLA Cosmochemistry Database, EGU General Assembly 2022, Vienna, Austria, 23–27 May 2022, EGU22-13188, https://doi.org/10.5194/egusphere-egu22-13188, 2022.
EGU22-13317 | Presentations | ESSI3.2
The critical role of unique identification of samples for the geoanalytical data pipelineKerstin Lehnert, Jens Klump, Sarah Ramdeen, Kirsten Elger, and Lesley Wyborn
When researchers collect or create physical samples they usually assign a user-generated number to each sample. Subsequently, that sample can be submitted to a laboratory for analysis of a variety of analytes. However, as geoanalytical laboratories are generating ever increasing volumes of data, most laboratories have automated workflows and it is no longer feasible for laboratories to use researcher-supplied sample numbers, particularly as it is not guaranteed that user-supplied numbers will be unique in comparison to numbers submitted by other users to the same laboratory. To address this issue new, laboratory-generated numbers may be assigned to that sample.
Moreover, as a single laboratory rarely has the capability to offer all analytical techniques, individual samples tend to move from laboratory to laboratory to acquire the desired suite of analytes. Each laboratory may implement a different number to that sample. At the conclusion of their project, the researcher may submit the same sample to a museum or institutional repository, where the sample will be assigned yet another institution-generated number to ensure that all samples are uniquely identified in their repository.
Ultimately, by the time the researcher submits an article to a journal and wants to identify samples in the text or tables, they may have a multitude of locally-generated numbers to choose from. Not one of the locally assigned numbers to that sample can be guaranteed to be globally unique. It is also unlikely that any of these local numbers will be persistent over the longer term (decades), or be resolvable to enable the location of the identified resource or any information about it elsewhere on the web (metadata, landing page, services related to it, etc).
Globally unique, persistent, resolvable identifiers such as the IGSN play a critical role in the unique identification of geoanalytical samples that pass between systems and organisations: they cannot be duplicated by another researcher, laboratory or sample repository. They persistently link to information about the origin of the sample; to personas in the creation of the sample (collector, institution, funder); to the laboratory data and their creation (analyst, laboratory, institution, funder, data software); and to the sample curation phase (curator, repository, funder). They connect the phases of a sample’s path from collection in the field to lab analysis to the synthesis/research phase to the publication to the archive. Globally unique sample identifiers also enable cross linkages to any artefacts derived from that sample (images, analytical data, other articles). Further, identifiers like IGSN enable sub samples or sample splits to be linked back to their parent sample, creating a holistic picture of any information derived from the initial sample.
Hence, best practice is clearly to assign the globally unique resolvable identifier to the initial resource. Like a birth certificate, the identifier can be carried through the progressive stages of the research ‘life-cycle’ including laboratory analysis, generation of further data, images, publication, and ultimately curation and preservation. Where any subsamples are derived, they, and any data generated on them, can be linked back to the parent identifier.
How to cite: Lehnert, K., Klump, J., Ramdeen, S., Elger, K., and Wyborn, L.: The critical role of unique identification of samples for the geoanalytical data pipeline, EGU General Assembly 2022, Vienna, Austria, 23–27 May 2022, EGU22-13317, https://doi.org/10.5194/egusphere-egu22-13317, 2022.
Please decide on your access
Please use the buttons below to download the presentation materials or to visit the external website where the presentation is linked. Regarding the external link, please note that Copernicus Meetings cannot accept any liability for the content and the website you will visit.
Forward to presentation link
You are going to open an external link to the presentation as indicated by the authors. Copernicus Meetings cannot accept any liability for the content and the website you will visit.
We are sorry, but presentations are only available for users who registered for the conference. Thank you.
EGU22-13330 | Presentations | ESSI3.2
EARThD: an effort to make East African tephra geochemical data available and accessibleErin DiMaggio, Sara Mana, and Cora VanHazinga
EARThD is a NSF funded data compilation project that has integrated and standardized geochemical and geochronological data from over 400 published scientific papers investigating tephra datasets from the East African Rift. Our team has trained 15 undergraduate students in spreadsheet data entry and management, data mining, scientific paper comprehension, and in East African tephrochronology. We utilize an existing NSF-supported community-based data facility, Interdisciplinary Earth Data Alliance (IEDA), to store, curate, and provide access to the datasets. We are currently working with IEDA to ensure that data generated from EARThD is ingested into the IEDA Petrological Database (PetDB) and ultimately EarthChem, making it broadly available. Here we demonstrate our data entry process and how a user can locate, retrieve, and utilize EARThD tephra datasets. With this effort we aim to preserve available geochemical data for posterity, fulfilling a crucial data integration role for researchers working in East Africa --especially those working at paleontological and archeological sites where tephra dating and geochemical correlations are critical. The EARThD compilation also enables data synthesis efforts required to address new science questions.
How to cite: DiMaggio, E., Mana, S., and VanHazinga, C.: EARThD: an effort to make East African tephra geochemical data available and accessible, EGU General Assembly 2022, Vienna, Austria, 23–27 May 2022, EGU22-13330, https://doi.org/10.5194/egusphere-egu22-13330, 2022.
EGU22-13338 | Presentations | ESSI3.2
A workflow to standardize collection and management of large-scale data and metadata from environmental observatoriesDylan O'Ryan, Charuleka Varadharajan, Erek Alper, Kristin Boye, Madison Burrus, Danielle Christianson, Shreyas Cholia, Robert Crystal-Ornelas, Joan Damerow, Wenming Dong, Hesham Elbashandy, Boris Faybishenko, Valerie Hendrix, Douglas Johnson, Zarine Kakalia, Roelof Versteeg, Kenneth Williams, Catherine Wong, and Deborah Agarwal
The Watershed Function Scientific Focus Area (WFSFA) is a U.S. Department of Energy research project that seeks to determine how mountainous watersheds retain and release water, carbon, nutrients, and metals. The WFSFA maintains a community field observatory at its primary field site in the East River, Colorado. The WFSFA collects diverse environmental data and has developed a “Field-Data” workflow that standardizes data management across the project, from field collection to laboratory analysis to publication. This workflow enables the WFSFA to address data quality and management challenges that environmental observatories face.
Through this workflow, the WFSFA has increased the use of the data curated from the project by (1) providing detailed metadata with unique identifiers for samples, locations, and sensors, (2) streamlining the data sharing and publication process through early sharing of data internally within the team and publication of data on the ESS-DIVE repository following curation, and (3) adopting machine-readable and FAIR community data standards (Findability, Accessibility, Interoperability, Reusability).
We describe an example application of this workflow for geochemical data, which utilizes a community geochemical data standard for water-soil-sediment chemistry (https://github.com/ess-dive-community/essdive-water-soil-sed-chem) developed by Environmental Systems Science Data Infrastructure for a Virtual Ecosystem (ESS-DIVE). This data standard is designed to standardize geochemical data, metadata, and file-level metadata, and was applied to WFSFA geochemical data, including ICP-MS, Isotope, Ammonia-N, Anion, DIC/NPOC/TDN datasets. This ensures important metadata is contained within the data file, such as precision of data analysis, storage and sample processing information, detailed sample names, material information, and unique identifiers associated with the samples (IGSNs). This metadata is essential to understand and reuse data products, as well as enable machine-readability for future model applications. Detailed examples of the standardized geochemical data types were created and are now being used as templates by WFSFA researchers to standardize their geochemical data. The adoption of this community geochemical data standard and more broadly the Field-Data workflow will improve the findability and reusability of WFSFA datasets.
How to cite: O'Ryan, D., Varadharajan, C., Alper, E., Boye, K., Burrus, M., Christianson, D., Cholia, S., Crystal-Ornelas, R., Damerow, J., Dong, W., Elbashandy, H., Faybishenko, B., Hendrix, V., Johnson, D., Kakalia, Z., Versteeg, R., Williams, K., Wong, C., and Agarwal, D.: A workflow to standardize collection and management of large-scale data and metadata from environmental observatories, EGU General Assembly 2022, Vienna, Austria, 23–27 May 2022, EGU22-13338, https://doi.org/10.5194/egusphere-egu22-13338, 2022.
Please decide on your access
Please use the buttons below to download the presentation materials or to visit the external website where the presentation is linked. Regarding the external link, please note that Copernicus Meetings cannot accept any liability for the content and the website you will visit.
Forward to presentation link
You are going to open an external link to the presentation as indicated by the authors. Copernicus Meetings cannot accept any liability for the content and the website you will visit.
We are sorry, but presentations are only available for users who registered for the conference. Thank you.

EGU22-13382 | Presentations | ESSI3.2
Science building on synthesis: From standardized palaeoclimate data to climate model evaluationKira Rehfeld
Efforts towards standardizing biogeochemical data from palaeoclimate archives such as speleothems, ice cores, corals, trees or marine sediments allow to tackle global-scale changes in palaeoclimate dynamics. These endeavours are sometimes initiated for very specific research questions. One such example is the multi-archive, multi-proxy dataset used in a characterization of changes in temperature variability from the last Glacial Maximum to the current Interglacial [1]. Here, we focused on collecting all published proxy time series for temperature that fulfilled sampling criteria, but we did not include a lot of metadata.
Another, quite prominent, example is the database that grew out of the working group on Speleothem synthesis and analysis (SISAL) in the Past Global Changes (PAGES) network. In its construction, researchers from all over the world collaborated, producing a quality-controlled data product with rich metadata. SISAL v2 [2] contains data from 691 speleothem records published over the decades, for more than 500 standardized age models were established. The design and data collection in the community allowed to draw together metadata and observations to reproduce the age modeling process of individual studies. This database has a rich set of purposes, ranging from the evaluation of monsoon dynamics, to that of isotope-enabled climate models [3].
Contrasting these two approaches I will discuss the challenges arising when multiple proxies, archives, modeling purposes and community standards need to be considered. I argue that careful design of standardized data products allows for a new type of geoscience work, further catalyzed by digitization, forming a basis for tackling future-relevant palaeoclimatic and palaeoenvironmental questions at the global scale.
[1] Rehfeld, K., et al. "Global patterns of declining temperature variability from the Last Glacial Maximum to the Holocene." Nature 554.7692: 356-359, https://doi.org/10.1038/nature25454, 2018
[2] Comas-Bru, L., et al. (incl. SISAL Working Group members): SISALv2: a comprehensive speleothem isotope database with multiple age–depth models, Earth Syst. Sci. Data, 12, 2579–2606, https://doi.org/10.5194/essd-12-2579-2020, 2020.
[3] Bühler, J. C. et al: Comparison of the oxygen isotope signatures in speleothem records and iHadCM3 model simulations for the last millennium, Clim. Past, 17, 985–1004, https://doi.org/10.5194/cp-17-985-2021, 2021.
How to cite: Rehfeld, K.: Science building on synthesis: From standardized palaeoclimate data to climate model evaluation, EGU General Assembly 2022, Vienna, Austria, 23–27 May 2022, EGU22-13382, https://doi.org/10.5194/egusphere-egu22-13382, 2022.
EGU22-13429 | Presentations | ESSI3.2
AusGeochem: an Australian AuScope Geochemistry Network data platform for laboratories and their usersAlexander M. Prent, Samuel C. Boone, Hayden Dalton, Yoann Gréau, Guillaume Florin, Fabian Kohlmann, Moritz Theile, Wayne Noble, Sally-Ann Hodgekiss, Bryant Ware, David Philips, Barry Kohn, Suzanne O’Reilly, Andrew Gleadow, Brent McInnes, and Tim Rawling
Over the last two years, the Australian AuScope Geochemistry Network (AGN) has developed AusGeochem in collaboration with geoscience-data-solutions company Lithodat Pty Ltd. This open, cloud-based data platform (https://ausgeochem.auscope.org.au) serves as a geo-sample registry, with IGSN minting capability, a geochemical data repository and a data analysis tool. With guidance from experts in the field of geochemistry from a number of Australian institutions, and following international standards and best practices, various sample and geochemistry data models were developed that align with the FAIR data principles. AusGeochem is currently accepting data of SIMS U-Pb as well as of fission track and (U-Th-Sm)/He techniques with LA-ICPS-MS U-Pb and Lu-Hf, 40Ar/39Ar data models under development. Special attention is paid to the implementation of streamlined workflows for AGN laboratories to facilitate ease of data upload from analytical sessions. Analytical results can then be shared with users through AusGeochem and where required can be kept fully confidential and under embargo for specified periods of time. Once the analytical data on individual samples are finalized, the data can then be made more widely accessible, and where required can be combined into specific datasets that support publications.
How to cite: Prent, A. M., Boone, S. C., Dalton, H., Gréau, Y., Florin, G., Kohlmann, F., Theile, M., Noble, W., Hodgekiss, S.-A., Ware, B., Philips, D., Kohn, B., O’Reilly, S., Gleadow, A., McInnes, B., and Rawling, T.: AusGeochem: an Australian AuScope Geochemistry Network data platform for laboratories and their users, EGU General Assembly 2022, Vienna, Austria, 23–27 May 2022, EGU22-13429, https://doi.org/10.5194/egusphere-egu22-13429, 2022.
EGU22-13457 | Presentations | ESSI3.2
Closing the gap between related databases: MetBase and the Astromaterials Data System (Astromat) plan for a common futureDominik C. Hezel and Kerstin A. Lehnert
MetBase is the world’s largest database for meteorite compositions [1], currently hosted in Germany. MetBase started more than 20 years ago with collecting cosmochemical data by a private collector. Among others, the database consists of more than 500.000 individual data of, for instance, bulk and component chemical, isotopic and physical properties. Further, the database holds more than 90,000 references from 1492 until today. In 2006, the high value of the database was acknowledged by the Meteoritical Society with its Service Award. MetBase has seen substantial transitions in the past years from a purely commercial to a donation, free-of-charge database. The technical foundation has been completely modernised.
More recently, the Astromaterials Data System (AstroMat) has been developed as a data infrastructure to store, curate, and provide access to laboratory data acquired on samples curated in NASA’s Astromaterials Collections. AstroMat is intended to host data from past, present, and future studies. AstroMat is developed and operated by a team that has long-term experiences in the development and operation of data systems for geochemical, petrological, mineralogical, and geochronological laboratory data acquired on physical samples – EarthChem and PetDB.
Astromat and MetBase are two initiatives with two very different histories – but a shared goal. Astromat and MetBase therefore plan a common future. As a part of this, we are currently starting a project to make MetBase data fully FAIR (findable, accessible, interoperable and reusable, [2]), thereby implementing the recently established Astromat database schema [3], which is based on the EarthChem data model. Astromat and MetBase currently also work on new solutions for a long term and centralized hosting of both databases and a data input backbone.
Both MetBase and Astromat participate in the OneGeochemistry initiative, to contribute to the development of community endorsed and governed standards for FAIR lab analytical data that will allow seamless data exchange and integration. Data access to the MetBase content will be provided both through Astromat and via a front-end that is part of the recently initiated ›National Data Infrastructure Initiative‹ (NFDI), covering all scientific areas [4].
References: [1] http://www.metbase.org. [2] Stall et al. 2019. Make scientific data FAIR. Nature 570(7759): 27-29. [3] https://www.astromat.org [4] https://www.dfg.de/en/research_funding/programmes/nfdi/index.htm [5] https://www.nfdi4earth.de
How to cite: Hezel, D. C. and Lehnert, K. A.: Closing the gap between related databases: MetBase and the Astromaterials Data System (Astromat) plan for a common future, EGU General Assembly 2022, Vienna, Austria, 23–27 May 2022, EGU22-13457, https://doi.org/10.5194/egusphere-egu22-13457, 2022.
EGU22-810 | Presentations | ESSI3.3
An open-source web application displaying present-day subsurface thermal conditions of the NE Mediterranean regionAyberk Uyanik
Conversion of dynamic bottom-hole temperatures (BHTs) into static ones and utilizing on the purpose of either calibration for basin modelling or drilling plan is a crucial step for hydrocarbon and geothermal exploration projects. However, records of temperature conversions might be ignored or might get lost from the archives due to various reasons, such as project team change, diversion of focus into other areas or simply deletion of data. Disappearance of previous studies does not only disrupt the geoscientific knowledge but also causes repetition for exploration geoscientists to start the time consuming BHT conversion process all over again.
NE Mediterranean Dashboard v1.0 provides a solution for the issue by benefiting from data science instruments of Python programming language. By implementing Plotly-Dash for the front-end, and PostgreSQL for the back end as the keeper of thermal records in datatables, this open-source project proposes a user-friendly web application displaying temperature, geothermal gradient and heat flow profiles in a dashboard style.
The application is consisted of three tabs. The Overview tab provides statistical information while 2D plots section allows users to interact with cross-plots demonstrating thermal conditions for all wells or a particular well selected by the user. It also compares the results of three different BHT conversion methods known as; Horner-plot method, AAPG correction and Harrison et al. (1983). The last tab, Map View, illustrates the temperature, geothermal gradient, and heat flow maps for every 500 meters from surface to 4.5 km depth. The maps reveal the effects of the regional tectonics and how it controls the subsurface thermal behaviour along the Cilicia and Latakia Basins dominating the NE Mediterranean region.
All maps and cross-plots are interactive, and their styles can be changed according to the user’s preferences. They can also be downloaded as images for possible use in scientific publishment and/or presentations. The same interface and visualisation style, accessed by username and password, can also provide consistency between all project workers.
The source code is available at Github repository with the link; https://github.com/Ayberk-Uyanik/NE-Mediterranean-Thermal-Conditions and can efficiently be implemented for exploration projects in other regions.
How to cite: Uyanik, A.: An open-source web application displaying present-day subsurface thermal conditions of the NE Mediterranean region, EGU General Assembly 2022, Vienna, Austria, 23–27 May 2022, EGU22-810, https://doi.org/10.5194/egusphere-egu22-810, 2022.
Please decide on your access
Please use the buttons below to download the presentation materials or to visit the external website where the presentation is linked. Regarding the external link, please note that Copernicus Meetings cannot accept any liability for the content and the website you will visit.
Forward to presentation link
You are going to open an external link to the presentation as indicated by the authors. Copernicus Meetings cannot accept any liability for the content and the website you will visit.
We are sorry, but presentations are only available for users who registered for the conference. Thank you.

EGU22-3590 | Presentations | ESSI3.3
Knowledge hidden in plain sight – Extending article metadata to support meta-analysis and knowledge accumulationLina Stein and Thorsten Wagener
The number of publications in the field of Hydrology (and in other geoscience fields) is rising at an almost exponential rate. In 2021 alone, more than 25 000 articles were listed in Web of Science on the topic of Water Resources. There is a tremendous wealth of knowledge and data hidden in these articles, which capture our experience in studying places, datasets or models. Hidden, because we currently do not possess (or at least, do not use) the necessary tools to access this knowledge resource in an effective manner. It is increasingly difficult for an individual researcher to build on existing knowledge. New ways to approach this problem are urgently needed.
One approach to address this problem of literature explosion might be to extend article metadata to include geoscience-specific information that can facilitate knowledge search, accumulation and synthesis in a domain specific manner. Imagine one could easily find all studies performed in a specific location/ climate/ land use thus allowing a full picture of the hydrology of that region/ climate/ land use. It is important for any geoscience, a field strongly depending on experience, that knowledge is not “forgotten” in a mountain of publications but can easily be integrated into larger understanding.
So what meta-information would be most useful in knowledge synthesis? Study location? Spatial and/or temporal scale? Models used? Here, we would like to (re-)start the discussion on geoscience-relevant metadata enrichment. With the recent advancement in text mining scholarly literature, it is critical to have this discussion now or fall behind.
The Geosciences strongly depend on experiences we gain, which we largely share through the articles we publish. Knowledge accumulation in our science is hindered if this exchange of knowledge becomes ineffective. We are afraid it already has!
How to cite: Stein, L. and Wagener, T.: Knowledge hidden in plain sight – Extending article metadata to support meta-analysis and knowledge accumulation, EGU General Assembly 2022, Vienna, Austria, 23–27 May 2022, EGU22-3590, https://doi.org/10.5194/egusphere-egu22-3590, 2022.
EGU22-7330 | Presentations | ESSI3.3
ENES Data Space: an open, cloud-enabled data science environment for climate analysisFabrizio Antonio, Donatello Elia, Andrea Giannotta, Alessandra Nuzzo, Guillaume Levavasseur, Atef Ben Nasser, Paola Nassisi, Alessandro D'Anca, Sandro Fiore, Sylvie Joussaume, and Giovanni Aloisio
The scientific discovery process has been deeply influenced by the data deluge started at the beginning of this century. This has caused a profound transformation in several scientific domains which are now moving towards much more collaborative processes.
In the climate sciences domain, the ENES Data Space aims to provide an open, scalable, cloud-enabled data science environment for climate data analysis. It represents a collaborative research environment, deployed on top of the EGI federated cloud infrastructure, specifically designed to address the needs of the ENES community. The service, developed in the context of the EGI-ACE project, provides ready-to-use compute resources and datasets, as well as a rich ecosystem of open source Python modules and community-based tools (e.g., CDO, Ophidia, Xarray, Cartopy, etc.), all made available through the user-friendly Jupyter interface.
In particular, the ENES Data Space provides access to a multi-terabyte set of specific variable-centric collections from large community experiments to support researchers in climate model data analysis experiments. The data pool of the ENES Data Space consists of a mirrored subset of CMIP datasets from the ESGF federated data archive collected by using the Synda community tool in order to provide the most up to date datasets into a single location. Results and output products as well as experiment definitions (in the form of Jupyter Notebooks) can be easily shared among users through data sharing services, which are also being integrated in the infrastructure, such as EGI DataHub.
The service was opened in the second part of 2021 and is now accessible in the European Open Science Cloud (EOSC) through the EOSC Portal Marketplace (https://marketplace.eosc-portal.eu/services/enes-data-space). This contribution will present an overview of the ENES Data Space service and its main features.
How to cite: Antonio, F., Elia, D., Giannotta, A., Nuzzo, A., Levavasseur, G., Ben Nasser, A., Nassisi, P., D'Anca, A., Fiore, S., Joussaume, S., and Aloisio, G.: ENES Data Space: an open, cloud-enabled data science environment for climate analysis, EGU General Assembly 2022, Vienna, Austria, 23–27 May 2022, EGU22-7330, https://doi.org/10.5194/egusphere-egu22-7330, 2022.
EGU22-8914 | Presentations | ESSI3.3
ViCTool: An open-source tool for vegetation indices computation of aerial raster images using python GDALJenniffer Carolina Triana-Martinez, Jose A. Fernandez-Gallego, Oscar Barrero, Irene Borra-Serrano, Tom De Swaef, Peter Lootens, and Isabel Roldan-ruiz
For precision agriculture (PA) applications that use aerial platforms, researchers are likely to be interested in extracting, study and understanding biophysical and structural properties in a spatio-temporal manner by using remotely sensed imagery to infer variations of vegetation biomass and/or plant vigor, irrigation strategies, nutrient use efficiency, stress, disease identification, among others. This requires measuring spectral responses of the crop at specific wavelengths by using, for instance, Vegetation Indices (VI). However, for the analysis of this spectral response and its heterogeneity and spatial variability, a large amount of aerial imagery (data) must be collected and processed using a photogrammetry software. Data extraction is often performed in a Geographic Information System (GIS) software and then analyzed using (in general) statistical software. On the one hand, a GIS is used for the collection of resources to manipulate, analyze, and display all forms of geographically referenced information. In this regard, Quantum GIS (QGIS) is one of the most well-known open-source software used which provides an integration of geoprocessing tools from a variety of different software libraries. QGIS is widely used to obtain VI computations through the raster calculator, although, this computation is performed with band rasters manually provided by the user; one by one, which is time-consuming. On the other hand, QGIS provides a Python interface to efficiently exploit the capabilities of a GIS to create similar plugins, but this can be a non-trivial task. In this work, we developed a specific and QGIS independent semi-automatic tool called ViCTool (Vegetation index Computation Tool) as a free open-source software (FOSS) for large amount of data extraction to derive VIs from aerial raster images in a certain region of interest. This tool has the option of extracting several multispectral and RGB VIs employing Blue, Green, Red, NIR, LWIR, or Red edge bands. The user must provide the input folder path containing one or more raster band folders, the shapefile with the regions of Interests, an output path to store the output VI rasters, and the file containing the VI computations. ViCTool was developed using Python PyQT for designing the User Interface (UI) and Python GDAL for raster processing to simplify and speed up the process of calculating a large amount of data intuitively.
How to cite: Triana-Martinez, J. C., Fernandez-Gallego, J. A., Barrero, O., Borra-Serrano, I., De Swaef, T., Lootens, P., and Roldan-ruiz, I.: ViCTool: An open-source tool for vegetation indices computation of aerial raster images using python GDAL, EGU General Assembly 2022, Vienna, Austria, 23–27 May 2022, EGU22-8914, https://doi.org/10.5194/egusphere-egu22-8914, 2022.
Please decide on your access
Please use the buttons below to download the presentation materials or to visit the external website where the presentation is linked. Regarding the external link, please note that Copernicus Meetings cannot accept any liability for the content and the website you will visit.
Forward to presentation link
You are going to open an external link to the presentation as indicated by the authors. Copernicus Meetings cannot accept any liability for the content and the website you will visit.
We are sorry, but presentations are only available for users who registered for the conference. Thank you.
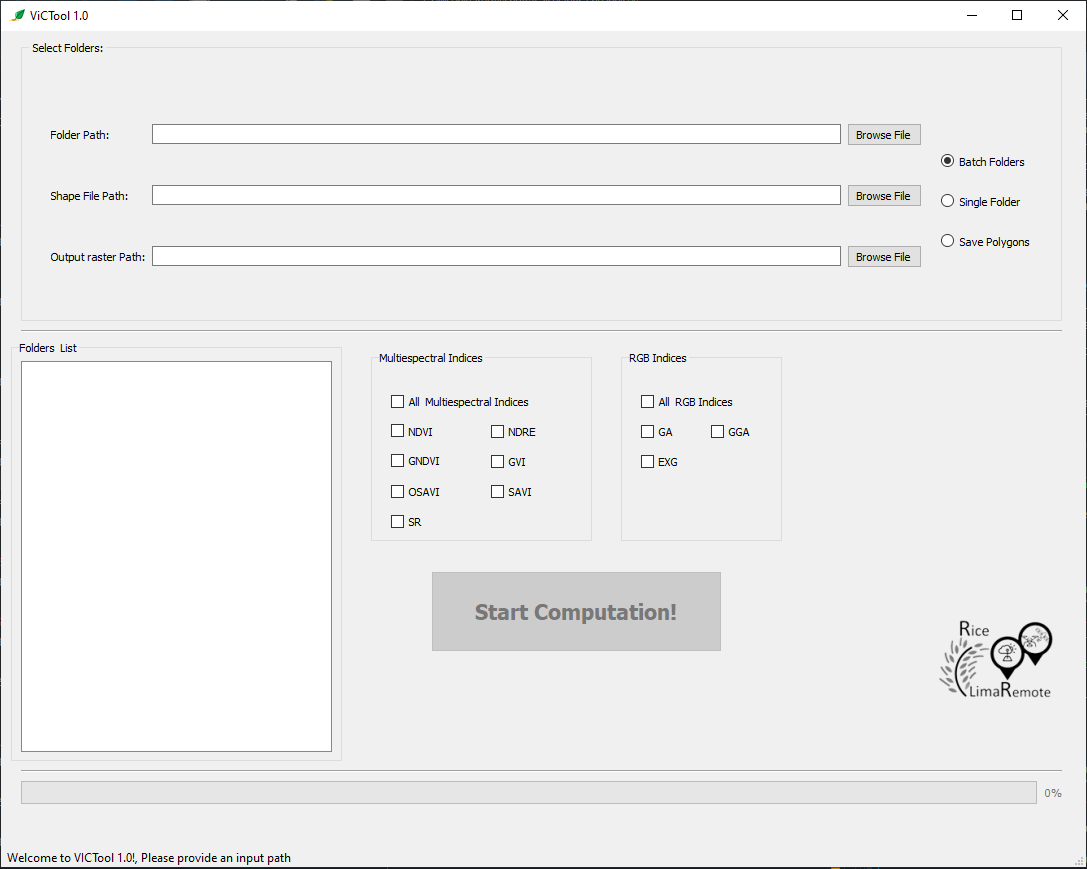
EGU22-9101 | Presentations | ESSI3.3
openEO Platform: Enabling analysis of large-scale Earth Observation data repositories with federated computational infrastructureBenjamin Schumacher, Patrick Griffiths, Edzer Pebesma, Jeroen Dries, Alexander Jacob, Daniel Thiex, Matthias Mohr, and Christian Briese
The growing data stream from Earth Observation (EO) satellites has advanced scientific knowledge about the environmental status of planet earth and has enabled detailed environmental monitoring services. The openEO API developed in the Horizon 2020 project openEO (2017–2020, see https://openeo.org/) demonstrated that large-scale EO data processing needs can be expressed as a common set of analytic operators which are implemented in many GIS software or image analysis software products. The openEO Platform service implements the API into an operational, federated service currently running at back-ends at EODC and VITO with access to SentinelHub data to meet processing needs of a wide user community.
openEO Platform (https://openeo.cloud/) enables users to access a large collection of open EO data and perform scientific computations with intuitive client libraries simplifying underlying complexity. The platform is currently under construction with a strong focus on user co-creation and input from various disciplines incorporating a range of use-cases and a free-of-charge Early Adopter program that allows users to test the platform and to directly communicate with its developers. The use cases include CARD4L compliant ARD data creation with user defined parameterisation, forest dynamics mapping including time series fitting and prediction functionalities, crop type mapping including EO feature engineering supporting machine learning based crop mapping and forest canopy mapping supporting regression based fraction cover mapping.
The interaction with the platform includes multiple programming interfaces (R, Python, JavaScript) and a browser-based management console and model builder which allows a direct, interactive display and modification of processing workflows. The resulting processing graph is then forwarded via the openEO API to the federated back-ends.
In the future users will be able to process continental-scale EO data and create ready-to-use environmental monitoring services with analysis-ready data (ARD) and predefined available processes. This presentation will provide an overview of the current capabilities and the evolution roadmap of openEO Platform. It will demonstrate the utility of the platform to process large amounts of EO data into meaningful information products, supporting environmental monitoring, scientific research and political decision-makers.
How to cite: Schumacher, B., Griffiths, P., Pebesma, E., Dries, J., Jacob, A., Thiex, D., Mohr, M., and Briese, C.: openEO Platform: Enabling analysis of large-scale Earth Observation data repositories with federated computational infrastructure, EGU General Assembly 2022, Vienna, Austria, 23–27 May 2022, EGU22-9101, https://doi.org/10.5194/egusphere-egu22-9101, 2022.
EGU22-10032 | Presentations | ESSI3.3
Technical-semantic interoperability referencePiotr Zaborowski, Rob Atkinson, Nils Hempelmann, and Marie-Francoise Voidrot
The FAIR data principles form the core OGC mission that renders in the open geospatial standards and the open-data initiatives that use them. Although OGC is best known for the technical interoperability, the domain modelling and semantic level play an inevitable role in the standards definition and the exploitation. On the one hand, we have a growing number of specialised profiles and implementations that selectively use the OGC modular specification model components. On the other hand, various domain ontologies exist already, enabling a better understanding of the data. As there could be multiple semantic representations, common data models support cross ontology traverses. Defining the service in the technical-semantic space requires fixing some flexibility points, including optional and mandatory elements, additional constraints and rules, and content including normalised vocabularies to be used.
The proposed solution of the OGC Definition Server is a multi-purpose application built around the triple store database engine integrated with the ingestion, validation, and entailment tools and exposing customized end-points. The models are available in the human-readable format and machine-2-machine aimed encodings. For manual processes, it enables understanding the technical and semantic definitions/relationships between entities. Programmatic solutions benefit from a precise referential system, validations, and entailment.
Currently, OGC Definition Server is hosting several types of definitions covering:
- Register of OGC bodies, assets, and its modules
- Ontological common semantic models (e.g., for Agriculture)
- Dictionaries of subject domains (e.g., PipelineML Codelists)
In practice, that is a step forward in defining the bridge between conceptual and logical models. The concepts can be expressed as instances of various ontological classes and interpreted within multiple contexts, with the definition translated into entities, relationships, and properties. In the future, it is linking the data to the reference model and external ontologies that may be even more significant. Doing so can greatly improve the quality of the knowledge produced based on the collected data. Ability to verify the research outcomes and explainable AI are just two examples where a precise log of inferences and unambiguous semantic compatibility of the data will play a key role.
How to cite: Zaborowski, P., Atkinson, R., Hempelmann, N., and Voidrot, M.-F.: Technical-semantic interoperability reference, EGU General Assembly 2022, Vienna, Austria, 23–27 May 2022, EGU22-10032, https://doi.org/10.5194/egusphere-egu22-10032, 2022.
EGU22-10213 | Presentations | ESSI3.3
Developing semantic interoperability in ecosystem studies: semantic modelling and annotation for FAIR data productionChristian Pichot, Nicolas Beudez, Cécile Callou, André Chanzy, Alyssa Clavreul, Philippe Clastre, Benjamin Jaillet, François Lafolie, Jean-François Le Galliard, Chloé Martin, Florent Massol, Damien Maurice, Nicolas Moitrier, Ghislaine Monet, Hélène Raynal, Antoine Schellenberger, and Rachid Yahiaoui
The study of ecosystem characteristics and functioning requires multidisciplinary approaches and mobilises multiple research teams. Data are collected or computed in large quantity but are most often poorly standardised and therefore heterogeneous. In this context the development of semantic interoperability is a major challenge for the sharing and reuse of these data. This objective is implemented within the framework of the AnaEE (Analysis and Experimentation on Ecosystems) Research Infrastructure dedicated to experimentation on ecosystems and biodiversity. A distributed Information System (IS) is developed, based on the semantic interoperability of its components using common vocabularies (AnaeeThes thesaurus and OBOE-based ontology extended for disciplinary needs) for modelling observations and their experimental context. The modelling covers the measured variables, the different components of the experimental context, from sensor and plot to network. It consists in the atomic decomposition of the observations, identifying the observed entities, their characteristics and qualification, naming standards and measurement units. This modelling allows the semantic annotation of relational databases and flat files for the production of graph databases. A first pipeline is developed for the automation of the annotation process and the production of the semantic data, annotation that may represent a huge conceptual and practical work without such automation. A second pipeline is devoted to the exploitation of these semantic data through the generation i) of standardized GeoDCAT and ISO metadata records and ii) of data files (NetCDF format) from selected perimeters (experimental sites, years, experimental factors, measured variables...). Carried out on all the data generated by the experimental platforms, this practice will produce semantically interoperable data that meets the linked opendata standards. The work carried out contributes to the development and use of semantic vocabularies within the ecology research community. The genericity of the tools make them usable in different contexts of ontologies and databases.
How to cite: Pichot, C., Beudez, N., Callou, C., Chanzy, A., Clavreul, A., Clastre, P., Jaillet, B., Lafolie, F., Le Galliard, J.-F., Martin, C., Massol, F., Maurice, D., Moitrier, N., Monet, G., Raynal, H., Schellenberger, A., and Yahiaoui, R.: Developing semantic interoperability in ecosystem studies: semantic modelling and annotation for FAIR data production, EGU General Assembly 2022, Vienna, Austria, 23–27 May 2022, EGU22-10213, https://doi.org/10.5194/egusphere-egu22-10213, 2022.
EGU22-10575 | Presentations | ESSI3.3
An open-source framework for nearly exact solutions to complex geoscience interactions (AEM)David R. Steward
An open-source framework is presented to support geoscientific investigations of flow, conduction, and wave propagation. The Analytic Element Method (AEM) provides nearly exact solutions to complicated boundary and interface problems, typically with 6-8 significant digits. Examples are presented for seepage of water through soil and aquifers including fractured flow, groundwater/surface water interactions through stream beds, and ecological interactions of plant water uptake. Related applications include waves near coastal features and propagation of tsunamis through bathymetric shoals. This presentation overviews the concise AEM representation from Steward (2020), "Analytic Element Method: Complex Interactions of Boundaries and Interfaces", where solutions discretize the domain into features, develop mathematical representations of interactions, and develop coupled systems of equations to solve boundary conditions. The companion site at Oxford University Press contains a wide range of open-source solutions to these problems and related applications across the geosciences.
How to cite: Steward, D. R.: An open-source framework for nearly exact solutions to complex geoscience interactions (AEM), EGU General Assembly 2022, Vienna, Austria, 23–27 May 2022, EGU22-10575, https://doi.org/10.5194/egusphere-egu22-10575, 2022.
EGU22-10615 | Presentations | ESSI3.3
The use of the Unidata Science Gateway as a cyberinfrastructure resource to facilitate education and research during COVID-19Mohan Ramamurthy and Julien Chastang
Unidata has developed and deployed data infrastructure and data-proximate scientific workflows and software tools using cloud computing technologies for accessing, analyzing, and visualizing geoscience data. These resources are provided to educators and researchers through the Unidata Science Gateway (https://science-gateway.unidata.ucar.edu) and deployed on the U. S. National Science Foundation funded Jetstream (https://jetstream-cloud.org) cloud facility. During the SARS-CoV-2/COVID-19 pandemic, the Unidata Science Gateway has been used by many universities to teach data-centric atmospheric science courses and conduct several software training workshops to advance skills in data science.
The COVID-19 pandemic led to the closure of university campuses with little advance notice. Educators at institutions of higher learning had to urgently transition from in-person teaching to online classrooms. While such a sudden change was disruptive for education, it also presented an opportunity to experiment with instructional technologies that have been emerging for the last few years. Web-based computational notebooks, with their mixture of explanatory text, equations, diagrams and interactive code are an effective tool for online learning. Their use is prevalent in many disciplines including the geosciences. Multi-user computational notebook servers (e.g., Jupyter Notebooks) enable specialists to deploy pre-configured scientific computing environments for the benefit of students. The use such tools and environments removes barriers for students who otherwise have to download and install complex software tools that can be time consuming to configure, simplifying workflows and reducing time to analysis and interpretation. It also provides a consistent computing environment for all students and democratizes access to resources. These servers can be provisioned with computational resources not found in a desktop computing setting and leverage cloud computing environments and high speed networks. They can be accessed from any web browser-enabled device like laptops and tablets.
Since spring 2020 when the Covid pandemic led to the closure of universities across the U. S., Unidata has assisted several earth science departments with computational notebook environments for their classes. We worked with educators to tailor these resources for their teaching objectives. We ensured the technology was correctly provisioned with appropriate computational resources and collaborated to have teaching material immediately available for students. There were many successful examples of online learning experiences.
In this paper, we describe the details of the Unidata Science Gateway resources and discuss how those resources enabled Unidata to support universities during the COVID-19 lockdown.
How to cite: Ramamurthy, M. and Chastang, J.: The use of the Unidata Science Gateway as a cyberinfrastructure resource to facilitate education and research during COVID-19, EGU General Assembly 2022, Vienna, Austria, 23–27 May 2022, EGU22-10615, https://doi.org/10.5194/egusphere-egu22-10615, 2022.
EGU22-10719 | Presentations | ESSI3.3
Virtual Labs for Collaborative Environmental Data ScienceMaria Salama, Gordon Blair, Mike Brown, and Michael Hollaway
Research in environmental data science is typically transdisciplinary in nature, with scientists, practitioners, and stakeholders creating data-driven solutions to the environment’s grand challenges, often using a large amount of highly heterogeneous data along with complex analytical methods. The concept of virtual labs allow collaborating scientists to explore big data, develop and share new methods, as well as communicate their results to stakeholders, practitioners, and decision-makers across different scales (individual, local, regional, or national).
Within the Data Science of the Natural Environment (DSNE) project, a transdisciplinary team of environmental scientists, statisticians, computer scientists and social scientists are collaborating to develop statistical/data science algorithms for environmental grand challenges through the medium of a virtual labs platform, named DataLabs. DataLabs, in continuous development by UKCEH in an agile approach, is a consistent and coherent cloud-based research environment that advocates open and collaborative science by providing the infrastructure and software tools to bring users of different areas of expertise (scientists, stakeholders, policy-makers, and the public) interested in environmental science into one virtual space to tackle environmental problems. DataLabs support end-to-end analysis from the assimilation and analysis of data through to the visualisation, interpretation, and discussion of the results.
DataLabs draw on existing technologies to provide a range of functionality and modern tools to support research collaboration, including: (i) parallel data cluster services, such as DASK and Spark; (ii) executable notebook technologies, such as Jupyter, Zepplin and R; (iii) lightweight applications such as RShiny to allow rapid collaboration among diverse research teams; and (iv) containerisation of application deployment (e.g. using Docker) so that technologies developed can be more easily moved to other cloud platforms as required. Following the principles of service-oriented architectures, the design enables selecting the most appropriate technology for each component and exposing any functions by other systems via HTTP as services. Within each component, a modular-layered architecture is used to ensure separation of concerns and separated presentation. DataLabs are using JASMIN as the host computing platform, giving researchers seamless access to HPC resources, while taking advantage of the cloud scalability. Data storage is available to all systems through shared block storage (NFS cluster) and object storage (QuoBye S3).
Research into and development of virtual labs for environmental data science are taking part within the DSNE project. This requires studying the current experiences, barriers and opportunities associated with virtual labs, as well as the requirements for future developments and extensions. For this purpose, we have conducted an online user engagement survey, targeting DSNE researchers and the wider user community, as well as the international research groups and organisations that contribute to virtual labs design. The survey results are considered are feeding into the continuous development of DataLabs. For instance, some of the researchers’ requirements include the ability to submit their own containers to DataLabs and the security issues to access external data storage. Other users have indicated the importance of having libraries of data science and data visualisation methods, which are currently being populated by DSNE researchers to be then explored in different environmental problems.
How to cite: Salama, M., Blair, G., Brown, M., and Hollaway, M.: Virtual Labs for Collaborative Environmental Data Science, EGU General Assembly 2022, Vienna, Austria, 23–27 May 2022, EGU22-10719, https://doi.org/10.5194/egusphere-egu22-10719, 2022.
Please decide on your access
Please use the buttons below to download the presentation materials or to visit the external website where the presentation is linked. Regarding the external link, please note that Copernicus Meetings cannot accept any liability for the content and the website you will visit.
Forward to presentation link
You are going to open an external link to the presentation as indicated by the authors. Copernicus Meetings cannot accept any liability for the content and the website you will visit.
We are sorry, but presentations are only available for users who registered for the conference. Thank you.

EGU22-10796 | Presentations | ESSI3.3
UAV Data Analysis in the Cloud - A Case StudyUlrich Kelka, Chris Peters, Owen Kaluza, Jens Klump, Steven Micklethwaite, and Nathan Reid
The mapping of fracture networks from aerial photographs, tracing of fault scarps in digital elevation models, and digitisation of boundaries from potential field data is fundamental to many geological applications (e.g. resource management, natural hazard assessment, geotechnical stability etc.). However, conventional approaches to digitising geological features are labour intensive and do not scale.
We describe how we designed an automated fracture detection workflow and implemented it in a cloud environment, using free and open-source software, as part of The Australian Scalable Drone Cloud (ASDC, https://asdc.io) national initiative. The ASDC aims to standardise and scale drone data, then analyse and translate it for users in academia, government, and industry.
In this use case, we applied automatic ridge/edge detection techniques to generate trace maps of discontinuities (e.g. fractures or lineaments). The approach allows for internal classification based on statistical description and/or geometry and enhances the understanding of the internal structure of such networks. Further, photogrammetry and image analysis at scale can be limited by the available computing resources, but this issue was overcome through implementation in the cloud. The simple methods l serve as a basis for emerging techniques that utilise machine learning to fully automate the discontinuity identification and represents an important step in the cultural adoption of such tools in the Earth Science community.
We deployed Open Drone Map (ODM) onto a cloud infrastructure to produce orthophoto mosaics from aerial images taken by UAV to implement this case study. We ported a fracture detection and mapping algorithm from Matlab to Python for the image analysis. The image analysis workflow is orchestrated through a Jupyter Notebook on a Jupyter Hub. The resulting prototype workflow will be used to better scope the services needed to manage the ASDC platform, like user management and data logistics.
How to cite: Kelka, U., Peters, C., Kaluza, O., Klump, J., Micklethwaite, S., and Reid, N.: UAV Data Analysis in the Cloud - A Case Study, EGU General Assembly 2022, Vienna, Austria, 23–27 May 2022, EGU22-10796, https://doi.org/10.5194/egusphere-egu22-10796, 2022.
EGU22-10850 | Presentations | ESSI3.3
A Natural Language Processing-based Metadata Recommendation Tool for Earth Science DataArmin Mehrabian, Irina Gerasimov, and Mohammad Khayat
As one of NASA's Science Mission Directorate data centers, the Goddard Earth Sciences Data and Information Services Center (GES-DISC) provides Earth science data, information, and services to the public. One of the objectives of our mission is to facilitate data discovery for users and systems that utilize our data. Metadata plays a very important role in data discovery. As a result, if a dataset is to be used efficiently, it needs to be enhanced with rich and comprehensive metadata. For example, most search engines rely on matching the search query with the indexed metadata in order to find relevant results. Here we present a tool that supports data custodians in the process of creating metadata by utilizing natural language processing (NLP).
Our approach involves combining several text corpora and training a semantic embedding. An embedding is a numerical representation of linguistic features that is aware of the semantics and context. The text corpora we use to train our embedding model contains publication abstracts, our data collections metadata, and ontologies. Our recommendations are based on keywords selected from the Global Change Master Directory (GCMD) and a collection of ontologies including SWEET and ENVO. GCMD offers a comprehensive collection of Earth Science vocabulary terms. This data lexicon enables data curators to easily search metadata and retrieve the data, services, and variables associated with each term. When a query is matched against various keywords in the GCMD branch, the probability of the query matching these keywords is calculated. A similarity score is then assigned to each of the branches of the GCMD, and each branch is sorted according to this similarity metric. In addition to unsupervised training, our approach has the advantage of being able to search for keyword recommendations of different sizes, ranging from sub-words to sentences and longer texts.
How to cite: Mehrabian, A., Gerasimov, I., and Khayat, M.: A Natural Language Processing-based Metadata Recommendation Tool for Earth Science Data, EGU General Assembly 2022, Vienna, Austria, 23–27 May 2022, EGU22-10850, https://doi.org/10.5194/egusphere-egu22-10850, 2022.
EGU22-10855 | Presentations | ESSI3.3
Cross-institutional collaboration through the prism of FOSS and Cloud technologiesPavel Golodoniuc, Vincent Fazio, Samuel Bradley, YunLong Li, and Jens Klump
The AuScope Virtual Research Environment (AVRE) program’s Engage activity was devised as a vehicle to promote low-barrier collaboration projects with Australian universities and publicly-funded research agencies and to provide an avenue for exploring new applications and technologies that could become part of the broader AuScope AVRE portfolio. In its second year, we developed two projects with another cohort of collaborative projects proponents from two Australian research institutions. Both projects have leveraged and extended upon previously developed open-source projects while tailoring them to clients’ specific needs.
The latest projects developed under the AuScope AVRE Engage program were the AuScope Geochemistry Network (AGN) Lab Finder Application and the Magnetic Component Symmetry (MCS) Analysis application. The Lab Finder application fits within a broader ecosystem of AGN projects and is an online tool that provides an overview of participating laboratories, their equipment, techniques, contact information with a catalogue that sums up the possibilities of each analytical technique, and a user-friendly search and browsing interface. The MCS Analysis application implements the CSIRO Orthogonal Magnetic Component (OMC) analysis method for the detection of l variations in the magnetic field (i.e., anomalies) that are the result of subsurface magnetizations. Both applications were developed using free and open-source software (FOSS) and leveraged prior work and further expand on it. The AGN Lab Finder is an adaptation of the Technique Finder originally developed by Intersect for Microscopy Australia, which was redesigned to accommodate geochemistry-specific equipment and describe its analytical capabilities It provides an indexing mechanism and a search functionality allowing researchers to efficiently locate and identify laboratories with the equipment necessary to their research needs and that satisfies their analytical capability requirements. The MCS Analysis application is a derivative product based on Geophysical Processing Toolkit (GPT) that implements a user-centred approach to visual data analytics and modelling. It significantly improves user experience by integrating with open data services, adding complex interactivity and data visualisation functionality, and improving overall exploratory data analysis capability.
The Engage approach to running collaborative projects has proved successful over the last two years and produced low-maintenance tools that are made freely accessible to researchers. The approach to engage a wider audience and improve the speed of science delivery has influenced other projects within the CSIRO Mineral Resources business unit to implement similar programs.
This case study will demonstrate the social aspects of our experience in cross-institutional collaboration, showcase our learnings during the development of pilot projects, and outline our vision for future work.
How to cite: Golodoniuc, P., Fazio, V., Bradley, S., Li, Y., and Klump, J.: Cross-institutional collaboration through the prism of FOSS and Cloud technologies, EGU General Assembly 2022, Vienna, Austria, 23–27 May 2022, EGU22-10855, https://doi.org/10.5194/egusphere-egu22-10855, 2022.
EGU22-11012 | Presentations | ESSI3.3
The Known Knowns, the Known Unknowns and the Unknown Unknowns of Geophysics Data Processing in 2030Lesley Wyborn, Nigel Rees, Jens Klump, Ben Evans, Tim Rawling, and Kelsey Druken
The Australian 2030 Geophysics Collections Project seeks to make accessible online a selection of rawer, high-resolution versions of geophysics datasets that comply with the FAIR and CARE principles, and ensure they are suitable for programmatic access in HPC environments by future 2030 next-generation scalable, data-intensive computation (including AI and ML). The 2030 project is not about building systems for the infrastructures and stakeholder requirements of today, rather it is about positioning geophysical data collections to be capable of taking advantage of next generation technologies and computational infrastructures by 2030.
There are already many known knowns of 2030 computing: high end computational power will be at exascale and today’s emerging collaborative platforms will continue to evolve as a mix of HPC and cloud. Data volumes will be measured in Zettabytes (1021 bytes), which is about 10 times more than today. It will be mandatory for data access to be fully machine-to-machine as envisaged by the FAIR principles in 2016. Whereas we currently discuss Big Data Vs (volume, variety, value, velocity, veracity, etc), by 2030 the focus will be on Big Data Cs (community, capacity, confidence, consistency, clarity, crumbs, etc).
So often today’s research is undertaken on pre-canned, analysis-ready datasets (ARD) that are tuned towards the highest common denominator as determined by the data owner. However, increased computational power colocated with fast-access storage systems will mean that geophysicists will be able to work on less processed data levels and then transparently develop their own derivative products that are more tuned to the parameters of their particular use case. By 2030, as research teams analyse larger volumes of high-resolution data they will be able to see the quality of their algorithms quickly and there will be multiple versions of open software being used as researchers fine tune individual algorithms to suit their specific requirements. We will be capable of more precise solutions and in hazards space and other relevant areas, analytics will be done in faster-than-real-time.
The known unknowns emerging are how we will preserve and make transparent any result from this diversity and flexibility with regards to the exact software used, the precise version of the data accessed, and the platforms utilised, etc. When we obtain a scientific ‘product’, how will we vouch for its fidelity and ensure it can be consistently replicated to establish trust? How do we preserve who funded what so that sponsors can see which investments have had the greatest impact and uptake?
To have any confidence in any data product, we will need to have transparency throughout the whole scientific process. We need to start working now on more automated systems that capture provenance through successive levels of processing, including how it was produced and which dataset/dataset extract was used. But how do we do this in a scaleable, machine readable way?
And then there will be the unknown unknowns of 2030 computing. Time will progressively expose these to us in the next decade as the scale and speed at which collaborative research is undertaken increases.
How to cite: Wyborn, L., Rees, N., Klump, J., Evans, B., Rawling, T., and Druken, K.: The Known Knowns, the Known Unknowns and the Unknown Unknowns of Geophysics Data Processing in 2030, EGU General Assembly 2022, Vienna, Austria, 23–27 May 2022, EGU22-11012, https://doi.org/10.5194/egusphere-egu22-11012, 2022.
Please decide on your access
Please use the buttons below to download the presentation materials or to visit the external website where the presentation is linked. Regarding the external link, please note that Copernicus Meetings cannot accept any liability for the content and the website you will visit.
Forward to presentation link
You are going to open an external link to the presentation as indicated by the authors. Copernicus Meetings cannot accept any liability for the content and the website you will visit.
We are sorry, but presentations are only available for users who registered for the conference. Thank you.
EGU22-11270 | Presentations | ESSI3.3
Freva, a software framework for the Earth System community. Overview and and new features.Etor E. Lucio-Eceiza, Christopher Kadow, Martin Bergemann, Mahesh Ramadoss, Brian Lewis, Andrej Fast, Jens Grieger, Andy Richling, Ingo Kirchner, Uwe Ulbrich, Hannes Thiemann, and Thomas Ludwig
The complexity of the climate system calls for a combined approach of different knowledge areas. For that, increasingly larger projects need a coordinate effort that fosters an active collaboration between members. On the other hand, although the continuous improvement of numerical models and larger observational data availability provides researchers with a growing amount of data to analyze, the need for greater resources to host, access, and evaluate them efficiently through High Performance Computing (HPC) infrastructures is growing more than ever. Finally, the thriving emphasis on FAIR data principles [1] and the easy reproducibility of evaluation workflows also requires a framework that facilitates these tasks. Freva (Free Evaluation System Framework [2, 3]) is an efficient solution to handle customizable evaluation systems of large research projects, institutes or universities in the Earth system community [4-6] over the HPC environment and in a centralized manner.
Freva is a scientific software infrastructure for standardized data and analysis tools (plugins) that provides all its available features both in a shell and web environment. Written in python, is equipped with a standardized model database, an application-programming interface (API) and a history of evaluations, among others:
- An implemented metadata system in SOLR with its own search tool allows scientists and their plugins to retrieve the required information from a centralized database. The databrowser interface satisfies the international standards provided by the Earth System Grid Federation (ESGF, e.g. [7]).
- An API allows scientific developers to connect their plugins with the evaluation system independently of the programming language. The connected plugins are able to access from and integrate their results back to the database, allowing for a concatenation of plugins as well. This ecosystem increases the number of scientists involved in the studies, boosting the interchange of results and ideas. It also fosters an active collaboration between plugin developers.
- The history and configuration sub-system stores every analysis performed with Freva in a MySQL database. Analysis configurations and results can be searched and shared among the scientists, offering transparency and reproducibility, and saving CPU hours, I/O, disk space and time.
Freva efficiently frames the interaction between different technologies thus improving the Earth system modeling science.
This framework has undergone major refactoring and restructuring of the core that will also be discussed. Among others:
- Major core Python update (2.7 to 3.9).
- Easier deployment and containerization of the framework via Docker.
- More secure system configuration via Vault integration.
- Direct Freva function calls via python client (e.g. for jupyter notebooks).
- Improvements in the dataset incorporation.
References:
[1] https://www.go-fair.org/fair-principles/
[2] Kadow, C. et al. , 2021. Introduction to Freva – A Free Evaluation System Framework for Earth System Modeling. JORS. http://doi.org/10.5334/jors.253
[3] gitlab.dkrz.de/freva
[4] freva.met.fu-berlin.de
[5] https://www.xces.dkrz.de/
[6] www-regiklim.dkrz.de
[7] https://esgf-data.dkrz.de/projects/esgf-dkrz/
How to cite: Lucio-Eceiza, E. E., Kadow, C., Bergemann, M., Ramadoss, M., Lewis, B., Fast, A., Grieger, J., Richling, A., Kirchner, I., Ulbrich, U., Thiemann, H., and Ludwig, T.: Freva, a software framework for the Earth System community. Overview and and new features., EGU General Assembly 2022, Vienna, Austria, 23–27 May 2022, EGU22-11270, https://doi.org/10.5194/egusphere-egu22-11270, 2022.
Please decide on your access
Please use the buttons below to download the presentation materials or to visit the external website where the presentation is linked. Regarding the external link, please note that Copernicus Meetings cannot accept any liability for the content and the website you will visit.
Forward to presentation link
You are going to open an external link to the presentation as indicated by the authors. Copernicus Meetings cannot accept any liability for the content and the website you will visit.
We are sorry, but presentations are only available for users who registered for the conference. Thank you.

EGU22-12617 | Presentations | ESSI3.3
Digital Twin of the Ocean - An Introduction to the ILIAD projectBente Lilja Bye, Georgios Sylaios, Arne-Jørgen Berre, Simon Van Dam, and Vivian Kiousi
The ILIAD Digital Twin of the Ocean, a H2020 funded project, builds on the assets resulting from two decades of investments in policies and infrastructures for the blue economy and aims at establishing an interoperable, data-intensive, and cost-effective Digital Twin of the Ocean. It capitalizes on the explosion of new data provided by many different Earth observation sources, advanced computing infrastructures (cloud computing, HPC, Internet of Things, Big Data, social networking, and more) in an inclusive, virtual/augmented, and engaging fashion to address all Earth data challenges. It will contribute towards a sustainable ocean economy as defined by the Centre for the Fourth Industrial Revolution and the Ocean, a hub for global, multistakeholder co-operation.
The ILIAD Digital Twin of the Ocean will fuse a large volume of diverse data, in a semantically rich and data agnostic approach to enable simultaneous communication with real world systems and models. Ontologies and a standard style-layered descriptor will facilitate semantic information and intuitive discovery of underlying information and knowledge to provide a seamless experience. The combination of geovisualisation, immersive visualization and virtual or augmented reality allows users to explore, synthesize, present, and analyze the underlying geospatial data in an interactive manner. To realize its potential, the ILIAD Digital Twin of the Ocean will follow the System of Systems approach, integrating the plethora of existing EU Earth Observing and Modelling Digital Infrastructures and Facilities. To promote additional applications through ILIAD Digital Twin of the Ocean, the partners will create the ILIAD Marketplace, included a market for Geosciences related applications and services. Like an app store, providers will use the ILIAD Marketplace to distribute apps, plug-ins, interfaces, raw data, citizen science data, synthesized information, and value-adding services derived from the ILIAD Digital Twin of the Ocean. It will also be an efficient way for scientists to discover and find relevant applications and services.
How to cite: Bye, B. L., Sylaios, G., Berre, A.-J., Van Dam, S., and Kiousi, V.: Digital Twin of the Ocean - An Introduction to the ILIAD project, EGU General Assembly 2022, Vienna, Austria, 23–27 May 2022, EGU22-12617, https://doi.org/10.5194/egusphere-egu22-12617, 2022.
EGU22-376 | Presentations | SM5.6
Three-dimensional electrical conductivity structure of the contiguous US from USArray MT dataFederico Munch and Alexander Grayver
Knowledge about the electrical conductivity structure of the Earth's interior is a key to understanding its thermo-chemical state and evaluate the impact of space weather events. USMTArray is a high quality data set of magnetotelluric measurements that addresses both of these problems. Covering ~70% of the contiguous United States on a quasi-regular 70 km spaced grid, this unique publicly available data led to the development of several regional 3D electrical conductivity models. However, an inversion of the entire data set demands novel multi-scale imaging approaches that can handle and take advantage of a large range of spatial scales contained in the data. We present a 3D electrical conductivity model of the contiguous United States derived from the inversion of ~1100 USArray magnetotelluric stations. The use of state-of-the-art modeling techniques based on high-order finite-element methods allows us to take into account complex coastline and reconstruct Earth’s conductivity across many scales. The retrieved electrical conductivity variations are in overall agreement with well-known continental structures such as the active tectonic processes within the western United States (e.g., Yellowstone hotspot, Basin and Range extension, and subduction of the Juan de Fuca slab) as well as the presence of deep roots (~250 km) beneath cratons.
How to cite: Munch, F. and Grayver, A.: Three-dimensional electrical conductivity structure of the contiguous US from USArray MT data, EGU General Assembly 2022, Vienna, Austria, 23–27 May 2022, EGU22-376, https://doi.org/10.5194/egusphere-egu22-376, 2022.
EGU22-562 | Presentations | SM5.6
Toward a three-dimensional tomographic model of the Pacific upper mantle with full resolution and uncertaintiesFranck Latallerie, Christophe Zaroli, Sophie Lambotte, and Alessia Maggi
Tomographic models suffer from unevenly distributed noisy data and therefore have complicated resolution and uncertainties that can hinder their interpretation. Using linear Backus & Gilbert inversion, it is possible to obtain tomographic models with resolution and uncertainties in a single step. Using such a method, we aim to produce a three-dimensional tomographic model of the Pacific upper mantle from surface-wave data. To linearise the forward problem, we use finite-frequency theory to describe the sensitivity of surface-wave phase-delays to the three-dimensional shear-wave velocity. We build a data-base of phase-delay measurements for surface-waves that cross the Pacific Ocean. We estimate the data uncertainties caused by measurement errors using a multitaper technique and those caused by poor knowledge of the seismic source and crust by a Monte-Carlo method. Using the Backus & Gilbert approach, the phase-delay dataset, and the data uncertainty estimates, we obtain a model of the shear-wave velocity of the Pacific upper mantle together with its three-dimensional resolution and uncertainties. These allow us to discuss, using robust statistical arguments, the existence and the three-dimensional organisation of structures we expect to see in the Pacific upper mantle, such as plume-like upwellings or small-scale sub-lithospheric convections.
How to cite: Latallerie, F., Zaroli, C., Lambotte, S., and Maggi, A.: Toward a three-dimensional tomographic model of the Pacific upper mantle with full resolution and uncertainties, EGU General Assembly 2022, Vienna, Austria, 23–27 May 2022, EGU22-562, https://doi.org/10.5194/egusphere-egu22-562, 2022.
Please decide on your access
Please use the buttons below to download the presentation materials or to visit the external website where the presentation is linked. Regarding the external link, please note that Copernicus Meetings cannot accept any liability for the content and the website you will visit.
Forward to presentation link
You are going to open an external link to the presentation as indicated by the authors. Copernicus Meetings cannot accept any liability for the content and the website you will visit.
We are sorry, but presentations are only available for users who registered for the conference. Thank you.
EGU22-1567 | Presentations | SM5.6
LitMod3D_4inv: Multi-observable and multi-scale geophysical inversions for the physical state of the Earth.Ilya Fomin, Juan Afonso, and Constanza Manassero
Characterising the physical state of the Earth's interior with high resolution requires the joint inversion of complementary geophysical datasets. LitMod3D_4inv is a method/software that allows regional and continental scale joint inversions within a probabilistic framework for the 3D thermochemical structure of the lithosphere and upper mantle. The software can simultaneously invert gravity anomalies, geoid height, gravity gradients, Love and Rayleigh surface-wave dispersion curves, receiver functions, body-wave travel times, surface heat flow, absolute elevation and magnetotelluric data, or any combination of them. The result is a collection of Earth models (a probabilistic distribution) with exceptional explicative power and robust estimates for uncertainties.
We use equations of state and Gibbs free energy minimisation routines to produce self-consistent sets of the seismic velocities, densities, and other properties from the actual parameters (unknowns) of the inversion – mantle chemical compositions, thermal profiles, and properties of the crustal layers (thickness, reference densities, Vp/Vs). The code relies on highly-optimised solvers for gravity, seismic, and magnetotelluric forward problems and multi-level hybrid parallel architecture to make use of multiple interacting markov chains. The modular structure of the code allows for extending the set of solvers to include new observables or to implement new Markov chain Monte Carlo algorithms.
In this presentation we will discuss recent developments in the LitMod3D_4inv suite and illustrate their performance with real examples in eastern Canada, in southern and central Africa, and north eastern Australia.
How to cite: Fomin, I., Afonso, J., and Manassero, C.: LitMod3D_4inv: Multi-observable and multi-scale geophysical inversions for the physical state of the Earth., EGU General Assembly 2022, Vienna, Austria, 23–27 May 2022, EGU22-1567, https://doi.org/10.5194/egusphere-egu22-1567, 2022.
EGU22-1920 | Presentations | SM5.6
Imaging oceanic basins with wave equation and radiative transfer modelsChiara Nardoni, Luca De Siena, Fabio Cammarano, Fabrizio Magrini, and Elisabetta Mattei
When seismic information is used to map Earth structures, a primary challenge is modelling the response of seismic wavefields to strong lateral variations in medium properties. These variations are especially relevant across oceanic basins with mixed continental-oceanic crust and including magmatic systems. These highly-scattering and absorption media produce stochastic signatures that are hard to separate from complex coherent reverberations due to shallow Moho. The discrimination between these two effects is fundamental for improving full-waveform techniques when imaging oceanic basins at regional and global scales. Here, we present a joint tomographic and modelling approach focusing on the ~1 Hz frequency band, where seismic scattering and attenuation mechanisms are predominantly resonant. Firstly, we image late-time coda attenuation as a marker of seismic absorption across the Italian peninsula and the Tyrrhenian Sea. Regional-scale data provide the ideal benchmark to explore the potential of attenuation imaging using radiative-transfer-derived sensitivity kernels in a mixed continental-oceanic crust. Then, we explore the response of seismic wavefield to structural variations combining coda-attenuation imaging with simulations based on radiative transfer and wave-equation modelling. The results provide evidence of intra-crustal reverberations and energy leakage in the mantle, finally being able to map Moho depths with regional earthquakes. This work is an ideal forward model of seismic wavefields recorded across the oceanic crust for future full-waveform inversions and imaging of crustal discontinuities.
How to cite: Nardoni, C., De Siena, L., Cammarano, F., Magrini, F., and Mattei, E.: Imaging oceanic basins with wave equation and radiative transfer models, EGU General Assembly 2022, Vienna, Austria, 23–27 May 2022, EGU22-1920, https://doi.org/10.5194/egusphere-egu22-1920, 2022.
EGU22-2459 | Presentations | SM5.6
Surface-wave tomography of the South-East Asia by joint inversion of Rayleigh and Love phase velocities from seismic ambient noise and teleseismic earthquakesFabrizio Magrini, Luca De Siena, Simone Pilia, Nicholas Rawlinson, and Boris Kaus
South-East Asia hosts the largest and most complicated subduction system of our planet, associated with extensive volcanism and seismicity. Obtaining high-resolution seismic images of South-East Asia can provide important constraints on the lateral variations of physical parameters such as density, composition, temperature, and viscosity of this dynamic patchwork. In turn, this has relevant implications on our ability to forecast its geodynamic evolution by numerical modeling. In this study, we join all the publicly-available seismic data distributed across the Malay Peninsula, Sumatra, Java, Sulawesi, South Borneo, and North Australia (amounting of 468 broad-band seismic receivers) with the continuous seismograms from 70 receivers recently installed in North Borneo, resulting in an unprecedented seismic coverage of the region.
We first use such data to extract Rayleigh and Love phase velocities based on both seismic ambient noise and teleseismic earthquakes. Overall, we retrieve 14,036 Rayleigh- and 12,005 Love-wave dispersion curves, covering surface-wave periods between 3 and 150 s and sensitive to both the shallow crust and the upper mantle. We then invert the dispersion curves for phase-velocity maps at different periods, using a linearized-inversion algorithm based on the ray theory with a roughness damping constraint. In doing so, we adopt an adaptive parameterization, allowing for a finer resolution of the resulting maps in the areas characterized by a relatively high density of measurements. At relatively short periods (<20 s), the phase-velocity maps are characterized by strong lateral heterogeneities. We find, for example, relatively low velocities in correspondence of the Central- and South-Sumatra Basin, ascribed to thick sedimentary layers, and higher velocities in the (adjacent) Barisan Mountains. Low velocities also characterize a large region approximately centered onto the Merapi volcano (Central Java), the Mentawai islands (in correspondence of the Mentawai Fault System), the Sahul Shelf (including the East Timor island), and the marine region between east Borneo and Sulawesi. Relatively high velocities are found below the Banda Sea. The amplitude of such lateral variations quickly decreases at larger periods and, among the most pronounced features, we observe relatively low velocities in the north-east of Borneo (as opposed to its south-western part), and high velocities in the Celebes Sea (north of the North-Sulawesi Trench).
At the time of writing, we are planning to translate the phase-velocity maps thus retrieved into shear-wave velocity (Vs) as a function of depth. Specifically, we plan to extract one Rayleigh- and one Love-wave phase-velocity profile for each grid cell constituting our phase-velocity maps, and (non-linearly) jointly invert them for Vs using the neighbourhood algorithm. The resulting 3-D tomographic model will thus be interpreted in light of the existing literature on the study area, involving (but not limited to) geodynamic and geologic models, geophysical, geochemical, and geodetic observations.
How to cite: Magrini, F., De Siena, L., Pilia, S., Rawlinson, N., and Kaus, B.: Surface-wave tomography of the South-East Asia by joint inversion of Rayleigh and Love phase velocities from seismic ambient noise and teleseismic earthquakes, EGU General Assembly 2022, Vienna, Austria, 23–27 May 2022, EGU22-2459, https://doi.org/10.5194/egusphere-egu22-2459, 2022.
EGU22-2686 | Presentations | SM5.6
Scattering and Absorption Imaging of the North Anatolian Fault Zone, northern TurkeyPanayiota Sketsiou, David Cornwell, and Luca De Siena
The North Anatolian Fault (NAF) is a right-lateral, strike-slip fault in the northern part of the Anatolian peninsula. It is estimated to have a length of up to 1500 km, extending westwards between the Karliova Triple Junction, where it nucleates, to the Aegean Sea. In the west and close to the Sea of Marmara, the NAF splays into northern (NNAF) and southern (SNAF) strands. The splay of the western part of the NAF separates the area into three primary terranes: the Istanbul Zone (north of the northern strand), the Armutlu-Almacik Block (between the two strands of the fault) and the Sakarya Zone (south of the southern strand).
There have been a series of high-magnitude earthquakes along the NAF since the 1930s, migrating from east to west. In order to investigate the western part of the North Anatolian Fault Zone (NAFZ), which is the most seismically active at the moment, the Dense Array for North Anatolia (DANA) temporary seismic network was deployed for 18 months between 2012 and 2013. A set of local earthquakes, recorded by DANA, were utilised to study the 2D scattering and coda attenuation structure in the western NAFZ, between 1 and 18 Hz. P-wave arrival times were manually picked and the events were re-located using the Non-Linear Location software. Peak-delay travel times were calculated as a measure of forward scattering, and the exponential decay of the coda wave envelopes was used to invert for the absorption structure using multiple scattering sensitivity kernels.
The obtained models are 2D averages of the first 10-15 km of the crust, where the majority of the seismic activity is located and they have been compared to recent geophysical studies in the same area. The scattering structure, between 1 and 6 Hz, highlights the three main tectonic units in the area. The absorption structure is generally more heterogeneous than the scattering structure, with the overall absorption decreasing as the frequency increases. The lithological variations and heterogeneity between and within the three terranes of the area, arising from the complex tectonic history of the region, are believed to be the main reasons for the scattering and absorption observations made. The high absorption zones observed along the two branches of the fault, and especially the southern branch, is a very important finding, as the signature of the southern branch in geophysical studies is often unclear.
How to cite: Sketsiou, P., Cornwell, D., and De Siena, L.: Scattering and Absorption Imaging of the North Anatolian Fault Zone, northern Turkey, EGU General Assembly 2022, Vienna, Austria, 23–27 May 2022, EGU22-2686, https://doi.org/10.5194/egusphere-egu22-2686, 2022.
EGU22-3257 | Presentations | SM5.6
Using K-Means Clustering to Compare Adjoint Waveform Tomography Models of California and NevadaClaire Doody, Arthur Rodgers, Christian Boehm, Michael Afanasiev, Lion Krischer, Andrea Chiang, and Nathan Simmons
Full waveform inversion models by adjoint methods represent the most detailed seismic tomography models currently available for waveform simulations. However, the influence of starting models on final inversion results is rarely studied due to computational expense. To study this influence, we present three adjoint waveform tomography models of California and Nevada using three different starting models: the SPiRaL global model (Simmons et al., 2021), the CSEM_NA model (Krischer et al., 2018), and the WUS256 model (Rodgers et al., 2021). Each model uses the same dataset of 103 events between magnitudes 4.5 and 6.5 that occurred from January 1, 2000 to October 31st, 2020. For each event, 175-475 stations record data, creating dense path coverage over California. The model iterations are computed using Salvus. We begin by running iterations for each starting model at three period bands: 30-100 seconds, 25-100 seconds, and 20-100 seconds. For each period band, we run iterations until the average misfit for all events is no longer reduced; over all period bands, we run more than 55 iterations and see misfit reductions of up to 40% in some period bands. Each model shows velocity anomalies of up to 20%, but the difference in VS values between the models can be significant. Most of these differences seem to correlate with small-scale differences in the starting models. To test whether these differences between the models could affect the interpretation of their results, we utilize k-means clustering to analyze the similarities in large-scale structure in all three models (e.g. Lekic and Romanowicz, 2011). We separate each model into a crustal layer (0-30km depth) and uppermost mantle layer (30-150km), then run a k-means clustering algorithm on absolute Vs wavespeeds and anisotropy [(Vsh/Vsv)^2] separately. We show that regardless of the differences seen on visual inspection, all three models can resolve tectonic-scale structures equally.
This work was supported by LLNL Laboratory Directed Research and Development project 20-ERD-008. This work was performed under the auspices of the U.S. Department of Energy by Lawrence Livermore National Laboratory under Contract DE-AC52-07NA27344. LLNL-ABS-830615.
How to cite: Doody, C., Rodgers, A., Boehm, C., Afanasiev, M., Krischer, L., Chiang, A., and Simmons, N.: Using K-Means Clustering to Compare Adjoint Waveform Tomography Models of California and Nevada, EGU General Assembly 2022, Vienna, Austria, 23–27 May 2022, EGU22-3257, https://doi.org/10.5194/egusphere-egu22-3257, 2022.
Please decide on your access
Please use the buttons below to download the presentation materials or to visit the external website where the presentation is linked. Regarding the external link, please note that Copernicus Meetings cannot accept any liability for the content and the website you will visit.
Forward to presentation link
You are going to open an external link to the presentation as indicated by the authors. Copernicus Meetings cannot accept any liability for the content and the website you will visit.
We are sorry, but presentations are only available for users who registered for the conference. Thank you.
EGU22-3507 | Presentations | SM5.6
Seismotomographic structure of the central zone of Kamchatka suprasubduction complex according to the dense seismological networks dataNatalia Bushenkova, Olga Bergal-Kuvikas, Evgeny I. Gordeev, Danila Chebrov, Ivan Koulakov, Ilyas Abkadyrov, Andrey Jakovlev, Tatiana Stupina, Angelika Novgorodova, and Svetlana Droznina
The strongest earthquakes and the largest explosive eruptions are confined to plate convergent boundaries. Many geodynamics aspects attract the scientific community's attention since answers to the most important questions cannot be obtained without reliable information about the deep structure. Geophysical studies of the crust and mantle provide essential information for lithospheric blocks interactions, mantle convection and fluid migration. This data is necessary to identify reliable criteria for assessing volcanic and seismic risk.
The studied area is central Kamchatka, where the cities of Petropavlovsk-Kamchatsky, Elizovo, and Vilyuchinks are located. It includes territory from the Gorely and Mutnovsky volcanoes in the south to the Bakening volcano and the Verkhneavachinskaya caldera in the north. It extends from the eastern to the western peninsula coasts. The study area includes the Avachinskaya group of volcanoes, the Vilyuchinsky and Zhupanovsky volcanoes, Karymshina caldera and a number of monogenic cinder cones. This region is assumed to be located at a transition between two principle different subduction regimes in the north and south of Kamchatka. Previous studies are sparse and have poor resolution due to the low density and uneven distribution of seismic stations.
In this study, we used a large dataset recorded by a new dense temporary network deployed in 2019-2020, which was specially designed for performing high-quality seismic tomographic studies of the suprasubduction complex structure (crust and upper mantle) beneath central Kamchatka. This dataset was supplemented by data recorded by (1) the temporary network operated on the Avachinskaya group of volcanoes in 2018-2019 and (2) the permanent stations Kamchatka branch of the Federal Research Center of the GS RAS. The seismic model is based on the data from 2687 local earthquakes that occurred during the operation of the mentioned temporary networks and were recorded by 134 regional stationary and temporary stations. In the tomographic inversion we used 59088 travel times of P-waves and 34697 of S-waves.
The new model makes it possible to trace zones of fluid and melt release from the slab, their migration in the mantle wedge and crust, and allows assessing their role in feeding the magmatic systems. Volcanoes of the Avachinskaya group have a common magma plumbing system at a depth more than 50 km, which could be traced from the slab. The Vilyuchinsky volcano feds through an intermediate large magma chamber located at a depth of 30-55 km, which is also related to the feeding of the Bolshebannaya hydrothermal system situated to the west. This large chamber fed from a conduit originated on the slab at more than 70 km depth. The feeding system of the Gorely and Mutnovsky volcanoes is traced to the slab at depths of more than 100 km.
This work was supported by the Russian Science Foundation (project No. 22-27-00215) and the Ministry of Education and Science of the Russian Federation (megagrant No. 14.W03.31.0033).
How to cite: Bushenkova, N., Bergal-Kuvikas, O., Gordeev, E. I., Chebrov, D., Koulakov, I., Abkadyrov, I., Jakovlev, A., Stupina, T., Novgorodova, A., and Droznina, S.: Seismotomographic structure of the central zone of Kamchatka suprasubduction complex according to the dense seismological networks data, EGU General Assembly 2022, Vienna, Austria, 23–27 May 2022, EGU22-3507, https://doi.org/10.5194/egusphere-egu22-3507, 2022.
Please decide on your access
Please use the buttons below to download the presentation materials or to visit the external website where the presentation is linked. Regarding the external link, please note that Copernicus Meetings cannot accept any liability for the content and the website you will visit.
Forward to presentation link
You are going to open an external link to the presentation as indicated by the authors. Copernicus Meetings cannot accept any liability for the content and the website you will visit.
We are sorry, but presentations are only available for users who registered for the conference. Thank you.
EGU22-3755 | Presentations | SM5.6
Receiver Function analysis of noise reduced OBS data recorded at the ultra-slow spreading Knipovich RidgeTheresa Rein, Zahra Zali, Frank Krüger, and Vera Schlindwein
Ultra-slow spreading ridges are characterized by huge volcanic complexes which are separated by up to 150 km long amagmatic segments. The mechanisms controlling the ultra-slow spreading ridges are not yet fully understood. With the aim to better understand the spreading mechanisms and the flow of the magma beneath the volcanic complexes an ocean-bottom array has been installed along a segment of the ultra-slow spreading Knipovich Ridge in the Greenland sea. The array consists of 23 LOBSTER-type ocean bottom seismometers (OBS) from the DEPAS pool and 5 LOBSTERs from the Institute of Geophysics of the Polish Academy of Sciences. We aim to constrain the crustal and mantle structure beneath the segment of the Knipovich Ridge by using receiver functions calculated from teleseismic events.
Seismic data, recorded on the ocean bottom, are highly contaminated by different noise sources, which are dominating at frequencies below 1 Hz. During the experiment the DEPAS-LOBSTERs were equipped with a MCS recorder and a Güralp CMG-40T seismometer (changed now to 6D6 recorder and Trillium Compact seismometer). This characteristic design introduces electronic noise at selected stations at frequencies below 0.2 Hz. Recently head-buoy-strumming has been identified as additional noise source at frequencies above 0.5 Hz during tidal currents. Hence, most teleseismic signals are masked by the high noise level, especially on the horizontal components. However, a good signal to noise ratio on both, the vertical and horizontal components is crucial for seismological analysis, especially the receiver function method. Applying the HPS noise reduction algorithm on OBS data, as shown by Zali et al (submitted in 2021), allows to separate percussive or transient signals, such as the teleseismic earthquake from more harmonic and monochromatic signals, such as most of the noise generated at the ocean bottom.
The results of the HPS noise reduction algorithm processing of selected KNIPAS station data show a significantly reduced noise level below 1 Hz on all seismogram components, especially on the horizontals. Here, the signal-to-noise ratio increased by up to 3.2-3.7 (average by 1.4-1.6). The increased signal-to-noise ratio on the noise reduced data allows for more reliable receiver function results and their interpretation. Here, we show the reduced noise level on the OBS data and compare the receiver function results calculated from original data with the results from noise-reduced data.
How to cite: Rein, T., Zali, Z., Krüger, F., and Schlindwein, V.: Receiver Function analysis of noise reduced OBS data recorded at the ultra-slow spreading Knipovich Ridge, EGU General Assembly 2022, Vienna, Austria, 23–27 May 2022, EGU22-3755, https://doi.org/10.5194/egusphere-egu22-3755, 2022.
EGU22-3850 | Presentations | SM5.6
Joint Geophysical and Petrological Inversion to Image the Lithosphere and Asthenosphere Beneath Ireland and BritainEmma Chambers, Raffaele Bonadio, Sergei Lebedev, Javier Fullea, Duygu Kiyan, Christopher Bean, Brian O'Reilly, Patrick Meere, Meysam Rezaeifar, Gaurav Tomar, and Tao Ye and the DIG Team
DIG (De-risking Ireland’s Geothermal Potential) integrates inter-disciplinary and multi-scale datasets in order to investigate Ireland’s low-enthalpy geothermal energy potential. Recent deployments of broadband seismic stations and the output surface-wave measurements yield dense data sampling of the crust and mantle beneath Ireland and neighbouring Great Britain, which can be used to determine the lithospheric and asthenospheric structure at a regional scale. In addition, we integrate magnetotelluric measurements, forming the foundations for a region-scale, multi-parameter modelling of the thermal and compositional structure of the lithosphere.
In this study, we utilise the large seismic dataset and extract Rayleigh and Love-wave phase velocity dispersion curves, measured for pairs of stations across Ireland and Great Britain. The measurements were performed using two methods with complementary period ranges; the teleseismic cross-correlation method and the waveform inversion method, yielding a 4-500 s period range for the dispersion curves. The joint analysis of Rayleigh and Love measurements constrains the isotropic-average shear-wave velocity, relatable to temperature and composition, providing essential constraints on the thermal structure of the region’s lithosphere. We demonstrate this by inverting the data using an integrated joint geophysical-petrological thermodynamically self-consistent approach (Fullea et al., GJI 2021), where seismic velocities, electrical conductivity, and density are dependent on mineralogy, temperature, composition, water content, and the presence of melt. The multi-parameter models produced by the integrated inversions fit the surface-wave and other data, revealing the temperatures and geothermal gradients within the crust and mantle, which will be used for future geothermal exploration and utilisation.
The project is funded by the Sustainable Energy Authority of Ireland under the SEAI Research, Development & Demonstration Funding Programme 2019 (grant number 19/RDD/522) and by the Geological Survey of Ireland.
How to cite: Chambers, E., Bonadio, R., Lebedev, S., Fullea, J., Kiyan, D., Bean, C., O'Reilly, B., Meere, P., Rezaeifar, M., Tomar, G., and Ye, T. and the DIG Team: Joint Geophysical and Petrological Inversion to Image the Lithosphere and Asthenosphere Beneath Ireland and Britain, EGU General Assembly 2022, Vienna, Austria, 23–27 May 2022, EGU22-3850, https://doi.org/10.5194/egusphere-egu22-3850, 2022.
Please decide on your access
Please use the buttons below to download the presentation materials or to visit the external website where the presentation is linked. Regarding the external link, please note that Copernicus Meetings cannot accept any liability for the content and the website you will visit.
Forward to presentation link
You are going to open an external link to the presentation as indicated by the authors. Copernicus Meetings cannot accept any liability for the content and the website you will visit.
We are sorry, but presentations are only available for users who registered for the conference. Thank you.

EGU22-4037 | Presentations | SM5.6
Ray theoretical investigations using matching pursuitsVolker Michel, Naomi Schneider, Karin Sigloch, and Eoghan Totten
The three-dimensional structure of the Earth's interior shapes its geomagnetic and gravity fields, and can thus be constrained by observing these fields. 3-D Earth structure also causes seismological observables to deviate from those predicted for approximated, spherically symmetrical reference models. Travel time tomography is the inverse problem that uses these observed differences to constrain the 3-D structure of the interior.
On the planetary scale, i.e. in a spherical geometry, this linearized inverse problem has been parameterized with a variety of basis systems, either global (e.g. spherical harmonics) or local (e.g. finite elements). The Geomathematics Group Siegen has developed alternative approximation methods for certain applications from the geosciences: the Inverse Problem Matching Pursuits (IPMPs). These methods combine different basis systems by calculating an approximation in a so-called best basis, which is chosen iteratively from a so-called dictionary, an intentionally overcomplete set of diverse trial functions. In each iteration, the choice of the next best basis element reduces the Tikhonov functional. A particular numerical expertise has been gained for applications on spheres or balls. Hence, the methods were successfully applied to, for instance, the downward continuation of the gravitational potential as well as the MEG-/EEG-problem from medical imaging.
Our aim is to remodel the IPMPs for travel time tomography. This includes developing the data-dependent operator, deciding for specific trial functions and applying the operator to them. We also have to define termination criteria and develop the regularization in theory and practice. We introduce the IPMPs and show results from our remodelling.
How to cite: Michel, V., Schneider, N., Sigloch, K., and Totten, E.: Ray theoretical investigations using matching pursuits, EGU General Assembly 2022, Vienna, Austria, 23–27 May 2022, EGU22-4037, https://doi.org/10.5194/egusphere-egu22-4037, 2022.
EGU22-4477 | Presentations | SM5.6
Optimal resolution tomography with error tracking and the structure of the crust and upper mantle beneath Ireland and BritainRaffaele Bonadio, Sergei Lebedev, Thomas Meier, Pierre Arroucau, Andrew J. Schaeffer, Andrea Licciardi, Matthew R. Agius, Clare Horan, Louise Collins, Brian M. O'Really, Peter W. Readman, and Ireland Array Working Group
The maximum achievable resolution of a tomographic model varies spatially and depends on the data sampling and errors in the data. The significant and continual measurement-error decreases in seismology and data-redundancy increases have reduced the impact of random errors on tomographic models. Systematic errors, however, are resistant to data redundancy and their effect on the model is difficult to predict; often this results in models dominated by noise if the target resolution is too high. Here, we develop a method for finding the optimal resolving length at every point, implementing it for surface-wave tomography. As in the Backus-Gilbert method, every solution at a point results from an entire-system inversion, and the model error is reduced by increasing the model-parameter averaging. The key advantage of our method consists in its direct, empirical evaluation of the posterior model error at a point.
We first measure interstation phase velocities at simultaneously recording station pairs and compute phase-velocity maps at densely, logarithmically spaced periods. Numerous versions of the maps with varying smoothness are then computed, ranging from very rough to very smooth. Phase-velocity curves extracted from the maps at every point can be inverted for shear-velocity (VS) profiles. As we show, errors in these phase-velocity curves increase nearly monotonically with the map roughness. We evaluate the error by isolating the roughness of the phase-velocity curve that cannot be explained by any Earth structure and determine the optimal resolving length at a point such that the error of the local phase-velocity curve is below a threshold.
A 3-D VS model is then computed by the inversion of the composite phase-velocity maps with an optimal resolution at every point. Importantly, the optimal resolving length does not scale with the density of the data coverage: some of the best-sampled locations display relatively low lateral resolution, due to systematic errors in the data.
We apply this method to image the lithosphere and underlying mantle beneath Ireland and Britain. Our very large data produces a total of 11238 inter-station dispersion curves, spanning a very broad total period range (4–500 s), yielding unprecedented data coverage of the area and providing state-of-the-art regional resolution from the crust to the deep asthenosphere. Our tomography reveals pronounced, previously unknown variations in the lithospheric thickness beneath Ireland and Britain, with implications for their Caledonian assembly and for the mechanisms of the British Tertiary Igneous Province magmatism.
How to cite: Bonadio, R., Lebedev, S., Meier, T., Arroucau, P., Schaeffer, A. J., Licciardi, A., Agius, M. R., Horan, C., Collins, L., O'Really, B. M., Readman, P. W., and Working Group, I. A.: Optimal resolution tomography with error tracking and the structure of the crust and upper mantle beneath Ireland and Britain, EGU General Assembly 2022, Vienna, Austria, 23–27 May 2022, EGU22-4477, https://doi.org/10.5194/egusphere-egu22-4477, 2022.
EGU22-4784 | Presentations | SM5.6
Seismic and multi-parameter 1D reference models of the upper mantleChiara Civiero, Sergei Lebedev, Yihe Xu, Raffaele Bonadio, and Javier Fullea
1D reference Earth models are widely used by the geoscience community and include global, regional and tectonic-type reference models. Seismic 1D profiles are used routinely as reference in imaging studies. Multi-parameter models can also include density, composition, attenuation, lithospheric thickness and other parameters, of interest in a broad range of studies. The recent growth in the number of seismic stations worldwide has yielded a dramatic increase in the global sampling of the Earth with seismic data and presents an opportunity for an improvement in the global and tectonic-type reference models. Concurrent developments in computational petrology have provided methods to constrain self-consistent multi-parameter Earth models with seismic and other data. Here, we use a large global dataset of Love and Rayleigh fundamental mode, phase-velocity measurements, performed with multimode waveform inversion using all available broadband data since the 1990s, and compute phase-velocity maps at densely spaced periods in a broad, 17-310 s period range. We then invert the phase velocity curves averaged globally and across 8 tectonic environments (4 continental: Archean cratons, stable platforms, recently active continents, and active rift zones; and 4 oceanic: old, intermediate and young oceans, and backarc regions) for 1D reference models of the upper mantle. For each tectonic type, a multi-parameter 1D model is computed in a petrological inversion, where the lithospheric thickness and temperature at the bottom of the lithosphere and in the underlying mantle are the inversion parameters, and steady-state conductive lithospheric geotherms are assumed. Lithospheric and asthenospheric compositions are taken from geochemical databases, and seismic velocities, densities and Q are computed from composition, temperature and pressure using computational petrology and thermodynamic databases. The models quantify the age dependence of the lithospheric thickness and temperature in continents and oceans. Radial anisotropy is also determined and shows notable variations with depth and with tectonic environments. For most tectonic types, the smooth, accurate observed phase velocity curves can be fit by the 1D models with a misfit under 0.1-0.2% of the phase velocity value. Additionally, we compute models with minimal complexity of seismic velocity structure, also fitting the data but without a sub-lithospheric low-velocity zone as in the thermal multi-parameter models. These purely seismic models, similar in appearance to ak135, do not correspond to realistic geotherms but provide useful reference for seismic imaging studies in different environments.
How to cite: Civiero, C., Lebedev, S., Xu, Y., Bonadio, R., and Fullea, J.: Seismic and multi-parameter 1D reference models of the upper mantle, EGU General Assembly 2022, Vienna, Austria, 23–27 May 2022, EGU22-4784, https://doi.org/10.5194/egusphere-egu22-4784, 2022.
EGU22-4870 | Presentations | SM5.6
Shear-velocity structure and dynamics beneath the Central Mediterranean inferred from seismic surface wavesMatthew Agius, Fabrizio Magrini, Giovanni Diaferia, Emanuel Kastle, Fabio Cammarano, Claudio Faccenna, Francesca Funiciello, and Mark van der Meijde
The evolution of the Sicily Channel Rift Zone (SCRZ), located south of the Central Mediterranean, is thought to accommodate the regional tectonic stresses of the Calabrian subduction system. It is unclear whether the rifting of the SCRZ is passive from far-field extensional stresses or active from mantle upwelling beneath. To map the structure and dynamics of the region, we measure Rayleigh- and Love-wave phase velocities from ambient seismic noise and invert for an isotropic 3-D shear-velocity and radial anisotropic model. Variations of crustal S-velocities coincide with topographic and tectonic features: slow under high elevation, fast beneath deep sea. The Tyrrhenian Sea has a <10 km thin crust, followed by the SCRZ (∼20 km). The thickest crust is beneath the Apennine-Maghrebian mountains (∼50 km). Areas experiencing extension and intraplate volcanism have positive crustal radial anisotropy (VSH>VSV); areas experiencing compression and subduction-related volcanism have negative anisotropy (VSH<VSV). The crustal anisotropy across the Channel shows the extent of the SW-NE extension. Beneath the Tyrrhenian Sea, we find very low sub-Moho S-velocities. In contrast, the SCRZ has a thin mantle lithosphere underlain by a low-velocity zone. The lithosphere-asthenosphere boundary rises from 40-60 km depth beneath Sicily and Tunisia to ∼33 km beneath the SCRZ. Upper mantle, negative radial anisotropy beneath the SCRZ suggests vertical mantle flow. We hypothesize a more active mantle upwelling beneath the rift than previously thought from an interplay between poloidal and toroidal fluxes related to the Calabrian slab, which in turn produces uplift at the surface and induces volcanism.
This project has received funding from the European Union’s Horizon 2020 research and innovation programme under the Marie Skłodowska-Curie grant agreement No 843696.
How to cite: Agius, M., Magrini, F., Diaferia, G., Kastle, E., Cammarano, F., Faccenna, C., Funiciello, F., and van der Meijde, M.: Shear-velocity structure and dynamics beneath the Central Mediterranean inferred from seismic surface waves, EGU General Assembly 2022, Vienna, Austria, 23–27 May 2022, EGU22-4870, https://doi.org/10.5194/egusphere-egu22-4870, 2022.
EGU22-5885 | Presentations | SM5.6
Seismic Attenuation of India, Himalaya and Tibet using Lg-coda wavesDibyajyoti Chaudhuri, Ayon Ghosh, Shubham Sharma, and Supriyo Mitra
We present maps to show the lateral variation of Lg coda attenuation at 1-Hz across India, Himalaya and Tibet. We use vertical component waveforms from regional earthquakes (epicentral distance<3500 km and Mw>5) recorded by the IISER-K seismological network, ones operated by the Indian Meteorological Department, and data acquired from the IRIS-DMC. Lg-coda waves are modeled as single back-scattered energy, sampling an ellipsoidal volume. The attenuation of Lg-coda is quantified using the quality factor (Q), which is frequency dependent. We use the stacked spectral ratio (SSR) method to calculate the single-trace Lg-coda Q at 1 Hz (Qo) and its frequency dependence (η). A moving-window stack of scaled-logarithmic ratios of spectral amplitudes, for window length of 25.6 s and different central lapse time, is computed for each frequency. Through a linear regression of log (stacked spectral ratio) and log (frequency), using least-squares fitting, we obtain (1-η) and log(Qo), respectively. Lg-coda is selected in a frequency range of 0.2-5 Hz, with coda window starting at 3.15 km/s. Our total coda window lengths vary between 140 s to 780 s. Our preliminary results show low Q values (~200-400) in the Eastern and Western Himalaya - possibly because of scattering of seismic energy from structural heterogeneities. Most of the Indian Shield and the intraplate regions of Shillong Plateau and Brahmaputra valley are characterized by intermediate to high Q values (~600-800), indicating fairly efficient propagation of seismic energy. Intermediate values of Q (~400-500) occur in the Indo-Burman Ranges which may be due to the cold elastic subducting oceanic lithosphere. Patches of low Q in the Tibetan Plateau (~200) are possibly the result of high temperatures and partial melts present in the crust. Our results show how the nature of the Indian Plate changes as we go from an active continent-continent collision zone in the north to eastward subduction of transitional material at the Indo-Burma ranges. Our plots of Qo and η as a function of epicentral distance, coda length and magnitude show no systematic variations.
How to cite: Chaudhuri, D., Ghosh, A., Sharma, S., and Mitra, S.: Seismic Attenuation of India, Himalaya and Tibet using Lg-coda waves, EGU General Assembly 2022, Vienna, Austria, 23–27 May 2022, EGU22-5885, https://doi.org/10.5194/egusphere-egu22-5885, 2022.
EGU22-6235 | Presentations | SM5.6
Exploring the Earth's mantle structure based on joint gravimetric and seismometric group-velocity dispersion curves of Rayleigh wavesKamila Karkowska, Monika Wilde-Piórko, Przemysław Dykowski, Marcin Sękowski, and Marcin Polkowski
Gravimetric data show excellent capabilities in long-period seismology. Tidal gravimeters can detect surface waves of periods even up to 500-600 s, while a typical broad-band seismic sensor, due to its mechanical limitation, can detect them only up to the periods of 200-300 s. Consequently, gravimetric data can complement seismic recordings for longer periods, depending on what seismometer the station is equipped with and what seismometer’s cut-off period is. A superconducting gravimeter can act as a single-dimension (only vertical component) of a very broad-band seismometer.
We selected over a dozen stations worldwide with co-located typical broad-band seismic sensors and superconducting gravimeters. A time series from broad-band seismometers have been downloaded from Incorporated Research Institutions for Seismology (IRIS) database. The raw gravimetric data (1-Hz or 1-min) are available in the International Geodynamics and Earth Tide Service (IGETS) database. Some of the data were made available courtesy of the station’s operators.
This study presents a joint analysis of the gravimetric and seismometric data to determine group-velocity dispersion curves of Rayleigh surface waves. We created a database of recordings of earthquakes for all stations and instruments. Following, we calculated the individual group-velocity dispersion curves of fundamental-mode Rayleigh waves. Simultaneous seismic and gravity recordings at the same location allow exploring a broader response for incoming seismic waves. In this way, one joint group-velocity dispersion curve of Rayleigh surface waves for a broader range of periods has been estimated for all stations. All curves were then inverted by linear inversion and Monte Carlo methods to calculate a distribution of shear-wave seismic velocity with depth in the Earth’s mantle.
This work was done within the research project No. 2017/27/B/ST10/01600 financed from the Polish National Science Centre funds.
How to cite: Karkowska, K., Wilde-Piórko, M., Dykowski, P., Sękowski, M., and Polkowski, M.: Exploring the Earth's mantle structure based on joint gravimetric and seismometric group-velocity dispersion curves of Rayleigh waves, EGU General Assembly 2022, Vienna, Austria, 23–27 May 2022, EGU22-6235, https://doi.org/10.5194/egusphere-egu22-6235, 2022.
EGU22-6399 | Presentations | SM5.6
Hamiltonian Monte Carlo Inversion of Surface Wave Dispersion to Evaluate their Potential to Constrain the Density Distribution in the Earth.Ariane Lanteri, Lars Gebraad, Andrea Zunino, and Andreas Fichtner
We present a probabilistic approach to constrain the density distribution in the Earth based on surface wave dispersion. Despite its outstanding importance in studies of the Earth’s thermo-chemical state and dynamics, 3D density variations remain poorly known, thereby posing one of the major challenges in geophysics.
Since the sensitivity of most seismic data to density is small compared to sensitivity with respect to seismic velocities, regularisation in traditional deterministic inversion tends to bias the recovered density image significantly. To avoid this issue, we propose to solve a regularisation-free Bayesian inference problem using the Hamiltonian Monte Carlo Markov Chain algorithm.
In the interest of simplicity, we consider anisotropic stratified media, where dispersion curves and corresponding sensitivity kernels can be computed semi-analytically. Exploiting derivative information for efficient sampling, Hamiltonian Monte Carlo approximates the posterior probability density of all model parameters, namely the P-wave velocities vPV and vPH , the S-wave velocities vSV and vSH , the anisotropy parameter η, and, of course, density ρ.
The proposed method forms the foundation of an open-source tool box that can be used to assess the unbiased ability of surface wave dispersion data, characterised in terms of frequency and modal content, to constrain density variations and their trade-offs with other Earth model parameters.
How to cite: Lanteri, A., Gebraad, L., Zunino, A., and Fichtner, A.: Hamiltonian Monte Carlo Inversion of Surface Wave Dispersion to Evaluate their Potential to Constrain the Density Distribution in the Earth., EGU General Assembly 2022, Vienna, Austria, 23–27 May 2022, EGU22-6399, https://doi.org/10.5194/egusphere-egu22-6399, 2022.
EGU22-6428 | Presentations | SM5.6
Interrogating the volume of the East Irish Sea sedimentary basins using probabilistic tomographic resultsXuebin Zhao, Andrew Curtis, and Xin Zhang
This study estimates the volume of the East Irish Sea sedimentary basins in the UK using 3D shear wave speed models derived from surface wave dispersion inversions. In order to answer volume-related questions, it is first necessary to define a target function that translates any (high-dimensional) model into (1-dimensional) volumes of interest. A key revelation of this study is that while the majority of computation may be spent solving inverse problems probabilistically, much of the skill and human effort involved in answering real-world questions may be spent defining and calculating those target function values in a clear and unbiased manner.
How to cite: Zhao, X., Curtis, A., and Zhang, X.: Interrogating the volume of the East Irish Sea sedimentary basins using probabilistic tomographic results, EGU General Assembly 2022, Vienna, Austria, 23–27 May 2022, EGU22-6428, https://doi.org/10.5194/egusphere-egu22-6428, 2022.
Please decide on your access
Please use the buttons below to download the presentation materials or to visit the external website where the presentation is linked. Regarding the external link, please note that Copernicus Meetings cannot accept any liability for the content and the website you will visit.
Forward to presentation link
You are going to open an external link to the presentation as indicated by the authors. Copernicus Meetings cannot accept any liability for the content and the website you will visit.
We are sorry, but presentations are only available for users who registered for the conference. Thank you.
EGU22-6780 | Presentations | SM5.6
An unusually long eclogitic lower crustal body imaged by the Korean nuclear explosionXiaoqing Zhang, Hans Thybo, Irina M. Artemieva, Tao Xu, and Zhiming Bai
The Sino-Korean Craton (SKC), which consists of the North China Craton (NCC) in China and North Korea, is one of the oldest cratons on earth. Since the Paleozoic, the SKC has experienced multiple subductions of the peripheral plates and the northeastern SKC is located in a junction area. Its characteristics are being investigated by geophysical and geochemical methods, which provides insights into the formation and subsequent evolution of the continental lithosphere.
We interpret the crustal structure of the northeastern SKC with the refraction/wide-angle reflection perspective using North Korean Nuclear Explosion sources recorded by 40 permanent and 7 temporary broadband stations, which were operated by the China Earthquake Administration and the Institute of Geology and Geophysics, Chinese Academy of Science, respectively.
Primary reflection phases from a discontinuity at 30km depth have an apparent velocity of about 6.2 km/s. This phase is observed to 1200km ultra-long offset, which shows that the average crustal velocity is extremely low. Another spectacular observation is of extremely strong phases which we interpret as Moho to surface multiples of all main phases in the seismic sections. Clear upper mantle refractions (Pn) are observed with an apparent velocity around 8.05 km/s as first arrivals over the offset range 300-1000 km. All observations show that the crust of northeastern SKC is very thin (about 30km), it has a low average crust velocity (6.2km/s), and the velocity contrast at the Moho discontinuity is extraordinarily strong.
We detect the “Seismic Moho” discontinuity, which is marked by a very strong and sharp increase in velocity. We interpret this “Seismic Moho” as the top of a layer consisting of the lower crust in eclogite facies. This “Seismic Moho” does not coincide with the true Crust-Mantle Boundary, which is defined by a change from felsic/intermediate/mafic crustal rocks to the dominantly ultramafic rocks of the upper mantle in petrological terms.
How to cite: Zhang, X., Thybo, H., Artemieva, I. M., Xu, T., and Bai, Z.: An unusually long eclogitic lower crustal body imaged by the Korean nuclear explosion, EGU General Assembly 2022, Vienna, Austria, 23–27 May 2022, EGU22-6780, https://doi.org/10.5194/egusphere-egu22-6780, 2022.
EGU22-6893 | Presentations | SM5.6
Modeling seismic wave propagation in the earth using the distributional finite difference methodyder masson
We present the theory and applications of the Distributional Finite Difference Method (DFD). The DFD method is an efficient tool for modeling the propagation of elastic waves in heterogeneous media in the time domain. It decomposes the modeling domain into multiple elements that can have arbitrary sizes. When using large elements, the DFD algorithm resembles the finite difference method because the wavefield is updated using operations involving band diagonal matrices only. This makes the DFD method computationally efficient. When small elements are employed, the DFD method permits to mesh complicated structures as in the finite element or the spectral element methods. We present numerical examples showing that the proposed algorithm accurately accounts for free surfaces, solid-fluid interfaces and accommodates non-conformal meshes. Seismograms obtained using the proposed method are compared to those computed using analytical solutions and the spectral element method. The DFD method requires fewer points per wavelength (down to 3) than the spectral element method (5 points per wavelength) to achieve comparable accuracy. We present examples demonstrating the advantages of the DFD method for modeling wave propagation in the Earth at the global and regional scales.
How to cite: masson, Y.: Modeling seismic wave propagation in the earth using the distributional finite difference method, EGU General Assembly 2022, Vienna, Austria, 23–27 May 2022, EGU22-6893, https://doi.org/10.5194/egusphere-egu22-6893, 2022.
EGU22-7544 | Presentations | SM5.6
Global gravity gradient inversion reveals variability of cratonic crustPeter Haas, Jörg Ebbing, and Wolfgang Szwillus
In this contribution, we present a global estimate of crustal thickness with emphasis to cratons. In an inverse scheme, satellite gravity gradient data are inverted for the Moho depth, exploiting laterally variable density contrasts based on seismic tomography. Our results are constrained by an active source seismic data base, as well as a tectonic regionalization map, derived from seismic tomography. For the global analysis, we implement a moving window approach to perform the gravity inversion, followed by interpolating the estimated density contrasts of common tectonic units with a flood-fill algorithm.
The estimated Moho depth and density contrasts are especially interesting for the cratons of the Earth. Our results reveal a surprising variability of patterns with average Moho depth between 32-42 km, reflecting an individual tectonic history of each craton. Statistical patterns of Moho depth and density contrasts are discussed for the individual cratons and linked to their stabilization age. For example, Australia shows the lowest average Moho depth (32.7 km), indicating early stabilization in the Archean and removal of a dense lower protocrust. This observation matches well with receiver function studies. The globally inverted Moho depth is validated by gridded seismic Moho depth information, which shows that for many cratons the inverted Moho depth is within expected uncertainties of the seismic Moho depth. In addition, the formerly connected cratons of South America and Africa are analyzed and discussed in a Gondwana reconstruction. Here, the once-connected West African and Amazonian Cratons have a shallow Moho depth, indicating that only little tectonic activity occurred during the Phanerozoic. The tectonically-linked Congo and Sao Francisco Cratons have intermediate Moho depths, with the Congo Craton having a slightly shallower Moho depth. This could reflect dynamic support of the upper mantle on the African side.
How to cite: Haas, P., Ebbing, J., and Szwillus, W.: Global gravity gradient inversion reveals variability of cratonic crust, EGU General Assembly 2022, Vienna, Austria, 23–27 May 2022, EGU22-7544, https://doi.org/10.5194/egusphere-egu22-7544, 2022.
Please decide on your access
Please use the buttons below to download the presentation materials or to visit the external website where the presentation is linked. Regarding the external link, please note that Copernicus Meetings cannot accept any liability for the content and the website you will visit.
Forward to presentation link
You are going to open an external link to the presentation as indicated by the authors. Copernicus Meetings cannot accept any liability for the content and the website you will visit.
We are sorry, but presentations are only available for users who registered for the conference. Thank you.
EGU22-7668 | Presentations | SM5.6
Ambient noise tomography of post-subduction setting in northern Borneo enhanced with machine learningJoseph Fone, Simone Pilia, Nicholas Rawlinson, and Song Hou
Given that subduction is an important driver of plate tectonics on Earth, it is notable that the effects of subduction termination are often complex and poorly understood. Northern Borneo is a prime example of a post-subduction environment, where two subduction zones have terminated within the last 20 Ma. The region however has seen very few seismic studies likely due to the low levels of seismicity in the region compared to the rest of Southeast Asia and due to the challenging deployment environment. The goal of the northern Borneo Orogeny Seismic Survey (nBOSS) network, which operated between 2018 and 2020 and consisted of 47 broadband instruments, was to provide constraints and answer first order questions about the structure of the lithosphere and asthenosphere in this post-subduction setting. Waveform data from this network were supplemented with data recorded by 33 permanent instruments operated by the Malaysian meteorological authority, METMalaysia. In this study we produce the first model of the crustal shear wave velocity structure under northern Borneo using surface wave ambient noise tomography to try and better understand the effects of subduction termination on the crust and to better understand the present day structure of the crust in this region which has not been imaged in this way before. We use a trans-dimensional tomography to produce variable resolution 2D Rayleigh wave phase velocity maps in the period range 2-30 seconds sampled every 2 seconds. Then to produce the final 3D shear wave velocity model a series of 1D inversions were used in combination with a neural network that is trained to find a generalised solution to the 1D inverse problem for this data set. This helps to prevent artefacts forming in the final model as a result of there being no lateral correlations in the 1D inversions by providing the more region specific trained neural network to perform the bulk of the 1D inversions. The result is a model that shows a detailed 3D shear wave velocity structure of the crust that matches expected velocity anomalies from known geological features. This includes the large sedimentary basins in the region, which are revealed as large slow velocity anomalies. Our new model agrees with results from other methods used to study this region, including receiver functions and surface wave tomography.
How to cite: Fone, J., Pilia, S., Rawlinson, N., and Hou, S.: Ambient noise tomography of post-subduction setting in northern Borneo enhanced with machine learning, EGU General Assembly 2022, Vienna, Austria, 23–27 May 2022, EGU22-7668, https://doi.org/10.5194/egusphere-egu22-7668, 2022.
EGU22-7767 | Presentations | SM5.6
A consistent full waveform inversion scheme for imaging heterogeneous isotropic elastic mediaLi-Yu Kan, Sébastien Chevrot, and Vadim Monteiller
Multi-parameter teleseismic full-waveform inversion (FWI) can provide key insights on the composition and thermal state of the lithosphere. In the isotropic version of such inversions, one classically inverts for a set of independent model parameters, for example (density, Vp, Vs). In this study, we demonstrate that by introducing model covariance matrices with non-diagonal terms to FWI, i.e. accounting for the existing correlations between density, Vp, and Vs, has a dramatic impact on the quality of the reconstructed models. We perform synthetic tests using with a simple subduction model. The teleseismic and regional wavefields are computed with our FK-SEM hybrid method. We invert vertical and radial component P waveforms from four teleseismic events coming from different epicentral distances and azimuths. We use a hierarchical iterative l-BFGS inversion, starting at long period (T > 10 s) to obtain a long wavelength model, and then progressively decreasing the spatial smoothing and cut-off period to 5 s and then 2.5 s. We also demonstrate that a complete non-diagonal model covariance matrix allows us to make the inversion results consistent, i.e. independent of the model parameterization. The inversions which account for the correlations between model parameters provide better models especially for density and Vs, less numerical artifacts, and are characterized by a faster convergence rate compared to inversions performed by assuming that model parameters are independent.
How to cite: Kan, L.-Y., Chevrot, S., and Monteiller, V.: A consistent full waveform inversion scheme for imaging heterogeneous isotropic elastic media, EGU General Assembly 2022, Vienna, Austria, 23–27 May 2022, EGU22-7767, https://doi.org/10.5194/egusphere-egu22-7767, 2022.
Please decide on your access
Please use the buttons below to download the presentation materials or to visit the external website where the presentation is linked. Regarding the external link, please note that Copernicus Meetings cannot accept any liability for the content and the website you will visit.
Forward to presentation link
You are going to open an external link to the presentation as indicated by the authors. Copernicus Meetings cannot accept any liability for the content and the website you will visit.
We are sorry, but presentations are only available for users who registered for the conference. Thank you.
EGU22-8121 | Presentations | SM5.6
Subduction history of the Caribbean from upper-mantle seismic imaging and plate reconstructionBenedikt Braszus, Saskia Goes, Rob Allen, Andreas Rietbrock, and Jenny Collier and the VoiLA Team
Even though the Caribbean region is constantly struck by the impact of geological hazards, the details of the Caribbean plate's evolution are still not completely understood. This interdisciplinary study combines and jointly interprets seismic tomography data with trench positions derived from plate reconstruction which constrains some of the most important events governing the evolution of the Caribbean plate.
Our new teleseismic P-wave tomography model of the upper mantle beneath the Caribbean includes manually processed and analysed data from 32 ocean-bottom seismometers installed for 16 months during the VoiLA experiment as well as recordings from 192 permanent and temporary land stations. Reconstruction tests show improved resolution compared to previous models and a sufficient recovery of a synthetic anomaly assimilating the Caribbean slab.
Based on reconstructed trench positions we attribute slab fragments residing in depths of 700-1200km to 90–115 Myr old westward subduction along the Great Arc of the Caribbean (GAC) prior to Caribbean Large Igneous Province volcanism, rather than to eastward dipping Farallon subduction.
In the mantle transition zone, the imaged slab coincides with predicted trench positions from 50-70 Ma with a slab window approximately at the location of the subducted Proto-Caribbean spreading ridge.
Along the otherwise continous slab in the shallow upper mantle from Hispanola to Grenada several tears are interpreted as ruptures along fault zones in the Proto-Caribbean crust as well as the subducted extinct Proto-Caribbean spreading ridge.
How to cite: Braszus, B., Goes, S., Allen, R., Rietbrock, A., and Collier, J. and the VoiLA Team: Subduction history of the Caribbean from upper-mantle seismic imaging and plate reconstruction, EGU General Assembly 2022, Vienna, Austria, 23–27 May 2022, EGU22-8121, https://doi.org/10.5194/egusphere-egu22-8121, 2022.
EGU22-8319 | Presentations | SM5.6
3D Variational Full-Waveform InversionXin Zhang, Muhong Zhou, Angus Lomas, York Zheng, and Andrew Curtis
Seismic full-waveform inversion (FWI) produces high resolution images of the subsurface by exploiting information in full seismic waveforms, and has been applied at global, regional and industrial spatial scales. FWI is traditionally solved by using optimization, in which one seeks a best model by minimizing the misfit between observed waveforms and model predicted waveforms. Due to the nonlinearity of the physical relationship between model parameters and waveforms, a good starting model is often required to produce a reasonable model. In addition, the optimization methods cannot produce accurate uncertainty estimates, which are required to better interpret the results.
To estimate uncertainties more accurately, nonlinear Bayesian methods have been deployed to solve the FWI problem. Monte Carlo sampling is one such algorithm but it is computationally expensive, and all Markov chain Monte Carlo-based methods are difficult to parallelise fully. Variational inference provides an efficient, fully parallelisable alternative methodology. This is a class of methods that optimize an approximation to a probability distribution describing post-inversion parameter uncertainties. Both Monte Carlo and variational full waveform inversion (VFWI) have been applied previously to solve 2D FWI problems, but neither of them have been applied to 3D FWI. In this study we apply the VFWI method to a 3D FWI problem. Specifically we use Stein variational gradient descent (SVGD) method to solve the 3D Bayesian FWI problem and to obtain an optimised set of samples of the full posterior probability distribution. The aim of this study is to explore performance of the method in 3D, to assess the computational requirements and to provide useful information for practitioners. Our results demonstrate that the 3D VFWI is practical, at least for small problems, and can be applied to image the subsurface in reality.
How to cite: Zhang, X., Zhou, M., Lomas, A., Zheng, Y., and Curtis, A.: 3D Variational Full-Waveform Inversion, EGU General Assembly 2022, Vienna, Austria, 23–27 May 2022, EGU22-8319, https://doi.org/10.5194/egusphere-egu22-8319, 2022.
EGU22-9636 | Presentations | SM5.6
Machine learning-based attenuation of steeply dipping events of seismic reflection image beneath the Korean PeninsulaYoungseok Song, Joongmoo Byun, Sooyoon Kim, Yonggyu Choi, and Sungmyung Bae
Seismic reflection images derived by ambient-noise seismic interferometry (SI) can show subsurface structures without active sources. To image and interpret the upper mantle structures and tectonic boundaries beneath the southern part of Korean Peninsula, we applied SI method to seismic ambient noise data recorded at 119 seismic stations on the Korean Peninsula in 2014 (from the seismic network of the Korean Meteorological Administration). The factor that makes interpretation difficult is the steeply dipping events in reflection images. Most of these events of apparent steeply dips show as true reflection events from steep geologic boundaries. Therefore, we need to attenuate these events to interpret true reflection events. These events overlap many times. Also, the value of the slope has several values close to half of the Rayleigh waves or P waves. To attenuate these events with these complex features, we used machine learning techniques. We attenuated our steeply dipping events by applying the Extraction of diffractions method. As the steeply dipping events are attenuated, horizontal events were strengthened, and noises were attenuated. We can more clearly identify the reflection events of the Moho discontinuity and the lithosphere/asthenosphere (LAB) boundary near the two-way reflection times of 7-11 s and 17-22 s respectively.
How to cite: Song, Y., Byun, J., Kim, S., Choi, Y., and Bae, S.: Machine learning-based attenuation of steeply dipping events of seismic reflection image beneath the Korean Peninsula, EGU General Assembly 2022, Vienna, Austria, 23–27 May 2022, EGU22-9636, https://doi.org/10.5194/egusphere-egu22-9636, 2022.
EGU22-10232 | Presentations | SM5.6
A new Integrated lithological model of the Iberian crustCarlos Clemente-Gómez, Javier Fullea, and Mariano S. Arnaiz-Rodríguez
The Earth’s crust hosts most of the geo-resources of societal interests (e.g. minerals, geothermal energy etc.). Integrative approaches combining geophysical and petrological observations to study the mantle assuming thermodynamic equilibrium are relatively common nowadays. However, in contrast to the mantle, where thermodynamic equilibrium is prevalent, vast portions of the crust are thermodynamically metastable. This is because equilibration processes are essentially temperature activated and the temperature in the crust is usually too low to trigger them. Consequently, the mineralogical assemblage of crustal rocks is mostly decoupled from the in situ pressure and temperature conditions, reflecting instead the conditions present at the moment of rock formation. Here we present a new methodology for integrated geophysical-petrological multi-data modelling of the crust. Our primary constraining data are fundamental mode Rayleigh wave surface wave dispersion curves determined by interstation cross-correlation measurements and teleseisms, as well as surface elevation (isostasy) and heat flow. Additional prior information is provided by P-wave velocities coming from controlled source and body wave tomography data. The inversion is framed within an integrated geophysical-petrological setting where mantle seismic velocities and densities are computed thermodynamically as a function of the in situ temperature and compositional conditions. In this work we develop a new parameterization of the crust where we first invert following global statistical correlations between Vp, Vs and crustal densities for different lithologies in a two-layered model. In a second step we compute the rock physical properties for different metamorphic facies and water contents using computational petrology to derive a plausible and consistent lithological model. In order to optimize the inversion procedure, we perform a sensitivity analysis assessing the resolution of the different data sets. The new methodology is applied to the Iberian Peninsula and adjacent margins where we jointly invert for both the crustal and lithospheric mantle structure.
How to cite: Clemente-Gómez, C., Fullea, J., and Arnaiz-Rodríguez, M. S.: A new Integrated lithological model of the Iberian crust, EGU General Assembly 2022, Vienna, Austria, 23–27 May 2022, EGU22-10232, https://doi.org/10.5194/egusphere-egu22-10232, 2022.
GI3 – Planetary and space (remote sensing) instrumentation
EGU22-337 | Presentations | GI3.1
Geochemical and sedimentological analysis of hypersaline Sambhar Lake of India: implications for paleolake exploration on MarsDeepali Singh, Priyadarshini Singh, Nidhi Roy, and Saumitra Mukherjee
Paleolakes on Mars have been proposed to be hydrologically active for thousands of years. They provide water, the prime ingredient for life to develop, and quiescent settings, making these lakes excellent targets in preserving biosignatures. Since ground truth analysis on Mars is limited to certain locations, most of the interpretations about Martian geology and past climate have been made through remote sensing. This study presents a comprehensive account of the physical and chemical aspects of an Earth-based hypersaline playa that has undergone intermittent wet and dry periods.
Sambhar Lake is the largest endorheic playa in India, situated southeast of the Aravalli mountains within the Thar Desert. The lake formed as a result of neotectonic and aeolian activity followed by stream capture like some paleolakes and hydrologically active inter-crater depressions on Mars. Sambhar Lake lies between arid and semi-arid transitional zones and is fed by two ephemeral streams indicating climate-driven hydrology. The surface and sub-surface brine samples collected from the lake were alkaline, Na-Cl type with salinity higher than the seawater. Silicate weathering and evaporation were identified as important processes responsible for influencing the hydro-geochemistry of the lake. Petrographic and geochemical analysis of the sediment and rock samples showed the presence of clay minerals and evaporites ranging from carbonates to halites suggesting that the lake had witnessed multiple hydrological cycles. The weathering index of the dried lake bed was comparable to some Gale crater samples and lakes with basaltic origin on Earth. The geochemical evolution of the Sambhar Lake is primarily governed by the inlet streams and their composition, partition of solutes in the water, and concentration of the evaporites. Thus, Sambhar Lake is a classic example of the climate-induced transition of a lacustrine basin to a playa. It may be helpful to study the evolution of hydrological basins, their morphology, and the process of mineral formation on Mars.
How to cite: Singh, D., Singh, P., Roy, N., and Mukherjee, S.: Geochemical and sedimentological analysis of hypersaline Sambhar Lake of India: implications for paleolake exploration on Mars, EGU General Assembly 2022, Vienna, Austria, 23–27 May 2022, EGU22-337, https://doi.org/10.5194/egusphere-egu22-337, 2022.
EGU22-497 | Presentations | GI3.1 | Highlight
Psychology in high demanding environmentsBrent Reymen and Celia Avila-Rauch
Our research aims to demonstrate that Emotional Intelligence Skills (EIS) could be a tool to support the cognitive processes that will be influenced by the complexity of tasks required during long duration space travel. Emotions, apart from being functional states of the whole organism, involve both physiological (organic) and psychological (mental) processes, therefore the management of EIS plays an important role in the regulation and self-control of a person, as well as their self-knowledge. This, in turn, contributes to professional and personal success. Very few research on this topic has been done with people working in the space sector which could be interesting since we are talking about professions that require high performance under special conditions with high levels of stress and moral responsibility. This research uses a series of questionnaires given to analog astronauts in the Analog Astronaut Training Center in Poland and groups of people brought together by the EuroMoonMars group who conducted scientific work in extreme environments. The questionnaires included in this research are: Emotional Meta-awareness Scale (TMMS-24); Group Environment Scale (GES-E & GES-R); HEXACO personality inventory; Cognitive and Affective Empathy Scale (TECA); Depression, Anxiety, Stress Scale (DASS); and the SCL-90-S, a psychopathology indicator. These questionnaires will provide comparative and orientation data from which we can examine if there is a possible emergence of an ideal personality style which leads to high EIS, how emotional processes can influence cognitive functions, and whether training in emotional intelligence can affect long-term cognitive processes in these kind of environments. This would be imperative for future astronauts in order to maintain their attention, their vigilance, and reduce the effects of fatigue and stress while in space.
How to cite: Reymen, B. and Avila-Rauch, C.: Psychology in high demanding environments, EGU General Assembly 2022, Vienna, Austria, 23–27 May 2022, EGU22-497, https://doi.org/10.5194/egusphere-egu22-497, 2022.
Please decide on your access
Please use the buttons below to download the presentation materials or to visit the external website where the presentation is linked. Regarding the external link, please note that Copernicus Meetings cannot accept any liability for the content and the website you will visit.
Forward to presentation link
You are going to open an external link to the presentation as indicated by the authors. Copernicus Meetings cannot accept any liability for the content and the website you will visit.
We are sorry, but presentations are only available for users who registered for the conference. Thank you.
EGU22-598 | Presentations | GI3.1
Privacy in spaceMurray Mackay, Angelo Miccoli, Salomé Gervasoni, Eleonora Kaiser, Simonas Pukinskis, Agata Kolodziejczyk, and Matt Harasymczuk
Astronaut missions require crew members, who come from various educational and social backgrounds, to co-exist and work with one another for a prolonged period of time in an extremely confined and isolated environment. Additionally, whilst working within the space environment, astronauts are subjected to continuous monitoring of their daily living activities and previous research suggests that decreased access to privacy can induce increased levels of psychological and physiological stress, thus producing risk factors which may hinder cohesion within the crew. For this reason, the present study evaluates how the implementation of a privacy shelter within the sleeping environment during an Analog Astronaut Mission may affect the sleep quality, physiological and psychological stress parameters of crew members during their period of isolation. The aim of this study is to gain a better insight into how potential mitigators to stress, such as privacy shelters within the bedroom module, may be introduced to further facilitate effective crew dynamics, and improve the overall likelihood of a space mission’s success. Materials and Methods: 4 male and 2 female Analog Astronauts underwent mental state and cognitive function testing, sleep cycle recordings and physiological parameter analysis before, during and after sleeping within the shared bedroom module without a privacy shelter for the first three nights of their mission. Following this, 2 control subjects then continued the rest of their mission sleeping within the previous conditions and the 4 other test subjects were provided with a privacy shelter. Test parameters, along with crew mission reports were then analysed to assess whether increased access to privacy during their sleeping hours would result in any significant effect on their psychological and physiological well-being as well as overall crew dynamics.
How to cite: Mackay, M., Miccoli, A., Gervasoni, S., Kaiser, E., Pukinskis, S., Kolodziejczyk, A., and Harasymczuk, M.: Privacy in space, EGU General Assembly 2022, Vienna, Austria, 23–27 May 2022, EGU22-598, https://doi.org/10.5194/egusphere-egu22-598, 2022.
EGU22-611 | Presentations | GI3.1
First results and Lessons Learned of CHILL-ICE 2021 Field CampaignMarc Heemskerk, Charlotte Pouwels, Thor Atli Fanndal, Sabrina Kerber, Árni B. Stefánsson, Esther Konijnenberg, Jaap Elstgeest, and Benedetta Cattani
During the summer of 2021, the first CHILL-ICE analogue campaign was held in and around the Stefánshellir Lava tube in the Hallmundarhraun lava field, in the West of Iceland. Here we present some of the campaign results of the two analogue missions that made up this research campaign.

After initial EuroMoonMars campagns in 2018 and 2020, the project group, named CHILL-ICE (Construction of a Habitat Inside a Lunar-analogue Lavatube - Iceland) was founded. More than 30 young researchers, students, and collaborators from 16 countries, worked closely together and two short analogue astronaut missions were held. These missions were the main goal of this campaign, where in the future also a stronger focus on the robot-human interfaces and exploration of subsurface cave systems is planned.

One of the rovers used during the mission was the Lunar Zebro, a student team project from TU Delft. Photo: Bernard Foing.
The two analogue astronaut missions were 55 hours each, as the main focus was on the set up and deployment of the portable and inflatable ECHO habitat inside the lava tube. To ensure a proper simulation, everything of the mission was done whilst wearing space suits, thus being limited in movement, visibility, maneuvrability, dexterity, and even time. The astronauts had an 8-hour EVA (Extra-Vehicular Activity) window in which all the components had to be set up/deployed.

One of the six astronauts, working on the deployment of all the life-support and scientific systems, was photographed during a secret observation. Photo: Luis Melo.
The four main life-support systems, ECHO (Extreme Cave Habitat One), the space suits, the PVES (PhotoVoltaic Energy System) and the communication systems, were provided by sponsors from Canada (ECHO, Wilson School of Design of the Kwantlen Polytechnic University), Spain (space suits, Astroland Interplanetary Agency), the Netherlands (PVES, Blinkinglights), and Iceland (Radio system, Reykjavík University).

The three astronauts of 'Crew Luna' during preparation and suit-testing. Fltr: David Smith, Crew Scientist; Christian Cardinaux, Crew Commander; and Agnieszka Elwertowska, Crew Engineer.
As one of the first steps towards actual lunar lava tube survival, this first CHILL-ICE mission campaign had a strong focus on scientific research, besides the developed prototype testing. During the mission, the crew went on EVAs to study the natural environment of the insides of the caves, collaborated with rovers and 3D cameras to map and explore, and took small geological samples for further analyses in laboratories on the mainland of Europe. Being the first mission of its kind, the CHILL-ICE Core Mission Team is thankful for all the support from our many sponsors and collaborators. A special thank you to the Kwantlen Polytechnic University, Reykjavík University, Astroland Interplanetary Agency, Blinkinglights, Space Iceland, GoPro, Lunar Zebro, and Árni B. Stefand and the landowners, for allowing us to study and work in this unique environment. Lava tubes are fragile environments and all research during CHILL-ICE was done with the utmost care for human and environmental safety.

ECHO habitat deployed inside Stefánshellir during the CHILL-ICE campaign. Photo: Jamal Ageli
How to cite: Heemskerk, M., Pouwels, C., Fanndal, T. A., Kerber, S., Stefánsson, Á. B., Konijnenberg, E., Elstgeest, J., and Cattani, B.: First results and Lessons Learned of CHILL-ICE 2021 Field Campaign, EGU General Assembly 2022, Vienna, Austria, 23–27 May 2022, EGU22-611, https://doi.org/10.5194/egusphere-egu22-611, 2022.
EGU22-622 | Presentations | GI3.1
Integrating Human Factors into the Colour Design of Human-Machine Interfaces for Spatial HabitatAo Jiang, Xiang Yao, Bernard Foing, Stephen Westland, Caroline Hemingray, and Shulei Mu
With the rapid advances in manned spaceflight technology, astronauts will stay in spatial habitat for a long time in the future, and spatial missions will be more diversified, which will place higher requirements on human-machine spacecraft systems. As an important visual element for interacting with astronauts, human-machine interfaces not only affect the astronauts’ physical, psychological and cognitive activities, but also their work efficiency and even the safety of the space mission. This study system investigated publications, videos and pictures from NASA, ESA, China Space Center and Roscosmos. It was found that colour elements play an important role in the life and work of astronauts and profoundly affect the habitability level of the space environment. At the same time, it was found that human physiological parameters, cognitive and decision-making abilities, human psychological factors are the main abilities affected by colour elements. Through sketching as well as 3D modelling and rendering, the relevant cabin interfaces of the future spatial habitat's areas for work, hygiene were designed. This study provides some enlightenment for future research on the colour design of spacecraft environments or lunar or Mars habitat environments.
How to cite: Jiang, A., Yao, X., Foing, B., Westland, S., Hemingray, C., and Mu, S.: Integrating Human Factors into the Colour Design of Human-Machine Interfaces for Spatial Habitat, EGU General Assembly 2022, Vienna, Austria, 23–27 May 2022, EGU22-622, https://doi.org/10.5194/egusphere-egu22-622, 2022.
EGU22-1798 | Presentations | GI3.1
First Evaluation of PRISMA Scene for geological mapping: the Dallol hydrothermal area in the salt flat of Danakil Desert, NE EthiopiaFrancesca Mancini, Adriano Tullo, Pascal Allemand, and Gian Gabriele Ori
Hyperspectral sensors offer the opportunity of analysing the chemical and physical composition of the remote sensed scene thanks to their ability of measuring the spectrum of the observed pixels in a large number of contiguous and narrow spectral channels [1].
Despite the technological advances, hyperspectral satellites are still poorly represented in spaceborne missions for Earth Exploration compared to multispectral ones [2]. In this context, the Italian Space Agency (ASI) EO mission named PRISMA (PRecursore IperSpettrale della Missione Applicativa, [3]) offers a great opportunity to improve the knowledge about the scientific and commercial applications of spaceborne hyperspectral data. PRISMA, launched in March 2019, includes a pushbroom hyperspectral camera covering the portion of the electromagnetic spectrum ranging from 400 nm to 2500 nm with 10 nm spectral sampling. Precisely, the PRISMA satellite comprises a high-spectral resolution Visible Near InfraRed (VNIR) and Short Wave InfraRed (SWIR) imaging spectrometer with 30 m ground sampling distance (GSD) and a panchromatic camera with 5 m GSD [4].
One of the critical issues in the exploitation of hyperspectral remotely sensed data is represented by the distortion effects due to the atmosphere in the radiative transfer path [5]. The products systematically produced by the PRISMA ground processor and made available to users consist of: Level 1 TOA radiometrically and geometrically calibrated radiance images; Level 2 geolocated and geocoded atmospherically corrected images. Details can be found in the PRISMA Products Specification Document [6].
Our analysis of PRISMA imagery was mainly performed on an arid environment in NE Ethiopia (Dallol; Long: 40.299351, Lat: 14.244367). One advantage of this area is that the nebulosity is generally low, in fact the image selected during the dry season has a cloud coverage percentage less than 1%. In the selected site, a salt suite was deposited and re-worked by hydrothermalism. The characteristic minerals of the area are: carbonate, halite, carnallite, anhydrite, gypsum, native sulfur of hydrothermal origin (7; 8). The unique lithological and geochemical features of Dallol and, specifically, the Mesozoic and Tertiary sedimentary cover, offer the opportunity to test PRISMA data at first order to delineate carbonates from salts.
The main objectives of this study are (1) to implement the atmospheric corrections for Level 1 data and compare the results with Level 2 data and (2) to test the capabilities of Prisma cubes to map an environment made of various sedimentary rocks and to differentiate and identify characteristic salt minerals.
References: [1] Chang, C.I., 2007. John Wiley & Sons. DOI: 10.1002/0470124628 [2] Transon, J., et al. 2018. Remote Sensing, 10(2), 157. DOI: 10.3390/rs10020157 [3] Candela, L., et al. 2016. IEEE international geoscience and remote sensing symposium (IGARSS), 253-256. DOI: 10.1109/IGARSS.2016.7729057 [4] Loizzo, R., et al. 2019. IEEE International Geoscience and Remote Sensing Symposium (IGARSS), 4503-4506. DOI: 10.1109/IGARSS.2019.8899272 [5] Schott, J.R., 2007. Oxford University Press on Demand [6] ASI, 2020. PRISMA Products Specification Document Issue 2.1 [7] Cavalazzi, B., et al. 2019. Astrobiology, 19(4), 553-578. DOI: 10.1089/AST.2018.1926 [8] López-García, J.M., et al. 2020. Frontiers in Earth Science, 7, 351. DOI: 10.3389/FEART.2019.00351
How to cite: Mancini, F., Tullo, A., Allemand, P., and Ori, G. G.: First Evaluation of PRISMA Scene for geological mapping: the Dallol hydrothermal area in the salt flat of Danakil Desert, NE Ethiopia, EGU General Assembly 2022, Vienna, Austria, 23–27 May 2022, EGU22-1798, https://doi.org/10.5194/egusphere-egu22-1798, 2022.
Please decide on your access
Please use the buttons below to download the presentation materials or to visit the external website where the presentation is linked. Regarding the external link, please note that Copernicus Meetings cannot accept any liability for the content and the website you will visit.
Forward to presentation link
You are going to open an external link to the presentation as indicated by the authors. Copernicus Meetings cannot accept any liability for the content and the website you will visit.
We are sorry, but presentations are only available for users who registered for the conference. Thank you.
EGU22-5600 | Presentations | GI3.1
Experimental petrology and spectroscopy: building analogue samples in laboratory for planetary explorationAlessandro Pisello, Pietro Tolomei, John Robert Brucato, Giovanni Poggiali, Maurizio Petrelli, Massimiliano Porreca, and Diego Perugini
Interpretation of spectral data acquired remotely and/or in situ from other planets requires an exhaustive database taking into account well-characterized spectra. Silicate glasses are one of the main constituents of volcanic rocks and a deep knowledge of their spectral response is fundamental to characterize volcanic terrains that we can observe on other planets.
We will show a study concerning spectroscopy properties of silicate glasses, which were synthesized at the Petro-Volcanology Laboratory of the University of Perugia. This study has the main objective to simulate and characterize putative compositions of lavas present on the Northern Volcanic Province of Mercury.
Glasses were synthesized mixing pure oxides and melting them at high temperatures. Once produced, glasses were partly crushed to powders in order to obtain different grain size classes and distributions. Furthermore, they were partly embedded as bulk fragments in epoxy and irradiated by laser ablation at different powers to simulate space weathering effects on Mercury.
The spectroscopic characterization of the samples was performed at the INAF-Astrophysical Observatory of Arcetri, Firenze, where mid-IR biconical diffuse reflectance FTIR spectra in the range 7-15 µm range were acquired on samples characterized by different granulometry. Spectroscopic measurements were performed first on 7 different homogeneous granulometric classes (ranging from 25 to 500 µm), then on six heterogeneous granulometric classes presenting gaussian distributions with varying values of average granulometry and standard deviation. Finally, spectra were acquired on slabs of glasses, which were previously irradiated by laser ablation simulating both weathered surface and re-deposited fine material after meteoritic impacts.
The results showed that spectroscopic features depend on the grain sizes, and in particular they are strongly influenced by presence of fine materials in the heterogeneous samples. Such information was used to retrieve detailed granulometrical data of the bulk samples which were covered by ablated and redeposited particles.
The study shows that experimental petrology is indeed a powerful tool to obtain planetary analogues of any terrestrial and planet product. The spectral characterization and space weathering simulation in the laboratory represent useful techniques to develop instrumental and analytical knowledge for space and planetary exploration. This study was performed on a specific Mercurian product, but in general this kind of approach can be preparatory to design future exploration missions of any planetary/asteroidal site in particular.
How to cite: Pisello, A., Tolomei, P., Brucato, J. R., Poggiali, G., Petrelli, M., Porreca, M., and Perugini, D.: Experimental petrology and spectroscopy: building analogue samples in laboratory for planetary exploration, EGU General Assembly 2022, Vienna, Austria, 23–27 May 2022, EGU22-5600, https://doi.org/10.5194/egusphere-egu22-5600, 2022.
Please decide on your access
Please use the buttons below to download the presentation materials or to visit the external website where the presentation is linked. Regarding the external link, please note that Copernicus Meetings cannot accept any liability for the content and the website you will visit.
Forward to presentation link
You are going to open an external link to the presentation as indicated by the authors. Copernicus Meetings cannot accept any liability for the content and the website you will visit.
We are sorry, but presentations are only available for users who registered for the conference. Thank you.
EGU22-5785 | Presentations | GI3.1
Experimental Measurements of Electric and Magnetic Fields in Simulated Dust Storms.David Reid and Karen Aplin
Mars is the only planet in our solar system with an atmosphere for which there have been no observations of lightning. Despite this, it is expected to occur, with the planet known to have dust devils, which due to triboelectrification become charged. Terrestrially, dust storms generate electric fields of around 100 kV/m and there have been recordings of magnetic fields in the region of 0.4 nT. On Earth, the electric fields are not sufficient to cause breakdown. If dust devils generate similar fields on Mars, the field strength will exceed the breakdown field strength of approximately 20 kV/m, thus discharges can be expected – although these may not take the form of terrestrial discharges. The Kazachok surface platform of ExoMars 2022 will deliver the MAIGRET instrument (consisting of a search coil magnetometer, electric field antenna, and a flux gate magnetometer), which will put the capability to measure electric and magnetic fields onto Mars. To better understand the dust devils on Mars, and to aid with the interpretation of returned data from ExoMars, a series of experiments are planned to investigate the magnetic fields from charged dust.
In 2003 Krauss et al performed experiments to determine the necessary conditions for sufficient tribocharging to cause breakdown in a Mars-like atmosphere by first mixing dust to simulate wind speed, and then by dropping dust vertically at a range of pressures. Based upon Krauss’s work, two experiments will be performed with an electric field mill (CS110) and the engineering model of the MAIGRET search coil and thus two hypotheses will be tested. These are, firstly, that the vertical separation of charge is responsible for the electric field, and, secondly, that the spiralling motion of the charged particles is responsible for the magnetic field. The planned vertical drop and horizontal mixing experiments isolate these components of motion, allowing the predictions to be tested.
How to cite: Reid, D. and Aplin, K.: Experimental Measurements of Electric and Magnetic Fields in Simulated Dust Storms., EGU General Assembly 2022, Vienna, Austria, 23–27 May 2022, EGU22-5785, https://doi.org/10.5194/egusphere-egu22-5785, 2022.
EGU22-5974 | Presentations | GI3.1
Enhancing well-being aboard confined Space environments: the role of Design research in the EMMPOL 8 analogue missionSerena Crotti, Annalisa Dominoni, Bernard Foing, Benedetto Quaquaro, Brent Reymen, Leander Schlarmann, Abdelali Ez Zyn, Jenne Dierckx, and Agata Kołodziejczyk
EuroMoonMars is an ILEWG initiative including several activities in the space field to facilitate Moon and Mars exploration [1-6]. EMMPOL missions are organized by EMM and AATC, aboard a confined simulator in Poland. The EMMPOL8 (9-16th September 2021) focussed on psychological wellbeing in confinement. During the simulation, biological experiments were also conducted by the crew to analyse the impact of microgravity and different light conditions on the growth of plants and to assess the lunar dust simulant toxicity to various organisms.
Here, we present three experiments with a focus on design which were performed by Serena Crotti, Vice-Commander of the mission, in the context of her MSc Thesis research in Integrated Product Design at Politecnico di Milano, under the academic supervision of Professors A. Dominoni, B. Quaquaro and B. Foing. Design for Space is an emerging discipline that applies design principles to the aerospace sector; increasing wellbeing and comfort are the main tasks of designers in this area. As missions get longer, psychophysical wellbeing becomes fundamental [7-9]. The following experiments stem from this context.
The Emotion Wall. An emotional monitoring system was tested during the EMMPOL8. It collects psychological data from individuals via a dedicated software; afterwards, it processes them into a visual representation of the crew’s emotional state. This experiment was carried out in collaboration with Brent Reymen and Abdelali Ez Zyn. Testing the system and evaluating its impact on crew dynamics were the main objectives. Real-time psychological data were collected to investigate individuals’ reactions to environmental stressors. This helped keep track of criticalities that can be turned into design opportunities to improve wellbeing.
Multi-sensory Scenarios and the Scents Experiment. Multi-sensory Scenarios exploited light, sounds and scents to simulate different environmental settings aboard. Projections recreated shadows cast by hypothetical windows and were accompanied by natural sounds and scents. In the Scents Experiment, astronauts were exposed to olfactory stimulations related to food evoking daily life. These were provided by the company AromaDesign. Stimulating the crew’s senses to provide relief from claustrophobia and monotony was the main aim. Interviews and surveys monitored the crew’s reactions.
References. [1] Foing B. et al (2021) LPSC52, 2502 [2] Musilova M. et al (2020) LPSC51, 2893 [3] Perrier I.R. et al (2021) LPSC52, 2562 [4] Foing, B. et al (2021) LPSC52, 2502 [5] Heemskerk, M. et al (2021) LPSC52, 2762 [6] Pouwels, C. et al (2021) EPSC15, 835 [7] Dominoni, A. (2021), “Design of Supporting Systems for Life in Outer Space. A Design Perspective on Space Missions Near Earth and Beyond”, Research for Development, Springer. [8] Dominoni, A., Quaquaro, B., Pappalardo, R. (2018) Space Design Learning. An Innovative Approach of Space Education Through Design, in: Proceedings of IAC 69th, Bremen, 2018. [9] Dominoni, A. (2015), “For Designers with Their Head Beyond the Clouds”, Maggioli, Milan.

How to cite: Crotti, S., Dominoni, A., Foing, B., Quaquaro, B., Reymen, B., Schlarmann, L., Zyn, A. E., Dierckx, J., and Kołodziejczyk, A.: Enhancing well-being aboard confined Space environments: the role of Design research in the EMMPOL 8 analogue mission, EGU General Assembly 2022, Vienna, Austria, 23–27 May 2022, EGU22-5974, https://doi.org/10.5194/egusphere-egu22-5974, 2022.
EGU22-6113 | Presentations | GI3.1
EuroMoonMars Etna Campaign 2021: Logistics and Mission ProtocolLeander Schlarmann, Anouk Ehreiser, Kevin McGrath, Gary Brady, Chirayu Mohan, Hannah Reilly, Patrycja Lakomiec, Gaia De Palma, Christoph Hönes, Yke Rusticus, Bernard Foing, and Armin Wedler
The EuroMoonMars Etna campaign (EMM-Etna) took place on Mt. Etna in Sicily between the 6th and 11th of July 2021. The scouting campaign was organised by ten students of the International Lunar Exploration Working Group (ILEWG) EuroMoonMars program [1-3] in preparation for the DLR ARCHES (Autonomous Robotic Networks to Help Modern Societies) campaign and the ExoMars launch in 2022. During the ARCHES campaign on Mt. Etna in the summer of 2022, a team of robotics engineers will test various moon landing scenarios to show the capabilities of heterogeneous, autonomous, and interconnected robotic systems [4]. For the EMM-Etna campaign, the team simulated the landing of the REMMI Rover [5] on Mt. Etna as a Mars-analogue site, using a 360-degree remote-controlled camera holder to replicate a panoramic camera. Furthermore, samples were collected and analysed using an Ocean Optics UV-Vis-NIR spectrometer, a Field Raman, and a portable microscope. When working with a team of scientists and engineers the planning and organisation of the campaign are vital. Therefore, every crew member had their distinctive role during the mission, starting from being responsible for individual instruments or the outreach during the campaign to roles such as planner and data officer. Additionally, a mission protocol for the operational steps of the landing of the rover in the volcanic environment was implemented to assure smooth operation in the field.
References:
[1] https://moonbasealliance.com/ilewg
[2] https://euromoonmars.space/
[3] H. Reilly et al. "Instruments Operations, Science and Innovation in Expedition Support: EuroMoonMars-Etna campaign 2021", European Planetary Science Congress 2021, online, 13–24 Sep 2021, EPSC2021-848, https://doi.org/10.5194/epsc2021-848, 2021.
[4] M. J. Schuster et al. "The ARCHES Space-Analogue Demonstration Mission: Towards Heterogeneous Teams of Autonomous Robots for Collaborative Scientific Sampling in Planetary Exploration", IEEE Robotics and Automation Letters 5.4 (2020): 5315-5322.
[5] C. Mohan et al. "Rover testing for lunar science and innovation", European Planetary Science Congress 2021, online, 13–24 Sep 2021, EPSC2021-850, https://doi.org/10.5194/epsc2021-850, 2021.
How to cite: Schlarmann, L., Ehreiser, A., McGrath, K., Brady, G., Mohan, C., Reilly, H., Lakomiec, P., De Palma, G., Hönes, C., Rusticus, Y., Foing, B., and Wedler, A.: EuroMoonMars Etna Campaign 2021: Logistics and Mission Protocol, EGU General Assembly 2022, Vienna, Austria, 23–27 May 2022, EGU22-6113, https://doi.org/10.5194/egusphere-egu22-6113, 2022.
Please decide on your access
Please use the buttons below to download the presentation materials or to visit the external website where the presentation is linked. Regarding the external link, please note that Copernicus Meetings cannot accept any liability for the content and the website you will visit.
Forward to presentation link
You are going to open an external link to the presentation as indicated by the authors. Copernicus Meetings cannot accept any liability for the content and the website you will visit.
We are sorry, but presentations are only available for users who registered for the conference. Thank you.
EGU22-9937 | Presentations | GI3.1
Planetary analogue studies of charge effects on cloud droplet behaviourMartin Airey, R. Giles Harrison, Karen Aplin, Christian Pfrang, and Keri Nicoll
Ionisation in planetary atmospheres resulting from cosmic rays fragments atmospheric molecules resulting in the formation of free ions. The rate at which ions are produced varies with altitude and is determined by a combination of the cosmic ray flux and atmospheric density. The altitude at which this ion production rate peaks is known as the Pfotzer-Regener maximum which, on Earth, occurs at around 15-20 km. On Venus this maximum occurs at ~63 km, coinciding with the main cloud deck. This study investigates the effects enhanced ionisation may have on cloud droplets and their behaviour. Interactions between the ions produced and cloud droplets may have many consequences, including activation at lower saturation ratios, enhanced droplet coalescence and, for large charges, droplet breakup by Rayleigh instability.
This work explores the effects of ionisation on water droplets in the laboratory and also simulates some of the conditions occurring in the clouds of Venus. The main element of the experimental apparatus is an acoustic levitator that can allow individual droplets to be electrically isolated and observed. Measurements are taken by a CCD camera and processed using LabView image acquisition software. The droplets can be subjected to enhanced ionisation from a corona source and perturbed by using a 10 kV/m electric field placed across the droplet causing it to be deflected relative to its charge. The principal findings on water droplets were that higher charge led to a slower evaporation rate; however, higher charge also led to increased incidence of Rayleigh explosions which were observed during several of the experiments. Overall, the effect of charge slowing evaporation did not lead to a longer droplet lifetime due to mass loss occurring from the periodic Rayleigh instabilities. In order to simulate conditions more like the clouds of Venus, sulphuric acid droplets were also examined. It was found that even very dilute sulphuric acid was extremely resistant to evaporation, suggesting that the clouds of Venus may have very long-lived droplet lifetimes. This has wide-reaching implications as cloud droplets on Venus have been suggested to act as a substrate for possible microbial life in the clouds.
How to cite: Airey, M., Harrison, R. G., Aplin, K., Pfrang, C., and Nicoll, K.: Planetary analogue studies of charge effects on cloud droplet behaviour, EGU General Assembly 2022, Vienna, Austria, 23–27 May 2022, EGU22-9937, https://doi.org/10.5194/egusphere-egu22-9937, 2022.
EGU22-10308 | Presentations | GI3.1
Callio Spacelab - An underground laboratory for future exploration and analogue missions in FinlandJari Joutsenvaara, Marko Holma, Ilkka Hynynen, Ossi Kotavaara, and Julia Puputti
An isolated but highly connected underground mine can be used as an analogue environment for the astronauts operating without sight to the home planet and with limited connectivity to the psychologically-important “home”. Similarly to the real-world space mission, the Earth-bound analogue mission can be run with limited resources, i.e., just enough for the duration of the mission. Such a location is available in Pyhäjärvi, Finland.
The conceptualisation of the use of the Pyhäsalmi mine as an analogue environment for space missions started in 2017 with an idea of a Marscape environment to be developed in the old part of the mine. The 1.4-km-deep base metal mine is ending its underground ore extraction (zinc, copper and pyrite as main products) in 2022. The concept is branded as Callio SpaceLab 1, and it has been developed by the Univerisity of Oulu, Finland, in cooperation with international partners. The Callio SpaceLab is part of the underground research centre Callio Lab 2, and it is one of the strategic research infrastructures of the University of Oulu.
The mine is located within a volcanogenic massive sulphide (VMS) deposit 3, with known mineralisation reaching a depth of 1.4 km. Deep overpressured ancient water-conducting fracture zones have occasionally been intersected by drilling. Water of this kind is accessible through a high-pressure valve system, making further analyses possible, especially from the astrobiological point of view.
The vast tunnel network with more than 100 km of tunnels, old main levels and operational areas give room for any activities ranging from technological testing to having analogue astronauts in total isolation. With the optical baseline and copper and wireless access, personnel and monitoring activities are possible through a 1+GB on-site internet connection, from the surface or securely through a VPN access. Moreover, there are two underground, hydroponic greenhouses built at the 660 m level. These can be used for analogue missions. The well-known geology gives many possibilities for scientific drilling, on-site analysis, and possibly in-situ resource utilisation.
The multidisciplinary University of Oulu has turned its eye to the stars. Many earthbound research topics are being evaluated from the space exploration viewpoint. These include mining technologies and processes 4, such as free crushing and comminution 5, dry beneficiation, digital construction, and geophysical methodologies.
We will present the possibilities brought by the Callio SpaceLab environment to the selected earthbound research topics and applications of space exploration.
1) Joutsenvaara, J. et al. The deep underground Callio SpaceLab, Finland - Sustainable living, sustaining life. EGUGA EGU21-14129 (2021).
2) Jalas, P. et al. Callio Lab, a new deep Underground Laboratory in the Pyhäsalmi mine. in Journal of Physics: Conference Series vol. 888 (2017).
3) Mäki, T. et al The Vihanti-Pyhäsalmi VMS Belt. in Mineral Deposits of Finland 507–530 (Elsevier Inc., 2015). doi:10.1016/B978-0-12-410438-9.00020-0.
4) Oulu Mining School University of Oulu. https://www.oulu.fi/en/university/faculties-and-units/faculty-technology/oulu-mining-school.
5) Hugger crusher. University of Oulu (2020).
How to cite: Joutsenvaara, J., Holma, M., Hynynen, I., Kotavaara, O., and Puputti, J.: Callio Spacelab - An underground laboratory for future exploration and analogue missions in Finland, EGU General Assembly 2022, Vienna, Austria, 23–27 May 2022, EGU22-10308, https://doi.org/10.5194/egusphere-egu22-10308, 2022.
Please decide on your access
Please use the buttons below to download the presentation materials or to visit the external website where the presentation is linked. Regarding the external link, please note that Copernicus Meetings cannot accept any liability for the content and the website you will visit.
Forward to presentation link
You are going to open an external link to the presentation as indicated by the authors. Copernicus Meetings cannot accept any liability for the content and the website you will visit.
We are sorry, but presentations are only available for users who registered for the conference. Thank you.
EGU22-10325 | Presentations | GI3.1
The use of infrared remote sensing to prospect ore deposits on Mars. Preliminary results from a planetary field analog in the Rio Tinto mining area in SpainMarta Ciazela, Jakub Ciazela, Bartosz Pieterek, and Dariusz Marciniak
Data from martian rovers and martian meteorites suggest the presence of ore minerals on Mars (eg. pyrite, chalcopyrite, pentlandite). Three spectrometers: CRISM (The Compact Reconnaissance Imaging Spectrometer for Mars; spectral range 0.4-3.9 µm) onboard Mars Reconnaissance Orbiter (MRO), OMEGA (Observatoire pour la Mineralogie, l'Eau, les Glaces et l; Activité, 0.4 - 5.1 µm ) and PFS (Planetary Fourier Spectrometer, 1.3-45.0 µm) onboard Mars Express (MEX) operate in near infrared (NIR) spectrum and provide information on the mineral composition of Mars but none of them is yet capable to efficiently identify sulfides. Detecting sulfide ore deposits is difficult in NIR due to spectral interferences with silicates. Due to the limited in-situ measurements by the Opportunity, Spirit, Curiosity, and Perseverance rovers, Mars mineralogical studies must be supported by studies of terrestrial analogs. One example is the Rio Tinto area in Andalusia, Spain, which hosts the largest known volcanogenic massive sulfide deposits on Earth. In this area, we analyzed satellite images in the infrared spectrum (ASTER, Landsat 8). We will compare these results to mineralogical data we will retrieve in the field during envisaged geological mapping in Spring 2022. By establishing our test field for remote sensing of sulfide deposits in a PFA site on Earth, we will be able to determine abundance thresholds for the detection of major sulfide phases on Mars and identify their key spectral features. Our results will help in 1) more efficient use of the current NIR Martian spectrometers to detect ore minerals, 2) designing new space instruments optimized for ore detection to include in future missions to Mars such as one developed at the Institute of Geological Sciences and the Space Research Centre of the Polish Academy of Sciences called MIRORES (Martian far-IR ORE Spectrometer).
Acknowledgments: The presented research are supported by National Science Centre of Poland project OPUS19 no. 2020/37/B/ST10/01420 and Europlanet2024-research infrastructure grant no. 20-EPN2-020.
How to cite: Ciazela, M., Ciazela, J., Pieterek, B., and Marciniak, D.: The use of infrared remote sensing to prospect ore deposits on Mars. Preliminary results from a planetary field analog in the Rio Tinto mining area in Spain, EGU General Assembly 2022, Vienna, Austria, 23–27 May 2022, EGU22-10325, https://doi.org/10.5194/egusphere-egu22-10325, 2022.
EGU22-587 | Presentations | GI3.2
Spectroscopic and microscopic study of microbial mats in the Ojos del Salado area in Chile, a (possible) analogue environment for habitats on Early MarsAnouk Ehreiser, Leander Schlarmann, Erwin Strahsburger, Adrien Tavernier, Ayon Garcia, Christopher Ulloa, and Bernard Foing
As much is still unknown about the conditions for life on Early Mars, extreme environments on Earth that resemble Early Martian conditions are particularly useful for planetary scientists and astrobiologists to understand Early Mars environments. As biosignatures could be preserved in the Martian mineral record, Mars analogue environments on Earth also provide useful points of reference for measurements gathered by Mars rover missions.
One of the best Martian Analogue Environments on Earth is the dry high-altitude desert in the area of the Ojos del Salado volcano in Chile. The Ojos del Salado is the highest point of the Puna de Atacama plateau in the Andes, characterized by extremely dry periglacial conditions, high UV radiation levels, low oxygen pressure, strong winds and the presence of volcanic and hydrothermal activity. High altitude lakes in the area feature polyextremophile microbial ecosystems that are adapted to these unique conditions and which provide a valuable insight into ecosystems that might resemble life on Early Mars. We report research results from Raman spectroscopy, UV-Vis spectroscopy and optical microscopy, gathered in-situ during the joint interdisciplinary Universidad de Atacama/LICA UDA/EuroMoonMars field campaign to the Ojos del Salado area in February/March 2022.
How to cite: Ehreiser, A., Schlarmann, L., Strahsburger, E., Tavernier, A., Garcia, A., Ulloa, C., and Foing, B.: Spectroscopic and microscopic study of microbial mats in the Ojos del Salado area in Chile, a (possible) analogue environment for habitats on Early Mars, EGU General Assembly 2022, Vienna, Austria, 23–27 May 2022, EGU22-587, https://doi.org/10.5194/egusphere-egu22-587, 2022.
Please decide on your access
Please use the buttons below to download the presentation materials or to visit the external website where the presentation is linked. Regarding the external link, please note that Copernicus Meetings cannot accept any liability for the content and the website you will visit.
Forward to presentation link
You are going to open an external link to the presentation as indicated by the authors. Copernicus Meetings cannot accept any liability for the content and the website you will visit.
We are sorry, but presentations are only available for users who registered for the conference. Thank you.
EGU22-1527 | Presentations | GI3.2
An extended investigation of the long-term trends in the fluxgate magnetometer (FGM) calibration parameters on the four Cluster spacecraftLeah-Nani Alconcel, Tim Oddy, Patrick Brown, and Chris Carr
An extended investigation of the long-term trends in the fluxgate magnetometer (FGM) calibration parameters on the four Cluster spacecraft
Leah-Nani Alconcel1, Tim Oddy2, Patrick Brown2, and Chris Carr2
1 University of Birmingham, Birmingham, United Kingdom
2 Imperial College London, London, United Kingdom
Over 20 years of calibrated data from the Cluster fluxgate magnetometer instruments (FGMs) aboard the four Cluster spacecraft are now accessible through the European Space Agency (ESA) Cluster Science Archive (CSA). The FGM team at Imperial College – the PI institute that built and supports operation of the magnetometers – has regularly provided validated data to the CSA since its inception. In 2014, the team published an initial investigation of the long-term trends in the calibration parameter stability between 2001 and 2012. The investigation showed that the offset parameter drift for three of the Cluster spacecraft FGMs (C2, C3 and C4) was nearly negligible, with the fourth being approximately 0.2 nT per year. This remarkable level of consistency is crucial to Cluster mission science, as the FGM data are used for the derivation of some datasets from other Cluster instruments.
With our dataset doubled in length, it is possible to quantitatively analyse very slow variations (years-long) trends observed in both the offsets and other parameters. We are now able to present an update to the earlier work, showing correlations between instrument calibration and housekeeping parameters.
How to cite: Alconcel, L.-N., Oddy, T., Brown, P., and Carr, C.: An extended investigation of the long-term trends in the fluxgate magnetometer (FGM) calibration parameters on the four Cluster spacecraft, EGU General Assembly 2022, Vienna, Austria, 23–27 May 2022, EGU22-1527, https://doi.org/10.5194/egusphere-egu22-1527, 2022.
Please decide on your access
Please use the buttons below to download the presentation materials or to visit the external website where the presentation is linked. Regarding the external link, please note that Copernicus Meetings cannot accept any liability for the content and the website you will visit.
Forward to presentation link
You are going to open an external link to the presentation as indicated by the authors. Copernicus Meetings cannot accept any liability for the content and the website you will visit.
We are sorry, but presentations are only available for users who registered for the conference. Thank you.
EGU22-1822 | Presentations | GI3.2
First Sounds from Mars : Results of the Microphones on PerseveranceRalph Lorenz and the Mars 2020 Acoustics Working Group
While Mars Polar Lander and Phoenix carried microphones, InSight has recorded infrasound, and Huygens and Venera returned some acoustic measurements, Mars 2020/Perseverance is the first planetary mission to return significant amounts of human-audible acoustic data. In addition to the public appeal of planetary sound recordings, these data reveal important aspects of the Martian environment.
Positioned near the top of the rover’s mast, the SuperCam microphone records audible sounds from 20 Hz to 10 kHz. A separate body-fixed microphone is associated with the EDL cameras. Detected sounds originate from three main sources: the atmosphere (turbulence, wind), the crack of the SuperCam laser blasts on rocks, and other rover sounds, such as the high-speed scroll compressor pump on the MOXIE instrument, or the aeroacoustic signal generated by the high-speed rotating blades of the Ingenuity helicopter. These sounds spread over the entire frequency domain accessible by the microphone: (i) the turbulence/wind-induced acoustic signal starts from the lowest frequency, continuously up to few hundred Hz depending on the wind activity. Acoustic power versus frequency shows a decreasing slope consistent with the dissipative regime. (ii) The frequency content of the laser-induced spark lies at higher frequencies (2 - 10 kHz) where it shows destructive interference gaps due to echoes on the mast structure. (iii) Rover generated sounds (MOXIE compressor, rover thermal pump) are monotonic. (iv) Three of the Ingenuity helicopter flights are heard, at the blade’s passing frequency of ~84Hz (with a small Doppler shift due to flight speed) and its first harmonic at 168 Hz.
Passive microphone observations are now made routinely to characterize turbulence, where the observations can access timescales shorter than conventional wind sensors. Similarly, the propagation times of the crack sounds from rapid series of laser shots can interrogate temperature fluctuations on length scales smaller than is possible with conventional temperature sensing. The observations also constrain the acoustic propagation in the Martian atmosphere, where the abundant CO2 causes appreciable attenuation, especially at high frequencies. This presentation will review results to date.
How to cite: Lorenz, R. and the Mars 2020 Acoustics Working Group: First Sounds from Mars : Results of the Microphones on Perseverance, EGU General Assembly 2022, Vienna, Austria, 23–27 May 2022, EGU22-1822, https://doi.org/10.5194/egusphere-egu22-1822, 2022.
EGU22-3384 | Presentations | GI3.2
Mapping subsurface structural lineament and geothermal potential areas in Southern Thailand using GOCE gravity dataTheethach Phiranram and Piyaphong Chenrai
The Gravity field and steady-state Ocean Circulation Explorer (GOCE) is the European Space Agency's (ESA) satellite gravity mission and is a revolutionary tool to reveal geologic information from the Earth. Geothermal energy is heat energy within the earth’s interior that can developed for a low carbon energy in the future. We use the GOCE satellite integrated with other data to extract geophysical information that are related to geothermal such as boundaries of the subsurface structures and plutonic rocks. The study area is in southern Thailand where a large plutonic rock associated major faults in the area playing an important role in geothermal system.
In this study total horizontal derivative, tilt derivative, and improved logistic were applied to emphasize the subsurface structural lineament and lithology. The result shows that the geological characteristics in southern Thailand are well correlated with gravity model from GOCE’s data.
How to cite: Phiranram, T. and Chenrai, P.: Mapping subsurface structural lineament and geothermal potential areas in Southern Thailand using GOCE gravity data, EGU General Assembly 2022, Vienna, Austria, 23–27 May 2022, EGU22-3384, https://doi.org/10.5194/egusphere-egu22-3384, 2022.
Please decide on your access
Please use the buttons below to download the presentation materials or to visit the external website where the presentation is linked. Regarding the external link, please note that Copernicus Meetings cannot accept any liability for the content and the website you will visit.
Forward to presentation link
You are going to open an external link to the presentation as indicated by the authors. Copernicus Meetings cannot accept any liability for the content and the website you will visit.
We are sorry, but presentations are only available for users who registered for the conference. Thank you.
EGU22-4823 | Presentations | GI3.2
Tool for optimizing the scientific operations and performance of the Mars landerHarri Haukka
For space projects, the availability of energy is a critical factor. The farther we go from the Sun the power of solar irradiance is weaker, at Mars it is 43 percent compared to the Earth. A special feature of Mars is the opacity of the atmosphere, as well as possible dust storms and sand floating in the atmosphere, which affect the solar irradiance received by the lander on the surface.
The most common methods for generating electrical energy in Mars are solar panels and a radioisotope thermoelectric generator (RTG). RGT produces energy all the time, regardless of the prevailing solar irradiance. For smaller landers, a combination of solar panels and batteries is usually sufficient. The possibility of using RTG as part of the energy production system has been considered in this work.
Payload and service electronics set the starting point for the design of the energy and power generation system. In addition to the electrical requirements, the mass and space limitations brought by the lander have to be taken account. The introduced tool was designed in the frame of the MetNet Mission and ESA MiniPINS study and both landers are relatively small and limitations are e.g. with the mass and volume of the batteries and available solar panels as well as the RTG. The optimization tool developed in this work provides virtually limitless possibilities to modify the energy system parameters, but due to the limitations imposed by the landers, in this study we do not simulate unrealistic alternatives for the selected landers.
The introduced optimization tool was developed in two steps. First with MS Excel, which was used to define realistic starting points, e.g. the number of solar panels and batteries and testing the static operating modes at different solar irradiance densities and subsystem efficiencies. Second, we use a Python tool that includes all the features of the Excel tool and we can simulate the operations with variable solar irradiances at any time of the day and season with one minute resolution. The required solar irradiance data is acquired and extrated from the Mars Climate Database covering almost the whole Mars surface. The developed tool is designed to simulate operations more than one Martian year, so with the tool, user can cover and simulate all seasons in any location on the Mars.
Devices on the surface of Mars operate fully autonomously. In this case, the availability of energy and optimized use of it are key factors. The lander service electronics must be able to operate even in non-optimal situations and, if necessary, interrupt scientific operations. These operations are controlled by the so-called cyclograms, i.e. pre-programmed operation plans, implemented by the lander computer when required. In this work, we simulate cyclograms for different operating conditions using the developed optimization tool.
How to cite: Haukka, H.: Tool for optimizing the scientific operations and performance of the Mars lander, EGU General Assembly 2022, Vienna, Austria, 23–27 May 2022, EGU22-4823, https://doi.org/10.5194/egusphere-egu22-4823, 2022.
Please decide on your access
Please use the buttons below to download the presentation materials or to visit the external website where the presentation is linked. Regarding the external link, please note that Copernicus Meetings cannot accept any liability for the content and the website you will visit.
Forward to presentation link
You are going to open an external link to the presentation as indicated by the authors. Copernicus Meetings cannot accept any liability for the content and the website you will visit.
We are sorry, but presentations are only available for users who registered for the conference. Thank you.
EGU22-7227 | Presentations | GI3.2
Development of an energy analyser for the characterization of the neutral and ionized upper atmosphere.Valentin Steichen, François Leblanc, Jean-Jacques Berthelier, and Pierre Gilbert
Measurements in the thermosphere are essential for understanding the solar forcing induced by the solar UV/EUV radiation, the particle precipitation and all sources of heating of this region of our atmosphere controlled by our Sun. Despite its significance, the Thermosphere Ionosphere (TI) stands as the least measured and understood of all atmospheric regions. Altitudes between ~100 to 200 km, where the magnetospheric current systems close and where Joule heating maximizes, are too high for balloon experiments and too low for existing LEO satellites. Moreover, characterizing this heating implies to be able to perform accurate measurements of the velocity, composition and density of the main species in this region.
Here we propose an instrument called INEA (Ions and Neutral Energy Analyser) that will be able to measure the density, temperature and drift velocity along the axis of sight of the instrument of neutral and ionized atmospheric particles with an accuracy compatible with DAEDALUS project (Sarris et al., Geosci. Instrum. Method. Data Syst., 2020). In order to analyse the energetic structure of particles within the TI, INEA’s performance must achieve resolutions lower than 20 K and 20 m/s over a wide range of densities.
In this presentation, I will present the concept of the instrument, the expected performances based on a complete numerical model of the instrument and the results of first experiments on parts of the instrument. With such accuracy, such an instrument could be used for other issues related to other planetary objects such as Mars where the direct measurement of atmospheric exhaust remains a challenge due to the inability of current mass spectrometers to measure the energy of neutral particles with enough accuracy.
How to cite: Steichen, V., Leblanc, F., Berthelier, J.-J., and Gilbert, P.: Development of an energy analyser for the characterization of the neutral and ionized upper atmosphere., EGU General Assembly 2022, Vienna, Austria, 23–27 May 2022, EGU22-7227, https://doi.org/10.5194/egusphere-egu22-7227, 2022.
EGU22-7695 | Presentations | GI3.2
Estimation of the NASA Mars2020 Perseverance rover path through Visual OdometrySimone Andolfo, Flavio Petricca, and Antonio Genova
The future space exploration missions will require autonomous robotic systems capable to safely move across the operational environment and reach sites of scientific interest with limited commands from the ground operators.
The NASA Mars2020 Perseverance rover is the most advanced robotic vehicle ever sent on the planet Mars and is currently exploring the Jezero crater searching for signs of ancient life and investigating the geological history of the planet. The increased computational resources of the Perseverance’s onboard computer enable the navigation software to continuously adjust the path, by processing visual inputs through the navigation cameras. The stereo images with the left and right rover cameras are analyzed to build local 3D maps of the surrounding terrain to identify hazardous areas (e.g., steep slopes) that could affect the rover’s safety.
We use Visual Odometry (VO) methods to accurately update the rover’s position and attitude (i.e., pose), by detecting and tracking the image-locations of landmarks (e.g., the sharp edge of a rock) through successive stereo pairs. VO is a fundamental technique to enhance the localization accuracies of wheeled vehicles in planetary environments where Global Navigation Satellite Systems (GNSS) are not available.
We present here the reconstructed position and attitude of the Perseverance rover that we retrieved by processing images acquired by the navigation cameras during sols 65, 66, 72, and 120. 3D-to-3D algorithms were applied accounting for the nonlinear optical effects that affect the raw images. The estimated rover’s orientation is fully in line with the accurate measurements provided by the onboard Inertial Measurement Units (IMUs). The displacements between the telemetered and the reconstructed rover’s location suggest errors in the WO measurements, which are compensated by our VO estimate.
How to cite: Andolfo, S., Petricca, F., and Genova, A.: Estimation of the NASA Mars2020 Perseverance rover path through Visual Odometry, EGU General Assembly 2022, Vienna, Austria, 23–27 May 2022, EGU22-7695, https://doi.org/10.5194/egusphere-egu22-7695, 2022.
EGU22-10668 | Presentations | GI3.2
Geophysical Investigations of Celestial Bodies through the Combination of Radio Science and Altimetric Crossover DataEdoardo Del Vecchio, Flavio Petricca, Antonio Genova, and Erwan Mazarico
The challenging science objectives of future planetary missions will require highly accurate trajectory reconstruction of deep space probes. Novel techniques that improve the navigation capabilities are developed with the purpose to expand the scientific return of geophysical investigations across the Solar System. Science instruments that provide geodetic data from the spacecraft orbit may support the orbit determination process in combination with deep space radio tracking measurements. Altimetric data that measure the relative distance of the spacecraft with respect to the celestial body’s surface yield key constraints on the orbit evolution. Differential measurements, from observations that are repeated over the same location (crossover), are less prone to errors associated with surface mismodeling, leading to significant improvements in the estimation of the spacecraft position.
In this work, we present a method based on the combination of ground-based radio science and altimetric crossover measurements to enhance the estimation of the spacecraft orbit and geodetic parameters. The methodology is developed to carry out thorough numerical simulations of mission scenarios, including the generation of synthetic observables. We show the results of our covariance analysis of the NASA mission Europa Clipper by simulating and processing measurements of the Radar for Europa Assessment and Sounding: Ocean to Near-surface (REASON) and the Gravity and Radio science (G/RS) investigations.
How to cite: Del Vecchio, E., Petricca, F., Genova, A., and Mazarico, E.: Geophysical Investigations of Celestial Bodies through the Combination of Radio Science and Altimetric Crossover Data, EGU General Assembly 2022, Vienna, Austria, 23–27 May 2022, EGU22-10668, https://doi.org/10.5194/egusphere-egu22-10668, 2022.
EGU22-12778 | Presentations | GI3.2
Prototype Laser Desorption/Ionization Mass Spectrometer for in situ Biosignature Detection on Ocean WorldsNikita Jennifer Boeren, Kristina Anna Kipfer, Niels Frank Willem Ligterink, Coenraad Pieter de Koning, Peter Keresztes Schmidt, Valentine Grimaudo, Marek Tulej, Robert Lindner, Pascale Ehrenfreund, Peter Wurz, and Andreas Riedo
The presence of extinct or extant life on extraterrestrial Solar System Bodies is a high priority topic in space science. Reliable detection of signatures of life poses many challenges, including the requirement for flight-capable instrumentation, meaning robust and simple. Furthermore, instrumentation should, ideally, be capable of detecting many different types of biosignatures and not be limited to a single compound or group of molecules. Several (groups of) compounds were listed as molecules of interest in the NASA Europa Lander Report, including amino acids, lipids, and polycyclic aromatic hydrocarbons (PAHs)[1]. Moreover, high sensitivity is required to detect biosignatures with trace abundances, while, simultaneously, highly abundant compounds should not be excluded, meaning a broad dynamic range is essential.
The search for presence of life is aimed towards several Solar System bodies. Two new astrobiological targets, Enceladus and Europa, were recently uncovered as an outcome of the Galileo and Cassini-Huygens missions [2]. They revealed the presence of oceans under the ice shells. Both “ocean worlds” are of high interest for detection of signatures of life, mainly because of putative presence of all ingredients required to form life (as we know it). If life is indeed present on these bodies, its biosignatures could be preserved in near surface ice, where they are protected from the harsh environment.
ORIGIN (ORganics Information Gathering INstrument) is a novel prototype laser desorption/ionization mass spectrometer (LDMS). ORIGIN was designed for in situ detection of biomolecules for future space exploration missions, and subsequently constructed at the University of Bern, Switzerland [3]. The design is compact and simplistic, making it a robust and lightweight system, which meets the requirements of space instrumentation. The current setup of ORIGIN is comprised of a nanosecond pulsed laser system for desorption of analytes, and a miniature reflectron-type time-of-flight mass analyzer (160 mm x Ø 60 mm)[4]. Positive ions are generated by laser desorption and separated in the mass analyzer based on their mass-to-charge ratio (TOF principle), resulting in a single mass spectrum for each laser shot.
The capabilities of ORIGIN were recently demonstrated by measurements of amino acids standards and now extended to PAHs and lipids [3,5,6]. Studies were conducted to investigate the limit of detection, optimal laser desorption conditions, and influence of the sample substrate. In our contribution, we will discuss the setup and measurement procedures, and show results of several studies regarding the performance of ORIGIN, specifically regarding detection of several potential biosignature targets. The implications of our results will be discussed, with a focus on the suitability of the presented technique for future space missions to explore Ocean Worlds in the search for signatures of life.
References:
[1] K.P. Hand, et al., Report of the Europa Lander Science Definition Team. Posted February, 2017. [2] J.I. Lunine, Acta Astronaut., 2017, 131, 123-130. [3] N.F.W. Ligterink, et al., Sci. Rep., 2020, 10, 9641. [4] A. Riedo, et al., J. Mass Spectrom., 2013, 48, 1-15. [5] K. A. Kipfer, et al., 2021, submitted to AAS. [6] N.J. Boeren et al., 2022, to be submitted.
How to cite: Boeren, N. J., Kipfer, K. A., Ligterink, N. F. W., de Koning, C. P., Keresztes Schmidt, P., Grimaudo, V., Tulej, M., Lindner, R., Ehrenfreund, P., Wurz, P., and Riedo, A.: Prototype Laser Desorption/Ionization Mass Spectrometer for in situ Biosignature Detection on Ocean Worlds, EGU General Assembly 2022, Vienna, Austria, 23–27 May 2022, EGU22-12778, https://doi.org/10.5194/egusphere-egu22-12778, 2022.
EGU22-13419 | Presentations | GI3.2
Miniature Planetary In-situ Sensors (MiniPINS) – Design status and the latest activitiesMaria Genzer, Maria Hieta, Harri Haukka, Ignacio Arruego, Victor Apéstigue, Javier Martínez-Oter, Alejandro Gonzalo, Jose Antonio Manfredi, Cristina Ortega, Carmen Camañes, Manuel Dominguez-Pumar, Servando Espejo, and Hector Guerrero and the MiniPINS team
MiniPINS is an ESA study led by the Finnish Meteorological Institute to develop and prototype miniaturised surface sensor packages (SSPs) for Mars (MINS) and the Moon (LINS). The study aims at miniaturizing the scientific sensors and subsystems, as well as identifying and utilizing commonalities of the packages, allowing to optimise the design, cut costs and reduce the development time. The project has passed its Preliminary Requirements Review in 2021 and is currently in phase B1.
MINS is a penetrator with approx. 25 kg mass, piggy-backed by another Mars mission spacecraft to Mars and deployed either from the approach orbit or Mars orbit. 4 penetrators are planned to be released to different landing sites on Mars. The design of MINS has significant heritage from FMI’s MetNet mission design [1]. In the Martian atmosphere the penetrators undergo aerodynamic braking with inflatable breaking units (IBUs) until they reach the target velocity of 60-80 m/s for entering the Martian surface. The penetration depth target is up to 0.5 m, depending on the hardness of the soil. The geometry of MINS penetrator includes a thin section to improve penetrability to the soil, a medium section with 150 mm diameter to accommodate a 2U CubeSat structure inside, and a top section with a wider diameter to stop the penetration and avoid the top part to be buried inside the soil. The deployable boom is accommodated in the top section along with the surface sensors.
LINS is a miniature 7 kg station deployed on the Moon surface by a rover. The baseline carrier mission for LINS is European Large Logistics Lander (EL3). 4 LINS packages are deployed to different sites within the rover’s traveling perimeter by the rover’s robotic arm. LINS thermal design enables its survival during 14-day long Lunar nights when the temperature drops down to -170 C. LINS consists of a double structure, with external separated from the internal by PEEK blocks. The bottom of LINS can be completely in contact with the lunar regolith, since it is isolated from the internal one, and the space between can accommodate additional thermal insulation. Additional heating power is provided by 3W RHU of European design.
The last stage of the MiniPINS project was a prototyping work package, which was divided into several developments. (i)The main activity was designing and manufacturing a high-impact facility to validate the MINS Penetrators. An existing air-vacuum canyon was combined with a penetration-targeting structure and a three-axis 60kg wireless accelerometer to test the penetrators with different terrains and impact velocities (facility located at INTA, Madrid). (ii) The design of a deployable mechanism for flexible solar panels for MINS by IMDEA. (iii) IMSE’s ASIC technologies qualify for temperatures compatible with the lunar surface (down to -180°C). (iv) A simulator of Lunar regolith for testing the future thermal probes to characterize the lunar regolith for LINS.
[1] Harri et al. (2017), The MetNet vehicle: a lander to deploy environmental stations for local and global investigations on Mars, Geosci. Instrum. Method. Data Syst., 6, 103-124
How to cite: Genzer, M., Hieta, M., Haukka, H., Arruego, I., Apéstigue, V., Martínez-Oter, J., Gonzalo, A., Manfredi, J. A., Ortega, C., Camañes, C., Dominguez-Pumar, M., Espejo, S., and Guerrero, H. and the MiniPINS team: Miniature Planetary In-situ Sensors (MiniPINS) – Design status and the latest activities, EGU General Assembly 2022, Vienna, Austria, 23–27 May 2022, EGU22-13419, https://doi.org/10.5194/egusphere-egu22-13419, 2022.
EGU22-13430 | Presentations | GI3.2 | Highlight
Containing Englacial Attenuation in the Absence of Continuous Reflecting InterfacesDustin Schroeder and Riley Culberg
The attenuation experienced by ice penetrating radar sounding signals within glaciers, ice sheets, or planetary ice shells is an expression of the temperature and chemistry of the ice through which it propagates. As a result, placing observational constraints on the amount and spatial variation of englacial attenuation can reveal the thermophysical and chemical configuration of planetary and terrestrial ice masses. In terrestrial radioglaciology, there are well-established techniques for estimating attenuation using continuous reflecting interfaces such as englacial layers or the glacier bed. However, for the most challenging and resource-constrained observing scenarios (e.g. the sounding of Jovian icy moons) such interfaces may be rare, unusable, or absent. In these scenarios, established approaches are unlikely to yield useful attenuation - and therefore thermal or compositional - estimates. To address this challenge, we develop, demonstrate, and discuss alternative analysis approaches to constrain ice-sheet and/or ice-shell attenuation in the absence of continuous reflecting interfaces by exploiting volume scattering, shadowing, iso-attenuation horizons, and isolated reflectors in radar sounding data.
How to cite: Schroeder, D. and Culberg, R.: Containing Englacial Attenuation in the Absence of Continuous Reflecting Interfaces, EGU General Assembly 2022, Vienna, Austria, 23–27 May 2022, EGU22-13430, https://doi.org/10.5194/egusphere-egu22-13430, 2022.
EGU22-3316 | Presentations | ESSI1.4
The geoid gravity potential inversion to dense anomalies and their comparison with the seismic tomography modelsRudolf Greku and Dmitry Greku
Greku R.Kh., Greku D.R.
Institute of Geological Sciences, Ukraine
SATMAR Laboratory, DDS Capital Investments, Australia
The geoid gravity potential inversion to dense anomalies and their comparison with the seismic tomography models
The results of using the gravitational tomography method is based on the use of algorithms for inverting the values of the gravitational potential (geoid) for calculating the Earth's density anomalies in the entire range of depths up to 5300 km [H. Moritz. The Figure of the Earth's Interior, Wichmann / Karlsruhe, 1990]. The initial data are the anomalies of the geoid heights according to the EGM2008 model in the expansion in spherical functions to harmonics n, m = 2190. The spatial resolution of the data on the surface is 10 km. The depths of the disturbing masses are determined taking into account the harmonic number. The result is maps of density distribution at specified depths, vertical sections and 3D models.
Examples of the distribution of density anomalies for certain regions of Ukraine, Europe and Antarctica are given. Discrepancies with known works on seismotomography are mainly due to different physical properties of the studied medium: density and acoustic properties of rocks.
Density anomaly results are reported as the percent deviation from the Earth's PREM density model for a given location and depth. The entire range of density anomalies in the form of deviations from the PREM model does not exceed 12%. Complete coincidence of the results is observed, for example, at great depths of 2800 km throughout the Earth. The section through the continent of Antarctica with a complex relief and structure to a depth of 400 km also shows similar images from seismic and gravity tomography. The gravitomographic model of the tectonically active region of Vrancea confirms the delamination nature of the formation of the disturbing mass and the occurrence of earthquakes in Europe.
The original call to the present topic of the GD7.5 session (Prof. Saskia Goes) rightly notes the important role of rheological variability in the mantle layers on the deformation of the earth's crust and surface, which can cause catastrophic destruction of large-block structures. In this sense, the intensity of the inner layers according to the data of structural inhomogeneities becomes more and more urgent.
How to cite: Greku, R. and Greku, D.: The geoid gravity potential inversion to dense anomalies and their comparison with the seismic tomography models, EGU General Assembly 2022, Vienna, Austria, 23–27 May 2022, EGU22-3316, https://doi.org/10.5194/egusphere-egu22-3316, 2022.
Please decide on your access
Please use the buttons below to download the presentation materials or to visit the external website where the presentation is linked. Regarding the external link, please note that Copernicus Meetings cannot accept any liability for the content and the website you will visit.
Forward to presentation link
You are going to open an external link to the presentation as indicated by the authors. Copernicus Meetings cannot accept any liability for the content and the website you will visit.
We are sorry, but presentations are only available for users who registered for the conference. Thank you.
EGU22-3380 | Presentations | ESSI1.4
The Potential of Moonlight Remote Sensing: A Systematic Assessment with Multi-Source and Multi-Moon phase Nightlight DataDi Liu and Qingling Zhang
Increased observation frequencies are current trends in optical remote sensing. However, there are still challenges at the night side when sunlight is not available. Due to their powerful capabilities in low-light sensing, nightlight satellite sensors have been deployed to capture nightscapes of the Earth from space, observing anthropomorphic and natural activities at night. At present, most nightlight remote sensing applications have mostly focused on artificial lights, particularly within cities or self-luminous entities such as fisheries, oil, shale gas, offshore rigs, and other self-luminous bodies. Little attention has been paid to examining the potential of nightlight remote sensing for mapping land surfaces in low-light suburban areas using satellite remote sensing technology. Observations taken under moonlight are often discarded or corrected to reduce the lunar effects. Some researchers have discussed the possibility of moonlight as a useful illuminating source at night for the detection of nocturnal features on Earth, but no quantitative analysis has been reported so far. This study aims to systematically evaluate the potential of moonlight remote sensing with the whole month of mono-spectral Visible Infrared Imaging Radiometer Suite/Day-Night-Band (VIIRS/DNB) and multi-spectral Unmanned Aerial Vehicle (UAV) nighttime images. The present study aims to:1) to study the potential of moonlight remote sensing for mapping land surface in low-light suburban areas; 2) to investigate the Earth observation capability of moonlight data under different lunar phases;3) to make two daily uniform nightlight datasets(moonlight included and removed) for various night scenes researches, like weather diurnal forecast, circadian rhythms in plants and so on; 4) to discuss the requirements for the next-generation nightlight remote sensing satellite sensors.
How to cite: Liu, D. and Zhang, Q.: The Potential of Moonlight Remote Sensing: A Systematic Assessment with Multi-Source and Multi-Moon phase Nightlight Data, EGU General Assembly 2022, Vienna, Austria, 23–27 May 2022, EGU22-3380, https://doi.org/10.5194/egusphere-egu22-3380, 2022.
EGU22-4300 | Presentations | ESSI1.4
Synergetic use of Sentinel-1 and Sentinel-2 data for large-scale Land Use/Land Cover MappingMelanie Brandmeier, Maximilian Hell, Eya Cherif, and Andreas Nüchter
One of the largest threats to the vast ecosystem of the Brazilian Amazon Forest is deforestation and forest degradation caused by human activity. The possibility to continuously monitor these degradation events has recently become more feasible through the use of freely available satellite remote sensing data and machine learning algorithms suited for big datasets.
A fundamental challenge of such large-scale monitoring tasks is the automatic generation of reliable and correct land use and land cover (LULC) maps. This is achieved by the development of robust deep learning models that generalize well on new data. However, these approaches require large amounts of labeled training data. We use the latest results of the MapBiomas project as the ‘ground-truth’ for developing new algorithms. In this project, Souza et al. [1] used yearly composites of USGS Landsat imagery to classify the LULC for the whole of Brazil. The latest iteration of their work became available for the years 1985–2020 as Collection 6 (https://mapbiomas.org). However, this reference data cannot be considered real ground truth, as it is itself generated from machine learning models and therefore requires novel approaches suited to overcome such problems of weakly supervised learning.
As tropical regions are often covered by clouds, radar data is better suited for continuous mapping than optical imagery, due to its cloud-penetrating capabilities. In a preliminary study, we combined data from ESA’s Sentinel-1 (radar) and Sentinel-2 (multispectral) missions for developing algorithms suited to act on multi-modal and -temporal data to obtain accurate LULC maps. The best performing proposed deep learning network, DeepForestM2, employed a seven-month radar time series combined with a single optical scene. This model configuration reached an overall accuracy of 75.0% on independent test data. A state-of-the-art (SotA) DeepLab model, trained on the very same data, reached an overall accuracy of 69.9%.
Currently, we are further developing this approach of fusing multi-modal data with a temporal aspect to improve on LULC classification. Larger amounts of more recent data, both Sentinel-1 and Sentinel-2 from 2020 are included in training experiments. Additional deep learning networks and approaches to deal with weakly supervised [2] learning are developed and tested on the data. The need for the weakly supervised methods arises from the reference data, which is both inaccurate and inexact, i.e., has a coarser spatial resolution than the training data. We aim to improve the classification results qualitatively, as well as quantitatively compared to SotA methods, especially with respect to generalizing well on new datasets. The resulting deep learning methods, together with the trained weights, will also be made accessible through a geoprocessing tool in Esri’s ArcGIS Pro for users without coding background.
- Carlos M. Souza et al. “Reconstructing Three Decades of Land Use and Land Cover Changes in Brazilian Biomes with Landsat Archive and Earth Engine”. en. In: Remote Sensing 17 (Jan. 2020). Number: 17 Publisher: Multidisciplinary Digital Publishing Institute, p. 2735. DOI: 10.3390/ rs12172735.
- Zhi-Hua Zhou. “A brief introduction to weakly supervised learning”. In: National Science Review 5.1 (Jan. 2018), pp. 44–53. ISSN: 2095-5138. DOI: 10.1093/nsr/nwx106.
How to cite: Brandmeier, M., Hell, M., Cherif, E., and Nüchter, A.: Synergetic use of Sentinel-1 and Sentinel-2 data for large-scale Land Use/Land Cover Mapping, EGU General Assembly 2022, Vienna, Austria, 23–27 May 2022, EGU22-4300, https://doi.org/10.5194/egusphere-egu22-4300, 2022.
EGU22-4678 | Presentations | ESSI1.4
Lithology Mapping with Satellite, Fieldwork-based Spectral data, and Machine Learning: the case study of Beiras Group (Central Portugal)João Pereira, Alcides J.S.C. Pereira, Artur Gil, and Vasco M. Mantas
The lack of cartography increases the problematic of poor knowledge of geological resources and land management in regions that could benefit greatly from this information. Remote sensing has been an invaluable mean of obtaining data to perform geological mapping objectively and with high scientific accuracy. In Portugal, there is a large gap of cartographic information at 1:50 000 scale throughout the territory, so this work intends to complement this problem through a set of techniques and methodologies applied to a study of a region of Grupo das Beiras.
Spectral databases serve as an initial tool for any methodology involving spectral analysis, namely for the development of cartography methods and quick characterization of rock samples.
To address these issues, a multispectral analysis of january and july 2015th scenes with low cloud cover and atmospheric corrections (level 2) was obtained from Landsat 8 (LS8). Certain statistical tests such as ANOVA and Tukey's were applied to both images to clearly know whether significant differences exist between lithologies.
For the hyperspectral analysis, two sampling campaigns were carried out with the collection of rock samples of metasediments and granites and soil. The analysis was performed in fresh samples, crushed samples (2 mm - 500 μm; 500 μm - 125μm; <125 μm) and soil samples demonstrating a significantly different spectral behavior among various particle sizes in the hyperspectral signatures between fresh and crushed samples. X-ray fluorescence (FRX) was used to obtain geochemical data of major elements to validate the spectral results obtained. As a result, there were identified correspondences between the obtained hyperspectral data and the databases as well in the literature meaning that the spectral signatures of this research are consistent with the studied samples.
The creation of machine learning models is an emerging tool for cartography in which LS8 reflectance data was used for this elaboration. In this work and for this context the models proved to be useful and successful for the image classification from algorithms assigned for this function.
How to cite: Pereira, J., Pereira, A. J. S. C., Gil, A., and Mantas, V. M.: Lithology Mapping with Satellite, Fieldwork-based Spectral data, and Machine Learning: the case study of Beiras Group (Central Portugal), EGU General Assembly 2022, Vienna, Austria, 23–27 May 2022, EGU22-4678, https://doi.org/10.5194/egusphere-egu22-4678, 2022.
Please decide on your access
Please use the buttons below to download the presentation materials or to visit the external website where the presentation is linked. Regarding the external link, please note that Copernicus Meetings cannot accept any liability for the content and the website you will visit.
Forward to presentation link
You are going to open an external link to the presentation as indicated by the authors. Copernicus Meetings cannot accept any liability for the content and the website you will visit.
We are sorry, but presentations are only available for users who registered for the conference. Thank you.
EGU22-5333 | Presentations | ESSI1.4
Remote sensing – based analysis of the islands dynamics in the Lower Danube RiverMarina Virghileanu and Gabriela Ioana-Toroimac
River islands are important components of the river morpho-dynamics, which can provide essential information on fluvial processes, as well as on sediment and flow regimes. In the same time, river islands play an essential role from the political, environmental and socio-cultural points of view. Thus, understanding the temporal dynamics of the river islands is a required task for channel navigation safety, port functionality, agricultural production and biodiversity. The aim of this study is to analyse the spatial and temporal changes on the river islands during the last 40 years, based on satellite remotely sensed images. The study focuses on the Lower Danube River, downstream the Iron Gates dams altering the flow and sediment load, which also suffers from dredging for navigation. The islands of the Lower Danube River generate major impacts on riparian states relationship, interfere with the ports activity and EU investments (as it is the case of Rast port in Romania), or are the subject of ecological restoration. Multispectral satellite data, including Landsat and Sentinel-2 images, were used for river islands mapping at different temporal moments, with a medium spatial resolution (up to 15 m on Landsat pansharpened data and 10 m on Sentinel-2). Spectral indices, as NDVI and NDWI, allowed the automatic extraction of island boundaries and land cover information. On these, two processes were carried out: 1) the characterization of the river islands morphology, and 2) the quantification of the spatial and temporal changes over time. The resulted data are connected with in-situ measurements on flow regime and sediment supply, as well as with flood events and human activities in order to identify the potential drivers of change. The results demonstrate a strong correlation between river islands dynamics and flood events in the Lower Danube River, as the major flood event from 2006 significantly modified the islands size and shape. This research can allow the identification of the evolutionary model of the Danube River.
This research work was conducted as part of the project PCE 164/2021 “State, Communities and Nature of the Lower Danube Islands: An Environmental History (1830-2020)”, financed by the UEFISCDI.
How to cite: Virghileanu, M. and Ioana-Toroimac, G.: Remote sensing – based analysis of the islands dynamics in the Lower Danube River, EGU General Assembly 2022, Vienna, Austria, 23–27 May 2022, EGU22-5333, https://doi.org/10.5194/egusphere-egu22-5333, 2022.
EGU22-7726 | Presentations | ESSI1.4
Investigating the links between primary metabolites of medicinal species with leaf hyperspectral reflectanceAyushi Gupta, Prashant K Srivastava, and Karuna Shanker
Recent studies have shown that the turnover in tree species composition across edaphic and elevational gradients is strongly correlated with functional traits. However, our understanding of functional traits has been limited by the lack of detailed studies of foliar chemistry across habitats and the logistical & economic challenges associated with the analysis of plant functional traits at large geographical scales. Advances in remote sensing and spectroscopic approaches that measure spectrally detailed light reflectance and transmittance of plant foliage provides accurate predictions of several functional chemical traits. In this study, Pyracantha crenulata (D. Don) M. Roemer has been used, which is an evergreen thorny shrub species found in open slopes between 1,000 and 2,400 m above mean sea level. P. crenulata is used in the treatment of hepatic, cardiac, stomach, and skin disease. In this study the P. crenulata leaves samples spectra were recorded using an ASD spectroradiometer and following primary metabolites such as chlorophyll, anthocyanin, phenolic, and sterol were analyzed. The spectroradiometer data were preprocessed using filter and then reduced to a few sensitive bands by applying feature selection to the hyperspectral data. The band values were directly correlated with the measured values. The analysis indicates a significant correlation between P. crenulata primary metabolite in the Visible and Infrared region (VISIR). This result suggests that molecules that have important functional attributes could be identified by VISIR spectroscopy, which would save a lot of time and expense as compared to wet laboratory analysis.
How to cite: Gupta, A., Srivastava, P. K., and Shanker, K.: Investigating the links between primary metabolites of medicinal species with leaf hyperspectral reflectance, EGU General Assembly 2022, Vienna, Austria, 23–27 May 2022, EGU22-7726, https://doi.org/10.5194/egusphere-egu22-7726, 2022.
Please decide on your access
Please use the buttons below to download the presentation materials or to visit the external website where the presentation is linked. Regarding the external link, please note that Copernicus Meetings cannot accept any liability for the content and the website you will visit.
Forward to presentation link
You are going to open an external link to the presentation as indicated by the authors. Copernicus Meetings cannot accept any liability for the content and the website you will visit.
We are sorry, but presentations are only available for users who registered for the conference. Thank you.
EGU22-7859 | Presentations | ESSI1.4
Predictive performance of deep-learning-enhanced remote-sensing data for ecological variables of tidal flats over timeLogambal Madhuanand, Katja Phillippart, Wiebe Nijland, Jiong Wang, Steven M. De Jong, Allert I. Bijleveld, and Elisabeth A. Addink
Tidal flat systems with a diverse benthic community (e.g., bivalves, polychaetes and crustaceans) is important in the food chain for migratory birds and fish. The geographical distribution of macrozoobenthos depends on physical factors, among which sediment characteristics are key aspects. Although high-resolution and high-frequency mapping of benthic indices (i.e., sediment composition and benthic fauna) of these coastal systems are essential to coastal management plans, it is challenging to gather such information on tidal flats through in-situ measurements. The Synoptic Intertidal Benthic Survey (SIBES) database provides this field information for a 500m grid annual for the Dutch Wadden Sea, but continuous coverage and seasonal dynamics are still lacking. Remote sensing may be the only feasible monitoring method to fill in this gap, but it is hampered by the lack of spectral contrast and variation in this environment. In this study, we used a deep-learning model to enhance the information extraction from remote-sensing images for the prediction of environmental and ecological variables of the tidal flats of the Dutch Wadden Sea. A Variational Auto Encoder (VAE) deep-learning model was trained with Sentinel-2 satellite images with four bands (blue, green, red and near-infrared) over three years (2018, 2019 and 2020) of the tidal flats of the Dutch Wadden Sea. The model was trained to derive important characteristics of the tidal flats as image features by reproducing the input image. These features contain representative information from the four input bands, like spatial texture and band ratios, to complement the low-contrast spectral signatures. The VAE features, the spectral bands and the field-collected samples together were used to train a random forest model to predict the sediment characteristics: median grain size and silt content, and macrozoobenthic biomass and species richness. The prediction was done on the tidal flats of Pinkegat and Zoutkamperlaag of the Dutch Wadden sea. The encoded features consistently increased the accuracy of the predictive model. Compared to a model trained with just the spectral bands, the use of encoded features improved the prediction (coefficient of determination, R2) by 10-15% points for 2018, 2019 and 2020. Our approach improves the available techniques for mapping and monitoring of sediment and macrozoobenthic properties of tidal flat systems and thereby contribute towards their sustainable management.
How to cite: Madhuanand, L., Phillippart, K., Nijland, W., Wang, J., De Jong, S. M., Bijleveld, A. I., and Addink, E. A.: Predictive performance of deep-learning-enhanced remote-sensing data for ecological variables of tidal flats over time, EGU General Assembly 2022, Vienna, Austria, 23–27 May 2022, EGU22-7859, https://doi.org/10.5194/egusphere-egu22-7859, 2022.
EGU22-8019 | Presentations | ESSI1.4
The extraction of urbanized areas based on the high-resolution night lights images: A case study in Barcelona, SpainQianhui Zheng and Josep Roca
The definition of urbanized areas, both regionally and globally, is an important basis for urban development monitoring and management, as well as an important condition for studying social policies, economics, culture and the environment.
Thanks to the development of science and technology, urban expansion is developing rapidly. The method of extracting urbanized areas quickly and accurately has become the focus of research.
In the 1970s, with the beginning of the Defense Meteorological Satellite Program (DMSP), the images of night lights that provide a new method for the extraction of urbanized areas were born.
However, due to the limits of spatial resolution and spectral range, it’s true that there are defects in urbanized area extraction based on OMSP-OLS nightlight images.
In recent years, with the development of remote sensing technology, remote sensing data with a higher resolution emerged, providing an effective and applicable data source for urban planning monitoring.
I suppose that the images of night lights with a higher resolution have greater precision than the old ones in the extraction of urbanized areas.
This work has dedicated the images of night lights (NPP-VIIRS and Luojia1-01) and the images of urbanized areas (FROM-GLC 2017) to construct a logistic regression model to evaluate and compare the accuracy of the two images of night lights in the extraction of urbanized areas.
The case study is Barcelona metropolitan area, Spain. (636 km2, 3.3 million inhabitants).
How to cite: Zheng, Q. and Roca, J.: The extraction of urbanized areas based on the high-resolution night lights images: A case study in Barcelona, Spain , EGU General Assembly 2022, Vienna, Austria, 23–27 May 2022, EGU22-8019, https://doi.org/10.5194/egusphere-egu22-8019, 2022.
EGU22-9012 | Presentations | ESSI1.4 | Highlight
Mapping the World at 10 m: A Novel Deep-Learning Land Use Land Cover Product and BeyondDawn Wright, Steve Brumby, Sean Breyer, Abigail Fitzgibbon, Dan Pisut, Zoe Statman-Weil, Mark Hannel, Mark Mathis, and Caitlin Kontgis
Land use / land cover (LULC) maps provide critical information to governments, land use planners, and decision-makers about the spatial layout of the environment and how it is changing. While a variety of LULC products exist, they are often coarse in resolution, not updated regularly, or require manual editing to be useful. In partnership, Esri, Microsoft Planetary Computer, and Impact Observatory created the world’s first publicly available 10-m LULC map by automating and sharing a deep-learning model that was run on over 450,000 Sentinel-2 scenes. The resulting map, released freely on Esri’s Living Atlas in June 2021, displays ten classes across the globe: built area, trees, scrub/shrub, cropland, bare ground, flooded vegetation, water, grassland, permanent snow/ice, clouds. Here, we discuss key findings from the resulting map, including a quantitative analysis of how 10-m resolution allows us to assess small, low density urban areas compared to other LULC products, including the Copernicus CGLS-LC100 100-m resolution global map. We will also share how we support project-based, on-demand LULC mapping and will present preliminary findings from a new globally consistent 2017-2021 annual LULC dataset across the entire Sentinel-2 archive.
How to cite: Wright, D., Brumby, S., Breyer, S., Fitzgibbon, A., Pisut, D., Statman-Weil, Z., Hannel, M., Mathis, M., and Kontgis, C.: Mapping the World at 10 m: A Novel Deep-Learning Land Use Land Cover Product and Beyond, EGU General Assembly 2022, Vienna, Austria, 23–27 May 2022, EGU22-9012, https://doi.org/10.5194/egusphere-egu22-9012, 2022.
Please decide on your access
Please use the buttons below to download the presentation materials or to visit the external website where the presentation is linked. Regarding the external link, please note that Copernicus Meetings cannot accept any liability for the content and the website you will visit.
Forward to presentation link
You are going to open an external link to the presentation as indicated by the authors. Copernicus Meetings cannot accept any liability for the content and the website you will visit.
We are sorry, but presentations are only available for users who registered for the conference. Thank you.

EGU22-9265 | Presentations | ESSI1.4
Application of unsupervised machine learning techniques for lithological and soil mapping in Ossa-Morena ZoneMarcelo Silva, Pedro Nogueira, Renato Henriques, and Mário Gonçalves
Unsupervised methods are a good entry point for satellite image classification, requiring little to no input, and outputting an analysis, in the form of a thematic map, that may act as a guide for more user input intensive methods. For this work, we use K-means methods to classify satellite and drone imagery that cover the Ossa-Morena Zone (OMZ), in Portugal, and assess their capacity for lithological and soil mapping. The drone is equipped with a High Precision NDVI Single Sensor and was flown over the ancient mines of Mociços, Mostardeira and Santa Eulália. The OMZ is a tectonostratigraphic domain shared between Portugal and Spain, divided in Sectors, extraordinarily rich and diverse from a lithological, stratigraphical, and structural point-of-view; for this work, we will focus on the Estremoz-Barrancos sector, comprised of a Neoproterozoic to Devonian metasedimentary succession, with a low-grade metamorphism in greenschist facies, and the Santa Eulália Plutonic Complex (SEPC), an elliptic late-Variscan granitic massif that crosscuts the Alter do Chão-Elvas Sector and the Blastomylonitic belt, constituted by two granitic facies, a few small mafic bodies, and some roof pendants that belong to the Alter do Chão-Elvas Sector.
The imagery used correspond to high-level satellite imagery products gathered between 2004 to 2006 (ASTER) and 2017 to 2021 (Landsat 8 and Sentinel-2), and drone imagery captured on May 6th and August 31st, 2021.
The K-means was applied to a variable number of selected bands, including band ratios, and tested for different number of initial clusters and different distance algorithms (Minimum Distance and Spectral Angle Mapping). Afterwards, it was assessed its ability to outlining and classify different geological structures by comparing the results to the geological map of OMZ.
The obtained thematic maps points towards poorer results when using a larger selection of bands - for instance, ASTER bands 1 to 9 (in which bands 1 to 3N were resampled to 30m) -, due to interspersion of different classes, whereas when using band ratio combinations, such as 4/2 and 6/(5+7) (ASTER), the produced map successfully classifies the major geological features present in the region, with increased sharpness between contacts with a higher number of classes.
Results show that K-means, when used under the correct conditions and parameters, has the potential for lithological and soil mapping through image classification, both for satellite and drone imagery.
Future work will focus on the integration of a pre-processing step for band selection using ML techniques, such as through Principal Component Analysis, Minimum Noise Fraction and Random Forest.
The authors acknowledge the funding provided by FCT through the Institute of Earth Sciences (ICT) with the reference UIDB/GEO/04683/2020.
How to cite: Silva, M., Nogueira, P., Henriques, R., and Gonçalves, M.: Application of unsupervised machine learning techniques for lithological and soil mapping in Ossa-Morena Zone, EGU General Assembly 2022, Vienna, Austria, 23–27 May 2022, EGU22-9265, https://doi.org/10.5194/egusphere-egu22-9265, 2022.
EGU22-10163 | Presentations | ESSI1.4
Utilizing hyperspectral imagery for burnt area mapping in a Greek settingChristina Lekka, Spyridon E. Detsikas, George P. Petropoulos, Petros Katsafados, Dimitris Triantakonstantis, and Prashant K. Srivastava
Earth observation (EO) - particularly so from hyperspectral imagers - gains increasing interest in wildfire mapping as it offers a prompt with high accuracy and low-cost delineation of a burnt area. A key hyperspectral orbital sensor with over 20 years of operational life is Compact High-Resolution Imaging Spectrometer (CHRIS), onboard ESA’s PROBA platform. This mission sensor collects spectral data in the VNIR range (400 - 1050 nm) simultaneously at 5 viewing angles and at different spatial resolutions of 17 m and 34 m which contains 19 and 63 spectral bands respectively. The present study focuses on exploring the use of CHRIS PROBA legacy data combined with machine learning (ML) algorithms in obtaining a burnt area cartography. In this context, a further objective of the study has been to examine the contribution of the multi-angle sensor capabilities to enhance the burn scar detection. As a case study was selected a wildfire occurred during the summer of 2007 in the island of Evvoia, in central Greece for which imagery from the CHRIS PROBA archive shortly after the fire outbreak was available. For the accuracy assessment of the derived burnt area estimate the error matrix statistics were calculated in ENVI. Burnt area estimates from were also further validated against the operational product developed in the framework of ESA’s Global Monitoring for Environmental Security/Service Element. This study’s results evidenced the added value of satellite hyperspectral imagery combined with ML classifiers as a cost-effective and robust approach to evaluate a burnt area extent, particularly so of the multi-angle capability in this case. All in all, the study findings can also provide important insights towards the exploitation of hyperspectral imagery acquired from current missions (e.g. HySIS, PRISMA, CHRIS, DESIS) as well as upcoming ones (e.g. EnMAP, Shalom, HySpiri and Chime).
KEYWORDS: CHRIS-PROBA, hyperspectral, machine learning, burnt area mapping
How to cite: Lekka, C., Detsikas, S. E., Petropoulos, G. P., Katsafados, P., Triantakonstantis, D., and Srivastava, P. K.: Utilizing hyperspectral imagery for burnt area mapping in a Greek setting, EGU General Assembly 2022, Vienna, Austria, 23–27 May 2022, EGU22-10163, https://doi.org/10.5194/egusphere-egu22-10163, 2022.
EGU22-11946 | Presentations | ESSI1.4
A GEOBIA-based approach for mapping Urban Green Spaces using PlanetScope imagery: the case of AthensEvangelos Dosiadis, Dimitris Triantakonstantis, Ana-Maria Popa, Spyridon E. Detsikas, Ionut Sandric, George P. Petropoulos, Diana Onose, and Christos Chalkias
The technological developments in geoinformatics in recent decades have allowed the inclusion of geospatial data and analysis techniques in a wide range of scientific disciplines. One such field is associated with the study of urban green spaces (UGS). Those are defined as open, undeveloped areas that provide residents with recreational space, improving the aesthetic and environmental quality of the neighboring areas. Mapping accurately their spatial extent is absolutely essential requirement in urban planning and their preservation and expansion in Metropolitan areas are of high importance to protect the environment and public health.
The objective of this study is to explore the use of high spatial resolution satellite imagery from PlanetScope combined with the Geographic Object-Based Image Analysis (GEOBIA) classification approach in mapping UGS in Athens, Greece. For the UGS retrieval, an object-based classification (GEOBIA) method was developed utilizing a multispectral PlanetScope imagery acquired in June 2020. Accuracy assessment was performed with a confusion matrix utilizing a set of randomly selected control points within the image selected from field visits and image photo-interpretation. In addition, the obtained UGS were compared versus independent estimates of the Green Urban Areas from the Urban Atlas global operational product. All the geospatial data analysis was conducted in a GIS environment (ArcGIS Pro).
Results demonstrated the usefulness of GEOBIA technique when combined with very high spatial-resolution satellite imagery from PlanetScope in mapping UGS, as was demonstrated by the high accuracy results that were obtained from the statistical comparisons. With the technological evolution in the Earth Observation datasets acquisition and image processing techniques, mapping UGS has been optimized and facilitated and this study contributes in this direction.
KEYWORDS: Urban Green Spaces, Athens, PlanetScope, Earth Observation, GEOBIA
How to cite: Dosiadis, E., Triantakonstantis, D., Popa, A.-M., Detsikas, S. E., Sandric, I., Petropoulos, G. P., Onose, D., and Chalkias, C.: A GEOBIA-based approach for mapping Urban Green Spaces using PlanetScope imagery: the case of Athens, EGU General Assembly 2022, Vienna, Austria, 23–27 May 2022, EGU22-11946, https://doi.org/10.5194/egusphere-egu22-11946, 2022.
EGU22-12092 | Presentations | ESSI1.4
Assessment of 10m Spectral and Broadband Surface Albedo Products from Sentinel-2 and MODIS dataJan-Peter Muller, Rui Song, Alistair Francis, Nadine Gobron, Jian Peng, and Nathan Torbick
In Song et al. (2021) [1] a framework for the retrieval of 10 m and 20 m spectral and 20 m broadband surface albedo products was described. This framework consists of four modules: 1) a machine learning based cloud detection method, Spectral ENcoder for SEnsor Independence (SEnSeI) [2]. 2) an advanced atmospheric correction model Sensor Invariant Atmospheric Correction (SIAC) [3]. 3) an endmember-based class extraction method, which enables the retrieval of 10 m/20 m albedos based on a regression between the MODIS Bidirectional Reflectance Distribution Function (BRDF) derived surface albedo and Sentinel-2 surface reflectance resampled to MODIS resolution. 4) a novel method of using the MODIS BRDF prior developed within the QA4ECV programme (http://www.qa4ecv.eu/) to fill in the gaps in a time series caused by cloud obscuration. We describe how ~1100 scenes were processed over 22 Sentinel-2 tiles at the STFC JASMIN facility. These tiles spanned different 4 month time periods for different users with a maximum of 22 dates per tile. These tiles cover Italy, Germany, South Africa, South Sudan, Ukraine and UK for 6 different users. For the Italian site, a detailed analysis was performed of the impact of this hr-albedo on the fAPAR and LAI derived using TIP [5] whilst a second user employed a method described in [6] to compare MODIS and Sentinel-2 and a third user looked at the impact on agricultural yield forecasting. Lessons learnt from these different applications will be described including both the opportunities and areas where further work is required to improve the data quality.
We thank ESA for their support through ESA-HR-AlbedoMap: Contract CO 4000130413 and the STFC JASMIN facility and in particular Victoria Bennett for their assistance.
[1] Song, R., Muller, J.-P., Francis, A., A Method of Retrieving 10-m Spectral Surface Albedo Products from Sentinel-2 and MODIS data," 2021 IEEE International Geoscience and Remote Sensing Symposium IGARSS, 2021, pp. 2381-2384, doi: 10.1109/IGARSS47720.2021.9554356
[2] Francis, A., Mrziglod, J., Sidiropoulos, P. and J.-P. Muller, "SEnSeI: A Deep Learning Module for Creating Sensor Independent Cloud Masks," in IEEE Transactions on Geoscience and Remote Sensing, doi: 10.1109/TGRS.2021.3128280.
[3] Feng et al. (2019) A Sensor Invariant Atmospheric Correction: Sentinel-2/MSI AND Landsat 8/OLI https://doi.org/10.31223/osf.io/ps957.
[4] Song, R.; Muller, J.-P.; Kharbouche, S.; Yin, F.; Woodgate, W.; Kitchen, M.; Roland, M.; Arriga, N.; Meyer, W.; Koerber, G.; Bonal, D.; Burban, B.; Knohl, A.; Siebicke, L.; Buysse, P.; Loubet, B.; Leonardo, M.; Lerebourg, C.; Gobron, N. Validation of Space-Based Albedo Products from Upscaled Tower-Based Measurements Over Heterogeneous and Homogeneous Landscapes. Remote Sensing 2020, 12, 1–23.doi: 10.3390/rs12050833
[5] Gobron, N.; Marioni, M.; Muller, J.-P.; Song, R.; Francis, A. M.; Feng, Y.; Lewis, P. ESA Sentinel-2 Albedo Case Study: FAPAR and LAI downstream products.; 2021; pp. 1–30. JRC TR (in press)
[6] Peng, J.; Kharbouche, S.; Muller, J.-P.; Danne, O.; Blessing, S.; Giering, R.; Gobron, N.; Ludwig, R.; Mueller, B.; Leng, G.; Lees, T.; Dadson, S. Influences of leaf area index and albedo on estimating energy fluxes with HOLAPS framework. J Hydrol 2020, 580, 124245.
How to cite: Muller, J.-P., Song, R., Francis, A., Gobron, N., Peng, J., and Torbick, N.: Assessment of 10m Spectral and Broadband Surface Albedo Products from Sentinel-2 and MODIS data, EGU General Assembly 2022, Vienna, Austria, 23–27 May 2022, EGU22-12092, https://doi.org/10.5194/egusphere-egu22-12092, 2022.
EGU22-12524 | Presentations | ESSI1.4
Error-reducing Structure-from-Motion derived Digital Elevation Models in data-scarce environmentsDirk Bakker, Phuoc Phùng, Marc van den Homberg, Sander Veraverbeke, and Anaïs Couasnon
High-accuracy Digital Elevation Models (DEMs) improve the quality of flood risk assessments and many other environmental applications, yet these products are often unavailable in developing countries due to high survey costs. Structure-from-Motion (SfM) photogrammetry combined with Unmanned Aerial Vehicles (UAVs) has been proven as an effective and low-cost technique that enables a wide audience to construct local-scale DEMs. However, the deviation from strict survey designs and guidelines regarding the number and distribution of Ground Control Points (GCPs) can result in linear and doming errors. Two surveys that suffer from these errors have been supplied for error-reduction, but both areas did not have an available high-accuracy DEM or could afford an additional differential Global Navigation Satellite System (dGNSS) ground survey to extract control points from to use in relative georeferencing approach. Little attention has been given to error-reduction using global open-access elevation data, such as: The TerraSAR-X add-on for Digital Elevation Measurements (TanDEM-X) 90; the Ice, Cloud and land Elevation Satellite-2 (ICESat-2); and Hydroweb.
The aim of this study was to improve and validate the two DEMs using control point extraction from the above data and analyze the validation results to determine the impact on error-reduction using regression analyses between the vertical error and distance from nearest control point. The outcomes shows that the ICESat-2 and Hydroweb can support surveys in absence of dGNSS GCPs with similar impact but cannot replace the necessity of dGNSS measurements in georeferencing and validation. These findings suggests that survey guidelines can be maintained with global open-access elevation data, but the effectiveness depends on both the number, distribution and estimated accuracy. Doming errors can be prevented by correct camera lens calibration, which depends on stable lens conditions or a stratified distribution of high-accuracy reference data. The validation of the SfM DEM in data-scarce areas proves difficult due to the lack of an independent validation dataset, but the Copernicus GLO-30 can give a quantification and show the spatial variability of the error. This study highlights the increasing accuracy of global open-access elevation data and shows that these databases allow the user to easily acquire more and independent data for georeferencing and validation, but the RSME is unable to be accurately reduced to sub-meter.
How to cite: Bakker, D., Phùng, P., van den Homberg, M., Veraverbeke, S., and Couasnon, A.: Error-reducing Structure-from-Motion derived Digital Elevation Models in data-scarce environments, EGU General Assembly 2022, Vienna, Austria, 23–27 May 2022, EGU22-12524, https://doi.org/10.5194/egusphere-egu22-12524, 2022.
EGU22-13002 | Presentations | ESSI1.4
ORBiDANSe: Orbital Big Datacube Analytics ServicePeter Baumann and Dimitar Misev
Datacubes form an accepted cornerstone for analysis (and visualization) ready spatio-temporal data offerings. The increase in user friendliness is achieved by abstracting away from the zillions of files in provider-specific organization. Data¬cube query languages additionally establish actionable datacubes enabling users to ask "any query, any time" with zero coding.
However, typically datacube deployments are aiming at large scale, data center environments accommodating Big Data and massive parallel processing capabilities for achieving decent performance. In this contribution, we conversely report about a downscaling experiment. In the ORBiDANSE project a datacube engine, rasdaman, has been ported to a cubesat, ESA OPS-SAT, and is operational in space. Effectively, the satellite thereby becomes a datacube service offering the standards-based query capabilities of the OGC Web Coverage Processing (WCPS) geo datacube analytics language.
We believe this will pave the way for on-board ad-hoc pro-cessing and filtering on Big EO Data, thereby unleashing them to a larger audience and in substantially shorter time.
In our talk, we report about the concept, technology, and experimental results of ad-hoc on-board datacube query processing.
How to cite: Baumann, P. and Misev, D.: ORBiDANSe: Orbital Big Datacube Analytics Service, EGU General Assembly 2022, Vienna, Austria, 23–27 May 2022, EGU22-13002, https://doi.org/10.5194/egusphere-egu22-13002, 2022.
EGU22-592 | Presentations | NH6.1
Producing a High-Resolution Land Cover Map for Southwest Ethiopia Using Sentinel-2 Images and Google Earth EngineFarzad Vahidi Mayamey, Navid Ghajarnia, Saeid Aminjafari, Zahra Kalantari, and Kristoffer Hylander
Accurate knowledge of local land cover and land use and their changes is crucial for many different applications such as natural resources management, environmental studies, ecological and biodiversity change evaluations, and food security. Global landcover maps can be useful datasets as a reference source and starting points, however, they usually show areas of geographical disagreements when compared to one another. Moreover, the global land cover products mostly generalize different land cover types which may not fit exactly to the specific needs of different projects and user communities. For instance, different types of forests are mostly considered as one category as they are not easy to be differentiated. In this study, we used high-resolution time-series images of Sentinel-2 to produce a local land cover for southwest Ethiopia with focusing on 8 major land cover classes: Forests, Plantations of exotic trees, Woodlands, Home Gardens, Annual crop fields, Grazing Wetlands, Urban areas, and Open water bodies. We also utilized high-resolution google map satellite imagery and the local expert knowledge on the study area to produce an observational dataset for training and validating steps. Different machine learning algorithms, land cover combinations, and seasonal scenarios were also used to produce the best local land cover map for the study area. For this purpose, a two-step approach was implemented to produce the final high-resolution land cover map. Firstly, we produced the best individual maps for each landcover class based on the highest producer accuracy among different scenarios. Then to produce the final land cover map for all land cover classes, all individual maps were combined by using the consumer accuracy index. For this, we found the most accurate land cover class for each pixel based on the highest consumer accuracy across all individually produced maps in the first step. In the end, we evaluated the results by the validation dataset and using different confusion indices. The final high-resolution land cover map produced in this study showed us the combination of remote sensing and local field-based knowledge in cloud computing platforms like google earth engine (GEE) improves the mapping of different land cover classes across southwest Ethiopia.
Keywords: Land cover map; Sentinel-2; High resolution; Machine Learning; Google Earth Engine; Ethiopia
How to cite: Vahidi Mayamey, F., Ghajarnia, N., Aminjafari, S., Kalantari, Z., and Hylander, K.: Producing a High-Resolution Land Cover Map for Southwest Ethiopia Using Sentinel-2 Images and Google Earth Engine, EGU General Assembly 2022, Vienna, Austria, 23–27 May 2022, EGU22-592, https://doi.org/10.5194/egusphere-egu22-592, 2022.
EGU22-1004 | Presentations | NH6.1 | Highlight
Remote sensing big data characterization of tectonic and hydrological sources of ground deformation in CaliforniaXie Hu, Roland Bürgmann, and Xiaohua Xu
Although scientific advances have been achieved in every individual geoscience discipline, enabled by more extensive and accurate observations and more robust models, our knowledge of the Earth’s complexity remains limited. California represents an ideal natural laboratory that hosts active tectonics processes associated with the San Andreas fault system and hydrological processes dominated by the Central Valley, which contribute to dynamic surface deformation across the state. The spatiotemporal characteristics and three-dimensional patterns of the tectonic and hydrological sources of ground motions differ systematically. Spatially, interseismic creep is distributed along several strands of the San Andreas Fault (SAF) system. The elastic deformation off the locked faults usually spreads out over tens of kilometers in a long-wavelength pattern. Hydrologically driven displacements are distinct between water-bearing sedimentary basins and the bounding fault structures. Temporarily, both displacement sources involve long-term trends such as from interseismic creep and prolonged climate change. In addition, episodic signals are due to seismic and aseismic fault slip events, seasonal elastic surface and groundwater loading, and poroelastic groundwater volume strain. The orientation of tectonic strain accumulation in California mainly represents a northwest trending shear zone associated with the right-lateral strike-slip SAF system. Hydrological processes mainly deform the Earth vertically while horizontal motions concentrate along the aquifer margins.
We used the time-series ground displacements during 2015-2019 relying on four ascending tracks and five descending tracks of the ESA’s Sentinel-1 Interferometric Synthetic Aperture Radar (InSAR) observations. We considered the secular horizontal surface velocities and strain rates, constrained from GNSS measurements and tectonic models, as proxies for tectonic processes. InSAR time series and GNSS velocity maps benefit from the Southern California Earthquake Center (SCEC) Community Geodetic Model (CGM) developments. We further extracted the seasonal displacement amplitudes from InSAR-derived time-series displacements as proxies for hydrological processes. We synergized multidisciplinary remote sensing and auxiliary big data including ground deformation, sedimentary basins, precipitation, soil moisture, topography, and hydrocarbon production fields, using an ensemble, random forest machine learning algorithm. We succeeded in predicting 86%-95% of the representative data sets.
Interestingly, high strain rates along the SAF system mainly occur in areas with a low-to-moderate vegetation fraction, suggesting a correlation of rough/high-relief coastal range morphology and topography with the active faulting, seasonal and orographic rainfall, and vegetation growth. Linear discontinuities in the long-term, seasonal amplitude and phase of the surface displacement fields coincide with some fault strands, the boundary zone between the sediment-fill Central Valley and bedrock-dominated Sierra Nevada, and the margins of the inelastically deforming aquifer in the Central Valley, suggesting groundwater flow interruptions, contrasting elastic properties, and heterogeneous hydrological units.
How to cite: Hu, X., Bürgmann, R., and Xu, X.: Remote sensing big data characterization of tectonic and hydrological sources of ground deformation in California, EGU General Assembly 2022, Vienna, Austria, 23–27 May 2022, EGU22-1004, https://doi.org/10.5194/egusphere-egu22-1004, 2022.
EGU22-1082 | Presentations | NH6.1 | Highlight
Monitoring of rehabilitation of a raised bog in Ireland using a machine learning modelRicha Marwaha and Matthew Saunders
Peatlands cover ~3% of the global land area and are under threat from a land-use change such as drainage for peat extraction, and conversion to agriculture and commercial forestry. Historically, peatlands in Ireland have been used for industrial peat extraction and domestic turf cutting. One such example is Cavemount bog, County Offaly, Ireland a former raised bog where peat extraction started in the 1970s and ceased in 2015. After 2015, a programme of rehabilitation commenced by rewetting the site to raise water levels and to promote the establishment of wetland habitats. Some of the key species associated with the vegetation communities that have been developing across the site include Betula pubescens, Calluna vulgaris, Eriophorum angustifolium, Typha latifolia and Phragmites australis.
To monitor the progress of the colonisation of natural vegetation as part of the rehabilitation plan, reliable habitat maps are required. Google Earth Engine (GEE) is a cloud computing platform where satellite images can be processed to obtain cloud-free composite images. GEE was used to develop an automated approach to map the habitats at Cavemount using multispectral satellite imagery (Sentinel-2) and a machine-learning model i.e. random forest classifier. In this study 9 habitat classes were used which included bare peat, coniferous trees, heather, heather and scrub, open water, pioneer open cutaway habitats, scrub pioneer open cutaway habitats, wetland and mosaic of wetland and scrub. Cloud-free composites for the growing season (May to September) using satellite imagery from 2018-2021 were used to get spectral indices such as NDVI (normalised difference vegetation index), NDWI (normalised difference water index), mNDWI (modified normalised difference water index), red-edge vegetation index, EVI (enhanced vegetation index) and BSI (bare soil index). To extract open water, a seasonal composite of mNDWI was used which could differentiate water from bare peat. The seasonal composite of mNDWI was also used to monitor flooding over winter periods due to increased rainfall and was compared with summer conditions. These indices along with 10 spectral bands (10-20 m resolution) were used as an input to a random forest model, and a yearly habitat map from 2018 to 2021 was developed. The overall accuracy for the testing data from 2018, 2019, 2020 and 2021 was 87.42%, 86.81%, 87.16% and 87.50% and kappa coefficient was 0.81, 0.80, 0.81 and 0.81 respectively. Over time, the former peat extraction area showed a transformation from bare peat to a mosaic of wetland vegetation. This methodology will provide a useful tool for the long-term monitoring of the habitats at this site and to evaluate the effect of rehabilitation on the ecological composition of the site. The final habitat map will also be integrated with the eddy covariance data from the site to provide further insight into the carbon and greenhouse gas dynamics of each habitat in the future.
How to cite: Marwaha, R. and Saunders, M.: Monitoring of rehabilitation of a raised bog in Ireland using a machine learning model, EGU General Assembly 2022, Vienna, Austria, 23–27 May 2022, EGU22-1082, https://doi.org/10.5194/egusphere-egu22-1082, 2022.
EGU22-2114 | Presentations | NH6.1
Multi-annual InSAR solution of vertical land motion in 2021 lethal building collapse site in MiamiXiao Yu and Xie Hu
NOAA reported that the sea level has risen by 203-228 mm since 1880 and the rates accelerated to 3.556 mm/year during 2006-2015. Coastal regions, home to about half of the world’s population (~3 billion), are subject to erosion from wind and waves and subsidence from natural compaction and artificial explication of subsurface resources, and are at high risks of floods from accidental storms and inundations from prolonged sea level rise. The vertical land motion (VLM) directly determines the relative sea level rise. To be specific, locally upward VLM can help alleviate the risks while locally downward VLM may hasten the arrival of inundation. Therefore, monitoring coastal VLM is fundamental in coastal resilience and hazard mitigation.
One 12-floor building, Champlain Towers South, in the Miami suburb of Surfside collapsed catastrophically and claimed 98 lives on June 24th, 2021. No confident conclusion has been drawn on the cause of the collapse, but it might be related to multiple processes from the ground floor pool deck instability, concrete damage, and land subsidence.
Subsidence has been noted in populous Surfside since 1990s. However, we still lack a detailed mapping of the contemporary coastal subsidence. Here we focus on multi-source Synthetic Aperture Radar (SAR) datasets from C-band Sentinel-1 and X-band TerraSAR-X satellite imagery.
We use the time-series SAR interferometry of ascending Sentinel-1 path 48 to extract the VLM from 2015 to 2021. A comparatively stable GPS station ZMA1 obtained from the Nevada Geodetic Laboratory acts as the reference site to calibrate InSAR results. Long-wavelength atmospheric phase screen and orbit errors are approximated by the low-order polynomial fitting. The average subsidence rates derived from stacking can help reduce the temporarily high-frequency noise. A comparison with the GPS network solution can help verify InSAR measurements. Beyond that, we will also rely on high-resolution X-band TerraSAR-X data (Path 36, strip_014) to elaborate VLM details in the building clusters. Beyond that, NOAA reported that the relative sea level increase in Florida is 2.97 mm/year from 1931 to 2020, i.e., >0.3 m in one century. The 2019 Unified Sea Level Rise Projection in Southeast Florida predicted that the sea level in 2024 will rise by 254 to 432 mm in Florida compared to the level in 2000. We aim to extract the high-accuracy VLM to provide scientific evidence for more safe urban planning and effective adaptation strategies in coastal cities, for an ultimate goal of coastal resilience during global climate change.
How to cite: Yu, X. and Hu, X.: Multi-annual InSAR solution of vertical land motion in 2021 lethal building collapse site in Miami, EGU General Assembly 2022, Vienna, Austria, 23–27 May 2022, EGU22-2114, https://doi.org/10.5194/egusphere-egu22-2114, 2022.
EGU22-3291 | Presentations | NH6.1
Land subsidence in Liaohe River Delta, China due to oil and gas withdrawal, measured from multi-geometry InSAR dataWei Tang, Zhiqiang Gong, Jinbao Jiang, and Zhicai Li
Liaohe River Delta (LRD) is one of the major centers for hydrocarbon production, agriculture, and fisheries in Northeastern China. Liaohe Oilfield, located in the deltaic region, is China’s third-largest oilfield with an annual production capacity of 10 million tons of crude oil and 800 million m3 of natural gas. Since its operation in 1970, Liaohe Oilfield had produced more than 480 million tons of crude oil and 88 billion m3 of natural gas by the end of 2019.
Pore pressure drawdown due to oil/gas production has resulted in reservoir compaction and surface subsidence above the reservoir. This compaction and subsidence can cause significant damages to production and surface facilities. Main concerns are related to low-lying coastal areas in the context of eustatic sea-level rise (SLR), where land subsidence contributes to relative SLR and exacerbates flooding hazards. In addition, regional and local land subsidence have combined with global SLR to cause wetland loss in the LRD.
Our main aim in this study is to investigate time-dependent land subsidence induced by reservoir depletion in LRD, by analyzing Synthetic Aperture Radar (SAR) images from Sentinel-1 satellite. We retrieved vertical land subsidence and horizontal displacements through processing and merging multi-geometry images from two ascending and two descending tracks covering the area over the 2017 to 2021 time span. We observed significant local subsidence features in several active production oilfields, and the areal extent of subsidence is basically consistent with the spatial extent of production wells. The most prominent subsidence is occurring in the Shuguang oilfield. Due to reservoir depletion, it forms a land subsidence bowl in an elliptical shape with a major axis of ~6.3 km and a minor axis of ~3.2 km, and the maximum subsidence rate is exceeding 230 mm/yr. Because of the large depth D relative to the areal extent L, that is, a relatively small ratio L/D, the displacement field caused by oil production is three-dimensional. An inward, symmetrical, east-west horizontal movement was observed around the subsidence bowl in Shuguang oilfield, with an average eastward movement rate of ~40 mm/yr and an average westward rate of ~30 mm/yr. This three-dimensional deformation is well reproduced by a cylindrical reservoir compaction/subsidence model.
In September 2021, a storm surge accompanied by heavy rainfall caused water levels to rise by 50-130 cm in Liaodong Bay, resulting in extreme flooding in oilfields along the coast. The most severe flooding hazard was occurring in the Shuguang oilfield with the highest land subsidence rate. Our new InSAR-derived surface subsidence associated with the oilfield operations raises the question of the potential impact of land subsidence on the flood severity. This work highlights the importance of incorporating reservoir depletion-induced subsidence into flood management to ensure the security of the oil and gas industry along the coastal regions.
How to cite: Tang, W., Gong, Z., Jiang, J., and Li, Z.: Land subsidence in Liaohe River Delta, China due to oil and gas withdrawal, measured from multi-geometry InSAR data, EGU General Assembly 2022, Vienna, Austria, 23–27 May 2022, EGU22-3291, https://doi.org/10.5194/egusphere-egu22-3291, 2022.
EGU22-4618 | Presentations | NH6.1
Supervised LSTM Modelling for Classification of Sinkhole-related Anomalous InSAR Deformation Time SeriesAnurag Kulshrestha, Ling Chang, and Alfred Stein
Recently, we have shown that sinkholes can be characterized at an early stage by precursory deformation patterns from InSAR time series [1]. These patterns are often related to sudden changes in deformations or deformation velocities. With such a priori information, accurate deformation modelling and early detection of precursory patterns is feasible. It is still a challenge, however, to scale up methods for classifying larger numbers of sinkholes over large areas that may contain tens of thousands of InSAR observations. To address this, we explore the use of Long Short-Term Memory (LSTM) Networks to classify multi-temporal datasets by learning unique and distinguishable hidden patterns in the deformation time series samples.
We propose to design a two-layered Bi-directional LSTM model and use a supervised classifier to train the model for classifying sinkhole-related anomalous deformation patterns and non-anomalous deformation time series. Samples for linear, Heaviside, and Breakpoint deformation classes are extracted by applying Multiple Hypothesis Testing (MHT) [2] on deformation time series and are used to compile the training dataset. These samples are randomly divided into a training set and a testing set, and associated with a target label using one-hot encoding method. Hyperparameters of the model are tuned over a broad range of commonly used values. Using categorical cross-entropy as the loss function the model is optimized using the Adam optimizer.
We tested our method on an oil extraction field in Wink, Texas, USA, where sinkholes have been continuously evolving since 1980 and a recent sinkhole occurred in mid-2015. We used 52 Sentinel-1 SAR data acquired between 2015 and 2017. The results show that the supervised LSTM model classifies linear deformation samples with an accuracy of ~98%. The accuracy for classifying Heaviside and Breakpoint classes is ~75% at the most. Temporal periodicity was observed in the occurrence of anomalies, which may be related to the frequency of oil extraction and water injection events. Heaviside anomalies were observed to be clustered in space, with a higher density close to the sinkhole location. Breakpoint class anomalies were much more uniformly distributed. Close to the sinkhole spot, we found that two InSAR measurement points were classified into the Breakpoint class, and have considerable changes in deformation velocities (~60o velocity-change angle) shortly before the occurrence of this sinkhole. It is likely associated with the sinkhole-related precursory patterns. Through this study we conclude that our supervised LSTM is an effective classification method to identify anomalies in time. The classification map in terms of InSAR deformation temporal behavior can be used to identify areas which are vulnerable to sinkhole occurrence in the future and require further investigation. In the future, we plan to further develop methods to increase the classification accuracy of anomalous classes.
References:
[1] Anurag Kulshrestha, Ling Chang, and Alfred Stein. Sinkhole Scanner: A New Method to Detect Sinkhole-related Spatio-temporal Patterns in InSAR Deformation Time Series. Remote Sensing, 13(15), 2021.
[2] Ling Chang and Ramon F. Hanssen. A Probabilistic Approach for InSAR Time-Series Postprocessing. IEEE Transactions on Geoscience and Remote Sensing, 54(1):421–430, 2016.
How to cite: Kulshrestha, A., Chang, L., and Stein, A.: Supervised LSTM Modelling for Classification of Sinkhole-related Anomalous InSAR Deformation Time Series, EGU General Assembly 2022, Vienna, Austria, 23–27 May 2022, EGU22-4618, https://doi.org/10.5194/egusphere-egu22-4618, 2022.
EGU22-4800 | Presentations | NH6.1
A methodology for the analysis of InSAR Time Series for the detection of ground deformation eventsLaura Pedretti, Massimiliano Bordoni, Valerio Vivaldi, Silvia Figini, Matteo Parnigoni, Alessandra Grossi, Luca Lanteri, Mauro Tararbra, Nicoletta Negro, and Claudia Meisina
The availability of Sentinel-1 dataset with high-temporal resolution of measures (6-12 days) and long time period, can be considered as a “near-real-time monitoring” since it provides a sampling frequency enough to track the evolution of some ground deformations (e.g. landslides, subsidence) if compared to other sensors. However, the analysis and elaborations of such huge dataset, covering large areas, could be tricky and time-consuming without a first exploitation to identify areas of potential interest for significant ground deformations. The A-InSAR Time Series (TS) interpretation is advantageous to understand the relation between ground movement processes and triggering factors (snow, heavy rainfall), both in areas where it is possible to compare A-InSAR TS with in-situ monitoring instruments, and in areas where in situ instruments are scarce or absent. Exploiting the availability of Sentinel-1 data, this work aims to develop a new methodology ("ONtheMOVE" - InterpolatiON of SAR Time series for the dEtection of ground deforMatiOneVEnts) to classify the trend of TS (uncorrelated, linear, non-linear); to identify breaks in non-linear TS; to provide the descriptive parameters (beginning and end of the break, length in days, cumulative displacement, the average rate of displacement) to characterize the magnitude and timing of changes in ground motion. The methodology has been tested on two Sentinel-1 datasets available from 2014 to 2020 in Piemonte region, in northwestern Italy, an area prone to slow-moving slope instabilities. The methodology can be applied to any type of satellite datasets characterized by low or high-temporal resolution of measures, and it can be tested in any areas to identify any ground instability (slow-moving landslides, subsidence) at local or regional scale. The thresholds used for event detection should be calibrated according to geological and geomorphological processes and characteristics of a specific site or regional site. This innovative methodology provides a supporting and integrated tool with conventional methods for planning and management of the area, furnishing a further validation of the real kinematic behaviour of ground movement processes of each test-site and where it is necessary doing further investigation. In addition, elaboration applied to Sentinel-1 data is helpful both for back analysis and for near real-time monitoring of the territory as regards the characterization and mapping of the kinematics of the ground instabilities, the assessment of susceptibility, hazard and risk.
How to cite: Pedretti, L., Bordoni, M., Vivaldi, V., Figini, S., Parnigoni, M., Grossi, A., Lanteri, L., Tararbra, M., Negro, N., and Meisina, C.: A methodology for the analysis of InSAR Time Series for the detection of ground deformation events, EGU General Assembly 2022, Vienna, Austria, 23–27 May 2022, EGU22-4800, https://doi.org/10.5194/egusphere-egu22-4800, 2022.
EGU22-6822 | Presentations | NH6.1
Detecting China's urban built-up areas expansion over the last decade based on the deep learning through NPP-VIIRS imagesMaoyang Bai
Abstract: Accurate spatial extent changes in urban built-up areas are essential for detecting urbanization, analyzing the drivers of urban development and the impact of urbanization on the environment. In recent years, nighttime light images have been widely used for urban built-up areas extraction, but traditional extraction methods need to be improved in terms of accuracy and automation. In this experiment, a U-Net model was built and trained with the NPP-VIIRS and MOD13A1 data in 2020. We used the optimal tuning model to inverse the spatial extent of built-up areas in China from 2012 to 2021. Through this model, we analyzed the changing trend of built-up areas in China from 2012 to 2021. The results showed that U-Net outperformed random forest (RF) and support vector machine (SVM), with an overall model accuracy (OA) of 0.9969 and mIOU of 0.7342. Built-up areas growth rate is higher in the south and northwest, but the largest growth areas are still concentrated in the east and southeast, which is consistent with China's economic development and urbanization process. This experiment produced a method to extract China's urban built-up areas effectively and rapidly, which provides some reference value for China's urbanization.
How to cite: Bai, M.: Detecting China's urban built-up areas expansion over the last decade based on the deep learning through NPP-VIIRS images, EGU General Assembly 2022, Vienna, Austria, 23–27 May 2022, EGU22-6822, https://doi.org/10.5194/egusphere-egu22-6822, 2022.
EGU22-7215 | Presentations | NH6.1 | Highlight
Scalable Change Detection in Large Sentinel-2 data with SEVAMike Sips and Daniel Eggert
We present SEVA, a scalable exploration tool that supports users in detecting land-use changes in large optical remote sensing data. SEVA addresses three current scientific and technological challenges of detecting changes in large data sets: a) the automated extraction of relevant changes from many high-resolution optical satellite observations, b) the exploration of spatial and temporal dynamics of the extracted changes, c) interpretation of the extracted changes. To address these challenges, we developed a distributed change detection pipeline. The change detection pipeline consists of a data browser, extraction, error analysis, and interactive exploration component. The data browser supports users to assess the spatial and temporal distribution of available Sentinel-2 images for a region of interest. The extraction component extracts changes from Sentinel-2 images using the post-classification change detection (PCCD) method. The error assessment component supports users in interpreting the relevance of extracted changes with global and local error metrics. The interactive exploration component supports users in investigating the spatial and temporal dynamics of extracted changes. SEVA supports users through interactive visualization in all components of the change detection pipeline.
How to cite: Sips, M. and Eggert, D.: Scalable Change Detection in Large Sentinel-2 data with SEVA, EGU General Assembly 2022, Vienna, Austria, 23–27 May 2022, EGU22-7215, https://doi.org/10.5194/egusphere-egu22-7215, 2022.
EGU22-7236 | Presentations | NH6.1
Application of remote sensing big data in landslide identificationYuqi Song and Xie Hu
Landslides are general natural disasters in the world. Knowledge on the landslide distribution is fundamental for landslide monitoring, disaster mitigation and reduction. Traditional in-situ observations (e.g., leveling, GPS, extensometer, inclinometer) usually have high accuracy, but they are expensive and labor intensive and may also involve risks in the field. Alternatively, remote sensing data can capture the regional land surface features and thus are efficient in landslide mapping. Recent studies on landslide identification mainly rely on the pixel-based or object-oriented classification using optical images. Nonetheless, landslide activities are governed by multiple processes including the topography, geology, land cover, catchment, precipitation, and tectonics (e.g., dynamic shaking or aseismic creeping). Remote sensing data and products are beneficial to extract some of these critical parameters on a regional scale. Rapid development of machine learning algorithms makes it possible to systematically construct landslide inventory by interpreting multi-source remote sensing big data. The populous California suffers from high risks of landsliding. The United States Geological Survey (USGS) compiles the landslide inventory in the State and reports that California has about 86k landslides. Steep slope in the costal ranges, wet climate in the northern California, youthful materials at the surface from active tectonics of the San Andreas Fault and secondary fault systems, dynamic and aseismic movements instigated from the faults all contribute to high landslide susceptibility in California. In May 2017, the steep slopes at Mud Creek on California’s Big Sur coast collapsed catastrophically. During January and February in 2019, several landslides occurred on the southern part of Santa Monica Mountains. In January 2021, a large debris flow hit the Rat Creek in Big Sur due to extreme precipitation. In addition, a fairly complete collection of remote sensing data and products are available in California. Here we use machine learning methods to refine landslides in California using remote sensing big data, including elevation, slope, and aspect derived from SRTM digital elevation models (DEM), the normalized differential vegetation index (NDVI) derived from Landsat 8 OLI images, the hydrometeorological observations, the nearest distance to rivers and faults, the geological and land cover maps, as well as Synthetic Aperture Radar (SAR) images. We will use the archived landslide inventory for model training and testing. We plan to further explore the critical variables in determining landslide occurrences and the inferred triggering mechanisms.
How to cite: Song, Y. and Hu, X.: Application of remote sensing big data in landslide identification, EGU General Assembly 2022, Vienna, Austria, 23–27 May 2022, EGU22-7236, https://doi.org/10.5194/egusphere-egu22-7236, 2022.
Please decide on your access
Please use the buttons below to download the presentation materials or to visit the external website where the presentation is linked. Regarding the external link, please note that Copernicus Meetings cannot accept any liability for the content and the website you will visit.
Forward to presentation link
You are going to open an external link to the presentation as indicated by the authors. Copernicus Meetings cannot accept any liability for the content and the website you will visit.
We are sorry, but presentations are only available for users who registered for the conference. Thank you.
EGU22-7803 | Presentations | NH6.1
Detection of Volcanic Deformations in InSAR Velocity Maps - a contribution to TecVolSA projectTeo Beker, Homa Ansari, Sina Montazeri, and Qian Song
TecVolSA (Tectonics and Volcanoes in South America) is a project with a goal of developing intelligent Earth Observation (EO) data processing and exploitation for monitoring various geophysical processes in central south American Andes. Large amount of Sentinel-1 data over the period of about 5 years has been processed using mixed Permanent Scatterer and Distributed Scatterer (PS/DS) approaches. The received products are velocity maps with InSAR relative error in the order of 1 mm/yr on a large scale (>100km). The second milestone of the project was automatic extraction of information from the data. In this work, the focus is on detecting volcanic deformations. Since the real data prepared in such manner is limited, to train a deep learning model for detection of volcanic deformations, a synthetic training set is used. Models are trained from scratch and InceptionResNet v2 was selected for further experiments as it was found to give best performance among the tested models. The explainable AI (XAI) techniques were used to understand and analyze the confidence of the model and to understand how to improve it. The models trained on synthetic training set underperformed on real test set. Using GradCAM technique, it was identified that slope induced signal and salt lake deformations were mistakenly identified as volcanic deformations. These patterns are difficult to simulate and were not contained in synthetic training set. Bridging this distribution gap was performed using hybrid synthetic-real fine-tuning set, consisting of the real slope induced signal data and synthetic volcanic data. Additionally, false positive rate of the model is reduced using low-pass spatial filtering of the real test set, and finally by adjustments of the temporal baseline received from a sensitivity analysis. The model successfully detected all 10 deforming volcanoes in the region, ranging from 0.4 - 1.8 cm/yr in deformation.
How to cite: Beker, T., Ansari, H., Montazeri, S., and Song, Q.: Detection of Volcanic Deformations in InSAR Velocity Maps - a contribution to TecVolSA project, EGU General Assembly 2022, Vienna, Austria, 23–27 May 2022, EGU22-7803, https://doi.org/10.5194/egusphere-egu22-7803, 2022.
EGU22-8948 | Presentations | NH6.1 | Highlight
Decrease of anthropogenic emission from aviation and detection of natural hazards with potential application in geosciences using satellite sensors, ground-based networks and model forecasts in the context of the SACS/ALARM early warning systemHugues Brenot, Nicolas Theys, Erwin de Donder, Lieven Clarisse, Pierre de Buyl, Nicolas Clerbaux, Simone Dietmüller, Sigrun Matthes, Volker Grewe, Sandy Chkeir, Alessandra Mascitell, Aikaterini Anesiadou, Riccardo Biondi, Igor Mahorčič, Tatjana Bolić, Ritthik Bhattacharya, Tim Winter, Adam Durant, Michel Van Roozendael, and Manuel Soler
Aviation safety can be jeopardised by multiple hazards arising from natural phenomena, e.g., severe weather, aerosols/gases from natural hazard, space weather. Furthermore, there is the anthropogenic emissions and climate impact of aviation, that could be reduced. The use of satellite sensors, ground-based networks, and model forecasts is essential to detect and mitigate the risk of airborne hazards for aviation, as flying through them can have a strong impact on engines (abrasion and damages caused by aerosols) and on the health of passengers (e.g. due to associated hazardous trace gases).
The goal of this work is to give an overview of the alert data products in development in the ALARM SESAR H2020 Exploratory Research project. The overall objective of ALARM (multi-hAzard monitoring and earLy wARning system; https://alarm-project.eu) is to develop a prototype global multi-hazard monitoring and Early Warning System (EWS), building upon SACS (Support to Aviation Control Service; https://sacs.aeronomie.be). This work presents the creation of alert data products, which have a potential use in geosciences (e.g. meteorology, climatology, volcanology). These products include observational data, alert flagging and tailored information (e.g., height of hazard and contamination of flight level – FL). We provide information about the threat to aviation, but also notifications for geoscience applications. Three different manners are produced, i.e., early warning (with geolocation, level of severity, quantification, …), nowcasting (up to 2 hours), and forecasting (from 2 to 48 hours) of hazard evolution at different FLs. Note that nowcasting and forecasting concerns SO2 contamination at FL around selected airports and the risk of environmental hotspots. This study shows the detection of 4 types of risks and weather-related phenomena, for which our EWS generates homogenised NetCDF Alert Products (NCAP) data. The first type is the near real-time detection of recent volcanic plumes, smoke from wildfires, and desert dust clouds, and the interest of combining geostationary and polar orbiting satellite observations. For the second type, ALARM EWS uses satellite and ground-based (GB) observations, and model forecasts to create NCAP related to real-time space weather activity. Exploratory research is developed by ALARM partners to improve detection of a third type of risk, i.e., the initiation of small-scale deep convection (under 2 km) around airports. GNSS data (ground-based networks and radio-occultations), lightning and radar data, are used to implement NCAP data (designed with the objective of bringing relevant information for improving nowcasts around airports). The fourth type is related to the detection of environmental hotspots, which describe regions that are strongly sensitive to aviation emissions. ALARM partners investigate the climate impact of aviation emissions with respect to the actual atmospheric synoptical condition, by relying on algorithmic Climate Change Functions (a-CCFs). These a-CCFs describe the climate impact of individual non-CO2 forcing compounds (contrails, nitrogen oxide and water vapour) as function of time, geographical location and cruise altitude.
Acknowledgements:
ALARM has received funding from the SESAR Joint Undertaking (JU) under grant agreement No 891467. The JU receives support from the European Union’s Horizon 2020 research and innovation programme and the SESAR JU members other than the Union.
How to cite: Brenot, H., Theys, N., de Donder, E., Clarisse, L., de Buyl, P., Clerbaux, N., Dietmüller, S., Matthes, S., Grewe, V., Chkeir, S., Mascitell, A., Anesiadou, A., Biondi, R., Mahorčič, I., Bolić, T., Bhattacharya, R., Winter, T., Durant, A., Van Roozendael, M., and Soler, M.: Decrease of anthropogenic emission from aviation and detection of natural hazards with potential application in geosciences using satellite sensors, ground-based networks and model forecasts in the context of the SACS/ALARM early warning system, EGU General Assembly 2022, Vienna, Austria, 23–27 May 2022, EGU22-8948, https://doi.org/10.5194/egusphere-egu22-8948, 2022.
Please decide on your access
Please use the buttons below to download the presentation materials or to visit the external website where the presentation is linked. Regarding the external link, please note that Copernicus Meetings cannot accept any liability for the content and the website you will visit.
Forward to presentation link
You are going to open an external link to the presentation as indicated by the authors. Copernicus Meetings cannot accept any liability for the content and the website you will visit.
We are sorry, but presentations are only available for users who registered for the conference. Thank you.
EGU22-10041 | Presentations | NH6.1 | Highlight
Monitoring anthropogenic pollution in the Russian sub-Arctic with high resolution satellite imagery: An oil spill case studyGraham Sadler and Gareth Rees
The Arctic region is a very remote and vulnerable ecosystem but also rich in natural resources, which have been exploited for many decades. These ecosystems are particularly vulnerable to any industrial accident. The Arctic has short summers, low temperatures, and limited sunlight, so it can take decades for Arctic ecosystems to recover from anthropogenic pollution. Examples of the potential hazards when exploiting natural resources in such fragile environments and the detrimental impact on the polar ecosystem and communities are all too frequent. In the case of the oil and gas industry, spills caused by the failure of old pipelines are a very regular occurrence. Given the geographical isolation of these activities, remote sensing is an obvious technology to underpin any effective monitoring solution. Increasing availability in the public domain, together with recent advances in resolution, suggest satellite imagery can play a key role in effectively monitoring oil spills and is the focus for this study.
The remote sensing of polar regions and the detection of terrestrial oil spills have both been studied previously, however, there has been little work to investigate the two in combination. The challenge is how to detect an oil spill if it is from an unknown incident or illegal activity such as discharge. Oil spill detection by applying image processing techniques to Earth Observation (EO) data has historically focused on marine pollution. Satellite-based Synthetic Aperture Radar (SAR), with its day/night and all-weather capability and wide coverage, has proven to be effective. Oil spill detection with remote sensing in terrestrial environments has received less attention due to the typically smaller regional scale of terrestrial oil spill contamination together with the overlapping spectral signatures of the impacted vegetation and soils. SAR has not proven to be very effective onshore because of the false positives and consequent ambiguities associated with interpretation, reflecting the complexity of land cover.
A number of studies have highlighted the potential of airborne hyperspectral sensors for oil spill detection either through the identification of vegetation stress or directly on bare sites, with absorption bands identified in the short-wave infrared (SWIR) range at 1730 and 2300nm. However, unlike spaceborne sensors, these devices do not provide regular coverage over broad areas. Several hyperspectral satellites have been launched to date but have technical constraints. The medium spatial resolution and long revisit times of most current hyperspectral instruments limit their use for identifying smaller incidents that often occur with high unpredictability.
No single sensor currently has all the characteristics required to detect the extent, impact and recovery from onshore oil spills. This study will look at the potential of combining medium spatial resolution imagery (Sentinel-2) for initial screening, with high spatial/temporal (WorldView-3) and high spectral (PRISMA) resolution data, both covering the key SWIR bands, for site specific analysis.
How to cite: Sadler, G. and Rees, G.: Monitoring anthropogenic pollution in the Russian sub-Arctic with high resolution satellite imagery: An oil spill case study, EGU General Assembly 2022, Vienna, Austria, 23–27 May 2022, EGU22-10041, https://doi.org/10.5194/egusphere-egu22-10041, 2022.
EGU22-10256 | Presentations | NH6.1
Automatic Interferogram Selection for SBAS-InSAR Based on Deep Convolutional Neural NetworksYufang He, Guangzong Zhang, Hermann Kaufmann, and Guochang Xu
The small baseline subset of spaceborne interferometric synthetic aperture radar (SBAS-InSAR) technology has become a classical method for monitoring slow deformations through time series analysis with an accuracy in the centimeter or even millimeter range. Additionally, the process of calculating interferograms itself directly affects the accuracy of the SBAS-InSAR measurements, whereby the selection of high-quality interferogram pairs is crucial for SBAS data processing. Especially in the era of big data, the demand for an automatic and effective selection method of high-quality interferograms in SBAS-InSAR technology is growing. However, there are some methods including simulated annealing (SA) searching strategy, the graph theory (GT) and others. Until now, the most effective approach of high-quality interferogram selection still relies on the traditional manual method. Due to the high degree of human interaction and a large risk of repetitive work, this traditional manual method increases the instability and inconsistency of the deformation calculation.
Considering that the different qualities of interference pairs show different color characteristics, the DCNN method is adopted in this study. The ResNet50 model (one of DCNN models) has the advantages of representing a standard network structure and easy programming. The idea is based on the fact that interferograms less contaminated by different noise sources display smaller color phase changes within a certain phase range. Hence, training sets containing almost 3000 interferograms obtained from land subsidences in several subregions of Shenzhen in China with varying contaminations of noise were established. Up next, the ResNet50–DCNN model was set up, the respective parameters were determined through analysis of the data sets trained, and traditional interferogram selection methods were used to evaluate the performance. For simulation experiments and the evaluation and validation of real data, phase unwrapping interferograms obtained by the time-spatial baseline threshold method are used to classify high and low quality interferograms based on the ResNet50 model. The quantity of high quality interferograms extracted by the ResNet50–DCNN method is above 90% for the simulation experiment and above 87% concerning the real data experiment, which reflects the accuracy and reliability of the proposed method. A comparison of the overall surface subsidence rates and the deformation information of local PS points reveals little difference between the land subsidence rates obtained by the ResNet50–DCNN method and the actual simulations or the manual method.
The proposed advanced method provides an automatized and fast interferogram selection process for high quality data, which contributes significantly to the application of SBAS-InSAR engineering. For future research, we will expand the training samples and study DCNN models to further improve the general accuracy for a wider applicability of this method.
How to cite: He, Y., Zhang, G., Kaufmann, H., and Xu, G.: Automatic Interferogram Selection for SBAS-InSAR Based on Deep Convolutional Neural Networks, EGU General Assembly 2022, Vienna, Austria, 23–27 May 2022, EGU22-10256, https://doi.org/10.5194/egusphere-egu22-10256, 2022.
EGU22-10630 | Presentations | NH6.1
Detection of forest stress from European spruce bark beetle attack in Northern Italy through a stress classification algorithm based on NDVI temporal changesMatteo Giomo, Johnny Moretto, and Luciano Fantinato
The European spruce bark beetle (Ips typographus) is one of the most detrimental insects of the European spruce forests. An effective mitigation measure consists in the removal of infected trees before the beetles leave the bark, which generally happens before the end of June. To minimize economic loss and prevent tree destruction, fast and early detection of European spruce bark beetle is therefore crucial for the future of spruce forests.
In order to detect the forest stressed regions, possibly associated to the beetle infestation, we investigated the forest vigour changes in time. One of the most damaged regions is Northern Italy in which the beetle diffusion has highly increased after the Storm Adrian of late 2018.
In this work we used Sentinel-2 images of a study area in the mountain territory of Val di Fiemme (Trento, Italy) from early 2017 to late 2021. A preliminary field investigation was necessary to localize healthy (green) and stressed (red) trees. NDVI index trends from Sentinel-2 showed an evident vigour discrepancy from green and red regions.
We therefore conceive a classification algorithm based on the slope of fitting lines of NDVI over time. Model accuracy is around 86%. The result is a classified map useful to distinguish stressed and healthy forest areas.
By using the proposed method and Google Earth Engine computational capabilities, we highlight the potential of a simple and effective model to predict and detect forest stressed areas, potentially associated with the diffusion of the European spruce bark beetle.
How to cite: Giomo, M., Moretto, J., and Fantinato, L.: Detection of forest stress from European spruce bark beetle attack in Northern Italy through a stress classification algorithm based on NDVI temporal changes, EGU General Assembly 2022, Vienna, Austria, 23–27 May 2022, EGU22-10630, https://doi.org/10.5194/egusphere-egu22-10630, 2022.
EGU22-10780 | Presentations | NH6.1
Morphometric analysis of volcanic structures using digital elevation models and models developed from radar images in the Apan volcanic field, México.Jesús Octavio Ruiz Sánchez, Jesús Eduardo Méndez Serrano, Mariana Patricia Jácome Páz, Nelly Ramírez Serrato, and Nestor López Váldes
The present project aims to make a preliminary assessment of the volcanic risk represented by the Apan Volcanic Field (CVA). The methodology was divided into two parts. In the first, Digital Elevation Models (DEM) published by official sources were used to identify unreported structures and perform morphometric analysis of previously dated structures. In the second stage, a new DEM was developed from interferometric methodologies to compare the results with those obtained from official sources. Two SAR satellite images from the SENTINEL-1 satellite of ESA's Copernicus program were used. Being the first of October 14, 2021, leader image, and the second of October 26, 2021, slave image. These images were processed in ESA's SNAP software. For the morphometric analysis, volcanic structures have been classified into three major categories: Young cones (0.18 Ma - 0.5 Ma), Intermediate cones (0.5 Ma-1 Ma), and Old cones (1 Ma-3 Ma). From the official DEM analysis, 243 volcanic structures were reported within the study area with a preliminary predominance of structures that fall in the range of old cones, 4 areas with a higher concentration of volcanic structures were detected in which some highly populated localities are found. In addition, demographic parameters were used for a better preliminary risk assessment in the study area. Official and Radar images DEMs were used for the morphometric analysis and the results were compared with the previously published models. Finally, it was concluded the importance of the CVA by comparison with other two Mexican volcanic fields CVA represents a moderate volcanic risk, for which a greater number of studies and monitoring in the area is recommended. This project provides a new understanding of the volcanic hazard and risk associated with the CVA and the development of the surrounding social environment.
How to cite: Ruiz Sánchez, J. O., Méndez Serrano, J. E., Jácome Páz, M. P., Ramírez Serrato, N., and López Váldes, N.: Morphometric analysis of volcanic structures using digital elevation models and models developed from radar images in the Apan volcanic field, México., EGU General Assembly 2022, Vienna, Austria, 23–27 May 2022, EGU22-10780, https://doi.org/10.5194/egusphere-egu22-10780, 2022.
EGU22-10962 | Presentations | NH6.1
Application of a semi-automatic tool for field variability assessment on a cultivated field in Northern Italy to evaluate variable fertilization benefitsJohnny Moretto, Matteo Giomo, Luciano Fantinato, and Roberto Rasera
Traditional fertilization techniques in crop production consist in a homogeneous distribution of inputs all over the cultivated field. Alternatively variable fertilization methods could minimize the environmental impact and increase economic benefits.
The objective of this study is to evaluate the capabilities of a Google Earth Engine code conceived to rapidly study the variability of cultivated fields, for a possible variable fertilization. The tool is semi-automatic as it requires just the field boundary and it gives few outputs ready to be inspected by the user. This work presents an application of this model in a corn field in Northern Italy (province of Venice).
Field variability is evaluated through NDVI index extracted from Sentinel-2 images from 2017 to 2021. For the purpose, the tool provides NDVI statistics, classified maps, classified area percentages, and punctual NDVI trends.
Results show that boundary regions of the field are systematically less vigour than other parts, thus crop production is not efficient. Otherwise, fertilization should be enhanced in internal parts, as they are steadily healthier.
The proposed model is a fast way to analyse field vigour status and Google Earth Engine capabilities permit to apply it nearly all over the world. Field variability and linked variable fertilization are crucial to reduce environmental and increase economic benefits, especially in extensive farming.
How to cite: Moretto, J., Giomo, M., Fantinato, L., and Rasera, R.: Application of a semi-automatic tool for field variability assessment on a cultivated field in Northern Italy to evaluate variable fertilization benefits, EGU General Assembly 2022, Vienna, Austria, 23–27 May 2022, EGU22-10962, https://doi.org/10.5194/egusphere-egu22-10962, 2022.
EGU22-11589 | Presentations | NH6.1
New advances of the P-SBAS based automatic and unsupervised tool for the co-seismic Sentinel-1 DInSAR products generationFernando Monterroso, Andrea Antonioli, Simone Atzori, Claudio De Luca, Riccardo Lanari, Michele Manunta, Emanuela Valerio, and Francesco Casu
Differential Synthetic Aperture Radar Interferometry (DInSAR) is a key method to estimate, with centimeter accuracy, the earth surface displacements caused by natural events or anthropogenic activities. Furthermore, since 2014 the scientific community can benefit from the huge spaceborne SAR data archives acquired by the Copernicus Sentinel-1 (S1) satellite constellation, which operationally provides SAR data with a free and open data access policy at nearly global scale. By using the S1 acquisitions, an automatic and unsupervised processing tool that generates co-seismic interferograms and LOS displacement maps has been developed. This tool routinely queries two different earthquake catalogs (USGS and INGV) to trigger, in automatic way, the S1 data download and the DInSAR processing through the Parallel Small BAseline Subsets (P-SBAS) algorithm. In particular, in order to guide the algorithm to only intercept the earthquakes which may produce ground displacements detectable through the DInSAR technology, the tool starts the SAR data processing for those events with a magnitude greater than 4.0 in Europe, and greater than 5.5 at a global scale.
We first remark that, in order to optimize the extension of the investigated area, thus reducing the processing time and effectively exploiting the available computing resources, an algorithm for the estimation of the co-seismically affected area has been integrated as first step of the workflow. More specifically, by considering the moment tensors provided by public catalogs (USGS, INGV, Global CMT project), a forward modelling procedure generates the predicted co-seismic displacement field, used by the P-SBAS algorithm to optimize some of the DInSAR processing steps. In particular, the phase unwrapping (PhU) algorithm is applied only to the part of the DInSAR interferograms delimited by the area identified through the predicted scenario and not to the whole S1 scene. In addition, the presented automatic and unsupervised tool has been migrated within a Cloud Computing (CC) environment, specifically the Amazon Web Service (AWS). This strategy allows us a more efficient management of the needed computing resources also in emergency scenario.
The adopted solutions allowed the creation of a worldwide co-seismic maps database. Indeed, by benefiting of the last seven years of Sentinel-1 operation, the tool has generated approximately 6500 interferograms and LOS displacement maps, corresponding to a total of 383 investigated earthquakes.
Note also that the generated interferograms and displacement maps have been made available for the scientific community through the EPOS infrastructure and the Geohazards Exploitation Platform, thus helping scientists and researchers to investigate the dynamics of surface deformation in the seismic zones around the Earth also in the case they have not available specific DInSAR processing capabilities and/or skills.
How to cite: Monterroso, F., Antonioli, A., Atzori, S., De Luca, C., Lanari, R., Manunta, M., Valerio, E., and Casu, F.: New advances of the P-SBAS based automatic and unsupervised tool for the co-seismic Sentinel-1 DInSAR products generation, EGU General Assembly 2022, Vienna, Austria, 23–27 May 2022, EGU22-11589, https://doi.org/10.5194/egusphere-egu22-11589, 2022.
EGU22-11701 | Presentations | NH6.1
Comparative analysis of the role of labelled benchmark datasets for automatic flood mapping using SAR dataDibakar Kamalini Ritushree, Mahdi Motagh, Shagun Garg, and Binayak Ghosh
The current scenario of the world has witnessed extreme events of floods irrespective of the heterogeneity in the geographical context. The necessity for accurately mapping such events is more of the essence for disaster relief and recovery efforts. The role of satellite imageries from both optical and radar sensors could have immensely benefited the process due to its easier interpretability and high resolution. However, the use of optical sensors for flood extent extraction is limited by weather conditions and the presence of clouds. In contrast, SAR sensors have proved to be one of the most powerful tools for flood monitoring due to their potential to observe in all-weather/day-night conditions. The exploitation of SAR in conjunction with optical datasets has shown exemplary results in flood monitoring applications.
With the onset of deep learning and big data, the application of data driven approaches on training models has shown great potential in automatic flood mapping. In order to improve the efficiency of deep learning algorithms at a global scale, publicly available labelled benchmark datasets have been introduced. One of such datasets is Sen1Floods11, that includes raw Sentinel-1 imagery and classified permanent water and flood water, covering 11 flood events. The flood events had coverage from Sentinel-1 and Sentinel-2 imagery on the same day or within 2 days of the Sentinel-1 image from Aug’2016 to May’2019. The other one is WorldFloods that consists of Sentinel-2 data acquired during 119 flood events from Nov’2015 to March’2019. In this study, we make a comparative analysis to investigate the efficiency of these labelled benchmark datasets for automatic flood mapping using SAR data. Various types of flooding in different geographic locations in Europe, Australia, India and Iran are selected and the segmentation networks are evaluated on existing Sentinel-1 images covering these events.
How to cite: Ritushree, D. K., Motagh, M., Garg, S., and Ghosh, B.: Comparative analysis of the role of labelled benchmark datasets for automatic flood mapping using SAR data, EGU General Assembly 2022, Vienna, Austria, 23–27 May 2022, EGU22-11701, https://doi.org/10.5194/egusphere-egu22-11701, 2022.
EGU22-12127 | Presentations | NH6.1
Methodologies for surface deformations analysis at regional scaleMicol Fumagalli, Alberto Previati, Serena Rigamonti, Paolo Frattini, and Giovanni B. Crosta
Analysis of ground deformation is particularly demanding when displacement rates are in the range of some mm/y. This study integrates different statistical techniques to unravel the spatial and temporal patterns of vertical ground deformation in an alluvial basin. Beyond the identification of critical areas, this is also essential to delineate a conceptual model for the uplift and subsidence mechanisms in complex environments such as a layered aquifer suffering strong piezometric oscillations and land use changes due to human activities.
The study area covers about 4000 km2 in the Lombardy region (N Italy) and includes the Milan metropolitan area and a part of the Po alluvial plain between the Como and Varese lakes. In this study, Sentinel-1A (C-band) PS-InSAR data with an average revisiting time 6 days and an average PS distance of 20 m, processed by TRE-Altamira, were analysed to investigate different movement styles in the study area.
The PS-InSAR data ranges from 2015 to 2020 and reveal a wide gently subsiding area oriented in NW-SE direction (average subsiding rate of nearly -1.5 mm/yr along the line of sight). Principal Component Analysis (PCA) and Independent Component Analysis (ICA) were applied on ground deformation and piezometric time series, showing analogue spatial patterns of the fluctuation styles. Then, from the correlations between the spatial patterns of ground motion, groundwater level changes and geological data, and between the temporal patterns of rainfall and groundwater abstraction rates, the main causes of ground motion were identified and summarized in a conceptual model.
Finally, after reconstructing the aquifer composition and the geo-hydro-mechanical properties, and by implementing the hydraulic stresses from the conceptual model, a hydro-mechanical coupled FEM numerical model was developed. This allowed verifying the hypotheses through the comparison between the simulated ground displacement and the measured one.
How to cite: Fumagalli, M., Previati, A., Rigamonti, S., Frattini, P., and Crosta, G. B.: Methodologies for surface deformations analysis at regional scale, EGU General Assembly 2022, Vienna, Austria, 23–27 May 2022, EGU22-12127, https://doi.org/10.5194/egusphere-egu22-12127, 2022.
Please decide on your access
Please use the buttons below to download the presentation materials or to visit the external website where the presentation is linked. Regarding the external link, please note that Copernicus Meetings cannot accept any liability for the content and the website you will visit.
Forward to presentation link
You are going to open an external link to the presentation as indicated by the authors. Copernicus Meetings cannot accept any liability for the content and the website you will visit.
We are sorry, but presentations are only available for users who registered for the conference. Thank you.

EGU22-12269 | Presentations | NH6.1 | Highlight
Time series analysis using global satellite remote sensing data archives for multi-temporal characterization of hazardous surface processesSigrid Roessner, Robert Behling, Mahmud Haghshenas Haghighi, and Magdalena Vassileva
The Earth’s surface hosts a large variety of human habitats being subject to the simultaneous influence of a wide range of dynamic processes. The resulting dynamics are mainly driven by a complex interplay between geodynamic and hydrometeorological factors in combination with manifold human-induced land use changes and related impacts. The resulting effects on the Earth’s surface pose major threats to the population in these areas, especially under the conditions of increasing population pressure and further exploitation of new and remote regions accompanied by ongoing climate changes. This situation leads to significant changes in the type and dimension of natural hazards that have not yet been observed in the past in many of the affected regions.
This situation has been leading to an increasing demand for systematic and regular large area process monitoring which cannot be achieved by ground based observations alone. In this context, the potential of satellite remote sensing has already been investigated for a longer period of time as an approach for assessing dynamic processes on the Earth’s surface for large areas at different spatial and temporal scales. However, until recently these attempts have been largely hampered by the limited availability of suitable satellite remote sensing data at a global scale. During the last years new globally available satellite remote sensing data sources of high spatial and temporal resolution (e.g., Sentinels and Planet) have been increasing this potential to a large extent.
During the last decade, we have been pursuing extensive methodological developments in remote sensing based time series analysis including optical and radar observations with the goal of performing large area and at the same time detailed spatiotemporal analysis of natural hazard prone regions affected by a variety of processes, such as landslides, floods and subsidence. Our methodological developments include among others large-area automated post-failure landslide detection and mapping as well as assessment of the kinematics of pre- and post-failure slope deformation. Our combined optical and radar remote sensing approaches aim at an improved understanding of spatiotemporal dynamics and complexities related to the evolution of these hazardous processes at different spatial and temporal scales. We have been developing and applying our methods in a large variety of natural and societal contexts focusing on Central Asia, China and Germany.
We will present selected methodological approaches and results for a variety of hazardous surfaces processes investigated by satellite remote sensing based time series analysis. In this we will focus on the potential of our approaches for supporting the needs and requirements imposed by the disaster management cycle representing a widely used conceptual approach for disaster risk reduction and management including, rapid response, long-term preparedness and early warning.
How to cite: Roessner, S., Behling, R., Haghshenas Haghighi, M., and Vassileva, M.: Time series analysis using global satellite remote sensing data archives for multi-temporal characterization of hazardous surface processes, EGU General Assembly 2022, Vienna, Austria, 23–27 May 2022, EGU22-12269, https://doi.org/10.5194/egusphere-egu22-12269, 2022.
EGU22-12271 | Presentations | NH6.1 | Highlight
Deep learning, remote sensing and visual analytics to support automatic flood detectionBinayak Ghosh, Shagun Garg, Mahdi Motagh, Daniel Eggert, Mike Sips, Sandro Martinis, and Simon Plank
Floods can have devastating consequences on people, infrastructure, and the ecosystem. Satellite imagery has proven to be an efficient instrument in supporting disaster management authorities during flood events. In contrast to optical remote sensing technology, Synthetic Aperture Radar (SAR) can penetrate clouds, and authorities can use SAR images even during cloudy circumstances. A challenge with SAR is the accurate classification and segmentation of flooded areas from SAR imagery. Recent advancements in deep learning algorithms have demonstrated the potential of deep learning for image segmentation demonstrated. Our research adopted deep learning algorithms to classify and segment flooded areas in SAR imagery. We used UNet and Feature Pyramid Network (FPN), both based on EfficientNet-B7 implementation, to detect flooded areas in SAR imaginary of Nebraska, North Alabama, Bangladesh, Red River North, and Florence. We evaluated both deep learning methods' predictive accuracy and will present the evaluation results at the conference. In the next step of our research, we develop an XAI toolbox to support the interpretation of detected flooded areas and algorithmic decisions of the deep learning methods through interactive visualizations.
How to cite: Ghosh, B., Garg, S., Motagh, M., Eggert, D., Sips, M., Martinis, S., and Plank, S.: Deep learning, remote sensing and visual analytics to support automatic flood detection, EGU General Assembly 2022, Vienna, Austria, 23–27 May 2022, EGU22-12271, https://doi.org/10.5194/egusphere-egu22-12271, 2022.
EGU22-12507 | Presentations | NH6.1
Spatio-temporal analysis of surface displacements in N’Djamena, Chad derived by Persistent Scatter-Interferometric Synthetic Aperture Radar (PS-InSAR) and Small BAseline Subset (SBAS) techniquesMichelle Rygus, Giulia Tessari, Francesco Holecz, Marie-Louise Vogt, Djoret Daïra, Elisa Destro, Moussa Isseini, Giaime Origgi, Calvin Ndjoh Messina, and Claudia Meisina
High-resolution characterisation of land deformation and its spatio-temporal response to external triggering mechanisms is an important step towards improving geological hazard forecasting and management. The work presented here is part of the ResEau-Tchad project (www.reseau-tchad.org), with a focus on the city of N’Djamena. The extraction of groundwater to sustain this rapidly growing capital city has increased the pressure on water supply and urban sanitation infrastructures which are failing to meet the current water demand. In this study we exploit Synthetic-Aperture Radar (SAR) data acquired by the Sentinel-1 satellite to investigate the temporal variability and spatial extent of land deformation to assist in the development of a sustainable water management program in N’Djamena city.
The objectives of the work are: 1) to analyse the recent evolution of land deformation using two multi-temporal differential interferometry techniques, SBAS and PS-InSAR; and, 2) to investigate the land deformation mechanism in order to identify the factors triggering surface movements. The PS-InSAR and SBAS techniques are implemented on SAR images obtained in both ascending and descending orbits from April 2015 to May 2021 to generate high resolution deformation measurements representing the total displacement observed at the surface. While the pattern of displacement indicated by the two datasets is similar, the average velocity values obtained with PS-InSAR tend to be noisier than the ones derived using the SBAS technique, particularly when the SBAS time-series shows non-linear deformation trends.
Characterisation of the subsidence areas by means of statistical analyses are implemented to reveal the surface deformation patterns which are related to different geo-mechanical processes. The integration of the spatio-temporal distribution of PS and SBAS InSAR results with geological, hydrological, and hydrogeological data, along with subsurface lithological modelling shows a relationship between vertical displacements, clay sediments, and surface water accumulation. These areas are located mostly in the surroundings of the urban area. The city centre is observed to be mostly stable, which might be the result of the removal of the surface water through the city drainage system. Investigation of the relationship between vertical displacements and seasonal groundwater fluctuations or effects due to the groundwater withdrawal is limited due to the temporally sparse piezometric dataset; however, the recent deformation rates appear to be correlated with the groundwater level trend at some locations.
How to cite: Rygus, M., Tessari, G., Holecz, F., Vogt, M.-L., Daïra, D., Destro, E., Isseini, M., Origgi, G., Ndjoh Messina, C., and Meisina, C.: Spatio-temporal analysis of surface displacements in N’Djamena, Chad derived by Persistent Scatter-Interferometric Synthetic Aperture Radar (PS-InSAR) and Small BAseline Subset (SBAS) techniques, EGU General Assembly 2022, Vienna, Austria, 23–27 May 2022, EGU22-12507, https://doi.org/10.5194/egusphere-egu22-12507, 2022.
EGU22-12552 | Presentations | NH6.1
Assessment of global burned area satellite products in the African savannahManuel Arbelo, Jose Rafael García-Lázaro, and Jose Andres Moreno-Ruiz
Africa is the continent with the highest annual burned area, with the African savanna being the most affected ecosystem. This paper presents an assessment of the spatio-temporal accuracy of three of the main global-scale burned area products derived from images from polar-orbiting satellite-borne sensors: 1) Fire_CCI 5. 1, of 250 m spatial resolution, developed by the European Space Agency (ESA) and led by the University of Alcalá de Henares; 2) MCD64A1 C6, of 500 m spatial resolution, developed by the University of Maryland; and 3) GABAM (Global Annual Burned Area Map), of 30 m spatial resolution, developed through the Google Earth Engine (GEE) platform by researchers from the Aerospace Information Research Institute of China. The first two products are based on daily images from the MODIS (Moderate-Resolution Imaging Spectroradiometer) sensor onboard NASA's Terra and Aqua satellites, and the third is based on Landsat images available on GEE. The almost total absence of reference burned area data from official sources has made it difficult to assess the spatio-temporal accuracy of these burned area products in Africa. However, the recent creation of the Burned Area Reference Database (BARD), which includes reference datasets from different international projects, opens the possibility for a more detailed assessment. The study focused on a region covering an area of approximately 29.5 million ha located in the southern hemisphere between 10oS and 15oS and bounded longitudinally by the 35oE and 40oE meridians. The results show that the Fire_CCI 5.1, MCD64A1 C6 and GABAM products present an annual distribution of burned area with an irregular pattern in the interval between 7 and 10 million ha per year (around 30% of the whole study area), but there is hardly any correlation between their time series, with correlation coefficients lower than 0.3 for the period 2000-2019. The spatio-temporal accuracy analysis was performed for 2005, 2010 and 2016, the only years for which BARD has reference perimeters. The results are highly variable, with values between 1 and 20 million ha per year depending on the product, the year and the reference set used, which does not allow definitive conclusions to be drawn on the accuracy of the burned area estimates. These results indicate that uncertainties persist both in the burned area estimates derived from remote sensing products in these regions and in the reference sets used for their evaluation, which require further research effort.
How to cite: Arbelo, M., García-Lázaro, J. R., and Moreno-Ruiz, J. A.: Assessment of global burned area satellite products in the African savannah, EGU General Assembly 2022, Vienna, Austria, 23–27 May 2022, EGU22-12552, https://doi.org/10.5194/egusphere-egu22-12552, 2022.
EGU22-12575 | Presentations | NH6.1
Removing Stripe Noise from Satellite Images using Convolutional Neural Networks in Frequency DomainMoien Rangzan and Sara Attarchi
Many satellite images are corrupted by stripping; this noise degrades the visual quality of the images and inevitably introduces errors in processing. Thermal and hyperspectral images often suffer from stripping. The frequency distribution characteristic of stripe noise makes it difficult to remove such noise in the spatial domain; contrariwise, this noise can be efficiently detected in the frequency domain. Numerous solutions have been proposed to eliminate such noise using Fourier transform; however, most are subjective and time-consuming approaches.
The lack of a fast and automated tool in this subject has motivated us to introduce a Convolutional Neural Network-based tool that uses the U-Net architecture in the frequency domain to suppress the anomalies caused by stripe noise. We added synthetic noise to satellite images to train the model. Then, we taught the network how to mask these anomalies in the frequency domain. The input image dataset was down-sampled to a size of 128 x128 pixels for a fast training time. However, our results suggest that the output mask can be up-scaled and applied on the original Fourier transform of the image and still achieve satisfying results; this means that the proposed algorithm is applicable on images regardless of their size.
After the training step, the U-Net architecture can confidently find the anomalies and create an acceptable bounding mask; the results show that - with enough training data- the proposed procedure can efficiently remove stripe noise from all sorts of images. At this stage, we are trying to further develop the model to detect and suppress more complex synthetic noise. Next, we will focus on removing real stripe noise on satellite images to present a robust tool.
How to cite: Rangzan, M. and Attarchi, S.: Removing Stripe Noise from Satellite Images using Convolutional Neural Networks in Frequency Domain, EGU General Assembly 2022, Vienna, Austria, 23–27 May 2022, EGU22-12575, https://doi.org/10.5194/egusphere-egu22-12575, 2022.
Please decide on your access
Please use the buttons below to download the presentation materials or to visit the external website where the presentation is linked. Regarding the external link, please note that Copernicus Meetings cannot accept any liability for the content and the website you will visit.
Forward to presentation link
You are going to open an external link to the presentation as indicated by the authors. Copernicus Meetings cannot accept any liability for the content and the website you will visit.
We are sorry, but presentations are only available for users who registered for the conference. Thank you.
EGU22-979 | Presentations | NH6.4
Mapping and geomorphological characterization of small-scale slope-related geohazards in the tropical high-mountain environment: case studies from Cordillera Villcanota, Peru and Eje Cafetero, ColombiaMarek Ewertowski and Aleksandra Tomczyk
Slope-related mass movements and erosional processes are common in all regions on Earth and especially dangerous in mountain areas, where they can rapidly transfer material, threatening human lives and infrastructure. However, the characteristics and activity of small scale (< 1000 m2) events in highly elevated tropical mountains remain poorly understood, even though these areas are often populated. The morphological characterization and investigation of the short-term dynamics of different types of mass movement and erosional processes can help infer about slope processes and take appropriate actions to limit associated hazards. This contribution aims:(1) To recognize the different processes that contribute to overall slope dynamics; (2) To document the morphology and short-term (annual dynamics) of geohazards-related landforms (e.g. small landslides, erosional rills and gullies); (3) To investigate the relationships between the characteristics and dynamics of geohazard sites and the landscape properties; (4) To develop a model of mass wasting mechanisms as agents of slopes development in tropical mountains.
The study areas were located in South America in Cordillera Vilcanota (Willkanuta) in Peruvian Andes and Eje Cafetero region in Colombian Andes. We documented and investigated the morphology and annual spatial pattern of activity of 15 sites representing different types of geohazards. Topographic analyses were based on time series of data captured using an unmanned aerial vehicle (UAV). Where possible, we investigated the observed dynamics of slope processes in combination with data on anthropogenic use to identify the main possible hazards. We identified four main types of processes responsible for transforming the land surface within studied sites: landslides, debris flows, falling, accelerated soil erosion. The morphological expression of these processes included the formation of erosional rills and gullies, landslide head scarps and lobes, debris flow channels, and avalanche deposits. In addition, we identified two main processes that control the activity of small geohazard sites. First, road works often caused activation of mass movements because of undercutting roadsides and associated anthropogenic earth movements. Second, the topographic properties of slopes (mainly slope and aspect) can increase the landscape response to direct anthropogenic pressure. Documented activity often follows a pattern of initiation of movements at the bottom of the site and its further propagation towards the upper escarpment. These results suggest that the dynamics of small geohazard sites strongly depend on local conditions and direct human impacts. While individual events are hard to predict, the presence of fine-scale rills and furrows might be helpful as indicators of probable increase in activity of slope processes. Over the longer time scales, that can be used to identify the most hazardous elements of the slope systems.
This project was funded by Narodowe Centrum Nauki (National Science Centre, Poland), grant number 2015/19/D/ST10/00251
How to cite: Ewertowski, M. and Tomczyk, A.: Mapping and geomorphological characterization of small-scale slope-related geohazards in the tropical high-mountain environment: case studies from Cordillera Villcanota, Peru and Eje Cafetero, Colombia, EGU General Assembly 2022, Vienna, Austria, 23–27 May 2022, EGU22-979, https://doi.org/10.5194/egusphere-egu22-979, 2022.
EGU22-1574 | Presentations | NH6.4
Potential Flood-Prone Areas in the Municipality of Saint Bernard, Southern Leyte, Philippines: Risk Evaluation and Flood Susceptibility Mapping using GIS-based Analytical Hierarchy Process (AHP)John Reige Bendijo and Maria Divina Morales
Floods are processes that significantly affect populations, the environment, economy and infrastructure. The Municipality of Saint Bernard, a rural, data-scarce locality, is one of the areas in the Philippines frequently affected by flooding. Risk Evaluation and Flood Susceptibility Mapping are critical components of flood prevention and mitigation techniques because they identify the most susceptible locations based on physiographic attributes that influence flooding propensity. The first objective of this study is to generate a flood susceptibility map for the identification of barangays or zones susceptible to flood in the Municipality of Saint Bernard based on the eight (8) physiographic maps, namely: (i) Fluvial Geomorphology, (ii) Slope, (iii) Elevation, (iv) Lithology, (v) Land cover, (vi) Topographic Wetness Index (TWI), (vii) Drainage density, and (viii) Distance from the Rivers and Streams. AHP serves to determine the weights of the aforementioned factors. The distance to rivers and streams is ranked as the essential factor for finding areas susceptible to flooding, with the highest weighted rate of 20.10%. The authors utilized a quantitative approach to validate the generated flood susceptibility map by correlating with the historical flood datasets. The quantitative validation showed an excellent agreement between the susceptibility zones and historical flood events, of which 74.6% were coincident with high or very high susceptibility levels, thus confirming the effectiveness of AHP. The second objective of this study is to evaluate the relative percentage risk of flooding in every barangays or zones and the generation of risk exposure maps, which is essential to visualize each barangays' or zones' builtups, roads, and the population at risk.
How to cite: Bendijo, J. R. and Morales, M. D.: Potential Flood-Prone Areas in the Municipality of Saint Bernard, Southern Leyte, Philippines: Risk Evaluation and Flood Susceptibility Mapping using GIS-based Analytical Hierarchy Process (AHP), EGU General Assembly 2022, Vienna, Austria, 23–27 May 2022, EGU22-1574, https://doi.org/10.5194/egusphere-egu22-1574, 2022.
Please decide on your access
Please use the buttons below to download the presentation materials or to visit the external website where the presentation is linked. Regarding the external link, please note that Copernicus Meetings cannot accept any liability for the content and the website you will visit.
Forward to presentation link
You are going to open an external link to the presentation as indicated by the authors. Copernicus Meetings cannot accept any liability for the content and the website you will visit.
We are sorry, but presentations are only available for users who registered for the conference. Thank you.

EGU22-2660 | Presentations | NH6.4
Multi-temporal sediment-yield estimates in a steep headwater catchment using UAV and sensor measurements. Challenges and results from the Rebaixader debris-flow monitoring site (Pyrenees).Marcel Hürlimann, Roger Ruiz-Carulla, José Moya, Ona Torra, Felipe Buill, and M. Amparo Núñez-Andrés
Debris flow and related processes strongly affect the morphology of headwater catchments and deliver large amounts of sediments into the drainage network. The Rebaixader monitoring site, which is situated in the Central Pyrenees, is a perfect location to analyse different slope mass-wasting processes and to quantify the sediment yield in this headwater catchment. Two types of data are available: first, yearly photogrammetric surveys by Uncrewed Aerial Vehicle (UAV) have been performed since 2016, and second, an instrumental monitoring system is operational since 2009. Therefore, six years of data can be compared by these two approaches. While the UAV surveys produce point-clouds, Digital Surface Models (DSM) and orthophotos, the monitoring system determines the total volume of each torrential flow by flow-depth sensors, geophones and video cameras. Therefore, the volumes of the torrential flows determined by the instrumental monitoring system were compared and contrasted with those obtained from the DoD (Dem of differences) of photogrammetric reconstructions from UAV flights.
The final values of the sediment yield are between 0.1 and 0.2 m3/m2/y, which shows that this torrential catchment has a very high erosion activity.
The experience from this study shows that the applied monitoring techniques make it possible to i) quantify the sediment yield, ii) identify the different phenomena, and iii) determine the spatial distribution of each process. Regarding the UAV-datasets, the appropriateness of using DoD or advantages of comparing directly the different 3D point clouds are other conclusions derived from this study that will be discussed.
How to cite: Hürlimann, M., Ruiz-Carulla, R., Moya, J., Torra, O., Buill, F., and Núñez-Andrés, M. A.: Multi-temporal sediment-yield estimates in a steep headwater catchment using UAV and sensor measurements. Challenges and results from the Rebaixader debris-flow monitoring site (Pyrenees)., EGU General Assembly 2022, Vienna, Austria, 23–27 May 2022, EGU22-2660, https://doi.org/10.5194/egusphere-egu22-2660, 2022.
EGU22-5942 | Presentations | NH6.4
Using remote sensing and GIS to project climate risk for asset management usersJames Brennan, Claire Burke, Laura Ramsamy, Hamish Mitchell, and Kamil Kluza
How to cite: Brennan, J., Burke, C., Ramsamy, L., Mitchell, H., and Kluza, K.: Using remote sensing and GIS to project climate risk for asset management users, EGU General Assembly 2022, Vienna, Austria, 23–27 May 2022, EGU22-5942, https://doi.org/10.5194/egusphere-egu22-5942, 2022.
EGU22-6058 | Presentations | NH6.4
The Relationship Between Soil Moisture and Drought Monitoring Using Sentinel-3 SLSTR Data in Lower Eastern Counties of KenyaGhada Sahbeni, Peter K. Musyimi, Balázs Székely, and Tamás Weidinger
Drought is an extreme climate phenomenon that influences Earth’s water resources and energy balance. It affects hydrological cycle processes such as evapotranspiration, precipitation, surface runoff, condensation, and infiltration. Its extreme and severe occurrences threaten food security and drinking water availability for local populations worldwide. In this regard, this study uses Sentinel-3 SLSTR data to monitor drought spatiotemporal variation between 2019 and 2021 and investigate the crucial role of vegetation cover, land surface temperature, and water vapor amount in influencing drought dynamics over Kenyan’s lower eastern counties. Three essential climate variables (ECVs) of interest were extracted, namely, land surface temperature (LST), fractional vegetation cover (FVC), and total column water vapor (TCWV). These features were processed for four counties between the wettest and driest episodes in 2019 and 2021. The results showed that Makueni county has the highest FVC values of 88% in April and 76% in both periods and years. Machakos and Kitui counties had the lowest FVC estimates of 51% in September for both periods and range between 63% and 65% during dry seasons of both years. The land surface temperature has drastically changed over time and space, with Kitui county having the highest estimates of approximately 27 °C and 29 °C in April 2019 and September 2019, respectively. A significant spatial variation of TCWV was noticed across different counties, with the lowest value of 22 mm in Machakos county during the dry season of 2019, while Taita Taveta county had the highest estimates varying from 30 to 41 mm during the wettest season of 2021. Land surface temperature variation is negatively proportional to vegetation density and soil moisture content, as non-vegetated areas are expected to have lower moisture. A close link between TCWV and soil moisture content has been well established. Overall, Sentinel-3 SLSTR products depict an efficient and promising data source for drought monitoring, especially in cases where in situ measurements are scarce. ECVs produced maps will assist decision-makers in a better understanding of drought events that extremely influence agriculture in Kenya’s arid and semi-arid areas. Similarly, Sentinel-3 products can be used to interpret hydrological, ecological, and environmental changes and implications under different climatic conditions.
How to cite: Sahbeni, G., Musyimi, P. K., Székely, B., and Weidinger, T.: The Relationship Between Soil Moisture and Drought Monitoring Using Sentinel-3 SLSTR Data in Lower Eastern Counties of Kenya, EGU General Assembly 2022, Vienna, Austria, 23–27 May 2022, EGU22-6058, https://doi.org/10.5194/egusphere-egu22-6058, 2022.
Please decide on your access
Please use the buttons below to download the presentation materials or to visit the external website where the presentation is linked. Regarding the external link, please note that Copernicus Meetings cannot accept any liability for the content and the website you will visit.
Forward to presentation link
You are going to open an external link to the presentation as indicated by the authors. Copernicus Meetings cannot accept any liability for the content and the website you will visit.
We are sorry, but presentations are only available for users who registered for the conference. Thank you.
EGU22-7141 | Presentations | NH6.4
Integration of a Graph Network for the Definition of Neighbourhood in Landslide Detection with Machine LearningManuel Andreas Luck and Irena Hajnsek
Landslide mapping using Machine Learning approaches often relies on various image statistics determined by neighbourhood functions. In this presentation, the effect of a graph network for the definition of the neighbourhood of each pixel is shown on the example of the Weheka valley, New Zealand. The graph network integrates the physical properties of sliding and flowing masses into the classification process of earth observation imagery. This neighbourhood is determined by connecting nodes based on the flow direction and therefore replacing common raster formats. Both Sentinel 1 and Sentinel 2 acquisitions are used to determine the change in each pixel. From the Sentinel 1 data the Beta Nought is calculated, and the Sentinel 2 data is used to derive multiple indices (e.g., NDWI and NDVI). These products are combined in each node of the graph network. Within the neighbourhood defined by the graph network image statistics (e.g., mean, and standard deviation) are derived for each node. All data and derived products are used to train a Random Forest Classifier which is applied to three different extents of a landslide in the Weheka valley. 81.11% of the affected area is detected for the largest event with a decreasing accuracy towards the margins of the reference area.
How to cite: Luck, M. A. and Hajnsek, I.: Integration of a Graph Network for the Definition of Neighbourhood in Landslide Detection with Machine Learning, EGU General Assembly 2022, Vienna, Austria, 23–27 May 2022, EGU22-7141, https://doi.org/10.5194/egusphere-egu22-7141, 2022.
Please decide on your access
Please use the buttons below to download the presentation materials or to visit the external website where the presentation is linked. Regarding the external link, please note that Copernicus Meetings cannot accept any liability for the content and the website you will visit.
Forward to presentation link
You are going to open an external link to the presentation as indicated by the authors. Copernicus Meetings cannot accept any liability for the content and the website you will visit.
We are sorry, but presentations are only available for users who registered for the conference. Thank you.

EGU22-7536 | Presentations | NH6.4
An integrated UAS and TLS approach for monitoring coastal scarps and mass movement phenomena. The case of Ionian Islands.Michalis Diakakis, Emmanuel Vassilakis, Spyridon Mavroulis, Aliki Konsolaki, George Kaviris, Evangelia Kotsi, Vasilis Kapetanidis, Vassilis Sakkas, John D. Alexopoulos, Efthymis Lekkas, and Nicholas Voulgaris
Mediterranean tectonically-active coastal areas are a highly-dynamic environment balancing internal tectonic dynamics with external geomorphic processes, as well as manmade influences. Especially in touristic areas characterized by high built-up pressure and land value, where these dynamics are even more concentrated, the evolution of coastal environments needs careful and high-resolution study to identify localized risk and the processes they derive from.
Recently, new advanced remote sensing techniques such as Unmanned Aerial Systems (UAS)- and Terrestrial Laser Scanners (TLS)-aided monitoring have improved our capabilities in understanding the natural processes and the geomorphic risks (i.e. mass movement phenomena).
An integrated study comprising Unmanned Aerial Vehicles (UAV) and Light Detection And Ranging (LIDAR) sensors was conducted in coastal areas of the southern Ionian Islands (Western Greece) aiming to the mitigation of earthquake-triggered landslide risk and to responsible coastal development. Located at the northwesternmost part of the Hellenic Arc, this area is characterized by high seismicity and has been affected by destructive earthquakes mainly due to the Cephalonia Transform Fault Zone (CTFZ), which constitutes one of the most seismic active structures in the Eastern Mediterranean region. One of the most common environmental effect triggered by these earthquakes are landslides distributed along fault scarps in developed and highly visited coastal areas. Furthermore, this area is highly susceptible to hydrometeorological hazards inducing intense geomorphic processes, including Medicanes among others.
These technologies allow a highly-detailed view of landslide processes, providing insights on the structures and factors controlling and triggering failures along coastal scarps as well as highlighting susceptible zones and high-risk areas with accuracy and mitigating adverse effects with precision and clarity. Overall, by providing a better understanding of the risks the approach used allows a more sustainable development of these coastal segments enhanced by risk mitigation.
The study was conducted in the framework of the project “Telemachus - Innovative Operational Seismic Risk Management System of the Ionian Islands”, co-financed by Greece and the European Union (European Regional Development Fund) in Priority Axis “Environmental Protection and Sustainable Development” of the Operational Programme “Ionian Islands 2014–2020”.
How to cite: Diakakis, M., Vassilakis, E., Mavroulis, S., Konsolaki, A., Kaviris, G., Kotsi, E., Kapetanidis, V., Sakkas, V., Alexopoulos, J. D., Lekkas, E., and Voulgaris, N.: An integrated UAS and TLS approach for monitoring coastal scarps and mass movement phenomena. The case of Ionian Islands., EGU General Assembly 2022, Vienna, Austria, 23–27 May 2022, EGU22-7536, https://doi.org/10.5194/egusphere-egu22-7536, 2022.
EGU22-8587 | Presentations | NH6.4
High-resolution mobile mapping of slope stability with car- and UAV-borne InSAR systemsOthmar Frey, Charles Werner, Andrea Manconi, and Roberto Coscione
References:
How to cite: Frey, O., Werner, C., Manconi, A., and Coscione, R.: High-resolution mobile mapping of slope stability with car- and UAV-borne InSAR systems, EGU General Assembly 2022, Vienna, Austria, 23–27 May 2022, EGU22-8587, https://doi.org/10.5194/egusphere-egu22-8587, 2022.
EGU22-9087 | Presentations | NH6.4
The use of UAV-derived ultrahigh resolution data for the assessment of semiarid badland exposure to hazardous geomorphological processes: case of the Eastern Caucasus foothillsAndrey Medvedev, Natalia Telnova, Natalia Alekseenko, Arseny Kudikov, Bashir Kuramagomedov, and Yaroslav Grozdov
Specific features of current semiarid landscape along the Eastern Caucasus foothills (so-called Dagestan extra-mountain region) are badlands formed on loess and clay deposits. The active piping, erosional and gravitational processes present a direct hazard for extensive grazing activities and infrastructure facilities accommodated here. The badlands topography is complicated with the abundance of diverse pseudokarst forms such as blind valleys, caverns, different sized and shaped sinkholes. Such typical patterns as chains of elongated sinkholes, marking the direction of underground flow along the bottoms of erosional forms, are rather distinguishable on satellite imagery with submeter spatial resolution. However, the real density and morphometric analysis of surface pseudokarst forms can be well mapped and analyzed only by means of remote sensing data with ultrahigh spatial and vertical resolution (about several decimeters). For the area in study we used UAV-derived data from 100 m altitude of survey to produced Digital Terrain Model (DTM) with resolution of 20 cm. The automatic extraction of DTM’s for semiarid badland with sparse desert steppe vegetation was rather simple but there is obvious limitations of using UAV data for morphometric analysis of the badland were manifested in the formation of the so-called "dead zones" in case of the large and deep sinkholes. For a complete three-dimensional reconstruction of the badland topography, the terrestrial laser scanning data were additionally involved.
As a result of the analysis of the DTM with very high resolution, derived highly-detailed morphometric and hydrological models were built, reflecting the complex structure and genesis of the badland topography. Automatic identification and mapping of sinkholes reveal the prevalence of large sinkholes with a diameter of 5-15 m and a depth of 1-3 m along the erosional valleys for the study area. Along the slopes more smaller sinkholes forms (up to 0.3 m in diameter and up to 1 m in depth) were identified, the complex network of gullies and micro-terraces pattern were clearly reconstructed. Identification and mapping of sites with high susceptibility to current processes of different genesis was done: in particular, the identified closed catchment micro-basins are areas of predominance of piping processes, while the escarpments in the upper parts of the steep slopes of the badlands are most affected by erosional processes with formation of micro-gullies.
Under regular monitoring of piping, erosional and gravitational processes remodeling the badland topography, it is necessary to carry out multitemporal UAV surveys at low altitudes along with terrestrial laser scanning data. Such complex approach will make it possible to identify more reliably the current ratio of surface and groundwater runoff, and to early allocate and warn the hazardous geomorphological processes.
How to cite: Medvedev, A., Telnova, N., Alekseenko, N., Kudikov, A., Kuramagomedov, B., and Grozdov, Y.: The use of UAV-derived ultrahigh resolution data for the assessment of semiarid badland exposure to hazardous geomorphological processes: case of the Eastern Caucasus foothills, EGU General Assembly 2022, Vienna, Austria, 23–27 May 2022, EGU22-9087, https://doi.org/10.5194/egusphere-egu22-9087, 2022.
EGU22-9513 | Presentations | NH6.4
Remote sensing detection of climate-smart practices: Enhancing farm resilience in AustriaJuan Carlos Laso Bayas, Martin Hofer, Ian McCallum, Gernot Bodner, Maxim Lamare, Olha Danylo, Victor Maus, David Luger, Linda See, and Steffen Fritz
Climate-smart agricultural practices are techniques that help crops to endure “extreme” weather events. Practices such as minimum or no tillage, crop rotations, and cover crops reduce wind and rain-driven erosion, enhance soil physical quality, and enable soil to store water for a longer time. Climate change has already led to an increased frequency of “extreme” weather events including prolonged dry spells and intense rain. From a farmer’s perspective, a clearer and more spatially explicit demonstration of how these practices can enhance the resilience of farms would support their accelerated uptake and thus result in increased food security. From a policy maker’s perspective, knowing the extent of adoption and location of these more resilient farms would enable them to produce policies that facilitate and promote the adoption of these practices, which can buffer the effects of climate change. The use of remote sensing to detect these practices would, therefore, benefit this process. Several existing remote sensing-derived indicators, such as the Normalized Difference Vegetation Index (NDVI), are already in use. They inform farmers and policy makers on, e.g., crop and nutrient status. A combination of existing and new remote sensing-derived indices is needed to facilitate and streamline the detection and promotion of climate-smart practices, but a lack of in-situ data to date has prevented the development and verification of new models of detection. The “SATFARM services” project, which brings together expertise in agriculture, remote sensing, and data analysis, aims to connect a large agricultural time-series data set, provided by the Austrian Chamber of Agriculture, with various remote-sensing derived indicators. The goal is to detect and track climate-smart practices and to display the results on a platform (https://apps.sentinel-hub.com/eo-browser/) accessible to farmers, researchers, and policy makers. This presentation will showcase the methodology employed, the initial results and the display of these indicators on the platform.
How to cite: Laso Bayas, J. C., Hofer, M., McCallum, I., Bodner, G., Lamare, M., Danylo, O., Maus, V., Luger, D., See, L., and Fritz, S.: Remote sensing detection of climate-smart practices: Enhancing farm resilience in Austria, EGU General Assembly 2022, Vienna, Austria, 23–27 May 2022, EGU22-9513, https://doi.org/10.5194/egusphere-egu22-9513, 2022.
Please decide on your access
Please use the buttons below to download the presentation materials or to visit the external website where the presentation is linked. Regarding the external link, please note that Copernicus Meetings cannot accept any liability for the content and the website you will visit.
Forward to presentation link
You are going to open an external link to the presentation as indicated by the authors. Copernicus Meetings cannot accept any liability for the content and the website you will visit.
We are sorry, but presentations are only available for users who registered for the conference. Thank you.
EGU22-10813 | Presentations | NH6.4
3D Reconstruction of the ancient church Santiago the Apostle, Morelos, Mexico as a follow up to the damage caused by the 2017 earthquakeJesús Eduardo Méndez Serrano, Jesús Octavio Ruiz Sánchez, Nelly Lucero Ramírez Serrato, Nestor López Valdés, and Mariana Patricia Jácome Paz
On September 19, 2017, Mexico was rocked by a 7.1 earthquake, causing an immense amount of damage in the states near the epicenter. This earthquake caused hundreds of damages in historical heritage, mainly in the states of Puebla, Oaxaca and Morelos. The patrimonial damages occurred were so extensive that they are prolonged till this day. Nepopualco Morelos was one of the towns that suffered great destruction by this shaking event. Their historical and main church, “Santiago the Apostle”, was shattered in the shake, and the cleanup is still ongoing. The objective of this project was to create a 3D model of the Santiago the Apostle Church to view the process of restoration done by the National Institute of Anthropology and History (INAH). The 3D model obtained was the result of 478 images, which were captured by three different drone flights and a set of images shot on terrestrial. These flights were done by an Anafi Parrot drone, two circular flights and a double grid flight (180 and 256 images, respectively). For the purpose of obtaining a georeferenced accurate model, twelve ground control points were acquired in the field using a Emlid Reach RS+. The 3D model presented in this project is a high-resolution model that allows the spatial analysis of the cabinet structure and represents a low-cost methodology. This model presents a centimeter resolution, while the error corresponds to 1.56%. The main contribution of this work is the obtainment of a 3D model of Nepopualco´s historical church in which the final product shows the present stage of reconstruction done on the structural damages caused by the earthquake. The 3D reconstruction model will be delivered to the corresponding authorities of the National Institute of Anthropology and History. There is a possible consideration in creating other models that may help the INAH in the recovery process of cultural heritage affected by natural phenomena, as well as its structural mitigation. This project is the first effort on creating a digital catalog of these types of structures that make up Morelos’ historical heritage.
Acknowledgments:
Thanks to Arq. Antonio Mondragón from INAH, Arq. Aimeé Mancilla and Arq. Fabián Bernal Orozco for their facilities and support. We also want to thank Mr. Félix García Reyes and Gilberto García Peña, the community representatives, for their assistance in opening the entrance to the church.
How to cite: Méndez Serrano, J. E., Ruiz Sánchez, J. O., Ramírez Serrato, N. L., López Valdés, N., and Jácome Paz, M. P.: 3D Reconstruction of the ancient church Santiago the Apostle, Morelos, Mexico as a follow up to the damage caused by the 2017 earthquake, EGU General Assembly 2022, Vienna, Austria, 23–27 May 2022, EGU22-10813, https://doi.org/10.5194/egusphere-egu22-10813, 2022.
EGU22-11192 | Presentations | NH6.4
Close-range hybrid solutions for glaciers instabilities monitoringDaniele Giordan, Niccolò Dematteis, Fabrizio Troilo, Paolo Perret, Simone Gotterdelli, and Luca Morandini
The dynamics that characterizes glaciers instabilities are often not well known because the study of these phenomena is done in many cases after their occurrence. A few examples of dedicated high resolution and high-frequency monitoring networks have been recently implemented to support risk assessment and management of glaciers affected by large potential instabilities.
The current climate trend and the rise of high mountain regions occupations by several anthropic activities have recently created areas affected by high potential risk due to the activation of glacial hazards, in particular during the summer season.
A few possible solutions are available: the substantial limitation of touristic exploitation of these areas or the management of the risk aimed to reduce the restrictions in accessing such high-value areas.
In this regard, it is required the implementation of high-resolution and high-frequency monitoring networks able to follow the evolution of the glacier and increase the knowledge of its dynamics.
In the Courmayeur municipality (Italy), the Planpincieux Glacier is a clear example of this critical condition: an active glacier with an unstable sector that could create a large ice avalanche that can reach the bottom of the valley, which is characterized by the presence of settlements and a famous touristic area.
For this reason, in the last decade, an innovative monitoring network has been implemented and tested in this very complex environment. The system comprises doppler radar, ground-based interferometric SAR and optical monitoring stations. The implementation of this hybrid network is a challenging task not only for the calibration of single instruments but also for the creation of network management that can acquire the dataset of different monitoring systems to obtain a precise representation of the evolution of the glacier. This is the final step that should be implemented for an effective strategy to support decision-makers.
How to cite: Giordan, D., Dematteis, N., Troilo, F., Perret, P., Gotterdelli, S., and Morandini, L.: Close-range hybrid solutions for glaciers instabilities monitoring, EGU General Assembly 2022, Vienna, Austria, 23–27 May 2022, EGU22-11192, https://doi.org/10.5194/egusphere-egu22-11192, 2022.
EGU22-11334 | Presentations | NH6.4
Mapping Exposure to Landslides by Means of Artificial Intelligence and UAV Aerial Imagery in the Curvature Subcarpathians, RomaniaZenaida Chitu, Ionut Sandric, Viorel Ilinca, and Radu Irimia
Curvature Subcarpathians is one of Romania's most complex geological and geomorphic areas, frequently affected by landslides. The juxtaposition of snowmelt and spring rainfalls triggers significant damages to roads and buildings every few years (2018, 2021). In this context, accurately delineating the most affected areas becomes critical for evaluating landslides exposure. Aerial images have begun to be used more and more for different risk assessment phases to detect natural phenomena spread and damaged infrastructure elements. In this study, we use fully automatic detection of the landslide body and infrastructure elements (intact or collapsed buildings and roads) to support Regional Civil Protection Agencies in disaster intervention decision support. Our methodology is based on deep learning techniques for automatic detection, mapping and classification of landslide and infrastructure elements. A U-Net model was trained to detect the landslide body, and several Mask RCNN models were trained to detect the landslide features and infrastructure elements. The training accuracy for the U-Net model used for landslide body mapping is 0.86, and the validation accuracy is 0.80. The training accuracy of the Mask RCNN models is 0.76 for landslide cracks, 0.82 for roads and 0.92 for buildings. Some confusions between landslide cracks and local roads without asphalt are often seen in rural areas. The models are run on high-resolution aerial imagery collected with Unammend Aerial Vehicles after a landslide event. The data obtained from the deep learning models are further integrated with information from various sources such as aerial/satellite imagery, online GIS resources, weather forecasts, and spatial analysis techniques for providing a helpful tool to emergency management specialists. The tools have been integrated into a GIS platform that acts as a decision support system, and it can be used from a graphical user interface without the need to have programming skills.
Acknowledgement
This work was supported by a grant of the Romanian Ministry of Education and Research, CCCDI - UEFISCDI, project number PN-III-P2-2.1-PED-2019-5152, within PNCDI III (project coordinator Ionuț Șandric, https://slidemap.gmrsg.ro) and by the project PN19450103 / Core Program (project coordinator Viorel Ilinca).
How to cite: Chitu, Z., Sandric, I., Ilinca, V., and Irimia, R.: Mapping Exposure to Landslides by Means of Artificial Intelligence and UAV Aerial Imagery in the Curvature Subcarpathians, Romania, EGU General Assembly 2022, Vienna, Austria, 23–27 May 2022, EGU22-11334, https://doi.org/10.5194/egusphere-egu22-11334, 2022.
EGU22-12942 | Presentations | NH6.4
Flood detection products to support emergency management services in the Lombardy regionIgnacio Gatti, Andrea Taramelli, Mario Martina, Serena Sapio, Maria Jimenez, Marcello Arosio, Emma Schiavon, Beatrice Monteleone, and Margherita Righini
Earth Observation (EO) environments have been increasing exponentially in the last decades. New generation of satellites are designed for monitoring climate related hazards, providing higher spatial and temporal resolution images. Hazards processes are triggered by anomalies in precipitation. The service will be able to provide information on the extent of the flood footprint. The test area is located south of the city of Milan, where the urban area of Pavia is located. There was an unexpected high runoff of the Ticino river that produced high water in the flood-plain surface, affecting the local population for three consecutive days and with a total damage estimate of 250,699 euro.
The identification of datasets counts on a broad availability of EO data processed, such as C-band Synthetic Aperture Radar (SAR) data from the Sentinel 1 satellite constellation together with X-band SAR data provided by the TerraSAR-X. Methods include in-SAR coherence, by cross-multiplying the two SAR images or techniques like threshold with a final pixel size of Sentinel 1 of 8.9 m and 1.8 m of TerraSAR-X. Imagery from the 25th of November (Sentinel 1) with a VV (vertical transmit, vertical receive) polarization and from the 27th of November (TerraSAR-X) with a HH (for horizontal transmit and horizontal receive) polarization were selected. Different bands have different characteristics, for instance in penetration and spatial resolution.
Obtained products include urban footprint and flood detection maps. Results could provide an important decision support tool for a wide range of actors, including public authorities to support the preparedness, mitigation and response phases of the emergency management cycle. In addition, adaptation measurements, intervention and urban planning, as well as flood mitigation activities are additional benefits. Future analysis will include impact estimates and vulnerability analysis on the urban footprint area.
How to cite: Gatti, I., Taramelli, A., Martina, M., Sapio, S., Jimenez, M., Arosio, M., Schiavon, E., Monteleone, B., and Righini, M.: Flood detection products to support emergency management services in the Lombardy region, EGU General Assembly 2022, Vienna, Austria, 23–27 May 2022, EGU22-12942, https://doi.org/10.5194/egusphere-egu22-12942, 2022.
Please decide on your access
Please use the buttons below to download the presentation materials or to visit the external website where the presentation is linked. Regarding the external link, please note that Copernicus Meetings cannot accept any liability for the content and the website you will visit.
Forward to presentation link
You are going to open an external link to the presentation as indicated by the authors. Copernicus Meetings cannot accept any liability for the content and the website you will visit.
We are sorry, but presentations are only available for users who registered for the conference. Thank you.
EGU22-26 | Presentations | NH6.5
Detection of nonlinear kinematics in InSAR displacement time series for hazard monitoringFabio Bovenga, Alberto Refice, Ilenia Argentiero, Raffaele Nutricato, Davide Oscar Nitti, Guido Pasquariello, and Giuseppe Spilotro
Multi-temporal SAR interferometry (MTInSAR), allows analysing wide areas, identifying critical ground instabilities, and studying the phenomenon evolution in a long time-scale. The identification of MTInSAR displacements trends showing non-linear kinematics is of particular interest since they include warning signals related to pre-failure of natural and artificial structures. Recently, the authors have introduced two innovative indexes for characterising MTInSAR time series: one relies on the fuzzy entropy and measures the disorder in a time series [1], the other performs a statistical test based on the Fisher distribution for selecting the polynomial model that more reliably approximate the displacement trend [2].
This work reviews the theoretical formulation of these indexes and evaluate their performances by simulating time series with different characteristics in terms of kinematic (stepwise linear with different breakpoints and velocities), level of noise, signal length and temporal sampling. Finally, the proposed procedures are used for analysing displacement time series derived by processing Sentinel-1 and COSMO-SkyMed datasets acquired over Southern Italian Apennine (Basilicata region), in an area where several landslides occurred in the recent past. The MTInSAR displacement time series have been analysed by using the proposed methods, searching for nonlinear trends that are possibly related to relevant ground instabilities and, in particular, to potential early warning signals for the landslide events. Specifically, the work presents an example of slope pre-failure monitoring on Pomarico landslide, an example of slope post-failure monitoring on Montescaglioso landslide, and few examples of structures (such as buildings and roads) affected by instability related to different causes.
References
[1] Refice, A.; Pasquariello, G.; Bovenga, F. Model-Free Characterization of SAR MTI Time Series. IEEE Geosci. Remote Sens. Lett. 2020, doi:10.1109/lgrs.2020.3031655.
[2] Bovenga, F.; Pasquariello, G.; Refice, A. Statistically‐based trend analysis of mtinsar displacement time series. Remote Sens. 2021, doi:10.3390/rs13122302.
Acknowledgments
This work was supported in part by the Italian Ministry of Education, University and Research, D.D. 2261 del 6.9.2018, Programma Operativo Nazionale Ricerca e Innovazione (PON R&I) 2014–2020 under Project OT4CLIMA; and in part by Regione Puglia, POR Puglia FESR-FSE 204-2020 - Asse I - Azione 1.6 under Project DECiSION (p.n. BQS5153).
How to cite: Bovenga, F., Refice, A., Argentiero, I., Nutricato, R., Nitti, D. O., Pasquariello, G., and Spilotro, G.: Detection of nonlinear kinematics in InSAR displacement time series for hazard monitoring, EGU General Assembly 2022, Vienna, Austria, 23–27 May 2022, EGU22-26, https://doi.org/10.5194/egusphere-egu22-26, 2022.
EGU22-935 | Presentations | NH6.5
The value of InSAR Coherence in TanDEM-X and Sentinel-1 for monitoring world’s forestsPaola Rizzoli, José-Luis Bueso-Bello, Ricardo Dal Molin, Daniel Carcereri, Carolina Gonzalez, Michele Martone, Luca Dell'Amore, Nicola Gollin, Pietro Milillo, and Manfred Zink
Covering about 30 percent of the Earth’s surface, forests are of paramount importance for the Earth’s ecosystem. They act as effective carbon sinks, reducing the concentration of greenhouse gas in the atmosphere, and help mitigating climate change effects. This delicate ecosystem is currently threatened and degraded by anthropogenic activities and natural hazards, such as deforestation, agricultural activities, farming, fires, floods, winds, and soil erosion. In an era of dramatic changes for the Earth’s ecosystems, the scientific community urgently needs to better support public and societal authorities in decision-making processes. The availability of reliable, up-to-date measurements of forest resources, evolution, and impact is therefore of paramount importance for environmental preservation and climate change mitigation.
In this scenario, Synthetic Aperture Radar (SAR) systems, thanks to their capability to operate in presence of clouds, represent an attractive alternative to optical sensors for remote sensing over forested areas, such as tropical and boreal forests, which are hidden by clouds for most of the year.
In this work, we will investigate the potential of SAR interferometry (InSAR) for mapping forests worldwide and retrieve important biophysical parameters, such as canopy height and above ground biomass. We will compare pros and cons of single-pass (bistatic) versus repeat-pass InSAR, discussing their main peculiarities and limitations. In particular, we will concentrate on the analysis of the interferometric coherence and on the relationship between volume and temporal decorrelation with respect to forest parameters estimation. We will present the work done at DLR for mapping forests worldwide at high spatial resolution using the TanDEM-X bistatic coherence, together with the potential of Sentinel-1 InSAR time-series for a regular monitoring of vegetated areas. We will discuss the algorithms which currently under development for the estimation of above ground biomass, by fusion of InSAR and multi-spectral optical data, based on the latest advances in the field of artificial intelligence and, in particular, of deep learning, presenting the first promising results for a more effective exploitation of current EO datasets.
How to cite: Rizzoli, P., Bueso-Bello, J.-L., Dal Molin, R., Carcereri, D., Gonzalez, C., Martone, M., Dell'Amore, L., Gollin, N., Milillo, P., and Zink, M.: The value of InSAR Coherence in TanDEM-X and Sentinel-1 for monitoring world’s forests, EGU General Assembly 2022, Vienna, Austria, 23–27 May 2022, EGU22-935, https://doi.org/10.5194/egusphere-egu22-935, 2022.
Please decide on your access
Please use the buttons below to download the presentation materials or to visit the external website where the presentation is linked. Regarding the external link, please note that Copernicus Meetings cannot accept any liability for the content and the website you will visit.
Forward to presentation link
You are going to open an external link to the presentation as indicated by the authors. Copernicus Meetings cannot accept any liability for the content and the website you will visit.
We are sorry, but presentations are only available for users who registered for the conference. Thank you.
EGU22-1327 | Presentations | NH6.5
Considerations on regional continuous Sentinel-1 monitoring services over three different regionsMatteo Del Soldato, Pierluigi Confuorto, Davide Festa, Silvia Bianchini, and Federico Raspini
In 2016, a first worldwide continuous monitoring was proposed and implemented over the Tuscany Region (central Italy). It was the first application of SAR (Synthetic Aperture Radar) images for continuous monitoring of on-going ground deformations and, thanks to a PS (Permanent Scatterers) time-series data-mining for identifying changes in the trend, i.e. sudden accelerations or decelerations. The data-mining algorithm was devoted to automatically recognize trend variations higher than a velocity threshold in a determined time span. The continuous monitoring approach benefits from the launch, in 2014, of the Sentinel-1 constellation that allows having a constant flux of images every 12 days (halved to 6 days since 2016 considering the twin satellite at 180° on the same orbit). Two years after Tuscany, in April 2018, the Valle d’Aosta Region, north-western Italy, implemented a similar system to monitor its territory. The challenge was to apply the same approach, with very few changes adopted, in a region with completely different geological and geomorphological features, also considering the snow and glacial covering in winter. In fact, the Tuscany territory is characterized by wide plains, gentle slopes, and mountainous ridges limited to the eastern border in concomitants with the Northern Apennines. Consequently, the ground deformation phenomena in Tuscany are related to active and dormant landslides and subsidence phenomena, mainly due to groundwater extraction and, less commonly, geothermal activity. Valle d’Aosta Region, on the contrary, is almost all characterized by steep slopes with a central close valley. For this reason, the ground deformations to recognize and monitor are almost totally related to landslides, DSGSDs (deep-seated gravitational slope deformation) or rock glaciers. Then, a year later, in July 2019, the continuous monitoring was activated also over the Veneto Region, North-East of Italy. Its territory has partially similar characteristics to Tuscany, in the southern portion, and to the Valle d’Aosta features, in the northern part. Considering the geological and geomorphological properties, the detected ground deformations from Veneto Region share many similarities with the ones from the other two regions. These three laboratories were critically investigated, and after one-year of life, the benefits and the drawbacks of this approach over different environments were highlighted. For all the regions, separately (i) the spatial distribution of the anomalies regions, considering the slope, the aspect, the land cover, and the height, (ii) the persistency of the anomalies along time, (iii) and the correspondence between highlighted moving areas and known inventories, were investigated. At the end, considerations about the benefits evidenced by the use of this approach, considering also the good feedback of the regional administrative personnel, and the required improvements were critically taken into account.
How to cite: Del Soldato, M., Confuorto, P., Festa, D., Bianchini, S., and Raspini, F.: Considerations on regional continuous Sentinel-1 monitoring services over three different regions, EGU General Assembly 2022, Vienna, Austria, 23–27 May 2022, EGU22-1327, https://doi.org/10.5194/egusphere-egu22-1327, 2022.
Please decide on your access
Please use the buttons below to download the presentation materials or to visit the external website where the presentation is linked. Regarding the external link, please note that Copernicus Meetings cannot accept any liability for the content and the website you will visit.
Forward to presentation link
You are going to open an external link to the presentation as indicated by the authors. Copernicus Meetings cannot accept any liability for the content and the website you will visit.
We are sorry, but presentations are only available for users who registered for the conference. Thank you.
EGU22-1467 | Presentations | NH6.5
Land subsidence hotspots in Central Mexico: from Sentinel-1 InSAR evidence to risk mapsFrancesca Cigna and Deodato Tapete
The use of satellite Interferometric Synthetic Aperture Radar (InSAR) for land subsidence assessment is already a well established scientific research approach. Although several studies analyze subsidence patterns via integration of InSAR output maps with geospatial layers depicting hazard factors or elements at risk (e.g. surface and bedrock geology, cadastral and infrastructure maps), still limited is the body of literature attempting to generate value-added products. These not only have the potential to be used by stakeholders in urban planning, but also can be updated as new InSAR data are made available. With this scope in mind, this work presents the experience gained across Central Mexico, where land subsidence due to groundwater resource overexploitation is a pressing issue affecting many urban centers and expanding metropolises. Groundwater availability and aquifer storage changes provided by the National Water Commission are analyzed in relation to surface deformation data from wide-area surveys based on InSAR. The Parallel Small BAseline Subset (P-SBAS) method integrated in ESA’s Geohazards Exploitation Platform (GEP) is used to process Sentinel-1 IW big data stacks over a region of 550,000 km2 encompassing the whole Trans-Mexican Volcanic Belt (TMVB) and several major states, including Puebla, Federal District, México, Hidalgo, Querétaro, Guanajuato, Michoacán, Jalisco, San Luis Potosí, Aguascalientes and Zacatecas. A number of hotspots affected by present-day subsidence rates of several cm/year are identified across the TMVB, with extents ranging from localized bowls up to whole valleys or metropolitan areas spanning hundreds of square kilometers. Surface faulting hazard and induced risk on urban properties are assessed and discussed with a focus on: (i) Mexico City metropolitan area, one of the most populated and fastest sinking cities globally (up to −40 cm/year vertical, and ±5 cm/year E-W rates) [1]; (ii) the state of Aguascalientes, where a structurally-controlled fast subsidence process (−12 cm/year vertical, ±3 cm/year E-W) affects the namesake valley and capital city [2]; and (iii) the Metropolitan Area of Morelia, a rapidly expanding metropolis where population doubled over the last 30 years and a subsidence-creep-fault process has been identified (−9 cm/year vertical, ±1.7 cm/year E-W) [3]. InSAR results and the derived risk maps prove valuable not only to constrain the land deformation process at the hotspots, but also to quantify properties and population at risk, hence an essential knowledge-base for policy makers and regulators to optimize groundwater resource management, and accommodate existing and future water demands.
[1] Cigna F., Tapete D. 2021. Present-day land subsidence rates, surface faulting hazard and risk in Mexico City with 2014-2020 Sentinel-1 IW InSAR. Remote Sensing of Environment, 253, 112161, https://doi.org/10.1016/j.rse.2020.112161
[2] Cigna F., Tapete D. 2021. Satellite InSAR survey of structurally-controlled land subsidence due to groundwater exploitation in the Aguascalientes Valley, Mexico. Remote Sensing of Environment, 254, 112254, https://doi.org/10.1016/j.rse.2020.112254
[3] Cigna F., Tapete D. 2022. Urban growth and land subsidence: Multi-decadal investigation using human settlement data and satellite InSAR in Morelia, Mexico. Science of the Total Environment, 811, 152211. https://doi.org/10.1016/j.scitotenv.2021.152211
How to cite: Cigna, F. and Tapete, D.: Land subsidence hotspots in Central Mexico: from Sentinel-1 InSAR evidence to risk maps, EGU General Assembly 2022, Vienna, Austria, 23–27 May 2022, EGU22-1467, https://doi.org/10.5194/egusphere-egu22-1467, 2022.
EGU22-1690 | Presentations | NH6.5
Tools for supporting Sentinel-1 data interpretation: the coast of Granada (Spain)Oriol Monserrat, Anna Barra, Cristina Reyes-Carmona, Rosa Maria Mateos, Jorge Pedro Galve, Roberto Tomas, Gerardo Herrera Herrera, Marta Béjar Bejar, José Miguel Azañón, Jose Navarro, and Roberto Sarro
In the last few years, satellite interferometry (InSAR) has become a consolidated technique for the detection and monitoring of ground movements. InSAR based techniques allows to process large areas providing a high number of displacement measurements with low cost. However, the outputs provided by such techniques are usually not easy, hampering the interpretation and time-consuming. This is critical for users who are not familiar with radar data. European Ground Motion Service (Copernicus) is a new public service that will bring a step forward in this context. However, the capability of exploiting it will still rely on the user experience. In this context, the development of methodologies and tools to automatize the information retrieval and to ease the results interpretation is a need to improve its operational use. Here we propose a set of tools and methodologies to detect and classify Active Deformation Areas, and to map the potential damages to anthropic elements, based on differential displacements. We present the results achieved in the coast of Granada, which is strongly affected by slope instabilities. The methodology is applied at a regional scale and allows to go to a detailed local scale of analysis. The presented results have been achieved within the framework of the Riskcoast Project (financed by the Interreg Sudoe Program through the European Regional Development Fund (ERDF)).
How to cite: Monserrat, O., Barra, A., Reyes-Carmona, C., Mateos, R. M., Galve, J. P., Tomas, R., Herrera, G. H., Bejar, M. B., Azañón, J. M., Navarro, J., and Sarro, R.: Tools for supporting Sentinel-1 data interpretation: the coast of Granada (Spain), EGU General Assembly 2022, Vienna, Austria, 23–27 May 2022, EGU22-1690, https://doi.org/10.5194/egusphere-egu22-1690, 2022.
Please decide on your access
Please use the buttons below to download the presentation materials or to visit the external website where the presentation is linked. Regarding the external link, please note that Copernicus Meetings cannot accept any liability for the content and the website you will visit.
Forward to presentation link
You are going to open an external link to the presentation as indicated by the authors. Copernicus Meetings cannot accept any liability for the content and the website you will visit.
We are sorry, but presentations are only available for users who registered for the conference. Thank you.
EGU22-2842 | Presentations | NH6.5
Exploiting Sentinel-1 InSAR capabilities for studying the land subsidence process in an urban areaAlessandro Zuccarini, Benedikt Bayer, Silvia Franceschini, Serena Giacomelli, Gianluigi Di Paola, and Matteo Berti
Since the beginning of the 1960s, the urban area of Bologna has experienced land subsidence due to excessive groundwater withdrawals. Sinking reached its peak in the 70s of the last century when the subsidence rate attained the maximum value of about 10 cm/year, and significant damages to structures and infrastructures occurred. This process has been intensively monitored over the years, and extensive ground displacement data were collected employing various increasingly sophisticated techniques, ranging from topographic levelling to GNSS surveys and, since 1992, to satellite interferometry. Satellite data, in particular, allowed an accurate reconstruction of the land subsidence process. The available interferometric data are the results of three different SAR campaigns undertaken by local authorities in which the PSInSAR technique was adopted: 1992 – 2000 (ERS), 2002 – 2006 (ENVISAT) and 2006 – 2011 (RADARSAT). Within this work, a new InSAR survey from the free SENTINEL1 2014 – 2020 ascending and descending orbits data was undertaken by the UniBo spin-off “Fragile”. The software GMTSAR was used to process each interferogram and then a Small Baseline (SBAS) approach was followed to resolve the ground displacements over time. Great attention was paid to the choice of reference pixels on the existing buildings and structures, in order to maximise their density in the study area, and to the definition of the considered time span ranging from 6 to 365 days, allowing to analyse both quicker and slower ground movements. Compared to previous surveys, the displacement map obtained by Sentinel has a much higher spatial and temporal resolution, thus leading to a detailed interpretation of the ongoing subsidence. Results show that the displacement field well agrees with the 3D geological model of the area and that the temporal evolution of the subsidence rate nicely matches the piezometric level and groundwater pumping temporal series.
How to cite: Zuccarini, A., Bayer, B., Franceschini, S., Giacomelli, S., Di Paola, G., and Berti, M.: Exploiting Sentinel-1 InSAR capabilities for studying the land subsidence process in an urban area, EGU General Assembly 2022, Vienna, Austria, 23–27 May 2022, EGU22-2842, https://doi.org/10.5194/egusphere-egu22-2842, 2022.
Please decide on your access
Please use the buttons below to download the presentation materials or to visit the external website where the presentation is linked. Regarding the external link, please note that Copernicus Meetings cannot accept any liability for the content and the website you will visit.
Forward to presentation link
You are going to open an external link to the presentation as indicated by the authors. Copernicus Meetings cannot accept any liability for the content and the website you will visit.
We are sorry, but presentations are only available for users who registered for the conference. Thank you.
EGU22-4919 | Presentations | NH6.5
A Method for the Correction of Non-Closure Phase Artefacts in Triplets of Multi-look SAR InterferogramsFrancesco Falabella and Antonio Pepe
Multi-temporal interferometric synthetic aperture radar (InSAR) algorithms represent nowadays mature tools to analyze the Earth’s ground deformation with high accuracy. Among them, a significant role is played by those algorithms based on the use of small-baseline (SB) multi-look interferograms, which are less affected by decorrelation noise artefacts. Recently, there is a great concern on the studying the sources of some inconsistencies in the InSAR products (i.e., ground deformation time-series and mean deformation velocity maps) that happen when sets of multi-look SAR interferograms with very short temporal baselines are processed, compared to those obtained using interferograms with longer temporal baselines. Concerning the interferometric SAR analyses for the study of the Earth's surface displacements, such spurious signals lead to systematic biases that, if not adequately compensated for, might lead to unreliable InSAR ground displacement products.
In this study, we propose a methodology to estimate and correct a set of multi-look SB interferograms that is based on computing and analyzing sets of (wrapped) non-closure phase triplets. The developed phase estimation method works on every single SAR pixels independently, assuming the (unknown) phase bias signal could be approximated as the sum of a constant phase velocity term v and a time-dependent (i.e., dependent on the interferograms temporal baseline) phase velocity difference terms Δv(Δti ), where Δti is the temporal baseline of the generic i-th interferogram. Once the whole set of triplets that could be formed using short baseline ML interferograms is identified, and considering the mathematical properties of the triplets non-closure phases, we can write an overdetermined system of linear equations, where the known terms are the measured wrapped non-closure phases over the set of identified triplets, namely ΔΦtriplets , and the unknowns are the temporal-baseline-dependent phase velocity difference terms Δv . For example, considering the Sentinel1-A/B sensors, the temporal baseline is sampled with an atomic sampling time of six days; accordingly, if we accept, for instance, a threshold of 96 days for the maximum allowed temporal baseline of the selected SB interferograms, we have 16 unknowns to be estimated. Once the linear system is solved in the Least-Squares sense, the phase biases at the different temporal baselines, namely ΔΦbias , are iteratively retrieved by integrating the phase acceleration terms, assuming as the initial condition that the phase bias at the maximum considered temporal baseline is zero, that is Δφbiasmax_baseline = 0.
Preliminarily experiments, performed on sets of Sentinel1-A/B SAR data in different geo-morphological conditions, demonstrate the effectiveness of the developed methodology. Additionally, we performed some simulations and experiments to test the validity of an extension of the developed method to the non-stationary case, e.g., when the phase bias signals depend on the specific single time acquisitions of the SAR images involved in the SB interferograms generation, and not only on their temporal baselines. Our work is propaedeutic for further investigations aiming at retrieving/analyzing the ground properties of the imaged targets on the terrain, such as the soil moisture content or other local ground properties that are usually not considered appropriately by conventional InSAR analyses.
How to cite: Falabella, F. and Pepe, A.: A Method for the Correction of Non-Closure Phase Artefacts in Triplets of Multi-look SAR Interferograms, EGU General Assembly 2022, Vienna, Austria, 23–27 May 2022, EGU22-4919, https://doi.org/10.5194/egusphere-egu22-4919, 2022.
EGU22-5293 | Presentations | NH6.5
Cross-checking of the nationwide Ground Motion Service (GMS) of Sweden with the previous InSAR-based results: Case studies of Uppsala and Gävle CitiesFaramarz Nilfouroushan, Nureldin Ahmed Adam Gido, and Mehdi Darvishi
The interest for using Interferometric Synthetic Aperture Radar (InSAR) for ground motion detection and monitoring is rapidly increasing, thanks to the Copernicus Senetinel-1 satellites which cover relatively large areas with a 6-days revisit time. Ground motion of many locations, especially urban areas around the world have been studied using Sentienl-1 data and the rate and distribution of the ground movements have been reported. For Sweden, for example, Fryksten and Nilfouroushan (2019) and Gido et al. (2020) studied the active ground subsidence in Uppsala and Gävle cities using the Senetinel-1 data collected between 2015-2020. The Persistent Scatterer Interferometry (PSI) technique was used to estimate the subsidence rate and the results were validated with the help of precise levelling data and correlated with the geological observations. Today, fortunately, we have the nationwide GMS of Sweden (https://insar.rymdstyrelsen.se) covering almost the entire country, which provides an opportunity to compare and cross-check the results of this new service with previous studies, for example the ones reported for Uppsala and Gävle cities. The temporal coverage of satellite data used for the GMS of Sweden has an overlap with the data used in previous studies for Uppsala and Gävle cities, and the same PSI technique has been used to generate the displacement map and time series.
In this study, we used the previous PSI results of Uppsala and Gävle cities to validate the newly launched nationwide GMS of Sweden. The Line Of Sight (LOS) displacement time-series at some deforming locations were compared for both PSI-results. Although the number and imaging date of Senetinel-1 data, and the parameters used for PSI processing are not completely the same, the compared results show a good agreement between corresponding studies on the localization and rate of the subsidence in those two cities in last ~5 years. The validation phase of the new GMS of Sweden is in progress and our study shows the promising results, at least for urban areas in those two cities.
References
Fryksten J., Nilfouroushan F., Analysis of Clay-Induced Land Subsidence in Uppsala City Using Sentinel-1 SAR Data and Precise Leveling. Remote Sens. 2019, 11, 2764. https://doi.org/10.3390/rs11232764
Gido N.A.A., Bagherbandi M., Nilfouroushan F., Localized Subsidence Zones in Gävle City Detected by Sentinel-1 PSI and Leveling Data. Remote Sens. 2020, 12, 2629. https://doi.org/10.3390/rs12162629
How to cite: Nilfouroushan, F., Gido, N. A. A., and Darvishi, M.: Cross-checking of the nationwide Ground Motion Service (GMS) of Sweden with the previous InSAR-based results: Case studies of Uppsala and Gävle Cities, EGU General Assembly 2022, Vienna, Austria, 23–27 May 2022, EGU22-5293, https://doi.org/10.5194/egusphere-egu22-5293, 2022.
Please decide on your access
Please use the buttons below to download the presentation materials or to visit the external website where the presentation is linked. Regarding the external link, please note that Copernicus Meetings cannot accept any liability for the content and the website you will visit.
Forward to presentation link
You are going to open an external link to the presentation as indicated by the authors. Copernicus Meetings cannot accept any liability for the content and the website you will visit.
We are sorry, but presentations are only available for users who registered for the conference. Thank you.
EGU22-5719 | Presentations | NH6.5
Ground deformation time series prediction based on machine learningCarolina Guardiola-Albert, Héctor Aguilera, Juliana Arias Patiño, Javier Fullea Urchulutegui, Pablo Ezquerro, and Guadalupe Bru
The problem of predicting terrain deformation time series from radar interferometry (InSAR) data is one of the biggest current challenges for the prevention and mitigation of the impact of geological risks (e.g. earthquakes, volcanoes, subsidence, slope landslides) that affect both urban (e.g. building movement) and non-urban areas. Generating spatio-temporal alert systems on the processes of deformation of the terrain based on predictive models is one of the great current challenges in the face of the prevention and management of geological risks. Within machine learning techniques, deep learning offers the possibility of applying prediction models of deformation time series on images using convolutional neural networks (Ma et al., 2020).
The objective of the present study is to develop a methodology to obtain predictive models of time series of terrain deformation from InSAR images using machine learning algorithms (e.g. deep convolutional neural networks). Data to train the algorithm will be time series of terrain deformation contained in InSAR images processed by the Geological Survey of Spain (IGME-CSIC). Different architectures and parameterizations of machine learning will be tested.
This work is performed within the framework of the SARAI Project PID2020-116540RB-C22 funded by MCIN/ AEI /10.13039/501100011033.
Reference:
Ma, P., Zhang, F., Lin, H. (2020). Prediction of InSAR time-series deformation using deep convolutional neural networks. Remote Sensing Letters, 11:2, 137-145.
How to cite: Guardiola-Albert, C., Aguilera, H., Arias Patiño, J., Fullea Urchulutegui, J., Ezquerro, P., and Bru, G.: Ground deformation time series prediction based on machine learning, EGU General Assembly 2022, Vienna, Austria, 23–27 May 2022, EGU22-5719, https://doi.org/10.5194/egusphere-egu22-5719, 2022.
EGU22-6040 | Presentations | NH6.5 | Highlight
A first appraisal of the European Ground Motion ServiceLorenzo Solari, Michele Crosetto, Joanna Balasis-Levinsen, Luke Bateson, Nicola Casagli, Valerio Comerci, Luca Guerrieri, Michaela Frei, Marek Mróz, Dag Anders Moldestad, Anneleen Oyen, and Henrik Steen Andersen
Satellite interferometry (InSAR) is a reliable and proven technique to monitor and map geohazards over wide areas. In the last years, InSAR is increasingly becoming an everyday tool for geoscientific and applicative analyses; many different users, ranging from academia to the industry, work and rely on InSAR products.
The European Ground Motion Service (EGMS) was conceived and is being implemented as a direct response to growing user needs. The EGMS is implemented under the responsibility of the European Environment Agency in the frame of the Copernicus Programme. The EGMS products are part of the portfolio of the Copernicus Land Monitoring Service. The EGMS provides consistent, regular, standardized, harmonized, and reliable information regarding natural and anthropogenic ground motion phenomena over the Copernicus Participating States and across national borders, with millimeter accuracy. The EGMS distributes three levels of products: (i) basic, i.e. line of sight (LOS) velocity maps in ascending and descending orbits referred to a local reference point; (ii) calibrated, i.e. LOS velocity maps calibrated with a geodetic reference network (a velocity model derived from thousands of global navigation satellite systems time series is used for calibration so that measurements are no longer relative to a local reference point) and (iii) ortho, i.e. components of motion (horizontal and vertical) anchored to the reference geodetic network. The products are generated from the multi-temporal interferometric analysis of Sentinel-1 images in ascending and descending orbit at full resolution. The data is available and accessible to all and free of charge through a dedicated viewer and download interface.
The accessibility to EGMS accurate and validated interferometric data offers the geoscientific and professional communities the opportunity to study geohazards at the European level, including difficult-to-reach areas or where the availability of ground motion data has so far been scarce or null. The EGMS provides, for example, information useful for the identification and monitoring of slow-moving landslides, natural subsidence, or subsidence due to groundwater exploitation or underground mining activities and volcanic unrest. In addition, the Service establishes a baseline for studies dedicated to localized deformation affecting buildings and infrastructure in general. This presentation will offer a first evaluation of the EGMS products under geoscientific aspects. Case studies from different European environmental contexts will be shown to demonstrate how the EGMS products can be successfully used for geohazards-related studies.
How to cite: Solari, L., Crosetto, M., Balasis-Levinsen, J., Bateson, L., Casagli, N., Comerci, V., Guerrieri, L., Frei, M., Mróz, M., Moldestad, D. A., Oyen, A., and Andersen, H. S.: A first appraisal of the European Ground Motion Service, EGU General Assembly 2022, Vienna, Austria, 23–27 May 2022, EGU22-6040, https://doi.org/10.5194/egusphere-egu22-6040, 2022.
Please decide on your access
Please use the buttons below to download the presentation materials or to visit the external website where the presentation is linked. Regarding the external link, please note that Copernicus Meetings cannot accept any liability for the content and the website you will visit.
Forward to presentation link
You are going to open an external link to the presentation as indicated by the authors. Copernicus Meetings cannot accept any liability for the content and the website you will visit.
We are sorry, but presentations are only available for users who registered for the conference. Thank you.
EGU22-6544 | Presentations | NH6.5 | Highlight
Hazard assessment with SAR – What to expect from the NISAR missionCathleen Jones, Karen An, and Scott Staniewicz
NASA’s NISAR mission, expected to launch in early 2023, will provide SAR observations of nearly all Earth’s land surfaces and selected ocean and sea ice areas on both ascending and descending orbits at a 12-day orbit repeat interval. In this talk, mission plans to support both sustained and event-driven observations for hazard assessment are presented. The NISAR satellite will carry both L- and S-band instruments, with the L-band instrument providing the near-global coverage and the S-band acquisitions concentrated in southern Asia and the polar regions. In addition, the mission system will be capable of accepting and implementing requests for rapid processing to support disaster response. Most land observations are part of the standard observation plan, so requested scenes will be marked for rapid processing and delivery, with the goal of providing information within hours of acquisition. In the event that new acquisitions are needed, e.g., over the ocean as major tropical storms develop, the instrument can be retasked to acquire new scenes.
In addition, we present information about efforts on the part of the mission to enable realistic simulation of NISAR’s capabilities across a broad range of science and applications topics. To that end, L-band quad-polarimetric and repeat pass SAR data acquired with the airborne UAVSAR instrument, which has ~3-m single look resolution, has been processed to be ‘NISAR-like,’ with the noise level and spatial resolution of NISAR’s planned acquisition modes. To date, more than 400 NISAR-like products from 70 different UAVSAR scenes acquired in North America and Greenland have been produced, and the UAVSAR project is continuing to generate more products specifically to support hazard assessment for fires and landslides. Examples of anticipated NISAR performance will be shown with comparison to results using the full resolution UAVSAR products.
This work was carried out in part at the Jet Propulsion Laboratory, California Institute of Technology, under a contract with NASA.
How to cite: Jones, C., An, K., and Staniewicz, S.: Hazard assessment with SAR – What to expect from the NISAR mission, EGU General Assembly 2022, Vienna, Austria, 23–27 May 2022, EGU22-6544, https://doi.org/10.5194/egusphere-egu22-6544, 2022.
EGU22-6817 | Presentations | NH6.5
Tracking slow-moving landslides over large regions using open-access standardized InSAR products produced by the Advanced Rapid Imaging and Analysis (ARIA) Center for Natural Hazards projectAlexander Handwerger, Eric Fielding, Simran Sangha, and David Bekaert
Slow-moving landslides are hydrologically driven and respond to changes in precipitation over daily to decadal timescales. Open-access satellite InSAR data products, which are becoming increasingly common, can be used to investigate landslides (and other ground surface deformation) over large regions. Here we use standardized open-access satellite radar interferometry data processed by the Advanced Rapid Imaging and Analysis (ARIA) team at NASA’s Jet Propulsion Laboratory to identify 247 active landslides in California, USA. These landslides occur in both wet and dry climates and span more than ~2 m/yr in mean annual rainfall. We quantify the sensitivity of 38 landslides to changes in rainfall, including a drought and extreme rainfall that occurred in California between 2015 and 2020. Despite the large differences in climate, we found these landslides exhibited surprisingly similar behaviors and hydrologic sensitivity, which was characterized by faster (slower) than normal velocities during wetter (drier) than normal years. Our study documents the first application of open-access standardized InSAR products from ARIA to identify and monitor landslides across large regions. Due to the large volume of open-access InSAR data that is currently available, and will continue to increase with time, especially with the upcoming launch of the NASA-ISRO SAR (NISAR) satellite, standardized InSAR products will become one of the primary ways to deliver InSAR data to the broader scientific community. Thus, it is important to continue to explore new approaches to analyze these InSAR products for scientific research.
How to cite: Handwerger, A., Fielding, E., Sangha, S., and Bekaert, D.: Tracking slow-moving landslides over large regions using open-access standardized InSAR products produced by the Advanced Rapid Imaging and Analysis (ARIA) Center for Natural Hazards project, EGU General Assembly 2022, Vienna, Austria, 23–27 May 2022, EGU22-6817, https://doi.org/10.5194/egusphere-egu22-6817, 2022.
EGU22-7159 | Presentations | NH6.5
Long-term analysis of the environmental impact of mining in the Upper Silesia Coal Basin area based on historical and the latest remote sensing dataMaria Przyłucka, Zbigniew Perski, and Zbigniew Kowalski
The paper presents the results of long-term terrain subsidence monitoring in the mining area of the Upper Silesian Coal Basin (USCB) in Poland using Interferometry Synthetic Aperture Radar (InSAR), supplemented with differential analysis of digital elevation models. The work included analysis of mining-induced subsidence based on three archival surface models: historical terrain model obtained from the digitization of Messtischblatt topographic maps, representing the surface in 1919-1944; numerical terrain model DTED, derived from the vectorization of diaposites of topographic maps from the 90s of the twentieth century; LIDAR digital terrain model from 2013. Archival analyses were complemented by the newest PSInSAR database of Sentinel-1 data, processed for the entire area of USCB. The data covered a period of 6 years (October 26, 2014 - June 26, 2020), in which a total of 260 scenes from 124 descending paths were used. In the time domain, data were recorded at intervals of 12 days (for one Sentinel-1 satellite) or every 6 days for the full Sentinel-1 A / B constellation. The entire collection includes 8,139,901 PS points over 6,620 km2, giving an average density of about 1230 PS /sq km. The dataset enabled the analysis of contemporary vertical land movements. This huge set of various data was used to analyze the long-term influence of mining in the area broken down into time intervals, collectively covering the period from the mid-twentieth century to 2020. As a result of the analyzes, zones of mining-induced subsidence were developed, where the terrain surface was systematically changed in individual years. The data allowed for over 600 sq km identification under the influence of exploitation. Subsidence areas were matched with topographic data such as buildings and roads to estimate the effect of subsidence on urban areas. The work shows the great advantage of remote monitoring methods, which is the possibility of showing the long-term environmental impact to a large extent. The use of both historical and the latest data allowed for a comprehensive analysis of changes on the surface of the area now and in the past.
How to cite: Przyłucka, M., Perski, Z., and Kowalski, Z.: Long-term analysis of the environmental impact of mining in the Upper Silesia Coal Basin area based on historical and the latest remote sensing data, EGU General Assembly 2022, Vienna, Austria, 23–27 May 2022, EGU22-7159, https://doi.org/10.5194/egusphere-egu22-7159, 2022.
Please decide on your access
Please use the buttons below to download the presentation materials or to visit the external website where the presentation is linked. Regarding the external link, please note that Copernicus Meetings cannot accept any liability for the content and the website you will visit.
Forward to presentation link
You are going to open an external link to the presentation as indicated by the authors. Copernicus Meetings cannot accept any liability for the content and the website you will visit.
We are sorry, but presentations are only available for users who registered for the conference. Thank you.
EGU22-8397 | Presentations | NH6.5
P-band SAR for deformation surveying: advantages and challengesYuankun Xu, Zhong Lu, and Jin-Woo Kim
To date, mainstream SAR (Synthetic Aperture Radar) systems dominantly operate in X/C/L bands (wavelengths of 3.1–24.2 cm), which commonly experience low coherence and thereby degraded InSAR accuracy over densely vegetated terrains. The long wavelength (69.7 cm) P-band SAR, in contrast, holds the potential to address this challenge by penetrating through dense forests to collect highly coherent data takes. Here, we experimented using the NASA JPL (Jet Propulsion Laboratory)’s P-band AirMOSS (Airborne Microwave Observatory of Subcanopy and Subsurface) radar system to acquire repeat-pass SAR data over diverse terrains (14 flight segments) in Washington, Oregon, and California (USA), and comprehensively evaluated the performance of P-band InSAR for ground deformation surveying. Our results show that the AirMOSS P-band InSAR could retain coherence two times as high as the L-band satellite ALOS-2 (Advanced Land Observing Satellite-2) data, and was significantly more effective in discovering localized geohazards that were unseen by the ALOS-2 interferograms in forested areas. Additionally, P-band InSAR could better avoid phase aliasing to resolve high-gradient deformation. However, despite these advantages, P-band InSAR were less sensitive to subtle deformation than X/C/L band radars and faced similar challenges posed by waterbodies, thick snow covers, shadow and layover effects, and the side-looking configuration. Overall, our results suggest that P-band InSAR could be a revolutionary tool for measuring relatively high-gradient deformation under dense forest canopies.
How to cite: Xu, Y., Lu, Z., and Kim, J.-W.: P-band SAR for deformation surveying: advantages and challenges, EGU General Assembly 2022, Vienna, Austria, 23–27 May 2022, EGU22-8397, https://doi.org/10.5194/egusphere-egu22-8397, 2022.
EGU22-9194 | Presentations | NH6.5
The importance of InSAR data post-processing for the interpretation of geomorphological processesMarta Zocchi, Benedetta Antonielli, Roberta Marini, Claudia Masciulli, Gianmarco Pantozzi, Francesco Troiani, Paolo Mazzanti, and Gabriele Scarascia Mugnozza
A-DInSAR (Advanced Differential Synthetic Aperture Radar Interferometry) is widely acknowledged as one of the most powerful remote sensing tools for measuring Earth’s surface displacements over large areas, and in particular landslides. The Persistent Scatterer Interferometry (PS-InSAR or PSI) is a common A-DInSAR multitemporal technique, which allows retrieving displacement measurements with sub-centimetric precision. Characterization and interpretation of landslides can greatly benefit from the application of A-DInSAR post-processing tools, especially when extremely slow-moving phenomena are not detectable by classical geomorphological investigations, or when complex displacement patterns need to be highlighted. Detailed representations of the spatial and temporal evolution of the processes provide useful constraints during the planning stages of reconstructions and for land use purposes.
The present study is part of a broader national project, focused on updating and monitoring landslide-prone slopes interacting with urban centres in the Central Apennines (Italy), by using both geomorphological and A-DInSAR analysis. Therefore, although field surveys permitted the systematic updating of the available landslide inventories, in most cases, clear indications of displacement were outlined only by the SAR interferometry results. In this regard, the preliminary results of the ongoing research focus on specific post-processing analyses of interferometric data performed in the study area.
A specific PS-toolbox software, developed by NHAZCA S.r.l. as a set of post-processing plugins for the open-source software QGIS, was specifically designed to enhance spatial and temporal deformation trends of the PSI results, as well as for visualizing the differences between multi-satellite datasets. Moreover, the PS-toolbox allowed depicting subtle surface patterns within the landslide area, shedding light on kinematics and style of activity of slope instabilities.
In complex morphological conditions, as the Apennines mountainous regions, the geometric distortions and the site coverage percentage can lead to a lack of information. Therefore, we compared the coverage of PSs and the accuracy of the surface velocity maps produced using different InSAR tool packages on both Sentinel-1 and COSMO-SkyMed scenes. Thus, the comparison of the resulting datasets allowed their validation in terms of measured displacements and reliability for further processing.
How to cite: Zocchi, M., Antonielli, B., Marini, R., Masciulli, C., Pantozzi, G., Troiani, F., Mazzanti, P., and Scarascia Mugnozza, G.: The importance of InSAR data post-processing for the interpretation of geomorphological processes, EGU General Assembly 2022, Vienna, Austria, 23–27 May 2022, EGU22-9194, https://doi.org/10.5194/egusphere-egu22-9194, 2022.
Please decide on your access
Please use the buttons below to download the presentation materials or to visit the external website where the presentation is linked. Regarding the external link, please note that Copernicus Meetings cannot accept any liability for the content and the website you will visit.
Forward to presentation link
You are going to open an external link to the presentation as indicated by the authors. Copernicus Meetings cannot accept any liability for the content and the website you will visit.
We are sorry, but presentations are only available for users who registered for the conference. Thank you.
EGU22-9443 | Presentations | NH6.5
Regional scale monitoring results of surface deformation in the Transcarpathian RegionBalint Magyar and Roland Horvath
One of the main objectives of the GeoSES* project to investigate dangerous natural and anthropogenic geo-processes and aim hazard assessment using space geodetic technologies and concentrating on the Hungary-Slovakia-Romania-Ukraine cross-border region. The monitoring of such natural hazards and emergency situations (e.g. landslides and sinkholes ) are also additional objectives of the project. In the framework of the presented project, our study utilizes one of the fastest developing space-borne remote sensing technology, namely InSAR, which is an outstanding tool to conduct large scale ground deformation observation and monitoring. According this, we utilized ascending and descending Sentinel-1 Level-1 SLC acquisitions since 2014 until 2021 over the indicated cross-border area, focusing the Transcarpathian Region.
We also present an automated processing chain of Sentinel-1 interferometric wide mode acquisitions to generate long-term ground deformation time-series. The pre-processing part of the workflow includes the migration of the input data from the Alaska Satellite Facility (ASF), the integration of precise orbits from S1QC, as well as the corresponding radiometric calibration and mosaicing of the TOPS mode data, furtheromore the geocoding of the geometrical reference. Subsequently all slave acquisition have be co-registered to the geometrical reference using iterative intensity matching and spectral diversity methods, then subsequent deramping has been also performed. To retrieve deformation time series from co-registered SLCs stacks, we have implemented multi-reference Interferometric Point Target Analysis (IPTA) using singe-look and multi-look phases using the GAMMA Software. After forming differential interferometric point stacks, we conducted the iterative IPTA processing. According this both topographical and orbit-related phase component, as well as the atmospheric phase, height-dependent atmospheric phase and linear phase term supplemented with the deformation phase are modeled and refined through iterative steps. To retrieve recent deformations of the investigated area, SVD LSQ optimization has been utilized to transform the multi-reference stack to single-reference phase time-series such could be converted to LOS displacements within the processing chain. Involving both ascending and descending LOS solutions also supports the evaluation of quasi East-West and Up-Down components of the surface deformations. Results are interpreted both in regional scale and through local examples of the introduced cross-border region as well.
* Hungary-Slovakia-Romania-Ukraine (HU-SK-RO-UA) ENI Cross-border Cooperation Programme (2014-2020) “GeoSES” - Extension of the operational "Space Emergency System"
How to cite: Magyar, B. and Horvath, R.: Regional scale monitoring results of surface deformation in the Transcarpathian Region, EGU General Assembly 2022, Vienna, Austria, 23–27 May 2022, EGU22-9443, https://doi.org/10.5194/egusphere-egu22-9443, 2022.
EGU22-9733 | Presentations | NH6.5
EGMS: a New Copernicus Service for Ground Motion Mapping and MonitoringMario Costantini, Federico Minati, Francesco Trillo, Alessandro Ferretti, Emanuele Passera, Alessio Rucci, John Dehls, Yngvar Larsen, Petar Marinkovic, Michael Eineder, Ramon Brcic, Robert Siegmund, Paul Kotzerke, Ambrus Kenyeres, Sergio Proietti, Lorenzo Solari, and Henrik Andersen
Satellite interferometric SAR (InSAR) has demonstrated to be a powerful technology to perform millimeter-scale precision measurements of ground motions. The European Ground Motion Service (EGMS), funded by the European Commission as an essential element of the Copernicus Land Monitoring Service (CLMS), constitutes the first application of the InSAR technology to high-resolution monitoring of ground deformations over an entire continent, based on full-resolution processing of all Sentinel-1 (S1) satellite acquisitions over most of Europe (Copernicus Participating States).
Upscaling from existing national precursor services to pan-European scale is challenging. EGMS employs the most advanced persistent scatterer (PS) and distributed scatterer (DS) InSAR processing algorithms, and adequate techniques to ensure seamless harmonization between the Sentinel-1 tracks. Moreover, within EGMS, a Global Navigation Satellite System (GNSS) high-quality 50 km grid model is realized, in order to tie the InSAR products to the geodetic reference frame ETRF2014.
The millimeter-scale precision measurements of ground motions provided by EGMS will enable mapping and monitoring of landslides, subsidence and earthquake or volcanic phenomena all over Europe, and the stability of slopes, mining areas, buildings and infrastructures. The first release of EGMS products will be in March 2022, with annual updates to follow.
To foster as wide usage as possible, EGMS foresees tools for visualization, exploration, analysis and download of the ground deformation products, as well as elements to promote best practice applications and user uptake.
The new European geospatial dataset provided by EGMS will hopefully also stimulate the development of value-added products/services for the analysis and monitoring of ground motions and stability of structures based on InSAR measurements, as well as other InSAR products with higher spatial and/or temporal resolution.
This work will describe all the qualifying points of EGMS. Particular attention will be paid to the characteristics and the accuracy of the realized products, ensured in such a huge production by advanced algorithms and quality checks.
In addition, many examples of EGMS products will be shown to discuss the great potential and the (few) limitations of EGMS for mapping and monitoring landslides, subsidence and earthquake or volcanic phenomena, and the related stability of slopes, buildings and infrastructures.
How to cite: Costantini, M., Minati, F., Trillo, F., Ferretti, A., Passera, E., Rucci, A., Dehls, J., Larsen, Y., Marinkovic, P., Eineder, M., Brcic, R., Siegmund, R., Kotzerke, P., Kenyeres, A., Proietti, S., Solari, L., and Andersen, H.: EGMS: a New Copernicus Service for Ground Motion Mapping and Monitoring, EGU General Assembly 2022, Vienna, Austria, 23–27 May 2022, EGU22-9733, https://doi.org/10.5194/egusphere-egu22-9733, 2022.
EGU22-10347 | Presentations | NH6.5
Monitoring mining-induced ground deformation in Karagandy mining basin using InSARGauhar Meldebekova, Chen Yu, Jon Mills, and Zhenhong Li
Strata deformation associated with underground longwall coal mining can induce large magnitudes of ground surface subsidence. The Karagandy basin, one of the largest coal mining regions in Kazakhstan, is located in close proximity to urban areas and critical infrastructure, necessitating detailed investigation into the spatial distribution and temporal dynamics of subsidence. Synthetic aperture radar interferometry (InSAR) is recognised as a powerful tool to detect, map and quantify ground deformation. In this research, C-band Sentinel-1 products were used to implement interferometric and time-series analysis using the Small BAseline Subset (SBAS) algorithm. Subsidence bowls were detected over eight mining sites. The maximum annual velocity along line-of-sight, some ‑82 mm/year, was detected at the Kostenko mine, whilst cumulative subsidence reached a maximum of 350 mm in five years. Wavelet transform analysis was used to inspect the non-linear nature of the signal and confirmed the annual periodicity of ground deformation. Spatio-temporal analysis of subsidence patterns revealed the different drivers of deformation, with sites clustered accordingly. Results from the research offer considerable insight for facilitating decision-making in forward sustainable mining operations, both in Kazakhstan and further afield.
How to cite: Meldebekova, G., Yu, C., Mills, J., and Li, Z.: Monitoring mining-induced ground deformation in Karagandy mining basin using InSAR, EGU General Assembly 2022, Vienna, Austria, 23–27 May 2022, EGU22-10347, https://doi.org/10.5194/egusphere-egu22-10347, 2022.
EGU22-11186 | Presentations | NH6.5
Values and challenges of DInSAR derived velocity estimates for landslide hazard assessment and mappingMylene Jacquemart and Andrea Manconi
Deep-seated slope instabilities pose a significant hazard to infrastructure and livelihoods in mountain regions all around the world. Increasingly accesible data from synthetic aperture radar (SAR) satellites, such as ESA’ Copernicus Sentinel-1 mission, offer easier access to displacement data that can be used to detect, delineate, and monitor landslides in mountainous terrain. However, displacement measurements retrieved from differential interferometric processing (DInSAR) can be biased by the terrain geometry, which can lead to an underestimation of the true displacement. In addition, the quality of DInSAR results is highly susceptible to changes of surface geometry and moisture conditions, for example due to snow melt, hillslope erosion, or vegetation changes. Furthermore, the relative nature of DInSAR measurements can lead to underestimation of displacements due to phase aliasing. These factors may severely impact the accuracy of landslide velocities quantification. However, landslide velocities are often directly used in hazard assessment.
In Switzerland, mean and maximum landslide velocities are key factors used to assess the hazard intensity of unstable slopes, and thus to determine the slope hazard potential and consequently hazard zonation. The latter has direct implications for land use and land-use planning. In this study, we use two exemplary large deep-seated instabilities at Brienzauls (canton of Grisons) and Spitzer Stein (canton of Bern), both in Switzerland, to showcase the challenges of relying on DInSAR derived velocities for hazard mapping. We attempt to disentangle effects of terrain and orbit geometry on the measurable velocities from those caused by transient changes to surface geometry and conditions, and explore ways by which the value of DInSAR-derived displacement measurements can nevertheless be maximized for hazard zonation mapping.
How to cite: Jacquemart, M. and Manconi, A.: Values and challenges of DInSAR derived velocity estimates for landslide hazard assessment and mapping, EGU General Assembly 2022, Vienna, Austria, 23–27 May 2022, EGU22-11186, https://doi.org/10.5194/egusphere-egu22-11186, 2022.
EGU22-11733 | Presentations | NH6.5 | Highlight
Operational monitoring of our hazardous planet with Sentinel-1Tim Wright, Andy Hooper, Milan Lazecky, Yasser Maghsoudi, Karsten Spaans, and Tom Ingleby
The European Commission’s Sentinel-1 constellation, operated by ESA, has been a game changer for operational monitoring of our hazardous planet. When fully operational, the Sentinel-1 mission is a two-satellite constellation; currently consisting of Sentinel-1A (launched in 2014) and Sentinel-1B (launched in 2016), the mission provides at least one SAR image for the whole land surface every 12 days, with both ascending and descending data acquired in tectonic/volcanic areas globally every 12 days, and images acquired in both geometries every 6 days over all of Europe. The narrow orbital tube, consistent imaging geometry, and long time series are optimised for ground deformation measurements with InSAR. Sentinel-1C and -1D have been built and will replace the existing satellites in due course. Perhaps the most important game changer has been the Copernicus data policy, which mandates fully free and open distribution of Sentinel-1 products for all applications, whether they are for research or commercial purposes. Sentinel-1 InSAR data has quickly become the primary data set for monitoring ground movement in our hazardous planet. Several research organisations/collaborations now process enormous quantities of Sentinel-1 data to produce deformation products that are made freely available through organisations like COMET in the UK, EPOS and the new European Ground Motion Service in Europe, and the Alaska SAR Facility in the US. Commercial providers are processing data at scales ranging from individual bridges/dams through to whole countries. In this presentation we will focus on Sentinel-1 results produced academically by COMET and commercially by SatSense Ltd. COMET now responds routinely to all continental earthquakes bigger than M5.5 and provides interactive tools and machine-learning-based alerting for global volcanoes. COMET is combining Sentinel-1 InSAR with GNSS to map tectonic strain at high spatial resolution on a continental scale, in areas including Anatolia, Tibet and Iran, and using the results to improve our understanding of seismic hazard. SatSense have demonstrated the value of Sentinel-1 InSAR for applications including dam monitoring, water pipe failures and railway infrastructure. The SatSense processing approach allows InSAR ground movement data to be kept continuously up to date for entire countries. We conclude the presentation by discussing prospects for the future of InSAR beyond Sentinel-1.
How to cite: Wright, T., Hooper, A., Lazecky, M., Maghsoudi, Y., Spaans, K., and Ingleby, T.: Operational monitoring of our hazardous planet with Sentinel-1, EGU General Assembly 2022, Vienna, Austria, 23–27 May 2022, EGU22-11733, https://doi.org/10.5194/egusphere-egu22-11733, 2022.
EGU22-11969 | Presentations | NH6.5
Combined DInSAR-PSInSAR approach for increasing the quality of deformation map estimation in the area of underground mining exploitationNatalia Wielgocka, Kamila Pawluszek-Filipiak, and Maya Ilieva
Monitoring the deformation of the mining ground surface is crucial to ensuring the safety of residents, workers and the protection of all infrastructure in mining areas.The Polish realization of the European Plate Observing System project (EPOS-PL and its continuation EPOS-PL+) aims to build an infrastructure to monitor the deformation of the ground surface caused by extensive underground mining activities in the area of Upper Silesian Coal Basin in Southern Poland. Among many geodetic and geophysical approaches for monitoring, two different Interferometric Synthetic Aperture Radar (InSAR) techniques have been applied, also taking the advantage of the big set of freely available and with shorter revisiting time (6 days) Sentinel-1 satellite data. In the current study the Differential InSAR (DInSAR) and the Persistent Scattered Interferometry (PSInSAR) approaches are compared, evaluated and integrated. Various processing strategies are tested aiming to increase the quality of the produced integrated deformation maps. The optimal processing strategy should accurately detect stable areas, estimate the small deformation, as well as the maximum deformation gradient occurring in the center of the subsidence bowl directly in the excavation area.
One of the main error contributors to the Sentinel-1 data is the water vapor in the atmosphere that might slower the radar signal and modulate the results. Thus, the atmospheric artefacts have to be minimized since they are one of the main effects that limits the accuracy of interferometric products. In the PSInSAR approach high-pass and low-pass filtering has been used, while in the DInSAR approach – estimation of the Atmospheric Phase Screen has been made based on polynomial surface estimation using stable coherent points. Comparison of the one-year cumulated deformation for the area of Rydułtowy mine in Poland with ground truth data such as static GNSS measurement on reference points shows that PSInSAR results are more accurate. However, due to the linear deformation model required in the PSInSAR processing the areas in the center of the subsidence bowls were not estimated. Therefore, the difference between PSInSAR and DInSAR results was used for the refinement of the DInSAR deformation map. This refinement was made based on various statistical approaches (e.g. polynomial interpolation, kriging, inverse distance weighted-IDW). The results of IDW and kriging shows the best performance and allowed to minimize errors associated with DInSAR approach and provide a more accurate deformation map in the area of mining as well as provided the opportunity to capture maximal deformation gradient.
How to cite: Wielgocka, N., Pawluszek-Filipiak, K., and Ilieva, M.: Combined DInSAR-PSInSAR approach for increasing the quality of deformation map estimation in the area of underground mining exploitation, EGU General Assembly 2022, Vienna, Austria, 23–27 May 2022, EGU22-11969, https://doi.org/10.5194/egusphere-egu22-11969, 2022.
Please decide on your access
Please use the buttons below to download the presentation materials or to visit the external website where the presentation is linked. Regarding the external link, please note that Copernicus Meetings cannot accept any liability for the content and the website you will visit.
Forward to presentation link
You are going to open an external link to the presentation as indicated by the authors. Copernicus Meetings cannot accept any liability for the content and the website you will visit.
We are sorry, but presentations are only available for users who registered for the conference. Thank you.
EGU22-12444 | Presentations | NH6.5
New advances of the P-SBAS algorithm for the efficient generation of full resolution DInSAR products through scalable HPC infrastructuresRiccardo Lanari, Manuela Bonano, Sabatino Buonanno, Michele Manunta, Pasquale Striano, Muhammad Yasir, and Ivana Zinno
The widespread availability of large SAR data volumes systematically acquired during the last 3 decades by several space-borne sensors, operating with different spatial resolutions, footprint extensions, revisit times and bandwidths (typically X-, C-, or L-band), has promoted the development of advanced Differential Interferometric SAR (DInSAR) techniques providing displacement time series relevant to wide areas with rather limited costs. These techniques allow us to carry out detailed analyses of the Earth surface deformation effects caused by various natural and anthropic phenomena and also to investigate the displacements affecting man-made structures. In particular, with reference to the latter issue, the increasing need to assess, preserve and mitigate the health conditions of buildings and infrastructures, due to the high vulnerability of the built-up environment, has fostered over the last decades an intense exploitation of the advanced DInSAR techniques. In this context, a new frontier for the development of these methodologies is related to their effective exploitation in operational contexts, requiring the use of up-to-date interferometric processing techniques and advanced HPC infrastructures to precisely and efficiently generate value-added information from the available, multi-temporal large SAR data stacks.
Among several advanced DInSAR algorithms, a widely used approach is the Small BAseline Subset (SBAS) technique which has largely demonstrated its effectiveness to retrieve deformations relevant to natural and anthropic hazard scenarios, through the generation of spatially dense mean velocity maps and displacement time series with millimetric accuracy, at different spatial resolution scales (both regional and local ones). Moreover, a parallel algorithmic solution for the SBAS approach, referred to as the parallel Small BAseline Subset (P-SBAS) technique, has been recently developed.
In this work, we present some new advances of the full resolution P-SBAS DInSAR processing chain that allow us to effectively retrieve, in reasonable time frames (less than 24 hours), the spatial and temporal patterns of the deformation signals associated to the built-up heritage. This is achieved through a dedicated implementation of the full resolution P-SBAS processing chain permitting to efficiently exploit HPC resources, also accessible through Cloud Computing environments. In particular, we make an extensive use of innovative hardware and software parallel solutions based on GPUs, which are able to efficiently store, retrieve and process huge amounts of full resolution DInSAR products, with high scalability performance.
To demonstrate the capability of the implemented solution we show the results of the massive full resolution P-SBAS processing relevant to several urban areas of the Italian territory. This is done by exploiting the overall, full frame SAR image stacks of ascending and descending X-band SAR data acquired by the sensors of the Italian COSMO-SkyMed (CSK) constellation, operated through the Stripmap mode (with about 3m x 3 m spatial resolution), and those of the C-band Sentinel-1 twin sensors of the Copernicus Programme, exploiting the Interferometric Wide Swath TOPS mode (with about 15 m x 4 m spatial resolution). Moreover, we also benefit from the availability of the first data acquired by the second generation COSMO-SkyMed constellation (CSG), which allows continuity with the CSK data in the monitoring of the detected deformation phenomena.
How to cite: Lanari, R., Bonano, M., Buonanno, S., Manunta, M., Striano, P., Yasir, M., and Zinno, I.: New advances of the P-SBAS algorithm for the efficient generation of full resolution DInSAR products through scalable HPC infrastructures, EGU General Assembly 2022, Vienna, Austria, 23–27 May 2022, EGU22-12444, https://doi.org/10.5194/egusphere-egu22-12444, 2022.
EGU22-12583 | Presentations | NH6.5
InSAR application for the detection of precursors on the Achoma landslide, PeruBenedetta Dini, Pascal Lacroix, and Marie-Pierre Doin
In the last few decades, InSAR has been used to identify ground deformation related to slope instability and to retrieve time series of landslide displacements. In some cases, retrospective retrieval of time series revealed acceleration patterns precursory to failure. This suggests that, the higher temporal sampling of new generation satellites, may indeed offer the opportunity to detect motion precursory to failure with viable lead time.
However, the possibility to retrieve continuous time series over landslides is often impaired by factors such as unfavourable orientation or landcover and fast movements, which make phase unwrapping difficult if not, in certain cases, impossible.
One way to retrieve precursors of destabilisation for landslides that present characteristics unfavourable to unwrapping and to time series inversion is to analyse in detail changes in successive interferograms in the phase domain in combination with interferometric coherence.
We generated and analysed 102 Sentinel-1 interferograms, covering the period between April 2015 and February 2021, at high spatial resolution (8 and 2 looks in range and azimuth respectively) over the Achoma landslide in the Colca valley, Peru. This large, deep-seated landslide, covering an area of about 40 hectares, previously unidentified, failed on 18th June 2020, damming the Rio Colca and giving origin to a lake.
We developed a method to analyse the changes through time of the unwrapped phase difference between a stable point and points within the landslide. In combination with this, we investigated patterns of coherence loss both within the landslide and in the surrounding area.
We observed that, in the weeks prior to the landslide, there was an increase of the phase difference between a stable reference and points within the landslide, indicating an acceleration of the downslope displacements. In addition to that, seasonal coherence loss is seen both within the landslide and in the surrounding area, in correspondence with wet periods. However, we observed also significant, local coherence loss outlining the scarp and the southeastern flank of the landslide, intermittently in the years before failure, in periods in which coherence was overall higher. Moreover, we observe a sharp decrease in the ratio between the coherence within the landslide and in the surrounding area, roughly six months before the failure.
This type of approach is promising with respect to the extraction of relevant information from interferometric data when the generation of accurate and continuous time series of displacements is hindered by the nature of landcover or of the landslide studied, such in the case of the Achoma landslide. The combination of key, relevant parameters and their changes through time obtained with this methodology may prove necessary for the identification of precursors over a wider range of landslides than with time series generation alone.
How to cite: Dini, B., Lacroix, P., and Doin, M.-P.: InSAR application for the detection of precursors on the Achoma landslide, Peru, EGU General Assembly 2022, Vienna, Austria, 23–27 May 2022, EGU22-12583, https://doi.org/10.5194/egusphere-egu22-12583, 2022.
EGU22-12646 | Presentations | NH6.5
Assessment of Land Subsidence Hazard, Vulnerability and Risk: A case study for National Capital Region in IndiaShagun Garg, Mahdi Motagh, Indu Jayaluxmi, Vamshi Karanam, Sivasakthy Selvakumaran, and Andrea Marinoni
Risk assessment and zoning are very important to risk management as it indicates how severe the hazard can be, and who would be most affected. It plays a crucial role in risk management, especially for densely populated areas.
Delhi- the capital of India, is the fifth most populous city in the world, with a population density of nearly 30,000 people per square mile. Like other global megacities, Delhi is also facing a looming water crisis due to urbanization and rapid population expansion. The increasing demand for water has translated into the extraction of larger quantities of groundwater in the region. One of the many consequences of groundwater over-extraction is land subsidence. Amongst all other ways to monitor land subsidence, Interferometric Synthetic Aperture Radar (InSAR) is considered to be the most effective and widely used technique. We used the InSAR technique and analyzed Sentinel-1 data acquired during 2014 - 2020 and identified some localized subsidence zones in the region. In addition to that, a risk assessment was also performed by considering hazards and vulnerability approach.
In this study, a land subsidence risk assessment index was proposed based on the Disaster Risk Index. The cumulative subsidence volume, the land subsidence velocity, subsidence gradient, and the groundwater exploitation intensity were collected, analyzed, and put together to create a land subsidence hazard evaluation map in the National capital region India. The population density, land cover, and population estimates were adopted as indexes to create the vulnerability map. Finally, the land subsidence risk map was created by combining the hazard and vulnerability maps using the matrix multiplication approach. Specifically, the final risk map was classified into three levels, i.e., high, medium, and low. The analysis highlights an approximate area of 100 square kilometers to be subjected to the highest risk level of land subsidence, demanding urgent attention. The findings of this study are highly relevant for government agencies to formulate new policies against the over-exploitation of groundwater and to facilitate a sustainable and resilient groundwater management system in Delhi NCR.
How to cite: Garg, S., Motagh, M., Jayaluxmi, I., Karanam, V., Selvakumaran, S., and Marinoni, A.: Assessment of Land Subsidence Hazard, Vulnerability and Risk: A case study for National Capital Region in India, EGU General Assembly 2022, Vienna, Austria, 23–27 May 2022, EGU22-12646, https://doi.org/10.5194/egusphere-egu22-12646, 2022.
EGU22-12898 | Presentations | NH6.5
Subsidence in Askja Caldera between 2015 to 2021Josefa Sepúlveda, Andy Hooper, Susanna Ebmeier, and Camila Novoa
Iceland is in a Mid Ocean Ridge, where the North American Plate is moving far away from Eurasian Plate at a relative rate of 18-19 mm/yr. The boundary between plates is marked by an active neovolcanism expressed by different volcanoes centres and fissures swarms. Askja volcano is located in the North Volcanic Zone of Iceland. It has an area of 45 km3 and hosts three calderas. Three main eruptions have been observed during different periods: i) 1874 to 1876, ii) 1921-1929, and iii) 1961. Monitoring data have shown a period of alternance between subsidence and uplift between 1966 to 1972. Thereafter, since at least 1983 the caldera has been subsiding at a rate of 5 cm/yr, but this rate has been decaying slowing with time. Additionally, tomography data has revealed a possible deeper zone (between 9 and 15 km depth) below the volcano where melting is storage and also the seismicity between 20 and 25 km depth may be interpreted like a magma movement in this area. However, there are still questions about what is producing the subsidence at Askja. In this work, we present Interferometry Synthetic Aperture Radar (InSAR) results during the period of 2015 to 2021 in Askja. This data will help to constraint what is it causing the subsidence at Askja Caldera.
How to cite: Sepúlveda, J., Hooper, A., Ebmeier, S., and Novoa, C.: Subsidence in Askja Caldera between 2015 to 2021, EGU General Assembly 2022, Vienna, Austria, 23–27 May 2022, EGU22-12898, https://doi.org/10.5194/egusphere-egu22-12898, 2022.
EGU22-881 | Presentations | NH6.3
Performance testing of optical flow time series analyses based on a fast, high–alpine landslideDoris Hermle, Michele Gaeta, Michael Krautblatter, Paolo Mazzanti, and Markus Keuschnig
Accurate remote analyses of high–alpine landslides are a key requirement for future alpine safety. In critical stages of alpine landslides, UAV (unmanned aerial vehicle) data can be employed, using image registration techniques to derive ground motion with high temporal and spatial resolution. Nevertheless, the classical area–based algorithms, dynamic surface alterations, and limited velocity range restrict detection, which results in noise from decorrelation, preventing their application to fast and complex landslides.
Here for the first time to our knowledge, we apply optical flow time series to analyse one of the fastest and most critical debris flow source zones in Austria. The benchmark site Sattelkar (2’130-2’730 m asl), a steep, high–alpine cirque in Austria, is highly sensitive to rainfall and melt–water events, which led to a 70.000 m³ debris slide event in July 2014. We use a UAV data set (0.16 m) collected over three years (five acquisitions, 2018-2020). Our novel approach is to employ optical flow, which, along with phase correlation, is incorporated into the software IRIS. To test the performance, we compared the two algorithms by applying them to image stacks to calculate time–series displacement curves and ground motion maps. These maps enable us to precisely identify compartments of the complex landslide body and reveal different displacement patterns, with displacement curves reflecting an increased acceleration. Traceable boulders in the UAS orthophotos independently validate the methodology applied. We demonstrate that UAV optical flow time series analysis generates a better signal extraction and a wider observable velocity range, highlighting how it can be applied to a fast, high–alpine landslide.
How to cite: Hermle, D., Gaeta, M., Krautblatter, M., Mazzanti, P., and Keuschnig, M.: Performance testing of optical flow time series analyses based on a fast, high–alpine landslide, EGU General Assembly 2022, Vienna, Austria, 23–27 May 2022, EGU22-881, https://doi.org/10.5194/egusphere-egu22-881, 2022.
Please decide on your access
Please use the buttons below to download the presentation materials or to visit the external website where the presentation is linked. Regarding the external link, please note that Copernicus Meetings cannot accept any liability for the content and the website you will visit.
Forward to presentation link
You are going to open an external link to the presentation as indicated by the authors. Copernicus Meetings cannot accept any liability for the content and the website you will visit.
We are sorry, but presentations are only available for users who registered for the conference. Thank you.
EGU22-1013 | Presentations | NH6.3
Exploring knowledge-based and data-driven approaches to map earthflow and gully erosion features in New ZealandDaniel Hölbling, Lorena Abad, Raphael Spiekermann, Hugh Smith, Andrew Neverman, and Harley Betts
In New Zealand, earthflows and gullies are - next to shallow landslides - important erosion processes and sediment sources in hill country areas. They can cause damage to infrastructure, affect the productivity of farmland, and impact water quality due to fine sediment input to streams. Implementing effective erosion mitigation measures requires detailed information on the location, extent, and spatial distribution of these features over large areas. Remote sensing provides an excellent opportunity to gain such knowledge, whereby different approaches can be applied. In this study, we present two approaches for detecting earthflow and gully erosion features on the North Island of New Zealand.
Earthflows are complex mass movement features that can occur on gentle to moderate slopes in plastic, mixed, and disturbed earth with significant internal deformation, whereby vegetation cover usually remains on the earthflow bodies during movement. High-resolution aerial photography and a LiDAR digital elevation model (DEM), including a range of derived products such as slope, surface roughness, terrain wetness index, were used within a knowledge-based object-based image analysis (OBIA) workflow to semi-automatically map potential earthflows. Specific earthflow characteristics discernible from the optical imagery, such as the presence of bare ground at the toe and rushes, were identified on different hierarchical segmentation levels and subsequently aggregated. Additionally, morphological and contextual properties (e.g. connection to streams) were integrated into the mapping workflow. Gully erosion is an indicator of land degradation, which occurs due to the removal of soil along drainage channels through surface water runoff. We tested a region-based convolutional neural network (Mask-RCNN) deep learning approach for object detection to map gully features. The deep learning was performed on three LiDAR DEM terrain derivatives, namely, slope length and steepness (LS) factor, hillshade and terrain ruggedness index. Labelled chips for training data were generated with reference gully features mapped manually on historical aerial photography.
Semi-automated earthflow detection appeared to be very challenging due to their complexity and the lack of distinct characteristics to differentiate them from other features. The initial results suggest the knowledge-based OBIA workflow has potential, but a major challenge is the creation of objects that represent one earthflow. Hence, the current mapping results may better indicate terrain susceptible to potential earthflow occurrence rather than correctly detecting single earthflows. As for gully mapping, the data-driven deep learning framework shows promising results regarding gully presence and absence. Validation resulted in detected gullies overlapping 60% of the reference gully area. However, a limiting factor related to the available reference data that was mapped on historical aerial photography and does not align with the LiDAR DEM. Given the significant impact of earthflows and gullies, it is essential to develop reliable and targeted analysis methods to better understand their spatial occurrence and enable improved representation of these erosion processes in catchment sediment budget models.
How to cite: Hölbling, D., Abad, L., Spiekermann, R., Smith, H., Neverman, A., and Betts, H.: Exploring knowledge-based and data-driven approaches to map earthflow and gully erosion features in New Zealand, EGU General Assembly 2022, Vienna, Austria, 23–27 May 2022, EGU22-1013, https://doi.org/10.5194/egusphere-egu22-1013, 2022.
Please decide on your access
Please use the buttons below to download the presentation materials or to visit the external website where the presentation is linked. Regarding the external link, please note that Copernicus Meetings cannot accept any liability for the content and the website you will visit.
Forward to presentation link
You are going to open an external link to the presentation as indicated by the authors. Copernicus Meetings cannot accept any liability for the content and the website you will visit.
We are sorry, but presentations are only available for users who registered for the conference. Thank you.

EGU22-1139 | Presentations | NH6.3
Large deformation field from InSAR during 2015 to 2021 for the Makran subduction and North TibetXiaoran Lv, Falk Amelung, Yun Shao, and Xiaoyong Wu
We have calculated the deformation velocity field for the Makran subduction and North Tibet region with the spatial range of [25°N - 31°N; 55°E-67°E] and [30N°-41°N; 85°E-97°E], respectively. There are two significant deformation signals in the epicenter of the 2013 Mw 7.7 Balochistan earthquake and the 2001 Mw 7.8 Kokoxili earthquake. For the Balochistan earthquake, we found that the 7-year post-seismic deformation was due to the widespread aseismic slip along the megathrust and not due to the viscoelastic relaxation. For the Kokoxili earthquake, we probed whether the viscoelastic relaxation of 2001 Kokoxili earthquake is still continuing. We first simulate the deformation caused by the interseismic slip along the major active faults in Tibet. By comparing the simulated deformation and the observed deformation, we found the maximum ratio of the simulated deformation to the observation is 42%, which means that the viscoelastic relaxation of 2001 Kokoxili earthquake is still continuing. The effective viscosities of lower crust and upper mantle are inverted as 1.78*1019Pas and 1.78 * 1020Pas, respectively.
How to cite: Lv, X., Amelung, F., Shao, Y., and Wu, X.: Large deformation field from InSAR during 2015 to 2021 for the Makran subduction and North Tibet, EGU General Assembly 2022, Vienna, Austria, 23–27 May 2022, EGU22-1139, https://doi.org/10.5194/egusphere-egu22-1139, 2022.
EGU22-1173 | Presentations | NH6.3
InSAR measurements of ground deformations at Ischia island (Naples, Italy) along two decades datasetLisa Beccaro, Cristiano Tolomei, Claudia Spinetti, Marina Bisson, Laura Colini, Riccardo De Ritis, and Roberto Gianardi
Ground deformation at volcanic areas is mainly driven by the interaction between lithology, morphology, seismology and volcanism. In the latest decades, radar interferometry has contributed to understand the volcanic dynamics through the measurement of ground deformations. This work focuses on the displacement analysis at Ischia, an active volcanic island located at the north-western end of the Gulf of Naples and characterized by a long eruptive and seismic history. The central portion of the island is dominated by Mt. Epomeo, a volcano-tectonic horst formed by caldera resurgence, tilted southward and bordered by a system of faults and fractures which represent the preferred degassing pathway of the hydrothermal system beneath the island. Seismicity is mainly concentrated in the northern area and the most recent and severe seismic sequence started with the Mw 3.9 earthquake on August 21st 2017 producing several damages and also victims. In this study, the investigation of surface displacement was carried out over a continuous time interval of about 17 years by using Synthetic Aperture Radar (SAR) dataset with different temporal and spatial resolutions. The Small Baseline Subset interferometric technique was applied to the dataset allowing the identification of the areas more potentially prone to trigger slope instability phenomena. The resulting ground displacement maps identified the highest deformations along the north-western, western and southern slopes of Mt. Epomeo and were validated by using GPS data acquired by local geodetic network. Mean velocity maps obtained from C-band Envisat and Sentinel-1 and X-band COSMO-SkyMed SAR data will be presented together with the ground deformation effects caused by the 2017 seismic swarm.
How to cite: Beccaro, L., Tolomei, C., Spinetti, C., Bisson, M., Colini, L., De Ritis, R., and Gianardi, R.: InSAR measurements of ground deformations at Ischia island (Naples, Italy) along two decades dataset, EGU General Assembly 2022, Vienna, Austria, 23–27 May 2022, EGU22-1173, https://doi.org/10.5194/egusphere-egu22-1173, 2022.
Please decide on your access
Please use the buttons below to download the presentation materials or to visit the external website where the presentation is linked. Regarding the external link, please note that Copernicus Meetings cannot accept any liability for the content and the website you will visit.
Forward to presentation link
You are going to open an external link to the presentation as indicated by the authors. Copernicus Meetings cannot accept any liability for the content and the website you will visit.
We are sorry, but presentations are only available for users who registered for the conference. Thank you.
EGU22-1329 | Presentations | NH6.3 | Highlight
Investigation of the Magnetospheric–Ionospheric–Lithospheric Coupling on occasion of the 14 August 2021 Haitian EarthquakeGiulia D'Angelo, Mirko Piersanti, Roberto Battiston, Igor Bertello, Antonio Cicone, Piero Diego, Francesco Follega, Roberto Iuppa, Coralie Neubuser, Emanuele Papini, Alexandra Parmentier, Dario Recchiuti, and Pietro Ubertini
In the last few decades, the effort of the scientific community to clarify the issue of short-term forecasting of earthquakes has grown fast also thanks to the increasing number of data coming from networks of ground stations and satellites. This led to the discovery of several atmospheric and ionospheric anomalies statistically related to seismic activity, such as ionospheric plasma density perturbations and/or atmospheric temperature and pressure changes. With the aim to contribute in the understanding of the physical mechanisms behind the coupling between the lithosphere, lower atmosphere, ionosphere and magnetosphere during an earthquake, this paper presents a multi-instrumental analysis of a low latitude seismic event (Mw = 7.2), occurred in the Caribbean region on 14 August 2021. The earthquake happened during both super solar quiet and fair weather conditions, representing an optimal case study to the attempt of reconstructing the seismic scenario in terms of the link between lithosphere, atmosphere, ionosphere and magnetosphere. The proposed reconstruction based on ground and satellites high quality observations, suggests that the fault break generated an atmospheric gravity wave able to perturb mechanically the ionospheric plasma density, which, in turn, drove the generation of both electromagnetic waves and magnetospheric field line resonance frequency variation. The comparison between observations and the recent analytical Magnetospheric Ionospheric Lithospheric Coupling (M.I.L.C.) model confirms the activation of the lithosphere–atmosphere–ionosphere–magnetosphere chain. In addition, the observations of the China Seismo-Electromagnetic Satellite (CSES-01), which was flying over the epicentre some hours before the earthquake, confirms both the presence of electromagnetic wave activity coming from the lower ionosphere and plasma density variation consistent with the anomaly distribution of plasma density detected at ground by a chain of Global Navigation Satellite System stations located around the epicentre.
How to cite: D'Angelo, G., Piersanti, M., Battiston, R., Bertello, I., Cicone, A., Diego, P., Follega, F., Iuppa, R., Neubuser, C., Papini, E., Parmentier, A., Recchiuti, D., and Ubertini, P.: Investigation of the Magnetospheric–Ionospheric–Lithospheric Coupling on occasion of the 14 August 2021 Haitian Earthquake, EGU General Assembly 2022, Vienna, Austria, 23–27 May 2022, EGU22-1329, https://doi.org/10.5194/egusphere-egu22-1329, 2022.
EGU22-2444 | Presentations | NH6.3 | Highlight
Possible precursory indicators for the devastating fire in North Evia island during August 2021, using remotely sensed and Earth-observation dataAlexandra Gemitzi and Nikos Koutsias
The present work aims at unveiling possible precursory signals of the devastating fire in North Evia island, during August 2021, that destroyed approximately 400 km2 of forest and cultivated land. Therefore, the time series of two environmental parameters known to be related to wild fire occurrence, i.e. soil moisture and Normalized Difference Vegetation Index (NDVI) were extracted and analyzed. Soil moisture in the top soil layer from 0 to 7cm was extracted from the ERA5-Land Monthly Averaged - ECMWF Climate Reanalysis data set at a spatial resolution of 9 km. The time series of remotely sensed NDVI was accessed through the Landsat 8 mission, at a spatial resolution of 30m, with a 32-day time step. Both time series covered the period from January 2015 to October 2021. Results indicated two specific patterns in the examined time series. Soil moisture time series in the affected areas demonstrated a shard declining trend since 2018, reaching its lowest value just prior the fire events in North Evia. The NDVI time series did not show any distinctive trend during the examined period in the affected sites, however comparing it to surrounding unaffected areas with the same extent, occupied from the same land cover types, an alarming finding was revealed; the NDVI time series in the affected sites demonstrated statistically significant lower variability compared to unaffected ones. This difference corresponds to a more homogeneous vegetation and possible absence of fire breaks in the burned areas compared to the ones that were not affected. Findings of the present work may help in highlighting areas with specific characteristics related to soil moisture and NDVI, that indicate a high risk of fire occurrence.
How to cite: Gemitzi, A. and Koutsias, N.: Possible precursory indicators for the devastating fire in North Evia island during August 2021, using remotely sensed and Earth-observation data, EGU General Assembly 2022, Vienna, Austria, 23–27 May 2022, EGU22-2444, https://doi.org/10.5194/egusphere-egu22-2444, 2022.
EGU22-3853 | Presentations | NH6.3
Landslide susceptibility mapping of Chitral, northwestern Pakistan using GISSaid Mukhtar Ahmad
Landslide susceptibility mapping of Chitral, northwestern Pakistan using GIS
Mukhtar S. Ahmad1, *, Mona Lisa1, Saad Khan2 Munawar Shah3
1Department of Earth Sciences, Quaid-I-Azam University, Islamabad 45320, Pakistan
2Bacha Khan University Charsadda, Pakistan
3Department of Space Science, Institute of Space Technology, 44000 Islamabad, Pakistan
1mukhtargeo44@gmail.com
1lisa_qau@yahoo.com
2saadkhan@bkuc.edu.pk
3shahmunawar1@gmail.com
*Corresponding author: mukhtargeo44@gmail.com
Abstract
Landslides are the most frequently occurring geohazard in rugged Himalayan mountainous terrains. They often cause significant loss to life and property, and therefore landslide susceptibility mapping (LSM) has become increasingly urgent and important. In this study, LSM is carried out in the Chitral district of the Hindukush region in northwestern Pakistan. Several Geographic Information System (GIS) based models (such as Analytical Hierarchy Process (AHP), weighted overlay) has been used to build landslide inventory and susceptibility maps. The study incorporated nine main factors (including human-induced parameters, such as distance from road; topographical parameters, such as slope, aspect, and landcover; geological parameters, such as lithology, distance to fault, seismicity; hydrological parameters, such as rainfall and distance to stream) to generate LSM, further classified in five classes, very high susceptibility zone, high, moderate, low, and very low susceptible zone. It is concluded that most of the landslides in the study area are the result of steep slopes of mountains, followed by precipitation and earthquake. Landslide in the form of rockfall is mostly due to the active seismicity of the Hindukush region. The predicted susceptible zones of landslide in the study area are in good agreement with the past landslide localities, which is an indication of the susceptibility mapping of landslides in the region.
How to cite: Ahmad, S. M.: Landslide susceptibility mapping of Chitral, northwestern Pakistan using GIS, EGU General Assembly 2022, Vienna, Austria, 23–27 May 2022, EGU22-3853, https://doi.org/10.5194/egusphere-egu22-3853, 2022.
EGU22-4082 | Presentations | NH6.3 | Highlight
Timing landslide and flash flood events from radar satelliteAxel Deijns, Olivier Dewitte, Wim Thiery, Nicolas d'Oreye, Jean-Philippe Malet, and François Kervyn
Landslides and flash floods are geomorphic hazards (hereafter called GH) that often co-occur and interact. Such events generally occur very quickly, leading to catastrophic impacts. In this study we focus on the accurate estimation of the timing of GH events using satellite Synthetic Aperture Radar (SAR) remote sensing. More specifically, we focus on a tropical region, i.e. environments that are frequently cloud-covered and where space-based accurate characterization of the timing of GH events at a regional scale can only be achieved through the use of SAR given its cloud penetrating capabilities. In our multi-temporal change analysis method we investigated amplitude, spatial amplitude correlation and coherence time series of four recent large GH events of several hundreds of occurrences each covering various terrain conditions and containing combinations of landslides and flash floods within the western branch of the East African Rift located in tropical Africa. We identified changes that could be attributed to the occurrence of the GH events within the SAR time series and estimated GH even timing from it. We compared the SAR time series with vegetation and rainfall time series to better understand the environmental influence imposed by the variying terrain conditions. The Copernicus Sentinel 1 satellite is the key product used, which next to being open access, offers a dense, high resolution time series within our study area. The results show that SAR can provide valuable information for GH event timing detection. The most accurate GH event timing estimations were achieved using the coherence time series ranging from one day to a 1,5 month difference from the GH event occurrence, followed by the spatial amplitude correlation time series with one day to a 2,5 month difference. Amplitude time series were highly influenced by seasonality and proved to be insufficient for accurate GH event timing estimation. The results provide additional insight into the influence of seasonal vegetation and rainfall patterns for varying landscape conditions on the SAR time series. This research is one of the first to show the capabilities of SAR to constrain the timing of GH events with an accuracy much higher than what can be obtained from optical imagery in cloud-covered environments. These methodological results have the potential to be implemented in cloud-based computing platforms to help improve GH event detection tools at regional scales, and help to establish unprecedented GH event inventories in changing environments such as the East African Rift.
How to cite: Deijns, A., Dewitte, O., Thiery, W., d'Oreye, N., Malet, J.-P., and Kervyn, F.: Timing landslide and flash flood events from radar satellite, EGU General Assembly 2022, Vienna, Austria, 23–27 May 2022, EGU22-4082, https://doi.org/10.5194/egusphere-egu22-4082, 2022.
EGU22-4849 | Presentations | NH6.3 | Highlight
Extending the integrated monitoring of deep-seated landslide activity into the past using free and open-source photogrammetryJohannes Branke, Thomas Zieher, Jan Pfeiffer, Magnus Bremer, Martin Rutzinger, Bernhard Gems, Margreth Keiler, and Barbara Schneider-Muntau
Deep-seated gravitational slope deformations (DSGSDs) pose serious threats to buildings and infrastructure in mountain regions. The understanding of past movement behavior are essential requirements for enhancing process knowledge and potential mitigation measures. In this context historical aerial imagery provides a unique possibility to assess and reconstruct the deformation history of DSGSDs. This study investigates the feasibility of 3D point clouds derived from historical aerial imagery using free and open-source (FOSS) photogrammetric tools for analyzing the long-term behavior of the Reissenschuh DSGSD in the Schmirn valley (Tyrol, Austria) and assessing related secondary processes as changes in creep velocity, rockfall or debris flows. For the photogrammetric analyses, scanned analogue and digital imagery of six acquisition flights, conducted in 1954, 1971/1973, 2007, 2010, and 2019, have been processed using the FOSS photogrammetric suite MicMac. Further point cloud processing was carried out in CloudCompare. An improved version of the image correlation approach (IMCORR) implemented in SAGA GIS was used for the area-wide assessment of slope deformation. For the georeferencing and scaling an airborne laser scanning (ALS) point cloud of 2008 provided by the Federal State of Tyrol (Austria) was used. In total five photogrammetric 3D point clouds covering the period from 1954 to 2019 were derived and analyzed in terms of displacement, velocity and acceleration. The accuracy assessment with computed Multiscale Model to Model Cloud Comparison (M3C2) distances between photogrammetric 3D point clouds and reference ALS 3D point cloud, showed an overall uncertainty of about ±1.2 m (95% quantile) for all 3D point clouds produced with scanned analogue aerial images (1954, 1971/1973 and 2007), whereas 3D point clouds produced with digital aerial imagery (2010, 2019) showed a distinctly lower uncertainty of about ±0.3 m (95% quantile). Also, digital elevation models (DEM) of difference (DoD) for each epoch were calculated. IMCORR and DoD results indicate significant displacements up to 40 meters in 65 years for the central part of the landslide. The historical datasets further indicate a change of spatio-temporal patterns of movement rates and a minor but overall acceleration of the landslide. The main challenges were the (i) gaps in the 3D point clouds on areas of steep, shadowed slopes and high vegetation, (ii) ground filtering on the photogrammetric point clouds for accurate calculation of digital terrain models (DTMs) and (iii) the quality of the scanned aerial imagery showing scratches, cuts, color irritations and linear artefacts. This research enabled the characterization of the spatio-temporal movement patterns of the Reissenschuh DSGSD over more than six decades. Further research will use the results as a reference for modelling the discussed multi-hazard processes.
This research was partly conducted within the project EMOD-SLAP funded by the Tyrolean Science Fund (TWF).
How to cite: Branke, J., Zieher, T., Pfeiffer, J., Bremer, M., Rutzinger, M., Gems, B., Keiler, M., and Schneider-Muntau, B.: Extending the integrated monitoring of deep-seated landslide activity into the past using free and open-source photogrammetry, EGU General Assembly 2022, Vienna, Austria, 23–27 May 2022, EGU22-4849, https://doi.org/10.5194/egusphere-egu22-4849, 2022.
Please decide on your access
Please use the buttons below to download the presentation materials or to visit the external website where the presentation is linked. Regarding the external link, please note that Copernicus Meetings cannot accept any liability for the content and the website you will visit.
Forward to presentation link
You are going to open an external link to the presentation as indicated by the authors. Copernicus Meetings cannot accept any liability for the content and the website you will visit.
We are sorry, but presentations are only available for users who registered for the conference. Thank you.

EGU22-5291 | Presentations | NH6.3
Electromagnetic anomalies detection over seismic regions during an earthquakeDario Recchiuti, Giulia D'angelo, Emanuele Papini, Piero Diego, Antonio Cicone, Alexandra Parmentier, Pietro Ubertini, Roberto Battiston, and Mirko Piersanti
The definition of the statistical distribution of the ionospheric electromagnetic (EM) waves energy in absence of seismic activity and other anomalous inputs (such as the ones derived by solar forcing) is a necessary step in order to determine a background in the ionospheric EM emissions over seismic regions. An EM signal which differs from the background (exceeding a statistically meaningful threshold) should be considered as a potential event to be investigated. In this work, by means of the FIF (Fast Iterative Filtering) data analysis technique, we performed a multiscale analysis of the ionospheric environmental background, using almost the entire CSES01 (China Seismo-ElectroMagnetic Satellite) electric and magnetic field dataset (2019 - 2021), by creating the map of the averaged relative energy (εrel) over a 3° x 3° latitude-longitude cell, depending on both spatial and temporal scale of the ionospheric medium.
In order to make a robust discrimination between external (atmospheric, ionospheric, magnetospheric, solar activities) and internal (earthquakes, volcanoes) sources generating anomalous signals, we took into account geomagnetic activity conditions in terms of the Sym-H index.
Here we present the results obtained for the August 14, 2021 Haitian earthquake (7.2 MW) and the September 27, 2021 Crete (Greece) earthquake (6.0 MW).
How to cite: Recchiuti, D., D'angelo, G., Papini, E., Diego, P., Cicone, A., Parmentier, A., Ubertini, P., Battiston, R., and Piersanti, M.: Electromagnetic anomalies detection over seismic regions during an earthquake, EGU General Assembly 2022, Vienna, Austria, 23–27 May 2022, EGU22-5291, https://doi.org/10.5194/egusphere-egu22-5291, 2022.
EGU22-5803 | Presentations | NH6.3 | Highlight
SAR-based scientific products in support to recovery from hurricanes and earthquakes: lessons learnt in Haiti from the CEOS Recovery Observatory pilot to the demonstratorDeodato Tapete, Francesca Cigna, Agwilh Collet, Hélène de Boissezon, Robin Faivre, Andrew Eddy, Jens Danzeglocke, Philemon Mondesir, David Telcy, Esther Manasse, Boby Emmanuel Piard, and Samuel Généa
Since 2014, the Committee on Earth Observation Satellites (CEOS) has been working on means to increase the contribution of satellite data to recovery from major disasters. The 4 year-long Recovery Observatory (RO) pilot project, led by CNIGS with technical support from CNES [www.recovery-observatory.org], was triggered to address the needs of the Haitian community in the south-west of the country involved in recovery after the impact of Hurricane Matthew in October 2016. Following that experience, the RO Concept was published in an Advocacy Paper [1] and the RO Demonstrator Team was created with the aim to activate a series of 3 to 6 ROs after major events between 2021 and late 2023 [2].
It is with regard to the RO pilot and the latest RO demonstrator activation after the 7.2 Mw earthquake and Hurricane Grace occurred in August 2021, that the following lessons learnt in Haiti are discussed:
- technical achievements and challenges in the use of SAR data from high revisit sensors (e.g. Sentinel-1) and on-demand acquisitions from high resolution missions (e.g. COSMO-SkyMed, TerraSAR-X) for terrain motion and land surface change applications;
- the role that the collaboration with users and stakeholders can play to add value to SAR-based scientific products;
- capacity building and training enabling local champions and public stakeholders to effectively uptake SAR technology for their own duties of disaster risk management.
During the pilot, a wide-area regional analysis was undertaken by processing Sentinel-1 in ESA’s Geohazards Exploitation Platform [3], to identify areas affected by ground motions not suitable for reconstruction. The exercise also allowed the understanding of the factors limiting the exploitation of this resource by users (e.g. skill gap, limited internet connectivity).
The high resolution monitoring activity with ASI’s COSMO-SkyMed data, CNES’ Pléiades images and ground-truth validation over 3 priority areas defined by the Haitian users, allowed the identification of the following categories of surface changes:
(a) environmental, along the Grand’Anse River south of Jérémie, mixed with quarrying and unregulated waste disposal [4];
(b) geological, along the rock cliffs north-west of Jérémie where toppling and lateral spreading may be worsened by future disasters, thus causing potential risks to small villages and isolated dwellings;
(c) urban, within the outskirts of Jérémie due to reconstruction and new constructions in unstable areas;
(d) rural, due to landslides to be distinguished by similar signals associated with agricultural practices along the slopes in Camp Perrin.
This knowledge was used as the most up-to-date baseline to assess the impact of the August 2021 earthquake and hurricane, and the current process of recovery on south-west Haiti peninsula in the framework of the RO demonstrator activation. The RO collaborated closely with local partners and the CNIGS performed satellite based analysis of damage after the earthquake. A long-term objective of the RO remains strong capacity development of local actors.
References:
[1] https://www.gfdrr.org/en/publication/use-of-eo-satellites-recovery
[2] https://ceos.org/document_management/Working_Groups/WGDisasters/WGMeetings/WGDisasters_Mtg16_Virtual/CEOS_WGD16_RO_Demonstrator.pdf
[3] Cigna, F. et al. (2020) Proceedings of 2020 IEEE IGARSS, pp. 6867–6870. https://doi.org/10.1109/IGARSS39084.2020.9323231
[4] De Giorgi, A. et al. (2021) Remote Sensing, 13 (17), 3509. https://doi.org/10.3390/rs13173509
How to cite: Tapete, D., Cigna, F., Collet, A., de Boissezon, H., Faivre, R., Eddy, A., Danzeglocke, J., Mondesir, P., Telcy, D., Manasse, E., Piard, B. E., and Généa, S.: SAR-based scientific products in support to recovery from hurricanes and earthquakes: lessons learnt in Haiti from the CEOS Recovery Observatory pilot to the demonstrator, EGU General Assembly 2022, Vienna, Austria, 23–27 May 2022, EGU22-5803, https://doi.org/10.5194/egusphere-egu22-5803, 2022.
Please decide on your access
Please use the buttons below to download the presentation materials or to visit the external website where the presentation is linked. Regarding the external link, please note that Copernicus Meetings cannot accept any liability for the content and the website you will visit.
Forward to presentation link
You are going to open an external link to the presentation as indicated by the authors. Copernicus Meetings cannot accept any liability for the content and the website you will visit.
We are sorry, but presentations are only available for users who registered for the conference. Thank you.
EGU22-5958 | Presentations | NH6.3
Mapping and kinematic history of active landslides in Panachaikon Mountain, Achaia (Peloponnese, Greece) by InSAR Time Series analysis and its relationship to rainfall patternsVarvara Tsironi, Athanassios Ganas, Ioannis Karamitros, Eirini Efstathiou, Ioannis Koukouvelas, and Efthimios Sokos
We investigate the kinematic behaviour of active landslides at several well-known locations around the Panachaikon Mountain, Achaia (Peloponnese, Greece), using space geodetic data (InSAR/GNSS). We process LiCSAR interferograms produced by Sentinel-1 (C-band) acquisitions using the open-source software LiCSBAS and we obtain average displacement maps for the period 2016-2021. The maximum displacement rate of each landslide is located at about the centre of each landslide. The average E-W velocity of the Krini landslide is 4 cm/yr (towards east) and 1 cm/yr downwards. The line-of-sight (LOS) velocity of this landslide compares well to a co-located GNSS station within (±) 3 mm/yr (25mm/yr for InSAR and 28mm/yr for GNSS for the descending orbit). Our results also suggest that there is a correlation between rainfall and landslide motion. A cross-correlation analysis of our data suggests that the mean time lag was 13.5 days between the maximum seasonal rainfall and the change of LOS displacement rate. Also, it seems that the amount of total seasonal rainfall controls the increase of displacement rate as 40-550% changes of the displacement rate of the Krini landslide were detected, following a seasonal maximum of rainfall values at the nearby meteorological station. A large part of this mountainous region of Achaia suffers from slope instability that is manifested in various degrees of ground displacement (detectable using space geodesy) affecting greatly its morphological features and inhabited areas.
We acknowledge funding by the project PROIΟΝ “Multiparametric microsensor monitoring platform of the Enceladus Hellenic Supersite” co-financed by Greece and the European Union
How to cite: Tsironi, V., Ganas, A., Karamitros, I., Efstathiou, E., Koukouvelas, I., and Sokos, E.: Mapping and kinematic history of active landslides in Panachaikon Mountain, Achaia (Peloponnese, Greece) by InSAR Time Series analysis and its relationship to rainfall patterns, EGU General Assembly 2022, Vienna, Austria, 23–27 May 2022, EGU22-5958, https://doi.org/10.5194/egusphere-egu22-5958, 2022.
Please decide on your access
Please use the buttons below to download the presentation materials or to visit the external website where the presentation is linked. Regarding the external link, please note that Copernicus Meetings cannot accept any liability for the content and the website you will visit.
Forward to presentation link
You are going to open an external link to the presentation as indicated by the authors. Copernicus Meetings cannot accept any liability for the content and the website you will visit.
We are sorry, but presentations are only available for users who registered for the conference. Thank you.
EGU22-8990 | Presentations | NH6.3
Small size but densely distributed: Insights from a LiDAR-based manual inventory of the recent earthquake-induced landslides case in JapanRasis Putra Ritonga, Takashi Gomi, Roy C. Sidle, Yohei Arata, and Rozaqqa Noviandi
Individually delineated landslide inventories are essential in analyzing post-earthquake-induced landslides (EIL) hazard assessments, particularly examining statistical correlations between landslides (e.g., frequency and size) and physical parameters. Despite rapid advances in remote sensing technology, previous recorded EIL inventories still have limitations in carrying out fine quality inventories, mainly due to limitations in delineating individual landslides manually over large areas by low-resolution satellite images. To be specific, fine quality inventory requires the ability to detect landslide scars and deposits separately over whole affected areas, recognizing smaller landslide sizes (<103 m2) under canopies, as well as avoiding amalgamations, i.e., a combination of several individual landslides in a single polygon, which can lead to severe distortion of landslide statistics. The latest technology from LiDAR-Digital Terrain Model (DTM) allows geomorphologists to manually delineate landslides precisely, but most studies had only focused on deep-seated landslides. Thus, the main objective of this study was to delineate the recent EIL based on LiDAR-DTM visualization over whole landslide-affected areas and test preliminary statistics between our manual LiDAR-based inventory (MLI) with automatic aerial-based inventory (AAI) in the same areas, in addition to NASA’s global EIL database.
We manually delineated the recent landslides affected by the 2018 Eastern Iburi earthquake in the Atsuma basin in Hokkaido within an area of 266 km2, accounting for about 90% of the total area affected by landslides. Shaded relief derived from LiDAR-DTM (0.5 m), and aerial photograph (0.2 m) were used to identify landslide morphometrics. AAI collected in the same study area (Kita, 2018) was used to compare with MLI. As a result, our MLI was able to detect a total of 17,160 landslides (total landslide area: 27.5 km2) while the automatic AAI was only 4241 landslides (total landslide area: 33 km2), probably because our MLI was able to recognize more small landslides and separate individual landslides from amalgams. The mean landslide density for MLI is four times greater (64 landslides/km2) compared to AAI (16 landslides/km2), also considered the densest landslide inventory recorded so far in 20 years based on NASA's global EIL inventory database. Based on the binned frequency area distribution (FAD), MLI has a power-law exponent (β) of 3.4 and a rollover point of 800 m2, whereas AAI is 2.7 and 3×10³ m2, respectively, probably because AAI's inventory overestimates its delineation by inserting channels and depositional regions in the delineated polygons. Compared with all global EIL inventories (mean β: 2.4), the value of the MLI was found to be larger, indicating that the Iburi EIL is the smallest size EIL so far in history (50% landslides are smaller than 103 m2), but very dense. Our findings suggest that MLI might reveal hidden unexpected statistics of the number and size of EILs, including exposing smaller landslides under the canopy and splitting amalgams.
How to cite: Ritonga, R. P., Gomi, T., Sidle, R. C., Arata, Y., and Noviandi, R.: Small size but densely distributed: Insights from a LiDAR-based manual inventory of the recent earthquake-induced landslides case in Japan, EGU General Assembly 2022, Vienna, Austria, 23–27 May 2022, EGU22-8990, https://doi.org/10.5194/egusphere-egu22-8990, 2022.
Please decide on your access
Please use the buttons below to download the presentation materials or to visit the external website where the presentation is linked. Regarding the external link, please note that Copernicus Meetings cannot accept any liability for the content and the website you will visit.
Forward to presentation link
You are going to open an external link to the presentation as indicated by the authors. Copernicus Meetings cannot accept any liability for the content and the website you will visit.
We are sorry, but presentations are only available for users who registered for the conference. Thank you.
EGU22-9066 | Presentations | NH6.3
A fuzzy multi-criteria decision tree model for flood hazard assessment in the Dhemaji district of the state of Assam in IndiaDiganta barman, Anupal baruah, Arjun bm, and Shiv prasad aggarwal
Flood in the North-Eastern part of India is a chronic event occurring from the River Brahmaputra and its tributaries and causes immense loss to the human life and property. Particularly, during the monsoon period, the north bank tributaries cause havoc on the nearby regions especially in the Dhemaji District. These tributaries mainly originate from the glacier fed regions and inundate the different locations of the Dhemaji district. In this work a fuzzy multi-criteria decision analysis model is developed to prepare the flood hazard map of the Dhemaji district. Six different layers are considered in the analysis such as elevation profile, Flood occurrence period, River confluence points of the second order tributaries, historical embankment breach locations, normalized difference vegetation index and normalized difference moisture index. The outputs from the model are categorized into very low to high hazard zone. The consistency ratio calculated from the assigned weights is found as 0.092. The computed flood hazard map from the present model is compared with the observed flood occurrence events and found to be realistic and satisfactory.
Keywords: Fuzzy AHP, Multi criteria decision analysis, Flood occurrence, Embankment breach, River confluence points
How to cite: barman, D., baruah, A., bm, A., and aggarwal, S. P.: A fuzzy multi-criteria decision tree model for flood hazard assessment in the Dhemaji district of the state of Assam in India, EGU General Assembly 2022, Vienna, Austria, 23–27 May 2022, EGU22-9066, https://doi.org/10.5194/egusphere-egu22-9066, 2022.
Please decide on your access
Please use the buttons below to download the presentation materials or to visit the external website where the presentation is linked. Regarding the external link, please note that Copernicus Meetings cannot accept any liability for the content and the website you will visit.
Forward to presentation link
You are going to open an external link to the presentation as indicated by the authors. Copernicus Meetings cannot accept any liability for the content and the website you will visit.
We are sorry, but presentations are only available for users who registered for the conference. Thank you.
EGU22-9856 | Presentations | NH6.3
Satellite-derived shorelines extracted using SAET for characterizing the effect of Storm Gloria in the Ebro Delta (W Mediterranean)Josep E. Pardo-Pascual, Carlos Cabezas-Rabadán, Jesús Palomar-Vázquez, Alfonso Fernández-Sarría, Jaime Almonacid-Caballer, Paola Emilia Souto-Ceccon, Juan Montes, Clara Armaroli, and Paolo Ciavola
Coastal storms constitute a key factor controlling shoreline position changes. They may deeply modify the beach morphology and contribute to erosive processes. Earth observation data as the images from the Sentinel satellites of ESA's Copernicus program and the Copernicus Contributing Missions offer potential information for characterizing beach changes.
SAET (Shoreline Analysis and Extraction Tool) is an open-source tool developed within the framework of the ECFAS project intended to enable the automatic shoreline extraction from optical satellite imagery. SAET is assessed in order to determine the accuracy of the resulting satellite-derived shorelines (SDSs) as well as its capacity to detect and characterise beach changes. The SDSs are employed to define the changes of the shoreline position through 82 km of beaches in the Ebro Delta (E Spain) associated with Storm Gloria. The storm peaked on 22 of January 2020 (significant wave heights over 7 m), heavily affecting the whole of eastern Spain.
The accuracy of the SDS extracted using SAET was assessed by comparing its position against the shoreline photo-interpreted on a VHR image. A Spot 7 (1.5 m of spatial resolution) acquired 37 minutes before the Sentinel-2 used for defining the SDS was employed for this purpose. Both images were acquired on 26 of January, four days after the peak of the storm. An average error of 5.18 m (seawards) ± 9.98 m was measured.
The comparison of the position of the SDS obtained before (18/01/2020) and after the peak of the storm (26/01/2020) allows to map the retreat of the shoreline position linked to this event. Within the ECFAS project this approach will be extended to a number of other test cases.
The ECFAS (European Coastal Flood Awareness System) project (https://www.ecfas.eu/) has received funding from the EU H2020 research and innovation programme under Grant Agreement No 101004211.
How to cite: Pardo-Pascual, J. E., Cabezas-Rabadán, C., Palomar-Vázquez, J., Fernández-Sarría, A., Almonacid-Caballer, J., Souto-Ceccon, P. E., Montes, J., Armaroli, C., and Ciavola, P.: Satellite-derived shorelines extracted using SAET for characterizing the effect of Storm Gloria in the Ebro Delta (W Mediterranean), EGU General Assembly 2022, Vienna, Austria, 23–27 May 2022, EGU22-9856, https://doi.org/10.5194/egusphere-egu22-9856, 2022.
EGU22-9857 | Presentations | NH6.3
SAET: a new tool for automatic shoreline extraction with subpixel accuracy for characterising shoreline changes linked to coastal stormsJesús Palomar-Vázquez, Jaime Almonacid-Caballer, Carlos Cabezas-Rabadán, and Josep E. Pardo-Pascual
SAET (Shoreline Analysis and Extraction Tool) is a tool intended to enable the automatic detection and quantification of the changes experienced by the shoreline position on beaches affected by coastal storms. It is an open-source tool developed within the framework of the ECFAS project which aims to demonstrate the technical and operational feasibility of a European Coastal Flood Awareness System. SAET takes advantage of the freely-available images from the Sentinel satellites of ESA's Copernicus program and the Copernicus Contributing Missions. The tool currently uses the mid-resolution images of the Sentinel 2 and Landsat 8 satellites, although in the future it will allow the use of images from other satellites (as the recently available Landsat 9).
In order to characterize the shoreline changes caused by a coastal storm at a certain coastal segment, SAET identifies, downloads, and processes the most suitable satellite images (those closest in time and with low cloud coverage). The shoreline extraction starts by an approximate definition of the shoreline position at pixel level using the AWEINSH water index. Subsequently, the subpixel extraction algorithm is applied over dynamic coastal stretches not affected by clouds operating over the Short-Wave Infrared bands. For each of the analysed images, the process results in the obtention of satellite-derived shorelines in vector format. Analysis of shoreline position changes is intended to offer quantitative data about the state of beaches in terms of erosion/accretion,and about their response subsequent capacity to recover after storm episodes.
The ECFAS (European Coastal Flood Awareness System) project (https://www.ecfas.eu/) has received funding from the EU H2020 research and innovation programme under Grant Agreement No 101004211.
How to cite: Palomar-Vázquez, J., Almonacid-Caballer, J., Cabezas-Rabadán, C., and Pardo-Pascual, J. E.: SAET: a new tool for automatic shoreline extraction with subpixel accuracy for characterising shoreline changes linked to coastal storms, EGU General Assembly 2022, Vienna, Austria, 23–27 May 2022, EGU22-9857, https://doi.org/10.5194/egusphere-egu22-9857, 2022.
EGU22-9901 | Presentations | NH6.3 | Highlight
Thunderslide - from rainfall to preliminary landslide mapping: an automated open-data workflow for regional authoritiesStefano Crema, Alessandro Sarretta, Donato Maio, Francesco Marra, Giorgia Macchi, Velio Coviello, Marco Borga, Lorenzo Marchi, and Marco Cavalli
Gathering systematic information on the effects of extreme weather events (e.g., floods, landslides and debris flows, windthrows) is a fundamental prerequisite to establishing rapid-response strategies and putting into practice management policies. However, the collection of field data requires significant economic and human efforts by local authorities. Furthermore, events occurring in remote areas are rarely detected and mapped accurately as they have a low chance of intersecting human infrastructures. These missed detections lead to incorrect assumptions in relation to both the extreme events’ spatial distribution and, especially, the real occurrence probability. This work proposes a framework for obtaining the automatic identification of severe weather events that may have caused important erosion processes or vegetation damage, combined with a rapid preliminary change detection mapping over the identified areas. The proposed approach leverages the free availability of both high-resolution global scale radar rainfall products and Sentinel-2 multi-spectral images to identify the areas to be analyzed and to carry out change detection algorithms, respectively. Radar rainfall data are analyzed and the areas where high-intensity rainfall and/or very important cumulative precipitation has occurred, are used as a mask for restricting the subsequent analysis, which, in turn, is based on a multi-spectral change detection algorithm. The whole procedure feeds a geodatabase (storing identified events, retrieved data and computed changes) for proper data management and subsequent analyses. The testing phase of the proposed methodology has provided encouraging results: applications to selected mountain catchments hit by intense events in northeastern Italy were capable of recognizing flooded areas, debris-flow and shallow landslide activations, and windthrows. The described approach can serve as a preliminary step toward detailed post-event surveys, but also as a preliminary “quick and dirty” mapping framework for local authorities especially when resources for ad hoc field surveys are not available, or in the case of an event that triggers changes in remote areas. Such a systematic potential change identification can help for a more homogeneous and systematic detection and census of the events and their effects. The workflow herein presented is intended as a starting point on top of which more modules can be added (e.g., radar climatology, SAR change detection for near real-time, other severe sources such as lightning, earthquakes or wildfires, machine learning algorithms for image classification, land use and morphological filtering of the results). Future improvements of the described procedure could be finally devised for allowing a continuous operational activity and for maintaining an open-source software implementation.
How to cite: Crema, S., Sarretta, A., Maio, D., Marra, F., Macchi, G., Coviello, V., Borga, M., Marchi, L., and Cavalli, M.: Thunderslide - from rainfall to preliminary landslide mapping: an automated open-data workflow for regional authorities, EGU General Assembly 2022, Vienna, Austria, 23–27 May 2022, EGU22-9901, https://doi.org/10.5194/egusphere-egu22-9901, 2022.
Please decide on your access
Please use the buttons below to download the presentation materials or to visit the external website where the presentation is linked. Regarding the external link, please note that Copernicus Meetings cannot accept any liability for the content and the website you will visit.
Forward to presentation link
You are going to open an external link to the presentation as indicated by the authors. Copernicus Meetings cannot accept any liability for the content and the website you will visit.
We are sorry, but presentations are only available for users who registered for the conference. Thank you.
EGU22-10149 | Presentations | NH6.3
Differential SAR interferometry for estimating snow water equivalent in central Apennines complex orography from Sentinel-1 satellite within SMIVIA projectGianluca Palermo, Edoardo Raparelli, Nancy Alvan Romero, Mario Papa, Massimo Orlandi, Paolo Tuccella, Annalina Lombardi, Errico Picciotti, Saverio Di Fabio, Elena Pettinelli, Elisabetta Mattei, Sebastian Lauro, Barbara Cosciotti, David Cappelletti, Massimo Pecci, and Frank Marzano
Snow-mantle extent (or area), its local thickness (or height) and mass (often expressed by the snow water equivalent, SWE) are the main parameters characterizing snow deposits. Such parameters result of particular importance in meteorology, hydrology, and climate monitoring applications. The considerable geographical extension of snow layers and their typical spatial heterogeneity makes it impractical to monitor snow by means of direct or indirect in situ measurements, suggesting the exploitation of satellite technologies. Space-borne C-band synthetic aperture radar (SAR) sensors (such as those operating in Sentinel-1 A and B missions) are particularly suitable for the analysis of snow deposits, providing data with resolutions up to some meters with global coverage and 6-day revisit time. Most of the satellite remote sensing applications have been focused on major mountain systems, such as the Andes, the Alps, or the Himalayan region. Other important mountain systems, like the Italian Apennines, have not been extensively considered, probably due to their complex orography and the high variability of their snow cover. Nevertheless, the central Apennine has a central role for the meteorological dynamics in the Mediterranean area, and it hosts the southernmost European glacier – namely, the Calderone glacier whose evolution represents a relevant indicator, at least for the medium latitudes, of climatic changes.
The implementation of the objectives of the SMIVIA (Snow-mantle Modeling, Inversion and Validation using multi-frequency multi-mission InSAR in central Apennines) project is based on the development of innovative simulation techniques and snow parameter estimators from SAR and differential interferometric SAR (DInSAR) measurements, based on the synergy with spatial measurements from optical remote sensing sensors, data from ground weather radar and simulations from dynamic snow cover models and on an inverse problem approach with a robust physical-statistical rationale. Furthermore, the scientific validity of the achievable results is supported by an enormous systematic validation effort in the Apennine area with in-situ measurements, identifying 3 pilot sites manned with meteorological and snow measurements, dielectric and georadar measurements, trenches and micro-macrophysical sampling, 6 sites of semi-automatic verification, 31 remote auxiliary sites and 1 site of glaciological interest (Calderone) with ad hoc campaigns. SAR data processing can be performed in different ways to retrieve snow parameters.
In this work we exploit SAR backscattering coefficient to study the effects of backscattering at the air-snow interface, at the snow-ground interface, together with the volumetric effects of the snow layer. The distinction between wet and dry snow is obtained exploiting the copolar and cross-polar SAR returns. DInSAR is exploited to analyze the effects of air-snow refraction and the snow-ground reflection, together with the coherence and phase-shifts between two sequential images. In this work we will present the Sentinel-1 DInSAR processing chain to estimate snowpack height (SPH) combined with SAR-backscattered data for wet snow discrimination. The potential of using physically based analytical and statistical inversion algorithms, trained by forward electromagnetic and snowpack models, is introduced, and discussed. The processing chain is tested in central Apennines, using validation sites with snow-pit in-situ measurements, discussing potential developments and critical issues.
How to cite: Palermo, G., Raparelli, E., Alvan Romero, N., Papa, M., Orlandi, M., Tuccella, P., Lombardi, A., Picciotti, E., Di Fabio, S., Pettinelli, E., Mattei, E., Lauro, S., Cosciotti, B., Cappelletti, D., Pecci, M., and Marzano, F.: Differential SAR interferometry for estimating snow water equivalent in central Apennines complex orography from Sentinel-1 satellite within SMIVIA project, EGU General Assembly 2022, Vienna, Austria, 23–27 May 2022, EGU22-10149, https://doi.org/10.5194/egusphere-egu22-10149, 2022.
EGU22-10737 | Presentations | NH6.3
Correlation analysis between the subsides reported as sinkholes and the thickness of the clays of the shallow aquifer in Mexico City (CDMX).Sergio García Cruzado, Nelly Ramírez Serrato, Graciela Herrera Zamarrón, Fabiola Yépez Rincón, Mario Hernández Hernández, José Hernandez Espriu, and Victor Velasco Herrera
CDMX is the capital of the country. This town has historically been at risk of subsidence damage to its civil structures due to its foundation. The area began to be populated with settlements in flooded areas for use in crops, followed by the colonization and subsequent drying out of the lake areas that ended up being urbanized. The areas formerly belonging to Lake Texcoco, previously used for cultivation, were drained to expand the developable coverage. As the water demand grew, it became necessary to extract groundwater from the shallow aquifer to supply the growing city. Although the depletion of this aquifer coincides with subsidence areas, previous studies indicate that there is no linear correlation between them. The objective of this project is to collect the different criteria related to the presence of sinkholes (as an effect of subsidence), such as Population and well density, distance to faults, fractures, roads, drainage, elevation and slope of the terrain, the thickness of subsoil clays, the type of rock and soil, the rate of subsidence and the geotechnical zones in the study area.
The criteria maps were compared with previous sinkholes mapping registered between the years 2017 to 2019. The statistics consisted of calculating the percentage of coincidence in coverage, categorized linear regression, and the application of logarithms as a normalization method to evaluate its correlation. The statistics consisted of calculating the percentage of coincidence in coverage, categorized linear regression, and the application of logarithms as a normalization method to evaluate its correlation. The most relevant results include the relationship between the sinkholes and the road zones (60%), the highest correlation registered in clays is 0.437 considering areas of competent rock. Although considering the total study site a 0.36 is reached, obtained from applying the logarithm of the clay values and correlating it with the sinkhole areas.
- 1Facultad de Ingeniería, Colegio de Geofísica, BUAP, Puebla, Mexico
- 2Laboratorio de Percepción Remota, Departamento de Recursos Naturales, Instituto de Geofísica, UNAM, CDMX, México
- 3Departamento de Recursos Naturales, Instituto de Geofísica, UNAM, CDMX, México
- 4Facultad de Ingeniería Civil, Universidad Nacional Autónoma de México, CDMX, México
- 5Consejo Nacional de Ciencia y Tecnología, Cátedras CONACYT- Instituto de Geofísica, UNAM, CDMX, México
- 6Facultad de Ingeniería, UNAM, CDMX, México
- 7Instituto de Geofísica, UNAM, CDMX, México
How to cite: García Cruzado, S., Ramírez Serrato, N., Herrera Zamarrón, G., Yépez Rincón, F., Hernández Hernández, M., Hernandez Espriu, J., and Velasco Herrera, V.: Correlation analysis between the subsides reported as sinkholes and the thickness of the clays of the shallow aquifer in Mexico City (CDMX)., EGU General Assembly 2022, Vienna, Austria, 23–27 May 2022, EGU22-10737, https://doi.org/10.5194/egusphere-egu22-10737, 2022.
Please decide on your access
Please use the buttons below to download the presentation materials or to visit the external website where the presentation is linked. Regarding the external link, please note that Copernicus Meetings cannot accept any liability for the content and the website you will visit.
Forward to presentation link
You are going to open an external link to the presentation as indicated by the authors. Copernicus Meetings cannot accept any liability for the content and the website you will visit.
We are sorry, but presentations are only available for users who registered for the conference. Thank you.

EGU22-10867 | Presentations | NH6.3
Comparing Academia's Perception of Needed SDG Research to SDG Progress Reports and Known SDG Synergies and TradeoffsHannah Chaney, Majdi Abou Najm, and Maria Jose Lopez Serrano
The Sustainable Development Goals (SDG) are a set of 17 goals that was released by the United Nations (UN) in 2015. Each goal has a target figure that countries and, ideally, the world should aim to reach in order to create sustainability within that sector for current and future generations. Seven years after the SDGs were released, thousands of studies and academic articles have promoted the SDGs, as well as regular updates that have been released by the UN on goal progress specific to each country. In addition, multiple studies have highlighted synergies and tradeoffs between SDGs that have the potential to significantly influence goal completion (Biggeri et. Al, 2019; Moyer & Bohl, 2019; Jose-Serrano, 2022; Zhao et. al, 2021). With this information in mind, this study aims to conduct a large-scale network analysis of research articles concerning SDG progress to answer the following questions: Which SDGs receive the most attention from researchers? What are the perceptions in academia regarding the synergies/ trade-offs between the SDGs? The network analysis will be conducted using the search engine SCOPUS resulting in hundreds of retrieved papers for each category within the SDGs. Results from this study will be compared to current SDG progress and known synergies and tradeoffs within the SDGs in order to determine how the perception of the SDGs compare with research conclusions and known SDG goal progress. This information will serve as an indication of which goals, synergies, or tradeoffs researchers and industries are aware of and readily researching and which of these categories needs more attention within academic circles. The ultimate goal for this research is that the results can be used as a tool to advocate for what SDG research is most needed in order for SDG goals to reach completion by 2030.
How to cite: Chaney, H., Abou Najm, M., and Jose Lopez Serrano, M.: Comparing Academia's Perception of Needed SDG Research to SDG Progress Reports and Known SDG Synergies and Tradeoffs, EGU General Assembly 2022, Vienna, Austria, 23–27 May 2022, EGU22-10867, https://doi.org/10.5194/egusphere-egu22-10867, 2022.
EGU22-12363 | Presentations | NH6.3 | Highlight
MIPS: a new airborne Multiband Interferometric and Polarimetric SAR system for the Italian territory monitoringAntonio Natale, Paolo Berardino, Gianfranco Palmese, Carmen Esposito, Riccardo Lanari, and Stefano Perna
Synthetic Aperture Radar (SAR) systems represent nowadays standard tools for the high resolution Earth observation in all weather conditions [1].
Indeed, thanks to well established techniques based on SAR data, such as SAR interferometry (InSAR), Differential InSAR (DInSAR) and SAR polarimetry (PolSAR), it is possible to generate added-value products, as for instance Digital Elevation Models, ground deformation maps and time series, soil moisture maps, and exploit these systems for the remote monitoring of both natural and anthropic phenomena [2] - [5].
In addition, recent advancements in radar, navigation and aeronautical technologies allow us to benefit of lightweight and compact SAR sensors that can be mounted onboard highly flexible aerial platforms [6] - [7]. These aspects offer the opportunity to design novel observation configurations and to explore innovative estimation strategies based, for instance, on data provided by multi-frequency, multi-polarization, multi-antenna or even multi-platform SAR systems.
This work is aimed at showing the imaging capabilities of the new Italian airborne SAR system named MIPS (Multiband Interferometric and Polarimetric SAR).
The system is based on the Frequency Modulated Continuous Wave (FMCW) technology and is able to operate at both L- and X- band. In particular, the L-band sensor is able to acquire fully-polarized radar data, while the X-band sensor exhibits single-pass interferometric SAR capabilities.
A detailed description of both the MIPS system and its imaging capabilities will be provided at the conference time, with a special emphasis given to the activities carried out within the ASI-funded DInSAR-3M project.
References
[1] A. Moreira, P. Prats-Iraola, M. Younis, G. Krieger, I. Hajnsek, K. P. Papathanassiou, “A tutorial on Synthetic Aperture Radar”, IEEE Geoscience and Remote Sensing Magazine, pp. 6-43, March 2013.
[2] Bamler, R., Hartl, P., 1998. Synthetic Aperture Radar Interferometry. Inverse problems, 14(4), R1.
[3] P. Berardino, G. Fornaro, R. Lanari and E. Sansosti, “A new algorithm for surface deformation monitoring based on small baseline differential SAR interferograms”, IEEE Trans. Geosci. Remote Sens., vol. 40, no. 11, pp. 2375-2383, Nov. 2002.
[4] Lee, J., Pottier, E., 2009. Polarimetric Radar Imaging: From Basics to Applications. CRC Press, New York.
[5] R. Lanari, M. Bonano, F. Casu, C. De Luca, M. Manunta, M. Manzo, G. Onorato, I. Zinno, “Automatic Generation of Sentinel-1 Continental Scale DInSAR Deformation Time Series through an Extended P-SBAS Processing Pipeline in a Cloud Computing Environment”, Remote Sensing, 2020, 12, 2961.
[6] S. Perna, G. Alberti, P. Berardino, L. Bruzzone. D. Califano, I. Catapano, L. Ciofaniello, E. Donini, C. Esposito, C. Facchinetti, R. Formaro, G. Gennarelli, C. Gerekos, R. Lanari, F. Longo, G. Ludeno, M. Mariotti d’Alessandro, A. Natale, C. Noviello, G. Palmese. C. Papa, G. Pica, F. Rocca, G. Salzillo, F. Soldovieri, S. Tebaldini, S. Thakur, “The ASI Integrated Sounder-SAR System Operating in the UHF-VHF Bands: First Results of the 2018 Helicopter-Borne Morocco Desert Campaign”, Remote Sensing, 2019, 11(16), 1845.
[7] C. Esposito, A. Natale, G. Palmese, P. Berardino, R. Lanari, S. Perna, “On the Capabilities of the Italian Airborne FMCW AXIS InSAR System”, Remote Sens. 2020, 12, 539.
How to cite: Natale, A., Berardino, P., Palmese, G., Esposito, C., Lanari, R., and Perna, S.: MIPS: a new airborne Multiband Interferometric and Polarimetric SAR system for the Italian territory monitoring, EGU General Assembly 2022, Vienna, Austria, 23–27 May 2022, EGU22-12363, https://doi.org/10.5194/egusphere-egu22-12363, 2022.
EGU22-12393 | Presentations | NH6.3
ARTEMIS – An operational tool to manage the information provided by Persistent Scatterers Monitoring at a regional scale.Davide Bertolo, Michel Stra, and Patrick Thuegaz
The increasing diffusion of the PS (Persistent Scatterers) InSAR services across the world and the early adoption of PS-Monitoring techniques, provide to the civil protection authorities effective and objective tools for disaster risk prevention, empowering the capability to detect early-stage terrain deformations even in unpopulated areas.
More in detail, the PS Monitoring technique exploits the high temporal resolution provided by the recent satellite constellations (e.g. Sentinel 2), with revisitation times of about 14 days detecting, at a regional scale, the so called “anomalies” (i.e.: the Persistent Scatterers which show acceleration trends compared to a given deformation trend). Considering that the deformation anomalies could be provoked by many factors not related to an incipient landslide, the so-called “false positives”, terrain investigations are usually required to assess a real landslide hazard .
Furthermore, to be effective, the terrain investigations aimed at validating a potential incipient landslide situation should be conducted within a short time, to allow an effective implementation of the safety measures by the civil protection authorities.
Many constraints such as the limited availability of human resources and terrain conditions usually hamper an extensive terrain validation of the anomalies provided by PS-InSAR monitoring services. It is thus necessary a fast and objective method to filter and prioritize the terrain deformation anomalies which have the highest probability to indicate an incipient landslide, and require an immediate terrain investigation.
To make that possible, we developed a semiautomated GIS-based information system, called ARTEMIS (Advanced Regional TErrain Motion Information System), which allows an objective and fast selection of the PS InSAR anomalies to be investigated, detected twice a month by the PS-Monitoring services.
The ARTEMIS is a multi-stage workflow operating a preliminary validation of the anomaly itself, followed by a danger assessment stage and a final risk-assessment stage. At the end of the process, a risk-rating score to prioritize the field investigation is provided.
ARTEMIS is a flexible and scalable tool, which can be adapted to different geographical realities and PS-Monitoring services. Its workflow is openly available for non-commercial use.
How to cite: Bertolo, D., Stra, M., and Thuegaz, P.: ARTEMIS – An operational tool to manage the information provided by Persistent Scatterers Monitoring at a regional scale., EGU General Assembly 2022, Vienna, Austria, 23–27 May 2022, EGU22-12393, https://doi.org/10.5194/egusphere-egu22-12393, 2022.
Please decide on your access
Please use the buttons below to download the presentation materials or to visit the external website where the presentation is linked. Regarding the external link, please note that Copernicus Meetings cannot accept any liability for the content and the website you will visit.
Forward to presentation link
You are going to open an external link to the presentation as indicated by the authors. Copernicus Meetings cannot accept any liability for the content and the website you will visit.
We are sorry, but presentations are only available for users who registered for the conference. Thank you.
EGU22-12951 | Presentations | NH6.3
ETNA 2021 13th December eruption: does SEVIRI data contribute to the early detection of lateral event?Massimo Musacchio, Malvina Silvestri, Giuseppe Puglisi, and Maria Fabrizia Buongiorno
Infrared remotely sensed data can be used to evaluate the surface thermal state of active volcanoes. Because the spectral radiance emitted by hot spots reaches its maximum in the region of Mid Infra-Red (MIR), the early detection of an impending eruption has been highlighted by exploiting the SEVIRI 3.9 mm channel. Despite its spatial resolution (3x3 sqkm at nadir), the presence of a high temperature source, even affecting only a small portion of one large pixel, causes a dramatic increase of the emitted MIR radiance easily detectable also at 4x5 sqKm (mid latitude).
The procedure named MS2RWS (MeteoSat to Rapid Response Web Service) allowed us to identify the Mt Etna summit area eruption since February 2010, when it was developed to detects the beginning and to estimates the duration of an eruption [1,2]. The procedure starts from the assumption that in a remote sensing image a pixel may assume a limited number of radiance values ranging from 0 up to the saturation. The radiance of a given pixel, in clear sky condition and no eruption ongoing, follows a characteristic Gaussian trend related to the Sun elevation and this trend varies during an eruption affecting, in particular, the pixel centred over the summit Mt. Etna craters [3].
On 13th December 2021 an eruptive vent opened in the eastern flank of Mt. Etna volcano, at an elevation of 2100 m a.s.l., about 3.5 km far from the summit craters. This eruption lasted only one day and produced a small lava flows (less than 1 km length). Thus it might be considered as a “punctual event” in the eruptive history of the volcano and ideal for validating the capability of the MS2RWS procedure in detecting flank eruptions since their beginning. This experiment succeed, demonstrating that the MS2RWS procedure has the capability to detect also lateral eruption, as this was, giving a further contribute on the monitoring of volcanic activity by space.
How to cite: Musacchio, M., Silvestri, M., Puglisi, G., and Buongiorno, M. F.: ETNA 2021 13th December eruption: does SEVIRI data contribute to the early detection of lateral event?, EGU General Assembly 2022, Vienna, Austria, 23–27 May 2022, EGU22-12951, https://doi.org/10.5194/egusphere-egu22-12951, 2022.
EGU22-13029 | Presentations | NH6.3
Characterisation of discolouration plumes resulting from submarine volcanism using remote sensing techniques between 2000 and 2018Joana R. Domingues, Vasco Mantas, and Alcides Pereira
There’s still a poor understanding of how submarine volcanism works, although the majority of Earth’s volcanic activity happen in submarine context, forming new crust and ejection large amounts of material into the ocean.
This type of eruption has associated risks such as tsunamis and problems with shipping and air traffic, and is a source of natural pollution - gases such as sulphur and particulates are released into the atmosphere - hence the need for monitoring. Also, the study of submarine volcanic products will help understand in more detail how these volcanic processes evolve. Due to the remote location of submarine volcanoes, the use of remote sensing and earth observation techniques can be helpful in the monitoring process in order to mitigate the consequences of volcanic activity.
To answer this problem, a database of pre-registered submarine volcanic eruptions between 2000 and 2018 was created, with results stating 60 eruptions referring to 31 different volcanoes. A total of 450 satellite images were detected through observations of discoloration plumes associated with submarine events, and 82 of these images were subsequently selected for extraction of spectral signature, through what were considered to be the most representative images for the eruption in question, in order to proceed to the extraction of spectral signatures.
The spectral signature of the 263 sample points has similar characteristics within the different types of discoloration plumes (green coloration, brown coloration, and associated with pumice rafts) and can therefore be classified into several classes.
It can be concluded that the detection and differentiation of discoloration plumes associated with submarine volcanic events using remote sensing data can be accomplished effectively, confirming why remote sensing is an efficient and affordable technique for the regular detection, monitoring, and study of submarine volcanic eruptions in near-real time.
How to cite: Domingues, J. R., Mantas, V., and Pereira, A.: Characterisation of discolouration plumes resulting from submarine volcanism using remote sensing techniques between 2000 and 2018, EGU General Assembly 2022, Vienna, Austria, 23–27 May 2022, EGU22-13029, https://doi.org/10.5194/egusphere-egu22-13029, 2022.
EGU22-13041 | Presentations | NH6.3
Application of the split range-spectrum method and GACOS model to correct the ionospheric and tropospheric delay of the InSAR time seriesMichał Tympalski, Marek Sompolski, Anna Kopeć, and Wojciech Milczarek
Synthetic aperture radar interferometry (InSAR) is an effective tool for large area measurements and analysis, including topography measurements or ground surface subsidence caused by mining operations, earthquakes, or volcanic activity. However, the accuracy of these measurements is often limited by the disturbances that arise during the microwave propagation process in the ionosphere and troposphere. The atmospheric delay in the interferometric phase may cause the detection of terrain surface changes to be impossible or significantly distorted. In our proposed approach, we propose a complete workflow to computing a time series from raw data obtained with the Sentinel-1 mission. The solution consists of a Small Baseline Subset (SBAS) algorithm with an implementation of the split range-spectrum method and the Generic Atmospheric Correction Online Service (GACOS) model. The proposed solution was used in time series calculations of SAR data in two areas: northern Chile and Taiwan. It is demonstrated that simultaneous allowance for both the tropospheric and ionospheric corrections significantly improves final results.
How to cite: Tympalski, M., Sompolski, M., Kopeć, A., and Milczarek, W.: Application of the split range-spectrum method and GACOS model to correct the ionospheric and tropospheric delay of the InSAR time series, EGU General Assembly 2022, Vienna, Austria, 23–27 May 2022, EGU22-13041, https://doi.org/10.5194/egusphere-egu22-13041, 2022.
EGU22-13232 | Presentations | NH6.3
Land degradation risk assessment using NDVI Landsat derived images – application in the hilly area of NE RomaniaGeorgiana Văculișteanu, Mihai Ciprian Margarint, and Mihai Niculita
Land degradation represents a complex concept to quantify, especially in today's global context of climate change. During the last decades, a reduction of land quality has been recorded globally, and literature indicates that climate change and human activities are the most significant factors. To properly assess and mitigate this global problem, several remote sensing techniques are developed mainly to classify the grassland quality, which became a valuable indicator of the state of land degradation.
Nowadays, remote sensing indices are used to evaluate and predict scenarios in matters of land degradation state and evolution. Hence, land cover changes, desertification and deforestation, drought monitoring, soil erosion, and salinization are successfully analyzed using the Normalized Difference Vegetation Index (NDVI). This index is the most efficiently used vegetation indicator to detect the vegetation dynamics and other problem-related to this phenomenon.
Our study aims to analyze the grassland dynamic to assess the land degradation risk in the north-eastern lowlands of Romania. During the last century, the area was characterized by successive land reforms that translated to a heterogeneous diversity of grassland exploitation. The socio-economic development has brought, besides land management deficiencies, many other problems related to land ownership, land abandonment, mowing frequency, or grazing intensity. To fulfill our objective, we use the 30m spatial resolution Landsat satellite archive within the Google Earth Engine platform to detect and monitor the regions with high fluctuation of the NDVI values. The investigated period starts in 2000 until 2021.
Correlating the historical background evolution of the land use in NE Romania, with the NDVI time series and the climatic data, has revealed that both human-induced activities and climate change are impacting the grassland dynamics. The mismanagement of the land use intensification process has led to degradation and irreversible changes inside the ecosystem.
How to cite: Văculișteanu, G., Margarint, M. C., and Niculita, M.: Land degradation risk assessment using NDVI Landsat derived images – application in the hilly area of NE Romania, EGU General Assembly 2022, Vienna, Austria, 23–27 May 2022, EGU22-13232, https://doi.org/10.5194/egusphere-egu22-13232, 2022.
EGU22-1853 | Presentations | GM2.3
Machine learning and geomorphometrical objects for convex and concave geomorphological features detectionMihai Niculiță
The delineation of geomorphometrical objects that can be translated to geomorphological features is one of the most practical aspects of geomorphometry. The concave (closed depressions) or convex features (mounds) are often important to be delineated from multiple points of view: theoretical approaches, planning for practical purposes, or various other aspects. In this work, I have approached sinkholes and burial mounds as representative cases of concave and convex features represented on high-resolution DEMs. Based on manual delineations, several algorithms of object-based delineation were tested for accuracy. The interest was in delineating as much as accurate possible the targeted features. Further, the segments were fed to a multilayer perceptron for the classification of the delineated segments. The results show promising accuracy in regard to both types of features.
How to cite: Niculiță, M.: Machine learning and geomorphometrical objects for convex and concave geomorphological features detection, EGU General Assembly 2022, Vienna, Austria, 23–27 May 2022, EGU22-1853, https://doi.org/10.5194/egusphere-egu22-1853, 2022.
Please decide on your access
Please use the buttons below to download the presentation materials or to visit the external website where the presentation is linked. Regarding the external link, please note that Copernicus Meetings cannot accept any liability for the content and the website you will visit.
Forward to presentation link
You are going to open an external link to the presentation as indicated by the authors. Copernicus Meetings cannot accept any liability for the content and the website you will visit.
We are sorry, but presentations are only available for users who registered for the conference. Thank you.
EGU22-5587 * | Presentations | GM2.3 | Highlight
Comparative analysis of the Copernicus (30 m), TanDEM-X (12 m) and UAV-SfM (0.2 m) DEM to estimate gully volumes and mobilization rates in central MadagascarLiesa Brosens, Benjamin Campforts, Gerard Govers, Emilien Aldana-Jague, Vao Fenotiana Razanamahandry, Tantely Razafimbelo, Tovonarivo Rafolisy, and Liesbet Jacobs
Over the past decades advanced technology has become available, revolutionizing the assessment of surface topography. At smaller scales (up to a few km²) structure from motion (SfM) algorithms applied to uncrewed aerial vehicle (UAV) imagery now allow sub-meter resolution. On the other hand, spaceborne digital elevation models (DEMs) are becoming increasingly accurate and are available at a global scale. Two recent spaceborne developments are the 12 m TanDEM-X and 30 m Copernicus DEMs. While sub-meter resolution UAV-SfM DEMs generally serve as a reference, their acquisition remains time-consuming and spatially constrained. However, some applications in geomorphology, such as the estimation of regional or national erosion quantities of specific landforms, require data over large areas. TanDEM-X and Copernicus data can be applied at such scales, but this raises the question of how much accuracy is lost because of the lower spatial resolution.
Here, we evaluate the performance of the 12 m TanDEM-X DEM and the 30 m Copernicus DEM to i) estimate gully volumes, ii) establish an area-volume relationship, and iii) determine sediment mobilization rates, through comparison with a higher resolution (0.2 m) UAV-SfM DEM. We did this for six study areas in central Madagascar where lavaka (large gullies) are omnipresent and surface area changes over the period 1949-2010s are available. Copernicus derived lavaka volume estimates were systematically too low, indicating that the Copernicus DEM is not suitable to estimate erosion volumes for geomorphic features at the lavaka scale (100 – 105 m²). The relatively coarser resolution of the DEM prevents to accurately capture complex topography and smaller geomorphic features. Lavaka volumes obtained from the TanDEM-X DEM were similar to UAV-SfM volumes for the largest features, while smaller features were generally underestimated. To deal with this bias we introduce a breakpoint analysis to eliminate volume reconstructions that suffered from processing errors as evidenced by significant fractions of negative volumes. This elimination allowed the establishment of an area-volume relationship for the TanDEM-X data with fitted coefficients within the 95% confidence interval of the UAV-SfM relationship. Combined with surface area changes over the period 1949-2010s, our calibrated area-volume relationship enabled us to obtain lavaka mobilization rates ranging between 18 ± 3 and 311 ± 82 t ha-1 yr-1 for the six study areas, with an average of 108 ± 26 t ha-1 yr-1. This does not only show that the Malagasy highlands are currently rapidly eroding by lavaka, but also that lavaka erosion is spatially variable, requiring the assessment of a large area in order to obtain a meaningful estimate of the average erosion rate.
With this study we demonstrate that medium-resolution global DEMs can be used to accurately estimate the volumes of gullies exceeding 800 m² in size, where the proposed breakpoint-method can be applied without requiring the availability of a higher resolution DEM. This might aid geomorphologists to quantify sediment mobilisation rates by highly variable processes such as gully erosion or landsliding at the regional scale, as illustrated by our first assessment of regional lavaka mobilization rates in the central highlands of Madagascar.
How to cite: Brosens, L., Campforts, B., Govers, G., Aldana-Jague, E., Razanamahandry, V. F., Razafimbelo, T., Rafolisy, T., and Jacobs, L.: Comparative analysis of the Copernicus (30 m), TanDEM-X (12 m) and UAV-SfM (0.2 m) DEM to estimate gully volumes and mobilization rates in central Madagascar, EGU General Assembly 2022, Vienna, Austria, 23–27 May 2022, EGU22-5587, https://doi.org/10.5194/egusphere-egu22-5587, 2022.
Please decide on your access
Please use the buttons below to download the presentation materials or to visit the external website where the presentation is linked. Regarding the external link, please note that Copernicus Meetings cannot accept any liability for the content and the website you will visit.
Forward to presentation link
You are going to open an external link to the presentation as indicated by the authors. Copernicus Meetings cannot accept any liability for the content and the website you will visit.
We are sorry, but presentations are only available for users who registered for the conference. Thank you.
EGU22-5715 | Presentations | GM2.3
r.survey: a tool to assess whether elements of specific sizes can be visually detected during field surveysIvan Marchesini and Txomin Bornaetxea
The concept of terrain visibility is vast and hard to summarise in a single definition. It can be generically said that it is a property that measures how observable a territory is from a single or multiple points of view.
The estimation or calculation of visibility indices has been used in multiple fields, including architecture, archaeology, communications, tourism, land planning, and military applications. Recently (Meinhardt et al., 2015, Bornaetxea et al., 2018, Knevels et al., 2020, ) the concept of viewshed, i.e. the geographical area that is visible from one or more points of view, has been called into play for applications involving geomorphology. In particular, it has been used to identify the portions of territory in which existing landslide inventories, carried out through field surveys, can be considered valuable for the calculation of landslide susceptibility. The aim is to delineate the Effective Surveyed Area, i.e. the area that has actually been observed by the operators in the field.
However, this purely geometric approach cannot guarantee that objects are actually visible just because they are in a direct line-of-sight relationship with the observer. Due to their size and/or orientation in space, they may be (i) poorly or not at all detectable and/or (ii) observable from only a few viewpoints.
For this reason we have developed r.survey (Bornaetxea & Marchesini, 2021), a plugin (Python script) for GRASS GIS, which allows to simulate (i) from how many observation points each point of the territory is visible, (ii) from which point of observation each point of the territory is most effectively visible, (iii) whether an object of a specific size can be detected. Concerning, in particular, the last element, r.survey calculates the solid angle subtended by a circle of equivalent dimensions to those of the object to be surveyed and assumed to be lying on the territory, oriented according to the slope and aspect derived from a digital terrain model. The solid angle provides a continuous measure of the visibility of the object sought, which can be compared with typical values of a human visual acuity. What happens then is that the concept of 'Effective Surveyed Area' can be reworked into the more accurate 'Size-specific Effective Surveyed Area' (SsESA). The new concept makes it possible to identify those portions of territory in which, during fieldwork, it is possible to observe objects of equal or greater size than those of interest, also considering their orientation in space with respect to the observer.
The code of r.survey, which is based on the libraries and modules of GRASS GIS and was written to exploit multi-core processing, is open source and available for downloading (https://doi.org/10.5281/zenodo.3993140) together with a manual and some example data.
How to cite: Marchesini, I. and Bornaetxea, T.: r.survey: a tool to assess whether elements of specific sizes can be visually detected during field surveys, EGU General Assembly 2022, Vienna, Austria, 23–27 May 2022, EGU22-5715, https://doi.org/10.5194/egusphere-egu22-5715, 2022.
Please decide on your access
Please use the buttons below to download the presentation materials or to visit the external website where the presentation is linked. Regarding the external link, please note that Copernicus Meetings cannot accept any liability for the content and the website you will visit.
Forward to presentation link
You are going to open an external link to the presentation as indicated by the authors. Copernicus Meetings cannot accept any liability for the content and the website you will visit.
We are sorry, but presentations are only available for users who registered for the conference. Thank you.

EGU22-8456 | Presentations | GM2.3
Sediment connectivity assessment through a geomorphometric approach: a review of recent applicationsMarco Cavalli, Stefano Crema, Sara Cucchiaro, Giorgia Macchi, Sebastiano Trevisani, and Lorenzo Marchi
Sediment connectivity, defined as the degree to which a system facilitates the transfer of sediment through itself by means of coupling relationships between its components, has recently emerged as a paramount property of geomorphic systems. The growing interest of the earth sciences community in connectivity led this property to become a key concept concerning sediment transfer processes analysis and one of the building blocks of modern geomorphology. The increasing availability of high-resolution Digital Elevation Models (DEMs) from different sources as LiDAR and Structure from Motion (SfM) paved the way to quantitative and semi-quantitative approaches for assessing sediment connectivity. A geomorphometric index of sediment connectivity, based on DEM derivatives as drainage area, slope, flow length and surface roughness, has been developed along with related freeware software tool (SedInConnect). The index aims at depicting spatial connectivity patterns at the catchment scale to support the assessment of the contribution of a given part of the catchment as sediment source and define sediment transfer paths. The increasing interest in the quantitative characterization of the linkages between landscape units and the straightforward applicability of this index resulted in numerous applications in different contexts. This work presents and discusses the main applications of the sediment connectivity index along with a recent application in the frame of the Interreg ITAT3032 SedInOut Project (2019-2022). Being a topography-based index, it is focused on structural aspects of connectivity, and quality and resolution of DEMs may have a significant impact on the results. Future development should consider process-based connectivity and incorporate temporal variability directly into the index. Moreover, this work demonstrates that, when carefully applied considering the intrinsic limitations of the topographic-based approach, the index can rapidly provide a spatial characterization of sediment dynamics, thus improving the understanding of geomorphic system behavior and, consequently, hazard and risk assessment.
How to cite: Cavalli, M., Crema, S., Cucchiaro, S., Macchi, G., Trevisani, S., and Marchi, L.: Sediment connectivity assessment through a geomorphometric approach: a review of recent applications, EGU General Assembly 2022, Vienna, Austria, 23–27 May 2022, EGU22-8456, https://doi.org/10.5194/egusphere-egu22-8456, 2022.
Please decide on your access
Please use the buttons below to download the presentation materials or to visit the external website where the presentation is linked. Regarding the external link, please note that Copernicus Meetings cannot accept any liability for the content and the website you will visit.
Forward to presentation link
You are going to open an external link to the presentation as indicated by the authors. Copernicus Meetings cannot accept any liability for the content and the website you will visit.
We are sorry, but presentations are only available for users who registered for the conference. Thank you.
EGU22-8994 | Presentations | GM2.3 | Highlight
FABDEM - A 30m global map of elevation with forests and buildings removedPeter Uhe, Laurence Hawker, Luntadila Paulo, Jeison Sosa, Christopher Sampson, and Jeffrey Neal
Digital Elevation Models (DEMs) depict the elevation of the Earth’s surface and are fundamental to many applications, particularly in the geosciences. To date, global DEMs contain building and forest artifacts that limit its functionality for applications that require precise measurement of terrain elevation, such as flood inundation modeling. Using machine learning techniques, we remove both building and tree height bias from the recently published Copernicus GLO-30 DEM to create a new dataset called FABDEM (Forest And Buildings removed Copernicus DEM). This new dataset is available at 1 arc second grid spacing (~30m) between 60°S-80°N, and is the first global DEM to remove both buildings and trees.
Our correction algorithm is trained on a comprehensive and unique set of reference elevation data from 12 countries that covers a wide range of climate zones and urban types. This results in a wider applicability compared to previous DEM correction studies trained on data from a single country. As a result, we reduce mean absolute vertical error from 5.15m to 2.88m in forested areas, and from 1.61m to 1.12m in built-up areas, compared to Copernicus GLO-30 DEM. Further statistical and visual comparisons to other global DEMs suggests FABDEM is the most accurate global DEM with median errors ranging from -0.11m to 0.45m for the different landcover types assessed. The biggest improvements were found in areas of dense canopy coverage (>50%), with FABDEM having a median error of 0.45m compared to 2.95m in MERIT DEM and 12.95m for Copernicus GLO-30 DEM.
FABDEM has notable improvements over existing global DEMs, resulting from the use of Copernicus GLO-30 and a powerful machine learning correction of building and tree bias. As such, there will be beneifts in using FABDEM for purposes where depiction of the bare-earth terrain is required, such as in applications in geomorphology, glaciology and hydrology.
How to cite: Uhe, P., Hawker, L., Paulo, L., Sosa, J., Sampson, C., and Neal, J.: FABDEM - A 30m global map of elevation with forests and buildings removed, EGU General Assembly 2022, Vienna, Austria, 23–27 May 2022, EGU22-8994, https://doi.org/10.5194/egusphere-egu22-8994, 2022.
Please decide on your access
Please use the buttons below to download the presentation materials or to visit the external website where the presentation is linked. Regarding the external link, please note that Copernicus Meetings cannot accept any liability for the content and the website you will visit.
Forward to presentation link
You are going to open an external link to the presentation as indicated by the authors. Copernicus Meetings cannot accept any liability for the content and the website you will visit.
We are sorry, but presentations are only available for users who registered for the conference. Thank you.

EGU22-13121 | Presentations | GM2.3
Clustering stream profiles to understand the geomorphological features and evolution of the Yangtze River by using DEMSFei Zhao and Liyang Xiong
Stream morphology is an important indicator for revealing the geomorphological features and evolution of the Yangtze River. Existing studies on the morphology of the Yangtze River focus on planar features. However, the vertical features are also important. Vertical features mainly control the flow ability and erosion intensity. Furthermore, traditional studies often focus on a few stream profiles in the Yangtze River. However, stream profiles are linked together by runoff nodes, thus affecting the geomorphological evolution of the Yangtze River naturally. In this study, a clustering method of stream profiles in the Yangtze River is proposed by plotting all profiles together. Then, a stream evolution index is used to investigate the geomorphological features of the stream profile clusters to reveal the evolution of the Yangtze River. Based on the stream profile clusters, the erosion base of the Yangtze River generally changes from steep to gentle from the upper reaches to the lower reaches, and the evolution degree of the stream changes from low to high. The asymmetric distribution of knickpoints in the Han River Basin supports the view that the boundary of the eastward growth of the Tibetan Plateau has reached the vicinity of the Daba Mountain.
How to cite: Zhao, F. and Xiong, L.: Clustering stream profiles to understand the geomorphological features and evolution of the Yangtze River by using DEMS, EGU General Assembly 2022, Vienna, Austria, 23–27 May 2022, EGU22-13121, https://doi.org/10.5194/egusphere-egu22-13121, 2022.
EGU22-13122 | Presentations | GM2.3
Mathematical vector framework for gravity-specific land surface curvatures calculation from triangulated irregular networksGuanghui Hu, Liyang Xiong, and Guoan Tang
Land surface curvature (LSC) is a basic attribute of topography and influences local effects of gravitational energy and surface material transport. However, the calculation of LSCs based on triangulated irregular networks (TINs) has not been fully studied, which restricts further geoscience studies based on TIN digital elevation models (DEMs). The triangular facets and vertices of a TIN are both expressions of the land surface; therefore, based on their adjacency relationship, the LSCs can be calculated. In this study, we propose a mathematical vector framework to enhance LSC system theory. In this framework, LSC can be calculated based on both triangular facets and vertices, and the selection of weighting methods in the framework is flexible. We use the concept of the curvature tensor to interpret and calculate the commonly used LSC, which provides a new perspective in geoscience research. We also investigate the capacity of the TIN-based method to perform LSCs calculations and compare it with grid-based methods. Based on a mathematically simulated surface, we reach the following conclusions. First, the TIN-based method has similar effects on the scale to the grid-based methods of EVANS and ZEVENBERGEN. Second, the TIN-based method is less error sensitive than the grid-based methods by the EVANS and ZEVENBERGEN polynomials for the high error DEMs. Third, the shape of the TIN triangles exerts a great influence on the LSCs calculation, which means that the accuracy of LSCs calculation can be further improved with the optimized TIN but will be discontinuous. Based on three real landforms with different data sources, we discuss the possible applications of the TIN-based method, e.g., the classification of land surface concavity–convexity and hillslope units. We find that the TIN-based method can produce visually better classification results than the grid-based method. This qualitative comparison reflects the potential of using TINs in multiscale geoscience research and the capacity of the proposed TIN-based LSC calculation methods. Our proposed mathematical vector framework for LSCs calculations from TINs is a preliminary approach to mitigate the multiple-scale problem in geoscience. In addition, this research integrates mathematical vector and geographic theories and provides an important reference for geoscience research.
How to cite: Hu, G., Xiong, L., and Tang, G.: Mathematical vector framework for gravity-specific land surface curvatures calculation from triangulated irregular networks, EGU General Assembly 2022, Vienna, Austria, 23–27 May 2022, EGU22-13122, https://doi.org/10.5194/egusphere-egu22-13122, 2022.
Please decide on your access
Please use the buttons below to download the presentation materials or to visit the external website where the presentation is linked. Regarding the external link, please note that Copernicus Meetings cannot accept any liability for the content and the website you will visit.
Forward to presentation link
You are going to open an external link to the presentation as indicated by the authors. Copernicus Meetings cannot accept any liability for the content and the website you will visit.
We are sorry, but presentations are only available for users who registered for the conference. Thank you.
EGU22-13124 | Presentations | GM2.3
Integrating topographic knowledge into deep learning for the void-filling of digital elevation modelsSijin Li, Liyang Xiong, and Guoan Tang
Digital elevation models (DEMs) contain some of the most important data for providing terrain information and supporting environmental analyses. However, the applications of DEMs are significantly limited by data voids, which are commonly found in regions with rugged terrain. We propose a novel deep learning-based strategy called a topographic knowledge-constrained conditional generative adversarial network (TKCGAN) to fill data voids in DEMs. Shuttle Radar Topography Mission (SRTM) data with spatial resolutions of 3 and 1 arc-seconds are used in experiments to demonstrate the applicability of the TKCGAN. Qualitative topographic knowledge of valleys and ridges is transformed into new loss functions that can be applied in deep learning-based algorithms and constrain the training process. The results show that the TKCGAN outperforms other common methods in filling voids and improves the elevation and surface slope accuracy of the reconstruction results. The performance of TKCGAN is stable in the test areas and reduces the error in the regions with medium and high surface slopes. Furthermore, the analysis of profiles indicates that the TKCGAN achieves better performance according to a visual inspection and quantitative comparison. In addition, the proposed strategy can be applied to DEMs with different resolutions. This work is an endeavour to transform perceptive topographic knowledge into computer-processable rules and benefits future research related to terrain reconstruction and modelling.
How to cite: Li, S., Xiong, L., and Tang, G.: Integrating topographic knowledge into deep learning for the void-filling of digital elevation models, EGU General Assembly 2022, Vienna, Austria, 23–27 May 2022, EGU22-13124, https://doi.org/10.5194/egusphere-egu22-13124, 2022.
Please decide on your access
Please use the buttons below to download the presentation materials or to visit the external website where the presentation is linked. Regarding the external link, please note that Copernicus Meetings cannot accept any liability for the content and the website you will visit.
Forward to presentation link
You are going to open an external link to the presentation as indicated by the authors. Copernicus Meetings cannot accept any liability for the content and the website you will visit.
We are sorry, but presentations are only available for users who registered for the conference. Thank you.
EGU22-13129 | Presentations | GM2.3
Research on texture features for typical sand dunes using multi-source dataJunfei Ma, Fayuan Li, Lulu Liu, Jianhua Cheng, and Guoan Tang
Deserts have obvious textural features. In detail, different types of sand dunes have significant differences in their morphological texture features. Existing studies on desert texture have mainly focused on extracting dune ridges or sand ripples using remote sensing images. However, comprehensive understanding of desert texture at multiple scales and quantitative representation of texture features are lacking. Our study area is in the Badain Jaran Desert. Four typical sand dunes in this desert are selected, namely, starlike chain megadune, barchans chain, compound chain dune, and schuppen chain megadune. Based on Sentinel-2 and ASTER 30m DEM data, the macroscopic and microscopic texture features of the desert are extracted using positive and negative topography, edge detection and local binary pattern (LBP) methods, respectively. Eight texture indexes based on gray level co-occurrence matrix(GLCM) are calculated for the original data and the abstract texture data respectivelyThen these texture parameters are clustered based on the result of Spearman correlation. Finally, the coefficient of variation is used to determine representative indicators for each cluster in order to construct a geomorphological texture information spectrum library of typical dune types. The results show that the macroscopic and microscopic texture features of the same type of sand dunes have high similarity. And geomorphological texture information spectrum can well distinguish different types of sand dunes by curve features.
How to cite: Ma, J., Li, F., Liu, L., Cheng, J., and Tang, G.: Research on texture features for typical sand dunes using multi-source data, EGU General Assembly 2022, Vienna, Austria, 23–27 May 2022, EGU22-13129, https://doi.org/10.5194/egusphere-egu22-13129, 2022.
Please decide on your access
Please use the buttons below to download the presentation materials or to visit the external website where the presentation is linked. Regarding the external link, please note that Copernicus Meetings cannot accept any liability for the content and the website you will visit.
Forward to presentation link
You are going to open an external link to the presentation as indicated by the authors. Copernicus Meetings cannot accept any liability for the content and the website you will visit.
We are sorry, but presentations are only available for users who registered for the conference. Thank you.
EGU22-13130 | Presentations | GM2.3
Regional differences in gully network connectivity based on graph theory: a case study on the Loess Plateau, ChinaJianhua Cheng, Lanhua Luo, Fayuan Li, and Lulu Liu
Gullies are some of the areas with the most frequent material exchanges in loess landforms. By studying the influence of the spatial structure of gully networks on material transport and describing the difficulty of material transport from sources to sinks, it is of great significance to understand the development and evolution of loess landforms. This study is based on graph theory and digital terrain analysis and describes the relationship between gully networks and terrain feature elements via a gully network graph model. The adjacency matrix of the gully network graph model is constructed to quantify the connectivity. Taking six typical small watershed sample areas of the Loess Plateau as the research objects, the changes in the gully network connectivity characteristics in different loess geomorphic areas are analyzed from the aspects of overall network connectivity and node connectivity. The results show that (1) From Shenmu to Chunhua (the sample areas from north to south), the average values of the gully network edge weights first decrease and then increase. The maximum value is 0.253 in the Shenmu sample area, and the minimum value is 0.093 in the Yanchuan sample area. These values show that as the gully development increases, the greater the capacity of the gully network to transport materials is, and the less resistance the material receives during the transfer process. (2) The average node strength reaches the minimum in the Yanchuan sample area, and from Yanchuan to the north and south sides, it gradually increases. It can be concluded that the overall connectivity of the gully network shows a gradually weakening trend from the Yanchuan sample area to the north and south sides. (3) The potential flow (Fi) and network structural connectivity index (NSC) show similar characteristic changes; from north to south, the connectivity of nodes from the Shenmu to Yanchuan sample areas gradually increases, and from the Yanchuan to Chunhua sample areas, it gradually weakens. The accessibility from source to sink (Shi) shows the opposite trend. At the same time, the connectivity index values of the gully network nodes in the six typical areas all show clustered spatial distribution characteristics. (4) By comparing the results of the connectivity indicators calculated by the Euclidian distance used in the previous study and the sediment transport capacity index used in this study and by comparing the variation in the gully network quantitative indicators and the gully network connectivity indicators, this comparison result indicates the rationality of connectivity indicators in this paper. The connectivity of the gully network contains abundant and important information on the development and evolution of loess gullies. Research on the connectivity of the gully network will help deepen the understanding of the evolution process and mechanism of loess gullies.
How to cite: Cheng, J., Luo, L., Li, F., and Liu, L.: Regional differences in gully network connectivity based on graph theory: a case study on the Loess Plateau, China, EGU General Assembly 2022, Vienna, Austria, 23–27 May 2022, EGU22-13130, https://doi.org/10.5194/egusphere-egu22-13130, 2022.
EGU22-13131 | Presentations | GM2.3
Morphological characteristics and evolution model of loess gully cross sectionLulu Liu, Fayuan Li, Xue Yang, and Jianhua Cheng
Gully morphology is an important part of loess geomorphology research. Along with gully development, the variation of its cross section is the most important aspect, and it can intuitively reflect the characteristics of the lateral widening of the gully slope. Therefore, in-depth research of the variation of the cross-sectional morphology of the gully is important to understanding the development process of the loess gully. Based on the data of nine periods of an indoor simulated loess small watershed, this paper deeply studies the evolution model of a complete branch ditch in the watershed from many aspects by using the theory and method of digital terrain analysis. Firstly, we analyse the morphological characteristics of the gully cross section in the simulated small watershed. The test shows that with the development of the gully, the average slope of the slope decreases continuously, and the slope morphology is mostly a concave slope along the slope direction. The degree of downward concave first increases and then gradually tends to be gentle. The gully erosion mode is gradually transformed from downward cutting erosion to lateral erosion. The more mature the gully development, the lower the depth of gully bottom cutting is compared with the width of gully widening. Furthermore, the surface cutting depth tends to be stable and the slope is stable. Then, the transformation law of the slope morphology of the gully cross section with the development of the gully is studied, and the prediction model of the transformation of the slope morphology of the gully cross section is established by using the Markov chain. The Markov model can better reflect the dynamic change of the slope morphology of the gully cross section, which is of considerable importance to revealing the external performance and internal mechanism of the gully morphology.
How to cite: Liu, L., Li, F., Yang, X., and Cheng, J.: Morphological characteristics and evolution model of loess gully cross section, EGU General Assembly 2022, Vienna, Austria, 23–27 May 2022, EGU22-13131, https://doi.org/10.5194/egusphere-egu22-13131, 2022.
EGU22-13239 | Presentations | GM2.3
Assessment of post-seismic landslide susceptibility using an index representative of seismic cracksMio Kasai and Shui Yamaguchi
In an area experienced a strong earthquake, the formation of clusters of seismic cracks is considered related to susceptibility to post-seismic slides. However, the relationship between crack distribution and the occurrence of post-seismic slides has rarely been evaluated. This study developed an index representing the spatial density of seismic cracks (dense crack index: DCI) for the area where post-seismic slides were identified after the 2016 Kumamoto earthquake (Mw 7.0). The susceptibility of post-seismic slides was then assessed using models that incorporated the weight of evidence (WoE) and random forest (RF) methods, with the DCI as a conditioning factor. Both the models confirmed the importance of the DCI, although the improvement in model performance as indicated by area under the curve values was marginal or negligible by including the index. This was largely because the combination of features that indicated where open cracks were likely to occur, or ridgelines where seismic waves were prone to be amplified, could compensate for the absence of the index. The contribution of the DCI could be improved if more accurate LiDAR data were used in the analysis.
How to cite: Kasai, M. and Yamaguchi, S.: Assessment of post-seismic landslide susceptibility using an index representative of seismic cracks, EGU General Assembly 2022, Vienna, Austria, 23–27 May 2022, EGU22-13239, https://doi.org/10.5194/egusphere-egu22-13239, 2022.
EGU22-13325 | Presentations | GM2.3
Evaluating Geomorphometric Variables to Identify Groundwater Potential Zones in Sahel-Doukkala, MoroccoAdnane Habib, Abdelaziz El Arabi, and Kamal Labbassi
Topography and geology are considered the primary factors influencing groundwater flow and accumulation. To evaluate their potential in identifying groundwater potential, an integrated approach was provided and used in this work to delineate groundwater potential zones in Sahel-Doukkala, Morocco, by combining geomorphometric variables and a Multi-Criteria Evaluation (MCE) technique. Aside from lithology, all variables used in this approach were derived from a 10 m Digital Elevation Model (DEM) generated from ALOS-PRISM stereo-images using photogrammetric techniques. The chosen variables were considered to be very closely associated with groundwater circulation and accumulation, namely lithology, topographic wetness index (TWI), convergence index (CI), lineament density, lineament intersection density, and drainage network. These variables were given weights based on their respective importance in the occurrence of groundwater, by using a cumulative effect matrix. This process has shown that lineament density had the most effects on other variables, with the biggest weight (24%), followed by lineament intersection density (20%). TWI and CI succeeded 16% while lithology and drainage network density had the least weight (12%). Later, in a GIS system, an MCE based weight sum method was used for generating the groundwater potential zones map.
The obtained map was classified into three zones, viz. “poor”, “moderate” and “high”. These zones delineate areas where the subsurface has varying degrees of potential to store water and also indicate the availability of groundwater. It was found that the zone with “high” potential covered an area of approximately 714 km2 (44 % of the study area), and it identified areas that are suitable for groundwater storage. These zones showed a high association with low drainage density, low TWI values, and a high density of lineaments and lineament intersections. The groundwater potential zones map produced by the proposed approach was verified using the location and groundwater level depth of 325 existing wells that were categorized as successful, and the result was found satisfactory, with 91% of the successful exiting wells were located at zones that fall in the “moderate” and “high” areas. In addition, the validity of the proposed approach was tested according to the groundwater level depth, which indicates the actual groundwater potential. It was found that places with "high" potential have an average groundwater level depth of approximately 27 m, whereas areas with “moderate” and “poor” potential showed an average of 31 m and 37 m, respectively. The validation results show a good agreement between existing groundwater wells and the obtained groundwater potential zones map and were considered to be reasonable. Therefore, the produced map can be of great help to hydrogeologists to detect, with time and cost-effectively, new zones that may carry a high groundwater potential.
Because DEM data is one of the most widely and easily accessible data, the proposed method is well suited for areas where data is scarce. As result, it can be widely used to develop conceptual models based on geomorphometric variables as primary inputs for similar arid and semi-arid regions suffering from data scarcity.
How to cite: Habib, A., El Arabi, A., and Labbassi, K.: Evaluating Geomorphometric Variables to Identify Groundwater Potential Zones in Sahel-Doukkala, Morocco, EGU General Assembly 2022, Vienna, Austria, 23–27 May 2022, EGU22-13325, https://doi.org/10.5194/egusphere-egu22-13325, 2022.
Please decide on your access
Please use the buttons below to download the presentation materials or to visit the external website where the presentation is linked. Regarding the external link, please note that Copernicus Meetings cannot accept any liability for the content and the website you will visit.
Forward to presentation link
You are going to open an external link to the presentation as indicated by the authors. Copernicus Meetings cannot accept any liability for the content and the website you will visit.
We are sorry, but presentations are only available for users who registered for the conference. Thank you.
EGU22-13343 | Presentations | GM2.3
A scale-independent model for the analysis of geomorphodiversity indexLaura Melelli, Martina Burnelli, and Massimiliano Alvioli
The World Urbanization Prospects (ONU) estimates that within 2050 about 70% of the world's population will live in urban areas. The use of GIS and spatial analysis are essential tools for proper land use planning, which takes into account the geomorphological characteristics of the territory, as the starting point for the safeguard of urban ecosystems.
Several geological and environmental approaches have been proposed, albeit they usually lack a new objective, quantitative and scale independent model. At variance with common approaches, recently a new geomorphodiversity index was proposed which aims at an objective classification of joint geological, hydrological, biotic and ... features, in Italy.
In this work, we show results of a study performed in urban areas in Italy, where we apply systematic spatial analysis for the identification of the geomorphodiversity index. The approach proposed a quantitative assessment of topographic features (i.e., slope and landforms classification) is a spatial analysis in GRASS GIS through the use of geomorphon method and additional morphometric quantities. We aim at the definition of a new scale-independent approach, analyzing all of the morphometric quantities calculated at different scales (i.e., within moving windows of different sizes). We shown that scale- and model-independent selection of such features is possible for most of the considered quantities.
We argue that our work is relevant for the objective selection of quantities to define a geomorphodiversity index, and its calculation in areas of arbitrary size and geomorphological properties, provided the same input data is available.
How to cite: Melelli, L., Burnelli, M., and Alvioli, M.: A scale-independent model for the analysis of geomorphodiversity index, EGU General Assembly 2022, Vienna, Austria, 23–27 May 2022, EGU22-13343, https://doi.org/10.5194/egusphere-egu22-13343, 2022.
Please decide on your access
Please use the buttons below to download the presentation materials or to visit the external website where the presentation is linked. Regarding the external link, please note that Copernicus Meetings cannot accept any liability for the content and the website you will visit.
Forward to presentation link
You are going to open an external link to the presentation as indicated by the authors. Copernicus Meetings cannot accept any liability for the content and the website you will visit.
We are sorry, but presentations are only available for users who registered for the conference. Thank you.
EGU22-1276 | Presentations | PS4.6
Observation of a Total Eclipse of the Moon at 183 GHzMartin Burgdorf, Niutao Liu, Stefan A. Buehler, and Yaqiu Jin
The observation of an eclipse of the Moon at millimetre wavelengths makes it possible to investigate the electrical and thermal properties of the lunar surface to a depth of 10 cm without being influenced by deeper layers. Such measurements are usually carried out with radio telescopes on Earth. When microwave instruments on weather satellites use observations of deep space for their calibration, however, the whole lunar disk appears sometimes in their field of view as well. We identified such an event with the Advanced Microwave Sounding Unit-B on NOAA-15 that coincided with a total lunar eclipse. From this unique vantage point in a polar orbit around the Earth we could measure, once per orbit, the lunar radiance at 183 GHz - a frequency, where the atmosphere is not transparent.
We found a maximum temperature drop during the eclipse of 47±9 K at 183 GHz, corresponding to 16.6±2.1% of the flux density of full Moon, and of 17.3±6 K, corresponding to 6.4±2.1% of the flux density of full Moon, for the window channel at 89 GHz. The evolution in time of the global flux agrees well with the predictions from a new radiative transfer model simulating the global brightness temperatures. Our measurements are consistent with results reported in the past, except for two, which we consider erroneous. The temperature changes are similar everywhere on the lunar disc. The good agreement between the observations from a weather satellite and theoretical predictions demonstrates that the Moon is very useful as flux reference and for checking the reliability of climate data records from Earth observation.
How to cite: Burgdorf, M., Liu, N., Buehler, S. A., and Jin, Y.: Observation of a Total Eclipse of the Moon at 183 GHz, EGU General Assembly 2022, Vienna, Austria, 23–27 May 2022, EGU22-1276, https://doi.org/10.5194/egusphere-egu22-1276, 2022.
Please decide on your access
Please use the buttons below to download the presentation materials or to visit the external website where the presentation is linked. Regarding the external link, please note that Copernicus Meetings cannot accept any liability for the content and the website you will visit.
Forward to presentation link
You are going to open an external link to the presentation as indicated by the authors. Copernicus Meetings cannot accept any liability for the content and the website you will visit.
We are sorry, but presentations are only available for users who registered for the conference. Thank you.

EGU22-2214 | Presentations | PS4.6
Large impact cratering during lunar magma ocean solidificationKatarina Miljkovic, Mark A. Wieczorek, Matthieu Laneuville, Alexander Nemchin, Phil A. Bland, and Maria T. Zuber
The lunar cratering record is used to constrain the bombardment history of both the Earth and the Moon. However, it is suggested from different perspectives, including impact crater dating, asteroid dynamics, lunar samples, impact basin-forming simulations, and lunar evolution modelling, that the Moon could be missing evidence of its earliest cratering record. Here we report that impact basins formed during the lunar magma ocean solidification should have produced different crater morphologies in comparison to later epochs. A low viscosity layer, mimicking a melt layer, between the crust and mantle could cause the entire impact basin size range to be susceptible to immediate and extreme crustal relaxation forming almost unidentifiable topographic and crustal thickness signatures. Lunar basins formed while the lunar magma ocean was still solidifying may escape detection, which is agreeing with studies that suggest a higher impact flux than previously thought in the earliest epoch of Earth-Moon evolution.
How to cite: Miljkovic, K., Wieczorek, M. A., Laneuville, M., Nemchin, A., Bland, P. A., and Zuber, M. T.: Large impact cratering during lunar magma ocean solidification, EGU General Assembly 2022, Vienna, Austria, 23–27 May 2022, EGU22-2214, https://doi.org/10.5194/egusphere-egu22-2214, 2022.
Please decide on your access
Please use the buttons below to download the presentation materials or to visit the external website where the presentation is linked. Regarding the external link, please note that Copernicus Meetings cannot accept any liability for the content and the website you will visit.
Forward to presentation link
You are going to open an external link to the presentation as indicated by the authors. Copernicus Meetings cannot accept any liability for the content and the website you will visit.
We are sorry, but presentations are only available for users who registered for the conference. Thank you.
EGU22-2815 | Presentations | PS4.6
Estimation of Lunar Ephemeris from Lunar Laser RangingVishwa Vijay Singh, Liliane Biskupek, Juergen Mueller, and Mingyue Zhang
Lunar Laser Ranging (LLR) has been measuring the distance between the Earth and the Moon since 1969, where the measurements are provided by the observatories as Normal Points (NPs). The Institute of Geodesy (IfE) LLR model has (as of April 2021) 28093 NPs. Using the LLR observation equation, the LLR residuals (difference of observed and calculated values of the light travel time) are obtained for each NP. The LLR analysis procedure is an iteration of the calculation of ephemeris of the solar system followed by the calculation of residuals and the estimation of parameters using a Least-Squares Adjustment (LSA). The initial orbit of the Moon (Euler angles and angular velocity of the lunar mantle, Euler angles of the lunar core, and the position and the velocity of the selenocenter), amongst many other parameters, is estimated from the LSA. In our previous standard calculation, the initial orbit of the Moon was estimated for June 28, 1969 and ephemeris was calculated from this time until June 2022. In this study, we estimate the initial orbit of the Moon for Jan 1, 2000 to be able to benefit from the higher accuracy of the NPs over the timespan of LLR. The ephemeris is then calculated in forward and backward directions (until June 2022 and June 1969). When comparing the uncertainty obtained from a LSA of this study with the previous standard calculation, preliminary results show an improvement of over 50% in the initial position and the initial velocity of the Moon, a deterioration of about 20% in the Euler angles of the mantle and the core, and an improvement of over 15% in the angular velocity of the mantle. The changed analysis procedure will allow to compute a more accurate ephemeris for the upcoming years benefitting future lunar science. Recent results will be presented and major changes would be discussed.
Acknowledgement. This research was funded by Deutsche Forschungsgemeinschaft (DFG) under Germany’s Excellence Strategy EXC 2123 QuantumFrontiers-390837967.
How to cite: Singh, V. V., Biskupek, L., Mueller, J., and Zhang, M.: Estimation of Lunar Ephemeris from Lunar Laser Ranging, EGU General Assembly 2022, Vienna, Austria, 23–27 May 2022, EGU22-2815, https://doi.org/10.5194/egusphere-egu22-2815, 2022.
Please decide on your access
Please use the buttons below to download the presentation materials or to visit the external website where the presentation is linked. Regarding the external link, please note that Copernicus Meetings cannot accept any liability for the content and the website you will visit.
Forward to presentation link
You are going to open an external link to the presentation as indicated by the authors. Copernicus Meetings cannot accept any liability for the content and the website you will visit.
We are sorry, but presentations are only available for users who registered for the conference. Thank you.
EGU22-5452 | Presentations | PS4.6
Investigating Potential Safe Landing Sites for ESA/ROSCOSMOS' Luna 27 MissionSarah Boazman, David Heather, Elliot Sefton-Nash, Csilla Orgel, Berengere Houdou, Xavier Lefort, and The Lunar Lander Team
ESA and ROSCOSMOS’ Luna 27 mission will explore the south polar region of the Moon and will sample the lunar surface. To ensure the best samples are collected, which yield the greatest scientific return eight potential landing sites are being investigated using remote sensing methods. We have studied the safety of the eight potential landing sites by creating slope maps using the LOLA (30m/px) digital elevation model and classified slopes into safe areas (slopes <10°) and unsafe areas (slopes >10°). Additionally, we created slope maps classified in 2° intervals from 0-14° and greater than 14°, to further investigate which areas have the lowest slopes and therefore potentially the safest landing sites.
We found that each of the eight landing sites contain areas that are safe for landing (slopes <10°) and sites 1, 2, 4, 6 and 8 contain large areas (>500 km2) that are classified as safe for landing. Site 3 has large craters with steep crater walls, which may present a hazard to landing. At site 5 there is a large crater (~20 km diameter) to the bottom right of the site, which has a steep crater walls and rim, which creates a topographic ridge in the south east of the landing site and should be avoided as a landing site. Site 7 also has a steep topographic ridge which again should be avoided as a landing area. In comparison site 8 contains a large area with shallow slopes in the center with slopes of 0-2°, which would be an ideal landing site. Site 1 covers a large crater (~40 km diameter), and the center of the crater floor has shallow slopes with less than 4°. Site 2 similarly has a large crater floor with slopes less than 4°. Both the crater floors of site 1 and site 2 could be a safe landing site.
This initial investigation into the potential landing sites has identified areas which could be safe for landing Luna 27. Future work will use multiple datasets to explore the scientific potential of the landing sites including investigating the surface roughness, identifying craters and boulders, which could present a hazard to the lander, using thermal maps to measure the thermal stability, and exploring the illumination conditions and Earth visibility at each of the landing sites.
How to cite: Boazman, S., Heather, D., Sefton-Nash, E., Orgel, C., Houdou, B., Lefort, X., and Lunar Lander Team, T.: Investigating Potential Safe Landing Sites for ESA/ROSCOSMOS' Luna 27 Mission, EGU General Assembly 2022, Vienna, Austria, 23–27 May 2022, EGU22-5452, https://doi.org/10.5194/egusphere-egu22-5452, 2022.
EGU22-7634 | Presentations | PS4.6
GPR Reverse-Time Migration for Layered Media: A Case Study at the Chang’E-4 Landing SiteIraklis Giannakis, Javier Martin-Torres, Maria-Paz Zorzano, Craig Warren, and Antonis Giannopoulos
Chang’E-4 was the first mission to land a human object on the far side of the Moon. The landing site was at the Von Kármán (VK) crater at the South-Pole Aitken (SPA) basin, one of biggest craters in the solar system. SPA is believed that was created by a huge impact that penetrated the lunar crust and uplifted mantle materials. Evidence of these materials are expected to be found by the Yutu-2, the rover of the mission that is still active to this day, having covered more than 1km on the lunar’s surface. Yutu-2 is equipped with a stereo camera, visible/near-infrared imaging spectrometer, alpha particle x-ray spectrometer and Ground-Penetrating Radar (GPR). In-situ GPR is a powerful geophysical methodology with a uniquely wide range of applications to civil engineering, archaeology and geophysics. In planetary science, it was first used in 2013 during the Chang’E-3 mission. Since then, GPR has become a very popular instrument in planetary missions, and has been included in the scientific payload of Chang’E-4, E-5, Tianwen-1, and Perseverance. It is also planned to be used in the future missions Chang’E-7 (2024) and ExoMars (September 2022).
Yutu-2 rover is equipped with three different GPR systems. One low frequency and two high frequency antennas. Unfortunately, due to interferences between the antenna and the metallic parts of the rover, the low frequency data have very low signal to clutter ratio making the interpretation of these data unreliable. On the other hand, the signal from the high frequency antennas is very clear, probably due the lack of ilmenite in the area, which results to low electromagnetic losses (compared to the Chang’E-3 landing site). This resulted to good quality radagrams that provided new insights into the structure and composition of the top ejecta layers at the VK crater.
In the current paper, we introduce a complete processing scheme, tuned for high frequency lunar penetrating radar. The first step of the proposed framework is an advanced hyperbola fitting (AHF) capable of inferring previously unseen layers due to their smooth boundaries. Subsequently, the reconstructed layered structure is used in a Reverse-Time Migration (RTM) coupled with Finite-Differences Time-Domain (FDTD) method. Via this approach, the radagram is focused subject to a 1D model, avoiding homogeneity constrains that often deviate from reality. Lastly, an un-supervised thresholding is applied to cluster the migrated image into two categories i.e. A) the background host medium and B) rocks/boulders. The suggested scheme is applied to the high frequency data collected by the Yutu-2 rover at the first 100 meters of the mission. A layered structure is inferred at the top 12 meters, similar to the results presented in [1]. Moreover, using the proposed RTM, an abundance of rocks/boulders was revealed. The distribution of the rocks/boulders correlates with the permittivity/density profile, indicating the reliability of the proposed scheme.
References
[1] Giannakis, I., Zhou, F., Warren, C., & Giannopoulos, A. (2021). Inferring the shallow layered structure at the Chang’E-4 landing site: A novel interpretation approach using lunar penetrating radar. Geophysical Research Letters, 48, e2021GL092866
How to cite: Giannakis, I., Martin-Torres, J., Zorzano, M.-P., Warren, C., and Giannopoulos, A.: GPR Reverse-Time Migration for Layered Media: A Case Study at the Chang’E-4 Landing Site, EGU General Assembly 2022, Vienna, Austria, 23–27 May 2022, EGU22-7634, https://doi.org/10.5194/egusphere-egu22-7634, 2022.
EGU22-8169 | Presentations | PS4.6
A more robust interpretation of water ice isotope signature from lunar polar missions: theoretical model for isotope fractionation during water ice sublimation in very low pressure systems at cryogenic temperatures.Veneranda López Días, Laurent Pfister, Christophe Hissler, and François Barnich
Targeting the deployment of sustainable human and robotic exploration on the Moon by the end of this decade, there is a pressing need for better understanding the lunar water cycle and the availability of water for ISRU. The O-H isotope signatures in lunar water are key for determining the water origin in the Earth-Moon system and the mechanisms controlling water distribution and redistribution on the Moon. This has profound implications for understanding the Earth-Moon system’s history and the stability and renewability of water deposits.
Lunar volatiles are involved in a largely unconstrained and complex system of input, transport, trapping, recycling, and loss. The water origin on the Earth-Moon system remains poorly understood. The δD signatures from Apollo samples and meteorites suggest various contributing reservoirs of different origins for lunar water, and/or secondary processes [1], [2]. The different origins include: i) Magmatic (primordial) [3]; ii) asteroidal/cometary impacts [4], [5]; iii) solar wind H+ [1]; iv) mixed origin (solar wind H+/inclusion within meteorite impact glasses or volcanic glasses [6]).
The Roscosmos/ESA Luna 27 mission [7] is one of several international lunar polar missions for in-situ analyses of lunar surface, targeting pressing scientific and industrial knowledge gaps. To interpret the results derived from those polar missions it is critical to understand the extent and nature of any potential water ice loss and related isotope fractionation during the sampling chain.
Experimental studies on isotope fractionation during ice sublimation in nonequilibrium conditions are scarce. These studies concluded on different trends: i) no relevant isotope fractionation up to 40% ice mass loss [8], ii) relevant Rayleigh-like fractionation trend [9]. There is no kinetic isotope fractionation model (theoretical or experimental) for ice sublimation in low pressure systems at cryogenic temperatures, which considers the expected physical processes. Thus, the calculation of water ice isotope signatures remains highly uncertain, hindering the assessment of potential lunar water resources and the interpretation of scientific planetary data.
Here we present a theoretical isotope fractionation model derived from concepts developed by Criss (1999) [10] and adapted to the physical processes expected under lunar conditions, which will contribute to i) more robust interpretations of water ice behaviour in lunar environment and/or extra-terrestrial and/or extreme terrestrial environments; ii) mission operational planning, data processing, extraction/processing techniques; iii) exploration/exploitation roadmap, space mining business plan, natural resources management. [1] B. M. Jones et al., 2018. Geophys. Res. Lett., 45(20), 10,959-10,967; [2] F. M. McCubbin and J. J. Barnes, 2019. Earth Planet. Sci. Lett., 526; [3] A. E. Saal et al., 2013. Science, 340(6138), 1317–1320; [4] J. P. Greenwood et al., 2011. Nat. Geosci., 4(2), 79–82; [5] J. J. Barnes et al., 2016. Nat. Commun., 7(1), 11684; [6] C. I. Honniball et al., 2021. Nat. Astron., 5(2), 121–127; [7] D. J. Heather et al., 2021. Lunar Planet. Sci. Conf. LPI, Abstract #2111; [8] J. Mortimer et al., 2018. Planet. Space Sci., 158(Feb), 25–33; [9] R. H. Brown et al., 2012. Planet. Space Sci., 60(1), 166–180 [10] R. E. Criss, 1999. USA: Oxford University Press.
How to cite: López Días, V., Pfister, L., Hissler, C., and Barnich, F.: A more robust interpretation of water ice isotope signature from lunar polar missions: theoretical model for isotope fractionation during water ice sublimation in very low pressure systems at cryogenic temperatures., EGU General Assembly 2022, Vienna, Austria, 23–27 May 2022, EGU22-8169, https://doi.org/10.5194/egusphere-egu22-8169, 2022.
EGU22-8651 | Presentations | PS4.6
Constraints on the lunar magnetic sources location using orbital magnetic field dataJoana S. Oliveira, Foteini Vervelidou, Mark A. Wieczorek, and Marina D. Michelena
Orbital magnetic field observations of the Moon show several magnetic anomalies distributed heterogeneously across its surface. These observations and results from paleomagnetic studies on lunar rocks corroborates that the lunar crust is locally magnetized. The origin of these magnetic field anomalies is still debated, as most of them are not related to known geological structures or processes. Some of the current suggestions to explain the origin of the anomalies sources include contamination from impactors that could deliver iron-rich material to the lunar surface, and heating associated with localized magmatic activity that could thermochemically alter rocks to produce strong magnetic carriers. Both hypotheses need however an inducing field to magnetize the lunar crust, and strong evidence from previous studies argues in favor of this being a global magnetic field generated by a core dynamo.
In this work, we aim to elucidate the origin of the magnetic anomalies by constraining the location and shape of the underlying magnetization. We do so by inferring the magnetization geometry from orbital magnetic field measurements using an inversion scheme that assumes unidirectional magnetization while making no a priori assumptions about its shape. This method has been used up to now to infer the direction of the underlying magnetisation but it has not yet been used to infer the geometry of the sources. We test the performance of the method by conducting a variety of synthetic tests using magnetized bodies of different geometries such as basins, dykes, and lava tubes, each corresponding to a different possible origin scenario for the observed magnetic anomalies. Results from our synthetic tests show that the method is able to recover the location and shape of the magnetized volume. We explore how different input parameters, such as shape, depth, thickness, and field direction influence the method’s performance in retrieving the characteristics of the magnetized volume. Such an analysis can be performed on many lunar magnetic anomalies, including those which are not related to swirls or impact craters, i.e., the mechanisms that have been most studied up to now. This will help elucidate the geological history of the Moon and key features of the lunar dynamo evolution.
How to cite: Oliveira, J. S., Vervelidou, F., Wieczorek, M. A., and D. Michelena, M.: Constraints on the lunar magnetic sources location using orbital magnetic field data, EGU General Assembly 2022, Vienna, Austria, 23–27 May 2022, EGU22-8651, https://doi.org/10.5194/egusphere-egu22-8651, 2022.
EGU22-9722 | Presentations | PS4.6
Sensitivity analysis of frequency-dependent visco-elastic effects on lunar orbitersXuanyu Hu, Alexander Stark, Dominic Dirkx, Hauke Hussmann, Agnès Fienga, Marie Fayolle-Chambe, Daniele Melini, Giorgio Spada, Anthony Mémin, Nicolas Rambaux, and Jürgen Oberst
Tidal response of the Moon provides crucial insight into the structure and rheology of the lunar interior (Williams et al. 2013). The body deformation subject to forces raised by external objects, most evidently Earth and the Sun, induces a variability of the gravitational field, which is characterized by the Love number, k. This effect may, in turn, manifest itself over time in the perturbed motion of orbiting spacecraft (Konopliv et al. 2013; Lemoine et al. 2013).
For an elastic body the response to the periodic excitation is instantaneous and relaxation times resulting in phase lags of the response are thus neglected. In reality, the lunar interior exhibits a degree of viscosity and dissipates energy through friction, in which case k not only varies with frequency but also comprises an imaginary part that represents a phase lag in tidal response (Williams et al. 2013).
Here, we investigate the signatures of the frequency-dependent Love number in the motion of a lunar orbiter. We formulate the problem following Williams & Boggs (2015), and focus on the variability of five Stokes' coefficients of the second degree effected by k2. The time-varying components are expanded at given characteristic frequencies associated with (linear combinations of) the Delaunay arguments. We make use of the Technical University Delft Astrodynamics Toolbox (Dirkx et al., 2019; https://tudat-space.readthedocs.io/) to investigate the orbit evolution of lunar orbiters, e.g., the Lunar Reconnaissance Orbiter (Mazarico et al. 2018), subject to the time-varying lunar gravitation. Meanwhile, we leverage the analytic theory of Kaula (1966) to illuminate the impact of such specific yet minute perturbations, especially non-short-period variations of the spacecraft orbit (Kaula 1964; Lambeck et al. 1974; Felsentreger et al. 1976).
A particular interest here is in the potential estimability of the frequency-dependent phase lag. Following Dirkx et al. (2016), we conduct a preliminary study of the sensitivity of spacecraft orbit adjustment to the said tidal effects. That is, we investigate if, under which conditions, and to what degree, the signals in question will be absorbed by the adjustment of initial states or other parameters, a consequence that will effectively prohibit the detection of the tidal effects. The outcome is expected to shed light on the minimum criteria of their estimation and thus instructive to real-world data analysis in the future.
Reference
Dirkx, D., et al. (2016), PSS, 134, 84-95
Dirkx, D., et al. (2019), Astrophysics and Space Science, 364:37
Kaula W.M. (1964), Reviews of Geophysics, 2, 661-685
Kaula W.M. (1966), Theory of Satellite Geodesy, Dover Publications, Inc.
Konopliv, A.S., et al. (2013), GRL, 41, 1452-1458
Lambeck, K., et al. (1974), Reviews of Geophysics and Space Physics, 12, 412-434
Felsentreger, T.L. et al. (1976), JGR, 81, 2557-2563
Lemoine, F.G., et al. (2013), JGRP, 118, 1676-1698
Mazarico, E., et al. (2018), PSS, 162, 2-19
Williams J.G., et al. (2013), JGRP, 119, 1546-1578
Williams J.G., and Boggs, D.H. (2015), JGRP, 120, 689-724
How to cite: Hu, X., Stark, A., Dirkx, D., Hussmann, H., Fienga, A., Fayolle-Chambe, M., Melini, D., Spada, G., Mémin, A., Rambaux, N., and Oberst, J.: Sensitivity analysis of frequency-dependent visco-elastic effects on lunar orbiters, EGU General Assembly 2022, Vienna, Austria, 23–27 May 2022, EGU22-9722, https://doi.org/10.5194/egusphere-egu22-9722, 2022.
EGU22-10171 | Presentations | PS4.6
The Moon Science Working Group of the Lunar Gravitational-Wave Antenna ProjectAlessandro Frigeri, Marco Olivieri, Jan Harms, Alessandro Bonforte, Carlo Giunchi, Goro Komatsu, Josipa Majstorović, Matteo Massironi, and Daniele Melini
Lunar Gravitational-wave Antenna (LGWA) proposes to deploy an array of high-end seismometers on the surface of the Moon. The LGWA network will measure the lunar surface displacement excited by Gravitational waves (GWs) with a targeted observation band of 1mHz – few Hz. Seismic noise in that frequency band is very low due to the absence of atmosphere and oceans, representing the main inherent advantage that makes the Moon an ideal target for a GW detection experiment.
The scientific and technical challenges of LGWA are diverse. Since its initiation, LGWA has relied on experts from fundamental physics, astrophysics, geophysics, engineering, and planetary science.
The collaboration is currently organized in working groups (WGs) to cover five key themes: GW science, lunar science, payload, deployment, and operations.
At the beginning of 2022, we started the activities of WG2 to assess the current knowledge of the lunar environment. We aim to characterize and develop models of deployment scenarios suitable for LGWA sensors, via a multi-pronged approach of data analysis and on-field experiments probing terrestrial analogs of lunar terrains.
Besides characterizing the lunar seismic background noise, other goals of the group are related to modeling the lunar interior structure as well as Moon’s normal modes. These will be further used to develop a model of the interaction between the Moon and GWs. The knowledge about the displacement level of this excitation and the background noise will be used to define novel techniques for background noise reduction.
For this purpose, WG2 is composed of physicists, engineers, geophysicists, and geologists. For our activities, we chose an interdisciplinary approach that requires initial communication efforts to create a common ground that will evolve into a crucial baseline activity for the whole LGWA project.
Here we will report our progress in the first months of the activity of our collaboration.
How to cite: Frigeri, A., Olivieri, M., Harms, J., Bonforte, A., Giunchi, C., Komatsu, G., Majstorović, J., Massironi, M., and Melini, D.: The Moon Science Working Group of the Lunar Gravitational-Wave Antenna Project, EGU General Assembly 2022, Vienna, Austria, 23–27 May 2022, EGU22-10171, https://doi.org/10.5194/egusphere-egu22-10171, 2022.
EGU22-10274 | Presentations | PS4.6
Investigating the origin of Mg-spinel exposures on Mons Hansteen Alpha, an evolved silicic volcanic structure on the MoonHimela Moitra and Saibal Gupta
Mons Hansteen Alpha is a lunar ‘red spot’ that is now considered to be of non-mare volcanic origin. In addition to being characterized by an evolved silicic composition, Mons Hansteen Alpha is also of interest because of the presence of Mg-spinel exposures in association with the siliceous lithology, as detected by the Moon Mineralogy Mapper on board the Chandrayaan-1 mission. The Compton-Belkovich volcanic complex on the Moon is the only other established example of this kind. The origin of Mg-spinel exposures on the lunar surface is considered to be either impact related or endogenic. Models have been proposed in earlier studies to explain the spinel exposures on anorthosites, and spinel in association with other mafic minerals such as olivine and orthopyroxene. However, the origin of Mg-spinel exposures within an evolved siliceous body that has very limited associated mafic minerals is yet to be fully explored. In this study, the Mg-spinel exposures on Mons Hansteen Alpha were analyzed using high resolution LROC NAC images and correlated with topographic information from the SLDEM data. These investigations suggest that in most cases, the spinel exposures on Mons Hansteen are not related to any impact related structures. The exposures are often found on elevated features such as ridges, or around irregular-shaped pits. The distribution of the exposures is mostly limited to the Pitted unit, the youngest unit in the volcanic structure; this favours an endogenic origin instead of one related to impact as otherwise, the exposures would also have been distributed in the other units. On the bases of these observations, it is suggested that the Mg-spinel exposures on Mons Hansteen Alpha are endogenic in nature. A model is proposed for the origin of endogenic Mg-spinel exposures on silicic volcanic structures. For this, model reactions were considered between a lunar picritic basaltic magma and two types of crustal protoliths- (i) a mixture of silica and anorthosite and (ii) a lunar monzogabbro. The modelling has been done using the alphaMELTS 2 software. The proposed model combines the crustal melting model for the genesis of silicic volcanic structures with a genetic model for the Mg-spinel exposures. The mixture of silica and anorthosite has been considered as a possible crustal protolith consistent with recent experimental lunar magma ocean (LMO) crystallization models that crystallized silica as one of the end stage products. On the other hand, earlier studies have proposed monzogabbro as a possible protolith composition for lunar silicic lithology. The models demonstrate the possible pathways of forming silicic compositions similar to the lunar granite samples collected during the Apollo missions, with simultaneous crystallization of Mg-spinel.
How to cite: Moitra, H. and Gupta, S.: Investigating the origin of Mg-spinel exposures on Mons Hansteen Alpha, an evolved silicic volcanic structure on the Moon, EGU General Assembly 2022, Vienna, Austria, 23–27 May 2022, EGU22-10274, https://doi.org/10.5194/egusphere-egu22-10274, 2022.
EGU22-10400 | Presentations | PS4.6
Absence of a long-lived lunar paleomagnetosphere and opportunities for future explorationJohn Tarduno
Understanding whether the Moon had a long-lived magnetic field is crucial for determining how the lunar interior and surface evolved, and in particular for assessing whether a paleomagnetosphere shielded the regolith. Magnetizations from some Apollo samples have been interpreted as records of a global lunar magnetic field between approximately 4.2 and 1.5 Ga that would have created shielding, but the inferred paleofields are too strong and continuous to be generated by the small lunar core. Moreover, vast areas of the lunar crust lack magnetic anomalies that should mark the past presence of a dynamo. New paleointensity data from an Apollo impact glass associated with a young 2 million-year-old crater records a strong Earth-like magnetization, providing evidence that impacts can impart intense signals to samples recovered from the Moon, and other planetary bodies (Tarduno, Cottrell, Lawrence et al., Science Advances, 2021). This observation provides motivation for future lunar collections to constrain impact size - magnetization scaling relationships. Moreover, new data from silicate crystals bearing magnetic inclusions from Apollo samples formed at 3.9, 3.6, 3.3, and 3.2, Ga are capable of recording strong core dynamo-like fields but do not, indicating the lack of a global magnetic field (Tarduno, Cottrell, Lawrence et al., Science Advances, 2021). Together, these new data indicate that the Moon did not have a long-lived core dynamo. As a result, the Moon was not sheltered by a sustained paleomagnetosphere, and the lunar regolith should hold buried 3He, water, and other volatiles resources acquired from solar winds and Earth’s magnetosphere over some 4 billion years. These findings highlight the opportunity to learn about the evolution of the solar wind and Earth’s earliest atmosphere during future lunar exploration. This could in turn provide key data to better understand how Earth evolved as a habitable planet despite the expected extreme solar forcing during its first billion years (Tarduno, Blackman, Mamajek, Phys. Planet Inter., 2014).
How to cite: Tarduno, J.: Absence of a long-lived lunar paleomagnetosphere and opportunities for future exploration, EGU General Assembly 2022, Vienna, Austria, 23–27 May 2022, EGU22-10400, https://doi.org/10.5194/egusphere-egu22-10400, 2022.
EGU22-10626 | Presentations | PS4.6
Measurement of tidal deformation through self-registration of laser profiles: Application to Earth’s MoonAlexander Stark, Haifeng Xiao, Xuanyu Hu, Agnès Fienga, Hauke Hussmann, Jürgen Oberst, Nicolas Rambaux, Antony Mémin, Arthur Briaud, Daniel Baguet, Giorgio Spada, Daniele Melini, and Christelle Saliby
Many moons of the Solar System, e.g. the Galilean satellites or Earth’s Moon, are subject to strong tidal deformations. Measurements of the tidal Love number h2 by laser altimeters from orbiting spacecraft may provide crucial constraints on their interior structures and rheology. Using precise observations by laser altimeters estimates for h2 were obtained for the Moon (Mazarico et al. 2014, Thor et al., 2021) and Mercury (Bertone et al., 2021), and are planned for Ganymede (Steinbrügge et al., 2015). Typically, height differences at crossing points of laser profiles, so called crossover points, are used for such measurements (Mazarico et al. 2014, Bertone et al., 2021). However, a new method based on simultaneous inversion of tidal deformations and global topography has recently been demonstrated (Thor et al. 2021) using data from the Lunar Orbiter Laser Altimeter (LOLA) on board the Lunar Reconnaissance Orbiter (LRO).
Here we propose the refined “self-registration” method, which makes use of an accurate reference digital terrain model (DTM) constructed from the laser profiles themselves. This DTM is obtained by iteratively co-registering random subsets of laser profiles to an intermediate DTM produced by the other profiles. With our method we are not limited to profiles that are actually crossing themselves and can obtain height difference between all available profiles. Moreover, we can overcome the interpolation error at the crossover points as we use the entire profile with all its data points to measure the relative height differences. This method was recently successfully applied to measure the seasonal change of the ice/snow level in polar regions of Mars using Mars Orbiter Laser Altimeter (MOLA) data (Xiao et al., 2021).
In order to validate our method and assess its performance we perform a simulation of a tidal signal in the LOLA data with an assumed value for the tidal Love number h2 of the Moon. Thereby the height measurement at the location of the LOLA footprint is derived from a DTM and an artificial tidal signal applied on it. Thereby, we consider viscoelastic effects on the tidal deformation and different tidal frequencies. With the help of these simulations we assess the accuracy of the h2 measurement and check the sensitivity to the measurement of the tidal phase lags.
References:
Mazarico et al. (2014). Detection of the lunar body tide by the Lunar Orbiter Laser Altimeter. GRL, 41(7), 2282-2288. doi:10.1002/2013GL059085
Thor et al. (2021). Determination of the lunar body tide from global laser altimetry data. JoG, 95(1). doi:10.1007/s00190-020-01455-8
Bertone et al. (2021). Deriving Mercury Geodetic parameters with Altimetric Crossovers from the Mercury Laser Altimeter (MLA). JGR-Planets, 126(4), e2020JE006683. doi:10.1029/2020JE006683
Xiao et al. (2021). Prospects for Mapping Temporal Height Variations of the Seasonal CO2 Snow/Ice Caps at the Martian Poles by Co-registration of MOLA Profiles. Under review in PSS, https://arxiv.org/abs/2109.04899
How to cite: Stark, A., Xiao, H., Hu, X., Fienga, A., Hussmann, H., Oberst, J., Rambaux, N., Mémin, A., Briaud, A., Baguet, D., Spada, G., Melini, D., and Saliby, C.: Measurement of tidal deformation through self-registration of laser profiles: Application to Earth’s Moon, EGU General Assembly 2022, Vienna, Austria, 23–27 May 2022, EGU22-10626, https://doi.org/10.5194/egusphere-egu22-10626, 2022.
EGU22-10764 | Presentations | PS4.6
Effect of Volcanically-Induced Transient Atmospheres on Transport and Deposition of Lunar Volatiles.Igor Aleinov, Michael Way, James Head, Konstantinos Tsigaridis, Chester Harman, Eric Wolf, Guillaume Gronoff, Matthew Varnam, and Christopher Hamilton
While the origin of lunar polar volatiles remains an open question, their most likely sources are volcanic outgassing or volatile-rich impactors. Both such sources are sporadic in nature and are characterized by release of large amounts of volatiles over a short period of time and long periods of repose between such events. If a sufficient amount of volatiles was generated in such a delivery event, a transient collisional atmosphere could form. Such an atmosphere, if it persists for a long enough time, would protect certain volatiles (like water) from photodissociation and escape to space and would promote their transport to the polar cold traps where they could be stored and preserved for billions of years. Hence, such transient atmospheres could have a significant impact on the distribution and abundance of volatiles currently observed on the Moon. Here we study such a hypothetical atmosphere that could have been formed due to volcanic outgassing during the peak of lunar volcanic activity at ~3.5 Ga and investigate its longevity, climatology and effect on volatile transport.
We employ the ROCKE-3D [1] planetary climate model to simulate processes in a volcanically-induced lunar atmosphere. We use orbital and radiation parameters corresponding to conditions at 3.5 Ga (17.8 days rotation period and a solar constant 75% of the modern value). For most experiments we use zero obliquity, though we investigate the effect of non-zero obliquity on atmospheric stability and volatile transport. We assume a CO2-dominated atmosphere in accordance with predictions of our chemistry model [2]. For the atmospheric thickness we follow the argument of Head et al. [3] that due to long periods of repose between the volcanic events the atmosphere would not accumulate above the pressure of a few microbars, and thus we limit our parameter space to a range of 1 microbar to 1 mb surface pressures. To investigate the ability of such an atmosphere to transport volatiles we set up a typical volcanic eruption experiment [4] and follow the fate of the outgassed water.
In most of our experiments the atmosphere was stable, though in some cases a small non-zero obliquity (a few degrees) was needed to prevent a collapse due to CO2 condensation at the poles. We found that even very thin atmospheres were efficiently transporting volatiles to the poles. The efficiency of transport sometimes was higher for thinner atmospheres, most likely due to a stronger circulation cell. We also found that water transport efficiency depended on initial conditions at the surface. A water-free dry surface suppressed re-evaporation, thus reducing the total flux of outgassed water to the poles. But even in the case of dry soil, water transport was efficient with 19% of outgassed water delivered to the poles in just a few months (for the 10 microbar atmosphere).
References: [1] Way M. J. et al. (2017) ApJS, 231, 12. [2] Aleinov I. et al. (2019) GRL, 46, 5107–5116. [3] Head J. W. et al. (2020) GRL, 47, e2020GL089509. [4] Wilson L. and Head J. W. (2018) GRL, 45, 5852-5859.
How to cite: Aleinov, I., Way, M., Head, J., Tsigaridis, K., Harman, C., Wolf, E., Gronoff, G., Varnam, M., and Hamilton, C.: Effect of Volcanically-Induced Transient Atmospheres on Transport and Deposition of Lunar Volatiles., EGU General Assembly 2022, Vienna, Austria, 23–27 May 2022, EGU22-10764, https://doi.org/10.5194/egusphere-egu22-10764, 2022.
EGU22-10988 | Presentations | PS4.6
Properties and provenance of the lunar regolith at Chang’E-5 landing site: Constraints from remote sensing observations and ejecta deposition modelsBojun Jia and Wenzhe Fa
China’s first lunar sample return mission, Chang’E-5, has collected 1.731 kg samples from one of the youngest mare basalt units in the northern Oceanus Procellarum. In this study, we conducted a systematical analysis on regolith properties at the landing site using optical, multispectral, thermal infrared and radar observations, and then traced regolith provenance using ejecta deposition models.
The CE-5 landing site is within a flat (< 5° in slope), young (˜1.3 Ga), intermediate titanium (4.6 wt.%) mare basalt unit, named P58/EM4, which is surrounded by several older, low titanium mare basalt units. In the Kaguya Multiband Imager TiO2 map, some impact craters have low titanium ejecta blankets (e.g., Mairan G), indicating that they have excavated the underlying low titanium materials. Size and spatial distribution of these craters suggest that the basalt is thicker in the center of unit P58 and thinner around the perimeter with thickness from ˜15 to ˜50 m. Morphologies of small fresh craters identified in high-resolution optical images show that regolith thickness varies from ˜1.5 to ˜8 m with a median value of ˜5 m. A comparison between Mini-RF radar image and Lunar Reconnaissance Orbiter Diviner surface rock abundance (RA) map indicates that subsurface rocks play a significant role in producing the observed radar backscatter. Further analysis of the radar echo suggests that subsurface RA is ˜0.47%–0.88% if the effective size is 3 cm, which can explain the shallow sampling depth (˜0.9 m) of the CE-5 drilling device.
To study sample provenance, deposition history and stratigraphy of landing site, we established a catalogue of 1896 craters that can deposit materials to the landing site. Our analysis shows that 80% of the primary ejecta (˜0.6 m) sampled by CE-5 comes from 12 craters within 1 km range from the landing site, and that XuGuangqi crater (46–90 Ma) contributes about 50%. There are four major source craters outside P58 unit, and their primary ejecta contribution is less than 10%. The detailed locations and depths of ejecta at landing site are given by using Maxwell Z-model (e.g., for XuGuangqi crater, 18.7–43.7 m depth and 112.3–123.0 m from crater center). Based on the age of the major craters, we further simulated the deposit thickness and composition profile of the regolith at landing site using the Monte Carlo and ballistic sedimentation model. The results show that the craters totally produced ˜1.1 m thick ejecta deposits, and the uppermost ˜0.46 m consists of primary ejecta from XuGuangqi and a smaller crater near landing site. The model predicts that FeO and TiO2 abundances decrease with depth, to a minimum value at ˜0.1 m, and then increase and become constant with depth. This can provide a feasible way to identify the provenance of single sample by using FeO and TiO2 abundances.
This study provides key information about geological context, regolith property, sample provenance and stratigraphy of landing site, which is critical for explaining laboratory measurements of CE-5 samples.
How to cite: Jia, B. and Fa, W.: Properties and provenance of the lunar regolith at Chang’E-5 landing site: Constraints from remote sensing observations and ejecta deposition models, EGU General Assembly 2022, Vienna, Austria, 23–27 May 2022, EGU22-10988, https://doi.org/10.5194/egusphere-egu22-10988, 2022.
Please decide on your access
Please use the buttons below to download the presentation materials or to visit the external website where the presentation is linked. Regarding the external link, please note that Copernicus Meetings cannot accept any liability for the content and the website you will visit.
Forward to presentation link
You are going to open an external link to the presentation as indicated by the authors. Copernicus Meetings cannot accept any liability for the content and the website you will visit.
We are sorry, but presentations are only available for users who registered for the conference. Thank you.
EGU22-12217 | Presentations | PS4.6
Estimating Lunar Rock Abrasion Stage using Photometric StudiesRachael Martina Marshal, Ottaviano Rüsch, Christian Wöhler, and Kay Wohlfarth
The study and investigation of local scale geological features (boulders and boulder fields) of planetary/asteroid surfaces can provide insight on the evolution of the regolith and the contribution of various processes to their formation. Numerous studies have employed photometric modelling to study the surface properties of the lunar regolith on a regional and local scale (e.g., [1], [2], [3])
In this study we employ photometric methods to study the properties of boulder fields/rock fragments in a multiscale approach from resolved (meter scale) to sub pixel (cm scale). In our approaches we use the Hapke model [4] on LROC NAC data [5]. The retrieved properties of boulders, in particular their shape, can in turn shed light on the boulder material strength and surface exposure time [6].
Usually, photometric studies (e.g., [2]) consider the Hapke parameters SSA (single scattering albedo), b, c, theta_bar (roughness) as unknown and estimate them by inversion. Here we take a different approach and strongly constrain the possible combinations of the four parameters. The constraint is facilitated by the knowledge of the geological context of the surface either above (sub pixel approach) or below (resolved boulder field approach) the image resolution, visually inferred with images.
We are interested in the relative probability of each geologic context for a given region. This information is sufficient reveal information about the possible micro-scale geology of a region, namely the shape, and thus degradation, of rocks. We apply these techniques to the boulder fields in the vicinity of the Apollo 16 landing site at North Ray crater.
Our approach consists of the construction of a set of digital terrain models (DTMs) representative of the most possible geologic contexts. The contexts are described by the rock and debris apron shape and reflect the abrasion stage of the rock – Non-Abraded (flat top), Non-Abraded (angular), Mildly and Highly Abraded. The size-frequency distribution of the rocks follows a power-law [1]. The rock abundance is either measured (resolved scale analysis) or set as a free parameter (unresolved scale analysis). The size and spatial resolution of the DTM is defined by the scale of the analysis, either resolved or unresolved by LROC NAC. The Hapke reflectance model [4] is then used to illuminate these DTMs. Direct comparison of the reflectance at two phase angles as well as the Normalized Log Phase Ratio Difference value is carried out for the unresolved and resolved scale analysis, respectively.
References:
[1] Watkins R.N. et al. (2019) JGR-Planets, 124, 2754–2771 [2] Sato et al. (2014) JGR-P, 119,1775-1805 [3] Lin et al. (2020) A&A,638 [4] Hapke (2012) Theory of Reflectance and Spectroscopy [5] Robinson M.S. et al. (2010) SSR,150,81-124 [6] Rüsch and Wöhler (2021) submitted to Icarus arXiv:2109.00052v1
How to cite: Marshal, R. M., Rüsch, O., Wöhler, C., and Wohlfarth, K.: Estimating Lunar Rock Abrasion Stage using Photometric Studies, EGU General Assembly 2022, Vienna, Austria, 23–27 May 2022, EGU22-12217, https://doi.org/10.5194/egusphere-egu22-12217, 2022.
Please decide on your access
Please use the buttons below to download the presentation materials or to visit the external website where the presentation is linked. Regarding the external link, please note that Copernicus Meetings cannot accept any liability for the content and the website you will visit.
Forward to presentation link
You are going to open an external link to the presentation as indicated by the authors. Copernicus Meetings cannot accept any liability for the content and the website you will visit.
We are sorry, but presentations are only available for users who registered for the conference. Thank you.
EGU22-12932 | Presentations | PS4.6
Lunar TLP's and the tectonic processes of the Earth and the MoonDimitar Ouzounov, Patrick Taylor, Menas Kafatos, and Kayden Cutchins
We are studying the transient lunar phenomena (TLP) as an indicator of lunar tectonics. Seismic events can be used as a direct indicator of some tectonic activities of the planets. The Moon-Earth gravitational interaction has been studied extensively as a triggering mechanism for earthquakes. However, this is a controversial topic. Our present study investigated the reverse Earth-Moon interaction concerning the TLP activities. The lunar outgassing is potentially the leading source of TLP activities. We have investigated both Earth venting and earthquakes and have found that radon was frequently activated before significant seismic events due to the Moon-Sun interaction with the Earth (Ouzounov et al., 2018). Earthquake lights, an associated phenomenon reported before some major earthquakes, are analogous to TLP activities on the Moon. In 1972, N. Kozyrev suggested a possible lunar response to the significant seismic events on the Earth. To understand whether TLP's have any possible connection with earthquakes, we performed a statistical review between significant earthquakes, using the NEIC catalog and TLPs during 1907-1977, for four lunar areas: Aristarchus, Plato, Gassendi, and Alphonsus. We used TLP catalogs published by Middlehurst et al. 1968; Cameron, 2006; and Crotts, 2008. Our results revealed a causal relationship between significant earthquakes and TLP events. However, the strength of this relationship varies from the location and depth of the earthquakes. Deformation on the Moon triggers the degassing process, and TLPs are indicators for those underlying activities. Our work can provide new information about the origin of TLP and the existence of a possible relationship between the tectonic processes of Earth and the Moon. The Earth causes crustal tides on the Moon, and the Moon produces tides on the Earth.
How to cite: Ouzounov, D., Taylor, P., Kafatos, M., and Cutchins, K.: Lunar TLP's and the tectonic processes of the Earth and the Moon, EGU General Assembly 2022, Vienna, Austria, 23–27 May 2022, EGU22-12932, https://doi.org/10.5194/egusphere-egu22-12932, 2022.
EGU22-13240 | Presentations | PS4.6
The evolution of lunar rock size-frequency distributions: An updated modelOttaviano Ruesch, Rachael M. Marshal, Wajiha Iqbal, Jan Hendrik Pasckert, Carolyn H. van der Bogert, and Markus Patzek
The model for the catastrophic rupture of rocks on the lunar surface [1] is revisited by considering new functions describing rock shattering by impacts and size-frequency distributions of meteoroids. The input functions are calibrated by comparing the model block size–frequency distributions with the measured size–frequency distribution of ejecta blocks around Tycho crater, which formation age is known. We find that the evolution of lunar block size–frequency distribution in the range 1–50 m is as follow: For young (≤ 50 Myr) population, the size–frequency distribution is best approximated by a power law, whereas for older populations, the extrapolation at small diameters is best performed by an exponential distribution. New destruction rates are in better agreement with recent measurements [2,3] compared to the original model. For rocks above ~5 cm the survival time increases with increasing size, whereas for rocks below ~5 cm the survival time slightly increases with decreasing size. The updated model allows the estimation of both the exposure age and the initial abundance of a block field using the measurement of a block size–frequency distribution from LROC/NAC images.
References: [1] Hoerz et al., 1975, The Moon 13, 235–258. [2] Basilevsky et al., 2013, PSS, 89 (118–12). [3] Ghent et al., 2014, doi:10.1130/G35926.1.
How to cite: Ruesch, O., Marshal, R. M., Iqbal, W., Pasckert, J. H., van der Bogert, C. H., and Patzek, M.: The evolution of lunar rock size-frequency distributions: An updated model, EGU General Assembly 2022, Vienna, Austria, 23–27 May 2022, EGU22-13240, https://doi.org/10.5194/egusphere-egu22-13240, 2022.
EGU22-13340 | Presentations | PS4.6
ArtMoonMars Science, Cultural and Artistic programme: towards an Artscience Museum on the MoonBernard Foing and ILEWG Lunar Explorers team and the ArtMoonMars collaboration team
The ArtMoonMars programme of cultural and artistic activities was started in 2010 by ILEWG Lunar Explorers Group in collaboration with ESA ESTEC and number of partner institutions, with more than 45 events (workshops, space artscience classes, public events, sessions at international conferences) and exhibitions.
What payload for an Artscience Museum on the Moon ? For prototype ExoGeoLab lander in 2009. the team looked at possibility to host cultural or artscience payload. Some joint ArtMoonMars events between space science, technology and art communities were organized, such as MoonLife Academy in 2010 .
ArtMoonMars organised classes of Artscience & Space at Royal Academy of Fine Arts in the Hague KABK –ESTEC. Artscience students participated to workshops at ESTEC & KABK and developed projects inspired by space and the Moon. These ArtScience classes were conducted 3 years with different themes. Some 50 ArtScience & Space projects were developed by students. Artists demos with scientists and engineers, including visual, electronic, VR artefacts and art performances.
ITACCUS The Committee for the Cultural Utilisation of Space (ITACCUS, created in 2006) https://www.iafastro.org/about/iaf-committees/technical-committees/committee-for-the-cultural-utilisation-of-space-itaccus.html
MoonGallery Foundation: The MoonGallery idea and concept was developed from 2010, to send an expanded gallery of artscience artefacts to the Moon on possible landers. on Gallery will launch 100 artefacts to the Moon within the compact format of 10 x 10 x 1cm plate on a lunar lander exterior panelling as early as 2022. .
A MoonGallery project team was formed in 2018 to issue a call for the community of artists. For these activities, ILEWG established ArtMoonMars grants to MoonGallery curators, and to some artists or temporary team members.
MoonMars Foundation : A new effort with external partner building on previous ArtMoonMars and EuroMoonMars programmes led to the definition of a new MoonMars foundation with broader objectives to develop opportunities and funding, to various groups including space artists.
Space Renaissance and Art: Space Renaissance International (SRI) is a global organisation dedicated to getting humanity off-world, not just astronauts engaged in pioneering exploration. The early Space Renaissance concept was founded on a pragmatic form of the humanist philosophy, with its roots here on Earth, and with its destiny among the stars. The founders took the historical Renaissance era with its focus on patronage of the arts and sciences as a model for a New Renaissance, a Space Renaissance. SRI runs a number of programs, projects and activities in support of its mission. It has started a Space Renaissance Art chapter.
How to cite: Foing, B. and team, I. L. E. and the ArtMoonMars collaboration team: ArtMoonMars Science, Cultural and Artistic programme: towards an Artscience Museum on the Moon , EGU General Assembly 2022, Vienna, Austria, 23–27 May 2022, EGU22-13340, https://doi.org/10.5194/egusphere-egu22-13340, 2022.
GI4 – Atmosphere and ocean monitoring
EGU22-3275 | Presentations | GI4.1
The Atmospheric Raman Temperature and Humidity Sounder: Highlights of Three Years of Ground-based and Ship-borne Boundary Layer Measurements with Turbulence ResolutionDiego Lange Vega, Andreas Behrendt, Christoph J Senff, Florian Späth, and Volker Wulfmeyer
Since there are only a very few suitable measurements, the thermodynamic field of the lower troposphere is mostly still Terra Incognita. To close this gap, we developed a thermodynamic profiler based on the Raman lidar technique. We call this instrument Atmospheric Raman Temperature and Humidity Sounder (ARTHUS) (Lange et al. 2019). ARTHUS can be operated on ground-based, ship-borne and airborne platforms.
Due to an advanced design of the transmitter and the receiver, simultaneous profiling of temperature (T) and water-vapor mixing ratio (WVMR) is possible with unprecedented accuracies and resolutions. Typical resolutions are a few seconds and meters in the lower troposphere. With the measurements themselves, also the statistical uncertainties are derived. The design of the system permits measurements in all weather conditions and even in clouds and rain up to an optical thickness of approx. 2.
Stable 24/7 operations over long periods were achieved during several field campaigns and at the Land Atmosphere Feedback Observatory (LAFO) accumulating almost a year of data until now and covering a huge variety of weather conditions.
During the EUREC4A field campaign (Stevens et al, 2020), for example, ARTHUS was deployed on board RV Maria S Merian, to study ocean-atmosphere interaction, (18 January to 18 February 2020). ARTHUS was combined with one Doppler lidar in vertically staring mode and a second one in a 6-beam scanning mode.
Between 15 July and 20 September 2021, ARTHUS was deployed at Lindenberg Observatory from the German Weather Service (DWD). The objective of the campaign was to demonstrate the potential of ARTHUS in the framework of a ground-based measurement campaign and the evaluation of the data obtained. The long-term stability, accuracy and high resolution of ARTHUS during the day and at night were demonstrated.
We also demonstrate that ARTHUS is capable of resolving (1) the strength of the inversion layer at the atmospheric boundary layer (ABL) top and thus the ABL depth zi, (2) elevated lids in the free troposphere, and (3) turbulent fluctuations in WVMR and T. In combination with Doppler lidar, the latter permits measurements of sensible and latent heat flux profiles in the convective ABL and thus flux-gradient relationships (Behrendt et al. 2020). Consequently, ARTHUS can be applied for process studies such as land-atmosphere feedback, weather and climate monitoring, model verification, and data assimilation in weather forecast models.
At the conference, highlights of the measurements during the last three years will be shown.
Stevens et. al. 2021, https://doi.org/10.5194/essd-2021-18
Lange et al. 2019, https://doi.org/10.1029/2019GL085774
Behrendt et al. 2020, https://doi.org/10.5194/amt-13-3221-2020
How to cite: Lange Vega, D., Behrendt, A., Senff, C. J., Späth, F., and Wulfmeyer, V.: The Atmospheric Raman Temperature and Humidity Sounder: Highlights of Three Years of Ground-based and Ship-borne Boundary Layer Measurements with Turbulence Resolution, EGU General Assembly 2022, Vienna, Austria, 23–27 May 2022, EGU22-3275, https://doi.org/10.5194/egusphere-egu22-3275, 2022.
EGU22-4735 | Presentations | GI4.1
Comparison between Atmospheric Boundary Layer Height remote sensing-retrievals over a complex topographyAndrea Burgos Cuevas, Adolfo Magaldi Hermosillo, David Adams, Michel Grutter de la Mora, Jorge L. Garcia Franco, and Angel Ruiz Angulo
The Atmospheric Boundary Layer (ABL) height is a key parameter in air quality research as well as in order to parametrize numerical simulations and forecasts. The identification of thermally stable layers has been one of the most common approaches in order to estimate this height. However, radiosonde's coarse temporal resolution is not enough to investigate the diurnal cycle of the ABL. Remote sensing has overcome this problem with a high temporal resolution. The backscatter retrieved by ceilometers elucidates the height that aerosols are able to reach and therefore has been used to estimate ABL height. Additionally, the implementation of Doppler lidars, and the velocity profiling provided by them, makes possible to investigate ABL via turbulence variables. However, different retrievals of ABL height are not usually coincident with each other and this issue becomes more evident over topographically complex terrain, such as Mexico City. It has been previously shown that the aerosol layer and the convective boundary layer height are generally not coincident over mountainous terrains. In this presentation we show that, at daytime hours, the convective boundary layer height (retrieved with Doppler lidar data) is lower than the aerosol layer height (retrieved with ceilometer data) during one year over Mexico City. Diurnal and monthly variabilities are discussed and the remote sensing-retrieved heights are compared with thermally stable layers estimated from radiosonde data. We show that multiple thermally stable layers develop, the upper ones are similar to the ceilometer retrieved heights and the lower ones are approximately as high as the Doppler lidar ones. Finally, the influence of radiation and precipitation over the retrieved heights is discussed over the year. The present research illustrates how the comparison between ceilometer backscatter and Doppler lidar ABL height retrievals can contribute to investigate the complexity of the ABL height over the mountainous terrain of Mexico City.
How to cite: Burgos Cuevas, A., Magaldi Hermosillo, A., Adams, D., Grutter de la Mora, M., Garcia Franco, J. L., and Ruiz Angulo, A.: Comparison between Atmospheric Boundary Layer Height remote sensing-retrievals over a complex topography, EGU General Assembly 2022, Vienna, Austria, 23–27 May 2022, EGU22-4735, https://doi.org/10.5194/egusphere-egu22-4735, 2022.
EGU22-5644 | Presentations | GI4.1
Cloud Aerosol Lidar for Global Scale Observations of the Ocean-Land-Atmosphere System – CALIGOLAPaolo Di Girolamo, Alberto Cosentino, Francesco Longo, Noemi Franco, Davide Dionisi, Donato Summa, Simone Lolli, Enrico Suetta, Alessandro Perna, and Simona Zoffoli
The Italian space industry, and specifically Leonardo S.p.A., has gained unique skills at an international level in the development of space-qualified power laser sources with for lidar Earth observation applications (Aeolus, EarthCARE). Moreover, Leonardo S.p.A. and the Italian optical industry, has a consolidated technical-scientific knowledge and consolidated experience in the design and development of lidar receiver sub-systems (telescopes, optical devices and sensors) with space applications. The Italian Space Agency (ASI) intends to benefit from long-term expertise to design and develop a lidar system for Earth observation applications. Two separate feasibility studies, one focusing of technical aspects and one focusing on scientific aspects, are presently underway to define mission goals and a possible instrument layout.
CALIGOLA has a primary focus on the atmosphere, but also a strong focus on the study of the Ocean-Earth-Atmosphere system and the mutual interactions within it. Exploiting the three Nd: YAG laser emissions at 354.7, 532 and 1064 nm and the elastic (Rayleigh-Mie) and Raman lidar echoes from atmospheric constituents, CALIGOLA is conceived to carry out three-wavelength particle backscatter and depolarization ratio and two-wavelength particle extinction profile measurements from aerosols and clouds to be used to retrieve their microphysical and dimensional properties. Furthermore, measurement of the elastic backscattered echoes from the sea surface and the underlying layers, and their degree of depolarization, CALIGOLA will be exploited to characterize sea optical properties (ocean color) and the suspended particulate matter, which are needed to study the seasonal and inter-annual phytoplankton dynamics and to improve the understanding of the role of phytoplankton in marine biogeochemistry, in the global carbon cycle and in the response of marine ecosystems to climate variability. A specific measurement channel will be dedicated to fluorescence measurements from atmospheric aerosols and marine chlorophyll, for the purpose of aerosol typing and for characterizing ocean primary production. Aerosol fluorescence measurements at 680 nm/460 nm are also planned for the purpose of aerosol typing. CALIGULA will also allow accurate measurements of the small-scale variability of the earth's surface elevation primarily associated with variations in the terrain, vegetation and forest canopy height.
The CALIGOLA project is explicitly included the on-going Three-Year Activity Plan (2021-2023) of the Italian Space Agency, with a scheduled tentative launch window of 2026-2028. The considered strategy to develop the above described space lidar mission in such a short time relies on the maximum exploitation of subsystems already developed at national level for space applications, with a high TRL (TRL>7), ultimately leading to a space mission with high impact and scientific timeliness. The Phase A study of the technological feasibility of the laser source is on-going, commissioned by ASI to Leonardo S.p.A., and scientific studies in support of the mission also on-going, with the University of Basilicata being the leading scientific institution. The Italian Space Agency is willing to pursue this mission in a coordinated way with one or more other European or extra-European Space Agencies, with a bilateral or multi-lateral contributed mission approach, and, in this regard, any interest from other Agencies is welcome and desired.
How to cite: Di Girolamo, P., Cosentino, A., Longo, F., Franco, N., Dionisi, D., Summa, D., Lolli, S., Suetta, E., Perna, A., and Zoffoli, S.: Cloud Aerosol Lidar for Global Scale Observations of the Ocean-Land-Atmosphere System – CALIGOLA, EGU General Assembly 2022, Vienna, Austria, 23–27 May 2022, EGU22-5644, https://doi.org/10.5194/egusphere-egu22-5644, 2022.
EGU22-7336 | Presentations | GI4.1
Sub-mesoscale evolution of spatial wind gust patterns measured with three Doppler lidars in a triangle configurationJulian Steinheuer, Frank Beyrich, Carola Detring, Stephanie Fiedler, Petra Friederichs, and Ulrich Löhnert
The evolution of wind gusts is difficult to observe as gusts are short-lived and small-scale phenomena. They occur with certain weather configurations (e.g. fronts, cold pools) and may already differ very locally. The question arises if individual gust observations can be taken as representative of their surroundings or if significant differences can already be apparent on the meso-gamma scale (2-20 km). Within the Field Experiment on Sub-Mesoscale Spatio-Temporal Variability in Lindenberg (FESSTVaL) different phenomena in the atmospheric boundary layer are studied with a variety of measurement instruments. This involved installing three StreamLine DWL systems from Halo Photonics at a distance of 6 km apart from each other. DWLs allow the retrieval of wind vector profiles and offer an alternative to classic meteorological tower observations, since they can be flexibly deployed at any electrified site. However, short-lived gusts are more difficult to capture than a persistent mean wind. A wind vector has to be obtained from different radial velocity measurements that are made sequentially, which limits the achievable temporal resolution. Therefore, we have developed a new retrieval method for deriving wind measurements that is suitable for different scan configurations and different time resolutions respectively different numbers of radial velocities. A fast continuous scanning mode (CSM), that completes a full observation cycle within 3.4 seconds and measures about eleven radial Doppler velocities is a suitable DWL configuration for deriving wind gusts, as shown by comparisons with measurements of a sonic anemometer at 90.3 m a.g.l. on the meteorological tower in Falkenberg. The fast CSM configuration was operated on the DWLs during the summer months 2021 at the three different sites. Their surrounding area is predominantly flat farmland, minimizing topographic impacts. This set-up allows us to observe the spatial-temporal evolution of gusts at the meso-gamma scale. Examples will be presented that illustrate the variability of wind gusts as observed during FESSTVaL.
How to cite: Steinheuer, J., Beyrich, F., Detring, C., Fiedler, S., Friederichs, P., and Löhnert, U.: Sub-mesoscale evolution of spatial wind gust patterns measured with three Doppler lidars in a triangle configuration, EGU General Assembly 2022, Vienna, Austria, 23–27 May 2022, EGU22-7336, https://doi.org/10.5194/egusphere-egu22-7336, 2022.
Please decide on your access
Please use the buttons below to download the presentation materials or to visit the external website where the presentation is linked. Regarding the external link, please note that Copernicus Meetings cannot accept any liability for the content and the website you will visit.
Forward to presentation link
You are going to open an external link to the presentation as indicated by the authors. Copernicus Meetings cannot accept any liability for the content and the website you will visit.
We are sorry, but presentations are only available for users who registered for the conference. Thank you.
EGU22-7792 | Presentations | GI4.1
ABL determination by Raman lidar with different approaches in the frame of HyMeX SOP1Donato Summa, Paolo Di Girolamo, Gemine Vivone, Noemi Franco, D'amico Giuseppe, and Benedetto De Rosa
The atmospheric planetary boundary layer (ABL) represents the lower region of the atmosphere directly in contact with the earth's surface and strongly influenced by this surface. In this layer physical quantities such as flow velocity, temperature and humidity exhibit rapid fluctuations associated with turbulent motion and vertical mixing.
Characterization of the planetary boundary layer is of primary importance in a variety of fields such as weather forecasting, climate change modeling and air quality forecasting and therefore it is very important to determine it correctly. The structure of ABL can be complex and highly variable. In this work different techniques to estimate the ABL height are compared. A first technique makes use of the pure rotational Raman lidar signals, which are strongly dependent on temperature. A second technique makes use of the water vapor roto-vibrational Raman lidar signals in the lower troposphere. Further techniques based on the Morphological Image Processing Approach (MIPA) are also considered. In the present research work, we consider the measurements from the University of Basilicata Raman lidar system BASIL collected in the period 16-21 October 2012 in the frame of HyMex SOP1 [1,2,3].
References:
[1] Di Girolamo, P., R. Marchese, D. N. Whiteman, B. B. Demoz, Rotational Raman Lidar measurements of atmospheric temperature in the UV. Geophysical Research Letters, 31, L01106, ISSN: 0094-8276, doi: 10.1029/2003GL018342, 2004.
[2] Vivone, G., D'Amico G., Summa D., Lolli S., Amodeo A., Bortoli D., and Pappalardo G.. Atmospheric boundary layer height estimation from aerosol lidar: a new approach based on morphological image processing techniques Atmos. Chem. Phys., 21, 4249–4265, 2021 https://doi.org/10.5194/acp-21-4249-2021.
[3] Summa, D., P. Di Girolamo, D. Stelitano, and M. Cacciani, Characterization of the planetary boundary layer height and structure by Raman lidar: comparison of different approaches, Atmos. Meas. Tech., 6, 3515–3525, 2013, www.atmos-meas-tech.net/6/3515/2013/doi:10.5194/amt-6-3515-2013
How to cite: Summa, D., Di Girolamo, P., Vivone, G., Franco, N., Giuseppe, D., and De Rosa, B.: ABL determination by Raman lidar with different approaches in the frame of HyMeX SOP1, EGU General Assembly 2022, Vienna, Austria, 23–27 May 2022, EGU22-7792, https://doi.org/10.5194/egusphere-egu22-7792, 2022.
Please decide on your access
Please use the buttons below to download the presentation materials or to visit the external website where the presentation is linked. Regarding the external link, please note that Copernicus Meetings cannot accept any liability for the content and the website you will visit.
Forward to presentation link
You are going to open an external link to the presentation as indicated by the authors. Copernicus Meetings cannot accept any liability for the content and the website you will visit.
We are sorry, but presentations are only available for users who registered for the conference. Thank you.
EGU22-7808 | Presentations | GI4.1
Remote-sensing of aerosol atmospheric rivers over the southwest Indian Ocean in September 2017: origins, evolution and impactsAlexandre Baron, Valentin Duflot, Patrick Chazette, Marco Gaetani, Cyrille Flamant, Juan Cuesta, Guillaume Payen, Philippe Keckhut, and Philippe Goloub
In the southern hemisphere, the dry season from June to October coincides with the occurrence of significant fires especially located along the tropical belt in Africa and South America. This fire activity is an important source of aerosols in the tropical troposphere and results in smoke plumes transported across long distances toward area generally aerosol-free. The atmospheric composition over the Indian Ocean is often influenced by biomass burning plumes shaped by the synoptic atmospheric circulation with high pressure over southern Africa and the movement of westerly waves that may embedded cut-off lows. The propagation over the Indian Ocean is then dependent on the position of the Mascarene High. The meandering shape of the plumes is then associated with an aerosol atmospheric river (AAR). Such a phenomenon has been sampled by spaceborne lidars and spectro-radiometers, and even observed above La Réunion (21.1°S, 55.3°E) during September 2017 by a ground-based lidar and a sun-photometer. The Li1200, an operational lidar in the frame of the Atmospheric Physics Reunion Observatory (OPAR), recorded the passage of an AAR during two nights. These measurements allow us to derive both the vertical structures of the plume and some vertically resolved aerosol optical properties. This information was used to constrain Lagrangian modelling tools to identify the pathways and origins of the biomass burning plume. These results have been corroborated by the spaceborne observations of CALIOP and CATS, and the passive sensor MODIS. Reanalysis of ECMWF with atmospheric composition outputs from the Copernicus Atmosphere Monitoring Service (CAMS) supports the understanding of the synoptic conditions leading to the formation of this aerosol plume configuration. We will present our scientific approach and discuss the environmental impact of these AARs in the southwest Indian Ocean.
How to cite: Baron, A., Duflot, V., Chazette, P., Gaetani, M., Flamant, C., Cuesta, J., Payen, G., Keckhut, P., and Goloub, P.: Remote-sensing of aerosol atmospheric rivers over the southwest Indian Ocean in September 2017: origins, evolution and impacts, EGU General Assembly 2022, Vienna, Austria, 23–27 May 2022, EGU22-7808, https://doi.org/10.5194/egusphere-egu22-7808, 2022.
EGU22-8554 | Presentations | GI4.1
Multi-year analysis on cirrus cloud optical and geometrical properties at Goddard Space Flight Center in the frame of the NASA MPLNET lidar networkSimone Lolli, Erica Dolinar, Jasper R. Lewis, James R. Campbell, and Ellsworth J. Welton
In this study, we present the results of 20 years of cirrus cloud optical and geometrical properties retrieved from lidar observations at NASA Goddard Flight Space Center, a permanent site of the Micropulse lidar network (MPLNET). In this research, moreover, we also focus on determining the consistency of lidar long-term measurements, i.e. assessing the Signal-To-Noise variation over the two decades and its relationship to detection sensitivity and/or the quality of the calibration procedure. Through this research, it is possible to assess how changes in optical and geometrical properties of the cirrus clouds over twenty years impacted the Earth-atmosphere radiative budget, both at the surface and at the top-of-the-atmosphere. This unique and unprecedented study is the first step in assessing how climate changes influence cirrus cloud formation and lifetime and their feedback to climate. The same analysis will be then carried out for all the MPLNET permanent observational sites deployed at global scale.
How to cite: Lolli, S., Dolinar, E., Lewis, J. R., Campbell, J. R., and Welton, E. J.: Multi-year analysis on cirrus cloud optical and geometrical properties at Goddard Space Flight Center in the frame of the NASA MPLNET lidar network, EGU General Assembly 2022, Vienna, Austria, 23–27 May 2022, EGU22-8554, https://doi.org/10.5194/egusphere-egu22-8554, 2022.
EGU22-9144 | Presentations | GI4.1
Aviation-induced changes in cirrus clouds over Europe during COVID-19 and in a ten-year period before COVID-19Qiang Li and Silke Groß
Aviation affects the Earth’s radiation budget through a combination of multiply processes which warm the atmosphere. Linear contrails and contrail cirrus induced by water vapor and soot emissions from air traffic in the upper atmosphere are expected to contribute a large part of the climate impact of avation. Furthermore, contrails cause a significant increase in cirrus optical thickness as well as an indirect effect on the microphysical properties of naturally formed cirrus clouds. During the first lockdown in April 2020, air traffic over Europe was significantly reduced to about 80% compared to the year before. This unique situation provides a good opportunity to study the effect of air traffic on cirrus. Based on the analysis of the spaceborne lidar measurements with CALIPSO, we found a significant reduction in the particle linear depolarization ratio (PLDR) of cirrus clouds measured in April 2020 compared to the previous years 2014-2019 under normal conditions, especially at colder temperatuers (T < -50oC). However, we note that civil aviation over Europe before the COVID-19 pandemic (i.e., before March 2020) grew strongly in terms of CO2 emission and flight densities, e.g. on average by 233 MTon/year over Germany, over the past years (2010-2019, especially 2013-2019, source: EUROCONTROL). In order to study the aviation effects of cirrus properties in a longer period (with, of course, milder change in air traffic than the case due to the COVID lockdown), we further extend our analysis to all the observations from Mar. 2010 to Feb. 2020. We found a long-term trend of 0,0087/year (~2.4% per year) in PLDR for all the cirrus observations (day+night) and a trend of 0.0107/year for only the day-time observations at altitudes between 6 and 13 km. In addition, seasonal variations of PLDR are also drived showing higher PLDR-values in winter than in summer for all the measurements as well as for the measurements in different altitude bins. In the end, we compared the background meteorological conditions including the ambient temperature, relative humidity, and vertical updrafts determined with ECMWF and analyzed the correlation between PLDR and the corresponding CO2 emissions as a proxy of air traffic densities.
Key words: CALIPSO; Cirrus cloud; Lidar; Depolarization ratio; PLDR; COVID-19
How to cite: Li, Q. and Groß, S.: Aviation-induced changes in cirrus clouds over Europe during COVID-19 and in a ten-year period before COVID-19, EGU General Assembly 2022, Vienna, Austria, 23–27 May 2022, EGU22-9144, https://doi.org/10.5194/egusphere-egu22-9144, 2022.
EGU22-9407 | Presentations | GI4.1
Observation of Simultaneous Etna Volcanic aerosol and Desert Dust aerosol over Naples: an experimental test for a new lidar inversion algorithmsAlessia Sannino, Salvatore Amoruso, Riccardo Damiano, Simona Scollo, pasquale Sellitto, and Antonella Boselli
Studies on the spatio-temporal characterization of microphysical and optical properties of atmospheric aerosol are of particular interest for their impacts on life cycle. Unfortunately, large uncertainties govern these studies because of the wide variability of the components which characterize the aerosol, especially when several sources concur in the observations. This is exactly what happens over the Central Mediterranean where particles of different nature and typology, produced by local sources or long-range transport phenomena from natural and anthropogenic sources, coexist frequently in the aerosol layers. Among these contributions, a special mention deserves the volcanic activity, since Mediterranean area hosts numerous active volcanoes, like Mount Etna, in Italy, whose degassing and explosive activities have a strong impact on the atmospheric aerosol composition. In this work we present the results from the Etna paroxysmal event occurred in February 21st - 26th, 2021 and observed in the Naples area in coexistence with Saharan dust transport. The event has been characterized by the ACTRIS (Aerosol, Clouds and Trace Gases Research Infrastructure) observation station of the University of Naples “Federico II” by combining lidar, sunphotometer and satellite data. Back-trajectories and volcanic plume dispersion simulations were also performed in order to better distinguish geometrical, optical and microphysical properties of the atmospheric aerosol. From our analysis, spatio-temporal information of the two main aerosol components in terms of their optical and microphysical proprieties were clearly identified. In particular, starting from lidar data, the particle size distributions were retrieved at desired altitudes using a novel inversion approach based on a new Monte Carlo algorithm. Interestingly, when integrated over the range on the observation column, the experimental findings result in good agreement with the data provided by the sunphotometer.
How to cite: Sannino, A., Amoruso, S., Damiano, R., Scollo, S., Sellitto, P., and Boselli, A.: Observation of Simultaneous Etna Volcanic aerosol and Desert Dust aerosol over Naples: an experimental test for a new lidar inversion algorithms, EGU General Assembly 2022, Vienna, Austria, 23–27 May 2022, EGU22-9407, https://doi.org/10.5194/egusphere-egu22-9407, 2022.
EGU22-11817 | Presentations | GI4.1
Performance assessment of the space-borne Raman Lidar ATLAS – Atmospheric Thermodynamic LidAr in SpaceNoemi Franco, Paolo Di Girolamo, Donato Summa, Benedetto De Rosa, Andreas Behrendt, and Volker Wulfmeyer
The Atmospheric Thermodynamic LidAr in Space (ATLAS) is a mission concept proposed to the European Space Agency in the frame of “Earth Explorer-11 Mission Ideas” Call by a team of researchers, with the aim to develop the first Raman Lidar in space capable to measure simultaneously atmospheric temperature and water vapour mixing ratio profiles with high temporal and spatial resolutions. Accurate measurements of these profiles are essential to understand water and energy cycles, as well as the prediction of extreme events, that nowadays still show huge deficiencies on all temporal and spatial scales (1). Such measurements would have a revolutionary impact on our understanding of the Earth system and would close the gap in our observational capabilities from the surface to the lower troposphere.
The specifications of the different lidar sub-system, as well as the expected capability to provide measurements with high temporal and spatial resolution in the low and middle troposphere, have already been established with an analytical simulation model (2,3). These simulations considered different atmospheric models and conditions to estimate the statistical uncertainty on water vapour and temperature measurements. New studies have been now performed to estimate the performances along several dawn-dusk orbits. An end-to-end simulator has been developed and used to estimate the statistical and systematic uncertainties. The input data, comprehensive of thermodynamic and optical parameters, have been extracted from the GEOS-5 Nature Run and have been chosen to perform simulations with different solar zenith angles and therefore different background contributions. The model includes information on cloud fraction and optical thickness, so it was also possible to consider the performances in cloudy conditions. The simulations show promising results, both in clear and cloudy conditions and with different background contributions. A comprehensive study of the assessed performances will be presented at the conference.
The simulated measurements obtained from the simulator will be also used as input observations in the Weather Research and Forecasting model (WRF). The aim is to estimate the impact of global measurements from a space-borne Raman Lidar in terms of skill-scores, obtained by the comparison of the weather forecast output with and without the assimilation of the simulated lidar data.
1 - Wulfmeyer, Hardesty, Turner, Behrendt, Cadeddu, Di Girolamo, et al. A review of the remote sensing of lower tropospheric thermodynamic profiles and its indispensable role for the understanding and the simulation of water and energy cycles. Reviews of Geophysics. 2015; 53(3):819–95.
2 - Di Girolamo, Behrendt, Wulfmeyer. Space-borne profiling of atmospheric thermodynamic variables with Raman lidar: performance simulations. Opt Express,OE. 2 aprile 2018; 26(7):8125–61.
3 - Di Girolamo, Behrendt, Wulfmeyer. Spaceborne profiling of atmospheric temperature and particle extinction with pure rotational Raman lidar and of relative humidity in combination with differential absorption lidar: performance simulations. Appl Opt, AO. 10 aprile 2006; 45(11):2474–94.
How to cite: Franco, N., Di Girolamo, P., Summa, D., De Rosa, B., Behrendt, A., and Wulfmeyer, V.: Performance assessment of the space-borne Raman Lidar ATLAS – Atmospheric Thermodynamic LidAr in Space, EGU General Assembly 2022, Vienna, Austria, 23–27 May 2022, EGU22-11817, https://doi.org/10.5194/egusphere-egu22-11817, 2022.
Please decide on your access
Please use the buttons below to download the presentation materials or to visit the external website where the presentation is linked. Regarding the external link, please note that Copernicus Meetings cannot accept any liability for the content and the website you will visit.
Forward to presentation link
You are going to open an external link to the presentation as indicated by the authors. Copernicus Meetings cannot accept any liability for the content and the website you will visit.
We are sorry, but presentations are only available for users who registered for the conference. Thank you.

EGU22-12076 | Presentations | GI4.1
Demonstration of water vapor and Isotopes measurement from lidar using a multi-platform, multi-instrumental approachJonas Hamperl, Patrick Chazette, Julien Totems, Jean-Baptiste Dherbecourt, Jean-Michel Melkonian, Philippe Nicolas, Myriam Raybaut, Aurélien Clémençon, Nicolas Geyskens, Pascal Geneau, Cyrille Flamant, Daniele Zannoni, Harald Sodemann, Hans Christian Steen-Larsen, Anne Monod, Amandine Durand, Sylvain Ravier, and Alfons Schwarzenboeck
The Lidar Emitter and Multispecies greenhouse gases Observation iNstrument (LEMON) objective is the development and test of a new Differential Absorption Lidar (DIAL) sensor concept for greenhouse gases and water vapor for spaceborne, airborne or ground-based measurements. The innovative instrument is based on a versatile transmitter. The concept of the measurement was recently preliminarily tested for water vapor in a co-dedicated field campaign from 13 to 24 September 2021 over the Aubenas airfield (France, 44° 32' N 4° 22' E). This campaign was also an opportunity to test different approaches for the measurement of the vertical water vapor profile using classical meteorological probes embarked on meteorological balloons and on an airplane, a vibrational Raman lidar WALI (Weather Atmospheric LIdar), a cavity ring-down spectrometer (CRDS) and of course a first version of the LEMON lidar named WaVIL (Water Vapor and Isotope Lidar). The field campaign involved an instrumented van with two lidars and three ULAs carrying various payloads: a backscatter Rayleigh-Mie lidar to identify atmospheric structures from the local to regional scales, a CRDS for water vapor isotope measurements and in situ samplers to characterize cloud-related forcing on atmospheric water vapor concentrations. The measurement strategy adopted made it possible to follow the evaporation of water vapor throughout the course of a thunderstorm and to sample an intrusion of dry air from high altitudes. It also provided initial answers as to the potential of the WaViL instrument for measuring the main isotope of water vapor and its secondary isotope HDO. The measurement campaign will be presented, as well as the first associated results.
How to cite: Hamperl, J., Chazette, P., Totems, J., Dherbecourt, J.-B., Melkonian, J.-M., Nicolas, P., Raybaut, M., Clémençon, A., Geyskens, N., Geneau, P., Flamant, C., Zannoni, D., Sodemann, H., Steen-Larsen, H. C., Monod, A., Durand, A., Ravier, S., and Schwarzenboeck, A.: Demonstration of water vapor and Isotopes measurement from lidar using a multi-platform, multi-instrumental approach, EGU General Assembly 2022, Vienna, Austria, 23–27 May 2022, EGU22-12076, https://doi.org/10.5194/egusphere-egu22-12076, 2022.
EGU22-12079 | Presentations | GI4.1 | Highlight
How sensitive are Aeolus Lidar Surface Returns (LSR) to the types of surface? Insights for LSR-based retrieval of AOD over ocean by using Aeolus.Lev Labzovskii, Gerd-Jan van Zadelhoff, David Donovan, Jos De Kloe, and Damien Josset
The Aeolus mission offers unique opportunities for lidar surface returns (LSR) applications considering its incidence angle (~37.5o) and the operated wavelength (~355 nm). Previous Aeolus-oriented studies have indicated that the contrast between LSR over dark and bright surfaces is expected to be particularly pronounced at 355 nm. We evaluated this surmise by comparing new LSR estimates from novel Aeolus prototype processor (using an optimal estimation approach) with various types of land for the Intensive Observation Period of Aeolus (September 2019) and an additional period during the same year. We discerned a very clear LSR gradient between the signal from water (mostly weak, but variable) and the signal from land (mostly strong), whereas the strongest LSR was found over white surfaces (ice or snow). Moreover, the sensitivity of LSR to the type of surface was also identified as the gradient between the brightest surfaces (snow/ice, sparse vegetation) and the dark surfaces (herbaceous forest, mangrove, wetland) was significant. Specifically, besides Antarctica and Greenland, the strongest returns over land were reported over the snow-covered areas of Tibet and Andes, followed by the arid areas of Northern America, Northern Africa and Middle East. Notably, the LSR from water was not always low as the average LSR estimate over water exhibited the strongest variability (~0.001 – 0.042 sr-1) and yielded most statistical outliers. The application of sea ice mask from MERRA-2 model revealed that most strong LSR cases over water were associated with the undetected ice. The masking of detected ice has resulted in the dramatic reduction of the average LSR over water. As a result, the related LSR variability over water was dwindled by the factor of ~10 down to ~0.001 – 0.004 sr-1 and >95% of outliers disappeared. Our findings about the sensitivity of Aeolus surface returns to the type of surface are beneficial because statistically robust LSR estimates over ocean lay the foundation for the Aeolus LSR-based Aerosol Optical Depth (AOD) retrieval over ocean. This retrieval can be established based on the fundamental link between LSR, near-surface wind speed and AOD over sea surface.
How to cite: Labzovskii, L., van Zadelhoff, G.-J., Donovan, D., De Kloe, J., and Josset, D.: How sensitive are Aeolus Lidar Surface Returns (LSR) to the types of surface? Insights for LSR-based retrieval of AOD over ocean by using Aeolus., EGU General Assembly 2022, Vienna, Austria, 23–27 May 2022, EGU22-12079, https://doi.org/10.5194/egusphere-egu22-12079, 2022.
EGU22-12960 | Presentations | GI4.1
Extremely fresh biomass burning aerosol observed in Potenza by multiwavelength Raman Lidar MUSA and the CIMEL 318 sun-photometer.Benedetto De Rosa, Lucia Mona, Aldo Amodeo, Nikos Papagiannopolos, Donato Summa, Michalis Mytilinaios, and Igor Veselovskii
On 14 August 2021 a forest fire started at 16:00 U.T.C. were observed by the Lidar Raman MUSA and the CIMEL 318 sun-photometer of CNR IMAA of Potenza located at 1 km from the fire. Due to proximity to only 1 km this measurements represents an important case of study. Measurements carried out by the Lidar MUSA reveal the presence of a smoke layer below 2.7 km from 22:27 to 23:19 the. The optical parameters derived are backscattering at 355, 532 and 1064 nm, extinction at 355 and 532 nm, Lidar ratios at 355 and 532 nm wavelengths, Ångström exponents, and particle and volume depolarization at 532 nm. Results indicate a low absorption an high scattering of fire particles.
Lidar ratio are 40 sr at 355 and 38 at 532, particle depolarization is 0.025 and Ångström exponents are approx 1.5 for all wavelengths.
To derive microphysical properties are used The inversion of 3 β + 2 α. The values of surface concentration is 410 µm2 cm-3, the volume concentration is 21 µm3 cm-3and numeric density is 2300 cm-3. The size distribution is bi-modal distribution with a peak at 0.13 µm. The effective radius is 0.15 µm. The single scattering albedo at 355, 532 and 1064 are 0.96, the real and the imaginary part of the refractive index are respectively 1.58 and 0.006.
Therefore, particles are small, spherical and weakly absorbing probably due to a minimum contribution of black carbon
The CIMEL 318 sun photometer measurements at 5:34 U.T.C confirm the results of MUSA.
How to cite: De Rosa, B., Mona, L., Amodeo, A., Papagiannopolos, N., Summa, D., Mytilinaios, M., and Veselovskii, I.: Extremely fresh biomass burning aerosol observed in Potenza by multiwavelength Raman Lidar MUSA and the CIMEL 318 sun-photometer., EGU General Assembly 2022, Vienna, Austria, 23–27 May 2022, EGU22-12960, https://doi.org/10.5194/egusphere-egu22-12960, 2022.
EGU22-744 | Presentations | GI4.2
Acoustic tomography assessment of the acoustic characteristics of bubble cloudsHo Seuk Bae, Su-Uk Son, Hyoung Rok Kim, Woo-Shik Kim, and Joung Soo Park
In the seawater environment, interactions of the rotation of ship propellers with the wind tend to produce masses of localized bubbles. These bubble clouds cause acoustical interference in the acquisition of sonar data during marine surveys and marine exploration. For example, pronounced bubble-attenuation of pressure levels results in acoustic signals received by sonar equipment being below predicted values. In addition, a strong backscattering signal may be detected due to the impedance difference between liquid water and intra-bubble air. These effects distort underwater sonar measurement data. If the acoustic characteristics of a bubble cloud in the seawater environment can be known in advance, more precise measurement data could be obtained through data processing. Thus, the aim of this study was to assess the acoustic characteristics of experimenter-produced bubbles. Acoustic tomography techniques were used to obtain data descriptive of the acoustic characteristics and distribution of bubble clouds. We developed six sets of buoy systems equipped with multiple projectors and hydrophones for acoustic tomography. The buoy systems were installed in a hexagonal arrangement in seawater. A transmitter emitted sequential sound signals into the water in response to radiofrequency-transmitted commands from a control device located on land. Each acoustic signal was recorded by multiple hydrophones. Applying repetitive optimization techniques to the tomography data, it was possible to analyze acoustic characteristics such as transmission loss of signals transmitted through bubble clouds, magnitude of backscattering associated with bubble clouds, and bubble distributions. The acoustic effects and distribution characteristics of bubbles documented in this experiment will be used as foundational data for subsequent research.
How to cite: Bae, H. S., Son, S.-U., Kim, H. R., Kim, W.-S., and Park, J. S.: Acoustic tomography assessment of the acoustic characteristics of bubble clouds, EGU General Assembly 2022, Vienna, Austria, 23–27 May 2022, EGU22-744, https://doi.org/10.5194/egusphere-egu22-744, 2022.
EGU22-2203 | Presentations | GI4.2 | Highlight
Automotive lidar in the Arctic: 3D monitoring and mappingBirgit Schlager, Thomas Goelles, Stefan Muckenhuber, Tobias Hammer, Kim Senger, Rüdiger Engel, Christian Bobrich, and Daniel Watzenig
We enable exciting and novel mapping and monitoring use cases for automotive lidar technologies in the Arctic. Originally, these lidar technologies were developed for enabling environment perception of automated vehicles with high spatial resolution and accuracy. Therefore, these lidar sensors have several advantages for mobile mapping applications in the Arctic compared to commonly used technologies like time-lapse cameras and satellite or aerial photogrammetry that suffer from lower accuracy of 3-dimensional (3D) data than the proposed automotive lidar sensors. At present, terrestrial laser scanners (TLS), like the Riegl VZ-6000, are commonly used in the Arctic. However, especially for mobile use cases, the automotive lidar provides a lot of advantages compared to TLS, for instance lower cost, more robust, smaller, and lighter and thus more portable. Therefore, automotive lidar sensors open the door for new mobile mapping and monitoring applications in the Arctic.
The data acquisition hardware consists of a sensor unit, a data logger, and batteries. The sensor unit integrates an automotive lidar, the Ouster OS1-64 Gen1, a ublox multi-band active global navigation satellite system (GNSS) antenna, and a Xsens 9-axis inertial measurement unit (IMU) with a gyroscope, an accelerometer, and a magnetometer. Furthermore, a long-term evolution (LTE) stick is integrated for retrieving real time kinematic (RTK) data. In a post-processing step, collected point clouds and IMU data can be used by a simultaneous localization and mapping (SLAM) algorithm for point cloud stitching with one big point cloud and the trajectory of the mapping sensor as a result, i.e., a map of the scanned environment. Optionally, the differential global positioning system (DGPS) data can be used additionally by the SLAM algorithm. The setup can be mounted in multiple ways to support a wide variety of new applications, e.g., on a handle, car, ship, or snowmobile.
We used the introduced setup for several applications and successfully mapped glacier caves and surrounding glacier surfaces on Longyearbreen and Larsbreen in Svalbard as one example of a novel Arctic use case. Furthermore, we showed that the setup is working on a ship scanning a harbor in Croatia. In this measurement campaign, we used a multi-beam sonar from Furuno in addition to our mapping setup which made it possible to map the coast above and below the water surface.
Therefore, we suggest several new applications of automotive lidar sensors in the Arctic, e.g., monitoring coastal erosions due to permafrost thawing and mapping glacier fronts. In this way, accurate outlines and structures of coasts and calving glacier fronts can be generated. Such data will be relevant for future development of glacier calving models. Furthermore, the setup can be used for monitoring glacier fronts over a period of several years. Further research may also include merging the gained 3D map with photogrammetry data to generate highly accurate 3D models of a glacier front with textural details. Another novel Arctic use case could be time-lapse scans of infrastructure, e.g., runway, roads, or cultural heritage, that is affected by the thawing permafrost to track its changes and movements cost-effectively.
How to cite: Schlager, B., Goelles, T., Muckenhuber, S., Hammer, T., Senger, K., Engel, R., Bobrich, C., and Watzenig, D.: Automotive lidar in the Arctic: 3D monitoring and mapping, EGU General Assembly 2022, Vienna, Austria, 23–27 May 2022, EGU22-2203, https://doi.org/10.5194/egusphere-egu22-2203, 2022.
EGU22-4615 | Presentations | GI4.2
Simultaneous monitoring of greenhouse gases and air pollutants in a single instrumentMorten Hundt, Maria Timofeeva, and Oleg Aseev
Air pollutants and greenhouse gases (GHG) can be attributed to a variety of sources, such as transportation vehicles and buildings, waste management and agricultural production, natural events such as forest fires and many others. Simultaneous monitoring of air pollutants and GHG with high selectivity and sensitivity enables to detect and evaluate their sources and sinks. Air pollution modelling and validation of emission inventories or satellite observations require measurements at various spatial and temporal scales.
Infrared laser (IR) absorption spectroscopy offers an efficient way to determine fingerprints of various gas species in monitored air with high precision and reliability. In the past, this technology was commonly used in “one-species-one-instrument” solutions due to limited coverage of used mid-IR distributed feedback quantum cascade lasers (DFB-QCLs). We provide a new compact laser absorption spectrometer that combines several mid-IR lasers. Our solution allows simultaneous high precision measurements of the greenhouse gases CO2, N2O, H2O and CH4, and the pollutants CO, NO, NO2, O3, SO2 and NH3 within a single instrument.
In our contribution we will demonstrate examples of our instruments’ applications for mobile monitoring of 10 GHG and air pollutants in urban areas, airborne measurements with airships and measurements at low pollution background stations. Furthermore, we will present the results of parallel monitoring with our instrument and standard conventional gas analysers used for GHG and air pollutant measurements. It demonstrates the ability of our instrument to serve as all-in-one solution and to replace up to 7 standard gas analysers opening a wide range of new mobile multi-compound gas monitoring applications for example in (small) airplanes or cars.
How to cite: Hundt, M., Timofeeva, M., and Aseev, O.: Simultaneous monitoring of greenhouse gases and air pollutants in a single instrument, EGU General Assembly 2022, Vienna, Austria, 23–27 May 2022, EGU22-4615, https://doi.org/10.5194/egusphere-egu22-4615, 2022.
EGU22-7738 | Presentations | GI4.2
Arctic Century 2021 – an interdisciplinary expedition to the Kara and Laptev Seas to study ocean, atmosphere and land processes in the changing ArcticGabriela Schaepman-Strub, Heidemarie Kassens, Samuel L. Jaccard, and Mikhail Makhotin and the Arctic Century science team
The region of the Kara and Laptev Seas in the Russian Arctic has been experiencing one of the highest warming rates globally during past decades. From 5 August – 6 September 2021, the Arctic Century science team gathered unique data during a research expedition, along marine transects and on seven high Arctic islands that are very rarely accessible. The aim of the expedition is to contribute to the understanding of the dynamics and interactions between the ocean, cryosphere, land and atmosphere in the face of global change. Here we provide an overview of the main research topics and investigations performed, including: dynamics of Atlantic water masses; biodiversity and ecosystem productivity in the ocean and on high Arctic islands, at the margin of life; dynamics of the atmosphere and interactions with the ocean and land; past climate change and sea level history reconstruction based on sediment and ice cores; and amount and flow of macro- and microplastic in the ocean and along the shoreline. First analyses of samples and data are currently being performed by the expedition consortium. After an initial moratorium, the data will be made openly accessible to the wider science community.
How to cite: Schaepman-Strub, G., Kassens, H., Jaccard, S. L., and Makhotin, M. and the Arctic Century science team: Arctic Century 2021 – an interdisciplinary expedition to the Kara and Laptev Seas to study ocean, atmosphere and land processes in the changing Arctic, EGU General Assembly 2022, Vienna, Austria, 23–27 May 2022, EGU22-7738, https://doi.org/10.5194/egusphere-egu22-7738, 2022.
EGU22-10605 | Presentations | GI4.2
Assessing the uncertainty of expert observations of cloud characteristics based on data from a field campaign in the Arctic ocean in August-September 2021Mikhail Borisov and Mikhail Krinitskiy
The sun is the closest natural source of radiation, both shortwave and longwave. The state of the atmosphere, and in particular the Total Cloud Cover (TCC) and the Lower Cloud Cover (LCC), most strongly affects the transfer of incoming solar radiation to the surface. At the moment, the amount and types of clouds are assessed primarily by an expert using visual observation, and such an assessment is considered reliable according to WMO observations guide. However, it is known that the estimates of an observer are subject to errors due to the subjectivity of perception of the visual cloudy scene. Uncertainty in observer estimates may lead to significant inaccuracies in operational weather forecast systems as well as in reanalyses and climatic time series. In addition, the lack of knowledge about the observation error limits one in assessing the corresponding uncertainty of the climatic trends of cloudiness characteristics. In this study, we investigated the uncertainty in the estimates of the TCC, LCC.
To carry out such a study, we conducted an experiment involving the simultaneous observation of the same cloudy situation by several observers. The experiment was carried out on board the Akademik Ioffe research vessel during the AI-58 research cruise from August 18 till September 6 of 2021 in Kara, Baltic and White Seas. The experiment involved 19 volulntary participants. There were 78 observation moments. The number of observers varied from 5 to 19 due to their own duties onboard. On average, the cloud characteristics were assessed by 12 participants.
Thus, in the present study, the uncertainties of cloud characteristics estimated by one forgetful independent observer several times in equivalent conditions were simulated with a large number of experts participating in synchronous observations. We demonstrate that the disparity of opinions is small for simple cloudy situations in which the sky is almost clear or mostly covered by clouds. We also show that the uncertainty in the conditions of moderate cloudiness can reach 1.5 oktas in terms of standard deviation.
This study may help clarifying existing and future models for assessing meteorological characteristics, as well as models used to calculate incoming solar radiation. We plan to assess the uncertainty of cloud types observed by human experts. We will also repeat our experiment in other regions of the World Ocean in order to expand the variety of observed cloud situations, in which a wider range of expert opinions can be expected, as well as to form a dataset balanced w.r.t. synoptic conditions.
How to cite: Borisov, M. and Krinitskiy, M.: Assessing the uncertainty of expert observations of cloud characteristics based on data from a field campaign in the Arctic ocean in August-September 2021, EGU General Assembly 2022, Vienna, Austria, 23–27 May 2022, EGU22-10605, https://doi.org/10.5194/egusphere-egu22-10605, 2022.
EGU22-10629 | Presentations | GI4.2
FAIR Data Teams: Rapid access to climate measurements by rethinking workflowsAndrew Barna, Stephen Diggs, and Susan Becker
In this presentation, we will discuss the procedures and utilities employed that produced the final core data (CTDO, nutrients, salinity, and oxygen). These datasets were published within 4 weeks of the conclusion of the cruise, much quicker than the program's 6-week requirement for preliminary data, and significantly faster than the 6-month final data requirement.
The Global Ocean Ship-based Hydrographic Investigations Program (GO-SHIP) “provides approximately decadal resolution of the changes in inventories of heat, freshwater, carbon, oxygen, nutrients, and transient tracers, covering the ocean basins from coast to coast and full depth (top to bottom), with global measurements of the highest required accuracy to detect these changes.”
The Oceanographic Data Facility at Scripps Institution of Oceanography has been making the CTDO, salinity, oxygen, and nutrient measurements since the program's inception for some of the US lead GO-SHIP expeditions. This group internally shares personnel with the corresponding data repository (CCHDO). This collaboration allows the technicians to proactively develop tools and data formats that are both compliant for data submission as well as easy to utilize at sea. Mature versions of these utilities and procedures were promoted in both 1-on-1 conversations and interactive demonstrations.
The most recent set of measurements made by the US GO-SHIP program was in the Atlantic ocean last year (March-May 2021). Taking advantage of existing close collaborations within the shipboard environment, we were able to ensure measurements were documented while the expedition was still in progress, ensuring that data formats were consistent and conforming to the program's required formats. A full metadata package for the global/cross-cruise database, in addition to mature preliminary files, was ready at the conclusion of the expedition. The close relationship between the seagoing team and the data managers in the repository has allowed for the accelerated publication of finalized measurements through sharing of software, metadata databases, and expertise.
How to cite: Barna, A., Diggs, S., and Becker, S.: FAIR Data Teams: Rapid access to climate measurements by rethinking workflows, EGU General Assembly 2022, Vienna, Austria, 23–27 May 2022, EGU22-10629, https://doi.org/10.5194/egusphere-egu22-10629, 2022.
Please decide on your access
Please use the buttons below to download the presentation materials or to visit the external website where the presentation is linked. Regarding the external link, please note that Copernicus Meetings cannot accept any liability for the content and the website you will visit.
Forward to presentation link
You are going to open an external link to the presentation as indicated by the authors. Copernicus Meetings cannot accept any liability for the content and the website you will visit.
We are sorry, but presentations are only available for users who registered for the conference. Thank you.
EGU22-11656 | Presentations | GI4.2
Network Design for a Cost-Effective Atmospheric Methane Measurement Network over IndiaEldho Elias, Dhanyalekshmi Pillai, Julia Marshall, Kai Uwe Totsche, and Christoph Gerbig
Studies have shown that the uncertainty of methane emission estimates over India is as high as 40-60%, largely due to the lack of observations. In India, measurements are limited to a few locations, with the majority of them being flask measurement stations. The observational constraint of the measurements could be greatly improved with the development of a network of continuous measurement stations at well-chosen locations. For this study, we have designed an atmospheric methane measurement network for India using transport modeling techniques and a scaling-factor-based inversion approach. A network optimization algorithm selects the combination of observation locations that gives the most uncertainty reduction in the estimates of posterior methane emission fluxes over India. The backbone of this study is a simple analytical inversion setup that utilizes the STILT (Stochastic Time Inverted Lagrangian Transport) model, a sectorial emission model based on EDGAR, as well as fluxes from wetlands and biomass burning. The state space of the inversion consists of monthly emissions, separated by sector, aggregated spatially to the level of political states.
The challenge in network design is to formulate an appropriate target quantity, which the network will be optimized to constrain. Using the annual total emissions as the single target results in a network that will optimally constrain the largest sources, irrespective of their spatial location or the seasonality of the source. Thus, we also included other targets, such as political-state-level emissions, sectoral emissions, and seasonality. For the study, we used a base network of existing stations (“base”) and added further stations from a candidate set (“extended”) on the basis of the incremental uncertainty reduction they provide. We found that more measurement stations along the Indo-Gangetic Plains and North-Eastern India are required. An optimized network was also designed from scratch using the same strategy and it was found to yield similar uncertainty reduction compared to the “base” + “extended” network despite having fewer stations. The effectiveness of the optimal network and the base network in reducing the uncertainties of the different emission categories is assessed and discussed.
How to cite: Elias, E., Pillai, D., Marshall, J., Totsche, K. U., and Gerbig, C.: Network Design for a Cost-Effective Atmospheric Methane Measurement Network over India, EGU General Assembly 2022, Vienna, Austria, 23–27 May 2022, EGU22-11656, https://doi.org/10.5194/egusphere-egu22-11656, 2022.
EGU22-11921 | Presentations | GI4.2 | Highlight
LanderPick, a Remote Operated Trawled Vehicle to cost-effectively deploy and recover lightweight oceanographic landersCesar Gonzalez-Pola, Francisco Sánchez, Luis Rodriguez Cobo, Rocío Graña, Juan Manuel Rodriguez, Jose Valdiande-Gutierrez, Daniel Hernandez-Urbieta, and Eneko Aierbe
Landers are modular structures equipped with miscellaneous sensors and monitoring equipment which are positioned directly on the seabed to operate autonomously for a defined timeframe. A drawback of landers intended to operate for prolonged periods in the deep ocean is the high cost of recovery systems, typically depending on buoyancy modules plus expendable ballast, or requiring ROVs assistance. LanderPick concept consists of the design of a specific trawled vehicle to deploy and recover lightweight oceanographic landers not provided with recovery elements, but having a capture mesh that facilitates their hitching. The LanderPick vehicle is technically a ROTV (Remote Operated Trawled Vehicle) controlled through a standard coaxial electromechanical cable that allows real-time control from the vessel. Navigation is enabled by a low-light high-definition camera, aided by spotlights and laser pointers. Small propellers aid in the final precision approach maneuvers. A mechanical release allows the precise placement at the sea bottom of landers carried as a payload, as well as their recovery by means of a triple hook. First sea missions of the system were carried out successfully in 2021 in southern Biscay. A 4-month deployment of a lander array equipped with current-meters along an energetic canyon axis provided unprecedented detail in the progression of the internal tidal bore. Short (48-hours) deployments of a fully-instrumented lander, including lapse-time image and baits in a deep seamount summit within a marine protected area, provided insights on the biodiversity of a unique ecosystem. The LanderPick novel approach to cost-effectively and precisely deploy and recover lightweight oceanographic landers allows to conceive (i) monitoring systems based on the deployment of arrays or fleets of low-cost landers and (ii) experiments associated with deep habitats such as coral reefs in which it is necessary to locate landers with great precision.
How to cite: Gonzalez-Pola, C., Sánchez, F., Rodriguez Cobo, L., Graña, R., Rodriguez, J. M., Valdiande-Gutierrez, J., Hernandez-Urbieta, D., and Aierbe, E.: LanderPick, a Remote Operated Trawled Vehicle to cost-effectively deploy and recover lightweight oceanographic landers, EGU General Assembly 2022, Vienna, Austria, 23–27 May 2022, EGU22-11921, https://doi.org/10.5194/egusphere-egu22-11921, 2022.
EGU22-12931 | Presentations | GI4.2
A carbon data integrating system supporting Carbon neutralityJing Zhao, Guoqing Li, and Zefeng Li
Since initiated by the Chinese Academy of Sciences (CAS) and the National Earth Observation Data Center (NODA) of China, Cooperation on Reanalysis of Carbon Satellite Data (CASA) had already advanced to the second stage. China aims to hit peak emissions before 2030 and for carbon neutrality by 2060.Carbon neutrality research involves Terrestrial-Marine-Atmospheric multiple fields, which inevitably require the support of scientific big data and Scientific Data e-Infrastructure (SDI). Open space-borne carbon data interconnectivity and interoperability across the massive carbon data (GOSAT, GOSAT-2, OCO-2/3, TanSat, Sentinel-5P, FY-3D, GF-5 and the second generation carbon satellites) and related auxiliary data resources integrated into the CASA platform is a key enabler to become more data-driven, to broader data value, and to meet the major demand of global and regional monitoring of anthropogenic carbon emissions. This study explores the technological barriers for carbon satellite data interconnectivity, discusses the concepts of carbon data interoperability and integration, management and governance in more detail, highlight some useful tools, and demonstrate examples in urban air pollution and CO2 emissions that can help researchers in their application studies upon estimation of anthropogenic carbon emissions based on “top-down” methods. We linked carbon data connection and interoperability both to carbon data collection and use within programmatic cycles and reflected interoperability both in organizational practices and data management plans that cover the full breadth of the data value chain. This will extend carbon data information service and provide better ways to utilizing carbon data across domains where innovation and integration are now necessarily needed.
How to cite: Zhao, J., Li, G., and Li, Z.: A carbon data integrating system supporting Carbon neutrality, EGU General Assembly 2022, Vienna, Austria, 23–27 May 2022, EGU22-12931, https://doi.org/10.5194/egusphere-egu22-12931, 2022.
EGU22-3425 | Presentations | AS4.4
Changes in net CO2 uptake, photosynthesis, and ecosystem respiration and their relationships with climate and snow characteristics in central SiberiaSung-Bin Park and Sang Seo Park
Anomalous or extreme climate conditions in high northern latitudes are likely to become more frequent and intense for the last several years. Based on the eddy covariance flux data from 2013-2017 collected at a boreal forest and peatland in central Siberia, net CO2 uptake in spring 2015 was the highest compared with the 2013-2017 average because of the anomalous surface warming over the region > 60N. This enhanced spring net CO2 uptake may be associated with more snowfall amount in winter. However, an increased spring net CO2 uptake may be compensated with summertime net CO2 uptake due to the relatively cool summer surface temperature in 2015. Spring 2020 in central Siberia has experienced even more substantial surface warming than in spring 2015, probably associated with excessive spring snowmelt. This suggests that further investigations in the effects of anomalous seasonal climate and snow conditions on net CO2 uptake, photosynthesis and ecosystem respiration are necessary to better understand annual CO2 balance. To characterize carbon fluxes and underlying mechanisms related to climate condition and snow characteristics from 2012-2020, we analyzed upscaling carbon flux dataset based on a random forest model by Jing et al. (2021), satellite-based net ecosystem exchange of CO2 (i.e., Soil Moisture Active Passive (SMAP) L4 data), snow characteristics (e.g. freeze-thaw cycle, snow depth), and reanalysis dataset. We will focus on seasonal CO2 uptake, photosynthesis and ecosystem respiration under the anomalous temperature and snowfall/snowmelt conditions, then discuss factors regulating annual net CO2 uptake capacity in boreal forests and peatlands in central Siberia.
How to cite: Park, S.-B. and Park, S. S.: Changes in net CO2 uptake, photosynthesis, and ecosystem respiration and their relationships with climate and snow characteristics in central Siberia, EGU General Assembly 2022, Vienna, Austria, 23–27 May 2022, EGU22-3425, https://doi.org/10.5194/egusphere-egu22-3425, 2022.
EGU22-3537 | Presentations | AS4.4
Peculiarities of the chemical composition of size-segregated atmospheric aerosols sampled at Fonovaya Observatory, West SiberiaBoris D. Belan, Denis Simonenkov, Mikhail Arshinov, Sergey Belan, Lyudmila Golobokova, Denis Davydov, Georgii Ivlev, Artem Kozlov, Alexandr Kozlov, Natalia Onischuk, Tatyana Sklyadneva, Gennadii Tolmachev, Alexandr Fofonov, and Tamara Khodzher
Aerosols play an important role in radiation processes in the atmosphere, as well as they have a significant impact on global and regional air quality. The process of the atmospheric nanoparticle formation starts from in situ conversion of condensable vapors. Then, the freshly formed nanometer-size clusters begin to grow due to the condensation of nucleating vapours on them and a self-coagulation as well, thus reaching the optically active size ranges. The relative contribution of the above mechanisms can be estimated by the chemical composition of size-segregated particles. Here, we present preliminary results of the analysis of aerosol samples characterizing the inorganic chemical composition of particles ranging from a few nm to 10 mm. The sampling was performed at Fonovaya Observatory (West Siberia) in October 2021 by means of the Model 125R Nano-MOUDI Impactor.
The analysis showed that in the lowest size range (<10 nm), only five ions were detected: SO42-, Cl-, K+, Na+, H+. The growth of the nucleation mode particles to the size range of 60-100 nm was accompanied by increasing content of SO42-, Na+, H+ ions to 50, 37 and 13%, respectively, suggesting the condensation of H2SO4 vapours or the coagulation of particles contained mainly Na2SO4. A content of ammonium ions (NH4+) appeared to be significant only in the accumulation mode size range (0.1-1.0 mm). Nitrates (NO3-) were detected mainly in the Aitken mode particles and then their contribution increases in accumulation and coarse mode ranges.
This work was supported by the RFBR grant No. 19-05-50024 (Microparticles in the atmosphere: formation and transformation in the atmospheric surface layer and in the free troposphere, radiation effects and impact on public health).
How to cite: Belan, B. D., Simonenkov, D., Arshinov, M., Belan, S., Golobokova, L., Davydov, D., Ivlev, G., Kozlov, A., Kozlov, A., Onischuk, N., Sklyadneva, T., Tolmachev, G., Fofonov, A., and Khodzher, T.: Peculiarities of the chemical composition of size-segregated atmospheric aerosols sampled at Fonovaya Observatory, West Siberia, EGU General Assembly 2022, Vienna, Austria, 23–27 May 2022, EGU22-3537, https://doi.org/10.5194/egusphere-egu22-3537, 2022.
EGU22-3737 | Presentations | AS4.4
Differences in the upper tropospheric and lower stratospheric aerosol compositionMikhail Yu. Arshinov, Pavel Antokhin, Victoriya Arshinova, Boris Belan, Sergey Belan, Lyudmila Golobokova, Denis Davydov, Georgii Ivlev, Artem Kozlov, Alexandr Kozlov, Tatyana Rasskazchikova, Denis Simonenkov, Gennadii Tolmachev, and Alexandr Fofonov
The stratosphere and troposphere are the main layers that define a significant part of the atmospheric processes of our planet. They are demarcated by the tropopause - a layer that has a stable stratification and makes it difficult to exchange air between them. As a consequence, the composition of the air differs slightly in the stratosphere and troposphere. However, the tropopause is not a fully material impermeable surface and therefore the exchange of impurities between both layers occurs. Under the conditions of a changing climate, the composition of the air in the troposphere has also noticeably changed. Therefore, it is important to study the processes of air exchange between the troposphere and stratosphere in a warming climate, especially if we take into account that one of the proposed geoengineering methods assumes to affect climate-forming factors by means of spraying sulphate particles into the stratosphere.
Here, we present the results of airborne measurements of the size distribution and chemical composition of aerosols carried out at the tropopause level and in the upper troposphere and lower stratosphere (UTLS) using the 'Optik' Tu-134 aircraft laboratory as a research platform. For the analysis, we have chosen 14 flight segments when the aircraft crossed the tropopause, which level was determined by the temperature gradient (up to 2°C/ km). All the selected profiles of atmospheric constituents were measured over the Russian Arctic seas or coastal areas, since the tropopause in the northern latitudes is much lower than in the middle ones.
Significant differences in the elemental composition of aerosol particles were revealed in the UTLS. Si was dominated in the composition of stratospheric particles, and Fe or Al in the tropospheric ones. The ionic composition of the LS aerosols was predominantly represented by sulfates (SO42-), while tropospheric ones by a group of different ions.
The particle number size distributions (PNSD) in both UT and LS were dominated by the Aitken mode (20-50 nm). At the same time, there were some differences in PNSD – in the stratosphere, the distribution curve was shifted towards larger sizes that suggests the older age of particles measured there. It is also important to note that the nucleation mode particles (3–20 nm) were also detected during some flights in the lower stratosphere. This indicates that, despite the low humidity and the very low content of ammonia here, the processes of the new particle formation (NPF) in the stratosphere were taking place. Taking into account the dominance of SO42- in the ionic composition, one can be assumed that sulfuric acid played a dominant role in the lower stratospheric NPF.
This work was supported by the grant of the Ministry of Science and Higher Education of the Russian Federation (Agreement No 075-15-2021-934).
How to cite: Arshinov, M. Yu., Antokhin, P., Arshinova, V., Belan, B., Belan, S., Golobokova, L., Davydov, D., Ivlev, G., Kozlov, A., Kozlov, A., Rasskazchikova, T., Simonenkov, D., Tolmachev, G., and Fofonov, A.: Differences in the upper tropospheric and lower stratospheric aerosol composition, EGU General Assembly 2022, Vienna, Austria, 23–27 May 2022, EGU22-3737, https://doi.org/10.5194/egusphere-egu22-3737, 2022.
EGU22-3947 | Presentations | AS4.4
Aerosol pollution in the Moscow megacity environment and its impact on radiative and meteorological properties of the atmosphereNataly Chubarova, Alexander Mahura, Elizaveta Androsova, Alexander Kirsanov, Mikhail Varentsov, Alexey Poliukhov, Pauli Paasonen, and Gdaliy Rivin
Urban aerosol pollution has a significant effect on solar irradiance and meteorological characteristics. Using the two online integrated meteorology – atmospheric composition modelling systems - COSMO-Ru2-ART (Consortium for Small-scale Modeling – Aerosols and Reactive Trace gases) and Enviro-HIRLAM (Environment – High Resolution Limited Area Model) ) taking into account urbanization effects, we studied the effects of aerosol pollution and its impact on radiative and meteorological characteristics of the atmosphere with focus on the Moscow megacity region (Russia). For the models’ runs, the initial and boundary conditions from the ICON-COSMO-Ru7 and ERA-5 as well as the CAMS redistributed inventory emissions were utilized.
In order to account for the absorbing aerosol properties of the Moscow urban atmosphere black carbon (BC) emissions were applied according to the ECLIPSE emission inventory, which demonstrated a satisfactory agreement in BC/PM10 ratio with experimental data in Moscow. A series of models’ simulations over an area of 300x300 km was performed with a 2 km horizontal grid step with the effects of urban areas (building effects/ BEP, anthropogenic heat fluxes/ AHF in Enviro-HIRLAM and TERRA_URB scheme in COSMO-Ru2-ART), and without their consideration. The estimates of urban aerosol content were made for typical conditions in April-May 2019 and during spring of 2020, when lowered anthropogenic emissions were observed in the Moscow region due to strict lockdown conditions of COVID-19 pandemic.
In this study, we accounted for the changes in emissions for the lockdown situation according to the recommendations (Le Quéré et al., 2020), which were mainly in agreement with the official statements. The estimates of aerosol urban properties were tested against the difference between the AERONET measurements obtained in the Moscow megacity and in a relatively clean region at Zvenigorod Scientific Station of the Institute of Atmospheric Physics, Russian Academy of Sciences. The quality of surface aerosol estimation was verified using the MosEcoMonitoring Agency dataset. The variability of concentration of different aerosol species at ground level and changes in aerosol optical depth and its absorbing properties in the total atmospheric column are discussed. The various aerosol radiative effects - direct, semidirect and indirect - and the influence of aerosol on selected meteorological characteristics (such as temperature, humidity, cloud cover, etc.) are analyzed. The features of spatio-temporal changes in urban aerosol fields and their effects on meteorology in conditions of elevated and lower emissions of pollutants in typical and lockdown conditions are investigated.
This study is partially supported by the Ministry of Education and Science of the Russian Federation (grant number 075-15-2021-574) and the Finnish Flagship “Atmosphere and Climate Competence Center” (Academy of Finland grant 337549). This research was performed according to the Development Programme of the Interdisciplinary Scientific and Educational School of MSU “Future Planet and Global Environmental Change”. The CSC - IT Center for Science Computing (Finland), is acknowledged for computational resources.
References:
Le Quéré C. et all (2020): Temporary reduction in daily global CO2 emissions during the COVID-19 forced confinement, Nat. Clim. Change, 10, 647–653.
How to cite: Chubarova, N., Mahura, A., Androsova, E., Kirsanov, A., Varentsov, M., Poliukhov, A., Paasonen, P., and Rivin, G.: Aerosol pollution in the Moscow megacity environment and its impact on radiative and meteorological properties of the atmosphere, EGU General Assembly 2022, Vienna, Austria, 23–27 May 2022, EGU22-3947, https://doi.org/10.5194/egusphere-egu22-3947, 2022.
EGU22-4297 | Presentations | AS4.4
Evaluating methane emissions between 2008 and 2019 in high northern latitudes by using inverse modelingSophie Wittig, Antoine Berchet, Jean-Daniel Paris, Marielle Saunois, Mikhail Arshinov, Toshinobu Machida, Motoki Sasakawa, Doug Worthy, and Isabelle Pison
The Arctic is particularly sensitive to global warming and the effects of the increasing temperatures can already be detected in this region by occurring events such as thawing permafrost and decreasing Arctic sea ice area. One of the possible consequences is the risk of enhanced regional greenhouse gas emissions such as methane (CH4) due to the exposure of large terrestrial carbon pools or subsea permafrost which have previously been shielded by ice and frozen soil.
Various sources, both natural and anthropogenic, are presently emitting methane in the Arctic. Natural sources include wetlands and other freshwater biomes, as well as the ocean and biomass burning. Despite the relatively small population in this region, CH4 emissions due to human activities are also significant. The main anthropogenic sources are the extraction and distribution of fossil fuels in the Arctic nations and, to a lesser extent, livestock activities and waste management.
However, assessing the amount of CH4 emissions in the Arctic and their contribution to the global budget still remains challenging due to the difficulties in carrying out accurate measurements in such remote areas. Besides, high variations in the spatial distribution of methane sources and a poor understanding of the effects of ongoing changes in carbon decomposition, vegetation and hydrology also complicate the assessment.
Therefore, the aim of this work is to reduce uncertainties on methane emissions in high northern latitudes. In order to achieve that, an inverse modeling approach has been implemented by using observational data sets of CH4 concentrations obtained at 42 surface stations located in different Arctic regions for the period from 2008 to 2019, the atmospheric transport model FLEXPART, as well as available bottom-up estimates of methane emissions provided by process-based surface models and CH4 emission inventories. The results have been analysed with regards to seasonal and inter-annual fluctuations, spatial differences and trends over the period of study.
How to cite: Wittig, S., Berchet, A., Paris, J.-D., Saunois, M., Arshinov, M., Machida, T., Sasakawa, M., Worthy, D., and Pison, I.: Evaluating methane emissions between 2008 and 2019 in high northern latitudes by using inverse modeling, EGU General Assembly 2022, Vienna, Austria, 23–27 May 2022, EGU22-4297, https://doi.org/10.5194/egusphere-egu22-4297, 2022.
EGU22-4365 | Presentations | AS4.4
Linking the measurement data of the substance flows of the SMEAR Estonia measuring station with the place of growthJoonas Kollo, Allar Padari, Alisa Krasnova, Ahto Kangur, and Steffen Noe
The SMEAR Estonia is an important step towards understanding how forest ecosystem and the atmosphere affect each other. The station provides long-term continuously measured eddy-covariance CO2 flux data. Parameters such as wind speed and direction are not controllable by human, but forest management methods are, thus the flux tower helps to assess how human activities affect forest ecosystem-atmosphere relationship as well as to assess natural processes. In this study, the footprint for years 2015–2020 was calculated with Kljun model according to wind speed and direction. Measurements were taken from 30 m and 70 m height. Data was obtained by continuous high frequency (10 Hz) measurements by the eddy-covariance method and averaged over half-hour intervals. Results showed that the footprint area measured from 30 m over six-year period differed only by 5%. From 70 m this difference was only 1.2% over the six-year period. Average area for both 30 m and 70 m FFP was 61,5 ha and 4029,7 ha respectively. The growing stock of the forest was affected by forest management, but in general it grew by 3,2% for 30 m FFP. The main tree species growing in the area of the footprint are Scots pine (Pinus sylvestris), Norway spruce (Picea abies) and Silver birch (Betula pendula) with some small amount of aspen and alder species. The dominant wind directions were ranging from west to south in 2015–2017 and in 2018–2020 from south-west to south-east. The footprint area is affected mainly by wind speed and direction, and by forest management activities like harvesting and clear-cutting. Such measurements help to understand how human activity and natural processes affect formation of the footprint.
How to cite: Kollo, J., Padari, A., Krasnova, A., Kangur, A., and Noe, S.: Linking the measurement data of the substance flows of the SMEAR Estonia measuring station with the place of growth, EGU General Assembly 2022, Vienna, Austria, 23–27 May 2022, EGU22-4365, https://doi.org/10.5194/egusphere-egu22-4365, 2022.
EGU22-4792 | Presentations | AS4.4
Integrated modelling for assessment the influence of aerosol feedbacks on a regional scale as a result of accidental wildfires and land cover changes in UkraineMykhailo Savenets, Larysa Pysarenko, Svitlana Krakovska, and Alexander Mahura
The study presents the analysis of regional atmospheric condition changes in Ukraine caused by direct and indirect aerosol effects performed by a series of simulations using the Environment – High Resolution Limited Area Model (Enviro-HIRLAM). The research is based on two case studies. The first case study includes a severe wildfire event in the Chornobyl Exclusion Zone (northern part of Ukraine) which was observed in April 2020. The second case study analyzed the influence of hypothetical total deforestation in Ukraine during the extreme heat wave and heavy rain episodes in August 2010. Enviro-HIRLAM model was run for the domain with 15-km resolution and further downscaling to 5 and 2-km resolution. The simulations include 4 running modes: reference run with no aerosol effects (CTRL); including direct (DAE), indirect (IDAE) and both (DAE+IDAE) aerosol effects. The study analyzes the aerosol impact on thermal and moisture regimes at the surface and on the model levels up to 5 km above the ground. It is emphasized the role of anthropogenic and natural processes at the surface (like wildfires, land cover changes, etc.) on the enhancing of aerosol effects during extreme and unfavorable weather conditions. This study is supported by the grants of HPC-Europa3 Transnational Access Programme for projects HPC17TRLGW IMA-WFires “Integrated Modelling for Assessment of Potential Pollution Regional Atmospheric Transport as Result of Accidental Wildfires” and HPC17ENAVF MALAWE “Integrated Modelling and Analysis of Influence of Land Cover Changes on Regional Weather Conditions/ Patterns”. The CSC - IT Center for Science Computing (Finland) is acknowledged for computational resources.
How to cite: Savenets, M., Pysarenko, L., Krakovska, S., and Mahura, A.: Integrated modelling for assessment the influence of aerosol feedbacks on a regional scale as a result of accidental wildfires and land cover changes in Ukraine, EGU General Assembly 2022, Vienna, Austria, 23–27 May 2022, EGU22-4792, https://doi.org/10.5194/egusphere-egu22-4792, 2022.
Please decide on your access
Please use the buttons below to download the presentation materials or to visit the external website where the presentation is linked. Regarding the external link, please note that Copernicus Meetings cannot accept any liability for the content and the website you will visit.
Forward to presentation link
You are going to open an external link to the presentation as indicated by the authors. Copernicus Meetings cannot accept any liability for the content and the website you will visit.
We are sorry, but presentations are only available for users who registered for the conference. Thank you.
EGU22-4895 | Presentations | AS4.4 | Highlight
CLIMATE-ORIENTED TRAININGS in the field of Climate Services, Climate CHANGE ADAPTATION and MitigationValeriya Ovcharuk, Alexander Mahura, Tetiana Kryvomaz, Enric Aguilar, Jon Olanо, Inna Khomenko, Oleg Shabliy, Larisa Sogacheva, Putian Zhou, Antti Mäkelä, Svitlana Krakovska, Hanna Lappalainen, Sergiy Stepanenko, Katja Lauri, Laura Riuttanen, Svyatoslav Tyuryakov, and Irina Bashmakova
The Erasmus+ ClimEd (2021-2023; http://climed.network; “Multilevel Local, Nation- and Regionwide Education and Training in Climate Services, Climate Change Adaptation and Mitigation”) project is aimed at the development of competency-based curricula for continuous comprehensive training of specialists in the field of climate services and additional education in climate change for decision-makers, experts in climate-dependent economic sectors, and public.
Some of the goals and objectives of the project are closely related to the Pan-Eurasian EXperiment (PEEX; www.atm.helsinki.fi/peex), and especially with multi-disciplinary, -scale and -component study climate change at resolving major uncertainties in the Earth system science and global sustainability issues.
The ClimEd Trainings (http://climed.network/events/climed-trainings), in total 7, will be carried out during the project and will be focused on training the faculty/ teaching/ research staff and postgraduates at the ClimEd partner institutions and collaborating organizations in advanced educational and information-and-communication technologies for building a flexible multi-level integrated practice-based education system in the field of Climate Services, Climate Change Adaptation and Mitigation.
Due to COVID pandemic situation, the originally planned face-to-face first trainings (in Estonia, Ukraine, and Finland) were converted into online training. Such online trainings were divided into 3 consecutive blocks: (i) online lecturing, (ii) home-work-assignments (HWAs) as group projects with established internal communication between the member of the groups and with an option of zoom-consulting during remote work, and (iii) final oral presentations (projects’ defenses) of HWAs with evaluation and feedback, discussions, and awarding certificates (corresponding to ECTS credits) with achieved learning outcomes. The majority of HWAs are based on the ClimEd main themes linking climate change vs. agriculture, energy, technical design and construction, urban economy, water management, health care; although other themes of interest can be selected by groups. Trainings also include questionnaires distributed among participants: evaluation of the training, and evaluation of own learning outcomes. Technically, the Moodle system, Zoom-hosting, e-evaluations, etc. are actively utilized in such trainings. All materials of the trainings are always publicly accessible online at the ClimEd project website as well as long-term stored at the Moodle system for each training.
The outcomes/ summaries – including the lecture topics and learning outcomes, information resources, themes of group projects, feedbacks and training results, established network-community of the training participants (trainees and lecturers and teachers of HWAs) – of the online training approach will be presented for the ClimEd Trainings. Summaries are available for: 1st training “Competence-Based Approach to Curriculum Development for Climate Education”; 19 Apr – 12 May 2021; http://climed.network/events/climed-trainings/climed-training-1-online); 2nd – “Adaptation of the Competency Framework for Climate Services to conditions of Ukraine” (29 Jun – 26 Aug 2021; http://climed.network/events/climed-trainings/climed-training-2-online); 3rd – “Digital tools and datasets for climate change education” (26 Oct – 12 Nov 2021; http://climed.network/events/climed-trainings/climed-training-3-online); and 4th “Developing learning courses in climate services considering needs of different users” (7–11 February 2022; http://climed.network/events/climed-trainings/climed-training-4).
How to cite: Ovcharuk, V., Mahura, A., Kryvomaz, T., Aguilar, E., Olanо, J., Khomenko, I., Shabliy, O., Sogacheva, L., Zhou, P., Mäkelä, A., Krakovska, S., Lappalainen, H., Stepanenko, S., Lauri, K., Riuttanen, L., Tyuryakov, S., and Bashmakova, I.: CLIMATE-ORIENTED TRAININGS in the field of Climate Services, Climate CHANGE ADAPTATION and Mitigation, EGU General Assembly 2022, Vienna, Austria, 23–27 May 2022, EGU22-4895, https://doi.org/10.5194/egusphere-egu22-4895, 2022.
EGU22-4945 | Presentations | AS4.4 | Highlight
Assessing the impact of observation networks and data mobility for their impacts on socio-economical activities in the Arctic – Perspectives by the iCUPE projectSteffen M. Noe, Alexander Mahura, Tuukka Petäjä, Ksenia Tabakova, Hanna K. Lappalainen, and Dataset Leaders
Rapid changes due to climate warming in the Arctic environment call for action and the implementation of sustainable measures in a scientific data driven policy process.
Assessment of available data on the Arctic and Antarctic regions and their linkage to Essential Variables (EV) and the UN Sustainable Development Goals (SDG) allow the implementation of scientific data driven policies and socio-economic activities mechanisms towards sustainable development. In the iCUPE (Integrative and Comprehensive Understanding on Polar Environments; www.atm.helsinki.fi/icupe) project (Petäjä et al., 2020), multiscale datasets ranging from in-situ small local scale to remotes sensing satellite data operating on global scale were generated and made public.
iCUPE developed further several data pilot applications that included flow of different data sources towards public services. Inclusion of indigenous knowledge and feedback by data users were tested (Noe et al., 2021)
The iCUPE datasets were used to evaluate impacts on social-economical activities in the Arctic and are well-linked to Sustainable Development Goals (SDGs) such as #3, 4, 11, 13, 14, 15, and 17. In particular, DSs (on aerosols, including black carbon, physico-chemical properties and spatio-temporal variability based on ground-based, satellite and unmanned aerial systems observations) show links to atmospheric pollution and climate change. These DSs allow to evaluate impact on environment and population (especially, indigenous people) health for the Arctic States as well as long-range transport/ deposition of pollution to remote populated regions. Hence, the evaluation results will be useful for the climate adaptation and changing social lifestyle and economic activities in Arctic regions. The DSs (on atmospheric mercury observations) show links to atmospheric pollution and deposition on underlying surfaces, and hence, the contamination of seas/lands. This helps to estimate impact on fishery and reindeer herding economical activities, and hence, impact on environment and population health through food chains. The DSs (emerging organic contaminants in water) show a situation on contamination of seas, which is important for evaluating the impacts on fishery industry, and hence, impact on population health and well-being through food chains and prosperity. The DSs (on emerging organic and anthropogenic contaminants in snow) underline contamination of food supply for reindeers, which is valuable for evaluating impact on economic activities and style of the life of indigenous people as well as impact on population health through food chains. The DSs (time series of lake size changes in Northeast Greenland) show changes in water resources availability, which can influence the hydropower plans of the Greenlandic government to foster economic development in Greenland.
Petaja, T., et al. (2020): Overview: Integrative and Comprehensive Understanding on Polar Environments (iCUPE) - concept and initial results. Atmospheric Chemistry and Physics. 20, 14, p. 8551-8592.
Noe S.M. et al. (2021): Arctic observations and Sustainable Development Goals - Contributions and examples from ERA-PLANET iCUPE data. Environmental Science and Policy, Manuscript in Review.
How to cite: Noe, S. M., Mahura, A., Petäjä, T., Tabakova, K., Lappalainen, H. K., and Leaders, D.: Assessing the impact of observation networks and data mobility for their impacts on socio-economical activities in the Arctic – Perspectives by the iCUPE project, EGU General Assembly 2022, Vienna, Austria, 23–27 May 2022, EGU22-4945, https://doi.org/10.5194/egusphere-egu22-4945, 2022.
EGU22-5714 | Presentations | AS4.4
The Space Weather events those accompany the long-lived macrosynoptic processesOlga Stupishina and Elena Golovina
The presented work evolves the study of the Space Weather state before and during the macrosynoptic processes movements in North Atlantic and Eurasia extratropical latitudes. The atmosphere circulation types – E-type (east transport), W-type (west transport) and C-type (meridional transport) – were investigated by their periods of the conservation: (5-7) days which corresponds to the Natural Synoptic Period (NSP) in Europe region and the Long Period (LP) which endured more than 10 days.
The investigation time interval: 1.01.2007 – 1.01.2014. That corresponds to: the Solar Activity (SA) 23-d cycle's fall branch, the SA minimum, the rise branch of the 24-th SA cycle, the maximum of 24-th SA cycle.
Space Weather parameters were: global variations of SA parameters; daily characteristics of the SA flare component in various bands of the electromagnetic spectrum; variations of daily statistics of Interplanetary Space characteristics in the near-Earth space; variations of daily statistics of Geomagnetic Field characteristics.
Results:
1. LP-E-type occurs 56% of all LP when LP-W-type occurs 36% and LP-C-type occurs 8%.
2. The concrete Space Weather parameters which behavior differences the moments of LP-beginnings from the moments of NSP-beginnings for the E-type circulation (here we are presenting only results for the most frequent macrosynoptic type) are follows:
- All daily indexes of SA global variations – the integral solar radioflux on the wavelength of 10.7cm, the solar spot number, the summarized spot area on the solar disk, the number of new Active Regions on the solar disk.
- The daily statistics (maximum, mean, range, standard deviation) of α-particle fluxes with the energy of 4-10 MeV.
- The daily statistics (maximum, mean, range, standard deviation) of electron fluxes of energy that is greater than 2 MeV.
- The daily statistics (maximum, mean, range, standard deviation) of the intensity of the whole magnetic field vector in the near-Earth space.
- The daily statistics (maximum, mean, range, standard deviation) of the intensity of the geomagnetic field that was measured at different terrestrial latitudes.
3. The most prominent events we can see in the behavior of the α-particle fluxes and in the behavior of the whole magnetic field vector in the near-Earth space those went on the background of the significant changing of global SA-indexes.
We suppose the complex impact the mentioned above Space Weather characteristics on the terrestrial atmosphere.
Results may be useful for the forecast of atmosphere response to the space impact.
How to cite: Stupishina, O. and Golovina, E.: The Space Weather events those accompany the long-lived macrosynoptic processes, EGU General Assembly 2022, Vienna, Austria, 23–27 May 2022, EGU22-5714, https://doi.org/10.5194/egusphere-egu22-5714, 2022.
EGU22-6436 | Presentations | AS4.4
West-Siberian meridional carbon transect: the conceptPavel Smirnov and Andrey Tolstikov
Last year, in Russia there was started a new government long-term initiative, that aims reduction for Russian greenhouse gas emissions by up to 70 percent compared to the 1990 level in less than next 10 years (by 2030).
On the one hand such ambitious goal to includes massive technical and industrial modernization and other hand – supposed to provide valid, verified and globally recognized scientific data on the runoff and emission of greenhouse gases from ecosystems all around Russia. Thus, a large-scale program for the development of carbon stations has started with running of carbon polygons, which should combine both research-methodological and educational functions, and, eventually, contribute to the achievement of the specified state objective. The educational function of the polygons includes training personnel with interdisciplinary competencies to work on "carbon" topics, including the highest qualifications.
Starting to design and equip the first running polygon in the Tyumen region (by University of Tyumen), we initially stated concept of creating an ecological and climatic transect across the whole of Russia from north to south. The general idea is connect the new carbon polygon near Tyumen with carbon monitor infrastructure in proposed polygons and stations in Tobolsk and Ishim, Khanty-Mansiysk (Mukhrino) and Yamalo-Nenets (Labytnangi)Autonomous Disctricts. With potential sites in partners, that University of Tyumen has in Central Asian republics, there are prospect to continue this meridional transect further to the south. And in this case, we have the prospect of getting a global-scale monitoring system in the center of Eurasia across all natural zones from north to south, that provide massive raw data set for global observation system.
How to cite: Smirnov, P. and Tolstikov, A.: West-Siberian meridional carbon transect: the concept, EGU General Assembly 2022, Vienna, Austria, 23–27 May 2022, EGU22-6436, https://doi.org/10.5194/egusphere-egu22-6436, 2022.
EGU22-6967 | Presentations | AS4.4
Seasonal dynamics and toxicity of PM-bound PAHs in northernmost European megacity.Marina Chichaeva, Yuliya Zavgorodnyaya, Olga Popovicheva, Arina Semenova, and Nikolai Kasimov
Cities are prone to air pollution caused by emissions associated with population activities such as road transport, industry, heating, and residential sector. The concentration and chemical composition of particulate matter (PM) is of particular importance as the parameter of air quality measurements. Concerning impact on urban air quality and hazardous health effects accompanied by the capacity for long-range atmospheric transport, polyromantic hydrocarbons (PAHs) are numbered among priority pollutants in the national and international regulatory activities. Seasonal dynamics and toxicity of PM-bound PAHs in a northern context attract the particular attention.
Sampling and PM10-bound PAHs characterization were carried out in urban background of Moscow megacity, the largest as well as the northernmost megacity in Europe. Composition of 16 PAHs which are numbered in the EPA list of ‘Priority Pollutants’, were considered for three periods: spring (from mid-April to the end of May, when a positive average daily temperature is set in Moscow), autumn (from the end of September to the end of November), and winter (from early December to mid-January, when the average daily temperature reliably drops below zero). The sum of 16 PAHs had ranged over the observation period from 0.4 to 10 ng/m3, with increase of the median concentration from spring and autumn to winter due to the maximum anticyclonic atmospheric circulation and emissions from thermal power plants in winter as well as the transition of PAH from PM to the gas phase with an increase of the temperature in spring. Average PAH toxic equivalent (TEQs) were higher in winter and autumn than those in summer and spring. Increased concentrations for BaA, BaP,BgP, Cry, BbF due to high wind speeds indicate a distant source and a long-range transfer of pollutants. While the presence of maxima of concentrations at medium or low wind speeds can serve as an indication of the proximity of sources, as well as the weakening of atmospheric circulation, which leads to accumulation of pollutants (ANT, PYR, BbF, DiBaA, BLU, PHE, BkF) in the measurement area.
Based on the statistical processing, high (> 0.75) positive correlations for all individual PAHs were obtained in autumn and winter. This indicates the high stability and the absence of significant transformation of PAH due to physical and photochemical reactions. At higher temperature in spring compared to autumn-winter, low correlations for phenanthrene was observed due to evaporation of the lowest molecular weight PAHs could proceed more intensively on the aerosol surface.
This work is supported by the Russian Government, through its grant number 14.W03.31.0002.
How to cite: Chichaeva, M., Zavgorodnyaya, Y., Popovicheva, O., Semenova, A., and Kasimov, N.: Seasonal dynamics and toxicity of PM-bound PAHs in northernmost European megacity., EGU General Assembly 2022, Vienna, Austria, 23–27 May 2022, EGU22-6967, https://doi.org/10.5194/egusphere-egu22-6967, 2022.
EGU22-7090 | Presentations | AS4.4
Elucidating the impact of Siberian biomass burning aerosol on the radiative balance in the Arctic: model analysis constrained by observationsIgor B. Konovalov, Nikolai A. Golovushkin, Matthias Beekmann, Guillaume Siour, Tatyana B. Zhuravleva, Ilmir M. Nasrtdinov, Victor N. Uzhegov, Irina N. Kuznetsova, Murat I. Nakhaev, Solène Turquety, and Florian Couvidat
Siberian wildfires inject into the atmosphere huge amounts of aerosol particles, part of which are transported into the Arctic. Once in the Arctic, biomass burning (BB) aerosol can contribute to the radiative balance and affect the climate processes in different ways, including the absorption and scattering of the solar radiation, changes in the albedo of the ice/snow surface cover, modification of the optical properties of clouds. However, quantitative knowledge of the role of Siberian BB aerosol in the Arctic is deficient, reflecting major uncertainties in available model representations of its emissions, chemical composition, and optical properties.
In this study, the CHIMERE v2020 chemistry transport model (https://www.lmd.polytechnique.fr/chimere/) coupled with the WRF meteorological model was used to examine the effects of aerosol-radiation interactions (the direct aerosol radiative effect and the associated semi-direct effects) due to the transport of BB plumes from Siberia into the Eastern Arctic. The analysis features the use of satellite and in situ observations to constrain the BB aerosol sources and optical properties. Furthermore, the simulations brought together new model representations of the optical properties and aging of the organic component of Siberian BB aerosol [1,2], which were also constrained by satellite and ground-based observations, and recent findings from aerosol chamber experiments [3]. The study focuses on the radiative effects associated with the strong fires that occurred in Siberia in July 2016.
It is found that weakly-absorbing Siberian BB aerosol exerted a strong cooling effect in the near-surface layer of the atmosphere and at the top of the atmosphere over large areas on land in the Eastern Arctic. However, the aerosol radiative effects over the ocean were found to be of a mixed character, which is partly due to semi-direct effects triggered by the aerosol absorbing components (black carbon and brown carbon). Overall, our study results indicate that direct and semi-direct radiative effects caused by Siberian BB aerosol constitute a significant part of the evolving natural baseline of the Arctic radiative budget and need to be taken into accounts in analyses and predictions of the Arctic amplification of climate change.
The study was supported by the Russian Science Foundation under grant agreement No. 19-77-20109 (modeling light-absorbing aerosol components), RFBR and CNRS according to the research project № 21-55-15009 (modeling light-scattering aerosol components).
References:
- Konovalov, I.B., Golovushkin, N.A., Beekmann, M., and Andreae, M.O.: Insights into the aging of biomass burning aerosol from satellite observations and 3D atmospheric modeling: evolution of the aerosol optical properties in Siberian wildfire plumes, Atmos. Chem. Phys., https://doi.org/10.5194/acp-21-357-2021, 2021.
- Konovalov, I.B., Golovushkin, N.A., Beekmann, M. Panchenko, M.V.; Andreae, M.O.: Inferring the absorption properties of organic aerosol in biomass burning plumes from remote optical observations, Atmos. Meas. Tech., https://doi.org/10.5194/amt-14-6647-2021, 2021.
- Kozlov, V.S., Konovalov I.B., Panchenko, M.V., Uzhegov, V.N., et al.: Dynamics of aerosol absorption characteristics in smoke combustion of forest biomass burning at the Large Aerosol Chamber at the stages of generation and aging in time. Proc. SPIE, https://doi.org/10.1117/12.2603496, 2021.
How to cite: Konovalov, I. B., Golovushkin, N. A., Beekmann, M., Siour, G., Zhuravleva, T. B., Nasrtdinov, I. M., Uzhegov, V. N., Kuznetsova, I. N., Nakhaev, M. I., Turquety, S., and Couvidat, F.: Elucidating the impact of Siberian biomass burning aerosol on the radiative balance in the Arctic: model analysis constrained by observations, EGU General Assembly 2022, Vienna, Austria, 23–27 May 2022, EGU22-7090, https://doi.org/10.5194/egusphere-egu22-7090, 2022.
EGU22-8036 | Presentations | AS4.4
Measurement report: Disentangling methane and other trace gases sources and transport across the Russian Arctic from aircraft measurementsClement Narbaud, Jean-Daniel Paris, Antoine Berchet, Sophie Wittig, Marielle Saunois, Philippe Nédelec, Boris Belan, Mikhail Arshinov, Denis Davydov, Aleksandr Fofonov, and Artem Kozlov
A more accurate characterization of the sources and sinks of methane (CH4) and carbon dioxide (CO2) in the vulnerable Arctic environment is required to better predict climate change. A large-scale aircraft campaign took place in September 2020 focusing on Siberian coast. CH4 and CO2 were measured in situ during the campaign and form the core of the study. Measured ozone (O3) and carbon monoxide (CO) are used here as tracers. Compared to the reference (i.e., the seasonal value at Mauna Loa, Hawaii, US), median CH4 mixing ratios are fairly higher (1890-1969 ppb vs 1887 ppb) while CO2 mixing ratios from all flights are lower (408.09-411.50 ppm vs 411.52 ppm). We also report on 3 case studies. Our analysis suggests that during the campaign the European part of Russia’s Arctic and Western Siberia were subject to long-range transport of polluted air masses, while the East mainly was under the influence of local emission of greenhouse gases. The relative contributions of anthropogenic and natural sources of CH4 in Siberia are simulated using the Lagrangian model FLEXPART in order to identify dominant sources in the boundary layer and in the free troposphere. In western terrestrial flights, air masses composition is influenced by from wetlands and anthropogenic activities (waste management, the fossil fuel industry and to a lesser extent the agricultural sector), while in the East, emissions are dominated by freshwaters, wetlands, and the oceans, with an ambiguous contribution from likely anthropogenic sources related to fossil fuels. Our results generally highlight the importance of the contribution form freshwater and oceans emissions and, combined with the large uncertainties associated with them, suggest that the emission from these aquatic sources should receive more attention in Siberia.
How to cite: Narbaud, C., Paris, J.-D., Berchet, A., Wittig, S., Saunois, M., Nédelec, P., Belan, B., Arshinov, M., Davydov, D., Fofonov, A., and Kozlov, A.: Measurement report: Disentangling methane and other trace gases sources and transport across the Russian Arctic from aircraft measurements, EGU General Assembly 2022, Vienna, Austria, 23–27 May 2022, EGU22-8036, https://doi.org/10.5194/egusphere-egu22-8036, 2022.
EGU22-9011 | Presentations | AS4.4
Validation and adaptation of WRF-Chem numerical model to simulate CO2 transport in Saint-PetersburgGeorgy Nerobelov, Yuri Timofeyev, Stefani Foka, Juha Hatakka, Yana Virolainen, and Sergei Smyshlyaev
Alteration of the Earth's radiation balance due to the rise of the content of the main anthropogenic greenhouse gas СО2 in the atmosphere leads to the changes of the planet's climate. It is known that megacities contribute approximately 70% to the total anthropogenic CO2 emissions playing a critical role in the climate changes. Several methods of emission estimation are being developed to control commitments undertaken by different countries on reducing greenhouse gas emissions. One of such methods - inverse modelling - combines accurate observations of the increase of gas` content, a priori anthropogenic emissions and numerical modelling of atmospheric transport to define gas` sources and correct emission data used in the simulation. Several studies demonstrated that the inverse modelling of CO2 anthropogenic emissions highly depends on the modelling of CO2 transport in the atmosphere. Therefore a careful validation of such models must be carried out before CO2 emissions estimation by the inverse modelling. In the current research we studied capabilities of numerical weather prediction and chemistry dynamic model WRF-Chem to simulate CO2 transport on the territory of Saint-Petersburg (Russia) using observations of near-ground and total CO2 content.
How to cite: Nerobelov, G., Timofeyev, Y., Foka, S., Hatakka, J., Virolainen, Y., and Smyshlyaev, S.: Validation and adaptation of WRF-Chem numerical model to simulate CO2 transport in Saint-Petersburg, EGU General Assembly 2022, Vienna, Austria, 23–27 May 2022, EGU22-9011, https://doi.org/10.5194/egusphere-egu22-9011, 2022.
EGU22-9018 | Presentations | AS4.4
Analysis of Saint-Petersburg`s CO2 anthropogenic emissions estimation by differential spectroscopy methodYury Timofeyev, Georgy Nerobelov, and Anatoliy Poberovskiy
Needs in obtaining independent and high-quality information on anthropogenic emissions of important for climate and ecology gases led to the development of spectroscopic (ground-based and satellite) methods of the emission determination. This challenge can be reduced to two sequential inverse problems - the inverse problem of atmospheric optics and atmospheric transport. Here we studied the merits and disadvantages of differential IR methods for the emissions estimation. Also we investigated the main factors determining their errors such as:
- Quality and number of the observations of spatio-temporal distribution of gases studied
- Capabilities of the numerical models to simulate atmospheric transport
- Spatial and temporal resolutions of emissions estimated
- etc.
In the current study integral anthropogenic CO2 emissions of Saint-Petersburg were determined using observation data of the city`s anthropogenic contribution to the gas content. In addition we implemented a new approach of inverse problem solution which was based on a priori CO2 emission data and scale coefficients applied only to the city`s areas covered by the observations. Integral anthropogenic CO2 emissions obtained were in a range from approximately 52 to 72 Mt/year. These emissions are significantly higher than inventory-based estimates which constitute ⁓30 Mt/year. Nevertheless, the minimal value of the range (~52 Mt/year) is lower by ~21% than emissions which we calculated earlier also using observations (~65 Mt/year).
How to cite: Timofeyev, Y., Nerobelov, G., and Poberovskiy, A.: Analysis of Saint-Petersburg`s CO2 anthropogenic emissions estimation by differential spectroscopy method, EGU General Assembly 2022, Vienna, Austria, 23–27 May 2022, EGU22-9018, https://doi.org/10.5194/egusphere-egu22-9018, 2022.
EGU22-9502 | Presentations | AS4.4 | Highlight
Summary of integrative and Comprehensive Understanding on Polar Environments (iCUPE) project resultsTuukka Petäjä and the iCUPE project team
The Horizon-2020 iCUPE (Integrative and Comprehensive Understanding on Polar Environments; https://www.atm.helsinki.fi/icupe) was a science driven the ERA-PLANET (European network for observing our changing planet; http://www.era-planet.eu) Programme Thematic Strand-4 project. The iCUPE overall aim was to evaluate and present a holistic understanding of impacts of various increasing human activities on the polar areas, and especially in the Arctic regions. The iCUPE main scientific impact is related to improved understanding and new knowledge about local and remote sources of Arctic air pollutants, including short-lived climate forcers and their precursors as well as their sinks, and improved quantification of the life cycle of mercury, heavy metals, black carbon and persistent organic pollutants. In addition, iCUPE examined changes in the Arctic snow and ice surfaces, vegetation, biomass characteristics, mapped out the development of natural resources extraction and delivered the new first impact assessments of the future exposure scenarios of pollutants in the Arctic regions. During iCUPE project lifetime the consortium worked on combining integrated in-situ and satellite Earth Observation with multi-scale modelling platform by: (1) synthesizing data from comprehensive long-term measurements, intensive campaigns and satellites, collected during the project or provided by on-going international initiatives; (2) relating the observed parameters to impacts; and (3) delivering novel data products, metrics and indicators to the stakeholders concerning the environmental status, availability and extraction of natural resources in the polar areas. Overall, iCUPE collected a significant body of knowledge, including 24 novel datasets, methods, algorithms and published more than 100 research papers. A summary of the iCUPE project obtained results will presented and discussed.
How to cite: Petäjä, T. and the iCUPE project team: Summary of integrative and Comprehensive Understanding on Polar Environments (iCUPE) project results, EGU General Assembly 2022, Vienna, Austria, 23–27 May 2022, EGU22-9502, https://doi.org/10.5194/egusphere-egu22-9502, 2022.
Please decide on your access
Please use the buttons below to download the presentation materials or to visit the external website where the presentation is linked. Regarding the external link, please note that Copernicus Meetings cannot accept any liability for the content and the website you will visit.
Forward to presentation link
You are going to open an external link to the presentation as indicated by the authors. Copernicus Meetings cannot accept any liability for the content and the website you will visit.
We are sorry, but presentations are only available for users who registered for the conference. Thank you.
EGU22-9775 | Presentations | AS4.4
Unprecedented wildfire smoke in the Siberian Arctic in August 2021Olga Popovicheva, Vasilii Kobelev, Marina Chichaeva, and Nikolai Kasimov
Long-range transport to the Arctic carries tracers of anthropogenic activities and wildfires, among other aerosol constituents. Black carbon (BC) shows a contribution of fossil fuels combustion and natural biomass burning (BB) to the Arctic atmosphere chemistry and aerosol pollution. Fossil sources mostly prevail during winter-spring season while BB sources dominate during low BC concentration periods in summer. Spectral dependence of the light absorption described by the absorption Ångström exponent (AAE) is used to differentiate between different aerosol types (BC, BrC) and indicate the impact of BB.
Long-term airborne observations of BC in Northern Siberia have revealed a strong impact of forest fires in summer (Kozlov et al., 2016; Paris et al., 2009;Popovicheva et al., 2020). Particulate brown carbon (BrC) has been reported to be emitted by intense wildfires and measured in plumes transported over two days (Forrister et al., 2015). Due to the mixing with background aerosol and ageing processes, the air masses influenced by BB events is expected to have increased AAE as compared to the BC produced by fossil fuel.
Yamalo-Nenets Autonomous Okrug (YNAO) is located in the Far North of Western Siberia, more than 50% of its area takes place beyond the Polar Circle. On August 4 of 2021, strong smoke enveloped Salehard, Noyabrsk, Tarko-Sale and other municipalities of the district. The air mass transportation from the southeastern directions brought smoke from forest fires located on the territory of the Republic of Sakha (Yakutia). According to the operational data of “Avialesokhrana”, 105 wildfires were active over an area of about 1.2 million hectares there.
A dense haze covered a city Nadym, located around 100 km to the south the Polar Circle, as well. Smoke sampling performed from 5 to 12 August 2021 was correlated with the haze day duration and showed the variation of AAE up to 2.5, the feature of strong BB impact. Unprecedented high BC is observed on Bely island taking place in the Kara sea, above Yamal Peninsula. Unprecedented high pollution for the Siberian Arctic was recorded by research polar aerosol station “Island Bely”. An extreme increase of BC concentration was observed on August 5, reaching 4000 ng per m3. The Arctic summer background was exceeded 40 times! It was found 8 times higher than the highest arctic haze concentrations observed in December 2019. AAE approached 1.4, very high value for area such remoted from wildfires (more than 1000 km). It indicated the long-range transportation from Yakutia of aged air masses influenced by BB events. Basic research in the Siberian Arctic is supported by Russia Geographical Society №17-2021И.
How to cite: Popovicheva, O., Kobelev, V., Chichaeva, M., and Kasimov, N.: Unprecedented wildfire smoke in the Siberian Arctic in August 2021, EGU General Assembly 2022, Vienna, Austria, 23–27 May 2022, EGU22-9775, https://doi.org/10.5194/egusphere-egu22-9775, 2022.
EGU22-10293 | Presentations | AS4.4
Geochemical processes in Yamal peninsula lakes under climate variationIrina Fedorova, Roman Zdorovennov, Galina Zdorovennova, and Nikita Bobrov
Climate change determines processes in Arctic lakes. Over the past ten years, within the framework of various projects, different types of Yamal lakes have been studied: deep glacio-karst Neytinskiye lakes in the central part of the peninsula and shallow thermokarst lakes formed due to melting of buried ice in the Yarkuta river valley; more than 50 lakes have been studied in total.
The studied lakes differed markedly in transparency (2-7 м), water bottom temperature (6-18°C), electrical conductivity (97-465 μS/cm), turbidity (6.73-34.3 FTU), chromaticity (9.8-46.7°), dissolved oxygen (5-10 mg/l), depending on their location, depth, the influence of melting buried ice, and local conditions. The concentration of biogenic elements (NO3, NO2, PO4, and SiO2) was insignificant, reaching a maximum of 2.63 mg/L, 0.07 mg/L, 1.05 mg/L, and 3.82 mg/L, correspondingly. pH values varied within a small range - 6.1-7.68, showing the neutral lakes environment.
For Yamal lakes, the values of stable oxygen isotopes δ18O corresponded to the lateral inflow of water into the lakes. Increase in the water and organic substances supply from the permafrost active layer, precipitation and groundwater can be predicted due to the observed climate warming.
The ecosystems of Yamala lakes poor in organic matter (OM) in general, but OM increase may occur due to hydroclimatic factors, permafrost degradation and additional OM flux to objects while intensification of eutrophication processes. However, the photodegradation and high accumulation exchange capacity of bottom lacustrine sediments indicates the presence significant relaxation period of ecosystem under external influences.
Decrease in ice thickness by 15-20 cm in 2040-2051 relative to the values of 2009-2021 is predicted for two thermokarst lakes according to RCP 2.6 and RCP 8.5. The lake bottom water temperature will increase by 1-2°C both during open water and under ice. The thermal balance of the bottom sediments and taliks will be positive, and increase of volume of talik will be contributed.
Three main paleoclimatic periods of sedimentation over the past 500 years have been identified based on the dating of lacustrine deposits and the description of their geochemical and spore-pollen features (the rate of sedimentation in the Neytinskiye lakes is an average of 0.8 mm/year, method for determining 210Pb): (1) 500-450 years - active sedimentation with high values of K, V, Ba; (2) 450-100 years - uniform sedimentation with low element’s concentrations, which can be interpreted as a general cooling and an erosion decrease on the lakes catchment; (3) 60-100 years - is a warmer period with waterlogging and increase of Mn and Fe and biogenic elements entry from the catchment due to the degradation of permafrost. A peak of Al and Zn can be interpreted as a result of anthropogenic impact.
Geochemical analyses were carried out on the equipment of the SPBU Resource centers "Magnetic Resonance Research Methods" and "Methods for the Analysis of Substance Composition." Research on the Yamal lakes will be continued with the support of the Russian Ministry of Science and Higher Education, agreement No. 075-15-2021-139
How to cite: Fedorova, I., Zdorovennov, R., Zdorovennova, G., and Bobrov, N.: Geochemical processes in Yamal peninsula lakes under climate variation, EGU General Assembly 2022, Vienna, Austria, 23–27 May 2022, EGU22-10293, https://doi.org/10.5194/egusphere-egu22-10293, 2022.
Please decide on your access
Please use the buttons below to download the presentation materials or to visit the external website where the presentation is linked. Regarding the external link, please note that Copernicus Meetings cannot accept any liability for the content and the website you will visit.
Forward to presentation link
You are going to open an external link to the presentation as indicated by the authors. Copernicus Meetings cannot accept any liability for the content and the website you will visit.
We are sorry, but presentations are only available for users who registered for the conference. Thank you.

EGU22-10368 | Presentations | AS4.4
Atmospheric Mercury Depletion Events: Assessment Impact of Meteorological Parameters in the Arctic WinterFidel Pankratov, Alexander Mahura, Vladimir Masloboev, and Valentin Popov
In 2001, the mercury analyzer was installed at Amderma (69.450 N, 61.390 E, 49 m above sea level; Yugor Peninsula) in the Nenets Autonomous Okrug (Russia) to carry out continuous measurements of gaseous elemental mercury vapor concentration in the atmospheric surface layer. The data analysis demonstrated that the atmospheric mercury depletion evens (AMDEs, concentration < 1 ng m-3) are observed on a rather limited territory, i.e. along the coast of the Arctic seas. During observational period (2001-2015), the analyzer was placed at three locations at different distances (8.9 km – 2001-2004, 2.5 km – 2005-2010, and 200 m - 2010-2015) from the Kara Sea coast.
For the AMDEs cases, during winters of 2001-2004 the air temperature was in range from -150С to -310С and relative humidity – 68-84%. The dominated atmospheric transport for these cases was mainly observed from the N-N-W direction. The number AMDEs relative to all measurements was about 0.2%. For 2005-2010, the temperature ranged from -10С to -370С and relative humidity – 74-83%. The atmospheric transport – from the E-E-N direction. The number AMDEs relative to all measurements was 2.7%. For 2010-2013, the temperature varied from -220С to -270С and relative humidity – 75-87%. The atmospheric transport – mainly from the S-S-W direction. The number AMDEs relative to all measurements was 26.9%, showing substantial 10-fold increase of AMDEs compared with the previous period. As a result, all cases correspond to range of air temperatures from -10C to -370C and relative humidity of 68-87% for entire monitoring period considered.
For selected considered episode (29-30 Mar 2002), the air temperature varied from -260C to -310C, and when it decreased to the minimum, the effect of mercury depletion was detected with the lowest concentration (0.39 ng m-3). For episode (29 Feb - 1 Mar 2007), the temperature was also decreasing from -160C to -370C, and at reaching the minimum, the mercury concentration was also the lowest (0.12 ng m-3). Moreover, in Dec 2006, for the first time, a significant number of AMDEs cases (23 events) was recorded during the polar night. In Feb 2010 the longer duration (up to 40 hours) AMDEs episodes were observed compared with Jan (up to 15 hours).
Note that all AMDEs are generally observed at lower air temperatures and relative humidity values with respect to the average values.
How to cite: Pankratov, F., Mahura, A., Masloboev, V., and Popov, V.: Atmospheric Mercury Depletion Events: Assessment Impact of Meteorological Parameters in the Arctic Winter, EGU General Assembly 2022, Vienna, Austria, 23–27 May 2022, EGU22-10368, https://doi.org/10.5194/egusphere-egu22-10368, 2022.
EGU22-10551 | Presentations | AS4.4
Seamless Modelling for Environmental Studies: Enviro-HIRLAM Recent Research and DevelopmentAlexander Mahura, Roman Nuterman, Alexander Baklanov, Georgii Nerobelov, Mykhailo Savenets, Larysa Pysarenko, Margarita Sedeeva, Pavel Amosov, Aleksandr Losev, Victoria Maksimova, Fidel Pankratov, Svitlana Krakowska, Sergey Smyshlayaev, Tuukka Petaja, and Markku Kulmala
The Enviro-HIRLAM (Environment - HIgh Resolution Limited Area Model) is seamless/ online integrated numerical weather prediction and atmospheric chemical transport modelling system capable to simulate simultaneously meteorology – atmospheric composition on regional to subregional – urban scales.
The main areas of the model research and development include: downscaling/ nesting for high resolutions; improved resolving boundary and surface layers structures; urbanization and sub-layer processes; improvement of advection schemes; integration of natural and anthropogenic emission inventories; implementation of gas-phase chemistry mechanisms, aerosol dynamics and microphysics, aerosol feedback and interactions mechanisms.
The Enviro-components includes: gas-phase chemistry; aerosol microphysics with nucleation, coagulation, condensation of sulfate, mineral dust, sea-salt, black and organic carbon together with aerosols’ dry and wet deposition, sedimentation processes; parameterisations of urban sublayer with modifications of the interaction soil–biosphere–atmosphere scheme; sulfur cycle mechanism with dimethyl sulfide, sulfur dioxide and sulfate; radiation scheme improved to account explicitly for aerosol radiation interactions for aerosol subtypes; aerosol activation implemented in condensation-convection scheme with nucleation dependent on aerosol properties and ice-phase processes; locally mass-conserving semi-Lagrangian numerical advection scheme; natural and anthropogenic emission inventories.
The Enviro-HIRLAM utilises extraction and pre-processing of initial/ boundary meteorology-chemistry-aerosol conditions and observations for data assimilation (from ECMWF’s ERA-5 & CAMS), pre-processing of selected emission inventories for anthropogenic and natural emissions. The latest version has been run on CRAY-XC30/40 and Atos BullSequana HPCs machines, and it has been developed through the research and HPC projects such as Enviro-HIRLAM at CSC and Enviro-PEEX & Enviro-PEEX(Plus) at ECMWF, as well as other research projects.
The research, development and science education of the modelling system and its applications will be demonstrated on examples, where the Enviro-HIRLAM is used as a research tool for studies in domain of the Pan-Eurasian Experiment (PEEX; https://www.atm.helsinki.fi/peex) programme. Examples of such include: aspects of regional-subregional-urban downscaling with focus on metropolitan areas of St.Petersburg and Moscow; influence of dust transport from artificial tailing dumps and Cu-Ni smelters of the Kola Peninsula on pollution of environment and health of population; aerosol feedbacks and interactions at regional scale in the Arctic-boreal domain; evaluation of atmosphere-land-sea surfaces interactions, and in particular, heat-moisture exchange/ regime between these surfaces and for better understanding and forecasting of local meteorology in the Arctic; analysis of urban meteorology and atmospheric pollution with integrated approach to high-resolution numerical modelling; and others. The modelling output provides meteorology-chemistry related input to assessment studies for population and environment as well as can be integrated into GIS environment for further risk/vulnerability/consequences/etc. estimation, and other studies.
The science education component for the model is also realised though short-term visits of young researchers, organization and carrying out research training weeks. The latest face-to-face trainings took place in Apr and Jun 2019 (Helsinki and Tyumen), and online in Nov-Dec 2021 (https://megapolis2021.ru).
How to cite: Mahura, A., Nuterman, R., Baklanov, A., Nerobelov, G., Savenets, M., Pysarenko, L., Sedeeva, M., Amosov, P., Losev, A., Maksimova, V., Pankratov, F., Krakowska, S., Smyshlayaev, S., Petaja, T., and Kulmala, M.: Seamless Modelling for Environmental Studies: Enviro-HIRLAM Recent Research and Development, EGU General Assembly 2022, Vienna, Austria, 23–27 May 2022, EGU22-10551, https://doi.org/10.5194/egusphere-egu22-10551, 2022.
Please decide on your access
Please use the buttons below to download the presentation materials or to visit the external website where the presentation is linked. Regarding the external link, please note that Copernicus Meetings cannot accept any liability for the content and the website you will visit.
Forward to presentation link
You are going to open an external link to the presentation as indicated by the authors. Copernicus Meetings cannot accept any liability for the content and the website you will visit.
We are sorry, but presentations are only available for users who registered for the conference. Thank you.
EGU22-11249 | Presentations | AS4.4 | Highlight
AASCO – Arena for gap analysis of the existing Arctic science co-operationsHanna Lappalainen, Tuukka Petäjä, Timo Vihma, Alexander Baklanov, Sergey Chalov, Yubao Qiu, Huadong Guo, Nikolay Kasimov, Paul Berkman, Heikki Lihavainen, and Markku Kulmala
A deep understanding of the land - atmosphere - ocean feedbacks and interactions is required to make impact on the sustainable and just development of the Arctic region. The science based knowledge of the Arctic environments would lead to improved mitigation and adaptation plans, sustainable services for the Arctic communities and stakeholders and to well targeted policy actions. At the same time with the science approach we need a process of making policies acceptable and normative to the people living in the Artic. AASCO – “Arena gap analysis of the existing Arctic science co-operations” highlights key areas for the Arctic interactions – feedbacks research from the atmospheric, oceanic, cryospheric and social perspectives, and summarizes the potential improvements stemming from the holistic understanding of the Arctic climate system. Furthermore, AASCO aims to provide an outlook and benefits of the bridges between other international approaches like Pan-Eurasian Experiment (PEEX) Program, University of Arctic network (U-Arctic), The Global Atmosphere Watch (GAW) Programme of WMO, Sustainable Arctic Observation Network (SAON) e.g it’s strategy process called “ROADS” and the Digital Belt and Road (DBAR) program and, in general, of bridges between research and society impact.
How to cite: Lappalainen, H., Petäjä, T., Vihma, T., Baklanov, A., Chalov, S., Qiu, Y., Guo, H., Kasimov, N., Berkman, P., Lihavainen, H., and Kulmala, M.: AASCO – Arena for gap analysis of the existing Arctic science co-operations, EGU General Assembly 2022, Vienna, Austria, 23–27 May 2022, EGU22-11249, https://doi.org/10.5194/egusphere-egu22-11249, 2022.
Please decide on your access
Please use the buttons below to download the presentation materials or to visit the external website where the presentation is linked. Regarding the external link, please note that Copernicus Meetings cannot accept any liability for the content and the website you will visit.
Forward to presentation link
You are going to open an external link to the presentation as indicated by the authors. Copernicus Meetings cannot accept any liability for the content and the website you will visit.
We are sorry, but presentations are only available for users who registered for the conference. Thank you.
EGU22-12701 | Presentations | AS4.4 | Highlight
Application of New Approaches in Teaching Earth SciencesSergiy Stepanenko, Inna Khomenko, Oleg Shabliy, Valeria Ovcharuk, and Inna Semenova
In view of unprecedented negative changes threatening safe existence of the humankind and taking place in all parts of the Earth system, decisive and rapid measures are needed to reduce vulnerability, which had been manifested in the Sustainable Development Goals which are intended to be achieved by the year 2030.
Despite numerous efforts in the field of combating climate and environmental change on planet Earth, negative trends leading to degradation of the planet persist to grow, which can be explained by many reasons such as lack of awareness of the threat that the humankind faces in the business community and the society, lack of flexibility in the response of the countries’ economies to the challenges of the time, weak ties between science, education and the economy.
In order to eliminate the above-mentioned causes and provide for society's transition to sustainable development, it is necessary to lay the foundations for a new type of education that would make it possible to arrive at continuous education in the field of Earth Sciences based on the principles of environmental law and sustainable development, with interdisciplinary interaction and cooperation of science, education and economics taken account of. The training should use a variety of modern educational tools to reach the widest range of target groups and promote climate and environmental literacy in the society.
Since the existing education system is not able to respond in a timely manner to the new challenges of the time, introduction of a new type of education requires setting up a completely new educational structure - a center of excellence - which, due to a number of advantages, compared to traditional university structures, meets modern demands in the field of education and being a multi-level, dynamic and flexible system, could effeciently be adapted to the pressing needs of the time to provide the entire range of educational servicesm, long-term to short-term courses, up to micro-learning, for various target groups and is able to function under the conditions of dominant inter- and transdisciplinarity.
Under the new conditions that the world has been facing since 2020, in order to facilitate access to educational resources, development of networked on-line study programmes, with involvement of world-class experts in work on educational courses and mutual learning, which significantly expands dissemination and tools for societal impact, the center of excellence is to feature a virtual scientific-and-educational IT platform. The Center of Excellence is to play the role of a consultuncy board, which will provide for transfer of knowledge in a targeted manner, in the form that is the most agreeable for the end-user and therefore is the most attractive to entice a wide range of stakeholders.
Due to the unique geographical location, as well as the accumulated scientific and educational potential in the field of Earth Sciences, Odessa State Environmental University proposes setting up a Center of Excellence in the Field of Earth Sciences and offers cooperation to all interested parties.
How to cite: Stepanenko, S., Khomenko, I., Shabliy, O., Ovcharuk, V., and Semenova, I.: Application of New Approaches in Teaching Earth Sciences, EGU General Assembly 2022, Vienna, Austria, 23–27 May 2022, EGU22-12701, https://doi.org/10.5194/egusphere-egu22-12701, 2022.
Please decide on your access
Please use the buttons below to download the presentation materials or to visit the external website where the presentation is linked. Regarding the external link, please note that Copernicus Meetings cannot accept any liability for the content and the website you will visit.
Forward to presentation link
You are going to open an external link to the presentation as indicated by the authors. Copernicus Meetings cannot accept any liability for the content and the website you will visit.
We are sorry, but presentations are only available for users who registered for the conference. Thank you.

EGU22-12818 | Presentations | AS4.4
Numerical simulation of the Lagrangian transport of aerosols of various genesis in urban conditionsAlexander Varentsov, Victor Stepanenko, and Evgeny Mortikov
This work is devoted to the development of a numerical model of the transport of aerosol particles in the atmospheric boundary layer, as well as its application in idealized cases and studies with a realistic urban surface. Air quality and the distribution of pollutants is one of the major urban problems, and measurement methods can be limited in the complex geometry of the city, which motivates the development of modeling methods.
The model uses the Lagrangian approach to modeling, taking into account the size and mass of each particle, the possibility of aerosol deposition and their collision with various surfaces. The particle motion equation takes into account various parameters of the atmosphere: wind direction and speed, turbulent characteristics. The influence of turbulence on the motion of aerosols can be taken into account in the model using several parametrizations – stochastic Lagrangian models of zero and first order. It is possible to simulate a huge number of particles at the same time. The algorithm is implemented in the C++ programming language.
The model can be used as a separate tool that requires information about the state of the atmosphere as input data - these can be measurement data, results of hydrodynamic modeling, analytically given values. Numerous experiments have been carried out in this mode. The model was verified on exact analytical solutions for light and heavy particles, on the data of field measurements of the concentrations of dust and sand particles. Calculations were carried out in conditions of idealized geometry of buildings (urban canyons) and in conditions of real urban development. For this, input data from RANS and LES models were used.
The developed algorithm can also be used as a module connected to hydrodynamic models. In this mode, it is possible to use the input data on atmospheric parameters with the maximum resolution in time and space. By connecting to the LES model, high-resolution simulations of aerosol transport in realistic urban environments were performed.
The work is supported by Russian Ministry of Science and Higher Education, agreement No. 075-15-2021-574 (megagrant leaded by M.Kulmala in Moscow State University, WP4), No. 075-15-2019-1621, by RSF grant 21-17-00249, by RFBR grants 20-05-00776 and 19-05-50110.
How to cite: Varentsov, A., Stepanenko, V., and Mortikov, E.: Numerical simulation of the Lagrangian transport of aerosols of various genesis in urban conditions, EGU General Assembly 2022, Vienna, Austria, 23–27 May 2022, EGU22-12818, https://doi.org/10.5194/egusphere-egu22-12818, 2022.
Please decide on your access
Please use the buttons below to download the presentation materials or to visit the external website where the presentation is linked. Regarding the external link, please note that Copernicus Meetings cannot accept any liability for the content and the website you will visit.
Forward to presentation link
You are going to open an external link to the presentation as indicated by the authors. Copernicus Meetings cannot accept any liability for the content and the website you will visit.
We are sorry, but presentations are only available for users who registered for the conference. Thank you.
GI5 – Earth surface and subsurface methods of investigation
EGU22-5010 | Presentations | GI5.1
Science and technology in deep unerground laboratoriesAldo Ianni
Deep Underground Laboratories (DULs) are large research infrastructures with a minimum rock overburden equivalent to one km water equivalent. In DULs the flux of muons from cosmic rays is reduced by several order of magnitude with respect to the surface. This allows to perform research on very rare events, such as exotic radioactive decays, double beta decays, low energy neutrino and dark matter interactions. The phenomenon of neutrino oscillations has been discovered in DULs back in 1998. Solar neutrinos were first observed in a DUL in 1968. As of today thanks to research carried out in DULs over four decades we have studied in detail the energy production mechanisms in the sun’s core. In 1987 neutrinos from a core collapse supernova in the Large Magellanic Cloud were observed confirming our basic understanding of this high energetic event. DULs, at present, are equipped with more sensitive and better performing experiments to improve significantly these early studies. The large SuperKamiokande detector in Japan can observe as many as ten thousand events for a core collapse supernova at the center of our galaxy. The Borexino experiment in Italy has observed CNO neutrinos which contribute to only 1% of the energy production in the sun but are very important for more massive stars. All these crucial measurements could have not been possible without operating experiments in a deep underground site.
In the last decade the research horizon in DULs has expanded to include gravitational waves, geophysics, astrobiology, and biology in underground environments.
DULs are equipped with facilities to measure low levels of radioactivity by means of different techniques. This offers a unique opportunity to study living organism in a low radioactivity environment, namely with a significant reduction of cosmic rays and neutrons with respect to surface. DULs are being used by a large community of scientists ranging from astrophysicists, particle physicists, geophysicists, and biologists. There are 14 DULs in operation worldwide which correspond to about one million cubic meters excavated.
In the talk a brief review of DUL’s main features and research activities will be discussed.
How to cite: Ianni, A.: Science and technology in deep unerground laboratories, EGU General Assembly 2022, Vienna, Austria, 23–27 May 2022, EGU22-5010, https://doi.org/10.5194/egusphere-egu22-5010, 2022.
EGU22-6987 | Presentations | GI5.1
Underground workings as a most suitable place for the development of mining technologies - a case study from Polish copper minesKrzysztof Fulawka, Piotr Mertuszka, Witold Pytel, Marcin Szumny, and Lech Stolecki
The current EU policy emphasizes the necessity of the development of more safe and efficient mineral raw exploitation methods. The higher extraction rate and lowest possible environmental footprint of mining activities are the main goals of many international projects. Still, as recent experiences have shown it is challenging to develop new technologies in standard laboratory conditions. This is due to the inability to reproduce the environments present in most of the underground sites. Therefore post-mining underground workings seem to be the most suitable places for the development, validation and testing of new, more efficient mining technologies.
Such activities are continuously performed in KGHM Polish Copper mines, which are the test sites for numerous national and international research projects aimed at improving machinery, monitoring systems, mining methods and safety of work in underground conditions.
In the present research, the recent experiences of KGHM CUPRUM company in terms of the development of new mining technologies fitted to Polish underground copper mines have been presented.
How to cite: Fulawka, K., Mertuszka, P., Pytel, W., Szumny, M., and Stolecki, L.: Underground workings as a most suitable place for the development of mining technologies - a case study from Polish copper mines, EGU General Assembly 2022, Vienna, Austria, 23–27 May 2022, EGU22-6987, https://doi.org/10.5194/egusphere-egu22-6987, 2022.
Please decide on your access
Please use the buttons below to download the presentation materials or to visit the external website where the presentation is linked. Regarding the external link, please note that Copernicus Meetings cannot accept any liability for the content and the website you will visit.
Forward to presentation link
You are going to open an external link to the presentation as indicated by the authors. Copernicus Meetings cannot accept any liability for the content and the website you will visit.
We are sorry, but presentations are only available for users who registered for the conference. Thank you.

EGU22-8784 | Presentations | GI5.1
Empowering Underground Laboratories Network UsageEija-Riitta Niinikoski, Jari Joutsenvaara, Julia Puputti, Ossi Kotavaara, Marton Magyar, and Marko Holma
Underground laboratories provide unique environments for science, research and business, but many are not known or stay underutilised. Some of the underground laboratories are located or are planned to be built around the Baltic Sea region. In this work, the main outcomes of the EUL and the BSUIN projects will be presented.
The Baltic Sea Underground Innovation Network (BSUIN [1]) started in 2017 (ended in 12/2020), bringing together 13 (initially 14) partners with the common goal to help the underground laboratories to overcome the underutilisation and develop their practices, business models and marketing for attracting new users. The Empowering the Underground Laboratories Network Usage in the Baltic Sea Region (EUL, 1-12/2021 [2]) tested the developed tools and, with the feedback, helped the project partners to develop the tools further. The tools included the EUL Innovation platform (https://undergroundlabs.network/), the customer management relationship and marketing strategies, and social media coverages with various approaches to find the optimal practices for the platform and the actual laboratories.
The underground laboratories [3] participating in the BSUIN and EUL projects are:
- Callio Lab, located at a 1.4-km deep base metal mine in Pyhäjärvi, Finland,
- ÄSPÖ Hard Rock Laboratory, SKB´s final repository research site for spent nuclear fuel, Oskarshamn, Sweden,
- Ruskeala Underground Laboratory, located at the Ruskeala Mining Park, Sortavala, Russia,
- Educational and research mine Reiche Zeche, Freiberg, Germany,
- Underground Low Background Laboratory of the Khlopin Radium Institute, located at the heart of St. Petersburg, Russia, and
- The Conceptual Lab developed and coordinated by the KGHM Cuprum R&D centre, Poland.
The EUL and BSUIN projects are funded by the Interreg Baltic Sea Region Programme.
[1] J. Joutsenvaara, “BSUIN - Baltic Sea Underground Innovation Network,” EGUGA, p. 11212, 2020, Accessed: Jan. 11, 2022. [Online]. Available: https://ui.adsabs.harvard.edu/abs/2020EGUGA..2211212J/abstract.
[2] E.-R. Niinikoski, “Empowering Underground Laboratories Network Usage in the Baltic Sea Region,” in EGU General Assembly Conference Abstracts, 2021, pp. EGU21--14791.
[3] M. Ohlsson et al., “Six Underground Laboratories (ULs) Participating in the Baltic Sea Underground Innovation Network,” EGUGA, p. 22403, 2020, Accessed: Jan. 11, 2022. [Online]. Available: https://ui.adsabs.harvard.edu/abs/2020EGUGA..2222403O/abstract.
How to cite: Niinikoski, E.-R., Joutsenvaara, J., Puputti, J., Kotavaara, O., Magyar, M., and Holma, M.: Empowering Underground Laboratories Network Usage, EGU General Assembly 2022, Vienna, Austria, 23–27 May 2022, EGU22-8784, https://doi.org/10.5194/egusphere-egu22-8784, 2022.
Please decide on your access
Please use the buttons below to download the presentation materials or to visit the external website where the presentation is linked. Regarding the external link, please note that Copernicus Meetings cannot accept any liability for the content and the website you will visit.
Forward to presentation link
You are going to open an external link to the presentation as indicated by the authors. Copernicus Meetings cannot accept any liability for the content and the website you will visit.
We are sorry, but presentations are only available for users who registered for the conference. Thank you.
EGU22-11619 | Presentations | GI5.1
Sky-high opportunities deep underground – Callio Lab research centreJulia Puputti, Jari Joutsenvaara, Ossi Kotavaara, and Eija-Riitta Niinikoski
One of the northernmost deep underground laboratories (DULs) in Europe can be found at Callio Lab, operating at the Pyhäsalmi Mine in Finland. What began as purely an underground physics centre in the early 2000s has been expanded into an international, multi- and transdisciplinary research centre known as Callio Lab. Its activities are coordinated by the University of Oulu Kerttu Saalasti Institute (KSI). Callio Lab is a founding member of the European Underground Laboratories Association, a part of the DULIA network, and a part of the national FIN-EPOS research infrastructure network. [1].
With underground mining ending in spring 2022, Callio Lab is a key element of the repurposing activities conducted under the CALLIO - Mine for Business concept. CALLIO will continue activities at the mine-site until at least 2025 [2]. Owing to the unique environment and circumstances, Callio Lab research can be conducted underground at seven deep underground laboratories found at various depths, as well as above-ground [3].
Callio Lab has conducted and facilitated research in fields ranging from particle physics and geosciences to underground food production and remote sensing. The operating environment presents versatile opportunities also in the study of circular economy, muography, and space and planetary sciences. Notable projects at Callio Lab have included the international EIT RM funded MINETRAIN, Interreg Baltic Sea Region funded BSUIN, and H2020 funded GoldenEye projects [4-6].
The operating environment at Callio Lab is well-known due to characterisation activities conducted during previous projects, datasets acquired from decades of research, and an extensive microseismic monitoring network. Callio Lab has a logistically ideal location, and the DULs themselves can be accessed via the incline tunnel or elevator shaft. The existing infrastructure and facilities, in-depth understanding and application of underground risk management and conditions, and well-established operating methodology ensures Callio Lab the capacity to successfully operate and facilitate a wide range of activities. [1,3].
[1] Callio Lab, www.oulu.fi/en/callio-lab, 11 Jan 2022
[2] Mine for Business – Callio – Pyhäjärvi, Finland, www.callio.info, 1 Jan 2022
[3] Callio Lab – Underground Center for Science and R&D, www.calliolab.com, 11 Jan 2022
[4] MINETRAIN, www.minetrain.eu, 8 Jan 2021
[5] Baltic Sea Underground Innovation Network, www.bsuin.eu, 11 Jan 2022
[6] GoldenEye EU H2020 funded project, www.goldeneye-project.eu, 11 Jan 2022
How to cite: Puputti, J., Joutsenvaara, J., Kotavaara, O., and Niinikoski, E.-R.: Sky-high opportunities deep underground – Callio Lab research centre, EGU General Assembly 2022, Vienna, Austria, 23–27 May 2022, EGU22-11619, https://doi.org/10.5194/egusphere-egu22-11619, 2022.
Please decide on your access
Please use the buttons below to download the presentation materials or to visit the external website where the presentation is linked. Regarding the external link, please note that Copernicus Meetings cannot accept any liability for the content and the website you will visit.
Forward to presentation link
You are going to open an external link to the presentation as indicated by the authors. Copernicus Meetings cannot accept any liability for the content and the website you will visit.
We are sorry, but presentations are only available for users who registered for the conference. Thank you.
EGU22-795 | Presentations | GI5.3
Mapping of Agricultural Subsurface Drainage Systems Using Time and Frequency Domain Ground Penetrating RadarsTriven Koganti, Ellen Van De Vijver, Barry J. Allred, Mogens H. Greve, Jørgen Ringgaard, and Bo V. Iversen
Agricultural subsurface drainage systems are installed in naturally poorly drained soils and areas with a rising water table to drain the excess water, eradicate soil salinization issues and increase crop yields. Globally, some of the most productive regions are a result of these artificial drainage practices. The installation of drainage systems provides many agronomic, economic, and environmental benefits. However, inevitably, they act as shortened pathways for the transport of undesired substances (nutrients, pesticides, and pathogens) through the soil profile promoting their increased leaching and offsite release to the surface water bodies. This drainage water cause potential eutrophication risk to the aquatic ecosystem. For example, the hypoxic zone in the Gulf of Mexico and harmful algal blooms in Lake Erie can be linked to the nitrogen and phosphorus losses from the Midwest USA agricultural areas. Hence, the knowledge of the location of these installations is essential for hydrological modelling and to plan effective edge-of-field mitigation strategies such as constructed wetlands, saturated buffer zones, denitrifying bioreactors, and phosphate filters. Moreover, their location is also important either in order to initiate repairs or retrofit a new drainage system to the existing one. Nevertheless, subsurface drainage installations are often poorly documented and this information is inaccurate or unavailable, inducing the need for extensive mapping campaigns. The conventional methods for drainage mapping involve tile probing and trenching equipment. While the use of tile probes provide only localized and discrete measurements, employing trenching with heavy machinery can be exceedingly invasive and carry a risk of severing the drainage pipes necessitating costly repairs. Non-destructive soil and crop sensors might provide a rapid and effective alternative solution. Previous studies show ground penetrating radar (GPR) to be especially successful; owing to its superior resolution over other near-surface geophysical methods. In this study, we tested the use of a stepped-frequency continuous wave (SFCW) 3D-GPR (GeoScope Mk IV 3D-Radar with DXG1820 antenna array) at study sites in Denmark and a time-domain GPR (Noggin 250 MHz SmartCart) at study sites in the Midwest USA to map the buried drainage pipes. The 3D-GPR mounted in a motorized survey configuration and mobilized behind an all-terrain vehicle proved certainly advantageous to get full coverage of the farm field area and provided the flexibility of adjusting the frequency bandwidth depending on the desired resolution and penetration depth (PD). Two different approaches were tested to estimate the PD and comparisons were made with electrical conductivity data measured using an electromagnetic induction instrument. With the impulse GPR, data collected along limited parallel transects spaced a few meters apart, spiral and serpentine segments incorporated into random survey lines proved sufficient when used adjacently with unmanned aerial vehicle imagery. In general, a better success can be expected when the average soil electrical conductivity is less than 20 mS m-1 and it is a recommendation to perform the GPR surveys preferably in a direction perpendicular to the expected drain line orientation when the water table is at/below the drainage pipes’ depth.
How to cite: Koganti, T., Van De Vijver, E., J. Allred, B., H. Greve, M., Ringgaard, J., and V. Iversen, B.: Mapping of Agricultural Subsurface Drainage Systems Using Time and Frequency Domain Ground Penetrating Radars, EGU General Assembly 2022, Vienna, Austria, 23–27 May 2022, EGU22-795, https://doi.org/10.5194/egusphere-egu22-795, 2022.
Please decide on your access
Please use the buttons below to download the presentation materials or to visit the external website where the presentation is linked. Regarding the external link, please note that Copernicus Meetings cannot accept any liability for the content and the website you will visit.
Forward to presentation link
You are going to open an external link to the presentation as indicated by the authors. Copernicus Meetings cannot accept any liability for the content and the website you will visit.
We are sorry, but presentations are only available for users who registered for the conference. Thank you.

EGU22-948 | Presentations | GI5.3
Quad-polarimetric radar measurements autonomously obtained with an ice-rover at Ekström Ice Shelf, East AntarcticaM.Reza Ershadi, Reinhard Drews, Inka Koch, Jonathan Hawkins, Keith Nicholls, Joshua Elliott, Falk Oraschewski, Richard Hanten, Cornelia Schulz, Sepp Kipfstuhl, and Olaf Eisen
Acquisition of quad-polarimetric radar data on ice sheets gives insights about the ice-fabric variability with depth and consequently can deliver essential constraints on the spatially variable ice rheology. Polarimetric measurements are collected manually in most ground-based surveys, discretely sampling a limited profile range. Measurements are time-intensive and often do not cover critical areas such as shear zones where field safety is a concern. Autonomous rovers can provide an alternative that optimizes for time, sampling resolution and safety.
Here, we present an autonomous acquisition technique of quad-polarimetric radar data using a rover. This technique is based on a previous layout that has proven its capacity to navigate in various snow conditions but did not yet actively trigger the geophysical instruments attached. We upgraded the rover with a novel Robotic Operating System (ROS2) that interfaces simultaneously with a real-time positioning GPS and an automatic phase-sensitive radio-echo sounder (ApRES) with multiple transmitters multiple receivers. Like this, the rover can autonomously steer to pre-destined waypoints and then take static measurements at those locations also in areas where field safety might be compromised. We demonstrate this proof-of-concept on the Ekström Ice Shelf Antarctica, where we acquired densely spaced polarimetric radar data measurements. The rover’s operating system offers many opportunities for other measurement principles, e.g., densely spaced co-polarized data suitable for synthetic aperture radar (SAR) processing.
How to cite: Ershadi, M. R., Drews, R., Koch, I., Hawkins, J., Nicholls, K., Elliott, J., Oraschewski, F., Hanten, R., Schulz, C., Kipfstuhl, S., and Eisen, O.: Quad-polarimetric radar measurements autonomously obtained with an ice-rover at Ekström Ice Shelf, East Antarctica, EGU General Assembly 2022, Vienna, Austria, 23–27 May 2022, EGU22-948, https://doi.org/10.5194/egusphere-egu22-948, 2022.
EGU22-1144 | Presentations | GI5.3
Ground Penetrating Radar survey at the archaeological site of Qubbet El-Hawa, Aswan, EgyptJosé A. Peláez, Juan L. Soler, Rashad Sawires, Alejandro Jiménez, and José M. Alba
The necropolis of Qubbet el-Hawa is located in West-Aswan, Upper Egypt. It looks like a huge dune covering the massive Nubian Sandstone Group, hosting one of the most densely occupied cemeteries of Ancient Egypt, dating back to c. 2500 B.C. to the Roman Period. Here we present the used methodology and the conducted ground-penetrating radar (GPR) survey accomplished in the Qubbet El-Hawa site.
Three different geological formations have been differentiated in the studied area. From bottom to top, the Abu Agag, the Timsah and the Um Barmil formations, which mainly belong to the Nubian Sandstone Group. The conducted GPR survey was accomplished in the Timsah Formation, the most heterogeneous formation of all of them, in which along its outcrops can be observed several stratigraphic discontinuities, being usually the alternation of lutite (mainly claystone), sandstone, and iron oxides, arranged in alternating layers varied in thickness from 5 to 10 cm, and from 30 to 50 cm thick blocks.
The studied area, 20 m width × 45 m length, showing a near-constant slope of about 35°, was surveyed using 250 and 500 MHz shielded antennas in a dense array pattern. Although dry eolian sand and sandstone rocks do not display a clear difference in their electromagnetic characteristics, the conducted survey was able to discriminate/define the interface among the underlying sandstone and the sand cover. This good behavior could be attributed to the different overlapping layers including ferruginous sediments and claystone. This was possible even when the studied area exhibits a steep slope, as well as many loose rocks in some parts, coming from the outcrops, that made the measurement difficult to carry out in some cases.
The interface among the underlying sandstone formation and the sand cover is acceptably resolved, providing some very useful data to archaeologists about the near-surface shape of the bedrock and their possible willingness to host some graves.
How to cite: Peláez, J. A., Soler, J. L., Sawires, R., Jiménez, A., and Alba, J. M.: Ground Penetrating Radar survey at the archaeological site of Qubbet El-Hawa, Aswan, Egypt, EGU General Assembly 2022, Vienna, Austria, 23–27 May 2022, EGU22-1144, https://doi.org/10.5194/egusphere-egu22-1144, 2022.
EGU22-1785 | Presentations | GI5.3
Ground Penetrating Radar and passive seismic investigation at the villa of Madonna dell’Alto in Campi Salentina (Lecce, Italy)Emanuele Colica, Sebastiano D'Amico, Giorgio Rizzo, and Raffaele Persico
We will present the results of Ground Penetrating Radar ([1-3] and passive seismic [4] prospections performed in the villa of Madonna dell’Alto in Campi Salentina (in the outskirts of Lecce, southern Italy). The structure dates back to the nineteen’s century. The villa presents a peculiar structure having a central room of a hexagonal shape surrounded by several other small rooms. GPR prospecting has been performed in a central hexagonal room acquiring data on an orthogonal grid having a spacing of 25 cm. The GPR system used was a Ris Hi-Mode manufactured by IDSGeoradar s.r.l. and equipped with a dual antenna at central frequency 200 and 600 MHz. A classical processing composed of zero timing, background removal, gain vs. depth. 1D filtering, Kirchhoff migration and depth slicing was applied on the data. The propagation velocity exploited for the migration algorithm was c=12 cm/ns. In this area, from the slices, we have noted an apparent target at the time depth of 390 cm. However, a comparison with the Bscans revealed that it is most probably due to the effects of the walls and the ceiling of the room where the measurements were taken. Single GPR lines were also taken in the other rooms of the villa where some potential anomalies have been identified. However, another campaign is planned in order to extend the data collection and interpretation.
Furthermore, within the Villa a set of seismic passive measurements have been taken by the means of a portable seismograph. The data where acquired both inside the structure in correspondence of the GPR investigation as well as on top of the structure. Data were processed by applying the H/V and the H/H [4] techniques.
Acknowledgements
This study was supported by a STSM Grant from COST Action SAGA: The Soil Science & Archaeo-Geophysics Alliance - CA17131 (www.saga-cost.eu), supported by COST (European Cooperation in Science and Technology www.cost.eu). We are also grateful to the Institute for the Electromagnetic Sensing of the Environment IREA-CNR, which put at our disposal the system with which the GPR measurements were taken.
References
[1] G. Gennarelli, I. Catapano, F. Soldovieri, R. Persico, On the Achievable Imaging Performance in Full 3-D Linear Inverse Scattering, IEEE Trans. on Antennas and Propagation, vol. 63, n. 3, pp. 1150-1155, March 2015.
[2] F. Gabellone, G. Leucci, N. Masini, R. Persico, G. Quarta, F. Grasso, “Nondestructive Prospecting and virtual reconstruction of the chapel of the Holy Spirit in Lecce, Italy”, Near Surface Geophysics, vol. 11, n. 2, pp. 231-238, April 2013.
[3] E. Colica, A. Antonazzo, R. Auriemma, L. Coluccia, I. Catapano, G. Ludeno, S. d’Amico, R. Persico, GPR investigation at the archaeological site of Le Cesine, Lecce, Italy, Information Science Vol. 12 n. 10, 412, https://doi.org/10.3390/info12100412, 2021.
[4] Panzera F., D'Amico S., Lombardo G., Longo E., 2016. Evaluation of building fundamental periods and effects of local geology on ground motion parameters in the Siracusa area, Italy. Journal of Seismology, 20, 1001-1019, doi:10.1007/s10950-016-9577-5
How to cite: Colica, E., D'Amico, S., Rizzo, G., and Persico, R.: Ground Penetrating Radar and passive seismic investigation at the villa of Madonna dell’Alto in Campi Salentina (Lecce, Italy), EGU General Assembly 2022, Vienna, Austria, 23–27 May 2022, EGU22-1785, https://doi.org/10.5194/egusphere-egu22-1785, 2022.
EGU22-2481 | Presentations | GI5.3
New integrated GPR surveys, using different frequencies, with direct archaeological excavations to locate chamber tombs in Monte Abatone necropolis, Cerveteri (Italy).Salvatore Piro and Daniele Verrecchia
The Monte Abatone Project, jointly developed between the Campania University “Luigi Vanvitelli” (Caserta) Prof. F. Gilotta, the Tuscia University (Viterbo) Prof. M. Micozzi and A. Coen, the Bonn University, Prof. M. Bentz and ISPC (CNR) is based on the development of an integrated research employing different methodologies to reconstruct the limits of the necropolis and the location of all different tombs. This necropolis is one of the main important necropolis of Cerveteri, located 60 km north of Rome (Latium, Italy). In the period 1950-1960, several tombs have been discovered and excavated, though still many remain hidden underneath the subsurface. In the period between 2018 - 2021, geophysical surveys have been carried out to investigate the unexplored portions of the ancient Etruscan Necropolis, to provide a complete mapping of the position of the tombs. Ground Penetrating Radar and the Magnetometric methods have been systematically employed to investigate about twelve hectares of the necropolis. GPR system SIR 3000 (GSSI), equipped with a 400 MHz antenna with constant offset, SIR4000 (GSSI) equipped with a dual frequency antenna with 300/800 MHz and the 3D Radar Geoscope multichannel stepped frequency system were employed to survey the selected areas where the presence of tombs was hypothesized from previous archaeological studies.
All the GPR profiles were processed with GPR-SLICE v7.0 Ground Penetrating Radar Imaging Software (Goodman 2020). The basic radargram signal processing steps included: post processing pulse regaining; DC drift removal; data resampling; band pass filtering; background filter and migration. With the aim of obtaining a planimetric vision of all possible anomalous bodies, the time-slice representation was calculated using all processed profiles showing anomalous sources up to a depth of about 2.5 m. The obtained results clearly show the presence of a network of strong circular or rectangular features, linked with the buried structural elements of the searched chamber or pit tombs. Together with archaeologists, these anomalies have been interpreted to have a good matching with the expected searched tombs. The obtained results have enhanced the knowledge of the necropolis layout and mapping. After the geophysical surveys, direct excavations have been conducted, which brought to light few of the investigated structures. The obtained results, after the excavation, have been compared and integrated with the geophysical maps to define the keys for the interpretation.
References
Campana S., Piro S., 2009. Seeing the Unseen. Geophysics and Landscape Archaeology. Campana & Piro Editors. CRC Press, Taylor & Francis Group. Oxon UK, ISBN 978-0-415-44721-8.
Goodman, D., Piro, S., 2013. GPR Remote sensing in Archaeology, Springer: Berlin.
Piro S., Papale E., Zamuner D., Kuculdemirci M., 2018. Multimethodological approach to investigate urban and suburban archaeological sites. In “Innovation in Near Surface Geophysics. Instrumentation, application and data processing methods.”, Persico R., Piro S., Linford N., Ed.s. pp. 461 – 504, ISBN: 978-0-12-812429-1, pp.1-505, Elsevier.
How to cite: Piro, S. and Verrecchia, D.: New integrated GPR surveys, using different frequencies, with direct archaeological excavations to locate chamber tombs in Monte Abatone necropolis, Cerveteri (Italy)., EGU General Assembly 2022, Vienna, Austria, 23–27 May 2022, EGU22-2481, https://doi.org/10.5194/egusphere-egu22-2481, 2022.
EGU22-2509 | Presentations | GI5.3
An innovative processing applied to GPR data gathered in the archaeological site of Le Cesine, Lecce, ItalyIlaria Catapano, Giovanni Ludeno, Emanuele Colica, Sebastiano D’Amico, Antonella Antonazzo, Rita Auriemma, Luigi Coluccia, and Raffaele Persico
This contribution deals with a GPR prospecting performed in the archaeological site of Le Cesine, Lecce, Southern Italy [1]. The measurement campaign was performed in the framework of a short-term scientific mission (STSM) funded by the European Cost Action 17131 (acronym SAGA), and aimed to map the subsoil of three wide areas in order to address and rationalize future archaeological excavations. As an innovative aspect, beyond a traditional data processing [2], each one of the collected B-scans was processed by means of an innovative data processing, which is based on an inverse scattering algorithm [3-4] accompanied by a shifting zoom procedure [5]. This latter makes possible a computationally effective microwave imaging of electrically large spatial domains and imitates, in a suitable way, the truncation applied on the migration integral, theoretically extended on an infinite observation line but practically necessarily limited to a finite line. For each investigated area, the B-scans, as elaborated by means of the innovative data processing procedure, were combined in order to obtain a depth slice visualization of the investigated areas. As it will be shown at the conference, the obtained images revealed the presence of buried ruins, maybe ascribable to structures related to an ancient Roman harbour. These results motivated founding request for archaeological excavations, which hopefully will be possible to execute in the next few years, and will confirm or correct the hypotheses suggested by the GPR survey as enhanced by the innovative data processing.
Acknowledgements
This study was supported by a STSM Grant from COST Action SAGA: The Soil Science & Archaeo-Geophysics Alliance - CA17131 (www.saga-cost.eu), supported by COST (European Cooperation in Science and Technology www.cost.eu).
References
[1] E. Colica, A. Antonazzo, R. Auriemma, L. Coluccia, I. Catapano, G. Ludeno, S. d’Amico, R. Persico, GPR investigation at the archaeological site of Le Cesine, Lecce, Italy, Information Science Vol. 12 n. 10, 412, https://doi.org/10.3390/info12100412, 2021.
[2] F. Gabellone, G. Leucci, N. Masini, R. Persico, G. Quarta, F. Grasso, “Nondestructive Prospecting and virtual reconstruction of the chapel of the Holy Spirit in Lecce, Italy”, Near Surface Geophysics, vol. 11, n. 2, pp. 231-238, April 2013.
[3] I. Catapano, G. Gennarelli, G. Ludeno and F. Soldovieri, "Applying Ground-Penetrating Radar and Microwave Tomography Data Processing in Cultural Heritage: State of the Art and Future Trends," in IEEE Signal Processing Magazine, vol. 36, no. 4, pp. 53-61, July 2019,.
[4] G. Gennarelli, I. Catapano, F. Soldovieri, R. Persico, On the Achievable Imaging Performance in Full 3-D Linear Inverse Scattering, IEEE Trans. on Antennas and Propagation, vol. 63, n. 3, pp. 1150-1155, March 2015.
[5] R. Persico, G. Ludeno, F. Soldovieri, A. De Coster, S. Lambot, 2D linear inversion of GPR data with a shifting zoom along the observation line, Remote Sensing, 9, 980; doi: 10.3390/rs9100980, open access, 2017.
How to cite: Catapano, I., Ludeno, G., Colica, E., D’Amico, S., Antonazzo, A., Auriemma, R., Coluccia, L., and Persico, R.: An innovative processing applied to GPR data gathered in the archaeological site of Le Cesine, Lecce, Italy, EGU General Assembly 2022, Vienna, Austria, 23–27 May 2022, EGU22-2509, https://doi.org/10.5194/egusphere-egu22-2509, 2022.
EGU22-3152 | Presentations | GI5.3
GPR prospecting in the archaeological site of Cavallino, Lecce, ItalyRaffaele Persico, Grazia Semeraro, Corrado Notario, and Ilaria Catapano
In this abstract we propose the results of GPR measurements [1-2] performed in a site of cultural interest. In particular, the measurements were performed in a rectangular area inside the Messapic archaeological ancient settlement of Cavallino, close to Lecce (southern Italy) with a RIS-Hi model GPR system manufactured by IDSGeoradar s.r.l. and belonging to the Institute for the Electromagnetic Sensing of the Environment IREA-CNR. The data processing was performed according to a classical sequence of steps provided by zero timing, background removal, gain vs. depth, 1D filtering and time domain migration [3]. Afterwards, slicing was performed too and the results were georeferenced in QGIS thanks to the coordinatives of the four vertex of the rectangular area. The results indicate that there are some possible Messapic remains in the investigated area and suggest somehow the most promising point for a future localized excavation. Future development will regard further processing of the data with an inverse scattering [4] algorithm accompanied with a shifting zoom procedure, that will make it possible to apply the inverse scattering approach to an electrically large domain [5].
Acknowledgments
This work is supported by the project AMOR – Advanced Multimedia and Observation services for
the Rome cultural heritage ecosystem, financed within the call ESA 5G for L’ART (Business Applications programme).
References
[1] F. Gabellone, G. Leucci, N. Masini, R. Persico, G. Quarta, F. Grasso, “Nondestructive Prospecting and virtual reconstruction of the chapel of the Holy Spirit in Lecce, Italy”, Near Surface Geophysics, vol. 11, n. 2, pp. 231-238, April 2013.
[2] R. Persico, S. D'Amico, L. Matera, E. Colica, C. De, Giorgio, A. Alescio, C. Sammut and P. Galea, GPR Investigations at St John's Co‐Cathedral in Valletta. Near Surface Geophysics, vol. 17 n. 3, pp. 213-229. doi:10.1002/nsg.12046, 2019.
[3] G. Gennarelli, I. Catapano, F. Soldovieri, R. Persico, On the Achievable Imaging Performance in Full 3-D Linear Inverse Scattering, IEEE Trans. on Antennas and Propagation, vol. 63, n. 3, pp. 1150-1155, March 2015.
[4] I. Catapano, G. Gennarelli, G. Ludeno and F. Soldovieri, "Applying Ground-Penetrating Radar and Microwave Tomography Data Processing in Cultural Heritage: State of the Art and Future Trends," in IEEE Signal Processing Magazine, vol. 36, no. 4, pp. 53-61, July 2019,.
[5] R. Persico, G. Ludeno, F. Soldovieri, A. De Coster, S. Lambot, 2D linear inversion of GPR data with a shifting zoom along the observation line, Remote Sensing, 9, 980; doi: 10.3390/rs9100980, open access, 2017.
How to cite: Persico, R., Semeraro, G., Notario, C., and Catapano, I.: GPR prospecting in the archaeological site of Cavallino, Lecce, Italy, EGU General Assembly 2022, Vienna, Austria, 23–27 May 2022, EGU22-3152, https://doi.org/10.5194/egusphere-egu22-3152, 2022.
EGU22-5163 | Presentations | GI5.3
Deep Learning Strategies for Target Classification via Tomographic Ground Penetrating RadarMichele Ambrosanio, Stefano Franceschini, Maria Maddalena Autorino, and Vito Pascazio
Subsurface and underground exploration and monitoring are of interest for several applications which span from geoscience and archaeology to security and safety areas [1, 2]. In the framework of non-destructive testing, ground penetrating radar (GPR) represents a valuable technology that has been extensively exploited for the detection and characterization of buried objects. Nevertheless, this remote sensing modality has some limitations related to the generated output, since these images of the underground require an expert user for their interpretation. Moreover, identifying and characterizing buried objects still represent a non-trivial task [3].
To this aim, several algorithms have been developed to face the aforementioned issues efficiently and automatically. In this context, approaches based on deep learning and convolutional neural networks (CNNs) have been proposed in the past years and recently gained a lot of attention by the scientific community [4]. Despite their efficiency, these approaches require many cases to perform the training step and improve their classification performance.
In this abstract, the case of a multistatic GPR system is considered via two-dimensional numerical simulations to classify the kind of underground utility automatically in areas in which both water and natural gas pipes can be located. More in detail, some discussions on the classification performance by adopting different topologies and network architectures will be dealt with.
[1] Persico, R., 2014. Introduction to ground penetrating radar: inverse scattering and data processing. John Wiley & Sons.
[2] Catapano, I., Gennarelli, G., Ludeno, G. and Soldovieri, F., 2019. Applying ground-penetrating radar and microwave tomography data processing in cultural heritage: State of the art and future trends. IEEE Signal Processing Magazine, 36(4), pp.53-61.
[3] Ambrosanio, M., Bevacqua, M.T., Isernia, T. and Pascazio, V., 2020. Performance Analysis of Tomographic Methods Against Experimental Contactless Multistatic Ground Penetrating Radar. IEEE Journal of Selected Topics in Applied Earth Observations and Remote Sensing, 14, pp.1171-1183.
[4] Kim, N., Kim, S., An, Y.K. and Lee, J.J., 2019. Triplanar imaging of 3-D GPR data for deep-learning-based underground object detection. IEEE Journal of Selected Topics in Applied Earth Observations and Remote Sensing, 12(11), pp.4446-4456.
How to cite: Ambrosanio, M., Franceschini, S., Autorino, M. M., and Pascazio, V.: Deep Learning Strategies for Target Classification via Tomographic Ground Penetrating Radar, EGU General Assembly 2022, Vienna, Austria, 23–27 May 2022, EGU22-5163, https://doi.org/10.5194/egusphere-egu22-5163, 2022.
EGU22-5568 | Presentations | GI5.3
Multi-illumination and multi-view GPR measurements for Through-the-Wall radar imagingCristina Ponti, Andrea Randazzo, Alessandro Fedeli, Matteo Pastorino, and Giuseppe Schettini
The use of Ground Penetrating Radar (GPR) as a non-destructive technique for the localization and imaging of buried targets is nowadays widely used in the fields of civil engineering, archeology, and geology. In traditional GPR applications, the transmitting antenna is placed in air, whereas targets are embedded in a background of different permittivity, which may be given by a soil or a construction material. However, the GPR architecture can be also applied to the case of targets located in air but hidden from the illumination field radiated by the transmitting antenna by a dielectric discontinuity, as in the case of the Through-the-Wall (TW) radar applications, where targets inside a building interior must be localized and imaged [1]. In this work, a commercial GPR equipment is employed to perform an experimental campaign on a TW scene, where two targets of different reflectivity, i.e., a metallic cylinder and a wooden bar, are located behind a masonry wall in a laboratory environment. To increase the information on the scattered fields, the scanning of the transmitting and receiving antennas is performed in a fully multi-bistatic manner, through a multi-view and multi-illumination mode, along a horizontal line parallel to the wall, and keeping the antennas in direct contact with it. The transmitting antenna is a transducer emitting a pulsed signal, with frequency centered at 1 GHz. The imaging of the buried targets has been performed through a novel two-step inverse-scattering technique, that is based on a regularization scheme developed in the framework of variable exponent Lebesgue spaces [2], [3]. In particular, the norm exponent function is directly built from the available data through an initial processing of the data, based on a beamforming approach or on a truncated singular value decomposition (TSVD) technique [4]. The whole frequency spectrum of the measured data is exploited, as the scattered field from the pulsed signals is extracted on a set of frequencies through a Fast Fourier Transform. The proposed approach, applied to the measured data, shows good reconstruction capabilities and a reduction of artifacts.
[1] M. G. Amin, Ed., Through-the-Wall Radar Imaging. Boca Raton, FL: CRC Press, 2011.
[2] C. Estatico, A. Fedeli, M. Pastorino, and A. Randazzo, ‘Quantitative microwave imaging method in Lebesgue spaces with nonconstant exponents’, IEEE Trans. Antennas Propag., vol. 66, no. 12, pp. 7282–7294, Dec. 2018.
[3] A. Randazzo, C. Ponti A. Fedeli, C. Estatico, P. D’Atanasio, M. Pastorino, G. Schettini, ‘A two-step inverse-scattering technique in variable-exponent Lebesgue spaces for through-the-wall microwave imaging: Experimental results’, IEEE Trans. Geosci. Remote Sens., vol. 59, no. 9, pp. 7189–7200, Sep. 2021.
[4] A. Randazzo, C. Ponti, A. Fedeli, C. Estatico, P. D’Atanasio, M. Pastorino, G. Schettini, ‘A Through-the-Wall Imaging Approach Based on a TSVD/Variable-Exponent Lebesgue-Space Method’, Remote Sens., vol. 13, 17 pp., 2021.
How to cite: Ponti, C., Randazzo, A., Fedeli, A., Pastorino, M., and Schettini, G.: Multi-illumination and multi-view GPR measurements for Through-the-Wall radar imaging, EGU General Assembly 2022, Vienna, Austria, 23–27 May 2022, EGU22-5568, https://doi.org/10.5194/egusphere-egu22-5568, 2022.
EGU22-5813 | Presentations | GI5.3
From Multiresolution to the System-by-Design based GPR ImagingFrancesco Zardi, Lorenzo Poli, and Andrea Massa
Ground Penetrating Radar (GPR) is a technology of high interest due to its many applications [1], requiring to process the collected data to retrieve the shape and/or electromagnetic (EM) characteristics of the imaged objects. Such a task can be formulated as an Inverse Scattering Problem (ISP), whose solution poses paramount challenges due to the ill-posedness and non-linearity [1]. Therefore, "smart" solution approaches must be developed capable of fully exploiting the available/acquired information to achieve satisfying reconstructions with limited computational resources. In this framework, the development of innovative GPR imaging methodologies is an active research area of the ELEDIA Research Center at the University of Trento, Italy. GPR microwave imaging strategies based on the Multiresolution (MR) paradigm demonstrated significant improvements in terms of reconstruction accuracy and inversion time [2]-[5]. The strength of the MR framework stems from balancing the number of unknowns with the amount of available data, reducing the non-linearity of the ISP. Moreover, it allows a straightforward exploitation of the "progressively-acquired" information on the imaged domain, resulting in a mitigation of the ill-posedness. Effective MR strategies have been recently proposed based on the exploitation of stochastic optimization algorithms [4] to mitigate the risk of false solutions. Recently, an MR-based solution strategy has been proposed that exploits an Inexact Newton method developed in Lp spaces to achieve better regularization of the subsurface ISP thanks to the joint processing of multiple spectral components of GPR data [5]. Another solution paradigm significantly improving the performance of GPR data inversion is the System-by-Design (SbD) [6][7]. The SbD, defined as "a framework to deal with complexity" in EM problems [6] leverages on the recent advancements in the area of Learning-by-Examples techniques and it allows a proper reformulation of the ISP enabling the "smart" reduction of its unknowns and the definition of a fast surrogate model to markedly reduce the computational burden of multi-agent evolutionary-inspired optimization tools [6][7].
References
[1] R. Persico, Introduction to Ground Penetrating Radar: Inverse Scattering and Data Processing. Hoboken, New Jersey: Wiley, 2014.
[2] M. Salucci et al. “GPR prospecting through an inverse-scattering frequency-hopping multifocusing approach,” IEEE Trans. Geosci. Remote Sens., vol. 53, no. 12, pp. 6573-6592, Dec. 2015.
[3] M. Salucci et al., “Advanced multi-frequency GPR data processing for non-linear deterministic imaging,” Signal Process., vol. 132, pp. 306–318, Mar. 2017.
[4] M. Salucci et al., “Multifrequency particle swarm optimization for enhanced multiresolution GPR microwave imaging,” IEEE Trans. Geosci. Remote Sens., vol. 55, no. 3, pp. 1305-1317, Mar. 2017.
[5] M. Salucci et al., “2-D TM GPR imaging through a multiscaling multifrequency approach in Lp spaces,” IEEE Trans. Geosci. Remote Sens., vol. 59, no. 12, pp. 10011-10021, Dec. 2021.
[6] A. Massa and M. Salucci, “On the design of complex EM devices and systems through the System-by-Design paradigm - A framework for dealing with the computational complexity,” IEEE Trans. Antennas Propag., in press (DOI: 10.1109/TAP.2021.3111417).
[7] M. Salucci et al., "Learned global optimization for inverse scattering problems - Matching global search with computational efficiency," IEEE Trans. Antennas Propag., in press (DOI: 10.1109/TAP.2021.3139627).
How to cite: Zardi, F., Poli, L., and Massa, A.: From Multiresolution to the System-by-Design based GPR Imaging, EGU General Assembly 2022, Vienna, Austria, 23–27 May 2022, EGU22-5813, https://doi.org/10.5194/egusphere-egu22-5813, 2022.
EGU22-7170 | Presentations | GI5.3
Reconstruction of GPR data using multiple-point geostatisticsJames Irving, Chongmin Zhang, Mathieu Gravey, and Grégoire Mariéthoz
A common challenge in the processing and analysis of ground-penetrating radar (GPR) reflection data is the reconstruction of missing traces. Gap filling, for example, may be required where data could not be recorded in the field in order to reduce artifacts produced during migration. Similarly, proper visualization and imaging of a GPR profile requires an even trace spacing, meaning that trace regularization is typically needed when the data are acquired in continuous mode using a fixed trace acquisition rate. Lastly, we may wish to increase the spatial resolution of a GPR dataset through trace densification, whereby new traces are reconstructed between existing ones, in order to improve data interpretability.
A number of methods have been proposed for the reconstruction of missing GPR data over the past few decades, which vary in their degree of complexity and underlying assumptions. Simple strategies such as linear, cubic, and sinc interpolation can be highly effective, but only in the absence of spatial aliasing. When aliasing is present, other methods that exploit the predictability and/or sparseness of the GPR data, commonly in a transformed domain, may be utilized. However, such methods often involve overly simplistic assumptions about the data structure (e.g., that windowed portions of data can be described by sum of plane waves), which can lead to unrealistic and linear results as gaps in the data become large. Finally, all current reconstruction approaches lead to a single "best" estimate of the missing traces based on the existing measurements and some explicit or implicit choice of prior information, with no consideration of the corresponding uncertainty.
Here, we attempt to address these shortcomings by considering a GPR data reconstruction strategy based on the QuickSampling (QS) multiple-point geostatistical method. With this approach, GPR traces are simulated via sequential conditional simulation based on patterns that are observed in nearby high-resolution data (training images). To demonstrate the potential of this approach, we show its successful application to a variety of examples involving gap filling, regularization, and trace densification.
How to cite: Irving, J., Zhang, C., Gravey, M., and Mariéthoz, G.: Reconstruction of GPR data using multiple-point geostatistics, EGU General Assembly 2022, Vienna, Austria, 23–27 May 2022, EGU22-7170, https://doi.org/10.5194/egusphere-egu22-7170, 2022.
EGU22-8022 | Presentations | GI5.3
Qualitative-enhanced full-waveform inversion of ground penetrating radar dataAlessandro Fedeli, Valentina Schenone, Matteo Pastorino, and Andrea Randazzo
Ground penetrating radar (GPR) prospection of underground scenarios is proven useful in numerous fields, from geophysics to structural engineering. At present, most of the typically deployed approaches make use of qualitative processing of GPR data [1]. Nevertheless, despite their increased complexity, full-waveform inversion (FWI) methods are emerging as a key tool to provide a complete characterization of the buried region under test [2].
This contribution aims at presenting an innovative qualitative-enhanced FWI strategy that combines the benefits from these different classes of GPR processing methods. In more detail, on the one hand a synthetic aperture-based technique retrieves a first qualitative map of the buried structures. On the other hand, the dielectric properties of buried targets are found by an FWI approach formulated in the unconventional context of nonconstant-exponents Lebesgue spaces [3]. The FWI procedure exploits the qualitative map for guiding the unknown update, as well as for constructing the nonconstant-exponent function. Both numerical and experimental results are discussed to assess the proposed inversion procedure.
[1] R. Persico, Introduction to Ground Penetrating Radar: Inverse Scattering and Data Processing. Hoboken, New Jersey: Wiley, 2014.
[2] M. Pastorino and A. Randazzo, Microwave Imaging Methods and Applications. Boston, MA: Artech House, 2018.
[3] V. Schenone, A. Fedeli, C. Estatico, M. Pastorino, and A. Randazzo, “Experimental Assessment of a Novel Hybrid Scheme for Quantitative GPR Imaging,” IEEE Geoscience and Remote Sensing Letters, vol. 19, pp. 1–5, 2022.
How to cite: Fedeli, A., Schenone, V., Pastorino, M., and Randazzo, A.: Qualitative-enhanced full-waveform inversion of ground penetrating radar data, EGU General Assembly 2022, Vienna, Austria, 23–27 May 2022, EGU22-8022, https://doi.org/10.5194/egusphere-egu22-8022, 2022.
EGU22-13149 | Presentations | GI5.3
GPR Prospecting Close to a Roman Amphitheatre in an Urban EnvironmentRaffaele Persico and Giuseppe Muci
In the present contribution we will present the results of a GPR [1-3] measurement campaign performed in St. Oronzo Square, Lecce, Italy, aimed to investigate and monitor the status of the Roman amphitheatre present in the square. The “ambulacra” of this amphitheatre in particular are currently buried under the square and only partially accessible. Also, further part of the amphitheatre are still buried, and cannot be excavated because of the presence of posterior structures, in some cases of historical relevance in their turn. The georeferencing of the results has been achieved in QGIS. Indeed, no GPS was available when the measurements were performed. However, the shape of the prospected areas, wedged in the ways around the amphitheatre has allowed a correct georeferencing. A home-made MATLAB code has helped to this pros.
References
[1] R. Persico, S. D'Amico, L. Matera, E. Colica, C. De, Giorgio, A. Alescio, C. Sammut and P. Galea, GPR Investigations at St John's Co-Cathedral in Valletta, Near Surface Geophysics 17, 3, 2019, pp. 213-229. doi: 10.1002/nsg.12046.
[2] E. Colica, A, Antonazzo, R. Auriemma, L. Coluccia, I. Catapano, G. Ludeno, S. D’Amico, R. Persico, GPR Investigation at the Archaeological Site of Le Cesine, Lecce, Italy, Information 2021, 12, 412, https://doi.org/10.3390/info12100412
[3] G. Gennarelli, I. Catapano, F. Soldovieri, R. Persico, On the Achievable Imaging Performance in Full 3-D Linear Inverse Scattering, IEEE Trans. on Antennas and Propagation, 63, 3, March 2015, pp. 1150-1155.
How to cite: Persico, R. and Muci, G.: GPR Prospecting Close to a Roman Amphitheatre in an Urban Environment, EGU General Assembly 2022, Vienna, Austria, 23–27 May 2022, EGU22-13149, https://doi.org/10.5194/egusphere-egu22-13149, 2022.
EGU22-1091 | Presentations | GI5.4
Differentiable Model for Muon Transport and Two-Phase Flow in Porous Media with applications to Subsurface Pollution MonitoringRoland Grinis, Vladimir Palmin, Danila Riazanov, and Slava Kovalev
How to cite: Grinis, R., Palmin, V., Riazanov, D., and Kovalev, S.: Differentiable Model for Muon Transport and Two-Phase Flow in Porous Media with applications to Subsurface Pollution Monitoring, EGU General Assembly 2022, Vienna, Austria, 23–27 May 2022, EGU22-1091, https://doi.org/10.5194/egusphere-egu22-1091, 2022.
Please decide on your access
Please use the buttons below to download the presentation materials or to visit the external website where the presentation is linked. Regarding the external link, please note that Copernicus Meetings cannot accept any liability for the content and the website you will visit.
Forward to presentation link
You are going to open an external link to the presentation as indicated by the authors. Copernicus Meetings cannot accept any liability for the content and the website you will visit.
We are sorry, but presentations are only available for users who registered for the conference. Thank you.
EGU22-2168 | Presentations | GI5.4 | Highlight
Muography as a novel complementary technique for geotechnical surveysLászló Oláh, Hiroyuki K. M. Tanaka, Gergő Hamar, Shinichi Miyamoto, Yukihiko Sakatani, Toshio Mori, and Kenji Sumiya
Muography is an imaging technique that can utilize cosmic-ray muons for remote and non destructive exploration of large-sized natural and human-made structures [1]. We applied mobile gaseous-detector-based muography instruments [2] for surveying different human-made structures in Japan:
(1) A buried reinforced concrete pillar (that is a standard pillar along Japanese railways) was installed inside a mound, and muography was blind tested from a three meter deep shaft located three meters away from the pillar [3]. Our muographic surveys revealed the bottom of the pillar at the depth of 80 cm with a spatial resolution of 15 cm within a few days.
(2) Debris dams are applied to prevent the catastrophic impacts of fast debris flows on the landscapes in mountain areas. We muographically measured the density-lengths through different debris dams (e.g., see in Ref. [4]) with a spatial resolution of below 50 cm within 2-4 weeks. The muographic surveys detected a weak zone inside a debris dam of Karasugawa river in consistency with elastic wave tomography survey.
(3) Muographic inspection of the Imashirozuka burial mound was conducted for detecting physical evidences related to a past earthquake [5]. This mound collapsed after a landslide generated by the 1596 Fushimi earthquake. Bidirectional muographic surveys detected a 4-8 m width low-density region at the top of the mound. These were interpreted as large-scale vertical cracks that caused the translational collapse process behind the rotational landslide that was already found in prior trench-survey-based works. The observations revealed that the mound already had intrinsic problem with the stability of the basic foundation before the earthquake.
These proof of concepts demonstrate the applicability of muography for geotechnical surveys and encourage the further studies for improving the protection of landscapes, economies and societies.
[1] Oláh, L., Tanaka, H. K. M., and Varga, D. Muography: Exploring Earth's Subsurface With Elementary Particles, 1st ed., Geophysical Monograph Series, Vol. 270, American Geophysical Union and John Wiley & Sons, ISBN 9781119723028, 2022.
[2] Oláh, L., et al.: CCC-based muon telescope for examination of natural caves, Geosci. Instrum. Method. Data Syst., 1, 229, https://doi.org/10.5194/gi-1-229-2012, 2012.
[3] Oláh, L., et al.: The first prototype of an MWPC-based borehole-detector and its application for muography of an underground pillar. Geophysical Exploration (J-STAGE), 71, 161-178, https://doi.org/10.3124/segj.71.161, 2018.
[4] Sakatani, Y., et al.: Research on the development of soundness analysis technology for Sabo-related infrastructure by muography (Part 1), Journal of the Japan Society of Erosion Control Engineering, ISSN 2433-0477, 85, 69, 2020. (In Japanese)
[5] Tanaka, H. K. M., Sumiya, K., and Oláh, L.: Muography as a new tool to study the historic earthquakes recorded in ancient burial mounds, Geosci. Instrum. Method. Data Syst., 9, 357, https://doi.org/10.5194/gi-9-357-2020, 2020.
How to cite: Oláh, L., Tanaka, H. K. M., Hamar, G., Miyamoto, S., Sakatani, Y., Mori, T., and Sumiya, K.: Muography as a novel complementary technique for geotechnical surveys, EGU General Assembly 2022, Vienna, Austria, 23–27 May 2022, EGU22-2168, https://doi.org/10.5194/egusphere-egu22-2168, 2022.
EGU22-2793 | Presentations | GI5.4
Overview of muography in geoscientific researchGábor Nyitrai, Gergő Hamar, and Gergely Surányi
Muography is a novel imaging method, using muon particles present in cosmic rays at Earth surface level. These naturally occurring high energy muons are able to penetrate even kilometers of rock. The count rate (flux) depends on the zenith angle of the incoming muon, as well as on the density-length of the rock (density integrated along the muon path up to the detector) thus providing a powerful tool to image the average densities of 10-1000 m rock layers. In some cases with multiple detector locations, even 3D density reconstruction is possible. The geometric constraint of muography is that the altitude of the particle tracking detector must be lower than the examined object level.
Applications arise in multiple disciplinaries, including volcanology, mining, archeology, civil engineering, speleology. In this presentation the technology of muography will be reviewed, the muon detectors developed in Wigner RCP Budapest will be introduced, and experiences learned from ongoing projects will be presented.
How to cite: Nyitrai, G., Hamar, G., and Surányi, G.: Overview of muography in geoscientific research, EGU General Assembly 2022, Vienna, Austria, 23–27 May 2022, EGU22-2793, https://doi.org/10.5194/egusphere-egu22-2793, 2022.
Please decide on your access
Please use the buttons below to download the presentation materials or to visit the external website where the presentation is linked. Regarding the external link, please note that Copernicus Meetings cannot accept any liability for the content and the website you will visit.
Forward to presentation link
You are going to open an external link to the presentation as indicated by the authors. Copernicus Meetings cannot accept any liability for the content and the website you will visit.
We are sorry, but presentations are only available for users who registered for the conference. Thank you.
EGU22-3551 | Presentations | GI5.4
Application examples of underground muographyGergely Surányi, Gergő Hamar, Gábor Nyitrai, and Ádám Gera
Muography (or muon tomography) is one of the most effective methods for locating unknown density inhomogeneities, (eg. ore bodies or voids) underground. The geometric conditions have limitations, but otherwise there is no any other competing geophysical method, either the resolution or the simplicity is considered.
In the last years thanks to the continuous R&D in Wigner Research Centre for Physics, Budapest, we have been provided low-cost, portable muon detectors as well as newly-developed data processing methods. We have several ongoing natural and artificial cavity exploration projects and density inhomogeneity location projects for mining applications.
Here we present case studies carried on in Hungarian underground sites, where we could find unknown cavities and verify the method by locating known artificial shafts and adits with high precision. We have achieved that if the characteristic size of the void is only 2-3% of the rock thickness between the detector and the surface, the cavity location is feasible. To reach these unknown voids and density anomalies is in progress either by conventional caving exploration techniques or by drilling.
Further measurements are ongoing by the new upgraded detectors. By decreasing the gas consumption and supporting the electric power by solar cells, we are able to measure even at remote locations without the need of any direct access for several months duration.
How to cite: Surányi, G., Hamar, G., Nyitrai, G., and Gera, Á.: Application examples of underground muography, EGU General Assembly 2022, Vienna, Austria, 23–27 May 2022, EGU22-3551, https://doi.org/10.5194/egusphere-egu22-3551, 2022.
EGU22-4312 | Presentations | GI5.4
Impact of Atmosphere fluctuations on Absorption Muon Tomography opacity estimates.Amélie Cohu, Matias Tramontini, Antoine Chevalier, Jean-Christophe Ianigro, and Jacques Marteau
Muography is an imaging technique based on the differential absorption of a flux of incident particles, muons, by the target being studied. Muons are elementary particles that have the property to pass through standard rocks in a straight line to the first order, up to several kilometers away, and whose relative absorption allows to generate images by contrast densitometry, like a standard clinical X-ray. This technique infers the density of an object by tracking the number of muons received by a detector, before and after traversing a structure. The amount of density met by a muon on its path minimizes its survival probability in a predictable manner, hence diminising the average flux received by a detector. The incident direction (defined by the zenital angle) of the detected muons is reconstructed by means of a detector composed of a 3 scintillators panels, allowing to produce 2-D (or 3-D) density images.
To evaluate the degree of absorption caused by the density of structures, there are two key components: (1) the input flux (open-sky flux) which is infered theoretically, and (2) the output flux, measured by a detector. However, due to the diversity of possible observation conditions (altitude, longitude, latitude, solar winds, weather conditions, geomagnetic field...) of the open-sky flux, it is challenging to estimate it properly. The goal of this study is to improve the current way in which this estimate is done and apply it to the imaging of an industrial structure.
Two approaches are generally possible to estimate the open-sky flux. The first is based on semi-empiric models (Tang, Shukla, Gaisser ,etc...). The parameters of these formulae are calibrated using data sets. Analytical or empirical correction factors could be used to extrapolate these values to the desired survey elevation (z) and take into account the atmospheric conditions influence on muon production. The second approach makes use of CORSIKA, a Monte Carlo driven Nuclei-Hadron interaction model used for cosmic shower simulation. It has been used to simulate the influence of atmospheric conditions on the production and buffering of muons, as well as the effect of the geomagnetic field and the detector elevation. Both of these approaches have to overcome issues with extreme zenital angles.
Inter-comparision of analytical models, CORSIKA fluxes, and laboratory measurements are used as a means to validate our CORSIKA numerical experiment. Then, we analyzed the geodesic effects on the muon flux in terms of energetic composition with varying magnetic field, altitude and density distribution of the atmosphere. As a result, we have used our theoretical CORSIKA fluxes on an industrial application. We have studied the impact of the input flux in the opacity (quantity of matter crossed along a trajectory) estimate. First numerical results suggest that opacity estimate is strongly influenced in the 70 to 90° zenith angle region especially for low opacity targets.
How to cite: Cohu, A., Tramontini, M., Chevalier, A., Ianigro, J.-C., and Marteau, J.: Impact of Atmosphere fluctuations on Absorption Muon Tomography opacity estimates., EGU General Assembly 2022, Vienna, Austria, 23–27 May 2022, EGU22-4312, https://doi.org/10.5194/egusphere-egu22-4312, 2022.
EGU22-6285 | Presentations | GI5.4 | Highlight
Cosmic Muon Images: a muon tomography citizen science projectTheodore Avgitas and Jacques Marteau
Muon tomography has witnessed significant growth during the last decade with volcanology being the main driving force behind this great success. Many sites around the world are currently studied and many new ideas concerning R&D, potential new targets and data analysis techniques are brought to light. Nevertheless, the potential for further developments is hindered by the lack of manpower to explore this changing landscape. Citizen science is the active involvement of the public in scientific research with the goal to further the domain’s knowledge. Citizen science projects has been developed during the last decade around experiments that produce high volume of data like ATLAS at CERN with the Higgs Hunters project and LIGO gravitational wave detector with Gravity Spy. This kind of projects has proved to build strong connections with a community of people that have an inner will for participation in scientific endeavors and muon tomography reaches fast that point where such a community could be proved valuable.
Cosmic Muon Images is a muon tomography citizen science framework developed within the REsearch Infrastractures FOR Citizens in Europe (REINFORCE[1]) project (EU-funded, GA-822859). REINFORCE brings together four major scientific domains in order to engage citizen scientists in the process of scientific discovery. Muon tomography, Gravitational Waves, Neutrino Astronomy and High Energy Physics provide the ground for discussion and active involvement of people from all over the world with critical scientific issues like detection techniques, signal vs background rejection, environmental impact on measurement and many more. The goal of reaching the broadest possible audience would be disrupted if the data used by these projects were not accessible easily by as many people as possible. SonoUno[2] is a user centered software developed within REINFORCE that allows people with different sensory styles to explore scientific data, both visually and through sonorization.
Zooniverse[3] website hosts various citizen science projects, and a very active community has grown around it over many years. Cosmic Muon Images utilizes the website’s tools to develop workflows while at the same time communicate the science behind muon tomography so that people do their work more efficiently and consciously. Muon telescope data are visualized with 3D and 1D plots with the goal being the identification of patterns through a series of lines and points on these plots. This pattern identification results will be used to train Machine Learning (ML) algorithms to discriminate between signal and background events. Afterward we will evaluate the performance (speed, accuracy) of these ML algorithms in comparison to more traditional track reconstruction and event selection algorithms that are already in use. Furthermore, the classification of a dataset that people have cataloged by eye can prove to be extremely valuable so much for simulation development and background identification.
Muon Tomography provides a vast landscape of applications for citizen scientists to explore and projects that facilitate active participation can have mutual benefits for scientists and citizens alike, this is a first step towards this direction.
[1] https://www.reinforceeu.eu/
[2] http://sion.frm.utn.edu.ar/sonoUno/
[3] https://www.zooniverse.org/
How to cite: Avgitas, T. and Marteau, J.: Cosmic Muon Images: a muon tomography citizen science project, EGU General Assembly 2022, Vienna, Austria, 23–27 May 2022, EGU22-6285, https://doi.org/10.5194/egusphere-egu22-6285, 2022.
EGU22-6792 | Presentations | GI5.4
Muography as a Novel Field Observation Tool of Geomorphic ResearchMarko Holma, Adrian M. Hall, Pertti Sarala, Niko Putkinen, Hiroyuki K.M. Tanaka, László Oláh, and Pasi Kuusiniemi
Cosmic-ray muography is a novel methodology for monitoring and spatial imaging density variations in solid and liquid materials. It is based on the translation of the “raw” muon flux attenuation data to meaningful images that visualise the target’s bulk density radiographically (2D) or tomographically (3D). Both can also be applied as time-sequential mode allowing long-term monitoring of density-affecting processes. The core strength of muography is that it permits the observation of processes that change density and occur in timescales from hours to years. In geosciences, this may allow, for example, monitoring of glaciers, ground frost, movements of waters and fluids, propagation of fractures, and detection of faults. In the latter case, periodic drying may render a fault muographically visible during monitoring. Large faults can be imaged also directly. The already classic application of applying muography for long-term monitoring of active volcanoes allows detection of magma ascent and, therefore, early warnings of possible eruptions. In addition, muography can also be used for practical and industrial applications such as tunnelling, mining and geo- and civil engineering. In these cases, muography provides unique opportunities for long-term monitoring of activities and work safety.
The capabilities of muography are particularly fitting for studying bedrock fractures, weathering and the inner structure of different landforms that (a) comprise at least a few percentage differences between bulk densities of two or more rock or soil types (or their mixtures), (b) are located within the uppermost few hundreds of metres of crust, and (c) allow the installation of the muon detector(s) below or side of the volume of interest. Regarding the latter, detectors must be positioned between the open sky (the source of muons) and the volume of interest (object). In geomorphic research, appropriate settings for muography include the sides of mountains, hills, valleys, cliffs, gorges, glacigenic deposits, river terraces, caves, tunnels or boreholes. Many of the current muon detectors are mobile and robust, and due to self-sustainability, automation and remote access to data, they allow field measurements even in distant, rugged or harsh environments.
Our earlier research has demonstrated that the actual muography data can, for example, detect concealed faults and fractures, visualise and monitor groundwater table, reveal permeability barriers or zones of high porosity in soil and rock masses, image density anomalies in crystalline rocks, detect ascent of magma within an active volcano, and map out natural caves. Other researchers have demonstrated and proposed many other exciting applications in geoscience, archaeology, civil engineering, and many other fields of human activity. We suggest that muography provides extraordinarily fresh prospects for studies of the structure of many different types of landscape elements and monitoring and, perhaps, predicting their evolution [1]. The possibilities include research on soil erosion, subsurface fracturing and weathering, hillslope evolution, groundwater reservoirs, river channel erosion, drainage divides, glaciers, landslides, karst terranes and their aquifers, sinkholes, collapses, regoliths, saprolites, bauxites, soil geoengineering, and short- and long-term climate change.
[1] B. Ferdowsi et al., Earthcasting: Geomorphic Forecasts for Society, Earth’s Future 9, e2021EF002088. doi:10.1029/2021EF002088.
How to cite: Holma, M., Hall, A. M., Sarala, P., Putkinen, N., Tanaka, H. K. M., Oláh, L., and Kuusiniemi, P.: Muography as a Novel Field Observation Tool of Geomorphic Research, EGU General Assembly 2022, Vienna, Austria, 23–27 May 2022, EGU22-6792, https://doi.org/10.5194/egusphere-egu22-6792, 2022.
EGU22-8808 | Presentations | GI5.4
Identification and three-dimensional localization of cavities at the Temperino mine (Tuscany-Italy) with the muon imaging techniqueDiletta Borselli, Guglielmo Baccani, Tommaso Beni, Lorenzo Bonechi, Massimo Bongi, Debora Brocchini, Nicola Casagli, Roberto Ciaranfi, Luigi Cimmino, Vitaliano Ciulli, Raffaello D'Alessandro, Chiara Del Ventisette, Andrea Dini, Giovanni Gigli, Sandro Gonzi, Silivia Guideri, Luca Lombardi, Massimiliano Nocentini, Pasquale Noli, Nicola Mori, Giulio Saracino, and Lorenzo Viliani
Muon radiography is a non-invasive imaging technique that allows, through cosmic muon absorption measurements, to obtain two-dimensional and three-dimensional images of the internal structure and average density of very large material volumes. Its applications currently range from many fields: geological, archaeological, industrial, civil and nuclear safety. The technique of muon radiography being non-invasive represents a valid alternative to the common survey techniques in these fields of applications. In this presentation I will show some results obtained with this technique in the geological field for the three-dimensional imaging of cavities and tunnels within the Temperino mine located in the San Silvestro Archaeological Mining Park near Campiglia Marittima in the province of Livorno in Tuscany (Italy). The Temperino mine has ancient etruscan origins and still has areas which are not mapped in the available documentation. The mining activities of the area have always been focused on the search for a hard and dense rock called skarn in which there are metallic sulphides of Cu, Ag, Pb, Zn, Fe. Currently only one of the most superficial levels of the mine is accessible to the public through a tourist route. The muographic measurements on this site therefore have a dual objective, on the one hand to test the imaging technique on known cavities, on the other hand to discover new cavities whose knowledge could be useful, for example, for important assessments concerning historical and safety aspect of the site. All measurements were carried out with the muon detector MIMA (Muon Imaging for Mining and Archaeology) designed and built at the National Institute of Nuclear Physics (INFN) in Florence. MIMA is a cubic tracker of approximate dimensions (50x50x50) cm3and is equipped with a special protective aluminum mechanism that allows its altazimuth orientation. Various measurements were made within the tourist gallery located about 50 m below ground level for the observation of areas above. By comparing muon transmission measurements with simulations, it was possible to generate two-dimensional angular maps of average density of material observed in every direction within the detector's acceptance. The presence of some low-density anomalies associated with the presence of cavities was thus identified. Through algorithms based on the triangulation technique and on a track backprojection technique, the cavities were located in three-dimensions. For the known cavities it was also possible to compare the reconstructed development with their real profile that was acquired with the laser scanner technique, finding a good compatibility (average deviation below 1 m for a 7 m high cavity located 20 m above the detector’s installation location). These measurements therefore validate the muon radiography technique in the geological field for the search for cavities inside mines. The technique can be applied to identify not only low-density anomalies or voids, but also high-density areas: the application of the muon imaging technique for the identification of dense ore bodies is being studied at Temperino mine.
How to cite: Borselli, D., Baccani, G., Beni, T., Bonechi, L., Bongi, M., Brocchini, D., Casagli, N., Ciaranfi, R., Cimmino, L., Ciulli, V., D'Alessandro, R., Del Ventisette, C., Dini, A., Gigli, G., Gonzi, S., Guideri, S., Lombardi, L., Nocentini, M., Noli, P., Mori, N., Saracino, G., and Viliani, L.: Identification and three-dimensional localization of cavities at the Temperino mine (Tuscany-Italy) with the muon imaging technique, EGU General Assembly 2022, Vienna, Austria, 23–27 May 2022, EGU22-8808, https://doi.org/10.5194/egusphere-egu22-8808, 2022.
EGU22-8837 | Presentations | GI5.4 | Highlight
Absorption-based muography for ore bodies prospecting: a case study from Temperino Mine (Italy)Tommaso Beni, Guglielmo Baccani, Diletta Borselli, Lorenzo Bonechi, Massimo Bongi, Debora Brocchini, Nicola Casagli, Roberto Ciaranfi, Luigi Cimmino, Vitaliano Ciulli, Raffaello D'Alessandro, Chiara Del Ventisette, Andrea Dini, Giovanni Gigli, Sandro Gonzi, Silvia Guideri, Luca Lombardi, Nicola Mori, Massimiliano Nocentini, Pasquale Noli, Giulio Saracino, and Lorenzo Viliani
In the last twenty years several applications of muography (or muon radiography) technique have been carried out for geological purposes. Among them, particular attention was given to underground ore bodies prospections. For thousands of years humans have been searching new methods to understand where to find underground ore bodies and how to localize it in the three-dimensional space. Often, economically useful minerals are bounded to other minerals, forming rocks of high density values that are hosted, usually, in rocks with lower density values. In literature gravimetry and magnetometry represent the most employed geophysical methods for imaging and detection of mineral-rich ore bodies. To verify the feasibility of muography as a non-invasive geophysical prospecting technique, our research group, composed by subnuclear physicists and geologists, carried out some underground measurement campaigns at the Temperino Mine (Campiglia Marittima, Italy). Here it is located a pliocenic metasomatic ore deposit, a Cu-Pb-Zn-Fe skarn complex composed by johannsenite, quartz, hedenbergite, ilvaite and accessory primary sulphides (chalcopyrite, galena, sphalerite, pyrite). These metalliferous bodies of skarn have tabular geometries with sub-vertical orientations. Currently, the first level of Temperino Mine has been equipped as a touristic path and belong to the Archeological Mining Park of San Silvestro. Along this gallery, carved both into the metamorphic and non-metamorphic rocks, it’s been installed the MIMA muon tracker (Muon Imaging for Mining and Archaeology), a small and rugged prototype (0.5 x 0.5. x 0.5 m3) developed by the physicists of the National Institute of Nuclear Physics (INFN), unit of Florence, and the Department of Physics and Astronomy of Florence. MIMA detector is able to measure the underground muon flux inside the mine gallery. Matching the simulated muon transmission rate with the experimentally measured one it’s possible to obtain a two dimensional average density angular map of the observed target. Also, using algorithms based on triangulation and back-projection techniques is possible to obtain a reconstruction of the 3D volume of high-density areas (and also low-density areas) inside the studied volume. The latter is the volume that falls within the detector’s acceptance. The aim of this research is to obtain a georeferenced 3D model of the Cu-Pb-Zn ore bodies hosted in the rocks between the top of the mine gallery and the surface of the Temperino Mine area. We want to confirm that muography technique could become a suitable and reliable tool for the mining prospections field.
How to cite: Beni, T., Baccani, G., Borselli, D., Bonechi, L., Bongi, M., Brocchini, D., Casagli, N., Ciaranfi, R., Cimmino, L., Ciulli, V., D'Alessandro, R., Del Ventisette, C., Dini, A., Gigli, G., Gonzi, S., Guideri, S., Lombardi, L., Mori, N., Nocentini, M., Noli, P., Saracino, G., and Viliani, L.: Absorption-based muography for ore bodies prospecting: a case study from Temperino Mine (Italy), EGU General Assembly 2022, Vienna, Austria, 23–27 May 2022, EGU22-8837, https://doi.org/10.5194/egusphere-egu22-8837, 2022.
EGU22-8906 | Presentations | GI5.4
Studying Terrestrial Impact Structures With Cosmic-Ray Induced Atmospheric MuonsTeemu Öhman, Marko Holma, and Pasi Kuusiniemi
Muography is used in, e.g., volcanology, archaeology, engineering and mineral exploration to characterise material densities [1–2]. To our knowledge, muography has not been applied for impact crater studies.
Muons are produced in the atmosphere as a by-product of particle reaction cascades commenced when high-energy cosmic-ray particles collide with air nuclei. Muons lose energy at a rate dependent on the density of the material. Muon counts are translated to density information and radiographic (2D), tomographic (3D), or time-lapse images. Joint inversion of muographic and gravity or seismic data is also possible [1,3].
Muon detectors are muon telescopes (MT) or downhole detectors (DD). The larger MTs “see” one direction at a time. DDs fit standard drill holes and “see” 360° but typically with a lower spatial resolution. They collect muon data from a conal volume of rocks.
Muography is energy-efficient and does not require radiation sources. In addition, muographic data are not affected by parameters other than density and, to a minor extent, chemistry. Also, the user has a lot of control for obtaining the required data quality and image resolution (e.g., more and/or larger detectors or longer surveys improve both parameters). This is a notable advantage over most other types of geophysical instruments.
The muon flux diminishes quickly with increasing depth. Hence, the deeper the detectors, the longer the surveys. In caves and mines below ~0.5 km, the measuring times have typically been months to years. However, this is not a severe challenge for impact structures, as most of them are shallow features and, consequently, the flux of muons has not yet been seriously diminished.
Every 1% difference in density provides an easily detectable ~3% difference in the muon flux. Granitoids have densities around 2600–2800 kgm-3, while mafic rocks can reach ~3000 kgm-3. In contrast, the densities of suevitic breccias vary substantially depending on the melt and clast contents, hydrothermal overprint, and weathering. They often have densities of ~2200–2300 kgm-3, while the densities of impact melt rocks tend to lie between those of target rocks and suevitic breccias. Fault breccias in crater rims and central uplifts can have densities ~100 kgm-3 lower than the surroundings.
A combination of MTs and DDs may provide the best results for impact structures. Topographic central peaks can be studied by both techniques. Crater fill materials and subdued central uplifts can be imaged via DDs. For preserved rims, it is best to use MTs on the crater floor or the terrace zone. The rims of shallow impact structures may be difficult for MTs, because only a few approximately horizontal muons bear information on the rim. In such a case, DDs can be applied much deeper, but the measurement may take longer. Overall, muography provides a cost-effective and more comprehensive 3D view of the crater than drill cores alone.
References: [1] Cosburn K. et al. (2019) Geophys. J. Int., 217, 1988–2002. [2] Zhang Z.-X. et al. (2020) Rock Mech. Rock Eng., 4893–4907. [3] Le Gonidec Y. et al. (2019) Sci. Rep., 3079.
How to cite: Öhman, T., Holma, M., and Kuusiniemi, P.: Studying Terrestrial Impact Structures With Cosmic-Ray Induced Atmospheric Muons, EGU General Assembly 2022, Vienna, Austria, 23–27 May 2022, EGU22-8906, https://doi.org/10.5194/egusphere-egu22-8906, 2022.
EGU22-9470 | Presentations | GI5.4
TomOpt: Differentiable Muon-Tomography OptimizationMaxime Lagrange, Tommaso Dorigo, Giles Strong, Andrea Giammanco, Pietro Vischia, Federica Fanzago, Federico Nardi, and Max Lamparth
We propose to employ differentiable programming techniques in order to construct a modular pipeline that models all the aspects of a muon tomography task, from the generation and interaction of cosmic ray muons with a parameterized detector and passive material, to the inference on the atomic number of the passive volume.
This enables the optimization of the detector parameters via gradient descent, to suggest optimal detector configurations, geometries, and specifications, subject to external constraints such as cost, detector size, and exposure time.
The eventual aim is to release the package open-source, to be used to guide the design of futur detectors for muon scattering and absorption imaging.
How to cite: Lagrange, M., Dorigo, T., Strong, G., Giammanco, A., Vischia, P., Fanzago, F., Nardi, F., and Lamparth, M.: TomOpt: Differentiable Muon-Tomography Optimization, EGU General Assembly 2022, Vienna, Austria, 23–27 May 2022, EGU22-9470, https://doi.org/10.5194/egusphere-egu22-9470, 2022.
EGU22-9746 | Presentations | GI5.4 | Highlight
Initial results of the MURAVES muon telescope at Mt. VesuviusMichael Tytgat and the MURAVES Collaboration
The MURAVES (Muon Radiography of VESuvius) muon telescope was conceived to study the internal structure of Mt. Vesuvius, an active volcano near Naples, Italy, using the absorption of muons generated by cosmic-ray showers in the upper atmosphere (a technique also known as “muography”). Even though the volcano is currently quiescent, this system presents a potential hazard for its highly populated surroundings. Muographical imaging data of the summit cone combined with gravimetric and seismic measurements may help the modeling of possible eruptive dynamics.
The MURAVES telescope currently consists of three identical, independent muon hodoscopes, each of them made of four 1m2 active area XY tracking stations and a 60cm thick lead wall placed in between the two downstream stations to passively reduce the background from low energy muons. The tracking stations are constructed using scintillator bars that are coupled via wave-length shifting fibers to silicon photomultipliers. The apparatus has been installed on Mt. Vesuvius and is currently acquiring data. Next to a description of the telescope setup, initial, preliminary results from the analysis of first data samples will be presented.
In addition, we will report on a number of simulation studies that allow us to investigate the effects of the experimental constraints and to compare our simulated data with the actual observations. The simulation chain is based on Geant4, and for the generation of cosmic showers a comparative study of particle generators, including CORSIKA and CRY, has been done to identify the most suitable one for our simulation framework. Muon transport through the mountain is being addressed using PUMAS and Geant4. We will present ongoing work on e.g. the detector digitization in the simulation, the muon track reconstruction and tracking inefficiencies, the effects of the lead wall, dark noise and other nuisances, and the simulation to measured data comparison.
How to cite: Tytgat, M. and the MURAVES Collaboration: Initial results of the MURAVES muon telescope at Mt. Vesuvius, EGU General Assembly 2022, Vienna, Austria, 23–27 May 2022, EGU22-9746, https://doi.org/10.5194/egusphere-egu22-9746, 2022.
Please decide on your access
Please use the buttons below to download the presentation materials or to visit the external website where the presentation is linked. Regarding the external link, please note that Copernicus Meetings cannot accept any liability for the content and the website you will visit.
Forward to presentation link
You are going to open an external link to the presentation as indicated by the authors. Copernicus Meetings cannot accept any liability for the content and the website you will visit.
We are sorry, but presentations are only available for users who registered for the conference. Thank you.
EGU22-10983 | Presentations | GI5.4
Seeing through old mining wastes with secondary cosmic raysMitro Juutinen, Marko Holma, and Pertti Sarala
Tailing sand is almost only gangue-minerals-containing mining waste formed during the ore enrichment process. This waste material is deposited as a slurry in tailings storage facilities. Waste rock is defined as a rock material removed around the ore and typically piled near the quarries and mines.
Back in the days when the ore processing methods were poorly developed and ore deposits were located just below the Earth’s surface, there were relatively large amounts of valuable materials left in the mining wastes. The heritage mining waste storage facilities, such as tailings ponds and waste rock stockpiles, are today considered significant secondary raw material resources by the EU. Moreover, due to the global trend of sustainable development and the EU’s vision of economic autonomy, especially those mining waste storage facilities that contain critical raw materials (such as battery metal-bearing minerals) are expected to play a significant role in the future. These factors drive exploration and beneficiation not only towards new ore deposits but also to the wastes of those deposits that were exploited in the past.
One of the methods that hold promise as a characterization method of heritage tailings and waste rocks in terms of the ore potential estimation is cosmic-ray muography. Muography is based on muons that are electron-like elementary particles formed by the collision of cosmic rays and substances of the atmosphere. All the time and everywhere on our planet, the surface of the Earth is bombarded by high-energy muons. Due to the high energy and the fact that a muon is much heavier than an electron, muons have a high penetrating power to dense materials. The idea of muography is to measure the attenuation of muons after they have travelled through the object and subsequently translate the recorded muon statistics into meaningful density information such as 2D or 3D images. As the highest-energy muons can pass through even kilometres of rock, muography can be applied in many applications within the uppermost kilometres or so of the Earth’s subsurface. The attenuation of muon flux depends on the mass density of the material: the denser the material is on average, the more it reduces the muon’s energy (muons that have lost enough energy become non-relativistic and rapidly cease to exist).
We tentatively propose that there is a major opportunity to utilize muography in the estimations of the ore potential of old mining waste facilities. For example, one application of muography could be the usage of a cylindrical detector placed in a borehole bored in a tailings pond. The measurements could be made at different depths and with several detectors. The measurements could tell if there are density differences in tailings and how they are distributed. Muography could be a considerable method of targeting further estimation studies of the resource potential of the old tailings. Muography measurements could also be a possible way to target the exploration of old waste rock stockpiles. Such an endeavour could be carried out from the sides of the stockpiles with one or more muon telescopes.
How to cite: Juutinen, M., Holma, M., and Sarala, P.: Seeing through old mining wastes with secondary cosmic rays, EGU General Assembly 2022, Vienna, Austria, 23–27 May 2022, EGU22-10983, https://doi.org/10.5194/egusphere-egu22-10983, 2022.
EGU22-12174 | Presentations | GI5.4
A telescope based on Scintillator technology for assessing massive rock falls – la reunion islandCatherine Truffert, Simon bouteille, Jacques Marteau, Benoit Le Moigne, Nicole Huebert, and Kevin Samyn
A telescope based on scintillators technology has been installed at the footstep of giant cliffs for assessing massive rocks falls. Such an experience is a first in the “world of muography”. It was made possible thanks to the national geological service, the BRGM, in particular its regional branch based in Reunion Island. Muography was chosen because it allows to access the density variation in time and space, in a passive way, by collecting in the telescope the muons which crossed the rock. The telescope has been installed for up to 6 months at the footwall of the giant cliff. The rainy season was chosen as the acquisition window to be able to follow the density variations that occur in the massif during rainy events.
The telescope is composed of 3 parallel ~1m2 active detection planes recording the positions and the precise time of the particles hits. The detector readout has been developed on the early concept of connected “smart sensors”. It allows an optimized selection of the particles hits to perform their tracking. A post-processing analysis will translate the recorded tracking properties into a detailed image of the target within the acceptance of the detector.
La Reunion Island, located East of Madagascar, is composed of three shield volcanoes among with la Fournaise which is still active. The volcanic cirques are subjected to large-scale rock-falls (>10,000 m3).
On the top of the wall (or Rempart), the target of our muography experiment, the decompression cracks are concentrated on a strip often equivalent to 10% of the height of the cliff. The cliff can be higher than 1,000 m. These cracks, sometimes more than a meter wide, delimit the rock scales likely to be crumbled. The origin of these cracks, which are almost vertical on the surface, is linked to the natural decompression of the massif by the vacuum. The geometry of these cracks at depth is not well known, but it is likely that they acquire a slightly concave shape, bringing them closer to the wall and cutting out large scales at the crest of the Rempart. The volume of rock falling highly depends on the depth of these cracks.
Our experiment is focused on the Maïdo Rempart overlooking the western part of the Cirque of Mafate where the formations of the ancient volcanic outcrop in 1,000 m high scarps. We have installed a Muons telescope at “l’Ilet de Roche-Plate”, a small village located at the foot of active scree cones at the foot of the Maïdo Rempart. This innovative experiment follows a fire that occurred on the top of the Rempart at the end of 2020, which led to an increase in falling blocks and a potential acceleration in the opening of cracks. One of the issues is to better delimit the volume of "fractured" rocks and if possible, to identify the depth of the decompression cracks that delimit the scales likely to fall.
How to cite: Truffert, C., bouteille, S., Marteau, J., Le Moigne, B., Huebert, N., and Samyn, K.: A telescope based on Scintillator technology for assessing massive rock falls – la reunion island, EGU General Assembly 2022, Vienna, Austria, 23–27 May 2022, EGU22-12174, https://doi.org/10.5194/egusphere-egu22-12174, 2022.
Please decide on your access
Please use the buttons below to download the presentation materials or to visit the external website where the presentation is linked. Regarding the external link, please note that Copernicus Meetings cannot accept any liability for the content and the website you will visit.
Forward to presentation link
You are going to open an external link to the presentation as indicated by the authors. Copernicus Meetings cannot accept any liability for the content and the website you will visit.
We are sorry, but presentations are only available for users who registered for the conference. Thank you.
EGU22-12554 | Presentations | GI5.4
Muographic Analysis of the NOvA-ND Cosmic DataPeter Filip and the NOvA Collaboration
Radiographic analysis of the overburden inhomogeneities above
the NOvA Near Detector, located -100m below the surface at Fermilab,
will be presented. A continuous measurement of the underground cosmic
muon flux by the NOvA detector (of size 4x4x15 meters) allowed us to detect
temporal variations of the overburden, related to the soil excavation and the concrete
mass accumulation during the ICARUS detector installation at Fermilab.
Utilising the internal reflection symmetries of the NOvA detector acceptance, we are
able to obtain a differential radiographic maps of the spatial overburden
variations directly from the measured cosmic data, without using the Geant
simulations or the open-sky data subtraction.
How to cite: Filip, P. and the NOvA Collaboration: Muographic Analysis of the NOvA-ND Cosmic Data, EGU General Assembly 2022, Vienna, Austria, 23–27 May 2022, EGU22-12554, https://doi.org/10.5194/egusphere-egu22-12554, 2022.
EGU22-3601 | Presentations | GI5.5 | Highlight
Towards an automatic real-time seismic monitoring system for the city of OsloErik Myklebust, Andreas Köhler, and Anna Maria Dichiarante
Global estimates for future growth indicate that city inhabitation will increase by 13% due to a gradual shift in residence from rural to urban areas. The continuous increase in urban population has caused many cities to upgrade their infrastructures and embrace the vision of a “smart-city”. Data collection through sensors represents the base layer of every smart-city solution. Large datasets are processed, and relevant information is transferred to the police, local authorities, and the general public to facilitate decisions and to optimize the performance of cities in areas such as transport, health care, safety, natural resources and energy. The objective of the GEObyIT project is to provide a real-time risk reduction system in an urban environment by applying machine learning methodologies to automatically identify and categorise different types of geodata, i.e., seismic events and geological structures. The project focusses on the city of Oslo, Norway, addressing the common need of two departments of the municipality, i.e., the Emergency Department and the Water and Sewage Department. In the present work, we focus on passive seismic records acquired with the objective to quickly locate urban events as well as to continuous monitor changes in the near surface. For this purpose, a seismic network of Raspberry Shake 3D sensors connected to GSM modems, to facilitate real-time data transfer, was deployed in target areas within the city of Oslo in 2021. We present preliminary results of three approaches applied to the continuous data: (1) automatic detection of metro trains, (2) automatic identification of outlier events such as construction and mining blasts, and (3) noise interferometry to monitor the near sub-surface in an area with quick clay. We use a supervised method based on convolutional neural networks trained with visually identified seismic signals on three sensors distributed along a busy metro track (1). Application to continuous data allowed us the reliably detect trains as well as their direction, while not triggering other events. Further development of this approach will be useful to either sort out known repeating seismic signals or to monitor traffic in an urban environment. In approach (2) we aim to detect rare or unusual seismic events using an outlier detection method. A convolutional autoencoder was trained to create dense features from continuous signals for each sensor. These features are used in a one-class support vector machine to detect anomalies. We were able to identify a series of construction and mine blasts, a meteor signal as well as two earthquakes. Finally, we apply seismic noise interferometry to close-by sensor pairs to measure temporal variations in the shallow ground (3). We observe clear seismic velocity variations during periods of strong frost in winter 2021/2022. This opens up for the potential to detect also non-seasonal changes in the ground, for example related to instabilities in quick clay deposits located within the city of Oslo.
How to cite: Myklebust, E., Köhler, A., and Dichiarante, A. M.: Towards an automatic real-time seismic monitoring system for the city of Oslo, EGU General Assembly 2022, Vienna, Austria, 23–27 May 2022, EGU22-3601, https://doi.org/10.5194/egusphere-egu22-3601, 2022.
EGU22-7094 | Presentations | GI5.5
Predicting and comparing canopy biomass by satellite-extracted vegetation indices and a temperature-driven phenological modelling approachWei-Chung Pan and Su-Ting Cheng
Urban forest provides several important ecosystem services to cite residents and city environment, by which most functions were related to trees’ canopy biomass. To understand the dynamics of canopy biomass affecting the ecosystem services, this study applied and compared two approaches in predicting canopy biomass of Koelreuteria elegans street trees in the city of Taipei in Taiwan. The first approach extracted vegetation indices (VI) from time series data of the 2018 Sentinel-2 satellite images, to represent signals of tree canopy variation, including Normalized Difference Vegetation Index (NDVI) and Enhanced Vegetation Index (EVI), image classification based on VI time series data was processed to extract pixels with high canopy covers, and examined the associated phenological activities. In contrast, the other approach applied a system dynamic model to capture changes of canopy phenological activities in different seasons by factors of canopy size, leaf duration, and phenology events, all controlled by an accumulated temperature function to characterize green up and defoliation mechanisms. The growth temperature and growth rate of new leaves were calibrated with the phenological records. Results found good correlations between satellite-extracted vegetation indices approach and a temperature-driven phenological modelling. Reconstructed by NDVI and EVI, both indices caught the start of spring growth of Koelreuteria elegans in March to a full-sized canopy in April, with the whole growing season extended to the end of September, and a beginning of main defoliation from October to the lowest canopy size in January and February next year. Built from the image classification results for pure canopy cover, the maximum value of NDVI and EVI was 0.443 and 0.486, while the minimum was 0.08 and 0.163, respectively. In comparison, results from the canopy phenological modelling showed similar trends that canopy biomass reached its lowest point in February, entered to a rapid growth phase in March and reached full canopy size in April. Although the canopy phenological model also predicted a main growing season lasted until October, during the defoliation period, the leaves of the Koelreuteria elegans never completely fell off, due to the actual monthly minimum average temperature in the city of Taipei was higher than 10oC as the threshold of the controlled temperature. Based on these results, we suggest that when ground tree survey and inventory data are available, both satellite-extracted vegetation indices and modelling approach can provide useful predictions for landscape planning and urban forestry management.
How to cite: Pan, W.-C. and Cheng, S.-T.: Predicting and comparing canopy biomass by satellite-extracted vegetation indices and a temperature-driven phenological modelling approach, EGU General Assembly 2022, Vienna, Austria, 23–27 May 2022, EGU22-7094, https://doi.org/10.5194/egusphere-egu22-7094, 2022.
Please decide on your access
Please use the buttons below to download the presentation materials or to visit the external website where the presentation is linked. Regarding the external link, please note that Copernicus Meetings cannot accept any liability for the content and the website you will visit.
Forward to presentation link
You are going to open an external link to the presentation as indicated by the authors. Copernicus Meetings cannot accept any liability for the content and the website you will visit.
We are sorry, but presentations are only available for users who registered for the conference. Thank you.
EGU22-8095 | Presentations | GI5.5
Mining impact in a coal exploitation under an urban area: detection by Sentinel-1 SAR dataJose Cuervas-Mons, María José Domínguez-Cuesta, Félix Mateos-Redondo, Oriol Monserrat, and Anna Barra
In this work, the A-DInSAR techniques are applied in Central Asturias (N Spain). In this area, the presence of the most important cities in the region is remarkable, as well as industry and port infrastructures and a dense road network. Moreover, this region is specially known for their historical coal exploitation, which was developed mainly on the Central Coal Basin for almost 2 centuries, and is being abandoned from the beginning of the 21st. The main aim of this study is detecting and analysing deformations associated to this underground coal mining activity. For this, the following methodology was realised: 1) Acquisition and processing of 113 SAR images, provided by Sentinel-1A and B in descending trajectory between January 2018 and February 2020, by means of PSIG software; 2) Obtaining of Line of Sight mean deformation velocity map (in mm year-1) and deformation time series (in mm); 3) Analysis of detected terrain displacements and definition of mining impact. The results show a Velocity Line of Sigh (VLOS) range between -18.4 and 37.4 mm year-1, and accumulated ground displacements of -69.1 and 75.6 mm. The analysis, interpretation and validation of these ground motion allow us to differentiate local sectors with recent deformation related to subsidence and uplift movements with maximum VLOS of -18.4 mm year-1 and 9.5 mm year-1. This study represents an important contribution to improve the knowledge about deformations produced by impact of coal mining activity in a mountain and urban region. In addition, this work corroborates the reliability and usefulness of the A-DInSAR techniques like powerful tools in the study and analysis of geological hazards at regional and local scales for the monitoring and control of underground mining infrastructures.
How to cite: Cuervas-Mons, J., Domínguez-Cuesta, M. J., Mateos-Redondo, F., Monserrat, O., and Barra, A.: Mining impact in a coal exploitation under an urban area: detection by Sentinel-1 SAR data, EGU General Assembly 2022, Vienna, Austria, 23–27 May 2022, EGU22-8095, https://doi.org/10.5194/egusphere-egu22-8095, 2022.
EGU22-8156 | Presentations | GI5.5
Investigating the carbon biogeochemical cycle at Mt EtnaMaddalena Pennisi, Simone D'Incecco, Ilaria Baneschi, Matteo Lelli, Antonello Provenzale, and Brunella Raco
The continuous acquisition of CO2 soil flux data has been started on Mt Etna in November 2021, with the aim of assessing a first balance between CO2 from volcanic and biological origin. Our long-term goal is an interdisciplinary study of volcanic, biological, ecological, biogeochemical, climatic and biogeographical aspects, including the anthropogenic impact on the environment. All aspects are integrated in the study of the so-called Critical Zone, i.e. the layer between the deep rock and the top of the vegetation where the main biological, hydrological and geological processes of the ecosystem take place. The new research activity at Mt Etna is performed within the framework of the PON-GRINT project for infrastructure enhancement (EU, MIUR), and it adds up to activities going on at Grand Paradiso National Park (Italian Alps), and Ny Alesund (Svalbard, NO, High Arctic) in the framework of the IGG-CNR Critical Zone Observatories.
During the first phase of the project, two fixed stations were installed in two sites at Piano Bello (Valle del Bove, Milo), in an area where the endemic Genista aetnensis grows. An Eddy Covariance system for net CO2 ecosystem exchange measurement and a weather station will be installed in 2022. Carbon stable isotopes data will be acquired periodically using in-situ instrumentation (i.e. Delta Ray). The installation sites are selected after CO2 soil flux surveys around the volcano using a portable accumulation chamber. The two stations installed at Piano Bello consist of an automatic accumulation chamber fixed to the ground, a mobile lid with a diffusion infrared sensor for measuring CO2, a data logger and a sensor for measuring soil moisture and temperature. The accumulation chambers are programmed to acquire data on ecosystem respiration every hour for all day. Data are transmitted to the IGG data collection center. The new IGG-CNR Mt Etna CZO will contribute investigating CO2 fluxes at the soil-vegetation-atmosphere interface in different geological and environmental contexts. We benefit from the collaboration with the National Institute of Geophysics and Volcanology (INGV), the Ente Parco dell'Etna, and the Dipartimento Regionale dello Sviluppo Rurale e Territoriale di Catania.
How to cite: Pennisi, M., D'Incecco, S., Baneschi, I., Lelli, M., Provenzale, A., and Raco, B.: Investigating the carbon biogeochemical cycle at Mt Etna, EGU General Assembly 2022, Vienna, Austria, 23–27 May 2022, EGU22-8156, https://doi.org/10.5194/egusphere-egu22-8156, 2022.
EGU22-8472 | Presentations | GI5.5
Ground motion emissions due to wind turbines: Results from two wind farms on the Swabian Alb, SW GermanyLaura Gassner and Joachim Ritter
Wind turbine (WT) ground motion emissions have a significant influence on sensitive measuring equipment like seismic monitoring networks. WTs permanently excite ground motions at certain constant frequencies due to the eigen modes of the tower and blades as well as the motion of the blades. The emitted waves have frequencies mainly below 10 Hz which are relevant for the observation of, e.g., local tectonic or induced seismicity. Furthermore, frequencies proportional to the blade passing frequency can be observed in ground motion data above 10 Hz, closely linked to acoustic emissions of the turbines. WTs are often perceived negatively by residents living near wind farms, presumably due to low frequency acoustic emissions. Therefore, similarities in ground motion and acoustic data provide constraints on the occurrence of such negatively perceived emissions and possible counter-measures to support the acceptance of WTs.
We study ground motion signals in the vicinity of two wind farms on the Swabian Alb in Southern Germany consisting of three and sixteen WTs, respectively, which are of the same turbine type, accompanied by acoustic measurements and psychological surveys. A part of the measurements is conducted in municipalities near the respective wind farms where residents report that they are affected by emissions. Additional measurements are conducted in the forests surrounding the WTs, and within WT towers. The wind farms are located on the Alb peneplain at 700-800 m height, approximately 300 m elevated compared to the municipalities. Results indicate that WTs are perceived more negatively in the location where the wind farm is closer to the municipality (ca. 1 km) and where other environmental noise sources like traffic occur more frequently. At the location more distant to the WT (ca. 2 km), even though more WTs are installed, residents are affected less. To improve the prediction of ground motion emissions, instruments are set up in profiles to study the amplitude decay over distance, which is linked to the local geology.
This study is supported by the Federal Ministry for Economic Affairs and Energy based on a resolution of the German Bundestag (03EE2023D).
How to cite: Gassner, L. and Ritter, J.: Ground motion emissions due to wind turbines: Results from two wind farms on the Swabian Alb, SW Germany, EGU General Assembly 2022, Vienna, Austria, 23–27 May 2022, EGU22-8472, https://doi.org/10.5194/egusphere-egu22-8472, 2022.
EGU22-11008 | Presentations | GI5.5
Preliminary Analysis on Multi-Devices Monitoring of Potential Deep-Seated Landslide in Xinzhuang, Southern TaiwanJi-Shang Wang, Tung-Yang Lai, Yu-Chao Hsu, Guei-Lin Fu, Cheng Hsiu Tsai, and Ting-Yin Huang
In-situ monitoring of slope is crucial for recognizing and recording the occurrence of landslide. Figuring out the correlation between monitoring data and hillslope displacement would help early warning for landslide-induced disasters. Xinzhuang potential deep-seated landslide area has been identified by Taiwan executive authority where is located in Kaohsiung City, southern Taiwan, it covers a 10.3 hectares’ area and 20 buildings with an average slope of 22.8 degrees. The lithology of the upper slope is sand-shale interbedded with highly sand contented, which differs from lower slope in shale with mud contented.
For conducting early warning and comprehending displacement of landslide in this study, the monitoring of ground displacement was carried out using the tiltmeter and the GNSS RTK (Real Time Kinematic), and the hydrology data (rainfall and ground water level) were recorded every 10 minutes by automatic gauges. Furthermore, we executed manual borehole inclinometer measurement to obtain the possible sliding position of subsurface.
This study has been conducted for two years, the results shows that (1) The local shallow creep (4-5 meters underground) in the central deep-seated landslide area was recorded by the tiltmeter, GNSS and borehole inclinometer measurement. (2) The groundwater level is the significant factor for displacements of creep in this site. (3) The velocity of the displacement would be accelerated when the groundwater level was higher than 2.1 meters. (4) The 6-hours displacement has a highly correlation with accumulative rainfall and ground water level. Moreover, the results have been applied to the landslide early-warning system of Taiwan authority.
How to cite: Wang, J.-S., Lai, T.-Y., Hsu, Y.-C., Fu, G.-L., Tsai, C. H., and Huang, T.-Y.: Preliminary Analysis on Multi-Devices Monitoring of Potential Deep-Seated Landslide in Xinzhuang, Southern Taiwan, EGU General Assembly 2022, Vienna, Austria, 23–27 May 2022, EGU22-11008, https://doi.org/10.5194/egusphere-egu22-11008, 2022.
Please decide on your access
Please use the buttons below to download the presentation materials or to visit the external website where the presentation is linked. Regarding the external link, please note that Copernicus Meetings cannot accept any liability for the content and the website you will visit.
Forward to presentation link
You are going to open an external link to the presentation as indicated by the authors. Copernicus Meetings cannot accept any liability for the content and the website you will visit.
We are sorry, but presentations are only available for users who registered for the conference. Thank you.
EGU22-11541 | Presentations | GI5.5
Slope stability analysis of embankment dam under total and effective pore pressureTri Hartanto
Very often many new construction and operating embankment dams need to be evaluated in terms of the slope stability. The necessity of considering body forces, pore-water pressures, and a variety of soil types in the analysis vitiates the application of methods that are well founded in the mechanics of continua and employ representative constitutive equations.
This study comparing stability analysis using total stress after the end of construction with effective stress couple of years later after the first impounding. Studies have indicated the advantages to be obtained employing an effective stress failure criterion (Bishop, 1952, Henkel and Skempton, 1955 and Bishop, 1960) for analysis and design of embankment dams. Pore-water pressure are determined from piezometer readings during the construction until the dam was operated.
This paper presents the results of stability analysis of embankments dam with both parameters and conditions, resulting that pore water pressures influence slope stability of the embankment.
How to cite: Hartanto, T.: Slope stability analysis of embankment dam under total and effective pore pressure, EGU General Assembly 2022, Vienna, Austria, 23–27 May 2022, EGU22-11541, https://doi.org/10.5194/egusphere-egu22-11541, 2022.
Please decide on your access
Please use the buttons below to download the presentation materials or to visit the external website where the presentation is linked. Regarding the external link, please note that Copernicus Meetings cannot accept any liability for the content and the website you will visit.
Forward to presentation link
You are going to open an external link to the presentation as indicated by the authors. Copernicus Meetings cannot accept any liability for the content and the website you will visit.
We are sorry, but presentations are only available for users who registered for the conference. Thank you.

EGU22-11730 | Presentations | GI5.5
Road surface friction measurement based on intelligent road sensor and machine learning approachesMezgeen Rasol, Franziska Schmidt, and Silvia Ientile
Real prediction of friction coefficient on the road surface is essential in order to enhance the resilience of traffic management procedures for the safety of road users. Critical weather conditions could have a significant impact on the road surface, and decrease the reliable friction coefficient in extreme conditions. Weather parameters are involved in the process of traffic management are water film thickness, ice percentage, pavement temperature, ambient temperature, and freezing point. Smart road monitoring of the road surface friction changes over time means the real-time prediction of the friction coefficient changes in the future based on the intelligent weather road-based sensor is crucial to avoid uncontrolled conditions during extreme weather conditions. For this reason, the use of intelligent data analysis such as machine learning approaches is key in order to provide a holistic robust decision-making tool to support road operators or owners for further consideration of the traffic management procedures. In this study, a machine learning approach is applied to train 18 months of data collected from the real case study in Spain, and results show a good agreement between real friction coefficient and predicted friction coefficient. The trained model has been validated with various cross-validation approaches, and the high accuracy of the model is observed.
This project has received funding from the European Union's Horizon 2020 research and innovation program under grant agreement No. 769129 (PANOPTIS project).
How to cite: Rasol, M., Schmidt, F., and Ientile, S.: Road surface friction measurement based on intelligent road sensor and machine learning approaches, EGU General Assembly 2022, Vienna, Austria, 23–27 May 2022, EGU22-11730, https://doi.org/10.5194/egusphere-egu22-11730, 2022.
EGU22-12263 | Presentations | GI5.5
System identification of a high-rise building: a comparison between a single station measuring translations and rotations, and a traditional array approach.Yara Rossi, John Clinton, Eleni Chatzi, Cédric Schmelzbach, and Markus Rothacher
We demonstrate that the extended dynamic response of an engineered structure can be obtained from just a single measurement at one position if rotation is recorded in combination with translation. Such a single station approach could save significant time, effort and cost when compared with traditional structural characterization using arrays. In our contribution we will focus on the monitoring of a high-rise building by tracking its dynamic properties, e.g., natural frequencies, mode shapes and damping. We present the results of the system identification for the Prime Tower in Zurich – with a height of 126 m, this concrete frame structure is the third highest building in Switzerland. It has been continuously monitored by an accelerometer (EpiSensor) and a co-located rotational sensor (BlueSeis) located near the building center on the roof for the past year. The motion on the tower roof includes significant rotations as well as translation, which can be precisely captured by the monitoring station. More than 9 natural frequencies, including the first 3 fundamental modes, as well as the next two overtones, where translations are coupled with rotations, are observed between 0.3 – 10 Hz, a frequency band of key interest for earthquake excitation, making an investigation essential. Using temporary arrays of accelerometers located across the roof and along the length of the building to perform a traditional dynamic characterisation, we can compare the array solution with the new single location solution in terms of system identification for the Prime Tower.
How to cite: Rossi, Y., Clinton, J., Chatzi, E., Schmelzbach, C., and Rothacher, M.: System identification of a high-rise building: a comparison between a single station measuring translations and rotations, and a traditional array approach., EGU General Assembly 2022, Vienna, Austria, 23–27 May 2022, EGU22-12263, https://doi.org/10.5194/egusphere-egu22-12263, 2022.
Please decide on your access
Please use the buttons below to download the presentation materials or to visit the external website where the presentation is linked. Regarding the external link, please note that Copernicus Meetings cannot accept any liability for the content and the website you will visit.
Forward to presentation link
You are going to open an external link to the presentation as indicated by the authors. Copernicus Meetings cannot accept any liability for the content and the website you will visit.
We are sorry, but presentations are only available for users who registered for the conference. Thank you.
EGU22-12901 | Presentations | GI5.5
Creating a spatially explicit road-river infrastructure dataset to benefit people and natureRochelle Bristol, Stephanie Januchowski-Hartley, Sayali Pawar, Xiao Yang, Kherlen Shinebayar, Michiel Jorissen, Sukhmani Mantel, Maria Pregnolato, and James White
Worldwide, roads cross most rivers big and small, but if nobody maps the locations, do they exist? In our experiences, the answer is no, and structures such as culverts and bridges at these road-river crossings have gone overlooked in research into the impacts that infrastructure can have on rivers and the species that depend on them. There remains a need for spatially explicit data for road-river crossings as well as identification of structure types to support research and monitoring that guides more proactive approaches to infrastructure management. Our initial focus was on mapping road-river structures in Wales, United Kingdom so to better understand how these could be impacting on nature, particularly migratory fishes. However, as we began developing the spatial dataset, we became aware of broader applications, including relevance to hazard management and movement of people and goods so to support livelihoods and well-being. In this talk, I will discuss our initial approach to tackling this problem in Wales, and how we learned from that experience and refined the approach for mapping in England, including our use of openly available remotely sensed imagery from Google and Ordnance Survey so to ensure the data can be reused and modified by others for their needs and uses. I will present a spatially explicit dataset of road-river structures in Wales, including information about surrounding environmental attributes and discuss how these can help us to better understand infrastructure vulnerability and patterns at catchment and landscape scales. I will discuss the potential for diverse applications of this road-river structure dataset, particularly in relation to supporting real-time monitoring and providing the baseline data needed for any futuer machine learning or computation modelling advances for monitoring road-river structures.
How to cite: Bristol, R., Januchowski-Hartley, S., Pawar, S., Yang, X., Shinebayar, K., Jorissen, M., Mantel, S., Pregnolato, M., and White, J.: Creating a spatially explicit road-river infrastructure dataset to benefit people and nature, EGU General Assembly 2022, Vienna, Austria, 23–27 May 2022, EGU22-12901, https://doi.org/10.5194/egusphere-egu22-12901, 2022.
EGU22-932 | Presentations | TS4.4
Structural setting, active tectonics and seafloor morphology of the northeastern Calabria accretionary prism (Ionian Sea, Italy)Lorenzo Lipparini, Andrea Argnani, Giulia Sgattoni, Claudio Pellegrini, Marzia Rovere, and Irene Molinari
The Calabrian accretionary prism is the result of a complex interaction between subduction-related tectonics and sedimentation, active since the Eocene. The limited seismicity recorded in recent years in the area appears mostly associated to the subduction interface and could reflect either a weak subduction coupling or a slow subduction rate. Nevertheless, recent intense deformation and uplift of the seafloor has been observed within the accretionary prism.
The analysis of multichannel 2D and high-quality 3D seismic data, morphobathymetric data and instrumental seismicity, allows defining and characterizing both the deeper and shallower tectonic deformation affecting the northeastern sector of the Calabrian accretionary prism.
Besides the uppermost thrust fault of the Calabrian accretionary prism, that outlines the Crotone promontory, the shallow tectonic pattern of the prism is characterized by a belt of broad flat-topped anticlines, and a set of minor narrow structures, mainly NNW-SSE to N-S oriented, that present a variable relationship with the underlying main thrust faults. The uppermost sedimentary strata within the anticlines are affected by numerous small-scale extensional faults, not rooted at depth, likely due to outer-arc extension above uplifted depocenters. In places, the inversion of basin-bounding faults is also visible. More regularly spaced and cylindrical NW-SE anticlines are also observed in the Gulf of Taranto, in the outer sector of the accretionary prism, where a thrust/back-thrust tectonic style is present. The origin of the anticlines varies within the overall set and reflects the long-term tectonic evolution of the accretionary prism, with the oblique docking of the Calabrian accretionary prism onto the Apulian Escarpment as a key feature.
How to cite: Lipparini, L., Argnani, A., Sgattoni, G., Pellegrini, C., Rovere, M., and Molinari, I.: Structural setting, active tectonics and seafloor morphology of the northeastern Calabria accretionary prism (Ionian Sea, Italy), EGU General Assembly 2022, Vienna, Austria, 23–27 May 2022, EGU22-932, https://doi.org/10.5194/egusphere-egu22-932, 2022.
EGU22-1588 | Presentations | TS4.4 | Highlight
Tracking past earthquakes along the Japan Trench: Fresh initial results from the IODP Japan Trench Paleoseismology ProjectMichael Strasser, Ken Ikehara, Jeremy Everest, and Lena Maeda and the IODP Expedition 386 Science Party
Short historical and even shorter instrumental records limit our perspective of earthquake maximum magnitude and recurrence, and thus are inadequate to fully characterize Earth’s complex and multiscale seismic behavior and its consequences. Examining prehistoric events preserved in the geological record is essential to reconstruct the long-term history of earthquakes and to deliver observational data that help to reduce uncertainties in seismic hazard assessment for long return periods. Motivated by the mission to fill the gap in long-term records of giant (Mw 9 class) earthquakes such as the Tohoku-Oki earthquake in 2011, International Ocean Discovery Program (IODP) Expedition 386, Japan Trench Paleoseismology, was designed to test and further develop submarine paleoseismology in the Japan Trench.
Earthquake rupture propagation to the trench and sediment remobilization related to the 2011 Mw 9.0 Tohoku-Oki earthquake, and the respective structures and deposits are preserved in trench basins formed by flexural bending of the subducting Pacific Plate. These basins are ideal study areas for testing event deposits for earthquake triggering as they have poorly connected sediment transport pathways from the shelf and experience high sedimentation rates and low benthos activity (and thus high preservation potential) in the ultra-deep water hadal environment. Results from conventional coring covering the last ~1,500 y reveal good agreement between the sedimentary record and historical documents. Subbottom profile data are consistent with basin-fill successions of episodic muddy turbidite deposition and thus define clear targets for paleoseismologic investigations on longer timescales accessible only by deeper coring.
In 2021, IODP Expedition 386 successfully collected 29 Giant Piston cores at 15 sites (1 to 3 holes each; total core recovery 831 meters), recovering 20 to 40-meter-long, continuous, upper Pleistocene to Holocene stratigraphic successions of 11 individual trench-fill basins along an axis-parallel transect from 36°N – 40.4°N, at water depth between 7445-8023 m below sea level. The cores are currently being examined by multimethod applications to characterize and date event deposits for which the detailed stratigraphic expressions and spatiotemporal distribution will be analyzed for proxy evidence of giant versus smaller earthquakes versus other driving mechanisms. Initial preliminary results presented in this EGU presentation reveal event-stratigraphic successions comprising several 10s of potentially giant-earthquake related event beds, revealing a fascinating record that will unravel the earthquake history of the different along-strike segments, that is 10–100 times longer than currently available information. The data set will enable a statistically robust assessment of the recurrence patterns of giant earthquakes as input for improved probabilistic seismic hazard assessment and advanced understanding of earthquake-induced geohazards globally.
How to cite: Strasser, M., Ikehara, K., Everest, J., and Maeda, L. and the IODP Expedition 386 Science Party: Tracking past earthquakes along the Japan Trench: Fresh initial results from the IODP Japan Trench Paleoseismology Project, EGU General Assembly 2022, Vienna, Austria, 23–27 May 2022, EGU22-1588, https://doi.org/10.5194/egusphere-egu22-1588, 2022.
EGU22-2942 | Presentations | TS4.4
The Plio-Quaternary activity of the Yusuf Fault System (Alboran Sea; Westernmost Mediterranean): From 3D deep structure to seafloor geomorphologyHector Perea, Sara Martínez-Loriente, Jaume Llopart, Ariadna Canari, Laura Gómez de la Peña, Rafael Bartolomé, and Eulàlia Gràcia
The identification and seismic characterization of the active structures in the Alboran Sea (westernmost Mediterranean) are essential to evaluate better the exposure of the South Iberian Peninsula and Maghreb coasts to different natural hazards. The Alboran Sea accommodates part of the present-day crustal deformation related to the NW-SE convergence (4-5 mm/yr) between the African and Eurasian plates. The area is characterized by low to moderate magnitude instrumental seismicity. However, large earthquakes (I > IX and M > 6.0) have occurred in this region in historical and recent times (i.e., 1522 Almeria, 1790 Oran, 1910 Adra, 1994 and 2004 Al-Hoceima or 2016 Al-Idrissi earthquakes). The dextral strike-slip Yusuf Fault System (YFS) is one of the largest active faults in the Alboran Sea and its seismogenic and tsunamigenic hazard needs to be characterized. The fault system trends WNW-ESE and has a length of ~150 km. Using multi-scale bathymetric (ranging from m to cm) and seismic data and different morphological and seismic analysis tools (i.e., slope or relief image maps), we have imaged and characterized the fault system. The analysis of this dataset reveals that the YFS is a complex structure composed of an array of strike-slip faults. The 3D structural model shows that most of the identified faults reach up and offset the seafloor and the Upper Quaternary sedimentary units. The current morphology of the seafloor is a consequence of the Plio-Quaternary tectonic evolution that have resulted in the formation of a large pull-apart basin, which is deeper than the surrounding areas, a topographic ridge, an elongated depression and morphologic lineaments following its trend. The dataset also images several submarine landslides scars, mainly on the steeper slopes surrounding the pull-apart basin. In addition, the analysis of ultra-high resolution data acquired along the Yusuf lineament with AUV has revealed the presence of a series of en-echelon scarps with heights ranging from few centimeters to less than 10 meter. Seismic profiles across these scarps show that they are related to different fault strands of the YFS that are offsetting the seafloor, possibly because of an earthquake occurred in historical times.
How to cite: Perea, H., Martínez-Loriente, S., Llopart, J., Canari, A., Gómez de la Peña, L., Bartolomé, R., and Gràcia, E.: The Plio-Quaternary activity of the Yusuf Fault System (Alboran Sea; Westernmost Mediterranean): From 3D deep structure to seafloor geomorphology, EGU General Assembly 2022, Vienna, Austria, 23–27 May 2022, EGU22-2942, https://doi.org/10.5194/egusphere-egu22-2942, 2022.
EGU22-4332 | Presentations | TS4.4
Tidal analysis of the NanTroSEIZE Long Term Borehole Monitoring System (LTBMS) pore pressure records at the Nankai margin, SW Japan.Jade Dutilleul and Masataka Kinoshita
In southwestern Japan, the northwestward subduction of the Philippine Sea plate beneath the Eurasian plate results in large magnitude (>8) earthquakes and tsunamis (e.g. 1944 Tonankai and 1946 Nankaido earthquakes) and slow earthquakes at the Nankai margin. As part of the Nankai Trough Seismogenic Zone Experiment (NanTroSEIZE), Long Term Borehole Monitoring Systems (LTBMSs), a suite of high-sensitivity borehole sensors providing real-time observations of hydrologic processes and crustal deformation, were installed from 2010 at 3 boreholes of the International Ocean Discovery Program (IODP).
The pore pressure recorded by the LTBMSs, used as a proxy for volumetric strain, shows transient variations associated with slow slip events (Araki et al., 2017). Similar observations have been made at other subduction zones, like the north Hikurangi margin (e.g. Wallace et al., 2016), highlighting the key role of hydromechanical properties in fault mechanics and processes. The LTBMSs also capture the pore pressure oscillations arising from Earth tides forcing, with diurnal (~24 h) and semidiurnal (~12 h) periods. The phase and amplitude of the tidal signal can be decomposed from the observational data using tidal analysis programs, providing an opportunity to monitor changes related to the hydraulic and poroelastic responses to tectonic loading and transient loading arising from SSEs.
In this study, we use BAYTAP-08 (Tamura and Agnew, 2008), a modified version of the Bayesian Tidal Analysis Program - Grouping Model program of Tamura et al. (1991), to extract the tidal response from the pore pressure recorded at different depth intervals, at three sites: above the updip limit of the locked seismogenic zone at Site C0002 (first-time LTBMS deployment in 2010), at the megasplay fault zone and its footwall at Site C0010 (since 2016) and at the frontal thrust of the accretionary prism at Site C0006 (since 2018).
Tidal amplitudes and phases of semi-diurnal and diurnal tide components were carefully checked for any possible temporal variations, that may be related to subseafloor strain accumulation or coseismic release. We focused on the M2 and O1 canonical components.
Using a 1D poroelastic model, the analytic solution for tidal amplitude and phase was derived and compared with observations. The average amplitude ratio (relative to the seafloor) is 0.62-0.66, which is lower than the theoretical loading efficiency value. The phase lag difference is <1° for all depth intervals, as predicted by the 1D poroelastic theory for the range of permeability values (10-15 to 10-19 m²) determined from core samples (e.g. Reuschlé, 2011; Rowe et al., 2011; Tanikawa et al., 2012, 2014; Chen, 2015; Dutilleul, 2021) or drilling data (e.g. Pwavodi and Doan, 2021). This may be caused by the borehole casing or the LTBMS assembly itself. More careful inspection is on the way.
The removal of the tidal signal computed with BAYTAP-08 provides a clearer residual (i.e. non-tidal) pore pressure signal, which seems to have a long-term variation. It may either be the instrumental drift, but may be related to potential subseafloor strain modulations related to plate convergence and seismic activities.
How to cite: Dutilleul, J. and Kinoshita, M.: Tidal analysis of the NanTroSEIZE Long Term Borehole Monitoring System (LTBMS) pore pressure records at the Nankai margin, SW Japan., EGU General Assembly 2022, Vienna, Austria, 23–27 May 2022, EGU22-4332, https://doi.org/10.5194/egusphere-egu22-4332, 2022.
EGU22-4835 | Presentations | TS4.4
Submarine landslides triggered by the 1663 earthquake (M>7) in the St. Lawrence Estuary, Quebec, CanadaMéril Mérindol, Guillaume Saint-Onge, Nabil Sultan, Patrick Lajeunesse, and Sébastien Garziglia
In eastern Canada, the Charlevoix-Kamouraska/Bas-Saint-Laurent (CKBSL) seismic zone presents a seismic hazard almost as high as the active Pacific zone. The major event of February 5, 1663, with a magnitude estimated at > 7 highlights this important seismic hazard. The numerous submarine landslides mapped in the St. Lawrence Estuary in the CKBSL seismic zone suggest that earthquakes have acted as a trigger for submarine slope failures. In this context, the SLIDE-2020 expedition on board the RV Coriolis II in the St. Lawrence Estuary aimed to map, image and sample more than 12 zones of submarine instabilities and their associated deposits. The analysis of sediment cores sampled in the distal sedimentary deposits from these landslides reveals the presence of rapidly deposited layers (turbidites and debrites) directly linked to the submarine landslides. Dating of these landslides with 210Pb and 14C techniques led to the identification of four periods of synchronous emplacement corresponding to the strongest historical earthquakes: 1663 AD, 1860/1870 AD, 1925 AD and 1988 AD. This synchronicity over a distance reaching 220 km of several landslides supports a relationship between their triggering in the St. Lawrence Estuary and regional seismicity. The fact that as many as 9 submarine landslides appear to have been triggered by the 1663 AD earthquake indicates that this event is the strongest recorded in the last two millennia.
Keywords: 1663 earthquake, Canada, Geohazards, Geophysics, Holocene, Quebec, Paleoseismicity, Sedimentology, Submarine landslides.
How to cite: Mérindol, M., Saint-Onge, G., Sultan, N., Lajeunesse, P., and Garziglia, S.: Submarine landslides triggered by the 1663 earthquake (M>7) in the St. Lawrence Estuary, Quebec, Canada, EGU General Assembly 2022, Vienna, Austria, 23–27 May 2022, EGU22-4835, https://doi.org/10.5194/egusphere-egu22-4835, 2022.
EGU22-7112 | Presentations | TS4.4
Classifying offshore faults for hazard assessment: A new approach based on fault size and vertical displacementMay Laor and Zohar Gvirtzman
For many countries, the methodology for offshore geohazards mitigation lags far behind the well-established onshore methodology. Particularly complicated is the mapping of active faults. One possibility is to follow the onshore practice, i.e., identifying a sub-seabed Holocene horizon and determining whether it displaces this horizon for each fault. In practice, such an analysis requires numerous coring and often ends without an answer.
Here we suggest a new approach aimed for master planning. Based on high-quality seismic data, we measure for each fault the amount of its recent (in our specific case 350 ky) displacement and the size of its plane. According to these two independently measured quantities, we classify the faults into three hazard levels, highlighting the “green” and “red” zone for planning.
Our case study is the Israeli continental slope, where numerous salt-related, thin-skinned, normal faults dissect the seabed, forming tens of meters high scarp, which are crossed by gas pipelines. A particular red zone is the upper slope south of the Dor disturbance, where a series of big listric faults rupture the seabed in an area where the sedimentation rate is four times faster than the displacement rate. We suggest that this indicates seismic rupture rather than creep.
How to cite: Laor, M. and Gvirtzman, Z.: Classifying offshore faults for hazard assessment: A new approach based on fault size and vertical displacement, EGU General Assembly 2022, Vienna, Austria, 23–27 May 2022, EGU22-7112, https://doi.org/10.5194/egusphere-egu22-7112, 2022.
EGU22-11083 | Presentations | TS4.4
Identification and 3D modeling of active faults in the Dubrovnik (Croatia) offshore area – preliminary resultsMarin Sečanj, Bruno Tomljenović, Josip Stipčević, Helena Latečki, and Iva Dasović
The wider region around the city of Dubrovnik, encompassing coastal and offshore area of southern Croatia, is characterized by the relatively high seismicity rate with intermittent occurrence of strong events indicating the ongoing tectonic activity. Historical, instrumental and paleoseismological records show that this area was hit by at least dozen strong earthquakes in the last 500 years. Among these the most significant is the Great Dubrovnik earthquake from 1667 which devastated the region. This and other strong events of this area are related to several individual to composite seismogenic sources that generally extends in NW-SE direction from Albania to the central part of External Dinarides fold-thrust-belt in Croatia, still however, not yet sufficiently known in great details. Here, we aim to present preliminary results of identification and 3-D modeling of distribution and geometry of active faults in the offshore Dubrovnik area, based on analyses of reflection seismic profiles associated with deep borehole and surface geology data provided by the Croatian Hydrocarbon Agency.
Identification and classification of recently active faults in this area were performed by matching at least one of the following criteria: (1) offsets of the Pliocene - Quaternary deposits along faults that could be correlated between neighboring seismic lines, (2) deformation of Pliocene - Quaternary deposits above fault tips and (3) correlation of fault geometry and kinematics with distribution of the earthquake hypocenters and available fault plane solutions. In addition, a long-term neotectonic activity of identified faults has been studied by deformation and truncation of Miocene and Pliocene stratigraphic horizons that are frequently found affected by faults closely related with a long-term salt tectonics activity.
Location and geometry of the identified recently active faults are in good correlation with distribution of instrumentally recorded earthquake locations, where certain events are clustered within narrow zones of delineated fault planes. These preliminary results will be used for 3D geological and structural modelling of active earthquake generating fault systems between the city of Dubrovnik and the town of Ston, cross-section balancing and slip-rate calculation along active faults. In turn, these would provide input data for seismic shaking simulation and future seismic hazard assessment in this area.
How to cite: Sečanj, M., Tomljenović, B., Stipčević, J., Latečki, H., and Dasović, I.: Identification and 3D modeling of active faults in the Dubrovnik (Croatia) offshore area – preliminary results, EGU General Assembly 2022, Vienna, Austria, 23–27 May 2022, EGU22-11083, https://doi.org/10.5194/egusphere-egu22-11083, 2022.
Please decide on your access
Please use the buttons below to download the presentation materials or to visit the external website where the presentation is linked. Regarding the external link, please note that Copernicus Meetings cannot accept any liability for the content and the website you will visit.
Forward to presentation link
You are going to open an external link to the presentation as indicated by the authors. Copernicus Meetings cannot accept any liability for the content and the website you will visit.
We are sorry, but presentations are only available for users who registered for the conference. Thank you.
EGU22-11506 | Presentations | TS4.4
Submarine active tectonics in the south and northwest Iberian marginsAdrià Ramos, Luis Somoza, Teresa Medialdea, Pedro Terrinha, and Juan-Tomás Vázquez
The Iberian Peninsula is surrounded to the north by the convergence margin between Eurasia and the former Iberian plates (North and Northwest Iberian margin), and to the south by a transform plate boundary between Eurasia and Nubia (Gulf of Cádiz) to a shear-compressive indentation of Nubia northwards in the Alborán Sea. These margins are affected by historic and present-day seismicity, which are linked to active tectonic structures deforming the seafloor of the margins. The main objective is to better understand their development in the framework of the present plate organization and thus evaluate the seismic hazard around Iberia. Therefore, we carried out an extensive geophysical characterization of submarine faults, focusing on those that show seabed morphological expressions, by mapping them with high-resolution swath bathymetry data, high-resolution parametric sub-bottom profiles and multichannel 2D seismic profiles. Their activity and distribution are in good agreement with the geodetic and seismological observations.
Our results show that the present-day active tectonics and its related deformation, including seismicity and tsunami-affected coastal areas, are mainly located in the south Iberian margin, around the boundary between the Eurasian and Nubia tectonic plates. The submarine active faults are represented in this margin by a large strike-slip fault system and fold-thrust systems, in response to the NW-SE convergence between the aforementioned tectonic plates. The different orientation and distribution of submarine faults, and the fault type from focal mechanism of seismic events, led us to identify simple and pure shear zones from the Alborán Sea to the east, to the Gibraltar Arc and Gulf of Cadiz to the west. This suggests a strain partitioning model along the plate boundary in response to the present-day shear stress orientation.
Deformation is also documented in the NW Iberian margin. Thrust fault systems with high seismic activity were identified and mapped along Iberian ocean-continent transition around the Galician and Portuguese margins, reflecting the re-activation of former Cenozoic faults. Deformation in this margin is also derived from the westward motion of the Iberian oceanic domain and the clockwise rotation of the Iberian continental domain with respect to the Eurasian plate.
How to cite: Ramos, A., Somoza, L., Medialdea, T., Terrinha, P., and Vázquez, J.-T.: Submarine active tectonics in the south and northwest Iberian margins, EGU General Assembly 2022, Vienna, Austria, 23–27 May 2022, EGU22-11506, https://doi.org/10.5194/egusphere-egu22-11506, 2022.
EGU22-12537 | Presentations | TS4.4
Structural reconstruction and Quaternary evolution of the buried thrust in the central Adriatic Sea (Italy).Francesco Emanuele Maesano, Giovanni Toscani, Yuri Panara, and Roberto Basili
Whenever sedimentation exceeds the tectonic rate, the detection and investigation of active faults become challenging, especially when the investigated area is offshore. The coastal area of the central Adriatic is characterized by the presence of Plio-Pleistocene thrusts, which strongly controlled the evolution of the Apennines foredeep. Apart from the significant exception of the Conero promontory, these thrusts are all blind and have no significant signature in the bathymetry. Nonetheless, the coastal and offshore central Adriatic has experienced some moderate-magnitude seismic sequences related to the frontal thrusts on either side, belonging to the Apennines and the Dinarides chains.
In the last years, multiple studies conducted along the Apennine orogeny assessed the Plio-Pleistocene slip rates using different approaches and methodologies. Fault plane dimensions and attitude are key parameters for seismotectonic information fed into seismic and tsunami hazard analyses. In this work, we present the interpretation of two regional seismic reflection profiles across the central Adriatic, calibrated with the available well-logs, which show the evolution of the thrust system in space and time and their influence on the development of the Apennines foredeep and help to put some constraints to understand the most recent tectonic history of the region.
How to cite: Maesano, F. E., Toscani, G., Panara, Y., and Basili, R.: Structural reconstruction and Quaternary evolution of the buried thrust in the central Adriatic Sea (Italy)., EGU General Assembly 2022, Vienna, Austria, 23–27 May 2022, EGU22-12537, https://doi.org/10.5194/egusphere-egu22-12537, 2022.
EGU22-12572 | Presentations | TS4.4
A releasing-bend at the northern termination of the Alfeo-Etna shear zone (Western Ionian Sea, Italy): seismotectonic implications and relation with Mt. Etna volcanismCarmelo Monaco, Giovanni Barreca, Valentina Bruno, Giorgio De Guidi, Carmelo Ferlito, Salvatore Gambino, Felix Gross, Mario Mattia, and Luciano Scarfì
Offshore data in the western Ionian Sea indicate that the NW-SE trending dextral shear zone of the Alfeo-Etna fault system turns to N-S direction near the Ionian coastline, where the Timpe fault system occurs. This latter deform the lower eastern slope of Mt. Etna, showing NNW-SSE to NNE-SSW orientation and resulting from E-W trending regional extension. They are seismically active having given rise to shallow and low-moderate magnitude earthquakes in the last 150 years. Morpho-structural data show that NW-SE trending right-lateral strike-slip faults connect the Timpe fault system with the upper slope of the volcano, where the eruptive activity mainly occurs along N-S to SW-NE trending fissures. As a whole, morpho-structural, geodetic and seismological data, seismic profiles and bathymetric maps suggest that similar geometric and kinematic features characterize the shear zone both on the eastern flank of the volcano and in the Ionian offshore. The Alfeo-Etna fault system probably represents a major kinematic boundary in the western Ionian Sea associated with the relative motion of Africa and Eurasia since it accommodates, by dextral transtensional kinematics, diverging motions in adjacent western Ionian compartments. Along this major tectonic alignment, crustal structures such as releasing bends, pull-apart basins and extensional horsetails occur both offshore and on-land, where they probably represent the pathway for magma uprising from depth.
How to cite: Monaco, C., Barreca, G., Bruno, V., De Guidi, G., Ferlito, C., Gambino, S., Gross, F., Mattia, M., and Scarfì, L.: A releasing-bend at the northern termination of the Alfeo-Etna shear zone (Western Ionian Sea, Italy): seismotectonic implications and relation with Mt. Etna volcanism, EGU General Assembly 2022, Vienna, Austria, 23–27 May 2022, EGU22-12572, https://doi.org/10.5194/egusphere-egu22-12572, 2022.
EGU22-2188 | Presentations | SM2.1
Locating Nearby Explosions in Fürstenfeldbruck, Germany, Combining 8 Rotational SensorsGizem Izgi, Eva P.S. Eibl, Frank Krüger, and Felix Bernauer
The seismic wavefield can only be completely described by the combination of translation, rotation and strain. Direct measurement of rotational motions in combination with the translational motions allow observing the complete seismic ground motion. Portable blueSeis-3A (iXblue) sensors allow to measure 3 components of rotational motions. We co-located Nanometrics Horizon seismometers with blueSeis-3A sensors and measured the full wavefield.
An active source experiment was performed in Fürstenfeldbruck, Germany in November 2019, in order to further investigate the performance of multiple rotational instruments in combination with seismometers. Within the scope of the experiment 5 explosions took place. For the first two explosions, all 8 rotational sensors were located inside of a bunker while for the rest of explosions, 4 sensors each were located at 2 different sites of the field. One group was co-located with translational seismometers. This is the first time the recordings of 8 rotational sensors are combined for event analysis and location. We calculate and intersect the back azimuths and derive phase velocities of the five explosions.
We discuss the reliability of the data recorded by the rotational sensors for further investigations in other environments.
How to cite: Izgi, G., Eibl, E. P. S., Krüger, F., and Bernauer, F.: Locating Nearby Explosions in Fürstenfeldbruck, Germany, Combining 8 Rotational Sensors, EGU General Assembly 2022, Vienna, Austria, 23–27 May 2022, EGU22-2188, https://doi.org/10.5194/egusphere-egu22-2188, 2022.
Please decide on your access
Please use the buttons below to download the presentation materials or to visit the external website where the presentation is linked. Regarding the external link, please note that Copernicus Meetings cannot accept any liability for the content and the website you will visit.
Forward to presentation link
You are going to open an external link to the presentation as indicated by the authors. Copernicus Meetings cannot accept any liability for the content and the website you will visit.
We are sorry, but presentations are only available for users who registered for the conference. Thank you.
EGU22-2455 | Presentations | SM2.1
Understanding surface-wave modal content for high-resolution imaging with ocean-bottom distributed acoustic sensingZack Spica, Loïc Viens, Mathieu Perton, Kiwamu Nishida, Takeshi Akuhara, Masanao Shinohara, and Tomoaki Yamada
Ocean Bottom Distributed Acoustic Sensing (OBDAS) is emerging as a new measurement method providing dense, high-fidelity, and broadband seismic observations from fiber-optic cables. Here, we use ~40 km of a telecommunication cable located offshore the Sanriku region, Japan, and apply ambient seismic field interferometry to obtain an extended 2-D high-resolution shear-wave velocity model. In some regions of the array, we observe and invert more than 20 higher modes and show that the accuracy of the retrieval of some modes strongly depends on the processing steps applied to the data. In addition, numerical simulations suggest that the number of modes that can be retrieved is proportional to the local velocity gradient under the cable. Regions with shallow low-velocity layers tend to contain more modes than those located in steep bathymetry areas, where sediments accumulate less. Finally, we can resolve sharp horizontal velocity contrasts under the cable suggesting the presence of faults and other sedimentary features. Our results provide new constraints on the shallow submarine structure in the area and further demonstrate the potential of OBDAS for offshore geophysical prospecting.
How to cite: Spica, Z., Viens, L., Perton, M., Nishida, K., Akuhara, T., Shinohara, M., and Yamada, T.: Understanding surface-wave modal content for high-resolution imaging with ocean-bottom distributed acoustic sensing, EGU General Assembly 2022, Vienna, Austria, 23–27 May 2022, EGU22-2455, https://doi.org/10.5194/egusphere-egu22-2455, 2022.
EGU22-2563 | Presentations | SM2.1
On the Multi-component Information of DAS for Near-Surface Seismic: A Pilot Field Experiment in the Groningen AreaMusab Al Hasani, Guy Drijkoningen, and Kees Wapenaar
In a surface-seismic setting, Distributed Acoustic Sensing (DAS) is still not a widely adopted method for near-surface characterisation, especially for reflection seismic imaging, despite the dense spatial sampling it provides over long distances. This is mainly due to the decreased broadside sensitivity that DAS suffers from when buried horizontally in the ground (that is when the upgoing wavefield (e.g. reflected wavefield) is perpendicular to the optical fibre). This is unlike borehole settings (e.g. zero-offset Vertical Seismic Profiling), where DAS has been widely adopted for many monitoring applications. Advancements in the field, like shaping the fibre to a helix, commonly known as helically wound fibre, allow better sensitivity for the reflections.
The promise of spatially dense seismic data over long distances is an attractive prospect for retrieving the local variations of near-surface properties. This is particularly valuable for areas impacted by induced seismicity, as is the case in the Groningen Province in the north of The Netherlands, where near-surface properties, mostly composed of clays and peats, play an essential role on the amount of damage on the very near-surface and the structures built on it. Installing fibre-optic cables for passive and active measurements is valuable in this situation. We installed multiple cables containing different fibre configurations of straight and helically wound fibres, buried in a 2-m deep trench. The combination of the different fibre configurations allows us to obtain multi-component information. We observe differences in the amplitude and phase information, suggesting that these differences can be used for separating the different components of the wave motion. We also see that using enhanced backscatter fibres, reflection images can be obtained for the helically wound fibre as well as the straight fibre, despite the decreased broadside sensitivity for the latter.
How to cite: Al Hasani, M., Drijkoningen, G., and Wapenaar, K.: On the Multi-component Information of DAS for Near-Surface Seismic: A Pilot Field Experiment in the Groningen Area, EGU General Assembly 2022, Vienna, Austria, 23–27 May 2022, EGU22-2563, https://doi.org/10.5194/egusphere-egu22-2563, 2022.
EGU22-3404 | Presentations | SM2.1 | Highlight
Fibre-optic observation of volcanic tremor through floating ice sheet resonanceAndreas Fichtner, Sara Klaasen, Sölvi Thrastarson, Yesim Cubuk-Sabuncu, Patrick Paitz, and Kristin Jonsdottir
We report on the indirect observation of low-frequency tremor at Grimsvötn, Iceland, via resonance of an ice sheet, floating atop a volcanically heated subglacial lake.
Entirely covered by Europe’s largest glacier, Vatnajökull, Grimsvötn is among Iceland’s largest and most active volcanoes. In addition to flood hazards, ash clouds pose a threat to settlements and air traffic, as direct interactions between magma and meltwater cause Grímsvötn to erupt explosively. To study the seismicity and structure of Grimsvötn in detail, we deployed a 12.5 km long fibre-optic cable around and inside the caldera, which we used for Distributed Acoustic Sensing (DAS) measurements in May 2021.
The experiment revealed a previously unknown level of seismicity, with nearly 2’000 earthquake detections in less than one month. Furthermore, the cable segment within the caldera recorded continuous and nearly monochromatic oscillations at 0.23 Hz. This corresponds to the expected fundamental-mode resonance frequency of flexural waves within the floating ice sheet, which effectively acts as a damped harmonic oscillator with Q around 15.
In spite of the ice sheet being affected by ambient noise at slightly lower frequencies, the resonance amplitude does not generally correlate with the level of ambient noise throughout southern Iceland. It follows that an additional and spatially localised forcing term is required to explain the observations. A linear inversion reveals that the forcing acts continuously, with periods of higher or lower activity alternating over time scales of a few days.
A plausible explanation for the additional resonance forcing is volcanic tremor, most likely related to geothermal activity, that shows surface expressions in the form of cauldrons and fumaroles along the caldera rim. Being largely below the instrument noise at channels outside the caldera, the ice sheet resonance acts as a magnifying glass that increases tremor amplitudes to an observable level, thereby providing a new and unconventional form of seismic volcano monitoring.
How to cite: Fichtner, A., Klaasen, S., Thrastarson, S., Cubuk-Sabuncu, Y., Paitz, P., and Jonsdottir, K.: Fibre-optic observation of volcanic tremor through floating ice sheet resonance, EGU General Assembly 2022, Vienna, Austria, 23–27 May 2022, EGU22-3404, https://doi.org/10.5194/egusphere-egu22-3404, 2022.
Please decide on your access
Please use the buttons below to download the presentation materials or to visit the external website where the presentation is linked. Regarding the external link, please note that Copernicus Meetings cannot accept any liability for the content and the website you will visit.
Forward to presentation link
You are going to open an external link to the presentation as indicated by the authors. Copernicus Meetings cannot accept any liability for the content and the website you will visit.
We are sorry, but presentations are only available for users who registered for the conference. Thank you.

EGU22-3728 | Presentations | SM2.1
Detecting earthen dam defects using seismic interferometry monitoring on Distributed Acoustic Sensing dataAurelien Mordret, Anna Stork, Sam Johansson, Anais Lavoue, Sophie Beaupretre, Romeo Courbis, Ari David, and Richard Lynch
Earthen dams and embankments are prone to internal erosion, their most significant source of failure. Standard monitoring techniques often measure erosion effects when they appear at the surface, reducing the potential response time to address the problem before failure. Through their integrative sensitivity along their propagation, seismic signals are well suited to assess mechanical changes in the bulk of a dam. Moreover, seismic velocities are strongly sensitive to porosity, pore pressure, and water saturation, physical properties that vary the most for internal erosion. Here, we used fiber optics and a Distributed Acoustic Sensing (DAS) array installed on an experimental dam with built-in defects to record the ambient seismic wavefield for one month while the dam reservoir is gradually filled up. The position and nature of the dam defects are unknown to us, to allow an actual blind-detection experiment. We computed cross-correlations between equidistant channels along the dam every 15 minutes and monitored the relative seismic velocity changes at each location for the whole month. The results show a strong correlation of the velocity changes with the water level in the reservoir at all locations along the dam. We also observe systematic deviations from the average velocity change trend. We interpret these anomalies as the effects of the built-in defects placed at different positions in the bulk of the dam. The careful analysis of the residual velocity changes allows us to hypothesize on the position and nature of the defects.
How to cite: Mordret, A., Stork, A., Johansson, S., Lavoue, A., Beaupretre, S., Courbis, R., David, A., and Lynch, R.: Detecting earthen dam defects using seismic interferometry monitoring on Distributed Acoustic Sensing data, EGU General Assembly 2022, Vienna, Austria, 23–27 May 2022, EGU22-3728, https://doi.org/10.5194/egusphere-egu22-3728, 2022.
Please decide on your access
Please use the buttons below to download the presentation materials or to visit the external website where the presentation is linked. Regarding the external link, please note that Copernicus Meetings cannot accept any liability for the content and the website you will visit.
Forward to presentation link
You are going to open an external link to the presentation as indicated by the authors. Copernicus Meetings cannot accept any liability for the content and the website you will visit.
We are sorry, but presentations are only available for users who registered for the conference. Thank you.

EGU22-3729 | Presentations | SM2.1
The Potential of DAS on Underwater Suspended Cables for Oceanic Current Monitoring and Failure Assessment of Fiber Optic CablesDaniel Mata, Jean-Paul Ampuero, Diego Mercerat, Diane Rivet, and Anthony Sladen
Distributed Acoustic Sensing (DAS) enables the use of existing underwater telecommunication cables as multi-sensor arrays. The great majority of underwater telecommunication cables are deployed from the water surface and the coupling between the cable and the seafloor is not fully controlled. This implies that there exists many poorly coupled cable segments less useful for seismological research. In particular, underwater cables include segments that are suspended in the water column across seafloor valleys or other bathymetry irregularities. However, it might be possible to use DAS along the suspended sections of underwater telecommunication cables for other purposes. A first one investigated here is the ability to monitor deep-ocean currents. It is common to observe that some particular sections of a cable oscillate with great amplitudes. These oscillations are commonly interpreted as due to vortex shedding induced by the currents. We investigate this hypothesis by estimating the oceanic current speeds from vortex frequencies measured in two underwater fiber optic cables located at Methoni, Greece, and another in Toulon, France. Our results in Greece are in agreement with in-situ historical measurements of seafloor currents while our estimations in Toulon are compatible with synchronous measurements of a nearby current meter. These different measurements therefore point to the possibility to exploit DAS measurements as a tool to monitor the activity of seafloor currents. A second possible application of DAS is to estimate how the cable is coupled to the seafloor, even in the absence of the strong oscillations associated to vortex shedding. For that, we have analyzed the spectral signature of the different cables. Some sections feature fundamental frequencies as expected from a theoretical model of in-plane vibration of hanging cables. By analyzing how the fundamental frequencies change along the cable, we are potentially inferring the contact points of the cable with the seafloor, which will promote fatigue of the cable and potential failure. This mapping of the coupling characteristics of the cable with the seafloor could also be useful to better interpret other DAS signals.
How to cite: Mata, D., Ampuero, J.-P., Mercerat, D., Rivet, D., and Sladen, A.: The Potential of DAS on Underwater Suspended Cables for Oceanic Current Monitoring and Failure Assessment of Fiber Optic Cables, EGU General Assembly 2022, Vienna, Austria, 23–27 May 2022, EGU22-3729, https://doi.org/10.5194/egusphere-egu22-3729, 2022.
EGU22-4014 | Presentations | SM2.1
Near-field observations of snow-avalanches propagating over a fiber-optic arrayPatrick Paitz, Pascal Edme, Andreas Fichtner, Nadja Lindner, Betty Sovilla, and Fabian Walter
We present and evaluate array processing techniques and algorithms for the characterization of snow avalanche signals recorded with Distributed Acoustic Sensing (DAS).
Avalanche observations rely on comprehensive measurements of sudden and rapid snow mass movement that is hard to predict. Conventional avalanche sensors are limited to observations on or above the surface. Recently, seismic sensors have increased in their popularity for avalanche monitoring and characterization due to their avalanche detection and characterization capabilities. To date, however, seismic instrumentation in avalanche terrain is sparse, thereby limiting the spatial resolution significantly.
As an addition to conventional seismic instrumentation, we propose DAS to measure avalanche-induced ground motion. DAS is a technology using backscattered light along a fiber-optic cable to measure strain (-rate) along the fiber with unprecedented spatial and temporal resolution - in our example with 2 m spatial sampling and a sampling rate of 1kHz.
We analyze DAS data recorded during winter 2020/2021 at the Valleé de la Sionne avalanche test site in the Swiss Alps, utilizing an existing 700 m long fiber-optic cable. Our observations include avalanches propagating on top of the buried cable, delivering near-field observations of avalanche-ground interactions. After analyzing the properties of near-field avalanche DAS recordings, we discuss and evaluate algorithms for (1) automatic avalanche detection, (2) avalanche surge propagation speed evaluation and (3) subsurface property estimation.
Our analysis highlights the complexity of near-field DAS data, as well as the suitability of DAS-based monitoring of avalanches and other hazardous granular flows. Moreover, the clear detectability of avalanche signals using existing fiber-optic infrastructure of telecommunication networks opens the opportunity for unrivalled warning capabilities in Alpine environments.
How to cite: Paitz, P., Edme, P., Fichtner, A., Lindner, N., Sovilla, B., and Walter, F.: Near-field observations of snow-avalanches propagating over a fiber-optic array, EGU General Assembly 2022, Vienna, Austria, 23–27 May 2022, EGU22-4014, https://doi.org/10.5194/egusphere-egu22-4014, 2022.
EGU22-4478 | Presentations | SM2.1
Non-linear ground response triggered by volcanic explosions at Etna Volcano, ItalyPhilippe Jousset, Lucile Costes, Gilda Currenti, Benjamin Schwarz, Rosalba Napoli, Sergio Diaz, and Charlotte Krawczyk
Volcanic explosions produce energy that propagates both in the subsurface as seismic waves and in the atmosphere as acoustic waves. We analyse thousands of explosions which occurred at different craters at Etna volcano (Italy) in 2018 and 2019. We recorded signals from infrasound sensors, geophones (GPH), broadband seismometers (BB) and Distributed Acoustic Sensing (DAS) with fibre optic cable. The instruments were deployed at Piano delle Concazze at about 2 to 2.5 km from the active craters, within (or onto) a ~300,000 m2 scoria layer deposited by recent volcanic eruptions. The DAS interrogator was setup inside the Pizzi Deneri Volcanic Observatory (~2800 m elevation). Infrasonic explosion records span over a large range of pressure amplitudes with the largest one reaching 130 Pa (peak to peak), with an energy of ca. 2.5x10¹¹ J. In the DAS and the BB records, we find a 4-s long seismic “low frequency” signal (1-2 Hz) corresponding to the seismic waves, followed by a 2-s long “high-frequency” signal (16-21 Hz), induced by the infrasound pressure pulse. The infrasound sensors contain a 1-2 Hz infrasound pulse, but surprisingly no high frequency signal. At locations where the scoria layer is very thin or even non-existent, this high frequency signal is absent from both DAS strain-rate records and BB/GPH velocity seismograms. These observations suggest that the scoria layer is excited by the infrasound pressure pulse, leading to the resonance of lose material above more competent substratum. We relate the high frequency resonance to the layer thickness. Multichannel Analysis of Surface Wave from jumps performed along the fibre optic cable provide the structure of the subsurface, and confirm thicknesses derived from the explosion analysis. As not all captured explosions led to the observation of these high frequency resonance, we systematically analyze the amplitudes of the incident pressure wave versus the recorded strain and find a non-linear relationship between the two. This non-linear behaviour is likely to be found at other explosive volcanoes. Furthermore, our observations suggest it might also be triggered by other atmospheric pressure sources, like thunderstorms. This analysis can lead to a better understanding of acoustic-to-seismic ground coupling and near-surface rock response from natural, but also anthropogenic sources, such as fireworks and gas explosions.
How to cite: Jousset, P., Costes, L., Currenti, G., Schwarz, B., Napoli, R., Diaz, S., and Krawczyk, C.: Non-linear ground response triggered by volcanic explosions at Etna Volcano, Italy, EGU General Assembly 2022, Vienna, Austria, 23–27 May 2022, EGU22-4478, https://doi.org/10.5194/egusphere-egu22-4478, 2022.
EGU22-4583 | Presentations | SM2.1
Dynamic weakening in carbonate-built seismic faults: insights from laboratory experiments with fast and ultra-localized temperature measurementsStefano Aretusini, Arantzazu Nuñez Cascajero, Chiara Cornelio, Xabier Barrero Echevarria, Elena Spagnuolo, Alberto Tapetado, Carmen Vazquez, Massimo Cocco, and Giulio Di Toro
During earthquakes, seismic slip along faults is localized in < 1 cm-thick principal slipping zones. In such thin slipping zones, frictional heating induces a temperature increase which activates deformation processes and chemical reactions resulting in dramatic decrease of the fault strength (i.e., enhanced dynamic weakening) and, in a negative feedback loop, in the decrease of the frictional heating itself.
In the laboratory, temperature measurements in slipping zones are extremely challenging, especially at the fast slip rates and large slip displacements typical of natural earthquakes. Recently, we measured the temperature evolution in the slipping zone of simulated earthquakes at high acquisition rates (∼ kHz) and spatial resolutions (<< 1 mm2). To this end, we used optical fibres, which convey IR radiation from the hot rubbing surfaces to a two color pyrometer, equipped with photodetectors which convert the radiation into electric signals. The measured signals were calibrated into temperature and then synchronized with the mechanical data (e.g., slip rate, friction coefficient, shear stress) to relate the dynamic fault strength to the temperature evolution and eventually constrain the deformation processes and associated chemical reactions activated during seismic slip.
Here, we reproduce earthquake slip via rotary shear experiments performed on solid cylinders (= bare rock surfaces) and on gouge layers both made of 99.9% calcite. The applied effective normal stress is 20 MPa. Bare rock surfaces are slid for 20 m with a trapezoidal velocity function with a target slip rate of 6 m/s. Instead, the gouge layers are sheared imposing a trapezoidal (1 m/s target slip rate for 1 m displacement) and Yoffe (3.5 m/s peak slip rate, and 1.5 m displacement) velocity function. The temperature measured within the slipping zone, which in some experiments increases up to 1000 °C after few milliseconds from slip initiation, allow us to investigate the deformation mechanisms responsible for fault dynamic weakening over temporal (milliseconds) and spatial (contact areas << 1 mm2) scales which are impossible to detect with traditional techniques (i.e., thermocouples or thermal cameras).
Importantly, thanks to FE numerical simulations, these in-situ temperature measurements allow us to quantify the partitioning of the dissipated energy and power between frictional heating (temperature increase) and wear processes (e.g., grain comminution), to probe the effectiveness of other energy sinks (e.g., endothermic reactions, phase changes) that would buffer the temperature increase, and to determine the role of strain localization in controlling the temperature increase. The generalization of our experimental data and observations will contribute to shed light on the mechanics of carbonate-hosted earthquakes, a main hazard in the Mediterranean and other areas worldwide.
How to cite: Aretusini, S., Nuñez Cascajero, A., Cornelio, C., Barrero Echevarria, X., Spagnuolo, E., Tapetado, A., Vazquez, C., Cocco, M., and Di Toro, G.: Dynamic weakening in carbonate-built seismic faults: insights from laboratory experiments with fast and ultra-localized temperature measurements, EGU General Assembly 2022, Vienna, Austria, 23–27 May 2022, EGU22-4583, https://doi.org/10.5194/egusphere-egu22-4583, 2022.
Please decide on your access
Please use the buttons below to download the presentation materials or to visit the external website where the presentation is linked. Regarding the external link, please note that Copernicus Meetings cannot accept any liability for the content and the website you will visit.
Forward to presentation link
You are going to open an external link to the presentation as indicated by the authors. Copernicus Meetings cannot accept any liability for the content and the website you will visit.
We are sorry, but presentations are only available for users who registered for the conference. Thank you.
EGU22-4963 | Presentations | SM2.1
A real-time classification method for pipeline monitoring combining Distributed Acoustic Sensing and Distributed Temperature and Strain SensingCamille Huynh, Camille Jestin, Clément Hibert, Jean-Philippe Malet, Vincent Lanticq, and Pierre Clément
Distributed Fiber Optic Systems (DFOSs) refer to an ensemble of innovative technology that turns an optical fiber into a vast network of hundreds to thousands equally spaced sensors. According to the nature of the sensor, one can be sensitive to acoustic vibration (Distributed Acoustic Sensing, DAS) or to strain and temperature variation (Distributed Temperature and Strain Sensing, DTSS). DAS systems are well suited to detect short-term events in contrast to DTSS systems, which are intended to prevent long-term events. A combination of these two systems appears to be a good way to prevent against most possible events that can appear along an infrastructure. Furthermore, DFOS systems allow the interrogation of long profiles with very dense spatial and temporal sampling. Handling such amounts of data then appears as a challenge when trying to identify a threat along the structure. Machine learning solutions then proves their relevance for robust, fast and efficient acoustical event classification.
The goal of our study is to develop a method to handle, in real time, acquired data from these two DFOSs, classify them according to the nature of their origin and trigger an alarm if required. We mainly focus on major threats that jeopardize the integrity of pipelines. Our database contains leaks, landslides, and third-party intrusion (footsteps, excavations, drillings, etc.) simulated and measured at FEBUS Optics test bench in South-West France. Water and air leaks were simulated using electrovalves of several diameters (1mm, 3mm and 5mm), and landslides with a plate whose inclination was controlled by 4 cylinders. These data were acquired under controlled conditions in a small-scale model of pipeline (around 20m long) along different fiber optic cables installed along the structure.
Our method relies on several tools. A Machine Learning algorithm called Random Forest is used to pre-classify the DAS signal. Our implementation of this algorithm works in flow for a real time event identification. For DTSS signal, a simple threshold is used to detect if a strain or temperature variation occurs. Both results are then gathered and analyzed using a decisional table to return a classification result. According to the potential threat represented by its identified class, the event is considered as dangerous or not. Using this method, we obtain good results with a good classification rate (threat/non-threat) of 93%, compared to 87% if the DAS is used without the DTSS. We have noticed that the combination of both devices enables a better classification, especially for landslides hard to detect with the DAS. This combination enables to dramatically reduce the part of undetected threats from 16% to 4%.
How to cite: Huynh, C., Jestin, C., Hibert, C., Malet, J.-P., Lanticq, V., and Clément, P.: A real-time classification method for pipeline monitoring combining Distributed Acoustic Sensing and Distributed Temperature and Strain Sensing, EGU General Assembly 2022, Vienna, Austria, 23–27 May 2022, EGU22-4963, https://doi.org/10.5194/egusphere-egu22-4963, 2022.
EGU22-5327 | Presentations | SM2.1
HDAS (High-Fidelity Distributed Acoustic Sensing) as a monitoring tool during 2021 Cumbre Vieja eruptionJosé Barrancos, Luca D'Auria, Germán Padilla, Javier Preciado-Garbayo, and Nemesio M. Pérez
La Palma is the second youngest and westernmost among Canary Island. Cumbre Vieja volcano formed in the last stage of the geological evolution of the island and had suffered eight volcanic eruptions over the previous 500 years. In 2017, two remarkable seismic swarms interrupted a seismic silence from the last eruption (Teneguía, 1971). Since then, nine additional seismic swarms have occurred at Cumbre Vieja volcano. On September 11th, 2021, seismic activity began to increase, and the depths of the earthquakes showed an upward migration. Finally, on September 19th, the eruption started after just a week of precursors.
During recent years, the seismic activity has been recorded by Red Sísmica Canaria (C7), composed of 6 seismic broadband stations, which was reinforced during the eruption by five additional broadband stations, three accelerometers and a seismic array consisting of 10 broadband stations.
Furthermore, as a result of a collaboration between INVOLCAN, ITER, CANALINK and Aragón Photonics Labs, it was possible to install, on October 19th, an HDAS (High-fidelity Distributed Acoustic Sensor). The HDAS was installed about 10 km from the eruptive vent and was connected to a submarine fibre optic cable directed toward Tenerife Island. Since then, the HDAS has been recording seismic with a temporal sampling rate of 100 Hz and a spatial sampling rate of 10m for a total length of 50 km using Raman Amplification. For more than two months, in addition to the intense volcanic tremor, the HDAS recorded thousands of earthquakes as well as regional and teleseismic events. On December 13th, 2021, after an intense paroxysmal phase with an eruptive column that reached 8 km in height, the volcanic tremor quickly decreased, and the eruption suddenly stopped. Only a weak volcano-tectonic seismicity and small amplitude long-period events were recorded in the next month.
This valuable dataset will provide a milestone for the development of techniques aimed at using DAS as a real-time volcano monitoring tool and studying the internal structure of active volcanoes.
How to cite: Barrancos, J., D'Auria, L., Padilla, G., Preciado-Garbayo, J., and Pérez, N. M.: HDAS (High-Fidelity Distributed Acoustic Sensing) as a monitoring tool during 2021 Cumbre Vieja eruption, EGU General Assembly 2022, Vienna, Austria, 23–27 May 2022, EGU22-5327, https://doi.org/10.5194/egusphere-egu22-5327, 2022.
Please decide on your access
Please use the buttons below to download the presentation materials or to visit the external website where the presentation is linked. Regarding the external link, please note that Copernicus Meetings cannot accept any liability for the content and the website you will visit.
Forward to presentation link
You are going to open an external link to the presentation as indicated by the authors. Copernicus Meetings cannot accept any liability for the content and the website you will visit.
We are sorry, but presentations are only available for users who registered for the conference. Thank you.

EGU22-5551 | Presentations | SM2.1
A showcase pilot of seismic campaign using Distributed Acoustic Sensing solutionsCamille Jestin, Christophe Maisons, Aurélien Chérubini, Laure Duboeuf, and Jean-Claude Puech
Distributed Acoustic Sensing (DAS) is a rapidly evolving technology that can turn a fibre optic cable into thousands of acoustic sensors. In this study, we propose to present a seismic survey conducted as a business showcase relying on a collaborative work supported by five partners: FEBUS Optics, RealTimeSeismic (RTS), Gallego Technic Geophysics (GTG), Petro LS and Well-SENSE. The project was carried out at a deep solution mining site developed for salt production, operated by KEMONE, and located nearby Montpellier (South of France).
The seismic campaign was based on two different cable deployments.
On the first hand, a Vertical Seismic Profile survey was conducted on borehole seismic measurements using two different fibre optic cables deployed in a 1800m deep vertical well. The first set of tests was performed along a Petro LS wireline cable including optical fibres. This deployment corresponds to a conventional wireline operation. The second set of data has been acquired along a FibreLine Intervention system (FLI) developed by WellSENSE. The deployment of the FLI system relies on the unspooling a bare optical fibre using a probe along a wellbore. This solution is single-use and sacrificial and can be left in the well at the end of the survey.
On another hand, a short 400m-surface 2D profile has been achieved along both a fibre optic cable and a set of STRYDE nodes deployed by GTG.
Fibre optic cables have been connected to FEBUS DAS interrogator to collect distributed acoustic measurements. The seismic tests, performed in collaboration with GTG, have been achieved with basic “weight drops” (1T falling from 4m) for the checkshot surveys and with an "IVI Mark 4" 44,000-pound seismic vibrator for VSP shots at offset from wellhead reaching 865m. Acquired data have been analysed by RTS.
This work will describe the survey, present the results, and discuss the learnings in two ways: the optimisation of acquisition setups and processing parameters to obtain the best exploitable results and seismic surveys perspectives and challenges using DAS technology.
How to cite: Jestin, C., Maisons, C., Chérubini, A., Duboeuf, L., and Puech, J.-C.: A showcase pilot of seismic campaign using Distributed Acoustic Sensing solutions, EGU General Assembly 2022, Vienna, Austria, 23–27 May 2022, EGU22-5551, https://doi.org/10.5194/egusphere-egu22-5551, 2022.
EGU22-5743 | Presentations | SM2.1
Making sense of urban DAS data with clustering of coherence-based array featuresJulius Grimm and Piero Poli
Seismic noise monitoring in urban areas can yield valuable information about near-surface structures and noise sources like traffic activity. Distributed Acoustic Sensing (DAS) is ideal for this task due to its dense spatial resolution and the abundance of existing fiber-optic cables below cities.
A 15 km long dark fiber below the city of Grenoble was transformed into a dense seismic antenna by connecting it to a Febus A1-R interrogator unit. The DAS system acquired data continuosly for 11 days with a sampling frequency of 250 Hz and a channel spacing of 19.2 m, resulting in a total of 782 channels. The cable runs through the entirety of the city, crossing below streets, tram tracks and a river. Various noise sources are visible on the raw strain-rate data. A local earthquake (1.3 MLv) was also recorded during the acquisition period.
To characterize the wavefield, the data is divided into smaller sub-windows and coherence matrices at different frequency bands are computed for each sub-window. Clustering is then performed directly on the covariance matrices, with the goal of identifying repeating sub-structures in the covariance matrices (e.g. localized repeating noise sources). Finding underlying patterns in the complex dataset helps us to better understand the spatio-temporal distribution of the occurring signals.
How to cite: Grimm, J. and Poli, P.: Making sense of urban DAS data with clustering of coherence-based array features, EGU General Assembly 2022, Vienna, Austria, 23–27 May 2022, EGU22-5743, https://doi.org/10.5194/egusphere-egu22-5743, 2022.
EGU22-5952 | Presentations | SM2.1
Strombolian seismic activity characterisation using fibre-optic cable and distributed acoustic sensingJean-Philippe Metaxian, Francesco Biagioli, Maurizio Ripepe, Eléonore Stutzmann, Pascal Bernard, Roberto Longo, Marie-Paule Bouin, and Corentin Caudron
Stromboli is an open-conduit volcano characterized by mild intermittent explosive activity that produces jets of gas and incandescent blocks. Explosions occur at a typical rate of 3-10 events per hour, VLP signals have dominant periods between 2 and 30 seconds. Seismic activity is also characterized by less energy short-period volcanic tremor related to the continuous out-bursting of small gas bubbles in the upper part of the magmatic column. The high rate of activity as well as the broadband frequency contents of emitted signals make Stromboli volcano an ideal site for testing new techniques of fibre-optic sensing.
In September 2020, approximately 1 km of fiber-optic cable was deployed on the Northeast flank of Stromboli volcano, together with several seismometers, to record the seismic signals radiated by the persistent Strombolian activity via both DAS and inertial-seismometers, and to compare their records.
The cable was buried manually about 30 cm deep over a relatively linear path at first and in a triangle-shaped array with 30-meters-long sides in the highest part of the deployment. The strain rate was recorded using a DAS interrogator Febus A1-R with a sampling frequency of 2000 Hz, a spatial interval of 2.4 m and a gauge length of 5m. Data were re-sampled at 200 Hz. A network of 22 nodes SmartSolo IGU-16HR 3C geophones (5 Hz) has been distributed over the fibre path. A Guralp digitizer equipped with a CMG CMG-40T 30 sec seismometer and an infrasound sensor were placed in the upper part of the path. The geolocation of the cable was obtained by performing kinematic GPS measurements with 2 Leica GR25 receivers. All equipment recorded simultaneously several hundreds of explosion quakes between September 20 and 23.
Data analysis provided the following main results:
- DAS interrogator clearly recorded the numerous explosion-quakes which occurred during the experiment, as well as lower amplitude tremor and LP events.
- DAS spectrum exhibits a lower resolution at long periods with a cut-off frequency of approximately 3 Hz.
- VLP seismic events generated by Strombolian activity are identified only at a few DAS channels belonging to a specific portion of the path, which seems affected by local amplification. At these channels, they display waveforms similar to those sensed by the Güralp CMG-40T.
- Comparison of DAS strain waveform to particle velocity recorded by co-located seismometers shows a perfect match in phase and a good agreement in amplitude.
- Beamforming methods have been applied to nodes data located on the upper triangle and to strain rate data, both in the 3-5 Hz frequency band. Slightly different back-azimuths were obtained, values estimated via DAS point more to the southwest with respect to the crater area. Apparent velocities obtained with DAS recordings have lower values compared to those obtained with nodes.
How to cite: Metaxian, J.-P., Biagioli, F., Ripepe, M., Stutzmann, E., Bernard, P., Longo, R., Bouin, M.-P., and Caudron, C.: Strombolian seismic activity characterisation using fibre-optic cable and distributed acoustic sensing, EGU General Assembly 2022, Vienna, Austria, 23–27 May 2022, EGU22-5952, https://doi.org/10.5194/egusphere-egu22-5952, 2022.
EGU22-6580 | Presentations | SM2.1
Quantifying microseismic noise generation from coastal reflection of gravity waves using DASGauthier Guerin, Diane Rivet, Martijn van den Ende, Eléonore Stutzmann, Anthony Sladen, and Jean-Paul Ampuero
Secondary microseisms are the most energetic noise in continuous seismometer recordings, and they are generated by interactions between ocean waves. Coastal reflections of ocean waves leading to coastal microseismic sources are hard to estimate in various global numerical wave models, and independent quantification of these coastal sources through direct measurements can therefore greatly improve these models. Here, we exploit a 40 km long submarine optical fiber cable located offshore Toulon, France using Distributed Acoustic Sensing (DAS). We record both the amplitude and frequency of ocean gravity waves, as well as secondary microseisms caused by the interaction of gravity waves incident and reflected from the coast. By leveraging the spatially distributed nature of DAS measurements, additional fundamental information are recovered such as the velocity and azimuth of the waves. On average, 30\% of the gravity waves are reflected at the shore and lead to the generation of local secondary microseisms that manifest as Scholte waves. These local sources can give way to other sources depending on the characteristics of the swell, such as its azimuth or its strength. These sources represent the most energetic contribution to the secondary microseism recorded along the optical fiber, as well as on an onshore broadband station. Furthermore, we estimate the coastal reflection coefficient R$^2$ to be constant at around 0.07 for our 5-day time series. The use of DAS in an underwater environment provides a wealth of information on coastal reflection sources, reflection of gravity waves and new constraints for numerical models of microseismic noise.
How to cite: Guerin, G., Rivet, D., van den Ende, M., Stutzmann, E., Sladen, A., and Ampuero, J.-P.: Quantifying microseismic noise generation from coastal reflection of gravity waves using DAS, EGU General Assembly 2022, Vienna, Austria, 23–27 May 2022, EGU22-6580, https://doi.org/10.5194/egusphere-egu22-6580, 2022.
EGU22-6976 | Presentations | SM2.1
Comparison between Distributed Acoustic Sensing (DAS) and strain meter measurements at the Black Forest ObservatoryJérôme Azzola, Nasim Karamzadeh Toularoud, Emmanuel Gaucher, Thomas Forbriger, Rudolf Widmer-Schnidrig, Felix Bögelspacher, Michael Frietsch, and Andeas Rietbrock
We present an original DAS measurement station, equipped with the Febus A1-R interrogator, which has been deployed at the Black Forest Observatory (Schiltach, Germany). The objective of this deployment is twofold. The first is to test the deployed fibre optic cables and to better characterise the recorded signals. The second is to define standards for the processing of these DAS measurements, with a view to using the equipment for passive seismic monitoring in the INSIDE project (supported by the German Federal Ministry for Economic Affairs and Energy, BMWi).
Testing sensors involving new acquisition technologies, such as instruments based on Distributed Fiber Optic Sensing (DFOS), is part of the observatory's goals, in order to assess, to maintain and to improve signal quality. Interestingly, reference geophysical instruments are also deployed on a permanent basis in this low seismic-noise environment. Our analyses thus benefit from the records of the observatory's measuring instruments, in particular a set of three strain meters recording along various azimuths. This configuration enables a unique comparison between strain meter and DAS measurements. In addition, an STS-2 seismometer (part of German Regional Seismic Network, GRSN) allows for additional comparisons.
These instruments provide a basis for a comparative analysis between the DAS records and the measurements of well-calibrated sensing devices (STS-2 sensor, strain meter array). Such a comparison is indeed essential to physically understand the measurements provided by the Febus A1-R interrogator and to characterise the coupling between the ground and the fiber, in various deployment configurations.
We present the experiment where we investigate several Fiber Optic Cable layouts, with currently our most successful setup involving loading a dedicated fiber with sandbags. We discuss different processing approaches, resulting in a considerable improvement of the fit between DAS and strain array acquisitions. The presented comparative analysis is based on the recordings of different earthquakes, including regional and teleseismic events.
How to cite: Azzola, J., Toularoud, N. K., Gaucher, E., Forbriger, T., Widmer-Schnidrig, R., Bögelspacher, F., Frietsch, M., and Rietbrock, A.: Comparison between Distributed Acoustic Sensing (DAS) and strain meter measurements at the Black Forest Observatory, EGU General Assembly 2022, Vienna, Austria, 23–27 May 2022, EGU22-6976, https://doi.org/10.5194/egusphere-egu22-6976, 2022.
EGU22-6984 | Presentations | SM2.1
Array signal processing on distributed acoustic sensing data: directivity effects in slowness spaceSven Peter Näsholm, Kamran Iranpour, Andreas Wuestefeld, Ben Dando, Alan Baird, and Volker Oye
Distributed Acoustic Sensing (DAS) involves the transmission of laser pulses along a fiber-optic cable. These pulses are backscattered at fiber inhomogeneities and again detected by the same interrogator unit that emits the pulses. Elastic deformation along the fiber causes phase shifts in the backscattered laser pulses which are converted to spatially averaged strain measurements, typically at regular fiber intervals.
DAS systems provide the potential to employ array processing algorithms. However, there are certain differences between DAS and conventional sensors. The current paper is focused on taking these differences into account. While seismic sensors typically record the directional particle displacement, velocity, or acceleration, the DAS axial strain is inherently proportional to the spatial gradient of the axial cable displacement. DAS is therefore insensitive to broadside displacement, e.g., broadside P-waves. In classical delay-and-sum beamforming, the array response function is the far-field response on a horizontal slowness (or wavenumber) grid. However, for geometrically non-linear DAS layouts, the angle between wavefront and cable varies, requiring the analysis of a steered response that varies with the direction of arrival. This contrasts with the traditional array response function which is given in terms of slowness difference between arrival and steering.
This paper provides a framework for DAS steered response estimation accounting also for cable directivity and gauge-length averaging – hereby demonstrating the applicability of DAS in array seismology and to assess DAS design aspects. It bridges a gap between DAS and array theory frameworks and communities, facilitating increased employment of DAS as a seismic array.
How to cite: Näsholm, S. P., Iranpour, K., Wuestefeld, A., Dando, B., Baird, A., and Oye, V.: Array signal processing on distributed acoustic sensing data: directivity effects in slowness space, EGU General Assembly 2022, Vienna, Austria, 23–27 May 2022, EGU22-6984, https://doi.org/10.5194/egusphere-egu22-6984, 2022.
Please decide on your access
Please use the buttons below to download the presentation materials or to visit the external website where the presentation is linked. Regarding the external link, please note that Copernicus Meetings cannot accept any liability for the content and the website you will visit.
Forward to presentation link
You are going to open an external link to the presentation as indicated by the authors. Copernicus Meetings cannot accept any liability for the content and the website you will visit.
We are sorry, but presentations are only available for users who registered for the conference. Thank you.

EGU22-7153 | Presentations | SM2.1
MEGLIO: an experiment to record seismic waves on a commercial fiber optic cable through interferometry measures with an ultra stable laser.Andre Herrero, Davide Calonico, Francesco Piccolo, Francesco Carpentieri, Aladino Govoni, Lucia Margheriti, Maurizio Vassallo, Rita di Giovambattista, Salvatore Stramondo, Cecilia Clivati, Roberto Concas, Simone Donadello, Fabio Simone Priuli, Filippo Orio, and Andrea Romualdi
The experiment MEGLIO follows the seminal work of Marra et al. (2018) where the authors demonstrate the possibility to observe seismic waves on fiber optic cables over large distances. The measure was based on an interferometric technique using an ultra stable laser. In theory, this active measurement technique is compatible with a commercial operation on a fiber, i.e. the fiber does not need to be dark. In 2019, Open Fiber, the largest optic fiber infrastructure provider in Italy, has decided to test this new technology on its own commercial network on land.
A team of experts in the different fields has been gathered to achieve this goal : besides Open Fiber, Metallurgica Bresciana; INRiM, which initially developed the technique, for their expertise on laser and sensors; Bain & Company for the analysis and the processing of the data; INGV for the expertise in the seismology field and for the validation of the observations.
The first year has been dedicated to developing the sensors. In the meantime, a buried optic cable has been chosen in function of its length and the seismicity nearby. The best candidate was the fiber connecting the towns of Ascoli Piceno (Marche, Italy) and Teramo (Abruzzo, Italy) for a length of around 30 km. Although this technique allows using cable lengths larger than 5.000 km, for this first test we have decided to keep the length short. Actually the cable is mainly buried underneath a road with medium traffic, passes across different bridges and viaducts, starts in the middle of a town and loops in the middle of another town. Thus we expected a strong anthropic noise on the data.
The measurement on the field started in mid June 2020 and the system was operational in early July. We also installed a seismic station at one end of the cable. During these first six months, we have compared the observations on the fiber with the Italian national seismic catalog and the worldwide catalog for the major events. We consider the first results a success. We have detected so far nearly all the seismic activity with magnitude larger than 2.5 for epicentral distance lesser than 50 km. Moreover, we have recorded large events in Mediterranean region and teleseisms. Finally we have recorded new and interesting noise signals. Collecting additional events will be helpful for a better characterization of the technique, its performances and for a statistical analysis.
How to cite: Herrero, A., Calonico, D., Piccolo, F., Carpentieri, F., Govoni, A., Margheriti, L., Vassallo, M., di Giovambattista, R., Stramondo, S., Clivati, C., Concas, R., Donadello, S., Priuli, F. S., Orio, F., and Romualdi, A.: MEGLIO: an experiment to record seismic waves on a commercial fiber optic cable through interferometry measures with an ultra stable laser., EGU General Assembly 2022, Vienna, Austria, 23–27 May 2022, EGU22-7153, https://doi.org/10.5194/egusphere-egu22-7153, 2022.
Please decide on your access
Please use the buttons below to download the presentation materials or to visit the external website where the presentation is linked. Regarding the external link, please note that Copernicus Meetings cannot accept any liability for the content and the website you will visit.
Forward to presentation link
You are going to open an external link to the presentation as indicated by the authors. Copernicus Meetings cannot accept any liability for the content and the website you will visit.
We are sorry, but presentations are only available for users who registered for the conference. Thank you.
EGU22-7182 | Presentations | SM2.1 | Highlight
Monitoring a submarine strike-slip fault, using a fiber optic strain cableMarc-Andre Gutscher, Jean-Yves Royer, David Graindorge, Shane Murphy, Frauke Klingelhoefer, Arnaud Gaillot, Chastity Aiken, Antonio Cattaneo, Giovanni Barreca, Lionel Quetel, Giorgio Riccobene, Salvatore Aurnia, Lucia Margheriti, Milena Moretti, Sebastian Krastel, Florian Petersen, Morelia Urlaub, Heidrun Kopp, Gilda Currenti, and Philippe Jousset
The goal of the ERC (European Research Council) funded project - FOCUS is to apply laser reflectometry on submarine fiber optic cables to detect deformation at the seafloor in real time using BOTDR (Brillouin Optical Time Domain Reflectometry). This technique is commonly used monitoring large-scale engineering infrastructures (e.g. - bridges, dams, pipelines, etc.) and can measure very small strains (<< 1 mm/m) at very large distances (10 - 200 km), but until now has never been used to study tectonic faults and deformation on the seafloor.
Here, we report that BOTDR measurements detected movement at the seafloor consistent with ≥1 cm dextral strike-slip on the North Alfeo fault, 25 km offshore Catania, Sicily over the past 10 months. In Oct. 2020 a dedicated 6-km long fiber-optic strain cable was connected to the INFN-LNS (Catania physics institute) cabled seafloor observatory at 2060 m depth and deployed across this submarine fault, thus providing continuous monitoring of seafloor deformation at a spatial resolution of 2 m. The laser observations indicate significant elongation (20 - 40 microstrain) at two fault crossings, with most of the movement occurring between 19 and 21 Nov. 2020. A network of 8 seafloor geodetic stations for direct path measurements was also deployed in Oct. 2020, on both sides of the fault to provide an independent measure of relative seafloor movements. These positioning data are being downloaded during ongoing oceanographic expeditions to the working area (Aug. 2021 R/V Tethys; Jan. 2022 R/V PourquoiPas) using an acoustic modem to communicate with the stations on the seafloor. An additional experiment was performed in Sept. 2021 using an ROV on the Fugro vessel Handin Tide, by weighing down unburied portions of the submarine cable with pellet bags and sandbags (~25kg each) spaced every 5m. The response was observed simultaneously by DAS (Distributed Acoustic Sensing) recordings using two DAS interrogators (a Febus and a Silixa). The strain caused by the bag deployments was observed using BOTDR and typically produced a 50 - 100 microstrain signal across the 120 meter-long segments which were weighed down. In Jan. 2022 during the FocusX2 marine expedition, 21 ocean bottom seismometers were deployed for 12-14 months, which together with 15 temporary land-stations as well as the existing network of permanent stations (both operated by INGV) will allow us to perform a regional land-sea passive seismological monitoring experiment.
How to cite: Gutscher, M.-A., Royer, J.-Y., Graindorge, D., Murphy, S., Klingelhoefer, F., Gaillot, A., Aiken, C., Cattaneo, A., Barreca, G., Quetel, L., Riccobene, G., Aurnia, S., Margheriti, L., Moretti, M., Krastel, S., Petersen, F., Urlaub, M., Kopp, H., Currenti, G., and Jousset, P.: Monitoring a submarine strike-slip fault, using a fiber optic strain cable, EGU General Assembly 2022, Vienna, Austria, 23–27 May 2022, EGU22-7182, https://doi.org/10.5194/egusphere-egu22-7182, 2022.
Please decide on your access
Please use the buttons below to download the presentation materials or to visit the external website where the presentation is linked. Regarding the external link, please note that Copernicus Meetings cannot accept any liability for the content and the website you will visit.
Forward to presentation link
You are going to open an external link to the presentation as indicated by the authors. Copernicus Meetings cannot accept any liability for the content and the website you will visit.
We are sorry, but presentations are only available for users who registered for the conference. Thank you.

EGU22-7203 | Presentations | SM2.1
Multiphase observations of a meteoroid in Iceland recorded over 40 km of telecommunications cables and a large-N networkIsmael Vera Rodriguez, Torsten Dahm, Marius P. Isken, Toni Kraft, Oliver D. Lamb, Sin-Mei Wu, Sebastian Heimann, Pilar Sanchez-Pastor, Christopher Wollin, Alan F. Baird, Andreas Wüstefeld, Sigríður Kristjánsdóttir, Kristín Jónsdóttir, Eva P. S. Eibl, Bettina P. Goertz-Allmann, Philippe Jousset, Volker Oye, and Anne Obermann
On July 2, 2021, around 22:44 CET, a meteoroid was observed crossing the sky near Lake Thingvallavatn east of Reykjavik in Iceland. During this event, a large-N seismic network consisting of 500, 3-component geophones was monitoring local seismicity associated with the Hengill geothermal field southwest of the lake. In addition to the large-N network, two fiber optic telecommunication cables, covering a total length of more than 40 km, were connected to distributed acoustic sensing (DAS) interrogation units. The systems were deployed under the frame of the DEEPEN collaboration project between the Eidgenössische Technische Hochschule Zürich (ETHZ), the German Research Centre for Geosciences (GFZ), NORSAR, and Iceland Geo-survey (ISOR). Both the large-N and the DAS recordings display multiple trains of infrasound arrivals from the meteoroid that coupled to the surface of the earth at the locations of the sensors. In particular, three strong phases and multiple other weaker arrivals can be identified in the DAS data.
Fitting each of the strong phases assuming point sources (i.e., fragmentations) generates travel time residuals on the order of several seconds, resulting in an unsatisfactory explanation of the observations. On the other hand, inverting the arrival times for three independent hypersonic-trajectories generating Mach cone waves reduces travel time residuals to well under 0.5 s for each arrival. However, whereas the 1st arrival is well constrained by more than 900 travel times from the large-N, DAS and additional seismic stations distributed over the Reykjanes peninsula, the 2nd and 3rd arrivals are mainly constrained by DAS observations near Lake Thingvallavatn. The less well-constrained, latter trajectories show a weak agreement with the trajectory of the first arrival. Currently, neither the multi-Mach-cone model nor the multi-fragmentation model explain all our observations satisfactorily. Thus, traditional models for interpreting meteoroid observations appear unsuitable to explain the combination of phase arrivals in the large-N network and DAS data consistently.
How to cite: Vera Rodriguez, I., Dahm, T., Isken, M. P., Kraft, T., Lamb, O. D., Wu, S.-M., Heimann, S., Sanchez-Pastor, P., Wollin, C., Baird, A. F., Wüstefeld, A., Kristjánsdóttir, S., Jónsdóttir, K., Eibl, E. P. S., Goertz-Allmann, B. P., Jousset, P., Oye, V., and Obermann, A.: Multiphase observations of a meteoroid in Iceland recorded over 40 km of telecommunications cables and a large-N network, EGU General Assembly 2022, Vienna, Austria, 23–27 May 2022, EGU22-7203, https://doi.org/10.5194/egusphere-egu22-7203, 2022.
EGU22-7311 | Presentations | SM2.1
Calibration and repositioning of an optical fibre cable from acoustic noise obtained by DAS technologyLucas Papotto, Benoit DeCacqueray, and Diane Rivet
DAS (Distributed Acoustic Sensing) turns fibre optic cables used for telecommunications into multi-sensor antenna arrays. This technology makes it possible to detect an acoustic signal from a natural source such as cetacean or micro-earthquakes, or a man-made source by measuring the deformation of the cable. At sea, the coupling between the optical fibre and the ground on which it rests, as well as the calibration of the cable, is a critical point when the configuration of the cable is unknown. Is the fibre buried or suspended? What is the depth of the sensor being studied? What impact do these parameters have on the signal? The answers to these questions have an impact on the quality of the results obtained, the location of sources - seismic or acoustic - and the characterisation of the amplitude of signals are examples of this. Here, a first approach to study this calibration is proposed. Acoustic noise generated by passing ships in the vicinity of a 42km long optical fibre off Toulon, south-east France, is used to obtain signals for which the position and the signal of the source are known. Then, the synthetic and theoretical signal representing the ship's passage is modelled (3D model, AIS Long/Lat coordinates and depth, propagation speed in water c₀ = 1530m/s). This simulation allows us to compare the real and synthetic signals, in order to make assumptions about the actual cable configuration. We compare the signals through beamforming, f-k diagram and time-frequency diagram in particular. The grid search approach allowed us to determine the new position or orientation of a portion of the antenna. This new position is then evaluated from the signals of different vessels.
How to cite: Papotto, L., DeCacqueray, B., and Rivet, D.: Calibration and repositioning of an optical fibre cable from acoustic noise obtained by DAS technology, EGU General Assembly 2022, Vienna, Austria, 23–27 May 2022, EGU22-7311, https://doi.org/10.5194/egusphere-egu22-7311, 2022.
EGU22-7742 | Presentations | SM2.1
Strain evolution on a submarine cable during the 2020-2021 Etna eruptionShane Murphy, Pierre Garreau, Mimmo Palano, Stephan Ker, Lionel Quetel, Philippe Jousset, Giorgio Riccobene, Salvatore Aurnia, Gilda Currenti, and Marc-Andre Gutscher
On the 13th December 2020, a Strombolian eruption occurred on Mount Etna. We present a study of the temporal and spatial variation of strain measured at the underwater base of volcano during this event.
As part of the FOCUS project, a BOTDR (Brillouin Optical Time Domain Reflectometry) interrogator has been connected to the INFN-LNS ( Istituto Nazionale di Fisica Nucleare - Laboratori Nazionali del Sud) fibre optic cable that extends from the port of Catania 25km offshore to TTS (Test Site South) in a water depth of 2km. This interrogator has been continuously recording the relative strain changes at 2m spacing along the length of the cable every 2 hrs since May 2020.
On preliminary analysis, a change in strain is observed at the around the time of the eruption, however this variation occurs close to the shore where seasonal variations in water temperatures are in the order of 5°C. As Brillouin frequency shifts are caused by both temperature and strain variations, it is necessary to remove this effect. To do so, numerical simulations of seasonal sea temperature specific to offshore Catania have used to estimate the change in temperature along the cable. This temperature change is then converted to a Brillouin frequency shift and removed from the frequency shift recorded by the interrogator before being converted to relative strain measurements. This processing produces a strain signature that is consistent with deformation observed by nearby geodetic stations on land.
How to cite: Murphy, S., Garreau, P., Palano, M., Ker, S., Quetel, L., Jousset, P., Riccobene, G., Aurnia, S., Currenti, G., and Gutscher, M.-A.: Strain evolution on a submarine cable during the 2020-2021 Etna eruption, EGU General Assembly 2022, Vienna, Austria, 23–27 May 2022, EGU22-7742, https://doi.org/10.5194/egusphere-egu22-7742, 2022.
EGU22-8113 | Presentations | SM2.1
Exploration of Distributed Acoustic Sensing (DAS) data-space using a trans-dimensional algorithm, for locating geothermal induced microseismicityNicola Piana Agostinetti, Emanuele Bozzi, Alberto Villa, and Gilberto Saccorotti
Distributed Acoustic sensing (DAS) data have been widely recognised as the next generation of seismic data for applied geophysics, given the ultra-high spatial resolution achieved. DAS data are recorded along a fiber optic cable at pre-defined distances (called “channels”, generally with 1-10 meters spacing). DAS data have been benchmarked to standard seismic data (e.g. geophones) for tasks related to both exploration and monitoring of georesources.
The analysis of DAS data has to face two key-issues: the amount of data available and their “directionality”. First, the huge amount of data recorded, e.g. in monitoring activities related to georesources exploitation, can not be easily handled with standard seismic workflow, given the spatial and temporal sampling (for example, manual picking of P-wave arrivals for 10 000 channels is not feasible). Moreover, standard seismic workflow have been generally developed for “sparse" network of sensors, i.e. for punctual measurements, without considering the possibility of recording the quasi-continuous seismic wavefield along a km-long cable. With the term “directionality" we mean the ability of the DAS data to record horizontal strain-rate only in the direction of the fiber optic cable. This can be seen as a measure of a single horizontal component in a standard seismometer. Obviously, standard seismic workflow have not been developed to work correctly for a network of seismometers with a unique horizontal component, oriented with variable azimuth from one seismometer to the other. More important, “directionality” can easily bias the recognition of the seismic phase arriving at the channel, which could be, based on the cable azimuth and the seismic noise level, a P-wave or an S-wave.
We developed a novel application for exploring DAS data-space in a way that: (1) data are automatically down weighted with the distance from the event source; (2) recorded phases are associated to P- or S- waves with a probabilistic approach, without pre-defined phase identification; and (3) the presence of outliers is also statistically considered, each phase being potentially a converted/refracted wave to be discarded. Our methodology makes use of a trans-dimensional algorithm, for selecting relevant weights with distance. Thus, all inferences in the data-space are fully data-driven, without imposing additional constrains from the seismologist.
How to cite: Piana Agostinetti, N., Bozzi, E., Villa, A., and Saccorotti, G.: Exploration of Distributed Acoustic Sensing (DAS) data-space using a trans-dimensional algorithm, for locating geothermal induced microseismicity, EGU General Assembly 2022, Vienna, Austria, 23–27 May 2022, EGU22-8113, https://doi.org/10.5194/egusphere-egu22-8113, 2022.
Please decide on your access
Please use the buttons below to download the presentation materials or to visit the external website where the presentation is linked. Regarding the external link, please note that Copernicus Meetings cannot accept any liability for the content and the website you will visit.
Forward to presentation link
You are going to open an external link to the presentation as indicated by the authors. Copernicus Meetings cannot accept any liability for the content and the website you will visit.
We are sorry, but presentations are only available for users who registered for the conference. Thank you.
EGU22-8294 | Presentations | SM2.1 | Highlight
Real-Time Magnitude Determination and Ground Motion Prediction using Optical Fiber Distributed Acoustic Sensing for Earthquake Early WarningItzhak Lior, Diane Rivet, Anthony Sladen, Diego Mercerat, and Jean-Paul Ampuero
Distributed Acoustic Sensing (DAS) is ideally suited for the challenges of Earthquake Early Warning (EEW). These distributed measurements allow for robust discrimination between earthquakes and noise, and remote recordings at hard to reach places, such as offshore, close to the hypocenters of most of the largest earthquakes on Earth. In this study, we propose the first application of DAS for EEW. We present a framework for real-time strain-rate to ground accelerations conversion, magnitude estimation and ground shaking prediction. The conversion is applied using the local slant-stack transform, adapted for real-time applications. Since currently, DAS earthquake datasets are limited to low-to-medium magnitudes, an empirical magnitude estimation approach is not feasible. To estimate the magnitude, we derive an Omega-squared-model based theoretical description for acceleration root-mean-squares (rms), a measure that can be calculated in the time-domain. Finally, peak ground motions are predicted via ground motion prediction equation that are derived using the same theoretical model, thus constituting a self-consistent EEW scheme. The method is validated using a composite dataset of earthquakes from different tectonic settings up to a magnitude of 5.7. Being theoretical, the presented approach is readily applicable to any DAS array in any seismic region and allows for continuous updating of magnitude and ground shaking predictions with time. Applying this method to optical fibers deployed near on-land and underwater faults could be decisive in the performance of EEW systems, significantly improving earthquake warning times and allowing for better preparedness for intense shaking.
How to cite: Lior, I., Rivet, D., Sladen, A., Mercerat, D., and Ampuero, J.-P.: Real-Time Magnitude Determination and Ground Motion Prediction using Optical Fiber Distributed Acoustic Sensing for Earthquake Early Warning, EGU General Assembly 2022, Vienna, Austria, 23–27 May 2022, EGU22-8294, https://doi.org/10.5194/egusphere-egu22-8294, 2022.
EGU22-8414 | Presentations | SM2.1
Towards microseismic moment tensor inversion in boreholes with DASKatinka Tuinstra, Federica Lanza, Andreas Fichtner, Andrea Zunino, Francesco Grigoli, Antonio Pio Rinaldi, and Stefan Wiemer
We present preliminary results on a moment tensor inversion workflow for Distributed Acoustic Sensing (DAS). It makes use of a fast-marching Eikonal solver and synthetically modeled data. The study specifically focuses on borehole settings for geothermal sites. Distributed Acoustic Sensing measures the wavefield with high spatial and temporal resolution. In borehole settings, individual DAS traces generally prove to be noisier than co-located geophones, whereas the densely spaced DAS shot-gathers show features that would have otherwise been missed by the commonly more sparsely distributed geophone chains. For example, the coherency in the DAS records shows the polarity reversals of the arriving wavefield in great detail, which can help constrain the moment tensor of the seismic source. The synthetic tests encompass different source types and source positions relative to the deployed fiber to assess moment tensor resolvability. Further tests include the addition of a three-component seismometer at different positions to investigate an optimal network configuration, as well as various noise conditions to mimic real data. The synthetic tests are tailored to prepare for the data from future microseismicity monitoring with DAS in the conditions of the Utah FORGE geothermal test site, Utah, USA. The proposed method aims at improving amplitude-based moment tensor inversion for DAS deployed in downhole or underground lab contexts.
How to cite: Tuinstra, K., Lanza, F., Fichtner, A., Zunino, A., Grigoli, F., Rinaldi, A. P., and Wiemer, S.: Towards microseismic moment tensor inversion in boreholes with DAS, EGU General Assembly 2022, Vienna, Austria, 23–27 May 2022, EGU22-8414, https://doi.org/10.5194/egusphere-egu22-8414, 2022.
EGU22-8664 | Presentations | SM2.1
Seismic Exploration and monitoring of geothermal reservoirs usiNg distributed fibre optic Sensing - the joint project SENSECharLotte Krawczyk, Leila Ehsaniezhad, Christopher Wollin, Johannes Hart, and Martin Lipus
For a successful operation of energy or resources use in the subsurface, exploration for potential reservoir or storage horizons, monitoring of structural health and control of induced seismic unrest are essential both from a technical and a socio-economic perspective. Furthermore, large-scale seismic surveys in densely populated areas are difficult to carry out due to the effort required to install sources and receivers and are associated with high financial and logistical costs. Within the joint project SENSE*, a seismic exploration and monitoring approach is tested, which is based on fibre-optic sensing in urban areas.
Besides the further development of sensing devices, the monitoring of borehole operations as well as the development of processing workflows form central parts of the joint activities. In addition, the seismic wave field was recorded and the localisation of the cables was tested along existing telecommunication cables in Berlin. Further testing of measuring conditions in an urban environment was also conducted along an optic fibre separately laid out in an accessible heating tunnel.
We suggest a workflow for virtual shot gather extraction (e.g., band pass filtering, tapering, whitening, removal of poor traces before and after cross-correlation, stacking), that is finally including a coherence-based approach. The picking of dispersion curves in the 1-7 Hz frequency range and inversion yield a shear wave velocity model for the subsurface down to a. 300 m depth. Several velocity interfaces are evident, and a densely staggered zone appears between 220-270 m depth. From lab measurements a distributed backscatter measurement in OTDR mode shows that high reflections and moderate loss at connectors can be achieved in a several hundred m distance. Depending on drilling campaign progress, we will also present first results gained during the borehole experiment running until February 2022.
* The SENSE Research Group includes in addition to the authors of this abstract Andre Kloth and Sascha Liehr (DiGOS), Katerina Krebber and Masoud Zabihi (BAM), Bernd Weber (gempa), and Thomas Reinsch (IEG).
How to cite: Krawczyk, C., Ehsaniezhad, L., Wollin, C., Hart, J., and Lipus, M.: Seismic Exploration and monitoring of geothermal reservoirs usiNg distributed fibre optic Sensing - the joint project SENSE, EGU General Assembly 2022, Vienna, Austria, 23–27 May 2022, EGU22-8664, https://doi.org/10.5194/egusphere-egu22-8664, 2022.
Please decide on your access
Please use the buttons below to download the presentation materials or to visit the external website where the presentation is linked. Regarding the external link, please note that Copernicus Meetings cannot accept any liability for the content and the website you will visit.
Forward to presentation link
You are going to open an external link to the presentation as indicated by the authors. Copernicus Meetings cannot accept any liability for the content and the website you will visit.
We are sorry, but presentations are only available for users who registered for the conference. Thank you.

EGU22-8787 | Presentations | SM2.1
PSD analysis and seismic event detectability of Distributed Acoustic Sensing (DAS) mesurements from several monitoring sitesNasim Karamzadeh Toularoud, Jérôme Azzola, Emmanuel Gaucher, Thomas Forbriger, Rudolf Widmer-Schnidrig, Felix Bögelspacher, Michael Frietsch, and Andreas Rietbrock
High spatial and temporal resolution of distributed acoustic sensing (DAS) measurements makes them very attractive in different applications in seismology, such as seismic noise analysis (e.g. Bahavar et al 2020, Spica et al 2020) and seismic event detection (e.g. Ajo-Franklin et al 2019, Fernandez Ruiz 2020, Jousset 2020). The quantity measured by a DAS is strain or strain rate of an optic fiber cable, which is related to the spatial gradient of displacement and velocity that is usually measured by single point seismometers. The amplitude (and signal to noise ratio, SNR) and frequency resolutions of DAS recordings depend on spatial and temporal acquisition parameters, such as i.e. gauge-length (GL) and derivative time (DT), the latter being of importance only if the device records the strain rate.
In this study, our aims have been to investigate, experimentally, how to adapt the averaging parameters such as GL and DT to gain sensitivity in frequency bands of interests, and to investigate the seismic event detection capability of DAS data under specific set up. We recorded samples of DAS raw data, over a few hours at the German Black Forest Observatory (BFO) and in Sardinia, Italy. We studied the spectral characteristics of strain and strain rate converted from DAS raw data, to analyze the sensitivity of DAS measurements to GL and DT. The power spectral densities are compared with the strain meter recordings at BFO site as a benchmark, which is recorded using the strain-meter arrays measuring horizontal strain in three different directions independently from the DAS (For details about the DAS measurement station at BFO see Azzola et al. EGU 2022). We concluded about the lower limit of the DAS noise level that is achievable with employing different acquisition parameters. Accordingly, we applied suitable parameters for continuous strain-rate data acquisition at another experimental site in Georgia, which is related to the DAMAST (Dams and Seismicity) project.
During the acquisition time periods at BFO and in Georgia, the visibility of local, regional and teleseismic events on the DAS data has been investigated. At both sites, a broadband seismometer is continuously operating, and can be considered as a reference to evaluate the event detection capability of the DAS recordings taking into account the monitoring set-up, i.e. cable types, cable coupling to the ground, directional sensitivity and acquisition parameters. In addition, at BFO the DAS seismic event detection capability is evaluated comparing with the strain-meter array. Examples of detected seismic events by DAS are discussed, in terms of achievable SNR for each frequency content and comparison with the seismometers and strain-meter array.
How to cite: Karamzadeh Toularoud, N., Azzola, J., Gaucher, E., Forbriger, T., Widmer-Schnidrig, R., Bögelspacher, F., Frietsch, M., and Rietbrock, A.: PSD analysis and seismic event detectability of Distributed Acoustic Sensing (DAS) mesurements from several monitoring sites, EGU General Assembly 2022, Vienna, Austria, 23–27 May 2022, EGU22-8787, https://doi.org/10.5194/egusphere-egu22-8787, 2022.
EGU22-10322 | Presentations | SM2.1
Strain accumulation along a 21km long optic fibre during a seismic crisis in Iceland, 2020Christopher Wollin, Philippe Jousset, Thomas Reinsch, Martin Lipus, and Charlotte Krawczyk
Slow slip plays an important role in accommodating plate motion along plate boundaries throughout the world. Further understanding of the interplay between aseismic and seismic slip has gained particular attention as it is crucial for the assessment of seismic risk. A wide range of instruments and acquisition techniques exist to quantify tectonic deformation which spans multiple orders of magnitude in duration as well as spatial extend. For example, seismometers acquire dense temporal data, however are sparsely deployed, leading to spatial aliasing. As opposite, remote sensing techniques have wide aperture but rather crude temporal resolution and accuracy (mm-range). In selected areas, strain is continuously measured with laser or borehole strainmeters.
In this contribution, we investigate the distribution of permanent strain along a telecommunication optic fibre on the Reykjanes Peninsula, South West Iceland. Continuous strain-rate was recorded via DAS (Distributed Acoustic Sensing) over a period of six months during the recent unrest of the Svartsengi volcano which began in January 2020. The interrogated fibre connects the town of Gridavik with the Svartsengi geothermal power plant and was patched to a second fibre leading to the western most tip of the Reykjanes Peninsula. It is approximately between 10 and 20km west of the active volcanic area which produced abundant local seismicity as well as surface uplift and subsidence in areas crossed with the optical fiber. The fibre was installed in a trench at less than one meter depth and consists of two roughly straight segments of 7 and 14km length. Whereas the longer segment trends WSW parallel to the strike of the Mid-Atlantic Ridge at this geographic height, the shorter segment trends NEN and thus almost coincides with the maximum compressive stress axis of the region.
Inspection of the spatio-temporal strain-rate records after the occurrence of local earthquakes indicates the accumulation of compressive as well as extensive strain in short fibre sections of a few dozen meters which could correlate with local geologic features like faults or dykes. This holds for events of M~2.5 and fibre segments in epicentral distances of more than 20km. Preliminary results regarding the total deformation of the fibre as response to an individual seismic event show a distinct behaviour for differently oriented fibre segments correlating with the overall stress regime, i.e. shortening in the order of some dozen nanometers in the direction of SHmax. Unfortunately, recordings of the two largest intermediate M>=4.8 events indicate saturation of the recording system or loss of ground coupling thus preventing a meaningful interpretation of their effect on permanent surface motion.
Perspectively, our efforts aim at investigating the feasibility of distributed optical strain-rate measurements along telecommunication infrastructure to track locally accumulated strain.
How to cite: Wollin, C., Jousset, P., Reinsch, T., Lipus, M., and Krawczyk, C.: Strain accumulation along a 21km long optic fibre during a seismic crisis in Iceland, 2020, EGU General Assembly 2022, Vienna, Austria, 23–27 May 2022, EGU22-10322, https://doi.org/10.5194/egusphere-egu22-10322, 2022.
EGU22-10574 | Presentations | SM2.1
Innovative high resolution optical geophysical instruments at the termination of long fibers: first results from the Les Saintes optical ocean bottom seismometer, and from the Stromboli optical strainmeterPascal Bernard, Guy Plantier, Philippe Ménard, Yann Hello, Guillaume Savaton, Jean-Philippe Metaxian, Maurizio Ripepe, Marie-Paule Bouin, Frederick Boudin, Romain Feron, Sébastien Deroussi, and Roberto Moretti and the optic-OBS-strain-2022 team
In June 2022, in the frame of the PREST interreg Caraïbe project, we installed an optical OBS offshore the Les Saintes archipelago (Guadeloupe, Lesser Antilles), at the termination of a 5.5 km long optic cable buried in the sea floor and landing in Terre-de-Bas island (FIBROSAINTES campaign: Antea vessel from the FOF, plow from GEOAZUR). This innovative seismometer, developped in the last decade by ESEO, is based on Fabry-Perot (FP) interferometry, tracking at high resolution (rms 30 pm) the displacement of the mobile mass of a 10 Hz, 3 component, purely mechanical geophone (no electronics nor feed-back). This optically cabled OBS is the marine version of the optical seismometer installed at the top of La Soufrière volcano of Guadeloupe, in 2019, at the termination of a 1.5 km long fiber (HIPERSIS ANR project). Both seismometers are telemetered in real-time to the Guadeloupe Observatory (IPGP/OVSG). The optical seismometer, located at a water depth of 43 m near the edge of the immersed reef, is aimed at improving the location of the swarm-like seismicity which still persists after the Les Saintes 2004, M6.3 normal fault earthquake. The considerable advantage of such a purely optical submarine sensor over commercial, electric ones is that its robustness, due to the absence of electrical component, guarantees a very low probability of failure, and thus significantly reduces the costs of maintenance. In May 2022, an optical pressiometer and an optical hydrostatic tiltmeter designed and constructed by ENS shoud be installed offshore and connected to the long fiber, next to the optical OBS.
Based on the same FP interrogator, ESEO and IPGP recently developped a high resolution fiber strainmeter, the sensing part being a 5 m long fiber, to be buried or cemented to the ground. A prototype has been installed mid-September 2021 on the Stromboli volcano, in the frame of the MONIDAS (ANR) and LOFIGH (Labex Univearth, Univ. Paris) projects. The interrogator was located in the old volcanological observatory, downslope, and the optical sensors, at 500 m altitude, were plugged at the end of a 3 km optic cable. They consist of three fibers, 5 m long each, buried 50 cm into the ground. Their different orientation allowed to retrieve the complete local strain field. The four weeks of continuous operation clearly recorded the dynamic strain from the frequent ordinary summital explosion ( several per hour), and, most importantly, the major explosion of the 6th of October (only a few per year). The records show a clear precursory signal, starting 120s before this explosion, corresponding to a transient compression, oriented in the crater azimuth, peaking at 0.9 microstrain 10 s before the explosion.
These two successfull installations of optical instruments open promising perspectives for the seismic and strain real-time monitoring in many sites, offshore, on volcanoes, and more generally in any site, natural or industrial, presenting harsh environmental conditions, where commercial, electrical sensors are difficult and/or costly to install and to maintain, or simply cannot be operated.
How to cite: Bernard, P., Plantier, G., Ménard, P., Hello, Y., Savaton, G., Metaxian, J.-P., Ripepe, M., Bouin, M.-P., Boudin, F., Feron, R., Deroussi, S., and Moretti, R. and the optic-OBS-strain-2022 team: Innovative high resolution optical geophysical instruments at the termination of long fibers: first results from the Les Saintes optical ocean bottom seismometer, and from the Stromboli optical strainmeter, EGU General Assembly 2022, Vienna, Austria, 23–27 May 2022, EGU22-10574, https://doi.org/10.5194/egusphere-egu22-10574, 2022.
EGU22-11311 | Presentations | SM2.1
Overcoming limitations of seismic monitoring using fibre-optic distributed acoustic sensingRegina Maaß, Sven Schippkus, Céline Hadziioannou, Benjamin Schwarz, Charlotte Krawczyk, and Philippe Jousset
Seismic monitoring refers to the measurement of time-lapse changes of seismic wave velocities and is a frequently used technique to detect dynamic changes in the Earth‘s crust. Its applications include a broad range of topics, such as natural hazard assessment and structural health monitoring. To obtain reliable measurements, results are usually stacked over time. Thereby, temporal resolution is lost, which makes the measurement less sensitive to short-term environmental processes. Another problem is that conventional datasets often lack spatial density and velocity changes can only be attributed to large areas. Recently, distributed acoustic sensing (DAS) has gained a lot of attention as a way to achieve high spatial resolution at low cost. DAS is based on Rayleigh-scattering of photons within an optical fibre. Because measurements can be taken every few meters along the cable, the fibre is turned into a large seismic array that provides information about the Earth’s crust at unprecedented resolution.
In our study, we explore the potential of DAS for monitoring studies. Specifically, we investigate how spatial stacking of DAS traces affects the measurements of velocity variations. We use data recorded by a 21-km-long dark fibre located on Reykjanes Pensinsula, Iceland. The cable is sampled with a channel spacing of 4 meters. We analyze the energy of the oceans microseism continuously recorded between March and September 2020. At first, we stack adjacent traces on the fibre in space. We then cross correlate the stacks to obtain approximations of the Green’s functions between different DAS-channels. By measuring changes in the coda waveform of the extracted seismograms, velocity variations can be inferred. Our analysis shows that spatial stacking improves the reliability of our measurements considerably. Because of that, less temporal stacking is required and the time resolution of our measurements can be increased. In addition, the enhancement of the data quality helps resolve velocity variations in space, allowing us to observe variations propagating along the cable over time. These velocity changes are likely linked to magmatic intrusions associated with a series of repeated uplifts on the Peninsula. Our results highlight the potential of DAS for improving the localization capabilities and accuracy of seismic monitoring studies.
How to cite: Maaß, R., Schippkus, S., Hadziioannou, C., Schwarz, B., Krawczyk, C., and Jousset, P.: Overcoming limitations of seismic monitoring using fibre-optic distributed acoustic sensing, EGU General Assembly 2022, Vienna, Austria, 23–27 May 2022, EGU22-11311, https://doi.org/10.5194/egusphere-egu22-11311, 2022.
EGU22-11508 | Presentations | SM2.1 | Highlight
Building a new type of seafloor observatory on submarine telecom fiber optic cables in ChileDiane Rivet, Sergio Barrientos, Rodrigo Sánchez-Olavarría, Jean-Paul Ampuero, Itzhak Lior, Jose-Antonio Bustamente Prado, and German-Alberto Villarroel Opazo
In most subduction zones, a great portion of seismicity is located offshore, away from permanent onland seismic networks. Chile is not the exception; since the upgraded seismic observation system began operating in 2013, 35% of the ~7000 earthquakes with M≥3 recorded yearly were located offshore. Most importantly, the epicenters of the largest earthquakes (M>7.5) from 2014 to 2016 were located offshore as well.
The Chilean national seismic network is mainly composed of coastal and inland stations, except for two stations located on oceanic islands, Rapa Nui (Easter Island) and Juan Fernandez archipelago. This station configuration makes it difficult to observe in sufficient detail the lower-magnitude seismicity at the nucleation points of large events. Moreover, the lack of seafloor stations limits the efficiency of earthquake early warning systems during offshore events. These challenges could be overcome by permanently instrumenting existing submarine telecom cables with Distributed Acoustic Sensing (DAS).
Thanks to GTD, a private telecommunications company that owns a 3500-km-long network of marine fiber optic cables with twelve landing points in Chile (Prat project), from Arica (~ 18⁰S) to Puerto Montt (~ 41⁰S), we conducted the POST (Submarine Earthquake Observation Project in Spanish) DAS experiment on the northern leg of the Concón landing site of the Prat cable. This experiment, one of the first to be conducted on a commercial undersea infrastructure in a very seismically active region, was carried out from October 28 to December 3, 2021. Based on the longitudinal strain-rate data measured along 150 km of cable with a spatial resolution of 4 meters and a temporal sampling of 125 Hz, we present preliminary results of analyses to assess the possibility of building a new type of permanent, real-time and distributed seafloor observatory for continuous monitoring of active faults and earthquake early warning systems.
How to cite: Rivet, D., Barrientos, S., Sánchez-Olavarría, R., Ampuero, J.-P., Lior, I., Bustamente Prado, J.-A., and Villarroel Opazo, G.-A.: Building a new type of seafloor observatory on submarine telecom fiber optic cables in Chile, EGU General Assembly 2022, Vienna, Austria, 23–27 May 2022, EGU22-11508, https://doi.org/10.5194/egusphere-egu22-11508, 2022.
EGU22-11599 | Presentations | SM2.1
Comparing two fiber-optic sensing systems: Distributed Acoustic Sensing and Direct TransmissionDaniel Bowden, Andreas Fichtner, Thomas Nikas, Adonis Bogris, Konstantinos Lentas, Christos Simos, Krystyna Smolinski, Iraklis Simos, and Nikolaos Melis
Distributed Acoustic Sensing (DAS) systems have gained popularity in recent years due to the dense spatial coverage of strain observations; with one fiber and one interrogator researchers can have access to thousands of strain or strain-rate observations over a region. DAS systems have a limited range, however, with usual experiments being on the order of 10’s of kilometers, owing to their reliance on weakly backscattered light. In contrast, systems that transmit light through a fiber and measure signals on the other end (or looped back) can traverse significantly longer distances (e.g., Marra et. al 2018, Zhan et. al 2021, Bogris et. al 2021), and have the added advantages of being potentially cheaper and potentially operating in parallel with active telecommunications purposes. The disadvantage of such transmission systems is that only a single measurement of strain along the entire distance is given.
During September - October 2021, we operated examples of both systems side-by-side using telecommunications fibers underneath North Athens, Greece, in collaboration with the OTE telecommunications provider. Several earthquakes were detected by both systems, and we compare observations from both. The DAS system is a Silixa iDAS Interrogator measuring strain-rate. The newly designed transmission system relies on interferometric use of microwave frequency dissemination; signals sent along the fiber and back in a closed loop are compared to what was sent to measure phase differences (Bogris et. al 2021). We find that both systems are successful in sensing earthquakes and agree remarkably well when DAS signals are integrated over the length of the cable to properly mimic the transmission observations.
The direct transmission system, however, may not be as intuitive to interpret as an integral of displacement ground motions along the fiber. We discuss both theoretical and data-driven examples of how the observed phases depend on the curvature of a given length of fiber, and describe how asymmetries in the fiber’s index of refraction play a role in producing observed signals. Such an understanding is crucial if one is to properly interpret the signals from such a system (e.g., especially very long trans-oceanic cables). Given a full theoretical framework, we also discuss a strategy for seismic tomography given such a system: with a very long fiber, the spatial sensitivity should evolve over time as seismic signals reach different sections.
How to cite: Bowden, D., Fichtner, A., Nikas, T., Bogris, A., Lentas, K., Simos, C., Smolinski, K., Simos, I., and Melis, N.: Comparing two fiber-optic sensing systems: Distributed Acoustic Sensing and Direct Transmission, EGU General Assembly 2022, Vienna, Austria, 23–27 May 2022, EGU22-11599, https://doi.org/10.5194/egusphere-egu22-11599, 2022.
EGU22-11864 | Presentations | SM2.1
Distributed Acoustic Sensing in the Athens Metropolitan Area: Preliminary ResultsKrystyna T. Smolinski, Daniel C. Bowden, Konstantinos Lentas, Nikolaos S. Melis, Christos Simos, Adonis Bogris, Iraklis Simos, Thomas Nikas, and Andreas Fichtner
Once a niche technology, Distributed Acoustic Sensing (DAS) has gained increasing popularity over the last decade, due to its versatility and ability to capture extremely dense seismic datasets in a wide range of challenging environments. While DAS has been utilised in some particularly remote locations, such as on glaciers and volcanoes, it also holds a great deal of potential closer to home; beneath our cities. As DAS is able to be used with existing telecommunication fibres, urban areas contain huge potential networks of strain or strain-rate sensors, right beneath our feet. This data enables us to monitor the local environment, recording events such as earthquakes, as well as characterising and monitoring the shallow subsurface. DAS experiments using dark fibres are unintrusive and highly repeatable, meaning that this method is ideal for long-term site monitoring.
In collaboration with the OTE Group (the largest telecommunications company in Greece), we have collected urban DAS data beneath North-East Athens, utilising existing, in-situ telecommunication fibres. This large dataset contains a wide range of anthropogenic signals, as well as many seismic events, ranging from small, local events, to an internationally reported Magnitude 6.4 earthquake in Crete.
We conduct a preliminary analysis of the dataset, identifying and assessing the earthquake signals recorded. This will be compared with the event catalogue of the local, regional network in Athens, to determine our sensitivity to events of different magnitudes, and in a range of locations. We hope to gain an understanding of how DAS could be combined with the existing network for seismic monitoring and earthquake detection.
Moving forward, we aim to also apply ambient noise methods to this dataset in order to extract dispersion measurements, and ultimately invert for a shallow velocity model of the suburbs of Athens.
How to cite: Smolinski, K. T., Bowden, D. C., Lentas, K., Melis, N. S., Simos, C., Bogris, A., Simos, I., Nikas, T., and Fichtner, A.: Distributed Acoustic Sensing in the Athens Metropolitan Area: Preliminary Results, EGU General Assembly 2022, Vienna, Austria, 23–27 May 2022, EGU22-11864, https://doi.org/10.5194/egusphere-egu22-11864, 2022.
EGU22-11869 | Presentations | SM2.1
Long range distributed acoustic sensing technology for subsea geophysical applicationsErlend Rønnekleiv, Ole Henrik Waagaard, Jan Petter Morten, and Jan Kristoffer Brenne
Recent advances in range and performance of distributed acoustic sensing (DAS) enable new geophysical applications by measuring fiber strain in existing telecom cables and subsea power cables that incorporate optical fibers. We will present new field data showing the usability of DAS for environmental and geophysical applications, focusing especially on seabed surface waves and the sub-Hz domain. These examples show that highly sensitive DAS technology can be a valuable tool within seismology and oceanography.
The sensitive range along the fiber for DAS was previously limited to about 50 km. We will demonstrate a newly developed system (named OptoDAS) that allows for launching several orders of more optical power into the fiber, and thereby significantly improving the range beyond 150 km.
This new interrogation approach allows for high degree of flexibility optimizing the interrogation parameters to optimize the noise floor, spatial and temporal resolution according to the application. The gauge length (spatial resolution) can be set from 2 to 40 m. For interrogation of 10 km fiber, we achieve a record low noise floor of 1.4 pε/√Hz with 10 m spatial resolution. For interrogation of fibers beyond 150 km, we achieve a noise floor below 50 pε/√Hz up to 100 km. Above 100 km, the noise is limited by the level of reflected optical power, and the noise increases by ~0.3-0.4 dB/km, corresponding to the dual path optical loss in the fiber.
A modern instrument control interface allows for automatic optimalization of interrogation parameters based on application parameters in a few minutes. The instrument computer provides a flexible platform for different applications. The high-capacity storage system can store recorded time-series of several weeks to support e.g., geophysical investigations where extensive post-processing is required. The computational capacity can also be used for real-time visualization and advanced signal processing, for example for event detection and direct reporting of estimated parameters.
The OptoDAS system can convert a submarine cable into a 100 km+ densely sampled array. From the recordings on a telecom cable in the North Sea, we will show examples of propagating Rayleigh and Love acoustical modes bounded to the seafloor surface. These modes can be excited by acoustic sources on or above the seafloor, such as trawls and anchors. The dense spatial sampling allows for accurate estimates of the location of these sources. The system also allows for applications in seismology and earthquake monitoring. When attached to a cable with non-straight geometry, the measurements have substantial information to determine the location of seismic events. This will be demonstrated using field data from the North Sea telecom cable.
From recordings on a submarine cable between Norway and Denmark, we present the DAS response in the frequency range 0.1 mHz-10Hz across a cable span of 120 km. The response in this frequency range will be a combination of temperature changes, ocean swells and tides. We show that increasing the gauge length in post-processing allows for improving the sensitivity for detecting ultra-low frequency signals.
How to cite: Rønnekleiv, E., Waagaard, O. H., Morten, J. P., and Brenne, J. K.: Long range distributed acoustic sensing technology for subsea geophysical applications, EGU General Assembly 2022, Vienna, Austria, 23–27 May 2022, EGU22-11869, https://doi.org/10.5194/egusphere-egu22-11869, 2022.
EGU22-574 | Presentations | CR2.1
Development of a permittivity sensor for melting probes to explore terrestrial and extraterrestrial cryospheresFabian Becker, Pia Friend, and Klaus Helbing
We will present the design of a permittivity sensor that can be attached to a melting probe and measure the respective ice properties during the melting process, yielding in a comprehensive permittivity profile. Melting probes were already successfully applied in terrestrial cryospheres, such as alpine glaciers and Antarctica. Further applications to cross the ice shield on Dome C in Antarctica or even on icy moons in the outer solar system, such as Europa, are already planned e.g. within the TRIPLE project line funded by the German aerospace center. A sensor measuring the permittivity of the surrounding ice in situ during melting could provide valuable data about the ice properties. The respective density of the ice is correlated with the permittivity, or volcanic ash layers can be identified through permittivity measurements. Another usage of the data could be to correct distance measurements from radar travel times within the ice.
The sensor is designed to operate in the frequency range of 0.1 - 1.5 GHz and works in the range of the near field, which is defined to be within one wavelength, corresponding to the frequency. The concept of this sensor is based on an open coaxial probe, which is connected to the medium of interest. The measurement principle and calibration techniques, as well as first lab measurement results of ice and other materials will be presented. A comprehensive data set on effects of porosity, salinity and impurities of lab-manufactured ice samples on the permittivity will also be given. These data will help to interpret the taken permittivity profiles of glaciers on further missions.
We will also show how the device can be integrated into a melting probe, such as the TRIPLE melting probe. One major challenge is to ensure good contact to the ice during measurement. The diameter of a melting hole often results to be several cm larger in diameter than the melting probe itself. A mechanism that extends the sensors of the melting probe and press it onto the ice for measurements is being developed.
How to cite: Becker, F., Friend, P., and Helbing, K.: Development of a permittivity sensor for melting probes to explore terrestrial and extraterrestrial cryospheres, EGU General Assembly 2022, Vienna, Austria, 23–27 May 2022, EGU22-574, https://doi.org/10.5194/egusphere-egu22-574, 2022.
EGU22-612 | Presentations | CR2.1 | Highlight
Using offsets in airborne radar sounding and laser altimetry to characterize near-surface firn properties over the Greenland ice sheetAnja Rutishauser, Andreas P. Ahlstrøm, Robert S. Fausto, Nanna B. Karlsson, Baptiste Vandecrux, Kirk M. Scanlan, Ghislain Picard, and Signe B. Andersen
In recent decades, the Greenland Ice Sheet (GrIS) has experienced a significant increase in surface melting and meltwater runoff, which is now the main contributor to GrIS mass loss. In areas covered by firn, meltwater percolation and refreezing processes can significantly buffer meltwater runoff to the ocean. However, this process leads to the formation of ice layers and an overall firn densification, which is predicted to limit the firns’ meltwater storage capacity in the future. Additionally, the high spatial and temporal variability of ice layer formation and subsequent firn densification can cause large uncertainties in altimetry-derived mass balance estimates. Thus, understanding the spatial and vertical extent of ice layers in the firn is important to estimate the GrIS contribution to sea-level rise.
Due to limited direct observations of firn properties, modeling future meltwater runoff and processes over the rapidly changing GrIS firn facies remains challenging. Here, we present a prospective new technique that leverages concurrent airborne radar sounding and laser altimetry measurements to characterize near-surface firn over spatially extensive areas. We hypothesize that due to their different depth sensitivities, the presence of ice layers in the firn yields an offset between radar sounding- and laser-derived surface elevations (differential altimetry). We compare existing airborne radar and laser measurements to in-situ firn observations and use one-dimensional radar sounding simulations to investigate 1) the sensitivity of the differential altimetry technique to different firn facies, and 2) the techniques’ capability to estimate firn density and firn ice content. Preliminary results over the western GrIS show good correlations between differential altimetry signatures and areas of firn affected by percolation and refreezing processes.
Through this technique, we explore the potential to leverage a wealth of radar sounding measurements conducted at low frequencies (< 200 MHz), that typically do not resolve the firn structure, to derive near-surface firn properties. Finally, we apply the differential altimetry technique to data collected as part of NASA’s Operation IceBridge between 2009-2019 to derive spatio-temporal changes in the GrIS firn in response to climatic conditions, in particular the formation of ice layers and changes in firn ice content. Our results can help reduce uncertainties in satellite-derived mass balance measurements and improve firn models, which both contribute to reducing uncertainties in current and projected GrIS contributions to global sea-level rise.
How to cite: Rutishauser, A., Ahlstrøm, A. P., Fausto, R. S., Karlsson, N. B., Vandecrux, B., Scanlan, K. M., Picard, G., and Andersen, S. B.: Using offsets in airborne radar sounding and laser altimetry to characterize near-surface firn properties over the Greenland ice sheet, EGU General Assembly 2022, Vienna, Austria, 23–27 May 2022, EGU22-612, https://doi.org/10.5194/egusphere-egu22-612, 2022.
EGU22-942 | Presentations | CR2.1
Towards assembling the internal ice stratigraphy in coastal regions of Dronning Maud Land, East AntarcticaReinhard Drews, Inka Koch, Falk Oraschewski, Mohammadreza Ershadi, Leah Sophie Muhle, Heiko Spiegel, Vjeran Visnjevic, Guy Moss, Jakob Macke, Steven Franke, Daniela Jansen, Daniel Steinhage, and Olaf Eisen
The internal ice stratigraphy as imaged by radar is an integrated archive of the atmospheric- oceanographic, and ice-dynamic history that the ice sheet has experienced. It provides an observational constraint for ice flow modeling that has been used for instance to predict age-depth relationships at prospective ice-coring sites in Antarctica’s interior. The stratigraphy is typically more disturbed and more difficult to image in coastal regions due to faster ice flow. Yet, knowledge of ice stratigraphy across ice shelf grounding lines and further seawards is important to help constrain ocean-induced melting and associated stability.
Here, we present preliminary results of synthesizing information from radar stratigraphic characteristics from airborne and ground-based radar surveys that have been collected for specific projects starting from the 1990s onwards focusing on ice marginal zones of Antarctica. The key data is based on airborne surveys from the German Alfred Wegener Institute’s polar aircrafts equipped with a 150 MHz radar. In the meantime this system has been replaced by an ultra-wide band 150-520 MHz radar. The older data will provide a baseline with extensive coverage that can be used for model calibration and change detection over time. We aim to provide metrics of the radio stratigraphy (e.g. shape and slope of internal reflection horizons) as well as classified prevalent stratigraphy types that can be used to calibrate machine learning approaches such as simulation based inference. The data obtained will be integrated in coordination efforts within the SCAR AntArchitecture Action Group.
How to cite: Drews, R., Koch, I., Oraschewski, F., Ershadi, M., Muhle, L. S., Spiegel, H., Visnjevic, V., Moss, G., Macke, J., Franke, S., Jansen, D., Steinhage, D., and Eisen, O.: Towards assembling the internal ice stratigraphy in coastal regions of Dronning Maud Land, East Antarctica, EGU General Assembly 2022, Vienna, Austria, 23–27 May 2022, EGU22-942, https://doi.org/10.5194/egusphere-egu22-942, 2022.
EGU22-1002 | Presentations | CR2.1
Application of cosmic ray snow gauges to monitor the snow water equivalent on alpine glaciersRebecca Gugerli, Darin Desilets, and Nadine Salzmann
Temporally continuous measurements of the snow water equivalent (SWE) are a key variable in many hydrological, meteorological and glaciological studies and are of particular importance in high mountain regions. Obtaining temporally continuous, accurate and reliable SWE observations in these harsh environments, however, remains a challenge. Recently, promising results have been achieved by using a neutronic cosmic ray snow gauge (n-CRSG). The n-CRSG device is deployed below the seasonal snowpack and counts fast neutrons from the secondary cascades of cosmic rays, which are efficiently moderated and absorbed by the hydrogen atoms contained in the snowpack. Based on the exponential relationship between neutrons and hydrogen atoms, we can infer SWE from the neutron count rate. We have installed and evaluated a n-CRSG on the Swiss Glacier de la Plaine Morte. Our validation with 22 manual measurements over five winter seasons (2016/17-2020/21) showed an average underestimation of -2% ±10% (one standard deviation).
In the present study, we explore the use of muons instead of neutrons to infer SWE. To this end, we deployed two muonic cosmic ray snow gauges (µ-CRSG), one below and one above the seasonal snowpack, for the winter season 2020/21 on the same glacier site in Switzerland. The difference in count rates between the top and bottom device can be related to the SWE of the snowpack. We derive a first-cut conversion function based on manual SWE observations by means of snow pits and snow cores. To evaluate the measurements by the µ-CRSG, we also compare them to SWE estimates by the n-CRSG. Over the winter season 2020/21, almost up to 2000 mm w.e. were observed. Overall, the µ-CRSG agrees well with the n-CRSG on the evolution of the snowpack at a high temporal resolution and thus demonstrates its great potential. Also, the inferred SWE measurements lie within the uncertainty of manual observations. Furthermore, the µ-CRSG has several advantages over the n-CRSG; It is cheaper, lighter and promises a higher measurement precision due to the improved counting statistics of the muon count rates. We conclude that the µ-CRSG has even greater potential than the n-CRSG to monitor SWE in remote high mountain environments.
How to cite: Gugerli, R., Desilets, D., and Salzmann, N.: Application of cosmic ray snow gauges to monitor the snow water equivalent on alpine glaciers, EGU General Assembly 2022, Vienna, Austria, 23–27 May 2022, EGU22-1002, https://doi.org/10.5194/egusphere-egu22-1002, 2022.
Please decide on your access
Please use the buttons below to download the presentation materials or to visit the external website where the presentation is linked. Regarding the external link, please note that Copernicus Meetings cannot accept any liability for the content and the website you will visit.
Forward to presentation link
You are going to open an external link to the presentation as indicated by the authors. Copernicus Meetings cannot accept any liability for the content and the website you will visit.
We are sorry, but presentations are only available for users who registered for the conference. Thank you.
EGU22-1021 | Presentations | CR2.1
Best practices for collecting polarimetric data with ApRES for constraining ice-fabric orientation and its spatial variabilityOlaf Eisen, Reza Ershadi, Reinhard Drews, Sophie Berger, Da Gong, Yazhou Li, Carlos Martin, and Ole Zeising
In recent years radar polarimetry has re-surfaced as an ideal tool to determine ice-fabric patterns and linked mechanical ice anisotropy. The leap forward was facilitated by coherent data processing often collected by phase-sensitive Radio-Echo-Sounding (pRES) systems at fixed locations. The polarimetric response can either be synthesized from a set of quad-polarimetric measurements or obtained by manually rotating the antennas. Specifics of the data collection in the field varied between the different surveys, and no set of best practices has yet emerged. Here we present a systematic study that includes more than fifty different combinations of how polarimetric data can be acquired, including:
- different distances between the transmitter and receiver (2, 4 and 8 m)
- different combinations in polarization orientation (22.5 deg)
- a comparison between discrete full azimuthal data collected every 22.5 degrees and synthesized data collected in a quad-pole setup
- the effect of 180-degree polarization orientation on repeat measurements, e.g., basal melt rate and polarimetric analysis, e.g., coherence phase
- definition of Horizontal (H) and Vertical (V) orientation is pRES antenna setup and its impact on synthesizing and analyzing data
- 90-degree fabric orientation ambiguity in polarimetric data
This study aims to provide best practices, considering that observation time in the field is limited. Ideally, this will lead to a unified setup and nomenclature, facilitating better compatibility from data collected by different groups on ice sheets, shelves, and glaciers.
How to cite: Eisen, O., Ershadi, R., Drews, R., Berger, S., Gong, D., Li, Y., Martin, C., and Zeising, O.: Best practices for collecting polarimetric data with ApRES for constraining ice-fabric orientation and its spatial variability, EGU General Assembly 2022, Vienna, Austria, 23–27 May 2022, EGU22-1021, https://doi.org/10.5194/egusphere-egu22-1021, 2022.
Please decide on your access
Please use the buttons below to download the presentation materials or to visit the external website where the presentation is linked. Regarding the external link, please note that Copernicus Meetings cannot accept any liability for the content and the website you will visit.
Forward to presentation link
You are going to open an external link to the presentation as indicated by the authors. Copernicus Meetings cannot accept any liability for the content and the website you will visit.
We are sorry, but presentations are only available for users who registered for the conference. Thank you.

EGU22-1852 | Presentations | CR2.1
Changes in the internal structure of polythermal glaciers over the last decade: the case study of Fridtjofbreen and Erdmanbreen from 2010 to 2021, SvalbardAleksandr Borisik, Aleksandr Novikov, Ivan Lavrentiev, and Andrey Glazovsky
Glaciers on Svalbard have been shrinking in recent decades in response to current climate change. Most of them have decreased in size, area and surface elevation with stable negative or even accelerated changes in mass balance. Many of them are of the polythermal type, and as they shrink, their thermal regime might also change significantly depending on climate and local parameters, such as distribution of ice facies, firn thickness, and other factors affecting hydrology and glacier movement. In this study, we used data from repeated GPR surveys in 2010/12 and 2020/21 to identify likely changes in the thermal regime of the two polythermal glaciers Fridtjovbreen and Erdmanbreen in the western part of the Nordenskiöldland. These changes we have identified by comparison of changes in the depth of the internal reflection horizon (IRH) which corresponds to the cold-temperate transition surface (CTS) in polythermal glaciers.
Comparison of radio-echo sounding (RES) data obtained along the same transverse and longitudinal transects shows that in the last decade the most prominent CTS changes have occurred in the upper western basin of the Fridtjovbreen, where the mean total ice thickness decreased with rate −0.76 m a-1 (from 151 to 144 m in 9 years), meanwhile the thickness of the temperate ice core decreased with rate −2.52 m a-1 (from 115 to 92 m). As a result, with a general reduction in the thickness of the glacier, its upper cold layer increased from 36 to 52 m. These changes we attribute to the reduction of the firn area in this basin, which resulted in less thermal insulation and water retention and internal refreezing, and, therefore, in the fast cold front penetration into the glacier body with rates more than 3 times higher than the glacier thinning.
How to cite: Borisik, A., Novikov, A., Lavrentiev, I., and Glazovsky, A.: Changes in the internal structure of polythermal glaciers over the last decade: the case study of Fridtjofbreen and Erdmanbreen from 2010 to 2021, Svalbard, EGU General Assembly 2022, Vienna, Austria, 23–27 May 2022, EGU22-1852, https://doi.org/10.5194/egusphere-egu22-1852, 2022.
EGU22-3030 | Presentations | CR2.1
Arctic Sea-Ice Permittivity Derived from GNSS Reflectometry Data of the MOSAiC ExpeditionMaximilian Semmling, Jens Wickert, Frederik Kreß, Mainul Hoque, Dmitry Divine, Sebastian Gerland, and Gunnar Spreen
|
Sea ice is a crucial parameter of the Earth’s climate system. Its high albedo compared to water and its insulating effect between ocean and atmosphere influences the oceans’ radiation budget significantly. The importance of monitoring sea-ice properties arises from the high variability of sea ice induced by seasonal change and global warming. GNSS reflectometry can contribute to global monitoring of sea ice with high potential to extend the spatio-temporal coverage of today’s observation techniques. Properties like ice salinity, temperature, thickness and snow cover can affect the signal reflection. The MOSAiC expedition (Multidisciplinary drifting Observatory for the Study of Arctic Climate) gave us the opportunity to conduct reflectometry measurements under different sea-ice conditions in the central Arctic. A dedicated setup was mounted, in close cooperation with the Alfred-Wegener-Institute (AWI), on the German research icebreaker Polarstern that drifted for one year with the Arctic sea ice. |
How to cite: Semmling, M., Wickert, J., Kreß, F., Hoque, M., Divine, D., Gerland, S., and Spreen, G.: Arctic Sea-Ice Permittivity Derived from GNSS Reflectometry Data of the MOSAiC Expedition, EGU General Assembly 2022, Vienna, Austria, 23–27 May 2022, EGU22-3030, https://doi.org/10.5194/egusphere-egu22-3030, 2022.
EGU22-3073 | Presentations | CR2.1 | Highlight
Drone-based GPR system for 4D glacier data acquisitionBastien Ruols, Ludovic Baron, and James Irving
Thanks to the excellent propagation characteristics of radar waves in ice, ground-penetrating radar (GPR) has been one of the key geophysical methods used in the field of glaciology over the last 50 years. Alpine glacier GPR surveys are typically performed either directly on the glacier surface (e.g., on foot, skis, or with snowmobiles), or by helicopter several tens of meters above the surface. Helicopter-based surveys allow the coverage of large areas safely and efficiently, but this comes at the expense of reduced resolution of glacier internal structures, particularly in the context of 3D surveys. On the other hand, ice-based acquisitions offer high-resolution opportunities, but are very time-consuming, often risky, and can be physically exhausting to perform. Recent advances in the development of drone technologies open new data acquisition possibilities for glacier GPR data, combining the advantages of both ice and air-based methods.
We have developed a drone-based GPR system that allows for safe and efficient high-resolution 3D and 4D data acquisition on alpine glaciers. Our custom-built GPR instrument uses real-time sampling to record traces of length 2800 ns, which corresponds to a depth of over 200 m in glacier ice. Each trace is stacked over 5000 times and acquired using a sampling frequency of 320 MHz, the latter of which is just enough to avoid aliasing with our single lightweight 70-MHz-center-frequency antenna. Traces are recorded at a rate of 14 Hz, meaning that a drone speed of at least 4 m/s can be considered while maintaining a sufficiently high trace density for high-resolution studies. This is at least four times faster than a conventional survey on foot. The total weight of our GPR system plus single transmit/receive antenna is around 2 kg. The drone used in our work has a maximum payload capacity of about 6 kg and is equipped with a radar-based ground sensor which enables us to follow the glacier surface topography during the flights. An independent differential GPS allows us to locate each recorded GPR trace with decimeter precision.
We performed initial testing of the above-described system in August 2021 on the Otemma glacier and successfully acquired around 70-line kilometers of 3D GPR data, over an 8-day period, covering a large portion of the glacier. In September 2021, we undertook additional fieldwork on the Tsanfleuron and Sex-Rouge glaciers and recorded 30-line kilometers of 3D GPR data in less than 3 days. We could then determine and model with high-precision the ice-thickness distribution over the Tsanfleuron pass. These first field results show the concrete benefit of drone-based GPR glacier surveys and motivate further development towards 3D and 4D studies.
How to cite: Ruols, B., Baron, L., and Irving, J.: Drone-based GPR system for 4D glacier data acquisition, EGU General Assembly 2022, Vienna, Austria, 23–27 May 2022, EGU22-3073, https://doi.org/10.5194/egusphere-egu22-3073, 2022.
EGU22-3192 | Presentations | CR2.1
Strong Ocean Influence on Seasonal Changes in Shallow Shear-Modulus Structure in AlaskaToshiro Tanimoto and Jiong Wang
We have developed a method to determine shear-modulus (rigidity) structure for the upper 20-50m of the Earth. The method is based on the analysis of co-located pressure and seismic instruments. We applied this method to about 200 (co-located) stations in Alaska and examined seasonal variation in shallow shear-modulus structure at each site; in this report we quantify this seasonal change by taking the ratio (R) of the highest shear-modulus to the lowest throughout a year and use it as a characteristic feature for each station.
R is smaller than 2 at many stations but there are some stations in and near the Arctic zone that have R larger than 10. Such a large seasonal change implies that there occurs massive melting of shallow permafrost and a significant development of the active layer every summer. As a side product, because of such a huge reduction in near-surface shear-modulus, horizontal amplitudes in seismic noise become 30 times larger in summer than amplitudes in winter.
These seasonal changes may not be surprising because thawing of ice is common every summer in the permafrost region. But regions with large R show a systematic geographic pattern on a large-scale map; large-R stations are typically found near the coast (ocean) and tend to decrease toward the interior of the continent (Alaska and NW Canada). Large R stations are found in the NW Territories in Canada, the North Slope region northern side of the Brooks Range, near the Seaward Peninsula (west), and the Yukon-Kuskokwim Delta (west). These locations suggest a strong influence by the nearby ocean on the climate at each station. Proximity to the ocean (coast) seems to be an important factor in evaluating periglacial hazards.
There are a few exceptions in the northernmost coastal stations as they show small R despite the fact that they are at the coast. But the ICEsat-2 (satellite) data show that sea ice seems to remain thick near the peninsula (near Barrow, Alaska) much longer than other coastal areas in this study; temperature is colder because of thicker sea ice and the amount of melting at these exception sites remains low. This would strengthen the hypothesis that near-coastal ocean has strong influence on the climate of continental interior.
How to cite: Tanimoto, T. and Wang, J.: Strong Ocean Influence on Seasonal Changes in Shallow Shear-Modulus Structure in Alaska, EGU General Assembly 2022, Vienna, Austria, 23–27 May 2022, EGU22-3192, https://doi.org/10.5194/egusphere-egu22-3192, 2022.
EGU22-3205 | Presentations | CR2.1 | Highlight
Estimation of snow SWE using passive RFID tags as radar reflectorsMathieu Le Breton, Éric Larose, Laurent Baillet, Alec van Herwijnen, and Yves Lejeune
Estimation of snow SWE using passive RFID tags as radar reflectors
Mathieu Le Breton(1,2), Éric Larose(1), Laurent Baillet(1), Alec van Herwijnen(3), Yves Lejeune(4)
(1) Univ. Grenoble Alpes, CNRS, ISTerre, Grenoble, France
(2) Géolithe Innov, Géolithe, Crolles, France
(3) WSL Institute for Snow and Avalanche Research SLF, Davos, Switzerland
(4) CEN-CNRM, Météo-France, CNRS, Saint Martin d’Heres, France
Passive radio-frequency identification (RFID) tags are used massively to remotely identify industrial goods, and their capabilities offer new ways to monitor the earth’s surface already applied to coarse sediments, landslides, rock fissures and soils (Le Breton et al., 2910, 2020, 2021b). We introduce a method to estimate the variations in snow water equivalent (SWE) of a snowpack using an 865–868 MHz (RFID) system based on commercial off-the-shelf devices. The system consists of a vertical profile of low-cost passive tags installed before the first snowfall, on a structure that is minimally disruptive to the snowpack. The tags are interrogated continuously and remotely by a fixed reader located above the snow. The key measured value is the increase of phase delay, induced by the new layers of fresh snow which slow down the propagation of the waves. The method is tested both in a controlled laboratory environment, and outdoors on the Col de Porte observation site, in order to cross-check the results with a well-documented reference dataset (Lejeune et al., 2019). The experiments demonstrate that SWE can be estimated by this non-contact and non-destructive RFID technique. However, multipath interferences in the snowpack can generate errors up to 40 mm of SWE. This error is mitigated by using multiple tags and antennas placed at different locations, allowing the RFID measurements to remain within +/-10% of the cumulated precipitations (outdoor) and snow weighting (laboratory). In complement, the system can also estimate whether the snow is wet or dry, using temperature sensors embedded in the tags combined with the received signal strength. Using this approach with a mobile reader could allow the non-destructive monitoring of snow properties with a large number of low-cost, passive sensing tags.
Publications related to the project:
Le Breton, M., Baillet, L., Larose, E., Rey, E., Benech, P., Jongmans, D., Guyoton, F., Jaboyedoff, M., 2019. Passive radio-frequency identification ranging, a dense and weather-robust technique for landslide displacement monitoring. Eng. Geol. 250, 1–10. http://doi.org/10.1016/j.enggeo.2018.12.027
Le Breton, M., Grunbaum, N., Baillet, L., Larose, É., 2021a. Monitoring rock displacement threshold with 1-bit sensing passive RFID tag (No. EGU21-15305). Presented at the EGU21, Copernicus Meetings. http://doi.org/10.5194/egusphere-egu21-15305
Le Breton, M., Liébault, F., Baillet, L., Charléty, A., Larose, É., Tedjini, S., 2021b. Dense and long-term monitoring of Earth surface processes with passive RFID -- a review. Submitted. Preprint at: https://arxiv.org/abs/2112.11965v1
Lejeune, Y., Dumont, M., Panel, J.-M., Lafaysse, M., Lapalus, P., Le Gac, E., Lesaffre, B., Morin, S., 2019. 57 years (1960–2017) of snow and meteorological observations from a mid-altitude mountain site (Col de Porte, France, 1325 m of altitude). Earth Syst. Sci. Data 11, 71–88. http://doi.org/10.5194/essd-11-71-2019
How to cite: Le Breton, M., Larose, É., Baillet, L., van Herwijnen, A., and Lejeune, Y.: Estimation of snow SWE using passive RFID tags as radar reflectors, EGU General Assembly 2022, Vienna, Austria, 23–27 May 2022, EGU22-3205, https://doi.org/10.5194/egusphere-egu22-3205, 2022.
EGU22-3248 | Presentations | CR2.1
Annual development of subalpine grassland observed with UAV: how NDVI evolution is controlled by snow meltingJesús Revuelto, Javier Sobrino, Daniel Gómez, Guillermo Rodriguez-López, Esteban Alonso-González, Francisco Rojas-Heredia, Eñaut Izagirre, Raquel Montorio-Lloveria, Fernando Pérez-Cabello, and Juan Ignacio López-Moreno
In the Pyrenees, as in other mid latitude mountain ranges, sub alpine areas have a long lasting snow cover that affect different mountain processes, including river discharge timing, soil erosion, primary production or animal and plant phenology. This work presents and analyzes a complete snow depth and Normalized Difference Vegetation Index (NDVI) spatial distribution dataset, generated by Unmanned Aerial Vehicles (UAV) over two years. This study aims to increase the knowledge and understanding of the relationship of the duration and timing of snowmelt and vegetation cover and its annual cycle.
The dataset was obtained in Izas Experimental Catchment, a 55 ha study area located in Central Spanish Pyrenees ranging between 2000 to 2300 m a.s.l., which is mostly covered by grasslands. A total of 18 UAV snow depth and 14 NDVI observations were obtained by a fixed wing UAV equipped with RGB and multispectral cameras during 2020 and 2021. The melt out date for the different areas of the catchment has been obtained from the snow depth distribution dataset, which in turn has been used to analyze the NDVI evolution. The NDVI values for each UAV flight have been correlated with the snow depth distribution observed in previous dates and with different topographic variables as elevation, solar radiation, curvature (through the Topographic Position Index) or slope.
The maximum seasonal NDVI happens throughout the study area simultaneously in the entire study area; however those zones with the latest snow disappearance do not reach NDVI values as high as those observed in areas with earlier snow disappearance. Oppositely areas with the soonest snow melting (in late February) have lower maximum NDVI values that those observed in areas with snow melting occurring later (around May). NDVI correlations have shown that the snow depth distribution observed about one month prior to each NDVI acquisition has a very important control on pasture phenology. This correlation is particularly evident on the free-snow areas during first melting weeks, with a lower influence in those areas where snow melts at the end of the snow season. This field study exemplifies how intensive UAV acquisitions allow understanding snow processes over extended areas with an unprecedented spatial resolution.
How to cite: Revuelto, J., Sobrino, J., Gómez, D., Rodriguez-López, G., Alonso-González, E., Rojas-Heredia, F., Izagirre, E., Montorio-Lloveria, R., Pérez-Cabello, F., and López-Moreno, J. I.: Annual development of subalpine grassland observed with UAV: how NDVI evolution is controlled by snow melting, EGU General Assembly 2022, Vienna, Austria, 23–27 May 2022, EGU22-3248, https://doi.org/10.5194/egusphere-egu22-3248, 2022.
Please decide on your access
Please use the buttons below to download the presentation materials or to visit the external website where the presentation is linked. Regarding the external link, please note that Copernicus Meetings cannot accept any liability for the content and the website you will visit.
Forward to presentation link
You are going to open an external link to the presentation as indicated by the authors. Copernicus Meetings cannot accept any liability for the content and the website you will visit.
We are sorry, but presentations are only available for users who registered for the conference. Thank you.
EGU22-4179 | Presentations | CR2.1
Hansbreen’s calving-driven ice loss derived from seismic data supported by millimetre-wave radar scans and neural networksWojciech Gajek, William Harcourt, and Dannielle Pearce
Calving of tidewater glaciers is a key driver of glacier mass loss as well as a significant contribution towards sea level rise. However, this dynamic process is still challenging to quantify. In addition, there are very few direct measurements of calving activity in Svalbard at daily to sub-daily resolution due to the requirement of continuous human labour at the calving front for field studies. Seismic instruments in the vicinity of glaciers offer the potential to circumvent this issue since they record ground motion signals, including those generated by calving events, with an unprecedented sub-second resolution. Such data sets are not affected by site conditions like poor visibility or darkness and, in the case of permanent regional seismological stations, already offer long-term datasets. Despite this, a knowledge gap remains which prevents making a direct link between precise calving volumes and seismic records. This study presents our effort made towards obtaining an estimate of volumetric ice loss from integrating seismic records with 3D millimetre-wave radar measurements of a tidewater glacier calving front. In the summer of 2021, an 8-day long time series of integrated measurements was acquired at the calving front of Hansbreen, South Spitsbergen. It included remote sensing observations from a millimetre-wave radar (AVTIS2), Terrestrial Laser Scanner and time-lapse cameras correlated with a seismic dataset from two local arrays deployed at direct vicinity of calving front and a closeby regional permanent seismological station in Hornsund. Integrating these datasets brings an opportunity to correlate visual observations of calving including volumetric ice loss derived from radar scans with seismic signatures registered at nearby seismic arrays. We explore various parameters that characterize observed calving events and develop a model linking chosen parameters with ice loss using machine learning techniques. Local arrays were installed for a limited time and the calibrated parameters are expected to change spatially. Therefore, we further transfer our approach and integrate decade long records from nearby permanent seismological station. Limiting data to a single station record reduces both the accuracy of estimated ice volume and spatial resolution. However, it enables us to apply detection algorithm trained using observed calvings to decade long records and, consequently, to revisit a decade long history of Hansbreen's calving.
How to cite: Gajek, W., Harcourt, W., and Pearce, D.: Hansbreen’s calving-driven ice loss derived from seismic data supported by millimetre-wave radar scans and neural networks, EGU General Assembly 2022, Vienna, Austria, 23–27 May 2022, EGU22-4179, https://doi.org/10.5194/egusphere-egu22-4179, 2022.
EGU22-4573 | Presentations | CR2.1
Single-frequency GNSS-IR for estimating snowpack height with consumer grade receivers and antennasGiulia Graldi, Simone Rover, and Alfonso Vitti
Ground and space based GNSS-IR (Interferometric Reflectometry) has been used in the last 20 years for characterizing the Earth Surface, together with other remote sensing techniques. Among the physical quantities which can be monitored using these techniques, the characterization of the snow cover is of particular interest since it is an important source of freshwater. The increase of the global temperature due to anthropogenic climate changes is threatening the seasonal recharging, and for this reason monitoring the snow cover is crucial. Ground based GNSS-IR can be used for obtaining information on the height of the snowpack, with a precision of 0.04 m by using geodetic-grade GNSS instruments (such those involved in Continuously Operating Reference Stations - CORS). In the present study, the sensitivity of the retrieval of the snowpack height from data acquired with low cost non-geodetic grade instruments with the GNSS-IR technique is evaluated. The analysis is applied to a flat alpine area in the Lavarone plateau in the Province of Trento, Italy (1400 m above sea level), where GNSS field campaigns were carried out in 2018, 2019 for short time periods (90, 120 minutes) due to constraints of the study area. Single-frequency GPS observations were collected with u-blox M8T GNSS receivers and patch u-blox and Tallysman antennas. Leica antenna and receiver were also used for collecting GPS data in double frequency, in order to acquire reference data with geodetic grade instruments. Given the characteristics of the area, it is possible to consider that GPS signals reflect with specular reflection, and thus modelling the Signal to Noise Ratio (SNR) as a function of the distance between the reflecting snow surface above solid ground and the antenna. Multipath frequency associated with snowpack height is retrieved by applying the Lomb Scargle Periodogram on SNR data. The results show that, by applying GNSS-IR technique to data acquired with low-cost receivers and antennas, it is possible to retrieve the height of the snow pack with a standard deviation of about 0.05 m. This demonstrates the feasibility of GNSS-IR also with non-geodetic grade instruments.
How to cite: Graldi, G., Rover, S., and Vitti, A.: Single-frequency GNSS-IR for estimating snowpack height with consumer grade receivers and antennas, EGU General Assembly 2022, Vienna, Austria, 23–27 May 2022, EGU22-4573, https://doi.org/10.5194/egusphere-egu22-4573, 2022.
Please decide on your access
Please use the buttons below to download the presentation materials or to visit the external website where the presentation is linked. Regarding the external link, please note that Copernicus Meetings cannot accept any liability for the content and the website you will visit.
Forward to presentation link
You are going to open an external link to the presentation as indicated by the authors. Copernicus Meetings cannot accept any liability for the content and the website you will visit.
We are sorry, but presentations are only available for users who registered for the conference. Thank you.
EGU22-5506 | Presentations | CR2.1
Beyond crossovers: Predicting ice thickness uncertainties in ice penetrating radar data from geometric controlsDuncan Young, Scott Kempf, and Gregory Ng
Ice thickness is a key parameter for predictive ice sheet modeling, geological interpretation of the underlying bed rock, and site selection for deep ice sheet and bed rock sampling. However, the uncertainties typically reported are in terms of crossover statistics, and ice thickness uncertainties are generally not formally integrated into ice sheet models. Here we examine what crossover statistics reveal and conceal for the actual uncertainty in reported ice thickness, examine the impact of system and geometric parameters on uncertainties, and place these parameters in the context of the observed subglacial roughness. We provide a predictive model for uncertainties as a function of ice thickness, sensor height, and subglacial roughness parameters, evaluate it from the perspective of ground based, airborne and orbital sounding and make recommendations for parameters that should be reported in ice thickness data products.
How to cite: Young, D., Kempf, S., and Ng, G.: Beyond crossovers: Predicting ice thickness uncertainties in ice penetrating radar data from geometric controls, EGU General Assembly 2022, Vienna, Austria, 23–27 May 2022, EGU22-5506, https://doi.org/10.5194/egusphere-egu22-5506, 2022.
EGU22-5865 | Presentations | CR2.1
Diffraction imaging of alpine glacier GPR dataJohanna Klahold, Benjamin Schwarz, Alexander Bauer, and James Irving
Over the past decades, ground-penetrating radar (GPR) has become a fundamental tool in glaciological studies thanks to its tremendous capacity to provide high-resolution images in snow and ice. 3D acquisitions in particular can give detailed information on the internal structure, properties, and dynamics of glaciers. For imaging and highlighting important englacial and subglacial features such as meltwater tunnels and voids, an analysis of the spatial distribution of diffractions in the data holds great potential. However, the diffracted wavefield typically has low amplitude and is often masked by more prominent arrivals. Diffraction separation and imaging procedures have already become topics of significant interest in the field of exploration seismology, and may potentially open new possibilities for the analysis of glacier GPR data.
Here, we explore the potential of recent advances in diffraction imaging for the analysis of alpine glacier GPR data. To this end, we consider a 3D data set acquired on the Haut Glacier d’Arolla (Valais, Switzerland) using a 70-MHz single-antenna real-time-sampling GPR system. The approach we use coherently approximates the dominant reflected wavefield and subtracts it from the data. The remaining diffracted wavefield is then enhanced using local coherent stacking. We find that this methodology is highly effective at isolating diffractions in glacier GPR data and provides clean images of the diffracting structures. Current work includes investigation of the correlation between these structures and the englacial and subglacial hydrological network.
How to cite: Klahold, J., Schwarz, B., Bauer, A., and Irving, J.: Diffraction imaging of alpine glacier GPR data, EGU General Assembly 2022, Vienna, Austria, 23–27 May 2022, EGU22-5865, https://doi.org/10.5194/egusphere-egu22-5865, 2022.
EGU22-6377 | Presentations | CR2.1
Using EisNet to Extract Bedrock and Internal layers from Digital and Analog Radiostratigraphy in Ice SheetsSheng Dong, Xueyuan Tang, and Lei Fu
The radar detection of bedrock interface and internal ice layers is a widely used technique for observing interiors and bottoms of ice sheets, which is also an important indicator of inferring the evolution of glaciers and explaining subglacial topographies. The conventional methods, such as the filtering denoise, are limited by the low contrast in ice radar image with noise and interferes and thus the automatic method in tracing and extracting layers' features is trapped. The manual and semiautomatic methods are widely applied but with large time-consuming especially for the large-scale radar image with continuous bedrock and internal layers. To extract and identify the bedrock interface and internal ice layers automatically, we propose EisNet, a fusion system consisting of three sub neural networks. Because of the limitations of conventional manual methods, it is relatively rare that the high-precision extraction of layer features, which can be applied as labels in training. To obtain sufficient radar images with high-quality training labels, we also propose a novel synthetic method to simulate the not only visual texture of the bedrock interface and internal layers but also the artifact noise and interference to match the feature in field data. EisNet is first verified on synthetic data and shows capacity on the extraction of multi types of layer targets. Second, the application on observational radar images reveals EisNet’s generalized performance from synthetic data to the CHINARE data. EisNet is also applied to extract bedrock interfaces from the radar film from the Antarctic. EisNet is now open open-accessing. We hope that EisNet could be applied in more ice radar images from other regions and different forms to promote glacial research.
How to cite: Dong, S., Tang, X., and Fu, L.: Using EisNet to Extract Bedrock and Internal layers from Digital and Analog Radiostratigraphy in Ice Sheets, EGU General Assembly 2022, Vienna, Austria, 23–27 May 2022, EGU22-6377, https://doi.org/10.5194/egusphere-egu22-6377, 2022.
EGU22-6414 | Presentations | CR2.1
Ice layer detection, distribution, and thickness in the near-surface firn on Devon Ice Cap: a new dual-frequency radar characterization approachKristian Chan, Cyril Grima, Anja Rutishauser, Duncan A. Young, Riley Culberg, and Donald D. Blankenship
Atmospheric warming has led to increased surface melting on glaciers in the Arctic. This meltwater can percolate into firn and refreeze to form ice layers. Depending on their thickness, low-permeability ice layers can act as barriers that inhibit subsequent vertical meltwater infiltration in deeper firn pore space and favor lateral meltwater runoff. Thus, characterizing ice layers in firn is key for understanding the near-surface hydrological conditions that could promote surface meltwater runoff and its contribution to sea level rise.
Airborne ice-penetrating radar (IPR) is a powerful tool for imaging subsurface structure, but only recently have these systems been applied to direct observations of the bulk properties of the near-surface. To evaluate the bulk permeability of the near-surface firn system of Devon Ice Cap (DIC), Canadian Arctic, we use the Radar Statistical Reconnaissance (RSR) technique, originally developed for accumulation studies in West Antarctica. This method utilizes both the coherent and incoherent components of the total surface return, which are predominately sensitive to near-surface permittivity/structure within the system’s vertical range resolution and surface roughness, respectively. Here, we apply RSR to IPR data collected over DIC with the High-Capability Airborne Radar Sounder 2 (HiCARS) system (60 MHz center-frequency, 15 MHz bandwidth), operated by the University of Texas Institute for Geophysics (UTIG). Guided by ground-based ice-penetrating radar data and firn core density measurements, we show that the near-surface heterogeneous firn structure, featuring ice layers, mainly affects the observed coherent component.
We further compare the coherent component of HiCARS with that derived from IPR data collected with the University of Kansas Multichannel Coherent Radar Depth Sounder (MCoRDS) 3 system (195 MHz center-frequency; 30 MHz bandwidth), to evaluate the utility of dual-frequency IPR for characterizing near-surface ice layers. We expect that each radar system is sensitive to a different scale of near-surface bulk properties (i.e., depth and thickness of ice layers of different vertical extents), governed by each radar systems’ center frequency and bandwidth-limited range resolution. We leverage these differences in range resolution to derive ice layer thickness constraints in the DIC firn zone containing meter-thick ice layers, which are consistent with ground-based observations. Our results suggest this dual-frequency approach does indeed show that ice layers are vertically resolvable, spatially extensive, and mostly impermeable to surface meltwater. Thus, we hypothesize that lateral flow over high elevation meter-thick ice layers may contribute to the total surface runoff routed through supraglacial rivers down-glacier in the ablation zone.
How to cite: Chan, K., Grima, C., Rutishauser, A., Young, D. A., Culberg, R., and Blankenship, D. D.: Ice layer detection, distribution, and thickness in the near-surface firn on Devon Ice Cap: a new dual-frequency radar characterization approach, EGU General Assembly 2022, Vienna, Austria, 23–27 May 2022, EGU22-6414, https://doi.org/10.5194/egusphere-egu22-6414, 2022.
EGU22-6575 | Presentations | CR2.1
Creating a database of electrical resistivity tomography surveys of permafrost in Canada and establishing best practices for data processing and sharingTeddi Herring and Antoni Lewkowicz
Electrical resistivity tomography (ERT) is a geophysical method that produces an estimate of subsurface resistivity distribution, which can be used to infer the presence and extent of frozen ground. Repeated ERT surveys indicate how subsurface temperature and ground ice conditions are changing over time, which is particularly important for evaluating the changes and risks associated with climate change. However, there is no existing framework for sharing ERT data and datasets are rarely published, making it difficult to find and use historical data to assess subsurface changes. To facilitate data sharing, we are developing a Canadian database for ERT surveys of permafrost.
A key component of this project is the development of an automated ERT data processing workflow to prepare datasets. Establishing best practices for data processing ensures that ERT results are optimized and standardized, which is essential so that changes in subsurface conditions can be reasonably interpreted. We also present our web-based data visualization tool that allows for targeted searching of surveys and plotting of selected results. By storing ERT data in a standardized and accessible way, our goal is to facilitate interpretations of permafrost change on a range of spatial and temporal scales and guide future research in permafrost science.
How to cite: Herring, T. and Lewkowicz, A.: Creating a database of electrical resistivity tomography surveys of permafrost in Canada and establishing best practices for data processing and sharing, EGU General Assembly 2022, Vienna, Austria, 23–27 May 2022, EGU22-6575, https://doi.org/10.5194/egusphere-egu22-6575, 2022.
EGU22-7154 | Presentations | CR2.1
In-situ measurements of sediment temperature under shallow water bodies in Arctic environmentsFrederieke Miesner, William Cable, Julia Boike, and Pier Paul Overduin
The thermal regime under lakes, ponds, and shallow near shore zones in permafrost zones in the Arctic is predominantly determined by the temperature of the overlying water body throughout the year. Where the temperatures of the water are warmer than the air, unfrozen zones within the permafrost, called taliks, can form below the water bodies.
However, the presence of bottom-fast ice can decrease the mean annual bed temperature in shallow water bodies and significantly slow down the thawing or even refreeze the lake or sea bed in winter. Small changes in water level have the potential to drastically alter the sub-bed thermal regime between permafrost-thawing and permafrost-forming. The temperature regime of lake sediments is a determining factor in the microbial activity that makes their taliks hot spots of methane gas emission. Measurements of the sediment temperature below shallow water bodies are scarce, and single temperature-chains in boreholes are not sufficient to map spatial variability.
We present a new device to measure in-situ temperature-depth profiles in saturated soils or sediments, adapting the functionality of classic Bullard-type heat flow probes to the special requirements of the Arctic. The measurement setup consists of 30 equally spaced (5cm) digital temperature sensors housed in a 1.5 m stainless steel lance. The lance is portable and can be pushed into the sediment by hand either from a wading position, a small boat or through a hole in the ice during the winter. Measurements are taken continuously and 15 minutes in the sediment are sufficient to acquire in-situ temperatures within the accuracy of the sensors (0.01K after calibration at 0°C). The spacing of the sensors yield a detailed temperature-depth-profile of the near-surface sediments, where small-scale changes in the bottom water changes dominate the temperature field of the sediment. The short time needed for a single measurement allows for fine-meshed surveys of the sediment in areas of interest, such as the transition zone from bottom-fast to free water.
Test campaigns in the Canadian Arctic and on Svalbard have proven the device to be robust in a range of environments. We present data acquired during winter and summer, covering non-permafrost, thermokarst lake and offshore measurements.
How to cite: Miesner, F., Cable, W., Boike, J., and Overduin, P. P.: In-situ measurements of sediment temperature under shallow water bodies in Arctic environments, EGU General Assembly 2022, Vienna, Austria, 23–27 May 2022, EGU22-7154, https://doi.org/10.5194/egusphere-egu22-7154, 2022.
Please decide on your access
Please use the buttons below to download the presentation materials or to visit the external website where the presentation is linked. Regarding the external link, please note that Copernicus Meetings cannot accept any liability for the content and the website you will visit.
Forward to presentation link
You are going to open an external link to the presentation as indicated by the authors. Copernicus Meetings cannot accept any liability for the content and the website you will visit.
We are sorry, but presentations are only available for users who registered for the conference. Thank you.
EGU22-7409 | Presentations | CR2.1
S-wave velocity profile of an Antarctic ice stream firn layer with ambient seismic recording using Distributed Acoustic SensingWen Zhou, Antony Butcher, J. Michael Kendall, Sofia-Katerina Kufner, and Alex Brisbourne
Measurements of the seismic properties of Antarctic ice streams are critical for constraining glacier dynamics and future sea-level rise contributions. In 2020, passive seismic data were acquired at the Rutford Ice Stream, West Antarctica, with the aim of imaging the near-surface firn layer. A DAS (distributed acoustic sensing) interrogator and 1 km of optic fibre were supplemented by 3-component geophones. Taking advantage of transient seismic energy from a petrol generator and seismicity near the ice stream shear margin (10s of km away from the DAS array), which dominated the ambient seismic noise field, we retrieve Rayleigh wave signals from 3 to 50 Hz. The extracted dispersion curve for a linear fibre array shows excellent agreement with an active seismic surface wave survey (Multichannel Analysis of Surface Waves) but with lower frequency content. We invert the dispersion curves for a 1D S-wave velocity profile through the firn layer, which shows good agreement with the previously acquired seismic refraction survey. Using a triangular-array geometry we repeat the procedure and find no evidence of seismic anisotropy at our study site. Our study presents challenges and solutions for processing noisy but densely sampled DAS data, for noise interferometry and imaging.
How to cite: Zhou, W., Butcher, A., Kendall, J. M., Kufner, S.-K., and Brisbourne, A.: S-wave velocity profile of an Antarctic ice stream firn layer with ambient seismic recording using Distributed Acoustic Sensing, EGU General Assembly 2022, Vienna, Austria, 23–27 May 2022, EGU22-7409, https://doi.org/10.5194/egusphere-egu22-7409, 2022.
EGU22-7447 | Presentations | CR2.1
Investigation of the induced polarization effect in transient electromagnetic soundings to characterize rock glaciersLukas Aigner, Nathalie Roser, Clemens Moser, Theresa Maierhofer, Umberto Morra Di Cella, Christian Hauck, and Adrián Flores Orozco
Geophysical characterization of rock glaciers commonly relies on electrical resistivity tomography (ERT) and seismic refraction tomography (SRT). Yet, large blocks make the installation of geophones and electrodes time consuming, while bad contacts lead to reduced signal-to-noise ratios in both methods. Additionally, ERT and SRT campaigns require rather heavy equipment and need long profiles to reach large depths of investigation. Transient electromagnetic (TEM) measurements offer diverse advantages, as they do not require a galvanic contact with the ground, and can be conducted with light instruments for simplified field procedures. We propose the application of TEM measurements with a single-loop configuration for the collection of extensive data sets in alpine environments. We hypothesize that TEM measurements provide the same information as SRT and ERT, yet field procedures of the TEM method are much more efficient permitting to cover larger areas in reduced time. In particular, we present investigations conducted on the Gran Sometta rock glacier (above Cervinia, Aosta Valley, Italian Alps). The study area consists of a large active rock glacier complex composed of two main lobes with varying ice content. Our surveys aimed at: (i) estimating the depth to the bedrock below the rock glacier, (ii) identifying the degree of weathering in the underlying bedrock, and (iii) evaluating spatial variations of ice content of the rock glacier. We collected TEM data with a TEM-FAST 48 system using 4 A current and a 50 m by 50 m single loop configuration. The experimental setup fits in a single backpack and our 3-person team covered an area of approximately 75’000 m² in 2.5 days, despite the difficult terrain. We measured 28 soundings distributed over the entire site and repeated two sounding locations with a larger 75 m square loop. Complementary spectral induced polarization (SIP) data were measured using 64 electrodes with a separation of 2.5 m between electrodes along two perpendicular profiles to validate our TEM results. We used separated transmitter and receiver instruments as well as cables to reduce EM coupling effects in our SIP data. TEM data reveal sign reversals, which are caused by the induced polarization effect due to the ice content in the rock glacier. We model the TEM response with the open-source algorithm empymod assuming a layered media. We observe that including a layer with a frequency-dependent polarization results in the signal reversals, while the geometry of such a layer also influences the TEM response. Furthermore, we observe that resistivity variations in the layer below the polarizable one can also be detected by the TEM data. Hence, our results demonstrate the applicability of TEM measurements to determine the geometry of the ice-rich layer in an active rock glacier, possible variations in ice content at the study area as well as the electrical properties of the underlying bedrock.
How to cite: Aigner, L., Roser, N., Moser, C., Maierhofer, T., Morra Di Cella, U., Hauck, C., and Flores Orozco, A.: Investigation of the induced polarization effect in transient electromagnetic soundings to characterize rock glaciers, EGU General Assembly 2022, Vienna, Austria, 23–27 May 2022, EGU22-7447, https://doi.org/10.5194/egusphere-egu22-7447, 2022.
EGU22-7552 | Presentations | CR2.1
Assessment of ESA CryoSat-2 radar altimetry data using GNSSdata at three sites on the Greenland Ice SheetKarina Hansen, Kristine M. Larson, Michael J. Willis, William Colgan, Veit Helm, and Shfaqat Abbas Khan
Ten-year records of ice surface elevation changes derived from three GNSS stations placed on the interior of the Greenland ice sheet are used to assess the ability of CryoSat-2 radar altimetry to capture surface elevation changes during 2010-2021. We use GNSS interferometric reflectometry (GNSS-IR) to derive time series of continuous daily surface elevations. The footprint of GNSS-IR is about 1000 m2 and the accuracy is ±2cm, making it an excellent tool to validate ice surface height from satellite altimetry. We compare GNSS-IR derived ice surface elevations with CryoSat-2 derived surface elevations and find Cryosat-2 performs best at the GNSS site furthest north (GLS3) with a maximum difference of 12cm. The other GNSS sites have a higher residual range because of poorer data availability and local surface variations. The number of Cryosat-2 data points are roughly doubled from GLS1 and GLS2 to GLS3. GLS3 Is located in a very flat area of the ice sheet only moving 55m during 2011-2020. In contrast GLS1 moved 292m in the same period, clearly indicating a steeper slope to the ice sheet at this location, which we have difficulty correcting for because digital elevation models are associated with high uncertainty on the interior of the ice sheet. The strength of this assessment method lies in the continuous daily time series of surface elevation change derived from GNSS, as they clearly capture extreme short-term changes, which otherwise might have been perceived as errors in the radar altimetry measurements.
How to cite: Hansen, K., Larson, K. M., Willis, M. J., Colgan, W., Helm, V., and Khan, S. A.: Assessment of ESA CryoSat-2 radar altimetry data using GNSSdata at three sites on the Greenland Ice Sheet, EGU General Assembly 2022, Vienna, Austria, 23–27 May 2022, EGU22-7552, https://doi.org/10.5194/egusphere-egu22-7552, 2022.
EGU22-7725 | Presentations | CR2.1
Illuminating the deeper radio-stratigraphy of an alpine glacier using SAR processingFalk Oraschewski, Inka Koch, Mohammadreza Ershadi, Jonathan Hawkins, and Reinhard Drews
The internal stratigraphy of alpine glaciers entails information about its past dynamics and accumulation rates. It further can be used for intercalibrating the age-depth scales of ice cores. The internal ice stratigraphy is often imaged using radar, but similar to polar ice sheets the deeper stratigraphy is often difficult to resolve with classical pulsed radar systems. For polar ice sheets, the introduction of phase coherent radars has illuminated this former echo-free zone (EFZ) and now patterns of folded, buckled and disrupted ice stratigraphy are clearly visible. Unfortunately, the new airborne and ground-based radar systems applied in polar regions are typically too heavy to be deployed in an alpine environment.
Here, we transfer the lightweight autonomous phase-sensitive radio-echo sounder (ApRES) to an alpine glacier targeting its echo-free zone (Colle Gnifetti, Italy/Switzerland). The ApRES is a coherent frequency modulated continuous wave radar with an integration time of 1 s per trace which we deployed in combination with a GNSS used in real time kinematic (RTK) mode. The latter allows repositioning of the antennas with sub-wavelength accuracy (approximately 5 cm) required to exploit the coherent signal. Like this, the radio-stratigraphy of the former EFZ at this site could be imaged using a matched filtering SAR method. The resulting radargrams cover former ice core sites (e.g., Ice Memory and KCC) and can be used to harmonize conflicting age-depth scales. This dataset will be analysed further in conjunction with ice-fabric measurements from ice cores to reveal how the anisotropic ice rheology imprints on the flow field of glaciers.
How to cite: Oraschewski, F., Koch, I., Ershadi, M., Hawkins, J., and Drews, R.: Illuminating the deeper radio-stratigraphy of an alpine glacier using SAR processing, EGU General Assembly 2022, Vienna, Austria, 23–27 May 2022, EGU22-7725, https://doi.org/10.5194/egusphere-egu22-7725, 2022.
EGU22-8245 | Presentations | CR2.1
A passive seismic approach including fiber-optic sensing for permafrost monitoring on Mt. Zugspitze (Germany)Fabian Lindner, Krystyna Smolinski, Jonas Igel, Daniel Bowden, Andreas Fichtner, and Joachim Wassermann
As observed elsewhere on a global scale, permafrost at Mt. Zugspitze (German/Austrian Alps) is warming in response to climate change. To monitor permafrost warming and thawing, which affect the rock slope stability and thus the hazard potential, borehole temperature logging and electrical resistivity tomography (ERT) have been employed at Mt. Zugspitze for more than a decade. Furthermore, a recent study shows that the ambient seismic noise recordings of a single seismometer at the same site can be utilized to track permafrost changes over the past 15 years. This passive seismic approach is non-invasive, labour- and cost-effective and provides high temporal resolution. Together with recent advances in instrumentation allowing the measurement of seismic vibrations on a meter scale along a fiber-optic cable (known as distributed acoustic sensing), passive seismology provides unprecedented spatio-temporal resolution for monitoring applications.
Starting in July 2021, we extended the single-station deployment on Mt. Zugspitze with three small seismic arrays (six stations each, aperture ~25 m) along the permafrost-affected ridge. The stations are partly installed in a tunnel beneath the surface, which intersects a permafrost body, thus allowing in-situ observations of the frozen rock. We equipped the tunnel facilities with a fiber-optic cable, which we will interrogate on a regular basis, about once per quarter year, to resolve seasonal permafrost dynamics. A first 10-day data set of this monitoring element with seismic channel spacing of 2 m along a cable exceeding 1 km in length is already available and shows that artificial avalanche triggering explosions were successfully recorded. We present data and first results dedicated to permafrost monitoring along the fiber-optic cable and between pairs of seismic stations through cross-correlation of ambient seismic noise. In addition, the seismic arrays are designed to derive rotational ground motions, which we expect to be more sensitive to local subsurface/permafrost changes compared to the classical translational motion measurements. The experiment aims to explore the permafrost monitoring capabilities of passive seismology compared to more classical and established methods as ERT.
How to cite: Lindner, F., Smolinski, K., Igel, J., Bowden, D., Fichtner, A., and Wassermann, J.: A passive seismic approach including fiber-optic sensing for permafrost monitoring on Mt. Zugspitze (Germany), EGU General Assembly 2022, Vienna, Austria, 23–27 May 2022, EGU22-8245, https://doi.org/10.5194/egusphere-egu22-8245, 2022.
EGU22-8555 | Presentations | CR2.1
Using different seismic approaches to detect submarine permafrost and gas hydrates on the continental Beaufort shelf of the Canadian ArcticHenrik Grob, Michael Riedel, Mathieu J. Duchesne, Sebastian Krastel, Jefferson Bustamante Restrepo, Gabriel Fabien-Ouellet, Dirk Kläschen, Jonas Preine, Young Keun Jin, and Jong Kuk Hong
In the Canadian Arctic, permafrost and permafrost-associated gas hydrates formed extensively during the last 1 Ma. After the last glaciation, a marine transgression followed and former terrestrially exposed shelf areas became submerged. Subaerial mean annual temperatures of -20°C or even less changed to present submarine bottom water temperatures near -1°C. The relict submarine permafrost and gas hydrates present in the Beaufort Sea still react to this ongoing thermal change which results in their continued degradation. Thawing permafrost and destabilisation of permafrost-associated gas hydrates may release previously trapped greenhouse gases and can lead to even further gas hydrate dissociation. Moreover, thawing permafrost poses a geohazard in form of landslides and ground collapses. Yet, both the extent of the submarine permafrost and the permafrost-associated gas hydrates are still not well known. Here, we present three different approaches using marine 2D multichannel seismic data to improve the current knowledge of the distribution of offshore permafrost and gas hydrates occurrences in the southern Canadian Beaufort Sea. The acoustic properties of permafrost are determined by the content of ice and unfrozen pore fluids. Changing permafrost conditions affect the elasticity of the medium making seismic methods appropriate for permafrost detection. First, we identify direct and indirect seismic reflection indicators from permafrost and gas hydrates by the presence of cross-cutting, polarity-reversed, and upward-bend reflections as well as velocity pull-ups and shallow pronounced high-amplitude reflections. Second, using diving-wave tomography provides insights into the near-surface permafrost structure by imaging the velocity structure in greater detail than achievable by standard velocity analyses. And third, diffractions separated from the reflected wavefield yield insights into the sub-wavelength architecture of the permafrost realm on the southern Canadian Beaufort Shelf that may add information about weak phase-boundaries and small-scale heterogeneities. All methods are applied to seismic lines crossing the outer continental margin, where a maximum thermal effect of the transgression is expected, and thus a maximum lateral variation in permafrost and permafrost-associated gas hydrate phase boundaries is expected to be present.
How to cite: Grob, H., Riedel, M., Duchesne, M. J., Krastel, S., Bustamante Restrepo, J., Fabien-Ouellet, G., Kläschen, D., Preine, J., Jin, Y. K., and Hong, J. K.: Using different seismic approaches to detect submarine permafrost and gas hydrates on the continental Beaufort shelf of the Canadian Arctic, EGU General Assembly 2022, Vienna, Austria, 23–27 May 2022, EGU22-8555, https://doi.org/10.5194/egusphere-egu22-8555, 2022.
Please decide on your access
Please use the buttons below to download the presentation materials or to visit the external website where the presentation is linked. Regarding the external link, please note that Copernicus Meetings cannot accept any liability for the content and the website you will visit.
Forward to presentation link
You are going to open an external link to the presentation as indicated by the authors. Copernicus Meetings cannot accept any liability for the content and the website you will visit.
We are sorry, but presentations are only available for users who registered for the conference. Thank you.
EGU22-8588 | Presentations | CR2.1
3D Spectral Induced Polarization survey to evaluate a thawing permafrost endangered hut in the Italian AlpsClemens Moser, Theresa Maierhofer, Elisabetta Drigo, Umberto Morra Di Cella, Christian Hauck, and Adrian Flores Orozco
Due to generally rising air temperatures in the European Alps in context of climate change, large areas of mountain permafrost are thawing, and subsurface pore ice is melting. Consequently, the cohesion of rock masses decreases which can constitute a threat for infrastructure like mountain huts in alpine areas. One directly affected building is the Guide Val d'Ayas al Lambronecca, a hut on a rock ledge in the Italian Alps at 3400 m above sea level. During the last decade the ground directly underneath the hut sank of about 2 m, probably due to the melting of pore ice in the subsurface below the hut. In this study, we investigate the subsurface properties beneath the hut using a 3D geophysical survey. In particular, we deploy the spectral induced polarization (SIP) method, which has emerged as a promising tool to discriminate between ice-rich and ice-poor regions in the subsurface. Our investigation is built on the hypothesis that ice can be identified in electrical images due to its high electrical resistivity and polarization (i.e., capacitive) properties at frequencies above 10 Hz. In our survey, we conducted 2D SIP measurements in summer 2020 (between 0.5 and 225 Hz) along three profiles near the hut, while real 3D SIP measurements (in the range between 1 and 240 Hz) were conducted in summer 2021. For the 3D measurements, we deployed two parallel lines, one on the southern and one on the northern rock wall of the summit where the hut is located. To improve the data quality, we used coaxial cables for the 2D measurements in 2020, while data collected in 2021 were based on the actual separation of the transmitter and receiver (i.e., instrument and cables) to reduce the contamination of the data due to parasitic electromagnetic fields. Processing of the data was based on the statistical analysis of normal and reciprocal misfits. Inversion of the data was performed in 3D using ResIPy which uses complex calculus to simultaneously resolve for the conductive and capacitive properties. Our imaging results evidence a core of ice-filled pores corresponding to high resistivity values (>10 kΩm) directly underneath the hut, this structure is overlain by lower values (<1 kΩm) in near-surface areas representing the active layer. Images of the polarization effect confirm an anomaly due to high values at frequencies above 10 Hz in the center of the rock ledge. Our study demonstrates that 3D SIP measurements can be used to differentiate between ice-rich and ice-poor areas in high mountain permafrost sites with complex topography. Moreover, 3D SIP approaches enable a detection of electrical anomalies in all three dimensions and not only along one certain direction in the case of 2D profiles. This information can be used to assess the impact of permafrost degradation on infrastructure stability in mountain regions and to support restoration actions.
How to cite: Moser, C., Maierhofer, T., Drigo, E., Morra Di Cella, U., Hauck, C., and Flores Orozco, A.: 3D Spectral Induced Polarization survey to evaluate a thawing permafrost endangered hut in the Italian Alps, EGU General Assembly 2022, Vienna, Austria, 23–27 May 2022, EGU22-8588, https://doi.org/10.5194/egusphere-egu22-8588, 2022.
EGU22-10159 | Presentations | CR2.1
Year-round high-resolution geoelectrical monitoring to improve the understanding of deglaciated soil evolution in the High ArcticMihai O. Cimpoiasu, Harry Harrison, Philip Meldrum, Paul Wilkinson, Jonathan Chambers, James Bradley, Pacifica Sommers, Steven K. Schmidt, Trevor Irons, Dane Liljestrand, Carlos Oroza, and Oliver Kuras
High Arctic regions are experiencing an accelerated rise in temperatures, about three times more than the global average. As a result, the glacier coverage over these landscapes is reducing, uncovering soils which start their development by sustaining emergent microbial communities. These new systems will have a significant impact on the global carbon budget, thus monitoring and understanding their evolution becomes a necessity.
Geoelectrical methods have emerged as a fast, cost-effective and minimally invasive way of imaging soil moisture dynamics in the shallow subsurface. BGS PRIME technology is designed to facilitate low-power remote geoelectrical tomography by using an array of sensor electrodes. We are using such technology to monitor the year-round variability of soil electrical resistivity in 4D on a glacier forefield in the vicinity of Ny-Alesund, Svalbard. Until now, such assessment of soil properties was confined to the summer period due to harsh Arctic winter conditions making site access very difficult.
Two PRIME systems were deployed during the summer of 2021 on Midtre Lovénbreen glacier forefield, which exhibits a soil chronosequence extending from the youngest soils near the glacier snout up to soils of approximately 120 years old. The two geophysical systems are monitoring electrical resistivity within the top 2m of soil of approximately 5 and 60 years of age respectively, recording soil moisture and freeze-thaw dynamics within the active layer above the permafrost.
We present early results, a timeseries of 3D soil electrical resistivity models, that captured several precipitation events during the summer and the progression of the freezing front when soil temperatures dropped below 0 °C in October 2021. These results reveal differences in the hydrodynamic activity between the 5- and 60-year-old sites determined by soil properties and their location on the glacier forefield. In addition, soil cores were sampled from the vicinity of the PRIME systems. These were subsequently subjected to laboratory tests to describe the changes in electrical resistivity as a function of moisture content and during successive freeze-thaw cycles. Furthermore, we are working towards an integrated analysis and a more comprehensive model of soil evolution at our sites by combining geoelectrical measurements with point measurements of environmental parameters and microbiological activity.
How to cite: Cimpoiasu, M. O., Harrison, H., Meldrum, P., Wilkinson, P., Chambers, J., Bradley, J., Sommers, P., Schmidt, S. K., Irons, T., Liljestrand, D., Oroza, C., and Kuras, O.: Year-round high-resolution geoelectrical monitoring to improve the understanding of deglaciated soil evolution in the High Arctic, EGU General Assembly 2022, Vienna, Austria, 23–27 May 2022, EGU22-10159, https://doi.org/10.5194/egusphere-egu22-10159, 2022.
EGU22-10195 | Presentations | CR2.1
Investigation of ice with geophysical measurements during the transit of cryobotsMarc S. Boxberg, Anna Simson, Qian Chen, and Julia Kowalski
Several icy moons of our Solar System like Jupiter’s moon Europa have a global ocean of liquid water below their icy crust. These ocean worlds are possible targets for space missions that aim to assess their potential for habitability or even to search for life. Cryobots (or ice melting probes) are suitable tools to reach the subglacial oceans for in-situ investigations. The necessary ice shell transit provides an excellent opportunity to investigate structure and composition of the ice itself by means of geophysical and other in-situ measurements. This will allow us to better understand the evolution of icy moons and their role in our solar system.
We present current ideas as well as first results from terrestrial analogue studies. Acoustic data obtained during a field test on Langenferner Glacier, Italy was used to conduct a travel time tomography, which yields insight into heterogeneities in the local acoustic wave propagation speed through the ice. The acoustic sensor set-up was originally designed for localization of the melting probe rather than an investigation of the ice structure. However, we can still show that such opportunity data can be used to obtain a wave velocity distribution which can be further interpreted with respect to ice properties like porosity.
While we already investigated the acoustic data, we evaluate the potential of other measurements. For example, Radar measurements in combination with the acoustics can be used to identify the ice-water boundary and, in addition, cracks and inclusions in the ice. Conductivity measurements provide information on the salinity. At ice-water interface regions, the salinity is in thermochemical equilibrium with the temperature and porosity of the ice. We present our concept for on-board electrical conductivity measurements and analyze its potential, for example, to constrain ice properties and to predict ice-water interfaces based on existing terrestrial field data and process models. Furthermore, some of the cryobot’s housekeeping data might be of interest for investigating the ambiance, too. For example, the temperature and the density of the ice affect the melting velocity of the cryobot, which constitutes an inverse problem to get further information on the ice.
How to cite: Boxberg, M. S., Simson, A., Chen, Q., and Kowalski, J.: Investigation of ice with geophysical measurements during the transit of cryobots, EGU General Assembly 2022, Vienna, Austria, 23–27 May 2022, EGU22-10195, https://doi.org/10.5194/egusphere-egu22-10195, 2022.
EGU22-10565 | Presentations | CR2.1
Initiation of an international database of geoelectrical surveys on permafrost to promote data sharing, survey repetition and standardized data reprocessingColine Mollaret, Christin Hilbich, Teddi Herring, Mohammad Farzamian, Johannes Buckel, Baptiste Dafflon, Daniel Draebing, Hannelore Fossaert, Rebecca Gugerli, Christian Hauck, Julius Kunz, Antoni Lewkowicz, Jonas K. Limbrock, Theresa Maierhofer, Florence Magnin, Cécile Pellet, Sebastian Pfaehler, Riccardo Scandroglio, and Sebastian Uhlemann and the IDGSP IPA Action Group
Geoelectrical methods are widely used for permafrost investigations by research groups, government agencies and industry. Electrical Resistivity Tomography (ERT) surveys are typically performed only once to detect the presence or absence of permafrost. Exchange of data and expertise among users is limited and usually occurs bilaterally. Neither complete information about the existence of geophysical surveys on permafrost nor the data itself is available on a global scale. Given the potential gain for identifying permafrost evidence and their spatio-temporal changes, there is a strong need for coordinated efforts regarding data, metadata, guidelines, and expertise exchange. Repetition of ERT surveys is rare, even though it could provide a quantitative spatio-temporal measure of permafrost evolution, helping to quantify the effects of climate change at local (where the ERT survey takes place) and global scales (due to the inventory).
Our International Permafrost Association (IPA) action group (2021-2023) has the main objective of bringing together the international community interested in geoelectrical measurements on permafrost and laying the foundations for an operational International Database of Geoelectrical Surveys on Permafrost (IDGSP). Our contribution presents a new international database of electrical resistivity datasets on permafrost. The core members of our action group represent more than 10 research groups, who have already contributed their own metadata (currently > 200 profiles covering 15 countries). These metadata will be fully publicly accessible in the near future whereas access to the resistivity data may be either public or restricted. Thanks to this open-access policy, we aim at increasing the level of transparency, encouraging further data providers and fostering survey repetitions by new users.
The database is set up on a virtual machine hosted by the University of Fribourg. The advanced open-source relational database system PostgreSQL is used to program the database. Homogenization and standardization of a large number of data and metadata are among the greatest challenges, yet are essential to a structured relational database. In this contribution, we present the structure of the database, statistics of the metadata uploaded, as well as first results of repetitions from legacy geoelectrical measurements on permafrost. Guidelines and strategies are developed to handle repetition challenges such as changing survey configuration, changing geometry or inaccurate/missing metadata. First steps toward transparent and reproducible automated filtering and inversion of a great number of datasets will also be presented. By archiving geoelectrical data on permafrost, the ambition of this project is the reanalysis of the full database and its climatic interpretation.
How to cite: Mollaret, C., Hilbich, C., Herring, T., Farzamian, M., Buckel, J., Dafflon, B., Draebing, D., Fossaert, H., Gugerli, R., Hauck, C., Kunz, J., Lewkowicz, A., Limbrock, J. K., Maierhofer, T., Magnin, F., Pellet, C., Pfaehler, S., Scandroglio, R., and Uhlemann, S. and the IDGSP IPA Action Group: Initiation of an international database of geoelectrical surveys on permafrost to promote data sharing, survey repetition and standardized data reprocessing, EGU General Assembly 2022, Vienna, Austria, 23–27 May 2022, EGU22-10565, https://doi.org/10.5194/egusphere-egu22-10565, 2022.
EGU22-10835 | Presentations | CR2.1
Combined measurement of snow depth and sea ice thickness by helicopter EM bird in McMurdo Sound, AntarcticaWolfgang Rack, Adrian Tan, Christian Haas, Usama Farooq, Aston Taylor, Adriel Kind, Kelvin Barnsdale, and Greg Leonard
Snow on sea ice is a controlling factor for ocean-atmosphere heat flux and thus ice thickness growth, and surface albedo. Active and passive microwave remote sensing is the most promising way to estimate snow depths over large sea ice areas although improved validation is understood as a missing information to support further progress. However, severe limitations in the representative measurement of snow depth over sea ice persist, which exacerbates sea ice mass balance assessments as well as the indirect estimation of consolidated ice thickness from remotely sensed freeboard.
We have designed and flown a snow radar in combination with an electromagnetic induction device for sea ice thickness. The goal was the simultaneous measurement of both the consolidated sea ice thickness and the snow depth on top as a tool to derive snow and ice statistics for satellite validation. The snow radar was integrated into an EM-bird and flown about 15 m above the surface by suspending the instrument from a helicopter. The combination of the applied technologies hasn’t been deployed in this configuration before. The helicopter flight speed was around 70 knots, resulting in a snow measurement about every four meters. The EM instrument can detect ice thickness at 0.1m accuracy, whereas the snow radar is designed to measure snow depth at 0.05m accuracy.
Our field area was the land-fast sea ice and adjacent ice shelf in McMurdo Sound (Antarctica) in November 2021. During this time we found a relatively shallow but variable snow cover (up to about 0.3m) above sea ice of about 2m thickness. Deeper snow was only measured at the transition from the sea ice to the ice shelf, and on the ice shelf itself, where the maximum radar penetration in snow in ideal conditions is estimated to be around 2-3 meters.
We present first results of snow cover statistics in comparison to ground validation and observed snow characteristics, and we compare these results to airphotos and optical satellite imagery. We show that the measurement set-up meets the requirements for level ice and rough fast ice with patchy but dry snow cover. The system still needs to be tested over pack ice with potentially more complex snow morphology.
How to cite: Rack, W., Tan, A., Haas, C., Farooq, U., Taylor, A., Kind, A., Barnsdale, K., and Leonard, G.: Combined measurement of snow depth and sea ice thickness by helicopter EM bird in McMurdo Sound, Antarctica, EGU General Assembly 2022, Vienna, Austria, 23–27 May 2022, EGU22-10835, https://doi.org/10.5194/egusphere-egu22-10835, 2022.
EGU22-10858 | Presentations | CR2.1
Simultaneous estimation of snow depth and freezing-ground uplift by GPS Interferometric Reflectometry over a permafrost areaYufeng Hu and Jiatong Wang
Ground surface movements and snow cover during freeze/thaw cycles of permafrost are important variables for studying climate change. GPS-IR has emerged as an effective technique to estimate the relative elevation changes of ground surface such as the thaw subsidence of frozen ground and snow depth variations. In permafrost areas, the freezing process of the ground is always accompanied by the snow accumulations, making it hard for GPS-IR to separate these two distinct signals from the estimated elevation changes. In this study, using the Signal to Noise Ratio (SNR) collected by a permafrost GPS site SG27 (Northern Alaska) in 2018, we proposed a physical model-based method to simultaneously estimate the daily snow depths and freezing-ground uplifts with GPS-IR. First, we applied GPS-IR to the SNR data to obtain the daily elevation changes of the ground surface from September 1 in 2018 to August 31 in 2019. The elevation change measurements indicate the onset of snow season on October 18 in 2018 and the end of snow-cover on June 15 in 2019. Second, we used the thermal index Accumulated Degree Days of Freezing (ADDF) calculated from the temperature records to determine the onset of the permafrost freezing season as of September 17 in 2018. Third, we fitted the Stefan function to the estimated elevation changes (i.e. freezing-ground uplifts) from September 17 to October 18 in 2018. The Stefan model agrees with the freezing uplifts with an R2 of 0.65. Forth, we extended the fitted model to the time when the ground was completely frozen (November 1) to estimate daily freezing-ground uplifts up to 1.75 cm under the snowpack. Last, we extracted the snow depths from the estimated elevation changes by subtracting the corresponding freezing-ground uplifts. Our study is the first attempt to simultaneously estimate the daily freezing-ground uplifts and snow depths over the permafrost area with GPS-IR, providing the measurements to understand the coupling effects of the permafrost and snow cover.
How to cite: Hu, Y. and Wang, J.: Simultaneous estimation of snow depth and freezing-ground uplift by GPS Interferometric Reflectometry over a permafrost area, EGU General Assembly 2022, Vienna, Austria, 23–27 May 2022, EGU22-10858, https://doi.org/10.5194/egusphere-egu22-10858, 2022.
EGU22-12006 | Presentations | CR2.1
Characterising ice sheet properties using Rayleigh wave ellipticityGlenn Jones, Ana Ferreira, Bernd Kulessa, Martin Schimmel, Andrea Berbellini, and Andrea Morelli
The physical properties of the ice column are fundamental to the deformation and flow of glaciers and ice sheets. With a warming climate, surface meltwater is ever increasingly being routed and distributed throughout the ice column changing the mechanical and hence thermal properties of the ice and leading to accelerated ice flow and ice mass loss. Since the early 1990s, ice mass loss from the Greenland Ice Sheet (GrIS) has contributed ~10% of the mean global sea level rise. Seismic waves have routinely been used to study the physical characteristics of glaciers and ice sheets due to their sensitivity to both mechanical and thermal properties of ice. Traditionally, reflection seismic surveys have been chosen as the primary seismic approach but this survey method can suffer from difficult logistics in polar regions. Recent advancements in ambient noise methods and the permanent installation of a seismic network in Greenland now permit the long term study of the ice properties of the GrIS.
Rayleigh wave ellipticity measurements (the horizontal-to-vertical ratio of Rayleigh wave particle motions) are particularly sensitive to the subsurface structure beneath a seismic station. Using the polarisation properties of seismic noise, we extract Rayleigh wave ellipticity measurements from the Earth’s ambient noise for on-ice stations deployed in Greenland from 2012-- 2018. For wave periods sensitive to the ice sheet (T ≤ 3.5 s), we observe significant deviation between ellipticity measurements extracted from noise and synthetic fundamental mode calculations using a single ice column. Using a forward modelling approach we show: (1) a slow seismic shear-wave velocity at the near surface, (2) seismic attenuation, quantified as the quality factor Q, is sensitive to the temperature, water content and density of the ice and (3) the excitation of Rayleigh wave overtones plays a leading role in perturbing the ellipticity. Our results highlight how the inclusion of Q and overtone information can fill important gaps in our knowledge of ice sheet temperature, density and water content, which are important for predictions of the future evolution of the GrIS.
How to cite: Jones, G., Ferreira, A., Kulessa, B., Schimmel, M., Berbellini, A., and Morelli, A.: Characterising ice sheet properties using Rayleigh wave ellipticity, EGU General Assembly 2022, Vienna, Austria, 23–27 May 2022, EGU22-12006, https://doi.org/10.5194/egusphere-egu22-12006, 2022.
EGU22-12082 | Presentations | CR2.1
Snow measurement campaign for snowpack model and satellite retrieval validation in Italian Central Apennines within SMIVIA projectEdoardo Raparelli, Paolo Tuccella, Annalina Lombardi, Gianluca Palermo, Nancy Alvan Romero, Mario Papa, Errico Picciotti, Saverio Di Fabio, Elena Pettinelli, Elisabetta Mattei, Sebastian Lauro, Barbara Cosciotti, Chiara Petroselli, David Cappelletti, Massimo Pecci, and Frank SIlvio Marzano
The Apennine mountain range is the backbone of the Italian peninsula, crossing it from North-West to South-East for approximately 1200 km. The main peaks are found in Central Apennines, especially in the Gran Sasso d’Italia massif, which hosts the highest Apennines peak, named Corno Grande, with its 2912 m a.s.l. During the winter season, Central Apennines are typically covered with snow, with thickness that can vary between a few centimeters to several meters. Despite the historical presence of snow in these territories, the Apennine snowpack is poorly studied and weather data coming from automatic measurement stations and manual snow measurements hardly coexist. Thus, within the SMIVIA (Snow-mantle Modeling, Inversion and Validation using multi-frequency multi-mission InSAR in Central Apennines) project, we identified the measurement sites of Pietrattina, at 1459 m a.s.l, and Campo Felice, at 1545 m a.s.l., both located in Central Apennines. There we collected automatic measurements using ad hoc installed automatic weather-snow stations (AWSS) and where we performed systematic manual measurements of the snowpack properties, from November 2020 till April 2021. The AWSS measures every 5 minutes air temperature, relative humidity, wind speed, wind direction, incoming short-wave radiation, reflected short-wave radiation, soil surface temperature, snow surface temperature and snow height. The manual part of the campaign included the digging of 10 and 8 snow pits at Pietrattina and Campo Felice sites, respectively, to measure vertical profiles of snow density, temperature, grain shape, grain size and fractional content of light absorbing impurities. Manual snow measurements provide important information on the state of the snowpack, and give the opportunity to reconstruct the history of the snowpack. Their proximity to automatic weather stations let us evaluate the impact of the very local atmospheric conditions on the snowpack evolution. These measurements were performed within the SMIVIA project to: i) evaluate the ability of the snow cover model SNOWPACK to reproduce the observed snow cover properties; ii) verify the possibility to infer snow height and snow water equivalent from the data retrieved with Earth observation satellites; iii) investigate whether the use of a combination of snow numerical models and remote sensing data may provide better results compared to using each of the aforementioned approach, separately. Nevertheless, the data collected during the SMIVIA campaign at the measurement sites of Pietrattina and Campo Felice during season 2020-2021 can also provide precious information for other fields of study, like hydrology, biology and chemistry.
How to cite: Raparelli, E., Tuccella, P., Lombardi, A., Palermo, G., Alvan Romero, N., Papa, M., Picciotti, E., Di Fabio, S., Pettinelli, E., Mattei, E., Lauro, S., Cosciotti, B., Petroselli, C., Cappelletti, D., Pecci, M., and Marzano, F. S.: Snow measurement campaign for snowpack model and satellite retrieval validation in Italian Central Apennines within SMIVIA project, EGU General Assembly 2022, Vienna, Austria, 23–27 May 2022, EGU22-12082, https://doi.org/10.5194/egusphere-egu22-12082, 2022.
Please decide on your access
Please use the buttons below to download the presentation materials or to visit the external website where the presentation is linked. Regarding the external link, please note that Copernicus Meetings cannot accept any liability for the content and the website you will visit.
Forward to presentation link
You are going to open an external link to the presentation as indicated by the authors. Copernicus Meetings cannot accept any liability for the content and the website you will visit.
We are sorry, but presentations are only available for users who registered for the conference. Thank you.
EGU22-12233 | Presentations | CR2.1 | Highlight
Monitoring lake ice with seismic and acoustic sensorsCedric Schmelzbach, Daniel May, Christoph Wetter, Simon Stähler, and John Clinton
Seismic monitoring of the thickness and elastic parameters of floating ice on lakes and the sea is of interest in understanding the climate change impact on Alpine and Arctic environments, assessing ice safety for recreational and engineering purposes, studying ice shelves as well as exploring possibilities for the future exploration of the icy crusts of ocean worlds in our solar system. Seismic data can provide an alternative to remote-sensing and ground-based radar measurements for estimation of ice thickness in cases where radar techniques fail. Because of the difficult access to Alpine and Arctic environments as well as seismic sensor coupling issues in ice environments, it is of interest to optimize the use of seismic instruments in terms of sensor type, sensor numbers and layouts.
With the motivation to monitor over time the seismic activity of the lake ice and the ice properties, we conducted a series of seismic experiments on frozen lake St. Moritz in the Swiss Alps during two consecutive winters. Arrangements of sensors ranging in numbers from 96 geophones in mini-arrays to installations of 8, 2 and 1 conventional seismic sensors were used to measure the seismic wavefield generated by ice quakes (cryoseisms), artificial sources like hammer strokes, and ambient vibrations. These data provide an impressive and rich insights into the growth of the ice and variations of seismic activity with time. Even recordings with only a single station enable the determination of ice parameters and location of ice seismicity. Furthermore, we are exploring the value of recording air-coupled waves with microphones as alternative contact-free measurements related to seismic wave propagation in the ice, possibly even with sensors placed on the lake shore.
How to cite: Schmelzbach, C., May, D., Wetter, C., Stähler, S., and Clinton, J.: Monitoring lake ice with seismic and acoustic sensors, EGU General Assembly 2022, Vienna, Austria, 23–27 May 2022, EGU22-12233, https://doi.org/10.5194/egusphere-egu22-12233, 2022.
EGU22-12490 | Presentations | CR2.1
Exploring the potential of cosmic muon scattering to measure the snow water equivalentAitor Orio, Esteban Alonso, Pablo Martínez, Carlos Díez, and Pablo Gómez
The seasonal snowpack influences the hydrology, ecology and economy of the areas where it is present. However, the real time monitoring of the seasonal snowpack is a still well known scientific challenge. In this study, we have explored the potential of muon scattering radiography (MSR) to infer the snow water equivalent (SWE) of the snowpack. We have used the energy and mass balance model Snowpack to realistically simulate the time evolution and microstructure of the snowpack. The ERA5-Land reanalysis was used as forcing of Snowpack, in a location close to the Monte Perdido massif (Central, Pyrenees) at an elevation of 2041m above sea level. The simulations cover the hydrologic year 2015/2016, approximately reaching up to 700mm of peak SWE. Then, we have coupled the Snowpack numerical simulations with the Geant4 model to simulate the propagation of the muons through the snow layers and to collect the deviation of the muon trajectories. We have measured these deviations with a virtual muon detector based in multiwire proportional chambers, replicating a real detection system designed by us. The obtained distributions of muon deviations have exhibited a strong correlation with the simulated SWE, showing a coefficient of determination of 0.99. This model presents a root-mean-square error (RMSE) of 23.9mm in the SWE estimation. In order to validate the simulation analysis results, we have replicated the numerical experiments under controlled conditions, measuring three artificial snow samples ranging from 0 to 200 mm of SWE in our laboratory. We have measured the samples with an experimental setup composed of the real muon detector whose hardware was virtually replicated for the numerical experiments. Then, we have applied the model derived from the numerical simulations to the muon deviations measured in our laboratory. We have calibrated the real measurements and we have obtained a RMSE of 38.4mm in the SWE estimation. These results show that MSR is a promising non-destructive technique that can be used for the deployment of accurate SWE monitoring networks and can eventually provide information from the internal layered structure of the snowpack.
How to cite: Orio, A., Alonso, E., Martínez, P., Díez, C., and Gómez, P.: Exploring the potential of cosmic muon scattering to measure the snow water equivalent, EGU General Assembly 2022, Vienna, Austria, 23–27 May 2022, EGU22-12490, https://doi.org/10.5194/egusphere-egu22-12490, 2022.
Please decide on your access
Please use the buttons below to download the presentation materials or to visit the external website where the presentation is linked. Regarding the external link, please note that Copernicus Meetings cannot accept any liability for the content and the website you will visit.
Forward to presentation link
You are going to open an external link to the presentation as indicated by the authors. Copernicus Meetings cannot accept any liability for the content and the website you will visit.
We are sorry, but presentations are only available for users who registered for the conference. Thank you.

EGU22-1438 | Presentations | NH4.1 | Highlight
Could the moderate-sized earthquakes trigger pre-seismic ionospheric irregularities? Study of the 2011 Murcia earthquake in the Mediterranean region (SE-Spain).Abdennasser Tachema
The interest of this research work is focused on the detection of possible pre-seismic perturbations related to medium-sized earthquakes (5≤Mw≤5.9) occurring in the upper ionized atmosphere (about 350 km above the Earth, ionospheric F2-region). For this specific purpose, we have exploited several geodetic data, derived through signal processing of dual-frequency permanent ground-based Global Positioning System (GPS)/Global Navigation Satellite Systems (GNSS) receivers, located at the Euro-Mediterranean basin.
To find out whether the ionospheric F2-layer is responsive to the energy released during the preparation periods of medium magnitude earthquakes, the Lorca seismic event (May 11th, 2011, Mw 5.1, Murcia region) was taken as an initial sample. For this shallow-focus earthquake (4 km depth), the longitude-latitude coordinates of the epicenter are 1.7114° W, 37.7175° N. As result, modeling regional ionosphere using GPS/GNSS-total electron content (TEC) measurements over the epicentral area through spherical harmonic analysis, allowing us to identify pre-earthquake ionospheric irregularities in response to the M5.1 Lorca event. After discerning the seismo-ionospheric precursors from those caused by space weather effects, via wavelet-based spectral analysis, these irregularities were identified about a week before the onset of the mainshock.
The seismo-geodetic technique adopted in this study validates our hypothesis that stimulates the existence of a strong correlation between deep lithospheric deformations and pre-seismic ionospheric anomalies due to moderate magnitudes.
Keywords: Murcia earthquake, Seismo-ionospheric precursors, Spherical harmonic analysis, Wavelet transform, GPS/GNSS-TEC, Lithospheric deformations, Regional F2-ionosphere maps.
How to cite: Tachema, A.: Could the moderate-sized earthquakes trigger pre-seismic ionospheric irregularities? Study of the 2011 Murcia earthquake in the Mediterranean region (SE-Spain)., EGU General Assembly 2022, Vienna, Austria, 23–27 May 2022, EGU22-1438, https://doi.org/10.5194/egusphere-egu22-1438, 2022.
EGU22-1505 | Presentations | NH4.1 | Highlight
Testing spatial aftershock forecasts accounting for large secondary events during on going earthquake sequences: A case study of the 2017-2019 Kermanshah sequenceBehnam Maleki Asayesh, Hamid Zafarani, Sebastian Hainzl, and Shubham Sharma
Large earthquakes are always followed by aftershocks sequence that last for months to years. Sometimes, these aftershocks are as destructive as the mainshocks. Hence, accurate and immediate prediction of aftershocks’ spatial and temporal distribution is of great importance for planning search and rescue activities. Despite large uncertainties associated with the calculation of Coulomb failure stress changes (ΔCFS), it is the most commonly used method for predicting spatial distributions of aftershocks. Recent studies showed that classical Coulomb failure stress maps are outperformed by alternative scalar stress quantities, as well as a distance-slip probabilistic model (R) and deep neural networks (DNN). However, these test results were based on the receiver operating characteristic (ROC) metric, which is not well suited for imbalanced data sets such as aftershock distributions. Furthermore, the previous analyses also ignored the potential impact of large secondary earthquakes.
In order to examine the effects of large events in spatial forecasting of aftershocks during a sequence, we use the 2017-2019 seismic sequence in western Iran. This sequence started by Azgeleh M7.3 mainshock (12 November 2017) and followed by Tazehabad M5.9 (August 2018) and Sarpol-e Zahab M6.3 (November 2018) events. Furthermore, 15 aftershocks with magnitude > 5.0 and more than 8000 aftershocks with magnitude > 1 were recorded by Iranian seismological center (IRSC) during this sequence (12.11.2017-04.07.2019). For this complex sequence, we applied the classical Coulomb failure stress, alternative stress scalars, and R forecast models and used the more appropriate MCC-F1 metric to test the prediction accuracy. We observe that the receiver independent stress scalars (maximum shear and von-Mises stress) perform better than the classical CFS values relying on the specification of receiver mechanisms (ΔCFS resolved on master fault, optimally oriented planes, and variable mechanism). However, detailed analysis based on the MCC-F1 metric revealed that the performance depends on the grid size, magnitude cutoff, and test period. Increasing the magnitude cutoff and decreasing the grid size and test period reduces the performance of all methods. Finally, we found that the performance of all methods except ΔCFS resolved on master fault and optimally oriented planes improve when the source information of large aftershocks is additionally considered, with stress-based models outperforming the R model. Our results highlight the importance of accounting for secondary stress changes in improving earthquake forecasts.
How to cite: Maleki Asayesh, B., Zafarani, H., Hainzl, S., and Sharma, S.: Testing spatial aftershock forecasts accounting for large secondary events during on going earthquake sequences: A case study of the 2017-2019 Kermanshah sequence, EGU General Assembly 2022, Vienna, Austria, 23–27 May 2022, EGU22-1505, https://doi.org/10.5194/egusphere-egu22-1505, 2022.
Please decide on your access
Please use the buttons below to download the presentation materials or to visit the external website where the presentation is linked. Regarding the external link, please note that Copernicus Meetings cannot accept any liability for the content and the website you will visit.
Forward to presentation link
You are going to open an external link to the presentation as indicated by the authors. Copernicus Meetings cannot accept any liability for the content and the website you will visit.
We are sorry, but presentations are only available for users who registered for the conference. Thank you.
EGU22-2152 | Presentations | NH4.1
Extension of the radon monitoring network in seismic areas in RomaniaVictorin - Emilian Toader, Constantin Ionescu, Iren-Adelina Moldovan, Alexandru Marmureanu, Iosif Lingvay, and Ovidiu Ciogescu
The Romanian National Institute of Earth Physics (NIEP) developed a radon monitoring network mainly for Vrancea seismic are characterized by deep earthquakes (a rectangle zone in longitude/ latitude 25.050/ 46.210 - 27.950/ 44.690, 60 Km – 250 Km). Few stations were relocated after a year of operation following inconclusive results regarding the relationship between radon and seismic activity. To the 5 stations that are in the Vrancea area (Bisoca, Nehoiu, Plostina, Sahastru and Lopatari) we added others positioned in areas with surface seismicity (Panciu, Râmnicu Vâlcea, Surlari and Mangalia). The last two are on the Intramoesica fault, which will be monitored in the future along with the Fagaras - Câmpulung fault. Radon together with CO2 - CO is monitored at Râmnicu Vâlcea within the SPEIGN project near a 40 m deep borehole in which the acceleration in three directions, temperature and humidity are recorded. The same project funded the monitoring of radon, CO2 and CO in Mangalia, which is close to the Shabla seismic zone. The last significant earthquake in the Panciu area with ML = 5.7 R occurred on 22.11.2014. The area is seismically active, which justified the installation of a radon detector next to a radio receiver in the ULF band within the AFROS project. Within the same project, radon monitoring is performed at Surlari, following the activity of the Intramoesica fault. In this location we also measure CO2, CO, air temperature and humidity. The first results show a normal radon activity in Panciu. The measurements in Surlari have higher values than those in Panciu, possibly due to the forest where the sensors are located. A special case is Mangalia where the data indicate more local pollution than the effects of tectonic activity. Radon CO2 and CO values vary widely beyond normal limits. The source of these anomalies may be the local drinking water treatment plant or the nearby shipyard. We also recorded abnormal infrasound values that are monitored in the same location. Determining the source of these anomalies requires at least one more monitoring point.
The purpose of expanding radon monitoring is to analyze the possibility of implementing a seismic event forecast. This can be done in a multidisciplinary approach. For this reason, in addition to radon, determinations of CO2, CO, air ionization, magnetic field, inclinations, telluric currents, solar radiation, VLF - ULF radio waves, temperature in borehole, infrasound and acoustics are made.
This research helps organizations specializing in emergencies not only with short-term earthquake forecasts but also with information on pollution and the effects of climate change that are becoming increasingly evident lately. The methods and solutions are general and can be applied anywhere by customizing them according to the specifics of the monitored area.
The main conclusion is that only a multidisciplinary approach allows the correlation of events and ensures a reliable forecast.
How to cite: Toader, V.-E., Ionescu, C., Moldovan, I.-A., Marmureanu, A., Lingvay, I., and Ciogescu, O.: Extension of the radon monitoring network in seismic areas in Romania, EGU General Assembly 2022, Vienna, Austria, 23–27 May 2022, EGU22-2152, https://doi.org/10.5194/egusphere-egu22-2152, 2022.
Please decide on your access
Please use the buttons below to download the presentation materials or to visit the external website where the presentation is linked. Regarding the external link, please note that Copernicus Meetings cannot accept any liability for the content and the website you will visit.
Forward to presentation link
You are going to open an external link to the presentation as indicated by the authors. Copernicus Meetings cannot accept any liability for the content and the website you will visit.
We are sorry, but presentations are only available for users who registered for the conference. Thank you.
EGU22-2979 | Presentations | NH4.1
TEC variation over Europe during the intense tectonic activity in the area of Arkalochori of Crete on December of 2021Michael E. Contadakis, Demeter N. Arabelos, Christos Pikridas, Styllianos Bitharis, and Emmanuel M. Scordilis
This paper is one of a series of papers dealing with the investigation of the Lower ionospheric variation on the occasion of an intense tectonic activity.In the present paper, we investigate the TEC variations during the intense seismic activity in Arkalochori of Crete on December 2021 over Europe. The Total Electron Content (TEC) data are been provided by the Hermes GNSS Network managed by GNSS_QC, AUTH Greece, the HxGN/SmartNet-Greece of Metrica S.A, and the EUREF Network. These data were analysed using Discrete Fourier Analysis in order to investigate the TEC turbulence band content. The results of this investigation indicate that the High-Frequency limit fo of the ionospheric turbulence content, increases as aproaching the occurrence time of the earthquake, pointing to the earthquake epicenter, in accordane to our previous investigations. We conclude that the Lithosphere Atmosphere Ionosphere Coupling, LAIC, mechanism through acoustic or gravity waves could explain this phenomenology.
Keywords: Seismicity, Lower Ionosphere, Ionospheric Turbulence, Brownian Walk, Aegean area.
How to cite: Contadakis, M. E., Arabelos, D. N., Pikridas, C., Bitharis, S., and Scordilis, E. M.: TEC variation over Europe during the intense tectonic activity in the area of Arkalochori of Crete on December of 2021, EGU General Assembly 2022, Vienna, Austria, 23–27 May 2022, EGU22-2979, https://doi.org/10.5194/egusphere-egu22-2979, 2022.
Please decide on your access
Please use the buttons below to download the presentation materials or to visit the external website where the presentation is linked. Regarding the external link, please note that Copernicus Meetings cannot accept any liability for the content and the website you will visit.
Forward to presentation link
You are going to open an external link to the presentation as indicated by the authors. Copernicus Meetings cannot accept any liability for the content and the website you will visit.
We are sorry, but presentations are only available for users who registered for the conference. Thank you.
EGU22-3138 | Presentations | NH4.1
The Jun 15, 2019, M7.2 Kermadec Islands (New Zealand) earthquake as analyzed from ground to spaceAngelo De Santis, Loredana Perrone, Saioa A. Campuzano, Gianfranco Cianchini, Serena D'Arcangelo, Domenico Di Mauro, Dedalo Marchetti, Adriano Nardi, Martina Orlando, Alessandro Piscini, Dario Sabbagh, and Maurizio Soldani
The M7.2 Kermadec Islands (New Zealand) large earthquake occurred on June 15, 2019 as the result of shallow reverse faulting within the Tonga-Kermadec subduction zone. This work deals with the study of the earthquake-related processes that occurred during the preparation phase of this earthquake. We focused our analyses on seismic (earthquake catalogues), atmospheric (climatological archives) and ionospheric data (from ground to space, mainly satellite) in order to disclose the possible Lithosphere-Atmosphere-Ionosphere Coupling (LAIC). For what concern the ionospheric investigations, we analysed and compared the observations from the Global Navigation Satellite System (GNSS) receiver network and those from satellites in space. Specifically, the data from the European Space Agency (ESA) Swarm satellite constellation and from the China National Space Administration (CNSA, in partnership with Italian Space Agency, ASI) China Seismo-Electromagnetic Satellite (CSES-01) are used in this study. An interesting comparison is made with another subsequent earthquake with comparable magnitude (M7.1) that occurred in Ridgecrest, California (USA) on July 6 of the same year. Both earthquakes showed several multiparametric anomalies that occurred at almost the same times from each earthquake occurrence, evidencing a chain of processes that point to the moment of the corresponding mainshock. In both cases, it is demonstrated that a multiparametric and multilayer analysis is fundamental to better understand the LAIC in complex phenomena such as the earthquakes.
How to cite: De Santis, A., Perrone, L., Campuzano, S. A., Cianchini, G., D'Arcangelo, S., Di Mauro, D., Marchetti, D., Nardi, A., Orlando, M., Piscini, A., Sabbagh, D., and Soldani, M.: The Jun 15, 2019, M7.2 Kermadec Islands (New Zealand) earthquake as analyzed from ground to space, EGU General Assembly 2022, Vienna, Austria, 23–27 May 2022, EGU22-3138, https://doi.org/10.5194/egusphere-egu22-3138, 2022.
EGU22-3194 | Presentations | NH4.1
Using Operational Earthquake Forecasting Tool for Decision Making: A Synthetic Case StudyChen Huang, Håkan Bolin, Vetle Refsum, and Abdelghani Meslem
Operational earthquake forecasting (OEF) provides timely information about the time-dependent earthquake probabilities, which facilitates resilience-oriented decision-making. This study utilized the tools developed within the TURNkey (Towards more Earthquake-Resilient Urban Societies through a Multi-Sensor-Based Information System enabling Earthquake Forecasting, Early Warning and Rapid Response Actions) project funded by the European Union’s Horizon 2020 research and innovation programme to demonstrate the benefits of OEF to the decision support system. The considered tools are developed based on the state-of-the-art knowledge about seismology and earthquake engineering, involving the Bayesian spatiotemporal epidemic-type aftershock sequence (ETAS) forecasting model, the time-dependent probabilistic seismic hazard assessment, the SELENA (SEimic Loss EstimatioN using a logic tree Approach) risk analysis, cost-benefit analysis and the multi-criteria decision-making methodology. Moreover, the tools are connected to the dense seismograph network developed also within the TURNkey project and, thus, it is capable of real-time updating the forecasting based on the latest earthquake information and observations (e.g., earthquake catalogue). Through a case study in a synthetic city, this study first shows that the changes in the earthquake probabilities can be used as an indicator to inform the authorities or property owners about the heightened seismicity, based on which the decision-maker can, for example, issue a warning of the potential seismic hazard. Moreover, this study illustrates that OEF together with the risk and loss analysis provides the decision-maker with a better picture of the potential seismic impact on the physical vulnerabilities (e.g., damage, economic loss, functionality) and social vulnerabilities (e.g., casualty and required shelters). Finally, given the decision-maker’s preference, this study shows how the hazard and risk results are used to help the decision-maker to identify the optimal action based on cost-beneficial class and the optimality value computed based on the multi-criteria decision-making methodology.
How to cite: Huang, C., Bolin, H., Refsum, V., and Meslem, A.: Using Operational Earthquake Forecasting Tool for Decision Making: A Synthetic Case Study, EGU General Assembly 2022, Vienna, Austria, 23–27 May 2022, EGU22-3194, https://doi.org/10.5194/egusphere-egu22-3194, 2022.
EGU22-3337 | Presentations | NH4.1
Multiparametric and multilayer investigation of global earthquakes in the World by a statistical approachDedalo Marchetti, Kaiguang Zhu, Angelo De Santis, Saioa A. Campuzano, Donghua Zhang, Maurizio Soldani, Ting Wang, Gianfranco Cianchini, Serena D’Arcangelo, Domenico Di Mauro, Alessandro Ippolito, Adriano Nardi, Martina Orlando, Loredana Perrone, Alessandro Piscini, Dario Sabbagh, Xuhui Shen, Zeren Zhima, and Yiqun Zhang and the Zhu Kaiguang's earthquake research group in Jilin University
Earthquake prediction has always been a challenging task, and some researchers have proposed that it is an even impossible goal, concluding earthquakes are unpredictable events. Such a conclusion seems too extreme and in contrast with several pieces of evidence of alterations recorded by several instrumentations from the ground, atmosphere, and more recently by Earth Observation satellite. On the other side, it is clear that searching the “perfect precursor parameter” doesn’t seem to be a good way, since the earthquake process is a complex phenomenon. In fact, a precursor that works for one earthquake does not necessarily work for the next one, even on the same fault. In some cases, another problem for precursors identification is the recurrency time between the earthquakes, which could be very long and, in such cases, we don’t have comparable observations of earthquakes generated by the same fault system.
In past years, we concentrated mainly on two aspects: statistical and single case study; the first one consists of some statistical evidence on ionospheric disturbances possibly related to M5.5+ earthquakes (e.g., presented at EGU2018-9468, and published by De Santis et al., Scientific Report, 2019), furthermore, some clear signals in the atmosphere statistically preceded the occurrence of M8+ events (e.g., presented at EGU2020-19809). On the other side, we also investigated about 20 earthquakes that occurred in the last ten years, some of them by a very detailed and multiparametric investigation, like the M7.5 Indonesia earthquake (presented at EGU2019-8077 and published by Marchetti et al., JAES, 2020), or the Jamaica earthquake investigation presented at the last EGU2021-15456. We found that both approaches are very important. Actually, the statistical studies can provide proofs that at least some of the detected anomalies seem to be related to the earthquakes, while the single case studies permit us to explore deeply the details and the possible connections between the geolayers (lithosphere, atmosphere and ionosphere).
In this presentation, we want to show an update of the statistical study of the atmosphere and ionosphere, together with a new statistical investigation of the seismic acceleration before M7.5+ global earthquakes.
Finally, we demonstrate that it is essential to consider the earthquake not as a point source (that is the basic approximation), but in all its complexity, including its focal mechanism, fault rupture length and even other seismological constraints, in order to try to better understand the preparation phase of the earthquakes, and the reasons for their different behaviour. These studies give hope and fundamental (but not yet sufficient) tools for the possible achievement, one day, of earthquakes prediction capabilities.
How to cite: Marchetti, D., Zhu, K., De Santis, A., Campuzano, S. A., Zhang, D., Soldani, M., Wang, T., Cianchini, G., D’Arcangelo, S., Di Mauro, D., Ippolito, A., Nardi, A., Orlando, M., Perrone, L., Piscini, A., Sabbagh, D., Shen, X., Zhima, Z., and Zhang, Y. and the Zhu Kaiguang's earthquake research group in Jilin University: Multiparametric and multilayer investigation of global earthquakes in the World by a statistical approach, EGU General Assembly 2022, Vienna, Austria, 23–27 May 2022, EGU22-3337, https://doi.org/10.5194/egusphere-egu22-3337, 2022.
Please decide on your access
Please use the buttons below to download the presentation materials or to visit the external website where the presentation is linked. Regarding the external link, please note that Copernicus Meetings cannot accept any liability for the content and the website you will visit.
Forward to presentation link
You are going to open an external link to the presentation as indicated by the authors. Copernicus Meetings cannot accept any liability for the content and the website you will visit.
We are sorry, but presentations are only available for users who registered for the conference. Thank you.

EGU22-3610 | Presentations | NH4.1
Mechanism of frictional discharge plasma at fault asperitiesKiriha Tanaka, Jun Muto, and Hiroyuki Nagahama
The mechanism of seismic-electromagnetic phenomena (SEP) encouraged as precursors of earthquake forecast remains unrevealed. The previous studies reported that the surface charges of the frictional and fractured quartz are enough to cause electric discharge due to the dielectric breakdown of air. To verify the discharge occurrence, friction experiments between a diamond pin and quartz disk were performed under nitrogen gas with a CCD camera and UV-VIS photon spectrometer (e.g., Muto et al., 2006). The photon emission was observed at the pin-to-disk gap only during the friction. The photon spectra obtained from a friction experiment (normal stresses of 13-20 MPa, a sliding speed of 1.0×10⁻² m/s, and a gas pressure of 2.4×10⁴ Pa) showed that the photon was emitted through the second positive band (SPB) system of neutral nitrogen and the first negative band (FNB) system of ionized nitrogen. The estimated potential difference at the gap gave the breakdown electric field and surface charge density on the frictional surface at a gap, where photon was the most intense. These values were enough to cause dielectric breakdown of air. Therefore, the above results demonstrated that frictional discharge could occur on a fault asperity due to dielectric breakdown of ambient gases by frictional electrification. However, the details of electronic transition during the discharge and its type are unknown.
This study discussed the details of the gas pressure dependency for the photon emission intensity and distribution, and the discharge type using the electronic transition theory. Moreover, we compared the surface charge density estimated from the potential difference with that estimated from electron and hole trapping centre concentrations in the frictional quartz subsurfaces measured by electron spin resonance. From this comparison, we also discussed the possibility for the trapping centres to be the sources of the discharge. We could explain the nitrogen gas pressure dependency for the photon emission intensity and vibration temperature observed during our friction experiments using the electron transition theory. For example, Miura et al. (2004) reported that the gas pressure decreases with increasing vibration temperature of the SPB system and the relative intensity in the SPB system to the FNB system. This result showed that the vibration temperature and the relative intensity were about 2800 K and 0.1 during the friction experiment under a pressure of 2.4×10⁴ Pa. The FNB system is related to negative glow charge and the discharge observed during the friction experiments was spark and/or glow discharges. The gas pressure decreases with increasing vibration temperature and molecule density as shown in several previous studies and decrease with increasing electron temperature and density as explained the electron transition theory. This implies that the increase in the free path of excited molecules as gas pressure decreases can result in the photo emission pattern change. The surface charge density of a frictional quartz surface estimated from the potential difference to be 5.5×10⁻⁵ C/m2 included in the range of 6.51×10⁻⁶–6.4×10⁻³ C/m² estimated from the trapping centre concentrations. Hence, the trapping centres can be the sources of the frictional discharge.
How to cite: Tanaka, K., Muto, J., and Nagahama, H.: Mechanism of frictional discharge plasma at fault asperities, EGU General Assembly 2022, Vienna, Austria, 23–27 May 2022, EGU22-3610, https://doi.org/10.5194/egusphere-egu22-3610, 2022.
EGU22-4417 | Presentations | NH4.1
The study of the geomagnetic diurnal variation behavior associated with Mw>4.9 Vrancea (Romania) EarthquakesIren Adelina Moldovan, Victorin Emilian Toader, Marco Carnini, Laura Petrescu, Anica Otilia Placinta, and Bogdan Dumitru Enescu
Diurnal geomagnetic variations are generated in the magnetosphere and last for about 24 hours. These can be seen on the recordings of all magnetic observatories, with amplitudes of several tens of nT, on all magnetic components. The shape and amplitude of diurnal variations strongly depend on the geographical latitude of the observatory. In addition to the dominant external source from the interaction with the magnetosphere, the diurnal geomagnetic variation is also influenced by local phenomena, mainly due to internal electric fields. External influence remains unchanged over distances of hundreds of kilometers, while internal influence may differ over very short distances due to the underground conductivity. The ration of the diurnal geomagnetic variation at two stations should be stable in calm periods and could be destroyed by the phenomena that can occur during the preparation of an earthquake, when at the station inside the seismogenic zone, the underground conductivity would change or additional currents would appear. The cracking process inside the lithosphere before and during earthquakes occurrence, possibly modifies the under- ground electrical structure and emits electro-magnetic waves.
In this paper, we study how the diurnal geomagnetic field variations are related to Mw>4.9 earthquakes occurred in Vrancea, Romania. For this purpose, we use two magnetometers situated at 150 km away from each other, one, the Muntele Rosu (MLR) observatory of NIEP, inside the Vrancea seismic zone and the other, the Surlari (SUA) observatory of IGR and INERMAGNET, outside the preparation area of moderate earthquakes. We have studied the daily ranges of the magnetic diurnal variation, R=DBMLR/DBSUA, during the last 10 years, to identify behavior patterns associated with external or internal conditions, where DB= Bmax-Bmin, during a 24 hours period.
As a first conclusion, we can mention the fact that the only visible disturbances appear before some earthquakes in Vrancea with Mw> 5.5, when we see a differentiation of the two recordings due to possible local internal phenomena at MLR. The differentiation consists in the decrease of the value of the vertical component Bzmax-Bzmin at MLR compared to the USA a few days before the earthquake and the return to the initial value after the earthquake. These studies need to be continued in order to determine if it is a repetitive behavior, or if it is just an isolated phenomenon.
Acknowledgments:
The research was supported by: the NUCLEU program (MULTIRISC) of the Romanian Ministry of Research and Innovation through the projects PN19080102 and by the Executive Agency for Higher Education, Research, Development and Innovation Funding (UEFISCDI) through the projects PN-III-P2-2.1-PED-2019-1693, 480 PED/2020 (PHENOMENAL) and PN-III-P4-ID-PCE- 2020-1361, 119 PCE/2021 (AFROS).
How to cite: Moldovan, I. A., Toader, V. E., Carnini, M., Petrescu, L., Placinta, A. O., and Enescu, B. D.: The study of the geomagnetic diurnal variation behavior associated with Mw>4.9 Vrancea (Romania) Earthquakes, EGU General Assembly 2022, Vienna, Austria, 23–27 May 2022, EGU22-4417, https://doi.org/10.5194/egusphere-egu22-4417, 2022.
EGU22-5375 | Presentations | NH4.1 | Highlight
Non-tectonic-induced stress variations on active faultsYiting Cai and Maxime Mouyen
Non-tectonic processes, namely solid earth tides and surface loads such as ocean, atmosphere, and continental water, constantly modify the stress field of the Earth's crust. Such stress perturbations may trigger earthquakes. Several previous studies reported that tides or hydrological loading could modulate seismicity in some areas. We elaborate on this idea and compute the total Coulomb stress change created by solid earth tides and surface loads together on active faults. We expect that computing a total stress budget over all non-tectonic processes would be more relevant than focusing on one of these processes in particular. The Coulomb stress change is a convenient approach to infer if a fault is brought closer to or further from its critical rupture when experiencing a given stress status. It requires to know 1) the fault's rake and geometry and 2) the value of the stress applied on it, which we retrieve from a subduction zone geometry model (Slab2) and a loading-induced Earth's stress database, respectively. In this study, we focus on the Coulomb stress variations on the Kuril-Japan fault over the few last years. By applying this method to the entire Slab2 catalogue and other known active faults, we aim at producing a database of non-tectonic-induced Coulomb failure function variations. Using earthquakes catalogues, this database can then be used to statistically infer the role of the non-tectonic process in earthquakes nucleation.
How to cite: Cai, Y. and Mouyen, M.: Non-tectonic-induced stress variations on active faults, EGU General Assembly 2022, Vienna, Austria, 23–27 May 2022, EGU22-5375, https://doi.org/10.5194/egusphere-egu22-5375, 2022.
Please decide on your access
Please use the buttons below to download the presentation materials or to visit the external website where the presentation is linked. Regarding the external link, please note that Copernicus Meetings cannot accept any liability for the content and the website you will visit.
Forward to presentation link
You are going to open an external link to the presentation as indicated by the authors. Copernicus Meetings cannot accept any liability for the content and the website you will visit.
We are sorry, but presentations are only available for users who registered for the conference. Thank you.
EGU22-6296 | Presentations | NH4.1
Analysis of Swarm Satellite Magnetic Field Data before and after the 2015 Mw7.8 Nepal Earthquake Based on Non-negative Tensor DecompositionMengxuan Fan, Kaiguang Zhu, Angelo De Santis, Dedalo Marchetti, Gianfranco Cianchini, Alessandro Piscini, Loredana Perrone, Xiaodan He, Jiami Wen, Ting Wang, Yiqun Zhang, Wenqi Chen, Hanshuo Zhang, Donghua Zhang, and Yuqi Cheng
In this paper, based on the Non-negative Tensor Decomposition (NTD), we analyzed the Y-component ionospheric magnetic field data as observed by Swarm Alpha and Charlie satellites before, during and after the 2015 (Mw=7.8) Nepal earthquake (April 25, 28.231°N 84.731°E). All the observation data were analyzed, including the data collected under quiet and strong geomagnetic activities. For each investigated satellite track, we can obtain a tensor, which is decomposed in three components. We found that the cumulative number of the inside anomalous tracks for one component of decomposition components (i.e., hs1, whose energy and entropy are more concentrated inside the earthquake-sensitive area, shows an accelerated increase which conforms to a sigmoid trend from 60 to 40 days before the mainshock. After that till the day before the mainshock, the cumulative result displays a weak acceleration trend which obeys a power law trend and resumed linear growth after the earthquake. According to the basis vectors, the frequency of the ionospheric magnetic anomalies is around 0.02 to 0.1 Hz, and by the skin depth formula the estimated depth of the mainshock is similar to the real one.
In addition, we did some confutation analysis to exclude the influence of the geomagnetic activity and solar activity on the abnormal phenomenon of the cumulative result for the hs1 component, according to the ap, Dst and F 10.7 indices. We also analyzed another area at the same magnetic latitude with no seismicity and find that its cumulative result shows a linear increase, which means that the accelerated anomalous phenomenon is not affected by the local time or due by chance.
At lithosphere, the cumulative Benioff Strain S also shows two accelerating increases before the mainshock, which is consistent with the cumulative result of the ionospheric anomalies. At the first acceleration, the seismicity occurred around the boundary of the research area not near the epicenter, and most of the ionospheric anomalies offset from the epicenter. During the second acceleration, some seismicity occurred closer to or on the mainshock fault, and the ionospheric anomalies appeared nearby the two faults around the epicenter, as well.
Furthermore, we considered combining with other studies on Nepal earthquake. Therefore, we noticed that the ionospheric magnetic field anomalies began to accelerate two days after the subsurface microwave radiation anomaly detected by Feng Jing et al. (2019). The spatial distribution of some ionospheric anomalies is consistent with the atmospheric Outgoing Longwave Radiation (OLR) anomalies found by Ouzounov et al. (2021). The latter occurred around two faults near the epicenter and the atmospheric anomalies occurred earlier than the ionospheric anomalies.
Considering the occurrence time of the anomalies in different layers, the abnormal phenomenon appeared in lithosphere, then transferred to the atmosphere, and at last occurred in the ionosphere. These results can be described by the Lithosphere Atmosphere Ionosphere Coupling model.
All these analyses indicate that by means of the NTD method, we can use all observed multi-channel data to analyze the Nepal earthquake and obtain a component whose anomalies are likely to be related to the earthquake.
How to cite: Fan, M., Zhu, K., De Santis, A., Marchetti, D., Cianchini, G., Piscini, A., Perrone, L., He, X., Wen, J., Wang, T., Zhang, Y., Chen, W., Zhang, H., Zhang, D., and Cheng, Y.: Analysis of Swarm Satellite Magnetic Field Data before and after the 2015 Mw7.8 Nepal Earthquake Based on Non-negative Tensor Decomposition, EGU General Assembly 2022, Vienna, Austria, 23–27 May 2022, EGU22-6296, https://doi.org/10.5194/egusphere-egu22-6296, 2022.
EGU22-7107 | Presentations | NH4.1 | Highlight
ANOMALOUS GEOMAGNETIC SIGNAL EMPHASISED BEFORE THE Mw8.2 ALASKA EARTHQUAKE OCCURRED ON JULY 29, 2021Dragos Armand Stanica
A very strong earthquake of magnitude Mw8.2 struck the coastal zone of Alaska (USA), on July 29, 2021. This earthquake was felt around the Gulf of Alaska, on a wide offshore area belonging to USA and Canada. In order to identify an anomalous geomagnetic signal before the onset of this earthquake, we retrospectively analyzed the data collected on the interval June 17 - July 31, 2021, via internet (www.intermagnet.org), at the two geomagnetic observatories, College (CMO) - Alaska and Newport (NEW)-USA, by using the polarization parameter (BPOL) and the strain effect–related to geomagnetic signal identification. Thus, for the both observation sites (CMO and NEW), the daily mean distribution of the BPOL and its standard deviation (STDEV) are carried out using an FFT band-pass filtering in the ULF range (0.001-0.0083Hz). Further on, a statistical analysis based on a standardized random variable equation was applied to emphasize the following: a) the anomalous signature related to Mw8.2 earthquake on the both time series BPOL*(CMO) and BPOL*(NEW); b) the differentiation of the transient local anomalies associated with Mw8.2 earthquake from the internal and external parts of the geomagnetic field, taking the NEW observatory as reference. Consequently, on the BPOL*(NEW-CMO) time series, carried out on the interval 07-31 July, 2021, a very clear anomaly of maximum, greater than 1.2 STDEV, was detected on July 22, with 7 days before the onset of Mw8.2 earthquake.
How to cite: Stanica, D. A.: ANOMALOUS GEOMAGNETIC SIGNAL EMPHASISED BEFORE THE Mw8.2 ALASKA EARTHQUAKE OCCURRED ON JULY 29, 2021, EGU General Assembly 2022, Vienna, Austria, 23–27 May 2022, EGU22-7107, https://doi.org/10.5194/egusphere-egu22-7107, 2022.
EGU22-7148 | Presentations | NH4.1
Investigating the spatiotemporal relationship between thermal anomalies and surface deformation; The Arkalochori Earthquake sequence of September 2021, Crete, Greece.Sofia Peleli, Maria Kouli, and Filippos Vallianatos
Among the different parameters, the fluctuations of Earth's thermally emitted radiation, as measured by sensors on board of satellite systems operating in the Thermal Infra-Red (TIR) spectral range and Earth's surface deformation as recorded by satellite radar interferometry, have been proposed since long time as potential earthquake precursors. Nevertheless, the spatiotemporal relationship between the two different phenomena has been ignored till now.
On September 27, 2021, a strong earthquake of magnitude M5.8 occurred in Crete, near the village of Arkalochori at 06:17:21 UTC, as the result of shallow normal faulting. The epicenter of the seismic event was located at latitude 35.15 N and longitude 25.27 E, while the focal depth was 10 km. Since the beginning of June, almost 4 months earlier, more than 400 foreshocks ranging in magnitude from M0.5 to M4.8 were recorded in the broader area while the strongest aftershock (M 5.3) occurred on September 28th at 04:48:09 UTC.
10 years of MODIS Land Surface Temperature and Emissivity Daily L3 Global 1km satellite records were incorporated to the RETIRA index computation in order to detect and map probable pre-seismic and co-seismic thermal anomalies in the area of tectonic activation. At the same time, SAR images of the Sentinel-1 Copernicus satellite in both geometries of acquisition were used to create the differential interferograms and the displacement maps according to the Interferometric Synthetic Aperture Radar (InSAR) technique. Then, the two kinds of datasets (i.e thermal anomaly maps and crustal deformation maps) were introduced into a Geographic Information System environment along with geological formations, active faults, and earthquakes’ epicenters. By overlapping all the aforementioned data, their spatiotemporal relation is explored.
How to cite: Peleli, S., Kouli, M., and Vallianatos, F.: Investigating the spatiotemporal relationship between thermal anomalies and surface deformation; The Arkalochori Earthquake sequence of September 2021, Crete, Greece., EGU General Assembly 2022, Vienna, Austria, 23–27 May 2022, EGU22-7148, https://doi.org/10.5194/egusphere-egu22-7148, 2022.
Please decide on your access
Please use the buttons below to download the presentation materials or to visit the external website where the presentation is linked. Regarding the external link, please note that Copernicus Meetings cannot accept any liability for the content and the website you will visit.
Forward to presentation link
You are going to open an external link to the presentation as indicated by the authors. Copernicus Meetings cannot accept any liability for the content and the website you will visit.
We are sorry, but presentations are only available for users who registered for the conference. Thank you.
EGU22-7309 | Presentations | NH4.1
Wave-like structures prior to very recent southeastern Mediterranean earthquakes as recorded by a VLF/LF radio receiver in Athens (Greece)Dimitrios Z. Politis, Stelios M. Potirakis, Sagardweep Biswas, Sudipta Sasmal, and Masashi Hayakawa
A VLF (10 – 47.5 kHz) radio receiver with call sign UWA has recently been installed at the University of West Attica in Athens (Greece) and is continuously monitoring the lower ionosphere by means of the receptions from many transmitters, in order to identify any possible pre-seismic signatures or other precursors associated with extreme geophysical and space phenomena. In this study, we examine the case of three very recent strong mainshocks with magnitude Mw ≥ 5.5 that happened in September and October of 2021 in the southeastern Mediterranean. The VLF data used in this work correspond to the recordings of one specific transmitter with the call sign “ISR” which is located in Negev (Israel). The borders of the 5th Fresnel zone of the corresponding sub-ionospheric propagation path (ISR-UWA) are close in distance with the epicenters of the two earthquakes (EQ), while the third one is located within the 5th Fresnel zone of the specific path. In this work, we computed the morlet wavelet scalogram of the nighttime amplitude signal in order to check for any embedded wave-like structures, which would indicate the existence of Atmospheric Gravity Waves (AGW) before each one of the examined EQs. In our investigation, we also checked for any other global extreme phenomena, such as geomagnetic storms and solar flares, which may have occurred close in time with the examined EQs and could have a contaminating impact on the obtained results. Our results revealed wave-like structures in the amplitude of the signal a few days before the occurrence of these three EQs.
How to cite: Politis, D. Z., Potirakis, S. M., Biswas, S., Sasmal, S., and Hayakawa, M.: Wave-like structures prior to very recent southeastern Mediterranean earthquakes as recorded by a VLF/LF radio receiver in Athens (Greece), EGU General Assembly 2022, Vienna, Austria, 23–27 May 2022, EGU22-7309, https://doi.org/10.5194/egusphere-egu22-7309, 2022.
Please decide on your access
Please use the buttons below to download the presentation materials or to visit the external website where the presentation is linked. Regarding the external link, please note that Copernicus Meetings cannot accept any liability for the content and the website you will visit.
Forward to presentation link
You are going to open an external link to the presentation as indicated by the authors. Copernicus Meetings cannot accept any liability for the content and the website you will visit.
We are sorry, but presentations are only available for users who registered for the conference. Thank you.
EGU22-8280 | Presentations | NH4.1
Primary-level Site Effect Zoning in Developing Urban Areas Through the Geomorphic Interpretation of LandformsZahra Pak Tarmani, Zohre Masoumi, and Esmaeil Shabanian
The site effect has a great impact on seismic hazard assessment in urban and industrial regions.
For instance, a layer of soft soil with a thickness of several meters amplifies seismic waves from
1.5 to 6 times relative to the underlying bedrock. Therefore, investigating the main characteristics
of Quaternary deposits such as the granulometry and mechanical layering is crucial in site effect
studies. These parameters are directly related to the local geologic/geomorphic setting and genesis
processes of the Quaternary deposits. Nevertheless, large cities in development countries have
rapidly been enlarged covering Quaternary terrains before being evaluated for the site effect. This
rather rapid growth in urbanization interested us to take advantage of ancient aerial photographs
reprocessed with new image processing techniques in order to provide 3D terrain models from
such kind of areas before the recent urbanization. It helped us in the geomorphic terrain
classification and the detection of regions with different site effects originally caused by the
geomorphic setting and genesis of the Quaternary terrains. For example, site effect in a river flood
plain will be different from surrounding areas underlined by alluvial conglomerates or bedrock.
The main target of this study is investigating the primary-level site effect in Urmia city using 3D
geomorphic models derived from ancient aerial photos taken in 1955. Urmia in NW Iran is one of
the populated high-risk areas according to the standard regulations of earthquake in Iran, and
covers a wide region from mountainous areas to the ancient coast of Lake Urmia, with the Shahr
Chai River as the axial drainage. We created the 3D terrain model through the Structure from
Motion (SfM) algorithm. We have provided a detailed geomorphic map of Plio-Quaternary terrains
using the 3D Anaglyph view, Digital Elevation Model (DEM), and orthophoto-mosaic of the
region. It was complemented by granulometry and mechanical layering information from the
available geotechnical boreholes to reconstruct a shallow soil structure model for the area. It
allowed us establishing a primary-level site effect zoning for Urmia. Our results reveal the
presence of five distinct geomorphic zones, with different genesis processes and soil characteristics
from piedmont to coastal zones, which represent different soil structures and probable site effects.
This zoning paves the way for performing complementary site effect investigations with lower
time consummation and cost. The developed method, proposes a sophisticated tool to evaluate
primary site effect in areas covered by urbanization subjected to future natural hazards like
earthquake, landslide and flood before designing geophysical networks for the measurement of
quantitative site effect parameters such as Nakamura microtremor H/V and Multichannel Analysis
of Surface Waves.
Key words: Earthquake hazard, Site effect, Image Processing, Aerial photos, Quaternary geology, Structure from
Motion
How to cite: Pak Tarmani, Z., Masoumi, Z., and Shabanian, E.: Primary-level Site Effect Zoning in Developing Urban Areas Through the Geomorphic Interpretation of Landforms, EGU General Assembly 2022, Vienna, Austria, 23–27 May 2022, EGU22-8280, https://doi.org/10.5194/egusphere-egu22-8280, 2022.
EGU22-8420 | Presentations | NH4.1
Ionospheric perturbations related to seismicity and volcanic eruptions inferred from VLF/LF electric field measurementsHans U. Eichelberger, Konrad Schwingenschuh, Mohammed Y. Boudjada, Bruno P. Besser, Daniel Wolbang, Maria Solovieva, Pier F. Biagi, Manfred Stachel, Özer Aydogar, Christoph Schirninger, Cosima Muck, Claudia Grill, and Irmgard Jernej
In this study we investigate electric field perturbations from sub-ionospheric VLF/LF paths which cross seismic and volcanic active areas. We use waveguide cavity radio links from the transmitters TBB (26.70 kHz, Bafa, Turkey) and ITS (45.90 kHz, Niscemi, Sicily, Italy) to the seismo-electromagnetic receiver facility GRZ (Graz, Austria). The continuous real-time amplitude and phase measurements have a temporal resolution of 1 sec, events are analyzed for the period 2020-2021. Of high interest in this time span are paroxysms of the stratovolcano Mt. Etna, Sicily, Italy. We show electric field amplitude variations which could be related to atmospheric waves, occurred at the active crater and propagated up to the lower ionosphere. This corresponds to vertical coupling processes from the ground to the E-region, the upper waveguide boundary during night-time. Ionospheric variations possibly related to earthquakes are discussed for events along the TBB-GRZ path, assumed is an area given by the so-called effective precursor manifestation zone [1,2]. The findings indicate statistical relations between electric field amplitude variations of the ITS-GRZ path in the VLF/LF sub-ionospheric waveguide and high volcanic activity of Etna. For earthquakes multi-parametric observations shall be taken into account to diagnose physical processes related to the events. In summary, VLF/LF investigations in a network together with automated data processing can be an essential component of natural hazards characterization.
References:
[1] Dobrovolsky, I.P., Zubkov, S.I., and Miachkin, V.I., Estimation of the size of earthquake preparation zones, PAGEOPH 117, 1025–1044, 1979. https://doi.org/10.1007/BF00876083
[2] Bowman, D.D., Ouillon, G., Sammis, C.G., Sornette, A., and Sornette, D., An observational test of the critical earthquake concept, JGR Solid Earth, 103, B10, 24359-24372, 1998. https://doi.org/10.1029/98JB00792
How to cite: Eichelberger, H. U., Schwingenschuh, K., Boudjada, M. Y., Besser, B. P., Wolbang, D., Solovieva, M., Biagi, P. F., Stachel, M., Aydogar, Ö., Schirninger, C., Muck, C., Grill, C., and Jernej, I.: Ionospheric perturbations related to seismicity and volcanic eruptions inferred from VLF/LF electric field measurements, EGU General Assembly 2022, Vienna, Austria, 23–27 May 2022, EGU22-8420, https://doi.org/10.5194/egusphere-egu22-8420, 2022.
Please decide on your access
Please use the buttons below to download the presentation materials or to visit the external website where the presentation is linked. Regarding the external link, please note that Copernicus Meetings cannot accept any liability for the content and the website you will visit.
Forward to presentation link
You are going to open an external link to the presentation as indicated by the authors. Copernicus Meetings cannot accept any liability for the content and the website you will visit.
We are sorry, but presentations are only available for users who registered for the conference. Thank you.
EGU22-8426 | Presentations | NH4.1 | Highlight
Earthquake nowcasting: Retrospective testing in Greece 2019 - 2021Gerasimos Chouliaras, Efthimios S. Skordas, and Nikolaos Sarlis
Earthquake nowcasting [1] (EN) is a modern method to estimate seismic risk by evaluating the progress of the earthquake cycle in fault systems [2]. EN employs natural time [3], which uniquely estimates seismic risk by means of the earthquake potential score (EPS) [1,4] and has found many useful applications both regionally and globally [1, 2, 4-10]. Among these applications, here we focus on those in Greece since 2019 [2], by using the earthquake catalogue of the Institute of Geodynamics of the National Observatory of Athens[11–13] (NOA) for the estimation of the EPS in various locations: For example, the ML(NOA)=6.0 off-shore Southern Crete earthquake on 2 May 2020, the ML(NOA)=6.7 Samos earthquake on 30 October 2020, the ML(NOA)=6.0 Tyrnavos earthquake on 3 March 2021, the ML(NOA)=5.8 Arkalohorion Crete earthquake on 27 September 2021, the ML(NOA)=6.3 Sitia Crete earthquake on 12 October 2021. The results are promising and reveal that earthquake nowcast scores provide useful information on impending seismicity.
[1] J.B. Rundle, D.L. Turcotte, A. Donnellan, L. Grant Ludwig, M. Luginbuhl, G. Gong, Earth and Space Science 3 (2016) 480–486. dx.doi.org/10.1002/2016EA000185
[2] J.B. Rundle, A. Donnellan, G. Fox, J.P. Crutchfield, Surveys in Geophysics (2021). dx.doi.org/10.1007/s10712-021-09655-3
[3] P.A. Varotsos, N.V. Sarlis, E.S. Skordas, Phys. Rev. E 66 (2002) 011902. dx.doi.org/10.1103/physreve.66.011902
[4] S. Pasari, Pure Appl. Geophys. 176 (2019) 1417–1432. dx.doi.org/10.1007/s00024-018-2037-0
[5] M. Luginbuhl, J.B. Rundle, D.L. Turcotte, Pure and Applied Geophysics 175 (2018) 661–670. dx.doi.org/10.1007/s00024-018-1778-0
[6] M. Luginbuhl, J.B. Rundle, D.L. Turcotte, Geophys. J. Int. 215 (2018) 753–759. dx.doi.org/10.1093/gji/ggy315
[7] N.V. Sarlis, E.S. Skordas, Entropy 20 (2018) 882. dx.doi.org/10.3390/e20110882
[8] S. Pasari, Y. Sharma, Seismological Research Letters 91 (6) (2020) 3358–3369. dx.doi.org/10.1785/0220200104
[9] J. Perez-Oregon, F. Angulo-Brown, N.V. Sarlis, Entropy 22 (11) (2020) 1228. dx.doi.org/10.3390/e22111228
[10] P.K. Varotsos, J. Perez-Oregon, E.S. Skordas, N.V. Sarlis, Applied Sciences 11 (21) (2021) 10093. dx.doi.org/10.3390/app112110093
[11] G. Chouliaras, Natural Hazards and Earth System Sciences 9 (3) (2009) 905–912. dx.doi.org/10.5194/ nhess-9-905-2009
[12] G. Chouliaras, N.S. Melis, G. Drakatos, K. Makropoulos, Advances in Geosciences 36 (2013) 7–9. dx.doi.org/10.5194/adgeo-36-7-2013
[13] A. Mignan, G. Chouliaras, Seismological Research Letters 85 (3) (2014) 657–667. dx.doi.org/10.1785/0220130209
How to cite: Chouliaras, G., Skordas, E. S., and Sarlis, N.: Earthquake nowcasting: Retrospective testing in Greece 2019 - 2021, EGU General Assembly 2022, Vienna, Austria, 23–27 May 2022, EGU22-8426, https://doi.org/10.5194/egusphere-egu22-8426, 2022.
EGU22-8718 | Presentations | NH4.1
Visibility graph analysis to identify correlations in the magnitude earthquake time series monitored in the Tehuantepec Isthmus subduction zone, México.Alejandro Ramírez-Rojas and Elsa Leticia Flores-Márquez
The visibility graph method has allowed to identify statistical properties of earthquake magnitude time series. So that, such statistical features in the time series have helped to classify the earthquakes sequences in different categories according with their tectonical sources related with their dynamical seismicity. The Tehuantepec Isthmus subduction zone, México, has showed different dynamical behavior before and after the M8.2 occurred on September 07, 2017. This behavior is associated with the temporal correlations observed in the magnitude sequences. With the aim to characterize these correlations we use the visibility graph method which has showed great potential to get the dynamical properties of studied system from the statistical properties in the network graph. In this study we investigate four periods: the first, between 2005 and 2012, the second (before the M8.2 EQ) from 2012 to 2017, the third from September 2017 to March 2018 corresponding to aftershocks period, and the fourth from April to December 2021, in order to find type of connectivity corresponding to each one, we have computed the distribution function P(k) of the connectivity degree k. Our results show the connectivity increases till the earthquake and decrease in the aftershocks period.
How to cite: Ramírez-Rojas, A. and Flores-Márquez, E. L.: Visibility graph analysis to identify correlations in the magnitude earthquake time series monitored in the Tehuantepec Isthmus subduction zone, México., EGU General Assembly 2022, Vienna, Austria, 23–27 May 2022, EGU22-8718, https://doi.org/10.5194/egusphere-egu22-8718, 2022.
EGU22-8924 | Presentations | NH4.1 | Highlight
The Cascading Foreshock Sequence of the Ms 6.4 Yangbi Earthquake in Yunnan, ChinaGaohua Zhu, Hongfeng Yang, Yen Joe Tan, Mingpei Jin, Xiaobin Li, and Wei Yang
Foreshocks may provide valuable information on the nucleation process of large earthquakes. The 2021 Ms 6.4 Yangbi, Yunnan, China, earthquake was preceded by abundant foreshocks in the ~75 hours leading up to the mainshock. To understand the space-time evolution of the foreshock sequence and its relationship to the mainshock nucleation, we built a high‐precision earthquake catalog using a machine-learning phase picker—EQtransformer and the template matching method. The source parameters of 17 large foreshocks and the mainshock were derived to analyze their interaction. Observed “back-and-forth” spatial patterns of seismicity and intermittent episodes of foreshocks without an accelerating pattern do not favor hypotheses that the foreshocks were a manifestation of a slow slip or fluid front propagating along the mainshock’s rupture plane. The ruptured patches of most large foreshocks were adjacent to one another with little overlap, and the mainshock eventually initiated near the edge of the foreshocks’ ruptured area where there had been a local increase in shear stress. These observations are consistent with a triggered cascade of stress transfer, where previous foreshocks load adjacent fault patches to rupture as additional foreshocks, and eventually the mainshock.
How to cite: Zhu, G., Yang, H., Tan, Y. J., Jin, M., Li, X., and Yang, W.: The Cascading Foreshock Sequence of the Ms 6.4 Yangbi Earthquake in Yunnan, China, EGU General Assembly 2022, Vienna, Austria, 23–27 May 2022, EGU22-8924, https://doi.org/10.5194/egusphere-egu22-8924, 2022.
Please decide on your access
Please use the buttons below to download the presentation materials or to visit the external website where the presentation is linked. Regarding the external link, please note that Copernicus Meetings cannot accept any liability for the content and the website you will visit.
Forward to presentation link
You are going to open an external link to the presentation as indicated by the authors. Copernicus Meetings cannot accept any liability for the content and the website you will visit.
We are sorry, but presentations are only available for users who registered for the conference. Thank you.
EGU22-9690 | Presentations | NH4.1 | Highlight
Lesson learnt after long-term (>10 years) correlation analyses between satellite TIR anomalies and earthquakes occurrence performed over Greece, Italy, Japan and TurkeyValeria Satriano, Roberto Colonna, Angelo Corrado, Alexander Eleftheriou, Carolina Filizzola, Nicola Genzano, Hattori Katsumi, Mariano Lisi, Nicola Pergola, Vallianatos Filippos, and Valerio Tramutoli
In the recent years, in order to evaluate the possible spatial-temporal correlation among anomalies in Earth’s thermally emitted InfraRed radiation and earthquakes occurrence, several long-term studies have been performed. Different seismically active areas around the world have been this way investigated by using TIR sensors on board geostationary (e.g. Eleftheriou et al. 2016, Genzano et al., 2020, Genzano et al., 2021, Filizzola et al., 2022) and polar (e.g. Zhang and Meng, 2019) satellites. Since the study of Filizzola et al. (2004) the better S/N ratio achievable by the geostationary sensors (compared with the polar ones) made this kind of sensors the first choice for this kind of long-term analyses.
In this paper the lesson learnt after 20 years of satellite TIR analyses are critically analyzed in the perspective of the possible inclusion of such anomalies among the parameters usefully contributing to the construction of a multi-parametric system for a time-Dependent Assessment of Seismic Hazard.
The more recent results achieved by applying the RST (Tramutoli et al., 2005, Tramutoli 2007) approach to long-term (>10 years) TIR satellite data collected by the geostationary sensors SEVIRI (on board MSG) - over Greece (Elefteriou et al., 2016), Italy (Genzano et al, 2020) and Turkey (Filizzola et al., 2022) – and by JAMI and IMAGER (on board MTSAT satellites) over Japan (Genzano et al., 2021) will be also presented and discussed.
References
Eleftheriou, A., C. Filizzola, N. Genzano, T. Lacava, M. Lisi, R. Paciello, N. Pergola, F. Vallianatos, and V. Tramutoli (2016), Long-Term RST Analysis of Anomalous TIR Sequences in Relation with Earthquakes Occurred in Greece in the Period 2004–2013, PAGEOPGH, 173(1), 285–303, doi:10.1007/s00024-015-1116-8.
Filizzola, C., N. Pergola, C. Pietrapertosa, V. Tramutoli (2004), Robust satellite techniques for seismically active areas moni-toring: a sensitivity analysis on September 7, 1999 Athens’s earthquake. Phys. Chem. Earth, 29, 517–527. 10.1016/j.pce.2003.11.019
Filizzola C., A. Corrado, N. Genzano, M. Lisi, N. Pergola, R. Colonna and V. Tramutoli (2022), RST Analysis of Anomalous TIR Sequences in relation with earthquakes occurred in Turkey in the period 2004–2015, Remote Sensing, (accepted).
Genzano, N., C. Filizzola, M. Lisi, N. Pergola, and V. Tramutoli (2020), Toward the development of a multi parametric system for a short-term assessment of the seismic hazard in Italy, Ann. Geophys, 63(5) doi:10.4401/ag-8227.
Genzano, N., C. Filizzola, K. Hattori, N. Pergola, and V. Tramutoli (2021), Statistical correlation analysis between thermal infrared anomalies observed from MTSATs and large earthquakes occurred in Japan (2005–2015). JGR: Solid Earth, 126, e2020JB020108, https://doi.org/10.1029/2020JB020108
Tramutoli, V. (2007), Robust Satellite Techniques (RST) for Natural and Environmental Hazards Monitoring and Mitigation: Theory and Applications, in 2007 International Workshop on the Analysis of Multi-temporal Remote Sensing Images, pp. 1–6, IEEE. doi: 10.1109/MULTITEMP.2007.4293057
Tramutoli, V., V. Cuomo, C. Filizzola, N. Pergola, C. Pietrapertosa (2005), Assessing the potential of thermal infrared satellite surveys for monitoring seismically active areas: The case of Kocaeli (İzmit) earthquake, August 17, 1999. RSE, 96, 409–426. https://doi.org/10.1016/j.rse.2005.04.006
Zhang, Y. and Meng, Q. (2019), A statistical analysis of TIR anomalies extracted by RSTs in relation to an earthquake in the Sichuan area using MODIS LST data, NHESS, 19, 535–549, https://doi.org/10.5194/nhess-19-535-2019, 2019
How to cite: Satriano, V., Colonna, R., Corrado, A., Eleftheriou, A., Filizzola, C., Genzano, N., Katsumi, H., Lisi, M., Pergola, N., Filippos, V., and Tramutoli, V.: Lesson learnt after long-term (>10 years) correlation analyses between satellite TIR anomalies and earthquakes occurrence performed over Greece, Italy, Japan and Turkey, EGU General Assembly 2022, Vienna, Austria, 23–27 May 2022, EGU22-9690, https://doi.org/10.5194/egusphere-egu22-9690, 2022.
EGU22-10161 | Presentations | NH4.1 | Highlight
Analysis of VLF and LF signal fluctuations recorded by Graz facility prior to earthquakes occurrencesMohammed Y. Boudjada, Pier Francesco Biagi, Hans Ulrich Eichelberger, Patrick H.M. Galopeau, Konrad Schwingenschuh, Maria Solovieva, Helmut Lammer, Wolfgang Voller, and Masashi Hayakawa
We report in our study on earthquakes that occurred in Croatia and Slovenia in the period from 1 Jan. 2020 to 31 Dec. 2021. Those seismic events happened in a localized region confined between 13.46°E and 17.46°E in longitude and 45.03°N and 49.03°N in latitude. Maximum magnitudes Mw6.4 and Mw5.4 occurred, respectively, on 29 Dec. 2020, at 11:19 UT, and 22 March 2020, at 05:24 UT. We use two-radio system, INFREP (Biagi et al., 2019) and UltraMSK (Schwingenschuh et al., 2011) to investigate the reception conditions of LF-VLF transmitter signals. The selected earthquakes occurred at distances less than 300km from the Graz station (47.03°N, 15.46°E) in Austria. First, we emphasize on the time evolutions of earthquakes that occurred along a same meridian, i.e. at a geographical longitude of 16°E. Second, we study the daily VLF-LF transmitter signals that exhibit a minimum around local sunrises and sunsets. This daily variations are specifically considered two/three weeks before the occurrence of the two intense events with magnitudes Mw6.4 and Mw5.4. We discuss the unusual terminator time motions of VLF-LF signals linked to earthquakes occurrences, and their appearances at sunrise- or sunset-times. Such observational features are interpreted as disturbances of the transmitter signal propagations in the ionospheric D- and E-layers above the earthquakes preparation zone (Hayakawa, 2015).
References:
Biagi et al., The INFREP Network: Present Situation and Recent Results, Open J. Earth. Research, 8, 2019.
Hayakawa, Earthquake Prediction with Radio Techniques, John Wiley and Sons, Singapore, 2015.
Schwingenschuh et al., The Graz seismo-electromagnetic VLF facility, Nat. Hazards Earth Syst. Sci., 11, 2011
How to cite: Boudjada, M. Y., Biagi, P. F., Eichelberger, H. U., Galopeau, P. H. M., Schwingenschuh, K., Solovieva, M., Lammer, H., Voller, W., and Hayakawa, M.: Analysis of VLF and LF signal fluctuations recorded by Graz facility prior to earthquakes occurrences, EGU General Assembly 2022, Vienna, Austria, 23–27 May 2022, EGU22-10161, https://doi.org/10.5194/egusphere-egu22-10161, 2022.
EGU22-10209 | Presentations | NH4.1
Enhancing Data Sets From Rudna Deep Copper Mine, SW Poland: Implications on Detailed Structural Resolution and Short-Term Hazard AssessmentMonika Sobiesiak, Konstantinos Leptokaropoulos, Monika Staszek, Natalia Poiata, Pascal Bernard, and Lukasz Rudzinski
Applying the software BackTrackBB (Poiata et al., 2016) for automated detection and location of seismic events to data sets from Rudna Deep Copper Mine, SW Poland, lead to an enhancement of existing routine catalogs by about a factor of 10.000 in number of events. Following our hypothesis that all types of seismic events contribute to seismic hazard in a mine, we included all events from major mine collapses (M>3), recorded blasting works and detonations, to machinery noise. These enhanced data sets enabled a detailed spatio-temporal distribution of seismicity in the mine and a short-term hazard assessment on a daily basis.
In this study, we focus on the data from two days with major mine collapses: the 2016-11-29 Mw=3.4, and the 2018-09-15 Mw=3.7 events. The spatio-temporal distribution of seismicity of both days deciphered detailed horizontal and vertical structures and revealed the increase of seismic activity after the daily blasting work. The daily histograms exhibit similar patterns, suggesting the dominant influence of explosions on the overall seismicity in the mine. Using the enhanced data sets for short-term hazard assessment, we observed gaps in the activity rates before the main shocks. They were followed by sudden increase of seismicity, a simultaneous drop in seismic b-value, and an increase in exceedance probability for the assumed largest magnitude events. This demonstrates the usefulness of enhanced data sets from surface networks for revealing precursory phenomena before destructive mine collapses and suggests a testing strategy for early warning procedures.
How to cite: Sobiesiak, M., Leptokaropoulos, K., Staszek, M., Poiata, N., Bernard, P., and Rudzinski, L.: Enhancing Data Sets From Rudna Deep Copper Mine, SW Poland: Implications on Detailed Structural Resolution and Short-Term Hazard Assessment, EGU General Assembly 2022, Vienna, Austria, 23–27 May 2022, EGU22-10209, https://doi.org/10.5194/egusphere-egu22-10209, 2022.
EGU22-10222 | Presentations | NH4.1
Optimized setup and long-term validation of anomaly detection methods for earthquake-related ionospheric-TEC (Total Electron Content) parameter over Italy and Mediterranean areaRoberto Colonna, Carolina Filizzola, Nicola Genzano, Mariano Lisi, Nicola Pergola, and Valerio Tramutoli
Near the end of the last century and the beginning of the new, different types of geophysical parameters (components of the electromagnetic field in several frequency bands, thermal anomalies, radon exhalation from the ground, ionospheric parameters and more) have been proposed as indicators of variability potentially related to the earthquakes occurrence. During the last decade, thanks to the availability of historical satellite observations which has begun to be significantly large and thanks to the exponential growth of artificial intelligence techniques, many advances have been made on the study of the seismic-related anomalies detection observed from space.
In this work, the variations in Total Electron Content (TEC) parameter are investigated as indicator of the ionospheric status potentially affected by earthquake related phenomena. In-depth and systematic analysis of multi-year historical data series plays a key role in distinguishing between anomalous TEC variations and TEC changes associated with normal ionospheric behavior or non-terrestrial forcing phenomena (mainly dominated by solar cycles and activity).
In order to detect the differences between the two types of variation, we performed an optimal setting of the methodological inputs for the detection of seismically related anomalies in ionospheric-TEC using machine learning techniques and validating the findings on multiple long-term historical series (mostly nearly 20-year). The setting was optimized using techniques capable of combining multi-year time series of TEC satellite data and multi-year time series of seismic catalogues, simulating their behaviors in tens of thousands of possible combinations and classifying them according to criteria established a priori. Input setup and validation were done by investigating possible links between TEC anomalies and earthquake occurring over Italy and Mediterranean area. We will show and comment the results of both, optimal input setting and statistical correlation analyses consequently performed, and we will discuss the potential impact of these on future developments in this field.
How to cite: Colonna, R., Filizzola, C., Genzano, N., Lisi, M., Pergola, N., and Tramutoli, V.: Optimized setup and long-term validation of anomaly detection methods for earthquake-related ionospheric-TEC (Total Electron Content) parameter over Italy and Mediterranean area, EGU General Assembly 2022, Vienna, Austria, 23–27 May 2022, EGU22-10222, https://doi.org/10.5194/egusphere-egu22-10222, 2022.
EGU22-10371 | Presentations | NH4.1
Utilizing machine learning techniques along with GPS ionospheric TEC maps for potentially predicting earthquake eventsYuval Reuveni, Sead Asaly, Nimrod Inbar, and Leead Gottlieb
The scientific use of ground and space-based remote sensing technology is inherently vital for studying different lithospheric-tropospheric-ionospheric coupling mechanisms, which are imperative for understanding geodynamic processes. Current remote sensing technologies operating at a wide range of frequencies, using either sound or electromagnetic emitted waves, have become a valuable tool for detecting and measuring signatures presumably associated with earthquake events. Over the past two decades, numerous studies have been presenting promising results related to natural hazards mitigation, especially for earthquake precursors, while other studies have been refuting them. While highly impacting for geodynamic processes the controversy around precursors that may precede earthquakes yet remains significant. Thus, predicting where and when natural hazard event such as earthquake is likely to occur in a specific region of interest still remains a key challenging task in geo-sciences related research. Recently, it has been discovered that natural hazard signatures associated with strong earthquakes appear not only in the lithosphere, but also in the troposphere and ionosphere. Both ground and space-based remote sensing techniques can be used to detect early warning signals from places where stresses build up deep in the Earth’s crust and may lead to a catastrophic earthquake. Here, we propose to implement a machine learning Support Vector Machine (SVM) technique, applied with GPS ionospheric Total Electron Content (TEC) pre-processed time series estimations, extracted from global ionospheric TEC maps, to evaluate any potential precursory caused by the earthquake and is manifested as ionospheric TEC anomaly. Each TEC time series data was geographically extracted around the earthquake epicenter and calculated by weighted average of the four closest points to evaluate any potential influence caused by the earthquake. After filtering and screening our data from any solar or geomagnetic influence at different time scales, our results indicate that with large earthquakes (> 6 [Mw]), there is a potentially high probability of gaining true negative prediction with accuracy of 85.7% as well as true positive prediction accuracy of 80%. Our suggested method has been also tested with different skill scores such as Accuracy (0.8285), precision (0.85), recall (0.8), Heidke Skill Score (0.657) and Tue Skill Statistics (0.657).
How to cite: Reuveni, Y., Asaly, S., Inbar, N., and Gottlieb, L.: Utilizing machine learning techniques along with GPS ionospheric TEC maps for potentially predicting earthquake events, EGU General Assembly 2022, Vienna, Austria, 23–27 May 2022, EGU22-10371, https://doi.org/10.5194/egusphere-egu22-10371, 2022.
Please decide on your access
Please use the buttons below to download the presentation materials or to visit the external website where the presentation is linked. Regarding the external link, please note that Copernicus Meetings cannot accept any liability for the content and the website you will visit.
Forward to presentation link
You are going to open an external link to the presentation as indicated by the authors. Copernicus Meetings cannot accept any liability for the content and the website you will visit.
We are sorry, but presentations are only available for users who registered for the conference. Thank you.
EGU22-10488 | Presentations | NH4.1
Results of the analysis of VLF and ULF perturbations and modeling atmosphere-ionosphere couplingYuriy Rapoport, Volodymyr Reshetnyk, Asen Grytsai, Alex Liashchuk, Alla Fedorenko, Masashi Hayakawa, Volodymyr Grimalsky, and Sergei Petrishchevskii
The work continues one presented by us in 2021, which included the identification of three groups of periods in the VLF amplitude variations in the waveguide Earth-Ionosphere (WGEI) according to data of Japan receivers, obtained in 2014–2017. Periods of 5–10 minutes correspond to the fundamental mode of acoustic-gravity waves (AGW) near the Brunt–Väisälä period and were firstly revealed in VLF signals. Apart from these values, periods of 2–3 hours and possibly 1 week were also detected; the weekly periodicity is caused by anthropogenic influence on the VLF data. The problem with penetration of the ULF electric field to the ionosphere is investigated both within the dynamic simulation of the Maxwell equations and within the quasi-electrostatic approach. It is demonstrated that in the case of open field lines the results of dynamic simulations differ essentially from the quasi-electrostatic approach, which is not valid there. In the case of closed field lines, the simulation results are practically the same for both approaches and correspond to the data of measurements of plasma perturbations in the ionosphere. It is shown that the diurnal cycle is most clearly visible in the variations of the VLF amplitudes. Disturbances from various phenomena also appear in the VLF data series. One of the strongest geomagnetic storms during the analyzed time range was the event of St. Patrick's Day (March 17, 2015), which is not reflected in Japanese data because this event occurred at night for East Asia. The use of information entropy in the VLF signal processing was tested with the determination of the main features of information entropy. Variations in information entropy at different stations are discussed in detail. It has been found that information entropy shows maxima near sunrise and sunset. The location of these peaks relative to the moments of sunrise and sunset changes with the seasons that is probably connected with the solar terminator passage at the heights of the VLF signal propagation. A study of 109 earthquakes during 2014-2017 did not show a clear dependence of information entropy when using the superposed epoch analysis, although a slight decrease in information entropy was observed before a part of the earthquakes. The effect of solar flares on information entropy has been established, but this issue needs further study. We have developed a model describing the penetration into the ionosphere of a nonlinear AGW packet excited by a ground source. Complex modulation of the initial AGW includes acoustic waves with closed frequencies and random phases. The model is important for the interpretation of atmosphere–ionosphere coupling along with seismoionospheric one. We are working on the application of this model to the spectrum of the VLF waves in the WGEI and unified models of the atmosphere–ionosphere coupling due to AGW and electromagnetic field excited by the same source in the lower atmosphere. This model would be important for the understanding seismogenic and tropical cyclone influence on the ionosphere.
How to cite: Rapoport, Y., Reshetnyk, V., Grytsai, A., Liashchuk, A., Fedorenko, A., Hayakawa, M., Grimalsky, V., and Petrishchevskii, S.: Results of the analysis of VLF and ULF perturbations and modeling atmosphere-ionosphere coupling, EGU General Assembly 2022, Vienna, Austria, 23–27 May 2022, EGU22-10488, https://doi.org/10.5194/egusphere-egu22-10488, 2022.
EGU22-10961 | Presentations | NH4.1
Regional applicability of earthquake forecasts using geoelectric statistical moments: Application to Kakioka, JapanHong-Jia Chen, Katsumi Hattori, and Chien-Chih Chen
Electromagnetic anomalies have become promising for short-term earthquake forecasting. One forecasting algorithm based on statistical moments of geoelectric data was developed and applied in Taiwan. The objective of our research was to investigate such a reliable, rigorously testable algorithm to issue earthquake forecasts. We tested the applicability of the forecasting algorithm and applied it to geoelectric data and an earthquake catalog in Kakioka, Japan with a long-term period of 26 years. We calculated the variance, skewness, and kurtosis of the geoelectric data each day, determined their anomalies, and then compared them with earthquake occurrences through the forecasting algorithm. We observed that the anomalies of variance, skewness, and kurtosis significantly precede earthquakes, suggesting that the geoelectric data distributions deviate from normal distributions before earthquakes. Furthermore, the forecasting algorithm can select robust optimal models and produce explicit forecasting probability for two-thirds of all experimental cases. Therefore, we concluded that the forecasting algorithm based on statistical moments of geoelectric data is universal and may contribute to short-term earthquake forecasting.
How to cite: Chen, H.-J., Hattori, K., and Chen, C.-C.: Regional applicability of earthquake forecasts using geoelectric statistical moments: Application to Kakioka, Japan, EGU General Assembly 2022, Vienna, Austria, 23–27 May 2022, EGU22-10961, https://doi.org/10.5194/egusphere-egu22-10961, 2022.
Please decide on your access
Please use the buttons below to download the presentation materials or to visit the external website where the presentation is linked. Regarding the external link, please note that Copernicus Meetings cannot accept any liability for the content and the website you will visit.
Forward to presentation link
You are going to open an external link to the presentation as indicated by the authors. Copernicus Meetings cannot accept any liability for the content and the website you will visit.
We are sorry, but presentations are only available for users who registered for the conference. Thank you.
EGU22-11299 | Presentations | NH4.1
b-value and kinematic parameters from 3D focal mechanisms distributions in Southern CaliforniaAndrea Carducci, Antonio Petruccelli, Angelo De Santis, Rita de Nardis, and Giusy Lavecchia
The frequency-magnitude relation of earthquakes, with particular attention to the b-value of Gutenberg-Richter law, is computed in Southern California. A three-dimensional grid is employed to sample relocated focal mechanisms and determine both the magnitude of completeness and the b-value for each node. Sampling radius and grid size are appropriately chosen accordingly to seismogenic source dimensions. The SCEC Community Fault Model is used for comparison of the main fault systems along with the calculated 3D distributions.
The b-values are compared to Aλ, a streamlined kinematic fault quantification, which does not use inversion processes since directly depends on individual rakes of focal mechanisms. Potential relationships between the two quantities are then computed through multiple regressions at increasing depth ranges: they may help to evaluate seismic hazard assessment in relating the frequency and size of earthquakes to kinematic features. The rheological transition from elastic to plastic conditions is computed, assuming different physical constraints, and its influence on b-value and Aλ is also analyzed. Among proposed linear, polynomial, and harmonic equations, the linear model is statistically valued as the most probable one to relate the two parameters at different depth ranges. b-values against Aλ results are implemented into a 3D figure, where point data are interpolated by “Lowess Smoothing” surfaces to visually check the constancy depending on depth.
How to cite: Carducci, A., Petruccelli, A., De Santis, A., de Nardis, R., and Lavecchia, G.: b-value and kinematic parameters from 3D focal mechanisms distributions in Southern California, EGU General Assembly 2022, Vienna, Austria, 23–27 May 2022, EGU22-11299, https://doi.org/10.5194/egusphere-egu22-11299, 2022.
EGU22-11511 | Presentations | NH4.1 | Highlight
Earthquake forecasting probability by statistical correlations between low to moderate seismic events and variations in geochemical parametersLisa Pierotti, Cristiano Fidani, Gianluca Facca, and Fabrizio Gherardi
Since late 2002, a network of six automatic monitoring stations is operating in Tuscany, Central Italy, to investigate possible geochemical precursors of earthquakes. The network is operated by the Institute of Geosciences and Earth Resources (IGG), of the National Research Council of Italy (CNR), in collaboration and with the financial support of the Government of the Tuscany Region. The areas of highest seismic risk of the region, Garfagnana, Lunigiana, Mugello, Upper Tiber Valley and Mt. Amiata, are currently investigated. The monitoring stations are equipped with multi-parametric sensors to measure temperature, pH, electric conductivity, redox potential, dissolved CO2 and CH4 concentrations in spring waters. The elaboration of long-term time series allowed for an accurate definition of the geochemical background, and for the recognition of a number of geochemical anomalies in concomitance with the most energetic seismic events occurred during the monitoring period (Pierotti et al., 2017).
In an attempt to further exploit data from the geochemical network of Tuscany in a seismic risk reduction perspective, here we present a new statistical analysis that focuses on the possible correlation between low to moderate seismic events and variations in the chemical-physical parameters detected by the monitoring network. This approach relies on the estimate of a conditional probability for the forecast of earthquakes from the correlation coefficient between seismic events and signals variations (Fidani, 2021).
Seismic events (EQ) are classified according to a magnitude threshold, Mo. We set EQ = 0, if no seismic events were observed with M < Mo, and EQ = 1, if at least a seismic event was observed with M > Mo. Chemical-physical (CP) events were defined based on their appropriate amplitudes threshold Ao, being CP = 0 if the amplitude A < Ao, and CP = 1 if A > Ao. Digital time series were elaborated from data collected over the last 10 years, where EQs were declustered and CPs detrended for external influences. The couples of events with the same time differences TEQ – TCP, between EQs and CPs, were summed in a histogram. Then, a Pearson statistical correlation coefficient corr(EQ,CP) was obtained starting from the covariance definition.
A conditional probability for EQ forecasting is estimated starting from the correlation coefficient in an attempt to use data from CP network of Tuscany in a seismic risk reduction framework. The approach consists in an evaluation of EQ probability in a defined area, given a CP detection by the station in the same area. The conditional probability P(EQCP), when a correlation between EQs and CPs exists and time difference is that evidenced by the correlation, is increased by a term proportional to the correlation coefficient as

with respect to the unconditioned probability P(EQ) when a CP event is detected, where P(CP) is the unconditioned probability of CP.
Fidani, C. (2021). Front. Earth Sci. 9:673105.
Pierotti, L. et al. (2017). Physics and Chemistry of the Earth, Parts A/B/C, 98, 161-172.
How to cite: Pierotti, L., Fidani, C., Facca, G., and Gherardi, F.: Earthquake forecasting probability by statistical correlations between low to moderate seismic events and variations in geochemical parameters, EGU General Assembly 2022, Vienna, Austria, 23–27 May 2022, EGU22-11511, https://doi.org/10.5194/egusphere-egu22-11511, 2022.
EGU22-12275 | Presentations | NH4.1
Virtual Earthquakes Cooperating with Natural Hazards and Simultaneously Scheduled Seismic ActivitiesTaner Sengor
Some samples are given illustrating possible influences of the natural hazards those will occur in the future times for the seismic activities those occur at the present time in [1]. Those samples force to ask whether there exist operational connections originating from future time’s naturel events, NEs on the present time’s NEs or do not. The analytical basics orienting such cooperation are derived in here [2]-[3].
Both the past time’s NEs and the future time’s NEs are not exist at the present time’s NEs topology when we want to observe and measure all them at the same location in the present time as a matter of the event for the present time’s temporal and spatial metric or in a space-time differential displacement with other words [4]. This situation brings the fact on the absence and/or presence of NEs in a temporal topology as a principle about the occurrence of NEs in their specific manifolds [4]. The very simple example in below may be helpful to understand the fact:
Example 1: If you want to be a medical doctor in your future then you have to study and learn medical facts in an official way. Without doing this in your past times and present times you cannot earn the medical doctor degree in your future times.
Result 1: The future time’s NEs present cooperation in both the past and future time’s NEs.
Example 1 and connected result 1 illustrate the future time’s event of being medical doctor operates the past and present time’s event of learning medicine so the principle 1 in below brings the processes designing the cooperation among past, present, and future NEs:
Principle 1: There is either definitive and/or fuzzy cooperation among the NEs in the future time, pas time, and present time for NEs’ topology.
The retarded potential in gauge form is split into two parts: The first part is a part of Fourier transform given the future time’s NEs and the second part is a Fourier sinus transform. The first part involves the ingredients of future time’s NEs. The second part involves the ingredients of both NEs of past time and present time. The first part has the property as a forwarded potential. The second part fits to the properties as the events at the past and/or the present.
The principle 1 is checked during several earthquakes received in 1999-2004 [5]- [6] and some important results are shared in [1]. The present writer calls virtual earthquake (VEQ) future time’s earthquake activities cooperating with the past and/or present time’s seismic activities and presents the topological processes with their analytical extractions from the above-mentioned observations.
-------------------
1Sengor T, http://meetingorganizer.copernicus.org/ EGU2020/EGU2020-22589.pdf.
2Sengor T, Helsinki University of Tech., Electromagnetics Lab. Report 344, Nov. 2000, ISBN 951-22-5258-9, ISSN 1456-632X.
3Sengor T, Helsinki University of Tech., Electromagnetics Lab. Report 347, Dec. 2000, ISBN 951-22-5274-0, ISSN 1456-632X.
4Sengor T, Invited paper. doi:10.23919/URSI- ETS.2019.8931455
5Sengor T, http://meetingorganizer.copernicus.org/EGU2019/EGU2019-17127.pdf.
6Sengor T, Helsinki University of Tech., Electromagnetics Lab. Report 368, May. 2001, ISBN 951-22-5275-1, ISSN 1456-632X.
How to cite: Sengor, T.: Virtual Earthquakes Cooperating with Natural Hazards and Simultaneously Scheduled Seismic Activities, EGU General Assembly 2022, Vienna, Austria, 23–27 May 2022, EGU22-12275, https://doi.org/10.5194/egusphere-egu22-12275, 2022.
EGU22-12349 | Presentations | NH4.1 | Highlight
Multi-channel singular spectrum analysis of soil radon concentration, Japan: Relationship between soil radon flux and precipitation and the local seismic activityKatsumi Hattori, Kazuhide Nemoto, Haruna Kojina, Akitsugu Kitade, Shu kaneko, Chie Yoshino, Toru Mogi, Toshiharu Konishi, and Dimitar Ouzounov
Recently, there are many papers on electromagnetic pre-earthquake phenomena such as geomagnetic, ionospheric, and atmospheric anomalous changes. Ionospheric anomaly preceding large earthquakes is one of the most promising phenomena. Lithosphere-Atmosphere-Ionosphere Coupling (LAIC) model has been proposed to explain these phenomena. In this study, to evaluate the possibility of chemical channel of LAIC by observation, we have installed sensors for atmospheric electric field, atmospheric ion concentration, atmospheric Rn concentration, soil radon Rn concentration (SRC), and weather elements at Asahi station, Boso, Japan. Since the atmospheric electricity parameters are very much influenced by weather factors, it is necessary to remove these effects as much as possible. In this aim, we apply the MSSA (Multi-channel Singular Spectral Analysis) to remove these influences from the variation of GRC and estimate the soil Rn flux (SRF). We investigated the correlations (1) between SRF and precipitation and (2) between SRF and the local seismic activity around Asahi station. The preliminary results show that SRF was significantly increased by heavy precipitations of 20 mm or more in total for 2 hours. We proposed two types of models, a rainwater load model and a rainwater infiltration model, and it is appropriate for both models to work and (2) between SRF and local seismicity within an epicenter distance of 50 km from the station.
How to cite: Hattori, K., Nemoto, K., Kojina, H., Kitade, A., kaneko, S., Yoshino, C., Mogi, T., Konishi, T., and Ouzounov, D.: Multi-channel singular spectrum analysis of soil radon concentration, Japan: Relationship between soil radon flux and precipitation and the local seismic activity, EGU General Assembly 2022, Vienna, Austria, 23–27 May 2022, EGU22-12349, https://doi.org/10.5194/egusphere-egu22-12349, 2022.
EGU22-748 | Presentations | NH3.5
Insights on factors controlling rockslope failure from pre-event crackingSophie Lagarde, Michael Dietze, Conny Hammer, Martin Zeckra, Anne Voigtländer, Luc Illien, Anne Schöpa, Jacob Hirschberg, Niels Hovius, and Jens M. Turowski
In order to reduce the societal impact of mass-wasting events, we need observations to investigate the factors that control slope failure, such as the state of crack propagation along a failure plane. However, usually the failure plane is not accessible in-situ. Hence, cracks have to be monitored indirectly, for example using seismic methods.
We analysed the data from a seismometer array in the Illgraben catchment, Switzerland, that had registered a series of crack propagation and mass-wasting events, leading to a main event that happened on 2 January 2013. We used a state-of-the-art machine learning technique based on hidden Markov models to detect and classify the seismic signals of crack events. We obtained the temporal evolution of three signal types: (1) single crack signal, (2) rock avalanche and (3) rockfall activity due to debris remobilization. The temporal evolution of the number of cracks showed a linear trend in the weeks prior to the main mass-wasting event and, in the hours preceding the main event, a sigmoidal exponential growth. Using these observations, we propose a mechanistic model to describe the rupture of the failure plane. The model considers the internal parameter of the total crack boundary length as the primary control on failure plane evolution, in addition to the previously suggested crack propagation velocity control parameter. According to this model, internal parameters appear to be the dominant control for the failure plane growth at a slope scale.
How to cite: Lagarde, S., Dietze, M., Hammer, C., Zeckra, M., Voigtländer, A., Illien, L., Schöpa, A., Hirschberg, J., Hovius, N., and Turowski, J. M.: Insights on factors controlling rockslope failure from pre-event cracking, EGU General Assembly 2022, Vienna, Austria, 23–27 May 2022, EGU22-748, https://doi.org/10.5194/egusphere-egu22-748, 2022.
EGU22-1718 | Presentations | NH3.5
What causes transient deformations in the Åknes landslide, Norway?Andreas Aspaas, Pascal Lacroix, Lene Kristensen, Bernd Etzelmüller, and François Renard
Slow creeping landslides move at rates of millimeters to several meters per year. They can cause extensive damage to infrastructure and pose a major threat to human lives if failing catastrophically. Landslides can progressively weaken over time by rock mass damage processes that may occur by constant slow creep or sudden transient slips. Eventually, damage can lead to strain localization along the basal shear plane and catastrophic failure of the landslide. When observed, transient slip events, also called creep bursts, may induce short-term loading and hence can control landslide stability. These creep bursts correspond to short periods that can last several days where the displacement of a landslide accelerates and then decelerates. Here, we compiled and analyzed extensive multiphysics data series of the Åknes landslide, Norway. This landslide is moving at a slow rate of 6 cm per year and could generate a large tsunami wave in a fjord if it would rupture catastrophically. Based on the time series of an array of eight seismometers, five extensometers, seven borehole inclinometers and piezometer strings, and ten continuous GPS stations sampled with time resolutions down to 5 minutes over several years, we detected creep bursts in this landslide. These events interact with a distinct creep trend related to seasonal variations of rainfall and snowmelt. We analyze the creep bursts in regards to micro-earthquake activity and water pressure levels, to study their origin.
How to cite: Aspaas, A., Lacroix, P., Kristensen, L., Etzelmüller, B., and Renard, F.: What causes transient deformations in the Åknes landslide, Norway?, EGU General Assembly 2022, Vienna, Austria, 23–27 May 2022, EGU22-1718, https://doi.org/10.5194/egusphere-egu22-1718, 2022.
Please decide on your access
Please use the buttons below to download the presentation materials or to visit the external website where the presentation is linked. Regarding the external link, please note that Copernicus Meetings cannot accept any liability for the content and the website you will visit.
Forward to presentation link
You are going to open an external link to the presentation as indicated by the authors. Copernicus Meetings cannot accept any liability for the content and the website you will visit.
We are sorry, but presentations are only available for users who registered for the conference. Thank you.

EGU22-1866 | Presentations | NH3.5
Spatial rockfall susceptibility prediction from rockwall surface classificationAlexander R. Beer, Nikolaus Krumrein, Sebastian G. Mutz, Gregor M. Rink, and Todd A. Ehlers
Rockfall both is a major process in shaping steep topography and a hazard in mountainous regions. Besides increasing thread due to thawing permafrost-stabilization in high-elevation areas, there are abundant permafrost-free over-steepened rockwalls releasing rockfall due to other triggers. General rockfall event susceptibility is addressed to frost cracking, earthquake shacking and hydrologic pressure in the walls, and to geotechnical rock properties. Spatial rockwall surface surveys or scans (delivering 3D point clouds) have been used to both deduce rock fracture patterns and to measure individual rockfall events from comparing subsequent scans. Though, the actually measured rockwall topography data has rarely been used as a general predictor of rockfall susceptibility against the background of observed events.
In this study, we use a series of dm-resolved annual (2014 to 2020) terrestrial laser scan surveys along 5km2 of limestone cliffs in the Lauterbrunnen Valley, Switzerland. The annual scan data were hand-cut to remove vegetation and fringes, and then referenced to detect subsequent topographic change in the direction of the wall. From the change-detection point clouds individual rockfall event volumes were detected from cluster and filtering analyses. One surveyed rockwall section of 2014 was used as training data for our Bayesian classification model of rockfall susceptibility, while the adjacent remaining section served for model validation. We rasterized their 3D data points and calculated several surface parameters per cell, including roughness, topography, mean distances for the three main fracture systems, fracture density, local dip, percent of overhang area, normal vector change rate (called edge) and percentage of overhang area. For various parameter sets and different cell sizes (32m2, 52m2, 102m2, 152m2, 252m2, and 402m2), we trained Naïve-Bayes-Classifier models. These were then used to predict rockfall susceptibility per cell, based on our observations of surface parameters, and assessed using Kullback-Leibler Divergence analysis and the misclassification cost score.
Results indicate the overall best model (accounting for the parameters roughness, edge, topography and overhang area) and for the lowest cell size (32m2) could predict rockfall cells with a probability of 0.73 (against a mean of 0.3 for all cells). Predictions on another rockwall section with observed rockfall, located on the opposite side of the valley, verified the model’s applicability by both comparable probabilities (0.6 vs 0.25) and visual surveys on overhangs. We find our approach could reliably extend this spatial rockfall susceptibility classification to all Lauterbrunnen rockwalls. The classification model generally identified overhang areas and fractured zones as high rockfall risks, matching the general insight of these zones to be of major susceptibility. Interestingly, our method is based only on orientation-independent variables that are directly calculated from the 3D point cloud. Thus, it should be principally transferable to other sites of fractured limestone walls. Specifically, there is no need to determine fracture sets from the point cloud as is generally done for susceptibility studies, since we account for topography that would anyway be used to calculate fracture planes (facets). Hence, this method provides a simple means to predict spatial rockfall susceptibility, applicable for both hazard mapping and landscape evolution studies.
How to cite: Beer, A. R., Krumrein, N., Mutz, S. G., Rink, G. M., and Ehlers, T. A.: Spatial rockfall susceptibility prediction from rockwall surface classification, EGU General Assembly 2022, Vienna, Austria, 23–27 May 2022, EGU22-1866, https://doi.org/10.5194/egusphere-egu22-1866, 2022.
EGU22-2623 | Presentations | NH3.5
Detection of rockfall activity due to rock freezing and thawing by electronic geotechnical sensors in SloveniaMateja Jemec Auflič, Ela Šegina, Tina Peternel, Matija Zupan, and Andrej Vihtelič
Rockfalls are caused by preparatory processes (weathering and crack propagation) that gradually degrade bedrock and by triggering g processes (freeze-thaw activity, precipitation events, earthquakes, snow avalanches, animals, or anthropogenic activities) that eventually release a rock block. Both processes are controlled by several factors representing the internal (geology), external (meteorology), and surface and near-surface conditions (topography, vegetation, snow cover, thermal conditions, chemical weathering, and hydrology) of the bedrock. In this paper, electronic geotechnical monitoring is developed to detect the rockfall activity due to rock freezing and thawing on two separate steep cliffs composed of igneous and carbonate rocks in the eastern part of Slovenia. The monitoring programme includes automatic recordings of rock temperatures and meteorological influencing factors (air temperature, humidity, and precipitation), tiltmeters, kit for measuring rock stress and deformability, laser distance meters, and crackmeters. During the 2020 field investigation, cracks and discontinuities were mapped and Rock Mass Rating (RMR) was estimated. The Hoek-Brown Geological Strength Index was determined to qualitatively assess surface conditions in inaccessible areas using visual assessments of tectonic ruptured walls. We will present the first preliminary results of the parameters monitored for 10 months, which will help interpret rockfall activity and identify freeze-thaw cycles.
Acknowledgement: The research was funded by the Slovenian Research Agency (Research project J1-3024). The electronic geotechnical sensors were founded by Project »Development of research infrastructure for the international competitiveness of the Slovenian RRI Space – RI-SI-EPOS« The operation is co-financed by the Republic of Slovenia, Ministry of Education, Science and Sport and the European Union from the European Regional Development Fund.
How to cite: Jemec Auflič, M., Šegina, E., Peternel, T., Zupan, M., and Vihtelič, A.: Detection of rockfall activity due to rock freezing and thawing by electronic geotechnical sensors in Slovenia, EGU General Assembly 2022, Vienna, Austria, 23–27 May 2022, EGU22-2623, https://doi.org/10.5194/egusphere-egu22-2623, 2022.
EGU22-2810 | Presentations | NH3.5
Large rock avalanches into a glacial lake(s): a new chapter of the Patagonian Ice Sheet storyTomáš Pánek, Michal Břežný, Elisabeth Schönfeldt, Veronika Kapustová, Diego Winocur, and Rachel Smedley
Although ice retreat is widely considered to be an important factor in landslide origin, many links between deglaciation and slope instabilities are yet to be discovered. Here we focus on the origin and chronology of an exceptionally large landslides situated along the eastern margin of the former Patagonian Ice Sheet (PIS). Accumulations of the largest rock avalanches in the former PIS territory are concentrated in the Lago Pueyrredón valley at the eastern foothills of the Patagonian Andes in Argentina. Long-runout landslides have formed along the rims of sedimentary and volcanic mesetas, but also on the slopes of moraines from the Last Glacial Maximum. At least two rock avalanches have volumes greater than 1 km3 and many other landslide accumulations have volumes in the order of tens to hundreds of million m3. Using cross-cutting relationships with glacial and lacustrine sediments and using OSL and 14C dating, we found that the largest volume of landslides occurred between ~17 and ~11 ka BP. This period coincides with a phase of rapid PIS retreat, the greatest intensity of glacial isostatic uplift, and a fast dropping of the glacial lakes along the foothills of the Patagonian Andes. The position of paleoshorelines in the landslide bodies and, in many places, the presence of folded and thrusted lacustrine sediments at the contact with rock avalanche deposits indicate that the landslides collapsed directly into the glacial lake. Although landslides along the former glacial lobe of Lago Pueyrredón continue today, they are at least an order of magnitude smaller than the rock and debris avalanches that occurred before the drainage of the glacial lake around 10-11 ka BP. Numerical modeling results indicate that large postglacial landslides may have been triggered by a combination of rapid sequential glacial lake drawdowns and seismicity due to glacial isostatic adjustment. We conclude that in addition to direct links such as glacial oversteepening, debuttressing and permafrost degradation, the retreat of ice sheets and the subsequent formation of transient large glacial lakes can fundamentally alter slope stability, especially if the slopes are built by weak sedimentary and volcanic rocks.
How to cite: Pánek, T., Břežný, M., Schönfeldt, E., Kapustová, V., Winocur, D., and Smedley, R.: Large rock avalanches into a glacial lake(s): a new chapter of the Patagonian Ice Sheet story, EGU General Assembly 2022, Vienna, Austria, 23–27 May 2022, EGU22-2810, https://doi.org/10.5194/egusphere-egu22-2810, 2022.
EGU22-2954 | Presentations | NH3.5
How does anisotropy control rock slope deformation? A discrete element modelling investigationMarius L. Huber, Luc Scholtès, and Jérôme Lavé
Deep-seated failures of rock slopes are partly controlled by structural, lithological and topographical factors. Among structural factors, layering, schistosity and foliation in rock material, which could be described as inherent anisotropy of the material, affect initiation and evolution of deep-seated rock slope deformation, especially in slow moving landslides.
In order to document such an influence of material anisotropy on slope stability, we carry out a parametric study using discrete element modelling (DEM). After a validation exercise for fully isotropic material, where we compare our numerical approach to an analytical slope stability solution, we introduce anisotropy (transverse isotropy) in our DEM model by inserting preferentially oriented and weakened bonds between discrete elements (weakness plane) to simulate two typical transverse isotropic lithologies, claystone and gneiss respectively. Considering these two lithologies, we then explore the influence of the weakness plane’s orientation with respect to the slope angle for both ridge and valley geometries.
We show that certain orientations of the weakness plane relative to the topographic slope favour deep-seated deformation. We also observe significant disparities in failure initiation, failure surface localisation, and mobilized volume depending on the weakness plane orientation. For instance, most unstable slopes occur when the weakness plane rises 10° to 30° less than the hillslope angle. These instabilities are associated with well-localized deformation at depth that when intersecting the surface mimic some of the morphological features (such as counter-slope scarps) that are commonly described along mountain ridges in association with slow-moving and deep-seated rock slope failures.
Our results help explain the appearance or absence of deep-seated failure in mountainous areas and allow to better assess slope failure hazard induced by anisotropic rock strength.
How to cite: Huber, M. L., Scholtès, L., and Lavé, J.: How does anisotropy control rock slope deformation? A discrete element modelling investigation, EGU General Assembly 2022, Vienna, Austria, 23–27 May 2022, EGU22-2954, https://doi.org/10.5194/egusphere-egu22-2954, 2022.
EGU22-3023 | Presentations | NH3.5
Rock slope dynamics in flysch formation under cold climate (part 1) : rock cracking and failure mechanismFrancis Gauthier, Tom Birien, and Francis Meloche
Rockfalls are major natural hazards for road users and infrastructures in northern Gaspésie (Eastern Canada). In the last 30 years, more than 17 500 rockfalls have reached the two major road servicing the area. Rockfalls come from 10 to 100 m high flysch rockwall conducive to differential weathering. The retreat and settlement of weak rock strata (shale, siltstone) causes the gradual cantilevering of stronger rock strata (sandstone, greywacke), contributing to the development of tension cracks. The block, separated from the cliff, will eventually slide or topple on the eroding rock strata. These dynamics have been observed, but rarely studied with the objective of 1) determining the mechanical stresses and weathering conditions that promote rock cracking and 2) identifying the geometric conditions that control the final failure mode. We use the cantilever beam theory to model critical cantilever length (block size) and rock tensile strength. A frost cracking model (Rempel et al., 2016) was then used to explain the overestimation of the critical cantilever length and to verify whether the development of microfractures caused by frost damage can explain the decrease of the rock tensile strength over time. The results show that the areas of frost damage concentration correspond to those of maximum stress in the overhanging blocks. In order to identify the type of failure of these blocks, tests using a tilting table were carried out in laboratory. 405 tests were performed on 10 blocks characterized by different roughness coefficients and geometric ratios (height / length ratio, overhang length / total length of the block). The results, validated on natural blocks in the field, were used to identify the geometric conditions for stability, sliding, and toppling failure of overhanging block on an inclined plane. Such stability criteria could support the development of rock instability detection algorithm using high resolution 3D model.
How to cite: Gauthier, F., Birien, T., and Meloche, F.: Rock slope dynamics in flysch formation under cold climate (part 1) : rock cracking and failure mechanism, EGU General Assembly 2022, Vienna, Austria, 23–27 May 2022, EGU22-3023, https://doi.org/10.5194/egusphere-egu22-3023, 2022.
EGU22-3079 | Presentations | NH3.5
Rock slope dynamics in flysch formation under cold climate (part 3) : rockfall forecastingJacob Laliberté, Francis Gauthier, and Birien Tom
Rockfalls are major natural hazards for road users and infrastructures in northern Gaspésie (Eastern Canada) where nearly 15 kilometers of road runs along 10 to 100 m high flysch rockwall. The Ministère des Transports du Québec (MTQ) has recorded more than 17 500 rockfalls that have reached the roadway since 1987, which represents a nearly permanent danger for users. In the late 90s, protective berms were erected to reduce the number of rocks reaching the roadway. Despite the efficiency of these infrastructures, more than a hundred events are still recorded each year. Based on previous studies showing that rock instabilities in this type of geology is strongly correlated with meteorological events, we used different machine learning methods (logistic regression, classification tree, random forest, neural network) to design the best operational rockfall prediction model. Three event variables based on different rock fall frequency and magnitude thresholds were created. Nearly one hundred weather variables were used to explain and predict events. Preliminary results show that thawing degree-days is one of the most effective variables explaining the occurrence of winter and spring rockfall events. In summer, rainfall intensity is the most potential explanatory variable. Finally, fall events appear to be more responsive to rain events and freeze-thaw cycles. In order to optimize the percentage of predicted events and reduce the false alarm ratio, it remains important to evaluate the impact of each parameter on the performance of the models. These models can be used operationally as decision support tools to predict days with high event probability.
How to cite: Laliberté, J., Gauthier, F., and Tom, B.: Rock slope dynamics in flysch formation under cold climate (part 3) : rockfall forecasting, EGU General Assembly 2022, Vienna, Austria, 23–27 May 2022, EGU22-3079, https://doi.org/10.5194/egusphere-egu22-3079, 2022.
EGU22-3128 | Presentations | NH3.5
Weathering, rock type, bedrock incision and landslides in a tropical environment: the Ruzizi gorge in the Kivu Rift, AfricaToussaint Mugaruka Bibentyo, Olivier Dewitte, Josué Mugisho Bachinyaga, Toussaint Mushamalirwa, Florias Mees, Charles Nzolang, and Stijn Dewaele
Tropical environments favour chemical weathering and regolith development. Weathering induces textural, mineralogical and chemical changes in rocks, modifying their strength and thus affecting slope stability. Degree of weathering is, however, not only a function of climatic conditions, but is also influenced by e.g. bedrock composition and structure, exposure length and intensity, and slope angle. To investigate the role of weathering and rock type on landslide occurrence, we focus on the Ruzizi Gorge in the Kivu Rift segment of the western branch of the East African Rift System. Stretching along the border between the DR Congo and Rwanda, development of this 40-km long bedrock river began about 10,000 years ago, rejuvenating the landscape at a very high rate, with rather invariant slope angles outside of the landslides. The gorge stretches across a region where two main types of rocks constitute the geological substrate, i.e. late Miocene to Pleistocene volcanic rocks and Mesoproterozoic metasedimentary rocks. The gorge is a hotspot of deep-seated landsides in the region, with slope failures of up to 2 km². For the present study, we sampled weathering profiles developed on both mentioned rock types, in each case with sampling points within and outside the landslides as well as within and outside the rejuvenated landscape. The chemical composition of rock and regolith samples was determined by Inductively Coupled Plasma–Optical Emission Spectroscopy (ICP–OES) analysis, and their mineralogical composition by X-Ray Diffraction (XRD) analysis and thin section observations. Geotechnical tests were used to determine mechanical properties. Overall, we observe that lithological aspects alone control regolith characteristics, and that slope angle and exposure to landscape rejuvenation hence play no significant role. In areas with volcanic rock substrate, where the largest, mostly slide-type, landslides develop, stratified weathering profiles are observed. These profiles show a greater weathering depth than those over metasedimentary rocks, where flow- and avalanche-type landslides are more common. The regolith derived from volcanic rocks has higher clay content, greater plasticity and stronger cohesion than the sandy to silty weathering material that overlies the metasedimentary rocks. These preliminary results show that weathering and rock type are more important than landscape rejuvenation in controlling the type of deep-seated landslides.
How to cite: Mugaruka Bibentyo, T., Dewitte, O., Mugisho Bachinyaga, J., Mushamalirwa, T., Mees, F., Nzolang, C., and Dewaele, S.: Weathering, rock type, bedrock incision and landslides in a tropical environment: the Ruzizi gorge in the Kivu Rift, Africa, EGU General Assembly 2022, Vienna, Austria, 23–27 May 2022, EGU22-3128, https://doi.org/10.5194/egusphere-egu22-3128, 2022.
EGU22-3207 | Presentations | NH3.5
Rock slope dynamics in flysch formation under cold climate (part 2): rock deformations and rockfall triggering factorsTom Birien and Francis Gauthier
Since 1987, more than 17 500 rockfalls reaching a 70 km stretch of road have been reported by the Québec Ministry of Transport (MTQ) in northern Gaspésie. This natural hazard represents a nearly permanent danger for users. Earthquake, rainfall and freeze-thaw cycles are considered to be the main rockfall triggering factors. Although these events are well correlated with rockfall occurrences, it is not clear how they affect the failure mechanism. The first step in managing the risk rockfalls pose is to better understand the pre-failure processes that contribute to their development. The second step is to improve our ability to predict and anticipate rockfalls. This study aims to better understand the influence of climate-dependent variables on (1) the mechanical deformations of stratified sedimentary rock and (2) the climatic conditions conducive to rockfalls. Meteorological instruments including a 550 cm thermistor strings have been installed directly on a vertical rockwall located in northern Gaspésie. Mechanical deformations of the flysch sequence composed of sandstone, siltstone and shale was monitored using crack-meters. In addition, rockwalls were scanned with a terrestrial laser scanner (TLS) during specific pre-targeted meteorological conditions. Over a period of 18 months, 17 LiDAR surveys have allowed to identify 1287 rockfalls with a magnitude above 0.005 m³ on a scanned surface of 12 056 m². Irreversible deformations are mainly induced by rainfall and snowmelt (shrink-swell process in porous and clayey rock and/or hydrostatic pressure variations in discontinuities), by freeze-thaw cycles and to a lesser extent, by large thermal variations. Gradual settling measured in the siltstone strata causes destabilization of sandstone strata and the eventual fall of sandstone blocks. In winter, rockfall frequency is 12 times higher during a superficial thaw than during a cold period in which temperature remains below 0°C. In summer, rockfall frequency is 22 times higher during a heavy rainfall event than during a period mainly dry. Superficial freeze-thaw cycle (< 50 cm) causes mostly a high frequency of small magnitude events while deeper spring thaw (> 100 cm) results in a high frequency of large magnitude events. Influence of meteorological conditions on mechanical deformations and on rockfall frequency and magnitude is crucial in order to improve risk management since large magnitude events represent higher potential hazards. This study provides a classification of meteorological conditions based on their ability to trigger rockfalls of different magnitudes which could be used to implement an adequate preventive risk management.
How to cite: Birien, T. and Gauthier, F.: Rock slope dynamics in flysch formation under cold climate (part 2): rock deformations and rockfall triggering factors, EGU General Assembly 2022, Vienna, Austria, 23–27 May 2022, EGU22-3207, https://doi.org/10.5194/egusphere-egu22-3207, 2022.
EGU22-3456 | Presentations | NH3.5
Characterization of a fractured rock mass using Geological Strength Index (GSI): A Discrete Fracture Network (DFN) and Machine learning (ML) approachJaspreet Singh, Sarada Prasad Pradhan, and Mahendra Singh
The rock mass is strongly influenced by the presence of discontinuities and their role is also strongly regarded in rock mass characterization. Different traditional methods were developed for accessing the rock mass condition for safely designing engineering projects such as slopes, tunnels, foundations, etc. The progress in computational techniques has led to a significant understanding of rock mass related problems. Among them, the discrete fracture network (DFN) technique based on statistical distribution gains significant importance in examining the rock mass. The applicability of remote sensing techniques such as photogrammetry has made it easy to collect the essential data, which otherwise was difficult to acquire using scanline survey or window mapping. The study aims application of DFN in estimating block volume distribution and Rock Quality Designation (RQD) for finding the Geological strength index (GSI) of the rock mass. The results also compare the aggregate and disaggregate DFN with GSI estimated using traditional methods in the field. Along with the estimation of GSI using the existing chart method, the work also proposed the applicability of machine learning (ML) in predicting the GSI value. It is easy and handy to use a chart but becomes time-consuming when dealing with a larger dataset. We have developed a ML inbuilt python-based GUI tool to estimate the GSI value from block volume and joint condition parameters quickly.
How to cite: Singh, J., Pradhan, S. P., and Singh, M.: Characterization of a fractured rock mass using Geological Strength Index (GSI): A Discrete Fracture Network (DFN) and Machine learning (ML) approach, EGU General Assembly 2022, Vienna, Austria, 23–27 May 2022, EGU22-3456, https://doi.org/10.5194/egusphere-egu22-3456, 2022.
EGU22-4199 | Presentations | NH3.5
Large landslides cluster along Patagonian Ice Sheet marginMichal Břežný, Tomáš Pánek, Stephan Harrison, Elisabeth Schönfeldt, and Diego Winocur
Deglaciation of mountain ranges promotes landslides of various scales and types, and many of them may present a major hazard. Traditionally, it is assumed that landslides are concentrated in the steepest, wettest, and most tectonically active parts of the orogens, where glaciers reached their greatest thickness. Based on our mapping of large landslides (>1km2) over an extensively large area of Southern Patagonia (~305,000 km²), we show that the distribution of landslides can have the opposite trend. The largest landslides within the limits of the former Patagonian Ice Sheet (PIS) cluster along its eastern margins occupying lower, tectonically less active, and arid part of the Patagonian Andes. In contrast to the heavily glaciated, highest elevations of the mountain range, the peripheral regions have been glaciated only episodically. However, a combination of glaciation, weak volcanic and sedimentary rocks, sufficient relief, and presence of large glacial lakes in the past, created favourable conditions for huge number of large landslides along eastern margin of PIS. We explain the scarcity of large landslides in the highest parts of the PIS by presence of strong granitic rocks and long-term glacial modification, that adjusted topography for efficient ice discharge. Our model is applicable only for large bedrock landslides, not for shallow slides and rock falls, which are abundant in the highest and western part of the Andes.
How to cite: Břežný, M., Pánek, T., Harrison, S., Schönfeldt, E., and Winocur, D.: Large landslides cluster along Patagonian Ice Sheet margin, EGU General Assembly 2022, Vienna, Austria, 23–27 May 2022, EGU22-4199, https://doi.org/10.5194/egusphere-egu22-4199, 2022.
EGU22-4554 | Presentations | NH3.5
Evidence of volcanic debris avalanche propagation dynamics from sedimentological analysis of the Tenteniguada and Abona deposits, Canary IslandsSymeon Makris, Matteo Roverato, Alejandro Lomoschitz, Paul Cole, and Irene Manzella
Debris avalanches (DA) are large landslide events characterised by long runouts and high mobility that poses a great hazard to communities close to volcanoes. Although many theories have been proposed to explain the excessive runout phenomenon, the mechanisms enabling the mobility remain unresolved and poorly constrained. As a result, it is still challenging for models and theoretical concepts to encompass DA deposit field observations.
DA deposits are complex; however, detailed study of their sedimentary architecture can provide information regarding their propagation processes. In this study, the deposits of two DAs in the Canary Islands: Tenteniguada DA, located on the east of Gran Canaria; and Abona DA on the southeast of Tenerife have been examined. Although they are located in nearby volcanic islands they occurred in different environments with different triggering processes, scale, material and their deposits suggest different propagation rheology. A detailed field study of the deposits was carried out in September 2021, mapping their facies and feature distribution and sedimentology. Structure from motion photogrammetry methodology has been used to generate high accuracy 3D models of outcrops and sample windows to quantify facies distribution. The data collected allow for evaluation of the effects of material properties, substrate and its geometry, and to assess aspects of the dynamics of the DAs. Therefore, it was possible to generate conceptual models for the transport and emplacement mechanisms of the two events corresponding to the observations and to relate them to the two debris avalanche distinctive characteristics by comparison.
In the Tenteniguada DA deposit, the degree of disaggregation is low, with large portions of the original edifice preserved along with their original stratigraphy, although displaced relative to each other by brittle deformation. In contrast, Abona DA is much more disaggregated. Monolithological blocks are microfractured and cataclased, and original stratigraphy is not preserved. There is no evidence of brittle deformation. The highly comminuted material has been elongated in a fluidised spreading flow, achieving a long runout on an erodible pumice substrate. Conversely, the Tenteniguada DA did not fully transition from a slide to a flow and has not generated a long runout while propagating in an active fluvial ravine. These findings suggest that the behaviour and the distribution of stresses was very different during propagation, owing to the properties and volume of the material in the flow and potentially the substrate properties and triggering mechanisms.
The present study highlights how the field examination of sedimentological, morphological, and structural features is vital in fully understanding DA propagation and emplacement mechanisms.
How to cite: Makris, S., Roverato, M., Lomoschitz, A., Cole, P., and Manzella, I.: Evidence of volcanic debris avalanche propagation dynamics from sedimentological analysis of the Tenteniguada and Abona deposits, Canary Islands, EGU General Assembly 2022, Vienna, Austria, 23–27 May 2022, EGU22-4554, https://doi.org/10.5194/egusphere-egu22-4554, 2022.
EGU22-4641 | Presentations | NH3.5
Long term stability of an abandoned construction pit in Eocene flysch rock mass: case study of Bracka street construction site (Split, Croatia)Goran Vlastelica, Ana Duhović, and Marija Relota
Excavations in soft rocks usually have to be performed by blasting with explosives or with heavy pneumatic hammers. However, in a certain period after excavation, their physical and mechanical properties begin to change to a level where even manual excavation can be used. These changes can be significant during the building design life, where the initial design solution of the slope cut may prove inappropriate, sometimes resulting in collapse. In this context, it is necessary to define the causes of changes in the soft rock physical and mechanical properties, and determine all the necessary parameters (primarily strength parameters, but also all others relevant to describe the change in rock properties over time) in all phases of expected change during construction or other applications (such as use of slope area, in case of abandoning the site in certain time period, etc.).
Furthermore, when preparing project documentation for construction, in the part where the calculations of the global stability of the building on the slope are performed, the possibility of significant changes in the shape of the slope during the structure/building design life are usually neglected. Therefore, this paper also presents the Fisher Lehmann model of the change of slope geometry during the period of construction use, and explains the influences of weathering factors on parameters of the soft rock over time by using laboratory simulation of weathering.
Combined changing the geometry of the slope and the properties of the rock can have a negative impact on the safety of the structure, which is explained and shown through an example of an abandoned construction pit at Bračka Street in Split, where the stability of neighboring residential houses is endangered. By using appropriate mathematical models of the slope morphology change, results of long term slope monitoring by TLS and appropriate software for slope stability analysis (Slide 2, RocScience), the time span in which the instability can occur for Bračka Street case study is determined for multiple possible future intervention scenarios.
How to cite: Vlastelica, G., Duhović, A., and Relota, M.: Long term stability of an abandoned construction pit in Eocene flysch rock mass: case study of Bracka street construction site (Split, Croatia), EGU General Assembly 2022, Vienna, Austria, 23–27 May 2022, EGU22-4641, https://doi.org/10.5194/egusphere-egu22-4641, 2022.
EGU22-5318 | Presentations | NH3.5
Spatial/temporal distribution of rock slope failures along the trans-Himalaya highway between Gangtok and Yumthang (Sikkim, India)Reginald Hermanns, Ivanna Penna, Vikram Gupta, Henriette Linge, Rajinder Bhasin, John Dehls, Odd Andre Morken, and Aniruddha Sengupta
The ca. 80 km long trans-Himalayan highway between Gangtok and Yumthang has experienced at least three large rock slope failures (RSF) within the past 40 years and tens of smaller RSF related to the 2011 Sikkim earthquake. More than 30 conspicuous boulder deposits suggest that similar failures happened in the past. Since the largest of these deposits are located within the shallowest sections of otherwise 60 – 75° steep slopes, they are often the location of settlements. We have used Terrestrial Cosmogenic Nuclide (TCN) dating to understand better where and how often these events are likely to occur.
The trans-Himalayan highway connects the Lesser Himalaya, with a tropical to subtropical climate, with the cold-temperate climate in the Higher Himalaya north of the Main Central Thrust (MCT). This highway also crosses the orographic barrier, with rainfalls exceeding 3000 mm/yr in the south and less than 500 mm/yr in the north. On September 10th, 1983, a large RSF was triggered by “exceptional” rainfall and impacted the settlement of Manul, with an estimated life loss of 200 persons. Today, the deposit is covered by a dense tropical forest 30-m high that restricts detailed analysis. However, boulder size and boulder density on the surface suggest that it was a rock avalanche.
The second reported RSF is a rock avalanche with a volume of 12 million m3 that occurred close to the village of Yumthang on March 11th, 2015. This deposit overlies two generations of prehistoric rock-avalanche deposits. No trigger was reported.
The last reported RSF involved a volume of 8.7 million m3, occurred on August 13th, 2016 at Dzongu, NW of Mangan. While no trigger for the collapse was reported, satellite footage indicates at least ten years of pre-failure rock-slope deformation. The deposit has the typical carapace of a rock avalanche, but videos posted on social media instead suggest that it was a collapse that took place over several hours.
RSF deposits are found in similar numbers in both the Higher and Lesser Himalaya, with the highest concentration in the vicinity of the MCT and a second cluster close to the village of Yumthang. We sampled ten of the deposits for TCN dating, including two of the historic events. Both historic events returned zero ages. The two older deposits overlain by the 2015 Yumthang rock avalanche returned equally young ages, suggesting multiple recent events at that site within a short time. The zero ages of both historical events suggest that inheritance of nuclides prior to failure in the samples can be ruled out. The ages of the remaining deposits range from 0.2 to ~12 kyr. Several deposits have bimodal age distributions. Others have three different ages in different sectors of the deposit. These results show that multiple RSF similar to the Yumthang site often can affect the same slope sector, leaving deposits on the same slope sections. Thus, the 30 identified deposits by far are the lower limit of RSF failures in the study area and that the threat of RSF is high.
How to cite: Hermanns, R., Penna, I., Gupta, V., Linge, H., Bhasin, R., Dehls, J., Morken, O. A., and Sengupta, A.: Spatial/temporal distribution of rock slope failures along the trans-Himalaya highway between Gangtok and Yumthang (Sikkim, India), EGU General Assembly 2022, Vienna, Austria, 23–27 May 2022, EGU22-5318, https://doi.org/10.5194/egusphere-egu22-5318, 2022.
EGU22-7249 | Presentations | NH3.5
Modelling Rockfall Source areas and hazard zoning along the Rhine-, Ahr- and Moselle-valleys in the Rhenish Massif, Rhineland-Palatinate, GermanyPhilip Süßer, Teemu Hagge-Kubat, Ansgar Wehinger, Michael Rogall, and Frieder Enzmann
Rockfall events, due to toppling or sliding rock slope failure are a common phenomenon within the Rhine-, Ahr- and Moselle-valley of the Rhenish Massif. Due to the dense traffic infrastructure, significant cases of damage with far-reaching economic and infrastructural consequences regularly occur in these areas. Therefore, there is a specific need for precautionary risk analysis in order to prevent further damage and to implement preventive measures. The research approach presented here aims to identify rockfall endangered zones for adjacent infrastructure in the valleys. It is assumed, that the main reason for these frequent occurrences are the high number of exposed rock faces and a complex fabric of intersecting foliation-, fracture- and cleavage- networks and faults. By using an index, calculated from the slope and real-surface area of high-definition LIDAR based DEM it is possible to extract areas with exposed rock faces as possible sources for rockfall modelling. To single out which parts of the outcrop are more likely to fail, we compute the aspect of natural occurring outcrops, characteristic of fabric orientations along which failure preferably takes place and pinpoint locations with highly varying directions. These intersection points, representing weakened areas within the outcrops serve as sources for our rock fall models using the Gravitational-Process-Path-Model by Wichmann (2017). Through the precise identification of the rockfall source areas and further input data like vegetation and relief energy numerous cases in the valley were modelled. By intersecting with real infrastructure data, it is possible to carry out risk assessments of specific sections of roads and railway lines. Validation using the mass movement database of the Rhineland-Palatinate Geological Survey and numerous ground checks show, that concrete rockfall events were plausibly simulated.
How to cite: Süßer, P., Hagge-Kubat, T., Wehinger, A., Rogall, M., and Enzmann, F.: Modelling Rockfall Source areas and hazard zoning along the Rhine-, Ahr- and Moselle-valleys in the Rhenish Massif, Rhineland-Palatinate, Germany, EGU General Assembly 2022, Vienna, Austria, 23–27 May 2022, EGU22-7249, https://doi.org/10.5194/egusphere-egu22-7249, 2022.
Please decide on your access
Please use the buttons below to download the presentation materials or to visit the external website where the presentation is linked. Regarding the external link, please note that Copernicus Meetings cannot accept any liability for the content and the website you will visit.
Forward to presentation link
You are going to open an external link to the presentation as indicated by the authors. Copernicus Meetings cannot accept any liability for the content and the website you will visit.
We are sorry, but presentations are only available for users who registered for the conference. Thank you.
EGU22-7454 | Presentations | NH3.5
The Innonet project: understanding the capacity of flexible protection systems against rockfall in natural terrainHelene Hofmann, Manuel Eicher, Andreas Lanter, and Andrin Caviezel
In the last 30 years, rockfall barriers made of steel wire nets have become established worldwide as a protective solution, are meanwhile CE certified and the question inevitably arises as to the effect of natural impacts, i.e. impacts from boulders that strike the net at any point, possibly also rotating as they do so. In 2019 an Innosuisse-sponsored research project was granted to the WSL Institute for Snow and Avalanche Research SLF together with the industry partner Geobrugg, for testing fully instrumented rockfall barriers, in natural terrain in the Swiss Alps, aiming at finding improvements to the capacity of a rockfall barrier outside of the certification standards. The awareness that the capacity of a rockfall barrier is different depending on the impact location, and how to deal with the so-called remaining capacity of rockfall barriers, in load cases outside the approval tests, differ worldwide. In some countries, specialized designers are aware of this fact and solve the problem by over-dimensioning the rockfall barriers to ensure the availability of residual capacity outside of the middle field. In other countries however, authorities and/or designers assume that a 1000kJ rockfall system absorbs this energy even in marginal areas or in case of an eccentric hit. Protective solutions are consequently not necessarily designed properly. This research project tries to assess the performance and the residual capacity of rockfall barriers, after being impacted by various load cases, to improve the current knowledge. Several field campaigns were conducted, in which rocks of different shapes and sizes are projected into the netting of the rockfall barrier and its structure (cables and posts). The barrier is equipped with sensors to measure the loading on different elements of the protection system. In addition, the test blocks (up to 3’200 kg) are also equipped with sensors that measure the rotation and the acceleration during the fall and on impact with the barrier. In combination with high-resolution drone recordings and video recordings from different viewing angles, the trajectories and velocities of the individual blocks can be reconstructed in detail, enabling further insights into the interaction of all parameters. The barrier was left in place since construction and is enduring its third winter without maintenance. A field survey (snow depth and density, loads on cables, posts, etc) was undertaken in the winters 19/20 and 20/21, and further surveys will take place this current winter. This contribution will present the evaluation of the rockfall test data. It allows an understanding of the remaining capacity of a barrier, the influence of rockfall rotation onto the protection system itself as well as the importance of the impact location. Forces measured in the system show a variation of up to 40% when compared to the standard testing results. The goal is then to assess if additional tests can be carried out to the standardized tests, to better prepare a rockfall barrier for the field.
How to cite: Hofmann, H., Eicher, M., Lanter, A., and Caviezel, A.: The Innonet project: understanding the capacity of flexible protection systems against rockfall in natural terrain, EGU General Assembly 2022, Vienna, Austria, 23–27 May 2022, EGU22-7454, https://doi.org/10.5194/egusphere-egu22-7454, 2022.
EGU22-8504 | Presentations | NH3.5
Rockfall triggering mechanism analyzed from video using optical flow techniqueChunwei Sun, Valérie Baumann Traine, Marc-Henri Derron, and Michel Jaboyedoff
This work presents an approach to identify the rockfall triggering mechanism from video employing Optical Flow Technique. The video was captured by phone camera on 3rd, October 2017 when the massive rockfall happened at a quarry in Le Locle Jura mountains, Switzerland. Time-series frames were extracted from the video and registered using SIFT (Scale-Invariant Feature Transform), kNN (k-nearest neighbor classification) and affine transformation algorithm, which efficiently eliminate the video jitters. After that, the transformation of pixels in the time-series image sequence and the correlation between adjacent frames are used to find the correspondence, so as to calculate the motion data of the object between adjacent frames by Optical Flow Technique. The instantaneous velocity of pixel movement of failure rock mass or debris on the video frames during rockfall dynamic behavior can be obtained. The basal failure surfaces and two main phases of the failure have been anlayzed for the rockfall triggering mechanism. The workflow proposed here can be applied in a slope disaster monitoring and early warning system to identify and track rockfall events effectively.
How to cite: Sun, C., Baumann Traine, V., Derron, M.-H., and Jaboyedoff, M.: Rockfall triggering mechanism analyzed from video using optical flow technique, EGU General Assembly 2022, Vienna, Austria, 23–27 May 2022, EGU22-8504, https://doi.org/10.5194/egusphere-egu22-8504, 2022.
EGU22-9134 | Presentations | NH3.5
Observations of slope movements in mountain landforms using permanent in-situ GNSS instrumentsJan Beutel and the PermaSense GNSS Team
Slope movements in mountain areas are abundant and diverse phenomena, with an extreme range in size and velocity, and constituted from different materials such as bedrock, debris, and ice. In the past two decades, many studies have observed accelerating trends in the surface velocities of these landforms, often attributed to global warming and its amplified impact on high mountains. Detailed data needed for quantitative analysis and modelling, however, remain scarce due to logistic and technical difficulties. In particular, state-of-the-art monitoring strategies of surface displacement in high-mountains rely either on geodetic terrestrial surveys or on remote sensing techniques. While these methods are beneficial for the establishment of long-term time series and distributed datasets of surface displacements, they lack high temporal resolution and are sensitive to data gaps. These characteristics limit their potential for underpinning detailed process understanding and natural hazard management procedures. By contrast, in-situ permanent instruments allow high temporal resolution without observation gaps, providing unprecedented information w.r.t. the processes at hand. Furthermore, continuous observations with short transmission delays are suitable for applications in real-time, essential for many aspects of natural hazard monitoring and early warning systems.
Here, we present a decadal dataset consisting of continuously acquired kinematic data obtained through in-situ global navigation satellite system (GNSS) instruments that have been designed and implemented in a large-scale multi field-site monitoring campaign across the Swiss Alps. The monitored landforms include rock glaciers, high-alpine steep bedrock as well as landslide sites, most of which are situated in permafrost areas. The dataset was acquired at 54 different stations between2304 and 4003 m a.s.l and comprises ~240’000 daily positions derived through double-difference GNSS post-processing. Apart from these, the dataset contains down-sampled and cleaned time series of weather station and inclinometer data as well as the full set of GNSS observables in RINEX format. Furthermore, the dataset is accompanied by tools for processing and data management in order to facilitate reuse, open alternative usage opportunities and support the life-long living data process with updates. To date, this dataset has seen numerous use cases in research as well as natural-hazard mitigation and adaptation measures. Some of those are presented in order to showcase the fidelity and versatility of the monitoring network.
How to cite: Beutel, J. and the PermaSense GNSS Team: Observations of slope movements in mountain landforms using permanent in-situ GNSS instruments, EGU General Assembly 2022, Vienna, Austria, 23–27 May 2022, EGU22-9134, https://doi.org/10.5194/egusphere-egu22-9134, 2022.
Please decide on your access
Please use the buttons below to download the presentation materials or to visit the external website where the presentation is linked. Regarding the external link, please note that Copernicus Meetings cannot accept any liability for the content and the website you will visit.
Forward to presentation link
You are going to open an external link to the presentation as indicated by the authors. Copernicus Meetings cannot accept any liability for the content and the website you will visit.
We are sorry, but presentations are only available for users who registered for the conference. Thank you.
EGU22-9344 | Presentations | NH3.5
Assessment of Rockfall Hazard and 3D Trajectography based on Slope and Structural Settings: Case Study in Les Fréaux, FranceTiggi Choanji, François Noël, Li Fei, Chunwei Sun, Charlotte Wolff, Marc-Henri Derron, Franck Bourrier, Michel Jaboyedoff, and Romain Gaucher
The case study is located in the municipality of Les Fréaux, France. The site consists of Cambrian-Ordovician of amphibolite and gneiss rock with complex structural geology that formed in mountainous and large valley with steep slopes and even overhanging rock walls. In this site, rockfall is a major hazard for access roads and houses.
To assess rockfall hazard in the vicinity of the elements at risk, LiDAR data have been analysed and field work done on site from 2020 to 2021. Rockfall source areas were identified directly on 3D point clouds (PC) based on two criteria, which are large slope angles and kinematic analysis from structural identification of fault, folds and joints. Based on these source areas, several 3D point cloud trajectory models were processed using the freeware stnParabel, for various block diameters (d1, d2, d3) in order to determine the propagation and the probability of reaching the settlements or roads.
Preliminary simulation of trajectories based on several method of simulations results showed some potential directions are reaching the road and also leading to settlements.
How to cite: Choanji, T., Noël, F., Fei, L., Sun, C., Wolff, C., Derron, M.-H., Bourrier, F., Jaboyedoff, M., and Gaucher, R.: Assessment of Rockfall Hazard and 3D Trajectography based on Slope and Structural Settings: Case Study in Les Fréaux, France, EGU General Assembly 2022, Vienna, Austria, 23–27 May 2022, EGU22-9344, https://doi.org/10.5194/egusphere-egu22-9344, 2022.
EGU22-9929 | Presentations | NH3.5
Preliminary analysis of potential daily cyclic movements on the surface of Brenva rockslide scar based on the GB-InSAR monitoring (Mont-Blanc massif, Aosta Valley, Italy)Li Fei, Charlotte Wolff, Davide Bertolo, Carlo Rivolta, Tiggi Choanji, Marc-Henri Derron, Michel Jaboyedoff, Fabrizio Troilo, Patrick Thuegaz, and Joëlle Hélène Vicari
With global warming, geological hazards such as rockfalls, rockslides and rock avalanches have increased in alpine areas recently. In many studies, this increase has been attributed to the redistribution of the slope stress field, fluctuations in the temperature field (surface layer thaws during summer), and changes in the seepage field (infiltration of snow and ice melting water), which are led by permafrost degradation and glacier retreat. On the other hand, it is necessary to assess the long-term effects of these changes on rock mass fatigue, which could lead to rock instability. The GB-InSAR technique can detect deformation in the mm range. It is ideal for monitoring small deformations caused by daily physical weathering or other factors in high mountains.
A GB-InSAR campaign was performed from 12 August 2020 to 19 October 2020 in the Brenva glacier basin to assess the displacement of the Brenva rockslide scar. We found a daily cycle of expansion and shrinkage on the scar surface during the summer after examining the movement of different control points along the line-of-sight (LOS). Consequently, we explored possible causes behind such displacement. In this case, we realized that the crest and trough of the displacement curve occurred at a certain period of each day. For instance, in the cases of control points 2, 7, and 8, most crests in the displacement curve occurred in the early morning of each day and the troughs in the late afternoon or evening of each day during 06 September and 13 September, with amplitudes of displacement around 0.15mm, 0.25mm, and 0.4mm, respectively. The preliminary correlation between air temperature and daily deformation shows that point 7 moves towards SAR as the air temperature increases, and away from SAR as the temperature decreases. This phenomenon means that such displacement could be caused by the daily changes in temperature (leading to thermal expansion and contraction of materials, and movement of ice in micro-macro cracks) in the rock mass and air.
However, a comprehensive analysis of the LOS displacement that consists of checking the raw data of GB-InSAR (i.e., radar signal comparison), setting more specific control points at locations with various dip directions, and clear correlation between meteorological data and displacement is undergoing to verify and explain such kind of displacement.
In conclusion, continuous daily physical weathering (behaving as cyclic movement) that led to rock mass fatigue probably exists on the surface of alpine slopes, and GB-InSAR could be an effective technique to detect such movement. Despite only slight daily displacement fluctuation on the surface, it could play a crucial role in the initiation of geo-disasters.
How to cite: Fei, L., Wolff, C., Bertolo, D., Rivolta, C., Choanji, T., Derron, M.-H., Jaboyedoff, M., Troilo, F., Thuegaz, P., and Vicari, J. H.: Preliminary analysis of potential daily cyclic movements on the surface of Brenva rockslide scar based on the GB-InSAR monitoring (Mont-Blanc massif, Aosta Valley, Italy), EGU General Assembly 2022, Vienna, Austria, 23–27 May 2022, EGU22-9929, https://doi.org/10.5194/egusphere-egu22-9929, 2022.
EGU22-10843 | Presentations | NH3.5
Primary structures of granite and following weathering schemes define landslide behavior in granite areas.Masahiro Chigira
Granite is distributed all over the world and one of the rock types that are very susceptible to various kinds of mass movements including rockfall, rock slide, debris slide and debris avalanche. For example in Japan, Hiroshima rainstorm disasters in 1999, 2014, and 2018, and southern Miyagi rainstorm disaster induced by typhoon 19 in 2019. This is because its special characteristics of formative processes and weathering behavior. The primary structures of granite have long been believed as orthogonal cooling joints since the pioneer work of Cloos (1921, 1922), but we found that a granite body has columnar joints near its roof using UAV and SfM. Whether granite has columnar joints or not leads to different mass movement types. Rock columns separated by columnar joints form high unstable rock towers or tors, which are susceptible to rockfalls. When rock columns are weathered under the ground, they form boulders surrounded by saprolite; when they are eroded to form hills they frequently fail during rainstorms and transform to debris avalanche or debris flow with high destructive potential because of large mass of boulders. Granite without columnar joints is not suitable for spheroidal weathering but is sheeted by unloading; sheeting forms dip slopes, on which rock slides occur. Some granite is micro-sheeted by unloading and micro-sheeted granite is weathered to form a loose soil layer beneath slope surfaces. Such soil layers are very prone to heavy rainfalls and frequently slide, transforming debris avalanches and debris flows.
Primary structures of granite and following weathering schemes thus define landslide behavior in granite areas.
How to cite: Chigira, M.: Primary structures of granite and following weathering schemes define landslide behavior in granite areas., EGU General Assembly 2022, Vienna, Austria, 23–27 May 2022, EGU22-10843, https://doi.org/10.5194/egusphere-egu22-10843, 2022.
EGU22-11107 | Presentations | NH3.5
Estimating rockfall release scenarios based on a straightforward rockfall frequency modelChristine Moos, Luuk Dorren, Michel Jaboyedoff, and Didier Hantz
A realistic quantification of rockfall risk is crucial for an effective and efficient prevention of damages. The estimation of realistic block and event volumes as well as their release frequencies remain a major challenge and are often based on mere expert estimation. Based on the analysis of the rockfall frequency and volume of a wide range of rock cliffs, Hantz et al. (2020) proposed a power law based model for the determination of rockfall magnitude-frequency aiming at a more objective approach for practitioners. It assumes that both, the released masses of rockfall events as well as the individual blocks of a rockfall event follow a power law distribution. The parameters of these distributions are determined using a simple classification of rock structure in combination with field measurements of blocks. In this study, we applied and tested the proposed rockfall frequency model (RFM) at 8 different sites at 7 locations in the Swiss Alps. The calculated frequencies of rockfall events and the derived block volumes were compared to release scenarios of official hazard assessments as well as inventory data. Block volume distributions of all sites could be well fitted by power law distributions (fitted b values between 0.69 to 1.69). The rockfall event and block volumes are in a comparable range as the scenarios of the official hazard assessments, but generally slightly larger. The differences increase with the return period. For all sites, the parameter sensitivity of the RFM is relatively large, in particular for return periods of 100-300 years. Nevertheless, the method proposed in this study allows for a more objective and consistent estimation of rockfall scenarios and thus has the potential to substantially improve the mostly opaque determination of rockfall scenarios. The results further show that the block volume scenarios for pre-defined return periods strongly depend on the considered cliff size, which does not appear to be consistently taken into account in current hazard assessments. However, the study should be extended to additional sites and the parameter estimation has to be optimised to come up with a consistent and transparent method to estimate rockfall frequencies in practice.
How to cite: Moos, C., Dorren, L., Jaboyedoff, M., and Hantz, D.: Estimating rockfall release scenarios based on a straightforward rockfall frequency model, EGU General Assembly 2022, Vienna, Austria, 23–27 May 2022, EGU22-11107, https://doi.org/10.5194/egusphere-egu22-11107, 2022.
EGU22-11320 | Presentations | NH3.5
Sentinel-1 InSAR Time-series Monitoring of the Unstable Rock Slopes in North Sikkim, IndiaGökhan Aslan, John Dehls, Reginald Hermanns, Ivanna Penna, Aniruddha Sengupta, and Vikram Gupta
The trans-Himalayan highway, between Gangtok and Yumthang, winds along steep valley sides, including a long section above the Teesta River. Many villages are precariously perched above the V-shaped valley bottoms. The highway is subject to frequent rainfall-triggered landslide events during monsoon season, disrupting transport and destroying infrastructure. The area has also experienced at least three large rock slope failures (RSF) within the past 40 years and many smaller RSF after the 2011 Sikkim earthquake (Martha et al, 2015). Earlier RSF, many prehistoric, have left at least 30 large boulder deposits along the valley. Several of those such as the Lanta Khola landslide get reactivated each monsoon season (Sengupta et al., 2011). A number of villages are located on these deposits, as they are frequently found in shallower sections of the valley slopes.
In the present study, Persistent Scatterer InSAR (PSI) has been employed, using Sentinel-1A and -1B Synthetic Aperture Radar (SAR) images acquired between 2015 and 2021 for selected historical landslides and landslide-prone areas along the Dzongu and Yumthang Valleys. Among them are the massive translational Dzongu landslide that occurred in 2016 near Mantam village forming a landslide dam (Morken et al., 2020), a large rock avalanche that occurred in 2015 in Yumthang valley (Penna et al., 2021), and several slope instabilities in the cities of Mangan and Mangshila.
Despite the challenges of dense vegetation and winter snow, we detected sufficient targets within the landslides, mainly over the scar areas, rock outcrops, building roofs, and landslide deposits. In this study, we compare the movement/settlement of these historic deposits with ongoing movement in prehistoric deposits. We look at linear vs seasonal components of ongoing deformation within the settlements built upon RSF deposits and discuss the implications with respect to possible catastrophic reactivation.
Martha, T. R., Govindharaj, K. B., & Kumar, K. V. (2015). Damage and geological assessment of the 18 September 2011 Mw 6.9 earthquake in Sikkim, India using very high-resolution satellite data. Geoscience Frontiers, 6(6), 793-805.
Morken, O. A., Hermanns, R. L., Penna, I., Dehls, J. F., & Bhasin, R. (2020, June). The Dzongu landslide dam: high sedimentation rate contributing to dam stability. In ISRM International Symposium-EUROCK 2020. OnePetro.
Penna, I. M., Hermanns, R. L., Nicolet, P., Morken, O. A., Dehls, J., Gupta, V., & Jaboyedoff, M. (2021). Airblasts caused by large slope collapses. Bulletin, 133(5-6), 939-948.
Sengupta, A., Gupta, S., and Anbarasu, K., 2010, Rainfall thresholds for the initiation of landslide at Lanta Khola in north Sikkim, India: Natural Hazards, v. 52, no. 1, p. 31-42.
How to cite: Aslan, G., Dehls, J., Hermanns, R., Penna, I., Sengupta, A., and Gupta, V.: Sentinel-1 InSAR Time-series Monitoring of the Unstable Rock Slopes in North Sikkim, India, EGU General Assembly 2022, Vienna, Austria, 23–27 May 2022, EGU22-11320, https://doi.org/10.5194/egusphere-egu22-11320, 2022.
EGU22-11330 | Presentations | NH3.5
Climate change and slope stability in IcelandThorsteinn Saemundsson and Jon Kristinn Helgason
Over the last decades climate has warmed up worldwide and changes have occurred in the general weather patterns. Where the increase in temperature has rapidly been gathering pace in the last decade. These changes have also been observed in Iceland. From 1980 to 2015 the average temperature increase has been 0,47°C per decade and the average precipitation has increased from 1500 mm/year to around 1600-1700 mm/year. The increased temperature changes have also resulted in more frequent thawing periods and rainfall events during winter months, especially in the lowlands.
Mass movements, including rock falls, rock avalanches, debris flows and debris slides, are common geomorphological processes in Iceland and thus present a significant and direct threat to many towns, villages, and farmhouses. Weather conditions, e.g. precipitation and temperature variations, and earthquake activity are the most common triggering factors for such activity in Iceland. During the last decades several, somewhat unusual, mass movements events have occurred in the island. These events have been unusual both regarding their size, increased frequency, their triggering factors and not at least the timing within the year they have occurred.
One of the most visible consequence of temperature rise in Iceland is the fast retreat and thinning of outlet glaciers and formation of proglacial lakes. The frequency of mass movements on outlet glaciers have increased considerably from the turn of the century compared to the last 4 decades of the 20th century. New discoveries of unstable slopes above outlet glaciers have also increased considerably from 2000.
In recent years, there has been an increasing interest worldwide in the influence of climate warming and possible decline of mountain permafrost on the occurrence of mass wasting phenomena. The rising frequency of rapid mass movements, such as debris flows, debris slides, rock falls and rock avalanches, in mountainous areas have been linked with mountain permafrost degradation. Several mass movements, which can be connected to thawing of mountain permafrost, have occurred in central N and NW parts of the island during the last decade.
Majority of landslides in Iceland in the past century have either occurred in relations with low-pressures systems that pass-through Iceland from August to November, bringing in high winds with heavy rainfall, or during spring snowmelt in May and June. But in the past two decades snowmelt and thawing periods are becoming more frequent and longer during wintertime resulting in higher frequency of slope failures during that time of year. Over the past 20 years’ large landslides events (> 300.000 m3) have become more frequent compared to the second half of the 20th century.
Climate change certainly seems to be affecting slope stability in Iceland and is an increasing risk. Especially slopes close to retreating glaciers and those affected by thawing of mountain permafrost. Changes in temperature and precipitation patterns in late fall and during winter months are causing slope failures that were not as common in the past.
How to cite: Saemundsson, T. and Helgason, J. K.: Climate change and slope stability in Iceland, EGU General Assembly 2022, Vienna, Austria, 23–27 May 2022, EGU22-11330, https://doi.org/10.5194/egusphere-egu22-11330, 2022.
EGU22-11604 | Presentations | NH3.5
Airblast caused by large slope collapsesIvanna Penna, Reginald Hermanns, Pierrick Nicolet, Odd Andre Morken, John Dehls, Vikram Gupta, and Michel Jaboyedoff
The sudden impact of a large slope collapse on the ground can cause a high degree of comminution of rocks and trigger an extreme rush of air loaded with particles, called an airblast. The airblast can expand the destructive capacity of a large slope collapse far beyond the run-out of the rock mass. The first airblast event documented in detail occurred in 1881 as consequence of a large collapse at Elm in the Unthertal valley (Switzerland). People being blown over by the air pressure wave were reported. In 2015, two rock avalanche related airblasts occurred in the Himalayas. In March 2015, an airblast in Yumthang valley (Sikkim, India) knocked down and snapped trees 1.4 km away from the impact zone of a rock avalanche. In April 2015, an avalanche triggered by the Gorkha earthquake induced a violent airblast that caused several casualties in Langtang valley. The destruction of stone and wooden houses can be observed in video footage. The damage on trees can be traced over a distance of 3.5 km and 400 m above the impact zone of the avalanche on the opposite slope. The most recent documented event occurred in February 2021 in Chamoli (India), where the flattened forest extends over 20 hectares.
This work presents a back analysis of the April 2015 airblast in the Sikkim Himalayas (India) and compares it with several other airblasts documented around the world. We review the conditions a large slope collapse should meet to cause a significant airblast. We also formulate an equation that links the potential energy of collapses having airborne trajectory to the extent of the related airblast.
How to cite: Penna, I., Hermanns, R., Nicolet, P., Morken, O. A., Dehls, J., Gupta, V., and Jaboyedoff, M.: Airblast caused by large slope collapses, EGU General Assembly 2022, Vienna, Austria, 23–27 May 2022, EGU22-11604, https://doi.org/10.5194/egusphere-egu22-11604, 2022.
EGU22-11756 | Presentations | NH3.5
Integrated 3D geological and Finite Element modeling of slow rock-slope deformations affecting hydropower facilitiesFederico Agliardi, Antonio Carnevale, Matteo Andreozzi, Andrea Bistacchi, Margherita C. Spreafico, Federico Franzosi, Chiara Crippa, Massimo Ceriani, Carlo Rivolta, Giovanni B. Crosta, and Riccardo Castellanza
Slow rock-slope deformations are widespread in orogenic belts and pose significant threats to critical infrastructures, due to continuing slow movements and potential evolution to collapse. The analysis of related risks requires realistic models, accounting for the 3D complexity of both large landslides and infrastructures, often hampered by over-simplification of geological aspects.
We propose an integrated workflow for the 3D modeling of a complex system of deep-seated landslides affecting the N slope of Mt. Palino (Valmalenco, Italian Central Alps). The slope was carved by glacial and fluvial erosion in a complex metamorphic sequence including layers of metapelite, serpentinite, gabbro and gneiss with a regional foliation deformed in two folding stages. The slope hosts a hydroelectric power plant and related structures, affected by deformations observed since 1972. Site investigations (field surveys, full-core borehole drilling, seismic surveys) and deformation monitoring (EDM, GNSS, structural monitoring, GB-InSAR) show that the slope is affected by a deep-seated gravitational slope deformation, probably active before the LGM and partially collapsed, and by a system of nested large landslides, including a toe failure up to 200 m deep and two suspended rockslides affecting some of the structures.
We performed an accurate 3D geomodelling to provide sound constraints on the geometry, lithology, and mechanisms of the active landslides. By integrating all available geological data we reconstructed longitudinal and transversal cross-sections in MOVETM and performed implicit-surface interpolation in SKUA-GOCADTM, eventually obtaining solid objects corresponding to tectono-stratigraphic units that are dissected by the nested landslides. These volumes are populated with their rock mass properties, interpolated from boreholes and surface surveys. The geomodel shows a complex dome-and-basin folded structure, strongly constraining the spatial distribution and anisotropy of weaker rocks (e.g. serpentinites), and thus the geometry, kinematics, rock strength and shear zone properties of active landslides.
Based on the geomodel, we set up a continuum-based 3DFEM elasto-plastic model in MIDAS GTS-NXTM. Individual solids in the analysis domain were discretized into a 3D mesh of 150000 hybrid finite elements with variable size in the range 20-200 m. Rock masses were considered as Mohr-Coulomb materials with tensile cut-off and post-peak dilatancy, while shear zones were included explicitly. After stress initialization, the model was ran with a Shear Strength Reduction (SSR) technique. Model parameters were calibrated using a quantitative back-analysis approach, optimizing the fit between normalized GB-InSAR measured displacements and computed displacements, projected in the radar LOS. The calibrated model was validated against field evidence and effects on man-made structures, and provided a starting point for forward modeling of the slope response to groundwater perturbations. We considered the effects of groundwater changes for 5 scenarios of perched aquifers, and assessed critical conditions corresponding to different instability scenarios with different impacts on the hydropower facilities.
Our results show that an explicit account for 3D geometrical and geological complexities is key to a realistic modeling of large slope failure mechanisms, their impacts on critical infrastructures and the evaluation of related risks.
How to cite: Agliardi, F., Carnevale, A., Andreozzi, M., Bistacchi, A., Spreafico, M. C., Franzosi, F., Crippa, C., Ceriani, M., Rivolta, C., Crosta, G. B., and Castellanza, R.: Integrated 3D geological and Finite Element modeling of slow rock-slope deformations affecting hydropower facilities, EGU General Assembly 2022, Vienna, Austria, 23–27 May 2022, EGU22-11756, https://doi.org/10.5194/egusphere-egu22-11756, 2022.
EGU22-11877 | Presentations | NH3.5
Experimental study towards the investigation of scale effects in 3D granular slidesSazeda Begam and Valentin Heller
Granular slides can be defined as gravity-driven rapid movements of granular particle assemblies mixed with air and often also water. This ubiquitous phenomenon is not only observed in industrial applications such as hoppers, blenders and rotating drums, but also in natural contexts in the form of landslides, rockslides and avalanches. These granular slides in nature may cause devastation and human losses in their run-out path and indirect effects such as landslide-tsunamis, landslide dams and glacial lake outburst floods. The investigation of granular slides in nature is challenging due to the dangers in accessing the landslide locations in a timely manner and the challenges in predicting when and where they occur. Here, we use well defined and controlled three-dimensional (3D) laboratory experiments, building up on own (Kesseler et al., 2020*) and other studies, which were commonly limited to two dimensions (2D). The primary aim of the current study is to extend the scale effects investigation of Kesseler et al. (2020) to 3D and to provide new physical insight into 3D granular slides.
The experimental setup from Kesseler et al. (2020) has been upgraded from 2D to 3D by extending the side of the ramp and runout zone. The upgraded versatile 3 m long and 1.5 m wide ramp transitions via a curved section into a 3 m long and 2 m wide runout area. The measurement system, consisting of cameras recording the slide evolution and for general observations and a photogrammetry system to investigate the slide deposit shape including the runout, has been complemented with two laser distance sensors measuring the slide thickness along its centreline at two distinct positions during slide propagation.
In this initial study, we explore two different slide volume limits and, surprisingly, found a negative correlation between the slide volume and runout distance. Moreover, we identified a positive correlation between the slide thickness and slide volume. A positive correlation has also been identified between the maximum deposit height and the initial slide volume. Further, the good test repeatability is demonstrated with a detailed quantification and presentation of the characteristic variation plot at different time instances, involving the slide centroid and front velocities, the maximum slide thickness, the slide side expansion ratio and the locations of the slide deposit front- and backlines.
These findings may ultimately contribute to landslide and avalanche hazard assessments by providing an efficient and improved prediction of the slide kinematics, the slide evolution and the slide deposition features such as the runout distance. Moreover, once all experiments are conducted at different scales, we hope to be able to quantify and understand scale effects of granular slides and to improve the upscaling procedure from laboratory scale to nature.
*Kesseler, M., Heller, V., Turnbull, B. (2020) Grain Reynolds number scale effects in dry granular slides. Journal of Geophysical Research-Earth Surface 125(1):1-19.
How to cite: Begam, S. and Heller, V.: Experimental study towards the investigation of scale effects in 3D granular slides, EGU General Assembly 2022, Vienna, Austria, 23–27 May 2022, EGU22-11877, https://doi.org/10.5194/egusphere-egu22-11877, 2022.
EGU22-11939 | Presentations | NH3.5
Investigation of rock slope failure processes in the Southern Swiss AlpsAlessandro De Pedrini, Christian Ambrosi, Cristian Scapozza, Andrea Manconi, and Federico Agliardi
The evolution of rockslide processes towards failure events depends on the combination of geological and geomorphological properties, structural setting, and the glacial history of each site. The identification and analysis of the dominant factors affecting the spatial distribution and the temporal evolution of such massive phenomena are relevant not only for scientific purposes but also have large impacts on hazard assessments. Several large rockslide phenomena are located between five valleys north of Bellinzona, southern Swiss Alps, including the Riviera, Leventina and Blenio valleys in Canton Ticino, and the Calanca and Mesolcina valleys in Canton Grisons. The distribution of such phenomena is highly variable and appears to be higher along the eastern side of the Leventina Valley and the western side of the Blenio valley rather than in the rest of the region. Furthermore, the observed failure events range from 13.50 ka cal BP to 2002 CE, and many rockslides have not yet collapsed despite visible signs of surface deformation. The reasons for these differences in spatial and temporal distribution are yet unknown.
Our research aims to define the influence and relationship of regional and local factors on the spatial and temporal rockslides distribution in this study area. We rely on an exceptional dataset including (i) detailed geological and geomorphological mapping of the area of study, (ii) a collection of historical data and scientific research on the activity of the large rock slope failures in Ticino and Grisons Cantons, (iii) detailed knowledge of the timing of deglaciation for several valleys of the Canton Ticino, (iv) a catalog of instabilities of the Canton of Ticino finalized in 2016, and (v) several results of current surface deformation activity constrained with satellite radar interferometry. Here we present the preliminary results of the activities performed to extend the rockslides catalog in the Calanca and Mesolcina valleys (Canto Grisons) obtained through the evaluation of stereo-photogrammetry datasets and evaluating the state of activity with satellite radar interferometry. Moreover, we will detail the approach used to set upslope stability modeling attempts at selected locations, combining techniques such as slope exposure dating, analysis of morphological parameters from digital elevation models, and analysis of structural data providing the dominant orientations of rock mass discontinuities.
How to cite: De Pedrini, A., Ambrosi, C., Scapozza, C., Manconi, A., and Agliardi, F.: Investigation of rock slope failure processes in the Southern Swiss Alps, EGU General Assembly 2022, Vienna, Austria, 23–27 May 2022, EGU22-11939, https://doi.org/10.5194/egusphere-egu22-11939, 2022.
Please decide on your access
Please use the buttons below to download the presentation materials or to visit the external website where the presentation is linked. Regarding the external link, please note that Copernicus Meetings cannot accept any liability for the content and the website you will visit.
Forward to presentation link
You are going to open an external link to the presentation as indicated by the authors. Copernicus Meetings cannot accept any liability for the content and the website you will visit.
We are sorry, but presentations are only available for users who registered for the conference. Thank you.
EGU22-12009 | Presentations | NH3.5
Inventory and characterization of recent (<100 years) gravitational activity of the Queyras DSGSDs - South French AlpsClément Boivin, Jean Philippe Malet, Catherine Bertrand, and Yannick Thiery
Deep Seated Gravitational Slope Deformation (DSGSD) are gravitational processes damaging slopes over long periods of time. These processes may be reactived with the occurrence of smaller, shallow gravitational events. Thus, a better understanding of DSGSDs, from their formation to more catastrophic phases of activity, is an important goal for natural hazard prevention in mountainous areas. .A first inventory of DSGSD in the Western Alps has been proposed by Crosta et al. (2013) with 1057 DSGSDs identified. A similar work has been conducted more recently at the scale of the French Alps by Blondeau (2018) who identified nearly 460 DSGSDs. Despite the importance of these works, there are still many Alpine sub-massifs where high concentrations of DSGSDs (Blondeau., 2018) have been recognized but where no detailed studies have been conducted. This is the case of the Queyras Massif (South French Alps). It is in this context that this study is carried out, with both the objectives of locating and characterizing the DSGSDs observed in this area and identifying their recent activity.
The proposed approach is based on quantitative geomorphological studies combining photo-interpretation of multi-date aerial imagery, analysis of DSMs and field observations. Quantitative description criteria are proposed to identify DSGSDs and discriminate them from large deep-seated landslides. Thirty DSGSDs are inventoried and their lithological and structural setting is analyzed. Analysis of multi-date aerial photographs and InSAR derived landslide velocities (NSBAS processing of Sentinel-1 observations; e.g. André et al., XX?) allow characterizing their gravitational activity.
How to cite: Boivin, C., Malet, J. P., Bertrand, C., and Thiery, Y.: Inventory and characterization of recent (<100 years) gravitational activity of the Queyras DSGSDs - South French Alps, EGU General Assembly 2022, Vienna, Austria, 23–27 May 2022, EGU22-12009, https://doi.org/10.5194/egusphere-egu22-12009, 2022.
EGU22-12124 | Presentations | NH3.5
Towards a national susceptibility map for rock avalanchesMartina Böhme, Odd Andre Morken, Thierry Oppikofer, Reginald L. Hermanns, Ivanna Penna, Pierrick Nicolet, Marie Bredal, José Pullarello, and Francois Noël
Several rock avalanches with significant consequences have taken place in Norway during the last centuries. This has caused a high awareness with respect to this natural hazard. As a result, mapping of unstable slopes was initiated in 2006 and several high-risk unstable rock slopes have been identified and investigated in detail and today are monitored. Furthermore, the mapping program of unstable rock slopes has become systematic. Under this initiative, so far five out of eleven Norwegian counties have been analysed systematically for unstable rock slopes and the mapping has been completed for one of these counties. Registered slopes are mapped and classified based on a systematic hazard and risk classification system, established in 2012. This process is time intensive, and currently attention might not be given to the highest risk objects.
In order to get a rapid, complete national overview of potential large rock slope failures, as well as their total hazard and consequence potential, a national overview mapping project has been started. This will make it possible to better prioritize high risk objects in the systematic mapping program. The project will be divided into several steps: (1) systematic analysis of remote sensing data (e.g. detailed DEM, orthophoto and InSAR data) to locate potential unstable rock slopes; (2) a simplified hazard ranking; (3) semi-automated volume estimation; (4) automated run-out assessment; (5) and empirical displacement wave run-up height assessment.
In order to minimize the area that needs to be analysed in Step 1, presently known unstable rock slopes have been analysed. Results indicate that the study area can be restricted based on available relief, presence of inhabitants and distance to the shorelines (fjords and lakes). This makes it possible to reduce the study area significantly, from the total land area of Norway down to roughly one third of this. Furthermore, for this quick overview assessment we use a simplified hazard ranking that is based on signs of activity, visible grade of development and its volume.
The resulting susceptibility map will serve as a source to prioritize mapping and mitigation efforts, with respect to other natural hazards in Norway as well.
How to cite: Böhme, M., Morken, O. A., Oppikofer, T., Hermanns, R. L., Penna, I., Nicolet, P., Bredal, M., Pullarello, J., and Noël, F.: Towards a national susceptibility map for rock avalanches, EGU General Assembly 2022, Vienna, Austria, 23–27 May 2022, EGU22-12124, https://doi.org/10.5194/egusphere-egu22-12124, 2022.
EGU22-12182 | Presentations | NH3.5
Movement of moisture during frost cracking cycles: First laboratory results from the CLIMROCK project.Andrew Mitchell and Oliver Sass
As a key part of landscape evolution and hazard to people in Alpine terrain, rock weathering leads to the breakdown and weakening of rock, causing rock fall and ultimately slope failure. Rock moisture availability is a major factor in these processes. It is understudied, partly due to a lack of reliable measurement techniques. Most frost weathering tests in the laboratory to date have been conducted with fully saturated specimens, which is often not the case under natural conditions.
As part of the DFG-funded CLIMROCK project, we performed laboratory based experiments in a climate cabinet looking at rock moisture movement during frost cracking cycles and its relation to rock weathering. A selection of Wettersteinkalk (limestone) blocks of 40 x 40 x 20 cm size were used, some of which were compact and some of which were highly fractured. The blocks saturated with water to different degrees (0%, 50%, 100%) and were insulated on the side faces. In different test runs, the base of the individual blocks were either left uncovered to allow water seeping through, also isolated at the base to create Different sensor types including Time Domain Reflectometry (TDR), Electrical Resistivity (ER) and Microwave sensor (MW) were used to quantify rock moisture levels and movement during freeze-thaw cycles of different duration. As a measure of relative rock weathering contact Acoustic Emissions (AE) loggers were used to detect subcritical cracking. Calibration of these instruments will be individual to each block.
Initial findings show marked movement of rock moisture at the beginning of the cycles with possible evidence of cryosuction down to 36cm depth from rock surface. Particularly strong moisture migration is seen in 50% and 100% samples at 25cm depth, though not when the sample is initially dry. There is also evidence of migrations to the freezing front and probable subsequent refreezing events.
Further test runs with different saturation levels (75%, 90%) are planned. Observations of moisture movements and weathering effects from the laboratory experiments will be applied to the interpretation of field rock moisture data from ongoing CLIMROCK studies in the Bavarian and Austrian Alps.
How to cite: Mitchell, A. and Sass, O.: Movement of moisture during frost cracking cycles: First laboratory results from the CLIMROCK project., EGU General Assembly 2022, Vienna, Austria, 23–27 May 2022, EGU22-12182, https://doi.org/10.5194/egusphere-egu22-12182, 2022.
EGU22-12230 | Presentations | NH3.5
Toward national-covering dynamic rockfall simulations: adapting stnParabel with efficiency in mindFrançois Noël, Thierry Oppikofer, Michel Jaboyedoff, Reginald Hermanns, Martina Böhme, and Synnøve Flugekvam Nordang
Working with 3D point clouds offers many benefits for reducing the subjectivity of rockfall simulations at a local scale. Indeed, many “dynamic” rockfall rebound models are strongly affected by the topography and the perceived surface roughness, which can be objectively represented with detailed terrain models. This reduces the need for complex time intensive back analyses and associated sensitive adjustments of parameters used for subjectively adjusting the simulations to the desired runout distances.
Predictable and reproductible simulations from a constrained set of parameters while still managing to reproduce observed runouts on a wide range of sites could be time saving for practitioners and their clients, ultimately improving quality at lower costs to the society. This could speed up the process for practitioners to deliver concise reports easier to interpret and quality-check by a wider range of employees on the client side.
However, working with 3D point clouds can have a steep learning curve and quickly becomes impractical at a larger scale for regional analysis, partially obscuring some of the previously mention advantages. To explore potential ways to circumvent these issues, a prototype of an algorithm that runs the stnParabel rockfall simulation freeware in batch was quickly implemented in 2020. It was developed to expand such dynamic simulation capabilities to larger regions and up to potentially national-covering capabilities.
Slight modifications were done on the impact detection algorithm to also work with high resolution gridded terrain models (DTMs) with a focus at not sacrificing the benefits of working on 3D point clouds. The sources biases due to the stretched grided cells underrepresenting the steep cliffs are worked around by randomly distributing the sources based on the 3D stretched surface occupied by the cells.
Preliminary results were produced regionally over 6000 km2, involving 115 000 000 simulated rockfalls with 10 m3 blocks of dimensions 3.8x3.2x1.8 m. The simulations were performed on the Norwegian national 1 m DTM from airborne LiDAR, up sampled to 50 cm cells for future proofing the approach. They were produced at a rate of about 15 000 000 simulated 3D trajectories per hour when ran on a small Ultrabook laptop with fast SSD.
The preliminary results from the dynamic rockfall model were then combined with databases of observed deposited blocks from previous rockfall events to act as a calibration guide for FlowR model. This simpler model based on gridded topographic-hydrologic spreading and sliding block approaches can be adjusted to produce a wide range of desired runouts envelopes from numerous processes, like rockfalls. The simpler simulations on 10 m DTM were used as a candidate for the revision of the national rockfall susceptibility mapping methodology.
The prototype approach to run detailed dynamic rockfall simulations regionally would require validations. Such potentially useful approach with objective dynamic simulations for hazard mapping as well as for the design of mitigation measures could then be shared through publications and be implemented in the distributed rockfall simulation freeware stnParabel.
How to cite: Noël, F., Oppikofer, T., Jaboyedoff, M., Hermanns, R., Böhme, M., and Flugekvam Nordang, S.: Toward national-covering dynamic rockfall simulations: adapting stnParabel with efficiency in mind, EGU General Assembly 2022, Vienna, Austria, 23–27 May 2022, EGU22-12230, https://doi.org/10.5194/egusphere-egu22-12230, 2022.
EGU22-12412 | Presentations | NH3.5
Automated delimitation of rockfall runout zones using high resolution trajectory modelling at regional scaleLuuk Dorren, Christine Moos, and Christoph Schaller
More than ten years ago, Swiss-wide rockfall modelling was carried out to indicate potential hazard areas and rockfall protection forests within the framework of the SilvaProtect-CH project. The forest effect itself was not included in these models and only one block size (1 m3) was calculated. The aim of our study was to model rockfall runout zones using Rockyfor3D for block size scenarios ranging from 0.05 – 30 m3 with explicit inclusion of the protective effect of the forest for an area of approx. 7200 km2 in Switzerland and Liechtenstein with a 2m-resolution. For the determination of the start cells as well as the slope surface characteristics, we used the terrain morphometry derived from a 1m-resolution digital terrain model as well as the Swiss TLM geodata and information from geological maps. The forest structure was defined by individual trees with their coordinates, diameters and tree type (coniferous or deciduous). These were generated on the one hand from detected individual trees and on the other hand from statistical relationships between the detected trees, remote sensing-based forest structure type definitions and stem numbers from field inventory data. Based on the latter, we generated forest strata in addition to the detected individual trees. The delimited rockfall runout zones automatically derived from the simulated reach probability maps were validated with 1554 mapped historical rockfall events. The results of the more than 78 billion simulated trajectories showed that 94% of the mapped silent witnesses could be reproduced by the simulations and 78% were within the delimited runout zones. The median of the volume of the non-reproduced silent witnesses was 0.1 m3, which led us to a hypothesis, that these mapped blocks could partly be deposited fragments from larger blocks. We conclude that a rockfall simulation with explicit consideration of the forest effect at 2m-resolution with plausible results is possible for very large areas.
How to cite: Dorren, L., Moos, C., and Schaller, C.: Automated delimitation of rockfall runout zones using high resolution trajectory modelling at regional scale, EGU General Assembly 2022, Vienna, Austria, 23–27 May 2022, EGU22-12412, https://doi.org/10.5194/egusphere-egu22-12412, 2022.
EGU22-12612 | Presentations | NH3.5
Slope Stability Assessment of Rock Slopes Using Finite Element Modelling Along National Highway-5, Shimla, Northwestern Himalaya, IndiaJugraj Singh, Mahesh Thakur, and Naval Kishore
Technology advances and rising population has led to the establishment of geoengineering projects such as dams, tunnels, bridges, road network, etc. in the mountainous terrain which causes slope destabilization. National Highway-5 connects Shimla, Kinnaur, Kullu, and China border to the rest of the country. The route is of paramount importance for defense and security purposes. The area encompasses complex geomorphological and geological terrain and often encounters road cut slopes susceptible to failure. In the present study, a detailed geotechnical investigation is carried out around Dhalli Landslide (September, 2017) and Malyana Landslide (August, 2018) along NH-5, Shimla, Himachal Pradesh. RMR, SMR, kinematic analysis and numerical modeling using the finite element modelling (FEM) technique is applied for the aforementioned two slopes and its nearby area. Kinematic analysis of joint data shows that rocks are prone to mainly wedge and planar failures. The RMR results show that the slopes belong to fair (Class III) and weak (Class IV) category. The SMR results for the slopes show that slopes lie in the completely unstable (Class V) category, unstable (Class IV) category and in the partially stable (Class III) category. The Strength Reduction Factor (SRF) was calculated using RS2 module of Rocscience. The SRF for both the slopes was less than 1 which shows that the slopes are completely unstable. Dominating factors responsible for the slope instability are identified and accordingly, some suggestions are proposed to strengthen the stability of road cut slope.
How to cite: Singh, J., Thakur, M., and Kishore, N.: Slope Stability Assessment of Rock Slopes Using Finite Element Modelling Along National Highway-5, Shimla, Northwestern Himalaya, India, EGU General Assembly 2022, Vienna, Austria, 23–27 May 2022, EGU22-12612, https://doi.org/10.5194/egusphere-egu22-12612, 2022.
EGU22-12639 | Presentations | NH3.5
A complete rockfall inventory across twelve orders of magnitude.Benjamin Jacobs, Florian Huber, and Michael Krautblatter
Understanding the magnitude-frequency relationship of rock falls is one of the most important issues for both geomorphologists assessing sediment budgets as well as public stakeholders evaluating rock fall hazards. Multi-temporal Terrestrial Laser Scanning (TLS) surveys, or more general LiDAR, is often applied to produce rock fall inventories of event magnitudes and their frequency. However, LiDAR-based rock fall inventories systematically miss or underestimate both ends of the magnitude bandwidth.
Here we present the first attempt of a complete rock fall inventory including the full spectrum of magnitudes, ranging from fragmental rock falls (cm³) to Bergsturz-sized events (106 m³). We combine rock fall inventories derived from multi-temporal TLS campaigns over six years, rock fall collectors and the historic record in a previously intensely investigated study area (Reintal, German Alps). We investigate which factors – such as structural geology, systematic sampling limitations or different rock fall processes – can lead to possible misinterpretation of rock fall inventories regarding geomorphic systems.
The study shows that (i) LiDAR-based rock fall inventories do not cover the full spectrum of rock fall magnitudes due to their limitations in temporal and spatial resolution, (ii) structural geological features control the magnitude/frequency relation beyond the roll-over of these inventories and (iii) taking fragmentation as well as a clear distinction between rock fall processes into account when analysing rock fall inventories is crucial.
How to cite: Jacobs, B., Huber, F., and Krautblatter, M.: A complete rockfall inventory across twelve orders of magnitude., EGU General Assembly 2022, Vienna, Austria, 23–27 May 2022, EGU22-12639, https://doi.org/10.5194/egusphere-egu22-12639, 2022.
EGU22-12804 | Presentations | NH3.5
Collapse, fragmentation, high-speed boulders, and dust cloud: analysis of the 2017 Pousset (Cogne, Val D’Aosta) rockslide in Northern ItalyGiovanni Crosta, Giuseppe Dattola, Fabio De Blasio, Camilla Lanfranconi, and Davide Bertolo
The dynamics of rock fragmentation during the collapse of a rock avalanche, a rockfall, or an extremely energetic rockfall, is insufficiently known (De Blasio et al., 2018). Fragmentation especially at the base of a rock avalanche may affect on the one hand the dynamics of the rock avalanche and the geometry of the final deposit. On the other hand, fragmentation in the upper layers produces a dust of rock particles which: i) impacts energetically with the surrounding areas, and in a later stage, ii) propagates as a dust cloud. Although such dynamics are commonly observed, they are still inadequately addressed.
Recently, a rock avalanche in the Italian Alps occurred in November 2017, giving us the possibility to investigate these phenomena in better detail. In particular, we analysed a 8,000 m3 collapse of serpentinites and metabasics (Grivola-Urtier metaophiolitic Unit) from the Pousset peak (Aosta Valley Region in Western Italian Alps). The peak collapsed from an average height of 2800 m a.s.l. to the foot of the slope 800 m below, where it completely disintegrated. The impact on the ground produced a rock dust cloud which subsequently flowed downstream over the successive few minutes. The site was visited immediately after the event, and it was possible to investigate the fresh deposit of rock dust before alteration by climate or weathering. This collapse thus represents an interesting case study for trying to determine the energy threshold required for fragmentation and dust cloud formation, the redistribution of the kinetic energy after impact and the amount related to cloud generation within the energy balance.
After identifying in situ the main characteristics of the collapse, we then concentrated our efforts on a more quantitative understanding of the event via numerical calculations. We reproduced the blocks trajectories and computed the impact points where a strong energy dissipation occurred by using the 3D rockfall simulator code HY-STONE (Crosta & Agliardi 2004; Frattini et al. 2012). In these points, the block fragmentation has been taken place and the formation of dust occurred. Through laboratory analysis of dust samples collected from the few centimetres thick deposits on trees and paths, we determined the particle size frequency curves for each location. The fragmentation energy was then estimated by integrating the spectrum of the grains assuming that the fragmentation energy is proportional to the area just created.
Once obtained the fragmentation energy, we estimated the maximum speed and runout of the dust cloud and the settling time using a simple model for suspension flows. From the analysis of the results obtained in the three described procedures, the fragmentation energy was found to be a relatively small fraction of the initial energy of the landslide, and the calculated flow rate of the suspended powder was found to be compatible with the one observed, even though flowage parameters for the cloud still need to be understood from first principles. In conclusion this case study, even if volumetrically small (or perhaps because of it), may add interesting information on the ongoing debate about rock fragmentation in catastrophic events.
How to cite: Crosta, G., Dattola, G., De Blasio, F., Lanfranconi, C., and Bertolo, D.: Collapse, fragmentation, high-speed boulders, and dust cloud: analysis of the 2017 Pousset (Cogne, Val D’Aosta) rockslide in Northern Italy, EGU General Assembly 2022, Vienna, Austria, 23–27 May 2022, EGU22-12804, https://doi.org/10.5194/egusphere-egu22-12804, 2022.
EGU22-13034 | Presentations | NH3.5
A new perception in the development, failure, and hyper-mobility of a giant rock avalanche in the suture zoneYunjian Gao and Siyuan Zhao
Giant rock avalanche is extremely rare worldwide, while giant rock avalanche developed in suture zone has presented unique development characteristics. The suture zone is a product of plate moving and strong tectonic activity, where the appearance of a giant avalanche not only plays a barometer role for the regional disaster development environment but an indicator role for the complicated geological environment. In 2019-2021, the author has found a giant paleo-rock avalanche (name Basu avalanche) in the Bangonghu-Nujiang suture zone of the Tibetan Plateau. Some infrequent characteristics such as huge volume, development in nappe structure, and hyper-mobility (debris impact height > 600m) appeared for this giant rock avalanche. In this paper, based on the detailed investigation, 36Cl dating, and reconstructing the pre-avalanche terrain methods, the development, failure, and hyper-mobility of this giant rock avalanche have been analyzed. The result shows that: (1) The volume of the Basu avalanche is about 3.5×10⁹m3, the residue is about 1.4×10⁹m3 now. The avalanche occurred at 205.70±7.71ka B.P.(ka: millennium), subsequent the accumulation body occurred two times secondary landslides (name Duolasi landslide) at 17.57±0.72ka B.P. and 7.01±0.32ka B.P., respectively; (2) The nappe structure, formed from the uplift and orogeny process of the suture zone, controls the development and volume size of the Basu avalanche, while the strong earthquake is the biggest likely to trigger the avalanche finally failure because of the dense active faults distribution; (3) Because of the rich Ultrabasic clasts derived from the F2 fault and fine particles produced by cataclastic rock mass, the Basu avalanche formed the slide belt that thickness from centimeters to meters during the motion. The lubrication effect of the slide belt has dominated the avalanche debris's high-speed motion and hyper-mobility, the mechanism is that: due to the huge avalanche volume and induced the high pressure and closed slide belt environment, the slide belt fine-grain formed the lubrication layer with certain water involved, and the friction force sharply decreased; (4) Because of the Basu rock avalanche and the debris flow successive blocked the Leng River, the Leng River valley has experienced diversions process and the river valley from the ’S’ shape to approximate straight-line shape.
How to cite: Gao, Y. and Zhao, S.: A new perception in the development, failure, and hyper-mobility of a giant rock avalanche in the suture zone, EGU General Assembly 2022, Vienna, Austria, 23–27 May 2022, EGU22-13034, https://doi.org/10.5194/egusphere-egu22-13034, 2022.
EGU22-273 | Presentations | NH3.7
Prediction of rainfall-induced shallow landslides through integration of hydrological model with a slope stability modelJuby Thomas and Manika Gupta
Landslides are one of the most widespread natural hazards on earth and has been a major problem in many countries, especially in developing countries. Rainfall induced shallow landslides are ubiquitous on steep terrains of Himalayas, India and are accountable for substantial damage to properties, loss of human lives and livestock. They are densely distributed across territories, very frequent in time and space, and occur without any significant premonitory signals. Due to the surge in occurrence of extreme precipitation events as a result of climate change, rainfall induced landslides have become more frequent in the Himalayas. Since the mountains are becoming increasingly inhabited because of the population expansion, the geohazards like landslides have become more destructible. The Himalayas is one of the most vulnerable areas in the world and is a region of crucial interests. The Himalayas has been receiving surplus amount of rainfall and which is a trigger for devastating landslides along the steep terrains. Prediction of rainfall induced landslides can help the policy makers and local administration to propose appropriate mitigation strategies for unstable and vulnerable terrains.
In the present study, a hydrological model is integrated with a dynamic physically based slope stability model for the grid-wise forecasting of the stability of the terrain in the central Himalayas. The model has been optimised and calibrated based on remotely sensed data and multi-temporal landslide inventory corresponding to various landslide inducing precipitation events. HYDRUS 1D platform is used for the hydrological modelling which includes the derivation of SHPs and subsurface soil moisture. The hydrological model with finer resolution SHPs and subsurface soil moisture is later integrated with Transient Rainfall Infiltration and Grid-based Regional Slope-stability (TRIGRS) model to compute the factor of safety of the terrain. The integrated model is validated for the study area with the previous occurrence of the rainfall induced landslides. The integrated model shows higher positive rate for landslide prediction as compared with the utilization of simple slope stability model.
Keywords: Himalayas, landslides, HYDRUS 1D, TRIGRS
How to cite: Thomas, J. and Gupta, M.: Prediction of rainfall-induced shallow landslides through integration of hydrological model with a slope stability model, EGU General Assembly 2022, Vienna, Austria, 23–27 May 2022, EGU22-273, https://doi.org/10.5194/egusphere-egu22-273, 2022.
EGU22-990 | Presentations | NH3.7
Uncertainties in local and regional mass movement prediction using rainfallBrian McArdell, Jacob Hirschberg, Alexandre Badoux, Elena Leonarduzzi, and Peter Molnar
The prediction of debris flows is relevant because this type of natural hazard can pose a threat to humans and infrastructure. Debris-flow (and landslide) early warning systems often rely on rainfall intensity–duration (ID) thresholds. Multiple competing methods exist for the determination of such ID thresholds but have not been objectively and thoroughly compared at multiple scales, and a validation and uncertainty assessment is often missing in their formulation. As a consequence, updating, interpreting, generalizing and comparing rainfall thresholds is challenging. Here, we present the findings of Hirschberg et al. (2021), which focused on (i) uncertainties related to ID thresholds, (ii) differences in local compared to regional ID thresholds, and (iii) how prediction can potentially be improved using statistical learning algorithms. The findings are of interest for debris-flow (and landslide) early-warning developers.
We use a 17-year record of rainfall and 67 debris flows in a Swiss Alpine catchment (Illgraben) to determine ID thresholds and associated uncertainties as a function of record du- ration. This included comparing two methods for rainfall threshold definition based on linear regression and/or true-skill-statistic maximization. The main difference between these approaches and the well-known frequentist method is that non-triggering rainfall events were additionally considered for obtaining ID-threshold parameters. Depending on the method applied, the ID-threshold parameters and their uncertainties differed significantly. We found that 25 debris flows are sufficient to constrain uncertainties in ID-threshold parameters to ±30% for our study site. We further demonstrated the change in predictive performance of the two methods if a regional landslide data set with a regional rainfall product was used instead of a local one with local rainfall measurements. Hence, an important finding is that the ideal method for ID- threshold determination depends on the available landslide and rainfall data sets. Furthermore, for the local data set we tested if the ID-threshold performance can be increased by considering other rainfall properties (e.g. antecedent rainfall, maximum intensity) in a multivariate statistical learning algorithm based on decision trees (random forest). The highest predictive power was reached when the peak 30 min rainfall intensity was added to the ID variables, while no improvement was achieved by considering antecedent rainfall for debris-flow predictions in Illgraben. Although the increase in predictive performance with the random forest model over the classical ID threshold was small, such a framework could be valuable for future studies if more predictors are available from measured or modelled data.
How to cite: McArdell, B., Hirschberg, J., Badoux, A., Leonarduzzi, E., and Molnar, P.: Uncertainties in local and regional mass movement prediction using rainfall, EGU General Assembly 2022, Vienna, Austria, 23–27 May 2022, EGU22-990, https://doi.org/10.5194/egusphere-egu22-990, 2022.
EGU22-1998 | Presentations | NH3.7
DTVT: a GIS tool for the automatic validation of Physically Based Landslide Models and the identification of the optimal warning criteriumSamuele Segoni, Giulio Pappafico, Elena Benedetta Masi, Guglielmo Rossi, and Veronica Tofani
Distributed physically based slope stability models represent the most advanced and scientifically sound method to forecast landslide triggering conditions. However, their operational application in regional warning systems is still hindered by some limitations. Among these, the problem of a robust validation (a task that is time consuming and not standardized) and the difficulty to manage a model output that (especially in the most advanced applications) is constituted by a raster of small pixels expressing the probability of landslide triggering: to activate an operational response an evaluation is usually performed on the overall conditions of larger spatial units and not on a pixel basis.
To overcome these shortcomings, we developed a GIS tool that can be fed with the results of slope stability models (raster maps representing the probability of landslide occurrence) and landslide inventory maps. The tool automatically performs a long series of operations traditionally performed by GIS operators to validate their models: the raw instability maps are reaggregated from pixels to watershed; warning maps are drawn; they are compared with the landslide inventory; a contingency matrix (with true positives, true negatives, false positive, and false negatives) is built; the validation results are drawn in a map. The warning criterium is defined based on two threshold values: the probability of failure above which a pixel should be considered stable and the percentage of unstable pixels that a watershed needs to consider the hazard level widespread enough to justify the issuing of an alert. The tool was named Double Threshold Validation Tool (DTVT) and after some tests in three different test sites it was verified that: (i) DTVT can be used to carry out a standardized validation procedure in a very shorter time than traditional methods (ii) a reiterated application of the tool (by varying the values of the thresholds) can be used to identify the best warning criterion for each test site (e.g. which double threshold maximizes correct predictions while minimizing missed alarms). It is important to stress that DTVT does not improve the results obtained with the slope stability model; instead, this newly proposed tool that can be used to shift form a triggering model to a warning model, the latter being aimed at identifying when larger spatial units need the activation of operational procedures.
How to cite: Segoni, S., Pappafico, G., Masi, E. B., Rossi, G., and Tofani, V.: DTVT: a GIS tool for the automatic validation of Physically Based Landslide Models and the identification of the optimal warning criterium, EGU General Assembly 2022, Vienna, Austria, 23–27 May 2022, EGU22-1998, https://doi.org/10.5194/egusphere-egu22-1998, 2022.
Please decide on your access
Please use the buttons below to download the presentation materials or to visit the external website where the presentation is linked. Regarding the external link, please note that Copernicus Meetings cannot accept any liability for the content and the website you will visit.
Forward to presentation link
You are going to open an external link to the presentation as indicated by the authors. Copernicus Meetings cannot accept any liability for the content and the website you will visit.
We are sorry, but presentations are only available for users who registered for the conference. Thank you.
EGU22-2774 | Presentations | NH3.7
DEWS: a QGIS tool pack for the automatic selection of reference rain gauges for landslide-triggering rainfall thresholdsOmar F. Althuwaynee, Massimo Melillo, Stefano Luigi Gariano, Luigi Lambardo, Hyuck-Jin Park, Sang-Wan Kim, Paulo Hader, Meriame Mohajane, Renata Pacheco Quevedo, Filippo Catani, and Ali Aydda
Several territorial landslide early warning systems in different parts of the world are based on empirical rainfall thresholds for landslide triggering. The calculation of such thresholds, using rainfall measurements gathered from rain gauges, has been examined frequently, especially considering uncertainties, modeling complexity, spatial assumptions, and analytical tools. Installed rain gauge networks that are spatially clustered in crowded areas have different spatial and attribute settings based on landslide occurrence conditions, such as rainfall record accessibility, processing, and usability, as well as specific locational, morphological, and hydrological settings.
In this research work, we introduce an automatic tool called DEWS (Distance, Elevation, Watershed, and Slope unit) for rainfall-induced landslide spatial reference rain gauge selection. DEWS can be considered supplementary and complementary to the CTRL-T tool (Calculation of Thresholds for Rainfall-induced Landslides Tool) developed earlier, and works on a macro-to-micro scale of the spatial components of CTRL-T rain gauge selections. The output information, i.e. the list of selected reference rain gauges, can be used as input for CTRL-T to calculate frequentist rainfall thresholds at different non-exceedance probabilities. The DEWS tool fills the gap of the current literature, where the selection of reference rain gauges is mostly based on the nearest distance location and on statistical or manual procedures, without considering the morphological and hydrological settings of the area in which landslides occurred.
The tool allows extracting rain gauges referring to landslide locations by employing four spatial filters: F1 (Distance), F2 (Elevation), F3 (Watershed), F4 (Slope unit), needing only a DEM, the coordinates of landslide and rain gauge locations and the parameters of the filter’s algorithms as inputs. More in detail, F1 selects rain gauges within a specified buffer distance from the landslide locations using the setting parameters and the coordinates of the landslides and rain gauges. Then, F2 uses the DEM to extract the elevation of the rain gauges and the landslides and then calculates the differences within each buffer circle; therefore, the filter keeps only the rain gauge with closest elevation values to each landslide (within F1 results) using the recommended/preferred/ or allowable elevation difference defined by the parameter’s settings. In F3, the rain gauges falling in the watershed that contains the landslide locations are extracted (within F1 and F2 results). F4, which is the smallest and most focused filter, uses a previously developed tool pack (within F1, F2, and F3 results) to extract the slope units associated with each landslide. Consequently, only the rain gauges falling within these slope units are selected.
DEWS was implemented in a free tool pack in QGIS software, with default parameter values for non-expert users. The tool pack is divided into three main blocks following the filter structure (F1 and F2 are kept together). The reliability of DEWS was tested at a territorial scale in South Korea, using 223 landslides and 328 rain gauges. As a second step, frequentist rainfall thresholds were calculated in the study area.
How to cite: Althuwaynee, O. F., Melillo, M., Gariano, S. L., Lambardo, L., Park, H.-J., Kim, S.-W., Hader, P., Mohajane, M., Quevedo, R. P., Catani, F., and Aydda, A.: DEWS: a QGIS tool pack for the automatic selection of reference rain gauges for landslide-triggering rainfall thresholds, EGU General Assembly 2022, Vienna, Austria, 23–27 May 2022, EGU22-2774, https://doi.org/10.5194/egusphere-egu22-2774, 2022.
Please decide on your access
Please use the buttons below to download the presentation materials or to visit the external website where the presentation is linked. Regarding the external link, please note that Copernicus Meetings cannot accept any liability for the content and the website you will visit.
Forward to presentation link
You are going to open an external link to the presentation as indicated by the authors. Copernicus Meetings cannot accept any liability for the content and the website you will visit.
We are sorry, but presentations are only available for users who registered for the conference. Thank you.

EGU22-3449 | Presentations | NH3.7
Implementation of soil moisture data into landslide rainfall thresholds: two case studies in Italy and NorwayPierpaolo Distefano, Luca Piciullo, David J. Peres, Pietro Scandura, and Antonino Cancelliere
Prediction of rainfall-induced landslides is a complex task, due to the multitude of processes involved, heterogeneity of soil properties, spatial variability of rainfall and uncertainty in landslide inventories. Rainfall thresholds can provide a useful insight on the prediction of rainfall-induced landslides; however, they just describe a part of the problem, completely neglecting the hydrological conditions. Empirical thresholds, generally focus on the characteristics of precipitation, expressed in terms of intensity and duration (I-D threshold). Although an increasing number of studies is aiming at defining the link between precipitation characteristics and soil moisture data, few are describing the usefulness of soil moisture together with empirical thresholds for rainfall-induced landslide prediction. Soil moisture data are generally used in physically based models being a function of the characteristics of the soils therefore highly site-specific and obtainable with instrumental observations and/or in situ or laboratory analyzes.
In this study, a preliminary analysis on the use of soil moisture data for the definition of empirical rainfall thresholds is carried out. The newly released fifth-generation reanalysis product of the European Center for Medium Range Weather Forecasts (ECMWF), i.e., ERA5, provides soil moisture data even for those areas in which no measuring instruments are available. ERA5 data are available in the Climate Data Store on regular latitude-longitude grids at 0.1° x 0.1° resolution covering a period from 1950 to the present with hourly resolution. The goodness of the product has been verified comparing in situ available data with those obtained with ERA by statistical analysis including the Taylor diagram that links correlation coefficient, standard deviation and root mean squared difference between two analyzed series. Soil moisture data have been collected for several stations located in Norway and Italy.
Soil moisture data for Norway has been collected from stations in two different places near Oslo, while soil moisture data for Italy comes from the International Soil Moisture Network (ISMN), specifically, Calabria region stations have been used. Rainfall-soil moisture thresholds have been defined for two case studies and the performance of thresholds considering and neglecting the soil moisture has been evaluated.
How to cite: Distefano, P., Piciullo, L., Peres, D. J., Scandura, P., and Cancelliere, A.: Implementation of soil moisture data into landslide rainfall thresholds: two case studies in Italy and Norway, EGU General Assembly 2022, Vienna, Austria, 23–27 May 2022, EGU22-3449, https://doi.org/10.5194/egusphere-egu22-3449, 2022.
Please decide on your access
Please use the buttons below to download the presentation materials or to visit the external website where the presentation is linked. Regarding the external link, please note that Copernicus Meetings cannot accept any liability for the content and the website you will visit.
Forward to presentation link
You are going to open an external link to the presentation as indicated by the authors. Copernicus Meetings cannot accept any liability for the content and the website you will visit.
We are sorry, but presentations are only available for users who registered for the conference. Thank you.
EGU22-3630 | Presentations | NH3.7
An analysis of robustness, sampling variation and performances of landslide triggering thresholds determined by different approachesDavid J. Peres and Antonino Cancelliere
Rainfall intensity-duration landslide-triggering thresholds have been proposed as a possible component for the implementation of territorial landslide early warning systems. Given a set of rainfall and landslide data, three approaches can be distinguished to determine thresholds: (i) methods based on triggering events only, (ii) methods based on the non-triggering events only, and (iii) methods based on both type of rainfall events. The aim of the present research is to compare these three possible approaches based on statistical criteria: robustness, sampling variation, and performance. This comparison can provide an insight on which of the three approaches is more appropriate based on the dataset that happens to be available for the area of interest.
We address these aspects by setting up a virtual simulation framework combining a stochastic rainfall model with a hydrological and slope stability model, which allows to make repeated experiments and to simulate different uncertainty conditions.
Our analysis shows that methods based on triggering rainfall only can be the worst with respect to the three investigated statistical properties. Methods based on both triggering and non-triggering rainfall have the highest performances in terms of the ROC true skill statistic; they are also robust, but still require a quite large sample to sufficiently limit the sampling variation of the threshold parameters. On the other side, methods based on non-triggering rainfall only, which are mostly overlooked up, are characterized by good robustness and low sampling variation. It can also be shown that in realistic scenarios their performances can be acceptable and even higher than thresholds derived from triggering events only. Indeed, the use of triggering rainfall only, a common practice in the past literature, yields to thresholds with the worse statistical properties, except when there is a clear separation between triggering and non-triggering events.
Based on these results, it can be stated that methods based on non-triggering rainfall only deserve wider attention, as they have also the practical advantage that can be in principle used where limited information on landslide occurrence is available. The fact that relatively large samples (about 200 landslides events) are needed for a sufficiently precise estimation of threshold parameters when using triggering rainfall, provides a possible insight on the level of uncertainty of thresholds proposed in the past literature.
How to cite: Peres, D. J. and Cancelliere, A.: An analysis of robustness, sampling variation and performances of landslide triggering thresholds determined by different approaches, EGU General Assembly 2022, Vienna, Austria, 23–27 May 2022, EGU22-3630, https://doi.org/10.5194/egusphere-egu22-3630, 2022.
EGU22-3806 | Presentations | NH3.7
Role of measured and simulated water content patterns for landslide early warning systemsTobias Halter, Peter Lehmann, Adrian Wicki, and Manfred Stähli
Landslide early warning systems based on rainfall intensity and duration thresholds neglect the role of antecedent rainfall events on the hydration state that defines the disposition of a steep slope to fail in forthcoming rainfall events. Water content, water potential and mechanical strength of the soil largely depend on the antecedent rainfall signature and the soil hydraulic properties. To investigate how soil moisture information can be used for LEWS, six soil moisture measuring stations have been installed in the Napf-Emmental region as part of an ongoing pilot study to develop a territorial LEWS in Switzerland. In order to estimate the spatial distribution of the initial water content and its effect on landslide frequency and magnitude, we combine water content patterns from these stations, topographic disposition and regional rainfall data. The calculated soil water content patterns are used as input for landslide triggering simulations using the hydromechanical model framework STEP-TRAMM. STEP-TRAMM calculates the load distribution between mechanically interacting soil columns that may result in progressive failure culminating in hazardous landslides. Using landslide inventory data for the pilot region, we calibrate and validate the landslide model and evaluate the role of uncertainty in initial water content pattern on landslide characteristics and rainfall thresholds. We found high correlations between the measured and simulated water content based on rainfall characteristics and topographic disposition (R2 = 0.94), allowing a reasonable estimate of the spatial distribution of the initial water content which underlines the outcome of further landslide triggering simulations.
How to cite: Halter, T., Lehmann, P., Wicki, A., and Stähli, M.: Role of measured and simulated water content patterns for landslide early warning systems, EGU General Assembly 2022, Vienna, Austria, 23–27 May 2022, EGU22-3806, https://doi.org/10.5194/egusphere-egu22-3806, 2022.
Please decide on your access
Please use the buttons below to download the presentation materials or to visit the external website where the presentation is linked. Regarding the external link, please note that Copernicus Meetings cannot accept any liability for the content and the website you will visit.
Forward to presentation link
You are going to open an external link to the presentation as indicated by the authors. Copernicus Meetings cannot accept any liability for the content and the website you will visit.
We are sorry, but presentations are only available for users who registered for the conference. Thank you.

EGU22-4990 | Presentations | NH3.7
Developing the conceptual framework for a prototype government-led regional Landslide Early Warning System in IndiaEmma Bee and Bruce Malamud and the LANDSLIP project partners
The LANDSLIP (LANDSLIde multi-hazard risk assessment, Preparedness and early warning in South Asia) research project commenced in 2016 with the aim of developing a prototype regional landslide forecasting and early warning system to help build resilience to hydrologically related landslides in two case study regions of India, the Nilgiris and Darjeeling. Here we present our pathway and reflections on the development of the LANDSLIP prototype LEWS (landslide early warning system) and its component parts, which includes a decision-support information dashboard and protype daily landslide forecast bulletin.
Central to the LEWS was a common and shared understanding of its conceptual framework. In other words, what were the components of the LEWS and how did they interact? To develop our LEWS conceptual framework we engaged a LANDSLIP interdisciplinary team which consisted of a range of researchers and practitioners from the British Geological Survey, Kings College London, Amrita University, Consiglio Nazionale delle Ricerche, Practical Action, UK Met Office, and Newcastle University. We developed the conceptual framework in collaboration with in-country partners (e.g. Save the Hills, Keystone, National Centre for Medium Range Weather Forecasting (NCMRWF) and District Management Authorities). As the nodal agency for landslides in India, the Geological Survey of India (GSI) partnered with the project and provided a focal point for the prototype LEWS.
The result of our final conceptual framework for the LEWS consisted of: (A) Dynamic forecast modelling data products, (B) semi-static landslide data layers feeding into (A), and (C) additional data sources. (A) to (C) then feed into (D) a LEWS information dashboard (data and physical models display). Finally, our conceptual framework included the communication flows, operating procedures and guidance documentation surrounding these communications. The aim of the conceptual framework was to help ensure that the prototype LEWS would create insight from the data and models and lead to behavioural change by recipients of the daily landslide forecast bulletins (i.e. District authorities).
The development of the LEWS conceptual framework occurred, not by design but out of necessity. At the start of the project, it was assumed all partners in the consortium had a shared vision for the LEWS. However, it quickly transpired that there were slightly different interpretations and nuances to this vision, which resulted in disparate working and a degree of disenfranchisement. By acknowledging this, and exploring it through a series of discussions and workshops, the consortium developed a shared and common conceptual framework for LANDSLIP’s prototype LEWS. This common framework helped guide the project and enabled all partners to realise how everyone contributed to the overall vision of the project. This session will cover some of the challenges, processes, outcomes and learning encountered through developing a conceptual framework for LANDSLIP’s prototype LEWS.
How to cite: Bee, E. and Malamud, B. and the LANDSLIP project partners: Developing the conceptual framework for a prototype government-led regional Landslide Early Warning System in India, EGU General Assembly 2022, Vienna, Austria, 23–27 May 2022, EGU22-4990, https://doi.org/10.5194/egusphere-egu22-4990, 2022.
EGU22-5272 | Presentations | NH3.7
Using machine learning for defining distributed monitoring variables correlated to the occurrence of rainfall-induced shallow landslides and debris flows: a case study in Campania region, ItalyMichele Calvello, Gaetano Pecoraro, Massimo Esposito, Marco Pota, Guido Rianna, and Alfredo Reder
Rainfall-induced shallow landslides and debris flows often cause casualties and significant damage to property. Territorial landslide early warning systems are recognized as an important countermeasure to avoid or reduce fatalities during rainfall events. A reliable warning model is a key component of these systems. Warning models operating over large areas usually relate the occurrence of landslides to rainfall monitoring data adopting appropriate thresholds (e.g., intensity-duration, cumulated rainfall-duration, hourly/daily rainfall indicators). The increasing availability of large sets of atmospheric and land monitoring data represents an opportunity to upgrade and improve existing landslide warning models. At the same time, appropriately treating such data may pose a significant challenge to analysts that are used to deal with much smaller amounts of data.
The objective of this preliminary study is to demonstrate that machine learning techniques can be effectively used to process monitoring data over large areas at regional scale, with the aim of defining and selecting the variables that best correlate with the initiation of shallow landslides and debris flows. The machine learning models have been tested in one of the warning zones defined by the regional civil protection agency for hydrogeological risk management in Campania (Italy). Two categories of data are used for the analyses: distributed monitoring data, and a landslide inventory. The monitoring variables are derived from the fifth generation of ECMWF atmospheric reanalysis (ERA5), available with a spatial resolution of about 31 km and a temporal resolution of 1 h (http://dx.doi.org/10.24381/cds.adbb2d47). Data on landslide events come from “FraneItalia”, a geo-referenced openly available catalogue of Italian landslides created consulting online news from 2010 onwards (http://dx.doi.org/10.17632/zygb8jygrw.2). Different machine learning models have been defined, trained, and tested to relate the occurrence of landslides in the case study area to multiple variables arising from different combinations of the adopted monitoring data, mainly rainfall and soil water content. The performance of these models is evaluated by means of standard contingencies and skill scores. The best performing variables are used to define an optimal multivariate threshold to be adopted in the landslide warning model. The results of the optimal model are also compared with the outcomes of an application of a more classical exceedance probability statistical methodology based on cumulated rainfall-duration thresholds.
How to cite: Calvello, M., Pecoraro, G., Esposito, M., Pota, M., Rianna, G., and Reder, A.: Using machine learning for defining distributed monitoring variables correlated to the occurrence of rainfall-induced shallow landslides and debris flows: a case study in Campania region, Italy, EGU General Assembly 2022, Vienna, Austria, 23–27 May 2022, EGU22-5272, https://doi.org/10.5194/egusphere-egu22-5272, 2022.
EGU22-5864 | Presentations | NH3.7
Assessing rainfall triggering of shallow landslides with an automatic tool generating thresholds: a case study for the Alpes-Maritimes region, FranceSophie Barthelemy, Séverine Bernardie, and Gilles Grandjean
In this work, we use a probabilistic approach for modelling rainfall thresholds (Caine 1980) triggering shallow landslides with a case study for the Alpes-Maritimes region (France).
In particular, the CTRL-T algorithm (Melillo and al. 2018) is tested to output critical rainfall thresholds, based on the accumulated rainfall – duration parameters (E-D), for different exceedance probabilities from respectively a landslide and two climate datasets. The first climate dataset stores high resolution gridded rainfall data (1km resolution, hourly) and the second climate dataset contains lower resolution gridded rainfall, snow, temperature and evapotranspiration data (8km resolution, daily); the first dataset provides the rainfall records directly used for defining the rainfall events and then for the threshold construction; the second one enables to assess the region’s climate via parameters imported in CTRL-T. The thresholds are then validated using a method designed by Gariano and al. (2015).
Several improvements are made to the method. First, potential evapotranspiration values approximated from temperatures and latitudes in one of the process’ steps are replaced by values from the second climate dataset, the result accounting best for the regional climate. Then, climate-specific duration values, used to split the raw rainfall records in events and sub-events, are computed for each mesh point. This second modification enables considering the heterogeneity of the Alpes-Maritimes climate.
Rainfall thresholds are eventually obtained for different exceedance probabilities, first from a set of probable conditions (MRC), then from a set of highly probable conditions (MPRC). The validation process strengthens the analysis as well as enables to identify best performing thresholds. This work represents novel scientific progress towards landslide reliable warning systems by (a) making a case study of probabilistic rainfall thresholds for Alpes-Maritimes, (b) using for the first time high-resolution rainfall data and (c) adapting the method to climatically heterogeneous zones.
How to cite: Barthelemy, S., Bernardie, S., and Grandjean, G.: Assessing rainfall triggering of shallow landslides with an automatic tool generating thresholds: a case study for the Alpes-Maritimes region, France, EGU General Assembly 2022, Vienna, Austria, 23–27 May 2022, EGU22-5864, https://doi.org/10.5194/egusphere-egu22-5864, 2022.
EGU22-5902 | Presentations | NH3.7
A data-driven approach to establish prediction surfaces for rainfall-induced shallow landslides in South Tyrol, ItalyStefan Steger, Robin Kohrs, Alice Crespi, Mateo Moreno, Peter James Zellner, Jason Goetz, Volkmar Mair, Stefano Luigi Gariano, Maria Teresa Brunetti, Massimo Melillo, Silvia Peruccacci, and Massimiliano Pittore
The occurrence of rainfall-induced shallow landslides is frequently caused by an interplay of predisposing environmental factors and dynamic preparatory and triggering conditions. For large-area assessments and for regional early warning, event-based landslide inventories are often employed to establish critical rainfall thresholds using statistical procedures (e.g., non-exceedance probability curves). These approaches typically put the spotlight on rainfall conditions associated with known landslide occurrences. Not accounting for rainfall conditions that did not induce slope instability comes along with a variety of criticalities, such as the impossibility to discriminate landslide from non-landslide rainfall conditions or the difficulty to validate the results.
This contribution proposes a data-driven approach based on Generalized Additive Mixed Models (GAMM) to identify season-dependent shallow landslide rainfall conditions for the province of South Tyrol, Italy. The work builds upon high resolution gridded daily rainfall data and landslide observations for the period from 2000 to 2020. The workflow comprised an initial filtering of rainfall-induced landslides (presence data) and a rule-based stratified random sampling procedure to select non-landslide rainy days at the same locations (absence data). The time periods (time windows in days) to describe preparatory and triggering cumulative rainfall conditions were determined using an optimization procedure based on cross validation. In addition to modelling a yearly effect, a circular day-of-the-year variable was included in the model to consider additional seasonal influences. The underlying nested data structure (i.e., repeated measurements at each landslide location) was accounted for via a location-dependent random intercept. The resulting probability scores for the analysed variables were validated using space-time cross validation, visualized in the form of probability surface plots and complemented with quantitative thresholds (e.g., curves that optimally separate landslide presences and absences).
Validation of the model showed a high capability to distinguish the two groups (presence vs. absence observations). The results further indicate that the temporal prediction of shallow landslides in South Tyrol can be improved by accounting for systematic seasonal effects other than triggering and preparatory rainfall variables. This novel approach is flexible and will further be extended to derive space-time predictions. Strengths and limitations for regional landslide early warning will be discussed.
The research leading to these results are related to the Proslide project that received funding from the research program Research Südtirol/Alto Adige 2019 of the Autonomous Province of Bozen/Bolzano – Südtirol/Alto Adige.
How to cite: Steger, S., Kohrs, R., Crespi, A., Moreno, M., Zellner, P. J., Goetz, J., Mair, V., Gariano, S. L., Brunetti, M. T., Melillo, M., Peruccacci, S., and Pittore, M.: A data-driven approach to establish prediction surfaces for rainfall-induced shallow landslides in South Tyrol, Italy, EGU General Assembly 2022, Vienna, Austria, 23–27 May 2022, EGU22-5902, https://doi.org/10.5194/egusphere-egu22-5902, 2022.
EGU22-6380 | Presentations | NH3.7
Rainfall thresholds for shallow landslides occurrence in a prone area of Northern ItalyValerio Vivaldi, Massimiliano Bordoni, and Claudia Meisina
Rainfall-induced shallow landslides can provoke severe consequences to people, infrastructures, cultivations and environment. For these reasons, it is necessary assessing the spatial and temporal probability of occurrence of these phenomena in the most prone zones of a territory, for early warning system strategies and land planning. The most adopted method for the determination of triggering events are rainfall thresholds. Empirical thresholds consider only rainfall attributes, such as duration, intensity and cumulated amount, while physically-based thresholds take into consideration also soil attribute, representing the soil conditions at the beginning of an event, such as the soil saturation degree at the depth of the sliding surface. This work focused to develop hydro empirical and physically-based thresholds for the occurrence of shallow landslides, taking into account field rainfall observations and soil moisture data, retrieved by hydrometeorological monitoring stations datasets. Monitoring stations were placed in 2 test sites representative of the hilly area of northern Italian Apennines and provided hydrometeorological time series, collecting data every 10 minutes. Empirical thresholds showed a good capacity to detect True Positives (TP: 95%) but they resulted affected by a high percentage of False Positives (FP: 24%), while physically-based thresholds detected 100% of TP and only 7% of FP, confirming the importance of soil conditions at the beginning of the event. Physically-based thresholds are reconstructed through a data-driven technique, based on “random forest”, that allows to find the best pair of parameters chosen within rainfall cumulated amounts and mean soil moisture conditions between 1 and 7 days. The model is calibrated considering a time span of 11 years (2007-2018) and validated using data between 2019 and 2021. The methodological approach is testing in different catchments of Oltrepò Pavese hilly area (northern Italy), that is representative of Italian Apennines environment. This work was made in the frame of the ANDROMEDA project, funded by Fondazione Cariplo.
How to cite: Vivaldi, V., Bordoni, M., and Meisina, C.: Rainfall thresholds for shallow landslides occurrence in a prone area of Northern Italy, EGU General Assembly 2022, Vienna, Austria, 23–27 May 2022, EGU22-6380, https://doi.org/10.5194/egusphere-egu22-6380, 2022.
Please decide on your access
Please use the buttons below to download the presentation materials or to visit the external website where the presentation is linked. Regarding the external link, please note that Copernicus Meetings cannot accept any liability for the content and the website you will visit.
Forward to presentation link
You are going to open an external link to the presentation as indicated by the authors. Copernicus Meetings cannot accept any liability for the content and the website you will visit.
We are sorry, but presentations are only available for users who registered for the conference. Thank you.
EGU22-6389 | Presentations | NH3.7
Empirical rainfall thresholds for landslide activity based on long-term Portuguese meteorological stationsTeresa Vaz and José Luís Zêzere
In this research the occurrence of landslides triggered by rainfall is investigated through the assessment of rainfall thresholds for three regions in Portugal: Lisbon, Oporto, and Coimbra. An historical landslide inventory is used, based on newspapers published between 1865 and 2010, associated with daily precipitation databases from three long-term meteorological stations. An empirical approach based on antecedent rainfall is applied to define the rainfall thresholds for landslides occurrence. The analysis is focused on each single rain gauge, for which the spatial representativeness is evaluated. The daily rainfall data is analysed using the Gumbel probability distribution for different durations. The critical rainfall combinations (cumulated rainfall duration) with the highest return period are associated with the landslide occurrence.
For the three regions, rainfall thresholds are defined from regression (linear and potential), extreme values (upper and lower) and probability (probability of a rainfall event resulting in a landslide event when the threshold is exceeded), and the results are assessed and calibrated using the receiver operating characteristic (ROC) metrics. The thresholds comparation reveal regional patterns in rainfall thresholds. The differences in regional critical rainfall conditions for landslide occurrence between regions are associated with geological, geomorphological, and climatic features.
This work is part of the project BeSafeSlide (BSS) - Landslide Early Warning soft technology prototype to improve community resilience and adaptation to environmental change [PTDC/GES-AMB/30052/2017]. JL Zêzere was supported by the RiskCoast project - Development of tools to prevent and manage geological risks on the coast linked to climate change, Interreg SUDOE [SOE3/P4/EO868]
How to cite: Vaz, T. and Zêzere, J. L.: Empirical rainfall thresholds for landslide activity based on long-term Portuguese meteorological stations, EGU General Assembly 2022, Vienna, Austria, 23–27 May 2022, EGU22-6389, https://doi.org/10.5194/egusphere-egu22-6389, 2022.
EGU22-6762 | Presentations | NH3.7
Rainfall thresholds for shallow landslides triggering in El SalvadorMario Reyes
El Salvador is a country that is geologically young in most of its territory, with steep slopes covered with unconsolidated volcanic sediments. It is frequently affected by extreme weather events and it also has the highest population density in Central America, which makes it very vulnerable to landslides. Therefore, predicting when landslides will occur it is necessary, and rainfall thresholds are a useful tool for that purpose. In this study, thresholds represented by cumulated rainfall (E, in mm) and duration (D, in hours) for shallow landslide initiation in El Salvador have been generated, with the objective of using them in the future in a national landslide early warning system. The thresholds have been delineated with the CTRL-T code (Melillo et al, 2018), which automatically reconstructs the rainfall conditions that triggered the landslides and determines thresholds at different non-exceedance probabilities. Rainfall data from an automatic rain gauge network and landslide data occurred in the period of 2004 to 2019 were used. A validation of the thresholds with the procedure introduced by Gariano et al (2015) has been conducted, using rainfall and landslide data for the year 2020. There are not previous ED thresholds at national level created for El Salvador, so a comparison with global and national thresholds from other countries was done.
References
Gariano S.L., Brunetti, M.T., Iovine, G., Melillo, M., Peruccacci, S., Terranova, O., Vennari, C., Guzzetti, F. (2015). Calibration and validation of rainfall thresholds for shallow landslide forecasting in Sicily, southern Italy. Geomorphology 228:653–665.
Melillo, M., Brunetti, M. T., Peruccacci, S., Gariano, S. L., Roccati, A., & Guzzetti, F. (2018). A tool for the automatic calculation of rainfall thresholds for landslide occurrence. Environmental Modelling & Software, 105:230-243.
How to cite: Reyes, M.: Rainfall thresholds for shallow landslides triggering in El Salvador, EGU General Assembly 2022, Vienna, Austria, 23–27 May 2022, EGU22-6762, https://doi.org/10.5194/egusphere-egu22-6762, 2022.
Please decide on your access
Please use the buttons below to download the presentation materials or to visit the external website where the presentation is linked. Regarding the external link, please note that Copernicus Meetings cannot accept any liability for the content and the website you will visit.
Forward to presentation link
You are going to open an external link to the presentation as indicated by the authors. Copernicus Meetings cannot accept any liability for the content and the website you will visit.
We are sorry, but presentations are only available for users who registered for the conference. Thank you.
EGU22-6795 | Presentations | NH3.7
Effect of data splitting and selection of machine learning algorithms for landslide susceptibility mappingMinu Treesa Abraham, Neelima Satyam, and Biswajeet Pradhan
Landslide susceptibility maps (LSMs) are inevitable parts of regional scale landslide forecasting models. The susceptibility maps can provide the spatial probability of occurrence of landslides and have crucial role in the development and planning activities of any region. With the wide availability of satellite-based data and advanced computational facilities, data driven LSMs are being developed for different regions across the world. Since a decade, machine learning (ML) algorithms have gained wide acceptance for developing LSMs and the performance of such maps depends highly on the quality of input data and the choice of ML algorithm. This study employs a k fold cross validation technique for evaluating the performance of five different ML models, viz., Naïve Bayes (NB), Logistic Regression (LR), Random Forest (RF), K Nearest Neighbors (KNN) and Support Vector Machines (SVM), to develop LSMs, by varying the train to test ratio. The ratio is varied by changing the number folds used for k fold cross validation from 2 to 10, and its effect on each algorithm is assessed using Receiver Operating Characteristic (ROC) curves and accuracy values. The method is tested for Wayanad district, Kerala, India, which is highly affected by landslides during monsoon. The results show that RF algorithm performs better among all the five algorithms considered, and the maximum accuracy values were obtained with the value of k as 8, for all cases. The variation between the minimum and maximum accuracy values were found to be 0.6 %, 0.74 %, 1.71 %, 1.92 % and 1.83 % for NB, LR, KNN, RF and SVM respectively.
How to cite: Abraham, M. T., Satyam, N., and Pradhan, B.: Effect of data splitting and selection of machine learning algorithms for landslide susceptibility mapping, EGU General Assembly 2022, Vienna, Austria, 23–27 May 2022, EGU22-6795, https://doi.org/10.5194/egusphere-egu22-6795, 2022.
EGU22-6895 | Presentations | NH3.7
Multi-model-based evaluation of landslide susceptibility in a meizoseismal areaXiao Wang, Di Wang, and Shaoda Li
On August 8, 2017, a magnitude 7 earthquake struck Jiuzhaigou County, Aba Prefecture, Sichuan Province, inducing a large number of landslides. Evaluating the susceptibility to landslides induced by strong earthquakes can provide a scientific basis for disaster risk management and monitoring. However, different evaluation models can obtain different spatial distributions of landslide susceptibility, and thus, selecting the optimal model is the most effective way to improve the susceptibility evaluation. To select the most suitable evaluation model for a strong earthquake area (Jiuzhaigou), 12 influencing factors affecting the landslide occurrence, including slope, elevation, and aspect, were extracted, and different statistical analysis methods and machine learning models were used to calculate the susceptibility index. The results show that the deep neural network model had the highest accuracy (85.4%), followed by the random forest and support vector machine models (84.2% and 82.3%, respectively), while the logistic regression model and certainty factor models achieved accuracies of 80.8% and 76.2%, respectively. Accordingly, the deep neural network model can be considered a new tool to achieve the more accurate zonation of landslide susceptibility in meizoseismal regions.
How to cite: Wang, X., Wang, D., and Li, S.: Multi-model-based evaluation of landslide susceptibility in a meizoseismal area, EGU General Assembly 2022, Vienna, Austria, 23–27 May 2022, EGU22-6895, https://doi.org/10.5194/egusphere-egu22-6895, 2022.
EGU22-6969 | Presentations | NH3.7
Development of a local impact-based Landslide Early Warning System using physically-based multi-hazards modelling and machine learning in Java, Indonesia.Andy Subiyantoro, Cees van Westen, Bastian van den Bout, Jetten Victor, Agus Muntohar, Akhyar Mushthofa, Ragil Andika Yuniawan, and Ratna Satyaningsih
Early Warning Systems are one of the most effective tools for reducing disaster risk, however the development of Landslide Early Warning Systems (LEWS) is complicated due to the random nature of landslide occurrence and the uncertainty in mapping the parameters that cause them. Local LEWS have been effective for known landslides, but regional scale LEWS based on rainfall thresholds have not been very effective up to now. In recent years physically-based multi-hazard models have been developed which allow to predict mass movement hazards at a local scale. However, it is still difficult to apply these in LEWS in a local scale due to the coarse resolution of rainfall estimates and the high computational modelling requirements for running such models real-time. On the other hand, machine learning approaches have been used to assess the relationship between the distribution of the landslide hazard and the catchment morphometric features.
This research applies a physically-based multi-hazard model combined with machine learning to forecast the mass movement impact, based on rainfall predictions in an area in Java, Indonesia. The landslide inventory was developed using a combination of local reporting data and machine learning techniques. The integrated physically-based multi hazard model OpenLISEM is used to create a database of hazard intensity maps under various rainfall scenarios. The resulting hazard intensity maps are subsequently used to subdivide the area in homogeneous zones for which warning levels are given. Machine learning is used to query the database and extract the most likely hazard intensity map based on the rainfall prediction. The intensity is then combined with exposure information of people, buildings, transportation infrastructure and agriculture to provide impact forecasts. The output of combining physically-based models with machine learning approaches has the potential to improve the prediction of landslide impact. The method also allows to make more specific local decisions related to the actions for various levels of warning (e.g. increased vigilance, removal of resources, evacuation of people). The method is currently under development as part of an Indonesian-Netherlands collaboration project to develop a blueprint to use tailored rainfall data, in combination with empirical and physically-based hydrological and landslide models, and historical landslide data for the development of thresholds for landslides and debris flows, as the basis for early warning at settlement level, applied to several test sites in Java.
How to cite: Subiyantoro, A., Westen, C. V., Bout, B. V. D., Victor, J., Muntohar, A., Mushthofa, A., Yuniawan, R. A., and Satyaningsih, R.: Development of a local impact-based Landslide Early Warning System using physically-based multi-hazards modelling and machine learning in Java, Indonesia., EGU General Assembly 2022, Vienna, Austria, 23–27 May 2022, EGU22-6969, https://doi.org/10.5194/egusphere-egu22-6969, 2022.
EGU22-7328 | Presentations | NH3.7
Seismically induced Landslide hazard assessment based on the spatial distribution of the slope strength demand in the Western HimalayasKunal Gupta and Neelima Satyam
Earthquake-induced landslides are among the most common seismic hazards in Indian Himalayan high terrains, claiming hundreds of lives and infrastructural losses. Uttarakhand state is in the Western Himalayas and comes under high seismic activity zones as per the seismic code of India. However, a detailed seismically induced landslide hazard assessment is unavailable for the region. Therefore, a parametric time probabilistic approach was used to evaluate the co-seismic landslide hazard in Uttarakhand. Characteristics of the seismicity affecting the area were considered to estimate the critical acceleration (Ac)x(p,t) that slopes should have to limit the probability of exceedance of Newmark displacement value x within time t. Initially, occurrence probabilities for different degrees of seismic shaking for a time frame of 50 years were calculated in terms of Arias intensity. Then, the spatial distribution of the slope strength demand was mapped using the empirical relationship of the Newmark displacement with Arias intensity and critical acceleration. Newmark displacement of 2 and 10 cm were considered critical thresholds with a 10% probability of exceedance. The obtained results suggested that the significant part of the region along the Main Boundary Thrust (MBT) and Main Central thrust (MCT) have Arias Intensity value greater than 2 m/s. Higher Arias intensity values of approximately 4.5 m/s for soil slope conditions and 3 m/s for rock slope conditions were observed throughout the lesser Himalayan zone. In these areas, for the thresholds mentioned above, the exceedance probability in 50 years reaches 50% in the case of 0.32 m/s for soil slope conditions and 70% in the case of 0:11 m/s for rock slope conditions. By comparing the anticipated strength demand with the actual critical acceleration values computed from slope material parameters and slope angle, the resultant slope strength demand maps could offer the basis for determining if particular slopes have a considerable failure probability.
How to cite: Gupta, K. and Satyam, N.: Seismically induced Landslide hazard assessment based on the spatial distribution of the slope strength demand in the Western Himalayas, EGU General Assembly 2022, Vienna, Austria, 23–27 May 2022, EGU22-7328, https://doi.org/10.5194/egusphere-egu22-7328, 2022.
Please decide on your access
Please use the buttons below to download the presentation materials or to visit the external website where the presentation is linked. Regarding the external link, please note that Copernicus Meetings cannot accept any liability for the content and the website you will visit.
Forward to presentation link
You are going to open an external link to the presentation as indicated by the authors. Copernicus Meetings cannot accept any liability for the content and the website you will visit.
We are sorry, but presentations are only available for users who registered for the conference. Thank you.
EGU22-7388 | Presentations | NH3.7
The use of robotized inclinometric system in Early Warning System. The case study of a large landslide monitoring.Danilo Godone, Paolo Allasia, Marco Baldo, Diego Guenzi, and Fabio De Polo
Geohazard monitoring is a key component in an early warning system (EWS). The implementation of monitoring actions provides data for the acquisition of variables related to the landslide, its triggering and kinematic; additionally, it can provide insights of its evolution in time in order to plan mitigation actions, including alarms and warnings. The use of high-frequency systems can also provide such data in the shortest time thus optimizing the aforementioned actions. In the last decades, numerous surface monitoring systems were developed, with various features, providing punctual information, like GNSS or Robotized Total Stations, at high frequency or large-scale data, i.e. Remote Sensing, at lower temporal resolution. The choice of the best one is related to the goals to be fulfilled but, independently from the selected method, surface techniques monitor only a displacement resulting from the sum of all the deep-seated ground deformations. To properly detect the subsoil behavior of a landslide, the use of subsurface sensors is necessary. To couple the subsoil survey with high frequency monitoring a robotic inclinometric system was developed, and patented, by the Geohazard Monitoring Group (GMG) of CNR-IRPI. The instrumentation features the operational characteristics of the manual inclinometric measures (reliability, double readings 0/180˚…) but integrates the advantages of the robotization (accuracy, measurement frequency…), too. The robotized instrumentation also called “Automated Inclinometer System” (AIS) allows the automatic exploration of all the borehole length (up to 120 meters in the standard configuration) with a single probe. The AIS is remotely connected by a 4G modem so it is possible to define the acquisition parameters, download measured data and check the device functioning parameters. The instrumentation was deployed, at the beginning of December 2021, in a borehole located in Passiria Valley (northeastern Italy) to monitor a large and slow-moving landslide involving the whole mountain face; thanks to instrumentation modularity, the AIS is ready to measure after only 4÷5 hours of installation time. Concurrently with the main installation, a GNSS benchmark was positioned and surveyed to provide, with the next measurement campaigns, a crosscheck with the AIS results. After 10÷15 days of monitoring at 1 measurement/day the landslide’s sliding surface, its depth and deformation rate, were clearly identified, thus confirming the capability of the AIS to perform early detection of the landslide kinematic. This result is key information in the risk reduction chain as it shortens the time necessary to achieve the numerical parameters describing the landslide and, consequently, plain the following, mitigating, actions.
How to cite: Godone, D., Allasia, P., Baldo, M., Guenzi, D., and De Polo, F.: The use of robotized inclinometric system in Early Warning System. The case study of a large landslide monitoring., EGU General Assembly 2022, Vienna, Austria, 23–27 May 2022, EGU22-7388, https://doi.org/10.5194/egusphere-egu22-7388, 2022.
EGU22-7819 | Presentations | NH3.7
Analysis of landslide-triggering rainfalls in a typhoon-prone region of the PhilippinesClàudia Abancó, Vicente Medina, Georgina L. Bennett, Adrian J. Matthews, and Marcel Hürlimann
The rain that falls weeks or months before the occurrence of landslides can play a major role in the failure process, therefore it is crucial to account for it in hazard assessments and warning systems. It is especially relevant in tropical areas, where the amount of water that falls during wet seasons can be very high. In the Philippines, rainfall and typhoon events trigger Multiple-Occurrence Regional Landslide Events (MORLEs, Crozier, 2005), which cause hundreds of fatalities and significant economic damage every year.
Satellite-based rainfall measurements (IMERG GPM) associated with three typhoons that triggered MORLEs in the area of Itogon (Benguet, Philippines) and water infiltrated into the soil during the previous months are analysed. Data from the three typhoons are compared with 560 high intensity rainfall events (from period 2000-2020) that did not trigger regional landslide events. Results show that landslides occurred when typhoon rainfall exceeds 300 mm and the water infiltrated was higher than 1000 mm in the previous months. For one specific landslide-triggering typhoon event, satellite-based soil moisture data (1 m top soil layer) are analysed and compared to other non-landslide triggering rainfalls. Results do not show a clear correlation of critical rainfall and soil moisture values that triggered landslides.
The findings of this work highlight that the antecedent rainfall, and in particular its infiltration below the top soil layer, plays a major role in the triggering process of landslides, especially in tropical regions.
Crozier, M.J. Multiple-occurrence regional landslide events in New Zealand: Hazardmanagement issues. Landslides 2, 247–256 (2005). https://doi.org/10.1007/s10346-005-0019-7
How to cite: Abancó, C., Medina, V., Bennett, G. L., Matthews, A. J., and Hürlimann, M.: Analysis of landslide-triggering rainfalls in a typhoon-prone region of the Philippines, EGU General Assembly 2022, Vienna, Austria, 23–27 May 2022, EGU22-7819, https://doi.org/10.5194/egusphere-egu22-7819, 2022.
EGU22-7863 | Presentations | NH3.7
Revisited Rainfall Threshold In the Indonesia Landslide Early Warning SystemRagil A Yuniawan, Ahmad Rifai, Fikri Faris, Cees van Westen, Victor Jetten, Bastian den Bout, Andy Subiyantoro, Agus Muntohar, Akhyar Musthofa, Rokhmat Hidayat, Alidina Hidayah, Banata Ridwan, Eka Priangga, Ratna Satyaningsih, and Samuel Sutanto
Landslides are one of the most disastrous natural hazards that frequently occur in Indonesia. Since 2017, Balai Sabo has developed an Indonesia Landslide Early Warning System (ILEWS) by utilizing a single rainfall threshold for an entire nation. This condition might lead to inaccuracy of the landslide prediction. Therefore, this study aims to improve the accuracy of the system by updating the rainfall threshold. This study focused on Java Island, where most of the landslides in Indonesia occur. We analyzed 420 landslide events with the one-day and three-day cumulative rainfall for each landslide event. Rainfall data were obtained from the Global Precipitation Measurement (GPM), which is also used in the ILEWS. We propose four methods to derive the thresholds, 1st is the existing threshold applied in the Balai Sabo-ILEWS, the 2nd and the 3rd use the average and minimum of rainfall that trigger landslides, respectively, and the 4th uses the minimum values of rainfall that induce major landslides. We employed the Receiver Operating Characteristic (ROC) analysis to evaluate the predictability of the rainfall thresholds. The 4th method shows the best result compared to the others, and this method provides a good prediction of landslide events with a low error value. The chosen threshold will be used as a new threshold in the Balai Sabo-ILEWS.
How to cite: Yuniawan, R. A., Rifai, A., Faris, F., Westen, C. V., Jetten, V., den Bout, B., Subiyantoro, A., Muntohar, A., Musthofa, A., Hidayat, R., Hidayah, A., Ridwan, B., Priangga, E., Satyaningsih, R., and Sutanto, S.: Revisited Rainfall Threshold In the Indonesia Landslide Early Warning System, EGU General Assembly 2022, Vienna, Austria, 23–27 May 2022, EGU22-7863, https://doi.org/10.5194/egusphere-egu22-7863, 2022.
EGU22-8081 | Presentations | NH3.7
Hydrometeorological thresholds based on catchment storage to predict changes in debris-flow susceptibility after the Wenchuan earthquake (Sichuan, China)Roberto Greco, Pasquale Marino, and Xuanmei Fan
After the 2008 Wenchuan earthquake (Mw 7.9), increased occurrence of rainfall-induced debris flows was initially observed in the earthquake-hit region (Sichuan, China). In the following years, the frequency of debris flows gradually reduced, indicating a progressive recovery of stability of debris deposits accumulated along slopes and in gullies after the earthquake. To assess these dynamically changing conditions, empirical thresholds have been identified to predict post-seismic debris flow occurrence with two approaches: a meteorological approach based only on precipitation characteristics, and a hydrometeorological approach that also considers the hydrologic conditions before the onset of rainfall. Both used the available record of precipitations and debris flows that occurred between 2008 and 2015 in several gullies, tributary of the upper Minjiang river course, in Wenchuan county. Hydrometeorological thresholds for debris flows were identified at the gully catchment scale, by assessing the water balance with a simplified lumped hydrological model, based on the Budyko framework. The parameters of the model were estimated based on the scarce available information about the water balance of the entire watershed of the upper Minjiang. Simulated catchment water storage was used as a proxy of the moisture state of the slopes. The results indicate that both meteorological and hydrometeorological thresholds allow catching the progressive recovery of stability of the debris deposits. Specifically, the assessment of water balance at the catchment scale highlights the role played by the hydrological processes affecting the slopes, leading to the definition of reliable thresholds, that resulted robust despite the uncertainty of the estimated parameters of the hydrological model. Therefore, the hydrometeorological approach appears suitable to define thresholds for early warning of debris flows at the catchment scale.
How to cite: Greco, R., Marino, P., and Fan, X.: Hydrometeorological thresholds based on catchment storage to predict changes in debris-flow susceptibility after the Wenchuan earthquake (Sichuan, China), EGU General Assembly 2022, Vienna, Austria, 23–27 May 2022, EGU22-8081, https://doi.org/10.5194/egusphere-egu22-8081, 2022.
EGU22-8464 | Presentations | NH3.7
Are hydrometeorological thresholds useful for regional-scale rockfall early warning systems? A preliminary analysis of the hydrometeorological conditions leading to rockfalls in NorwayRosa M Palau, Graham L Gilbert, Anders Solheim, Vittoria Capobianco, and Kjersti Gisnås
Norway's high-relief landscape is susceptible to gravity-driven natural hazards including snow avalanches, landslides, debris flows, and rockfalls. Rockfalls are the most numerous geohazard in Norway. There are currently over 35 000 rockfall events registered in Norway's national hazard database, accounting for nearly 50% of the total number of events for all hazard types. Rockfalls commonly impact the functioning of infrastructure assets such as roads and railways, and occasionally damage buildings and result in death.
The relationship between rockfall events and weather conditions is recognised but not straightforward. Several hydrometeorological variables are significant for rockfall triggering including precipitation, snow melt, freezing and thawing, temperature, insolation, and soil or rock moisture. The highest frequency of rockfall activity in Norway is observed in spring, a period of snowmelt and freeze-thaw cycling. Given the links to meteorological variables, rockfall frequency is expected to change with climate, altering the exposure of population and infrastructures to rockfalls.
Rockfall risk mitigation at regional scale is challenging. Early warning systems are a helpful tool to depict the time and location of future rockfall events so that emergency managers can act in advance. At present, most existing rockfall early warning systems (REWS) are based on the monitoring and analysis of seismic signals to determine the movement of boulders or the cracking of joints. Little previous research has been conducted to analyse the meteorological conditions that could trigger rockfalls. There is currently no REWS in Norway.
The main objective of this work is to investigate the feasibility of using hydrometeorological thresholds for regional scale rockfall warning. To do so rainfall, temperature, and soil moisture data from SeNorge.no, and the rockfall inventory contained in the Norwegian national hazard database have been analysed to find relations between the hydrometeorological conditions and the triggering of rockfalls in Norway.
How to cite: Palau, R. M., Gilbert, G. L., Solheim, A., Capobianco, V., and Gisnås, K.: Are hydrometeorological thresholds useful for regional-scale rockfall early warning systems? A preliminary analysis of the hydrometeorological conditions leading to rockfalls in Norway, EGU General Assembly 2022, Vienna, Austria, 23–27 May 2022, EGU22-8464, https://doi.org/10.5194/egusphere-egu22-8464, 2022.
EGU22-9375 | Presentations | NH3.7
The potential of Satellite and model derived precipitation and soil moisture for estimation of landslide hazard thresholds in RwandaJudith Uwihirwe, Alessia Riveros, Faraz Sadeghi Tehrani, Frederiek Sperna Weiland, Markus Hrachowitz, and Thom A. Bogaard A. Bogaard
A combination of extreme environmental conditions such as high soil moisture content and heavy or prolonged precipitation contribute to landslide initiation in mountainous areas worldwide. On-site soil moisture monitoring equipment and rain gauge have been widely used to record these variables despite the sparse spatial coverage. Satellite‐based technologies provide estimates of rainfall and soil moisture over large spatial areas sufficient to be explored for landslide hazard assessment in data scarce regions. In this study, we used statistical metrics to compare the gauge based to the satellite precipitation products: TRMM42, CHIRPS, PERSIANN-CDR, GLDAS-2.1, CFSV2, GPM-IMERG, and ERA-5 and assess their performance. Similarly, high resolution satellite and hydrological model derived soil moisture was compared to the automated soil moisture observations at Rwanda weather station sites to assess the usefulness in empirical landslide hazard assessment thresholds in Rwanda. Based on statistical indicators, the NASA GPM based IMERG showed the highest skill to reproduce the main spatiotemporal precipitation patterns. Similarly, the satellite and hydrological model derived soil moisture broadly reproduce the in situ measured soil moisture. The landslide explanatory variables from IMERG satellite precipitation; event rainfall volume E and Duration D in bilinear thresholds framework reveal promising results with improved landslide prediction capabilities in terms of true positive alarms ~80-90% and low rate of false alarms ~14-16%. However, the incorporation of satellite and model derived antecedent soil moisture to the empirical landslide hydro-meteorological thresholds showed no significant improvement. This may be attributed to the probable long and no constant timescale of the defined landslide triggering events that could be shortened to further improve the landslide prediction and support the early warning system development in Rwanda.
How to cite: Uwihirwe, J., Riveros, A., Sadeghi Tehrani, F., Sperna Weiland, F., Hrachowitz, M., and A. Bogaard, T. A. B.: The potential of Satellite and model derived precipitation and soil moisture for estimation of landslide hazard thresholds in Rwanda, EGU General Assembly 2022, Vienna, Austria, 23–27 May 2022, EGU22-9375, https://doi.org/10.5194/egusphere-egu22-9375, 2022.
EGU22-10251 | Presentations | NH3.7
Electrical Resistivity Tomography (ERT) Applied to the assessment of Karst Carbonate Aquifers structure: Case Study from Zaghouan-Bent Saidan (NE Tunisia)Amal Mhimdi, Hakim Gabtni, Ines Ezzine, Fadoua Hamzaoui, Mohamed Ghanmi, and Rachida Bouhlila
Abstract:
Karst aquifers belong to the fractured aquifer family. The Zaghouan region located in NE of Tunisia (North Africa) is characterized by a high degree of karstification due to the climate impact and the development of fracture network. Survey using electrical resistivity tomography (ERT) is deployed to provide a cost-effective characterization of the subsurface karst environments. A total of three ERT profiles with a length of 300 meters were evaluated in Zaghouan region.
The area represents an anticline of Jurassic limestone rocks, which is overlain by a thin clay layer. In this study, an ERT survey was conducted to examine the spatial distribution and shape of underground cavities in the karst area of Jebel Bent Saidan. In this study, geological, hydrogeological and electrical resistivity tomography (ERT) methods were applied to determine the geometry of the karst aquifer in the Zaghouan area (NE Tunisia). The area is characterized by fractured and karstic limestone aquifer of Jurassic. Three resistivity profiles were carried out along the study area (Jebel Bent Saidan). The correct resistivity data was interpreted using ZONDRes 2D software. The results of the interpreted geo-electrical sections showed that the resistivity of the carbonate aquifer ranges from 350 to over 4000 Ωm. The thickness of the aquifer varies between 15 and 30 meters, while its depth from the surface is between 10 and 40 meters. The ERT not only provided accurate near-surface information, but was also very useful in establishing the geometry of the aquifer. It was also very useful in establishing the 3D geometry and position of several potential karst cavities and conduits. The results show the presence of two large isolated cavities at different depths. The low resistivity of karst cavities in the Jurassic carbonate of Jebel Bent Saidane was explained by the saturation of groundwater. The ERT imaging technique using to identify and characterize the discontinuities, faults and water investigation of the fractured and karstified limestone aquifers in the Bent Saidan Mounts. The conducted research demonstrated that the ERT method was an effective tool for imaging the subsurface in the karst terrain.
Keywords: Bent Saidan (NE Tunisia), karst aquifers, electrical resistivity tomography (ERT), cavities.
How to cite: Mhimdi, A., Gabtni, H., Ezzine, I., Hamzaoui, F., Ghanmi, M., and Bouhlila, R.: Electrical Resistivity Tomography (ERT) Applied to the assessment of Karst Carbonate Aquifers structure: Case Study from Zaghouan-Bent Saidan (NE Tunisia), EGU General Assembly 2022, Vienna, Austria, 23–27 May 2022, EGU22-10251, https://doi.org/10.5194/egusphere-egu22-10251, 2022.
EGU22-10474 | Presentations | NH3.7
Extending a ML impact-based forecasting model for typhoons in the Philippines with a rainfall threshold for consecutive landslide eventsRenske Free, Marc van den Homberg, Frederiek Sperna Weiland, Aklilu Teklesadik, Massimo Melillo, and Thom Bogaard
Anticipatory action requires models that can accurately predict the impact of both the primary hazard and its consecutive events. In the Philippines, typhoons trigger 90% of landslides, causing a lot of fatalities and damage to infrastructure and agriculture. The lack of information on past landslides hampers the development of accurate forecasting models of landslide occurrence and impact. An impact-based forecasting model for typhoons currently operational in the Philippines predicts impact due to the high wind speeds associated with typhoons and includes the possible impact due to landslides only via a static landslide susceptibility map. This study expands the impact-based forecasting model of 510, an initiative of the Netherlands Red Cross, with a dynamic landslide component via hybrid modeling for two typhoon events in the Bicol region in the Philippines.
A hydrometeorological model to forecast landslide occurrences was successfully created, even with the limited data on landslide occurrences and rainfall available. The newly established regional event duration threshold was applied on the case study events with an increased impact boundary of 300 km compared to the typhoon impact boundary of 100 km. The dynamic multi-hazard model showed an improved impact forecast - compared to the model considering solely static input of landslides - both in geographical impact extent and accuracy: the True Positives doubled, whereas the False Negatives reduced by half. A separate landslide forecasting model as an extension of the existing ML model provided additional benefits as the models can be decoupled to optimize the performance and reliability of both models. This study resulted in a prototype of an impact-based multi-hazard or consecutive event model for the Philippines and demonstrated the importance of considering the impact from consecutive hazards.
Keywords: Landslide, typhoon, consecutive hazards, impact-based forecasting, rainfall, machine learning, Philippines
How to cite: Free, R., van den Homberg, M., Sperna Weiland, F., Teklesadik, A., Melillo, M., and Bogaard, T.: Extending a ML impact-based forecasting model for typhoons in the Philippines with a rainfall threshold for consecutive landslide events, EGU General Assembly 2022, Vienna, Austria, 23–27 May 2022, EGU22-10474, https://doi.org/10.5194/egusphere-egu22-10474, 2022.
Please decide on your access
Please use the buttons below to download the presentation materials or to visit the external website where the presentation is linked. Regarding the external link, please note that Copernicus Meetings cannot accept any liability for the content and the website you will visit.
Forward to presentation link
You are going to open an external link to the presentation as indicated by the authors. Copernicus Meetings cannot accept any liability for the content and the website you will visit.
We are sorry, but presentations are only available for users who registered for the conference. Thank you.
EGU22-10685 | Presentations | NH3.7
BeSafeSlide – A Landslide early warning soft technology prototype to improve community resilience and adaptation to environmental changeSérgio C. Oliveira, José L. Zêzere, Ricardo M. Trigo, Fernando Marques, Alexandre Tavares, Rui Marques, Alexandre M. Ramos, and Raquel Melo
As observed worldwide during the last decades, landslides are one of the deadliest natural hazards in mainland Portugal and Azores archipelago being responsible for significant direct and indirect societal and economic losses, justifying the implementation of a landslide early warning system at the regional scale.
The BeSafeSlide project aims to develop and implement a soft technology/low-cost prototype for precipitation-triggered landslide early warning system (LEWS) in Portugal. We plan it to allow be adaptable to a changing climate and a changing land use by working with different climate scenarios. Future changes on regional rainfall patterns due to climate change were evaluated in the LEWS for 2071-2100 period, considering two emission scenarios: RCP 4.5 and RCP 8.5. To evaluate future exposure trends and effects in risk analysis, simulations of changes in land use, by the end of the 21th century, will be carried out. The uncertainty of future projections will be addressed by developing a set of different scenarios.
The LEWS prototype for Portugal is sustained on different types of regional rainfall thresholds for landslide occurrence based on daily/hourly rainfall series available for each BeSafeSlide study area. The proposed prototype aims at integrating 3-day rainfall forecasts on rainfall thresholds monitoring and on dynamic physically based susceptibility models, to anticipate changes in hydrological conditions and consequently on the spatio-temporal occurrence of landslides. Special attention is given to two different types of rainfall-triggered landslide events, recognized as responsible for shallow and deep-seated landslides occurrence on natural slopes, which are permanently monitored within the regional early warning system in hotspot risk areas: (i) landslide events associated to intense, short-duration rainfall periods; and (ii) landslide events associated to long-lasting rainfall periods.
The LEWS main goals are to provide information to civil protection services to anticipate and manage people’s evacuation from landslide prone areas and to ensure the maintenance and operability of regional transport, energy and communications networks and the safeguarding of people´s lives. Although the LEWS is being developed within the framework of Portugal we expect to be applicable in different settings. The application of the LEWS will define warning communication procedures, assess response capacity of stakeholders and develop social capacity practices, to reduce vulnerability and mitigate risk, providing a reduction of affected people, economic losses and critical infrastructures/basic services disruptions.
Acknowledgments: This work was financed by national funds through FCT (Foundation for Science and Technology, I. P.), in the framework of the project BeSafeSlide – Landslide early warning soft technology prototype to improve community resilience and adaptation to environmental change (PTDC/GES-AMB/30052/2017), and the Research Unit UIDB/00295/2020 and UIDP/00295/2020.
How to cite: Oliveira, S. C., Zêzere, J. L., Trigo, R. M., Marques, F., Tavares, A., Marques, R., Ramos, A. M., and Melo, R.: BeSafeSlide – A Landslide early warning soft technology prototype to improve community resilience and adaptation to environmental change, EGU General Assembly 2022, Vienna, Austria, 23–27 May 2022, EGU22-10685, https://doi.org/10.5194/egusphere-egu22-10685, 2022.
EGU22-10918 | Presentations | NH3.7
Integration of the Terrain Characteristics and Data of Gaging Station for Mimicking the Plausible Surface of Slope Failures.Hock-Kiet Wong, Chih-Ling Wang, Ching-Yuan Ma, and Yih-Chin Tai
An Idealized curve surface (ICS) with two constant curvatures was proposed in Tai et al. (2020) for mimicking the plausible landslide failure surface in numerical simulation. For ease of illustrating the ICS, Ko et al. (2021) suggested the concept of a reference ellipse for constructing the associated ICS, i.e. the ellipse-ICS method. Hence, with respect to a landslide-prone area, the most appropriate ICS can be figured out by translating, rotating and side-tilting the reference ellipse.
In the present study, the criteria for the searching the most appropriate ICS consist of the terrain characteristics (cracks, scarps, erosion gullies) and the data of the gauging station (inclinometer and groundwater indicators), where the terrain characteristics indicate the plausible boundary of the failure area, the records of inclinometer help to identify the (local) depth of sliding surface. Since the inclinometer and groundwater indicators provide the local data only, the proposed ellipse-ICS method is employed as an efficient tool to construct the plausible ICS and to investigate the impacts of the groundwater distribution on the slope stability.
The ellipse-ICS method is therefore applied to two potential large-scale landslide areas in Taiwan, i.e., the T003 at Yanping Township in eastern Taiwan and the T002 at Fuxing District in northern Taiwan. The ICSs are identified with respect to the failure depths measured by inclinometer, where the safety factors are estimated. Together with the numerical approach given in Tai et al. (2019), the subsequent flow paths of post-failure can be estimated and may serve as useful information for hazard assessment.
Keywords:
ellipse-ICS, inclinometer, groundwater level, safety factors, flow paths
References
- Tai, Y. C., Heß, J., & Wang, Y. (2019). Modeling Two‐Phase Debris Flows with Grain‐Fluid Separation over Rugged Topography: Application to the 2009 Hsiaolin Event, Taiwan. Journal of Geophysical Research: Earth Surface, 124(2), 305-333.
- Tai, Y. C., Ko, C. J., Li, K. D., Wu, Y. C., Kuo, C. Y., Chen, R. F., & Lin, C. W. (2020). An idealized landslide failure surface and its impacts on the traveling paths. Frontiers in Earth Science, 8, 313.
- Ko, C. J., Wang, C. L., Wong, H. K., Lai, W. C., Kuo, C. Y. & Tai, Y. C. (2021). Landslide Scarp Assessments by Means of an Ellipse-Referenced Idealized Curved Surface. Frontiers in Earth Science, 9,862.
How to cite: Wong, H.-K., Wang, C.-L., Ma, C.-Y., and Tai, Y.-C.: Integration of the Terrain Characteristics and Data of Gaging Station for Mimicking the Plausible Surface of Slope Failures., EGU General Assembly 2022, Vienna, Austria, 23–27 May 2022, EGU22-10918, https://doi.org/10.5194/egusphere-egu22-10918, 2022.
EGU22-11011 | Presentations | NH3.7
Tailings dam monitoring and early warning with InSAR techniqueIda Svendsen, Luca Piciullo, Malte Vöge, Roberto Montalti, and Emanuele Intrieri
Waste materials produced by mining activities (tailings) can be collected in artificial ponds delimited by earth embankments (tailings dams). In case of tailings dam failure, the consequences are often catastrophic for the surrounding communities and livelihoods as this rupture may release large amounts of tailings and mining wastewater that moves downstream. Furthermore, the mining by-products cause, in many cases, a devastating impact on the surrounding environments and ecosystem. As an increased trend of tailings dam failure has been observed in the last decade, there is an urgent demand from the industry as well as the civil society and the investor community to gain a broader understanding of the risks posed by tailings facilities. Furthermore, efficient techniques to monitor and predict the failure of tailings dams are also crucial.
This study investigates how the satellite remote sensing interferometric synthetic aperture radar (InSAR) technique can be used to monitor tailings dams and the applicability of the inverse velocity method to predict failures. InSAR data have been used to map surface displacement prior to dam failures in two case studies: the Feijao tailings dam in Brazil and the Cadia tailings dam in Australia. In the case of the Feijao dam, both the SBAS and PS techniques were applied to process displacement time-series from the satellite data. For the Cadia dam, data processing was carried out using the SqueeSAR algorithm.
The inverse velocity method uses surface displacement measurement points to predict a time of failure. For the Feijao dam InSAR dataset, the inverse velocity method was applicable to different periods presenting an evident increase in the displacement rate. However, it was difficult to retrieve any reliable indication of failure. Contrary to the Feijao dam, the results from the Cadia dam shows a significantly accelerating deformation with time, and by applying the inverse velocity method a predicted time of failure can be retrieved in good agreement with the actual failure.
How to cite: Svendsen, I., Piciullo, L., Vöge, M., Montalti, R., and Intrieri, E.: Tailings dam monitoring and early warning with InSAR technique, EGU General Assembly 2022, Vienna, Austria, 23–27 May 2022, EGU22-11011, https://doi.org/10.5194/egusphere-egu22-11011, 2022.
EGU22-12227 | Presentations | NH3.7
Dynamic Rainfall Thresholds for Landslide Early Warning System in Progo Catchment, Java, IndonesiaRatna Satyaningsih, Victor Jetten, Janneke Ettema, Ardhasena Sopaheluwakan, Danang Eko Nuryanto, Yakob Umer, Tri Astuti Nuraini, and Rian Anggraeni
Landslide occurrences are governed by precondition factors and triggering factors. Hence, it is desirable to include physical parameters representing precondition factors in determining thresholds over which landslides are likely to occur. In the case of rainfall-triggered landslides, such parameters include soil properties and land cover information. However, high-resolution data required for a physical-based approach are rarely readily available for a large area, especially in developed countries. Therefore, in developing a landslide early warning system (LEWS) for a large area, rainfall thresholds are derived by optimizing the usage of rainfall datasets.
This study aims to derive rainfall thresholds from a meteorological perspective regarding rainfall event characteristics (e.g., cumulative rainfall, intensity, duration) that result in trigger the landslides in Progo Catchment in Java, Indonesia. We explore various hourly rainfall datasets, including rain gauge measurements and satellite-based rainfall products (e.g., the Japan Aerospace Exploration Agency’s Global Satellite Mapping of Precipitation/GSMaP and the Climate Prediction Center/National Oceanic and Atmospheric Administration’s morphing technique/ CMORPH), to derive the thresholds. The effect of rainfall event characteristics is assessed by clustering the rainfall event types and preceding conditions associated with different triggering mechanisms leading to the landslide occurrences. The rainfall thresholds are then derived using the frequentist method for each group, hence “dynamic.”
How to cite: Satyaningsih, R., Jetten, V., Ettema, J., Sopaheluwakan, A., Eko Nuryanto, D., Umer, Y., Astuti Nuraini, T., and Anggraeni, R.: Dynamic Rainfall Thresholds for Landslide Early Warning System in Progo Catchment, Java, Indonesia, EGU General Assembly 2022, Vienna, Austria, 23–27 May 2022, EGU22-12227, https://doi.org/10.5194/egusphere-egu22-12227, 2022.
Please decide on your access
Please use the buttons below to download the presentation materials or to visit the external website where the presentation is linked. Regarding the external link, please note that Copernicus Meetings cannot accept any liability for the content and the website you will visit.
Forward to presentation link
You are going to open an external link to the presentation as indicated by the authors. Copernicus Meetings cannot accept any liability for the content and the website you will visit.
We are sorry, but presentations are only available for users who registered for the conference. Thank you.
EGU22-12899 | Presentations | NH3.7
Rainfall induced shallow landslides: rainfall thresholds and antecedent conditionsElena Leonarduzzi, Reed Maxwell, and Peter Molnar
Landslides are a natural hazard affecting alpine regions all over the world. They cause not only substantial economic damages, but also human casualties. The focus here is on rainfall induced shallow landslides, which happen following an increase in the pore water pressure in the soil. As the name suggests, this typically occurs after rainfall events, either prolonged in time or short but intense, and combining such rainfall data with landslide inventories allows the definition of landslide-triggering rainfall thresholds. Nevertheless, it is now widely accepted that antecedent conditions, i.e., the wetness of the soil prior to the (non) triggering rainfall, also plays an essential role. Not accounting for the soil condition prior to the rainfall event is the main limitation of rainfall thresholds, together with the fact that they do not consider spatial heterogeneities within the domain.
Here we take advantage of two long records of daily rainfall (MeteoSwiss) and landslides events (WSL) existing in Switzerland, as well as the hydrological estimates provided by two hydrological forecasting systems operational over Switzerland. We use these not only to confirm the importance of antecedent conditions, but also to explore how to best exploit them to improve upon classical rainfall thresholds to predict landslide occurrence.
We start by considering antecedent rainfall and demonstrate that it is helpful in reducing the misclassification associated with rainfall thresholds: missed landslide events are anticipated by high N-day antecedent rainfall, while false alarms by low N-day antecedent rainfall. Recognising the limit of this simple proxy of antecedent conditions, which cannot account for snowmelt or water redistribution, we proceed by considering the soil saturation provided by a) a European physically based hydrological forecasting system (TerrSysMP) and b) a Swiss conceptual hydrological model (PREVAH). The comparison between these two systems leads to the following main findings. First, the soil saturation estimates provided by PREVAH are more informative for landslides prediction, due to a much higher spatial resolution (Prevah 250m while TerrSysMP 12.5km). Second, if spatial heterogeneities in triggering conditions are considered by using the hydrological soil wetness estimates for the calculation of the Factor of Safety (infinite slope stability model), the separation between triggering and non-triggering conditions improves compared to just using saturation. Third, while the information content of antecedent conditions is evident, accounting for them in a regional warning system is not straightforward. In fact, we find a classical hydrometeorological threshold (with a measure of antecedent conditions on the x-axis and a measure of triggering rainfall on the y-axis) to be less successful than a pure rainfall threshold. Instead, we propose a sequential threshold, where first a soil saturation threshold is used to separate “wet” and “dry” conditions, and then 2 rainfall thresholds are utilised for the wet and dry antecedent conditions.
How to cite: Leonarduzzi, E., Maxwell, R., and Molnar, P.: Rainfall induced shallow landslides: rainfall thresholds and antecedent conditions, EGU General Assembly 2022, Vienna, Austria, 23–27 May 2022, EGU22-12899, https://doi.org/10.5194/egusphere-egu22-12899, 2022.
Please decide on your access
Please use the buttons below to download the presentation materials or to visit the external website where the presentation is linked. Regarding the external link, please note that Copernicus Meetings cannot accept any liability for the content and the website you will visit.
Forward to presentation link
You are going to open an external link to the presentation as indicated by the authors. Copernicus Meetings cannot accept any liability for the content and the website you will visit.
We are sorry, but presentations are only available for users who registered for the conference. Thank you.
EGU22-13151 | Presentations | NH3.7
Geophysical imaging for local landslide early warning systemsJim Whiteley, Arnaud Watlet, John-Michael Kendall, and Jonathan Chambers
A complete assessment of slope stability is achieved by identifying and monitoring the subsurface properties and processes leading to slope failure conditions. Monitoring technologies need to be applied at appropriate scales and resolution, and with sufficient coverage, to be able to assess these conditions in local landslide early warning systems. A holistic understanding of the subsurface at the slope-scale is not always captured by some landslide monitoring approaches, such as remote sensing observations with limited depth penetration or sparse resolution, or point sensor measurements with highly localised information. Geophysical techniques have demonstrable capacity to link between the different scales, resolutions and coverage of these established landslide monitoring techniques. Here, we present a novel framework identifying the benefits and limitations of including geophysical imaging and monitoring techniques at different stages of local landslide early warning system strategies. These include the use of geophysical inputs to aid the design of local landslide early warning systems, monitor slopes at risk of failure, inform forecasting, and support decision making for stakeholders.
How to cite: Whiteley, J., Watlet, A., Kendall, J.-M., and Chambers, J.: Geophysical imaging for local landslide early warning systems, EGU General Assembly 2022, Vienna, Austria, 23–27 May 2022, EGU22-13151, https://doi.org/10.5194/egusphere-egu22-13151, 2022.
Please decide on your access
Please use the buttons below to download the presentation materials or to visit the external website where the presentation is linked. Regarding the external link, please note that Copernicus Meetings cannot accept any liability for the content and the website you will visit.
Forward to presentation link
You are going to open an external link to the presentation as indicated by the authors. Copernicus Meetings cannot accept any liability for the content and the website you will visit.
We are sorry, but presentations are only available for users who registered for the conference. Thank you.

EGU22-3253 | Presentations | GMPV9.2
Air quality real-time monitoring during volcanic crises with low-cost sensors: the Cumbre Vieja volcano study caseFátima Viveiros, Diogo Henriques, José Pacheco, Alexandra Moutinho, Marcos Martins, Sérgio Oliveira, Dário Silva, Tiago Matos, Pedro Hernández, Nemesio Pèrez, Catarina Goulart, Diamantino Henriques, Paulo Fialho, Luís Gonçalves, Carlos Faria, João Rocha, Eleazar Padrón, Jose Barrancos, and María Asensio-Ramos
Volcanic gases and particulate matter (PM) can be hazardous for population not only during an eruptive event, but also during the post-eruption phase, even at significant distances from the volcanic edifice. Volcanic plume dispersion can be affected by diverse factors, such as the weather conditions (e.g., wind speed and direction, rainfall) and/or the topography. Several studies have showed that gas concentrations and PM impacts on the quotidian life during a volcanic crisis can be significant, highlighting the importance of setting up permanent monitoring systems.
Instruments with carbon dioxide (CO2), sulphur dioxide (SO2)and particulate matter (PM2.5 and PM10) low-cost sensors were developed in order to easily and continuously monitor any volcanic area, and the 2021 Cumbre Vieja eruption was chosen as test site to deploy and validate the instrumentation. A network of nine instruments was set up around the volcanic eruption site, covering both the north and south areas of the lava flows, at distances varying between 1.6 and 7 km from the volcano craters. Five instruments were designed to work autonomously in the field, powered by batteries, and the electrical network powered the other four sensors. All nine instruments broadcasted the recorded data via LoRa communication.
The network settled after the 9th December 2021, closer to the ending of the eruptive period, recorded maximum CO2 concentrations of 1585 ppm at station named “Perm-2”, located at about 4.8 km distance from the volcanic craters, on the 21st December 2021. Regarding particulate matter, even if the 24 hour-mean standards set by the World Health Organization (WHO) for the PM2.5 and PM10 (25 mg/m3 and 50 mg/m3, respectively) were not exceeded during the monitored period, maximum concentrations were also recorded for these two parameters (470 and 874 mg/m3) at “Perm-2” in the 21st December. For the same period, the station located closer to the volcano craters measured maximum SO2 concentrations of 1.11 ppm. Maximum PM values were recorded also at other two monitoring sites in the same day, suggesting spatial and temporal correlation between the different parameters. In this particular case, and considering that maximum concentrations were registered during the night in the exclusion zone, one can reject the potential association of the measured values with suspended ashes resulting from sweeping and cleaning activities. For other periods, particularly after the ending of the eruption, this association must be considered. The highest concentrations of particles post-eruption were measured in the 31st December 2021 and 3rd January 2022.
The installed instruments seem to be adequate for an easier and faster deploy during a volcanic crises, allowing recognizing the presence of hazardous gas and particulate matter concentrations, crucial to reduce potential health effects on the population, even after the end of the eruptive phase.
How to cite: Viveiros, F., Henriques, D., Pacheco, J., Moutinho, A., Martins, M., Oliveira, S., Silva, D., Matos, T., Hernández, P., Pèrez, N., Goulart, C., Henriques, D., Fialho, P., Gonçalves, L., Faria, C., Rocha, J., Padrón, E., Barrancos, J., and Asensio-Ramos, M.: Air quality real-time monitoring during volcanic crises with low-cost sensors: the Cumbre Vieja volcano study case, EGU General Assembly 2022, Vienna, Austria, 23–27 May 2022, EGU22-3253, https://doi.org/10.5194/egusphere-egu22-3253, 2022.
EGU22-4591 | Presentations | GMPV9.2 | Highlight
Tomographic imaging of the magmatic system feeding the 2021 Cumbre Vieja eruption (La Palma, Canary Islands).Luca D'Auria, Ivan Koulakov, Janire Prudencio, Iván Cabrera-Pérez, Jesús M. Ibáñez, Jose Barrancos, Rubén García-Hernández, David Martínez van Dorth, Germán D. Padilla, Monika Przeor, Victor Ortega, Pedro Hernández, and Nemesio M. Peréz
The 2021 Cumbre Vieja surprised the worldwide volcanological community for its peculiar, unexpected features. Among these are the quite explosive character, even having the erupted magma a femic composition, the long duration (almost three months) and the huge erupted volume (more than 200 Mm3). The eruption was preceded by seismicity starting in Oct. 2017. However, the genuine precursory seismicity began only eight days before the eruption, with an evident upward migration of hypocenters. During the eruption, the seismicity mainly was concentrated at a subcrustal (10-15 km) and an upper mantle (20-25) depth.
Before and during the eruption, we collected a dataset of 11,349 earthquakes recorded from 7 October 2017 to 13 to December 2021 with 140,078 P wave and 155,231 S wave picks. We performed a high-resolution traveltime tomography, obtaining a three-dimensional P and S-wave velocity model up to a depth of about 25 km. The tomographic models evidence the presence of various interesting structures. At shallow depth (< 3 km), we identified a localized low-velocity anomaly interpreted as a volume of hydrothermal alteration. The Moho shows a complex geometry, with an upwelling beneath Cumbre Vieja volcano up to 10 km depth. Finally, a large deep volume (> 400 km3) is characterized by high Vp/Vs values. This volume can be possibly related to the main magmatic reservoir feeding the eruption.
The tridimensional velocity model also allowed for a precise relocation of the seismicity, providing an interesting insight into the evolution of the eruption. Before eruption onset, magma ascended from about 10 km depth to the surface in a few days. The melt migration occurred along the contact between consolidated oceanic crust and altered hydrothermal material at shallow depth. We postulate that similar structural discontinuities could potentially drive the formation of new eruptive centres during future eruptions.
How to cite: D'Auria, L., Koulakov, I., Prudencio, J., Cabrera-Pérez, I., Ibáñez, J. M., Barrancos, J., García-Hernández, R., Martínez van Dorth, D., Padilla, G. D., Przeor, M., Ortega, V., Hernández, P., and Peréz, N. M.: Tomographic imaging of the magmatic system feeding the 2021 Cumbre Vieja eruption (La Palma, Canary Islands)., EGU General Assembly 2022, Vienna, Austria, 23–27 May 2022, EGU22-4591, https://doi.org/10.5194/egusphere-egu22-4591, 2022.
Please decide on your access
Please use the buttons below to download the presentation materials or to visit the external website where the presentation is linked. Regarding the external link, please note that Copernicus Meetings cannot accept any liability for the content and the website you will visit.
Forward to presentation link
You are going to open an external link to the presentation as indicated by the authors. Copernicus Meetings cannot accept any liability for the content and the website you will visit.
We are sorry, but presentations are only available for users who registered for the conference. Thank you.

EGU22-4943 | Presentations | GMPV9.2 | Highlight
The hows and whys of pre-eruptive magma migration before 2021 Cumbre Vieja eruptionPablo J. Gonzalez, María Charco, Yu Jiang, Antonio Eff-Darwich, Eugenio Sansosti, Diego Reale, Yu Morishita, Hiroshi Munekane, and Tomokazu Kobayashi
Reservoirs accumulate and evolve magma during decades to centuries under Canary Islands volcanoes. Finally, magma migrates towards the surface before eruptions. However, little is known about the pathways and mechanisms controlling this migration. Past low eruption recurrence rate and the fact that the most recent 2011-2012 El Hierro eruption was off-shore hampered us to fully understand the magma(s) migration process. During the 2021 Cumbre Vieja eruption eruptible magmas showed remarkable mobility during the preceding 8 days before the eruption on the 13th of September 2021. This magma migration was reflected as surface ground deformation and seismicity. We used satellite radar interferometry to track 1) the geometry of the active magmatic reservoirs, and 2) the dynamics of magma emplacement and migration. To further, speculate about the reasons for that geometry and dynamics. Hence, the 2021 Cumbre Vieja eruption represents a unique opportunity to learn more about the mechanisms that facilitate magma migration beneath these volcanoes, and compare it with similar basaltic volcanoes. Our work aims to contribute knowledge that will help hazard assessment and volcanic risk reduction.
How to cite: Gonzalez, P. J., Charco, M., Jiang, Y., Eff-Darwich, A., Sansosti, E., Reale, D., Morishita, Y., Munekane, H., and Kobayashi, T.: The hows and whys of pre-eruptive magma migration before 2021 Cumbre Vieja eruption, EGU General Assembly 2022, Vienna, Austria, 23–27 May 2022, EGU22-4943, https://doi.org/10.5194/egusphere-egu22-4943, 2022.
EGU22-5041 | Presentations | GMPV9.2 | Highlight
Faulting and crater development controlled by pre-existing topography - evidence from drone and satellite observations during the 2021 Cumbre Vieja eruptionThomas R. Walter, Edgar Zorn, Pablo J. Gonzalez, Simon Plank, Valeria Munoz Villacreses, Alina Shevchenko, Nicole Richter, and Carla Valenzuela Malebran
Volcanic terrains host complex and commonly steep morphologies and are often also subject to tensile and shear faulting episodes. Previous studies demonstrated that strike slip and dip slip faults deflect at topographic highs and may locally diverge to develop multiple fault branches with varying strike and dip directions. Although fault deflection is associated with dike-related faults, a direct link to the positioning of eruption craters could not be established yet. Here we show that the Cumbre Vieja eruptions occurred in a complex pre-existing topographic and structural environment that affected fault development and evolution of eruption vents.
We investigate available satellite radar data from the CosmoSkymed and TerraSAR-X missions, to track the temporal and spatial evolution of summit craters and faults. We find that summit craters are closely aligned in a direction NW-SE and developing a nested structure. We also conducted repeat drone measurements to acquire close-range optical images of the summit and nearby flanks. Results allow an in-depth analysis of the morphology of craters and the geometry, traces and throws of faults. We find that in late stages of the eruption important tensile faults evolve, and deflect at pre-existing topographic highs. We further find that these faults are developing complex sinkholes and secondary features due to their burial by loose unconsolidated material (i.e. tephra), and that the faults converge again at topographic lows, with varying degrees of the slip or dilation tendency. We discuss the coalignment of these structures with crater alignments, and present results from analogue models aiming to better constrain the varying deflection of faults controlled by topography.
How to cite: Walter, T. R., Zorn, E., Gonzalez, P. J., Plank, S., Villacreses, V. M., Shevchenko, A., Richter, N., and Malebran, C. V.: Faulting and crater development controlled by pre-existing topography - evidence from drone and satellite observations during the 2021 Cumbre Vieja eruption, EGU General Assembly 2022, Vienna, Austria, 23–27 May 2022, EGU22-5041, https://doi.org/10.5194/egusphere-egu22-5041, 2022.
EGU22-5133 | Presentations | GMPV9.2
Spatio-temporal velocity variations observed during the pre-eruptive episode of La Palma eruption inferred from ambient noise interferometryIván Cabrera Pérez, Luca D'Auria, Jean Soubestre, Monika Przeor, Ivan Koulakov, David Martínez van Dorth, Jesús M. Ibáñez, Víctor Ortega, José Barrancos, Germán D. Padilla, Rubén García-Hernández, and Nemesio Pérez
On September 19th, 2021, a volcanic eruption began on La Palma, resulting in a significant social, economic and scientific impact. Earthquakes were first recorded in 2017, however, the pre-eruptive unrest started on Sept. 11st, 2021, only a few days before the eruption. It was characterized by a seismic sequence with hypocenters located at a depth of less than 10 km and ground deformation that reached more than 20 cm in the vertical component of the GPS. Surprisingly, this episode was very short, however, given the large amount of scientific instrumentation (seismometers, GPS, etc.) operated by the Instituto Volcanológico de Canarias (INVOLCAN) and other scientific institutions, the entire pre-eruptive episode has been accurately monitored, and the civil protection authorities were notified about the development of the volcanic unrest in advance. One of the techniques that have shown great potential in volcanic monitoring is ambient noise interferometry. This method consists in estimating the relative velocity variations using empirical Green’s functions retrieved through the cross-correlations of ambient noise signals. In this study, we applied this technique to the data recorded by six broadband seismic stations that allowed us to estimate spatio-temporal relative velocity variation during the week preceding the eruption.
The overall pattern of the pre-eruptive seismicity shows a progressive westward and upward migration of the hypocenters. However, five days before the eruption, we observed the occurrence of shallow (< 5 km) low magnitude earthquakes, whose hypocenters were detached from the main seismic cluster. At the same time, seismic interferometry detected a decrease in the seismic velocity in the region where such hypocenters were located. Therefore, we interpret those earthquakes as the effect of triggering caused by hydrothermal fluids released by the ascending magma and reaching shallow depths faster than magma.
Furthermore, a couple of days before the eruption, an even more significant reduction in relative velocity variation was observed, possibly corresponding to the rapid magmatic upward intrusion process, which led to the volcanic eruption.
How to cite: Cabrera Pérez, I., D'Auria, L., Soubestre, J., Przeor, M., Koulakov, I., Martínez van Dorth, D., Ibáñez, J. M., Ortega, V., Barrancos, J., Padilla, G. D., García-Hernández, R., and Pérez, N.: Spatio-temporal velocity variations observed during the pre-eruptive episode of La Palma eruption inferred from ambient noise interferometry, EGU General Assembly 2022, Vienna, Austria, 23–27 May 2022, EGU22-5133, https://doi.org/10.5194/egusphere-egu22-5133, 2022.
Please decide on your access
Please use the buttons below to download the presentation materials or to visit the external website where the presentation is linked. Regarding the external link, please note that Copernicus Meetings cannot accept any liability for the content and the website you will visit.
Forward to presentation link
You are going to open an external link to the presentation as indicated by the authors. Copernicus Meetings cannot accept any liability for the content and the website you will visit.
We are sorry, but presentations are only available for users who registered for the conference. Thank you.
EGU22-5225 | Presentations | GMPV9.2
Electromagnetic monitoring of the Cumbre Vieja eruption (La Palma, Canary Islands)David Martínez van Dorth, Perla Piña-Varas, Iván Cabrera-Pérez, Juanjo Ledo, Luca D'Auria, and Nemesio Pérez
Geophysical monitoring is essential to understand the activity and behaviour of volcanoes, especially when new or unusual signs are detected. Monitoring would help to address critical issues, such as the evolution of the magma at depth, which is of particular interest when the volcanic event takes place in populated areas. Among the geophysical methods, the electromagnetic ones have not been widely used in volcanic monitoring. However, these methods are very sensitive to the presence of fluids and therefore, to the presence of magma, since this will have a significant impact on the electrical resistivity of the subsoil.
Thus, after the onset of the volcanic eruption that began on September, 19, 2021 in the Cumbre Vieja area, on the island of La Palma (Canary Islands), several magnetotelluric stations were installed to perform a volcanic monitoring experiment. The different geophysical stations were installed in the surroundings of the volcanic edifice, as well as in those areas where the epicenters of the major seismic swarms were located. Magnetotelluric stations have been installed for continuous monitoring, recording electric and magnetic fields in the N-S and E-W directions. According to the quality of the data, we have obtained transfer functions for the period range of 0.001 - 100 s.
The aim of this experiment is to analyze the possible variations of the apparent resistivity and phase curves in time. In addition, the electrical resistivity model of the island published in 2020 will be compared with the seismicity that has been occurring since the beginning of the volcanic crisis.
The first preliminary results show slight changes in time and, in comparison with the previous data, this could be related to magmatic movements at depth. Furthermore, the comparison of the seismicity with the previous electrical resistivity model shows that most of the epicenters are located outside the clay cap. This epicenter-resistivity structure relationship is highlighting the considerable difference in the behavior of the clay layer and the surrounding rocks, which is somewhat validating the resistivity model and its interpretation.
How to cite: Martínez van Dorth, D., Piña-Varas, P., Cabrera-Pérez, I., Ledo, J., D'Auria, L., and Pérez, N.: Electromagnetic monitoring of the Cumbre Vieja eruption (La Palma, Canary Islands), EGU General Assembly 2022, Vienna, Austria, 23–27 May 2022, EGU22-5225, https://doi.org/10.5194/egusphere-egu22-5225, 2022.
Please decide on your access
Please use the buttons below to download the presentation materials or to visit the external website where the presentation is linked. Regarding the external link, please note that Copernicus Meetings cannot accept any liability for the content and the website you will visit.
Forward to presentation link
You are going to open an external link to the presentation as indicated by the authors. Copernicus Meetings cannot accept any liability for the content and the website you will visit.
We are sorry, but presentations are only available for users who registered for the conference. Thank you.
EGU22-5603 | Presentations | GMPV9.2
Sulphur dioxide (SO2) emissions by means of miniDOAS measurements during the 2021 eruption of Cumbre Vieja volcano, La Palma, Canary IslandsVioleta T. Albertos, Guillermo Recio, Mar Alonso, Cecilia Amonte, Fátima Rodríguez, Claudia Rodríguez, Lia Pitti, Victoria Leal, Germán Cervigón, Judith González, Monika Przeor, José Manuel Santana-León, José Barrancos, Pedro A. Hernández, Germán D. Padilla, Gladys V. Melián, Eleazar Padrón, María Asensio-Ramos, and Nemesio M. Pérez
Cumbre Vieja is the most active volcano of the Canary Islands since it has been the scenario of 8 of 17 historical eruptions in this archipelago. A recent magmatic reactivation started at Cumbre Vieja volcano on October 2017, and 9 additional seismic swarms occurred until the recent eruption which started on September 19, 2021, and ended on December 13, 2022 after 85 days of eruption. Since the first day of the eruption, extending to current days, INVOLCAN performed the monitoring of SO2 realesed by this eruption using a miniDOAS on terrestrial (car), sea (ship) and air (helicopter) mobile position. More than 360 measurements of SO2 emission rates were carried out daily. The standard deviation of the estimated values obtained daily was ~ 20%. During the first days of the eruption, estimated SO2 emission rates reached more than 30,000 tons/day, and maintaining weekly average values above 10,000 tons/day until the end of the eruption. After a final paroxysmal phase with an eruptive column of 8,500 m altitude, decreased significantly to averages values of 250 tons/day. Estimated SO2 emission rates from the 2021 Cumbre Vieja eruption became a powerful tool to contribute to the understanding of eruptive dynamics.
How to cite: Albertos, V. T., Recio, G., Alonso, M., Amonte, C., Rodríguez, F., Rodríguez, C., Pitti, L., Leal, V., Cervigón, G., González, J., Przeor, M., Santana-León, J. M., Barrancos, J., Hernández, P. A., Padilla, G. D., Melián, G. V., Padrón, E., Asensio-Ramos, M., and Pérez, N. M.: Sulphur dioxide (SO2) emissions by means of miniDOAS measurements during the 2021 eruption of Cumbre Vieja volcano, La Palma, Canary Islands, EGU General Assembly 2022, Vienna, Austria, 23–27 May 2022, EGU22-5603, https://doi.org/10.5194/egusphere-egu22-5603, 2022.
EGU22-5629 | Presentations | GMPV9.2 | Highlight
CO2-rich emissions from alkalic magmatism in the Canary Islands, SpainMike Burton, Alessandro Aiuppa, María Asensio-Ramos, Alessandro La Spina, Patrick Allard, Emma Liu, Vittorio Zanon, Ana Pardo Cofrades, José Barrancos, Kieran Wood, Marcello Bitetto, Eleazar Padrón, Joao Pedro Lages, Catherine Hayer, Klaudia Cyrzan, Federica Schiavi, Estelle Rose-Koga, Pedro Hernández, Luca D'Auria, and Nemesio Pérez
Mafic alkali-rich magmas, such as those which form the Canary Islands, Spain, have been proposed as being CO2-rich due to low-degree partial melting and the presence of recycled oceanic crust in the mantle source region. A CO2-rich mantle source of Canary magmas has been suggested from melt inclusions study of the 2011 submarine El Hierro eruption, but this has not been verified yet by directly measuring magmatic CO2 emissions during a subaerial eruption as the last such event in the archipelago, in 1971, occurred before the advent of modern gas sensing tools. Here we report on the first results for gas emissions from the
2021 eruption of Cumbre Vieja on La Palma island. We determined the chemical composition and mass flux of magmatic degassing during both effusive and explosive activities by combining direct plume measurements with MultiGas sensors from the ground, UAV and helicopter, OP-FTIR remote sensing and satellite-based (TROPOMI) SO2 flux quantification based on back-trajectory modelling. Degassing mass budgets and the magma volatile concentrations were then derived from microprobe analysis of olivine-hosted melt inclusions and comparing our gas results with best estimates of the magma extrusion rates during both explosive and effusive activities. Based on this approach we obtain a direct quantification of the initial CO2 content of the magma and of the exsolved pre-eruptive CO2 gas phase that fed the Cumbre Vieja eruption.
We find unprecedentedly high CO2 content in the mantle source of La Palma magma, consistent with high volatile contents predicted from petrological analyses. Eruptions of oceanic island alkali-rich magmas produce disproportionately high CO2 emissions, highlighting the key role mantle heterogeneity plays in determining the impact of intraplate volcanism.
How to cite: Burton, M., Aiuppa, A., Asensio-Ramos, M., La Spina, A., Allard, P., Liu, E., Zanon, V., Pardo Cofrades, A., Barrancos, J., Wood, K., Bitetto, M., Padrón, E., Lages, J. P., Hayer, C., Cyrzan, K., Schiavi, F., Rose-Koga, E., Hernández, P., D'Auria, L., and Pérez, N.: CO2-rich emissions from alkalic magmatism in the Canary Islands, Spain, EGU General Assembly 2022, Vienna, Austria, 23–27 May 2022, EGU22-5629, https://doi.org/10.5194/egusphere-egu22-5629, 2022.
EGU22-6345 | Presentations | GMPV9.2
Diffuse He and H2 emissions from Cumbre Vieja volcano before and during the recent eruption, La Palma, Canary IslandsGladys Melián, Ana Meire, Cecilia Amonte, Lia Pitti Pimienta, Daniel Di Nardo, Mar Alonso, Maud Smit, Victoria Leal, Rubén García-Hernández, William Hernández, Sonia M.M. Pereira, Simone Aguiar, Leticia Ferrera, and Nemesio M. Pérez
La Palma Island (708 km2) is located at the north-west and is one of the youngest (~2.0My) of the Canarian Archipelago. On September 19, 2021, a new volcanic eruption occurred at Cumbre Vieja volcanic system at the southern part of the island, the most active basaltic volcano in the Canaries. The erupting fissure (~1.0 km-length) is characterized by lava effusion, strombolian activity, lava fountaining, ash venting and gas jetting. After 85 days of eruption finished on December 13, 2021. We report herein the results of an intensive soil gas study, focused on non-reactive and/or highly mobile gases such as helium (He) and hydrogen (H2), in Cumbre Vieja. He has unique characteristics as a geochemical tracer: it is chemically inert and radioactively stable, non-biogenic, highly mobile and relatively insoluble in water. H2 is one of the most abundant trace species in volcano-hydrothermal systems and is a key participant in many redox reactions occurring in the hydrothermal reservoir gas. Since 2002, soil gas samples were regularly collected at ~40 cm depth using a metallic probe at 600 sites for each survey. He content was analysed by means of a quadrupole mass spectrometer (QMS; Pfeiffer Omnistar 422 and HIDEN QGA) and H2 concentrations by a micro-gas chromatograph (microGC; VARIAN CP490). Spatial distribution maps have been constructed following the sequential Gaussian simulation (sGs) procedure to quantify the diffuse He and H2 emission from the studied area. The time series of both diffuse He and H2 emission show significant increases before and during the occurrence of seismic swarms that took place in the period 2017-2021. During the eruptive period, significant increases in diffuse He and H2 emission were also observed with good temporal agreement with the increase of the volcanic tremor. These increases in diffuse He and H2 emission preceded the peak of diffuse CO2 emission as expected by the characteristics of these gases. The absence of visible volcanic gas emissions (fumaroles, hot springs, etc.) at the surface environment of Cumbre Vieja, makes this type of studies in an essential tool for volcanic surveillance purposes.
How to cite: Melián, G., Meire, A., Amonte, C., Pitti Pimienta, L., Di Nardo, D., Alonso, M., Smit, M., Leal, V., García-Hernández, R., Hernández, W., Pereira, S. M. M., Aguiar, S., Ferrera, L., and Pérez, N. M.: Diffuse He and H2 emissions from Cumbre Vieja volcano before and during the recent eruption, La Palma, Canary Islands, EGU General Assembly 2022, Vienna, Austria, 23–27 May 2022, EGU22-6345, https://doi.org/10.5194/egusphere-egu22-6345, 2022.
EGU22-6419 | Presentations | GMPV9.2
Texturally constrained machine learning thermobarometry and chemometry of the Cumbre Vieja 2021 eruption, La PalmaOliver Higgins, Corin Jorgenson, Alessandro Musu, Fátima Rodríguez, Beverley Coldwell, Alba Martín-Lorenzo, Matt Pankhurst, Luca D’Auria, Guido Giordano, and Luca Caricchi
Magma has a dynamic and often-complex journey from source to surface, the record of which is largely encoded in the chemistry of minerals. Its storage conditions prior to eruption and modifications during ascent can influence eruptive dynamics and eruption duration. We present quantitative 2D chemical maps of clinopyroxene crystals from the Cumbre Vieja eruption (La Palma, Canary Islands; 19th September 2021 – 13th December 2021). The histories of individual crystals are constrained using novel thermobarometric (pressure, temperature) and chemometric (equilibrium melt composition) machine learning algorithms. We identify the remobilisation of colder (~950 ˚C), deeper (2 – 3.5 kbar), and more evolved (1 – 2 wt% MgO) cores by a hotter (1050 – 1100 ˚C) and less-evolved (3.5 – 4.5 wt% MgO) carrier melt. Textural evidence shows resorption of these antecrystic cores suggesting an uninterrupted ascent through the crustal column followed by upper-crustal (~ 1kbar) crystallisation and eruption. By using both quantitative maps and reliable single-phase thermobarometric and chemometric calibrations, we overcome several issues associated with acquiring statistically representative mineral chemistry via single spot analyses. In doing so we precisely track the syn-eruptive evolution of storage pressure-temperature and magma composition. These parameters are then related to the variation of geophysical signals (seismicity, gas monitoring) recorded during the La Palma eruption.
How to cite: Higgins, O., Jorgenson, C., Musu, A., Rodríguez, F., Coldwell, B., Martín-Lorenzo, A., Pankhurst, M., D’Auria, L., Giordano, G., and Caricchi, L.: Texturally constrained machine learning thermobarometry and chemometry of the Cumbre Vieja 2021 eruption, La Palma, EGU General Assembly 2022, Vienna, Austria, 23–27 May 2022, EGU22-6419, https://doi.org/10.5194/egusphere-egu22-6419, 2022.
EGU22-7705 | Presentations | GMPV9.2
Gas hazard assessment at Puerto Naos and La Bombilla inhabited areas, Cumbre Vieja volcano, La Palma, Canary IslandsPedro A. Hernández, Eleazar Padrón, Gladys V. Melián, Nemesio M. Pérez, Germán Padilla, María Asensio-Ramos, Daniel Di Nardo, José Barrancos, José M. Pacheco, and Maud Smit
The recent volcanic eruption of Cumbre Vieja, on the island of La Palma, has beenconsidered by many to be the most important and devastating urban eruption of the last 100 years in Europe. After its completion on December 13, 2021, some urban areas not directed damaged by lava flows are affected by strong carbon dioxide (CO2) emissions from the soil. CO2 is a toxic gas at high concentration, as well as an asphyxiant gas and may be lethal when present in concentrations higher than 15 V%. The base of the small cliff where the La Bombilla neighborhood is located as well as the basements and garages of numerous buildings in the town of Puerto Naos, seem to represent leaking pathways along which CO2 related to the volcanic-hydrothermal activity rises to the surface. In order to assess the hazard represented by the endogenous gas emissions, a scientific observational study was undertaken by means of diffuse CO2 and H2S efflux measurements as well as gas sampling from the soil atmosphere at 40cm depth and the measurement of the soil temperature at 15cm and 40cm in 97 points homogeneous distributed at La Bombilla and Puerto Naos, in order to delimit anomalous gas emission zones and to know the emission rates of the measured gases. Also we carried out the installation of a Tunable Diode Laser system to measure continuously the CO2 air concentrations in the basement of a building at Puerto Naos and three permanent CO2 monitoring stations. Diffuse CO2 efflux values measured in the Puerto Naos area were relatively low (between not detected and 24 g m-2 d-1). However, in numerous points of the built-up area of Puerto Naos, air CO2 concentration values measured both in the street at a height of about 40 cm and in the lower part of several garage doors were generally over 1-2%V, with some sites with values higher than 20%V. The area with the highest CO2 diffuse efflux values is located in the La Bombilla neighborhood, reaching values higher than 7 kg m-2 d-1. δ13C-CO2 values of soil gases ranged from -19.2 to -1.7‰ vs. VPDB, confirming a volcanic-hydrothermal origin for those samples exhibiting high CO2 effluxes and concentration. No H2S effluxes as well as air concentrations were registered. During the survey, many animals were found dead due to high concentrations of CO2 and low levels of O2 in the air .All these anomalous CO2 emissions are not associated to thermal anomalies. Results of this study show that in many sites at La Bombilla and Puerto Naos areas there is a dangerous CO2 air concentration that exceeds the hazardous thresholds. These zones should be continuously monitored for gas hazard and the multi-measurement approach adopted in the present study is of paramount importance for decision-making of people's return to their homes.
How to cite: Hernández, P. A., Padrón, E., Melián, G. V., Pérez, N. M., Padilla, G., Asensio-Ramos, M., Di Nardo, D., Barrancos, J., Pacheco, J. M., and Smit, M.: Gas hazard assessment at Puerto Naos and La Bombilla inhabited areas, Cumbre Vieja volcano, La Palma, Canary Islands, EGU General Assembly 2022, Vienna, Austria, 23–27 May 2022, EGU22-7705, https://doi.org/10.5194/egusphere-egu22-7705, 2022.
Please decide on your access
Please use the buttons below to download the presentation materials or to visit the external website where the presentation is linked. Regarding the external link, please note that Copernicus Meetings cannot accept any liability for the content and the website you will visit.
Forward to presentation link
You are going to open an external link to the presentation as indicated by the authors. Copernicus Meetings cannot accept any liability for the content and the website you will visit.
We are sorry, but presentations are only available for users who registered for the conference. Thank you.
EGU22-7722 | Presentations | GMPV9.2 | Highlight
@Involcan communication strategies on the 2021 Cumbre Vieja eruption: Of do´s, don´ts, trolls and other fantastic beastsDavid Calvo, María Asensio-Ramos, Pedro A. Hernández, Luca D’Auria, Matthew J. Pankhurst, Nemesio M. Pérez, Fátima Rodríguez, Eleazar Padrón, Germán D. Padilla, José Barrancos, Berverly C. Coldwell, and VIctoria Leal
The 2021 Cumbre Vieja eruption has provided powerful insights not only on the pure research field, but as well on the communication side. From INVOLCAN we´ve developed a clear strategy on how to communicate what was going on, and about the role of science on this eruption. But there is as well a long road to let the different audiences understand the ultimate goal of an institutional profile, that is telling about science and nothing else related to the drama lived by the population. That strategy led us to show anything but science, discarding tons of footage of destruction of infrastructure and properties.
Through the eruption our Twitter and Facebook profiles published the same content, with a clear divergence on the output. While Facebook followers remained almost stagnant all over the 3 months period, the Twitter account skyrocketed to a +-5000% increase on followers, and almost 100M tweet impressions. We focused on working on a single profile rather than in personal profiles of researchers, where part of the message and the influence can be lost in time
All our graphic material was released as public domain, what resulted in hundreds of INVOLCAN TV hours, and led to hundreds of interviews on media from anywhere in the world. The impact of the INVOLCAN brand is literally unaccountable and we believe strengthens the Institute reputation all over.
But we have discovered some flaws as well on the “relationship” established between the “speaker” (INVOLCAN) and the “audience”. As massive attention was driven to the INVOLCAN account, the number of trolls and eccentric characters emerged. This is a well-known behaviour on social media, but never happened before to us on that scale.
A clear ignorance of the objectives of INVOLCAN may explain part of some feedback received, which perhaps did not understand well that INVOLCAN was not responsible for emergency tasks such as evacuations, or that it was not responsible for showing the destruction of private property or that at least it wasn't our job.
But there is still an important part of the work to be done, insofar as it is exhausting to see the proliferation of "experts" capable of demanding information that does not make any sense to the population or that directly accused of hiding information.
There is a long way to go in the world of social networks, and this eruption, the same as that of the COIVD-19 pandemic, has revealed the multiple menaces that threaten science lurking in the shadows, which may end up losing its voice in a tower of Babylon where anyone thinks they know the language of volcanoes
How to cite: Calvo, D., Asensio-Ramos, M., Hernández, P. A., D’Auria, L., Pankhurst, M. J., Pérez, N. M., Rodríguez, F., Padrón, E., Padilla, G. D., Barrancos, J., Coldwell, B. C., and Leal, V.: @Involcan communication strategies on the 2021 Cumbre Vieja eruption: Of do´s, don´ts, trolls and other fantastic beasts, EGU General Assembly 2022, Vienna, Austria, 23–27 May 2022, EGU22-7722, https://doi.org/10.5194/egusphere-egu22-7722, 2022.
EGU22-8052 | Presentations | GMPV9.2 | Highlight
Electrical activity of the 2021 Cumbre Vieja eruptionCaron E.J. Vossen, Corrado Cimarelli, Valeria Cigala, Ulrich Kueppers, José Barrancos, Isabella Haarer, Markus Schmid, Wolfgang Stoiber, Luca D’Auria, Germán Padilla, Pedro Hernández, and Nemesio Pérez
Volcanic lightning is a common phenomenon observed during explosive eruptions of high magnitude and intensity. Lightning observations in milder explosive eruptions, generally of basaltic composition, are less frequent, arising the question of whether electrification may be a common feature over the whole spectrum of explosive styles and magma compositions.
The 2021 eruption of Cumbre Vieja on the island of La Palma (Canary Islands, Spain) started on 19 September 2021, continuously producing lava flows and tephra of average basanite to tephrite composition during 85 consecutive days, eventually generating a >200 m tall scoria cone (about 1220 m a.s.l.) and a vast compound lava flow field. Lightning was frequently observed in the plume during different phases of the explosive activity. This eruption provided the rare opportunity to monitor variations in the electrical activity on various time scales continuously over several weeks. We measured such electrical activity using a lightning detector operating in the extremely low frequency range with a sample rate of 100 Hz (Vossen et al., 2021), installed about 2 km away from the active vents. The detector was deployed on 11 October 2021 and recorded continuously until the end of the eruption on 13 December 2021, thus providing a unique dataset of its kind.
Lightning activity varied during the eruption with alternating hours-long periods of high intensity continuous lightning production as well as minutes-long isolated episodes with interposed periods of quiet. Stable fair-weather conditions over La Palma recorded by meteorological stations during the whole eruption (exception made for a thunderstorm episode on 26 November 2021), allow a confident attribution of the changeable lightning activity to the explosive activity of the scoria cone. Here, we present volcanic lightning and electrification timeseries as a function of the varying explosive activity as observed through thermal videography and acoustic recordings (Cigala et al., 2022).
Vossen, C. E. J., Cimarelli, C., Bennett, A. J., Geisler, A., Gaudin, D., Miki, D., Iguchi, M., and Dingwell, D. B. (2021). Long-term observation of electrical discharges during persistent Vulcanian activity. Earth Planet. Sci. Lett., 570, 117084. https://doi.org/10.1016/j.epsl.2021.117084.
How to cite: Vossen, C. E. J., Cimarelli, C., Cigala, V., Kueppers, U., Barrancos, J., Haarer, I., Schmid, M., Stoiber, W., D’Auria, L., Padilla, G., Hernández, P., and Pérez, N.: Electrical activity of the 2021 Cumbre Vieja eruption, EGU General Assembly 2022, Vienna, Austria, 23–27 May 2022, EGU22-8052, https://doi.org/10.5194/egusphere-egu22-8052, 2022.
EGU22-8183 | Presentations | GMPV9.2
Imaging the crust and the upper mantle of Cumbre Vieja volcano (La Palma, CanaryIslands) through receiver function analysis.Víctor Ortega and Luca D'Auria
The receiver function analysis (RF) is a commonly used and well-established method to investigate subsurface crustal and upper mantle structures, removing the source, ray-path and instrument signature. RF gives the unique of sharp seismic discontinuities and information about P-wave (P) and shear-wave (S) velocity below a seismic station.
This work aims to study the crust and the upper mantle of La Palma up to 40 km depth by using RF analysis. Because of the geological context as an active island, it is expected that Mohorovičić’s discontinuity has a complex geometry under Cumbre Vieja and possibly a high anisotropy can be present. This makes the application of conventional RF function analysis difficult.
That is why in this study, we applied the frequency-domain RF inversion using multi-taper deconvolution. After that, we have applied the transdimensional approach of Bodin et al. (2012) to determine 1D profiles of P and S wave velocities in terms of probability distributions, as well as the probability of a discontinuity to be located at a given depth. This approach does not require establishing “a priori” the number of layers to be used for the inversion.
Our preliminary results allowed us to correlate the different discontinuities besides the stations we got deployed around Cumbre Vieja. We have seen at least for different layers with a significant change in their Vp/Vs ratios. Moreover, we have determined the Moho topography under Cumbre Vieja and the whole island.
These results are compared with the seismicity observed during the 2021 Cumbre Vieja eruption, mainly located at the base of the crust (10-15 km) and in the upper mantle (20-30 km), possibly indicating the presence of two magmatic reservoirs at these depths.
References
Bodin, T., Sambridge, M., Tkalčić, H., Arroucau, P., Gallagher, K., & Rawlinson, N. (2012). Transdimensional inversion of receiver functions and surface wave dispersion. Journal of Geophysical Research: Solid Earth, 117(B2).
How to cite: Ortega, V. and D'Auria, L.: Imaging the crust and the upper mantle of Cumbre Vieja volcano (La Palma, CanaryIslands) through receiver function analysis., EGU General Assembly 2022, Vienna, Austria, 23–27 May 2022, EGU22-8183, https://doi.org/10.5194/egusphere-egu22-8183, 2022.
Please decide on your access
Please use the buttons below to download the presentation materials or to visit the external website where the presentation is linked. Regarding the external link, please note that Copernicus Meetings cannot accept any liability for the content and the website you will visit.
Forward to presentation link
You are going to open an external link to the presentation as indicated by the authors. Copernicus Meetings cannot accept any liability for the content and the website you will visit.
We are sorry, but presentations are only available for users who registered for the conference. Thank you.
EGU22-8273 | Presentations | GMPV9.2
Magma effect on the electrical resistivity: La Palma (Canary Islands)Perla Piña-Varas, Juanjo Ledo, David Martínez van Dorth, Pilar Queralt, Iván Cabrera Pérez, Luca D’Auria, and Nemesio Pérez
The recent eruption in La Palma (September 19th-December 14th, 2021) represents a unique opportunity to assess the effect of the magma on the electrical resistivity distribution of the subsoil. On the one hand, the presence of magma generates strong resistivity contrasts with the hosting units, since magmas contain dissolved water in their composition that reduces its resistivity. On the other hand, a 3-D resistivity model of La Palma Island was performed in 2019, proving us with a baseline model.
Several electromagnetic experiments have been performed in the island since the beginning of the volcanic eruption, in order to understand the changes of the resistivity associated to the magma intrusion, as well as the potential of these methods for the volcanic monitoring.
Here, we present in the frame of PIXIL project some preliminary results of a set of tests conducted against the 3-D resistivity model of the island (baseline model), to determine the characteristics of the detectable magmatic body at depth with the magnetotelluric data available. Understanding the extension, geometry, pathway, etc. of the magma is essential since many volcanic hazards are related to the size and depth of the sources of magma, especially in La Palma Island which is one of the highest potential risks in the Canary Islands.
How to cite: Piña-Varas, P., Ledo, J., Martínez van Dorth, D., Queralt, P., Cabrera Pérez, I., D’Auria, L., and Pérez, N.: Magma effect on the electrical resistivity: La Palma (Canary Islands), EGU General Assembly 2022, Vienna, Austria, 23–27 May 2022, EGU22-8273, https://doi.org/10.5194/egusphere-egu22-8273, 2022.
EGU22-8773 | Presentations | GMPV9.2
Long-term variations of diffuse CO2 at Cumbre Vieja volcano, La Palma, Canary IslandsJosé Manuel Santana de León, Gladys V. Melián, Claudia Rodríguez, Germán Cervigón-Tomico, Victor Ortega, David Martínez van Dorth, Iván Cabrera-Pérez, María Cordero, Monika Przeor, Rui Filipe Fagundes Silva, Sandro Branquinho de Matos, Eleonora Baldoni, Maria Margarida Pires Ramalho, Fátima Viveiros, David Calvo, and Nemesio M. Pérez
On September 19, 2021, a volcanic eruption began at the west flank of Cumbre Vieja, La Palma, the most northwestern of the Canary Islands. The lava flows caused the evacuation of thousands of residents living in the vicinity of the volcano, and 1,219 hectares were covered by lava flows. After 85 days of activity, the eruption ended on December 13, 2021. Since visible volcanic gas emissions (fumaroles, hot springs, etc.) do not occur at the surface environment of Cumbre Vieja, the geochemical program for the volcanic surveillance has been focused mainly on diffuse (non-visible) degassing studies. Since 2001, diffuse CO2 emission surveys have been yearly performed in summer periods to minimize the influence of meteorological variations. Measurements of soil CO2 efflux have been performed following the accumulation chamber method in about 600 sites and spatial distribution maps have been constructed following the sequential Gaussian simulation (sGs) procedure to quantify the diffuse CO2 emission from the studied area. In the period 2001-2016, the diffuse CO2 output released to the atmosphere from Cumbre Vieja volcano ranged between 320 to 1,544 t·d-1. During pre-eruptive period (2016-2021), time series of the diffuse CO2 emission showed a change with an increasing trend from 788 t·d-1 up to 1,870 t·d-1, coinciding with the beginning of the seismic swarms. This increase of diffuse CO2 emission is interpreted as a geochemical precursory signal of volcanic eruption of Cumbre Vieja, on September 19, 2021. The observed increase on the diffuse CO2 emission during this time window suggests that in October 2017 a process of magma ascent began from the upper mantle to depths between 35-25 km, at which the seismic swarms were recorded for four years. During eruption period, diffuse CO2 emission showed strong temporal variations with a minimum value of the diffuse CO2 emission in October 21, followed by an increase trend of up to 4,435 t·d-1 on December 14, the highest of time series and coinciding with the end of the eruption. During the post-eruptive period, the diffuse CO2 emission has shown a descending trend. Our results demonstrate that periodic surveys of diffuse CO2 emission are extremely important in the volcanic surveillance tools of Cumbre Vieja to improve the detection of early warning signals of future volcanic unrest episodes.
How to cite: Santana de León, J. M., Melián, G. V., Rodríguez, C., Cervigón-Tomico, G., Ortega, V., Martínez van Dorth, D., Cabrera-Pérez, I., Cordero, M., Przeor, M., Silva, R. F. F., Matos, S. B. D., Baldoni, E., Ramalho, M. M. P., Viveiros, F., Calvo, D., and Pérez, N. M.: Long-term variations of diffuse CO2 at Cumbre Vieja volcano, La Palma, Canary Islands, EGU General Assembly 2022, Vienna, Austria, 23–27 May 2022, EGU22-8773, https://doi.org/10.5194/egusphere-egu22-8773, 2022.
EGU22-8817 | Presentations | GMPV9.2
Hydrogeochemical temporal variations related to the recent volcanic eruption at Cumbre Vieja volcano, La Palma, Canary IslandsVictoria Leal, Cecilia Amonte, Gladys V. Melián, Ana Meire Feijoo, Daniel Di Nardo, Lía Pitti Pimienta, José M. Santana de León, Sergio Rojas, Lucía Barbero, Nemesio M. Pérez, Beverley C. Coldwell, Matthew J. Pankhurst, Fátima Rodríguez, María Asensio-Ramos, Eleazar Padrón, and Pedro A. Hernández
A recent volcanic eruption has occurred in Cumbre Vieja volcano located in the west of the La Palma Island (at the northwest of the Canary Islands) from September 19 to December 13, 2021. A total of 85 days of eruption makes it the longest volcanic event since historical data have been recorder on La Palma. This volcanic eruption is part of the last stage in the geological evolution of La Palma Island, the fifth in extension (706 km2) and the second in elevation (2,423 m a.s.l.) of the Canarian archipelago. Cumbre Vieja volcano, where the volcanic activity has taken place exclusively in the last 123 ka, forms the southern part of the island. As a response to the occurrence of several seismic swarms and to strengthen the volcanic monitoring of Cumbre Vieja, a regular sampling of groundwater started in October 2017. Three sampling points have been selected, Las Salinas well and two horizontal galleries: Peña Horeb and Trasvase Oeste. Temperature (ºC), pH and electrical conductivity (EC, µS·cm 1) were measured in situ. Water samples were taken to measure the chemical and isotopic composition of the groundwaters in the laboratory. The temperature values showed mean values of 22.1 ºC, 23.7 ºC and 19.6 ºC for Las Salinas, Peña Horeb and Trasvase Oeste, respectively. The mean pH values were 6.50 for Las Salinas, 7.33 for Peña Horeb and 6.81 for Trasvase Oeste, while the mean E.C. values were 41,566 µS·cm-1, 1,684 µS·cm-1 and 426 µS·cm-1 for Las Salinas, Peña Horeb and Trasvase Oeste, respectively. The total alkalinity mean value of groundwater from Las Salinas well was 8.75 mEq·L-1 HCO3-, while that from Peña Horeb was 18.8 mEq·L-1 HCO3- and 4.4 mEq·L-1 HCO3- for Trasvase Oeste. The isotopic composition of O and H (δ18O and δD) showed a meteoric origin, with mean values of 0.8‰ and 7‰ vs. VSMOW for Las Salinas, -4.0‰ and -15‰ vs. VSMOW for Peña Horeb and -4.5‰ and -17 ‰ vs. VSMOW for Trasvase Oeste. Significant changes were observed during the eruptive period, likely related to interaction with endogenous gases such as CO2, H2S and H2. Regarding the isotopic composition of total dissolved carbon, expressed as δ13C-CO2, the average values were -4.6‰, -8.1‰ and -10.8‰ for Las Salinas, Peña Horeb and Trasvase Oeste, respectively, what suggests an endogenous origin for the CO2. Such deep-seated interaction seems stronger at Las Salinas. At this point, the isotopic composition of total dissolved carbon became more magmatic along the studied period, changing from an average of -3.79 in 2017-2018 to -5.17 from 2019 to 2021.Temporal variations were observed in the total alkalinity, δ13C-CO2 andδ18O and δD during the eruption period on La Palma Island. These changes observed in both chemical and isotopic composition were related to interaction between deep volcanic fluids and the groundwaters. Groundwaters studies associated to volcanic aquifers can provide important information about the magmatic gas input in the aquifer, to model groundwater circulations edifice and to strengthen the volcano monitoring.
How to cite: Leal, V., Amonte, C., Melián, G. V., Meire Feijoo, A., Di Nardo, D., Pitti Pimienta, L., Santana de León, J. M., Rojas, S., Barbero, L., Pérez, N. M., Coldwell, B. C., Pankhurst, M. J., Rodríguez, F., Asensio-Ramos, M., Padrón, E., and Hernández, P. A.: Hydrogeochemical temporal variations related to the recent volcanic eruption at Cumbre Vieja volcano, La Palma, Canary Islands, EGU General Assembly 2022, Vienna, Austria, 23–27 May 2022, EGU22-8817, https://doi.org/10.5194/egusphere-egu22-8817, 2022.
EGU22-8830 | Presentations | GMPV9.2
Low-cost, fast deployment multi-sensor observations of the 2021 Cumbre Vieja eruptionJosé Pacheco, Alexandra Moutinho, Diogo Henriques, Marcos Martins, Pedro Hernández, Sérgio Oliveira, Tiago Matos, Dário Silva, Fátima Viveiros, José Barrancos, Diamantino Henriques, Nemesio Pèrez, Eleazar Padrón, Gladys Melián, Africa Barreto, Yenny Gonzalez, Sergio Rodríguez, Emilio Cuevas, Ramón Ramos, Paulo Fialho, Catarina Goulart, Luís Gonçalves, Carlos Faria, and João Rocha
The management of natural hazards is a vital concern for the sustainable development of any country and information is the single most important factor to tackle the risks from natural hazards within the risk reduction phase, and to manage response during a crisis. To cope with these challenges it is required, on one hand, to collect baseline information on the natural systems to understand their current state, to identify changes and predict or forecast their future behaviour and, on the other hand, to update information during crisis to review and determine management strategies.
One major difficulty to this approach is the economic weight of the classic monitoring systems, requiring heavy investments, costly maintenance, and substantial human resources. To overcome these obstacles, an alternative concept was developed based on low-cost and fast deployable wireless sensors networks made by autonomous devices, each capable to communicate to a cloud computing service that compiles and processes data, producing information readily accessible via web.
The 2021 eruption of the Cumbre Vieja volcano presented an excellent opportunity for a proof of concept of this idea. A trial run was set up on this challenging environment, focusing mainly on the detection and measurement of eruptive products, targeting the measurement of eruptive plume components, such as carbon dioxide (CO2), sulphur dioxide (SO2) and ash (particle matter, PM), and the monitoring of lava flows entering the sea. Besides the sensor’s setups, also the automatic data processing and different communications were tested.
The experiment consisted of a proximal network of different stations measuring CO2, SO2, PM10, PM2.5, temperature, and humidity; a set of trials to intercept the eruptive plume with weather balloons to measure in-situ the same parameters; a distal aethalometer to detect particles from the distal plume; and a set of buoys to monitor hydroacoustic and environmental parameters in the proximity of the lava deltas. The proximal network allowed for a continuous monitoring with information immediately available via web, with good spatial and temporal correlations between different parameters. The atmospheric soundings allowed to measure particle mass concentrations and sulphur dioxide along a profile of the eruptive plume and characterize its vertical profile, with in situ measurements, while back trajectory of air parcel analyses and aethalometer measurements carried out at Izaña Atmospheric Observatory (2367 m.a.s.l.) showed attenuation variability that could be associated with small volcanic particles transported to at least 140 km from the source. The buoys trial allowed to record the acoustic environment near the lava deltas and to test the design and configurations of the device regarding sensors integration and communications.
The Cumbre Vieja eruption experiment allowed to try-out a fast deployment low-cost multi-sensor system with good results on volcanic plume characterization and real-time data production that proved to be useful for managing volcanic crisis and demonstrated the relevance of this alternative monitoring concept.
How to cite: Pacheco, J., Moutinho, A., Henriques, D., Martins, M., Hernández, P., Oliveira, S., Matos, T., Silva, D., Viveiros, F., Barrancos, J., Henriques, D., Pèrez, N., Padrón, E., Melián, G., Barreto, A., Gonzalez, Y., Rodríguez, S., Cuevas, E., Ramos, R., Fialho, P., Goulart, C., Gonçalves, L., Faria, C., and Rocha, J.: Low-cost, fast deployment multi-sensor observations of the 2021 Cumbre Vieja eruption, EGU General Assembly 2022, Vienna, Austria, 23–27 May 2022, EGU22-8830, https://doi.org/10.5194/egusphere-egu22-8830, 2022.
EGU22-8873 | Presentations | GMPV9.2
Syn-eruptive edifice collapses during the Cumbre Vieja (Canary Islands) 2021 eruptionJorge Romero, Mike Burton, Francisco Cáceres, Edward Llewellin, Margherita Polacci, Maria Asensio-Ramos, Luca D'Auria, Tullio Ricci, Riccardo Civico, Jacopo Taddeucci, Daniele Andronico, Piergiorgio Scarlato, Fatima Rodríguez, Matt Pankhurst, Alba Martín-Lorenzo, and Nemesio Pérez
During September-December 2021, the Cumbre Vieja eruption (La Palma, Canary Islands) was characterised by simultaneous explosive and effusive activity (Longpré, 2021; Pankhurst et al., 2021). The eruption produced a ~200 m high complex pyroclastic cone (Romero et al., 2022). A series of syn-eruptive lateral collapses modified the edifice morphology and caused sporadic breaching towards the west-northwest, influencing the nature and distribution of eruptive hazards.
We documented these destructive events using tremor and seismic data, as well as direct visual and thermal observations of the eruptive activity. In addition, UASs were used for aerial surveys and DEM generation in late September 2021. Field descriptions of the resulting deposits and stratigraphic sampling of tephra fallout were carried out in October and November 2021. Microanalysis of pyroclastic fragments included scanning electron microscope and electron microprobe for textural and compositional characterisation.
Two classes of collapse events were observed: the first involved a substantial portion of the cone and led to its horseshoe scar morphology; the second mainly affected ramparts of pyroclasts that separated vents along the fissure. The largest breaching event, which occurred on September 25, was generated by a high eruption rate and associated rapid deposition of pyroclasts on a steep pre-eruptive surface. Smaller collapses resulted from rapid pyroclastic agglutination on the conduit/fissure.
Some collapses triggered an immediate and substantial increase in the lava flux presumably through release of lava that has been stored in the vent and/or shallow plumbing system. The largest collapses produced lava flows up to 10 m thick which rafted decameter-sized chunks of the failed edifice. In some cases, these outpourings inundated residential areas. Collapses were sometimes followed by an increase in the eruption intensity, forming lava fountains up to several hundred metres in height; we infer these fountains resulted from unloading of the shallow plumbing system.
The 2021 eruption of Cumbre Vieja volcano provides a rare opportunity to document recurrent, syn-eruptive collapses of the vent edifice during a cone-forming eruption, and to identify and characterise the hazards associated with this common type of activity.
References:
Longpré, M. A. (2021). Reactivation of Cumbre Vieja volcano. Science, 374(6572), 1197-1198. Doi: 10.1126/science.abm9423
Pankhurst, et al. (2022). Rapid response petrology for the opening eruptive phase of the 2021 Cumbre Vieja eruption, La Palma, Canary Islands. Volcanica, 5(1), pp. 1–10. Doi: 10.30909/vol.05.01.0110.
Romero et al. (2022). Volume and stratigraphy of the Cumbre Vieja 2021 eruption tephra fallout, La Palma Island. VMSG Virtual Annual Meeting, 10-12th January 2022, Manchester, United Kingdom.
How to cite: Romero, J., Burton, M., Cáceres, F., Llewellin, E., Polacci, M., Asensio-Ramos, M., D'Auria, L., Ricci, T., Civico, R., Taddeucci, J., Andronico, D., Scarlato, P., Rodríguez, F., Pankhurst, M., Martín-Lorenzo, A., and Pérez, N.: Syn-eruptive edifice collapses during the Cumbre Vieja (Canary Islands) 2021 eruption, EGU General Assembly 2022, Vienna, Austria, 23–27 May 2022, EGU22-8873, https://doi.org/10.5194/egusphere-egu22-8873, 2022.
EGU22-9295 | Presentations | GMPV9.2
Acoustic signals from the 2021 Cumbre Vieja eruptionValeria Cigala, Ulrich Kueppers, Caron E. J. Vossen, José Barrancos, Laura Spina, David Fee, Corrado Cimarelli, Julia Gestrich, Markus Schmid, Pedro Hernández, Matthew Pankhurst, Luca D'Auria, Nemesio Pérez, and Donald B. Dingwell
After 50 years of volcanic quiescence, on 19 September 2021, an eruption started on the western flank of the Cumbre Vieja ridge of La Palma, Canary Islands, Spain. The eruption was characterised by simultaneous effusive and explosive activity from a several hundred-meter-long fissure, which later built up a cone and showed variable eruptive behaviour at different vents, suggesting a spatially complex plumbing system. Explosive eruptive activity ranged from mild ash emissions, Strombolian explosions to fire fountaining episodes.
We carried out field measurements to study the variable explosive eruptive activity and associated acoustic signals. A single microphone initially deployed at about 2 km SW of the vents from 6 to 11 October was later replaced by an array of 3 microphones from 6 November to 13 December at about 300 m W of the microphone location in October. The microphones (PCB ½” free field acoustic sensors, 3.15-20 kHz frequency range) were each connected to an OptiMeas SmartPro digitiser continuously sampling at 5000 Hz. The digitisers are GPS synchronised for accurate acoustic array processing. The acoustic array was complemented by a thunderstorm detector continuously recording (since 11 October) lightning and electrical activity generated by the volcanic explosions (Vossen et al., 2022). Additionally, at the beginning of November 2021, thermal videos of the eruptive activity were acquired.
Preliminary analysis of the large and unique acoustic dataset shows varying waveforms indicating evolving source conditions: eruption intensity, source mechanism, vent geometry, fragmentation depth and amount of ash ejected. Moreover, we observe a variability of frequency (peak and mean) and amplitude with time. Further analysis includes the characterisation of the acoustic source location within the growing volcanic edifice and the comparison and correlation with lightning and thermal infrared data to detail changes in explosive activity related to the evolving eruption sources.
Caron E.J. Vossen et al. (2022), Electrical activity of the 2021 Cumbre Vieja eruption, EGU22-8052.
How to cite: Cigala, V., Kueppers, U., Vossen, C. E. J., Barrancos, J., Spina, L., Fee, D., Cimarelli, C., Gestrich, J., Schmid, M., Hernández, P., Pankhurst, M., D'Auria, L., Pérez, N., and Dingwell, D. B.: Acoustic signals from the 2021 Cumbre Vieja eruption, EGU General Assembly 2022, Vienna, Austria, 23–27 May 2022, EGU22-9295, https://doi.org/10.5194/egusphere-egu22-9295, 2022.
EGU22-9297 | Presentations | GMPV9.2
Styles of explosive activity during the 2021 Cumbra Vieja eruption, as illuminated by high-frequency imaging and acoustic sensingPiergiorgio Scarlato, Jacopo Taddeucci, Daniele Andronico, Tullio Ricci, Riccardo Civico, Elisabetta Del Bello, Laura Spina, Luca D'Auria, Maria Asensio-Ramos, David Calvo, Eleazar Pardrón, Pedro Hernández, and Nemesio Pérez
A variety of eruptive styles concurred to define the explosive activity of the 2021 Cumbre Vieja eruption (La Palma, Canary Islands, Spain). These styles include, as broadly defined, lava fountaining, Strombolian explosions, rapid Strombolian, spattering, ash-rich jets, and ash venting, and occurred both alternately and simultaneously at the multiple vents that hosted the activity during the more-than-three-months-long eruption. In order to capture the defining features and the underlying processes of these styles and of their transitions, we deployed FAMoUS (Fast, MUltiparametric Setup) during two field campaigns, between 22 September-1 October and between 5-9 November 2021. FAMoUS includes one high-speed camera (frame rate 250 to 500 frames per second (FPS) and 0.021-0.147 m/pixel resolution at the vent), one thermal camera (up to 50 FPS and 0.2-0.8 m/pixel .ca), three high-definition cameras (25 FPS, 0.03-1.2 m/pixel ca.), and one microphone (flat response between 0.5 and 10000 Hz, sampling rate 20 kHz). Preliminary video processing results, obtained using both manual tracking and Optical Flow routines, reveal ejection velocities of pyroclasts in the 20-220 m/s range, with the highest and the lowest values of peak velocity being recorded during Strombolian explosions and ash venting, respectively. All activity styles display ejection velocity fluctuations and variably marked ejection pulses, which are more pronounced during Strombolian explosions. Lava fountains feature the highest mean ejection velocity and a variety of fluctuation patterns, with larger-amplitude and more abrupt ones when transitioning towards Strombolian explosions. The maximum settling velocity of bomb-to lapilli-sized pyroclasts in the vicinity of the vent is remarkably stable around 50 m/s. The transition between the different styles of activity is marked by changing rates of ejection pulse frequency/amplitude and relative proportions of ash and bombs, pointing to a feedback between the volume, ascent rate, and frequency of gas pockets rising in the conduit, and the changes induced by their transit through the magma residing in the uppermost termination of the conduit.
How to cite: Scarlato, P., Taddeucci, J., Andronico, D., Ricci, T., Civico, R., Del Bello, E., Spina, L., D'Auria, L., Asensio-Ramos, M., Calvo, D., Pardrón, E., Hernández, P., and Pérez, N.: Styles of explosive activity during the 2021 Cumbra Vieja eruption, as illuminated by high-frequency imaging and acoustic sensing, EGU General Assembly 2022, Vienna, Austria, 23–27 May 2022, EGU22-9297, https://doi.org/10.5194/egusphere-egu22-9297, 2022.
EGU22-9349 | Presentations | GMPV9.2
Early evidence of magmatic rise through 3He/4He ratio measurements at Dos Aguas cold mineral spring, La Palma, Canary IslandsEleazar Padrón, Nemesio M. Pérez, Gladys V. Melián, Hirochika Sumino, María Asensio-Ramos, Pedro A. Hernández, Claudia Rodríguez, José H. Lorenzo, Guillermo Recio, Mar Alonso, Fátima Rodríguez, and Luca D’Auria
A volcanic eruption began at Cumbre Vieja volcano (La Palma, Canary Islands, Spain) on September 19, 2021, and resulted in the longest volcanic event since data are available on the island: it finished after 85 days and 8 hours of duration and 1,219 hectares of lava flows. This volcanic eruption is part of the volcanic evolution of La Palma Island, the fifth in extension (706 km2) and the second in elevation (2,423 m a.s.l.) of the Canarian archipelago. Cumbre Vieja volcano, where the volcanic activity has taken place exclusively in the last 123 ka, forms the southern part of the island. The first geophysical precursory signals of the last eruptive process, started on October 7th and 13rd, 2017, when two remarkable seismic swarms interrupted a seismic silence of 46 years in Cumbre Vieja volcano with earthquakes located beneath Cumbre Vieja volcano at depths ranging between 14 and 28 km with a maximum magnitude of 2.7. Five additional seismic swarms were registered in 2020 and four in 2021, the last being the one that preceded the eruption, beginning a week before it. 3He/4He ratio has been monitored at Dos Aguas cold mineral spring in La Palma Island since 1991 to date as an important volcano monitoring tool able to provide early warning signal of future volcanic unrest episodes, as magmatic helium emission studies have demonstrated to be sensitive and excellent precursors of magmatic processes occurring at depth. A significant increase was observed from 2011 to 2012, when the 3He/4He ratio reached the highest value of the period 1991-2019: 10.24 RA (being RA the ratio in atmospheric helium) in September 2012. At that time, this was the highest 3He/4He ratio reported from the Canarian archipelago measured either in the lavas or terrestrial fluids (Padrón et al., 2015). We suggest the occurrence of aseismic magma rising episodes beneath La Palma within the upper mantle towards an ephemeral magma reservoir in the period 2011-2012. Later, in the period 2017-2020, magma rising continued and produced seismic swarms that were accompanied also by the highest 3He/4He ratio measured at Dos Aguas (September, 2020). In 2021, 3He/4He ratio decreased ~0.32 RAsince the beginning of the year, including the eruptive period. 3He/4He ratio values suggest that upward magma migration that caused the 2021 Cumbre Vieja eruption likely started in or before 2012.
Padrón et al., (2015). Bull Volcanol 77:28. DOI 10.1007/s00445-015-0914-2
How to cite: Padrón, E., Pérez, N. M., Melián, G. V., Sumino, H., Asensio-Ramos, M., Hernández, P. A., Rodríguez, C., Lorenzo, J. H., Recio, G., Alonso, M., Rodríguez, F., and D’Auria, L.: Early evidence of magmatic rise through 3He/4He ratio measurements at Dos Aguas cold mineral spring, La Palma, Canary Islands, EGU General Assembly 2022, Vienna, Austria, 23–27 May 2022, EGU22-9349, https://doi.org/10.5194/egusphere-egu22-9349, 2022.
EGU22-9419 | Presentations | GMPV9.2
Measuring the height of the eruptive column during the 2021 eruption of Cumbre Vieja (La Palma Island, Canary Islands)Alicia Felpeto, Antonio J. Molina-Arias, Francisco Quirós, Jorge Pereda, Laura García-Cañada, and Eduardo A. Díaz-Suárez
Last year's almost 3-month eruption on the island of La Palma was a Strombolian eruption. The explosive behaviour has been very variable and significant throughout the eruption. The IGN (Instituto Geográfico Nacional) measured the height of the eruptive column from the first days of the eruption using visual cameras. The main camera used was one from the IAC (Instituto Astrofísico de Canarias), located at 2365 masl altitude and 16.5 km north of the main vent. The cameras were calibrated with geodetic techniques to check the accuracy of the measurements and avoid errors due to small displacements or rotation of the cameras. The effect of wind at different heights was also taken into account in the assessment of the plume height. The maximum value of the column height measured was 8500 masl, which occurred hours before the end of the eruption, while the characteristic value was about 3500 masl. This work shows the evolution of the column height throughout the eruptive period and its correlation with different volcano monitoring techniques. The measurement of the eruptive column height is of great relevance in reducing the potential impact of volcanic ash on civil aviation, as significant changes in the height of the eruptive plume are communicated to the VAAC (Volcanic Ash Advisory Centre) in Toulouse to be taken into account in volcanic ash cloud forecasts.
How to cite: Felpeto, A., Molina-Arias, A. J., Quirós, F., Pereda, J., García-Cañada, L., and Díaz-Suárez, E. A.: Measuring the height of the eruptive column during the 2021 eruption of Cumbre Vieja (La Palma Island, Canary Islands), EGU General Assembly 2022, Vienna, Austria, 23–27 May 2022, EGU22-9419, https://doi.org/10.5194/egusphere-egu22-9419, 2022.
EGU22-9449 | Presentations | GMPV9.2
Complex seismicity patterns accompanying the 2021 volcanic eruption at La Palma, Canary Islands, SpainCarmen del Fresno, Simone Cesca, Itahiza Domínguez Cerdeña, Eduardo Díaz-Suarez, Claus Milkereit, Carla Valenzuela, Rubén López-Díaz, Torsten Dahm, and Carmen López
A moderate seismicity accompanied the dike intrusion which preceded the 2021 volcanic eruption at La Palma, Canary Islands, Spain. Nevertheless, the largest magnitudes were recorded during the eruption, from September 19th to December 13th, 2021. This volcanotectonic activity accompanied the upward magma transfer to feed the eruption and provides important clues to the understand the feeding system geometry, as we are dealing with the first fully monitored eruption in the island. Seismicity during the eruption displayed a stable bimodal spatial distribution, with hypocenters clustering at two, well separated depth intervals. A shallower seismic cluster was active beneath the central area of Cumbre Vieja ~10-14 km depth, starting by September 27, just after a short quiescence of about 3 hours in the tremor signal and with peaks of intensification rates in mid and late November. A deeper and larger cluster (~33-39 km) extended further to the Northeast. Here, the activity started with some delay on October 5th and the cluster was mostly active over October and November 2021, reaching a peak magnitude mbLg 5.1 November 19th, 2021, the largest earthquake of the whole seismic sequence. In this study, we use a variety of seismological methods to resolve hypocentral and centroid location at the two clusters, as well as full moment tensors for 156 earthquakes, including largest ones at each cluster. The hypocentral relocation of 7150 earthquakes reconstructs the geometry of the active seismogenic structures, resolving small-scale details within each of the two clusters. The centroid moment tensor inversion resolves different families of moment tensors in each cluster including earthquakes with almost reversed focal mechanism that respond to local stress perturbations introduced by the magma rise through a complex path and multiple magmatic reservoirs. The source studies are complemented by a temporal analysis of the families based on waveform characterization, which allows to reconstruct the timeline of the magma transfer and seismogenic processes. Our seismological analysis provides details of seismicity accompanying the volcanic unrest at La Palma and documents the evolution of seismogenic processes in response to the rise of magma batches through the complex plumbing system.
How to cite: del Fresno, C., Cesca, S., Domínguez Cerdeña, I., Díaz-Suarez, E., Milkereit, C., Valenzuela, C., López-Díaz, R., Dahm, T., and López, C.: Complex seismicity patterns accompanying the 2021 volcanic eruption at La Palma, Canary Islands, Spain, EGU General Assembly 2022, Vienna, Austria, 23–27 May 2022, EGU22-9449, https://doi.org/10.5194/egusphere-egu22-9449, 2022.
EGU22-9557 | Presentations | GMPV9.2 | Highlight
Time series compositional insights into magmatic evolution during the 2021 Cumbre Vieja eruption, La Palma, Canary Islands, SpainJane H. Scarrow, Katy J. Chamberlain, Matthew J. Pankhurst, Olivia A. Barbee, Beverley C. Coldwell, James Hickey, David A. Neave, Daniel J. Morgan, Alba Martín-Lorenzo, Fátima Rodríguez, Gavyn K. Rollinson, William Hernández, Pedro A. Hernández, and Nemesio M. Pérez
On 19 September 2021, Cumbre Vieja volcano, La Palma, Canary Islands erupted after 50 years of quiescence. The eruption lasted 85 days through to 13 December. Cone building that initiated from the main fissure vent resolved into discrete emission centres dominated by ash plumes and lava fountains that fed flows that coursed to the west and west-southwest. The lava flow field covers over 1000 hectares and is up to 3.5 km wide and ~6.2 km long. Tephra fall covers over 5,500 hectares with volcanic plume heights reaching up to 6000 m depositing material mainly in the eastern part of the island but, on occasion, reaching other Canary islands: El Hierro, La Gomera, Tenerife and Gran Canaria.
Significantly, uncertainties exist regarding how such eruptions initiate, evolve and ultimately cease, e.g. changes in magma composition and volume. Here we show time series whole-rock and mineral chemistry variations throughout the eruption from initiation to paroxysm and finally cessation. Bulk chemical trends of erupted products in the first week together with textural and mineralogical observations made within a few weeks of samples’ eruption provide an initial benchmark for understanding the evolution of the eruption. Petrographically, the lavas are hypocrystalline, porphyritic and vesicular. Clinopyroxene is the most common coarse mineral with olivine and amphibole also present. Whole-rock XRF and ICP-MS analyses show that samples have restricted, primitive, metaluminous, alkaline whole-rock compositions; geochemically, lavas plot as basanite-tephrites, but mineralogical observations, for example the absence of feldspathoids, classify them as alkali basalts.
Time-resolved whole-rock analyses through the eruption show increasing MgO contents and decreasing incompatible element contents, which may reflect changes in melting dynamics or crystal cargos. A jump in whole-rock major and trace element compositions on day 7 to 8 of the eruption coincides with the disappearance of resorbed amphibole crystals in the thin sections, and also the amphibole peak in XRD spectra, as well as transition to the eruption of less viscous lava flows. The whole-rock compositional changes also correlate with variations in geophysical monitoring records of real-time seismic amplitude measurements.
Our new data has potential to be applied to eruption forecasting, as well as evaluation of volcanic hazards and associated risks for activity in the Canary Islands and other comparable ocean island systems.
How to cite: Scarrow, J. H., Chamberlain, K. J., Pankhurst, M. J., Barbee, O. A., Coldwell, B. C., Hickey, J., Neave, D. A., Morgan, D. J., Martín-Lorenzo, A., Rodríguez, F., Rollinson, G. K., Hernández, W., Hernández, P. A., and Pérez, N. M.: Time series compositional insights into magmatic evolution during the 2021 Cumbre Vieja eruption, La Palma, Canary Islands, Spain, EGU General Assembly 2022, Vienna, Austria, 23–27 May 2022, EGU22-9557, https://doi.org/10.5194/egusphere-egu22-9557, 2022.
EGU22-9629 | Presentations | GMPV9.2
Geochemistry of ash leachates during the 2021 eruption of Cumbre Vieja volcano, La Palma, Canary IslandsFátima Rodríguez, Nemesio M. Pérez, Cecilia Amonte, Alba Martín-Lorenzo, Gladys V. Melián, Beverly C. Coldwell, Matthew J. Pankhurst, María Asensio-Ramos, Pedro A. Hernández, and Eleazar Padrón
On September 19, 2021, a new eruption began at the west flank of Cumbre Vieja volcano (La Palma, Canary Islands), after an inter-eruptive period of 50 years from the previous eruption (Teneguía, October 1971). The 2021 event was a fissure and powerful strombolian eruption with a magnitude VEI=3 and it has been considered as the most important eruption of Europe during the last 75 years in terms of the significant amount of SO2 released and the serious damage caused by the lava flows.
In this work we report the leachate analyses of volcanic ash from the beginning of the eruption, focused on determining the relationship between chemical composition of water‐soluble components adhering to volcanic ash and the volcano’s activity episodes. A total of 5 main control sites or ash-collecting stations were established and ash was picked up in a daily basis. These were located around the main eruptive vents at different distances. Water-extractable concentrations of the samples leached at 1:25 for 2 hours were analyzed by ion chromatography (Cl-, SO42-, F-, Br-, NO3-, Na+, Ca2+, Mg2+, K+) and ICP-MS (Li, B, Al, Si, Sr, Ba, Fe, Ti, Cu, Sb, Rb, Ni, Co, Cd, V). The most abundant components in the leachates were SO42- for the anions and Na+ for the cations, with mean concentrations of 854 and 455 mg/kg, respectively. The results showed the following trend, in decreasing order of abundance: SO4-2>Na+>Cl->F->Ca2+>Al3+>K+>Mg2+. Fluoride, an element of primary concern for human and animal health, showed a range of 16 and 733 mg/kg and an average of 239 mg/kg, which is relatively higher than global median value (129 mg/kg). The S/Cl molar ratio in the ash leachate presented a ranged of values from 0.16 to 5.9 and the observed values > 3.0 seems to be related to ash-rich phases of the eruption. Preliminary results show significant temporal variations in ash leachate compositions, revealing changes in the eruption dynamics.
How to cite: Rodríguez, F., Pérez, N. M., Amonte, C., Martín-Lorenzo, A., Melián, G. V., Coldwell, B. C., Pankhurst, M. J., Asensio-Ramos, M., Hernández, P. A., and Padrón, E.: Geochemistry of ash leachates during the 2021 eruption of Cumbre Vieja volcano, La Palma, Canary Islands, EGU General Assembly 2022, Vienna, Austria, 23–27 May 2022, EGU22-9629, https://doi.org/10.5194/egusphere-egu22-9629, 2022.
EGU22-9661 | Presentations | GMPV9.2
Time series petrological insights into magmatic evolution during the 2021 Cumbre Vieja eruption, La Palma, Canary Islands, SpainKaty J Chamberlain, Jane H Scarrow, Matthew J Pankhurst, Olivia A Barbee, David A Neave, Dan J Morgan, Penny Wieser, Beverley C Coldwell, James Hickey, Alba Martín-Lorenzo, Fátima Rodríguez, Gavyn K Rollinson, William Hernández, Pedro A Hernández, and Nemesio M Pérez
On 19 September 2021, Cumbre Vieja volcano, La Palma, Canary Islands erupted after 50 years of quiescence. The eruption lasted 85 days, ending on 13 December. At present, whilst geophysical data may be used to estimate the scale of magma reservoirs (and when combined with the magma output rate can provide a guide to eruption longevity), experience shows that using such techniques to see through activity at crustal levels and quantify deeper magmatic processes during an eruption is not always productive or possible. Success of geophysical techniques is dependent on both the level of instrumentation and the degree to which local magmatic and tectonic environments are understood. Thus, deep magma supply and crustal interactions may be intractable or even invisible, even if they are seismogenic. Simple on-site compositional information (e.g. from handheld XRF) can indicate broad-scale changes in erupted compositions and reflect, for example, changes in crystallinity or melt composition. However, such bulk data can be ambiguous and therefore insufficiently robust to be useful for decision-makers. In contrast, petrological observations of mineral textures and compositions can provide direct, quantifiable evidence of deep and shallow magmatic processes that, in tandem with upper crustal stress states, ultimately drive magma ascent and eruption. Advancements in the use of precise and automated sample preparation techniques, rapid and high-resolution textural and compositional characterisation, and increasing computing capacity now allows samples to be collected, analysed and interpreted within days rather than months. Measurements of volcanic products include: textures, mineralogy, mineral chemistry (and profiles), whole-rock geochemistry, volatiles, isotope geochemistry and rheology. Petrology combines these data into interpretations of the magmatic system state and evolution, which can inform understanding of the dynamic processes driving eruptions and physical behaviours of tephra and lava. Hence, forecasts of volcanic behaviour underpinned by petrological characterization and trends are more robust. Here we present textural and chemical data from time-resolved samples of lavas and tephras from the eruptive sequence, marking the initiation, duration and cessation of volcanism. These data are used to constrain and trace temperature(s) and pressure(s) of mineral growth and magma storage; mineral-melt equilibrium dynamics; and timescales of magmatic processes through diffusion chronometry. Initial petrographic study has shown the lavas to be hypocrystalline, porphyritic and vesicular. Clinopyroxene is the most common coarse mineral, with olivine and amphibole also present; however, these mineral abundances are not constant through time. This study highlights the importance of time-resolved sampling and shows how both rapid qualitative observations and in situ petrological characterisation can be used to couple volcanic behaviour with subsurface magma dynamics.
How to cite: Chamberlain, K. J., Scarrow, J. H., Pankhurst, M. J., Barbee, O. A., Neave, D. A., Morgan, D. J., Wieser, P., Coldwell, B. C., Hickey, J., Martín-Lorenzo, A., Rodríguez, F., Rollinson, G. K., Hernández, W., Hernández, P. A., and Pérez, N. M.: Time series petrological insights into magmatic evolution during the 2021 Cumbre Vieja eruption, La Palma, Canary Islands, Spain, EGU General Assembly 2022, Vienna, Austria, 23–27 May 2022, EGU22-9661, https://doi.org/10.5194/egusphere-egu22-9661, 2022.
EGU22-9754 | Presentations | GMPV9.2
La Palma PM10 ash particle geometry and adherence to pulmonary cell tissueBeverley Coldwell, David Wertheim, Lisa Miyashita, Richard Giddens, Ian Gill, Jonathon Grigg, and Nick Petford
While studies have shown adverse health effects associated with volcanic eruptions are thought to result from resultant gases and ash particle clouds, the precise reasons remain unclear. However, the shape of particles has previously been shown to influence their ability to adhere to human cancer cells (He and Park 2016). Furthermore grain size and the presence of silica are thought to be important in understanding respiratory effects associated with volcanic ash particles.
We have previously shown that volcanic ash particles can have sharp appearing surface features from 3D confocal microscopy (Wertheim et al. 2017). The aim of this study was to examine the 3D appearance, chemistry and adherence to cells of volcanic ash particles from the September 2021 La Palma eruption in particles of size PM10 as they are considered of particular interest in respiratory conditions. Volcanic ash particles collected from the first day of the eruption were imaged using confocal scanning laser microscopy and scanning electron microscopy in order to assess their 3D appearance and geometry. In addition, 2D shape and elemental analysis, obtained from secondary and backscattered electron imaging, was performed to link ash particle geometry with composition.
Initial results confirming the angular (3D-fragmented) nature of PM10 and smaller particles from the La Palma eruption, suggest an ability to adhere to cells. Experiments to confirm this by exposing A549 human adenocarcinomic epithelial cells to La Palma ash particles are ongoing.
How to cite: Coldwell, B., Wertheim, D., Miyashita, L., Giddens, R., Gill, I., Grigg, J., and Petford, N.: La Palma PM10 ash particle geometry and adherence to pulmonary cell tissue, EGU General Assembly 2022, Vienna, Austria, 23–27 May 2022, EGU22-9754, https://doi.org/10.5194/egusphere-egu22-9754, 2022.
EGU22-9819 | Presentations | GMPV9.2
Continuous monitoring of diffuse CO2 emission from Cumbre Vieja volcano: early evidences of magmatic CO2 surface arrivalClaudia Rodríguez-Pérez, José Barrancos, Pedro A. Hernández, Nemesio M. Pérez, Eleazar Padrón, Gladys V Melián, Fátima Rodríguez, María Asensio-Ramos, and Germán D. Padilla
Cumbre Vieja volcano is the last stage in the geological evolution of La Palma Island (Canarian Archipelago, Spain). The volcanic activity of La Palma has taken place exclusively in Cumbre Vieja in the last 123 ka, and has remained in volcanic quiescence in the last 50 years. After the occurrence of several seismic seismic swarms since 2017, a volcanic eruption began at Cumbre Vieja volcano on September 19, 2021, and resulted in the longest volcanic event since data are available on the island. The eruption lasted for 85 days and 8 hours and lava flows covered 1,219 hectares. As part of the volcano monitoring program of Cumbre Vieja, diffuse degassing of CO2 has been continuously monitored since 2005 at the southernmost part of Cumbre Vieja according to the accumulation chamber method. The monitoring site (LPA04) was selected because it shows anomalous diffuse CO2 degassing emission values with respect to the background values that had been measured in different surveys (Padrón et al., 2015). Meteorological and soil physical variables are also measured in an hourly basis and transmitted to ITER facilities about 150 Km far away. Since its installation, CO2 emissions ranged from non-detectable (<1.5 gm-2d-1) to 1,464.0 gm-2d-1. The time series was characterized by a strong variability in the measured values that are modulated mainly by the atmospheric and soil parameters. Soil moisture is the monitored parameter that explains the highest variability of the data, being the dry season (spring y summer) the period with the highest observed diffuse emission values. This behavior in the time series changed after 2017 as an increasing trend was observed in a good temporal agreement with the increase of seismic activity recorded. Diffuse CO2 emission values showed a sustained increase reaching maximum values (up to 890 gm-2d-1) before de eruption onset. The observed diffuse CO2 emissions trend in the LPA04 geochemical station was useful to record the arrival of magmatic CO2 due to the occurrence of an upward magma migration beneath La Palma Island that caused the 2021 eruptive event.
Padrón et al., (2015). Bull Volcanol 77:28. DOI 10.1007/s00445-015-0914-2
How to cite: Rodríguez-Pérez, C., Barrancos, J., Hernández, P. A., Pérez, N. M., Padrón, E., Melián, G. V., Rodríguez, F., Asensio-Ramos, M., and Padilla, G. D.: Continuous monitoring of diffuse CO2 emission from Cumbre Vieja volcano: early evidences of magmatic CO2 surface arrival, EGU General Assembly 2022, Vienna, Austria, 23–27 May 2022, EGU22-9819, https://doi.org/10.5194/egusphere-egu22-9819, 2022.
EGU22-9986 | Presentations | GMPV9.2
Preliminary results from textural studies on tephra deposits erupted during the 2021 eruption at Cumbre Vieja volcanoAlba Martín Lorenzo, Daniele Andronico, Fátima Rodríguez, Beverley Coldwell, Matt Pankhurst, Jacopo Taddeucci, Piergiorgio Scarlato, Costanza Bonadonna, Marco Pistolesi, Jorge E. Romero, Gladys Melián, and Nemesio M. Pérez
On September 19, 2021, the Cumbre Vieja volcano (La Palma, Canary Islands) erupted after 50 years dormant; the last eruption occurred in 1971, forming the Teneguía cone. Historical volcanism on La Palma typically produces simultaneous explosive/effusive eruptions producing cinder cones, tephra deposits and lava flow fields. The 2021 eruption was characterized by almost continuous tephra emission along a ~ 1 km long fissure, with only a few phases of quiescence lasting no more than few hours. Up to ten explosive vents were active at different times, with eruptive styles ranging from ash-venting, powerful Strombolian activity and lava fountaining. These formed volcanic plumes occasionally reaching 6-7 km above the growing composite cone. Coeval lava flows with variable, but mostly high effusion rates accompanied the explosive activity. The eruption stopped after 85 days on December 13, 2021.
Studying the textures and morphology of tephra deposits can help define and classify the explosive processes that dominated the rise of magma and its fragmentation. For this reason, from the onset of the eruption, tephra samples were collected daily. These samples represent airfall from the plume, and were collected at distances between 1 and 13 km from the new Cumbre Vieja cone. Samples were used to evaluate the mass load per square meter unit, together with grain-size analysis. During the study period, 87 samples were weighed, giving tephra mass loads between 0.10 kg/m2 and 79 kg/m2. These values can be used for estimating the total erupted tephra mass within the first period of the eruption. The grain-size distribution of samples was measured at half-phi steps by CAMSIZER (Retsch), and shows significant temporal variation in magma fragmentation and dispersal. This can be correlated to variations in plume height and eruption style.
Componentry analysis on ash samples was performed to assess both style and changes in the explosive activity. Seventeen ash samples (22 September – 1 November) were sieved to separate the 0.25-0.5 mm fraction, which allows easier distinction of particle components. Four types of components were recognized: sideromelane, tachylite, lithics and free crystals, each one characterized by different morphological and textural features. During the opening phase, a high percentage of sideromelane was erupted, then over the following weeks an increase in both lithic particles and variations in morphological features of sideromelane fragments were observed. Fragmentation-related broken crystals within intact particles are also found.
These preliminary results match the variability in eruption styles observed. They confirm that tephra studies may constitute a powerful tool for monitoring ongoing intense eruptions by helping to comprehend, together with other techniques, the evolution of eruption dynamics, magma processes, and magma level in volcanic conduits.
How to cite: Martín Lorenzo, A., Andronico, D., Rodríguez, F., Coldwell, B., Pankhurst, M., Taddeucci, J., Scarlato, P., Bonadonna, C., Pistolesi, M., Romero, J. E., Melián, G., and Pérez, N. M.: Preliminary results from textural studies on tephra deposits erupted during the 2021 eruption at Cumbre Vieja volcano, EGU General Assembly 2022, Vienna, Austria, 23–27 May 2022, EGU22-9986, https://doi.org/10.5194/egusphere-egu22-9986, 2022.
Please decide on your access
Please use the buttons below to download the presentation materials or to visit the external website where the presentation is linked. Regarding the external link, please note that Copernicus Meetings cannot accept any liability for the content and the website you will visit.
Forward to presentation link
You are going to open an external link to the presentation as indicated by the authors. Copernicus Meetings cannot accept any liability for the content and the website you will visit.
We are sorry, but presentations are only available for users who registered for the conference. Thank you.
EGU22-10124 | Presentations | GMPV9.2
Temporal evolution of melt composition during the 2021 Cumbre Vieja eruptionMarc-Antoine Longpré, Samantha Tramontano, Franco Cortese, Fátima Rodríguez, Beverley Coldwell, Alba Martín-Lorenzo, Olivia Barbee, Matthew Pankhurst, and Andreas Klügel
The 2021 eruption of Cumbre Vieja volcano (La Palma, Canary Islands) produced sustained Strombolian to violent Strombolian explosive activity, resulting in widespread tephra fall deposits in addition to lava flows. Frequent sampling of rapidly quenched volcanic ash provides the rare opportunity to document the compositional evolution of fragmenting magma at a high temporal resolution. Here we present preliminary textural observations and electron microprobe measurements of matrix glass from dated ash samples spanning the first four weeks of the eruption. Ash shards show two broad types of groundmass texture: Type 1 groundmass comprises abundant glass with microlites of plagioclase, clinopyroxene, and Fe-Ti oxides ± olivine, whereas Type 2 groundmass is microcrystalline (plagioclase, clinopyroxene, Fe-Ti oxides) and contains little to no glass. Type 1 and Type 2 groundmasses are sometimes observed mingling together at the ash shard scale. The glass composition of Type 1 groundmass is consistently tephritic, but displays significant variations over time. Glass from the earliest sample collected on 19 September is among the most primitive of the sequence, with 46.4 wt.% SiO2 and 4.0 wt.% MgO. In contrast, a sample erupted on 21–22 September records a shift to higher silica content (48.2 wt.%) and lower MgO (3.6 wt.%). Over the following five days (until 27 September), glasses return to lower silica contents, down to 45.9 wt.%, and then continue to evolve more subtly towards more primitive compositions for the next three weeks. Overall, from 21 September to 16 October, SiO2 decreases from 48.2 to 45.1 wt.%, while FeOt and MgO increase from 9.6 to 11.8 wt.% and from 3.6 to 4.1 wt.%, respectively. Chlorine concentrations also decrease from 1300 to 830 ppm. We interpret Type 1 groundmass to represent the main magma batch feeding the 2021 eruption. The observed temporal trends may be related to variable extents of microlite crystallization, particularly Fe-Ti oxides, as suggested by the association of high SiO2, low FeOt and high Fe-Ti oxide crystal fractions for the 21–27 September samples. We note that these samples coincide with a phase of the eruption characterized by highest volcanic tremor amplitudes and lowest eruption column heights (≤3 km). The origin of microcrystalline Type 2 groundmass is more ambiguous, but it may represent Type 1 magma that has undergone a more protracted cooling history, a remobilized mushy magma intersected by Type 1 magma, or lithic material. Further textural and chemical analyses of Type 1 and Type 2 groundmasses are underway to tell these scenarios apart.
How to cite: Longpré, M.-A., Tramontano, S., Cortese, F., Rodríguez, F., Coldwell, B., Martín-Lorenzo, A., Barbee, O., Pankhurst, M., and Klügel, A.: Temporal evolution of melt composition during the 2021 Cumbre Vieja eruption, EGU General Assembly 2022, Vienna, Austria, 23–27 May 2022, EGU22-10124, https://doi.org/10.5194/egusphere-egu22-10124, 2022.
EGU22-10203 | Presentations | GMPV9.2
The magma ascent path during the 2021 eruption of Cumbre Vieja (La Palma Island, Canary archipelago) highlighted by fluid inclusions and seismicityVittorio Zanon, Klaudia Cyrzan, Luca D'Auria, Matt Pankhurst, Fátima Rodríguez, Beverley Coldwell, and Alba Martín-Lorenzo
The recent eruption from the Cumbre Vieja volcanic system at La Palma Island (19 September to 14 December 2021) occurred through the impulsive emission of various batches of magma. The first emitted magma is a tephrite (clinopyroxene, amphibole and rare olivine phenocrysts). The following pulses erupted basanites (clinopyroxene and olivine phenocrysts).
Fluid inclusions and seismicity data of the first 40 days of activity are here merged to provide a snapshot of the magma ascent path.
Fluid inclusions form trails through the crystals or are more rarely in isolated clusters. They show evidence of partial density re-equilibration events. At room temperature are single phase (L) or may contain a vapour bubble (V+L).
Trapped fluid is pure CO2 (Tm=-56.6 ±0.1 °C). Final inclusion homogenisation occurred to the liquid (ThL) phase in all crystals and to the vapor (Thv) in few olivines. The corresponding density values have been recalculated to account for max 10% water in the trapped fluid.
In amphiboles (N=60) ThL=23.3-30.9 °C (ρr=546-768 kg·m3);
In clinopyroxenes (N=69) ThL=27.2-31 °C (ρr=514-703 kg·m3);
In early olivines (N=241) ThV=30.4-30.9 °C (ρr=382-464kg·m3); ThL=-6.2-31 °C (ρr=492-963 kg·m3);
In late october olivines (N=180) ThV=30.9 °C (ρr=464kg·m3); ThL=20.6-30.9 °C (ρr=546-802 kg·m3).
The histograms of density data reveals fluid trapping and re-equilibration events. Pressures were obtained from isochore distribution in the P-T space at the trapping temperature of 1075 °C for the tephrite and 1150° C for the basanite.
The tephrite ascended from a depth of ~17.2 km (487 MPa) and partially re-equilibrated at ~14.2 km (392 MPa), ~11.5 km (307 MPa), ~10 km (264 MPa) and ~8.2 km (218 MPa).
Basanites ascended from (or through) a depth between ~25.8 and ~22.6 km (656-757 MPa). Multiple ponding stages are between ~19 and ~17 km deep (484-543 MPa), at ~12 km (336 MPa) and from ~8.7 to ~6.1 km (162-229 MPa).
This picture agrees with the spatial and temporal pattern of the seismicity recorded during the eruption. After a very rapid pre-eruptive phase, lasting about a week, in which hypocentres rapidly ascended from about 10 km depth up to the surface a few hours before the eruption, seismicity waned considerably in just a few days. Since 27 September, a progressive increase of the seismicity in a cluster located at about 8-12 km depth was observed. In the following days, we observed the appearance of another cluster of hypocentres at a depth of about 20-25 km. Seismicity increased progressively during the first weeks of October, with many events having magnitudes higher than 4 in both clusters. The seismicity started waning at the beginning of December, disappearing almost entirely at the end of the eruption. We interpret these syn-eruptive seismicity clusters at the effect of crustal readjustment following the rapid emptying of two magmatic reservoirs located respectively just beneath each seismicity cluster. This model agrees well with the bimodal depth range inferred from fluid inclusion, as well as with the observed variation in the composition during the eruption.
How to cite: Zanon, V., Cyrzan, K., D'Auria, L., Pankhurst, M., Rodríguez, F., Coldwell, B., and Martín-Lorenzo, A.: The magma ascent path during the 2021 eruption of Cumbre Vieja (La Palma Island, Canary archipelago) highlighted by fluid inclusions and seismicity, EGU General Assembly 2022, Vienna, Austria, 23–27 May 2022, EGU22-10203, https://doi.org/10.5194/egusphere-egu22-10203, 2022.
EGU22-10266 | Presentations | GMPV9.2
Insights into magma degassing processes during the 2021 Cumbre Vieja eruption, La Palma, from open-path FTIR spectroscopyAna Pardo Cofrades, Mike Burton, María Asensio-Ramos, José Barrancos, Alessandro La Spina, Patrick Allard, Catherine Hayer, Benjamin Esse, Pedro A. Hernández, Eleazar Padrón, Gladys V. Melian, and Nemesio M. Peréz
On September 19th 2021 a fissure eruption started on the Cumbre Vieja rift on La Palma, Canary Islands. The fissure eruption rapidly evolved into a cone-forming eruption, with several summit vents producing explosive activity and lava jetting, while lava spattering and effusive activity occurred at/from lower flank vents.
We used open-path Fourier transform infrared spectroscopy (OP-FTIR) to measure the chemical composition of degassing associated with both explosive and effusive activities, using absorption spectra of the radiation emitted by molten lava and incandescent ash. Measurements were performed daily since October 2nd until the end of the eruption (mid-December), from different sites and at distance range of 0.6 to 5 km from the vents. They allowed us to retrieve the molar proportions of H2O, CO2, SO2, HCl and CO in gas emissions from the different vents and different activities.
In this work, we report the main results obtained for the gas compositions, their spatial and temporal evolution during the eruption, the influence of fragmentation (ash) on the degassing of HCl, and the gas-magma redox state during the La Palma 2021 eruption.
How to cite: Pardo Cofrades, A., Burton, M., Asensio-Ramos, M., Barrancos, J., La Spina, A., Allard, P., Hayer, C., Esse, B., Hernández, P. A., Padrón, E., Melian, G. V., and Peréz, N. M.: Insights into magma degassing processes during the 2021 Cumbre Vieja eruption, La Palma, from open-path FTIR spectroscopy, EGU General Assembly 2022, Vienna, Austria, 23–27 May 2022, EGU22-10266, https://doi.org/10.5194/egusphere-egu22-10266, 2022.
EGU22-10309 | Presentations | GMPV9.2 | Highlight
Dike intrusion before the 2021 La Palma eruptionItahiza Francisco Domínguez Cerdeña, Laura García Cañada, Anselmo Fernández García, Carmen del Fresno, and Eduardo Andrés Díaz Suárez
On 19 September 2021 at 14:10h (UTC) a volcanic eruption started in the South of La Palma (Canary Islands). Just a week earlier, on 11 September, an intense seismic swarm had begun in the area, with the hypocenters located at 11 km depth in the first days but gradually approaching the surface throughout the week. This activity, together with an evident deformation recorded both at the island's GNSS stations and in InSAR measurements, were key to the monitoring of the reactivation and estimate the eruption onset parameters.
In this presentation we show the results obtained using the volcanic monitoring network of the Instituto Geográfico Nacional (IGN) before La Palma eruption. Consistent results have been obtained combining seismic and geodetic techniques. We have used hypoDD relative location algorithm to improve the hypocenters of 1323 earthquakes of the IGN catalog. Deformation results have been obtained using Sentinel-1 images to get the InSAR interferograms and GNSS time series have been computed using double differences with Bernese software considering a regional network.
At the beginning, seismicity was 11 kilometers below the central part of Cumbre Vieja and for ~6 days it migrated towards the surface in northwest direction. Meanwhile, the deformation indicated a magma intrusion in the area of the activity, showing a good correlation with seismic data. Some hours before the eruption started there was a sudden change in the migration direction pointing north while hypocenters considerably accelerated its trend to the surface. This episode was accompanied by a rapid deformation of more than 7 cm to the South and 5 cm upwards in the closest GNSS station. Finally, 4 hours before the eruption, an increase in the shallow seismicity rates was observed. Most of the earthquakes were not felt by the island population and moderate magnitudes were recorded reaching a maximum of 3.8 (mbLg). InSAR results during the whole process show more than 20 cm of deformation in LOS (Line of Sight) to the South of the eruption vent.
Hours before the eruption, the seismicity behavior and the deformation shape indicate the existence of an intruding dike that culminated in eruption and that would be the last stage of a magmatic process that had begun at least four years earlier with the seismic reactivations on the island.
How to cite: Domínguez Cerdeña, I. F., García Cañada, L., Fernández García, A., del Fresno, C., and Díaz Suárez, E. A.: Dike intrusion before the 2021 La Palma eruption, EGU General Assembly 2022, Vienna, Austria, 23–27 May 2022, EGU22-10309, https://doi.org/10.5194/egusphere-egu22-10309, 2022.
EGU22-10465 | Presentations | GMPV9.2 | Highlight
Combination of geodetic techniques for deformation monitoring during 2021 La Palma eruptionElena González-Alonso, Héctor Lamolda, Francisco Quirós, Antonio Jesús Molina, Anselmo Fernández-García, Laura García-Cañada, Jorge Pereda de Pablo, Jorge Domínguez-Valbuena, Fernando Prieto-Llanos, and Lucía Sáez-Gabarrón
Surface deformation is considered one of the most important parameters in volcano monitoring. That was shown during the recent Cumbre Vieja eruption (La Palma, Canary Islands) which started on 19th September 2021 and lasted almost three months. Several days after the beginning of the unrest, on 11th September, deformation data were able to confirm the depth of the volcanic intrusion and constrain an approximate volume.Maximum deformation of 20 cm were measured prior to the beginning of the eruption pointing to the area were the dike finally reached the surface.
After the eruption onset, deformation monitoring resulted essential to understand eruption dynamics. This work is focused on results obtained by the geodetic techniques operated by Instituto Geográfico Nacional (IGN) during the three months of volcanic activity. This system includes GNSS permanent stations, InSAR processing, tiltmeters and a GNSS-RTK periodic measurements on benchmarks around Cumbre Vieja. It allowed to measure displacements with different temporal and spatial scales providing a complete picture of the deformation, which, together with other geophysical parameters, helped to manage the volcanic crisis and interpret the magmatic processes.
How to cite: González-Alonso, E., Lamolda, H., Quirós, F., Molina, A. J., Fernández-García, A., García-Cañada, L., Pereda de Pablo, J., Domínguez-Valbuena, J., Prieto-Llanos, F., and Sáez-Gabarrón, L.: Combination of geodetic techniques for deformation monitoring during 2021 La Palma eruption , EGU General Assembly 2022, Vienna, Austria, 23–27 May 2022, EGU22-10465, https://doi.org/10.5194/egusphere-egu22-10465, 2022.
EGU22-10531 | Presentations | GMPV9.2 | Highlight
Lava flow dynamics during the 2021 Cumbre Vieja eruption, La Palma, SpainEinat Lev, Janine Birnbaum, Pedro Hernandez, José Barrancos, Samantha Tramontano, Laura Connor, Charles Connor, and Jose Gabriel
Over the three-month duration of the 2021 Cumbre Vieja eruption, lava flows covered an area of 1,241 ha. (12.41 km2) out of the total 8,790 ha (87.90 km2) impacted by the eruption overall. Consequently, lava is responsible for the destruction of a majority of the 3,000 buildings and large agricultural areas. At the beginning of the eruption, authorities used a model to forecast the inundation areas. We compare that preliminary forecast with those produced by other models, such as MOLASSES, Q-LAVHA, MrLavaLoba, VolcFlow, and others. The different forecasted flow fields are also compared with the evolution of the flow field as observed by satellite and aerial mapping. Where available, we anchor dynamic model predictions for observables such as flow velocity to local measurements obtained from velocimetry on UAV and ground-based videos of flowing lava. Lava properties used in the models are informed by petrological analysis of samples collected during the eruption.
How to cite: Lev, E., Birnbaum, J., Hernandez, P., Barrancos, J., Tramontano, S., Connor, L., Connor, C., and Gabriel, J.: Lava flow dynamics during the 2021 Cumbre Vieja eruption, La Palma, Spain, EGU General Assembly 2022, Vienna, Austria, 23–27 May 2022, EGU22-10531, https://doi.org/10.5194/egusphere-egu22-10531, 2022.
EGU22-10749 | Presentations | GMPV9.2
Temporal evolution of Cumbre Vieja explosive activity and ash plumes from ground-based infrared and visible camerasJanine Birnbaum, Einat Lev, Pedro Hernandez, José Barrancos, Germán Padilla, María Asensio-Ramos, David Calvo, Fátima Rodríguez, Nemesio Pérez, and Sonia Calvari
During the main phase of the 2021 eruption of the Cumbre Vieja volcano (La Palma, Spain), eruptive activity was characterized by Strombolian eruptions, fire fountaining, white and grey ash and gas-dominated plumes, and lava effusion from multiple events. Over the period November 16 to November 26, we recorded continuous time-lapse IR images and opportunistic visible and IR videos of the vent from multiple ground-based locations. We measure the apparent area of the high-temperature gas-and-ash jet and fire fountaining from time-lapse images recorded between 1 and 60 frames/min to investigate the evolution of the explosive activity and of these plumes on minutes to days time scales. We compare plume size estimates from two different angles and vent-camera distances. We will explore periodicity and relationships between neighboring vents and discuss the implications for processes occurring in the shallow-most plumbing system of the volcano.
How to cite: Birnbaum, J., Lev, E., Hernandez, P., Barrancos, J., Padilla, G., Asensio-Ramos, M., Calvo, D., Rodríguez, F., Pérez, N., and Calvari, S.: Temporal evolution of Cumbre Vieja explosive activity and ash plumes from ground-based infrared and visible cameras, EGU General Assembly 2022, Vienna, Austria, 23–27 May 2022, EGU22-10749, https://doi.org/10.5194/egusphere-egu22-10749, 2022.

EGU22-10914 | Presentations | GMPV9.2
Reactivation of Cumbre Vieja volcano: Insights from a paired tephra glass and olivine crystal recordSamantha Tramontano, Marc-Antoine Longpré, Franco Cortese, Fátima Rodríguez, Beverley Coldwell, Alba Martín-Lorenzo, Olivia Barbee, and Matthew Pankhurst
Cumbre Vieja volcano, on La Palma, Canary Islands, Spain, is an excellent natural laboratory for exploring igneous processes at the individual eruption scale (e.g. eruption precursors) and at the larger volcanic-magmatic-system scale (e.g. repose period) because of similar eruptive styles, volumes, and chemical compositions across historical eruptions [1]. To determine the timing and nature of perturbations during pre-eruptive magma assembly and how they may relate to variations in eruption repose and style, we analyze and model the chemical fingerprints of tephra glass and tephra-hosted crystals at the system scale (sampling of all eruptions since 1585) and at the eruption scale (daily sampling of the 2021 eruption). Broadly, the tephra-olivine record is remarkably similar across samples from the 2021, 1971, 1949, 1712, 1677, 1646, and 1585 eruptions: 86% of analyzed crystals (n=85) display a more evolved core composition (Fo80 ± 1.4), followed by a reversely zoned inner rim (Fo82 ± 0.9) and a steeply, normally zoned outer rim (as low as Fo73). Reversely and normally zoned crystal segments respectively show convex and concave Fo–Ni relationships, correspondingly indicating diffusion- and growth-dominated zoning mechanisms. At a finer temporal scale, we observe systematic chemical variability over the first four weeks of the 2021 eruption. At least three distinct chemical flavors can be distinguished thus far: 1) 19-Sept products are most primitive (tephra glass is 46.4 ± 0.3 wt.% SiO2, containing olivine up to Fo87), 2) 22-Sept products are most evolved (tephra glass is 48.2 ± 0.7 wt.% SiO2, containing Fo79 ± 0.8 olivine), and 3) products from 22-Sept to 15-Oct become more primitive over time (tephra glass averages 45.9 ± 0.5 wt.% SiO2 and contains Fo82 ± 1.0 olivine). Based on these zoning patterns and the application of diffusion chronometry to reverse zones, we propose that episodic injections of primitive melt from depth invade more evolved crystal mushes days to months before and during eruption. Fo-Ni relationships along olivine traverses and thermodynamic decompression models suggest that these crystals are then entrained in an ascending and evolving carrier liquid, crystallizing normally zoned overgrowth rims before eruption. Our work suggests that primitive melt recharge is a critical mechanism for reactivating and sustaining activity at Cumbre Vieja, and we find that the timings of primitive injections (or recharge events) are not related to repose periods between eruptions. Rather, we propose that it is the timing and volume of primitive melt generation and extraction in the upper mantle that strongly influences volcano reactivation and may influence eruption style and duration.
[1] Longpré and Felpeto (2021), JVGR
How to cite: Tramontano, S., Longpré, M.-A., Cortese, F., Rodríguez, F., Coldwell, B., Martín-Lorenzo, A., Barbee, O., and Pankhurst, M.: Reactivation of Cumbre Vieja volcano: Insights from a paired tephra glass and olivine crystal record, EGU General Assembly 2022, Vienna, Austria, 23–27 May 2022, EGU22-10914, https://doi.org/10.5194/egusphere-egu22-10914, 2022.
Please decide on your access
Please use the buttons below to download the presentation materials or to visit the external website where the presentation is linked. Regarding the external link, please note that Copernicus Meetings cannot accept any liability for the content and the website you will visit.
Forward to presentation link
You are going to open an external link to the presentation as indicated by the authors. Copernicus Meetings cannot accept any liability for the content and the website you will visit.
We are sorry, but presentations are only available for users who registered for the conference. Thank you.

EGU22-11086 | Presentations | GMPV9.2
Seismoacoustic monitoring of La Palma 2021 volcanic eruption (Canary Islands): first resultsMaria Jose Jurado, Carmen Lopez, Maria Jose Blanco, Ruben Lopez, Stavros Meletlidis, and David Moure
We present first results on the continuous monitoring of the 2021 La Palma volcanic eruption (Canary Islands, Spain), from September 2021 to December 2021. During the eruption we installed a 8 level 3-component geophone string and 15 m spacing between geophones in Las Manchas within the restricted area and less than 2 km away of the volcanic edifice. The string was installed on the ground surface, in a straight line pointing towards the volcano. The 24 channels were sampled at 250 Hz, and data acquisition was performed in real-time and continuously till the end of the eruption with occasional minor gaps. The resulting seismoacoustic dataset is a sample of elastic energy propagating in both the subsurface and the atmosphere, allowing us to improve our understanding of the eruptive subsurface and subaerial processes. We use these seismoacoustic records to identify and characterize the different phases and signals of the volcanic activity. For the first analysis of the dataset we performed the calculation and graphing of spectrograms during the acquisition. We identify eruptive signals and correlate them with different events that can be directly observed on the basis of frequency content and relative timing. Explosive events like those derived from destruction of conduit plugs and ash-rich plumes emission, ash-rich explosions, volcanic lightning and degassing events are being analysed.
Finally, we study the correlation of seismic and seismoacoustic records for the same event by comparing with seismic data recorded on land stations. Results show that a good correlation exists between seismic and seismo-acoustic data for the main activity observed in the surface: the activity at the various vents and events like episodes of ash emission and bursts, indicating that this methodology can be successfully applied to monitor remote eruptions. Coupled seismoacoustic observations have turned out to be useful because they provide a comprehensive record of subsurface and subaerial eruptive activity.
How to cite: Jurado, M. J., Lopez, C., Blanco, M. J., Lopez, R., Meletlidis, S., and Moure, D.: Seismoacoustic monitoring of La Palma 2021 volcanic eruption (Canary Islands): first results, EGU General Assembly 2022, Vienna, Austria, 23–27 May 2022, EGU22-11086, https://doi.org/10.5194/egusphere-egu22-11086, 2022.
EGU22-11371 | Presentations | GMPV9.2
Geochemical monitoring of the volcanic unrest and the eruption in La Palma island (Canary Islands, Spain): the 2017-2021 dataset and first resultsPedro Antonio Torres González, Natividad Luengo Oroz, Ángel David Moure García, Lucía Sáez Gabarrón, Víctor Villasante Marcos, Rubén López Díaz, Carlos Cecilio Rodríguez López, Walter D'Alessandro, Luís Pujol, and Fausto Grassa
In 2017, La Palma Island entered a state of volcanic unrest, with nine pre-eruptive seismic swarms detected by the seismic monitoring network of the Instituto Geográfico Nacional (IGN) up to 2021, most of the events occurring at depths of 20-35 km. During this period, the IGN geochemical network detected significant changes in deep gas emissions. On 11 September 2021, the last and most energetic pre-eruptive unrest began with more than 1500 earthquakes located at 10-15 km depth and migrating upwards, accompanied by ground deformation with up to ~20 cm vertical inflation detected by the IGN deformation network (GNSS, Insar, tiltmeters). On 19 September 2021 at 15:08 UTC, a volcanic eruption began on the western flank of Cumbre Vieja in El Paso village. This was the first eruption in the island after 50 years of quiescence.
The 2021 eruption has lasted almost three months, ending on 13-14 December 2021 (last activity at the time of this writing). It began as a SE-NW fissural eruption and rapidly evolved to construct a main volcanic edifice up to ~200 m high, with several craters partially overlapping in a SE-NW direction, and later it constructed a secondary cone with a horseshoe shape open to the NE. The eruptive activity has been both strombolian and effusive, sometimes alternating and many times simultaneous with different behaviour at different emission points, a typical situation being strong degassing and strombolian jet and ash emission from an upper crater simultaneous to emission of fluid lavas and lava lake formation and periodical overflowing from a lower crater. Significant volcanic plumes have reached up to 8500 masl (typical value of 3000-3500 masl), and a large set of successive basanitic lava flows has been emitted to the west, developing a volcanic lava-fan covering ~12 km2 (~3000 buildings) and reaching the sea at several points along the western coast of La Palma.
During the eruption, the IGN geochemical monitoring network included four stations measuring diffuse radon/thoron in soil, one station measuring diffuse CO2 flux in soil, an infrared thermal camera coupled with a visual camera and six water sampling points, regularly sampled for water composition, dissolved radon content, total and isotopic composition of dissolved gas (5 points) and free gas (1 point). Physical-chemical parameters (pH, Eh, T, EC, alkalinity) were also regularly measured in situ at these points. In this work we present the obtained dataset and first results. Changes in dissolved gas, mainly H2 and He, were recorded before and during the eruption. In two radon/thoron stations, abrupt increases in both gaseous species related to the eruptive process were also detected. Changes in dissolved radon in water were also observed at some of the sampling points. Finally, the analysis of the thermal image set can be used to monitor the surface volcanic activity in correlation with visual images and geophysical signals (volcanic tremor).
How to cite: Torres González, P. A., Luengo Oroz, N., Moure García, Á. D., Sáez Gabarrón, L., Villasante Marcos, V., López Díaz, R., Rodríguez López, C. C., D'Alessandro, W., Pujol, L., and Grassa, F.: Geochemical monitoring of the volcanic unrest and the eruption in La Palma island (Canary Islands, Spain): the 2017-2021 dataset and first results, EGU General Assembly 2022, Vienna, Austria, 23–27 May 2022, EGU22-11371, https://doi.org/10.5194/egusphere-egu22-11371, 2022.
EGU22-11549 | Presentations | GMPV9.2 | Highlight
Instituto Geográfico Nacional Volcano Monitoring of the 2021 La Palma eruption (Canary Islands, Spain)Carmen Lopez, Maria Jose Blanco, and Ign Team
The monitoring of the anomalous signals associated with the ongoing magmatic process occurring in La Palma, and their interpretation, allowed the proper forecast and management of the last eruption in the Canaries. This eruption occurred 10 years after the submarine eruption in El Hierro island (Tagoro, 2011) and 50 years since the last eruption in La Palma island (Teneguía, 1971). The early signs started in October 2017 and lasted until 2021, with the occurrence of 7 short lasting seismic swarms located at depths between 20-30 km, below Cumbre Vieja volcanic edifice (the volcanic active zone of the island during the last 125 ky). Also, during this period, several geochemical signals were registered associated with the emplacement of magma below the island and the local changes of stress. The eruption was preceded by 1 week (September, from the 11th to the 19th) of strong unrest, with seismic activity (shallower than the previous swarms) and surface deformations. Data registered by the IGN volcano-monitoring network, were transmitted, processed and interpreted in real time, and have been essential to the management of the volcanic crisis, providing the Canarian Civil Protection with valuable scientific information to undertake the preventive actions in each phase of the crisis in order to mitigate its effects. Data and samples collected (lava, ashes, water, gases) will allow to identify the causes and mechanisms of this eruption and will shed light on the origin of the magmatism in the Canaries.
How to cite: Lopez, C., Blanco, M. J., and Team, I.: Instituto Geográfico Nacional Volcano Monitoring of the 2021 La Palma eruption (Canary Islands, Spain), EGU General Assembly 2022, Vienna, Austria, 23–27 May 2022, EGU22-11549, https://doi.org/10.5194/egusphere-egu22-11549, 2022.
EGU22-11700 | Presentations | GMPV9.2
Preliminary results on the rheological characterization of the 2021 lava from Cumbre Vieja volcano (La Palma, Canary Islands, Spain)Fabrizio Di Fiore, Alessandro Vona, Alex Scarani, Guido Giordano, Claudia Romano, Daniele Giordano, Luca Caricchi, Alba Martin-Lorenzo, Fatima Rodriguez, Beverley Coldwell, Pedro Hernandez, and Matt Pankhurst
After half a century of quiescence, activity at Cumbre Vieja volcano (La Palma, Canary Islands, Spain) restarted with a spectacular flank eruption characterized by both high fire fountaining and effusive activity. The products emitted comprise tephra fall and lava flows, ranging from tephrite to basanite. Between September 19th and December 13th 2021 the lava flows covered ~ 12,5 km2, affecting more than 3000 buildings and paralyzing the viability and the essential activity on the SW sector of the island. This scenario highlights the importance of rheological data deriving from experimental studies of such low viscosity magma to better understand lava flow emplacement dynamics, hazard and mitigate risk.
We performed a detailed experimental study to characterize the rheology of the basanitic lava sampled between October 3rd and 7th in a Concentric Cylinder set-up. Starting from a superliquidus state of 1400 °C, a set of isothermal deformation experiments was carried out at different target subliquidus temperatures (from 1225 to 1175 °C) and fixed shear-rate of 10 s-1 to investigate the near equilibrium viscosity. Moreover, a series of cooling deformation experiments were performed at different cooling-rates (ranging from 0.1 to 10 °C/min) and at constant shear-rate of 10 s-1 with the aim to mimic the dynamic evolution of natural flowing lava through controlled cooling-rate conditions. In isothermal deformation experiments, the steady state conditions (i.e., stable crystal contents) were achieved faster at increasing degree of undercooling, showing a progressive increase in the final viscosity values. In cooling deformation experiments, with increasing cooling-rate applied, the onset of crystallization took place at progressively lower temperature over shorter timescales. The experiments performed at cooling-rates from 0.1 to 1 °C/min were interrupted when viscous rupture (i.e., the transition from coherent flow to shear localization and physical separation) was observed. For the experiments conducted at higher cooling-rates (i.e., from 3 to 10 °C/min), the experimental runs were stopped at viscosity values of ~104 (Pa s), when the stress limit of the device was achieved.
Preliminary results show that the thermal history plays a fundamental role on the kinetics of the crystallization hence modulating the capacity of lava to flow. The different viscosity paths observed at low and high cooling-rates lead to a rheological decoupling between the slow-cooling core and the fast-cooling external part of the lava flows. This process would be key in promoting the transition from pahoehoe to ‘a‘ā emplacement regimes, ultimately controlling the runout distance of lava flows.
How to cite: Di Fiore, F., Vona, A., Scarani, A., Giordano, G., Romano, C., Giordano, D., Caricchi, L., Martin-Lorenzo, A., Rodriguez, F., Coldwell, B., Hernandez, P., and Pankhurst, M.: Preliminary results on the rheological characterization of the 2021 lava from Cumbre Vieja volcano (La Palma, Canary Islands, Spain), EGU General Assembly 2022, Vienna, Austria, 23–27 May 2022, EGU22-11700, https://doi.org/10.5194/egusphere-egu22-11700, 2022.
EGU22-11927 | Presentations | GMPV9.2 | Highlight
Characterization of the tephra deposit associated with the 2021 eruption of Cumbre Vieja (La Palma)Costanza Bonadonna, Marco Pistolesi, Marija Voloschina, Maria-Paz Reyes Hardy, Lucia Dominguez, Alba Martin, Jorge Eduardo Romero Moyano, Camille Pastore, Daniele Andronico, Corrado Cimarelli, Beverley Coldwell, Ulrich Kueppers, Fátima Rodríguez, Matt Pankhurst, Margherita Polacci, Piergiorgio Scarlato, and Jacopo Taddeucci
Between 19 September and 13 December 2021 (85 days), a flank eruption took place along the Cumbre Vieja ridge (La Palma Island), one of the most active volcanic centers of Canary Islands. The last 7000 years of Cumbre Vieja activity has been characterized by a combination of effusive and explosive eruptions. These generated both cinder cones and lava flows. The previous event occurred between October 26 and November 28, 1971 (eruption of Teneguía). The 2021 eruption was characterized by the alternate (and often simultaneous) emission of lava flows, lava fountains and tephra plumes along a ~1 km-length fissure consisting of about ten vents that built a cinder cone complex. The southern vents were mostly associated with the generation of tephra plumes and lava fountains, while the northern vents were mostly associated with the generation of lava flows. The ~12 km2 lava flow field on the west side of the island reached the sea on September 28, forming a new lava delta and interacting with sea water producing lava haze (i.e. laze). Even though tephra was sedimented all over La Palma and sometimes reached the neighboring islands, the cumulative tephra deposit is mostly elongated towards the southwest and the northeast due to the prevailing wind direction, reaching a maximum thickness southwest of the fissure. Both lava fountains and more explosive tephra plumes contributed to the formation of the tephra deposit. Tephra plumes were associated with variable intensity reaching a few kilometers of altitude (<10 km). Multiple tephra layers, which are associated with distinct phases of the eruption, can be identified based on grainsize, clast texture and deposit characteristics. Some of the layers are dominated by black fluidal glassy clasts mostly associated with lava fountain activity, while some others are dominated by brown, finely to coarsely vesicular clasts mostly associated with more explosive tephra plumes. Most layers, as well as the cumulative deposit, are characterized by a thinning break-in-slope between 3-4 km from the vents. A distinctive lithic-rich, reddish layer, which mostly sedimented on October 15-16 during a new vent opening phase, helps the correlation among the various layers. Grainsize on land is dominated by lapilli and coarse ash, with fine ash being mostly deposited in the ocean (beyond 6 km from the vents). Individual layers are associated with volumes that range between Volcanic Explosivity Index (VEI) 2 and 3, while the total tephra deposit is associated with a VEI 3 (excluding the volume of the cone).
How to cite: Bonadonna, C., Pistolesi, M., Voloschina, M., Reyes Hardy, M.-P., Dominguez, L., Martin, A., Romero Moyano, J. E., Pastore, C., Andronico, D., Cimarelli, C., Coldwell, B., Kueppers, U., Rodríguez, F., Pankhurst, M., Polacci, M., Scarlato, P., and Taddeucci, J.: Characterization of the tephra deposit associated with the 2021 eruption of Cumbre Vieja (La Palma), EGU General Assembly 2022, Vienna, Austria, 23–27 May 2022, EGU22-11927, https://doi.org/10.5194/egusphere-egu22-11927, 2022.
EGU22-12170 | Presentations | GMPV9.2
First insights into the noble gas signature of the 2021 Cumbre Vieja eruption, La Palma (Canary Islands)Andrea L. Rizzo, Andres Sandoval-Velasquez, Federico Casetta, Theodoros Ntaflos, Alessandro Aiuppa, Mar Alonso, Eleazar Padrón, Matthew Pankhurst, and Nemesio M. Pérez
The 2021 eruption of Cumbre Vieja volcano (La Palma Island) is one of the largest natural disasters in Europe in recent times, but also a unique opportunity for monitoring the evolution of a volcanic system and its underlying mantle source.
Geophysical and geochemical evidence suggests that volcanism in Canary Islands is driven by the presence of a mantle plume, even though helium isotopes highlight this lower mantle component (3He/4He>9 Ra) only in the Dos Aguas spring gases and the older lavas from the Taburiente caldera (north of La Palma). Conversely, fluid inclusions in lavas and spring gases from the recent Cumbre Vieja system have a MORB-like signature (8±1 Ra). These distinct signatures were ascribed to the mixing between different mantle components (Day and Hilton, 2020). In this framework, the 2021 Cumbre Vieja eruption opens new avenues to investigate the current composition of the local mantle and test the pre-existing models.
Here, we present the first insights into the 3He/4He signature of volcanic gases and phenocryst-hosted fluid inclusions from lavas erupted by the Cumbre Vieja in September-November 2021. For comparison, we analyzed the poorly evolved lavas from 1677 San Antonio eruption bearing mantle xenoliths (South of Cumbre Vieja) and a 3 Ma old picrite cropping out in the Taburiente caldera, close to the Dos Aguas spring (Day et al., 2010).
The 2021 lavas belonging to the October 27th and November 9th flows are basanite tephrites, with an average Mg# of 58.6, being more mafic than those from the September opening phase (Mg# = 50.3; Pankhurst et al., 2022). Olivine phenocrysts have Fo content mostly of mostly 78-83, and elevated Al and Cr contents. The estimated T based on the Cr and Al in olivine thermometers (DeHoog et al., 2010) is 920-960°C.
The 3He/4He ratio in phenocryst-hosted fluid inclusions from the 2021 products is 7-7.5 Ra, confirming the MORB-like signature of the volcanic products and gases dissolved in water of the Cumbra Vieja system (Day and Hilton, 2020; Torres-Gonzalez et al., 2020). Instead, the olivines in the Taburiente picrite yield 9.4±0.1 Ra, comparable to values in the Dos Aguas spring, confirming the existence of a lower mantle component below this sector of the island.
The distinct 3He/4He signature observed at Taburiente and Cumbre Vieja products is preliminary interpreted as due to either (i) small-scale heterogeneities in the local mantle, and/or (ii) a plumbing system effect that lowers the 3He/4He of the recently erupted magmas. In the latter case, magma differentiation and degassing at the crust-mantle boundary or even deeper in the mantle, coupled to the production and accumulation of radiogenic 4He, would play a central role.
REFERENCES
Day, J.M.D., et al. 2010, Geochimica et Cosmochimica Acta, v. 74, p. 6565–6589.
Day, J.M.D., Hilton, D.R., 2020. Geology.
De Hoog, J. C., Gall, L., & Cornell, D. H., 2010. Chemical Geology, 270(1-4), 196-215.
Pankhurst, M. J., et al., 2022. Volcanica, 5, 1-10.
Torres-González, P. A. et al., 2020. J. Volcanol. Geotherm. Res. 392, 106757.
How to cite: Rizzo, A. L., Sandoval-Velasquez, A., Casetta, F., Ntaflos, T., Aiuppa, A., Alonso, M., Padrón, E., Pankhurst, M., and Pérez, N. M.: First insights into the noble gas signature of the 2021 Cumbre Vieja eruption, La Palma (Canary Islands), EGU General Assembly 2022, Vienna, Austria, 23–27 May 2022, EGU22-12170, https://doi.org/10.5194/egusphere-egu22-12170, 2022.
Please decide on your access
Please use the buttons below to download the presentation materials or to visit the external website where the presentation is linked. Regarding the external link, please note that Copernicus Meetings cannot accept any liability for the content and the website you will visit.
Forward to presentation link
You are going to open an external link to the presentation as indicated by the authors. Copernicus Meetings cannot accept any liability for the content and the website you will visit.
We are sorry, but presentations are only available for users who registered for the conference. Thank you.
EGU22-12201 | Presentations | GMPV9.2
From up above to down below: Comparison of satellite- and ground-based observations of SO2 emissions from the 2021 eruption of Cumbre Vieja, La PalmaCatherine Hayer, José Barrancos, Mike Burton, Fátima Rodríguez, Ben Esse, Pedro Hernández, Gladys Melián, Eleazar Padrón, María Asensio-Ramos, and Nemesio Pérez
Volcanic gas emissions are an integral part of volcano monitoring around the world and can be interpreted to understand the state of a volcano and the evolution of an individual eruption. The low ambient concentrations of SO2 make it an ideal monitoring candidate.
Throughout the 2021 eruption of Cumbre Vieja, La Palma (Spain), observations of SO2 emissions were made using ground-based instruments, in transverse mode, static scanners and on-board drones, as well as by numerous satellite instruments. Direct comparison between satellite- and ground-based instruments is always challenging, but the long duration of the eruption and repeated measurements from both data sets made this a good candidate.
Data from the Sentinel-5P instrument TROPOMI was combined with the PlumeTraj back-trajectory analysis toolkit to produce sub-daily SO2 fluxes that can be directly compared to the ground-based observations as well as other geophysical and geochemical monitoring data.
The volcano produced significant volcanic ash emissions, particularly in the earlier phases of the eruption, which impacted both ground- and satellite-based measurements. This produced underestimations in the SO2loading where ash was present, impacting the proximal plume more that the distal as the ash settles out with time. This meant that traverse measurements were more impacted, leading to a disparity in the measured fluxes from ground and space. Later, when ash emissions had decreased, the agreement between the two was much improved, with trends closely replicated between the traverse and satellite fluxes.
The initial estimates of the total SO2 emission from the eruption were 4.1 Mt from TROPOMI and 1.2 Mt from the traverse data.
These measurements formed part of the official monitoring effort, providing insights into the eruption’s evolution and informing the civil defence response throughout the eruption.
How to cite: Hayer, C., Barrancos, J., Burton, M., Rodríguez, F., Esse, B., Hernández, P., Melián, G., Padrón, E., Asensio-Ramos, M., and Pérez, N.: From up above to down below: Comparison of satellite- and ground-based observations of SO2 emissions from the 2021 eruption of Cumbre Vieja, La Palma, EGU General Assembly 2022, Vienna, Austria, 23–27 May 2022, EGU22-12201, https://doi.org/10.5194/egusphere-egu22-12201, 2022.
Please decide on your access
Please use the buttons below to download the presentation materials or to visit the external website where the presentation is linked. Regarding the external link, please note that Copernicus Meetings cannot accept any liability for the content and the website you will visit.
Forward to presentation link
You are going to open an external link to the presentation as indicated by the authors. Copernicus Meetings cannot accept any liability for the content and the website you will visit.
We are sorry, but presentations are only available for users who registered for the conference. Thank you.
EGU22-12449 | Presentations | GMPV9.2
Geological risk at Roque de los Muchachos astronomical observatory: lessons learned from Cumbre Vieja eruption.Antonio Eff-Darwich, Pablo J. González, Begoña García-Lorenzo, Julio Castro-Almazán, Juan Carlos Pérez-Arencibia, and Jose Antonio Rodríguez-Losada
In 2010, it was published an analysis of the impact of geological activity on the main astronomical observatories worldwide (Eff-Darwich et al., 2010), among them, Roque de los Muchachos observatory (ORM), in the island of La Palma, Canary Islands (Spain). In this work, we compare the results on geological risk at ORM that were obtained in 2010 with the actual impact of Cumbre Vieja eruption. In this sense, we studied the effects of seismicity, ash fall, landslides and ground deformation at ORM. In general, we found a good agreement between the expected and actual impact of volcanic activity at the observatory; however, large differences were found in the distribution of ash fall, likely due to the improper characterization of the atmospheric inversion layer in the model of the dispersion of the volcanic plume.
Eff-Darwich, A., García-Lorenzo, B., Rodríguez-Losada, J., de la Nuez, J., Hernández-Gutiérrez, L., Romero, C., Monthly Notices of the Royal Astronomical Society, Volume 407, Issue 3, September 2010, Pages 1361–1375, https://doi.org/10.1111/j.1365-2966.2010.16925.x
How to cite: Eff-Darwich, A., González, P. J., García-Lorenzo, B., Castro-Almazán, J., Pérez-Arencibia, J. C., and Rodríguez-Losada, J. A.: Geological risk at Roque de los Muchachos astronomical observatory: lessons learned from Cumbre Vieja eruption., EGU General Assembly 2022, Vienna, Austria, 23–27 May 2022, EGU22-12449, https://doi.org/10.5194/egusphere-egu22-12449, 2022.
EGU22-12452 | Presentations | GMPV9.2
Mantle-derived xenoliths from the Cumbre Vieja 2021 lava flows: insights on the composition of the lithosphere beneath La Palma (Canary Islands)Theodoros Ntaflos, Federico Casetta, Andrès Sandoval-Velasquez, Andrea Luca Rizzo, Alessandro Aiuppa, Mar Alonso, Eleazar Padron, Matthew Pankhurst, and Nemesio Perez
Small, cm-sized ultramafic xenoliths have been reported from the opening phase of the 2021 eruption at Cumbre Vieja, where clinopyroxene aggregates, sometimes amphibole, olivine and/or magnetite-bearing (Pankhurst et al., 2021), likely represent early fractionation products and/or relics of mush-like systems located beneath the volcanic edifice.
Detailed sampling of the lavas produced during the intermediate-late eruptive phase (November 9th) revealed the existence, in the massive portion of the flows, of a 1 cm sized dunitic xenolith with protogranular to partly recrystallized texture. The internal portion of the xenolith is composed of Fo88-89 olivine (0.33-0.34 wt% NiO), Ti-Al-poor clinopyroxene (Mg# = 87-92; Al2O3 <1.7 wt%; TiO2 <0.5 wt%), Cr-rich spinel and rare Mg-rich orthopyroxene (Mg# = 88-91; Al2O3 from 0.4-0.5 to 1.7-1.9 wt%). Textural and chemical data (Fe-Mg distribution) indicate that olivine, orthopyroxene and clinopyroxene are not far from equilibrium. Preliminary calculations show that the equilibrium T recorded by the xenolith ranges from 950 to 1070°C, with good consistency between results obtained from olivine-spinel and orthopyroxene-clinopyroxene pairs. Silica oversaturated interstitial glasses (SiO2= 67 wt%) were found in the partly recrystallized part of the xenolith.
Part of the coarse-grained xenolith forms a corona of fine-grained and worm-like association of, olivine, orthopyroxene, clinopyroxene and spinel. Both parts are surrounded by a continuous narrow external zone consisting of Ti-magnetite and sub-euhedral greenish Ti-augite, which is in contact with the host basalt. The composition of olivine and orthopyroxene in the corona keeps getting more Fe-rich towards the external zone whereas the clinopyroxene changes gradually from Ti-free to Ti-bearing diopside.
The small xenolith recovered from the November 9th lava flow is apparently a mantle-derived xenolith similar to those from the Duraznero 1949 eruption described by Klügel (1998), and those from the San Antonio 1677 eruption described by Neumann & Wulff-Pedersen, 1997. On the way to surface, the mantle xenolith likely reacted with basaltic melts to form the first corona. These processes presumably took place in depths between 0.10-0.12 GPa as can be inferred by the presence of silica oversaturated glasses (Neumann & Wulff-Pedersen, 1997). The external zone probably formed as the result of a late-stage stagnation of the host magma at sub-crustal depths, as suggested by the compositional similarity between the clinopyroxene-spinel assemblage and the phenocrysts in the matrix.
Klüger, A. (1998). Reactions between mantle xenoliths and host magma beneath La Palma (Canary Islands: constraints on magma ascent rates and crustal reservoirs. Contrib Mineral Petrol 131:238-257
Neumann, E.-R. and E. Wulff-Pedersen (1997). The Origin of Highly Silicic Glass in Mantle Xenoliths from the Canary Island. Journal of Petrology 32: 1515-1539
Pankhurst, M. J., et al., (2021). Petrology of the opening eruptive phase of the 2021 Cumbre Vieja eruption, La Palma, Canary Islands. Volcanica: 5(1), 1–10
How to cite: Ntaflos, T., Casetta, F., Sandoval-Velasquez, A., Rizzo, A. L., Aiuppa, A., Alonso, M., Padron, E., Pankhurst, M., and Perez, N.: Mantle-derived xenoliths from the Cumbre Vieja 2021 lava flows: insights on the composition of the lithosphere beneath La Palma (Canary Islands), EGU General Assembly 2022, Vienna, Austria, 23–27 May 2022, EGU22-12452, https://doi.org/10.5194/egusphere-egu22-12452, 2022.
EGU22-12491 | Presentations | GMPV9.2 | Highlight
The 2021 Cumbre Vieja eruption: an overview of the geochemical monitoring programNemesio M. Pérez, Pedro A. Hernández, Gladys V. Melián, Eleazar Padrón, María Asensio-Ramos, José Barrancos, Germán D. Padilla, Fátima Rodríguez, Luca D'Auria, Cecilia Amonte, Mar Alonso, Alba Martín-Lorenzo, David Calvo, Claudia Rodríguez, William Hernández, Beverley Coldwell, and Matthew J. Pankhurst and the International Collaborative Research TEAM
Cumbre Vieja (220 km2) is the most active volcano in the Canary Islands. It has been the location of 8 of the 17 historical eruptions in the archipelago during the last 600 years. The establishment of a geochemical monitoring program by our research group for the volcanic surveillance of Cumbre Vieja started in 1997. This program was mainly focused on diffuse degassing monitoring because of the absence of visible volcanic degassing manifestations (fumaroles, plumes, etc.) as well as other obvious geothermal features at Cumbre Vieja up to the 2021 eruption which started on September 19, ended on December 13 and lasted 85 days.
The INVOLCAN’s soil degassing monitoring at Cumbre Vieja is carried out by means of a geochemical instrumental permanent network (soil CO2 efflux, soil gas 222Rn and soil C isotope ratio) and regular geochemical surveys covering the entire area of Cumbre Vieja (diffuse CO2, He and H2 emissions). Several soil degassing anomalies have been observed and some of them years before the 2021 eruption, which illustrates the importance of diffuse degassing monitoring for volcanic surveillance. The single visible manifestation of volcanic degassing at La Palma is a cold CO2-rich site at Taburiente volcano. Regular helium-3 emission monitoring of this observation site has been carried out since 1991 in collaboration with Tokyo Univ., and provided a clear early warning signal of the 2021 Cumbre Vieja eruption. Because of the registration of seismic swarms, and to strengthen the INVOLCAN geochemical monitoring program of Cumbre Vieja volcano, regular sampling of groundwater for chemical and isotopic analysis started in October 2017. The results of this hydrogeochemical monitoring also showed significant changes related to the recent volcanic unrest of Cumbre Vieja.
Since the 2021 eruption onset, INVOLCAN performed daily observations of SO2 emissions using a miniDOAS in traverse mode, on terrestrial (car), sea (ship) and air (helicopter) mobile position recording relatively high SO2 emissions (> 50.000 t/d). Static scanners and satellite instruments were used also to monitoring the SO2 emission released by this eruption; a task lead by the volcano research group of Manchester University. Additional plume geochemical monitoring was carried out using OP-FTIR spectrometers and UAV, helicopter and ground-base MultiGas units to characterize the chemical composition of the plume degassing in collaboration with scientists from Manchester Univ., Palermo Univ., UCL, INGV, IPGP and Azores Univ. Carbon isotope analysis of the CO2 gas plume was also undertaken in collaboration with New Mexico Univ. Analysis of pristine ash leachates has been also performed in collaboration with Durham Univ. and Tokyo Institute of Technology since it is often used to estimate the composition of the gas phase during volcanic eruptions and provides important information on the eruption processes was also performed.
The results of these geochemical observations during the inter-eruptive, pre-eruptive, eruptive and post-erupive phases have been tremendously useful to understand the recent magmatic reactivation of Cumbre Vieja volcano.
How to cite: Pérez, N. M., Hernández, P. A., Melián, G. V., Padrón, E., Asensio-Ramos, M., Barrancos, J., Padilla, G. D., Rodríguez, F., D'Auria, L., Amonte, C., Alonso, M., Martín-Lorenzo, A., Calvo, D., Rodríguez, C., Hernández, W., Coldwell, B., and Pankhurst, M. J. and the International Collaborative Research TEAM: The 2021 Cumbre Vieja eruption: an overview of the geochemical monitoring program, EGU General Assembly 2022, Vienna, Austria, 23–27 May 2022, EGU22-12491, https://doi.org/10.5194/egusphere-egu22-12491, 2022.
Please decide on your access
Please use the buttons below to download the presentation materials or to visit the external website where the presentation is linked. Regarding the external link, please note that Copernicus Meetings cannot accept any liability for the content and the website you will visit.
Forward to presentation link
You are going to open an external link to the presentation as indicated by the authors. Copernicus Meetings cannot accept any liability for the content and the website you will visit.
We are sorry, but presentations are only available for users who registered for the conference. Thank you.
EGU22-12678 | Presentations | GMPV9.2 | Highlight
Impact assessment of buildings exposed to the tephra fallout of the 2021 Cumbre Vieja eruption in La Palma, SpainLucia Dominguez Barragan, Luigia Di Maio, Maria-Paz Reyes Hardy, Corine Frischknecht, Giulio Zuccaro, Nemesio Perez, and Costanza Bonadonna
Long-lasting volcanic eruptions involving a variety of hazards have significant implications on the emergency response and on the final impact on the exposed elements. The eruption of Cumbre Vieja (La Palma, Spain), started on 19 September and ended on 13 December 2021. It was associated with earthquakes, gas emissions, lava flows, lava fountains, and tephra fallout (including large volcanic bombs) that significantly impacted the southwest of the island, caused the evacuation of more than 7,000 people and affected 1,676 buildings. In particular, the total extension of about 12 km2 of lava flows, from the fissural source to the western coast, affected 3 municipalities and cut the island in two, generating a significant disruption of transportation. A comprehensive and systematic survey of about 300 buildings affected by tephra south of the lava flow was carried out during two weeks in October 2021 in order to assess the typology of affected buildings and the associated structural and non-structural damages. Structural damage was associated with partial or total roof collapse of secondary buildings (small independent constructions for warehouse, farming and garage) and annexes (small dependent constructions annexed to the main buildings). The most common non-structural damages include clamping vertical and horizontal cracks, partial or total overturning of walls (in case of clamping or thrust of the stressed roofs), and partial damage of several elements (tiles, plaster, curbs, canopies, parapets, windows, corrugate and fretted sheets and tarps). No major structural damage was observed on main buildings. The reason is due to the fact that primary residential and commercial buildings were considered necessary to meet basic needs of the local population; therefore, roofs were regularly cleaned as part of the emergency management and the daily volcanic response activity on the island. This was not the case for secondary buildings and annexes. This emphasizes the important role of clean-up operations on the resilience of buildings during long-lasting volcanic eruptions that can lapse for weeks or months. Even though structural damage has been observed only on secondary structures and annexes, the detailed impact assessment of those conducted in La Palma provides the first insights into the consequences of tephra loads on medium to weak quality buildings or constructions made with light materials (e.g., corrugated metallic tiles), which can be very common on other volcanic settings.
How to cite: Dominguez Barragan, L., Di Maio, L., Reyes Hardy, M.-P., Frischknecht, C., Zuccaro, G., Perez, N., and Bonadonna, C.: Impact assessment of buildings exposed to the tephra fallout of the 2021 Cumbre Vieja eruption in La Palma, Spain, EGU General Assembly 2022, Vienna, Austria, 23–27 May 2022, EGU22-12678, https://doi.org/10.5194/egusphere-egu22-12678, 2022.
EGU22-12844 | Presentations | GMPV9.2
The September 2021 eruption at Cumbre Vieja volcano (La Palma, Canary Islands): investigation on the pre- and co-eruptive phases through DInSAR measurements and analytical modellingClaudio De Luca, Emanuela Valerio, Flora Giudicepietro, Giovanni Macedionio, Francesco Casu, and Riccardo Lanari
Since 19 September 2021, an intense eruptive activity has begun at Cumbre Vieja volcano (La Palma, Canary archipelago, Spain), causing huge social and economic damage. The eruption was preceded and accompanied by several phenomena, such as ground deformations and seismic activity. In this work, we analyse the Differential Interferometric Synthetic Aperture Radar (DInSAR) measurements obtained by processing Sentinel-1 images acquired from both ascending and descending orbits, in order to quantify the retrieved pre- and co-eruptive deformation patterns. In particular, we exploit the Advanced DInSAR technique referred to Parallel-Small BAseline Subsets (P-SBAS), showing the importance for oceanic islands, such as La Palma, of investigating DInSAR products retrieved from time series, instead of single interferograms. Indeed, this may allow us to effectively remove possible atmospheric artifacts within the retrieved displacement measurements. Subsequently, we invert the processed DInSAR measurements through analytical modelling with the aim of examining the characteristics of the volcanic sources responsible for the observed deformations. In detail, our results highlight that a sill-like source was active in the pre-eruptive phase (8 – 16 September) and it can be interpreted as the effect of the temporary accumulation of magma during its transport toward the surface. On the other hand, the action of two dikes prevailed during the co-eruptive phase (17 – 22 September), causing the eruptive vent opening. Therefore, our results suggest that a complex network of sills and dikes has allowed the magma rising. Moreover, our findings are in good agreement with the seismicity recorded by the Instituto Geografico Nacional (IGN) network, and several geophysical evidences (i.e., resistivity anomaly, petrographic analyses, computation of the erupted magma volumes, field observations).
How to cite: De Luca, C., Valerio, E., Giudicepietro, F., Macedionio, G., Casu, F., and Lanari, R.: The September 2021 eruption at Cumbre Vieja volcano (La Palma, Canary Islands): investigation on the pre- and co-eruptive phases through DInSAR measurements and analytical modelling, EGU General Assembly 2022, Vienna, Austria, 23–27 May 2022, EGU22-12844, https://doi.org/10.5194/egusphere-egu22-12844, 2022.
EGU22-12852 | Presentations | GMPV9.2 | Highlight
Impact at the astronomical Observatory of Roque de los Muchachos from the Cumbre Vieja 2021 volcanic eruption at La Palma.Juan Carlos Pérez-Arencibia, Julio A. Castro-Almazán, Antonio Eff-Darwich, David García-Álvarez, Jon Vilches-Sarasate, Víctor Gallo-Acosta, Begoña García-Lorenzo, and Casiana Muñoz-Tuñón
Between September 19 and December 13, 2021 a strombolian volcanic eruption took place on the island of La Palma. The main edifice was appeared at an altitude of around 900 masl, reaching 1122 masl at the end of the process. The Roque de los Muchachos Observatory (ORM) is an outstanding international astronomical site, hosting some of the most important astrophysical facilities of the world. The Observatory is located 16 km away from the eruptive cone, in the summit of the island, at an altitude ranging between 2200 and 2400 masl. The atmospheric conditions at the Canary Islands conform an almost permanent thermal inversion layer below the level of the observatory that modulated the arrival of the volcanic plume. In this work we are going to briefly review the influence of different parameters associated to the eruption in the ORM routine operation. We will evaluate the impact of the seismic activity, volcanic ash falling, presence of SO2 and airborne particulate matter. The number of days with high remarkable values recorded of these parameters were few. Nevertheless, the actual impact on the different telescopes was heterogeneous, depending on the different risk evaluations, and recovery/response times. An impact report with a compilation of measurements and forecasts was released twice a day during the whole process to help facilities in the daily operational decision making. As a final conclusion, no damages were suffered in any of the installations. Although an important downtime was reported, astronomical observations continued in different degree during the whole episode.
How to cite: Pérez-Arencibia, J. C., Castro-Almazán, J. A., Eff-Darwich, A., García-Álvarez, D., Vilches-Sarasate, J., Gallo-Acosta, V., García-Lorenzo, B., and Muñoz-Tuñón, C.: Impact at the astronomical Observatory of Roque de los Muchachos from the Cumbre Vieja 2021 volcanic eruption at La Palma., EGU General Assembly 2022, Vienna, Austria, 23–27 May 2022, EGU22-12852, https://doi.org/10.5194/egusphere-egu22-12852, 2022.
EGU22-1415 | Presentations | GM2.2
Fully coupled modelling of non-uniform sediment transport in sewer systemsJinxin Liu, Zhixian Cao, and Xichun Li
Flushing is considered as a cost-effective technique for mitigating sediments and constraining environmental problems in sewer systems. Previous mathematical models are almost exclusively based upon simplified governing equations and weak sediment transport assumptions, of which the applicability remains to be theoretically justified. Here a fully coupled one-dimensional model is presented for non-uniform sediment transport in sewer systems, as adapted from recently established shallow water hydro-sediment-morphodynamic models for fluvial processes. The present model is tested for an experimental flushing case in the Des Coteaux catchment system of Paris city. The computational results are compared with measured data, and satisfactory agreements are acquired. It is revealed that the adaptation of bedload sediments to capacity regime can be fulfilled quickly, while the adaptation of suspended sediment transport to capacity regime requires a relatively long time and space, thereby underpinning and warranting the non-capacity modelling paradigm for sewer systems.
How to cite: Liu, J., Cao, Z., and Li, X.: Fully coupled modelling of non-uniform sediment transport in sewer systems, EGU General Assembly 2022, Vienna, Austria, 23–27 May 2022, EGU22-1415, https://doi.org/10.5194/egusphere-egu22-1415, 2022.
EGU22-1419 | Presentations | GM2.2
Flow structure at reservoir-tributary confluence with high sediment loadJunhao Zhang, Yining Sun, Zhixian Cao, and Ji Li
Fluvial flow with high sediment load may plunge into the reservoir to form turbidity current, which may feature strong interaction with inflow from a tributary. However, to date, the understanding of confluent flow structure with high sediment load has remained poor. Here, a computational fluid dynamic software, Flow-3D, is applied to resolve such flows for a series of cases at laboratory-scale by solving unsteady, 3D Reynolds-averaged Navier-Stokes and sediment transport equations, based on finite difference method with structured meshes. The 3D results are compared with those due to a recently established 2D double layer-averaged shallow water hydro-sediment-morphodynamic model. One distinctive flow structure pattern is generated at the confluence with the intrusion of reservoir turbidity current from the main channel into the tributary. Apparent bed aggradation occurs inside the tributary mouth after a long-term hydro-sediment-morphodynamic process. The present finding has a more profound influence on sediment transport and morphological evolution at a reservoir–tributary confluence with high sediment load.
How to cite: Zhang, J., Sun, Y., Cao, Z., and Li, J.: Flow structure at reservoir-tributary confluence with high sediment load, EGU General Assembly 2022, Vienna, Austria, 23–27 May 2022, EGU22-1419, https://doi.org/10.5194/egusphere-egu22-1419, 2022.
EGU22-1463 | Presentations | GM2.2
An integrated two-layer model for simulating shallow flow, sediment transport and overtopping-induced breach processesJiaheng Zhao, Jingming Hou, Ilhan Özgen Xian, Tian Wang, and Reinhard Hinkelmann
Extreme rainfall may generate flash floods, which may overtop the flood defences (e.g., dam, dike, and levees) and subsequently lead to structure failure, threatening the safety of the downstream population and properties. This work presents a new two-layer modelling approach to simulate surface water flooding and the subsequent dam/dike breach process caused by overtopping. The new modelling framework simulates the surface water flooding process in the upper layer using a high-resolution hydrodynamic model that also considers sediment transport and morphodynamic change. A cell-based infinite slope model is implemented to identify unstable slope/soil and estimate the sliding depth for the lower layer. And a cellular automaton method based on diffusion-wave assumption is further developed to simulate the dynamics of the resulting bed granular movement. The momentum and bed elevation source terms of the hydrodynamic governing equations (the flood layer) and the soil depth of debris flow (the granular layer) are simultaneously calculated in a fully coupled way. This results in a fully coupled flooding induced breach chain model. The proposed model is validated against experimental and real-world tests with different breach types. And the sensitivities of calibrated parameters and mesh sizes are discussed in detail. The results indicate that the proposed model can simultaneously simulate overtopping flooding and the associated slope failure and breach processes.
How to cite: Zhao, J., Hou, J., Özgen Xian, I., Wang, T., and Hinkelmann, R.: An integrated two-layer model for simulating shallow flow, sediment transport and overtopping-induced breach processes, EGU General Assembly 2022, Vienna, Austria, 23–27 May 2022, EGU22-1463, https://doi.org/10.5194/egusphere-egu22-1463, 2022.
EGU22-1685 | Presentations | GM2.2
Impact of embankments for reversing neck cutoff on flow structure in a Zoige meandering riverZhiwei Li, Peng Gao, and Bang Chen
Cutoff occurrence is a pivotal process of the forward long-term evolution of meandering river. Here a neck cutoff occurred unexpectedly in a highly sinuous bend of a meandering river in the Zoige basin on the Qinghai-Tibet Plateau in July 2018. Nonetheless, for protecting the grassland inside this bend, subsequently two artificial embankments reversed this neck cutoff (backward evolution) in 2018-2019 and strongly affected three-dimensional flow structure according to field surveys using an unmanned aerial vehicle and acoustic Doppler Current Profiler from 2018 to 2021. This rare case for inhibiting natural cutoff remains an unknown geomorphic process, and furthermore the inverse impact of human intervention on an occurred cutoff is still unclear. The artificial earth embankment was breached in the 2019 flood season and left the broken debris at both ends. Soon afterwards the second rockfill embankment was built in the late 2019 to force the flow back to the original bend so far. Some main results are summarized: (i) Flow structure in the new cutoff channel was intensely adjusted in combination with locally increased channel slope by the cutoff and the first earth embankment built in 2019. Conversely, flow velocity and circulation in the upstream straight reach was less affected by neck cutoff and artificial embankments, while the flow velocity in the bend section was obviously adjusted after neck cutoff and two embankments built. The lateral distribution of the maximum velocity and circulation intensity at the apex of the bend are altered. (ii) After the cutoff occurred, the separate zone shifted to the erosion side of the new cutoff channel in 0.3 times channel width in 2019. At the cross-section of the apex, the clockwise circulation was generated with the maximum streamwise velocity close to the outer bank. The maximum streamwise velocity moved to 0.2 times channel width. (iii) The artificial embankment is a driving factor to generate the strong alteration on the bend completeness and hydrodynamic adjustment along the course in this unique case. It is of great importance on understanding the inverse process for implementing engineering measures to restore the original sinuous flow path and sustain an intact meander landscape after a cutoff occurred. Given that the intervention of reversing neck cutoff is a mandatory task required by local people, it is a better choice to wait 2-3 years until the cutoff channel reaching the quasi-equilibrium state.
How to cite: Li, Z., Gao, P., and Chen, B.: Impact of embankments for reversing neck cutoff on flow structure in a Zoige meandering river, EGU General Assembly 2022, Vienna, Austria, 23–27 May 2022, EGU22-1685, https://doi.org/10.5194/egusphere-egu22-1685, 2022.
EGU22-1885 | Presentations | GM2.2
A novel two-dimensional numerical model developed for slope soil erosionTian Wang, Jingming Hou, Yu Tong, Jiaheng Zhao, and Feng Wang
Slope erosion is the main source of soil erosion. Simulated slope erosion sediment yield and its development process have great significance for quantitative erosion evaluation at the spatiotemporal scale. In this study, a loess slope erosion experiment was implemented indoors to establish a sediment carrying capacity formula suitable for loess slope erosion. A two-dimensional slope erosion numerical model was developed based on the developed sediment carrying capacity formula, and the model was verified by a simulated indoor slope rainfall erosion experiment. The results showed that the corrected slope sediment transport capacity formula is suitable for loess slopes, which have a higher prediction precision. The developed erosion numerical model simulation was verified by simulated rainfall slope erosion experiments. Regarding the evaluation metrics for slope simulation accuracy, the Nash-Sutcliffe efficiency (NSE) values were 0.83 for the runoff rate and 0.66 for the sediment concentration, R2 values were 0.89 for the runoff rate and 0.73 for the sediment concentration, and the relative bias (RB) values were -5.02% for the runoff rate and -1.02% for the sediment concentration. The spatial contribution rate of slope erosion was analysed based on the simulation results, and the most severely eroded areas were the middle and lower parts of the slope. The erosion contribution rate reached 69.59% on the 1-4 m area of the slope. The research results can further improve loessal slope erosion process simulation and prediction.
How to cite: Wang, T., Hou, J., Tong, Y., Zhao, J., and Wang, F.: A novel two-dimensional numerical model developed for slope soil erosion, EGU General Assembly 2022, Vienna, Austria, 23–27 May 2022, EGU22-1885, https://doi.org/10.5194/egusphere-egu22-1885, 2022.
EGU22-1951 | Presentations | GM2.2
A new two-phase shallow water hydro-sedi-morphodynamic model with the HLLC solver for inter-grid numerical flux estimationPeng Hu, Binghan Lyu, Ji Li, Qifeng Liu, Youwei Li, and Zhixian Cao
Given that fluvial flows carrying relatively coarse sediments involve strong interactions between the water and the sediment phases, two-phase shallow water hydro-sedi-morphodynamic models have been developed (Li et al. 2019, Advances in Water Resources, 129(JUL.), 338-353; Lyu et al. 2021: EGU General Assembly 2021, online, 19–30 Apr 2021, EGU21-4258). Here we report improvements over the model by Lyu et al. (2021), which lead to considerably improved numerical accuracies. Specifically, using finite volume method (FVM) to solve the governing equations on unstructured grids, the Harten-Lax-van Leer-Contact (HLLC) Riemann solver is proposed to estimate the inter-cell numerical flux for the flow phase and the sediment phases separately, in contrast to previous two-phase flow models using centered schemes. The improved numerical accuracy is demonstrated by numerically revisiting a series of experimental scenarios including refilling of a dredged trench, and a full dam-break flow in an abruptly widening channel.
How to cite: Hu, P., Lyu, B., Li, J., Liu, Q., Li, Y., and Cao, Z.: A new two-phase shallow water hydro-sedi-morphodynamic model with the HLLC solver for inter-grid numerical flux estimation, EGU General Assembly 2022, Vienna, Austria, 23–27 May 2022, EGU22-1951, https://doi.org/10.5194/egusphere-egu22-1951, 2022.
Please decide on your access
Please use the buttons below to download the presentation materials or to visit the external website where the presentation is linked. Regarding the external link, please note that Copernicus Meetings cannot accept any liability for the content and the website you will visit.
Forward to presentation link
You are going to open an external link to the presentation as indicated by the authors. Copernicus Meetings cannot accept any liability for the content and the website you will visit.
We are sorry, but presentations are only available for users who registered for the conference. Thank you.

EGU22-2194 | Presentations | GM2.2
2-D fully coupled morphodynamic modelling in vegetated environments based on the anisotropic porosity methodWei Li, Bingrun Liu, and Peng Hu
Previous studies for numerical representation of aquatic vegetation based on the isotropic porosity shallow water models can not only consider the effects of vegetation resistance and spatial occupation in physics, but also improve the computational efficiency in large-scale modelling. This type of models provides a promising tool to numerically study the vegetated flow and the corresponding sediment transport in practice. However, the characteristics of preferential flow among complex vegetation distributions which are often observed in nature cannot be well captured due to the isotropic assumption. Thus, we make an improvement by introducing the anisotropic porosity method in the shallow water model. Unlike the isotropic porosity method which uses only one porosity parameter to describe the vegetation spatial occupation, the anisotropic porosity method defines a cell-based porosity for volumetric occupation and an edge-based porosity for flux exchange to capture the flow heterogeneity in space. Under the framework of finite volume method, the model is solved explicitly with a hybrid LTS/GMaTS method and the Open MP techniques for fast modelling. The well-balanced property and accuracy of the developed model have been tested by a series of flume experiments with different vegetation distributions over fixed or mobile beds. In general, both velocity and deposition patterns are well reproduced. It shows that a constant vegetation drag coefficient can lead to numerical solutions of comparable accuracy as those complex empirical relations in the anisotropic porosity modelling. In addition, the stem-scale turbulence could be a critical factor affecting the sediment transport inside and around vegetation patches and its appropriate quantification in the shallow water modelling deserves further research.
How to cite: Li, W., Liu, B., and Hu, P.: 2-D fully coupled morphodynamic modelling in vegetated environments based on the anisotropic porosity method, EGU General Assembly 2022, Vienna, Austria, 23–27 May 2022, EGU22-2194, https://doi.org/10.5194/egusphere-egu22-2194, 2022.
EGU22-3043 | Presentations | GM2.2
Erosional dynamics of a river driven by groundwater seepageMarie Vulliet, Eric Lajeunesse, and Jerome A. Neufeld
How to cite: Vulliet, M., Lajeunesse, E., and Neufeld, J. A.: Erosional dynamics of a river driven by groundwater seepage, EGU General Assembly 2022, Vienna, Austria, 23–27 May 2022, EGU22-3043, https://doi.org/10.5194/egusphere-egu22-3043, 2022.
EGU22-3387 | Presentations | GM2.2
Large-scale experiment on dike breaching with complex measures on the crownWei Huang, Deliang Shi, Hongyan Wei, Yufang Ni, and Wengang Duan
Dike breaching is the main component of flood defending system. To temporally enhance the capacity of the river, small levees will be build on the dike crown to increase the elevation of the dike crest. Also, the dike top usually be paved with concrete as transportation road. Under these two condition, break mechanism are different from those without complex measures on the crown, which has not been investigated yet. Large-scale experiment has been carried to investigate the breaching mechanism. Results show that with small levees, the flow forms a little fall at the downstream edge of the levee top and a much larger fall on the downstream face of the dike. The “headcut” backward retreat is the main breaching mechanism in the early stage of breaching. During the rapid development stage of breaching, the vertical erosion, lateral erosion and gravity collapse are the breaching mechanism. The existence of the external small levee protected the top of the dike from erosion for a long time, which largely delayed the breaching processes. As the top was paved, the breaching processes likes that of dike with small levees. Two falls forms at the edge of the road and at the downstream face respectively. When the backward retreat of “headcut” at the downstream face of the dike reaches the base of the dike, the underneath soil is washed away and lead to concrete of the road collapse. Once the road is collapsed completely, two falls merged into one, thereafter the breaching processes likes dikes without complex measures on the crown. The paved road also delayed the breaching processes. This study can provide scientific support to dike breaching emergency management.
How to cite: Huang, W., Shi, D., Wei, H., Ni, Y., and Duan, W.: Large-scale experiment on dike breaching with complex measures on the crown, EGU General Assembly 2022, Vienna, Austria, 23–27 May 2022, EGU22-3387, https://doi.org/10.5194/egusphere-egu22-3387, 2022.
EGU22-3607 | Presentations | GM2.2
Application of the Shields diagram for evaluating critical shear stress for vegetated flowsYesheng Lu, Nian-Sheng Cheng, and Maoxing Wei
The well-known Shields diagram is developed for unvegetated open channel flows to describe incipient sediment motion by means of critical bed shear stress. Due to difficulties in estimating the bed shear stress in vegetated flows, it is not clear whether the Shields diagram is applicable in the presence of vegetation. By applying the phenomenological theory of turbulence, a new method to evaluate the bed shear stress in vegetated flows is proposed in this study. With this method, the critical bed shear stress subject to vegetated flows is calculated using the published data. The result shows that the calculated critical shear stresses are consistent with the Shields diagram.
How to cite: Lu, Y., Cheng, N.-S., and Wei, M.: Application of the Shields diagram for evaluating critical shear stress for vegetated flows, EGU General Assembly 2022, Vienna, Austria, 23–27 May 2022, EGU22-3607, https://doi.org/10.5194/egusphere-egu22-3607, 2022.
EGU22-4162 | Presentations | GM2.2
Morphodynamic model of the Yichang-Chenglingji Reach: migration of erosion centers downstream of the Three Gorges DamHualin Wang, Shan Zheng, and Chenge An
Abstract: Many rivers worldwide have suffered great degradation after large reservoirs construction. By investigating the Yichang-Chenglingji reach downstream of the Three Gorges Dam, we identified and analyzed the erosion centers (sub-reach with most severe erosion intensity) which migrated downstream along the river with the rate of 7.5 km/yr. To simulate the phenomenon and study the factors influencing the migration rate of erosion centers, a one-dimensional river morphodynamic model is implemented using field data (including water and sediment regimes and grain size of bed material) of Yichang-Chenglingji reach based on the active layer theory. We set three values for the thickness of active layer and designed four groups of grain size distribution of the sub-layer based on the drill data and the grain size distribution of bed surface material at Yichang station. The simulation results show that the main cause of the erosion centers is bed armoring. A high-speed bed armoring process is instrumental in the formation and migration of erosion centers, as the armoring of bed surface inhibits the further degradation in the upper reach. The thinner the active layer and the coarser the sub-layer, the faster the process of bed armoring. Under the condition that the thickness of the active layer is 1.5m and the sediment of sub-layer is the field data of bed surface material at Yichang station in 2020, the migration rate (13km/yr.) of erosion centers in simulation results are most in agreement with the actual erosion centers. Our results may deepen the understanding of the river evolution after the abrupt sediment reduction.
Key words: Three Gorges Dam; Yichang-Chenglingji Reach; Morphological evolution; Erosion centers; Spatial clustering; Numerical model
How to cite: Wang, H., Zheng, S., and An, C.: Morphodynamic model of the Yichang-Chenglingji Reach: migration of erosion centers downstream of the Three Gorges Dam, EGU General Assembly 2022, Vienna, Austria, 23–27 May 2022, EGU22-4162, https://doi.org/10.5194/egusphere-egu22-4162, 2022.
EGU22-4258 | Presentations | GM2.2
The effects of dredged channel geometry on the barrier lake outburstYufang Ni, Wei Huang, and Wengang Duan
The events of barrier lake outburst have been frequently reported under the impacts of earthquakes, climate change and human activities, which usually brought tremendous disaster to the downstream regions. Dredging a channel is one of the main measures to deal with the barrier lake risk. However, the effects of the channel geometry on the outburst have been unclear. Therefore, we conducted a series of large-scale field experiments on the barrier lake outburst responding to different geometry profiles of dredged channels. Results show that the barrier lake outburst with dredged channel has four development stages, i.e., erosion alongside the dredged channel, backward headcut erosion, rapid development and weak development. For all cases in this work, the peak stage in the reservoir appears earlier than the peak discharge. The rates of the enlargement of the dredged channel are similar among all the cases, while the start time of the enlargement and the final width of the breach are different. Digging of a small notch advances the enlargement of the breach.
How to cite: Ni, Y., Huang, W., and Duan, W.: The effects of dredged channel geometry on the barrier lake outburst, EGU General Assembly 2022, Vienna, Austria, 23–27 May 2022, EGU22-4258, https://doi.org/10.5194/egusphere-egu22-4258, 2022.
EGU22-4448 | Presentations | GM2.2
Sediment load determines the shape of riversPredrag Popovic, Olivier Devauchelle, Anais Abramian, and Eric Lajeunesse
Understanding how rivers adjust to the sediment load they carry is critical to predicting the evolution of landscapes. Presently, however, no physically based model reliably captures the dependence of basic river properties, such as its shape or slope, on the discharge of sediment, even in the simple case of laboratory rivers. Here, we show how the balance between fluid stress and gravity acting on the sediment grains, along with cross-stream diffusion of sediment, determines the shape and sediment flux profile of laminar laboratory rivers that carry sediment as bedload. Using this model, which reliably reproduces the experiments without any tuning, we confirm the hypothesis, originally proposed by G. Parker (1978), that rivers are restricted to exist close to the threshold of sediment motion (within about 20%). This limit is set by the fluid–sediment interaction and is independent of the water and sediment load carried by the river. Thus, as the total sediment discharge increases, the intensity of sediment flux (sediment discharge per unit width) in a river saturates, and the river can transport more sediment only by widening. In this large discharge regime, the cross-stream diffusion of momentum in the flow permits sediment transport. Conversely, in the weak transport regime, the transported sediment concentrates around the river center without significantly altering the river shape. If this theory holds for natural rivers, the aspect ratio of a river could become a proxy for sediment discharge—a quantity notoriously difficult to measure in the field.
How to cite: Popovic, P., Devauchelle, O., Abramian, A., and Lajeunesse, E.: Sediment load determines the shape of rivers, EGU General Assembly 2022, Vienna, Austria, 23–27 May 2022, EGU22-4448, https://doi.org/10.5194/egusphere-egu22-4448, 2022.
EGU22-4631 | Presentations | GM2.2
Verification of the pier scour development in the experimental environmentGordon Gilja, Robert Fliszar, Antonija Harasti, and Nikola Adžaga
Experiments conducted in the hydraulic flume provide a controlled flow environment, which often provides means for prompt qualitative investigation of general flow structure. Under the R3PEAT project (www.grad.hr/r3peat), research focus is on the scour at bridge piers protected by the riprap sloping structure – investigated using both physical and 3D numerical model. Experimental data, while constrained by the flume dimensions and the pump capacity, measured with high frequency Vectrino Profiler’s provide detailed insight into turbulence around the structure. Experimental models are set-up as segments of the river extruded from the bathymetric and hydraulic surveys, corresponding to the flume size and selected scaling. Based on the experimental data, 3D numerical model will be calibrated in order to investigate flow conditions for the relevant floods with design return period, exceeding the flume capacity. Physical model therefore must reliably present the prototype bridge, through resulting flow field in the pier vicinity. This paper presents verification of the physical model using field ADCP measurements. ADCP velocities are compared to experimental data on the 4 cross-sections adjacent to the bridge, adapted to the relative flume streamwise orientation. Advantages and disadvantages of the physical model usage as benchmark for numerical model setup are discussed.
Acknowledgments
This work has been supported in part by Croatian Science Foundation under the project R3PEAT (UIP-2019-04-4046).
How to cite: Gilja, G., Fliszar, R., Harasti, A., and Adžaga, N.: Verification of the pier scour development in the experimental environment, EGU General Assembly 2022, Vienna, Austria, 23–27 May 2022, EGU22-4631, https://doi.org/10.5194/egusphere-egu22-4631, 2022.
EGU22-4702 | Presentations | GM2.2
Experimental study on sediment deposition and water level surge under unsteady sediment supplyQihang Zhou, Lu Wang, Xingnian Liu, and Ruihua Nie
Storms often cause serious rainfall runoff in mountain river areas, which results large amounts of sediment form upstream hills to downstream channels, leading to a reconstruction of the riverbed and finally water and sediment disasters. High concentration sediment transport may exist during flash floods, and performs unsteady supply process in channels. Based on laboratory experiments, this paper analyzed the responses of riverbed elevation and water level to unsteady sediment supply. The unsteady sediment supply is described as a single triangular sediment process. The sediment supply rate of all tests is greater than the sediment transport capacity of the flow. Results show that the riverbed deposits and water level rises continuously during sediment supply, while the flow depth decreases correspondingly. The greater the rate of sediment supply, the faster the rising of riverbed elevation and water level. After the sediment supply ended, the deposited bed degraded and the rising water level decreased. Compared with the constant sediment supply, the riverbed elevation and water level under unsteady sediment supply rise greatly. In addition, it is found that the flow discharge with saturated sediment supply is much less than that without sediment supply in the same water level. Because the concentration sediment transport increases the flow resistance and then makes the water level sharply rise. The study highlighted the important effects of the unsteady sediment supply on bed morphology and water level surge in water and sediment disasters, and enhanced the understanding of the mechanism caused by the sharply rise of water level in flash floods.
How to cite: Zhou, Q., Wang, L., Liu, X., and Nie, R.: Experimental study on sediment deposition and water level surge under unsteady sediment supply, EGU General Assembly 2022, Vienna, Austria, 23–27 May 2022, EGU22-4702, https://doi.org/10.5194/egusphere-egu22-4702, 2022.
EGU22-4883 | Presentations | GM2.2
Impacts of approach bedforms on live-bed scour at rock weirsWen Zhang, Lu Wang, Xingnian Liu, and Ruihua Nie
Rock weirs are river restoration structures used for grade control, raising upstream water level and restoring river habitat. This paper presents an experimental study of local scour at rocks weirs under live-bed scour condition. The effects of approaching bedform, flow intensity, weir height and void ratio on the scour depth at rock weirs are analyzed and discussed. Under clear-water scour condition, scour occurs only at the downstream of rock weirs; the equilibrium scour depth increases with increased flow intensity and weir height, but decreases with increased void ratio. Under live-bed scour condition, scour occurs both upstream and downstream of rock weirs. The equilibrium upstream scour depth increases first and then decreases with increased flow intensity, decreases with increased weir height, and has a complex relationship with increased void ratio. The equilibrium downstream scour depth decreases first and then increases with flow intensity, increases with increased weir height, and decreases with increased void ratio.
How to cite: Zhang, W., Wang, L., Liu, X., and Nie, R.: Impacts of approach bedforms on live-bed scour at rock weirs, EGU General Assembly 2022, Vienna, Austria, 23–27 May 2022, EGU22-4883, https://doi.org/10.5194/egusphere-egu22-4883, 2022.
EGU22-6105 | Presentations | GM2.2
Simulating water flow over a rolling bed of non-cohesive materials by using a Hydromorphodynamic model.Zaid Alhusban, Manousos Valyrakis, and Hamed Farhadi
In the process of sediment exchange from one region of the water column to another, morphological development occurs, as does the transmission of varying sediment concentrations and flow momentum along the stream. Herein, a one-dimensional hydro-morphodynamic model is proposed for simulating water flow over a rolling bed of non-cohesive materials to understand better how water flows. Flow hydrodynamics, sediment movement, and bed growth are all considered in this simulation. The governing equations were solved using first-order accurate Harten Lax-van Leer solvers, and the fluxes at cell sides were determined using a finite volume technique based on a structured rectangular mesh. Adding geometry and bed topography to the equations in both the x and y axes may be used to convert a onedimensional model to a two-dimensional model, which is a common approach to transforming one-dimensional models into two-dimensional models. Experimental measurements are also utilized to test and assess the integrated model.
How to cite: Alhusban, Z., Valyrakis, M., and Farhadi, H.: Simulating water flow over a rolling bed of non-cohesive materials by using a Hydromorphodynamic model., EGU General Assembly 2022, Vienna, Austria, 23–27 May 2022, EGU22-6105, https://doi.org/10.5194/egusphere-egu22-6105, 2022.
EGU22-6355 | Presentations | GM2.2
Evaluation of riprap failure impact on the downstream scour holeRobert Fliszar and Gordon Gilja
Scouring around bridge piers is considered to be a significant process in rivers because it can alter bridge loading and consequently its stability. Riprap is often deployed as scour countermeasure, and while it does protect the pier from local scouring, it doesn’t completely solve the scouring problem because it deflects the scour hole downstream of the bridge. Riprap is flexible, and flood events can induce five significant failure mechanisms - shear, edge and winnowing failure under clear-water conditions and bedform-induced and bed-degradation-induced failure under live-bed conditions. On the other hand, the thick riprap layer can withstand a partial failure of the layer with the capability of armouring the scour hole. This paper investigates the mechanisms of riprap partial collapsing and its effects on the development of a downstream scour hole. Experiments were conducted on the physical model of scouring around bridge piers protected with riprap built in the Department of Hydroscience and Engineering laboratory under the University of Zagreb. Experimental setup included different pier shapes (rectangular and circular piers) in order to examine the influence of the pier as well as the influence of riprap geometry in different flow conditions.
Acknowledgments
This work has been supported in part by Croatian Science Foundation under the project R3PEAT (UIP-2019-04-4046).
How to cite: Fliszar, R. and Gilja, G.: Evaluation of riprap failure impact on the downstream scour hole, EGU General Assembly 2022, Vienna, Austria, 23–27 May 2022, EGU22-6355, https://doi.org/10.5194/egusphere-egu22-6355, 2022.
EGU22-6898 | Presentations | GM2.2
Changes of channel bars in the wandering reach of the lower Yellow River from 2018 to 2021Min Zhang
Since Xiaolangdi Reservoir began to retained sediment in 1999, the Lower Yellow River (LYR) has deepened and widened continuously. The bankfull discharge has increased obviously, and the average depth has increased 1.3m~3.3m. The incoming water was abundant in recent four years from 2018 to 2021, and the peak discharge in the four year were all greater than 4000m3/s. The maximum discharge of Xiaolangdi station has reached 5500m3/s, which is the largest one since 1996. The evolution of channel bar in wandering reach is always the focus in sediment-laden rivers, especially in erosion period. Therefore, to appraise the changes in wandering reach of LYR in the erosion period, this study presents a detailed investigation of the channel bar changes in recent typical floods form 2018 to 2021. We described the bar pattern formation and sensitivity in wandering reach of LYR. Furthermore, we analyzed the numbers and area of channel bars based on the remote sensing images. We convert the channel bar at the same level from the relationship between the area of channel bar and water level at low water period. The results show that the channel sinuosity has decreased from 1.25 to 1.22, while the radius of curvature has increased from 2.80 to 2.96km. The number and area of channel bar have increased slightly. This phenomenon was affected mainly by the operation of Xiaolangdi Reservoir. The clear water and few bankfull discharge in 21 years since 1999, the channel erosion efficiency has decreased in the first ten years. So the erosion in recent four years floods was fewer. And the changes of channel bar slightly in recent four years. But the channel bar and channel pattern evolution dramatically from 1999 to 2021.
How to cite: Zhang, M.: Changes of channel bars in the wandering reach of the lower Yellow River from 2018 to 2021, EGU General Assembly 2022, Vienna, Austria, 23–27 May 2022, EGU22-6898, https://doi.org/10.5194/egusphere-egu22-6898, 2022.
EGU22-7110 | Presentations | GM2.2
Determination of the appropriate baseflow separation method for gauging stations on the two lowland rivers in CroatiaMartina Lacko, Kristina Potočki, and Gordon Gilja
The estimation of baseflow is one of the essential tasks in water resources management and hydrologic research to assess the impacts of climate change and to describe and predict flood events based on the flood hydrograph characteristics (peak flow, duration and volume). Several methods have been developed to separate baseflow from direct flow, and in recent years they have been automated through the use of available R packages. In this work R programming language packages “EcoHydRology” and “lfstat” were used to separate baseflow from direct flow on the historical daily discharge time series of the several gauging stations on the two large lowland rivers in Croatia: the Sava River and the Drava River. The aim of this study is to determine the appropriate baseflow separation method for gauging stations on Sava River and Drava River in order to evaluate the baseflow separation method for future multivariate analysis of flood events under the R3PEAT project (www.grad.hr/r3peat) that explores pier scour development next to the bridges crossing large rivers in Croatia with installed scour countermeasures.
How to cite: Lacko, M., Potočki, K., and Gilja, G.: Determination of the appropriate baseflow separation method for gauging stations on the two lowland rivers in Croatia, EGU General Assembly 2022, Vienna, Austria, 23–27 May 2022, EGU22-7110, https://doi.org/10.5194/egusphere-egu22-7110, 2022.
EGU22-7196 | Presentations | GM2.2
Threshold of aeolian and fluvial nonsuspended sediment transport along arbitrarily sloped beds from an analytical model of periodic grain motionYulan Chen and Thomas Pähtz
The downslope component of the gravitational force affects the threshold and direction of sediment transport along an arbitrarily sloped bed. It plays an important role for the shape and stability of river channels, and for the formation, evolution, and morphology of aeolian and fluvial bedforms. Here, we generalize an existing model of the threshold of nonsuspended sediment transport, which unifies aeolian and fluvial transport conditions using an analytical description of flow-driven periodic grain motion, to account for arbitrarily sloped beds. Without any readjustment of the model parameters, the generalized model captures the experimentally measured bed slope effect on the transport threshold much better than previously proposed models based on incipient grain motion, especially for large bed slopes in the direction transverse to the driving flow. This is mostly because drag resistance counteracts the transverse average motion of transported grains, which in the model has the same mathematical effect as a reduction of the transverse bed slope. For aeolian transport, the model predicts substantial gravity-induced transverse diffusion of saltating grains, neglected in previous studies, which may explain why aeolian barchan dunes generally tend to have a larger width than length.
How to cite: Chen, Y. and Pähtz, T.: Threshold of aeolian and fluvial nonsuspended sediment transport along arbitrarily sloped beds from an analytical model of periodic grain motion, EGU General Assembly 2022, Vienna, Austria, 23–27 May 2022, EGU22-7196, https://doi.org/10.5194/egusphere-egu22-7196, 2022.
EGU22-8006 | Presentations | GM2.2
Using a natural laboratory to quantify sediment mobility in the turbulent wake of instrument frames and offshore infrastructure.Christopher Unsworth, Martin Austin, and Katrien Van Landeghem
Predicting sediment transport near the threshold of mobility is a particular challenge in coastal environments, due in part to turbulence in the wake of bedforms and infrastructure but also due to variable grain size distributions and biological processes affecting mobility. Understanding the relevant processes and having the ability to accurately predict sediment transport in shallow shelf seas are currently of pivotal importance due to the prevalence of offshore wind infrastructure being built on mobile seabeds with mixtures of sediment grain sizes.
Bridging the gap between the small-scale detail of sediment transport to large-scale modelling is a key challenge for the community. Using a set of novel observations of suspended sediment concentration (via a multifrequency acoustic backscatter system) and turbulence (via Nortek’s Aquadopp High Resolution Doppler Profiler) from a coastal site (~15 m depth) with sandy bed sediments, we revisit the threshold of motion from the perspective of Grass’ 1970’s work by investigating the overlaps of bed shear stress and initiation of motions for the bed sediments. A section of electricity cable was attached to the seabed instrument frame so that on ebb tides turbulent wakes and sediment suspensions from interactions with the cable and frame were measured, and on flood tides a clear boundary layer flow was measured.
We create a distribution of initiation of motions from bed sediment data, and from the ADCP data we calculate distributions of bed shear stresses using a temporal filter based on the large eddy turnover time. We investigate the overlap between the two distributions to assess the temporal mobility of the sediments, and discuss how estimating these distributions (and their overlap) can be an important way of improving our predictive capability of sediment transport beyond the usual median grain size and bed shear stress methods – especially important when there are turbulent wakes from bedforms and sea bed infrastructure.
How to cite: Unsworth, C., Austin, M., and Van Landeghem, K.: Using a natural laboratory to quantify sediment mobility in the turbulent wake of instrument frames and offshore infrastructure., EGU General Assembly 2022, Vienna, Austria, 23–27 May 2022, EGU22-8006, https://doi.org/10.5194/egusphere-egu22-8006, 2022.
EGU22-8428 | Presentations | GM2.2
Coupling physical and digital built environments for proactive asset managementFotios Konstantinidis, Panagiotis Michalis, and Manousos Valyrakis
Various sectors of the built environment (BE) are threatened by deterioration processes that have an increasing trend due to ageing infrastructure, current extreme climatic conditions, increasing urban population, and limited financial resources [1]. Digitalization has the potential to transform the current processes of managing and sharing critical information that can enhance decision-making and, in the long term, enable efficient and sustainable BE. However, despite the recent technological advancements, BE, and particularly critical infrastructure systems are still managed following a traditional approach in both technological but also organizational, and institutional aspects. As a result, they do not take full advantage of the recent technological developments that can enable a more sophisticated approach that involves the incorporation of real-time data streams and the employment of advanced analytical methods for efficient management of resources and risks. To overcome this challenge, the utilization of technologies and advancements provided by Civil Infrastructure 4.0 (CI4.0) [2] accelerate the digitalization of the BE focusing on critical infrastructure systems.
This study focuses on providing an overview of the pillars for the next generation BE, which aims to enable an interconnected and collaborative ecosystem across cities, infrastructure, and societies. Various case studies are presented, including large residential regions, transportation networks across waterways, and buildings in which digitalization can play a pivotal role in providing instantly information to the BE stakeholders for enhanced decision-making. These are based on obtaining real-time data from the surrounding environment to assist in predicting the current and future states of BE. For example, obtained information derived from advanced microcontrollers measure the deteriorating performance of the ageing infrastructure systems over waterways and the flood levels in real-time. At the same time, datasets are incorporated into a high-performance machine hosted in cloud and deep-learning algorithms to predict the upcoming states of the infrastructure and climatic risk. In the case of an emergency state (e.g., river overflow, flash floods, or infrastructure disruption), the management system generates an alarm. At the same time, the models also predict infrastructure deterioration to inform critical stakeholders promptly to take action and adapt the societal functions accordingly. Digitalization is expected to enable a flourishing society and physical and natural environment across our cities and infrastructure, which play a significant role in the upcoming Society 5.0.
References
[1] Pytharouli, S., Michalis, P. and Raftopoulos, S. (2019). From Theory to Field Evidence: Observations on the Evolution of the Settlements of an Earthfill Dam, over Long Time Scales. Infrastructures 2019, 4, 65. https://doi.org/10.3390/infrastructures4040065
[2] Michalis, P., Konstantinidis, F. and Valyrakis, M. (2019). The road towards Civil Infrastructure 4.0 for proactive asset management of critical infrastructure systems. Proceedings of the 2nd International Conference on Natural Hazards & Infrastructure (ICONHIC), 23–26 June, Chania, Greece, pp. 1-9.
How to cite: Konstantinidis, F., Michalis, P., and Valyrakis, M.: Coupling physical and digital built environments for proactive asset management, EGU General Assembly 2022, Vienna, Austria, 23–27 May 2022, EGU22-8428, https://doi.org/10.5194/egusphere-egu22-8428, 2022.
EGU22-9689 | Presentations | GM2.2
Influence of spillway structure upon the outburst flood process in a high risk barrier lakezhao zhou and yaojun cai
Aimed at the engineering problems of uncontrollable outburst flood process and large outburst flood peak in a high risk barrier lake, this paper successively adjusts the lateral and longitudinal spillway structure through an indoor physical model and then investigates the consequent outburst flood process differences between the trapezoidal spillway, the compound spillway and the vertical scarp spillway. The results show that the outburst flood process for all kinds of spillway can be successively divided into four typical stages, the initial stage, the retrospective stage, the swift failure development stage and the recovery stage. Compared to the relatively hysteretic initial stage in the trapezoidal spillway, the compound spillway can effectively accelerate the development of initial stage by decreasing down the overtopping elevation, thereby shortening the outburst flood process and cutting down the outburst flood peak by 17.0%. Moreover, the vertical scarp spillway can artificially make a vertical scarp to increase the local velocity at the retrospective stage and further accelerate the initial outburst process, thus significantly shortening the water storage time with upstream maximum water level greatly down. Correspondingly, the barrier body in the vertical scarp spillway would collapse slightly faster due to the excessively accelerated initial outburst process, but the maximum outburst flood peak can still be 11.4% lower than that of the trapezoidal spillway. These investigations can provide reasonable and abundant choices for the emergency disposal in the high risk barrier lake.
How to cite: zhou, Z. and cai, Y.: Influence of spillway structure upon the outburst flood process in a high risk barrier lake, EGU General Assembly 2022, Vienna, Austria, 23–27 May 2022, EGU22-9689, https://doi.org/10.5194/egusphere-egu22-9689, 2022.
EGU22-10068 | Presentations | GM2.2
Analysis of oscillatory flow around a rigidly attached spherical particle to the bottom in a sloshing tankOral Yagci, Murat Aksel, Fatih Yorgun, and Manousos Valyrakis
Oscillatory flows are commonly observed flow conditions in sloshing tanks or at the seabed/river mouths under the effect of gravity and seiche waves. In such environments, particles are exposed to bi-directional oscillation-caused forces. These particles are usually sediments in settling basins under earthquake conditions or deposits on seabed/river mouths.
Physical model tests investigated the hydrodynamic forces acting on a spherical particle. This step is followed by a computational fluid dynamic model (i.e., RANS model), which aims to resolve the pressure and force fluctuations around a rigidly attached spherical particle to the bottom.
The experiments were conducted in a sloshing tank with 28.5cm length, 14.5 cm in width, and 20 cm in depth. A step-type-computer-controlled motor triggered the body of water within the tank. The motion of the mobile component of the tank was measured using two independent devices, i.e., an accelerometer and an ultrasonic distance sensor. The utilization of these measurement devices enables verifying the records of the motion double. Six different cases were conducted to define the error band for each device. These calibration cases emerge as a combination of the “better step motor speed” and “maximum displacement”. The acceleration records constitute a basis as an input for the RANS-based numerical model. During the validation/calibration of the CFD model, video records of the water surface observed during the experiment and the CFD outputs were comparatively analyzed based on an image-processing technique.
Once it was ensured that the CFD model simulated the sloshing process within the tank with an acceptable accuracy, a spherical particle was fixed to the bottom as the second phase of this study. Various sloshing scenarios were performed better to understand the fluctuation of the pressure field around the sphere. Based on these simulations, the variation of drag coefficient around the spherical body which emerges under the oscillatory flow was calculated.
How to cite: Yagci, O., Aksel, M., Yorgun, F., and Valyrakis, M.: Analysis of oscillatory flow around a rigidly attached spherical particle to the bottom in a sloshing tank, EGU General Assembly 2022, Vienna, Austria, 23–27 May 2022, EGU22-10068, https://doi.org/10.5194/egusphere-egu22-10068, 2022.
EGU22-10116 | Presentations | GM2.2
Numerical simulation and experimental validation of the air-water flow in a Hydraulic Test BenchZied Driss, Khadija Rahal, Mariem Lajnef, Mohamed Salah Abid, and Manousos Valyrakis
Air-water flow interfaces around and over most hydraulic structures are complex, yet of crucial importance for safeguarding society and the resilience of the built environment. In this context, the present research work reports a computational fluid dynamics (CFD) methodology to accurately predict the complex air-water flow in a large-scale hydraulic test bench. It focuses on the potential of the volume of fluid (VOF) model to predict the free water surface evolution. The simulations were performed using the commercial software ANSYS Fluent 17.0, which utilized a three-dimensional Navier–Stokes equations in the unsteady flow regime. The Standard k-ɛ turbulence model was used, and the finite volume method was considered. The numerical uncertainty was quantified by the grid convergence index (GCI) method. The numerical results were found to be in excellent agreement with the experimental data.
Keywords: CFD, Turbulent Flows, Air-water flows, Hydraulic test bench.
How to cite: Driss, Z., Rahal, K., Lajnef, M., Salah Abid, M., and Valyrakis, M.: Numerical simulation and experimental validation of the air-water flow in a Hydraulic Test Bench, EGU General Assembly 2022, Vienna, Austria, 23–27 May 2022, EGU22-10116, https://doi.org/10.5194/egusphere-egu22-10116, 2022.
EGU22-10189 | Presentations | GM2.2
Assessment of the transport capacity of floating plastics through fluvial systemsRidwan Raquib, Lukasz Przyborowski, and Manousos Valyrakis
Since the early times of plastic production, the relative change increased approximately about 391,050%. It went from a cumulative production of 2 million tons in 1950 to 7.82 billion tons in 2015. Even though there are variable recycling methods at present, not all discarded plastic gets recycled. The vast majority of the waste plastic makes its way to the ocean through specific pathways, with one of the most dominant being transport via fluvial networks. Moreover, a relatively minimal amount of data is available on the transport of riverine plastic. Plastics found in rivers can accumulate, causing flow blockages and potentially affecting flow routing (intensifying flooding and other climate risks). They can also affect water quality and ecology, including biota that may ingest these through the leakage of chemicals. Out of the various types of plastic, buoyant macro plastic is a major polluter, and understanding its flow in rivers can help us reduce plastic pollution in the long run.
This study focuses on getting a better understanding of how floating plastics debris is transported in rivers with aquatic vegetation by undertaking well-controlled lab flume experiments. Specifically, the transport of floating plastic debris in a river system was studied through a series of flume experiments, using instream simulated vegetation. Vegetation patches of different densities were used to assess their effect on the flow field carrying buoyant plastics of variable sizes. The video camera is used to record the transport process of plastic along the flume until they impinge on the simulated vegetation patch. Obtained video files of the flume experiments are analyzed to assess the effect of vegetation density on the transport efficiency of the plastic. Preliminary results focus on using specific transport metrics, particle velocity before contact with the vegetated patch, focusing on the size of plastics being transported. Altered according to various flow conditions and river morphology, the results of this study will help engineers in the future to design and produce more resilient methods of vegetation patches and engineering structures in order to exploit the trapping effects of macro plastics.
How to cite: Raquib, R., Przyborowski, L., and Valyrakis, M.: Assessment of the transport capacity of floating plastics through fluvial systems, EGU General Assembly 2022, Vienna, Austria, 23–27 May 2022, EGU22-10189, https://doi.org/10.5194/egusphere-egu22-10189, 2022.
EGU22-10252 | Presentations | GM2.2
Some observations on the prediction of bridge scour from first principlesManish Pandey, Yi Xu, Panagiotis Diplas, and Manousos Valyrakis
The development and generation of scour holes around hydraulic infrastructures, such as bridge piers, can affect their stability and lead to their structural failure. Bridge scour is becoming increasingly challenging to tackle, especially under the context of climate change, increased urbanization pressures, and lack of adequate funding to inspect and maintain aging built infrastructure near water surface bodies [1,2]. As a result, many infrastructure failures are driven by the formation of scour holes due to strong enough turbulent flows. Traditionally, the research community has explored infrastructure scour by aiming to identify correlations between phenomenologically relevant parameters, such as the pier characteristics and the mean flow conditions around it. However, such bridge pier scour prediction models and relevant formulas are developed focusing on idealized lab experiments using bulk/averaged parameters. Thus, they may receive criticism due to their relatively limited generalization ability and their capacity to be validated with field data.
This study adopts a new paradigm assuming that it is rather meaningful to study scour as a dynamic process stemming from the interplay of the highly turbulent three-dimensional eddies stemming downstream of the pier with the granular material comprising the bed around it. Motivated by this observation and recent relevant research, the current study aims to shed more light on the role of impulse induced by the dynamics of flow energy acting on individual particles and setting them in motion [2], leading to the scour hole formation.
To the above goal, experimental tests are conducted in a water-recirculating flume with a depth of 50cm, a width of 90cm, and a length of 700cm. The generated scour hole developed past different cylindrical pier models is studied. Flow impulses are calculated from high resolution (200Hz) flow velocimetry data collected over a finely spaced grid downstream of the bridge pier model. This study is a first attempt to demonstrate the application of the impulse criterion towards predicting scour depth - as opposed to all past phenomenological models that employ bulk flow and pier parameters.
References
[1] Pandey, M., Valyrakis, M., Qi, M., Sharma, A., Lodhi, A.S. (2020). Experimental assessment and prediction of temporal scour depth around a spur dike, International Journal of Sediment Research, 36(1), pp.17-28, DOI: 10.1016/j.ijsrc.2020.03.015.
[2] Khosronejad, A., Diplas, P., Angelidis, D., Zhang, Z., Heydari, N., Sotiropoulos, F. (2020). Scour depth prediction at the base of longitudinal walls: A combined experimental, numerical, and field study, Environmental Fluid Mechanics, 20, pp.459–478, DOI: 10.1007/s10652-019-09704-x.
[3] Valyrakis, M., Diplas, P., Dancey, C.L. (2013). Entrainment of coarse particles in turbulent flows: An energy approach, Journal of Geophysical Research, 118(1), pp.42-53, DOI:10.1029/2012JF002354.
How to cite: Pandey, M., Xu, Y., Diplas, P., and Valyrakis, M.: Some observations on the prediction of bridge scour from first principles, EGU General Assembly 2022, Vienna, Austria, 23–27 May 2022, EGU22-10252, https://doi.org/10.5194/egusphere-egu22-10252, 2022.
EGU22-10620 | Presentations | GM2.2
Assessing the risk of infrastructure scour due to turbulence, using miniaturized instrumented particlesYi Xu, Hamed Farhadi, Panagiotis Michalis, and Manousos Valyrakis
During extreme river-flow conditions induced by the continually worsening effects of climate change, the riverbed granular surface may get destabilized and can potentially be the cause of infrastructure failures [1]. Such conditions signify the start of the geomorphic change of the river's boundaries, affecting natural river habitat and the built infrastructure in its vicinity, especially near surface water bodies, costing billions of pounds per year globally. Given its importance, identifying the conditions leading to hydraulic infrastructure scour (i.e., scour around abutments and piers) has been a topic of intense focus for hydraulic researchers and engineering practitioners alike, especially over the last decades.
This research aims at studying the conditions leading to the start of hydraulic infrastructure scour by assessing the turbulent energy of flow structures leading to the destabilization of the bed surface around them. Specifically, a physical model of a cylindrical bridge pier is used in a flume to conduct lab experiments for various flow rates, aiming at probing the risk of critical failure of the riverbed surface. The experiments are conducted at a water recirculating laboratory flume with a cylindrical pier under four different flow rates. The experimental setup involves a flat fixed bed surface hydraulically roughened by spherical beads packed closely in a hexagonal arrangement, with a similarly roughened 3D-printed test section, on top of which an instrumented particle [2] can be positioned at distinct distances from the model pier. The risk of bed surface destabilization and scour initiation is assessed by the probability of entrainment of the instrumented particle for the combination of flow rates and distances downstream of the model cylinder [3]. The latter can be estimated as the rate of entrainment of the instrumented particle, monitored from the appropriate post-processing of the fused sensor data and validated from video observations (from a top and side camera). In this work, the 3-axis accelerometers and gyroscopes that offer records to help directly produce estimates of the probability of entrainment are embedded within an instrumented particle with an external diameter of 3.5cm.
These observations are further linked to the flow turbulence energy by aiming to establish correlations of the entrainment risk of the exposed instrumented particle to the probability of occurrence of turbulent eddies shed downstream the cylindrical model pier. Profiles of point flow turbulence measurements are obtained with acoustic Doppler velocimetry (ADV) at distinct distances downstream of the model pier. Flow energy and impulses are calculated from the probed flow velocity data at seven longitudinal distances.
References
[1] Michalis P, Xu Y, Valyrakis M (2020). Current practices and future directions of monitoring systems for the assessment of geomorphological conditions at bridge infrastructure. River Flow 2020. In: Proceedings of the 10th Conference on Fluvial Hydraulics, Delft, Netherlands, 7–10 July, pp.1–6. ISBN 9781003110958
[2] AlObaidi, K., Valyrakis, M. (2021). Explicit linking the probability of entrainment to the flow hydrodynamics, Earth Surface Processes and Landforms, DOI: 10.1002/esp.5188.
[3] Valyrakis, M., Diplas, P., Dancey C.L. (2011). Entrainment of coarse grains in turbulent flows: an extreme value theory approach, Water Resources Research, 47(9), W09512, pp.1-17, DOI:10.1029/2010WR010236.
How to cite: Xu, Y., Farhadi, H., Michalis, P., and Valyrakis, M.: Assessing the risk of infrastructure scour due to turbulence, using miniaturized instrumented particles, EGU General Assembly 2022, Vienna, Austria, 23–27 May 2022, EGU22-10620, https://doi.org/10.5194/egusphere-egu22-10620, 2022.
EGU22-10656 | Presentations | GM2.2 | Highlight
Predicting coarse particle displacements due to turbulent flows at near-threshold conditions via LSTM modelsHamed Farhadi, Yi Xu, Panagiotis Michalis, Zaid AlHusban, and Manousos Valyrakis
Bed particle motion as bedload transport in riverine flows is a topic of interest in scientific and engineering fields as it is responsible for erosion and sedimentation, which are essential for hydraulic structures design and maintenance [1] but also for river and basin management. The physics of particle motion as the bedload is governed by stochastic processes which interrelated various parameters and conditions (i.e., particle-particle and particle-flow interrelations). Therefore, applying physically-based or hydrodynamic modeling is not always intuitive because of the complex dynamics. In these situations, in which physics is complex, data-driven modeling approaches may yield an efficient alternative approach since it solely considers the relations among the data. Artificial intelligence models (as for data-driven approach) have offered robust predictive performance in various fields of study. In addition, for time-series and sequential forecasting, a beneficial approach is to choose a model that relates previous states to predict future events.
This study contributes to developing a Long Short-Time Memory (LSTM) neural network modeling to predict the particle displacements near-threshold conditions. In order to prepare the data needed for the study, experimental tests were conducted in a hydraulic laboratory on a tilting recirculating flume with a 2000 (length) cm × 60 (width) cm dimension. Laser Doppler Velocimetry (LDV) was applied to record the flow velocity time-series upstream of the particle with 350-hertz frequency. Also, a He-Ne laser with a photomultiplier tube was used to track the particle motion [2]. Data were pre-processed with some statistical approaches for outlier detections and normalization purposes [3]. Therefore, different training and validation datasets ratios were considered, and the results were analyzed with some statistical measures (i.e., MAPE and RMSE).
The proposed input-output architecture (based on the hydrodynamic forces acting on the bed particle) was a function of the future particle displacement and local instantaneous streamwise flow velocity (about 1 diameter upstream of it). Accordingly, the proposed LSTM model achieved high particle displacement prediction accuracy even for lower percent data conditions for model training.
References
[1] Michalis, P., Saafi, M. and Judd, M. (2012). Wireless sensor networks for surveillance and monitoring of bridge scour. Proceedings of the XI International Conference Protection and Restoration of the Environment - PRE XI. Thessaloniki, Greece, pp. 1345–1354.
[2] Diplas, P., Celik, A.O., Dancey, C.L., Valyrakis, M. (2010). Non-intrusive method for Detecting Particle Movement Characteristics near Threshold Flow Conditions, Journal of Irrigation and Drainage Engineering, 136(11), pp.774-780, DOI:10.1061/(ASCE)IR.1943-4774.0000252.
[3] Valyrakis, M., Diplas, P., Dancey, C.L. (2011). Prediction of coarse particle movement with adaptive neuro-fuzzy inference systems, Hydrological Processes, 25(22). pp.3513-3524, DOI:10.1002/hyp.8228.
How to cite: Farhadi, H., Xu, Y., Michalis, P., AlHusban, Z., and Valyrakis, M.: Predicting coarse particle displacements due to turbulent flows at near-threshold conditions via LSTM models, EGU General Assembly 2022, Vienna, Austria, 23–27 May 2022, EGU22-10656, https://doi.org/10.5194/egusphere-egu22-10656, 2022.
EGU22-12375 | Presentations | GM2.2
A New Risk Monitoring Approach to Assess Infrastructure PerformanceKhaldoon AlObaidi, Yi Xu, Hamed Farhadi, Panagiotis Michalis, and Manousos Valyrakis
One of the most vulnerable elements of the built environment is critical infrastructure constructed near water bodies, as flowing water negatively impacts their performance [1]. Water-related hazards can increase degradation effects which can be the leading cause for their structural failure. The current practice to assess the condition of structures is typically based on visual inspections, which in many cases are carried out in challenging environmental conditions posing threats for the health and safety of inspectors, among other issues [2]. Important key points about the safety of the structures are often not captured by the visual inspections because these areas of interest are not accessible or visible by inspectors. Real-time monitoring of flood events together with other environmental and structural-related datasets are considered key to better understanding essential aspects of degradation effects at infrastructure. The difficulty in detecting seepage processes inside the body of geo-infrastructure with conventional methods also leads to irreversible impacts with significant disruption and costs to road asset owners, maintainers, and users. The need to obtain real-time information about the evolution of natural and climatic hazards is therefore considered necessary considering the ageing infrastructure, constructed near geomorphologically active rivers, and the extreme shifting climatic conditions.
This work investigated the development of a new risk-monitoring ecosystem to remotely assess the condition of infrastructure. The development of two sensing units with complementary characteristics to provide information about flood risk at bridge sites and seepage processes at road embankments is presented. The sensing system is based on a cloud-based interface with a web-based visualization tool that enables asset owners to monitor in real-time the health of infrastructure systems and receive early warnings when incoming data exceed predetermined threshold levels [1,2,3]. Finally, the potential application location of the sensing units is also discussed alongside the proposed threshold levels that will provide information about the low, medium, high, and very high-risk probability.
References
[1] Michalis, P., Saafi, M. and Judd, M. 2012. Wireless sensor networks for surveillance and monitoring of bridge scour. Proceedings of the XI International Conference Protection and Restoration of the Environment - PRE XI. Thessaloniki, Greece, pp. 1345–1354.
[2] Michalis, P. Xu., Y. and Valyrakis M. (2020). Current practices and future directions of monitoring systems for the assessment of geomorphological conditions at bridge infrastructure. River Flow 2020. Proceedings of the 10th Conference on Fluvial Hydraulics, Delft, Netherlands, 7-10 July. pp. 1-6.
[3] AlObaidi, K. and Valyrakis, M. (2021). Explicit linking the probability of entrainment to the flow hydrodynamics, Earth Surface Processes and Landforms, DOI: 10.1002/esp.5188.
How to cite: AlObaidi, K., Xu, Y., Farhadi, H., Michalis, P., and Valyrakis, M.: A New Risk Monitoring Approach to Assess Infrastructure Performance, EGU General Assembly 2022, Vienna, Austria, 23–27 May 2022, EGU22-12375, https://doi.org/10.5194/egusphere-egu22-12375, 2022.
EGU22-12570 | Presentations | GM2.2
Incorporating an instrumented particle to monitor the dynamic processes of bed particle motion from entrainment to low transport stagesZaid Al-Husban, Hamed Farhadi, Khaldoon AlObaidi, Yi Xu, and Manousos Valyrakis
Bed particle motion as bedload entrainment in riverine flows is a topic of interest in scientific and engineering fields. It is responsible for erosion and sedimentation, essential for designing hydraulic structures and river and basin management. Stochastic processes govern the physics of coarse particle motion due to particle-particle (here, bed particles) and fluid-particle interrelations, yet not mainly considered for estimating and describing the bedload flux and motions. Therefore, authentic knowledge of bed particle behavior in different phases of entrainment and transport might lead to a better description of the phenomenon. This study contributes to applying a non-intrusive particle monitoring technique, i.e., an embedded micro-electromechanical system (MEMS) as “smart particle” [1], to explore and monitor the dynamics of the initial and the bed particle motion near- and above threshold conditions.
Additionally, the imaging technique was deployed to track and monitor the instantaneous particle velocity and displacement during the transport, which was also applied as a complementary technique to calibrate and assess the MEMS sensor results [2]. The dynamics of incipient particle motion and particle transport were evaluated in sets of hydraulic flume experiments (by applying the instrumented particle) for different flow conditions, which deliver distinct particle entrainment and transport regimes [3-5]. The stochastic frameworks, which best described the hydrodynamic aspects of the entrainment and transport conditions, were chosen and discussed in relation to the near riverbed surface flow hydrodynamic conditions for better comprehension of the conditions leading to incipient entrainment and relatively low bedload transport stages.
References
[1] Valyrakis, M., Alexakis, A. (2016). Development of a “smart-pebble” for tracking sediment 2transport. River Flow 2016, MO, USA.
[2] Valyrakis, M., Farhadi, H. (2017). Investigating coarse sediment particles transport using PTV and “smart-pebbles”instrumented with inertial sensors, EGU General Assembly 2017, Vienna, Austria, 23-28 April 2017, id. 9980.
[3] Farhadi, H. and Valyrakis, M. (2021). Exploring probability distribution functions best-fitting the kinetic energy of coarse particles at above threshold flow conditions. In EGU General Assembly Conference Abstracts (pp. EGU21-1820).
[4] AlObaidi, K., Xu, Y., and Valyrakis, M. (2020). The Design and Calibration of Instrumented Particles for Assessing Water Infrastructure Hazards, Journal of Sensor and Actuator Networks, 2020, 9(3), pp.36(1-18), DOI: 10.3390/jsan9030036.
[5] AlObaidi, K. and Valyrakis, M. (2021). Linking the explicit probability of entrainment of instrumented particles to flow hydrodynamics. Earth Surface Processes and Landforms, 46(12), pp.2448-2465.
How to cite: Al-Husban, Z., Farhadi, H., AlObaidi, K., Xu, Y., and Valyrakis, M.: Incorporating an instrumented particle to monitor the dynamic processes of bed particle motion from entrainment to low transport stages, EGU General Assembly 2022, Vienna, Austria, 23–27 May 2022, EGU22-12570, https://doi.org/10.5194/egusphere-egu22-12570, 2022.
EGU22-12828 | Presentations | GM2.2 | Highlight
Experimental characterization of mechanical clogging of dry granular flows through sudden constrictionsSolange Mendes, Rodrigo Farias, Rui Aleixo, Michele Larcher, Teresa Viseu, and Rui Ferreira
A granular system is a collection of macroscopic particles that interacts through dissipative collisions and enduring contacts. It can exhibit gas, liquid or solid behaviour. These systems present phase transitions and coexistence of different phases. As for solid-liquid transitions, there is vast literature in thermal and athermal systems but no universal models of first-order or second-order phase transitions.
In particular, dry granular flows (the movement of granular material in fluids of low density and viscosity) can serve as models of debris flows. Mechanical clogging occurs when the mass of granular material is stopped in from of slits or orifices in check dams. There is currently not enough knowledge on the processes that lead to clogging.
In this research we conducted a series of 31 laboratory experiments of dry granular flows constricted through a vertical gap, adjacent to the side wall, mimicking slit dam conditions. The granular material was composed of monosized polystyrene particles (Ø1.8 mm). The width of the slit was 2 particle diameters. The granular mass was released suddenly in a 1.5 m long chute, tilted at 20°. Instrumentation included two high-speed cameras (300 fps), located upstream, at the gate location, and downstream, at the slit location. Instantaneous velocities were obtained with PTV at the chute wall. In this work we discuss the behaviour or mean longitudinal velocities and of granular temperatures when the clogging occurs. The start of the clogging process was identified as the ts – solidification instant, this instant is defined by the moment the first particles stop moving.
It is shown that the statistical distribution of ts is probably not heavy-tailed. It has a positive asymmetry [0.410] and low flatness [-1.369]. Analysing 0.133 s before and after the solidification instant, it is shown that the mean velocity and the granular temperature of the granular system is constant up to 0.033 s before ts while the solid volume increases. It is not clear which portions of the system are in a gas phase and which are in a liquid phase.
The dissipative nature of the system becomes apparent from ts – 0.033 s. It is postulated that the rate of collisions has substantially increased with the increase of the solid fraction. It is expected that the rate of dissipation of fluctuating energy is a non-linear increasing function of the volume fraction. Hence, from ts – 0.033 onwards, a decrease in granular temperature (granular cooling) becomes evident. A reduction of the mean velocity becomes apparent at the same instant. The decrease of the fluctuating kinetic energy is continuous across the phase transition but appears stronger after ts.
As a result of this work we will explore the hypothesis that the liquid-solid phase transition, observed in terms of mean velocities and granular temperatures is best modelled as smooth transition.
This work was funded by Portuguese Foundation for Science and Technology (FCT) through Project PTDC / ECI-EGS / 29835/2017 - POCI-01-0145-FEDER-029835, financed by FEDER funds through COMPETE2020, by National funds through FCT, IP. and partially funded by FEDER Project by the FCT Project RECI/ECM-HID/0371/2012.
How to cite: Mendes, S., Farias, R., Aleixo, R., Larcher, M., Viseu, T., and Ferreira, R.: Experimental characterization of mechanical clogging of dry granular flows through sudden constrictions, EGU General Assembly 2022, Vienna, Austria, 23–27 May 2022, EGU22-12828, https://doi.org/10.5194/egusphere-egu22-12828, 2022.
EGU22-1378 | Presentations | GM2.1
Particle path length estimation: a signal processing approachLindsay Capito, Simone Bizzi, Nicola Surian, and Walter Bertoldi
The structure and function of rivers is directly related to bedload transport which is difficult to measure due to its spatial heterogeneity and the logistic constraints of field measurements. These difficulties have given rise to the morphological method wherein sediment transport is inferred from changes in morphology and estimates of the distance traveled by sediment during a flood, its path length. However, current methods for estimating path length are time and labor intensive, have low recovery rates, and are limited to some morphological units. We propose a method to estimate path length from repeat digital elevation models (DEM’s of difference i.e. DoDs) which are requisite for the morphological method. We interpret the pattern of erosion and deposition downstream as a signal and apply Variational Mode Decomposition (VMD), a signal processing method, to quantify the periodicity as a proxy for path length. We developed this method using flume experiments with measured sediment flux and applied it to published field data with tracer measurements for validation. The preliminary results provide a range of values on the same order of magnitude as measured tracer and flux data and are coherent with channel geometry. This method provides a reasonable estimation of path length based solely on remotely sensed data and a range of plausible sediment fluxes associated with specific channel morphological processes through DoD interpretation.
How to cite: Capito, L., Bizzi, S., Surian, N., and Bertoldi, W.: Particle path length estimation: a signal processing approach, EGU General Assembly 2022, Vienna, Austria, 23–27 May 2022, EGU22-1378, https://doi.org/10.5194/egusphere-egu22-1378, 2022.
Please decide on your access
Please use the buttons below to download the presentation materials or to visit the external website where the presentation is linked. Regarding the external link, please note that Copernicus Meetings cannot accept any liability for the content and the website you will visit.
Forward to presentation link
You are going to open an external link to the presentation as indicated by the authors. Copernicus Meetings cannot accept any liability for the content and the website you will visit.
We are sorry, but presentations are only available for users who registered for the conference. Thank you.
EGU22-1395 * | Presentations | GM2.1 | Highlight
Network-scale analysis of sedimentary hotspots in dynamic, seismically-active steepland riversNiraj Bal Tamang and Jon Tunnicliffe
Seismic shaking in mountain environments introduces the potential for complex fluvial response from a multitude of landslide sources. Stream networks may be impacted in multiple branches, introducing the possibility of interacting sedimentary ‘pulses’ moving through the system. Large quantities of mobile sediment added to the stream network from multiple sources during and after a co-seismic event can overload susceptible river reaches, causing changes in sediment transport and storage. Although past research works have addressed dynamic sediment movement in river networks and identification of sedimentary hotspots, the physiographic factors (e.g. canyons, bends, fans, slope change) that prompt such change remain unexplored. The catchment settings and reach sequences that contribute most to delay/acceleration of the sediment in the active mountain environments are investigated in order to improve hazard assessment in susceptible terrain. In this work, we employ the one-dimensional River Network Bed-Material Sediment model (Czuba & Foufoula-Georgiou, 2014) to explore the landscape factors that may lead to hotspot behaviour for the very coarse sand fraction (2mm), followed by multi-criteria analysis of four basic stream network parameters: slope, sinuosity, channel confinement and tributary influence. Patterns of network topology associated with delay and accumulation of river sediment in the model were systematically identified in 75,400 stream links from 16 major drainages (135 to 6425 km2) of New Zealand’s upper South Island, as assessed by sediment travel time and the cluster persistence index (CPI). Catchment size determines the number of sediment sources, and thus ultimately the magnitude of the sedimentary hotspots i.e., bigger catchments can accommodate more landslides which increases the sediment input, along with the chances of sediment accumulation at susceptible locations. Multi-criteria analysis of the top 10 reaches with highest CPI values in each catchment (160 sites, total), showed that about 30% of the hotspots occurred in partly-confined valley settings with gentle slope (<0.02m/m), moderate sinuosity (1-1.1), downstream from the confluence of two or more tributaries. This combination emerged as the most likely setting for the occurrence of sedimentary hotspots in active mountain river networks. This approach may provide a simple means to map out susceptible sites based upon reach characteristics, which will not only contribute to improved catchment hazard assessment but may also help to augment more sophisticated models of catchment response to co-seismic landslide events.
How to cite: Tamang, N. B. and Tunnicliffe, J.: Network-scale analysis of sedimentary hotspots in dynamic, seismically-active steepland rivers, EGU General Assembly 2022, Vienna, Austria, 23–27 May 2022, EGU22-1395, https://doi.org/10.5194/egusphere-egu22-1395, 2022.
Please decide on your access
Please use the buttons below to download the presentation materials or to visit the external website where the presentation is linked. Regarding the external link, please note that Copernicus Meetings cannot accept any liability for the content and the website you will visit.
Forward to presentation link
You are going to open an external link to the presentation as indicated by the authors. Copernicus Meetings cannot accept any liability for the content and the website you will visit.
We are sorry, but presentations are only available for users who registered for the conference. Thank you.

EGU22-2505 | Presentations | GM2.1
Multi-river Calibration Curve for Passive Acoustic Bedload Transport Monitoring.Mohamad Nasr, Thomas Geay, Sébastien Zanker, and Alain Recking
Bedload transport estimation is required for a variety of engineering and ecological applications. Measurement of bedload transport by direct sampling is expensive and time-consuming and rarely captures the spatio-temporal variability of bedload transport. Recent research shows that passive acoustic technology, such as hydrophone, has the potential to monitor bedload transport by recording Self Generated Noise (SGN) resulting from particles collision. In this work, we present a calibration curve relating specific bedload flux to cross-sectional acoustic power for 40 experiments conducted on 13 French rivers. We present the measurement protocols for bedload transport and SGN, the results of the campaign, and discuss the physics of the relationship between the measured quantities.
How to cite: Nasr, M., Geay, T., Zanker, S., and Recking, A.: Multi-river Calibration Curve for Passive Acoustic Bedload Transport Monitoring., EGU General Assembly 2022, Vienna, Austria, 23–27 May 2022, EGU22-2505, https://doi.org/10.5194/egusphere-egu22-2505, 2022.
EGU22-2894 | Presentations | GM2.1
Capturing the Influence of Large Wood on Fluvial Bedload Transport with RFID Tracers and Linear Mixed ModellingMiles Clark, Georgina Bennett, Sandra Ryan, David Sear, and Aldina Franco
Bedload transport is a fundamental process by which coarse sediment is transferred through landscapes by river networks and may be well described stochastically by distributions of grain step length and rest time obtained through tracer studies. To date, none of these published tracer studies have specifically investigated the influence of large wood in the river channel on distributions of step length or rest time, limiting the applicability of stochastic sediment transport models in these settings. Large wood is a major component of many forested rivers and is increasing due to anthropogenic ‘Natural Flood Management’ (NFM) practices. This study aims to investigate and model the influence of large wood on grain-scale bedload transport.
We tagged 957 cobble – pebble sized particles (D50 = 73 mm) and 28 pieces of large wood (> 1 m in length) with RFID tracers in an alpine mountain stream. We monitored the transport distance of tracers annually over three years, building distributions of tracer transport distances. Empirical data was used in linear mixed modelling (LMM) statistical analysis, determining the relative influence proximity to wood had on likelihood of entrainment, deposition, and the transport distances of sediments.
Tracer sediments accumulated both up and downstream of large wood pieces, with LMM analysis confirming a reduction in the probability of entrainment of tracers closer to wood in all three years. Upon remobilisation, tracers entrained from positions closer to large wood had shorter subsequent transport distances in each year. In 2019, large wood also had a trapping effect, significantly reducing the transport distances of tracer particles entrained from upstream, i.e. forcing premature deposition of tracers. This study demonstrates the role of large wood in influencing bedload transport in alpine stream environments, with implications for both natural and anthropogenic addition of wood debris in fluvial environments.
How to cite: Clark, M., Bennett, G., Ryan, S., Sear, D., and Franco, A.: Capturing the Influence of Large Wood on Fluvial Bedload Transport with RFID Tracers and Linear Mixed Modelling, EGU General Assembly 2022, Vienna, Austria, 23–27 May 2022, EGU22-2894, https://doi.org/10.5194/egusphere-egu22-2894, 2022.
Please decide on your access
Please use the buttons below to download the presentation materials or to visit the external website where the presentation is linked. Regarding the external link, please note that Copernicus Meetings cannot accept any liability for the content and the website you will visit.
Forward to presentation link
You are going to open an external link to the presentation as indicated by the authors. Copernicus Meetings cannot accept any liability for the content and the website you will visit.
We are sorry, but presentations are only available for users who registered for the conference. Thank you.
EGU22-6075 * | Presentations | GM2.1 | Highlight
How does Coastal Gravel get Sorted under Stormy Longshore Transport?Haggai Eyal, Yehouda Enzel, Eckart Meiburg, Bernhard Vowinckel, and Nadav G Lensky
Storm waves transport and sort coarse gravel along coasts. This fundamental process is important under changing sea-levels and increased storm frequency and intensity. However, limited information on intra-storm clast motion restricts theory development for coastal gravel sorting and coastal management of longshore transport. Here, we use ‘smart boulders’ equipped with loggers recording underwater, real-time, intra-storm clast motion, and measured longshore displacement of varied-mass marked boulders during storms. We utilize the unique setting of the Dead Sea shores where rapidly falling water levels allow isolating boulder transport during individual storms. Guided by these observations, we develop a new model quantifying the critical wave height for a certain clast mass mobilization. Then, we obtain an expression for the longshore clast displacement under the fluid-induced pressure impulse of a given wave. Finally, we formulate the sorting enforced by wave-height distributions during a storm, demonstrating how sorting is a direct manifestation of regional hydroclimatology.
How to cite: Eyal, H., Enzel, Y., Meiburg, E., Vowinckel, B., and G Lensky, N.: How does Coastal Gravel get Sorted under Stormy Longshore Transport?, EGU General Assembly 2022, Vienna, Austria, 23–27 May 2022, EGU22-6075, https://doi.org/10.5194/egusphere-egu22-6075, 2022.
EGU22-6321 | Presentations | GM2.1
Fast and automatic measurement of grain geometries from 3D point cloudsLaure Guerit, Philippe Steer, Dimitri Lague, Alain Crave, and Aurélie Gourdon
The size distribution of sediments together with their shape inform on their transport history, are important factors controlling the efficiency of erosion and transport, and control the quality of aquatic ecosystems. However, the size distribution of sediments is generally assessed using poorly representative field measurements and determining the grain-scale shape of sediments remains a real challenge in geomorphology. To tackle this issue, we develop a new methodological approach based on the segmentation and geomorphological fitting of 3D point clouds. Point cloud segmentation into individual grains is performed using a watershed algorithm applied here to 3D point clouds. Once the grains are individualized into several sub-clouds, the morphology of each grain is determined by fitting a 3D ellipsoid to each sub-cloud. These 3D models are then used to extract the size distribution and the grain-scale shape of the sediment population. The algorithm is validated against field data acquired by Wolman counts in coastal and fluvial environments. The main benefits of this automatic and non-destructive method are that it provides, with a fast and efficient approach, access to 1) an un-biased estimate of surface grain-size distribution on a large range of scales, from centimeters to tens of meters; 2) a very large number of data, only limited by the number of grains in the point-cloud dataset; 3) the 3D morphology of grains, in turn allowing to develop new metrics characterizing the size and shape of grains; and 4) the in-situ orientation and organization of grains and grain clusters. The main limit of this method is that it is only able to detect grains with a characteristic size significantly greater than the resolution of the point cloud.
How to cite: Guerit, L., Steer, P., Lague, D., Crave, A., and Gourdon, A.: Fast and automatic measurement of grain geometries from 3D point clouds, EGU General Assembly 2022, Vienna, Austria, 23–27 May 2022, EGU22-6321, https://doi.org/10.5194/egusphere-egu22-6321, 2022.
EGU22-6666 * | Presentations | GM2.1 | Highlight
Measurement and modeling of slope-wash and rill erosion on hillslopes using a novel combination of instrumented plots and remote sensingJon Pelletier, Nathan Abramson, Satya Chataut, Sriram Ananthanarayan, and David Ludwick
We have measured unit sediment fluxes and their relationship to unit water discharges over 7 orders of magnitude on hillslopes of up to 350 m in length in Arizona. Unit sediment and water fluxes were measured using a novel combination of instrumented monitoring plots and repeat photogrammetric surveys analyzed volumetrically. The monitoring plots, which are ideal for measuring sediment fluxes in relatively planar portions of the landscape dominated by slope-wash erosion, funnel water and sediment into a detention basin where bedload sediment fluxes are measured and then into a flume where water discharges and suspended sediment fluxes are measured at 1-minute intervals using a pressure transducer and calibrated turbidity sensor. Repeat photogrammetric surveys complement the monitoring plots by measuring sediment fluxes in rills that tend to form in areas of convergent flow during intense rain events. The volumetric change in each pixel is digitally routed to determine the volumetric sediment flux in each pixel associated with rilling during a rain event. Unit water discharges for every pixel cannot be measured directly but are estimated using a rainfall-runoff model calibrated to the monitoring plot data. The relationship between unit sediment fluxes and unit water dischargees exhibits two piecewise power-function relationships with different exponents characterizing the slope-wash and rill-dominated regimes. We developed a novel landscape evolution model, inspired by the SIBERIA model but improved in specific ways optimized for hillslopes, that uses the measured piecewise power-function relationship between unit sediment fluxes and unit water discharges to predict hillslope evolution from time scales of individual events to decades. The predictions of the model are validated using ten years of observation of rill development at the study site. We provide equations for estimating the parameters of the piecewise power-function relationship for other hillslopes with different cover characteristics. This measurement and modeling framework must be tested at more study sites but is potentially useful for predicting the erosion of any hillslope, including alternative designs for landscape rehabilitations following mining or other anthropogenic disturbances.
How to cite: Pelletier, J., Abramson, N., Chataut, S., Ananthanarayan, S., and Ludwick, D.: Measurement and modeling of slope-wash and rill erosion on hillslopes using a novel combination of instrumented plots and remote sensing, EGU General Assembly 2022, Vienna, Austria, 23–27 May 2022, EGU22-6666, https://doi.org/10.5194/egusphere-egu22-6666, 2022.
EGU22-6702 | Presentations | GM2.1
An acoustic model for monitoring bedload transport with microphones arrayZheng Chen, Siming He, Tobias Nicollier, Lorenz Ammann, Alexandre Badoux, and Dieter Rickenmann
Accurate measurements of bedload flux in mountain rivers remain an important issue in hydraulic engineering. Diverse acoustic-based monitoring devices have been utilized to record continuous vibration signals triggered by bedload particle impacts, aiming to translate bedload information such as transport rates and grain size distributions from the generated signals. However, the spatial variability of bedload impacts on the river bed (or on an impact plate) contributes to uncertainty in the calibration relationship between the recorded signal and bedload flux.
The present study develops an acoustic model based on microphone data to determine the characteristics of the air shock waves induced by the bedload particle impacts on the bed. A phased microphone array (PMA) system is established on the plane underside of an impact plate flush with the river bed, which includes a number of mini microphone elements set apart from each other at a specific spacing distance. The model allows for a calculation of the cross-power matrix of the air vibrations recorded by each microphone of the array. The acoustic vibrations recorded on the PMA plane are subsequently reconstructed and transformed to an acoustic image of the sound source on a scanning plane of the plate surface, considering different air propagation models corresponding to monopole, multipole and moving sources. As a result, the locations of the bedload particle impacts can be detected, connecting to the central coordinates of the reconstructed sound source. The signal amplitude extracted from the sound intensity in the reconstructed acoustic image potentially provides a better way for classifying bedload particle size than just utilizing the raw data recorded by one of the microphone elements.
The findings of this study contribute to the measurement and monitoring of the bedload transport with an acoustic system, illustrating a promising way to identify bedload impact locations, which could be helpful in grain size classification during the transport process.
How to cite: Chen, Z., He, S., Nicollier, T., Ammann, L., Badoux, A., and Rickenmann, D.: An acoustic model for monitoring bedload transport with microphones array, EGU General Assembly 2022, Vienna, Austria, 23–27 May 2022, EGU22-6702, https://doi.org/10.5194/egusphere-egu22-6702, 2022.
EGU22-6865 * | Presentations | GM2.1 | Highlight
Modelling the sensitivity of changes in sediment flux and grainsize distributions on flooding in the Kathmandu basin, NepalSaraswati Thapa, Hugh D. Sinclair, Maggie Creed, Simon M. Mudd, Mikael Attal, Manoranjan Muthusamy, and Bholanath Sharma
Abstract: Climate change and land-use change impact the sediment flux and grainsize delivered to rivers which influences channel morphologies and hence modifies flood risk; this is particularly the case where channels are fed by high mountain catchments. Here, We studied the Nakkhu River which is the largest southern tributary of the Kathmandu basin, Nepal. The mobility of the channel is well documented in response to bank erosion, down-cutting, and accumulation of bar forms; these processes are particularly important during extreme flood events. Comparing satellite images from 2003 to 2020, the river course, which has a medium channel width of 15 m, has migrated laterally up to 130m. Bank erosion and down-cutting reduce the inundation and water storage upstream, whereas aggradation of river bar forms downstream reduces the channel’s conveyance capacity. These vertical and lateral geomorphological alterations result in significant impact on flood risk downstream.
In this research, we investigate how changes in sediment supply, and grain size affect river morphology and flood inundation in the Nakkhu River. We use the landscape evolution model, CAESAR-Lisflood, combined with a newly generated (2019) 10 m digital elevation model, field-derived grainsize data and 20 years (2001 to 2020) of daily discharge data, to simulate erosion and deposition along a 14 km reach of the river. In a set of experiments, we compare river bed cross-sections, flood extent, and water depths for 15 model scenarios where we vary sediment supply and grain size from fine sand to coarse gravel dominated distributions assessing the geomorphic uncertainty of observation of sediment data.
The model results show that channel morphologies are sensitive to changes in sediment grainsize distribution. The study suggests that lack of consideration of sediment impact in flood hazard mapping could lead to increased flood risk. In addition, this study highlights some of the challenges regarding the significance of grain size parameter and uncertainty to the landscape evolution model that need to be addressed in current research.
Keywords: River morphology, sediment flux, grainsize, flood modelling, Nepal
How to cite: Thapa, S., Sinclair, H. D., Creed, M., Mudd, S. M., Attal, M., Muthusamy, M., and Sharma, B.: Modelling the sensitivity of changes in sediment flux and grainsize distributions on flooding in the Kathmandu basin, Nepal, EGU General Assembly 2022, Vienna, Austria, 23–27 May 2022, EGU22-6865, https://doi.org/10.5194/egusphere-egu22-6865, 2022.
Please decide on your access
Please use the buttons below to download the presentation materials or to visit the external website where the presentation is linked. Regarding the external link, please note that Copernicus Meetings cannot accept any liability for the content and the website you will visit.
Forward to presentation link
You are going to open an external link to the presentation as indicated by the authors. Copernicus Meetings cannot accept any liability for the content and the website you will visit.
We are sorry, but presentations are only available for users who registered for the conference. Thank you.
EGU22-7344 | Presentations | GM2.1
Establishing time series of flux and grain size of suspended sand in rivers using an acoustic methodJessica Laible, Benoît Camenen, Jérôme Le Coz, Guillaume Dramais, Francois Lauters, and Gilles Pierrefeu
Measuring the concentration and grain size of suspended sand in rivers continuously remains a scientific challenge due to its pronounced spatio-temporal variability. Vertical and lateral gradients within a river cross-section require spatially-distributed water sampling at multiple verticals and depths. However, this classical approach is time-consuming and offers limited temporal resolution. Sampling is particularly difficult in presence of a bimodal suspension composed of fine sediment and a sand fraction, notably if the fine/sand ratio varies with time. The aim of this study is to establish time series of sand concentration and grain size by improving temporal resolution using an acoustic multi-frequency method based on acoustic attenuation and backscatter to measure the suspension indirectly. Experiences of Moore et al. (2012) and Topping & Wright (2016) with Horizontal Acoustic Doppler Current Profilers (HADCPs) show that dual-frequency inversion can separate the fine sediment fraction dominating acoustic attenuation from the sand fraction dominating acoustic backscatter. Concentration and grain size of suspended sediment, both the fine and sand fraction, can be quantified by signal inversion after correction for transmission losses.
Applying existing dual-frequency, semi-empirical methods in a typical Piedmont river (River Isère, France) remains a challenge due to the high concentrations and a broad bimodal distribution. Two monostatic HADCPs of 400 and 1000 kHz were installed at a hydrometric station of the Isère at Grenoble Campus where discharge and turbidity have been recorded for more than 20 years. Using frequent isokinetic water samples obtained with US P-72 and US P-06 samplers close to the ensonified volume, a relation between acoustic signal and the sediment concentration and grain size can be determined. Simultaneously, total sand flux and grain size distribution are calculated performing solid gaugings using Delft bottle samples and ADCP measurements in the entire cross-section. The method using index concentration and grain size in the HADCP measurement area is then used to evaluate the total sand flux and average grain size time-series in the cross-section.
First results show good correlations between the fine sediment concentration and the sediment attenuation for both frequencies. Specific extreme events (e.g. debris flows, dam flushes or spring floods) show distinct signatures in acoustic attenuation, backscatter and ratio between the two frequencies. During a debris flow (concentration up to 5.3 g/l), attenuation reached 1.6 and 3 dB/m for 400 respectively 1000 kHz, but no peak in backscatter intensity, whereas a spring flood (up to 4 g/l with at least 50 % sand) caused major peaks in attenuation and backscatter. Pronounced hysteresis during the events and time-varying ratio between attenuation due to sediments measured by 400 and 1000 kHz indicate suggest that the grain size distribution may vary. Relating sand concentration from physical samples with beam-averaged backscatter may elucidate changes in grain size more precisely. Existing heterogeneities of concentration and grain size along the acoustic beam contradict the homogeneous distribution supposed by the method and require local analysis based on local concentration and grain size characteristics.
How to cite: Laible, J., Camenen, B., Le Coz, J., Dramais, G., Lauters, F., and Pierrefeu, G.: Establishing time series of flux and grain size of suspended sand in rivers using an acoustic method, EGU General Assembly 2022, Vienna, Austria, 23–27 May 2022, EGU22-7344, https://doi.org/10.5194/egusphere-egu22-7344, 2022.
Please decide on your access
Please use the buttons below to download the presentation materials or to visit the external website where the presentation is linked. Regarding the external link, please note that Copernicus Meetings cannot accept any liability for the content and the website you will visit.
Forward to presentation link
You are going to open an external link to the presentation as indicated by the authors. Copernicus Meetings cannot accept any liability for the content and the website you will visit.
We are sorry, but presentations are only available for users who registered for the conference. Thank you.
EGU22-7633 | Presentations | GM2.1
Isolating bed load transport from river induced seismic signalsBronwyn Matthews, Mark Naylor, Hugh Sinclair, Michael Dietze, Richard Williams, and Calum Cuthill
Bed load transport is a critical parameter in the study of landscape evolution and also provides valuable information for problems in the fields of ecology, river and landuse management, and civil engineering. Bed load transport is difficult to assess due to its stochastic nature and highly variable transport rates, and traditional measurement techniques have struggled to capture the spatial and temporal variability of bed load transport. In recent years, bed load monitoring based on seismological observations has emerged, which allows non-invasive and continuous indirect measurements. However, there still remains a significant challenge to independently characterise the seismic signature of bed load from other sources of noise, such as turbulence. Our study aims to explore seismic data recorded at the highly braided River Feshie in Scotland, which has undergone significant morphological change in its history and has been highly monitored over the last couple decades through Digital Elevation Models. Since the deployment of our seismometers in December 2020 we have captured three independent high flow events plus an isolated earthquake, which are being used to determine the environmental signals and the site specific signal characteristics. In some previous studies, an observed hysteretic relationship between seismic power and hydrological parameters has been interpreted as being characteristic of bed load transport. From the data we have gathered we have observed a hysteresis in the signals, and through Shields calculations it is suggested that bed load transport would be expected during these events. However, without independent constraints we do not feel we can be absolutely certain that this behaviour is a result of bed load transport. Our ongoing study therefore aims to combine multiple physical measurement techniques, such as hydroacoustic measurements, time-lapse imagery and seismic observations, to try and pinpoint what is contributing to the seismic signals recorded and how we can isolate the bed load transport component.
How to cite: Matthews, B., Naylor, M., Sinclair, H., Dietze, M., Williams, R., and Cuthill, C.: Isolating bed load transport from river induced seismic signals, EGU General Assembly 2022, Vienna, Austria, 23–27 May 2022, EGU22-7633, https://doi.org/10.5194/egusphere-egu22-7633, 2022.
Please decide on your access
Please use the buttons below to download the presentation materials or to visit the external website where the presentation is linked. Regarding the external link, please note that Copernicus Meetings cannot accept any liability for the content and the website you will visit.
Forward to presentation link
You are going to open an external link to the presentation as indicated by the authors. Copernicus Meetings cannot accept any liability for the content and the website you will visit.
We are sorry, but presentations are only available for users who registered for the conference. Thank you.
EGU22-7639 | Presentations | GM2.1
Video-Imagery Analysis of Aeolian Sand Transport over a BeachAndreas Baas
Sand transport by wind displays dynamic structure and organisation in the form of streamers (aka ‘sand snakes’) that appear, meander and intertwine, and then dissipate as they are advected downwind. These patterns of saltating grain populations are thought to be initiated and controlled by eddies in the turbulent boundary layer airflow that scrape over the bed surface raking up sand into entrainment. Streamer behaviour is thus fundamental to understanding sand transport dynamics, in particular its strong spatio-temporal variability, and is equally relevant to granular transport in other geophysical flows (fluvial, submarine).
This paper presents findings on sand transport rates and streamer dynamics observed in a field experiment on a beach, by analysing imagery from 30Hz video footage, combined with 50Hz sand transport data from laser particle counters (‘Wenglors’), all taking place over an area of ~10 m2 and over periods of several minutes.
Mapping of streamers and saltation cloud density is compared with fluctuations in sand transport rate measured at the Wenglors. Large-Scale Particle Image Velocimetry (LSPIV) is applied to determine advection vectors that can be matched against in-situ measurements of airflow and sand transport. Analysing video-imagery of aeolian sand transport faces several challenges, however, most notably the difficulties of background subtraction to differentiate the moving streamers from the underlying beach surface.
How to cite: Baas, A.: Video-Imagery Analysis of Aeolian Sand Transport over a Beach, EGU General Assembly 2022, Vienna, Austria, 23–27 May 2022, EGU22-7639, https://doi.org/10.5194/egusphere-egu22-7639, 2022.
EGU22-8480 | Presentations | GM2.1
What are the key elements that control the seismic signature of highly concentrated sediment flows?Marco Piantini, Florent Gimbert, Evangelos Korkolis, Romain Rousseau, Hervé Bellot, and Alain Recking
Flowing through the landscape, rivers generate high-frequency ground vibrations (> 1 Hz) by exerting force fluctuations on the bed. The well-established evidence that seismic sensors detect a wide variety of fluvial processes has motivated the use of seismology to indirectly measure sediment transport. In the last decade, numerous efforts have been dedicated to develop physically-based mechanistic models to investigate the link between the river-induced seismic signal and sediment transport properties such as the characteristic diameter of the transported sediments, bedload transport rate, debris flow thickness and velocity. However, most of the existing theories rely on simplistic descriptions of the transport dynamics that may not necessarily be sufficient to capture realistic behaviours. In particular, highly concentrated sediment flows are characterized by complex grain scale physical processes that could have a major impact on their seismic signature (Allstadt et al., 2020; Piantini et al., 2021).
Here, we carry out laboratory experiments to explore the seismic signature of highly concentrated sediment flows. Our scaled experimental setup allows the self-triggering and propagation of sediment pulses in a steep channel (slope of 18%), using a wide bimodal grain size distribution typical of mountain streams. We monitor physical parameters such as flow surface elevation, outlet solid discharge and the corresponding granulometric composition, together with seismically relevant quantities such as basal force fluctuations and flume vibrations using force and ultrasonic sensors, respectively. We observe transport conditions that range from the dilute transport of big grains (sediment pulse front) to dense sediment flows (sediment pulse body). Consistent with previous studies, the passage of the unsaturated front exerts the highest force fluctuations and seismic power. However, we also find that the body, despite having an amount of coarse particles similar to the front, becomes dramatically quieter when bulk density increases and the content of fine particles is maximum. We explain this latter behaviour by two main processes. First, flow stratification prevents a large part of the transported sediments from generating direct impacts to the fixed channel bed. Second, fines allow the formation of a conveyor belt that transport big particles with reduced collisions, as manifested by a considerable increase in their downstream velocity. These findings argue that internal stratification and the presence of a high content of fines may exert a major control on the seismic signature of highly concentrated sediment flows.
References
Allstadt, K. E., Farin, M., Iverson, R. M., Obryk, M. K., Kean, J. W., Tsai, V. C., Rapstine, T. D., and Logan, M.: Measuring Basal Force Fluctuations of Debris Flows Using Seismic Recordings and Empirical Green’s Functions, J. Geophys. Res.-Earth Surf., 125, 9, https://doi.org/10.1029/2020JF005590, 2020
Piantini, M., Gimbert, F., Bellot, H., and Recking, A.: Triggering and propagation of exogenous sediment pulses in mountain channels: insights from flume experiments with seismic monitoring, Earth Surf. Dynam., 9, 1423–1439, https://doi.org/10.5194/esurf-9-1423-2021, 2021
How to cite: Piantini, M., Gimbert, F., Korkolis, E., Rousseau, R., Bellot, H., and Recking, A.: What are the key elements that control the seismic signature of highly concentrated sediment flows?, EGU General Assembly 2022, Vienna, Austria, 23–27 May 2022, EGU22-8480, https://doi.org/10.5194/egusphere-egu22-8480, 2022.
EGU22-8642 | Presentations | GM2.1
Monitoring the stability of leaky dams and their influence on debris transport with innovative sensor technology on the SENSUM projectMartina Egedusevic, Georgina Bennett, Kyle Roskilly, Alessandro Sgarabotto, Irene Manzella, Alison Raby, Sarah J. Boulton, Miles Clark, Robin Curtis, Diego Panici, and Richard E Brazier
Woody debris dams/leaky dams are an increasingly popular Natural Flood Management (NFM) measure in low order tributaries, with preliminary evidence suggesting that they are effective in attenuating flood peaks and reducing flood risk. However, the stability of these dams is not widely monitored, and thus there is a poor evidence base for best design practice with respect to the long-term integrity of such features. This is particularly pertinent given the threat posed to downstream infrastructure by woody debris carried in floodwaters after potentially catastrophic dam failure. There is also a lack of research into how effective dams of different designs are at holding back large wood and sediment transported by the flow and reducing the impact of flood debris on downstream infrastructure, including bridges, culverts etc. In the SENSUM project (Smart SENSing of landscapes Undergoing hazardous hydrogeomorphic Movement, https://sensum.ac.uk), we are developing and applying innovative sensor technology to assess the stability of different woody debris dam designs and build an evidence base to inform policy on this NFM practice locally and nationally. We also use these sensors to track woody debris and assess how effective dams are at trapping and retaining large wood debris and cobble-sized sediment. This paper addresses these questions at several field sites across the UK and in laboratory experiments to report quantitative data which evaluate the literal success/failure of NFM interventions and how these may impact the future design of such approaches.
How to cite: Egedusevic, M., Bennett, G., Roskilly, K., Sgarabotto, A., Manzella, I., Raby, A., Boulton, S. J., Clark, M., Curtis, R., Panici, D., and Brazier, R. E.: Monitoring the stability of leaky dams and their influence on debris transport with innovative sensor technology on the SENSUM project, EGU General Assembly 2022, Vienna, Austria, 23–27 May 2022, EGU22-8642, https://doi.org/10.5194/egusphere-egu22-8642, 2022.
EGU22-8757 | Presentations | GM2.1
Smart-pebbles in sediment transport studies: state of the art, future directions, and unsolved problems.Charlie Gadd and Georgios Maniatis
The use of Inertial Measurement Units (IMUs) in geomorphological studies has exploded during the last decade. Scientists are deploying IMUs in a range of settings: from single grain flume experiments to full scale landslide motions and from capturing rock falls to measuring flows in glacial environments.
The vast majority of these experiments deploy sensing units that are partly customised for each application. However, there are limits to the level of IMU customisation geomorphologists can do as they rarely have access to bottom-up sensor assembly and production lines. Commercial IMUs and IMU components are built and calibrated for very different uses than the monitoring of dynamic sediment transport regimes, such as integration into electronic devices, wearables or Internet of Things applications.
Deploying commercial IMUs outside their nominal operational range has two main implications, the first being methodological. As the sensor is partly a "black box", we are obliged to do extensive testing in a trial-and-error manner and think deeply about the underlying physics of IMUs. If such difficulties are not acknowledged the results become difficult to interpret in the context of sediment movement.
The second implication concerns standardisation. The more our community uses commercial sensors and analytical tools, the more apparent becomes the need for open-source pre-processing and processing workflows that are fully validated and universally available to ensure comparability of published results.
This presentation aspires to contribute to this open debate about IMU sensors in geomorphology. The focus will be on the sensing requirements for grain motion detection, force capture and tracking by IMUs in the context of sediment transport. The presented calculations will use results published before the emergence of IMUs in geomorphology for a range of environments (fluvial, coastal, aeolian and glacial).
The above requirements capture will be accompanied by a meta-analysis of published IMU data in geomorphic applications which will be classified according to the exact type of sensor (accelerometer, full IMU, GPS (or equivalent)-aided IMU) and the sensors' specs (mainly sensing range and frequency).
Finally, this presentation will explore the case study of using a commercially available IMU for the capture of fluvial sediment interactions. The deployed IMU will be subjected to a series of simple physical experiments (e.g., drop tests) and then deployed to a flume setting designed to model grain-grain and grain-substrate collisions. The novelty here is the use of an independent very high-speed camera (1μs exposure frame rate) to monitor the sensor during calibration, which allows for the coherent propagation of uncertainty for all the experiments. All the results are presented within a processing workflow based on free, open-source R libraries.
How to cite: Gadd, C. and Maniatis, G.: Smart-pebbles in sediment transport studies: state of the art, future directions, and unsolved problems., EGU General Assembly 2022, Vienna, Austria, 23–27 May 2022, EGU22-8757, https://doi.org/10.5194/egusphere-egu22-8757, 2022.
EGU22-9016 | Presentations | GM2.1 | Highlight
Rocks and Rivers that Remember: Using Smartrocks To Constrain Bedload Transport Statistics and Evolving Thresholds of Motion in Natural Mountain RiversJoel Johnson, Kealie Pretzlav, Lindsay Olinde, D. Nathan Bradley, and Claire Masteller
Instrumented “smartrock” tracer clasts hold the potential to quantify unique and useful sediment transport statistics from the point of view of each grain--a Lagrangian reference frame. In this presentation we synthesize lessons learned based on two successful smartrock field deployments in natural mountain rivers during snowmelt floods. Our sensors contain accelerometers, data loggers and batteries. We have primarily used smartrock data to simply measure the exact timing of grain rests and motions, although future analyses and additional sensors could be used to measure many more aspects of transport. In addition to methodological suggestions and challenges, we show how smartrock data can be used to measure (a) rest and hop time scaling over a range of timescales, and (b) changes in thresholds of motion through time as a function of discharge. In data from Halfmoon Creek, Colorado, USA, and Reynolds Creek, Idaho, USA, rest duration scaling is heavy-tailed and varies systematically with both timescale and shear stress. The shear stress dependence suggests that bedload clast dispersal becomes less superdiffusive as flood size becomes larger. We identify several likely diffusion regimes, and hypothesize how timescales of flow variability from turbulence to daily discharge cyclicity may cause scaling breaks over minutes to hours. In addition, thresholds of motion tend to increase with cumulative flow (reducing transport rates over time), but also decrease with increases in discharge (increasing transport rates until grains restabilize at the higher flow). The threshold data are used to calibrate and partially validate a new model for discharge-dependent threshold evolution. Finally, we brainstorm ways in which smartrocks could be used to explore sediment transport questions in other Earth surface environments.
How to cite: Johnson, J., Pretzlav, K., Olinde, L., Bradley, D. N., and Masteller, C.: Rocks and Rivers that Remember: Using Smartrocks To Constrain Bedload Transport Statistics and Evolving Thresholds of Motion in Natural Mountain Rivers, EGU General Assembly 2022, Vienna, Austria, 23–27 May 2022, EGU22-9016, https://doi.org/10.5194/egusphere-egu22-9016, 2022.
Please decide on your access
Please use the buttons below to download the presentation materials or to visit the external website where the presentation is linked. Regarding the external link, please note that Copernicus Meetings cannot accept any liability for the content and the website you will visit.
Forward to presentation link
You are going to open an external link to the presentation as indicated by the authors. Copernicus Meetings cannot accept any liability for the content and the website you will visit.
We are sorry, but presentations are only available for users who registered for the conference. Thank you.
EGU22-9500 | Presentations | GM2.1
Moving the frontier of comparative erosion measurements under different agricultural schemes – Development of a long-term, high-resolution, 4D erosion measurement site of the Bavarian Agricultural Institute in Lower Bavaria (Germany)Florian Ebertseder, Johannes Mitterer, and Markus Disse
Today, erosion is increasing in many intensively used agricultural regions with fertile soils. At the same time, scientists expect that the intensity of heavy precipitation events, their erosivity, drought intensity and persistance will increase significantly through climate change. In combination with more strict regulations to protect the natural environment from nutrients and hazardous substances (such as herbicides and micro-plastics), it is challenging to balance the interests of food (and energy) production and environmental protection.
Therefore, we design and establish a worldwide unique measurement plot at the Bavarian Agricultural Institute (LfL) to assess different combinations of four- and six-year crop rotation schemes and machining methods concerning their long-term soil fertility, stability and resilience against climate change effects and environmental impacts, focusing on compound effects. The plot to measure and compare soil-water retention, nutrient fluxes, surface runoff, and erosion masses has an area of four acres and 14 parallel crop strips. Crop cultivation, experiments and measurements with and without artificial rain will be performed for more than ten years after a three-year set-up phase, will have a 4D (3D spatial plus temporal) high-resolution design and combine established and innovative measurement and management techniques, such as artificial intelligence, neural networks, deep learning, and robotics. Finally, up-to-date process-based hydrological modelling will incorporate the measurement data to increase our process understanding and enable upscaling to catchment scales.
This contribution to EGU 2022 will inform and include the scientific community during the set-up phase about the running and planned activities to build an international scientific network, discuss our approaches, efficiently use the existing scientific knowledge, and initiate future collaborations around the measurement financed by the German federal state of Bavaria.
How to cite: Ebertseder, F., Mitterer, J., and Disse, M.: Moving the frontier of comparative erosion measurements under different agricultural schemes – Development of a long-term, high-resolution, 4D erosion measurement site of the Bavarian Agricultural Institute in Lower Bavaria (Germany), EGU General Assembly 2022, Vienna, Austria, 23–27 May 2022, EGU22-9500, https://doi.org/10.5194/egusphere-egu22-9500, 2022.
Please decide on your access
Please use the buttons below to download the presentation materials or to visit the external website where the presentation is linked. Regarding the external link, please note that Copernicus Meetings cannot accept any liability for the content and the website you will visit.
Forward to presentation link
You are going to open an external link to the presentation as indicated by the authors. Copernicus Meetings cannot accept any liability for the content and the website you will visit.
We are sorry, but presentations are only available for users who registered for the conference. Thank you.

EGU22-9698 | Presentations | GM2.1
Tracing sediment movement using Infra-Red Stimulated LuminescenceTessa M. C. Spano, Edward J. Rhodes, and Rebecca A. Hodge
Understanding sediment transport dynamics is key to understanding landscape evolution, and has important implications for engineering projects, aquatic ecosystem dynamics, and transmission of water-borne diseases. Multiple elevated temperature infra-red stimulated luminescence (MET-IRSL) has great potential to provide detailed information on the transport of sediments using infra-red light to stimulate the luminescence signal of feldspars. MET-IRSL uses a series of elevated temperature stimulations to access multiple signals with different characteristic rates of signal reduction by light exposure (bleaching), for example, during grain transport. During deposition and storage, trapped charge accumulates, leading to growth of the different IRSL signals, until the grain is again subject to transport. Applied in this manner, MET-IRSL measurements can constrain past sediment burial and exposure histories.
MET-IRSL measurements of different grain and clast sizes (e.g. silt, sand, pebbles and cobbles) can provide a range of sediment transport information, providing further constraint to sediment dynamics and system behaviour. Different clast size groups are associated with varied ways to structure the MET-IRSL measurements, e.g. depth bleaching profiles observed within pebbles and cobbles. In this presentation we demonstrate the potential of combining these approaches, and of constructing time-space equivalence models for real world situations, including the site of Allt Dubhaig, Perthshire, Scotland.
How to cite: Spano, T. M. C., Rhodes, E. J., and Hodge, R. A.: Tracing sediment movement using Infra-Red Stimulated Luminescence, EGU General Assembly 2022, Vienna, Austria, 23–27 May 2022, EGU22-9698, https://doi.org/10.5194/egusphere-egu22-9698, 2022.
EGU22-10198 | Presentations | GM2.1
Investigating boulder motions with smart sensors in lab experimentsAlessandro Sgarabotto, Irene Manzella, Kyle Roskilly, Chunbo Luo, Miles Clark, Aldina M. A. Franco, Georgina L. Bennett, and Alison Raby
Events such as landslides, rockslides, debris flows, and flash floods can have destructive and possibly fatal outcomes. In these events, boulders and cobbles are carried downstream under the action of gravity and the study of their transport and movement can give important insight on the dynamics and hazards related to these processes. Recently, boulder motion has been investigated by the use of smart sensors in geomorphology applications both in lab and field experiments. Smart sensors are small and light-weighted devices that are able to collect different environmental data with low battery consumption communicating to a server through a wireless connection. However, the reliability of smart sensors still needs to be evaluated for monitoring purposes and for developing early warning systems.
In the present study, dedicated laboratory experiments were designed to assess the ability of the sensors to detect movements and distinguish between intensity and type of movement (e.g. sliding or rolling) within a well-constrained setting. For this purpose, a tag equipped with an accelerometer, a gyroscope, and a magnetometer sensor has been installed inside a cobble of 10.0 cm diameter within a borehole of 4.0 cm diameter, closed hermetically before each experiment. The experiments consisted in letting the cobble fall on an experimental table composed of an inclined plane of 1.5 m, followed by a horizontal one of 2.0 m. The inclined plane can be tilted at different angles (18˚- 55˚) and different types of movement have been generated by letting the cobble roll, bounce, or slide. Sliding was generated by embedding the cobble within a layer of sand. The position of the cobble travelling down the slope was derived from camera videos by a tracking algorithm developed within the study.
Raw sensor data allowed detection of movement and separation of two modes of movement, namely rolling and sliding. Furthermore, raw datasets approximated the magnitude of movement even without any calibration. On the other hand, by coupling smart-sensor measurements and camera-based positions, it was possible to develop a filter to derive reliable values for the position, orientation, velocity, and acceleration to fully represent cobble motions. These findings show how the raw data can provide information about the type and an indication of the magnitude of movement, and confirm the potential to use these sensors to improve early warning systems, although further studies are in progress to assess response time in a field setting. At the same time, the development of a filter that gives more precise and reliable data from the sensors enables assessment of the rotational and linear acceleration of the tracked element. If used in more sophisticated lab and field experiments, this has the potential to give new insights on the behaviour of cobbles within different types of processes and can shed new light on the dynamics of complex hazardous flows.
How to cite: Sgarabotto, A., Manzella, I., Roskilly, K., Luo, C., Clark, M., Franco, A. M. A., Bennett, G. L., and Raby, A.: Investigating boulder motions with smart sensors in lab experiments, EGU General Assembly 2022, Vienna, Austria, 23–27 May 2022, EGU22-10198, https://doi.org/10.5194/egusphere-egu22-10198, 2022.
EGU22-10289 | Presentations | GM2.1 | Highlight
SENSUM project, Smart SENSing of landscapes Undergoing hazardous hydrogeomorphic MovementKyle Roskilly, Georgina Bennett, Robin Curtis, Martina Egedusevic, Joshua Jones, Michael Whitworth, Benedetta Dini, Chunbo Luo, Irene Manzella, and Aldina Franco
An increase in storminess under climate change and population pressure are resulting in an increase in landslide and flood events, in the UK and globally, and threatening the defences put in place to mitigate these hazards. Monitoring of unstable hillslopes and flood-prone rivers as well as structures designed to protect these is vital. Furthermore, as landslides and floods are both triggered by heavy rainfall, often occurring simultaneously, and may interact to generate cascading hazards, we need integrated approaches for their management.
A key objective of the SENSUM project (Smart SENSing of landscapes Undergoing hazardous hydrogeomorphic Movement, https://sensum.ac.uk) is to develop a smart sensor to be embedded within boulder and wood debris in landslide and flood prone sites to detect and track hazardous movement. These low-power, low-cost devices communicate this in near real time via Internet of Things networks. Several wireless sensor networks (WSNs) have been installed on landslides and in flood-prone rivers around the UK, involving insertion of devices into debris, installation of long-range wireless network gateways, and camera installation for validation of movements. The developed system architecture also permits straightforward integration of additional third-party sensors and open data. We aim to build a dataset with which hazardous movement can be detected using machine learning and communicated in near real time via alerts and web services to relevant stakeholders. This effort will be complemented by laboratory experiments.
How to cite: Roskilly, K., Bennett, G., Curtis, R., Egedusevic, M., Jones, J., Whitworth, M., Dini, B., Luo, C., Manzella, I., and Franco, A.: SENSUM project, Smart SENSing of landscapes Undergoing hazardous hydrogeomorphic Movement, EGU General Assembly 2022, Vienna, Austria, 23–27 May 2022, EGU22-10289, https://doi.org/10.5194/egusphere-egu22-10289, 2022.
Please decide on your access
Please use the buttons below to download the presentation materials or to visit the external website where the presentation is linked. Regarding the external link, please note that Copernicus Meetings cannot accept any liability for the content and the website you will visit.
Forward to presentation link
You are going to open an external link to the presentation as indicated by the authors. Copernicus Meetings cannot accept any liability for the content and the website you will visit.
We are sorry, but presentations are only available for users who registered for the conference. Thank you.

EGU22-10761 | Presentations | GM2.1
Disco Gravel: Image-based bedload tracking in shallow water flume experimentsFatemeh Asal Montakhab, Megan Iun, and Bruce MacVicar
Previous experiments on the restoration of sediment cover in semi-alluvial channels with irregular boundaries have shown that coarse size fractions of the bedload are dispersed faster over a bare bed than the finer fractions, and that the coarse fraction helps to build a set of skeleton bars that are later covered by finer sediment. Unsteady flow experiments in the same channel confirmed these trends over a bed of mobile sediment and further indicate strong spatial gradients in bedload transport and deposition. Despite these advances, a methodological gap remains in the tracking of bedload sediment during the experiments. In this study we advance a tracking technique for obtaining vectors of particle displacements during unsteady flow experiments. Methods involve painting the coarsest three sediment fractions with different colours of fluorescent paint and illuminating a region of interest within the flume with ultraviolet lights (wavelength 400-410 nm) during the experiment, which results in the painted gravel appearing in bright neon colors while the water remains transparent and dark (i.e. the ‘Disco’). We use a Panasonic BGH1 camera recording at 60 fps and a resolution of 1080 x 1920 pixels to film a region of interest in the channel roughly 0.25 m wide 1.0 m long. With this technique we are able to identify the displacements of the two coarsest size fractions. For the third size fraction the tracers were too numerous and too small to be tracked with confidence. Analysis of the videos occurred in three steps: 1) color segmentation to isolate the size class of interest, 2) application of TracTrac algorithm (Heyman, 2019) to identify particle paths, and 3) post-processing to reduce two types of error. The errors are likely related to the irregular water surface, which can result in particles appearing to ‘vibrate’ in place when they are not moving, and also result in a continuous tracer path being broken into a series of shorter discontinuous paths. Overall the technique appears to be useful for characterizing spatial variability at the threshold of motion and delimiting preferential transport pathways. Future improvements in resolution and tracer concentration should help to reduce the minimum size of tracer that can be tracked with confidence.
How to cite: Montakhab, F. A., Iun, M., and MacVicar, B.: Disco Gravel: Image-based bedload tracking in shallow water flume experiments, EGU General Assembly 2022, Vienna, Austria, 23–27 May 2022, EGU22-10761, https://doi.org/10.5194/egusphere-egu22-10761, 2022.
EGU22-11367 | Presentations | GM2.1
Monitoring Gravel Volume Change by Very High Resolution Satellite Image StereopairsLi-Shan Lin and Kuo-Hsin Tseng
Taiwan is located on the convergent boundary of the Philippine Sea Plate and the Eurasian Plate. Due to the active orogenic movement, the rock formations are fragmented and the weak joints are developed. In recent years, heavy rainfall accompanied with the occurrence of river surges carry a large amount of broken sand and gravel to the downstream. The accumulation of a large amount of sand and gravel in the river may threaten the safety along the river bank, such as channel diversion and flooding. Therefore, the river channel needs to be dredged regularly to reduce the risk to the residents and properties. Because the dredging area is scattered and difficult to reach, on-site measurement has become a time-consuming and labor-intensive method. With the improvement of satellite technology, it is feasible to use efficient remote sensing technology to generate point clouds and a surface elevation model (DSM) for monitoring purposes. However, several problems still exist in this technology, including the scatteredness of control points and feature points, instability of the platform, varying imaging conditions, and time differences in the matching process. To solve the DSM errors caused by these problems, this study uses 3-D point cloud registration method to align the horizontal and vertical directions and tries to reduce elevation system error due to the failure of co-registration. First, feature description, extraction, and feature matching are performed. Second, the iterative closest point algorithm (ICP) is used to closely match two sets of point clouds after coarse alignment. Finally, elevation difference between two dets of DSM is verified with ground measurement data and the accuracy of the point cloud registration is assessed. We use a dredging area in Laonong River, Taiwan, as an example to monitor gravel volume change in river channel by high resolution Pléiades images and UAV in different time periods. Our preliminary results show that the spaceborne technology could achieve submeter level accuracy in monitoring height changes in each transect.
How to cite: Lin, L.-S. and Tseng, K.-H.: Monitoring Gravel Volume Change by Very High Resolution Satellite Image Stereopairs, EGU General Assembly 2022, Vienna, Austria, 23–27 May 2022, EGU22-11367, https://doi.org/10.5194/egusphere-egu22-11367, 2022.
GI6 – Multidisciplinary sessions on geoscience instrumentation, data networks, and analysis
EGU22-629 | Presentations | GI6.1
Utilizing Hyperspectral Remote Sensing to Detect Concentration of Cyanobacteria in Freshwater EcosystemsJalissa Pirro, Christopher Thomas, Cameron Wallace, Zoe Alpert, Madison Tuohy, Timothy de Smet, Kiyoko Yokota, Patrick Jackson, Lisa Cleckner, Courtney Wigdahl-Perry, Kelly Young, Kely Amejecor, and Austin Scheer
Harmful algal blooms (HABs) are a threat to freshwater quality, public health, and aquatic ecosystems. The economic losses suffered by the agricultural, fishing, and tourism industries as a result of HABs exceed billions of dollars worldwide annually, with cleanup costs from local and national governments reaching a similar price. Current manual field-based sampling methods followed by laboratory analysis to detect and monitor HABs in expensive, labor-intensive, and slow, delaying critical management decisions. Moreover, current detection methods have limited success documenting HABs in freshwater bodies and such attempts employ satellite-based multispectral remote sensing; however, satellite-based methods are limited by cost, low spatial and spectral resolution, and restricting temporal windows for on-demand revisits. Our study used relatively low-cost unpiloted aerial systems (UAS) and hyperspectral sensors to detect HABs with higher resolution while having the capacity to conduct near real-time detection. Additionally, our hyperspectral remote sensing can detect and differentiate between HABs that produce cyanobacteria and other chlorophyll-producing plants. We detected a spectral peak of 710 nm that is characteristic of cyanobacteria producing HABs. Principal components analysis (PCA) was useful to spatially highlight HABs over wide areas. By utilizing hyperspectral remote sensing with UAS, HABs can be monitored and detected more efficiently. This new state-of-the-art research methodology will allow for targeted assessment, monitoring, and design of HABs management plans that can be adapted for other impacted inland freshwater bodies.
How to cite: Pirro, J., Thomas, C., Wallace, C., Alpert, Z., Tuohy, M., de Smet, T., Yokota, K., Jackson, P., Cleckner, L., Wigdahl-Perry, C., Young, K., Amejecor, K., and Scheer, A.: Utilizing Hyperspectral Remote Sensing to Detect Concentration of Cyanobacteria in Freshwater Ecosystems, EGU General Assembly 2022, Vienna, Austria, 23–27 May 2022, EGU22-629, https://doi.org/10.5194/egusphere-egu22-629, 2022.
Please decide on your access
Please use the buttons below to download the presentation materials or to visit the external website where the presentation is linked. Regarding the external link, please note that Copernicus Meetings cannot accept any liability for the content and the website you will visit.
Forward to presentation link
You are going to open an external link to the presentation as indicated by the authors. Copernicus Meetings cannot accept any liability for the content and the website you will visit.
We are sorry, but presentations are only available for users who registered for the conference. Thank you.
EGU22-1107 | Presentations | GI6.1
New index for assessment of environment in post-mining area – Mining and Geology Impact Factor (MaGIF)Anna Buczyńska and Jan Blachowski
The lignite mine called 'Friendship of Nations - Babina Shaft', located on the border between Poland and Germany, was closed almost 50 years ago. Despite the cessation of mining works (carried out by opencast and underground methods) and carrying out reclamation process, the negative effects of the former mineral exploitation are still observed in this region (e.g. sinkholes, local flooding, subsidence). It should be emphasized that the area of the currently closed mine is also characterized by a complicated glaciotectonic structure, which is the result of successive glacial periods in the past. Both factors, i.e., the past mining activity and geological conditions, may affect the condition of soils and vegetation of the analysed area. The aim of this study was to determine, whether and to what extent the former lignite mining and the complicated glaciotectonic structure had an impact on the changes in the state of plant cover and soils, noted in the period of 1989-2019. A new index, Mining and Geology Impact Factor (MaGIF), was developed to describe the strength and the nature of the relationship between the aforementioned factors within four test fields, based on coefficients’ values and variables of six Ordinary Least Squares (OLS) models. In the research 12 independent variables, representing geological and mining conditions of the area, were prepared. The dependent variables, statistics of selected spectral indices obtained for 1989-2019, were determined in the GIS environment, within individual pixels of the research area. In this study, two vegetation indices (NDVI and NDII) and four soil indices (DSI, SMI, Ferrous Minerals and SI3), calculated on the basis of Landsat TM/ETM +/OLI images, were used. The values of the obtained MaGIF index were in the range of -9.99 - 0.62, and their distribution in the test fields proved that the former mining and geological conditions had the strongest impact on the vegetation and soils of the central part of field no. 1, as well as on north-western and south-eastern parts of field no. 4. The nature of the influence of explanatory factors on the indicated components of the environment was negative (an increase or decrease in the value of the independent variable correlated with a decrease or increase in the value of a given spectral index, respectively). In the western and southern parts of field no. 1, eastern part of field no. 3, central and eastern parts of field no. 4, as well as in a major part of field no. 2, the influence of explanatory factors was the smallest. Only in fields no. 2 and 4, the small zones of positive impact of the independent variables were observed. The results indicate that the former mining and geological conditions have a significant influence on the condition of the vegetation and soils of post-mining areas. Therefore, it is extremely important to monitor the changes taking place in these regions in order to undertake appropriate preventive works and eliminate the resulting damage.
How to cite: Buczyńska, A. and Blachowski, J.: New index for assessment of environment in post-mining area – Mining and Geology Impact Factor (MaGIF), EGU General Assembly 2022, Vienna, Austria, 23–27 May 2022, EGU22-1107, https://doi.org/10.5194/egusphere-egu22-1107, 2022.
EGU22-1185 | Presentations | GI6.1
Application of UAS laser scanning for precision crop monitoring in HungaryLászló Bertalan, Péter Riczu, Róbert Bors, Szilárd Szabó, and Anette Eltner
Airborne Laser Scanning (ALS) is a widely used method in Earth science, Agriculture or Forestry. This method could provide high resolution and accurate spatial data for the better understanding of surface structures, moreover, based on the laser pulses, it can even show important features of the ground below dense vegetation. However, these ALS surveys requires specially designed aircrafts, pilots and operators, detailed flight planning, which leads to an expensive way of data analysis. The application of laser scanners for Unmanned Aerial Systems (UAS) has started in the last few years. These sensor payloads provide less weight and size and decreased accuracy compared to the traditional ALS surveys but still serve as more reliable mapping technology contrary to the photogrammetric methods in many cases. However, several new UAS laser scanners are being developed but their accuracy conditions and applicability for agricultural monitoring must be studied in many ways.
In our study we applied the novel Zenmuse L1 LiDAR sensor mounted on a DJI Matrice M300 RTK UAS. We surveyed a ~50 ha area of corn field near Berettyóújfalu, Hungary in the summer of 2021. Our aim was to reveal the applicability of UAS laser scanning for the precise ground surface reconstruction. In this period, the corn was under irrigated condition, therefore, extensive weed patches were observed between the paths. The laser scanner ground filtering data was compared to a photogrammetry-based aerial survey that we have carried out at the beginning of the vegetation cycle at the same parcel. Our results showed both the potentials and limitations of this sensor for precision agriculture. The laser beams produced significant amount of noise between the paths that had to be cleaned to extract the ground surface below the corn canopy. Based on our data processing methods we were able to delineate similar drainage networks within the parcel that was also processed from the initial aerial survey. However, the UAS LiDAR gained the most accurate surface reconstruction at the more clear grassland patches around the parcel.
L. Bertalan was supported by the INKP2022-13 grant of the Hungarian Academy of Sciences. This research was funded by the Thematic Excellence Programme (TKP2020-NKA-04) of the Ministry for Innovation and Technology in Hungary. This research was also influenced by the COST Action CA16219 “HARMONIOUS - Harmonization of UAS techniques for agricultural and natural ecosystems monitoring”.
How to cite: Bertalan, L., Riczu, P., Bors, R., Szabó, S., and Eltner, A.: Application of UAS laser scanning for precision crop monitoring in Hungary, EGU General Assembly 2022, Vienna, Austria, 23–27 May 2022, EGU22-1185, https://doi.org/10.5194/egusphere-egu22-1185, 2022.
EGU22-2545 | Presentations | GI6.1
Trends in vegetation changes over wetland areas in Denmark using remote sensing dataJoan Sebastian Gutierrez Diaz, Mogens Humlekrog Greve, and Lis Wollesen de Jonge
Land cover dynamics play a vital role in many scientific fields, such as natural resources management, environmental research, climate modeling, and soil biogeochemistry studies; thus, understanding the spatio-temporal land cover status is important to design and implement conservation measures. Remote sensing products provide relevant information regarding spatial and temporal changes on the earth’s surface, and recently, time series analyses based on satellite images, and spectral indices have become a new tool for accurate monitoring of the spatial trend, and land cover changes over large areas. This work aims to determine the trends of vegetation spectral response expressed as the Normalized Difference Vegetation Index (NDVI) over the period 2005 and 2018 and compare these trends with the land-use and cover changes between 2005 and 2018 in wetland areas across Denmark. Change detection methods between two years based on bi-temporal information may lead up to the detection of pseudo-changes, which hinders the land-use and cover monitoring process at different scales. We studied the potentiality of including NDVI temporal curves derived from a yearly time-series Landsat TM images (30-m spatial resolution) to obtain more accurate change detection results. We computed the NDVI temporal trends using pixel-wise Theil-Sen and Man-Kendall tests, then we explored the relationship between NDVI trends and the different land-use and cover change classes. We found a significant relationship between NDVI trends and changes in land use and cover. Changes from cropland to wetland and cropland to forest coincided with statistically significant (p≤0.05) negative NDVI, and positive NDVI trends, respectively. Changes from grasslands to permanent wetlands corresponded with statistically significant negative NDVI trends. The difference in vegetation productivity trends could be indicative of the combined effect of human activity and climate. We show that this combined analysis provides a more complete picture of the land use and cover changes in wetland areas over Denmark. This analysis could be improved if the NDVI time series is seasonally aggregated.
How to cite: Gutierrez Diaz, J. S., Humlekrog Greve, M., and Wollesen de Jonge, L.: Trends in vegetation changes over wetland areas in Denmark using remote sensing data, EGU General Assembly 2022, Vienna, Austria, 23–27 May 2022, EGU22-2545, https://doi.org/10.5194/egusphere-egu22-2545, 2022.
EGU22-2711 | Presentations | GI6.1
Open data sets on spectral properties of boreal forest componentsMiina Rautiainen, Aarne Hovi, Petri Forsström, Jussi Juola, Nea Kuusinen, and Daniel Schraik
Spectral libraries of different components forming forests – such as leaves, bark and forest floor – are needed in the development of remote sensing methods and land surface models, and for understanding the shortwave radiation regime and ecophysiological processes of forest canopies. This poster summarizes spectral libraries of boreal forest vegetation and lichens collected in several projects led by Aalto University. The spectral libraries comprise reflectance and transmittance spectra of leaves (or needles) of 25 tree species, reflectance spectra of tree bark, and reflectance spectra of different types of forest floor vegetation and lichens. The spectral libraries have been published as open data and are now readily available for the community to use.
How to cite: Rautiainen, M., Hovi, A., Forsström, P., Juola, J., Kuusinen, N., and Schraik, D.: Open data sets on spectral properties of boreal forest components, EGU General Assembly 2022, Vienna, Austria, 23–27 May 2022, EGU22-2711, https://doi.org/10.5194/egusphere-egu22-2711, 2022.
Please decide on your access
Please use the buttons below to download the presentation materials or to visit the external website where the presentation is linked. Regarding the external link, please note that Copernicus Meetings cannot accept any liability for the content and the website you will visit.
Forward to presentation link
You are going to open an external link to the presentation as indicated by the authors. Copernicus Meetings cannot accept any liability for the content and the website you will visit.
We are sorry, but presentations are only available for users who registered for the conference. Thank you.
EGU22-3130 | Presentations | GI6.1
A knowledge-based, validated classifier for the identification of aliphaticand aromatic plastics by WorldView-3 satellite dataShanyu Zhou
Although the C–H chains of petroleum derivatives display unique absorption features in the short-wave infrared (SWIR), it is a challenge to identify plastics on terrestrial surfaces. The diverse reflectance spectra caused by chemically varying polymer types and their different kinds of brightness and transparencies, which are, moreover, influenced further by the respective surface backgrounds. This paper investigates the capability of WorldView-3 (WV-3) satellite data, characterized by a high spatial resolution and equipped with eight distinct and relatively narrow SWIR bands suitable for global monitoring of different types of plastic materials. To meet the objective, hyperspectral measurements and simulations were conducted in the laboratory and by aircraft campaigns, based on the JPL-ECOSTRESS, USGS, and inhouse hyperspectral libraries, all of which are convolved to the spectral response functions of the WV-3 system. Experiments further supported the analyses wherein different plastic materials were placed on different backgrounds, and scaled percentages of plastics per pixel were modeled to determine the minimum detectable fractions. To determine the detectability of plastics with various chemical and physical properties and different fractions against diverse backgrounds, a knowledge-based classifier was developed, the routines of which are based on diagnostic spectral features in the SWIR range. The classifier shows outstanding results on various background scenarios for lab experimental imagery as well as for airborne data and it is further able to mask non-plastic materials. Three clusters of plastic materials can clearly be identified, based on spectra and imagery: The first cluster identifies aliphatic compounds, comprising polyethylene (PE), polyvinylchloride (PVC), ethylene vinyl acetate copolymer (EVAC), polypropylene (PP), polyoxymethylene (POM), polymethyl methacrylate (PMMA), and polyamide (PA). The second and third clusters are diagnostic for aromatic hydrocarbons, including polyethylene terephthalate (PET), polystyrene (PS), polycarbonate (PC), and styrene-acrylonitrile (SAN), respectively separated from polybutylene adipate terephthalate (PBAT), acrylonitrile butadiene styrene (ABS), and polyurethane (PU). The robustness of the classifier is examined on the basis of simulated spectra derived from our HySimCaR model, which has been developed inhouse. The model simulates radiation transfer by using virtual 3D scenarios and ray tracing, hence, enables the analysis of the influence of various factors, such as material brightness, transparency, and fractional coverage as well as different background materials. We validated our results by laboratory and simulated datasets and by tests using airborne data recorded at four distinct sites with different surface characteristics. The results of the classifier were further compared to results produced by another signature-based method, the spectral angle mapper (SAM) and a commonly used technique, the maximum likelihood estimation (MLE). Finally, we applied and successfully tested the classifier on WV-3 imagery of sites known for a high abundance of plastics in Almeria (Spain), Cairo (Egypt), and Accra, (Ghana, West Africa). Both airborne and WV-3 data were atmospherically corrected and transferred to “at-surface reflectances”. The results prove the combination of WV-3 data and the newly designed classifier to be an efficient and reliable approach to globally monitor and identify three clusters of plastic materials at various fractions on different backgrounds.
How to cite: Zhou, S.: A knowledge-based, validated classifier for the identification of aliphaticand aromatic plastics by WorldView-3 satellite data, EGU General Assembly 2022, Vienna, Austria, 23–27 May 2022, EGU22-3130, https://doi.org/10.5194/egusphere-egu22-3130, 2022.
EGU22-3532 | Presentations | GI6.1
The use of satellite data to support the volcanic monitoring during the last Vulcano island crisisMalvina Silvestri, Federico Rabuffi, Vito Romaniello, Massimo Musacchio, and Maria Fabrizia Buongiorno
The “La Fossa” summit crater of Vulcano island (Sicily, Italy) showed increasing volcanic activities, characterized by strong gases emissions and high soil temperatures, during July 2021 (https://cme.ingv.it/stato-di-attivita-dei-vulcani-eoliani/crisi-idrotermale-vulcano-2021). The National Civil Protection Department declared the “yellow alert” level and the Mayor of the island issued an order to prohibit citizens to stay in areas surrounding the harbor due to large amounts of gases emitted; an alternative accommodation was sought for about 250 persons. In this work, we report and analyze the surface temperature estimated by using satellite data (ASTER and Landsat-8) from 2000 to 2022. These analyses extend the study described in “Silvestri et al., 2018” which reports a time series of thermal anomalies from 2000 to 2018, with a focus on two specific sites of the Vulcano island: “La Fossa” and “Fangaia”. So, we updated the dataset up to 2022 and analyzed space-borne remotely sensed data of the surface temperature on the whole island. We applied the Pixel Purity Index technique to ASTER and Landsat-8 satellite data (GSD=90 m) in order to detect pixels that are most relevant from the thermal point of view; thus, we used these pixels as significant points for the time series analysis. Moreover, strong carbon dioxide emissions could be detected from satellite data acquired by the new Italian space mission PRISMA (GSD=30 m) carrying onboard a hyperspectral sensor operating in the range 0.4-2.5 µm; this possibility will be explored by analyzing data on active fumaroles in the island. The goal of the analysis is also to verify if volcanic activity variations (in terms of thermal anomalies and gases emissions), in the Vulcano island, can be detected by satellite data.
How to cite: Silvestri, M., Rabuffi, F., Romaniello, V., Musacchio, M., and Buongiorno, M. F.: The use of satellite data to support the volcanic monitoring during the last Vulcano island crisis, EGU General Assembly 2022, Vienna, Austria, 23–27 May 2022, EGU22-3532, https://doi.org/10.5194/egusphere-egu22-3532, 2022.
EGU22-3583 | Presentations | GI6.1
Monitoring gas dynamics in underwater volcanic environments using iXblue SeapiX multi split beam echosounder: an example from the Laacher See (Eifel, Germany)Guillaume Jouve, Corentin Caudron, Guillaume Matte, and Frédéric Mosca
Forecasting volcanic and limnic eruption for improving early warning systems is crucial to prevent severe impact on human lives. One of the main triggers of explosive eruptions is volcanic gases which, contrary to the atmosphere, are easily detected in water column, particularly using hydro-acoustic methods [1]. Two pioneering studies have monitored gas venting into Kelud Crater Lake (Indonesia) from a hydroacoustic station shortly before a Plinian eruption in 1990 [1] and, nearly two decades later, by empirically quantifying CO2 fluxes by acoustic measurements in the same lake just before a non-explosive eruption [2]. However, despite hydroacoustic detection capabilities, fundamental advances are limited by technology performances. Overall acoustic detection of a bubble field is easy, while its quantification remains complex due to the 3D structure of clouds, heterogeneous bubbles sizes and acoustic interactions between them. It is thus necessary to accurately map the different bubble clouds, to monitor their evolution through time to reduce the volcanic risk, which is major in aqueous environments. Here, we present preliminary results of water column gas distributions and quantification from an Eifel crater lake (Germany), using iXblue Seapix 3D multi splitbeam echosounder. SeapiX acoustic array is based on very special geometry, a dual/steerable multibeam echosounder with a Mills Cross configuration. It allows a 120° x120° coverage (quasi realtime coverage) with 1.6° resolution, made by 128 single elements. All beams in all steering direction process Split Beam TS measurement to provide true acccurate volumic TS from all single target in the volume. Backscatter profiles of elements in the water column allowed to distinguish fish and gas bubbles, which demonstrates a potential for the development of an automatic gas detection module using the Seapix software. Ongoing research on the Target Strengh (TS) of bubbles suggest they are of very small size (35 μm), much smaller than observed elsewhere using single beam echosounders, which might also explain why, in the same spot, we did not observe gas bubbles using camera mounted on ROV. Using the steerable capability of the system, a recent mission performed a 4D monitoring of gas bubbling of a single gas plume, in a static position placed on a USV and anchored, raising new perspectives to anticipate the tipping point of a critical enhancement of gas release and to mitigate the volcanic risk.
[1] Vandemeulebrouck et al (2000) J. Volcanol. Geotherm. Res 97, 1-4: 443-456
[2] Caudron et al (2012) JGR: Solid Earth 117, B5
How to cite: Jouve, G., Caudron, C., Matte, G., and Mosca, F.: Monitoring gas dynamics in underwater volcanic environments using iXblue SeapiX multi split beam echosounder: an example from the Laacher See (Eifel, Germany), EGU General Assembly 2022, Vienna, Austria, 23–27 May 2022, EGU22-3583, https://doi.org/10.5194/egusphere-egu22-3583, 2022.
EGU22-4460 | Presentations | GI6.1
Remotely sensed dune movement rates in desert margins of Central Asia over five decades using satellite imageryLukas Dörwald, Janek Walk, Frank Lehmkuhl, and Georg Stauch
Remote sensing is being used widely to detect, map, and monitor environmental changes and remains a rapidly developing field. The detection of dune movement rates is carried out in field since the 20th century and through remote sensing, once the technical requirements were met in the 1970th (Hugenholtz et al. 2011). A wide variety of imagery from the last four decades is freely available in the archives of Sentinel-2 and Landsat 5 to 8 satellite images with spatial resolutions ranging between 10 and 25 meters. Complementing these data sources, in this study, we additionally used CORONA KH-4B images from the 1960s and 1970s. Despite its age, the KH-4B satellite delivered a considerably high spatial resolution of up to 1.8 m, thus bridging a considerable time gap of high resolution imagery and enabling the detection and mapping of singular dunes and dune fields. These satellites were originally used to record military intelligence images before being declassified for scientific use in 1995. After georeferencing, these images were utilized to detect and quantify the rates and directions of sand dune movement as well as for the estimation of dune height through a simple trigonometric approach.
We focus on single dunes and their movement rates in the high-altitude intramontane Gonghe Basin in Central Asia. The location of the study area at the north-eastern edge of the Asian summer monsoon and the mid-latitude Westerlies makes it especially sensitive to climatic variability (Vimpere et al. 2020). The dominant south easterly dune migration directions are in good agreement with the prevailing wind patterns. Dune heights of ~8–28 meters and ~3-31 meters for the late 1960s and 2020s, respectively, were calculated. Also, movement rates of under one meter up to ~24 meters per year were assessed for the time range of the late 1960s and 2020s.References:
Hugenholtz, C., H., Levin, N., Barchyn, T.E., Baddock, M., C. (2012): Remote sensing and spatial analysis of Aeolian sand dunes: A review and outlook. Earth-Science Reviews 111, 319–334, https://doi.org/10.1016/j.earscirev.2011.11.006
Vimpere, L., Watkins, S., E., Castelltort, S. (2021): Continental interior parabolic dunes as a potential proxy for past climates. Global and Planetary Change, 206: 103622, https://doi.org/10.1016/j.gloplacha.2021.103622
How to cite: Dörwald, L., Walk, J., Lehmkuhl, F., and Stauch, G.: Remotely sensed dune movement rates in desert margins of Central Asia over five decades using satellite imagery, EGU General Assembly 2022, Vienna, Austria, 23–27 May 2022, EGU22-4460, https://doi.org/10.5194/egusphere-egu22-4460, 2022.
Please decide on your access
Please use the buttons below to download the presentation materials or to visit the external website where the presentation is linked. Regarding the external link, please note that Copernicus Meetings cannot accept any liability for the content and the website you will visit.
Forward to presentation link
You are going to open an external link to the presentation as indicated by the authors. Copernicus Meetings cannot accept any liability for the content and the website you will visit.
We are sorry, but presentations are only available for users who registered for the conference. Thank you.
EGU22-6153 | Presentations | GI6.1 | Highlight
An integrated approach for environmental multi-source remote sensingMaria Marsella, Angela Celauro, and Ilaria Moriero
Remote sensing measurements have benefited from a great technological improvement, which has allowed a higher degree of automation while increasing spatial and temporal resolution of the collected data. Multi- scale and multi-frequency optical and radar satellite sensors, often adopted in an integrated manner, are starting to provide efficient solutions for controlling and monitoring rapidly evolving urban and natural areas. On the other hand, close range remote-sensing techniques, such as operated by UAV platforms, and innovative ground-based instruments offer, respectively, the chance to downscale the observation performing site-specific analysis at an enhanced resolution and to collect in-situ dataset for calibration and data quality. By improving the quantity and quality of the collected data, a better understanding of the in-going processes is possible and the setting up of a numerical forecast model for future scenarios.
Therefore, implementation of integrated techniques for environmental monitoring turns out to be a strategic solution to analyze hazardous areas at different spatial and temporal resolution. Research devoted to the optimization of data processing tools by means of AI algorithms has evolved with the aim of improving the level of information and its reliability. In this context, a great impact is linked to the availability of open data and open-source processing tools distributed after the Copernicus Program.
A review of the available technologies for environmental monitoring is provided including examples on experimental cases in areas affected by natural hazards (volcanic eruptions, landslides, coastal erosion, flooding, etc.) and human activities that can produce incidental damages on the environment (urbanization, agriculture, infrastructures, landfills, dumpsites, pollutions, etc.). In addition, the same approach is useful for monitoring the degradation of the cultural heritage sites. Finally, the capability of collecting fat at a global level contributed to the analysis of environmental and economic impacts consequent the Covid-19 pandemic.
How to cite: Marsella, M., Celauro, A., and Moriero, I.: An integrated approach for environmental multi-source remote sensing, EGU General Assembly 2022, Vienna, Austria, 23–27 May 2022, EGU22-6153, https://doi.org/10.5194/egusphere-egu22-6153, 2022.
Please decide on your access
Please use the buttons below to download the presentation materials or to visit the external website where the presentation is linked. Regarding the external link, please note that Copernicus Meetings cannot accept any liability for the content and the website you will visit.
Forward to presentation link
You are going to open an external link to the presentation as indicated by the authors. Copernicus Meetings cannot accept any liability for the content and the website you will visit.
We are sorry, but presentations are only available for users who registered for the conference. Thank you.
EGU22-6983 | Presentations | GI6.1
Geochemical investigations of 100 superficial soils observed by Sentinel 2 and PRISMAGian Marco Salani, Michele Lissoni, Stefano Natali, and Gianluca Bianchini
Geochemical investigations of agricultural soils are fundamental to characterize pedosphere dynamics that sustain ecosystem services linked with agriculture. Parameters like soil moisture, soil organic matter (SOM), and soil organic carbon (SOC) are strong instruments to evaluate carbon sink potential.
Satellite Earth Observation is a significant source of free data that can be linked to soil characteristics and dynamics and employed to produce temporal series. Access to these data is nowadays facilitated by platforms such as ADAM (https://adamplatform.eu), which allow users to quickly search for, visualize and subset data products, greatly reducing the volume of data that end users must handle.
In this work we demonstrate the usefulness of such systems by carrying out a geochemical investigation of 100 superficial (0-15 cm) soil samples collected in the province of Ferrara (North-Eastern Italy) and using the ADAM platform to associate to each a time series of Sentinel 2 data. The samples were collected in October 2021 in fields that were ploughed or mono-cultivated at maize, soybean, rice, and winter vegetables. To obtain the average soil properties over a spatial scale larger than the satellite sensor resolution, we adopted a composite sampling strategy, merging 5 sub-samples collected at the vertexes and at the center of a 30x30 m2 area. Soil granulometry was recognized from clay to medium sand, with exception of peat deposits. Soil moisture, and SOM, contents were estimated by loss on ignition (LOI), respectively at 105°C (values from 0.3 to 7.4 wt%), and 550°C (values from 2.1 to 21.0 wt%). SOC contents (values from 0.7 to 9.3 wt%) were determined through DIN19539 analysis performed with an Elementar soliTOC Cube. Using the ADAM platform, we associated a temporal series from 2016 to 2021 of the Sentinel 2 NDVI data product to each sampling location, using a cloud coverage mask to eliminate values taken on cloudy days. Localized phenological cycles for each year are recognizable in the remotely-sensed data. Hence, our database describes for each parcel, geochemical parameters and vegetative temporal series.
In a separate study, we also attempted to train a neural network to predict geochemical properties from the soil spectrum measured by the hyperspectral satellite PRISMA. We used the geochemical properties of our 100 samples as training data, associated with the PRISMA spectra of the sampling locations measured on April 7 2020, when, according to our NDVI data, none was covered in vegetation.
How to cite: Salani, G. M., Lissoni, M., Natali, S., and Bianchini, G.: Geochemical investigations of 100 superficial soils observed by Sentinel 2 and PRISMA, EGU General Assembly 2022, Vienna, Austria, 23–27 May 2022, EGU22-6983, https://doi.org/10.5194/egusphere-egu22-6983, 2022.
EGU22-6995 | Presentations | GI6.1
AI-based hydromorphological assessment of river restoration using UAV-remote sensingFelix Dacheneder, Karen Schulz, and Andre Niemann
Many hydromorphological restoration measures have been applied on German water courses since 2000 the European water framework directive has been induced. The measures aim to improve the diversity of habitat alteration. Often a positive effect on aquatic biota can’t be detected, therefore implementation and the hydromorphological development of such measures can be questioned. But also the common monitoring and assessment methods for physical river habitat mapping can be questioned as they are limited in spatial scale and objectiveness of the mapper itself.
In the last decade, Unmaned Areal Vehicle (UAV) in combination with high-resolution sensors open new opportunities in a spatial and temporal scales. This research shows a case study of the river Lippe for the detection of hydromorphological habitat structures using Structure from Motion (SfM) and Deep learning based classification methods. In detail, this work discusses the difficulties of creating digital surface and orthomosaics from field survey data, but also shows results from a case study using a deep learning classification approach to identify physical river habitat structures.
How to cite: Dacheneder, F., Schulz, K., and Niemann, A.: AI-based hydromorphological assessment of river restoration using UAV-remote sensing, EGU General Assembly 2022, Vienna, Austria, 23–27 May 2022, EGU22-6995, https://doi.org/10.5194/egusphere-egu22-6995, 2022.
EGU22-8296 | Presentations | GI6.1
Satellite imagery band ratio for mapping the open pit mines: A preliminary studyAnita Punia, Rishikesh Bharti, and Pawan Kumar Joshi
Indices are designed to differentiate land use and land cover classes to avoid misinterpretation of landscape features. The resemblances of spectral reflectance of mines with urban built-up and barren land cause difficulties in identification of objects. Open pit mines of Rampura-Agucha for Zn and Pb were selected for this study. The freely available data of Advanced Spaceborne Thermal Emission and Reflection Radiometer (ASTER) was selected from the year of 2001 and 2003. It is observed that b1-b5/b1+b5 equation of ASTER imagery significantly differentiate Zn-Pb mine from urban settlement and other features. The reflected range (µm) for b1 and b5 is 0.52-0.60 (Visible and Near-Infrared) and 2.145-2.185 (Shortwave Infrared) respectively. The pixel values indicate higher reflectance of open pit suggesting feasibility of equation for differentiating it from barren and built-up area. The mine is rich in sphalerite followed by galena, pyrite and pyrrhotite in different proportions of abundance. Spectral reflectance depends on type of minerals hence need further studies to develop the index according to specific minerals and mines. In the mining regions, the role of temperature, moisture content, vegetation covers and high concentration of pollutants in variation of spectral reflectance are highly important. The developed index would be beneficial for tracing the extent of overburden dumps, tailings and mines at faster rate.
How to cite: Punia, A., Bharti, R., and Joshi, P. K.: Satellite imagery band ratio for mapping the open pit mines: A preliminary study, EGU General Assembly 2022, Vienna, Austria, 23–27 May 2022, EGU22-8296, https://doi.org/10.5194/egusphere-egu22-8296, 2022.
EGU22-8417 | Presentations | GI6.1
Impact of different corner reflectors installation on InSAR time-seriesRoland Horváth, Bálint Magyar, and Sándor Tóth
Identification of relatively stable ground control points is always difficult in satellite-based remote sensing microwave technology. In our case, we have analyzed the amplitude and phase of backscattered signal of artificial objects in the resolution cell. In 2020, we have temporarily installed a compact active transponder (CAT) to the top of the Satellite Geodetic Observatory (SGO). During this probation period we had tested the operation of this electronic corner reflector (ECR).
In November, 2021 we have deployed, adjusted and precisely aligned the CAT and also mounted a 90 cm inner leg of passive double-backflip triangular corner reflector pair (part of the Integrated Geodetic Reference Station) to serve as Persistent Scatterers. Hence, we have observed the behaviour of the complex microwave signal using interferometric synthetic aperture radar technique (InSAR), utilizing Sentinel-1 SAR high resolution images. We have concentrated to demonstrate the effect of the corner reflector (CR) installation: estimate the Signal-to-Clutter Ratio (SCR), calculate the Radar Cross Section (RCS), define the phase center in sub-pixel dimension over well-specified stack of time-series.
We are expecting and focusing to integrate the CRs as benchmarks, into our developing processing algorithm system to achieve more accurate results of surface displacement using ground control points. In addition, the function of this project is to contribute and ensure the extension of our passive corner reflector reference network (SENGA). In this paper, we present the interpretation of the recent outcomes.
How to cite: Horváth, R., Magyar, B., and Tóth, S.: Impact of different corner reflectors installation on InSAR time-series, EGU General Assembly 2022, Vienna, Austria, 23–27 May 2022, EGU22-8417, https://doi.org/10.5194/egusphere-egu22-8417, 2022.
EGU22-8825 | Presentations | GI6.1
The use of low-cost sensors for monitoring coastal climate hazards and developing early warning support against extreme events.Tasneem Ahmed, Leo Creedon, Iulia Anton, and Salem Gharbia
Coastal areas are socially, economically, and environmentally intensive zones. Their risk to various natural coastal hazards like coastal flooding, erosion, and storm surges has increased due to climate-induced changes in their forcing agents or hazard drivers (e.g. sea-level rise). The increased exposure (e.g. dense population living near the coast) and vulnerability (e.g. insufficient adaptation) to these hazards in the coastal areas have complicated the adaptation challenges.
Thus, monitoring coastal hazards is essential to inform suitable adaptation to increase the climate resilience of the coastal areas. In monitoring coastal climate hazards to develop coastal climate resilience, both the forcing agents and the coastal responses should be observed.
As coastal monitoring is often expensive and challenging, creating a database through a systematic analysis of low-cost sensing technologies, like UAV photogrammetry for monitoring the hazards and their drivers would be beneficial to the stakeholders. Real-time information from these low-cost sensors in complement to the existing institutional sensors will facilitate better adaptation policies including the development of early warning support for building coastal resilience. In addition, it would also provide a valuable dataset for validating coastal numerical models and providing insights into the relationship between these hazards and forcing agents. Additionally, such low-cost sensors would also create opportunities for engaging citizens in the data collection process, for efficient data collection, and increasing scientific literacy amongst the general public. For instance, in the Sensing Storm Surge Project (SSSP), citizen science was used to collect technical data to characterise estuarine storm surges, generating data useable in peer-reviewed Oceanography journals. Coastal areas show complex morphological changes in response to the forcing agents over a wide range of temporal and spatial scales. Thus, monitoring the hazards with a sufficient temporal and spatial resolution is imperative to distinguish the changes in these hazards/drivers due to climate change from natural variability. This will not only help address the response strategies to these hazards but also adjust these response strategies according to the changing vulnerability of a particular region.
The database of the low-lost sensors thus created is in no way exhaustive since those have been retrieved through a certain combination of keywords in databases like Sciencedirect, Web of Science, and Scopus, nonetheless it is useful as these are the latest low-cost sensors available to monitor the major coastal hazards in the vulnerable coastal regions.
How to cite: Ahmed, T., Creedon, L., Anton, I., and Gharbia, S.: The use of low-cost sensors for monitoring coastal climate hazards and developing early warning support against extreme events., EGU General Assembly 2022, Vienna, Austria, 23–27 May 2022, EGU22-8825, https://doi.org/10.5194/egusphere-egu22-8825, 2022.
EGU22-9328 | Presentations | GI6.1 | Highlight
Mapping NO2 pollution in Piedmont Region (Italy) using TROPOMI: preliminary resultsAdele Campus, Fiorella Acquaotta, and Diego Coppola
Recently, numerous agencies and administrations in their latest reports show how it’s impossible to overlook the negative impact of atmospheric air pollution on human health. In this regard, it’s essential to be able to understand the spatial and temporal distribution of the concentration of main pollutants, and its ways to change. Among the numerous strategies proposed to tackle this problem, from the ’70s the study of satellite data assumed a key role, extending the analyzes carried out only with ground tools.
In this work we analyzed the data acquired by TROPOMI (TROPOspheric Monitoring Instrument), a multispectral imaging spectrometer mounted onboard the ESA Copernicus Sentinel-5P satellite (orbiting since October 2017) and specifically focused on mapping atmospheric composition. In particular, we processed the TROPOMI NO2 products acquired over Piedmont Region (Italy) between 2018 and 2021. We obtain preliminary results by comparing the satellite-derived tropospheric NO2 columns data with ground-based NO2 concentration acquired by the ARPA-Piemonte network in different urban and geomorphological contexts. In particular, we compared the TROPOMI-derived time series with the acquisitions of ground stations located in urban and suburban areas (e.g. in the city of Turin), identified as “traffic stations”, and in rural areas (low population density and countryside areas) identified as “background stations”. The results allow us to investigate the correlation and coherence between the two datasets and discuss the added values and limits of satellite data in different environmental contexts, with the prospective of providing NO2 concentration maps of the Piedmont Region.
How to cite: Campus, A., Acquaotta, F., and Coppola, D.: Mapping NO2 pollution in Piedmont Region (Italy) using TROPOMI: preliminary results, EGU General Assembly 2022, Vienna, Austria, 23–27 May 2022, EGU22-9328, https://doi.org/10.5194/egusphere-egu22-9328, 2022.
EGU22-10455 | Presentations | GI6.1
Large and small-scale multi-sensors remote sensing for dumpsites characterization and monitoringAngela Celauro, Matteo Cagnizi, Annalisa Cappello, Emilio D'Amato, Peppe Junior Valentino D'Aranno, Gaetana Ganci, Luigi Lodato, Ilenia Marini, Maria Marsella, and Ilaria Moriero
Remote sensing techniques are an ever-growing reliable means for monitoring, detecting and analysing the spatial and temporal changes of solid waste and landfill sites. In this paper, different UAV and satellite sensors are used to detect, characterize and monitor dumpsites in Sicily (Italy). In particular, data acquired and processed are (i) high-density point clouds detected from LIDAR sensor; (ii) optical photograms with a resolution of 3 cm; (iii) thermal photograms with a resolution of 5 cm/pixel and (iv) multispectral photograms with 5 cm/pixel. High spatial resolution UAV multispectral and thermal remote sensing allowed for the extraction of indicators, such as the Normalized Difference Vegetation Index (NDVI) and the Land Surface Temperature (LST), useful to characterize the changes in the vegetation and the skin temperature increase due to organic waste decomposition, respectively. On the other hand, the processing of UAV optical images to extract high-resolution orthophotos and their integration with high-density point clouds obtained from LIDAR, were used to provide the identification of the effective perimeter of the landfill body and the extraction of waste volumes. These products were integrated and compared with those obtained from different kinds of medium-to-high spatial resolution satellite images, such as from Landsat, Aster, Sentinel-2 and Planetscope sensors. Results show that UAV data represents an excellent opportunity for detecting and characterizing dumpsites with an extremely high detail, and that the joint use with satellite data is recommended for having a comparison on different scales, allowing continuous monitoring. Additional SAR data methodologies will be investigated for evaluating the landfill body landslides over the years that could be integrated with high resolution satellite multispectral and hyperspectral images for monitoring dumpsites environmental impact.
How to cite: Celauro, A., Cagnizi, M., Cappello, A., D'Amato, E., D'Aranno, P. J. V., Ganci, G., Lodato, L., Marini, I., Marsella, M., and Moriero, I.: Large and small-scale multi-sensors remote sensing for dumpsites characterization and monitoring, EGU General Assembly 2022, Vienna, Austria, 23–27 May 2022, EGU22-10455, https://doi.org/10.5194/egusphere-egu22-10455, 2022.
EGU22-10490 | Presentations | GI6.1
Estimation of maize sowing dates from Sentinel 1&2 data, over South PiedmontMatteo Rolle, Mehrez Zribi, Stefania Tamea, and Pierluigi Claps
Information of crop sowing dates is important to enhance the accuracy of crop models and for the assessments of crop requirements during the growing seasons. The sowing calendars of densely harvested areas are often driven by heterogeneous factors like annual crop rotations, crop switches and the alternation of winter and summer products over the same fields. Remote sensing is widely used for agricultural applications, especially to maximize crop yields through precision farming tools. Indices combining optical and infrared bands are particularly suitable for the crop classification algorithms and the plant health monitoring. Synthetic Aperture Radar (SAR) is often used in agriculture to classify irrigated and rainfed fields, due to its high sensitivity to soil water content. Despite SAR data are also used to identify changes in the ground roughness, this information has been rarely combined with optical data to identify crop sowing dates at the field scale.
In this study, SAR data from Sentinel-1 and NDVI derived from multispectral (MSI) acquisitions of Sentinal-2 have been used to identify the sowing dates of maize over a densely harvested pilot area in South Piedmont (Italy). NDVI data have been used to identify maize fields together with the agricultural geodatabase provided by the Piedmont public authority. The moisture-induced noise of SAR data has been filtered to avoid the impact of precipitation on the radar signal during the bare soil phase. Combining the VH and VV bands acquired by Sentinel-1 it was possible to identify the moment when maize plants break through the soil in each field.
Results show a good alignment with the information of sowing periods acquired from local farmers, also in terms of multiple growing seasons due to the presence of different maize types. The distribution of sowing dates points out that most of the maize is sown during the second half of May, while the other fields are sown even a month later after the harvesting of winter crops. The method proposed in this study may lead to significant applications in the agriculture monitoring, providing useful information for crop-related management policies. The combined use of SAR and NDVI data has the potential to improve the crop models for the benefit of yields and food security.
How to cite: Rolle, M., Zribi, M., Tamea, S., and Claps, P.: Estimation of maize sowing dates from Sentinel 1&2 data, over South Piedmont, EGU General Assembly 2022, Vienna, Austria, 23–27 May 2022, EGU22-10490, https://doi.org/10.5194/egusphere-egu22-10490, 2022.
Please decide on your access
Please use the buttons below to download the presentation materials or to visit the external website where the presentation is linked. Regarding the external link, please note that Copernicus Meetings cannot accept any liability for the content and the website you will visit.
Forward to presentation link
You are going to open an external link to the presentation as indicated by the authors. Copernicus Meetings cannot accept any liability for the content and the website you will visit.
We are sorry, but presentations are only available for users who registered for the conference. Thank you.

EGU22-10607 | Presentations | GI6.1
Use of Rapideye images from the planet platform to update vegetation cover studies in Tenosique, Tabasco, Mexico.Jacob Jesús Nieto Butrón, Nelly Lucero Ramírez Serrato, Mariana Patricia Jácome Paz, Tania Ximena Ruiz Santos, and Juan Manuel Núñez
Tenosique is a small town located on the border between Mexico and Guatemala, on the banks of the Usumacinta River. The area is considered a tropical climate with swampy and jungle areas. Previous studies had exposed the changes in vegetation cover related to the public policies applied at the site. Some examples of these policies are: the 1917 agrarian reform of land distribution to the peasants for cultivation, in 1938 concessions were made to national and foreign companies to exploit forest resources; in 1958 the agrarian reform for cultivation made the agricultural zone advance towards the jungle forest; in 1965 the food crisis promoted livestock; in 1976 it opted for the extraction of oil, and with the economic crisis in 1982 the financial support to the peasants and their ejidos is withdrawn, and finally in 2008 this area becomes a flora and fauna protection area. Past studies have been developed from a social and artistic point of view as well as quantifiable with the use of Landsat satellite images, covering large temporalities as well as a regional coverage scale, however, the results resolutions have made their interpretation difficult, reporting only the 20% plant loss over time. The objective of this project is to update the pre-existing study using high-resolution images, on a smaller surface. For this, 5-meter resolution Rapideye satellite images were downloaded from the Planet platform (Planet Application Program Interface: In Space for Life on Earth) with the help of an educational license obtained from an artistic quality project. The temporality of the images ranges from 2010 to 2020. The methodology includes corresponding atmospheric corrections, the supervised classification, and the coverage analysis obtained from the application of the Normalized Difference Vegetation Index (NDVI). Conclusions show the impact of the inputs resolution improvement in the study.
How to cite: Nieto Butrón, J. J., Ramírez Serrato, N. L., Jácome Paz, M. P., Ruiz Santos, T. X., and Manuel Núñez, J.: Use of Rapideye images from the planet platform to update vegetation cover studies in Tenosique, Tabasco, Mexico., EGU General Assembly 2022, Vienna, Austria, 23–27 May 2022, EGU22-10607, https://doi.org/10.5194/egusphere-egu22-10607, 2022.
Please decide on your access
Please use the buttons below to download the presentation materials or to visit the external website where the presentation is linked. Regarding the external link, please note that Copernicus Meetings cannot accept any liability for the content and the website you will visit.
Forward to presentation link
You are going to open an external link to the presentation as indicated by the authors. Copernicus Meetings cannot accept any liability for the content and the website you will visit.
We are sorry, but presentations are only available for users who registered for the conference. Thank you.
EGU22-11409 | Presentations | GI6.1
Deep Learning and Sentinel-2 data for artisanal mine detection in a semi-desert areaMaría Cuevas-González, Lorenzo Nava, Oriol Monserrat, Filippo Catani, and Sansar Raj Meena
In sub-Saharan Africa, artisanal and small-scale mining (ASM) represents a source of subsistence for a significant number of individuals. While 40 million people officially work in ASM across 80 countries, more than 150 million rely indirectly upon ASM. However, because ASM is often illegal, and uncontrolled, the materials employed in the excavation process are highly dangerous for the environment, as well as for the people involved in the mining activities. One of the most important aspects regarding ASM is their localization, which currently is missing in most of the African regions. ASM inventories are crucial for the planning of safety and environmental remediation interventions. Furthermore, the past location of ASM could be used to predict the spatial probability of the creation of newborn mines. To this end, we propose a Deep Learning (DL) based approach able to exploit Sentinel-2 open-source data and a non-complete small-size mine inventory to accomplish this task. The area chosen for this study lies in northern Burkina Faso, Africa. The area is chosen for its peculiar semi-desert environment which, in addition to being a per se challenging mapping environment, presents a wide spatial variability. Moreover, given the high level of danger involved in field mapping, it is fundamental to develop reliable remote sensing-based methods able to detect ASM. Performance comparison of two convolutional neural networks (CNNs) architectures is provided, along with an in-depth analysis of the predictions when dealing both with dry and rainy seasons. Models’ predictions are compared against an inventory obtained by manual mapping of Sentinel-2 tiles, with the help of multitemporal interpretation of Google Earth imagery. The findings show that this approach can detect ASM in semi-desertic areas starting with a few samples at a low cost in terms of both human and financial resources.
How to cite: Cuevas-González, M., Nava, L., Monserrat, O., Catani, F., and Meena, S. R.: Deep Learning and Sentinel-2 data for artisanal mine detection in a semi-desert area, EGU General Assembly 2022, Vienna, Austria, 23–27 May 2022, EGU22-11409, https://doi.org/10.5194/egusphere-egu22-11409, 2022.
Please decide on your access
Please use the buttons below to download the presentation materials or to visit the external website where the presentation is linked. Regarding the external link, please note that Copernicus Meetings cannot accept any liability for the content and the website you will visit.
Forward to presentation link
You are going to open an external link to the presentation as indicated by the authors. Copernicus Meetings cannot accept any liability for the content and the website you will visit.
We are sorry, but presentations are only available for users who registered for the conference. Thank you.
EGU22-11908 | Presentations | GI6.1
Questioning the adequacy of an invasive plant management technique through remote sensing observationsFrançois Toussaint, Alice Alonso, and Mathieu Javaux
Palo Verde National Park, located in the northwest of Costa Rica, contains a wetland plain of international ecological importance in Central America. It is home of a rich biodiversity and provides vital shelter for over 60 species of migratory and resident birds.
From the 1980’s onward, the wetland landscape has shifted from diverse vegetation and large open water areas to a near monotypic stand of cattail (Typha domingensis). This resulted into a sharp reduction in the number of birds in the area, as many bird species prefer other native plants and open water for feeding, nesting and for shelter. The Fangueo technique, which consists in crushing the plant under water using a tractor equipped with angle-iron paddle wheels has been adopted to reduce the spread of Typha.
This plant management technique typically results in a significant decrease in Typha population in the first year after its implementation, as well as an increase in plant diversity and open water area.
In this study, we used historical Landsat and Sentinel imagery to investigate the medium to long-term impact of Fangueo on vegetation and open water. We found that invasive vegetation regrowth happened faster than previous studies had indicated. The increase in open water areas was therefore short-lived. This result questions the adequacy of this technique for invasive plant management.
This work highlights how crucial simple remote sensing methods can be for assessing the adequacy of supposedly effective environmental management practices, and for informing stakeholders.
How to cite: Toussaint, F., Alonso, A., and Javaux, M.: Questioning the adequacy of an invasive plant management technique through remote sensing observations, EGU General Assembly 2022, Vienna, Austria, 23–27 May 2022, EGU22-11908, https://doi.org/10.5194/egusphere-egu22-11908, 2022.
EGU22-12697 | Presentations | GI6.1
Application of the autoregressive integrated moving average (ARIMA) model in prediction of mining ground surface displacementMarek Sompolski, Michał Tympalski, Anna Kopeć, and Wojciech Milczarek
Underground mining, regardless of the excavation method used, has an impact on the terrain surface. For this reason, continuous monitoring of the ground surface above the excavations is necessary. Deformations on the ground surface occur with a time delay in relation to the mining works, which poses a risk of significant deformations in built-up areas, leading to building disasters. In addition to monitoring, it is therefore necessary to forecast displacements, which at present is usually done using the empirical integral models, which describes the shape of a fully formed subsidence basin and require detailed knowledge of the geological situation and parameters of the deposit. However, insufficiently precise determination of coefficients may lead to significant errors in calculations. Machine learning can be an interesting alternative to predict ground displacement in mining areas. Machine learning algorithms fit a model to a set of input data so that it best represents all the correlations and trends detected in the set. However, the fitting process must be controlled to avoid overfitting. The validated model can then be used to detect new deformations on the ground surface, categorize the resulting displacements, or predict the value of subsidence. In this case ARIMA model (Auto-Regressive Integrated Moving Average) was used to predict deformation values for single points placed in the centers of the subsidence basins in the LGCB (Legnica-Głogów Copper Belt) area. The InSAR time series calculated using the SBAS method for the years 2016-2021 was used as input data. The results were compared with the persistence model, against which there was an improvement in accuracy of several percentage points.
How to cite: Sompolski, M., Tympalski, M., Kopeć, A., and Milczarek, W.: Application of the autoregressive integrated moving average (ARIMA) model in prediction of mining ground surface displacement, EGU General Assembly 2022, Vienna, Austria, 23–27 May 2022, EGU22-12697, https://doi.org/10.5194/egusphere-egu22-12697, 2022.
EGU22-12774 | Presentations | GI6.1
Using UAV-based Infrared Thermometry in the identification of gas seeps: a case study from Ciomadul dormant volcano (Eastern Carpathians, Romania)Boglarka Kis, Dan Mircea Tămaș, Alexandra Tămaș, and Roland Szalay
In our study, we tested a UAV-based IRT and Structure from Motion (SfM) for the identification of CO2 rich gas emission areas at Ciomadul dormant volcanic area, Eastern Carpathians. Our aim is to demonstrate the efficiency of the identification method providing example from a case-study in the Eastern Carpathians.
The gas emissions from Ciomadul come with high flux and are of magmatic origin, associated with the volcanic activity in the past. We had the following assumptions before performing the measurements with the drone: the temperature of the gas vents is constant, as well as their flux, variability is represented only by the changes in ambient temperature. We had previous knowledge on the temperature of the gas emissions (6 °C), so we chose periods when the ambient temperature is either lower or higher than the temperature of the gas. We performed several field observations with the camera both at daytime and in the evening.
The acquisition of UAV photography was made using a DJI Mavic 2 Enterprise Dual drone. This device is equipped with a 12 MP visual camera (RGB) with a 1/2.3" CMOS sensor. The visual camera has a lens with field of view of approx. 85°, 24 mm (35 mm format equivalent) lens with an aperture of f/2.8. It was also equipped with an Integrated Radiometric FLIR® Thermal Sensor. It is an Uncooled VOx Microbolometer with a horizontal field of view of 57° and f/1.1 aperture, sensor resolution is 160x120 (640x480 image size) and a spectral band of 8-14 μm.
The gas vents were clearly visible on the thermal images, and we discovered additional seeps that were not identified before. Later we confirmed the presence of the gas emissions with in situ measurements on the concentrations of CO2. The visibility of the gas emissions was influenced by parameters like temperature, the orientation of the gas vent, the influence of sunlight, the flux of the gas vent, etc.
How to cite: Kis, B., Tămaș, D. M., Tămaș, A., and Szalay, R.: Using UAV-based Infrared Thermometry in the identification of gas seeps: a case study from Ciomadul dormant volcano (Eastern Carpathians, Romania), EGU General Assembly 2022, Vienna, Austria, 23–27 May 2022, EGU22-12774, https://doi.org/10.5194/egusphere-egu22-12774, 2022.
EGU22-2960 | Presentations | GI6.2
A Database of Aircraft Carbon Monoxide (CO) Measurements with High Temporal and Spatial Resolution during 2011 – 2021Valéry Catoire, Chaoyang Xue, Gisèle Krysztofiak, Vanessa Brocchi, Stéphane Chevrier, Michel Chartier, Patrick Jacquet, and Claude Robert
To understand tropospheric air pollution at a regional/global scale, the SPIRIT airborne instrument (SPectromètre Infra-Rouge In situ Toute altitude) was developed in 2011 and used on aircraft to measure CO, an important indicator of air pollution, during the last decade. SPIRIT could provide high-quality CO measurements with 1σ precision of 0.3 ppbv at a time resolution of 1.6 s. It can be operated on different aircraft from DLR (Germany) and SAFIRE (CNRS-CNES-Météo France) such as Falcon-20 and ATR-42. With support from various projects, more than 200 flight hours measurements were conducted over three continents (Europe, Asia, Africa), including two inter-continental transect measurements (Europe-Asia and Europe-Africa). Levels of CO and its horizontal and vertical distribution are briefly discussed and compared between different regions/continents. A 3D trajectory mapped by CO level was plotted for each flight and presented in this study. The database containing all the raw data will be archived on the AERIS database (www.aeris-data.fr), the French national center for Earth observation dedicated to the atmosphere. The database can help to understand the horizontal and vertical distribution of CO over different regions and continents. Besides, it can help to validate model performance and satellite measurements. For instance, the database covers measurements at high-latitude regions (i.e., Kiruna, Sweden, 68˚N) where satellite measurements are still a challenge, and at low-latitude regions (West Africa and South-East Asia) where in situ data are scarce and satellites need more validation by airborne measurements.
How to cite: Catoire, V., Xue, C., Krysztofiak, G., Brocchi, V., Chevrier, S., Chartier, M., Jacquet, P., and Robert, C.: A Database of Aircraft Carbon Monoxide (CO) Measurements with High Temporal and Spatial Resolution during 2011 – 2021, EGU General Assembly 2022, Vienna, Austria, 23–27 May 2022, EGU22-2960, https://doi.org/10.5194/egusphere-egu22-2960, 2022.
EGU22-3803 | Presentations | GI6.2
TotalBrO: First results of a small solar occultation instrument for the stratospherePhilip Holzbeck, Karolin Voss, Ralph Kleinschek, Hans Nordmeyer, Klaus Pfeilsticker, and André Butz
Spectroscopic remote sensing in solar occultation geometry offers an important tool for determining atmospheric trace gas concentrations in the middle atmosphere. Monitoring ozone-depleting substances such as halogen oxides is essential to watch the ozone layer throughout a changing climate. The new TotalBrO instrument consists of an active solar tracker (LxWxH ~ 0.40 x 0.40 x 0.50 m, weight ~ 12 kg) and a spectrometer unit (LxWxH ~ 0.45 x 0.40 x 0.40 m, weight ~ 25 kg) with two temperature-stabilized grating spectrometers for the UV/visible spectral range. The instrument is compact and designed to measure bromine and iodine monoxide (BrO and IO) in addition to other gases such as ozone (O3) and nitrogen dioxide (NO2) by means of Differential Optical Absorption Spectroscopy (DOAS). Sets of spectra collected during balloon ascent, sunset and sunrise allow for inferring vertical profiles of the gases.
Here, we report on the first deployment of TotalBrO on a stratospheric balloon launched from Kiruna, Sweden, during the Klimat campaign in August 2021. The solar tracker was able to track the sun once the balloon gondola was azimuthally stabilized above altitudes of about 25 km. TotalBrO collected UV/visible absorption spectra throughout solar occultation during sunset and sunrise on August 21/22, 2021. For the solar occultation periods, the tracking deviation with respect to the center of the solar disk was in the targeted regime of < 0.05°, and the solar tracker was able to catch the sun down to solar zenith angles (SZA) of around 95°, corresponding to tangent heights of about 10 km. We show preliminary results for profile retrievals of O3 and NO2 and for DOAS analyses of BrO and IO. The latter currently suffer from an unexplained oscillatory spectral pattern, for which we report on extensive sensitivity studies.
How to cite: Holzbeck, P., Voss, K., Kleinschek, R., Nordmeyer, H., Pfeilsticker, K., and Butz, A.: TotalBrO: First results of a small solar occultation instrument for the stratosphere, EGU General Assembly 2022, Vienna, Austria, 23–27 May 2022, EGU22-3803, https://doi.org/10.5194/egusphere-egu22-3803, 2022.
Please decide on your access
Please use the buttons below to download the presentation materials or to visit the external website where the presentation is linked. Regarding the external link, please note that Copernicus Meetings cannot accept any liability for the content and the website you will visit.
Forward to presentation link
You are going to open an external link to the presentation as indicated by the authors. Copernicus Meetings cannot accept any liability for the content and the website you will visit.
We are sorry, but presentations are only available for users who registered for the conference. Thank you.
EGU22-5355 | Presentations | GI6.2
Airborne measurement of ship emissions in international waters and Sulphur Emission Control AreaDominika Pasternak, James Lee, James Hopkins, Stéphane Bauguitte, Stephanie Batten, Ming-Xi Yang, Thomas Bell, Hugh Coe, Keith Bower, Stephen Andrews, Loren Temple, Jake Vallow, Emily Matthews, Thomas Bannan, Nicholas Marsden, Huihui Wu, and Navaneeth Thamban
1 January 2020 marked a major change in the legal sulphur content of shipping fuel – from 3.5% to 0.5% by mass outside of the Sulphur Emission Control Areas (SECAs). The anticipated effect of the new regulation is improvement of coastal air quality, supporting both environmental and human health. In addition, since sulphur is believed to be a negative climate forcer, removal of its substantial source might have positive influence on the global climate.
The Atmospheric Composition and Radiative forcing changes due to UN International Ship Emissions regulations (ACRUISE) project demonstrates the use of a large aircraft to measure emissions from ships and their impact on local air quality and cloud formation. The Facility for Airborne Atmospheric Measurements (FAAM) research aircraft was deployed first in July 2019 (before regulation change) in shipping lanes along the Portuguese coast, the English Channel SECA and the Celtic Sea. Over 100 ships were sampled, 15 specifically targeted for plume aging and cloud interaction. A large container ship showed significant reduction in apparent fuel sulphur content upon entering SECA. Bulk statistics in and out of extremely busy shipping lanes were collected. The second, post regulation change, part of the fieldwork was postponed by the COVID-19 pandemic until September 2021. Over 150 ships were measured in the shipping lanes of the Bay of Biscay, the English Channel SECA and Celtic Sea. This part of the work focussed more on targeting specific ships, than on bulk measurements due to lower density of ships in the region and improved sampling strategy.
This study presents a range of aspects of measurements. Onboard measurements of SO2, CO2, CH4 and speciated PM provide emission factors and apparent fuel sulphur content for a variety of ships. Moreover, about 100 whole air samples were taken during each fieldwork and analysed for VOCs. The encountered vessels included container ships, bulk carriers, cruise ships, ferries, crude oil tankers and even elusive LNG tankers. Some ships were measured both in and out of SECA and a few ships were measured both in 2019 and 2021.
How to cite: Pasternak, D., Lee, J., Hopkins, J., Bauguitte, S., Batten, S., Yang, M.-X., Bell, T., Coe, H., Bower, K., Andrews, S., Temple, L., Vallow, J., Matthews, E., Bannan, T., Marsden, N., Wu, H., and Thamban, N.: Airborne measurement of ship emissions in international waters and Sulphur Emission Control Area, EGU General Assembly 2022, Vienna, Austria, 23–27 May 2022, EGU22-5355, https://doi.org/10.5194/egusphere-egu22-5355, 2022.
EGU22-5557 | Presentations | GI6.2
First flight of the mid-infrared limb-imaging interferometer GLORIA on a stratospheric balloonMichael Höpfner, Gerald Wetzel, Felix Friedl-Vallon, Thomas Gulde, Anne Kleinert, Erik Kretschmer, Johannes C. Laube, Guido Maucher, Tom Neubert, Hans Nordmeyer, Christof Piesch, Peter Preusse, and Jörn Ungermann
GLORIA (Gimballed Limb Observer for Radiance Imaging of the Atmosphere) is a limb-imaging Fourier-Transform spectrometer (iFTS) providing radiances of the thermal infrared emission of atmospheric species. The nominal wavelength range is from 780 to1400 cm-1 with a spectral sampling of 0.0625 cm-1. GLORIA-B is an adaption of the airborne GLORIA instrument to stratospheric balloon platforms. It has performed its first flight from ESRANGE/Northern Sweden in August 2021 during the KLIMAT 2021 campaign in the framework of the EU Research Infrastructure HEMERA.
The maiden flight of GLORIA-B has proven its technical qualification and has provided a first imaging hyperspectral limb-emission dataset from 5 to 36 km altitude. Scientific objectives are, amongst others, the observation of the evolution of the upper tropospheric and stratospheric chlorine and nitrogen budget/family partitioning in a changing climate in combination with the set of 20 MIPAS-B (Michelson Interferometer for Passive Atmospheric sounding-balloon) flights since the mid-1990ies, the observation of photochemically active trace gases during sunset and sunrise, as well as the quantification of pollution of the Arctic upper troposphere/lower stratosphere, e.g. through forest fires.
In this contribution we will demonstrate the performance of GLORIA-B with regard to level-1 (calibrated spectra) as well as level-2 data, consisting of retrieved altitude profiles of a variety of trace gases. These retrievals will be thoroughly characterized as well as compared to externally available datasets (e.g. from simultaneous AirCore observations).
How to cite: Höpfner, M., Wetzel, G., Friedl-Vallon, F., Gulde, T., Kleinert, A., Kretschmer, E., Laube, J. C., Maucher, G., Neubert, T., Nordmeyer, H., Piesch, C., Preusse, P., and Ungermann, J.: First flight of the mid-infrared limb-imaging interferometer GLORIA on a stratospheric balloon, EGU General Assembly 2022, Vienna, Austria, 23–27 May 2022, EGU22-5557, https://doi.org/10.5194/egusphere-egu22-5557, 2022.
Please decide on your access
Please use the buttons below to download the presentation materials or to visit the external website where the presentation is linked. Regarding the external link, please note that Copernicus Meetings cannot accept any liability for the content and the website you will visit.
Forward to presentation link
You are going to open an external link to the presentation as indicated by the authors. Copernicus Meetings cannot accept any liability for the content and the website you will visit.
We are sorry, but presentations are only available for users who registered for the conference. Thank you.
EGU22-5728 | Presentations | GI6.2
Quantum-cascade laser absorption spectrometer (QCLAS) for balloon-borne measurements of UTLS water vaporSimone Brunamonti, Manuel Graf, Lukas Emmenegger, and Béla Tuzson
Water vapor (H2O) is the strongest greenhouse gas in our atmosphere, and it plays a key role in multiple processes that affect weather and climate. Particularly, H2O in the upper troposphere - lower stratosphere (UTLS) is of great importance to the Earth's radiative balance, yet accurate measurements of H2O in this region are notoriously difficult, and significant discrepancies were found in the past between different techniques (both in-situ and remote sensing). Currently, cryogenic frostpoint hygrometry (CFH) is considered as the reference method for balloon-borne measurements of UTLS H2O [1]. However, the ongoing phasing-out of the cooling agent required by CFH (freon R23) urges the need of an alternative solution to maintain the monitoring of UTLS H2O in long-term global observing networks, such as the GCOS Reference Upper Air Network (GRUAN).
As an alternative method, we developed a compact instrument based on mid-IR quantum-cascade laser absorption spectroscopy (QCLAS) [2]. The spectrometer incorporates a specially designed segmented circular multipass cell to extend the optical path length to 6 m within a small footprint [3], while meeting the stringent requirements in terms of mass, size, and temperature resilience, posed by the balloon platform and by the harsh environmental conditions of the UTLS. Two successful test flights performed in December 2019, in collaboration with the German Meteorological Service (DWD), demonstrated the instrument's outstanding capabilities under real atmospheric conditions up to 28 km altitude.
The accuracy and precision of QCLAS at UTLS-relevant conditions were validated by a dedicated laboratory campaign conducted at the Swiss Federal Institute of Metrology (METAS). Using a dynamic-gravimetric permeation method, we generated SI-traceable reference gas mixtures with H2O amount fractions as low as 2.5 ppmv and 1.5 % uncertainty in synthetic air. All measurements by QCLAS were found within ± 1.5 % of the reference value, corresponding to a maximum absolute deviation of 210 ppbv, and with an absolute precision better than 30 ppbv at 1 s resolution. This represents an unprecedented level of accuracy and precision for a balloon-borne hygrometer. Further in-flight validation campaigns from Lindenberg (Germany) are currently in preparation.
[1] Brunamonti et al., J. Geophys. Res. Atmos., 2019, 124, 13, 7053-7068.
[2] Graf et al., Atmos. Meas. Tech., 2021, 14, 1365-1378.
[3] Graf, Emmenegger and Tuzson, Opt. Lett., 2018, 43, 2434-2437.
How to cite: Brunamonti, S., Graf, M., Emmenegger, L., and Tuzson, B.: Quantum-cascade laser absorption spectrometer (QCLAS) for balloon-borne measurements of UTLS water vapor, EGU General Assembly 2022, Vienna, Austria, 23–27 May 2022, EGU22-5728, https://doi.org/10.5194/egusphere-egu22-5728, 2022.
EGU22-6337 | Presentations | GI6.2 | Highlight
Potential of SIOS’s airborne imaging sensors in SvalbardShridhar Jawak, Agnar Sivertsen, Trond Løke, Veijo Pohjola, Małgorzata Błaszczyk, Achut Parajuli, Esther Mas Sanz, Joanna Szafraniec, Michał Laska, Julian Podgorski, Marie Henriksen, Oliver Hasler, Sagar Wankhede, Shunan Feng, Riccardo Cerrato, Ximena Vega, William Harcourt, Ilkka Matero, Øystein Godøy, and Heikki Lihavainen and the SIOS Hyperspectral Remote Sensing Team
Svalbard Integrated Arctic Earth Observing System (SIOS) is an international partnership of 26 scientific institutions from 9 countries studying the environment and climate in and around Svalbard. The key aims of SIOS are: (1) to develop an efficient observing system, (2) to share technology, experience, and data, (3) to close knowledge gaps, and (4) to decrease the environmental footprint of science. SIOS encourages the usage of airborne remote sensing platforms for research activities in Svalbard to complement in situ measurements and reduce the environmental footprint of research. SIOS member institution Norwegian Research Centre (NORCE) has installed and tested a suite of optical imaging sensors on the Lufttransport Dornier aircraft stationed in Longyearbyen as part of the SIOS-InfraNor project. Two optical sensors are installed onboard the Dornier aircraft (1) the PhaseOne IXU-180 RGB camera and (2) the HySpex VNIR-1800 hyperspectral sensor. The aircraft with these cameras is configured to acquire aerial RGB imagery and hyperspectral remote sensing data in addition to its regular transport operation in Svalbard. To date, SIOS has supported around 50 hours of flight time to acquire airborne data using Dornier aircraft in Svalbard for more than 20 scientific projects. Airborne imaging sensors include a variety of applications within glaciology, biology, hydrology, and other fields of Earth system science to understand the state of the environment of Svalbard. Mapping glacier crevasses, generating DEMs for glaciological applications, mapping and characterising earth (e.g., minerals, vegetation), ice (e.g., sea ice, icebergs, glaciers and snow cover) and ocean surface features (e.g. colour, chlorophyll) are examples of implementation. Aerial photos are also useful for monitoring the seasonal changes in snow, sea ice cover, and ocean colour. In 2021, SIOS conducted capacity building activities to train the next generation of polar scientists to use airborne imaging sensor data for their projects as part of the SIOS hyperspectral remote sensing training course (HSRS). This study presents a few selected applications from this course to demonstrate the potential of airborne imaging sensors in Svalbard. These include mapping water bodies (e.g. fjords, rivers), estimation of snow grain size, land cover classification, deriving chlorophyll, and mapping terrestrial vegetation. Preliminary results from these studies will be used to develop operational scientific applications and complement measurements from in-situ observations acquired by SIOS infrastructure in Svalbard. Eventually, these datasets will be valuable resources for calibration and validation activities for upcoming satellite hyperspectral missions, for example, the Copernicus Hyperspectral Imaging Mission for the Environment (CHIME).
How to cite: Jawak, S., Sivertsen, A., Løke, T., Pohjola, V., Błaszczyk, M., Parajuli, A., Sanz, E. M., Szafraniec, J., Laska, M., Podgorski, J., Henriksen, M., Hasler, O., Wankhede, S., Feng, S., Cerrato, R., Vega, X., Harcourt, W., Matero, I., Godøy, Ø., and Lihavainen, H. and the SIOS Hyperspectral Remote Sensing Team: Potential of SIOS’s airborne imaging sensors in Svalbard, EGU General Assembly 2022, Vienna, Austria, 23–27 May 2022, EGU22-6337, https://doi.org/10.5194/egusphere-egu22-6337, 2022.
Please decide on your access
Please use the buttons below to download the presentation materials or to visit the external website where the presentation is linked. Regarding the external link, please note that Copernicus Meetings cannot accept any liability for the content and the website you will visit.
Forward to presentation link
You are going to open an external link to the presentation as indicated by the authors. Copernicus Meetings cannot accept any liability for the content and the website you will visit.
We are sorry, but presentations are only available for users who registered for the conference. Thank you.
EGU22-7139 | Presentations | GI6.2
Use of a large aircraft to measure composition and chemistry of wildfires.James Lee, James Hopkins, Freya Squires, and Shona Wilde
Tropospheric ozone (O3) can adversely affect human health and environmental ecosystems and it is therefore vitally important to understand its formation pathways from both natural and anthropogenic precursors. Wildfires are an important source of these precursors (both VOCs and NOx) and it is likely that the prevalence of wildfires will increase in a warming climate. Wildfires have been shown to contribute to elevated O3 at air quality monitoring sites, so it is therefore important to better understand the emissions, photochemistry and impacts of these fires. Instrumented research aircraft provide one of the best methods for studying emissions of VOCs and NOx from wildfires. Aircraft provide the flexibility to sample close to fires, allowing for calculation of emission factors, as well as further afield to study the chemical processing of fire plumes.
Here we present measurements of O3 and its precursors taken from the UK large atmospheric research aircraft. Flights sampling wildfires in the Amazon rainforest in Brazil, scrublands in Senegal, wetlands in Uganda and moorland peat fires in the UK are reported, with measurements of O3, CO, NOx, CH4, CO2, C2H6 and a wide range of VOCs sampled directly in the plume and in more aged air up to 5 days from the source. Measurements of a range of O3 enhancement ratios (DO3 / DCO) are observed, ranging from 0.05 when sampling within 1-2 hours transport time from all 4 types of fire, to 0.3 when sampling up to 100 hours away from the Senegalese fires. VOC composition of the plumes is also investigated. Ratios of different VOCs to CO are examined to derive emission ratios that are used to provide emission estimates of VOCs from wildfires. OH reactivity calculations in the plumes are used to assess the potential contribution of different VOCs to O3 formation. In addition, measurements of aged air from fires in sub-Saharan Africa are compared against values calculated by the GEOS Composition Forecasting (GEOS-CF) system, a global atmospheric model with 25 km resolution, focusing on the model’s ability to capture ozone from biomass burning.
How to cite: Lee, J., Hopkins, J., Squires, F., and Wilde, S.: Use of a large aircraft to measure composition and chemistry of wildfires., EGU General Assembly 2022, Vienna, Austria, 23–27 May 2022, EGU22-7139, https://doi.org/10.5194/egusphere-egu22-7139, 2022.
EGU22-7587 | Presentations | GI6.2
High resolution vertical information of halogenated trace gas abundances in the polar stratosphere: First flight of the „MegaAirCore“ in summer 2021Johannes Laube, Anne Richter, Andreas Sitnikow, Timo Keber, Elena Popa, Tanja Schuck, Thomas Wagenhäuser, and Andreas Engel
Measurements of halogenated trace gases such as CFCs, halons, HCFCs, HFCs, and PFCs are highly relevant due to their impact on the stratospheric ozone layer as well as their high Global Warming Potentials. Yet in situ profiles of the abundances of many of these species in the stratosphere have been increasingly rare in the last two decades, especially above the altitude range accessible by aircraft (i.e. up to 20 km). More recently, the AirCore technique, which was initially utilized for measurements of more abundant trace gases such as carbon dioxide and methane (Karion et al., 2010), has been demonstrated to also enable stratospheric mixing ratio determination for six halogenated species (Laube et al., 2020). However, a direct measurement comparison of AirCore-based air samples with those collected via a more established technique has been missing so far for such low-abundant species. We here present results from a large balloon flight in Esrange, Sweden (67.8877°N, 21.0838°E) in August 2021. An established cryogenic whole-air sampler (Engel et al., 2009) was flown on the same gondola as a so-called “MegaAirCore”, which has, at ~15 liters, a much larger internal volume than common AirCores (~1-1.5 liters). The air collected between ~32 km and ~5 km by this “MegaAirCore” was transferred into 51 sub-samples immediately after the flight, and these were subsequently analysed for their content of >30 halogenated trace gases. The 13 larger air samples collected by the cryosampler were also measured on the same mass spectrometry-based instrument.Results compare well for many species, which represents an independent verification of AirCore-based measurements of halogenated trace gases at mixing ratios of parts per trillion levels or below – while at the same time demonstrating the viability of stratospheric air sampling at a much higher vertical resolution than previously possible. This opens up new possibilities for studying stratospheric chemistry and dynamics as well as for improvements of the independent validation of remote sensing-based observations.
References
Engel et al., Nat. Geosci., 2, 28–31, 2009
Karion et al., J. Atmos. Ocean. Technol., 27(11), 1839–1853, 2010
Laube, et al., Atmos. Chem. Phys., 20, 9771–9782, 2020, https://doi.org/10.5194/acp-20-9771-2020
How to cite: Laube, J., Richter, A., Sitnikow, A., Keber, T., Popa, E., Schuck, T., Wagenhäuser, T., and Engel, A.: High resolution vertical information of halogenated trace gas abundances in the polar stratosphere: First flight of the „MegaAirCore“ in summer 2021, EGU General Assembly 2022, Vienna, Austria, 23–27 May 2022, EGU22-7587, https://doi.org/10.5194/egusphere-egu22-7587, 2022.
EGU22-7775 | Presentations | GI6.2 | Highlight
The new IAGOS Data PortalDamien Boulanger, Asmae Bouhouili, Olivier Bex-Chauvet, Pawel Wolff, Valérie Thouret, and Hannah Clark
IAGOS (In-service Aircraft for a Global Observing System) is a European Research Infrastructure that aims to provide long-term, regular and spatially resolved in situ observations of the atmospheric composition. IAGOS observation systems are deployed on a fleet of commercial aircraft and perform uninterrupted measurements, from take-off to landing, of aerosols, cloud particles, greenhouse gases, ozone, carbon monoxide, water vapor and nitrogen oxides, from the surface to the lower stratosphere. The IAGOS database is an essential part of the global atmospheric monitoring network.
The IAGOS Data Portal (via https://www.iagos.org) is managed by AERIS, the French Data and Services Cluster for Atmosphere (https://en.aeris-data.fr). The new portal offers improved discovery and access to all the IAGOS datasets from the observational data to the derived and elaborated data products. Thanks to the H2020 project ENVRI-FAIR, all data is now managed in accordance with the FAIR principles. Rich metadata and data files are available in standardized formats (NetCDF-CF, etc.). The portal also provides advanced web-processing services such as visualisation capabilities and machine actionable access.
Particular attention has been paid to the interoperability of IAGOS data with external data portals. Interoperability is currently being implemented with other airborne programs such as SAFIRE and EUFAR, with other Research Infrastructures from the Atmospheric domain and more generally from the Environmental domain in the frame of the ENVRI community.
In the frame of the European projects ATMO-ACCESS and RI-URBANS, IAGOS is currently developing new advanced services such as: statistical analysis tools, combination of products from different sources with satellite data and models, Jupyter notebooks for demonstration of IAGOS data usage, footprints calculation and homeless data service for datasets acquired on mobile platforms.
How to cite: Boulanger, D., Bouhouili, A., Bex-Chauvet, O., Wolff, P., Thouret, V., and Clark, H.: The new IAGOS Data Portal, EGU General Assembly 2022, Vienna, Austria, 23–27 May 2022, EGU22-7775, https://doi.org/10.5194/egusphere-egu22-7775, 2022.
EGU22-8004 | Presentations | GI6.2
Instrument design and laboratory evaluation of the OSAS-B heterodyne spectrometer for sounding atomic oxygen in the MLTMartin Wienold, Alexey Semenov, Heiko Richter, Enrico Dietz, Sven Frohmann, and Heinz-Wilhelm Hübers
The Oxygen Spectrometer for Atmospheric Science on a Balloon (OSAS-B) is dedicated to the remote sounding of atomic oxygen in the mesosphere and lower thermosphere (MLT) region of Earth's atmosphere, where atomic oxygen is the dominant species. OSAS-B is a heterodyne receiver for the thermally excited ground state transition of atomic oxygen at 4.75 THz. Due to water absorption, this line can only be observed from high-altitude platforms such as a balloon. A combined Helium/nitrogen dewar comprises the detector of the instrument, a hot-electron bolometer mixer, as well as a quantum-cascade laser, which serves as the local oscillator for heterodyning. A turning mirror allows for measurements at different vertical inclinations and for radiometric calibration against two blackbody sources. The first flight will take place in autumn 2022 within the HEMERA2020 program. We will present the instrument design and results of the laboratory evaluation of the instrument.
How to cite: Wienold, M., Semenov, A., Richter, H., Dietz, E., Frohmann, S., and Hübers, H.-W.: Instrument design and laboratory evaluation of the OSAS-B heterodyne spectrometer for sounding atomic oxygen in the MLT, EGU General Assembly 2022, Vienna, Austria, 23–27 May 2022, EGU22-8004, https://doi.org/10.5194/egusphere-egu22-8004, 2022.
EGU22-8353 | Presentations | GI6.2
New EUFAR flight finderVianney Retornard, Damien Boulanger, Wendy Garland, and Paola Formenti
EUFAR (EUropean Facility for Airborne Research, https://www.eufar.net) was born out of the necessity to create a central network for the airborne research community in Europe with the principal aim of supporting scientists, by granting them access to research aircraft and instruments otherwise not accessible in their home countries. With time EUFAR has grown, introducing new activities and objectives to place itself as the unique network and portal of airborne research for the environmental and geosciences in Europe. From serving as an interactive and dynamic hub of information, to maintaining a central data archive, and developing tools and standards to collect, process and analyse data, EUFAR continues to improve the operational environment for conducting airborne research.
EUFAR's data archive activity seeks to improve access to and use of the data collected by instrumented aircraft in Europe, providing a unique portal to the data along with supporting metadata. AERIS, the French Data and Services Cluster for Atmosphere (https://en.aeris-data.fr) has implemented a new Data and Metadata Catalogue for EUFAR that in the longer term is intended to become a principal data portal for the European airborne science community.
All EUFAR datasets are following the FAIR principles. The main features of the catalogue, i.e. data and metadata discovery and download, have been improved. Advanced services have been implemented such as the discovery of external datasets from EUFAR partners starting with the French Research Airborne Data Portal SAFIRE+. This will be extended to other databases in 2022 such as DLR, NERC-ARF, FAAM, Met Office, etc. New advanced features are currently under development: discovery of datasets from other airborne Research Infrastructures (IAGOS, HEMERA, etc.); data visualization services; integration of the EUFAR products and services in EOSC (European Open Science Cloud); tools for the management of campaigns metadata, etc.
How to cite: Retornard, V., Boulanger, D., Garland, W., and Formenti, P.: New EUFAR flight finder, EGU General Assembly 2022, Vienna, Austria, 23–27 May 2022, EGU22-8353, https://doi.org/10.5194/egusphere-egu22-8353, 2022.
EGU22-8371 | Presentations | GI6.2
Airbone data strategy in the French National cluster AERISOlivier Bex-Chauvet, Sébastien Payan, Damien Boulanger, Asmae Bouhouili, Vianney Retornard, and Cathy Boonne
AERIS, the French Data and Services Cluster for Atmosphere (https://en.aeris-data.fr), aims to facilitate and enhance the use of French atmospheric data acquired by satellites, ground-based facilities and airborne platforms during long observation periods and scientific campaigns. AERIS manages a large set of datasets acquired on aircraft or balloons platforms.
AERIS is the Data Centre for the European Research Infrastructure IAGOS (In-service Aircraft for a Global Observing System) that acquires readings of atmospheric composition from instrumented international commercial airliners. AERIS also manages all data obtained from airborne scientific survey campaigns flown over nearly 30 years, by French research aircraft today operated by the SAFIRE unit, accessible through the SAFIRE+ portal. AERIS recently developed the new version of the EUFAR (EUropean Facility for Airborne Research) data catalogue.
In AERIS, data from balloon survey campaigns operated by the international science community are managed and distributed in a unified fashion. Through the European HEMERA (Integrated access to balloon-borne platforms for innovative research and technology) project, AERIS provides archive balloon survey data and an environment to accommodate future campaigns.
All the data are openly accessible to the scientific community. Recently, AERIS has been working on the application of the FAIR principles with an emphasis on the implementation of interoperability. Cross discovery of all the datasets is implemented or under development on the different data portals with links between AERIS airborne datasets and external ones. Specific advanced services have been implemented, such as aircraft and balloons trajectories visualisation, data plotting, etc.
AERIS as well supports airborne campaigns providing services like operational websites offering various digital tools to facilitate the organisation of measurement campaigns (website, data repository, specific products, quicklooks, trajectory forecast, satellite colocation, etc.). Catalogues are also proposed for discovery and publication of the data acquired during the campaigns.
How to cite: Bex-Chauvet, O., Payan, S., Boulanger, D., Bouhouili, A., Retornard, V., and Boonne, C.: Airbone data strategy in the French National cluster AERIS, EGU General Assembly 2022, Vienna, Austria, 23–27 May 2022, EGU22-8371, https://doi.org/10.5194/egusphere-egu22-8371, 2022.
Please decide on your access
Please use the buttons below to download the presentation materials or to visit the external website where the presentation is linked. Regarding the external link, please note that Copernicus Meetings cannot accept any liability for the content and the website you will visit.
Forward to presentation link
You are going to open an external link to the presentation as indicated by the authors. Copernicus Meetings cannot accept any liability for the content and the website you will visit.
We are sorry, but presentations are only available for users who registered for the conference. Thank you.
EGU22-9814 | Presentations | GI6.2
Innovative airborne experiments tools for Science UsersThomas Vernizeau, Rémy Gallois, Jean Marc Gaubert, and Tetyana Jiang
The SAFIRE, a joint service unit of CNRS, Météo-France and CNES in charge of environment observation campaigns, aeronautical R&D projects, as well as preparation and validation of space missions, is striving to provide state of the art infrastructure and services to its Science Users. Hence, SAFIRE has always supported development of common standards and use of best practices for hosting Science Payloads in its airborne infrastructure.
In the recent years, airborne scientific operations have been significantly improved through digitalization. However, growing number of individual equipment embarked still leads to tedious work when attempting to integrate together acquisition, measurement and processing tools or to manage the experimental set up as a whole. To answer this challenge, SAFIRE has proposed to use MQTT protocol messaging to allow an easier flow of data between on board equipment.
Collaborating with the SAFIRE, ATMOSPHERE developed MQTT-based solutions aiming to provide automated storage of measurement data in specific formats, and live monitoring of data produced by various equipment. These solutions can be easily interfaced with other MQTT compliant equipment and allow more centralized data management and processing.
The paper will describe the benefits of the new SAFIRE airborne architecture and will review early results from latest measurements campaigns. It will also describe how the exploitation of data monitoring and processing tools using MQTT-based communication can benefit the scientific community.
How to cite: Vernizeau, T., Gallois, R., Gaubert, J. M., and Jiang, T.: Innovative airborne experiments tools for Science Users, EGU General Assembly 2022, Vienna, Austria, 23–27 May 2022, EGU22-9814, https://doi.org/10.5194/egusphere-egu22-9814, 2022.
EGU22-10133 | Presentations | GI6.2
Distribution of hydrogen peroxide over Europe during the BLUESKY aircraft campaignZaneta Hamryszczak, Andrea Pozzer, Florian Obersteiner, Birger Bohn, Benedikt Steil, Jos Lelieveld, and Horst Fischer
Hydrogen peroxide and higher organic hydroperoxides form an important reservoir for peroxy radicals (HOx), which are key contributors to the self-cleaning processes of the atmosphere. The work gives an overview of airborne in-situ trace gas observations of hydrogen peroxide (H2O2), and methyl hydroperoxide (MHP) over Europe during the Chemistry of the Atmosphere – Field Experiments in Europe (CAFE-EU, also BLUESKY) aircraft campaign. The purpose of the campaign was to obtain an overview of the trace gas and aerosol distribution over Europe to analyze atmospheric chemistry under the conditions of the COVID-19 lock-down. The campaign anticipated to investigate the impact of reduced emissions from anthropogenic sources due to the COVID-19 pandemic on the chemistry and physics of the atmosphere. The rapid decrease of anthropogenic emissions established a unique opportunity for analysis of the changes in the atmosphere. The campaign took place in May/June 2020 over Central and Southern Europe and within the North Atlantic Flight Corridor. Airborne measurements were performed on the High Altitude and Long-range (HALO) research aircraft out of the base of operation in Oberpfaffenhofen (Germany). Average mixing ratios for H2O2 of 0.32 ± 0.25 ppbv, 0.39 ± 0.23 ppbv and 0.38 ± 0.21 ppbv within the upper and middle troposphere and the boundary layer were measured over Europe, respectively. Vertical distribution of H2O2 reveals a significant decrease above the boundary layer in comparison with previous airborne observations, most likely due to cloud scavenging and subsequent rainout. The expected maximum hydrogen peroxide mixing ratios at 3 – 7 km were not found during BLUESKY in contrast to observations during previous studies over Europe, during the campaigns HOOVER and UTOPIHAN-ACT II/III. Simulations with the global chemistry-transport model EMAC reproduce partly the impact of cloud uptake and rainout loss of H2O2. A comparison of calculated deposition loss rates based on EMAC reveals an underestimation relative to the observations. A performed sensitivity study without H2O2 scavenging underlines the major impact of cloud processing and precipitation on the hydrogen peroxide budget. Differences between simulations and observations are most likely due to difficulties in the simulation of wet scavenging.
How to cite: Hamryszczak, Z., Pozzer, A., Obersteiner, F., Bohn, B., Steil, B., Lelieveld, J., and Fischer, H.: Distribution of hydrogen peroxide over Europe during the BLUESKY aircraft campaign, EGU General Assembly 2022, Vienna, Austria, 23–27 May 2022, EGU22-10133, https://doi.org/10.5194/egusphere-egu22-10133, 2022.
EGU22-11428 | Presentations | GI6.2
Refractive static Fourier transform spectrometer: a balloon borne applicationFabio Frassetto, Lorenzo Cocola, Riccardo Claudi, Vania Da Deppo, Paola Zuppella, and Luca Poletto
Static Fourier Transform spectrometers are traditionally realized with reflecting diffractive gratings. The positive aspects of these instruments, wide field of view and the absence of moving parts, are tested on an optical configuration in which the diffractive-reflective gratings are replaced with refractive-reflective prisms (Littrow prisms).
Beside the reduction in the resolution power, especially in the near IR, due to the dispersive power of the glasses, the optical quality of Littrow prisms can provide low noise instruments at low price.
The application to a sounding balloon flight on the Hemera project is presented. The flight took place in October 2021 at the CNES "Centre d'Opérations Ballons" at Aire sur l’Adour, France.
This work has been supported by ASI, Agenzia Spaziale Italiana, Agreement n. 2019-33-HH.0. for the payload realization and the flight opportunity has been provided by the European Commission in the frame of the INFRAIA grant 730790-HEMERA.
How to cite: Frassetto, F., Cocola, L., Claudi, R., Da Deppo, V., Zuppella, P., and Poletto, L.: Refractive static Fourier transform spectrometer: a balloon borne application, EGU General Assembly 2022, Vienna, Austria, 23–27 May 2022, EGU22-11428, https://doi.org/10.5194/egusphere-egu22-11428, 2022.
EGU22-11594 | Presentations | GI6.2
Investigations of comparison uncertainties for airborne validation of air quality satellite productsAlexis Merlaud, Michel Van Roozendael, Frederik Tack, Ruthtz Thomas, Dragos Ene, Andreea Calcan, Magdalena Ardelean, Daniel Constantin, and Dirk Schuettemeyer
When validating atmospheric satellite observations, several error sources must be taken into account: the uncertainties of the satellite products, the uncertainties of the reference measurements, and the representativity of the latter with respect to the investigated satellite pixels. Compared to static ground-based reference measurements, airborne observations reduce the spatial component of the representativity error. Recent airborne campaigns indicate a remaining low-bias for TROPOMI tropospheric NO2 VCDs above polluted areas. This bias has been attributed in particular to wrong assumptions on the NO2 profiles in the satellite products.
In the context of the RAMOS and SVANTE projects, we started regular continuous mapping of the NO2 tropospheric VCDs above Bucharest and Berlin, respectively. Both activities make use of compact whiskbroom imagers, namely SWING. In Bucharest, we also measure the profiles of NO2 and of aerosols from the aircraft and perform car-based DOAS measurements of tropospheric NO2 underneath the aircraft. We study the error budgets of the validation of the TROPOMI tropospheric NO2 VCD product in these two situations. We quantify the added values of the ancillary observations in Bucharest and assess the temporal component of the representativity error. Given the time duration of a scientific flight, several configurations are possible for our whiskbroom observations, and it may be useful to undersample satellite pixels to cover a large area. This work is therefore also useful to optimize the flight patterns and information content of future validation flights.
How to cite: Merlaud, A., Van Roozendael, M., Tack, F., Thomas, R., Ene, D., Calcan, A., Ardelean, M., Constantin, D., and Schuettemeyer, D.: Investigations of comparison uncertainties for airborne validation of air quality satellite products, EGU General Assembly 2022, Vienna, Austria, 23–27 May 2022, EGU22-11594, https://doi.org/10.5194/egusphere-egu22-11594, 2022.
Please decide on your access
Please use the buttons below to download the presentation materials or to visit the external website where the presentation is linked. Regarding the external link, please note that Copernicus Meetings cannot accept any liability for the content and the website you will visit.
Forward to presentation link
You are going to open an external link to the presentation as indicated by the authors. Copernicus Meetings cannot accept any liability for the content and the website you will visit.
We are sorry, but presentations are only available for users who registered for the conference. Thank you.
EGU22-12083 | Presentations | GI6.2
HERMES: HEmera Returning MESsengerGiovanni Romeo, Alessandro Iarocci, Giuseppe Spinelli, Giuseppe Di Stefano, Amedeo Lepore, Pasquale Adobbato, Silvia Masi, and Simone Bacci
Stratospheric long-duration balloons (LDBs) are a cheap and easy way to access the near space, allowing geophysical and cosmological observations.
A common issue for LDBs is the high bit rate data transferring. Just few hours after launch balloons are nor reachable with direct radio link, and satellite links are, simply, too expensive. For this reason the satellite link is used only for house keeping and remote control, and scientific data are recorded on board. This makes mandatory to recover the payload to get the observation’s results, a difficult task operating in polar areas, impossible during the polar winter.
The aim of the project is to provide an autonomous glider capable of physically carrying data and samples from the stratospheric platform to a recovery point on the ground. The glider itself can also transport instruments and can make measurements during the flight. We estimate that an electrical motorglider released in the stratosphere can fly for several hundreds kilometres.
The glider is installed on the balloon payload through a remotely controlled release system (which provides its own direct radio link and satellite communications), and connected to the main computer to receive data and geographic coordinates of the recovery point. The glider trajectory can be monitored with Iridium SBD, and remotely controlled using Iridium too.
The glider is a carbon fiber reinforced foam structure, a compact and robust design, self-stable, which has been shown to steer correctly in the lower stratosphere.
Several test have been conducted with motorized and non motorized gliders, showing that the presence of the engine helps the aircraft to get into flight attitude, at around 20 km of altitude, compared to 10 km achieved in non-motorized flights.
How to cite: Romeo, G., Iarocci, A., Spinelli, G., Di Stefano, G., Lepore, A., Adobbato, P., Masi, S., and Bacci, S.: HERMES: HEmera Returning MESsenger, EGU General Assembly 2022, Vienna, Austria, 23–27 May 2022, EGU22-12083, https://doi.org/10.5194/egusphere-egu22-12083, 2022.
EGU22-12448 | Presentations | GI6.2
Urban emissions of N2O and CH4 estimated from airborne active AirCore observationsXin Tong, Steven Heuven, Bert Scheeren, Bert Kers, Ronald Hutjes, and Huilin Chen
Urban emissions of N2O and CH4 may be an important part of their total anthropogenic emissions. In this study, we aimed to independently estimate the fluxes based on direct observations focusing on two urban regions. We developed a new active AirCore (~6 L) system that is able to continuously collect air samples aboard aircraft. The sampling can last 2.5 hours with a typical flow rate of 40 mL/min, and the spatial resolution dependent on diffusion in the tubing as well is ~ 1800 m with a typical flight speed of 40 m/s. Several flights were conducted with the new active AirCore aboard a SkyArrow aircraft over the Groningen and Utrecht regions in 2020 and 2021. During a few of those flights, both the active AirCore and a commercially available LICOR-7810 analyzer for high precision CH4 were flown together. The in situ LICOR CH4 measurements were used to optimize the AirCore retrieval algorithm. The optimized AirCore CH4 showed a high agreement with the in situ LICOR CH4 measurements (R2 = 0.9998). Furthermore, a mass balance approach was utilized to derive CH4 fluxes. The preliminary results show that the estimated CH4 emission rate from three flights over the Groningen region is 41±28 mol/s, much higher than the yearly average emission rate (3.3 mol/s) from the EDGARv6.0 inventory in 2018, and we localize one potential source to be southwest outside the Groningen city. The CH4 estimated emission rate from one flight over the Utrecht region is 30 mol/s, also higher than the EDGARv6.0 mean value 2.2 mol/s. Since the N2O signals are weak, we will explore whether it will be feasible to estimate the N2O emission rates based on these flights.
How to cite: Tong, X., Heuven, S., Scheeren, B., Kers, B., Hutjes, R., and Chen, H.: Urban emissions of N2O and CH4 estimated from airborne active AirCore observations, EGU General Assembly 2022, Vienna, Austria, 23–27 May 2022, EGU22-12448, https://doi.org/10.5194/egusphere-egu22-12448, 2022.
Please decide on your access
Please use the buttons below to download the presentation materials or to visit the external website where the presentation is linked. Regarding the external link, please note that Copernicus Meetings cannot accept any liability for the content and the website you will visit.
Forward to presentation link
You are going to open an external link to the presentation as indicated by the authors. Copernicus Meetings cannot accept any liability for the content and the website you will visit.
We are sorry, but presentations are only available for users who registered for the conference. Thank you.
EGU22-12470 | Presentations | GI6.2
The TWIN - Hemera stratospheric balloon flight: sulfur, halogens and tracers in the stratosphereMaria Elena Popa, Andreas Engel, Huilin Chen, Mélanie Ghysels-Dubois, Johannes C Laube, Nadir Amarouche, Steven van Heuven, Sophie Baartman, Tanja Schuck, Thomas Wagenhäuser, Alessandro Zanchetta, Georges Durry, Timo Keber, Anneliese Richter, Andreas Sitnikow, Fabien Frerot, and Jean Christophe Samake
The TWIN - Hemera stratospheric balloon flight took place on 12 - 13-Aug-2021 from the Esrange Space Center near Kiruna, Sweden (67°N).The project was supported by Hemera (www.hemera-h2020.eu) via the first call of proposals, and the flight was managed by the CNES (Centre national d'Etudes Spatiales) and SSC (Swedish Space Corporation). The scientific payload was developed in collaboration by several institutions from the Netherlands, Germany and France.
The main objectives were: (1) to characterize the vertical structure of COS mole fraction and isotopic composition; (2) to characterize the CFCs, other ozone depleting substances and climate relevant trace gases in the present atmosphere, linked to their change over the past decade; and (3) to compare and evaluate several instruments and sampling techniques.
The payload included several AirCores (U. Frankfurt, CIO and FZJ), two Pico-SDLA mid-infrared in-situ diode laser spectrometers (GSMA/DT-INSU), and devices for taking large whole air samples of stratospheric air for subsequent laboratory measurements: the BONBON whole-air cryosampler (U. Frankfurt) and LISA (CIO). IMAU is involved for the analysis of isotopic composition and mole fractions of samplers from the cryo-sampler. This approach allows obtaining a comprehensive dataset covering a range of spatial resolutions: from the multitude of gas species to be measured in the high-volume samples, to the subset of gases at higher vertical resolution from AirCores, and finally to the continuous in-situ CO2 and CH4 data from tunable diode laser spectroscopy. We expect this dataset to lead to novel and important knowledge on the trace gases in the stratosphere.
In this presentation we will describe the overall setup of the scientific payload, the flight characteristics, and we will give an overview of the already performed and planned measurements.
How to cite: Popa, M. E., Engel, A., Chen, H., Ghysels-Dubois, M., Laube, J. C., Amarouche, N., van Heuven, S., Baartman, S., Schuck, T., Wagenhäuser, T., Zanchetta, A., Durry, G., Keber, T., Richter, A., Sitnikow, A., Frerot, F., and Samake, J. C.: The TWIN - Hemera stratospheric balloon flight: sulfur, halogens and tracers in the stratosphere, EGU General Assembly 2022, Vienna, Austria, 23–27 May 2022, EGU22-12470, https://doi.org/10.5194/egusphere-egu22-12470, 2022.
EGU22-12838 | Presentations | GI6.2
Dust in the Upper Stratosphere Tracking Experiment and Retrieval: Exploring the Dust Reservoir of the Upper Stratosphere through BalloonsAnna Musolino, Vincenzo Della Corte, Alessandra Rotundi, Zélia Dionnet, Luigi Folco, Vito Liuzzi, and Stefano Ferretti
Dust in the Upper Stratosphere Tracking Experiment and Retrieval (DUSTER) aims to collect and characterize uncontaminated particles (<30μm) from the Earth stratosphere (30–40km). The upper stratosphere is populated by both terrestrial and extraterrestrial particles. However, it is richer in the extraterrestrial ones compared to lower altitudes [1]. The stratosphere is a reservoir for Interplanetary Dust Particles (IDPs) [2]: a selection effect would facilitate fragile materials that could not reach the ground [3].
In addition to DUSTER, only a few other attempts have been made for the collection of particles through balloons at altitude >30km [4,5]. The innovations brought by DUSTER include: (i) does not require sample manipulation after collection; (ii) guarantees low impact velocities between particles and the collector’s substrate; and (iii) a key factor, adopts a strict control protocol for the minimization of contamination [3,6]. On the collector (a holder with 13 TEM grids), directly exposed to the airflow, the particles remain stuck without the use of adhesive materials (dry collection). High-resolution images of the collector and the blank (similar to the collector but not exposed to the airflow) are acquired before and after the flight, to exclude from the count pre-existing particles [6,7].
Five DUSTER launch campaigns successfully collected stratospheric particles. The most recent ones took place at the ESRANGE, Kiruna (Sweden), in 2019 and 2021. DUSTER sampled the stratosphere at an altitude of ~33km for ~5 hours over Lapland, and its collector and blank are currently under analysis. Up to now, the identified particles range from 0.1 to 150µm (latest data to be published). Morphologically, they can be classified as mineral fragments and aggregates, spherules, fungal spores [10], and a type-I cosmic spherule. EDX analyses have shown the occurrence of minerals like plagioclase, silica, fassaite, but also carbonates, CaO – all mineralogic phases present in CI and CM carbonaceous chondrites, unequilibrated ordinary chondrites, and comets [8]. The occurrence of CaO and carbon nanoparticles has been suggested to be a result of condensation after disaggregation of carbonates of extraterrestrial origin [11].
The ambitious goal of DUSTER is to become a reference collection for uncontaminated extraterrestrial particles available for scientific research – a unique and barely explored reservoir complementary to (micro)meteorites and IDPs available at the Earth’s surface.
In general, the properties of solid and condensed dust in the upper stratosphere remain poorly known. Complete morphological and chemical characterization of particles collected at altitudes >30 km remains incidental with few exceptions, DUSTER will provide a record of the amount of solid aerosols, their size, shapes and chemical properties in the upper stratosphere, including particles less than 3 microns in size.
Acknowledgement – ASI-INAF “Rosetta GIADA”,I/024/12/0 and 2019-33-HH.0; PRIN2015/MIUR; European Union's Horizon 2020 research and Innovation programme,No.730970.
References – [1]Flynn, 1997. Nature,387, 248. [2]Brownlee 1985. Annu.Rev.Earth Planet.Sci., 13(1),147-173. [3]Della Corte & Rotundi, 2021. Elsevier,269-293. [4]Testa et al., 1990. Earth Planet.Sci.Lett., 98,287-302. [5]Wainwright et al., 2003. FEMS Microbiol.Lett., 218,161-165. [6]Della Corte et al., 2012. SpaceSci.Rev, 169,159-180. [7]Palumbo et al., 2008. Mem.Soc.Astron.Ital., 79,853. [8]Rietmeijer et al., 2016. Icarus, 266,217-234. [10]Della Corte et al., 2014. Astrobiology, 14(8),694-705. [11]Della Corte et al., 2013. TellusB: Chem.Phys.Meteorol.,65(1),1-12.
How to cite: Musolino, A., Della Corte, V., Rotundi, A., Dionnet, Z., Folco, L., Liuzzi, V., and Ferretti, S.: Dust in the Upper Stratosphere Tracking Experiment and Retrieval: Exploring the Dust Reservoir of the Upper Stratosphere through Balloons, EGU General Assembly 2022, Vienna, Austria, 23–27 May 2022, EGU22-12838, https://doi.org/10.5194/egusphere-egu22-12838, 2022.
EGU22-1941 | Presentations | GI6.3
The role atmospheric water management technologies might play in Nature-based solutions (NbS)Thomas DeFelice
Atmospheric water management or cloud seeding technologies might be effectively applied to assess the impacts from changing climate on water security and renewable energy use. During said assessments it might be possible to exploit their observations to mitigate the negative impacts from climate change by enhancing the water supply as part of a water security plan, and/or by effectively removing low-level supercooled cloud decks/fogs to facilitate renewable energy use providing added sunshine during typically overcast day-time periods. Cloud seeding technologies are used to positively affect the natural hydrologic cycle, while respecting and avoiding damage to public health, safety and the environment. This talk summarizes atmospheric water management technologies and their use, how these technologies might be applied as part of a strategy to ensure water security and how their application might provide a potential opportunity for recouping lost energy potential.
How to cite: DeFelice, T.: The role atmospheric water management technologies might play in Nature-based solutions (NbS), EGU General Assembly 2022, Vienna, Austria, 23–27 May 2022, EGU22-1941, https://doi.org/10.5194/egusphere-egu22-1941, 2022.
EGU22-2263 | Presentations | GI6.3
EasyGeoModels: a New Tool to Investigate Seismic and Volcanic Deformations Retrieved through Geodetic Data. Software Implementation and Examples on the Campi Flegrei Caldera and the 2016 Amatrice EarthquakeGiuseppe Solaro, Sabatino Buonanno, Raffaele Castaldo, Claudio De Luca, Adele Fusco, Mariarosaria Manzo, Susi Pepe, Pietro Tizzani, Emanuela Valerio, Giovanni Zeni, Simone Atzori, and Riccardo Lanari
The increasingly widespread use of space geodesy has resulted in numerous, high-quality surface deformation data sets. DInSAR, for instance, is a well-established satellite technique for investigating tectonically active and volcanic areas characterized by a wide spatial extent of the inherent deformation. These geodetic data can provide important constraints on the involved fault geometry and on its slip distribution as well as on the type and position of an active magmatic source. For this reason, over last years, many researchers have developed robust and semiautomatic methods for inverting suitable models to infer the source type and geometry characteristics from the retrieved surface deformations.
In this work we will present a new software we have implemented, named easyGeoModels, that can be used by geophysicists but also by less skilled users who are interested in sources modeling to determine ground deformation in both seismo-tectonic and volcanic contexts. This software is characterized by some innovative aspects compared to existing similar tools, such as (i) the presence of an easy-to-use graphic interface that allows the user, even if not particularly expert, to manage the data to be inverted, the input parameters of one or more sources, the choice of the deformation source (s), effective and simple way; (ii) the possibility of selecting the GPS data to be inverted, simply by selecting the area of interest: in this case the software will automatically consider for the inversion only the GPS stations present in the selected area and will download the relative data from the Nevada Geodetic Laboratory site; (iii) the generation of output files in Geotiff, KMZ and Shapefile format, which allow a faster and more immediate visualization through GIS tools or Google Earth.
Finally, as applications, we will show some preliminary results obtained through the easyGeoModels software on areas characterized by huge deformation both in a volcanic context, such as that of the Campi Flegrei caldera, and a seismo-tectonic one, as for the case of the Amatrice earthquake (central Italy) which occurred on 24 August 2016.
How to cite: Solaro, G., Buonanno, S., Castaldo, R., De Luca, C., Fusco, A., Manzo, M., Pepe, S., Tizzani, P., Valerio, E., Zeni, G., Atzori, S., and Lanari, R.: EasyGeoModels: a New Tool to Investigate Seismic and Volcanic Deformations Retrieved through Geodetic Data. Software Implementation and Examples on the Campi Flegrei Caldera and the 2016 Amatrice Earthquake, EGU General Assembly 2022, Vienna, Austria, 23–27 May 2022, EGU22-2263, https://doi.org/10.5194/egusphere-egu22-2263, 2022.
EGU22-4876 | Presentations | GI6.3 | Highlight
Geodetic imaging of the magma ascent process during the 2021 Cumbre Vieja (La Palma, Canary Islands) eruptionMonika Przeor, José Barrancos, Raffaele Castaldo, Luca D’Auria, Antonio Pepe, Susi Pepe, Takeshi Sagiya, Giuseppe Solaro, and Pietro Tizzani
On the 11th of September of 2021, a seismic sequence began on La Palma (Canary Islands), followed by a rapid and significant ground deformation reaching more than 10 cm in the vertical component of the permanent GNSS station ARID (Aridane) operated by the Instituto Volcanológico de Canarias (INVOLCAN). The pre-eruptive episode lasted only nine days and was characterized by an intense deformation in the western part of the island and intense seismicity with the upward migration of hypocenters. After the onset of the eruption, which occurred on the 19th of September of 2021, the deformation increased a few cm more, reaching a maximum on the 22nd of September and subsequently showing a nearly steady deflation trend in the following months.
We obtained a Sentinel-1 DInSAR dataset along both ascending and descending orbits, starting from the 27th of February of 2021 and the 13th of January of 2021, respectively. We selected the study area at the radial distance of 13 km from the eruption point (Latitude: 28.612; Longitude: -17.866) to realize an inverse model of the geometry of the causative sources of the observed ground deformation. While the ascending orbit that passed on the 18th of September indicated mainly a dike intrusion in the shallow depth, the descending orbit from the 20th of September seemed to indicate a deformation caused by at least two sources: the pre-eruptive intrusion and the nearly-vertical eruptive dike. The deeper source spatially coincides with the location of most of the pre-eruptive volcano-tectonic hypocenters.
Finally, based on the preliminary inverse model of the DInSAR dataset, we applied the geodetic imaging of D’Auria et al., (2015) to retrieve the time-varying spatial distribution of volumetric ground deformation sources. The final results show the kinematics of the upward dike propagation and magma ascent.
References
D’Auria, L., Pepe, S., Castaldo, R., Giudicepietro, F., Macedonio, G., Ricciolino, P., ... & Zinno, I. (2015). Magma injection beneath the urban area of Naples: a new mechanism for the 2012–2013 volcanic unrest at Campi Flegrei caldera. Scientific reports, 5(1), 1-11.
How to cite: Przeor, M., Barrancos, J., Castaldo, R., D’Auria, L., Pepe, A., Pepe, S., Sagiya, T., Solaro, G., and Tizzani, P.: Geodetic imaging of the magma ascent process during the 2021 Cumbre Vieja (La Palma, Canary Islands) eruption, EGU General Assembly 2022, Vienna, Austria, 23–27 May 2022, EGU22-4876, https://doi.org/10.5194/egusphere-egu22-4876, 2022.
Please decide on your access
Please use the buttons below to download the presentation materials or to visit the external website where the presentation is linked. Regarding the external link, please note that Copernicus Meetings cannot accept any liability for the content and the website you will visit.
Forward to presentation link
You are going to open an external link to the presentation as indicated by the authors. Copernicus Meetings cannot accept any liability for the content and the website you will visit.
We are sorry, but presentations are only available for users who registered for the conference. Thank you.
EGU22-5431 | Presentations | GI6.3
Modeling Potential Impacts of Gas Exploitation on the Israeli Marine Ecosystem Using Ecopath with EcosimElla Lahav, Peleg Astrahan, Eyal Ofir, Gideon Gal, and Revital Bookman
Exploration, production, extraction and transport of fossil fuels in the marine environment are accompanied by an inherent risk to the surrounding ecosystems as a result of the on-going operations or due to technical faults, accidents or geo-hazards. Limited work has been conducted on potential impacts on the Mediterranean marine ecosystem due to the lack of information on organism responses to hydrocarbon pollution. In this study, we used the Ecopath with Ecosim (EwE) modeling software which is designed for policy evaluation and provides assessments of impacts of various stressors on an ecosystem. An existing EwE based Ecospace food-web model of the Israeli Exclusive Economic Zone (EEZ) was enhanced to include local organism response curves to various levels of contaminants, such as crude oil, in the water and on the sea floor sediments. The goal of this study is to evaluate and quantify the possible ecological impacts of pollution events that might occur due to fossil fuel exploitation related activities. Multiple spatial static and dynamic scenarios, describing various pollution quantities and a range of habitats and locations were constructed. Using the enhanced Ecospace models for assessing the potential impacts of gas exploitation on organism biomass, the spatial and temporal distribution and food-web functioning was tested and evaluated. The results of this study will show a quantitative assessment of the expected ecological impacts that could assist decision makers in developing management and conservation strategies.
How to cite: Lahav, E., Astrahan, P., Ofir, E., Gal, G., and Bookman, R.: Modeling Potential Impacts of Gas Exploitation on the Israeli Marine Ecosystem Using Ecopath with Ecosim, EGU General Assembly 2022, Vienna, Austria, 23–27 May 2022, EGU22-5431, https://doi.org/10.5194/egusphere-egu22-5431, 2022.
EGU22-5618 | Presentations | GI6.3
Slope stability monitoring system via three-dimensional simulations of rockfalls in Ischia island, Southern ItalyAda De Matteo, Massimiliano Alvioli, Antonello Bonfante, Maurizio Buonanno, Raffaele Castaldo, and Pietro Tizzani
Volcanoes are dynamically active systems in continuous evolution. This behaviour is emphasized by many different processes, e.g., fumarolic activity, earthquakes, volcanic slope instabilities and volcanic climax eruptions. Volcanic edifices experience slope instability as consequence of different solicitations such as i) eruption mechanism and depositional process, ii) tectonic stresses, iii) extreme weather conditions; all these events induce the mobilization of unstable fractured volcanic flanks.
Several methods exist to gather information about slope stability and to map trajectories followed by individual falling rocks in individual slopes. These methods involve direct field observation, laser scanning, terrestrial or aerial photogrammetry. Such information is useful to infer the likely location of future rockfalls, and represent a valuable input for the application of three-dimensional models for rockfall trajectories.
The Ischia island is volcano-tectonic horst that is a part of the Phlegrean Volcanic District, Southern Italy. It covers an area of about 46 km2 and it has experienced a remarkable ground uplift events due to a resurgence phenomenon. Slope instability is correlated both with earthquakes events and with volcanism phenomena. Specifically, evidences suggest that rockfalls occurred as an effect of the gravitational instability on the major scarps generated by the rapid resurgence, eased by the widespread rock fracturing.
We present results of an analysis relevant to the most probable individual masses trajectories of rockfall affecting the slopes of Ischia island. We first identified the prospective rockfall sources through an expert-mapping of source area in sample locations and statistical analysis on the whole island. Probabilistic sources are the main input of the three-dimensional rockfalls simulation software STONE.
The software assumes point-like masses falling under the sole action of gravity and the constraints of topography, and it calculates trajectories dominated by ballistic dynamics during falling, bouncing and rolling on the ground. Analysis of high-definition critical sector pictures, achieved by using UAV (Unmanned Aerial Vehicle) platform, will allow a detailed localization of source areas and an additional more robust simulations.
The procedure can be viewed as a multiscale analysis and allows besting allocating computational efforts and economic resources, focusing on a more detailed analysis on the slopes identified as the most risky ones during the first, large-scale analysis of the whole area.
How to cite: De Matteo, A., Alvioli, M., Bonfante, A., Buonanno, M., Castaldo, R., and Tizzani, P.: Slope stability monitoring system via three-dimensional simulations of rockfalls in Ischia island, Southern Italy, EGU General Assembly 2022, Vienna, Austria, 23–27 May 2022, EGU22-5618, https://doi.org/10.5194/egusphere-egu22-5618, 2022.
EGU22-6226 | Presentations | GI6.3
The framework for improving air quality monitoring over Indian citiesArindam Roy, Athanasios Nenes, and Satoshi Takahama
Indian air quality monitoring guideline is directly adopted from World Health Organization (1977) guidelines without place-based modification. According to Indian air quality guidelines (2003), the location of monitoring sites should be determined from air quality modeling and previous air quality information. If such information is not available, the use of emission densities, wind data, land-use patterns and population information is recommended for prioritizing areas for air quality monitoring. The mixed land-use distribution over Indian cities and randomly distributed sources pose serious challenges, as Indian cities (unlike in other parts of the world) are characterized by a lack of distinct residential, commercial, and industrial regions, so the concept of “homogeneous emissions” (which have guided site monitoring decisions) simply does not apply. In addition, the decision-making data emission and population information, are either not available or outdated for Indian cities. Unlike the cities in Global North, the Indian urban-scape has distinguished features in terms of land use, source and population distribution which has not been addressed in air quality guidelines.
We have developed an implementable place-based framework to address the above problem of establishing effective new air quality stations in India and other regions with complex land-use patterns. Four Indian million-plus cities were selected for the present study; Lucknow, Pune, Nashik and Kanpur. We broadly classified air quality monitoring objectives into three; monitoring population exposure, measurements for compliance with the national standards and characterization of sources. Each monitoring station over four cities was evaluated and metadata has been created for each station to identify its monitoring objective for each of the stations. We find that present air quality monitoring networks are highly inadequate in characterizing average population exposure throughout each city, as current stations are predominantly located at the site of pedestrian exposure, and are not representative of the city-wide exposure.
Possible new sites for monitoring were identified using night-time light data, satellite-derived PM2.5, existing emission inventories, land-use patterns and other ancillary open-sourced data. Over Lucknow, Pune and Nashik, setting up stations at highly populated areas is recommended to fulfill the knowledge gaps on the average population exposure. Over Kanpur, it was recommended to incorporate stations to measure short-term pollution exposure in traffic and industrial sites. Rapidly developing peri-urban regions were identified using night-time light data and recommendations were provided for setting up monitoring stations in these regions.
How to cite: Roy, A., Nenes, A., and Takahama, S.: The framework for improving air quality monitoring over Indian cities, EGU General Assembly 2022, Vienna, Austria, 23–27 May 2022, EGU22-6226, https://doi.org/10.5194/egusphere-egu22-6226, 2022.
Please decide on your access
Please use the buttons below to download the presentation materials or to visit the external website where the presentation is linked. Regarding the external link, please note that Copernicus Meetings cannot accept any liability for the content and the website you will visit.
Forward to presentation link
You are going to open an external link to the presentation as indicated by the authors. Copernicus Meetings cannot accept any liability for the content and the website you will visit.
We are sorry, but presentations are only available for users who registered for the conference. Thank you.
EGU22-6374 | Presentations | GI6.3
Geochemical monitoring of the Tenerife North-East and North West Rift Zones by means of diffuse degassing surveysLía Pitti Pimienta, Fátima Rodríguez, María Asensio-Ramos, Gladys Melián, Daniel Di Nardo, Alba Martín-Lorenzo, Mar Alonso, Rubén García-Hernández, Víctor Ortega, David Martínez Van Dorth, María Cordero, Tai Albertos, Pedro A. Hernández, and Nemesio M. Pérez
Tenerife (2,034 km2), the largest island of the Canarian archipelago, is characterized by three volcanic rifts NW-SE, NE-SW and N-S oriented, with a central volcanic structure in the middle, Las Cañadas Caldera, hosting Teide-Pico Viejo volcanic complex. The North-West Rift-Zone (NWRZ) is one of the youngest and most active volcanic systems of the island, where three historical eruptions (Boca Cangrejo in 16th Century, Arenas Negras in 1706 and Chinyero in 1909) have occurred, whereas the North-East Rift-Zone (NERZ) is more complex than the others due to the existence of Pedro Gil stratovolcano that broke the main NE-SW structure 0.8 Ma ago. The most recent eruptive activity along the NERZ took place during 1704 and 1705 across 13 km of fissural eruption in Siete Fuentes (Arafo-Fasnia). To monitor potential volcanic activity through a multidisciplinary approach, diffuse degassing studies have been carried out since 2000 at the NWRZ (72 km2) and since 2001 at the NERZ (210 km2) in a yearly basis. Long-term variations in the diffuse CO2 output in the NWRZ have shown a temporal correlation with the onsets of seismic activity at Tenerife, supporting unrest of the volcanic system, as is also suggested by anomalous seismic activity recorded in the studied area during April, 2004 and October, 2016 (Hernández et al., 2017). In-situ measurements of CO2 efflux from the surface environment were performed according to the accumulation chamber method using a portable non-dispersive infrared (NDIR) sensor. Soil CO2 efflux values for the 2021 survey ranged between non-detectable values and 104 g·m-2·d-1, with an average value of 8 g·m-2·d-1 for NWRZ. For NERZ, soil CO2 efflux values ranged between non-detectable values and 79 g·m2·d-1, with an average value of 7 g·m-2·d-1. The probability plot technique applied to the data allowed to distinguish different geochemical populations. Background population represented 49.2% and 74.0% of the total data for NWRZ and NERZ, respectively, with a mean value (1.7 - 2.0 g·m-2·d-1) similar to the background values calculated for other volcanic systems in the Canary Islands with similar soils, vegetation and climate (Hernández et al. 2017). Peak population represented 0.9 and 0.7% for NWRZ and NERZ, respectively and with a mean value of 45 and 57 g·m-2·d-1. Soil CO2 efflux contour maps were constructed to identify spatial-temporal anomalies and to quantify the total CO2 emission using the sequential Gaussian simulation (sGs) interpolation method. Diffuse emission rate of 506 ± 22 t·d-1 for NWRZ and 1,509 ± 58 t·d-1 NERZ were obtained. The normalized CO2 emission value by area was estimated in 7.03 t·d-1·km-1 for NWRZ and in 7.2 t·d-1·km-1 for NERZ. The monitorization of the diffuse CO2 emission contributes to detect early warning signals of volcanic unrest, especially in areas where visible degassing is non-existent as in the Tenerife NWRZ and NERZ.
Hernández et al. (2017). Bull Volcanol, 79:30, DOI 10.1007/s00445-017-1109-9.
How to cite: Pitti Pimienta, L., Rodríguez, F., Asensio-Ramos, M., Melián, G., Di Nardo, D., Martín-Lorenzo, A., Alonso, M., García-Hernández, R., Ortega, V., Martínez Van Dorth, D., Cordero, M., Albertos, T., Hernández, P. A., and Pérez, N. M.: Geochemical monitoring of the Tenerife North-East and North West Rift Zones by means of diffuse degassing surveys, EGU General Assembly 2022, Vienna, Austria, 23–27 May 2022, EGU22-6374, https://doi.org/10.5194/egusphere-egu22-6374, 2022.
Please decide on your access
Please use the buttons below to download the presentation materials or to visit the external website where the presentation is linked. Regarding the external link, please note that Copernicus Meetings cannot accept any liability for the content and the website you will visit.
Forward to presentation link
You are going to open an external link to the presentation as indicated by the authors. Copernicus Meetings cannot accept any liability for the content and the website you will visit.
We are sorry, but presentations are only available for users who registered for the conference. Thank you.
EGU22-6452 | Presentations | GI6.3
Numerical analysis of Seismic and Hydrobiological data around lake Mavrovo in the period Jul.2020-Nov.2021Cvetan Sinadinovski and Stoe Smiljkov
Two moderate earthquakes with magnitude ML5.0 happened on 11th of November 2020 near the Mavrovo lake in northwestern Macedonia. The lake is an artificial lake with a dam built between 1947 and filled by 1953. Its maximum length is 10km, width is 5km and the depth is 50m. Given its water volume, it is possible that geological factors causing earthquakes could also affect the hydrobiological characteristics of the flow system surrounding the lake.
A list of 180 earthquakes registered by the local stations with magnitudes equal or greater than ML1.7 was analysed in terms of temporal and spatial distribution around the lake. No specific clustering of events was noticed in the foreshock period from July 2020. In the aftershock period, the most numerous events lasted about a month after the main events. However, there was another period of increased seismicity during March 2021, followed by gradual decrease onwards. The distribution of epicentres was mainly along the terrain of Radika river and a few smaller tributaries to the lake system.
A comparative analysis was done with the dataset collected by the program run at the department of Biology at the Faculty of Natural Sciences, University UKIM in Skopje. Environmental investigations in Europe have shown stress reactions of hydrobionts in respect to water temperature and heavy metal pollution, for example the influence of radioactive radiation. Earthquake-induced seismic changes most often affect the chemical-physical properties of water quality and temperature stratification, i.e., mixing of water masses. In our research, we analyse for the first time the relationship between the seismological activities in the Jul 2020-Nov 2021 period in details and a possible impact to environment thru the population of macrozoobenthos from Mavrovo Lake.
How to cite: Sinadinovski, C. and Smiljkov, S.: Numerical analysis of Seismic and Hydrobiological data around lake Mavrovo in the period Jul.2020-Nov.2021, EGU General Assembly 2022, Vienna, Austria, 23–27 May 2022, EGU22-6452, https://doi.org/10.5194/egusphere-egu22-6452, 2022.
EGU22-6468 | Presentations | GI6.3
Measuring greenhouse gas fluxes – what methods do we have versus what methods do we need?David Bastviken, Julie Wilk, Nguyen Thanh Duc, Magnus Gålfalk, Martin Karlson, Tina Neset, Tomasz Opach, Alex Enrich Prast, and Ingrid Sundgren
Appropriate methods to measure greenhouse gas (GHG) fluxes are critical for our ability to detect fluxes, understand regulation, make adequate priorities for climate change mitigation efforts, and verify that these efforts are effective. Ideally, we need reliable, accessible, and affordable measurements at relevant scales. We surveyed present GHG flux measurement methods, identified from an analysis of >11000 scientific publications and a questionnaire to sector professionals and analysed method pros and cons versus needs for novel methodology. While existing methods are well-suited for addressing certain questions, this presentation presents fundamental limitations relative to GHG flux measurement needs for verifiable and transparent action to mitigate many types of emissions. Cost and non-academic accessibility are key aspects, along with fundamental measurement performance. These method limitations contribute to the difficulties in verifying GHG mitigation efforts for transparency and accountability under the Paris agreement. Resolving this mismatch between method capacity and societal needs is urgently needed for effective climate mitigation. This type of methodological mismatch is common but seems to get high priority in other knowledge domains. The obvious need to prioritize development of accurate diagnosis methods for effective treatments in healthcare is one example. This presentation provides guidance regarding the need to prioritize the development of novel GHG flux measurement methods.
How to cite: Bastviken, D., Wilk, J., Duc, N. T., Gålfalk, M., Karlson, M., Neset, T., Opach, T., Enrich Prast, A., and Sundgren, I.: Measuring greenhouse gas fluxes – what methods do we have versus what methods do we need?, EGU General Assembly 2022, Vienna, Austria, 23–27 May 2022, EGU22-6468, https://doi.org/10.5194/egusphere-egu22-6468, 2022.
EGU22-8458 | Presentations | GI6.3
Temporal evolution of dissolved gases in groundwater of Tenerife IslandCecilia Amonte, Nemesio M. Pérez, Gladys V. Melián, María Asensio-Ramos, Eleazar Padrón, Pedro A. Hernández, and Ana Meire Feijoo
The oceanic active volcanic island of Tenerife (2,034 km2) is the largest of the Canarian archipelago. There are more than 1,000 galleries (horizontal drillings) in the island, which are used for groundwater exploitation and allow reaching the aquifer at different depths and elevations. This work presents the first extensive study on the temporal variation of dissolved gases in groundwaters from Fuente del Valle and San Fernando galleries (Tenerife, Spain) since April 2016 to June 2020. This investigation is focused on the chemical and isotopic content of several dissolved gas species (CO2, He, O2, N2 and CH4) present in the groundwaters and its relationship with the seismic activity registered in the island. The results show CO2 as the major dissolved gas specie in the groundwater from both galleries presenting a mean value of 260 cm3STP·L-1 and 69 cm3STP·L-1 for Fuente del Valle and San Fernando, respectively. The average δ13C-CO2 data (-3.9‰ for Fuente del Valle and -6.4‰ for San Fernando) suggest a clear endogenous origin as result of interaction of them with deep-origin fluid. A bubbling gas sample from Fuente del Valle gallery was analysed, obtaining a CO2 rich gas (87 Vol.%) with a considerable He enrichment (7.3 ppm). The isotopic data of both components in the bubbling gas support the results obtained in the dissolved gases, showing an endogenous component that could be affected by the different activity of the hydrothermal system. During the study period, an important seismic swarm occurred on October 2, 2016, followed by an increase of the seismic activity in and around Tenerife. After this event, important geochemical variations were registered in the dissolved gas species, such as dissolved CO2 and He content and the CO2/O2, He/CO2, He/N2 and CH4/CO2 ratios. These findings suggest an injection of fluids into the hydrothermal system during October 2016, a fact that evidences the connection between the groundwaters and the hydrothermal system. The present work demonstrates the importance of dissolved gases studies in groundwater for volcanic surveillance.
How to cite: Amonte, C., Pérez, N. M., Melián, G. V., Asensio-Ramos, M., Padrón, E., Hernández, P. A., and Meire Feijoo, A.: Temporal evolution of dissolved gases in groundwater of Tenerife Island, EGU General Assembly 2022, Vienna, Austria, 23–27 May 2022, EGU22-8458, https://doi.org/10.5194/egusphere-egu22-8458, 2022.
EGU22-8580 | Presentations | GI6.3
Analysis of thermal regimes at Tenerife(Canary Islands) with Independent Component Analysis applied to time series of Remotely Sensed Land Surface TemperaturesDaniela Stroppiana, Monika Przeor, Luca D’Auria, and Pietro Tizzani
Land surface temperature (LST) is a manifestation of the surface thermal environment (LSTE) and an important driver of physical processes of surface land energy balance at local to global scales. Tenerife is one of the most heterogeneous islands among the Canaries from a climatological and bio-geographical point of view. We study the surface thermal conditions of the volcanic island with remote sensing techniques. In particular, we consider a time series of Landsat 8 (L8) level 2A images for the period 2013 to 2019 to estimate LST from surface reflectance (SR) and brightness Temperature (BT) images. A total of 26 L8 dates were selected based on cloud cover information from metadata (land cloud cover < 10%) to estimate pixel-level LST with an algorithm based on Radiative Transfer Equations (RTE). The algorithm relies on the Normalized Difference Vegetation Index (NDVI) for estimating emissivity pixel by pixel. We apply the Independent Component Analysis (ICA) that revealed to be a powerful tool for data mining and, in particular, to separate multivariate LST dataset into a finite number of components, which have the maximum relative statistical independence. The ICA allowed separating the land surface temperature time series of Tenerife into 11 components that can be associated with geographic and bioclimatic zones of the island. The first ten components are related to physical factors, the 11th component, on the contrary, presented a more complex pattern resulting possibly from its small amplitude and the combination of various factors into a single component. The signal components recognized with the ICA technique, especially in areas of active volcanism, could be the basis for the space-time monitoring of the endogenous component of the LST due to surface hydrothermal and/or geothermal activity. Results are encouraging, although the 16-day revisit frequency of Landsat reduces the frequency of observation that could be increased by applying techniques of data fusion of medium and coarse spatial resolution images. The use of such systems for automatic processing and analysis of thermal images may in the future be a fundamental tool for the surveillance of the background activity of active and dormant volcanoes worldwide.
How to cite: Stroppiana, D., Przeor, M., D’Auria, L., and Tizzani, P.: Analysis of thermal regimes at Tenerife(Canary Islands) with Independent Component Analysis applied to time series of Remotely Sensed Land Surface Temperatures, EGU General Assembly 2022, Vienna, Austria, 23–27 May 2022, EGU22-8580, https://doi.org/10.5194/egusphere-egu22-8580, 2022.
EGU22-9376 | Presentations | GI6.3
An IoT based approach to ultra high resolution air quality mapping thorigh field calibrated monitoring devicesSaverio De Vito, Grazia Fattoruso, and Domenico Toscano
Recent advances in IoT and chemical sensors calibration technologies have led to the proposal of Hierarchical air quality monitoring networks. They are indeed complex systems relying on sensing nodes which differs from size, cost, accuracy, technology, maintenance needs while having the potential to empower smart cities and communiities with increased knowledge on the highly spatiotemporal variance Air Quality phenomenon (see [1]). The AirHeritage project, funded by Urban Innovative Action program have developed and implemented a hierarchical monitoring system which allows for offering real time assessments and model based forecasting services including 7 fixed low cost sensors station, one (mobile and temporary located) regulatory grade analyzer and a citizen science based ultra high resolution AQ mapping tool based on field calibrated mobile analyzers. This work will analyze the preliminary results of the project by focusing on the machine learning driven sensors calibration methodology and citizen science based air quality mapping campaigns. Thirty chemical and particulate matter multisensory devices have been deployed in Portici, a 4Km2 city located 7 km south of Naples which is affected by significant car traffic. The devices have been entrusted to local citizens association for implementing 1 preliminary validation campaign (see [2]) and 3 opportunistic 2-months duration monitoring campaigns. Each 6 months, the devices undergoes a minimum 3 weeks colocation period with a regulatory grade analyzer allowing for training and validation dataset building. Multilinear regression sw components are trained to reach ppb level accuracy (MAE <10ug/m^3 for NO2 and O3, <15ug/M^3 for PM2.5 and PM10, <300ug/M^3 for CO) and encoded in a companion smartphone APP which allows the users for real time assessment of personal exposure. In particular, a novel AQI strongly based on European Air Quality Index ([3]) have been developed for AQ real time data communication. Data have been collected using a custom IoT device management platform entrusted with inception, storage and data-viz roles. Finally data have been used to build UHR (UHR) AQ maps, using spatial binning approach (25mx25m) and median computation for each bin receiving more than 30 measurements during the campaign. The resulting maps have hown the possibility to allow for pinpointing city AQ hotpots which will allows fact-based remediation policies in cities lacking objective technologies to locally assess concentration exposure.
[1] Nuria Castell et Al., Can commercial low-cost sensor platforms contribute to air quality monitoring and exposure estimates?, Environment International, Volume 99, 2017, Pages 293-302 ISSN 0160-4120, https://doi.org/10.1016/j.envint.2016.12.007.
[2] De Vito, S, et al., Crowdsensing IoT Architecture for Pervasive Air Quality and Exposome Monitoring: Design, Development, Calibration, and Long-Term Validation. Sensors 2021, 21, 5219. https://doi.org/10.3390/s21155219
[3] https://airindex.eea.europa.eu/Map/AQI/Viewer/
How to cite: De Vito, S., Fattoruso, G., and Toscano, D.: An IoT based approach to ultra high resolution air quality mapping thorigh field calibrated monitoring devices, EGU General Assembly 2022, Vienna, Austria, 23–27 May 2022, EGU22-9376, https://doi.org/10.5194/egusphere-egu22-9376, 2022.
Please decide on your access
Please use the buttons below to download the presentation materials or to visit the external website where the presentation is linked. Regarding the external link, please note that Copernicus Meetings cannot accept any liability for the content and the website you will visit.
Forward to presentation link
You are going to open an external link to the presentation as indicated by the authors. Copernicus Meetings cannot accept any liability for the content and the website you will visit.
We are sorry, but presentations are only available for users who registered for the conference. Thank you.
EGU22-10290 | Presentations | GI6.3
Soil gas Rn monitoring at Cumbre Vieja prior and during the 2021 eruption, La Palma, Canary IslandsDaniel Di Nardo, Eleazar Padrón, Claudia Rodríguez-Pérez, Germán D. Padilla, José Barrancos, Pedro A. Hernández, María Asensio-Ramos, and Nemesio M. Pérez
Cumbre Vieja volcano (La Palma, Canary Islands, Spain) suffered a volcanic eruption that started on September 19 and finished on December 13, 2021. The eruption is considered the longest volcanic event since data are available on the island: it finished after 85 days and 8 hours of duration and 1,219 hectares of lava flows. La Palma Island is the fifth in extension (706 km2) and the second in elevation (2,423 m a.s.l.) of the Canarian archipelago. Cumbre Vieja volcano, where the volcanic activity has taken place exclusively in the last 123 ka, forms the sand outhern part of the island. In 2017, two remarkable seismic swarms interrupted a seismic silence of 46 years in Cumbre Vieja volcano with earthquakes located beneath Cumbre Vieja volcano at depths ranging between 14 and 28 km with a maximum magnitude of 2.7. Five additional seismic swarms were registered in 2020 and four in 2021. The eruption started ~1 week after the start of the last seismic swarm.
As part of the INVOLCAN volcano monitoring program of Cumbre Vieja, soil gas radon (222Rn) and thoron (220Rn) is being monitored at five sites in Cumbre Vieja using SARAD RTM2010-2 RTM 1688-2 portable radon monitors. 222Rn and 220Rn are two radioactive isotopes of radon with a half-life of 3.8 days and 54.4 seconds, respectively. Both isotopes can diffuse easily trough the soil and can be detected at very low concentrations, but their migration in large scales, ten to hundreds of meters, is supported by advection (pressure changes) and is related to the existence of a carrier gas source (geothermal fluids or fluids linked to magmatic and metamorphic phenomena), and to the existence of preferential routes for degassing (deep faults). Previous results on the monitoring of soil Rn in the Canary Islands with volcano monitoring purposes are promising (Padilla et al, 2013).
The most remarkable result of the Rn monitoring network of Cumbre Vieja was observed in LPA01 station, located at the north-east of Cumbre Vieja. Since mid-March 2021, soil 222Rn activity experienced a sustained until reaching maximum values of ~1.0E+4 222Rn Bq/m3 days before the eruption onset. During the eruptive period, soil 222Rn activity showed a gradual decreasing trend. The increase of magmatic-gas pressure due to magma movement towards the surface and the transport of anomalous 222Rn originated from hydrofracturing of rock, from direct magma degassing or from both, is the most plausible explanation for the increases in radon activity before the eruption onset observed at LPA01. As soil gas radon activity increased prior to the eruption onset, this monitoring technique can be efficiently used as an initial warning sign of the pressurization of magma beneath La Palma Island.
Padilla, G. D., et al. (2013), Geochem. Geophys. Geosyst., 14, 432–447, doi:10.1029/2012GC004375.
How to cite: Di Nardo, D., Padrón, E., Rodríguez-Pérez, C., Padilla, G. D., Barrancos, J., Hernández, P. A., Asensio-Ramos, M., and Pérez, N. M.: Soil gas Rn monitoring at Cumbre Vieja prior and during the 2021 eruption, La Palma, Canary Islands, EGU General Assembly 2022, Vienna, Austria, 23–27 May 2022, EGU22-10290, https://doi.org/10.5194/egusphere-egu22-10290, 2022.
EGU22-10603 | Presentations | GI6.3 | Highlight
The "Campania Trasparente" multiscale and multimedia monitoring project: an unprecedented experience in Italy.Stefano Albanese, Annamaria Lima, Annalise Guarino, Chengkai Qu, Domenico Cicchella, Mauro Esposito, Pellegrino Cerino, Antonio Pizzolante, and Benedetto De Vivo
In 2015, the "Campania Trasparente" project (http://www.campaniatrasparente.it), a monitoring plan focused on assessing the environmental conditions of the territory of the Campania region, started thanks to the financial support of the regional government. The project's general management was in charge of the Experimental Zooprophylactic Institute of Southern Italy (IZSM).
In the project framework, the collection and analysis of many environmental and biological samples (including soil and air and human blood specimen) were completed. The primary aim of the whole project was to explore the existence of a link between the presence of some illnesses in the local population and the status of the environment and generate a reliable database to assess local foodstuff healthiness.
Six research units were active in the framework of the project. As for soil and air, the Environmental Geochemistry Working Group (EGWG) at the Department of Earth, Environment and Resources Sciences, University of Naples Federico II, was in charge of most of the research activities. Specifically, the EGWG completed the elaboration of the data on potentially toxic metals/metalloids (PTMs) and organic contaminants (PAHs, OCPs, Dioxins) in the regional soils and air.
The monitoring of air contaminants lasted more than one year, and it was completed employing passive air samplers (PAS) and deposimeters spread across the whole region.
Three volumes were published, including statistical elaborations and geochemical maps of all the contaminants analysed to provide both the regional government and local scientific and professional community with a reliable tool to approach local environmental problems starting from a sound base of knowledge.
Geochemical distribution patterns of potentially toxic elements (PTEs), for example, were used to establish local geochemical background/baseline intervals for those metals (naturally enriched in regional soils) found to systematically overcome the national environmental guidelines (set by the Legislative Decree 152/2006).
Data from the air, analysed in terms of concentration and time variation, were, instead, fundamental to discriminate the areas of the regional territory characterised by heavy contamination associated with the emission of organic compounds from anthropic sources.
The integration of all the data generated within the "Campania Trasparente" framework, including the data proceeding from the Susceptible Population Exposure Study (SPES), focusing on human biomonitoring (based on blood), allowed the development of a regional-wide conceptual model to be used as a base to generate highly specialised risk assessments for regional population and local communities affected by specific environmental problems.
How to cite: Albanese, S., Lima, A., Guarino, A., Qu, C., Cicchella, D., Esposito, M., Cerino, P., Pizzolante, A., and De Vivo, B.: The "Campania Trasparente" multiscale and multimedia monitoring project: an unprecedented experience in Italy., EGU General Assembly 2022, Vienna, Austria, 23–27 May 2022, EGU22-10603, https://doi.org/10.5194/egusphere-egu22-10603, 2022.
EGU22-10659 | Presentations | GI6.3
Long-term variations of diffuse CO2, He and H2 at the summit crater of Teide volcano, Tenerife, Canary Islands during 1999-2021Germán D. Padilla, Fátima Rodríguez, María Asensio-Ramos, Gladys V. Melián, Mar Alonso, Alba Martín-Lorenzo, Beverley C. Coldwell, Claudia Rodríguez, Jose M. Santana de León, Eleazar Padrón, José Barrancos, Luca D'Auria, Pedro A. Hernández, and Nemesio M. Pérez
Tenerife Island (2,034 km2) is the largest island of the Canarian archipelago. Its structure is controlled by a volcano-tectonic rift-system with NW, NE and NS directions, with the Teide-Pico Viejo volcanic system located in the intersection. Teide is 3,718 m.a.s.l. high and its last eruption occurred in 1798 through an adventive cone of Teide-Pico Viejo volcanic complex. Although Teide volcano shows a weak fumarolic system, volcanic gas emissions observed in the summit cone consist mostly of diffuse CO2 degassing.
In this study we investigate the Teide-Pico Viejo volcanic system evolution using a comprehensive diffuse degassing geochemical dataset 216 geochemical surveys have been performed during the period 1999-2021 at the summit crater of Teide Volcano covering an area of 6,972 m2. Diffuse CO2 emission was estimated in 38 sampling sites, homogeneously distributed inside the crater, by means of a portable non dispersive infrared (NDIR) CO2 fluxmeter using the accumulation chamber method. Additionally, soil gases were sampled at 40 cm depth using a metallic probe with a 60 cc hypodermic syringe and stored in 10 cc glass vials and send to the laboratory to analyse the He and H2 content by means of quadrupole mass spectrometry and micro-gas chromatography, respectively. To estimate the He and H2 emission rates at each sampling point, the diffusive component was estimated following the Fick’s law and the convective emission component model was estimated following the Darcy’s law. In all cases, spatial distribution maps were constructed averaging the results of 100 simulations following the sequential Gaussian simulation (sGs) algorithm, in order to estimate CO2, He and H2 emission rates.
During 22 years of the studied period, CO2 emissions ranged from 2.0 to 345.9 t/d, He emissions between 0.013 and 4.5 kg/d and H2 between 1.3 and 64.4 kg/d. On October 2, 2016, a seismic swarm of long-period events was recorded on Tenerife followed by an increase of the seismic activity in and around the island (D’Auria et al., 2019; Padrón et al., 2021). Several geochemical parameters showed significant changes during ∼June–August of 2016 and 1–2 months before the occurrence of the October 2, 2016, long-period seismic swarm (Padrón et al., 2021). Diffuse degassing studies as useful to conclude that the origin of the 2 October 2016 seismic swarm an input of magmatic fluids triggered by an injection of fresh magma and convective mixing. Thenceforth, relatively high values have been obtained in the three soil gases species studied at the crater of Teide, with the maximum emission rates values registered during 2021. This increase reflects a process of pressurization of the volcanic-hydrothermal system. This increment in CO2, He and H2 emissions indicate changes in the activity of the system and can be useful to understand the behaviour of the volcanic system and to forecast future volcanic activity. Monitoring the diffuse degassing rates has demonstrated to be an essential tool for the prediction of future seismic–volcanic unrest, and has become important to reduce volcanic risk in Tenerife.
D'Auria, L., et al. (2019). J. Geophys. Res.124,8739-8752
Padrón, E., et al., (2021). J. Geophys. Res.126,e2020JB020318
How to cite: Padilla, G. D., Rodríguez, F., Asensio-Ramos, M., Melián, G. V., Alonso, M., Martín-Lorenzo, A., Coldwell, B. C., Rodríguez, C., Santana de León, J. M., Padrón, E., Barrancos, J., D'Auria, L., Hernández, P. A., and Pérez, N. M.: Long-term variations of diffuse CO2, He and H2 at the summit crater of Teide volcano, Tenerife, Canary Islands during 1999-2021, EGU General Assembly 2022, Vienna, Austria, 23–27 May 2022, EGU22-10659, https://doi.org/10.5194/egusphere-egu22-10659, 2022.
EGU22-11493 | Presentations | GI6.3
Analysis and Modelling of 2009-2013 Unrest Episodes at Campi Flegrei CalderaRaffaele Castaldo, Giuseppe Solaro, and Pietro Tizzani
Geodetic modelling is a valuable tool to infer volume and geometry of volcanic source system; it represents a key procedure for detecting and characterizing unrest and eruption episodes. In this study, we analyse the 2009–2013 uplift phenomenon at Campi Flegrei (CF) caldera in terms of spatial and temporal variations of the stress/strain field due to the effect of the retrieved inflating source. We start by performing a 3D stationary finite element (FE) modelling of geodetic datasets to retrieve the geometry and location of the deformation source. The geometry of FE domain takes into account both the topography and the bathymetry of the whole caldera. For what concern the definition of domain elastic parameters, we take into account the Vp/Vs distribution from seismic tomography. We optimize our model parameters by exploiting two different geodetic datasets: the GPS data and DInSAR measurements. The modelling results suggest that the best-fit source is a three-axis oblate spheroid ~3 km deep, similar to a sill-like body. Furthermore, in order to verify the reliability of the geometry model results, we calculate the Total Horizontal Derivative (THD) of the vertical velocity component and compare it with those performed with the DInSAR measurements. Subsequently, starting from the same FE modelling domain, we explore a 3D time-dependent FE model, comparing the spatial and temporal distribution of the shear stress and volumetric strain with the seismic swarms beneath the caldera. Finally, We found that low values of shear stress are observed corresponding with the shallow hydrothermal system where low-magnitude earthquakes occur, whereas high values of shear stress are found at depths of about 3 km, where high-magnitude earthquakes nucleate.
How to cite: Castaldo, R., Solaro, G., and Tizzani, P.: Analysis and Modelling of 2009-2013 Unrest Episodes at Campi Flegrei Caldera, EGU General Assembly 2022, Vienna, Austria, 23–27 May 2022, EGU22-11493, https://doi.org/10.5194/egusphere-egu22-11493, 2022.
EGU22-11874 | Presentations | GI6.3
Time evolution of Land Surface Temperature (LST) in active volcanic areas detected via integration of satellite and ground-based measurements: the Campi Flegrei caldera (Southern Italy) case study.Andrea Barone, Daniela Stroppiana, Raffaele Castaldo, Stefano Caliro, Giovanni Chiodini, Luca D'Auria, Gianluca Gola, Ferdinando Parisi, Susi Pepe, Giuseppe Solaro, and Pietro Tizzani
Thermal features of environmental systems are increasingly investigated after the development of remote sensing technologies; the increasing availability of Earth Observation (EO) missions allows the retrieval of the Land Surface Temperature (LST) parameter, which is widely used for a large variety of applications (Galve et al., 2018). In volcanic environment, the LST is an indicator of the spatial distribution of thermal anomalies at the ground surface, supporting designed tools for monitoring purposes (Caputo et al., 2019); therefore, LST can be used to understand endogenous processes and to model thermal sources.
In this framework, we present the results of activities carried out in the FLUIDs PRIN project, which aims at the characterization and modeling of fluids migration at different scales (https://www.prinfluids.it/). We propose a multi-scale analysis of thermal data at Campi Flegrei caldera (CFc); this area is well known for hosting thermal processes related to both magmatic and hydrothermal systems (Chiodini et al., 2015; Castaldo et al., 2021). Accordingly, data collected at different scales are suitable to search out local thermal trends with respect to regional ones. In particular, in this work we compare LST estimated from Landsat satellite images covering the entire volcanic area and ground measurements nearby the Solfatara crater.
Firstly, we exploit Landsat data to derive time series of LST by applying an algorithm based on Radiative Transfer Equations (RTE) (Qin et al., 2001; Jimenez-Munoz et al., 2014). The algorithm exploits both thermal infrared (TIR) and visible/near infrared (VIS/NIR) bands of different Landsat missions in the period 2000-2021; we used time series imagery from Landsat 5 (L5), Landsat 7 (L7) and Landsat 8 (L8) satellite missions to retrieve the thermal patterns of the CFc area with spatial resolutions of 30 m for VIS/NIR bands and 60 m to 120 m for TIR bands. Theoretical frequency of acquisition of the Landsat missions is 16 days that is reduced over the study area by cloud cover: Landsat images with high cloud cover were in fact discarded from the time series.
In particular, we process both the daily acquisitions as well nighttime data to provide thermal features at the ground surface in the absence of solar radiation. To emphasize the thermal anomalies of endogenous phenomena, the retrieved LST time-series are corrected following these steps: (i) removal of spatial and temporal outliers; (ii) correction for adiabatic gradient of the air with the altitude; (iii) detection and removal of the seasonal component.
Regarding to the ground-based acquisitions, we consider the data collected by the Osservatorio Vesuviano, National Institute of Geophysics and Volcanology (OV- INGV, Italy, Naples); the dataset consists of 151 thermal measurements distributed within the 2004-2021 time-interval and acquired inside the Solfatara and Pisciarelli areas at a depth of 0.01 m below the ground surface. Similarly, we process this dataset following corrections (i) and (iii).
Finally, we compare the temporal evolution of thermal patterns retrieved by the satellite and ground-based measurements, highlighting the supporting information provided by LST and its integration with data at ground.
How to cite: Barone, A., Stroppiana, D., Castaldo, R., Caliro, S., Chiodini, G., D'Auria, L., Gola, G., Parisi, F., Pepe, S., Solaro, G., and Tizzani, P.: Time evolution of Land Surface Temperature (LST) in active volcanic areas detected via integration of satellite and ground-based measurements: the Campi Flegrei caldera (Southern Italy) case study., EGU General Assembly 2022, Vienna, Austria, 23–27 May 2022, EGU22-11874, https://doi.org/10.5194/egusphere-egu22-11874, 2022.
EGU22-11990 | Presentations | GI6.3
Integrating geophysical, geochemical, petrological and geological data for the thermal and rheological characterization of unconventional geothermal fields: the case study of Long Valley CalderaGianluca Gola, Andrea Barone, Raffaele Castaldo, Giovanni Chiodini, Luca D'Auria, Rubén García-Hernández, Susi Pepe, Giuseppe Solaro, and Pietro Tizzani
We propose a novel multidisciplinary approach to image the thermo-rheological stratification beneath active volcanic areas, such as Long Valley Caldera (LVC), which hosts a magmatic-hydrothermal system. Geothermal facilities near the Casa Diablo locality supply 40 MWe from three binary power plants, exploiting about 850 kg s−1 of 160–180 °C water that circulates within the volcanic sediments 200 to 350 meters deep. We performed a thermal fluid dynamic model via optimization procedure of the thermal conditions of the crust. We characterize the topology of the hot magmatic bodies and the hot fluid circulation (the permeable fault-zones), using both a novel imaging of the a and b parameters of the Gutenberg-Richter law and an innovative procedure analysis of P-wave tomographic models. The optimization procedure provides the permeability of a reservoir (5.0 × 10⁻¹⁴ m2) and of the fault-zone (5.0 · 10−14 – 1.0 × 10⁻¹³ m2), as well as the temperature of the magma body (750–800°C). The imaging of the rheological properties of the crust indicates that the brittle/ductile transition occurs about 5 km b.s.l. depth, beneath the resurgent dome. There are again deeper brittle conditions about 15 km b.s.l., agreeing with the previous observations. The comparison between the conductive and the conductive-convective heat transfer models highlights that the deeper fluid circulation efficiently cools the volumes above the magmatic body, transferring the heat to the shallow geothermal system. This process has a significant impact on the rheological properties of the upper crust as the migration of the B/D transition. Our findings show an active magmatic system (6–10 km deep) and confirm that LVC is a long-life silicic caldera system. Furthermore, the occurrence of deep-seated, super-hot geothermal resources 4.5 – 5.0 km deep, possibly in supercritical conditions, cannot be ruled out.
How to cite: Gola, G., Barone, A., Castaldo, R., Chiodini, G., D'Auria, L., García-Hernández, R., Pepe, S., Solaro, G., and Tizzani, P.: Integrating geophysical, geochemical, petrological and geological data for the thermal and rheological characterization of unconventional geothermal fields: the case study of Long Valley Caldera, EGU General Assembly 2022, Vienna, Austria, 23–27 May 2022, EGU22-11990, https://doi.org/10.5194/egusphere-egu22-11990, 2022.
EGU22-12331 | Presentations | GI6.3 | Highlight
The evaluation of soil organic carbon through VIS-NIR spectroscopy to support the soil health monitoringHaitham Ezzy, Anna Brook, Claudio Ciavatta, Francesca Ventura, Marco Vignudelli, and Antonello Bonfante
Increasing the organic matter content of the soil has been presented in the:”4per1000″ proposal as a significant climate mitigation measure able to support the achievement of Sustainable Development Goal 13 - Climate Action of United Nations.
At the same time, the report of the Mission Board for Soil health and Food, "Caring for soil is caring for life," indicates that one of the targets that must be reached by 2030 is the conservation and increase of soil organic carbon stock. De facto, the panel clearly indicates the soil organic carbon as one of the indicators that can be used to monitor soil health, and at the same time, if the current soil use is sustainable or not.
Thus it is to be expected that the monitoring of SOC will become requested to check and monitor the sustainability of agricultural practices realized in the agricultural areas. For all the above reasons, the development of a reliable and fast indirect methods to evaluate the SOC is necessary to support different stakeholders (government, municipality, farmer) to monitor SOC at different spatial scales (national, regional, local).
Over the past two decades, data mining approaches in spatial modeling of soil organic carbon using machine learning techniques and artificial neural network (ANN) to investigate the amount of carbon in the soil using remote sensing data has been widely considered. Accordingly, this study aims to design an accurate and robust neural network model to estimate the soil organic carbon using the data-based field-portable spectrometer and laboratory-based visible and near-infrared (VIS/NIR, 350−2500 nm) spectroscopy of soils. The measurements will be on two sets of the same soil samples, the first by the standard protocol of requested laboratories for soil scanning, The second set of the soil samples without any cultivation to simulate the soil condition in the sampling field emphasizes the predictive capabilities to achieve fast, cheap and accurate soil status. Carbon soil parameter will determine using, multivariate regression method used for prediction with Least absolute shrinkage and selection operator regression (Lasso) in interval way (high, medium, and low). The results will increase accuracy, precision, and cost-effectiveness over traditional ex-situ methods.
The contribution has been realized within the international EIT Food project MOSOM (Mapping of Soil Organic Matter; https://www.eitfood.eu/projects/mosom)
How to cite: Ezzy, H., Brook, A., Ciavatta, C., Ventura, F., Vignudelli, M., and Bonfante, A.: The evaluation of soil organic carbon through VIS-NIR spectroscopy to support the soil health monitoring, EGU General Assembly 2022, Vienna, Austria, 23–27 May 2022, EGU22-12331, https://doi.org/10.5194/egusphere-egu22-12331, 2022.
EGU22-12364 | Presentations | GI6.3
Stromboli Volcano observations through the Airborne X-band Interferometric SAR (AXIS) systemPaolo Berardino, Antonio Natale, Carmen Esposito, Gianfranco Palmese, Riccardo Lanari, and Stefano Perna
Synthetic Aperture Radar (SAR) represents nowadays a well-established tool for day and night and all-weather microwave Earth Oobservation (EO) [1]. In last decades, a number of procedures EO techniques based on SAR data have been indeed devised developed for investigating several natural and anthropic phenomena the monitoring of affecting our planet. Among these, SAR Interferometry (InSAR) and Differential SAR Interferometry (DInSAR) undoubtedly represent a powerful techniques to characterize the deformation processes associated to several natural phenomena, such as eEarthquakes, landslides, subsidences andor volcanic unrest events [2] - [4].
In particular, such techniques can benefit of the operational flexibility offered by airborne SAR systems, which allow us to frequently monitor fast-evolving phenomena, timely reach the region of interest in case of emergency, and observe the same scene under arbitrary flight tracks.
In this work, we present the results relevant to multiple radar surveys carried out over the Stromboli Island, in Italy, through the Italian Airborne X-band Interferometric SAR (AXIS) system. The latter is based on the Frequency Modulated Continuous Wave (FMCW) technology, and is equipped with a three-antenna single-pass interferometric layout [5].
The considered dataset has been collected during three different acquisition campaigns, carried out from July 2019 to June 2021, and consists of radar data acquired along four flight directions (SW-NE, NW-SE, NE-SW, SE-NW), as to describe flight circuits around the island and to illuminate the Stromboli volcano under different points of view.
References
[1] Moreira, P. Prats-Iraola, M. Younis, G. Krieger, I. Hajnsek, K. P. Papathanassiou, “A tutorial on Synthetic Aperture Radar”, IEEE Geoscience and Remote Sensing Magazine, pp. 6-43, March 2013.
[2] Bamler, R., Hartl, P., 1998. Synthetic Aperture Radar Interferometry. Inverse problems, 14(4), R1.
[3] P. Berardino, G. Fornaro, R. Lanari and E. Sansosti, “A new algorithm for surface deformation monitoring based on small baseline differential SAR interferograms”, IEEE Trans. Geosci. Remote Sens., vol. 40, no. 11, pp. 2375-2383, Nov. 2002.
[4] R. Lanari, M. Bonano, F. Casu, C. De Luca, M. Manunta, M. Manzo, G. Onorato, I. Zinno, “Automatic Generation of Sentinel-1 Continental Scale DInSAR Deformation Time Series through an Extended P-SBAS Processing Pipeline in a Cloud Computing Environment”, Remote Sensing, 2020, 12, 2961.
[5] C. Esposito, A. Natale, G. Palmese, P. Berardino, R. Lanari, S. Perna, “On the Capabilities of the Italian Airborne FMCW AXIS InSAR System”, Remote Sens. 2020, 12, 539.
How to cite: Berardino, P., Natale, A., Esposito, C., Palmese, G., Lanari, R., and Perna, S.: Stromboli Volcano observations through the Airborne X-band Interferometric SAR (AXIS) system, EGU General Assembly 2022, Vienna, Austria, 23–27 May 2022, EGU22-12364, https://doi.org/10.5194/egusphere-egu22-12364, 2022.
EGU22-12927 | Presentations | GI6.3 | Highlight
FRA.SI.project - AN INTEGRATED MULTI-SCALE METHODOLOGIES FOR THE ZONATION OF LANDSLIDE-INDUCED HAZARD IN ITALYPietro Tizzani, Paola Reichenbach, Federica Fiorucci, Massimiliano Alvioli, Massimiliano Moscatelli, and Antonello Bonfante and the Fra.Si. Team
Fra. Si. a national research project supported by the Ministry of the Environment and Land and Sea Protection, develops a coherent set of multiscale methodologies for the assessment and zoning of earthquake-induced landslide hazards. To achieve the goal, the project operates at different geographical, temporal, and organizational scales, and in different geological, geomorphological, and seismic-tectonic contexts. Given the complexity, variability, and extent of earthquake-induced landslides in Italy, operating at multiple scales allows you to (a) maximize the use of available data and information; (b) propose methodologies and experiment with models that operate at different scales and in different contexts, exploiting their peculiarities at the most congenial scales and coherently exporting the results at different scales; and (c) obtain results at scales of interest for different users.
The project defines a univocal and coherent methodological framework for the assessment and zoning of earthquake-induced landslide hazard, integrating existing information and data on earthquake-induced landslide in Italy, available to proponents, available in technical literature and from "open" sources - in favor of the cost-effectiveness of the proposal. The integration exploits a coherent set of modeling tools, expert (heuristic) and numerical (statistical and probabilistic, physically-based, FEM, optimization models). The methodology considers the problem at multiple scales, including: (a) three geographic scales - the national synoptic scale, the regional mesoscale and the local scale; (b) two time scales - the pre-event scale typical of territorial planning and the deferred time of civil protection, and the post-event scale, characteristic of real civil protection time; and (c) different organizational and management scales - from spatial planning and soil defense, including post-seismic reconstruction, to civil protection rapid response. Furthermore, the methodology considers the characteristics of the seismic-induced landslide and the associated hazard in the main geological, geomorphological and seismic-tectonic contexts in Italy.
The project develops methodologies and products for different users and/or users. The former concern methodologies for (i) the synoptic zoning of the hazard caused by earthquake-induced landslides in Italy; (ii) the zoning and quantification of the danger from earthquake-induced landslides on a regional scale; (iii) the quantification of the danger of single deep landslides in the seismic phase; and for (iv) the identification and geological-technical modeling of deep co-seismic landslides starting from advanced DInSAR analyzes from post-seismic satellites.
How to cite: Tizzani, P., Reichenbach, P., Fiorucci, F., Alvioli, M., Moscatelli, M., and Bonfante, A. and the Fra.Si. Team: FRA.SI.project - AN INTEGRATED MULTI-SCALE METHODOLOGIES FOR THE ZONATION OF LANDSLIDE-INDUCED HAZARD IN ITALY, EGU General Assembly 2022, Vienna, Austria, 23–27 May 2022, EGU22-12927, https://doi.org/10.5194/egusphere-egu22-12927, 2022.
EGU22-4659 | Presentations | GI6.4
The effect of space weather, proxy parameters of solar activity, and stratospheric phenomena on the concentration of cosmogenic radionuclide 7Be (in the Czech Republic)Kateřina Podolská, Michal Kozubek, Miroslav Hýža, and Tereza Šindelářová
Cosmogenic radionuclides concentrations are predominantly determined by the solar activity and space weather around the Earth, forming an important source of cosmic-origin background radiation in the terrestrial environment. The highest values of such radiation are observed during the solar minima because the penetrability of the Earth’s magnetosphere is greatest at that time. Beryllium 7Be binds to aerosols and is transported within a few years to the Earth’s surface. Its concentrations are higher during the spring and summer months when the stratospheric 7Be penetrates the troposphere as a result of the exchange of air masses between the troposphere and stratosphere. We compare periods of strong solar and geomagnetic storms with periods of very low solar activity in the longitudinal view during the years 1986 – 2020.
For a better understanding of the process dynamics, in our work we investigate the coupling of concentrations of the cosmogenic radionuclide 7Be (time series of activity concentration of 7Be in aerosols) to space weather parameters around the Earth (Kp planetary index, disturbance storm time Dst, proton density, proton flux), proxy parameters of the solar activity (intensity of solar radio flux, relative sunspot number), stratospheric dynamics parameters (temperature, zonal component of wind, O3), and aggregates of strong atmospheric frontal transition. The beryllium radionuclide 7Be concentration was evaluated by the corresponding activity in aerosols on a weekly basis at the National Radiation Protection Institute Monitoring Section in Prague.
We also perform the case study of cosmogenic radionuclide 7Be concentrations during the period of strong solar and geomagnetic storm in November 2021 with the ERA5 reanalysis data, and Aeolus satellite lidar wind measurements.
How to cite: Podolská, K., Kozubek, M., Hýža, M., and Šindelářová, T.: The effect of space weather, proxy parameters of solar activity, and stratospheric phenomena on the concentration of cosmogenic radionuclide 7Be (in the Czech Republic), EGU General Assembly 2022, Vienna, Austria, 23–27 May 2022, EGU22-4659, https://doi.org/10.5194/egusphere-egu22-4659, 2022.
EGU22-5539 | Presentations | GI6.4
Measurements of cosmic rays by a mini neutron monitor aboard the German research vessel Polarstern.Bernd Heber, Sasa Banjac, Sönke Burmeister, Martin Zoska, Hanna Giese, Konstantin Herbst, Lisa Romaneehsen, Carolin Schwerdt, Dutoit Stauss, Carsten Wallmann, Adrian Vogt, and Michael Walter
Galactic cosmic rays (GCRs) consist of energetic electrons and nuclei which are a direct sample of material from far beyond the solar system. Measurements by various particle detectors have shown that the intensity varies on different timescales, caused by the Sun’s activity and geomagnetic variation. Interplanetary disturbances cause space weather effects which warrant a more detailed study. Many studies on GCR intensity decreases is based on the analysis of ground-based neutron monitors and muon telescopes. Their measurements depend on the geomagnetic position, and the processes in the Earth's atmosphere. In order to get a better understanding of the geomagnetic filter over the solar cycle, the Christian-Albrechts-Universität zu Kiel, DESY Zeuthen, and the North-West University in Potchefstroom, South Africa agreed on a regular monitoring of the GCR intensity as a function of latitude, by installing a portable device aboard the German research vessel Polarstern in 2012. The vessel is ideally suited for this research campaign because it covers extensive geomagnetic latitudes (i.e. goes from the Arctic to the Antarctic) at least once per year. Here we present the measurements for different latitude surveys including the periods of solar maximum in 2014 and solar minimum in 2019.
The Kiel team received funding from the European Union’s Horizon 2020 research and innovation programme under grant agreement No 870405. The team would like to thank the crew of the Polarstern and the AWI for supporting our research campaign.
How to cite: Heber, B., Banjac, S., Burmeister, S., Zoska, M., Giese, H., Herbst, K., Romaneehsen, L., Schwerdt, C., Stauss, D., Wallmann, C., Vogt, A., and Walter, M.: Measurements of cosmic rays by a mini neutron monitor aboard the German research vessel Polarstern., EGU General Assembly 2022, Vienna, Austria, 23–27 May 2022, EGU22-5539, https://doi.org/10.5194/egusphere-egu22-5539, 2022.
EGU22-6238 | Presentations | GI6.4 | Highlight
Challenges and solutions for cosmic-ray neutron sensing in heterogeneous soil moisture situations related to irrigation practicesCosimo Brogi, Heye Reemt Bogena, Markus Köhli, Harrie-Jan Hendricks Franssen, Olga Dombrowski, Vassilios Pisinaras, Anna Chatzi, Kostantinos Babakos, Jannis Jakobi, Patrizia Ney, and Andreas Panagopoulos
Water availability is a key challenge in agriculture, especially given the expected increase of droughts related to climate change. Soil moisture (SM) sensors can be used to collect information on water availability in a reliable and accurate way. However, due to their very small measuring volume, the installation of multiple sensors is required. In addition, in-situ sensors may need to be removed during field management and connecting cables are often damaged by rodents and other wilderness animals. Hence, the demand for SM sensors that do not have such limitations will increase in the upcoming years. A promising non-invasive technique to monitor SM is cosmic-ray neutron sensing (CRNS), which is based on the negative correlation between fast neutrons originating from cosmic radiation and SM content. With its large measuring footprint of ~130-210m, CRNS can efficiently cover the field-scale. However, heterogeneous agricultural management (e.g., irrigation) can lead to abrupt SM differences, which pose a challenge for the analysis of CRNS data. Here, we investigate the effects of small-scale soil moisture patterns on the CRNS signal by using both modelling approaches and field studies. The neutron transport model URANOS was used to simulate the neutron signal of a CRNS station located in irrigated plots of different sizes (from 1 to 8 ha) with different soil moisture (from 5 and 50 Vol.%) inside and outside such a plot. A total of 400 different scenarios were simulated and the response functions of multiple detector types were further considered. In addition, two CRNS with Gadolinium shielding were installed in two irrigated apple orchards of ~1.2 ha located in the Pinios Hydrologic Observatory (Greece) in the context of the H2020 ATLAS project. Reference soil moisture was determined using 25 SoilNet stations, each with 6 SM sensors installed in pairs at 5, 20 and 50 cm depth and water potential sensors at 20 cm depth. The orchards were also equipped with two Atmos41 climate stations and eight water meters for irrigation monitoring. The CRNS were calibrated using either soil samples or the SM measured by the SoilNet network. In the URANOS simulations, the percentage of neutrons detected by the CRNS that are representative of an irrigated plot varied between 45 and 90% and was strongly influenced by both the dimension and SM of the irrigated plot. As expected, the CRNS footprint decreased considerably with increasing SM but did not appear to be influenced by the plot dimension. SM variation within the irrigated plot strongly affected the neutron energy at detection, which was not the case for SM variations outside the plot. The instrumented fields corroborated the URANOS findings and the performance of the local CRNS was dependent on a) the timing and intensity of irrigation and precipitation, b) the CRNS calibration strategy, and c) the management of the surrounding fields. These results provide novel and meaningful information on the impact of horizontal SM patterns on CRNS measurements, which will help to make CRNS more useful in irrigated agriculture.
How to cite: Brogi, C., Bogena, H. R., Köhli, M., Hendricks Franssen, H.-J., Dombrowski, O., Pisinaras, V., Chatzi, A., Babakos, K., Jakobi, J., Ney, P., and Panagopoulos, A.: Challenges and solutions for cosmic-ray neutron sensing in heterogeneous soil moisture situations related to irrigation practices, EGU General Assembly 2022, Vienna, Austria, 23–27 May 2022, EGU22-6238, https://doi.org/10.5194/egusphere-egu22-6238, 2022.
Please decide on your access
Please use the buttons below to download the presentation materials or to visit the external website where the presentation is linked. Regarding the external link, please note that Copernicus Meetings cannot accept any liability for the content and the website you will visit.
Forward to presentation link
You are going to open an external link to the presentation as indicated by the authors. Copernicus Meetings cannot accept any liability for the content and the website you will visit.
We are sorry, but presentations are only available for users who registered for the conference. Thank you.
EGU22-6430 | Presentations | GI6.4
Utilizing Cosmic Ray data as input for neutron-based soil moisture measurementHanna Giese, Bernd Heber, Konstantin Herbst, and Martin Schrön
Neutrons on Earth interact with the soil and are substantially moderated by hydrogen atoms. Since the reflected neutron flux is a function of the soil water content, cosmic-ray neutron measurements above the ground can be used to estimate the average field soil moisture. Thus, if the local incoming neutron flux and the abundance of nearby hydrogen pools are known, the reflected neutron flux could be modeled and compared to observed detector count rates. However, the incoming neutrons are secondaries produced by interacting energetic Galactic Cosmic Rays (GCRs) in the atmosphere. The total neutron flux on the ground depends on the solar modulation-dependent GCR flux, the geomagnetic position, and the altitude within the atmosphere. So far, measurements of either the Jungfraujoch neutron monitor (NM) or a NM of similar cutoff rigidity have been used and altered to estimate the neutron flux at the position of each neutron detector. In this contribution we present a new method based on the Dorman function to directly compute the local neutron flux using remote neutron monitor data.
We received funding from the European Union’s Horizon 2020 research and innovation programme under grant agreement No. 870405
How to cite: Giese, H., Heber, B., Herbst, K., and Schrön, M.: Utilizing Cosmic Ray data as input for neutron-based soil moisture measurement, EGU General Assembly 2022, Vienna, Austria, 23–27 May 2022, EGU22-6430, https://doi.org/10.5194/egusphere-egu22-6430, 2022.
EGU22-8872 | Presentations | GI6.4
Relationship between the time series of cosmic ray data and aerosol optical properties: (Case study: southern Italy, 2016-2020)Faezeh Karimian Sarakhs, Fabio Madonna, Marco Rosoldi, and Salvatore De Pasquale
Abstract
High energy Cosmic Ray (CR) particles are capable of ionizing the Earth’s atmosphere, which leads to changes in the atmospheric physical and chemical properties. One of the most important effects of interactions between the CR particles and atmospheric molecules is the formation of aerosol and its subsequent condensation nuclei processes. These interactions are known with considerable uncertainty yet and may translate into even bigger uncertainties in future climate predictions. Laser Detection and Ranging (LIDAR) is currently the best suited technology to retrieve aerosol optical and microphysical properties is also used for the atmosphere correction of high energy cosmic ray observatory data. LIDAR measurements are available from single stations or from networks at continental scale like the European Aerosol Research LIdar NETwork (EARLINET). Sun photometer data are the most suitable complement to LIDAR measurements for the study of aerosol properties due to the extensive coverage of their measurements available through the AErosol RObotic NETwork (AERONET) network. The purpose of this study is to find the correlation between the aerosol properties and the CR data. The aerosol properties retrieved from two databases for the period of 2016-2020: I) the multi-wavelength LIDAR system Potenza EArlinet Raman Lidar (PEARL) which operates at the CNR-IMAA (Tito Scalo (Italy) and contributes to the EAELINET); and II) the AERONET sun photometer data from the stations located at Southern Italy i.e. Potenza (40.60° N, 15.72° E, 820m), Naples (40.83° N, 14.30° E, 50 m) and Lecce (40.33° N, 18.11° E, 30m). whereas, the CR data made available in Italy from the Extreme Energy Events project (http://eee.centrofermi.it/monitor). Air mass back-trajectories were used to confirm the observed aerosol types and support the correlation study. Our study showed promising results in understanding the relationship between cosmic ray and aerosol properties.
Keywords: Cosmic Ray, Aerosol, Lidar, Sun Photometer, Back-trajectory
How to cite: Karimian Sarakhs, F., Madonna, F., Rosoldi, M., and De Pasquale, S.: Relationship between the time series of cosmic ray data and aerosol optical properties: (Case study: southern Italy, 2016-2020), EGU General Assembly 2022, Vienna, Austria, 23–27 May 2022, EGU22-8872, https://doi.org/10.5194/egusphere-egu22-8872, 2022.
Please decide on your access
Please use the buttons below to download the presentation materials or to visit the external website where the presentation is linked. Regarding the external link, please note that Copernicus Meetings cannot accept any liability for the content and the website you will visit.
Forward to presentation link
You are going to open an external link to the presentation as indicated by the authors. Copernicus Meetings cannot accept any liability for the content and the website you will visit.
We are sorry, but presentations are only available for users who registered for the conference. Thank you.
EGU22-9264 | Presentations | GI6.4
Smart Scintillating Neutron Detectors for Soil Moisture MonitoringPatrick Stowell and the COSMIC-SWAMP and STFC Food Network+ Collaborations
Cosmic ray neutron sensing has been shown to be a powerful method for continuously monitoring soil moisture over large areas. This technique relies on the detection of albedo cosmic ray neutrons coming from from the soil to infer the local hydrogen content. Cosmic ray neutron sensing is well-suited for hydrological monitoring in the field sizes typically seen on smallholder farms. The ongoing development of new lower-cost neutron detector instrumentation and processing tools will help to further support the adoption of this novel technique within the agricultural industry.
In this presentation I will discuss recent efforts at Durham University (UK) to develop low-cost cosmic ray neutron detectors to support soil moisture monitoring in the agriculture sector. These systems rely on lithium and boron-based scintillator foils for thermal neutron detection. Recent pilot studies in collaboration with the COSMOS-UK network have shown that the detected neutron rate in these sensors correlates well with results obtained from traditional gaseous systems. Work is now underway to improve the robustness of these scintillator systems for use in agricultural and civil engineering applications.
In addition, I will present a new international research network, COSMIC-SWAMP, which is looking at the integration of cosmic ray neutron sensors with managed irrigation sites in Brazil. By combining low-cost neutron probes with a smart water management platform (SWAMP), this research network is looking at using cosmic ray neutrons to perform data-driven irrigation control over large areas. The instrumentation being considered for COSMIC-SWAMP will be presented before discussing the future plans for the network.
How to cite: Stowell, P. and the COSMIC-SWAMP and STFC Food Network+ Collaborations: Smart Scintillating Neutron Detectors for Soil Moisture Monitoring, EGU General Assembly 2022, Vienna, Austria, 23–27 May 2022, EGU22-9264, https://doi.org/10.5194/egusphere-egu22-9264, 2022.
EGU22-9438 | Presentations | GI6.4
Geomagnetic field shielding over the past 100 000 yearsMonika Korte, Jiawei Gao, and Sanja Panovska
The geomagnetic field prevents energetic particles, such as galactic cosmic rays, from directly interacting with the Earth's atmosphere. The geomagnetic field is not static but constantly changing, and over the last 100,000 years several geomagnetic excursions occurred. During geomagnetic field excursions, the field strength is significantly decreased and the field morphology is controlled by non-dipole components, and more cosmic ray particles can access the Earth's atmosphere. Paleomagnetic field models provide a global view of the long-term geomagnetic field evolution, however, with individual spatial and temporal resolution. Here, we reconstruct the geomagnetic shielding effect over the last 100,000 years by calculating the geomagnetic field cutoff rigidity using four global paleomagnetic field models, i.e., GGF100k, GGFSS70, LSMOD.2, and CALS10k.2. We find that the non-dipole components of the geomagnetic field are not negligible for estimating the long-term geomagnetic shielding effect, in particular during excursions. Our results indicate that cosmic ray flux, impact area, and cosmic ray radiation intensity increase strongly during the excursions. Our results provide the possibility to accurately estimate the cosmogenic isotope production rate and cosmic radiation dose rate covering the last 100,000 years.
How to cite: Korte, M., Gao, J., and Panovska, S.: Geomagnetic field shielding over the past 100 000 years, EGU General Assembly 2022, Vienna, Austria, 23–27 May 2022, EGU22-9438, https://doi.org/10.5194/egusphere-egu22-9438, 2022.
EGU22-11230 | Presentations | GI6.4
Space or climate? Disentangling cosmogenic and climatic drivers of present-day tritium (3H) in global precipitationStefan Terzer-Wassmuth, Luis J. Araguas-Araguas, Lorenzo Copia, and Jodie A. Miller
The generation of cosmogenic tritium (3H) through spallation of 14N in the upper atmosphere and a its decay (half-life of 12.32 y) are the two main processes resulting in the global steady-state inventory of tritium in the hydrosphere of approximately 2.95 kg. Various mechanisms of scavenging of stratospheric 3H into the troposphere, such as stratosphere-troposphere transports (STTs) during the so-called “spring leak”, or the tropospheric distribution by means of the Brewer-Dobson circulation, have been described to explain the observed spatial and seasonal distribution of present-day tritium levels in global precipitation. Following thermonuclear weapons testing prior to the Preliminary Test Ban Treaty in 1963, the natural 3H input signal was overlaid by the so-called “bomb peak”. This characteristic tritium pulse has been used for decades in nuclear and hydrological sciences, with 3H values in Vienna, the reference northern hemisphere station of the IAEA-WMO Global Network of Isotopes in Precipitation (GNIP), peaking in 1963 at approximately 400 Bq L-1. Since the year 2000, this 3H pulse has dissipated in the northern hemisphere, and 3H levels at the Vienna monitoring site have reached their natural background value of ca. 1.2 Bq L-1.
The present-day steady state of natural 3H levels in precipitation allow to research their inter-annual variability as driven by cosmogenic input, with particular emphasis on neutron flux intensity governed by the 11-year sunspot cycles. With almost two full solar cycle’s worth of observed 3H data in Vienna’s precipitation and other GNIP stations in the northern hemisphere, we discuss the impact of the neutron flux (as exemplified by the Oulu Neutron Monitor) in modulating the inter-annual variability. Our findings showed that while 52% of the interannual variability was explained by changes in the cosmogenic flux, an additional 31% of the variability resulted from the seasonal distribution of the amount of precipitation, a finding prominent in the previous solar cycle valley, particularly in the year 2015, that coincided with abnormally high winter precipitation.
While the regular oscillations of the neutron flux seem to constitute the main driver of the observed interannual changes of 3H contents in precipitation, atmospheric circulation processes were of varying importance in 15 GNIP stations. In spite of the relative data paucity (i.e. absence of sufficiently long records at even spatial distribution), we hypothesize that changes in precipitation seasonality, due to climate change impacts on global or regional atmospheric circulation patterns, may drive fluctuations in the natural steady-stage 3H levels in precipitation used to investigate atmospheric and hydrological processes. Hence, we stress the importance of spatially and temporally adequate observational baselines on a global level.
How to cite: Terzer-Wassmuth, S., Araguas-Araguas, L. J., Copia, L., and Miller, J. A.: Space or climate? Disentangling cosmogenic and climatic drivers of present-day tritium (3H) in global precipitation, EGU General Assembly 2022, Vienna, Austria, 23–27 May 2022, EGU22-11230, https://doi.org/10.5194/egusphere-egu22-11230, 2022.
Please decide on your access
Please use the buttons below to download the presentation materials or to visit the external website where the presentation is linked. Regarding the external link, please note that Copernicus Meetings cannot accept any liability for the content and the website you will visit.
Forward to presentation link
You are going to open an external link to the presentation as indicated by the authors. Copernicus Meetings cannot accept any liability for the content and the website you will visit.
We are sorry, but presentations are only available for users who registered for the conference. Thank you.
EGU22-12334 | Presentations | GI6.4
Rail-based cosmic ray neutron sensing (CRNS): pushing the boundaries towards expanding footprints and temporal resolutionsDaniel Altdorff, Sascha Oswald, Steffen Zacharias, Carmen Zengerle, Hannes Mollenhauer, Peter Dietrich, Sabine Attinger, and Martin Schrön
Cosmic ray neutron sensing (CRNS) has become an established method for deriving the soil water content (SWC), based on the inverse relationship of neutron counting and the SWC of the surrounding area. The provided footprint, lateral up to 200m and vertical of several decimeter, qualifies CRNS to bridge the information gap between classical hydrogeophysical approaches and remote sensing. While stationary CRNS offers continuous long-term SWC measurements at high temporal resolution, the covered area remains fixed and predefined. Car-borne CRNS roving on the other hand, allows to expand the mapped area. However, the method requires active operation and is limited to snap shot information only. As an alternative, the operation of a permanent mobile CRNS platform on trains promises to combine the advantages from stationary and car-borne CRNS measurements, as recently suggested by Schrön et al. (2021), while also its technical implementation, data processing and interpretation raises new challenges and complexity.
In this study we introduce a fully automatic CRNS railway system, installed in a conventional locomotive of a freight train, as first and novel of its kind. Results of the first phase of operation will be presented. The measurements along an experimental rail track were supported by local SWC measurements, gravimetric and dielectric records (Mobile Wireless Ad-hoc Sensor Network), at three areas along the railway, and by a newly installed weather station. Additionally, car-borne CRNS data were recorded on two days close to the railway track.
Preliminary results of data collected between September and December 2021 showed very stable spatial pattern in relation to the segments crossed by the train, which have been confirmed by the car-borne dataset. Temporal variations within hours were also evident as direct or indirect response to local rain and snow events. Based on the first results, we are confident, that rail-based CRNS offers the chance to play a prominent role in addressing soil hydrology at landscape scale in the future.
Schrön, M., Oswald, S. E., Zacharias, S., Kasner, M., Dietrich, P., & Attinger, S. (2021). Neutrons on rails: Transregional monitoring of soil moisture and snow water equivalent. Geophysical Research Letters, 48, e2021GL093924
How to cite: Altdorff, D., Oswald, S., Zacharias, S., Zengerle, C., Mollenhauer, H., Dietrich, P., Attinger, S., and Schrön, M.: Rail-based cosmic ray neutron sensing (CRNS): pushing the boundaries towards expanding footprints and temporal resolutions, EGU General Assembly 2022, Vienna, Austria, 23–27 May 2022, EGU22-12334, https://doi.org/10.5194/egusphere-egu22-12334, 2022.
EGU22-12618 | Presentations | GI6.4
Zonal distribution of cosmogenic isotopes in stratosphere and troposphere via CCM SOCOLKseniia Golubenko
Cosmogenic isotopes are mostly produced in the stratosphere and troposphere, and the corresponding fractions depend on solar activity and tropopause altitude. Solar-cycle variability of cosmogenic isotope production is the strongest at high latitudes due to the lack of geomagnetic shielding. However, the exact zonal distribution of the production in troposphere and stratosphere regions, that is needed for the precise modelling of their transport and deposition, is not clear. In this work, we provide numerical estimates of cosmogenic isotopes production in the atmosphere for different conditions. Using the SOCOL-AER2-BE Chemical Climatic model (CCM), we present simulations of the production of cosmogenic isotopes ($^{14}$C, $^{36}$Cl, $^{10}$Be, and $^{7}$Be) and provide zonal distributions (tropical, subtropical, and polar regions) in the stratosphere and troposphere. The model is driven by four solar activity scenarios: 1) solar minimum year with solar modulation function - phi = 400 MeV and 2) solar maxima year with phi = 1100MeV. In these cases, the production is modulated by Galactic Cosmic Rays (GCR). Two other scenarios are 3) ground-level enhancement (GLE) event number 5 with hard spectrum on February 23, 1956 and 4) GLE event number 24 with soft spectrum on August 04, 1972. The production rates were calculated using a combination of the SOCOL and CRAC models.
How to cite: Golubenko, K.: Zonal distribution of cosmogenic isotopes in stratosphere and troposphere via CCM SOCOL, EGU General Assembly 2022, Vienna, Austria, 23–27 May 2022, EGU22-12618, https://doi.org/10.5194/egusphere-egu22-12618, 2022.
EGU22-12812 | Presentations | GI6.4
Signal contribution of remote areas to cosmic-ray neutron sensors based on distance and sensitivityMartin Schrön, Markus Köhli, and Steffen Zacharias
Cosmic-Ray Neutron Sensing (CRNS) is an established measurement technique for water content in soils and snow. The high integration depth and the large measurement footprint is an important advantage compared to conventional point-scale sensors. However, the radial-symmetrical footprint definition based on the 86% quantile of detected neutrons is often not helpful to explain the influence of certain areas in complex fields. Many natural sites are highly heterogeneous and thus knowledge of the contribution of distant areas to the measurement signal would be very useful, e.g. to support calibration sampling, sensor location design, data interpretation, and uncertainty assessment. Here, CRNS calibration and validation remains a challenge, since the influence of the different fields and structures to the signal is usually not known.
In this presentation, we proposes a generalized analytical procedure to estimate the contribution of patches or fields in the footprint of a cosmic-ray neutron detector to its signal using the radial intensity functions. The proposed method could greatly support calibration sampling, sensor location design, and uncertainty assessment, e.g. in complex or vegetated terrain, without the need of computationally expensive neutron modeling. Furthermore, a new concept for a more practical definition of the sensor footprint is proposed, which represents the maximal distance to a field such that its soil moisture change is still sensible in terms of measurement precision.
How to cite: Schrön, M., Köhli, M., and Zacharias, S.: Signal contribution of remote areas to cosmic-ray neutron sensors based on distance and sensitivity, EGU General Assembly 2022, Vienna, Austria, 23–27 May 2022, EGU22-12812, https://doi.org/10.5194/egusphere-egu22-12812, 2022.
EGU22-775 | Presentations | GI6.7 | Highlight
Radon monitoring in a volcanic cave: El Viento Cave (Canary Islands, Spain)M. Candelaria Martín-Luis, Pedro A. Salazar-Carballo, María López-Pérez, Xiomara Duarte-Rodríguez, and María Esther Martín González
Radon (222Rn, t 1/2 = 3.82 days) is by far the dominant radionuclide in indoor air and constitutes a health hazard in poorly ventilated environments, such as caves, mines or tunnels. In these contexts, radon gas can accumulate, reaching harmful concentrations due to the ionizing radiation from 222Rn and its progeny. To minimize the exposure risk, a radon monitoring program is required to adopt mitigation measures for the radiological protection of workers, cavers and visitors. The Directive 2013/59/EURATOM sets the recommended occupational and public effective dose limits being 20 and 1 mSv/year, respectively.
El Viento Cave is a volcanic lava tube located in the northern flank of Pico-Viejo volcano, in the Icod Valley, (Tenerife, Canary Islands, Spain). It was formed during the early eruptions of the Pico Viejo volcano, 27,030 ± 430 years ago, from basaltic, plagioclase-rich pahoehoe lavas. The cave has an extraordinary complexity, with several sinuous tubes and branches in three superimposed and interconnected levels and is considered the 5th longest volcanic cavity on Earth (Carracedo and Troll, 2013). A 200 m long segment of this lava tube, named “El Sobrado Cave”, is enabled for touristic visits. Only in 2019 the cave received more than 28000 visitors.
Monthly radon profiles were obtained during one year (from 2020/10/01 to 2021/09/30) in the touristic section of the cave by using SSNTD (CR-39), installed approximately every 35 m. Besides, a RadonScout monitor (SARAD GmbH) was set up at about 100 m from the cave entrance, for continuous monitoring (integration time of 1 hour) of radon and environmental parameters (air temperature, relative humidity, and barometric pressure).
222Rn levels inside the cave ranged from 0-5.000 Bq/m3, exhibiting seasonal, diurnal and semidiurnal fluctuations. Short-period radon variations (24 and 12 h frequencies) are related to air temperature and humidity. Long-period radon fluctuations (annual-seasonal) are correlated with rainfall, with lower radon levels in winter (rainy season) and higher in summer (dry season).
Annual mean effective dose due to 222Rn gas exposure was estimated from the geometric mean of radon concentration during the studied period, assuming an average indoor occupancy of 10 working hours/week during 48 weeks/year for guides and a punctual visit of 1 hour for tourists. In these conditions, the resulting annual effective dose computed for guides is below 2mSv/year.
References:
Carracedo, J.C. & Troll, V.R. (Eds.). (2013). Teide Volcano: Geology and Eruptions of a Highly Differentiated Oceanic Stratovolcano. Active Volcanoes of the World, Springer Berlin Heidelberg, 296 pp.
How to cite: Martín-Luis, M. C., Salazar-Carballo, P. A., López-Pérez, M., Duarte-Rodríguez, X., and Martín González, M. E.: Radon monitoring in a volcanic cave: El Viento Cave (Canary Islands, Spain), EGU General Assembly 2022, Vienna, Austria, 23–27 May 2022, EGU22-775, https://doi.org/10.5194/egusphere-egu22-775, 2022.
Please decide on your access
Please use the buttons below to download the presentation materials or to visit the external website where the presentation is linked. Regarding the external link, please note that Copernicus Meetings cannot accept any liability for the content and the website you will visit.
Forward to presentation link
You are going to open an external link to the presentation as indicated by the authors. Copernicus Meetings cannot accept any liability for the content and the website you will visit.
We are sorry, but presentations are only available for users who registered for the conference. Thank you.

EGU22-2684 | Presentations | GI6.7 | Highlight
The role of Pusteria fault zone (North-Eastern Alps, Italy) on enhancing the Geogenic Radon componentEleonora Benà, Giancarlo Ciotoli, Chiara Coletti, Antonio Galgaro, Volkmar Mair, Matteo Massironi, Claudio Mazzoli, Corrado Morelli, Pietro Morozzi, Livio Ruggiero, Laura Tositti, and Raffaele Sassi
Radon (222Rn) is a radioactive gas widely considered an indoor air pollutant due to its harmful effects on human health (WHO, 2009). The Geogenic Radon Potential (GRP) quantifies what “Earth delivers” in terms of radon and represents the most important contributor to Indoor Radon Concentrations (IRC) indicating the potential risk over an area (Bossew 2015). This is the special case of some municipalities in Pustertal/Pusteria Valley (Bozen/Bolzano, North-Eastern Italy) which display a high IRC, based on Indoor measurements carried out by Minach et al. (1999), exceeding the threshold value recommended by EURATOM 59/2013. These municipalities are located along a wide brittle-fracture zone between the Pusteria Line (PL, the eastern part of Periadriatic Lineament) and the Deffereggen-Anterselva-Valles (DAV) faults. This fractured zone may act as preferential pathway for radon transport and migration by carrier gases (mainly CO2 and CH4), strongly contributing to its geogenic component. A GRP map of the study area has been developed based on field measurements of radon, thoron (220Rn) and other soil gases (CO2, CH4, H2, O2, H2S) according to a sampling grid in an area of 6x10 km, and along three profiles crossing above mentioned fault lines in Terenten/Terento, Mühlen/Molini and Pfalzen/Falzes specific areas. The GRP map was constructed by using soil gas radon data and other proxy variables in a spatial regression model. Soil gas measurements have been supported by high-resolution gamma-ray spectrometry on 16 rock samples belonging to the main outcropping lithologies in the study area i.e. granite, orthogneiss, micaschist-paragneiss, phyllite. The preliminary radon map highlights a wide area of radon anomaly located to the North of the Periadriatic Lineament. The global trend of these radon anomalies follows the structural trend of the brittle fracture zone between PL and DAV faults and tends to close from the eastern part (Pfalzen/Falzes) toward the western part (Terenten/Terento) of the study area. In particular the easternmost sector of the map displays a wide north-south area of radon anomaly related to a wide brittle-fracture zone probably composed by a system of sub-parallel faults. The spatial distribution of radon anomalies confirms the key role played by the Pustertal/Pusteria fault system in the fluid degassing processes enhancing geogenic radon potential of the Pustertal/Pusteria Valley.
Keywords: Natural Radioactivity, Geogenic Radon Potential, Indoor Radon, Periadriatic Lineament
References:
Bossew Peter. Mapping the Geogenic Radon Potential and Estimation of Radon Prone Areas in Germany. Radiation Emergency Medicine 2015 Vol. 4, No.2 13-20.
Council Directive 2013/59/EURATOM. Basic safety standards for protection against the dangers arising from exposure to ionising radiation.
Minach L., Verdi L., Marchesoni C., Amadori C. Radon in Südtirol. Environmental Protection Agency. 1999.
WHO 2009. Zeeb H. and Shannoun F. (eds.) WHO handbook in Indoor Radon - a public health perspective. ISBN 978 92 4 1547672.
How to cite: Benà, E., Ciotoli, G., Coletti, C., Galgaro, A., Mair, V., Massironi, M., Mazzoli, C., Morelli, C., Morozzi, P., Ruggiero, L., Tositti, L., and Sassi, R.: The role of Pusteria fault zone (North-Eastern Alps, Italy) on enhancing the Geogenic Radon component, EGU General Assembly 2022, Vienna, Austria, 23–27 May 2022, EGU22-2684, https://doi.org/10.5194/egusphere-egu22-2684, 2022.
EGU22-2868 | Presentations | GI6.7
Testing the response of proximal gamma ray spectroscopy and cosmic ray neutron sensors to dry and wet conditions in an agricultural field (Spain)Leticia Gaspar, Trenton Franz, Ivan Lizaga, and Ana Navas
Gamma ray spectroscopy (GRS) and cosmic ray neutron sensors (CRNS) have become promising proximal soil moisture sensing techniques at intermediate scale in recent years. The high efficiency and relatively good spectral resolution provided by Sodium Iodide (NaI) detectors allow gamma-ray surveys for monitoring the spatial and temporal distribution of terrestrial radioelements like 40K, which is inversely proportional to the volumetric soil water content SWC (m3/m3). Cosmic ray neutron sensors detect and count the number of neutrons in the soil and the air just above the soil. Dryer soil has more fast-moving neutrons, while wetter soil has fewer because more hydrogen from water is available to absorb energy.
The objective of this study is to test the response of the proximal gamma ray spectroscopy and the cosmic ray neutron sensor in an agricultural field under dry and wet soil conditions to infer the information of soil water content in the first 30 cm. For the first time in Spain GRS and CRNS sensors have been assayed on a test site of aprox. 40 × 80 m2 (41º 43’ 37’’ N, 0º 48’ 46’’ W) at the experimental farm of the Estación Experimental de Aula Dei (EEAD-CSIC, Zaragoza, Spain). The experimental setup is equipped of a Cosmic Ray Neutron Sensor placed at 2 m above the ground located at the middle of the field, and a proximal gamma-ray equipment composed by sodium iodide scintillator detector (NaI). The CRNS provided continuous data every 15 min, while NaI detector supplied data at selected sites before and after a 16-liter rain episode. In this contribution, we present the preliminary results under dry and wet conditions of the distribution of 40K (cps, Bq m-2) and analyse the SWC after performing GRS and CRNS measurements. Our results were also compared with soil moisture estimated by volumetric field sensors showing high sensitivity to the different status of soil moisture, highlighting the promising of the use of these nuclear techniques for environmental and agricultural purposes.
How to cite: Gaspar, L., Franz, T., Lizaga, I., and Navas, A.: Testing the response of proximal gamma ray spectroscopy and cosmic ray neutron sensors to dry and wet conditions in an agricultural field (Spain), EGU General Assembly 2022, Vienna, Austria, 23–27 May 2022, EGU22-2868, https://doi.org/10.5194/egusphere-egu22-2868, 2022.
EGU22-3145 | Presentations | GI6.7
Radon hazard vs. radon risk – consequences for radon abatement policyPeter Bossew and Eric Petermann
Exposure to indoor radon (Rn) is recognized as a health hazard which may cause several 100,000 lung cancer fatalities per year world-wide. Physical causes are Rn generation as part of the decay chains that originate in ubiquitous uranium and thorium and its transport through the natural to the built environment, where it can infiltrate indoor air. Generation and transport of Rn constitute geogenic Rn hazard. Its geographical distribution reflects the ones of the properties of the media in which the processes occur, namely their geochemistry and physical properties such as porosity, permeability and humidity. By linking to measured indoor Rn concentration, geogenic hazard can be transformed into the expected indoor Rn concentration in a hypothetical house at a location or the probability that in the house a Rn threshold is exceeded.
Hazard turns into risk if somebody is exposed to the hazardous agent. Given a certain amount of hazard, the risk results from conditions which enable exposure (defining vulnerability and susceptibility to the hazard) and the presence of people who are actually exposed. While hazard yields a probability that somebody exposed suffers a detriment, risk quantifies the size of the detriment, e.g. the expected number of Rn induced lung cancer fatalities per unit area. Elevated risk can occur also if the individual probability of detriment is low, if the number of exposed persons is high.
Rn abatement policy which through regulation aims to reduce the detriment, should respond differently to hazard and risk. In the former case, it should reduce the probability of individual high exposure occurring, by remediation, or avoiding it to occur, by preventive action. Responding to the latter means reducing collective exposure.
So far, policy has mainly focused on the first, i.e. hazard reduction, while comparatively less attention has been given to the second, although the overall detriment to society depends on it. Although Rn regulation has already been developed extensively in Europe, discussion of the aspect of collective risk reduction seems to be in the beginning only.
In this presentation, we outline the problem by showing the difference between hazard and risk and addressing existing Rn abatement strategies.
How to cite: Bossew, P. and Petermann, E.: Radon hazard vs. radon risk – consequences for radon abatement policy, EGU General Assembly 2022, Vienna, Austria, 23–27 May 2022, EGU22-3145, https://doi.org/10.5194/egusphere-egu22-3145, 2022.
Please decide on your access
Please use the buttons below to download the presentation materials or to visit the external website where the presentation is linked. Regarding the external link, please note that Copernicus Meetings cannot accept any liability for the content and the website you will visit.
Forward to presentation link
You are going to open an external link to the presentation as indicated by the authors. Copernicus Meetings cannot accept any liability for the content and the website you will visit.
We are sorry, but presentations are only available for users who registered for the conference. Thank you.
EGU22-3966 | Presentations | GI6.7
New traceability chains for the measurement of radon at the environmental levelStefan Röttger, Annette Röttger, Claudia Grossi, Ute Karstens, Giorgia Cinelli, and Chris Rennick
In the framework of the EMPIR project 19ENV01 traceRadon(1) [1] stable atmospheres with low-level, activity concentrations of radon have to be produced for the calibration of radon detectors [2] capable of measuring the outdoor air activity concentration. The traceable calibration of these detectors at very low activity concentrations is of special interest, for the radiation protection community, as well as the climate observation community. Because radiation protection networks (like the EUropean Radiological Data Exchange Platform (EURDEP)) and climate observation networks (like the Integrated Carbon Observation System (ICOS)) need reliable, accurate radon activity concentration measurements, either for identification of Radon Priority Areas (RPA), for false alarm prevention or to apply the Radon Tracer Method (RTM) for the estimation of greenhouse gas (GHG) emissions.
Radon gas is the largest source of public exposure to naturally occurring radioactivity, and concentration maps based on atmospheric measurements aid developers to comply with EU Safety Standard Regulations. Radon can also be used as a tracer to evaluate dispersal models important for supporting successful greenhouse gas (GHG) mitigation strategies. One of the recently most applied technique for this propose is the Radon Tracer Method (RTM). To reduce the uncertainty of both radiation protection measurements and those used for GHG modelling, traceability to SI units for radon exhalation rate from soil, its concentration in the atmosphere and validated models for its dispersal are needed. The project traceRadon started in 2020 to provide the necessary measurement infrastructure [3,4]. This is particularly important for GHG emission estimates that support national reporting under the Paris Agreement on climate change.
As there is an overlapping need between the climate research and radiation protection communities for improved traceability at low-level outdoor radon and radon flux measurements the project traceRadon works on this aspect for the benefit of two large scientific communities. The results at midterm of the project are presented.
[1] Röttger, A. et al: New metrology for radon at the environmental level 2021 Meas. Sci. Technol. 32, 124008, https://doi.org/10.1088/1361-6501/ac298d
[2] Radulescu, I et al.: Inter-comparison of commercial continuous radon monitors responses, Nuclear Instruments and Methods in Physics Research Section A, Volume 1021, 2022, 165927, https://doi.org/10.1016/j.nima.2021.165927
[3] Mertes, F et. al.: Approximate sequential Bayesian filtering to estimate Rn-222 emanation from Ra-226 sources from spectra, https://doi.org/10.5162/SMSI2021/D3.3
[4] Mertes, F. et. al.: Ion implantation of 226Ra for a primary 222Rn emanation standard, Applied Radiation and Isotopes, Volume 181, March 2022, 110093, https://doi.org/10.1016/j.apradiso.2021.110093
(1) This project has received funding from the EMPIR programme co-financed by the Participating States and from the European Union's Horizon 2020 research and innovation programme. 19ENV01 traceRadon denotes the EMPIR project reference
How to cite: Röttger, S., Röttger, A., Grossi, C., Karstens, U., Cinelli, G., and Rennick, C.: New traceability chains for the measurement of radon at the environmental level, EGU General Assembly 2022, Vienna, Austria, 23–27 May 2022, EGU22-3966, https://doi.org/10.5194/egusphere-egu22-3966, 2022.
EGU22-4833 | Presentations | GI6.7 | Highlight
Measuring Background Radiation with a Novel Ionisation Detector Aboard A North Atlantic VoyageJustin Tabbett, Karen Aplin, and Susana Barbosa
Radon and its progeny are well-documented sources of natural radioactivity which can be used as benchmarks for testing a novel ionisation detector. The miniaturised ionisation detector was deployed aboard the NRP Sagres on a SAIL mission in July 2021 which travelled between the Açores and Lisbon in the North Atlantic Ocean. On its voyage, the detector profiled natural background radiation and in-directly detected cosmic ray muons, providing both spectroscopic energy discrimination and count rate data. The detector was simultaneously run with a NaI(Tl) gamma ray counter and other meteorological instruments.
The small form factor and low-power detector, composed of a 1x1x0.8 cm3 CsI(Tl) microscintillator coupled to a PiN photodiode, was able to identify gamma peaks from Bi-214 and K-40, having been calibrated using laboratory gamma sources up to 1.3 MeV. This research aims to investigate the performance of the ionisation detector and behaviour of discrete gamma energies over the duration of the voyage. Additionally, we will show a comparison of the CsI(Tl) based ionisation detector against the gamma ray counter which features a larger NaI(Tl) scintillator.
How to cite: Tabbett, J., Aplin, K., and Barbosa, S.: Measuring Background Radiation with a Novel Ionisation Detector Aboard A North Atlantic Voyage, EGU General Assembly 2022, Vienna, Austria, 23–27 May 2022, EGU22-4833, https://doi.org/10.5194/egusphere-egu22-4833, 2022.
Please decide on your access
Please use the buttons below to download the presentation materials or to visit the external website where the presentation is linked. Regarding the external link, please note that Copernicus Meetings cannot accept any liability for the content and the website you will visit.
Forward to presentation link
You are going to open an external link to the presentation as indicated by the authors. Copernicus Meetings cannot accept any liability for the content and the website you will visit.
We are sorry, but presentations are only available for users who registered for the conference. Thank you.

EGU22-6049 | Presentations | GI6.7
Automatic classification of peaks in gamma radiation measurements from the Eastern North Atlantic (ENA-ARM) station in Graciosa island (Azores)Susana Barbosa, José Matos, and Eduardo Azevedo
The automatic classification of peaks in gamma radiation time series is relevant for both scientific and practical applications. From the practical perspective, the classification of peaks is fundamental for early-warning systems for radiation protection and detection of radioactive material. From the scientific point of view, peaks in gamma radiation are often driven by precipitation and consequent scavenging of airborne radon progeny radionuclides to the ground (mainly Pb-214 and Bi-214). Thus measurements of gamma radiation at the earth's surface have the potential to provide information on micro-physical processes occurring high above in the clouds, as the dominant source of radon progeny is thought to be associated with in-cloud processes – nucleation scavenging and interstitial aerosol collection by cloud or rain droplets.
The present study addresses the classification of peaks in high-resolution (1-minute) gamma radiation time series from the GRM (Gamma Radiation Monitoring) campaign, which is being carried out since 2015 at the Eastern North Atlantic (ENA) station of the ARM (Atmospheric Radiation Measurements) programme. In addition to the gamma time series, precipitation information from laser disdrometer measurements is considered, including rain rate, liquid water content, median drop diameter and droplet concentration. Diverse machine learning algorithms are examined with the goal to identify and classify gamma peaks driven by precipitation events, and further examine the association between precipitation characteristics and the resulting gamma radiation peak on the ground.
How to cite: Barbosa, S., Matos, J., and Azevedo, E.: Automatic classification of peaks in gamma radiation measurements from the Eastern North Atlantic (ENA-ARM) station in Graciosa island (Azores), EGU General Assembly 2022, Vienna, Austria, 23–27 May 2022, EGU22-6049, https://doi.org/10.5194/egusphere-egu22-6049, 2022.
EGU22-9563 | Presentations | GI6.7 | Highlight
222Radon (222Rn) levels of Thermal Waters in the geothermally active Campi Flegrei volcanic caldera (Southern Italy) using a RAD7 radon detectorRaffaella Silvia Iovine, Monica Piochi, Rosario Avino, Emilio Cuoco, Carmine Minopoli, Alessandro Santi, Stefano Caliro, Antonio Piersanti, and Gianfranco Galli
Radon is an inert radioactive and radiogenic gas whose exposure is considered harmful for human health. Radon migrates in the hydrogeological systems and discharge into air when water is exposed to the atmosphere. In hydrothermal and geothermal settings of quiescent volcanoes, the surveillance of dissolved 222Rn can be useful to define the hydrological setting and to track fluids’ dynamics. The quantity of dissolved 222Rn depends on different factors such as the characteristics of the aquifer, water-rock-gas interactions, water residence time, radioactive supply. The present study provides measurements of radon concentration levels in 20 thermal waters at the Campi Flegrei volcanic caldera, an important geothermal system with hydrothermal manifestations in the Neapolitan area. We used a Radon-in-air detector (RAD7®, Durridge Co.) equipped with Big Bottle RAD H2O and DRTYSTICK accessories. Water samples are taken from subsurface thermal groundwater, springs, lakes, pools and one submerged thermal spring with different chemical-physical conditions. They are mostly chlorine to bicarbonate waters, with the exception of few sulphate, sampled nearby gas vents of Solfatara and Pisciarelli, with temperature and pH values ranging from 18.1 to 91.3 °C and from 2 to 8 respectively. The hottest and most acidic sulphate waters refer to a small boiling pool at the hydrothermal discharge area of Pisciarelli and have nearly zero Rn levels.
Dissolved radon concentrations vary from 0.1 ± 0.1 to 910 ± 9 Bq/L with an average value of 122.7 Bq/L, using the CAPTURE program, the default RAD7 data acquisition program. Similar values in radon concentration are obtained using the method proposed in De Simone et al. (2015), ranging between 0.1 ± 0.1 and 1037± 60 Bq/L with an average value of 133.0 Bq/L.
The 222Rn levels from this study not exceed the additional reference level of 1000 Bq/L that can be used in specific situations for the protection of human health.
No correlation has been observed between temperature, pH, major anions and radon concentration values, nor between rock composition since it is almost homogeneous at the study sites. Rn levels therefore appear to reflect the local sedimentological, structural or hydrogeological setting.
These results are the first of our investigation of dissolved Rn at the Campi Flegrei caldera, acquired in the ongoing “Pianeta Dinamico” project focused on the hydrothermal system functioning of the quiescent volcanoes and financed by the Istituto Nazionale di Geofisica e Vulcanologia. The final goal will be to define the natural Rn fluctuations in relation to the background levels and eventual anomalies in the hydrogeological system, also for public health safety monitoring. Therefore, a future step in this framework will be integrating more dissolved radon measurements in the Campania territory using the same research approach adopted in this study.
De Simone G., Galli G., Lucchetti C., Tuccimei P. (2015) Calibration of Big Bottle RAD H2O set-up for radon in water using HDPE bottles Radiat. Meas., 76, pp. 1-7.
How to cite: Iovine, R. S., Piochi, M., Avino, R., Cuoco, E., Minopoli, C., Santi, A., Caliro, S., Piersanti, A., and Galli, G.: 222Radon (222Rn) levels of Thermal Waters in the geothermally active Campi Flegrei volcanic caldera (Southern Italy) using a RAD7 radon detector, EGU General Assembly 2022, Vienna, Austria, 23–27 May 2022, EGU22-9563, https://doi.org/10.5194/egusphere-egu22-9563, 2022.
Radon timeseries typically contain a mixture of periodic and transient signals. Radon cycles can cover a broad frequency spectrum ranging from half-diurnal (S2, M2), daily (S1, O1), multiday, fortnightly, monthly, semi-annually, seasonal, to decadal variations. Physically, these variations are caused by a complex mix of meteorological parameters like air pressure, air temperature, wind, humidity, rain, snow, soil moisture, as well as pressure and temperature gradients in the ground or water level changes. In rare cases also Earth tides may modulate the radon signal. From time to time transient signals appear on top of these quasi-periodic signals – sometimes even in the form of radon bursts. These bursts are characterised by a sharp increase in radon concentration, often followed by a decay-like decrease. They last for hours, days, or months; they occur in soil, sediments, and rocks (granite, phyllite, lava), and appear in various geological environments (mofettes, mud volcanoes, volcanoes, rift systems). Spike-like bursts were also reported for other gases like methane or carbon dioxide. Deformation and related pore-pressure changes are discussed as physical origin of these transients. Spike-like anomalies are frequently claimed to be earthquake precursors. But they can also be caused by external events, like strong rainfall events, lake-level changes and even be artificially induced, e.g. by drilling activities. Thus my working hypothesis is that it is not possible to deduce the origin of a spike-like anomaly from its form and duration.
How to cite: Woith, H.: Radon bursts, EGU General Assembly 2022, Vienna, Austria, 23–27 May 2022, EGU22-9600, https://doi.org/10.5194/egusphere-egu22-9600, 2022.
EGU22-10082 | Presentations | GI6.7
Learning from subsurface migration profiles of an artificial radionuclide during a volatile migration periodMisa Yasumiishi and Taku Nishimura
Artificial radionuclides emitted into the environment have become tools to understand the physical processes in the last half-century and model future geophysical phenomena. In the case of a high contamination event such as a nuclear accident, it is challenging to capture the three-dimensional subsurface migration behavior of radionuclides during the most dynamic and crucial period shortly after the initial fallout because of the risk to human observers. Thus, geophysical models often rely on stabilized radionuclides, hypothesizing the radionuclide mobility in the initial phase. This study aims to demonstrate the rapid changes of vertical profiles of Cs-137 in short years after initial depositions, using soil samples collected in a forest and on abandoned farmland in Fukushima, Japan, five to seven years after the Fukushima Daiichi Nuclear Power Plant Accident in 2011.
The subsurface migration profiles, including the actual migration head depth of Cs-137, were examined against local topographic indices. Some of the preliminary results show that actual subsurface migration of the FDNPP-derived Cs-137 was equal to or deeper than 30 cm depth in nine forest soil samples; the confirmed deepest migration was at 38 cm. Meanwhile, the actual migration depths in abandoned crop fields were less than 15 cm. Along a 500 m hillslope, deposition was observed at five locations. The interaction of the timing of deposition and erosion depths was deciphered from Cs-137 vertical profiles and surrounding topography. The findings from this study demonstrate the implications of radionuclides behavior during a dynamic migration period to natural and artificial environmental radioactivity analysis. To accurately estimate the activities of radionuclides years later, these initial losses and gains of target radionuclides in the soil need to be considered with temporal progress, along with nuclear decay.
How to cite: Yasumiishi, M. and Nishimura, T.: Learning from subsurface migration profiles of an artificial radionuclide during a volatile migration period, EGU General Assembly 2022, Vienna, Austria, 23–27 May 2022, EGU22-10082, https://doi.org/10.5194/egusphere-egu22-10082, 2022.
EGU22-10090 | Presentations | GI6.7
Forest versus pasture radon-222 flux in a granitic context: the Sapine drainage basin at Mont Lozère, FranceBo Lei, Frédéric Perrier, and Frédéric Girault
Radon-222 (222Rn) is a well-known tracer of atmospheric, environmental and geological processes. In a recent reviews of radon-222 flux (RF) from ground surface at continental scale, or in recent observations of RF in association with earthquakes, the question of the influence of vegetation cover emerges repeatedly. In this study, a total of 58 RF flux (RF) measurement were performed from ground surface in September 2021 at the Sapine drainage in the Mont Lozère (French Central Massif). The micro-observations site was located at the south slope of the granitic context between a forest and pasture. No significant difference was observed between the RF in pasture (225±63 mBq m-2 s-1) and forest (247±80 mBq m-2 s-1). These results are compared with other recent RF results obtained in granitic areas in France, and to experimental evidence on radium-226 distribution obtained in soils and in vegetation. Other systematic effects on RF, such as soil humidity, soil pH or soil temperature, and their potential consequences on transport processes are discussed, as well as their impact on various problems in geosciences.
How to cite: Lei, B., Perrier, F., and Girault, F.: Forest versus pasture radon-222 flux in a granitic context: the Sapine drainage basin at Mont Lozère, France, EGU General Assembly 2022, Vienna, Austria, 23–27 May 2022, EGU22-10090, https://doi.org/10.5194/egusphere-egu22-10090, 2022.
EGU22-10471 | Presentations | GI6.7
Natural radioactivity and rock-water interactions in the springs of Sopron Mountains (Hungary)Bence Molnár, Petra Baják, Katalin Csondor, Viktor Jobbágy, Bálint Izsák, Márta Vargha, Tamás Pándics, Ákos Horváth, and Anita Erőss
As groundwater is an important source of drinking water, its quality is of great importance. In recent years, following the EU regulations, radioactivity parameters are also included among the quality measures.
In the area of the city Sopron (Hungary), groundwater resources are used for drinking water supply. The area had been actively researched for fissile materials, and previous studies measured high radon activity for example in the geophysical observatory (500–1000 kBq m–3) and in natural springs (up to 220 Bq L–1).
Natural springs bear important information about their parent flow systems, about the transit time and the rock-water interactions along the flow paths. The aim of the study was to investigate the natural springs of the Sopron Mountains and to measure not only the physico-chemical properties (discharge rate, pH, electrical conductivity, temperature, dissolved oxygen content, redox potential, major ion content), but also to determine the uranium, radium and radon activity concentration of the springwaters.
The measurements revealed low discharge rate (< 5 L min–1), low dissolved solid content (< 450 mg L–1 TDS) and temperature (10–12°C) for the majority of the springs, which indicate that the waters travel in the subsurface along local flow systems. Two springs, which are situated in the foothills, i.e. at lower elevation, show higher dissolved solid content (1115 mg L–1, 481 mg L–1) and higher temperature (15.6°C, 16°C). Their uranium content was also higher, 86–93 mBq L–1. In the case of these springs, the physico-chemical parameters suggest longer travel time, i.e. more time for rock-water interactions which is reflected in their higher dissolved solid and uranium content.
Radon exceeding the 100 Bq L–1 activity concentration was measured in two springs. For the other springs, the radon concentrations were 2-79 Bq L-1.
As all the springs are situated in the regional recharge area of groundwater resources of the area, the study delivered important information regarding the rock-water interactions and the improvement of groundwater quality during subsurface reactions.
How to cite: Molnár, B., Baják, P., Csondor, K., Jobbágy, V., Izsák, B., Vargha, M., Pándics, T., Horváth, Á., and Erőss, A.: Natural radioactivity and rock-water interactions in the springs of Sopron Mountains (Hungary), EGU General Assembly 2022, Vienna, Austria, 23–27 May 2022, EGU22-10471, https://doi.org/10.5194/egusphere-egu22-10471, 2022.
Please decide on your access
Please use the buttons below to download the presentation materials or to visit the external website where the presentation is linked. Regarding the external link, please note that Copernicus Meetings cannot accept any liability for the content and the website you will visit.
Forward to presentation link
You are going to open an external link to the presentation as indicated by the authors. Copernicus Meetings cannot accept any liability for the content and the website you will visit.
We are sorry, but presentations are only available for users who registered for the conference. Thank you.

EGU22-11835 | Presentations | GI6.7
RadHawk: a smart UAV for hunting radioactivityMatteo Albéri, Daniele Cabras, Enrico Chiarelli, Luca Cicala, Tommaso Colonna, Matteo Corbo, Mario De Cesare, Antonio Ferraro, Jacopo Givoletti, Enrico Guastaldi, Andrea Maino, Fabio Mantovani, Massimo Morichi, Michele Montuschi, Kassandra Giulia Cristina Raptis, Filippo Semenza, Virginia Strati, and Franco Vivaldi
Vertical take-off and landing Unmanned Aerial Vehicles (UAVs) for Gamma-Ray Surveys (GRS) provide a cost-effective and timely approach tool for environmental radioactivity mapping. The UAV technique combines the advantages of ground and airborne measurements: there is no need for an airport for take-off and landing, and high spatial resolution surveys can also be performed in dangerous areas without endangering the operators.
The main limitation of existing UAVs for GRS is the lack of software and hardware integration between avionics systems and radiation detectors. RadHawk fills this gap with an advanced mechanical, electronic, and software connection between a specifically developed quadcopter and a digital Multi-Channel Analyzer GammaStream (GS). The GS is coupled with a 2” CeBr3 scintillator having spectral energy resolution ~60% better than that of a NaI for 137C detection. Communication between the GS onboard microcomputer and the drone’s autopilot Pixhawk is achieved through a custom protocol which allows sharing telemetry updates and executing commands.
The best spatial resolution of radiometric data is achieved through a list mode real-time processing that generates, with optimized acquisition time, energy calibrated georeferenced gamma spectra. A radio frequency transceiver module sends data to a control station, where the user can easily control the flight path and check the artificial radionuclides warning for real-time identifying of hotspots.
A post-processing algorithm based on a Full Spectrum Analysis – Maximum Likelihood Estimation was developed to enhance the identification capability of anthropogenic radionuclides and to produce maps of the K, Th and U abundances of the investigated areas.
How to cite: Albéri, M., Cabras, D., Chiarelli, E., Cicala, L., Colonna, T., Corbo, M., De Cesare, M., Ferraro, A., Givoletti, J., Guastaldi, E., Maino, A., Mantovani, F., Morichi, M., Montuschi, M., Raptis, K. G. C., Semenza, F., Strati, V., and Vivaldi, F.: RadHawk: a smart UAV for hunting radioactivity, EGU General Assembly 2022, Vienna, Austria, 23–27 May 2022, EGU22-11835, https://doi.org/10.5194/egusphere-egu22-11835, 2022.
EGU22-12872 | Presentations | GI6.7
Drone-Based Investigation of Uranium Mining Legacies – Recent Developments in the DUB-GEM ProjectBenedikt Preugschat, Malte Ibs-von Seht, Christian Kunze, Robert Arndt, Felix Kandzia, Benjamin Wiens, Sven Altfelder, and Clemens Walther
Uranium mining legacies still pose a significant risk to human health and the environment in certain Central Asian regions. Drone-based methods are well-suited for mapping radionuclides of contaminated sites and for planning, monitoring and quality assurance of remediation measures. In the DUB-GEM project (Development of a UAV-based Gamma spectrometry for the Exploration and Monitoring of Uranium Mining Legacies), which is funded by the Federal Ministry of Education and Research (BMBF), a German interdisciplinary consortium led by the Federal Institute for Geosciences and Natural Resources (BGR) is developing a drone-based detector system for the investigation of contaminated uranium mining and processing legacy sites. The project is co-funded by the Coordination Group for Uranium Legacy Sites (CGULS) program of the International Atomic Energy Agency (IAEA). CGULS coordinates cooperation among IAEA Member States affected by ULS and national and international organizations involved in the management, remediation, or regulatory oversight of ULS. CGULS supports the Central Asian partner countries of DUB-GEM to participate in activities of the DUB-GEM consortium.
The applicability of the system is to be tested in the DUB-GEM partner countries Kyrgyzstan, Kazakhstan, Uzbekistan and Tajikistan. Some of the uranium legacy sites (ULS) in Central Asia, especially those in Kyrgyzstan, are difficult to access due to the mountainous topography. Once fully developed, the system will allow the efficient and safe mapping and monitoring of radioactive contamination at such sites without requiring experts to trek through difficult terrain with heavy equipment, exposing themselves to potential physical and radiological risks.
As part of the DUB-GEM project, two specially designed scintillation detectors were used, each of which can be mounted on the heavy-lift drone which was also custom-built for the project and has a maximum take-off mass (MTOM) of 25 kg. The drone-based gamma spectrometry system was successfully tested at different sites in Germany in autumn 2020 and late summer 2021. In autumn 2021, the system was tested for the first time in Kyrgyzstan (Mailuu Suu) and Kazakhstan (Muzbel’). Despite the technical and logistical challenges, drone surveys with the gamma spectrometers could be flown at three sites. The count rates of the detectors were transmitted in real time to a ground station so that hotspots could be detected during flight.
The resulting maps presented here show the distributions of dose rates and radionuclides of the uranium-238 series, thorium-232 series and potassium-40. Comparison with samples from the ground was used to calibrate the instruments.
The extensive data sets from both detectors offer a multitude of further evaluation possibilities, which are currently being evaluated.
A further airborne survey campaign in Central Asia is planned for late summer 2022 to map legacies in Uzbekistan.
How to cite: Preugschat, B., Ibs-von Seht, M., Kunze, C., Arndt, R., Kandzia, F., Wiens, B., Altfelder, S., and Walther, C.: Drone-Based Investigation of Uranium Mining Legacies – Recent Developments in the DUB-GEM Project, EGU General Assembly 2022, Vienna, Austria, 23–27 May 2022, EGU22-12872, https://doi.org/10.5194/egusphere-egu22-12872, 2022.
EGU22-13202 | Presentations | GI6.7 | Highlight
Investigating a redistribution of naturally occurring radioactive material (NORM) in dwelling wallsJens Fohlmeister and Bernd Hoffmann
Depending on their concentration, naturally occurring radioactive materials (NORM) used for the construction of walls in living rooms may contribute elevated levels of radiation exposure for inhabitants. The main path of exposure by building materials is thought to be due to gamma radiation of 40K and the progenies of the 238U and 232Th decay chains. Many efforts have been focused on developing computational methodologies to evaluate and predict the indoor gamma dose rate. Those studies investigated factors such as concrete density or wall thickness of the material as well as factors relating to the dimensions of the room with respect to gamma ray exposure.
Here, we re-implemented a well-established room model (Mustonen, 1984). This model approximates the gamma ray exposure at any point in a model room by accounting for the source strength, radiation absorption by concrete including build-up factors and the 1/r2 decrease due to the distance to the source. The results of our re-implemented model compare well with other models, which focus on the radiation exposure in the midpoint of the room. In addition to concrete density and wall thickness, we focus our investigation on a non-homogenous distribution of NORM in walls, ceiling and floors. We compare different configurations of NORM distributions with respect to the radiation exposure in the room centre and with the average received within the room at a height of 1.25m.
References:
Mustonen, R. (1984). Methods for evaluation of radiation from building materials. Radiation Protection Dosimetry 7, 235-238.
How to cite: Fohlmeister, J. and Hoffmann, B.: Investigating a redistribution of naturally occurring radioactive material (NORM) in dwelling walls, EGU General Assembly 2022, Vienna, Austria, 23–27 May 2022, EGU22-13202, https://doi.org/10.5194/egusphere-egu22-13202, 2022.
Please decide on your access
Please use the buttons below to download the presentation materials or to visit the external website where the presentation is linked. Regarding the external link, please note that Copernicus Meetings cannot accept any liability for the content and the website you will visit.
Forward to presentation link
You are going to open an external link to the presentation as indicated by the authors. Copernicus Meetings cannot accept any liability for the content and the website you will visit.
We are sorry, but presentations are only available for users who registered for the conference. Thank you.
EGU22-13477 | Presentations | GI6.7
Residence time of groundwater in porous aquifers by estimating Ra retardation factorAlessandra Briganti, Mario Voltaggio, Paola Tuccimei, and Michele Soligo
Groundwater age can differ when determined by radioactive tracers due to different retardation factors. According to Krishnawami et al. 1982, Radon isotopes supply to groundwater is considered as a measure of the supply of Radium isotopes. This assumption considerably affects the estimation of the Ra retardation factor. Briganti et al. 2020 reports how the different groundwater supply mechanisms of Ra and Rn should be considered in order to avoid a relevant variation between the real water residence time and the age calculated. In the same work an alternative method for estimating Ra retardation factor is proposed without using Rn data as a comparison term. A synthesis of the main results of laboratory tests is presented in order to describe possible applications of the method.
References
Briganti A., Voltaggio M., Tuccimei P. & Soligo M. 2020. Radium in groundwater hosted in porous aquifers: estimation of retardation factor and recoil rate constant by using NAPLs. SN Appl. Sci. 2, 1934 (2020). https://doi.org/10.1007/s42452-020-03610-4
Krishnaswami S., Graustein W.S., Turekian K.K., Dowd J.F. 1982. Radium, thorium and radioactive lead isotopes in groundwaters: application to the in situ determination of adsorption-desorption rate constants and retardation factors. Water Resour. Res. 18:1633–1675.
How to cite: Briganti, A., Voltaggio, M., Tuccimei, P., and Soligo, M.: Residence time of groundwater in porous aquifers by estimating Ra retardation factor, EGU General Assembly 2022, Vienna, Austria, 23–27 May 2022, EGU22-13477, https://doi.org/10.5194/egusphere-egu22-13477, 2022.
EGU22-343 | Presentations | ERE1.8
Geotourism assessment of the northwestern part of the Gerecse Mountains, HungaryEdina Hajdú, Gáspár Albert, and Márton Pál
Geotourism is a relatively new sector in tourism, in which visitors are offered earth scientific knowledge when visiting spectacular locations (geosites or geotopes) and participating in various organized activities there. Areas and sites with high geological-geomorphological relevance are usually managed by national parks, geoparks or other types of nature reserves. For this reason, research into the assessment of these sites serves not only the purposes of geoscience but also those of these organisations and, through them, tourism.
The aim of our research was to carry out a quantitative geotourism assessment in the NW part of the Gerecse Mts, Hungary, on an area of 180 km2. As this type of assessment determining geotourism potential has not been made here before, the Gerecse Mountains are still undiscovered in terms of quantitative geotourism values. However, this area has great geodiversity due to its earth scientific richness (its various and spectacular geosites are mainly from the Mesozoic, but Eocene, Miocene and Quaternary sediments are also present). It has strong connections to culture and human activities: it is an important source of building stones since Roman times.
We used analogue geological and topographic maps, publications, and databases to identify potential geosites. The selected sites were ranked based on their types (e.g., cliff, quarry, break of slope) and distance from trails. They were visited on site – omitting the least important ones based on the preliminary categorization. Following the fieldwork, the potential geosites were evaluated based on quantitative assessment models that have been used in Hungary several times. We applied the Geosite Assessment Model (GAM, Vujičić et al., 2011) and the Modified Geosite Assessment Model (M-GAM, Tomič & Božić, 2014). Among objective aspects, the latter involves tourists (from other studies) into the evaluation process, thus giving a more realistic image of the geotourism potential of the given geosite. The final score of an object is built up by scientific, infrastructural and this visitor-based values. In the end of the work, each geosite got an analysis on its improvable characteristics, and a group of them were selected as suitable for later geotourism activities and development.
The results (more than 100 evaluated geotopes) contribute to the geosite cadastral of the Gerecse Mts – providing useful data for the management body – the Duna-Ipoly National Park Diretorate. Suitable protection and tourism activity measures of local earth science values can be planned using our results – these two factors are the base of a good balance between nature and society.
EH is supported by the ÚNKP-21-2 New National Excellence Program of the Ministry for Innovation and Technology from the source of the National Research, Development and Innovation Fund.
Tomić, N., & Božić, S. (2014). A modified Geosite Assessment Model (M-GAM) and its Application on the Lazar Canyon area (Serbia). International Journal of Environmental Research, 8(4), 1041-1052.
Vujičić, M., Vasiljević, D., Marković, S., Hose, T., Lukić, T., Hadžić, O., & Janićević, S. (2011). Preliminary geosite assessment model (GAM) and its application on Fruška Gora Mountain, potential geotourism destination of Serbia. Acta Geographica Slovenica, 51(2), 361-377.
How to cite: Hajdú, E., Albert, G., and Pál, M.: Geotourism assessment of the northwestern part of the Gerecse Mountains, Hungary, EGU General Assembly 2022, Vienna, Austria, 23–27 May 2022, EGU22-343, https://doi.org/10.5194/egusphere-egu22-343, 2022.
Please decide on your access
Please use the buttons below to download the presentation materials or to visit the external website where the presentation is linked. Regarding the external link, please note that Copernicus Meetings cannot accept any liability for the content and the website you will visit.
Forward to presentation link
You are going to open an external link to the presentation as indicated by the authors. Copernicus Meetings cannot accept any liability for the content and the website you will visit.
We are sorry, but presentations are only available for users who registered for the conference. Thank you.
EGU22-2077 | Presentations | ERE1.8
Fusing GEDI, Sentinel-1, Sentinel-2, and elevation data for seasonal forest biomass mapping across AustraliaYuri Shendryk
Accurate mapping of forest aboveground biomass (AGB) is critical for carbon budget accounting, sustainable forest management as well as for understanding the role of forest ecosystem in the climate change mitigation.
In this study, spaceborne Global Ecosystem Dynamics Investigation (GEDI) LiDAR data were used in combination with Sentinel-1 synthetic-aperture radar (SAR) and Sentinel-2 multispectral imagery as well as elevation data to produce a wall-to-wall AGB map of Australia that is more accurate and with higher spatial and temporal resolution than what is possible with any one data source alone. Specifically, the AGB density map was produced that covers the whole extent of Australia at 200m spatial resolution for the Austral winter (June-August) of 2020. To produce this map Copernicus Sentinel-1 and Sentinel-2 composites and ALOS World 3D Digital Surface Model (DSM) were trained with samples from the GEDI Level 4A product.
From GEDI Level 4A data available within Australia between June – August 2020, all measurements not meeting the requirements of L4A product quality, and those with degraded state of pointing or positioning information and an estimated relative standard error in GEDI-derived AGB exceeding 50% were rejected. Mean Sentinel-1 composite was generated using thermal noise corrected, radiometrically calibrated and terrain corrected VV- and VH-polarization backscatter imagery. Similarly, median Sentinel-2 composite was generated using cloud and cloud-shadow free Level-2A imagery, and was further used to calculate Normalized Difference Spectral Indices (NDSIs) from all spectral bands. Finally, aspect and slope were calculated from the DSM.
The boosting tree machine learning model was applied to predict wall-to-wall AGB density map. For each 200m × 200m cell the number of available GEDI measurements was calculated and models were built based on average AGB density of cells containing > 5 GEDI measurements.
Up to ≈62000 cells, each 200m × 200m, were used to train predictive machine learning models of AGB density. The predictive performance of models based on Sentinel-2 imagery only (single-data source) and a fusion of Sentinel-2 with Sentinel-1 imagery and elevation data (multi-data source) was compared. Bayesian hyperparameter optimization was used to identify the most accurate Light Gradient Boosting Machine (LightGBM) model using 5-fold cross-validation.
The single-data source analysis based on Sentinel-2 imagery resulted in AGB density predicted with the coefficient of determination (R2) of 0.74-0.81, root-mean-square error (RMSE) of 40-44 Mg/ha and root-mean-square percentage error (RMSPE) of 45-55%.Model performance improved only marginally with the addition of Sentinel-1 and DSM information: AGB density prediction with R2 of 0.75-0.82, RMSE of 36-41 Mg/ha and RMSPE of 44-48%. Using a SHapley Additive exPlanations (SHAP) approach to explain the output of LightGBM models it was found that Sentinel-2 derived NDSIs using Red Edge and Short-wave Infrared bands were the most important in predicting seasonal AGB density.
Similar model performance is expected for annual prediction of AGB density at a finer resolution (e.g. 100m) due to higher density of GEDI measurements. This research highlights methodological opportunities for combining GEDI measurements with satellite imagery and other environmental data toward seasonal AGB mapping at the regional scale through data fusion.
How to cite: Shendryk, Y.: Fusing GEDI, Sentinel-1, Sentinel-2, and elevation data for seasonal forest biomass mapping across Australia, EGU General Assembly 2022, Vienna, Austria, 23–27 May 2022, EGU22-2077, https://doi.org/10.5194/egusphere-egu22-2077, 2022.
EGU22-2484 | Presentations | ERE1.8
Update on soil carbon balance in Hungarian crop rotation systemsGiulia De Luca, Krisztina Pintér, Szilvia Fóti, Zoltán Nagy, and János Balogh
Long term flux measurements are needed to improve our understanding of the carbon balance of arable lands. The objective of our study was to determine the seasonal dynamics of carbon cycling in a Hungarian cropland and to examine the effect of crop rotation on net ecosystem exchange of CO2 (NEE), furthermore to assess the influences of C outputs and inputs derived from lateral fluxes on soil organic carbon (SOC) stock. In this study we update the results presented in our poster of last year’s conference (EGU21-10977).
The experiment began in 2017 and crop rotation of the measured field consisted of winter wheat (2017-2018 and 2019-2020), rapeseed (2018), sorghum (2019) and sunflower (2021). CO2 fluxes and annual net ecosystem exchange (NEE) of CO2 were measured by a field-scale eddy covariance (EC) station at a Central Hungarian cropland site. Both vertical and lateral C fluxes were taken into account when calculating the net ecosystem carbon budget (NECB).
As presented in our previous study the largest sink activity was observed in the sorghum season (-277 g C m-2 from sowing to harvest). The cropland acted as a source of CO2 during the rapeseed season (140 g C m-2) due to incomplete germination caused by extreme autumnal drought.
We found that during the study period both meteorological variables and lateral carbon fluxes such as C inputs derived from seed and crop residues and outputs (harvest) had significant influence on the C dynamics. The higher temperatures and precipitation amount that characterised the fall of 2019 caused large differences in NEE dynamics for winter wheat when compared to 2017. The impact of climatic factors could be seen in the sunflower period since lack of precipitation in 2021 led to remarkably low carbon uptake.
Fallow periods in total covered a relatively long period of time (approximately 1 year out of the 4 year long study period). These fallow periods had a significant effect on NECB values due to immense C loss. During the four years of our experiment cumulative NEE was -222 g C m-2 and NECB was 726 g C m-2 as carbon loss during fallow periods (437 g C m-2 in total) and carbon export through harvest (964 g C m-2 in total) counterbalanced the crop’s CO2 uptake.
We can conclude that while this Hungarian cropland was a sink of carbon it could not maintain the soil organic carbon content as it was not able to sequester enough carbon to do so. Cover plants and crop residue retention could be a solution to reduce the risk of soil carbon stock depletion but further studies are needed in the field of soil management practices.
How to cite: De Luca, G., Pintér, K., Fóti, S., Nagy, Z., and Balogh, J.: Update on soil carbon balance in Hungarian crop rotation systems, EGU General Assembly 2022, Vienna, Austria, 23–27 May 2022, EGU22-2484, https://doi.org/10.5194/egusphere-egu22-2484, 2022.
EGU22-3398 | Presentations | ERE1.8
A Study on the Selection of Biodiversity Offset Area in Korea - Focusing on Jeju IslandDayong Jeong, Seungyeon Lee, Yujin Shin, and Seongwoo Jeon
Jeju island’s unique and diverse species of flora and fauna and well-preserved natural environment earned Jeju the designation as a UNESCO Biosphere Reserve in December 2002(World Heritage Office & Jeju Special Self-Governing Province, 2016). To achieve no net loss and preferably a net gain of this outstanding biodiversity, ‘biodiversity offsets’ can be implemented(BBOP, 2009). Until now, there have been attempts in Korea to introduce the concept of offset, such as the establishment of the ‘Total Natural Resource Conservation’(Lee et al., 2020), but studies on the specific criteria or method of biodiversity offset area are insufficient. It is desirable not to prepare offset area whenever damage occurs, but to select them in consideration of ecological connectivity, environmental functional aspects, and socio-cultural continuity in the planning process(Lee et al., 2020). Therefore, we intend to select the offset area of Jeju Island using the methodology of Pilgrim et al (2012), which derives the relative offsetability in consideration of the biodiversity conservation concern, residual impact magnitude, theoretical offset opportunity, practical offset feasibility. Potential offset area derived from previous studies has already reflected the concept of biodiversity conservation concern, including vulnerability and irreplaceability. Through the Environmental Impact Assessment(EIA) of Jeju Island, the type of development that had a significant impact on biodiversity is selected as an example, and the impact magnitude of the development type is identified. In addition, offset opportunity is derived by considering functional area and natural distribution, and offset feasibility is derived by factors such as developer capacity and financing. Finally, the relative offsetability is evaluated and the offsetability map is established. The characteristics of offset areas are analyzed using the established offsetability map. For instance, the size and patterns of sites with high offsetability can be studied. As a result, the offsetability map is established by evaluating the relative offsetability of potential offset areas. Therefore, it is possible to specifically find where the biodiversity offset is available in Jeju Island, and to identify the offset priority through comparison of the relative offsetability between the selected offset sites. By analyzing the characteristics of the offset area, it is possible to identify what characteristics increase the offsetability, how large it should be to have high offsetability, and what patterns exist between the selected offset areas. This study shows the specific offset area selection process, and through this, it will help to create a roadmap for selecting a site for a biodiversity offset where the biodiversity offset concept was not introduced into the policy. This work was supported by the Korea Environment Industry and Technology Institute (KEITI) through the Decision Support System Development Project for Environmental Impact Assessment, funded by the Korea Ministry of Environment (MOE) (No. 2020002990009). This work was Supported by a Korea University Grant.
How to cite: Jeong, D., Lee, S., Shin, Y., and Jeon, S.: A Study on the Selection of Biodiversity Offset Area in Korea - Focusing on Jeju Island, EGU General Assembly 2022, Vienna, Austria, 23–27 May 2022, EGU22-3398, https://doi.org/10.5194/egusphere-egu22-3398, 2022.
EGU22-3421 | Presentations | ERE1.8
Mapping the Biodiversity Conservation Value for Potential Offset AreaYu Jin Shin, Seungyeon Lee, Dayong Jeong, and Seongwoo Jeon
Jeju Island, the research area, has been registered as a UNESCO World Natural Heritage Site and has high biodiversity and ecological value, such as designation as a global geopark and biosphere reserve. It also has a beautiful landscape, so it is not only necessary for conservation but also highly demanded as a landscape resource (Kim et al., 2015; Ko, 2011). Accordingly, it is necessary to prioritize the conservation area that can reconcile the conflict between indiscriminate development and nature protection, as well as to establish potential offset sites for ‘No Net Loss’ in order to respond to development impacts. Selecting conservation areas based on biodiversity value can be an effective offset decision-making tool on where and how to prioritize conservation policies (Li et al., 2021; SANBI & UNEP-WCMC, 2016). There have been many studies on biodiversity conservation between excellent ecological value and development pressure in Jeju Island, but there are almost no studies on the implementation conditions of the offset or offset sites. We here aim to map a conservation area map in consideration of the environmental characteristics of Jeju Island and to select a potential offset area that can practically work offset. We will use ‘Zonation’ program, which is a systematic conservation planning-based model. Zonation is a useful land planning tool that can minimize development impact and realize biodiversity offset (Wintle, 2008; Lethomaki & Moilanen, 2013). The biodiversity attributes inputs required for running Zonation are potential habitat data using MaxEnt and environmental variable data. As a result, we will identify the spatial range and location of the potential biodiversity offset area through Zonation Priority Rank Map output. In addition, we can also analyze their spatial and environmental characteristics, and group out the shape of potential offset site composition (size or pattern). This study can be utilized as a basis for feasible offset policy by proposing potential offset areas through selecting conservation areas in Jeju Island. This work was conducted with the support of the Korea Environment Industry & Technology Institute (KEITI) through its Urban Ecological Health Promotion Technology Development Project, and funded by the Korea Ministry of Environment (MOE) (2020002770003).
How to cite: Shin, Y. J., Lee, S., Jeong, D., and Jeon, S.: Mapping the Biodiversity Conservation Value for Potential Offset Area, EGU General Assembly 2022, Vienna, Austria, 23–27 May 2022, EGU22-3421, https://doi.org/10.5194/egusphere-egu22-3421, 2022.
EGU22-3656 | Presentations | ERE1.8
Comparing the spatio-temporal differences of global NPP simulation data with different resolutionsTao Zhou, Xiaolu Tang, Yuting Hou, Xinrui Luo, Zhihan Yang, Yunsen Lai, Peng Yu, Ke Luo, and Runying Zhao
*Corresponding author: Xiaolu Tang (lxtt2010@163.com)
Net primary productivity (NPP) is a key parameter to characterize terrestrial ecological processes. NPP reflects the carbon sequestration capacity of vegetation to absorb atmospheric carbon dioxide, and plays an important role in mitigating atmospheric carbon dioxide content. Currently, the majority of studies focused on the model efficiency total NPP at the global scale. However, whether the model resolution of NPP affects the NPP amount at the global is still uncertainty. To fill this knowledge gap, we first collected 3307 NPP field observations from published literatures, and then model NPP using climate, soil, and vegetation variables using Random Forest (RF) to predicted global NPP at the spatial resolutions of 0.05°, 0.25° and 0.5°. Results showed that RF could well capture the spatial and temporal variability of NPP with the model efficiencies (R2) of 0.55, 0.52 and 0.53 for at the resolution of 0.05°, 0.25° and 0.5°, respectively. Similar spatial patterns were also found for NPP at different spatial resolutions and NPP decreased with increased latitude where the highest NPP was found in the tropical regions and the lowest NPP were distributed in high latitude areas, e.g. alpine tundra. However, a great difference was found for the magnitude of NPP resulting a great difference in total global NPP of 71.5, 78.6, 87.7 Pg C year-1 from 1981 to 2016 for the resolutions of 0.05°, 0.25° and 0.5°, respectively. These findings suggested the challenges to improve modelling accuracies of the global carbon fluxes used appropriate resolutions.
Keywords: Net primary productivity; Different resolutions; Random Forest; Spatial pattern; Appropriate resolution;
Acknowledgment: the study was supported by the National Science Foundation of China (31800365).
How to cite: Zhou, T., Tang, X., Hou, Y., Luo, X., Yang, Z., Lai, Y., Yu, P., Luo, K., and Zhao, R.: Comparing the spatio-temporal differences of global NPP simulation data with different resolutions, EGU General Assembly 2022, Vienna, Austria, 23–27 May 2022, EGU22-3656, https://doi.org/10.5194/egusphere-egu22-3656, 2022.
Please decide on your access
Please use the buttons below to download the presentation materials or to visit the external website where the presentation is linked. Regarding the external link, please note that Copernicus Meetings cannot accept any liability for the content and the website you will visit.
Forward to presentation link
You are going to open an external link to the presentation as indicated by the authors. Copernicus Meetings cannot accept any liability for the content and the website you will visit.
We are sorry, but presentations are only available for users who registered for the conference. Thank you.
EGU22-4378 * | Presentations | ERE1.8 | Highlight
From SDGs to IDGs: Translating global Sustainable Development Goals for water, food and energy to river basin specific Indus Development GoalsArthur Lutz, Wouter Smolenaars, Sanita Dhaubanjar, Khalid Jamil, Hester Biemans, Fulco Ludwig, and Walter Immerzeel
The UN Sustainable Development Goals (SDGs) are a powerful concept to drive action towards a more sustainable future. However, the SDGs are formulated in a qualitative and generic way whereas specific and quantitative definitions of targets are required to steer policy and practice.
The Indus river basin is a global hotspot for future climate change and socioeconomic development. The basin has the largest continuous irrigation scheme in the world, and hydropower is developing rapidly with a large hydropower potential still untapped. Therefore, water, food and energy are strongly interlinked in the basin’s water-food-energy nexus. The basin already faces insecurity of water, food and energy in the present situation, and with strong projected climate and socioeconomic change, achieving the SDGs for these three resources in the basin will be challenging.
Here we present a novel approach to translate the global SDGs for water, food and energy (SDGs 2, 6 and 7) to quantitative targets specified for the Indus river basin. Our approach is based on a resource accounting framework operating at sub-basin scale and monthly time step, combining models and geospatial data. The approach uses ensembles of downscaled projections for three climate change scenarios driving water availability and three sets of downscaled projections of socioeconomic drivers, including population and GDP, as main drivers for the demand for water, food and energy. The accounting framework considers dependencies between the three resources and represents scenario-specific exchange of resources between sub-basins in this transboundary river basin. The approach results in scenario-specific quantitative targets for water, food and energy to be realized to achieve the three related SDGs at the river basin scale.
How to cite: Lutz, A., Smolenaars, W., Dhaubanjar, S., Jamil, K., Biemans, H., Ludwig, F., and Immerzeel, W.: From SDGs to IDGs: Translating global Sustainable Development Goals for water, food and energy to river basin specific Indus Development Goals, EGU General Assembly 2022, Vienna, Austria, 23–27 May 2022, EGU22-4378, https://doi.org/10.5194/egusphere-egu22-4378, 2022.
EGU22-5400 | Presentations | ERE1.8
openghgmap.net - Estimating CO2 Emissions for 108,000 European CitiesDaniel Moran, Peter-Paul Pichler, Heran Zheng, Helene Muri, Jan Klenner, Diogo Kramel, Johannes Többen, Helga Weisz, Thomas Wiedmann, Annemie Wykmans, Anders Hammer Strømman, and Kevin R. Gurney
City-level CO2 emissions inventories are foundational for supporting the EU’s decarbonization goals. Inventories are essential for priority setting and for estimating impacts from the decarbonization transition. Here we present a new CO2 emissions inventory for all 116,572 municipal and local government units in Europe, containing 108,000 cities at the smallest scale used. The inventory spatially disaggregates the national reported emissions, using 9 spatialization methods to distribute the 167 line items detailed in the National Inventory Reports (NIRs) using the UNFCCC Common Reporting Framework (CRF). The novel contribution of this model is that results are provided per administrative jurisdiction at multiple administrative levels, following the region boundaries defined OpenStreetMap, using a new spatialization approach. Project website: openghgmap.net
How to cite: Moran, D., Pichler, P.-P., Zheng, H., Muri, H., Klenner, J., Kramel, D., Többen, J., Weisz, H., Wiedmann, T., Wykmans, A., Strømman, A. H., and Gurney, K. R.: openghgmap.net - Estimating CO2 Emissions for 108,000 European Cities, EGU General Assembly 2022, Vienna, Austria, 23–27 May 2022, EGU22-5400, https://doi.org/10.5194/egusphere-egu22-5400, 2022.
EGU22-6287 | Presentations | ERE1.8
A global assessment of spatiotemporal uncertainties in Land Cover – a key indicator for monitoring sustainable developmentcaterina barrasso, ruben remelgado, and carsten meyer
Land cover (LC) is an important indicator to reach several of the targets under the Global Goals. Accurate global LC time-series are thus vital to monitor sustainable development. Although the number and quality of open-access, remotely sensed LC products is increasing, all products have uncertainties due to widespread classification errors. However, the relative magnitude of uncertainties among exiting LC products is largely unknown, which hampers their confident selection and robust use for sustainable development evaluation and planning. To close this gap, we quantified region-, time-period-, and coarse-LC class-specific data uncertainties for the 10 most widely used global LC time-series. To this end, we developed a novel multi-scale validation framework that accounts for differences in mapping resolutions and scale mismatches between the spatial extent of map grid cells and validation samples. We aimed for a fair validation assessment by carefully evaluating the quality of our validation samples with respect to landscape heterogeneity that LC products often fail to classify accurately. To address the issue, we supported the validation assessment with Landsat-based measures of cross-scale spectra similarity. The metric was computed by taking advantage of the full Landsat archive in Google Earth Engine. We base our assessment on more than 1.8 million globally integrated LC validation sites, where we mobilized around 2.8 million samples during the period 1980-2020 composed by hundreds of sampling effort of varied nature, from field surveys to crowdsourcing campaigns. Here, we will present the results of the assessment, providing insights on global and regional patterns of LC uncertainties. We found that no single product is more accurate over the others in mapping all LC classes, regions and time-periods. We will provide recommendations on the selection of fit-for-purpose LC time-series, and discuss future strategies for addressing their uncertainties in sustainable development evaluation and planning.
How to cite: barrasso, C., remelgado, R., and meyer, C.: A global assessment of spatiotemporal uncertainties in Land Cover – a key indicator for monitoring sustainable development, EGU General Assembly 2022, Vienna, Austria, 23–27 May 2022, EGU22-6287, https://doi.org/10.5194/egusphere-egu22-6287, 2022.
EGU22-6413 | Presentations | ERE1.8
Carbon sequestration potential of Miscanthus application as biofuel source in SwedenAli Mohammadi
Abstract
Sweden aims to achieve net zero GHG emissions by 2045. To do this, one strategy could be increasing the biomass contribution in energy sector as approximately 75% of total greenhouse gas (GHG) emissions are related to energy consumption. Therefore, it is beneficial to explore efficient ways to upgrade biomass materials into high value-added bioenergy. This study considers the potential of Miscanthus cultivation and its application as biofuel materials in Sweden in terms of carbon sequestration and contribution in climate impact mitigation. Miscanthus, as an energy crop with relatively low maintenance requirements and a high dry matter yield and energy content, can play a major role in the sustainable development of biofuels. Using Miscanthus for energy, results in avoiding fossil fuel combustion and the corresponding GHG emissions. The results of this assessment demonstrated that the Miscanthus cultivation contributes in soil organic carbon sequestration by over one tonne carbon ha−1 yr−1 which results in mitigating a significant amount of soil CO2 fluxes. Therefore, the adaption of Miscanthus biomass, would directly contribute in UN Goal 7, affordable and clean energy, and Goal 13, climate action due to a significant reduction in GHG emissions. The integration of Miscanthus plant into the landscape may stimulate the economy of rural areas in the country and offer more profit than afforestation and reforestation on abandoned and marginal croplands.
Keywords: Energy crops, Climate change, Bioenergy, Soil organic carbon, Ecosystem services
How to cite: Mohammadi, A.: Carbon sequestration potential of Miscanthus application as biofuel source in Sweden, EGU General Assembly 2022, Vienna, Austria, 23–27 May 2022, EGU22-6413, https://doi.org/10.5194/egusphere-egu22-6413, 2022.
EGU22-7143 | Presentations | ERE1.8
The division of dry and wet areas of evergreen broad-leaved forest in Sichuan Provinceshiqi zhang
The topography of Sichuan Province is extremely complex, with a rich variety of vegetation, and its vegetation shows a clear horizontal and vertical distribution structure. The subtropical evergreen broad-leaved forest is the zonal vegetation of Sichuan. In 1980, according to the field survey data, forestry scientists roughly divided the evergreen broad-leaved forest in Sichuan Province into Erlang Mountain, Daxiangling Mountain, Xiaoliang Mountain or Huangmaogeng. It was divided into a dry evergreen broad-leaved forest in the west and a moist evergreen broad-leaved forest in the east. However, there is no quantitative classification of wet and dry evergreen broad-leaved forests in Sichuan. The traditional forest vegetation survey mainly relies on manual field survey, which has a long period, high cost, and consumes a lot of manpower and material resources. Remote sensing technology, with its wide coverage, large amount of information and short update cycle, brings the possibility of rapid and accurate quantitative classification of wet and dry evergreen broad-leaved forests. In this paper, based on the field survey data of evergreen broad-leaved forests in Sichuan Province, we combined NASADEM_HGT elevation data and Landsat8 images to perform SCS+C topographic correction on remote sensing images of the whole region of Sichuan on the Google earth engine cloud computing platform, and also based on the differences in spectral, textural and temporal characteristics between dry and wet evergreen broad-leaved forests. The experimental results were compared with the field survey data and obtained excellent accuracy, and it provides a strong technical support for vegetation mapping and forestry resources investigation and monitoring, and also lays a certain foundation for the classification of complex mountain forest vegetation.
How to cite: zhang, S.: The division of dry and wet areas of evergreen broad-leaved forest in Sichuan Province, EGU General Assembly 2022, Vienna, Austria, 23–27 May 2022, EGU22-7143, https://doi.org/10.5194/egusphere-egu22-7143, 2022.
EGU22-7343 | Presentations | ERE1.8
Conceptualising the management of climate extreme events through the GIS-based digital twin systemKhurram Riaz, Marion McAfee, Iulia Anton, and Salem Gharbia
Climate change has been recognised for decades, and environmental risks related to it are expected to become more common over time as the world's population continues to grow. This tendency is compounded by people congregating in areas such as coastal regions, which are becoming increasingly vulnerable due to climate change. It is demonstrated that overpopulated regions need robust early warning systems representing the region's complex systems to allow all stakeholders to receive the correct information and respond appropriately and quickly under extreme climate events to avoid losing lives and property. The concept of a 'digital twin' is proposed as an accurate virtual representation of the effect of climate events on a specific region, which can be used as a tool to achieve better resilience of cities against extreme events. A digital twin can be created by combining data from various IoT sensors and artificial intelligence with a city model to represent a digital replica of the actual world. This paper presents an up-to-date picture of the GIS-based digital twin technology developed in the last decade for the early warning of extreme climate events worldwide and their integration with the smart city management systems. The findings suggest that GIS-based digital twin technology for severe climate hazard early warning is an emerging method. Yet, it has gained prominence in recent years due to developments in technology, software development, and communication technologies. However, much more research on digital twins is necessary to create a more effective early warning system approach. This paper highlights a potential framework for the development, implementation, and application of GIS-Based digital twins in climate resilience management in coastal regions.
How to cite: Riaz, K., McAfee, M., Anton, I., and Gharbia, S.: Conceptualising the management of climate extreme events through the GIS-based digital twin system, EGU General Assembly 2022, Vienna, Austria, 23–27 May 2022, EGU22-7343, https://doi.org/10.5194/egusphere-egu22-7343, 2022.
EGU22-9721 | Presentations | ERE1.8
Modeling Aboveground Biomass and carbon sequestration at local and national scale with in-situ and remote sensing dataLuca Foresta, Sake Alkema, Niels Anders, Rens Masselink, Vincent Schut, Sacha Takacs, and Arjen Vrielink
Monitoring carbon release and sequestration is now more important than ever. Not only to confirm that carbon sinks remain intact or vulnerable ecosystems do not further degrade, but also to keep track of our journey towards carbon neutrality, where increasing efforts to offset CO2 emissions have been initiated. Amongst a number of solutions, carbon trading schemes have been introduced, such as the EU Emission Trading System that is used in programs where local smallholder farmers benefit from transitioning towards agroforestry. Critical to the success of such programs is the use of accurate, scalable and transparent remote sensing technologies that objectively monitor the carbon that trees in a given plot of land have removed from the atmosphere.
At Satelligence, we exploit radar and optical satellite data worldwide and at scale to empower clients to combat deforestation and decrease carbon losses, as well as to protect biodiversity and prevent land degradation. In this contribution, we will present our approach to model Aboveground Biomass (AGB) over tropical moist forests at (sub) national scale based on data from several Earth Observation missions (GEDI, Sentinel-1, Sentinel-2, Landsat) and machine learning models. In-situ data, where available, are integrated to improve models at local and regional scales. We will show preliminary results of modeled AGB and carbon sequestration over large areas as well as individual agricultural plots for selected countries in Africa and South America.
How to cite: Foresta, L., Alkema, S., Anders, N., Masselink, R., Schut, V., Takacs, S., and Vrielink, A.: Modeling Aboveground Biomass and carbon sequestration at local and national scale with in-situ and remote sensing data, EGU General Assembly 2022, Vienna, Austria, 23–27 May 2022, EGU22-9721, https://doi.org/10.5194/egusphere-egu22-9721, 2022.
EGU22-11084 | Presentations | ERE1.8
Terrestrial net primary productivity dynamics under climatic variability and urban expansion in western HimalayaSonali Sharma, Pawan Kumar Joshi, and Christine Fürst
The western Himalaya is one of the most climate-sensitive and ecologically vulnerable ecosystems of the world. In the recent past, the region has undergone rapid alterations owing to climate change and paced urbanization. These alterations have significantly impacted Terrestrial Net Primary Productivity (TNPP) of the region. The present study takes the emerging urbanizing centers: Pithoragarh (Uttarakhand) and Dharamsala (Himachal Pradesh), situated in Indian western Himalaya to estimate TNPP dynamics of various land use classes. The study demonstrates usage of Enhanced Spatial and Temporal Adaptive Reflectance Fusion Model (ESTARFM) for predicting a high spatio-temporal Normalised Difference Vegetation Index (NDVI) imagery obtained by fusing spatial details of Landsat NDVI and temporal details of Moderate Resolution Imaging Spectroradiometer (MODIS) NDVI images. The predicted NDVI showed a good agreement with actual Landsat NDVI (R2=0.64 and 0.89; RMSE: 0.09 and 0.04; p < 0.01 for Dharamsala and Pithoragarh, respectively), therefore was reliable for TNPP estimations. This was assimilated in Carnegie Ames Stanford Approach (CASA) model for TNPP estimation for the years 2001 to 2019. The preliminary results show a net loss in TNPP in both of the urbanizing centers. During the study period 2001-2019, TNPP fluctuated annually and showed a decreasing trend of 1475.77 g C m-2 year-1 and 790.84 g C m-2 year-1 in Dharamsala and Pithoragarh, respectively. Among the forest vegetation classes, Oak the most dominant forest class experienced the highest decline in TNPP accounting for 67.55% and 34.04% of net TNPP loss in Dharamsala and Pithoragarh, respectively. The urban expansion contributed to 14.77% (Dharamsala) and 9.77% (Pithoragarh) decline of net TNPP loss. The results provide a better understanding of spatio-temporal dynamics of TNPP consequent to climatic variability and urbanization and provide a theoretical reference for future urban planning.
How to cite: Sharma, S., Joshi, P. K., and Fürst, C.: Terrestrial net primary productivity dynamics under climatic variability and urban expansion in western Himalaya, EGU General Assembly 2022, Vienna, Austria, 23–27 May 2022, EGU22-11084, https://doi.org/10.5194/egusphere-egu22-11084, 2022.
Please decide on your access
Please use the buttons below to download the presentation materials or to visit the external website where the presentation is linked. Regarding the external link, please note that Copernicus Meetings cannot accept any liability for the content and the website you will visit.
Forward to presentation link
You are going to open an external link to the presentation as indicated by the authors. Copernicus Meetings cannot accept any liability for the content and the website you will visit.
We are sorry, but presentations are only available for users who registered for the conference. Thank you.
EGU22-11923 | Presentations | ERE1.8
A multiscale approach for discovery of illegal micro-dumps based on satellite detectionsDonato Amitrano, Cesario Vincenzo Angelino, Luca Cicala, Francesco Gargiulo, Gabriella Gigante, Francesco Nebula, Roberto Palumbo, Sara Parrilli, Domenico Pascarella, Gianpaolo Pigliasco, and Francesco Tufano
Satellite remote sensing allows for large scale monitoring with low cost and high revisit time. However, in some applications, it does not provide all the information needed by the analyst for the full characterization of the problem due to, as an example, insufficient resolution or lack of specific measurements. This can lead to inaccuracies in classification and/or detection tasks. Nevertheless, satellite data can be used to guide subsequent discovery, recognition and characterization actions, defining potential areas of interest of limited extension that can be furtherly investigated with on-site strategies. This work presents an innovative framework showing how to use incomplete and inaccurate information extracted by satellite images in order to address on-ground discovery actions aimed to the mapping and the characterization of illegal micro-dumps in Campania Region (Italy). In particular, high-resolution images up to 50 cm resolution are exploited to detect potential micro-dumps by means of a statistical learning method based on spatial features. The detection map is then used to create a priority map based on environmental risk considerations, such as the extension of the area interested by the dump and its proximity to urban settlements, and previous risk mitigation actions. This information is ingested by a planning system in order to allocate and calculate patrolling routes based on the available manpower and vehicles for on-site surveying. The survey is implemented by means of drones equipped with payloads and software allowing for real-time three-dimensional reconstruction of the scene and volumetric estimations. This provides further data to assess the real dangerousness of the site giving to decision makers essential information to plan remediation actions. The system is demonstrated through a case study showing all the stages of the decision process.
How to cite: Amitrano, D., Angelino, C. V., Cicala, L., Gargiulo, F., Gigante, G., Nebula, F., Palumbo, R., Parrilli, S., Pascarella, D., Pigliasco, G., and Tufano, F.: A multiscale approach for discovery of illegal micro-dumps based on satellite detections, EGU General Assembly 2022, Vienna, Austria, 23–27 May 2022, EGU22-11923, https://doi.org/10.5194/egusphere-egu22-11923, 2022.
EGU22-12071 | Presentations | ERE1.8
Increasing spatial and temporal resolution in energy system optimization model for energy access – the case of KenyaNandi Moksnes, Mark Howells, and Will Usher
Energy has been identified as an enabler for several of the Sustainable Development Goals (SDGs). Globally, 759 million people (2019) still lack access to electricity. Energy planning is important to describe the pathway to achieve the nations goals, where energy systems models are important tools to explore scenarios and provide insight. Until recently, modelling energy access with low electrification rate was conducted either at low spatial (e.g. national) or temporal resolution (e.g. annual time slices). The central grid is often modelled as a black box with approximate optimization methods. This is recognised as unsuitable for understanding integration of technological alternatives to a centralised grid, including distributed generation and mini-grids/renewables. However, methods to model national energy systems at very high spatial and temporal resolutions are data and computation intensive. At the same time increased transparency on the data and code behind these models and insight is important as energy infrastructure is both capital intensive and strategic for the nation.
In this paper we investigate the use of OSeMOSYS, an open-source energy systems model, and increase the spatial resolution while keeping a medium time resolution. OSeMOSYS is a linear programming model and conveniently finds the global optimum in contrast to approximate methods. The approach provides insights into the trade-offs across supply and demand. The model generation is available in an open-source repository where results can be reproduced.
For this paper we use Kenya as our case study where still 16 million people lack access to electricity (2019). We select the spatial resolution to 378 supply cells (40x40km square cells) which leads to 591 demand cells split between electrified and un-electrified. The modelled number of seasons are 12 and the day is split into 3 slices: day, evening, and night, leading to 36 time slices. Specific demand profiles for electrified and un-electrified are assessed in combination with location specific supply options (expansion from the grid, PV, wind, diesel gensets).
Our preliminary results show that the varying un-electrified demand profile, with a high evening peak and low night-time demand, hybrid solutions are preferred with more than one supply option to meet the demand. The expansion of the grid to cells located far away is not motivated due to the low expected consumption, therefore decentralized supply options are required to serve at a high service level.
The results highlight the need for further work to investigate the sensitivity of the spatial and temporal resolutions in combine in energy systems optimization models.
How to cite: Moksnes, N., Howells, M., and Usher, W.: Increasing spatial and temporal resolution in energy system optimization model for energy access – the case of Kenya, EGU General Assembly 2022, Vienna, Austria, 23–27 May 2022, EGU22-12071, https://doi.org/10.5194/egusphere-egu22-12071, 2022.
EGU22-12177 | Presentations | ERE1.8
SOMERS: Monitoring greenhouse gas emission from the Dutch peatland meadows on parcel levelGilles Erkens, Roel Melman, Siem Jansen, Jim Boonman, Ype van der Velde, Mariet Hefting, Joost Keuskamp, Merit van den Berg, Jan van den Akker, Christian Fritz, Huite Bootsma, Ralf Aben, Rudi Hessel, Ronald Hutjes, Sanneke van Asselen, Sarah Faye Harpenslager, Bart Kruijt, and Nobv consortium
Following the Paris Agreement (2015) that aims to limit climate warming, the Dutch government presented a National Climate Agreement in 2019. This agreement stated the overall ambition of reducing the national greenhouse gas emission by 49% in 2030 (compared to 1990) and allocates this reduction target to different sectors, such as industry, mobility, agriculture or land use. Within the latter sector, the peatland meadows are currently estimated to contribute ~4.6 to 7 Mton per year of CO2 to the national Dutch greenhouse gas emission. In the National Climate Agreement, the aim is to reduce the net CO2 emission from the peatland meadows with 1 Mton per year by 2030.
To comply with the greenhouse gas emission reduction targets for peatlands, a set of measures that raise groundwater levels are currently being proposed and tested in pilots. The Dutch National Research Programme on Greenhouse Gas Emissions from Peat Meadows (NOBV) investigates the effects of the proposed measures on the greenhouse gas emission balance under different environmental conditions. In the National Climate Agreement, it was decided that annual progress made in reducing greenhouse gas emissions needs to be monitored. The NOBV consortium is developing a registration system for this monitoring and presents it current status and ideas for future development in this contribution.
The registration system SOMERS (Subsurface Organic Matter Emission Registration System) is based on a multi-model ensemble approach. Using numerical models that simulate groundwater and carbon dynamics, the CO2 emission as a result of peat decomposition is calculated. Within SOMERS, existing models are supplemented by two newly developed models for assessing groundwater dynamics and peat decomposition, that require limited data input and have a short runtime. The new models simulate at parcel resolution and together are used to make a multi-model ensemble estimate of annual, national peatland greenhouse gas emissions since 2016 (the reference year). The new models are tested with annual carbon flux estimates. In the long run, we envisage to fully couple the modelling approach with the automated field measurements that are being collected in a new national measurement network.
In this contribution, SOMERS will be introduced, and the calibration and validation approach will be discussed. We present predictions, under idealized average weather conditions, to establish effects of proposed mitigation measures. This directly serves policy development in regional spatial plans for the Dutch peatland meadows. Lastly, a first national peatland CO2 emission budget based on SOMERS is presented, which after some further development may support LULUCF-sector reporting in the Netherlands.
How to cite: Erkens, G., Melman, R., Jansen, S., Boonman, J., van der Velde, Y., Hefting, M., Keuskamp, J., van den Berg, M., van den Akker, J., Fritz, C., Bootsma, H., Aben, R., Hessel, R., Hutjes, R., van Asselen, S., Harpenslager, S. F., Kruijt, B., and consortium, N.: SOMERS: Monitoring greenhouse gas emission from the Dutch peatland meadows on parcel level, EGU General Assembly 2022, Vienna, Austria, 23–27 May 2022, EGU22-12177, https://doi.org/10.5194/egusphere-egu22-12177, 2022.
EGU22-12962 | Presentations | ERE1.8
Green pearls: digital support for reforestationDjamilja Oud, Angelina Savchuk, Simon Quesseveur, Abdoul Aziz Mounkaila Issaka, and Marc van den Homberg
Haiti faces extreme land degradation, making the country prone to natural hazards and poverty, both undeniably linked. The Haitian Red Cross partnered with the Netherlands Red Cross, 510, and Commonland to roll out a long-term landscape restoration program. Over two decades, this program aims to realize 30 ‘Green Pearls. These are areas where best practices on restoration are combined to retrieve healthy landscapes, making communities more resilient and empowering people economically. Landscape restoration happens in small areas through planting trees and bushes. To carefully identify reforestation zones with the highest possible potential success rate, GIS-based site suitability analysis is applied using several indicators: Elevation (Slope), Soil (Soil PH, Soil Texture, Soil Bulk Density), and Climate (Solar Radiation, Temperature, Rainfall). Data on these indicators was obtained from different, often satellite-based data sources. All resulting layers (maps) per indicator are by default processed as equally important. However, the analysis can be tailored to produce different outcomes depending on the reclassification and weights given by experts to specific indicators. For the La Vallée de Jacmel region in the Haiti case, weighting was applied with the help of local experts. The output is a raster map indicating the locations for planting trees divided into five classes (from most suitable to least suitable). Currently, social indicators such as land ownership are not yet included. Our site suitability method is set up as a model using only open data from global datasets and is, therefore, replicable to other areas. The default model has also been applied to a similar case in the Kayes region in Mali. However, local knowledge on the significance of specific indicators remains indispensable input for the reforestation model. Overall, the site suitability method has proven to be a very useful digital support for holistic land restoration.
How to cite: Oud, D., Savchuk, A., Quesseveur, S., Mounkaila Issaka, A. A., and van den Homberg, M.: Green pearls: digital support for reforestation, EGU General Assembly 2022, Vienna, Austria, 23–27 May 2022, EGU22-12962, https://doi.org/10.5194/egusphere-egu22-12962, 2022.
EGU22-13558 | Presentations | ERE1.8
A comparative analysis of urban environmental quality of developing cities of India: A geospatial approachSrashti Singh and Kamal Jain
Excessive growth in the global human population and eventually urbanisation has become a serious threat to the environment. These situations arise especially in the rapidly developing nations, India being one of them. A higher population naturally poses a high pressure on the environment directly or indirectly, which is a threat for the sustainable development of the country. Most Indian cities face environmental sustainability challenges. Most cities in India are presently going through rapid urbanization and industrialization which leads to environmental degradation of the city. The objective of this study is to analyse the environmental quality of the selected developing cities and also compare the intensity to which they are affected by urbanisation. The study is performed using satellite-based remote sensing data. Initially, Landsat data is used for the years 2001 to 2021 and is utilized for studying the LULC (land use land cover) transformations. MODIS data products are used at 1 km resolution to extract the biophysical indicators (BI) such as normalized difference vegetation index (NDVI) and land surface temperature (LST). MODIS data for PM2.5 is also utilised and finally, an index is calculated to represent the comprehensive environmental quality of the selected cities (CEQI). The yearly and decadal changes in the values of this index is mapped. The LULC transformations depicted a phenomenal decay in the greenness and an increase in the urban built-up area of the city. The CEQI variations and temporal trends reveal the significant deterioration of the overall environmental conditions in most of the cities. This is due to the change in gentrification patterns and also the change in urbanization and the greenness of the city. The study suggests that emission control strategies and urban greening can significantly contribute to enhancing urban environmental quality, especially in rapidly developing cities. The measures suggested to improve the environmental quality can help the policy-makers in the sustainable planning of the city.
How to cite: Singh, S. and Jain, K.: A comparative analysis of urban environmental quality of developing cities of India: A geospatial approach, EGU General Assembly 2022, Vienna, Austria, 23–27 May 2022, EGU22-13558, https://doi.org/10.5194/egusphere-egu22-13558, 2022.
Please decide on your access
Please use the buttons below to download the presentation materials or to visit the external website where the presentation is linked. Regarding the external link, please note that Copernicus Meetings cannot accept any liability for the content and the website you will visit.
Forward to presentation link
You are going to open an external link to the presentation as indicated by the authors. Copernicus Meetings cannot accept any liability for the content and the website you will visit.
We are sorry, but presentations are only available for users who registered for the conference. Thank you.
EGU22-279 | Presentations | GM2.7
Assessment of sensor pre-calibration to mitigate systematic errors in SfM photogrammetric surveysJohannes Antenor Senn, Jon Mills, Claire L. Walsh, Stephen Addy, and Maria-Valasia Peppa
Remotely piloted airborne system (RPAS) based structure-from-motion (SfM) photogrammetry is a recognised tool in geomorphological applications. However, time constraints, methodological requirements and ignorance can easily compromise photogrammetric rigour in geomorphological fieldwork. Light RPAS mounted sensors often provide inherent low geometric stability and are thus typically calibrated on-the-job in a self-calibrating bundle adjustment. Solving interior (lens geometry) and exterior (position and orientation) camera parameters requires variation of sensor-object distance, view angles and surface geometry.
Deficient camera calibration can cause systematic errors resulting in final digital elevation model (DEM) deformation. The application of multi-sensor systems, common in geomorphological research, poses additional challenges. For example, the low contrast in thermal imagery of vegetated surfaces constrains image matching algorithms.
We present a pre-calibration workflow to separate sensor calibration and data acquisition that is optimized for geomorphological field studies. The approach is time-efficient (rapid simultaneous image acquisition), repeatable (permanent object), at survey scale to maintain focal distance, and on-site to avoid shocks during transport.
The presented workflow uses a stone building as a suitable 3D calibration structure (alternatively boulder or bridge) providing structural detail in visible (DJI Phantom 4 Pro) and thermal imagery (Workswell WIRIS Pro). The dataset consists of feature coordinates extracted from terrestrial laser scanner (TLS) scans (3D reference data) and imagery (2D calibration data). We process the data in the specialized software, vision measurement system (VMS) as benchmark and the widely applied commercial SfM photogrammetric software, Agisoft MetaShape (AM) as convenient alternative. Subsequently, we transfer the camera parameters to the application in an SfM photogrammetric dataset of a river environment to assess the performance of self- and pre-calibration using different image network configurations. The resulting DEMs are validated against GNSS reference points and by DEMs of difference.
We achieved calibration accuracies below one-third (optical) and one-quarter (thermal) of a pixel. In line with the literature, our results show that self-calibration yields the smallest errors and DEM deformations using multi-scale and oblique datasets. Pre-calibration in contrast, yielded the lowest overall errors and performed best in the single-scale nadir scenario. VMS consistently performed better than AM, possibly because AM's software “black-box” is less customisable and does not allow purely marker-based calibration. Furthermore, we present findings regarding sensor stability based on a repeat survey.
We find that pre-calibration can improve photogrammetric accuracies in surveys restricted to unfavourable designs e.g. nadir-only (water refraction, sensor mount). It can facilitate the application of thermal sensors on surfaces less suited to self-calibration. Most importantly, multi-scale survey designs could potentially become redundant, thus shortening flight time or increasing possible areal coverage.
How to cite: Senn, J. A., Mills, J., Walsh, C. L., Addy, S., and Peppa, M.-V.: Assessment of sensor pre-calibration to mitigate systematic errors in SfM photogrammetric surveys, EGU General Assembly 2022, Vienna, Austria, 23–27 May 2022, EGU22-279, https://doi.org/10.5194/egusphere-egu22-279, 2022.
Please decide on your access
Please use the buttons below to download the presentation materials or to visit the external website where the presentation is linked. Regarding the external link, please note that Copernicus Meetings cannot accept any liability for the content and the website you will visit.
Forward to presentation link
You are going to open an external link to the presentation as indicated by the authors. Copernicus Meetings cannot accept any liability for the content and the website you will visit.
We are sorry, but presentations are only available for users who registered for the conference. Thank you.

EGU22-344 | Presentations | GM2.7
A sensitivity analysis of Rillstats for soil erosion estimates from UAV derived digital surface models.Josie Lynch, Derek McDougall, and Ian Maddock
Typically, analysing UAV-Structure-from-Motion (SfM) derived soil erosion data requires a survey prior to the erosion event with repeat monitoring for change over time to be quantified. However, in recent years the ability of soil erosion estimations without the pre-erosion data has emerged. Rillstats, which is specifically designed to quantify volume loss in rills/gullies, has been developed by Báčová et al., (2019) using the algorithm and Python implementation in ArcGIS to perform automatic calculations of rills. Although this technique has been developed, it is not yet tested.
This research evaluates the sensitivity of Rillstats to estimate soil erosion volumes from Digital Surface Models (DSM) obtained using a DJI Phantom 4 RTK UAV. The aims of the research were to test i) the influence of UAV-SfM surveys with varying flight settings and environmental conditions and ii) the effect of the size and shape of the boundary polygon. Results will be presented that analyse the sensitivity of estimations of soil erosion to changes in DSM resolution, image angle, lighting conditions, soil colour and texture to develop recommendations for a best practice to optimize results.
How to cite: Lynch, J., McDougall, D., and Maddock, I.: A sensitivity analysis of Rillstats for soil erosion estimates from UAV derived digital surface models., EGU General Assembly 2022, Vienna, Austria, 23–27 May 2022, EGU22-344, https://doi.org/10.5194/egusphere-egu22-344, 2022.
EGU22-2513 | Presentations | GM2.7
Evaluation of UAV-borne photogrammetry and UAV-borne laser scanning for 3D topographic change analysis of an active rock glacierVivien Zahs, Lukas Winiwarter, Katharina Anders, Magnus Bremer, Martin Rutzinger, Markéta Potůčková, and Bernhard Höfle
Recent advances in repeated data acquisition by UAV-borne photogrammetry and laser scanning for geoscientific monitoring extend the possibilities for analysing surface dynamics in 3D at high spatial (centimeter point spacing) and temporal (up to daily) resolution. These techniques overcome common challenges of ground-based sensing (occlusion, heterogeneous measurement distribution, limited spatial coverage) and provide a valuable additional data source for topographic change analysis between successive epochs.
We investigate point clouds derived from UAV-borne photogrammetry and laser scanning as input for change analysis. We apply and compare two state-of-the-art methods for pairwise 3D topographic change quantification. Our study site is the active rock glacier Äußeres Hochebenkar in the Eastern Austrian Alps (46° 50’ N, 11° 01’ E). Whereas point clouds derived from terrestrial laser scanning (TLS) have become a common data source for this application, point clouds derived from UAV-borne sensing techniques have emerged only in recent years and their potential for methods of 3D and 4D (3D + time) change analysis is yet to be exploited.
We perform change analysis using (1) the Multi Scale Model to Model Cloud Comparison (M3C2) algorithm [1] and (2) the correspondence-driven plane-based M3C2 [2]. Both methods have shown to provide valuable surface change information on rock glaciers when applied to successive terrestrial laser scanning point clouds of different time spans (ranging from 2 weeks to several years). The considerable value of both methods also lies in their ability to quantify the uncertainty additionally to the associated change. This allows to distinguish between significant change (quantified magnitude of change > uncertainty) and non-significant or no change (magnitude of change ≤ uncertainty) and hence enables confident analysis and geographic interpretation of change.
We will extend the application of the two methods by using point clouds derived using (1) photogrammetric techniques on UAV-based images and (2) UAV-borne laser scanning. We investigate the influence of variations in measurement distribution and density, completeness of spatial coverage and ranging uncertainty by comparing UAV-based point clouds to TLS data of the same epoch. Using TLS-TLS-based change analysis as reference, we examine the performance of the two methods with respect to their capability of quantifying surface change based on point clouds originating from different sensing techniques.
Results of this assessment can support the theoretical and practical design of future measurement set-ups. Comparing results of both methods further aids the selection of a suitable method (or combination) for change analysis in order to meet requirements e.g., regarding uncertainty of measured change or spatial coverage of the analysis. To ease usability of a broad suite of state-of-the-art methods of 3D/4D change analysis, we are implementing an open source Python library for geographic change analysis in 4D point cloud data (py4dgeo, www.uni-heidelberg.de/3dgeo-opensource). Finally, our presented study provides insights how methods for 3D and 4D change analysis should be adapted or developed in order to exploit the full potential of available close-range sensing techniques.
[1] https://doi.org/ 10.1016/j.isprsjprs.2013.04.009
[2] https://doi.org/10.1016/j.isprsjprs.2021.11.018
How to cite: Zahs, V., Winiwarter, L., Anders, K., Bremer, M., Rutzinger, M., Potůčková, M., and Höfle, B.: Evaluation of UAV-borne photogrammetry and UAV-borne laser scanning for 3D topographic change analysis of an active rock glacier, EGU General Assembly 2022, Vienna, Austria, 23–27 May 2022, EGU22-2513, https://doi.org/10.5194/egusphere-egu22-2513, 2022.
EGU22-2643 | Presentations | GM2.7
Applicability of aerial photography for identifying of oil mining technogenesis: mechanical transformations, bitumization, technogenic salinizationPavel Sannikov, Yuliya Khotyanovskaya, and Sergei Buzmakov
The main type of research material is multi-season aerial photography of the oil mining karst river basin was carried out by unmanned aerial vehicle.
Visual photo delineation revealed the consequences of mechanical transformations, some hydrocarbon inputs (bitumization) and salts (technogenic salinization) were also identified. The last processes were verified using materials from direct geochemical surveys (chemical analyses of soils, surface waters and sets of ordinary photo of sample plots).
It has been established that mechanical transformations, as a rule, is detected by the color and shape of objects. Less often, it is necessary to additionally analyze indirect photo delineation signs: shape of the shadow, configuration of the borders, traces of heavy vehicle tracks. Photo delineation signs of technogenic salinization are turbidity of water and the acquisition of a bluish-whitish color; the change of the color of the water body to green-yellow; white ground salt spots. The bituminization process is sufficiently reliably identified only in the presence of open oil spills on the surface of soil or water. Despite the difficulty of photo delineation, the use of orthophotos allows to identify 13 new sites (26 in total in the studied area) of the processes of bitumization and technogenic salinization, which had not been noted during previous large-scale field survey.
The use of orthophotos to detect the processes of bitumization and technogenic salinization is effective, especially in combination with direct field studies. Conditions for using aerial photography to identify the consequences of oil mining technogenesis: pixel resolution should be equals or more precise than 20 cm / pixel (more desirable – equals or more precise than 10 cm / pixel), snowless shooting season, lack or low level of cloud cover, relatively low forest cover percent. The spatial distribution of the identified areas of all types of technogenesis indicates a close relationship with the location of oil mining facilities.
A promising direction for the development of the research is associated with the use of multispectral imaging, the improvement of attend field surveys, as well as the expansion of the experience of aerial photography of oil fields located in other natural conditions.
The reported study was funded by Russian Foundation for Basic Research (RFBR) and Perm Territory, project number 20-45-596018.
How to cite: Sannikov, P., Khotyanovskaya, Y., and Buzmakov, S.: Applicability of aerial photography for identifying of oil mining technogenesis: mechanical transformations, bitumization, technogenic salinization, EGU General Assembly 2022, Vienna, Austria, 23–27 May 2022, EGU22-2643, https://doi.org/10.5194/egusphere-egu22-2643, 2022.
EGU22-3163 | Presentations | GM2.7
Comparison of 3D surfaces from historical aerial images and UAV acquisitions to understand glacier dynamics: The Aneto glacier changes in 40 yearsIxeia Vidaller, Jesús Revuelto, Eñaut Izagirre, Jorge García, Francisco Rojas-Heredia, and Juan Ignacio López-Moreno
Pyrenean glaciers have shown a marked area and thickness decrease in the last century, especially in the last decades, and currently are highly threatened by climate change. Out of the 39 glaciers existing in the Pyrenees in 1984, 23 very small glaciers remain in this mountain range, from which only four have more than 10 ha. Probably, the most emblematic glacier of these four is Aneto glacier as it is located in the North-East face of the highest summit in the Pyrenees, the Aneto peak (3404 m a.s.l.). This work presents the Aneto glacier surface reconstruction from aerial images obtained in 1981, and its comparison with the glacier surface obtained in 2021 with Unmanned Aerial Vehicles (UAV) images.
The 1981 and 2021 images have been processed with Structure from Motion (SfM) algorithms to reconstruct the Digital Surface Model (DSM) of the glacier and nearby terrain. Taking advantage of the accurate geolocation of the UAV images in 2021 (GPS with RTK/PPK surveying), the DSM obtained has a precise representation of the glacier surface. Oppositely the aerial images of 1981 lack precise geolocation and thus require a post-processing analysis. The aerial images of the '80s have been firstly geolocated with Ground Control Points (GCPs) of known coordinates within the study area (summits, crests, and rock blocks with unaltered position). After this initial geolocation, the DSM of 1981 was generated with SfM algorithms. Nevertheless, this DSM still lacks a geolocation accuracy. To allow a comparison between the 1981 and the 2021 DSMs, the glacier surface in 1981 was registered to the 2021 surface with an Iterative Close Point (ICP) routine in the surrounding area of the glacier. The technique described in this work may be applicable to other historical aerial images, which may allow studying glacier evolutions all over the world for dates without field observations.
The surface comparison generated with images that have a temporal difference of 40 years has shown the dramatic area and thickness loss of this glacier, with areas decreasing more than 68 m, and an average thickness reduction of 31.5 m. In this period, the glacier has reduced its extent by about a 60%. There is a recent acceleration in the rate of shrinkage if we compare these data with the obtained for the period 2011-2021, in which area loss reaches 15% and thickness reduction almost reaches 10 m. During the 1981-2021 period the shrinkage rate is 0.78 m thickness/year and 1.5% area/year, meanwhile, during the 2011-2021 period the shrinkage rate is 0.99 m thickness/year and 2.7% area/year.
How to cite: Vidaller, I., Revuelto, J., Izagirre, E., García, J., Rojas-Heredia, F., and López-Moreno, J. I.: Comparison of 3D surfaces from historical aerial images and UAV acquisitions to understand glacier dynamics: The Aneto glacier changes in 40 years, EGU General Assembly 2022, Vienna, Austria, 23–27 May 2022, EGU22-3163, https://doi.org/10.5194/egusphere-egu22-3163, 2022.
Please decide on your access
Please use the buttons below to download the presentation materials or to visit the external website where the presentation is linked. Regarding the external link, please note that Copernicus Meetings cannot accept any liability for the content and the website you will visit.
Forward to presentation link
You are going to open an external link to the presentation as indicated by the authors. Copernicus Meetings cannot accept any liability for the content and the website you will visit.
We are sorry, but presentations are only available for users who registered for the conference. Thank you.
EGU22-3516 | Presentations | GM2.7
Uncertainty of grain sizes from close-range UAV imagery in gravel barsDavid Mair, Ariel Henrique Do Prado, Philippos Garefalakis, Alessandro Lechmann, and Fritz Schlunegger
Data on grain sizes of pebbles in gravel-bed rivers are a well-known proxy for sedimentation and transport conditions, and thus a key quantity for the understanding of a river system. Therefore, methods have been developed to quantify the size of gravels in rivers already decades ago. These methods involve time-intensive fieldwork and bear the risk of introducing sampling biases. More recently, low-cost UAV (unmanned aerial vehicle) platforms have been employed for the collection of referenced images along rivers with the aim to determine the size of grains. To this end, several methods to extract pebble size data from such UAV imagery have been proposed. Yet, despite the availability of information on the precision and accuracy of UAV surveys, a systematic analysis of the uncertainty that is introduced into the resulting grain size distribution is still missing.
Here we present the results of three close-range UAV surveys conducted along Swiss gravel-bed rivers with a consumer-grade UAV. We use these surveys to assess the dependency of grain size measurements and associated uncertainties from photogrammetric models, in turn generated from segmented UAV imagery. In particular, we assess the effect of (i) different image acquisition formats, (ii) specific survey designs, and (iii) the orthoimage format used for grain size estimates. To do so, we use uncertainty quantities from the photogrammetric model and the statistical uncertainty of the collected grain size data, calculated through a combined bootstrapping and Monte Carlo (MC) modelling approach.
First, our preliminary results suggest some influence of the image acquisition format on the photogrammetric model quality. However, different choices for UAV surveys, e.g., the inclusion of oblique camera angles, referencing strategy and survey geometry, and environmental factors, e.g., light conditions or the occurrence of vegetation and water, exert a much larger control on the model quality. Second, MC modelling of full grain size distributions with propagated UAV uncertainties shows that measured size uncertainty is at the first order controlled by counting statistics, the selected orthoimage format, and limitations of the grain size determination itself, i.e., the segmentation in images. Therefore, our results highlight that grain size data are consistent and mostly insensitive to photogrammetric model quality when the data is extracted from single, undistorted orthoimages. This is not the case for grain size data, which are extracted from orthophoto mosaics. Third, upon looking at the results in detail, they reveal that environmental factors and specific survey strategies, which contribute to the decrease of the photogrammetric model quality, also decrease the detection of grains during image segmentation. Thereby, survey conditions that result in a lower quality of the photogrammetric model also lead to a higher uncertainty in grain size data.
Generally, these results indicate that even relative imprecise and not accurate UAV imagery can yield acceptable grain size data for some applications, under the conditions of correct photogrammetric alignment and a suitable image format. Furthermore, the use of a MC modelling strategy can be employed to estimate the grain size uncertainty for any image-based method in which individual grains are measured.
How to cite: Mair, D., Do Prado, A. H., Garefalakis, P., Lechmann, A., and Schlunegger, F.: Uncertainty of grain sizes from close-range UAV imagery in gravel bars, EGU General Assembly 2022, Vienna, Austria, 23–27 May 2022, EGU22-3516, https://doi.org/10.5194/egusphere-egu22-3516, 2022.
Please decide on your access
Please use the buttons below to download the presentation materials or to visit the external website where the presentation is linked. Regarding the external link, please note that Copernicus Meetings cannot accept any liability for the content and the website you will visit.
Forward to presentation link
You are going to open an external link to the presentation as indicated by the authors. Copernicus Meetings cannot accept any liability for the content and the website you will visit.
We are sorry, but presentations are only available for users who registered for the conference. Thank you.
EGU22-4225 | Presentations | GM2.7
Automatic Extraction and Characterization of Natural Surface Changes from Near-Continuous 3D Time Series using 4D Objects-By-Change and Kalman FilteringKatharina Anders, Lukas Winiwarter, and Bernhard Höfle
Near-continuous time series of 3D point clouds capture local landscape dynamics at a large range of spatial and temporal scales. These data can be acquired by permanent terrestrial laser scanning (TLS) or time lapse photogrammetry, and are being used to monitor surface changes in a variety of natural scenes, including snow cover dynamics, rockfalls, soil erosion, or sand transport on beaches.
Automatic methods are required to analyze such data with thousands of point cloud epochs (acquired, e.g., hourly over several months), each representing the scene with several million 3D points. Usually, no a-priori knowledge about the timing, duration, magnitude, and spatial extent of all spatially and temporally variable change occurrences is available. Further, changes are difficult to delineate individually if they occur with spatial overlap, as for example coinciding accumulation processes. To enable fully automatic extraction of individual surface changes, we have developed the concept of 4D objects-by-change (4D-OBCs). 4D-OBCs are defined by similar change histories within the area and timespan of single surface changes. This concept makes use of the full temporal information contained in 3D time series to automatically detect the timing and duration of changes. Via spatiotemporal segmentation, individual objects are spatially delineated by considering the entire timespan of a detected change regarding a metric of time series similarity (cf. Anders et al. 2021 [1]), instead of detecting changes between pairs of epochs as with established methods.
For hourly TLS point clouds, the extraction of 4D-OBCs improved the fully automatic detection and spatial delineation of accumulation and erosion forms in beach monitoring. For a use case of snow cover monitoring, our method allowed quantifying individual change volumes more accurately by considering the timespan of changes, which occur with variable durations in the hourly 3D time series, rather than only instantaneously from one epoch to the next. The result of our time series-based method is information-rich compared to results of bitemporal change analysis, as each 4D-OBC contains the full 4D (3D + time) data of the original 3D time series with determined spatial and temporal extent.
The objective of this contribution is to present how interpretable information can be derived from resulting 4D-OBCs. This will provide new layers that are supporting subsequent geoscientific analysis of observed surface dynamics. We apply Kalman filtering (following Winiwarter et al. 2021 [2]) to model the temporal evolution of individually extracted 4D-OBCs. This allows us to extract change rates and accelerations for each point in time, and to subsequently derive further features describing the temporal properties of individual changes. We present first results of this methodological combination and newly obtained information layers which can reveal spatial and temporal patterns of change activity. For example, deriving the timing of highest change rates may be used to examine links to external environmental drivers of observed processes. Our research therefore contributes to extending the information that can be extracted about surface dynamics in natural scenes from near-continuous time series of 3D point clouds.
References:
[1] https://doi.org/10.1016/j.isprsjprs.2021.01.015
[2] https://doi.org/10.5194/esurf-2021-103
How to cite: Anders, K., Winiwarter, L., and Höfle, B.: Automatic Extraction and Characterization of Natural Surface Changes from Near-Continuous 3D Time Series using 4D Objects-By-Change and Kalman Filtering, EGU General Assembly 2022, Vienna, Austria, 23–27 May 2022, EGU22-4225, https://doi.org/10.5194/egusphere-egu22-4225, 2022.
EGU22-4522 | Presentations | GM2.7
Morphological evolution of volcanic crater through eruptions and instabilities: The case of Ol Doinyo Lengaï since the 2007-08 eruptionPierre-Yves Tournigand, Benoît Smets, Kate Laxton, Antoine Dille, Michael Dalton-Smith, Gian Schachenmann, Christelle Wauthier, and Matthieu Kervyn
Ol Doinyo Lengaï (OL) in north Tanzania is the only active volcano in the world emitting natrocarbonatite lavas. This stratovolcano (2962 m a.s.l) is mostly characterized by effusive lava emissions since 1983. However, on the 4th of September 2007, explosive events marked the beginning of a new eruptive style that lasted until April 2008. This new phase involved short-lived explosive eruptions that generated volcanic ash plumes as high as 15 km during its paroxysmal stage. This explosive activity resulted in the formation of a 300 m wide and 130 m deep crater in place of the growing lava platform that had filled the crater since 1983. Since then the effusive activity at OL resumed within the crater and has been partially filling it over the last 14 years. Due to the remote location of the volcano there is a lack of monitoring of its activity and, hence, its eruptive and morphological evolution over the last years is not well constrained (e.g., emission rates, number of vents, unstable areas). This absence of monitoring, preventing the detection of features, such as instabilities of the summit cone, could have hazard implications for the tourists regularly visiting the summit area.
In this study, we quantify the evolution of OL crater area over the last 14 years by reconstructing its topography at regular time interval. We collated several sources of optical images including Unoccupied Aircraft Systems (UAS) images, videos and ground-based pictures that have been collected over the period 2008-2021 by scientists and tourists. Those data have been sorted by year and quality in order to reconstruct the most accurate topographical models using Agisoft Metashape Pro, a software for Structure from Motion (SfM) photogrammetry, and CloudCompare a 3D point cloud processing software. This enables estimating the emitted volume of lava, the emission rate and the remaining crater volume available before crater overflow. It also allows identifying punctual events, such as hornito formation or destruction, and partial crater collapses. Our results indicate that the main lava emission area has repeatedly moved over the years within the crater floor and that OL’s effusion rate has been increasing over the last few years, with more than two times higher lava emission in the period 2019-2021 compared to 2017-2019. Assuming a similar lava effusion rate in the coming years, the crater could again be filled within the next decade leading to new lava overflows. There is thus a need for periodic assessment of the situation at OL. New cost- and time-effective photogrammetry techniques, including UAS and SfM processing, offer a solution to improve the monitoring of such remote volcanoes.
How to cite: Tournigand, P.-Y., Smets, B., Laxton, K., Dille, A., Dalton-Smith, M., Schachenmann, G., Wauthier, C., and Kervyn, M.: Morphological evolution of volcanic crater through eruptions and instabilities: The case of Ol Doinyo Lengaï since the 2007-08 eruption, EGU General Assembly 2022, Vienna, Austria, 23–27 May 2022, EGU22-4522, https://doi.org/10.5194/egusphere-egu22-4522, 2022.
EGU22-4763 | Presentations | GM2.7
Using high-resolution topography to solve “periglacial puzzles”: A semi-automated approach to monitor solifluction movementMarije Harkema, Jana Eichel, Wiebe Nijland, Steven de Jong, Daniel Draebing, and Teja Kattenborn
Solifluction is the slow downslope movement of soil mass due to freeze-thaw processes. It is widespread on hillslopes in Polar and Alpine regions and contributes substantially to sediment transport. As solifluction lobe movement is in the order of millimeters to centimeters per year, it is tricky to measure with a high spatial and temporal resolution and accuracy. We developed a semi-automated approach to monitor movement of three solifluction lobes with different degrees of vegetation cover along an elevational gradient between 2,170 and 2,567 m in Turtmann Valley, Swiss Alps. Subsequently, we compared movement rates and patterns with environmental factors.
- For solifluction movement monitoring, we applied a combination of the Phantom 4 Pro Plus and Phantom 4 RTK (Real Time Kinematic) drones, image co-alignment and COSI-CORR (Co-registration of Optically Sensed Images and Correlation) to track movement on orthophotos between 2017 and 2021. This drone data acquisition and co-alignment procedure enable a simple, time-saving field setup without Ground Control Points (GCPs).
- Our high co-registration accuracy enabled us to detect solifluction movement if it exceeds 5 mm with sparse vegetation cover. Dense vegetation cover limited feature tracking but detected movement rates and patterns still matched previous measurements using classical total station measurements at the lowest, mostly vegetated lobe.
- In contrast to traditional solifluction monitoring approaches using point measurements, our monitoring approach provides spatially continuous movement estimates across the complete extend of the lobe. Lobe movement rates were highest at the highest elevations between 2,560 and 2,567 m (up to 14.0 cm/yr for single years) and lowest at intermediate elevations between 2,417 and 2,427 m (up to 2.9 cm/yr for single years). We found intermediate movement rates at lowest elevations between 2,170 and 2,185 m (up to 4.9 cm/yr for single years). In general, movement had the highest rates at the solifluction lobes center and the lowest rates at the front of solifluction lobes.
- We linked observed movement patters to environmental factors possibly controlling solifluction movement, such as geomorphic properties, vegetation species and coverage, soil properties determined from electrical resistivity tomography (ERT), and soil temperature data. The least movement at the lobe front is characterized by coarse material and plant species stabilizing the risers or plant species growing here due to the stable risers. Most movement at the lobe center is characterized by fine material and no vegetation or plant species promoting movement. The soil temperature data further suggests that snow cover reduced freezing rates at solifluction lobes and potentially decreased solifluction movement at the lobe between 2,417 and 2,427 m.
This study is the first to demonstrate the use of drone-based images and a semi-automated method to reach high spatiotemporal resolutions to detect subtle movements of solifluction lobes at timescales of years at sub-centimeter resolution. This provides new insights into solifluction movement and into drivers of and factors controlling solifluction movement and lobe development. Therefore, our semi-automated approach may have a great potential to uncover the fundamental processes to understand solifluction movement.
How to cite: Harkema, M., Eichel, J., Nijland, W., de Jong, S., Draebing, D., and Kattenborn, T.: Using high-resolution topography to solve “periglacial puzzles”: A semi-automated approach to monitor solifluction movement, EGU General Assembly 2022, Vienna, Austria, 23–27 May 2022, EGU22-4763, https://doi.org/10.5194/egusphere-egu22-4763, 2022.
EGU22-6894 | Presentations | GM2.7
Rapid formation of a bedrock canyon following gravel mining in the Marecchia River, Northern Apennines.Manel Llena, Tommaso Simonelli, and Francesco Brardinoni
River canyons are characteristic features of transient fluvial systems responding to perturbations in base level and/or sediment supply. Investigating the dynamics of canyon formation and development is challenging due to the typically long time scales and the possible experimental confounding involved. In this context, the lower portion of the Marecchia River, with a history of gravel mining on alluvial deposits resting on highly erodible (i.e., claystones and poorly consolidated sands) bedrock, offers the opportunity to set up a natural experiment and investigate the onset of canyon incision and its subsequent stages of development across five decades (1955-1993). To these ends, we evaluate decadal geomorphic changes of 10-km valley segment of the Marecchia River between Ponte Verucchio and Rimini (Northern Italy) through analysis of Digital Elevation Models derived from the application of Structure from Motion to archival aerial imagery (i.e., 1955, 1969, 1976, 1985, 1993) and from a reference-LiDAR survey (i.e. 2009), in conjunction with analysis of planimetric changes in active channel width and lateral confinement.
During the 1955-2009 period, fluvial incision led to the formation of a 6-km canyon, with average vertical incision of about 15 m (in places exceeding 25 m) and a corresponding annual knickpoint migration rate of about 100 m/yr. In volumetric terms, canyon formation and evolution has involved 6.1 106 m3 (95%) of degradation and 0.29 106 m3 of aggradation (5%), with a corresponding net volume loss of 5.8 106 m3. As a result of canyon development, the active channel has narrowed by about 80%, and channel pattern has drastically changed from braided unconfined to single-thread tightly confined one. These processes were especially important during the 1955-1993 period. Since 1993 to the present, main channel is characterized by a general stability of the active channel width with evidences of a slight recovery through mass wasting processes within it. Local disturbance associated with ongoing canyon development have propagated and are still propagating upstream, posing immediate threat to infrastructures.
How to cite: Llena, M., Simonelli, T., and Brardinoni, F.: Rapid formation of a bedrock canyon following gravel mining in the Marecchia River, Northern Apennines., EGU General Assembly 2022, Vienna, Austria, 23–27 May 2022, EGU22-6894, https://doi.org/10.5194/egusphere-egu22-6894, 2022.
EGU22-7374 * | Presentations | GM2.7 | Highlight
Expanding glacier time series of Antarctica and Greenland using Soviet Era KFA-1000 satellite imagesFlora Huiban, Mads Dømgaard, Luc Girod, Romain Millan, Amaury Dehecq, Jeremie Mouginot, Anders Schomacker, Eric Rignot, and Anders Bjørk
Long-term records of glaciers are more than ever crucial to understand their response to climate change. High-quality photogrammetric products, Digital Elevation Models (DEMs) and orthophotographs from early satellites are essential, as they offer a unique high-resolution view on the historical glacial dynamics. However, obtaining and producing high-resolution datasets from historical imagery can be a challenge.
In our study, we are extending available satellite images time series using images from Soviet Era KFA-1000 satellite cameras. Each KFA-1000 has a 1000 mm objective, holding 1800 frames in its magazine. Each frame is typically 18x18 cm or 30 × 30 cm, with an 80 km swath width, providing panchromatic images. They supplement the very sparse data period between aerial images and high-resolution modern satellites, giving us high-resolution insight of Antarctica and Greenland dating from 1974 to 1994. Since these images have been largely underused, they have the potential to improve our knowledge of glaciers and open new scientific perspectives. They could help us improve models in studies regarding, for instance the frontal position, the flow-velocity (by doing feature tracking), the surface elevation or the grounding line of the glaciers, etc. With a spatial resolution up to 2 m and images recorded in stereo geometry, they offer a valuable complement to other historical satellite archives such as the declassified American KH imagery. Here, we use structure-from-motion (SfM) to reconstruct former glacier surfaces and flow of main outlet glaciers in both Antarctica and Greenland. We compare and assess the quality of the results by comparing the produced DEMs with recent high-resolution imagery from Worldview’s ArcticDEM. We combine the historical DEMs with recent satellite imagery of the ice elevation and reconstruct the comprehensive history of volume change over southeast and northeast Greenland glaciers since the 90s. Mostly lost from sight for 50 years, we are now resurrecting these highly valuable records and will make them freely available to science and the public.
How to cite: Huiban, F., Dømgaard, M., Girod, L., Millan, R., Dehecq, A., Mouginot, J., Schomacker, A., Rignot, E., and Bjørk, A.: Expanding glacier time series of Antarctica and Greenland using Soviet Era KFA-1000 satellite images, EGU General Assembly 2022, Vienna, Austria, 23–27 May 2022, EGU22-7374, https://doi.org/10.5194/egusphere-egu22-7374, 2022.
Please decide on your access
Please use the buttons below to download the presentation materials or to visit the external website where the presentation is linked. Regarding the external link, please note that Copernicus Meetings cannot accept any liability for the content and the website you will visit.
Forward to presentation link
You are going to open an external link to the presentation as indicated by the authors. Copernicus Meetings cannot accept any liability for the content and the website you will visit.
We are sorry, but presentations are only available for users who registered for the conference. Thank you.
EGU22-7686 | Presentations | GM2.7
Comparison of deep learning methods for colorizing historical aerial imageryShimon Tanaka, Hitoshi Miyamoto, Ryusei Ishii, and Patrice Carbonneau
Historical aerial imagery dating back to the mid-twentieth century offers high potential to distinguish anthropogenic impacts from natural causes of environmental change and reanalyze the long-term surface evolution from local to regional scales. However, the older portion of the imagery is often acquired in panchromatic grayscale thus making image classification a very challenging task. This research aims to compare deep learning image colorisation methods, namely, , the Neural Style Transfer (NST) and the Cycle Generative Adversarial Network (CycleGAN), for colorizing archival images of Japanese river basins for land cover analysis. Historical monochrome images were examined with `4096 x 4096` pixels of three river basins, i.e., the Kurobe, Tenryu, and Chikugo Rivers. In the NST method, we used the transfer learning model with optimal hyperparameters that had already been fine-tuned for the river basin colorization of the archival river images (Ishii et al., 2021). As for the CycleGAN method, we trained the CycleGAN with 8000 image tiles of `256 x256` pixels to obtain the optimal hyperparameters for the river basin colorization. The image tiles used in training consisted of 10 land-use types, including paddy fields, agricultural lands, forests, wastelands, cities and villages, transportation land, rivers, lakes, coastal areas, and so forth. The training result of the CycleGAN reached an optimal model in which the root mean square error (RMSE) of colorization was 18.3 in 8-bit RGB color resolution with optimal hyperparameters of the dropout ratio (0.4), cycle consistency loss (10), and identity mapping loss (0.5). Colorization comparison of the two-deep learning methods gave us the following three findings. (i) CycleGAN requires much less training effort than the NST because the CycleGAN used an unsupervised learning algorithm. CycleGAN used 8000 images without labelling for training while the NST used 60k with labelling in transfer learning. (ii) The colorization quality of the two methods was basically the same in the evaluation stage; RMSEs in CycleGAN were 15.4 for Kurobe, 13.7 for Tenryu and 18.7 for Chikugo, while RMSE in NST were 9.9 for Kurobe, 15.8 for Tenryu, and 14.2 for Chikugo, respectively. (iii) The CycleGAN indicated much higher performance on the colorization of dull surfaces without any textual features, such as the river course in Tenryu River, than the NST. In future research work, colorized imagery by both the NST and CycleGAN will be further used for land cover classification with AI technology to investigate its role in image recognition. [Reference]: Ishii, R. et al.(2021) Colorization of archival aerial imagery using deep learning, EGU General Assembly 2021, EGU21-11925, https://doi.org/10.5194/egusphere-egu21-11925.
How to cite: Tanaka, S., Miyamoto, H., Ishii, R., and Carbonneau, P.: Comparison of deep learning methods for colorizing historical aerial imagery, EGU General Assembly 2022, Vienna, Austria, 23–27 May 2022, EGU22-7686, https://doi.org/10.5194/egusphere-egu22-7686, 2022.
Please decide on your access
Please use the buttons below to download the presentation materials or to visit the external website where the presentation is linked. Regarding the external link, please note that Copernicus Meetings cannot accept any liability for the content and the website you will visit.
Forward to presentation link
You are going to open an external link to the presentation as indicated by the authors. Copernicus Meetings cannot accept any liability for the content and the website you will visit.
We are sorry, but presentations are only available for users who registered for the conference. Thank you.
EGU22-7967 | Presentations | GM2.7
Time-lapse stereo-cameras and photogrammetry for continuous 3D monitoring of an alpine glacierFrancesco Ioli, Alberto Bianchi, Alberto Cina, Carlo De Michele, and Livio Pinto
Photogrammetry and Structure-from-Motion have become widely assessed tools for geomorphological 3D reconstruction, and especially for monitoring remote and hardly accessible alpine environments. UAV-based photogrammetry enables large mountain areas to be modelled with high accuracy and limited costs. However, they still require a human intervention on-site. The use of fixed time-lapse cameras for retrieving qualitative and quantitative information on glacier flows have recently increased, as they can provide images with high temporal frequency (e.g., daily) for long-time spans, and they require minimum maintenance. However, in many cases, only one camera is employed, preventing the use of photogrammetry to compute georeferenced 3D models. This work presents a low-cost stereoscopic system composed of two time-lapse cameras for continuously and quantitatively monitoring the north-west tongue of the Belvedere Glacier (Italian Alps), by using a photogrammetric approach. Each monitoring station includes a DSLR camera, an Arduino microcontroller for camera triggering, and a Raspberry Pi Zero with a SIM card to send images to a remote server through GSM network. The instrumentation is enclosed in waterproof cases and mounted on tripods, anchored on big and stable rocks along the glacier moraines. The acquisition of a defined number of images and the timing can be arbitrary scheduled, e.g., 2 images per day acquired by each camera, around noon. A set of ground control points is materialized on stable rocks along the moraines and measured with topographic-grade GNSS receivers at the first epoch to orient stereo-pairs of images. From daily stereo-pairs, 3D models are computed with the commercial Structure from Motion software package Agisoft Metashape, and they can be used to detect morphological changes in the glacier tongue, as well as to compute daily glacier velocities. The work is currently focused on improving the orientation of stereo-pairs: the use of computer vision algorithms is under study to automatize the process and increase the robustness of consecutive orientation of stereo-images, e.g., by including images coming from different epochs in the same bundle block adjustment and dividing them afterwards for dense 3D reconstruction. Change detection can be then computed from 3D point clouds by using M3C2 algorithms. Although the stereoscopic system is already installed on the Belvedere Glacier and it is properly taking daily images of the glacier tongue, the processing workflow of stereo-pairs needs to be tuned and automatized to enable high-accurate continuous 3D photogrammetric monitoring of an alpine glacier, computing short-term and infra-seasonal ice volume variations and velocities, as well as detecting icefalls.
How to cite: Ioli, F., Bianchi, A., Cina, A., De Michele, C., and Pinto, L.: Time-lapse stereo-cameras and photogrammetry for continuous 3D monitoring of an alpine glacier, EGU General Assembly 2022, Vienna, Austria, 23–27 May 2022, EGU22-7967, https://doi.org/10.5194/egusphere-egu22-7967, 2022.
Please decide on your access
Please use the buttons below to download the presentation materials or to visit the external website where the presentation is linked. Regarding the external link, please note that Copernicus Meetings cannot accept any liability for the content and the website you will visit.
Forward to presentation link
You are going to open an external link to the presentation as indicated by the authors. Copernicus Meetings cannot accept any liability for the content and the website you will visit.
We are sorry, but presentations are only available for users who registered for the conference. Thank you.

EGU22-8738 | Presentations | GM2.7 | Highlight
Review on the processing and application of historical aerial and satellite spy images in geosciencesCamillo Ressl, Amaury Dehecq, Thomas Dewez, Melanie Elias, Anette Eltner, Luc Girod, Robert McNabb, and Livia Piermattei
Historical aerial photographs captured since the early 1900s and spy satellite photographs from the 1960s onwards have long been used for military, civil, and research purposes in natural sciences. These historical photographs have the unequalled potential for documenting and quantifying past environmental changes caused by anthropogenic and natural factors.
The increasing availability of historical photographs as digitized/scanned images, together with the advances in digital photogrammetry, have heightened the interest in these data in the scientific community for reconstructing long-term surface evolution from local to regional scale.
However, despite the available volume of historical images, their full potential is not yet widely exploited. Currently, there is a lack of knowledge of the types of information that can be derived, their availability over the globe, and their applications in geoscience. There are no standardized photogrammetric workflows to automatically generate 3D (three-dimensional) products, in the form of point clouds and digital elevation models from stereo images (i.e. images capturing the same scenery from at least two positions), as well as 2D products like orthophotos. Furthermore, influences on the quality and the accuracy of the products are not fully understood as they vary according to the image quality (e.g. photograph damage or scanning properties), the availability of calibration information (e.g. focal length or fiducial marks), and data acquisition (e.g. flying height or image overlap).
We reviewed many articles published in peer reviewed journals from 2010 to 2021 that explore the potential of historical images, covering both photogrammetric reconstruction techniques (methodological papers) and the interpretation of 2D and 3D changes in the past (application papers) in different geoscience disciplines such as geomorphology, cryosphere, volcanology, bio-geosciences, geology and archaeology. We present an overview of these published studies and a summary of available image archives. In addition, we compare the main methods used to process historical aerial and satellite images, highlighting new approaches. Finally, we provide our advice on image processing and accuracy assessment.
How to cite: Ressl, C., Dehecq, A., Dewez, T., Elias, M., Eltner, A., Girod, L., McNabb, R., and Piermattei, L.: Review on the processing and application of historical aerial and satellite spy images in geosciences, EGU General Assembly 2022, Vienna, Austria, 23–27 May 2022, EGU22-8738, https://doi.org/10.5194/egusphere-egu22-8738, 2022.
EGU22-9799 | Presentations | GM2.7
Coastal erosion dynamics of high-Arctic rock walls: insights from historical to recent orthoimages and DEMsJuditha Aga, Livia Piermattei, Luc Girod, and Sebastian Westermann
The thermal regime of permafrost, as well as the retreat of sea ice, influence coastal erosion in Arctic environments. Warming permafrost temperatures might lead to enhanced instabilities, while shorter periods of sea ice expose coastal cliffs to waves and tides for longer periods. Although most studies focus on erosion rates in ice-rich permafrost, coastal cliffs and their permafrost thermal regime are still poorly understood.
In this study, we investigate the long-term evolution of the coastline along Brøgger Peninsula (~30 km2), Svalbard. Based on high-resolution aerial orthophotos and, when available, digital elevation model (DEMs) we automatically derive the coastline from 1936 (Geyman et al., 2021), 1970, 1990, 2011 and 2021. Therefore, we quantified coastal erosion rates along the coastal cliffs over the last 85 years. Due to their high spatial resolution and accuracy, the two DEMs from 1970 and 2021 are used to calculate the erosion volumes within this time. Elevation data and coastline mapping from 2021 is validated with dGPS measurements from August 2021 along three transects of the coastline. In addition, we measured surface temperature of the coastal bedrock from September 2020 to August 2021.
Our preliminary results show erosion rates along the coastal cliffs of Brøgger Peninsula. Uncertainties remain due to mapping issues, which include resolution of aerial images and DEMs, and shadow effects. Overall, historical aerial images combined with recent data provide insight into coastal evolution in an Arctic environment where permafrost temperatures are close to the thaw threshold and might become prone to failure in future.
Geyman, E., van Pelt, W., Maloof, A., Aas, H. F., & Kohler, J. (2021). 1936/1938 DEM of Svalbard [Data set]. Norwegian Polar Institute. https://doi.org/10.21334/npolar.2021.f6afca5c
How to cite: Aga, J., Piermattei, L., Girod, L., and Westermann, S.: Coastal erosion dynamics of high-Arctic rock walls: insights from historical to recent orthoimages and DEMs, EGU General Assembly 2022, Vienna, Austria, 23–27 May 2022, EGU22-9799, https://doi.org/10.5194/egusphere-egu22-9799, 2022.
EGU22-10060 | Presentations | GM2.7
Automated mapping of Soil Surface Components (SSCs) in highly heterogeneous environments with Unoccupied Aerial Systems (UAS) and Deep Learning: working towards an optimised workflowEva Arnau-Rosalén, Ramón Pons-Crespo, Ángel Marqués-Mateu, Jorge López-Carratalá, Antonis Korkofigkas, Konstantinos Karantzalos, Adolfo Calvo-Cases, and Elias Symeonakis
Pattern recognition remains a complex endeavour for ‘structure/function’ approaches to ecosystem functioning. It is particularly challenging in dryland environments where spatial heterogeneity is the inherent functional trait related with overland flow redistribution processes. Within this context, the concept of Soil Surface Components (SSCs) emerged, representing Very-High-Resolution (VHR) hydrogeomorphic response units. SSCs are abstraction entities where spatial patterns of the soil surface and erosional functional processes are linked, according to a large pool of experimental evidence.
Τhis abstraction complexity, particularly in the abiotic domain, has so far mandated the use of on-screen visual photointerpretation for the mapping of SSCs, thus limiting the extent of the study cases and their potential for providing answers to the ongoing research discourse. Although significant advances have been achieved with regards to the VHR mapping of vegetation traits with either shallow or deep machine learning algorithms, mapping the full range of SSCs requires bridging the existing gap related with the abiotic domain.
The current confluence of technical advances in: (i) Unoccupied Aerial Systems (UAS), for VHR image acquisition and high geometric accuracy; (2) photogrammetric image processing (e.g. Structure from Motion, SfM), for accurately adding the third dimension, and (3) Deep Learning (DL) architectures that consider the spatial context (i.e. Convolutional Neural Networks, CNN), offers an unprecedented opportunity for achieving the pattern recognition quality required for the automated mapping of SSCs.
We decompose this complex issue with a stepwise approach in an attempt to optimise protocols across all stages of the entire process. For the initial step of image acquisition, we focus on the design of optimal UAS flight parameters, particularly with regards to flight height and image resolution, as this relates to the scale of the analysis: a critical issue for hillslope and catchment scale surveys. At the core of the methodological framework, we then approach the challenge of mapping the patchy mosaic of SSCs as a hierarchical image segmentation problem, decomposed into classification (i.e. discrete) and regression (i.e. continuous fields) tasks, required for dealing with the biotic (e.g. vegetation) and abiotic (e.g. fractional cover of rock fragments) domains, respectively.
Our pilot study area is a hillslope transect near Benidorm, a representative case in semi-arid environment of SE Spain. In this area, the mapping of SSCs was previously undertaken via visual image interpretation. We obtain satisfactory results that allow for the differentiation of plant physiognomies (i.e. annual herbaceous, shrubs, perennial tussock grass and trees). Regarding the abiotic SSCs, in addition to the identification of rock outcrops, we are also able to quantify the fractional cover of rock fragments (RF): an improvement to the visual photointerpretation of only three intervals of RF coverage. A number of challenges remain, such as the position of RF and the transferability of our methodological framework to sites with different lithological and climatological properties.
How to cite: Arnau-Rosalén, E., Pons-Crespo, R., Marqués-Mateu, Á., López-Carratalá, J., Korkofigkas, A., Karantzalos, K., Calvo-Cases, A., and Symeonakis, E.: Automated mapping of Soil Surface Components (SSCs) in highly heterogeneous environments with Unoccupied Aerial Systems (UAS) and Deep Learning: working towards an optimised workflow, EGU General Assembly 2022, Vienna, Austria, 23–27 May 2022, EGU22-10060, https://doi.org/10.5194/egusphere-egu22-10060, 2022.
EGU22-10190 | Presentations | GM2.7 | Highlight
Historical Structure From Motion (HSfM): An automated historical aerial photography processing pipeline revealing non-linear and heterogeneous glacier change across Western North AmericaFriedrich Knuth, David Shean, Chistopher McNeil, Eli Schwat, and Shashank Bhushan
Mountain glaciers are responding in concert to a warming global climate over the past century. However, on interannual to decadal time scales, glaciers show temporally non-linear dynamics and spatially heterogeneous response, as a function of regional climate forcing and local geometry. Deriving long-term geodetic glacier change measurements from historical aerial photography can inform efforts to understand and project future response.
We present interannual to decadal glacier and geomorphic change measurements at multiple sites across Western North America from the 1950s until present. Glacierized study sites differ in terms of glacial geometry and climatology, from continental mountains (e.g., Glacier National Park) to maritime stratovolcanoes (e.g., Mt. Rainier). Quantitative measurements of glacier and land surface change are obtained from Digital Elevation Models (DEMs) generated using the Historical Structure from Motion (HSfM) package. We use scanned historical images from the USGS North American Glacier Aerial Photography (NAGAP) archive and other aerial photography campaigns from the USGS EROS Aerial Photo Single Frames archive.
The automated HSfM processing pipeline can derive high-resolution (0.5-2.0 m) DEMs and orthomosaics from scanned historical aerial photographs, without manual ground control point selection. We apply a multi-temporal bundle adjustment process using all images for a given site to refine both extrinsic and intrinsic camera model parameters, prior to generating DEMs for each acquisition date. All historical DEMs are co-registered to modern reference DEMs from airborne lidar, commercial satellite stereo or global elevation basemaps. The co-registration routine uses a multi-stage Iterative Closest Point (ICP) approach to achieve high relative alignment accuracy amongst the historical DEMs, regardless of reference DEM source.
We examine the impact of regional climate forcing on glacier elevation change and dynamics using downscaled climate reanalysis products. By augmenting the record of quantitative glacier elevation change measurements and examining the relationship between climate forcing and heterogeneous glacier response patterns, we aim to improve our understanding of regional glacier mass change across multiple temporal scales, as well as inform management decisions impacting downstream water resources, ecosystem preservation, and geohazard risks.
How to cite: Knuth, F., Shean, D., McNeil, C., Schwat, E., and Bhushan, S.: Historical Structure From Motion (HSfM): An automated historical aerial photography processing pipeline revealing non-linear and heterogeneous glacier change across Western North America, EGU General Assembly 2022, Vienna, Austria, 23–27 May 2022, EGU22-10190, https://doi.org/10.5194/egusphere-egu22-10190, 2022.
Please decide on your access
Please use the buttons below to download the presentation materials or to visit the external website where the presentation is linked. Regarding the external link, please note that Copernicus Meetings cannot accept any liability for the content and the website you will visit.
Forward to presentation link
You are going to open an external link to the presentation as indicated by the authors. Copernicus Meetings cannot accept any liability for the content and the website you will visit.
We are sorry, but presentations are only available for users who registered for the conference. Thank you.
EGU22-10513 | Presentations | GM2.7
Using UAS-based LiDAR data to quantify oyster reef structural characteristics for temporal monitoringMichael C. Espriella, Vincent Lecours, H. Andrew Lassiter, and Benjamin Wilkinson
Given the global decline in oyster reef coverage, conservation and restoration efforts are increasingly needed to maintain the ecosystem services these biogenic features offer. However, monitoring and restoration are constrained by a lack of continuous quantitative metrics to effectively assess reef health. Traditional sampling methods typically provide a limited perspective of reef status, as sampling areas are just a fraction of the total reef area. In this study, an unoccupied aircraft system collected LiDAR data over oyster reefs in Cedar Key, FL, USA to develop digital surface models (DSMs) of their 3D structure. Ground sampling was also conducted in randomly placed quadrats to enumerate the live and dead oysters within each plot. Over 20 topographic complexity metrics were derived from the DSM, allowing relationships between various geomorphometric measures and reef health to be quantified. These data informed generalized additive models that explained up to 80% of the deviation of live to dead oyster ratios in the quadrats. While topographic complexity has been associated with reef health in the past, this process quantifies the relationships and indicates what metrics can be relied on to efficiently monitor intertidal oyster reefs using DSMs. The models can also inform restoration efforts on which surface characteristics are best to replicate when building restored reefs.
How to cite: Espriella, M. C., Lecours, V., Lassiter, H. A., and Wilkinson, B.: Using UAS-based LiDAR data to quantify oyster reef structural characteristics for temporal monitoring, EGU General Assembly 2022, Vienna, Austria, 23–27 May 2022, EGU22-10513, https://doi.org/10.5194/egusphere-egu22-10513, 2022.
EGU22-10597 | Presentations | GM2.7
Semantic segmentation of historical images in Antarctica with neural networksFelix Dahle, Roderik Lindenbergh, Julian Tanke, and Bert Wouters
The USGS digitized many historical photos of Antarctica which could provide useful insights into this region from before the satellite era. However, these images are merely scanned and do not contain semantic information, which makes it difficult to use or search this archive (for example to filter for cloudless images). Even though there are countless semantic segmentation methods, they are not working properly with these images. The images are only grayscale, have often a poor image quality (low contrast or newton’s rings) and do not have very distinct classes, for example snow/clouds (both white pixels) or rocks/water (both black pixels). Furthermore, especially for this archive, these images are not only top-down but can also be oblique.
We are training a machine-learning based network to apply semantic segmentation on these images even under these challenging conditions. The pixels of each image will be labelled into one of the six different classes: ice, snow, water, rocks, sky and clouds. No training data was available for these images, so that we needed to create it ourselves. The amount of training data is therefore limited due to the extensive amount of time required for labelling. With this training data, a U-Net was trained, which is a fully convolutional network that can work especially with fewer training images and still give precise results.
In its current state, this model is trained with 67 images, split in 80% training and 20% validation images. After around 6000 epochs (approx. 30h of training) the model converges and training is stopped. The model is evaluated on 8 randomly selected images that were not used during training or validation. These images contain all different classes and are challenging to segment due to quality flaws and similar looking classes. The model is able to segment the images with an accuracy of around 75%. Whereas some classes, like snow, sky, rocks and water can be recognized consistently, the classes ice and clouds are often confused with snow. However, the general semantic structure of the images can be recognized.
In order to improve the semantic segmentation, more training imagery is required to increase the variability of each class and prepare the model for more challenging scenes. This new training data will include both labelled images from the TMA archive and from other historical archives in order to increase the variability of classes even more. It should be checked if the quality of the model can be further improved by including metadata of the images as additional data sources.
How to cite: Dahle, F., Lindenbergh, R., Tanke, J., and Wouters, B.: Semantic segmentation of historical images in Antarctica with neural networks, EGU General Assembly 2022, Vienna, Austria, 23–27 May 2022, EGU22-10597, https://doi.org/10.5194/egusphere-egu22-10597, 2022.
Please decide on your access
Please use the buttons below to download the presentation materials or to visit the external website where the presentation is linked. Regarding the external link, please note that Copernicus Meetings cannot accept any liability for the content and the website you will visit.
Forward to presentation link
You are going to open an external link to the presentation as indicated by the authors. Copernicus Meetings cannot accept any liability for the content and the website you will visit.
We are sorry, but presentations are only available for users who registered for the conference. Thank you.

EGU22-10943 | Presentations | GM2.7
High-resolution topography project on the rock walls of the Mont-Blanc massif to reconstruct volume changeDaniel Uhlmann, Michel Jaboyedoff, Marc-Henri Derron, Ludovic Ravanel, Joelle Vicari, Charlotte Wolff, Li Fei, Tiggi Choanji, and Carlota Gutierrez
Before modern remote sensing techniques, quantifying rock wall retreat due to rockfall events in the high alpine environment was limited to low-frequency post-event measurements for high-magnitude events. LiDAR and SFM now provide precise and accurate 3D models for computing 3D volume changes over time. Otherwise, mid- and low-sized events can remain unobserved due to the remoteness of the rockwalls and the lack of remnant evidence due to the rapid sequestration of ice in surrounding valley and cirque glaciers. To extend rockfall event measurement an initial measurement (t0) is necessary. The Mont-Blanc Massif (MBM, European Alps) High Resolution Topography Project is currently completing high-precision 3D models in the MBM using ground-based and aerial LiDAR, and drone-based structure-from-motion (SFM). In 2021, we began acquisition with initial measurements of 11 major sectors of the massif, representing about 80 km2 of rock and ice slopes, between 1700m - 4810m in elevation. By choosing a study area with robust existent photographic and film archives, such as the MBM, it is possible to extend 3D models back in time for comparison with current datasets. Despite existent high-quality image archives, SFM processing is more challenging and error-prone than from contemporary images due to a lack of metadata, such as camera and lens type, precise dates of images, and the general degradation of the original material. Despite these limitations, the use of historical-image-based SFM in combination with modern LiDAR data can allow the reconstruction of significant slopes of the MBM over several decades in order to i) obtain estimates of erosion rates, ii) to document rockfall events, and iii) to quantify the extent change and volume loss of hanging glaciers and ice aprons. We thus explore geomorphic processes in the high mountain environment in context of warming climate, as well as the limits of input data (image sets) in terms of practical output resolution.
How to cite: Uhlmann, D., Jaboyedoff, M., Derron, M.-H., Ravanel, L., Vicari, J., Wolff, C., Fei, L., Choanji, T., and Gutierrez, C.: High-resolution topography project on the rock walls of the Mont-Blanc massif to reconstruct volume change, EGU General Assembly 2022, Vienna, Austria, 23–27 May 2022, EGU22-10943, https://doi.org/10.5194/egusphere-egu22-10943, 2022.
Please decide on your access
Please use the buttons below to download the presentation materials or to visit the external website where the presentation is linked. Regarding the external link, please note that Copernicus Meetings cannot accept any liability for the content and the website you will visit.
Forward to presentation link
You are going to open an external link to the presentation as indicated by the authors. Copernicus Meetings cannot accept any liability for the content and the website you will visit.
We are sorry, but presentations are only available for users who registered for the conference. Thank you.
EGU22-11081 | Presentations | GM2.7
Extraction of geomorphological entities from unstructured point clouds – a three-dimensional level-set-based approachReuma Arav, Florian Poeppl, and Norbert Pfeifer
The use of 3D point clouds has become ubiquitous in studying geomorphology. The richness of the acquired data, together with the high availability of 3D sensing technologies, enables a fast and detailed characterisation of the terrain and the entities therein. However, the key for a comprehensive study of landforms relies on detecting geomorphological features in the data. These entities are of complex forms that do not conform to closed parametric shapes. Furthermore, they appear in varying dimensions and orientations, and they are often seamlessly embedded within the topography. The large volume of the data, uneven point distribution and occluded regions present even a greater challenge for autonomous extraction. Therefore, common approaches are still rooted in utilising standard GIS tools on rasterised scans, which are sensitive to noise and interpolation methods. Schemes that investigate morphological phenomena directly from the point cloud use heuristic and localised methods that target specific landforms and cannot be generalised. Lately, machine-learning-based approaches have been introduced for the task. However, these require large training datasets, which are often unavailable in natural environments.
This work introduces a new methodology to extract 3D geomorphological entities from unstructured point clouds. Based on the level-set model, our approach does not require training datasets or labelling, requires little prior information about existing objects, and wants minor adjustments between different types of scenes. By developing the level-set function within the point cloud realm, it requires no triangulated mesh or rasterisation. As a driving force, we utilise visual saliency to focus on pertinent regions. As the estimation is performed pointwise, the proposed model is completely point-based, driven by the geometric characteristics of the surface. The result is three-dimensional entities extracted by their original points, as they were scanned in the field. We demonstrate the flexibility of the proposed model on two fundamentally different datasets. In the first scene, we extract gullies and sinkholes in an alluvial fan and are scanned by an airborne laser scanner. The second features pockets, niches and rocks in a terrestrially scanned cave. We show that the proposed method enables the simultaneous detection of various geomorphological entities, regardless of the acquisition technique. This is facilitated without prior knowledge of the scene and with no specific landform in mind. The proposed study promotes flexibility of form and provides new ways to quantitatively describe the morphological phenomena and characterise their shape, opening new avenues for further investigation.
How to cite: Arav, R., Poeppl, F., and Pfeifer, N.: Extraction of geomorphological entities from unstructured point clouds – a three-dimensional level-set-based approach, EGU General Assembly 2022, Vienna, Austria, 23–27 May 2022, EGU22-11081, https://doi.org/10.5194/egusphere-egu22-11081, 2022.
EGU22-12200 | Presentations | GM2.7
Terrain Change Detection with ICESat-2: A Case Study of Central Mountain Range in TaiwanPin-Chieh Pan and Kuo-Hsin Tseng
Ice, Cloud, and land Elevation Satellite 2 (ICESat-2), part of NASA's Earth Observing System, is a satellite mission for measuring ice sheet elevation as well as land topography. ICESat-2 is equipped with the Advanced Topographic Laser Altimeter System (ATLAS), a spaceborne lidar that provides topography measurements of land surfaces around the globe. This study intends to utilize ICESat-2 ATL03 elevation data to identify the outdated part in Taiwan’s Digital Elevation Model (DEM). Because the update of DEM takes time and is relatively expensive to renew by airborne LiDAR, a screen of elevation change is crucial for planning the flight route. ICESat-2 has not only a dense point cloud of elevation but also a short revisit time for data collection. That is, ICESat-2 may have a chance to provide a reference for the current condition of terrain formation.
In this study, we aim to verify the 20-meter DEM from the Ministry of the Interior, Taiwan, by ICESat-2 elevation data. The goal is to find out the patches that have experienced significant changes in elevation due primarily to landslides. We select a typical landslide hillside in southern Taiwan as an example, and compare the DEM with ICESat-2 ATL03 photon-based heights before and after the occurrence of landslide events. In our preliminary results, the comparison of DEM and ICESat-2 ATL03 heights has a high degree of conformity inaccuracy (within meter level), indicating ICESat-2’s ability for DEM renewal.
How to cite: Pan, P.-C. and Tseng, K.-H.: Terrain Change Detection with ICESat-2: A Case Study of Central Mountain Range in Taiwan, EGU General Assembly 2022, Vienna, Austria, 23–27 May 2022, EGU22-12200, https://doi.org/10.5194/egusphere-egu22-12200, 2022.