Content:
Presentation type:
CL – Climate: Past, Present & Future

The Miocene epoch, spanning 23.03-5.33Ma, was a dynamic climate of sustained, polar-amplified warmth that peaked during the Miocene Climatic Optimum (16.75-14.5Ma). Miocene atmospheric CO2 concentrations are typically reconstructed between 300-600 ppmv with estimates as high as 800-1100 ppmv during the MCO. With surface temperature reconstructions pointing to substantial midlatitude and polar warmth, it is unclear what processes maintained the much weaker-than-modern equator-to-pole temperature gradient. Emanating from community discussions at MioMeet (hosted by the Bolin Centre for Climate Research in 2019), Burls et al. (2021) synthesize several Miocene climate modeling efforts, together with available terrestrial and ocean surface temperature reconstructions. The range of model-data agreement was evaluated, highlighting robust mechanisms operating across the Miocene modelling efforts, as well as the regions where the differences across models (coming from a combination of model differences in imposed non-CO2 Miocene boundary conditions and model feedback strengths) result in a large spread in warming responses. This MioMIP1 effort was an ensemble of opportunity: the models, boundary conditions, and reference datasets were state-of-the-art, but also inhomogeneous and not ideal for a formal intermodel comparison effort. Building on MioMIP1, the Miocene community is currently drafting the experimental design for a coordinated set of MioMIP2 simulations wherein participating modelling groups will use common boundary conditions. This talk will review the take-home findings from MioMIP1 and the status of the community’s MioMIP2 effort.

How to cite: Burls, N.: Simulating Miocene warmth: insights from an opportunistic Multi-Model ensemble (MioMIP1) and efforts towards a coordinated intercomparison (MioMIP2), EGU General Assembly 2023, Vienna, Austria, 23–28 Apr 2023, EGU23-6492, https://doi.org/10.5194/egusphere-egu23-6492, 2023.

EGU23-6667 | Orals | CL1

Potential role of methane and other non-CO2 trace gases in past warm climates 

Peter Hopcroft, Diane Segalla, Gilles Ramstein, and Thomas Pugh

Past warm climates allow the evaluation model predictions of the response of the Earth System to elevated greenhouse gas levels. However, Earth System model simulations routinely underestimate high-latitude warmth for past states, meaning that the forcings provided to models, the models themselves or the climate reconstructions are in error. We focus on the first of these and review the potential role of varying levels of atmospheric trace gases besides carbon dioxide (non-CO2 trace gases), which has been investigated in relatively few studies to date. Using a combination of terrestrial biogeochemistry models and simplified atmospheric chemistry scheme we make first-order estimates of the radiative forcing by non-CO2 trace gases for the mid-Pliocene and compare these with new results for the Miocene. We will discuss the main uncertainties involved and review potential avenues for future research.

How to cite: Hopcroft, P., Segalla, D., Ramstein, G., and Pugh, T.: Potential role of methane and other non-CO2 trace gases in past warm climates, EGU General Assembly 2023, Vienna, Austria, 23–28 Apr 2023, EGU23-6667, https://doi.org/10.5194/egusphere-egu23-6667, 2023.

EGU23-8969 | Orals | CL1 | Highlight

Pliocene climate and the high latitudes: a data/model perspective 

Alan Haywood

It is well established that during intervals of the Pliocene epoch climatic conditions were both warmer and wetter than the pre-industrial era. Since the first global compilations of geological proxy data and climate modelling studies, it has been known that the pattern of surface temperature change during the Pliocene was not spatially uniform, with both geological data and models showing an amplification of surface temperature change at higher latitudes. This is a trait which the Pliocene shares with other warm(er) climate states in Earth history. Over the last two decades our appreciation of the character of climate and environmental change in the high latitudes has evolved significantly with (a) the availability of new and multi-proxy reconstructions, and (b) through the application of different climate, vegetation and ice sheet models, methodologies and intercomparison projects (PlioMIP1 and 2 and PLISMIP). We have become increasingly aware of the complex interaction of different sources of uncertainty (in proxies, models, model boundary conditions and forcings) when assessing the degree to which climate models are able to reproduce the magnitude of climate change indicated by geological data. It is clear that broad and simple assumptions cannot be made regarding the efficacy of either proxy reconstructions or climate model simulations for the Pliocene high latitudes, and that the picture of Pliocene climate at the higher latitudes, and how well models simulate it, is a nuanced one.

Whilst modelling studies have tended to agree in demonstrating the primacy of greenhouse gas forcing on Pliocene warming as a global average, it is increasingly apparent how important other factors such as palaeogeography and ice-sheet reconstructions can be in determining the local and regional pattern of climate change in the high latitudes. Yet, at present many of these aspects remain poorly constrained.

Energy balance analyses have demonstrated the importance of clear sky albedo, cloud albedo and heat transports in determining the degree of warming at the high latitudes in climate models. This has helped to inspire new climate modelling studies using perturbed physics in order to explore model uncertainty. However, our focus has largely been on the assessment of the ability of climate models to simulate mean annual temperature change, rather than the seasonal expression of temperature change. Recent work has demonstrated that a large ensemble of climate models is generally able to simulate warm season temperatures in the high latitudes of the Northern Hemisphere, with the apparent discrepancy in mean annual surface temperatures being driven largely by climate models underestimating the magnitude of warming during the cold season. If this is true, it would place a useful additional constraint on how Pliocene climate simulations need to evolve in order to match proxy reconstructions more closely. 

How to cite: Haywood, A.: Pliocene climate and the high latitudes: a data/model perspective, EGU General Assembly 2023, Vienna, Austria, 23–28 Apr 2023, EGU23-8969, https://doi.org/10.5194/egusphere-egu23-8969, 2023.

EGU23-8995 | Orals | CL1

Efforts towards reconstructing ice sheets during the Pliocene 

Aisling Dolan, Daniel Hill, Alan Haywood, and Yvonne Smith

Understanding Polar climate and the stability of high-latitude ice sheets is incredibly important in light of predicted future climate change and the polar amplification of warming.  The mid-Pliocene warm period (3.3 to 3.0 Ma) has been a highly investigated time in Earth history and it is well established that during this time period temperatures were warmer and CO2 levels were elevated compared to that of the pre-industrial era.  Changes in the polar cryosphere are a key driver of Pliocene climate change and reduced equator-to-pole temperature gradients. During the mid-Pliocene, estimates of sea level change between 5m and 25m have been reconstructed based on geological evidence. Best estimates of maximum sea level rise are around 20m, suggesting a significant contribution to sea level from both the Greenland and Antarctic Ice sheets is likely at certain intervals within the mid-Pliocene. Despite the uncertainties, Pliocene sea level has become a key target for ice sheet models trying to simulate ice sheet melt and a test-bed for ice loss physics.

Alongside a series of modelling efforts to understand the broader Pliocene climate (PlioMIP1 and PlioMIP2), the Pliocene ice sheet modelling Intercomparison project (PLISMIP) was formed to investigate the dependency of ice sheet reconstructions on the specific climate or ice sheet model employed.   We detail investigations of ice sheet model parameterisations and initial conditions, climate model boundary conditions and the climate model used, and show the extent to which these impact our predictions of ice sheet configuration during the Pliocene. 

We consider the implications of having to prescribe an ice sheet configuration in large model intercomparison projects such as PlioMIP and how the results from PLISMIP and more recent independent ice sheet modelling work has influenced the experimental design in PlioMIP3 to include different ice sheet scenarios over Antarctica.  We also highlight key areas where there is the potential to use geological proxy data or employ enhanced modelling techniques to constrain our estimates of ice in a warmer world.  

How to cite: Dolan, A., Hill, D., Haywood, A., and Smith, Y.: Efforts towards reconstructing ice sheets during the Pliocene, EGU General Assembly 2023, Vienna, Austria, 23–28 Apr 2023, EGU23-8995, https://doi.org/10.5194/egusphere-egu23-8995, 2023.

DeepMIP-Eocene is a community project dedicated to improving our understanding of the super-warm Eocene climate, ~50 million years ago. The objectives of the DeepMIP group include fostering closer links between the palaeoclimate modelling and data communities; designing and carrying out paleoclimate model simulations; creating and synthesising datasets to enable meaningful model-data comparisons; and analysing the results with the aims of evaluating the models, understanding the reasons behind the model-model and model-data differences, and, where possible, providing suggestions for model improvements.

DeepMIP-Eocene is nearing completion of its first phase.  In this talk, I will present the key results to emerge from this first phase.  This includes the large-scale modelled features of the Eocene climate (including the causes of polar amplification), model-data comparisons (including an assessment of whether models have improved over time), climate and Earth system sensitivity (derived from both proxies and models), ocean circulation (including an assessment of likely regions of deep water formation),  sea ice and Arctic climate,  and African and Australian hydroclimate.

I will finish with an outlook to the next phase of DeepMIP-Eocene, including new aspects of the experimental design and novel analyses.

How to cite: Lunt, D. and the The DeepMIP Team: DeepMIP-Eocene: A window to a super-warm world, 50 million years ago, through an model-model-proxy-proxy intercomparison approach, EGU General Assembly 2023, Vienna, Austria, 23–28 Apr 2023, EGU23-9627, https://doi.org/10.5194/egusphere-egu23-9627, 2023.

EGU23-9880 | Orals | CL1

Cenozoic CO2: from the deep ocean to the atmosphere 

James Rae and the OldCO2NewArchives Collaborators

The Cenozoic is a time of climatic extremes: abrupt events and state changes pepper the transition from Hothouse warmth to the Pleistocene Icehouse, and these evolving climate regimes are accompanied by major changes in ocean chemistry and biota.  CO2 is thought to play a critical role in environmental change throughout this era, but despite recent progress, there is still much to learn on the Cenozoic evolution of the ocean-atmosphere CO2 system.  To address this, we present new reconstructions of ocean pH and atmospheric CO2 spanning the late Cretaceous to the Pleistocene, based on the boron isotope composition of benthic and planktic foraminifera.  These are accompanied by improved constraints on the secular evolution of seawater chemistry, which are critical for accurate and precise determination of ocean pH and atmospheric CO2 from boron isotopes.  Using the most reliable data and updated calculation routines, we find close coupling between the CO2 system of the deep ocean, the atmosphere, and climate over the last 66 million years.  Our data also highlight intervals of dynamic changes in the carbon cycle, such as the transition into the Early Eocene Climatic Optimum, where we suggest a novel link between changes in ocean circulation, redox, and the sulphur and carbon cycles.  Overall, our data demonstrate the persistence of CO2’s control on the climate system across varying boundary conditions, and the influence of both the long-term carbon cycle and shorter-term ocean biogeochemical cycling on Earth’s climate.

How to cite: Rae, J. and the OldCO2NewArchives Collaborators: Cenozoic CO2: from the deep ocean to the atmosphere, EGU General Assembly 2023, Vienna, Austria, 23–28 Apr 2023, EGU23-9880, https://doi.org/10.5194/egusphere-egu23-9880, 2023.

EGU23-11669 | Orals | CL1

Effects of CO2 and Ocean Mixing on Miocene and Pliocene Temperature Gradients 

Gerrit Lohmann, Gregor Knorr, Akil Hossain, and Christian Stepanek


During the Cenozoic Era hothouse climate transformed to a state that allowed establishment of extensive ice-sheets. The transformation towards an overall cooler climate encompassed periods of relatively steady change of global temperatures which were interrupted by short-term aberrations of relatively rapid cooling or warming. Various drivers have been found to contribute to this complex process of climate cooling - among these drawdown of carbon dioxide, reorganized ocean circulation related to ocean gateway evolution, varying amplitude and geographic location of deep water upwelling and formation processes, and internal feedbacks related to changes in environmental and land surface conditions in particular at high latitudes and on the continents.

The fact that carbon dioxide as the most important current driver of climate change is not always proportionally linked to past changes in global temperatures underlines the importance of mechanisms beyond greenhouse gas drawdown that contributed to Cenozoic climate cooling. Several questions remain regarding mechanisms and drivers of climate evolution as reconstructed from Cenozoic proxy recorders: How can a low meridional temperature gradient be maintained at carbon dioxide concentrations that are in line with reconstructions and inference on relatively modest tropical tempatures? Which mechanisms contributed to extremely high deep sea temperatures ?

Here we propose that during the Miocene and the Pliocene enhanced vertical mixing in the ocean may provide potential explanations to some of these enigmas. We employ the global general circulation model, which contributed to PlioMIP, MioMIP, and DeepMIP (e.g., Stärz et al., 2017; Stepanek et al., 2020; Hossain et al., 2020), and study the impact of variations in vertical mixing in the ocean on large-scale climate patterns, meridional temperature gradient, and deep sea ocean temperatures. We find that both carbon dioxide and enhanced vertical mixing cause increased radiative feedback by reducing effective emissivity and surface albedo. For the Miocene, enhanced oceanic heat uptake due to invigorated vertical mixing causes intense warming of the deep ocean (5-10°C) and of the Arctic (>12°C). For the Pliocene we find that the impact of radiative forcing and enhanced vertical mixing is less relevant. This hints to a dependency of carbon dioxide and mixing sensitivity to background climate and ocean dynamics.

While our work is focused on climate modelling, we highlight that consideration of enhanced vertical mixing leads in our Miocene and Pliocene climate simulations to large-scale climate patterns that are in better agreement with specific aspects of proxy-based inference on past warm climates. To further corroborate our results we must compare our simulations with reconstructions of thermocline depth and seasonality - lower seasonality in reconstructions would be in line with higher heat capacity as facilitated by enhanced vertical mixing. Our ad-hoc enhanced mixing formulation for the Pliocene and Miocene (Lohmann et al., 2022) can be motivated by recent simulations with a strongly eddying ocean and an altered heat transport (Nooteboom et al, 2022). In the future, we make use of the eddy resolving model to evaluate the polar amplification of the system with respect to model resolution, gateway configuration, and background CO2.

How to cite: Lohmann, G., Knorr, G., Hossain, A., and Stepanek, C.: Effects of CO2 and Ocean Mixing on Miocene and Pliocene Temperature Gradients, EGU General Assembly 2023, Vienna, Austria, 23–28 Apr 2023, EGU23-11669, https://doi.org/10.5194/egusphere-egu23-11669, 2023.

EGU23-14588 | Orals | CL1

Pliocene climate variability on glacial-interglacial timescales (PlioVAR): lessons learned from multi-proxy reconstructions of sea-surface temperatures and data-model comparisons 

Erin McClymont, Sze Ling Hi, Heather Ford, Julia Tindall, and Alan Haywood and the PlioVAR Working Group

The Pliocene epoch (~2.6-5.3 million years ago) offers an opportunity to study a climate state in long-term equilibrium with current or predicted near-future atmospheric CO2 concentrations. Compared to today, the late Pliocene was characterised by a globally warmer climate, with reduced continental ice volume and reduced ocean/atmosphere circulation intensity. Towards the end of the Pliocene, there was a marked increase in glaciation in the northern hemisphere and atmospheric CO2 concentrations declined.

The Past Global Changes (PAGES) PlioVAR working group co-ordinated a synthesis of marine data to characterise spatial and temporal variability of Pliocene climate, underpinned by high quality data sets and robust stratigraphies. Here we present some of the main findings of this synthesis effort, including new assessments of sea surface temperatures (SSTs) during the KM5c interglacial (~3.2 million years ago) and Pliocene-Pleistocene intensification of northern hemisphere glaciation. We outline our approaches to integrating multi-proxy reconstructions of sea-surface temperatures from a globally distributed suite of marine sediment cores, which included a review and assessment of the impacts of SST calibration choice and interpretation. We show that an improved relationship between proxy data and climate models could be generated by focussing on a single interglacial. Differences between proxies, and between proxies and models, tended to be associated with surface ocean fronts or currents, although seasonality may also be important. The transition towards enhanced northern hemisphere glaciation at the end of the Pliocene had asynchronous trends and patterns in SST as well as benthic stable isotope records. We consider how these results might inform our understanding of past climate forcings and feedbacks during both warm intervals of the past and the development of larger ice sheets in the northern hemisphere. Additional proxy data is required from high-latitude regions of both hemispheres, to assess polar amplification and meridional temperature gradients. Co-ordinated multiproxy SST analyses will also significantly enhance our understanding and interpretation of the signals they record, and provide additional detail for comprehensive data-model comparisons.

How to cite: McClymont, E., Hi, S. L., Ford, H., Tindall, J., and Haywood, A. and the PlioVAR Working Group: Pliocene climate variability on glacial-interglacial timescales (PlioVAR): lessons learned from multi-proxy reconstructions of sea-surface temperatures and data-model comparisons, EGU General Assembly 2023, Vienna, Austria, 23–28 Apr 2023, EGU23-14588, https://doi.org/10.5194/egusphere-egu23-14588, 2023.

The reduction in the tropical to mid-latitude sea surface temperature gradient, as shown by proxy records across the Pacific, is a common feature of past warm intervals but remains difficult for climate models to replicate. This model-data discrepancy (termed “the low-gradient problem”) is potentially tied to the parameterizations of cloud and moist convection in the models, which remain highly uncertain and largely limit the confidence of predicted future climate change. Here, focusing on the mid-Pliocene (4 - 3 Ma) interval, for which climate forcing conditions are relatively well constrained and global SSTs are well sampled, two sets of atmosphere-dynamical ocean coupled simulations with (at 25 km) and without (at 100 km) weather-resolving atmospheric resolution using Community Earth System Model version 1.3 are compared to identify whether better resolved cloud and moist convection can ameliorate the low-gradient problem. Preliminary results show more extensive mid-Pliocene warming in the North Pacific relative to the preindustrial simulated in the high-resolution simulations compared to the low-resolution simulations, whereas tropical Pacific warming is similar in both sets of simulations. The approximate partial radiative perturbation method and heat transport decomposition will be implemented to quantify differences in the shortwave cloud effects and responses of atmospheric dry static and latent energy and ocean heat transport between the high- and low-resolution simulations. The contributions from better resolved clouds and moist convection to the amplified North Pacific warming in the high-resolution simulations will be further quantified.

How to cite: Feng, R.: Revisiting the low-gradient problem with weather-resolving atmosphere-ocean coupled simulations, EGU General Assembly 2023, Vienna, Austria, 23–28 Apr 2023, EGU23-16511, https://doi.org/10.5194/egusphere-egu23-16511, 2023.

EGU23-12474 | ECS | Orals | CL3.1.2 | Arne Richter Award for Outstanding Early Career Scientists Lecture

The kids aren’t alright 

Wim Thiery

Under continued global warming, extreme events such as heatwaves will continue to rise in frequency, intensity, duration, and spatial extent over the next decades. Younger generations are therefore expected to face more such events across their lifetimes compared to older generations. This raises important questions about solidarity and fairness across generations that have fuelled a surge of climate protests led by young people in recent years, and that underpin questions of intergenerational equity raised in recent climate litigation. However, scientific analyses that explicitly consider the intergenerational equity dimension of the climate crisis are remarkably absent. Our standard scientific paradigm is to assess climate change in discrete time windows or at discrete levels of warming, a “period” approach that inhibits quantification of how much more extreme events a particular generation will experience over its lifetime compared to another. By developing a “cohort” perspective to quantify changes in lifetime exposure to climate extremes and compare across generations, we estimate that children born in 2020 will experience a two to sevenfold increase in extreme events, relative to the 1960 birth cohort, under current climate pledges. Building on this framework, we quantify where and when people start living an unprecedented life, as well as intergenerational differences in exposure to attributable extreme events. Furthermore, using a new water deficit indicator, we uncover spatiotemporal differences in lifetime water scarcity. Our results overall highlight a severe threat to the safety of young generations and call for drastic emission reductions to safeguard their future. Finally, this research is already being used in ongoing litigation (e.g. Duarte Agostinho and Others v. Portugal and 32 Other States), calling for more research in this direction to bolster the upcoming wave of climate lawsuits.

How to cite: Thiery, W.: The kids aren’t alright, EGU General Assembly 2023, Vienna, Austria, 23–28 Apr 2023, EGU23-12474, https://doi.org/10.5194/egusphere-egu23-12474, 2023.

EGU23-1893 | Orals | MAL14 | Hans Oeschger Medal Lecture

Combining model results and paleodata using data assimilation 

Hugues Goosse

Observations and model results provide two complementary sources of information on past climate variations. The paleo -or proxy - data characterize the changes that occurred at a particular time while models can be used to infer the mechanisms responsible for those changes. Observations and model results are thus ideally used jointly and the first step before applying models to study past and future climate is to evaluate their ability to reproduce the signal recorded in the data. Paleodata and model results can also be combined more profoundly using data assimilation. While classical model-data comparison can only assess the skills of the model, data assimilation can guide the model results to have a better agreement with the real observed changes and thus to reproduce more accurately the processes at their origin.

The main challenges in paleo data assimilation will be reviewed here. Issues related to the generation of the model results, the model data comparison and the data assimilation technique itself will be addressed. Some recent achievements and perspectives will then be presented, first for spatial reconstructions based on data assimilation and secondly for the quantification of internal and forced climate variability as well as the role of atmospheric and oceanic circulation in past climate changes.

How to cite: Goosse, H.: Combining model results and paleodata using data assimilation, EGU General Assembly 2023, Vienna, Austria, 23–28 Apr 2023, EGU23-1893, https://doi.org/10.5194/egusphere-egu23-1893, 2023.

EGU23-9748 | Orals | CL1.2 | Highlight | Milutin Milankovic Medal Lecture

Milankovitch cycles and the Arctic: insights from past interglacials 

Bette L. Otto-Bliesner

The Arctic is warming at a rate greater than the global average. End-of-summer minimum sea ice extent is declining and reaching new minimums for the historical record of the last 4 decades. The Greenland ice sheet is now losing more mass than it is gaining, with increased surface melting. Earth System Models suggest that these trends will continue in the future. The geologic past can be used to inform what could happen in the future. Emiliani in his 1972 Science paper commented on the relevance of paleoclimate for understanding our future Earth.


Interglacials of the last 800,000 years, including the present (Holocene) period, were warm with low land ice extent. In contrast to the current observed global warming trend, which is attributed primarily to anthropogenic increases in atmospheric greenhouse gases, regional warming during these interglacials was driven by changes in Earth’s orbital configuration. Although the circumstances are different, understanding the behavior, processes, and feedbacks in the Arctic provides insights relevant to what we might expect during future global warming.


Data compilations suggest that despite spatial heterogeneity, Marine Isotope Stages (MIS) 5e (Last Interglacial, ~129 to 116 ka) was globally strong. The Last Interglacial (LIG) is characterized by large positive solar insolation anomalies in the Arctic during boreal summer associated with the large eccentricity of the orbit and perihelion occurring close to the boreal summer solstice. The atmospheric carbon dioxide concentration was similar to the preindustrial period.


Geological proxy data for the LIG indicates that Arctic latitudes were warmer than present, boreal forests extended to the Arctic Ocean in vast regions, summer sea ice in the Arctic was much reduced, and Greenland ice sheet retreat contributed to the higher global mean sea level. Model simulations provide critical complements to this data as the they can quantify the sensitivity of the climate system to the forcings, and the processes and interplay of the different parts of the Arctic system on defining these responses. As John Kutzbach explained in a briefing for science writers, "climate forecasts suffer from lack of accountability. Their moment of truth is decades in the future. But when those same computer programs are used to hindcast the past, scientists know what the correct answer to the test should be."


Significant attention and progress have been made in modeling the LIG in the last 2 decades. Earth System Models now capture more realism of processes in the atmosphere, ocean, and sea ice, can couple to models of the Greenland ice sheet, and include representations of the response of Arctic vegetation to the NH high-latitude summer warming. Increases in computing power has allowed these models to be run at higher spatial resolution and to perform transient simulations to examine the evolving orbital forcing during the LIG.  The international PMIP4 simulations for 127 ka illustrated the importance of positive cryosphere and ocean feedbacks for a warmer Arctic. A CESM2-Greenland ice sheet, transient LIG simulation from 127 ka to 119 ka, established a key role of vegetation feedbacks on Arctic climate change.

How to cite: Otto-Bliesner, B. L.: Milankovitch cycles and the Arctic: insights from past interglacials, EGU General Assembly 2023, Vienna, Austria, 23–28 Apr 2023, EGU23-9748, https://doi.org/10.5194/egusphere-egu23-9748, 2023.

CL1 – Past Climates

EGU23-188 | ECS | Orals | CL1.1

Long-term changes in Carbon accumulation in mountain peatbogs in the South-West of Norway 

Christian Quintana, Anne Bjune, Alistair Seddon, and Hanna Lee

There is relevant research on temporal carbon accumulation changes, mostly in arctic permafrost peatlands in Norway, but little is known about the differences and comparisons with more oceanic and lower latitude peatlands in the region, where rainfall is one of the main climatic drivers. Climate projections in Norway for 2031-2060 and 2071-2100 show a rise in mean temperature and an increase of annual rainfall with more intense seasonal events in western, eastern, and northern parts. Under this rationale, this study hypothesizes that temporal variability of temperature and precipitation during the Holocene led to weaker and stronger evapotranspiration and moisture signals affecting local and regional vegetation in peatland ecosystems, water-table changes, and carbon accumulation capacity. This study will contribute to the generation of evidence of the roles and interactions of hydrology, temperature, vegetation, and land use changes on peatbogs carbon accumulation capacity during the Holocene. It will help to disentangle the responses of the carbon budget at different time scales. Methods involve the use of a set of proxies such as pollen, testate amoeba, LOI and bulk density to reconstruct the peat composition rate, organic matter, water table, and local (and regional) vegetation. A generation of an age-depth model and further multivariate analysis will allow to investigate the relationship between the proxies and carbon accumulation rate over the Holocene to further understand the temperature/precipitation correlation and the effects of a changing climate on the carbon budget.

How to cite: Quintana, C., Bjune, A., Seddon, A., and Lee, H.: Long-term changes in Carbon accumulation in mountain peatbogs in the South-West of Norway, EGU General Assembly 2023, Vienna, Austria, 23–28 Apr 2023, EGU23-188, https://doi.org/10.5194/egusphere-egu23-188, 2023.

EGU23-1447 | ECS | Orals | CL1.1

Temperature and precipitation reconstruction for Last Glacial Central Europe reveals new insights into continental climate dynamics 

Charlotte Prud homme, Peter Fischer, Olaf Jöris, Sergey Gromov, Mathias Vinnepand, Christine Hatté, Hubert Vonhof, Olivier Moine, Pierre Antoine, Andreas Vött, and Kathryn Fitzsimmons

Over the last glacial period, the climate of the Northern Hemisphere experienced numerous abrupt variations on millennial to centennial timescales known as Dansgaard-Oeschger events. These events, characterised by rapid warming at the beginning of interstadials and gradual cooling back to stadial conditions are best documented in Greenland ice cores and North Atlantic marine records, while their propagation onto the continents and potential feedbacks are less well documented. In this context, loess palaeosol sequences in central Europe are valuable archives, often recording these climatic changes in the form of brown soils and tundra gley horizons - indicating milder interstadial conditions - intercalated with primary loess deposits reflecting cold stadial conditions.

To reconstruct palaeoclimate changes at high resolution we use singular material from loess sediments: fossil earthworm calcite granules (ECG). ECGs, composed of aggregated sparite crystals formed in the calciferous earthworm glands, are secreted daily at the soil surfacemostly by Lumbricus species and experience limited vertical mixing within the loess sedimentary column. ECGs are thus an excellent terrestrial material for palaeoclimate reconstructions using stable isotopic geochemistry and radiocarbon dating. ECGs have been collected from two temporally overlapping loess-palaeosol sequences along an NNW-SSE transect in the Rhine River valley of western Germany. We present warm-season land-surface temperature and precipitation estimates at millennial timescales spanning ~ 45-22 cal kBP (late OIS 3 - OIS 2).  We demonstrate that OIS 3-2 climate in the Rhine Valley was significantly cooler during the warm season and overall drier with annual precipitation reduced by up to 70%, compared to the present day. Interstadials were only slightly warmer (1-4°C) than stadial indicating strong attenuation compared to Greenland records. In combination with mesoscale wind and moisture transport modelling we can show that this region was dominated by westerlies and thereby inextricably linked to North Atlantic climate forcing.

The approach combining high-resolution age-depth modelling and geochemical proxy-based climate reconstruction can be readily adopted at other loess palaeosol sequences. We envisage a widespread application of this approach that would improve our understanding of regional variability over the European continent in response to North Atlantic climate changes over millennial to centennial timescales.

How to cite: Prud homme, C., Fischer, P., Jöris, O., Gromov, S., Vinnepand, M., Hatté, C., Vonhof, H., Moine, O., Antoine, P., Vött, A., and Fitzsimmons, K.: Temperature and precipitation reconstruction for Last Glacial Central Europe reveals new insights into continental climate dynamics, EGU General Assembly 2023, Vienna, Austria, 23–28 Apr 2023, EGU23-1447, https://doi.org/10.5194/egusphere-egu23-1447, 2023.

EGU23-1460 | ECS | Posters on site | CL1.1

Warmer and wetter past interglacials in northeast Greenland recorded in speleothems 

Anika Donner, Gina E. Moseley, Werner Kofler, Laurent Marquer, Lena Friedrich, Christoph Spötl, and R. Lawrence Edwards

The Arctic is particularly sensitive to climate warming and the impacts of this warming are expected to have global consequences. In order to improve understanding of the Arctic’s amplified response, it is valuable to study past interglacial periods. In contrast to existing palaeoclimate records for some areas in the Arctic, Greenland prior to 130 ka remains under-investigated. Northeast Greenland, especially, is one of the regions where the effects of Arctic amplification are particularly pronounced, both within the observational period as well as modelled future scenarios. In this study, we utilise inactive speleothems from caves in northeast Greenland (80°N) to investigate the palaeoenvironment of the region. In today’s environment, speleothem deposition is prevented by an arid climate (ca. 200 mm a-1) and frozen ground. Accordingly, the presence of extensive speleothem deposits in the region suggests that there was at least one period of wetter and warmer climate in the recent geological past. The most recent significant speleothem deposition occurred during marine isotope stage 11 (MIS11). Prior to this, the extended MIS13-15 interglacial period was a period of exceptionally prolific speleothem deposition in northeast Greenland. During these two growth phases, the δ18O and δ13C variability show large centennial-scale excursions. Preliminary investigations into pollen preserved in MIS11 speleothem samples suggest an environment vastly different to today, where the landscape is mostly barren except for a few small alpine plants and shrubs. For MIS11, the samples indicate the presence of boreal coniferous species such as Picea, Abies and Pinus as well as others such as Corylus, Alnus, Ericaceae, Cyperaceae, and Poaceae. These results are in agreement with a record of MIS11 vegetation in a marine core off the coast of south Greenland, and while still being under investigation, this could imply that the reconstructed forestation of south Greenland during MIS11 reached further north. Preserved floral macrofossils and large amounts of spores in the speleothem samples indicate potential for further investigations of environmental conditions in northeast Greenland during a warmer and wetter past.      

How to cite: Donner, A., Moseley, G. E., Kofler, W., Marquer, L., Friedrich, L., Spötl, C., and Edwards, R. L.: Warmer and wetter past interglacials in northeast Greenland recorded in speleothems, EGU General Assembly 2023, Vienna, Austria, 23–28 Apr 2023, EGU23-1460, https://doi.org/10.5194/egusphere-egu23-1460, 2023.

EGU23-1735 | ECS | Posters on site | CL1.1

Polycyclic Aromatic Hydrocarbons (PAHs) in speleothems. 

Julia Homann, Sebastian Breitenbach, Stacy Carolin, David Hodell, Jessica Oster, Cameron de Wet, and Thorsten Hoffmann

Secondary mineral deposits in caves, such as stalagmites, constitute valuable paleoclimate archives because they are largely protected from degradation by stable in-cave conditions and can be precisely dated In addition to established climate proxies such as stable isotopes and trace elements, organic proxies have become increasingly attractive in recent years for the study of paleo vegetation, wildfires, and hydrodynamics. [1]

Biomass burning events are major sources of atmospheric particulate matter that influences global and local climate. [2] Investigating fire proxies in paleoclimate archives may therefore help determine the interactions of climate, hydrology, and fire activity.

Polycyclic Aromatic Hydrocarbons (PAHs) are organic molecules made up of two or more fused aromatic rings. They stem from the incomplete combustion of organic matter. Their persistence in the environment makes them useful for the reconstruction of fire events from paleoenvironmental archives like sediments, peat, ice cores, and soils. [3-6] Their presence has also been reported in speleothems, however, only a limited range of PAHs seem to be transported into the cave and subsequently preserved in speleothem carbonate. [7, 8]

We present a new sample preparation method for the extraction of PAHs from speleothem and the subsequent extraction of levoglucosan, an anhydrosugar derived from the combustion of cellulose that also constitutes a marker for biomass burning. We apply this method to speleothems from Cenote Ch'en Mul, Mayapan, on the Yucátan peninsula, and White Moon Cave, California, to investigate the relationship between PAHs and levoglucosan. Such tandem approach will deepen our understanding of paleo-fire dynamics and strengthen proxy-based reconstructions.

[1] A. Blyth et al. Quat. Sci. Rev. 149 (2016) 1-17 [2] P. Yao et al. J. of Glaciology 59 (2013) 599-611 [3] Tan et al. Palaeogeography, Palaeoclimatology, Palaeoecology 560 (2020) 110015 [4] Argiriadis et al. Microchem. J. 156 (2020) 104821 [5] Vecchiato et al. Sci. Rep. (2020) 10:10661 [6] Chen et al. ACS Earth Space Chem. 2018, 2, 1262−1270 [7] Argiriadis et al. Anal. Chem. 2019, 91, 7007−7011 [8] Perrette et al. Chem. Geol. 251 (2008) 67–76

How to cite: Homann, J., Breitenbach, S., Carolin, S., Hodell, D., Oster, J., de Wet, C., and Hoffmann, T.: Polycyclic Aromatic Hydrocarbons (PAHs) in speleothems., EGU General Assembly 2023, Vienna, Austria, 23–28 Apr 2023, EGU23-1735, https://doi.org/10.5194/egusphere-egu23-1735, 2023.

EGU23-2303 | ECS | Orals | CL1.1

Tracking methane fluxes using intact polar and core lipids in an aridity transect of the Okavango Delta (Botswana) 

Julie Lattaud, Mangaliso Gondwe, Darci Rush, Ellen Hopmans, Carole Helfter, and Cindy De Jonge

Wetland methane (CH4) emissions are the largest natural source in the global CH4 budget, contributing to roughly one third of total natural and anthropogenic emissions. As the second most important anthropogenic greenhouse gas in the atmosphere after CO2, CH4 is strongly associated with climate feedbacks. The different pathways of biochemical cycling of CH4, which exert a primary control on atmospheric CH4 concentrations through its production and biological consumption, remain poorly constrained. It is therefore crucial to understand and, if possible, quantify these variable CH4 sources to natural climate variability.

We studied a soil transect (up to seven sites, 250 m long) across a seasonal floodplain at Nxaraga on the south-west part of the Chief’s Island, Okavango Delta, Botswana, over three years (2018 – 2020, 50 samples in total). Previous studies showed a clear link between CH4 fluxes and soil water content in the area, with CH4 fluxes in the seasonally flooded soils of up to 492 nmol m-2 s-1.

To constrain biomass active in CH4 production (specifically, methanogenic archaea) intact and core isoprenoid lipids (and their stable carbon isotope signature) were quantified on a High Performance Liquid Chromatograph (HPLC) and on an high-resolution mass spectrometer ("Orbitrap"). To constrain biomass of CH4 oxidizers (i.e. bacterial methanotrophs), core (hopanol) and intact lipids (i.e., bacteriohopanepolyols (BHPs)) were analyzed non-derivatized on an Orbitrap. Confirming their proposed methanotroph source, BHP-aminopentol and methylcarbamate-BHP were detected and their variation correlated positively with those of hopanols and archaeol lipids. Methyl-amino BHPs however were not detected in the soils. In-depth study of their environmental variation points towards two bacterial communities depending on the pH, EC and water content of the soils. This will be confirmed or refuted by bacterial community profiling based on 16S RNA genes, and functional genes for methane oxidation

How to cite: Lattaud, J., Gondwe, M., Rush, D., Hopmans, E., Helfter, C., and De Jonge, C.: Tracking methane fluxes using intact polar and core lipids in an aridity transect of the Okavango Delta (Botswana), EGU General Assembly 2023, Vienna, Austria, 23–28 Apr 2023, EGU23-2303, https://doi.org/10.5194/egusphere-egu23-2303, 2023.

EGU23-2706 | Posters on site | CL1.1

crestr: An R package to perform probabilistic climate reconstructions from palaeoecological datasets 

Manuel Chevalier and Brian M. Chase

Quantitative climate reconstructions are fundamental to better understanding past environmental changes and evaluating climate simulations. The proliferation of pollen-based reconstructions during the past decades has been instrumental in improving our understanding of past climate dynamics across various spatial and temporal scales. However, this knowledge has been mainly concentrated in North America and parts of Eurasia, and very few quantifications exist in the tropics. This global data imbalance is partly due to the sparser network of supporting pollen records in these regions and, in equal proportions, to the limitations of the most commonly used reconstruction techniques (e.g. the analogue technique or WA-PLS) in dealing with the specificities of tropical vegetation. To address this problem and produce the much-needed climate quantification from tropical regions, we propose using the probabilistic method CREST (Climate REconstruction SofTware) that uses probability density functions (‘pdfs’) fitted on modern occurrence plant data to reconstruct environmental parameters. CREST, which has been successfully employed in Africa and South America, offers many advantages over the classical approaches, including 1) a higher flexibility of application, 2) a better capacity to estimate uncertainties, and thanks to the recent developments of a dedicated R package crestr that includes a global calibration dataset, 3) CREST is applicable in every environment where plants currently grow. Considering these advantages, the large-scale application of CREST to quantitatively reconstruct important climate parameters from the existing tropical fossil pollen records should 1) help better integrate and interpret regional proxy compilations, 2) shed light on the spatiotemporal climate variability of tropical regions, and 3) determine the main modes of tropical climate variability. With this contribution, we will showcase the use of the crestr package with a novel temperature reconstruction derived from the 270,000-year-long, high-resolution pollen record from Laguna Fùquene in Colombia and discuss how this type of analysis could be generalised to determine spatial patterns of climate change from multi-record reconstructions

How to cite: Chevalier, M. and Chase, B. M.: crestr: An R package to perform probabilistic climate reconstructions from palaeoecological datasets, EGU General Assembly 2023, Vienna, Austria, 23–28 Apr 2023, EGU23-2706, https://doi.org/10.5194/egusphere-egu23-2706, 2023.

EGU23-3736 | ECS | Posters on site | CL1.1

The Influence of Temperature on the Fall of the Guge Kingdom in Western Tibet, China 

Haichao Xie and Jie Liang

Branched glycerol dialkyl glycerol tetraethers (brGDGTs) from lacustrine sediments have been widely used to reconstruct mean annual air temperature (MAAT). Although many proxy calibrations relating brGDGT characteristics have been put forth, these calibrations may produce warm biases when applied to lakes in cold regions. We present an expanded Chinese lake surface sediment brGDGT-MAAT calibration with 29 new surface samples from cold regions along with 39 previously published from Chinese lakes. We deployed sediment traps in a meromictic lake, Dagze Co, and compared results with previously published data from a dimictic lake, Lake 578 in Greenland, to determine potential seasonal and depth-dependence of brGDGTs. In the meromictic lake, brGDGTs are primarily produced in the lake bottom water, whereas in the dimictic lake, the brGDGTs are produced throughout the water column and mainly reflect the annual bottom water temperature or mixing season water column temperature. We applied our refined calibration to a sediment core from Western Tibet to examine how fluctuations in temperature influenced the Guge Kingdom over the last 2,000 years. Our record reveals relatively warm temperatures during the Medieval Climate Anomaly, cooling of 2°C to -2°C during the Little Ice Age, warming into the eighteenth century, and stabilization after 1800 CE. The temperature variations coincided with a transition of dynasties in Western Tibet. Temperature sensitivity tests on barley distribution, the principal cultivated cereal in Tibet, suggest that a decline in temperature led to a decreased crop yield that may have factored into the disappearance of the Guge Kingdom.

How to cite: Xie, H. and Liang, J.: The Influence of Temperature on the Fall of the Guge Kingdom in Western Tibet, China, EGU General Assembly 2023, Vienna, Austria, 23–28 Apr 2023, EGU23-3736, https://doi.org/10.5194/egusphere-egu23-3736, 2023.

EGU23-6593 | ECS | Orals | CL1.1

Applying Brillouin thermometry as a novel tool for reconstructing temperatures, depths, and seasonal biases of Holocene/Pleistocene Searles Lake, California 

Kristian Olson, Emmanuel Guillerm, Mark Peaple, Tim Lowenstein, Véronique Gardien, Frédéric Caupin, Sarah Feakins, Jessica Tierney, Justin Stroup, Steve Lund, and David McGee

Paleoclimate records from lakes of the southwestern USA have been limited by a lack of independent paleothermometers, resulting in conflicting characterizations of millennial-scale variability in temperature and moisture. Here a novel method called Brillouin thermometry is applied to halite-bearing dry intervals of the late Pleistocene/Holocene (45–0 ka) core record of Searles Lake, California. Halite from the sediment-water interface records lake bottom temperatures during dry, high salinity periods. Analysis of modern saline lakes of various chemistries, depths, climate zones, and mixing regimes shows that: 1) average bottom water temperature is approximately equal to mean annual air temperature, and 2) annual range of bottom water temperature is inversely proportional to lake depth. Brillouin temperatures for eight halite intervals 30.6 ka to 8.5 ka range from 11.8 ± 3.6 to 22.4 ± 3.2 °C. Bottom water temperature variability indicates paleolake depths of ~10 m during halite precipitation. Brillouin thermometric results are then assessed in comparison with two additional temperature proxy records from the same Searles Lake sediment core: 1) branched glycerol dialkyl glycerol tetraethers (brGDGTs) extracted from wet mud intervals, and 2) thermodynamic constraints from evaporite minerals and mineral sequences. Temperatures from brGDGTs for mud intervals 44.7 ka to 3.6 ka range from 13.4 ± 2.8 to 23.9 ± 3.0 °C. Comparisons of Brillouin/brGDGT temperatures with predicted equilibrium temperatures of salt crystallization indicate intervals where seasonal temperature variability forced the dissolution and/or recrystallization of existing temperature-sensitive evaporites. The multiproxy temperature record of Searles Lake agrees with other regional records at glacial/interglacial timescales but displays a wider degree of millennial-scale variability, with temperatures during the last glacial ranging from 8.3 °C below modern mean annual temperatures to 3.8 °C above.

How to cite: Olson, K., Guillerm, E., Peaple, M., Lowenstein, T., Gardien, V., Caupin, F., Feakins, S., Tierney, J., Stroup, J., Lund, S., and McGee, D.: Applying Brillouin thermometry as a novel tool for reconstructing temperatures, depths, and seasonal biases of Holocene/Pleistocene Searles Lake, California, EGU General Assembly 2023, Vienna, Austria, 23–28 Apr 2023, EGU23-6593, https://doi.org/10.5194/egusphere-egu23-6593, 2023.

EGU23-8090 | ECS | Posters on site | CL1.1

A Late Holocene δ18O paleoclimate record from the afro-alpine Lake Garba Guracha, Bale Mountains Ethiopia: implications for human occupation/abandonment 

Samuel, Getachew Chernet, Lucas Bittner, Graciela Gil-Romera, and Michael Zech

The Late Holocene, being a period when human footprint in paleoenvironmental archives became increasingly apparent, records important information about how early humans adapted to ever changing climatic conditions. Garba Guracha is an afro-alpine cirque lake located in the Bale Mountains National Park in the southeastern highlands of Ethiopia. The reconstructed age depth model with a time resolution of 10 years/cm makes it one of the best climate archives in the highlands of Eastern Africa. A total of 15.5 meter core recording 16 ka of sedimentation was retrieved from the lake. Previous works done on the archive include: (i) establishing the age-depth model and determination of sedimentation rates using bulk sedimentary organic matter, bulk n-alkane and charcoal 14C ages (Bittner et al. 2020); (ii) multi-proxy paleoenvironment reconstruction using charcoal, diatoms, biomarkers, and stable isotopes (Bittner et al., 2022; Gil-Romera et al., 2019). Results from these works show a strong variability for the late Holocene that represents the termination of the African Humid Period (AHP) and increased fire intensity. This study focuses on the topmost sedimentary succession of the core representing the late Holocene (~5 ka to present) and implements δ18Osugar extracted from organic matter derived sugar biomarkers in high resolution (every 4 cm). The δ18Osugar record can be used for reconstructing the lake evaporation history. Furthermore, combing these new data with other data obtained from n-alkane, charcoal and archaeological studies will shade light on a possible climate human interactions in high alpine ecosystem.

References

Bittner, L., Bliedtner, M., Grady, D., Gil-Romera, G., Martin-Jones, C., Lemma, B., Mekonnen, B., et al., 2020. Revisiting afro-alpine Lake Garba Guracha in the Bale Mountains of Ethiopia: rationale, chronology, geochemistry, and paleoenvironmental implications. Journal of Paleolimnology 64, 293–314.

Bittner, L., Gil-Romera, G., Grady, D., Lamb, H., Lorenz, E., Weiner, M., Zech, M. (2022). The Holocene lake-evaporation history of the afro-alpine Lake Garba Guracha in the Bale Mountains, Ethiopia, based on δ18O records of sugar biomarker and diatoms. Quaternary Research, 105, 23-36.

Gil-Romera, G., Adolf, C., Benito Blas, M., Bittner, L., Johansson, M.M.U., Grady, D.D.A., Lamb, H.H.F., et al., 2019. Long-term fire resilience of the Ericaceous Belt, Bale Mountains, Ethiopia. Biology Letters 15, 20190357. 

How to cite: Chernet, S. G., Bittner, L., Gil-Romera, G., and Zech, M.: A Late Holocene δ18O paleoclimate record from the afro-alpine Lake Garba Guracha, Bale Mountains Ethiopia: implications for human occupation/abandonment, EGU General Assembly 2023, Vienna, Austria, 23–28 Apr 2023, EGU23-8090, https://doi.org/10.5194/egusphere-egu23-8090, 2023.

EGU23-8094 | Posters on site | CL1.1

Dansgaard-Oeschger climate oscillation during the early MIS3 in Europe: evidence from a multi proxy (bulk & clumped stable isotopes and trace elements) speleothem record in Han-sur-Lesse, Belgium 

Marion Peral, Marta Marchegiano, Sophie Verheyden, Steven Goderis, Tom Van Helden, Frank Vanhaecke, Thibaut Van Acker, Jia Xuexue, Hai Cheng, and Philippe Claeys

The Marine Isotope Stage 3 (MIS 3) – a period between 60 and 27 ka ago during the last glacial cycle – experienced several abrupt climatic warming phases known as Dansgaard-Oeschger (DO) events. The DO events are abrupt transitions from cold (stadial) to mild (interstadial) climate conditions.

Speleothems are precious continental records and provide important climatic information at high resolution. However, during this time period, the north central Europe is less studied because the MIS 3 is generally not recorded, due to the climatic conditions. Here, we present the first Belgium continuous speleothem (flowstone) record covering the early MIS 3 (from 60 to 40 ka) from the Verviétois Gallery that is part of the Han sur Lesse cave system (southern Belgium). High resolution bulk stable isotope and elemental combined with U-Th dating are used to define the Belgium climatic variability. Additionally, clumped isotope measurements have been performed to reconstruct temperature to better constrain climatic response during the DO 16-12.

The multiproxy approach used to investigate the speleothem record shows a regional response to the global climate conditions during MIS3. The d13C and d18O values as well as the elemental analyses (Mg, Ba and Sr as water availability proxies and P and Zn as soil development) mirror the DO 16 and 12 events indicating dry-wet and cold-warm changes. During interstadials events low values of d18O and d13C and Mg, Ba and Sr content suggest wet/warm conditions, while the increase of isotopic and elemental values during the stadials support a climate deterioration with cooling and drier conditions. The clumped-isotope temperatures, performed on the DO 16 and 12, suggest warm interstadials (12OC +/- 2OC) and cold stadials (7OC +/- 2OC) climate.

During the DO12, a delay in the climatic amelioration and the vegetation is observed. This delay, also noted in south-west France cave (Villars cave), seems to be linked to a delay between increase of temperature and water availability allowing the soil above the cave to growth. Also, a climatic deterioration occurred after the DO11, with an increase time lag from the north to the south of Europe, showing a progressive cooling to the south Europe. It is interesting to note that this gradual cooling in Europe coincides, withing dating error bars, with the potential progressive north-south decline of the Neanderthals in Europe.

How to cite: Peral, M., Marchegiano, M., Verheyden, S., Goderis, S., Van Helden, T., Vanhaecke, F., Van Acker, T., Xuexue, J., Cheng, H., and Claeys, P.: Dansgaard-Oeschger climate oscillation during the early MIS3 in Europe: evidence from a multi proxy (bulk & clumped stable isotopes and trace elements) speleothem record in Han-sur-Lesse, Belgium, EGU General Assembly 2023, Vienna, Austria, 23–28 Apr 2023, EGU23-8094, https://doi.org/10.5194/egusphere-egu23-8094, 2023.

EGU23-9130 | Orals | CL1.1

Retrieving the rainfall signature from the isotope composition of speleothem fluid inclusion water: progress and pitfalls 

Hubert Vonhof, Monika Markowska, Elan Levy, Alfredo Martinez Garcia, Sam Nicholson, and Julian Schroeder

Over recent years, a growing number of case studies have highlighted the relevance of fluid inclusion (FI) isotope analysis on speleothem calcite for the reconstruction of rainfall isotope variation back in time. Multiple studies documented FI isotope results consistent with projected local meteoric water line values, demonstrating that FI isotope analysis can provide unique and quantitative paleohydrological data. Several other studies have shown that FI isotope data can be compromised due to diagenetic effects, or (petrography-controlled) analytical artefacts. Such diagenetic or analytical artefacts typically have a detrimental impact on the accuracy of isotope equilibrium-based cave temperatures calculated from paired oxygen isotope values of FI water and host calcite.

Here, we will highlight some recent FI isotope records, discuss current views on the recognition of FI isotopic artefacts, and provide guidelines for the interpretation of FI isotope data as a paleo-rainfall proxy, with particular focus on direct comparison to novel TEX86 paleotemperatures that can be derived from the same speleothem calcite.

How to cite: Vonhof, H., Markowska, M., Levy, E., Martinez Garcia, A., Nicholson, S., and Schroeder, J.: Retrieving the rainfall signature from the isotope composition of speleothem fluid inclusion water: progress and pitfalls, EGU General Assembly 2023, Vienna, Austria, 23–28 Apr 2023, EGU23-9130, https://doi.org/10.5194/egusphere-egu23-9130, 2023.

EGU23-9362 | Posters on site | CL1.1

Resurrecting lost forests – speleothems inform on environmental changes in northern Scotland during MIS 5e 

Sebastian F.M. Breitenbach, Julia Homann, Hamish Couper, Beth R.S. Fox, Ola Kwiecien, Tim J. Lawson, Thorsten Hoffmann, Gideon M. Henderson, and Tim C. Atkinson

Modern Northern Scotland is a largely barren landscape, with most of the natural temperate rainforest that covered the Atlantic side of Great Britain lost to active deforestation and overgrazing, mainly by sheep and deer (Shrubsole 2022). Pockets of relic temperate rainforest are reminders of the significant changes induced by the arrival of humans and their domestic animals. However, little is known about early Holocene and previous interglacial environmental conditions, and here we propose an unorthodox archive of natural vegetation cover of Scotland.

We present a new U-Th dated speleothem from the previous interglacial (MIS 5e/Ipswichian) and use stable oxygen and carbon isotope ratios, in tandem with lignin, a biopolymer with three monomers, to gain insight into last interglacial environmental conditions in Assynt, NW Scotland. The lignin monomer ratio provides information about relative changes between gymnosperm vs. angiosperm plant communities, and thus on changes in vegetation (e.g., from pine forest to moorland or grassland).

Flowstone TJL20080901 was found broken and recovered in 2008 from Rana Hole, a cave at 352 m above sea level overlain by heather moorland overlying blanket peat (Lawson & Dowswell 2022). Seven U-Th dates, analysed at Oxford University, show that this calcite flowstone was deposited between 127 and 119 ka BP during Marine Isotope Stage 5e, with an average growth rate between 20 and 40 μm/yr.

We suggest that speleothem δ13C indicates local infiltration and vegetation and soil composition, whereas δ18O reflects the history (source, temperature, seasonality) of the moisture feeding the cave stream from which the flowstone was precipitated. The lignin composition directly relates to local vegetation cover.

Our new multi-proxy record provides unique insights into environmental conditions in Assynt during MIS 5e, and the history of vegetation developing without human interference.

References

Homann et al. (2022) Linked fire activity and climate whiplash in California during the early Holocene. Nature Communications 13:7175

Lawson T. J. & Dowswell P. N. F. (2022) Caves of Assynt (3rd edition). Grampian Speleological Group. Edinburgh, 211 pages, ISBN 987-1-7397635-0-3

Shrubsole G. (2022) The lost rainforests of Britain. HarperCollins Publishers, 336 pages, ISBN 9780008527952

How to cite: Breitenbach, S. F. M., Homann, J., Couper, H., Fox, B. R. S., Kwiecien, O., Lawson, T. J., Hoffmann, T., Henderson, G. M., and Atkinson, T. C.: Resurrecting lost forests – speleothems inform on environmental changes in northern Scotland during MIS 5e, EGU General Assembly 2023, Vienna, Austria, 23–28 Apr 2023, EGU23-9362, https://doi.org/10.5194/egusphere-egu23-9362, 2023.

EGU23-9507 | Posters on site | CL1.1

Timescales of volcanic impacts on terrestrial and aquatic ecosystems in the Eastern Mediterranean 

Nadine Pickarski, Ola Kwiecien, and Thomas Litt

Instrumental data show that while the impact of volcanic eruptions on their immediate vicinity is destructive, long-term consequences can be beneficial. However, beyond last millennia observational data and ancient oral history, the detailed insights into timescales and scopes of recovery remain largely unresolved. Here we illustrate the complex response of local and regional vegetation, aquatic ecosystem, and fire activity to volcanic eruptions in close connection to prevailing climate conditions and assess the recovery time in varve-years.

We selected five volcaniclastic layers in the annually laminated sediments from Lake Van (Turkey). Analysed intervals cover glacial, interglacial, stadial and interstadial snapshots (spanning from Marine Isotope Stages 3 to 9e) and facilitate studying ecosystem’s responses under different climatic boundary conditions. Using high-resolution pollen data, non-pollen palynomorphs, and microscopic charcoal particles (>20 µm) we attempted to disentangle climatic and volcanic forcing of natural environmental disturbances. Our results highlight that the thickness of subsequent volcanic deposits and the respective climatic conditions strongly influence the impact on terrestrial and aquatic ecosystems. Similarily, the vegetation types predominant before the volcanic eruption have a decisive influence on subsequent pollen productivity and vegetation composition. On land, the most common response to ash deposition is a sudden shift towards steppe herbaceous taxa and abrupt fire activity. The affected herbaceous vegetation can recover to pre-eruption levels in as few as 20 to 40 varve-years. On the contrary, the lake water experiences intensified productivity due to subsequent nutrient input and significant short-term increase in aquatic taxa and non-siliceous microfossils.

Our approach helps in understanding complex ecosystems subjected to a variety of influencing factors operating on different time scales. Our results show the importance of distinguishing between the impact of tephra deposition and volcanically-induced climate change for tracking short-term ecosystem changes superimposed on long-term trends.

How to cite: Pickarski, N., Kwiecien, O., and Litt, T.: Timescales of volcanic impacts on terrestrial and aquatic ecosystems in the Eastern Mediterranean, EGU General Assembly 2023, Vienna, Austria, 23–28 Apr 2023, EGU23-9507, https://doi.org/10.5194/egusphere-egu23-9507, 2023.

EGU23-9780 | ECS | Orals | CL1.1

Quantifying Holocene temperature changes using bacterial and archaeal membrane lipids (GDGTs) in the Swiss Alps 

Fatemeh Ajallooeian, Sarah Nemiah Ladd, Nathalie Dubois, Carsten Schubert, Mark Alexander Lever, and Cindy De Jonge

Currently, Holocene paleoclimate research shows discrepancies in the timing and extent of the so-called Holocene “climate optimum” (1). To better understand this phenomenon in the alpine region, we examine the mean annual air temperature (MAT) record based on the distribution of Glycerol Dialkyl Glycerol Tetraethers (GDGTs) in a 14-m long sediment core from Lake Rot, Switzerland. This small eutrophic monomictic lake is characterized by a seasonally anoxic hypolimnion. An age model based on 20 calibrated 14C dates shows that the top 10 m of sediments reflect the early, middle, and late Holocene (10 cal. ka BP to recent).


To constrain environmental changes, we also look at total organic carbon (TOC), total inorganic carbon (TIC), total nitrogen (TN), and bulk organic matter δ13C and δ15N (n = 300). These indices give insight into the sources of organic matter in Lake Rot sediments. A stable and dominantly in-situ produced lacustrine source of organic matter is indicated by the range in C/N values (4-17) and d15N values (-0.37-5.84). Increasing TOC and δ13C values during the early Holocene (around 10 cal. ka BP), likely reflect elevated primary production in the lake during postglacial climate warming. Subsequently, high TIC values indicate a period with high calcite precipitation (10-8 cal. ka BP). Between 8-1.5 cal. ka BP, high TOC and very low TIC values indicate a dramatic change in the system, reflecting a higher production and/or conservation of organic matter. After this period, TOC decreases, showing a last increase in the top 50cm of the core, presenting signs of eutrophication. Lake Rot thus has experienced large changes in the last 10ka.

From a subset of 63 samples, GDGTs are analysed to reconstruct MAT using the methylation index of brGDGTs (MBT’5ME). Using a lake calibration (2), reconstructed average MAT is 8.4℃ (RMSE = 2.1℃). The absence of large temperature changes during the Holocene highlights that the MBT’5ME-based reconstructed temperatures are not influenced by the large changes in water chemistry recorded by the bulk TOC and TIC values. Instead, the temperature reconstruction reflects stable Holocene temperature ranges, presenting no expressed “climate optimum” in this core. The most recent reconstructed temperature of 9.7℃ resembles actual measured MAT (10.7℃).

Based on our results, the isoprenoid GDGT TEX86 is not applicable for the reconstruction of temperature in Lake Rot. This matches a recent study of perialpine lakes where the successful application of TEX86 was suggested to be limited to deep lakes (>100 m) (3). In addition, we will discuss whether production of in-situ brGDGTs in the water column and seasonality influence the sediment temperature record, as proposed by the authors and other studies (2,4).


1: Herzschuh et al., (2022). EGUsphere, 1-23.

2: Russell et al., (2018). Organic Geochemistry, 117, 56-69.

3: Damsté et al., (2022). Quaternary Science Reviews, 277, 107352.

4: Loomis et al., (2014). Geochimica et Cosmochimica Acta, 144, 173-187.

How to cite: Ajallooeian, F., Ladd, S. N., Dubois, N., Schubert, C., Lever, M. A., and De Jonge, C.: Quantifying Holocene temperature changes using bacterial and archaeal membrane lipids (GDGTs) in the Swiss Alps, EGU General Assembly 2023, Vienna, Austria, 23–28 Apr 2023, EGU23-9780, https://doi.org/10.5194/egusphere-egu23-9780, 2023.

EGU23-10570 | ECS | Orals | CL1.1

Exploring Pacific Island hydroclimatic extremes using the South Pacific Drought Atlas 

Philippa Higgins, Jonathan Palmer, Fiona Johnson, Martin Andersen, and Chris Turney

Droughts are a natural occurrence in many small Pacific Islands and can have severe impacts on local populations and environments. The El Niño-Southern Oscillation (ENSO) is a well-known driver of drought in the South Pacific, but our understanding of extreme ENSO events and their influence on island hydroclimate is limited by the short instrumental record and the infrequency of ENSO extremes. To address this gap, we present the South Pacific Drought Atlas (SPaDA), a multi-proxy, spatially resolved reconstruction of the November-April Standardised Precipitation Evapotranspiration Index for the southwest Pacific islands. The reconstruction integrates coral proxies, which provide local information on the South Pacific hydroclimate but are limited in number and length, with a network of continental tree-ring chronologies targeting Pacific climate variability through remote teleconnections. The reconstruction demonstrates the benefits of multi-proxy reconstructions incorporating tree rings, which allow for the alignment of other proxy records without chronological error.

The SPaDA provides a 350-year, continuous dataset of climate information, which can be used to explore the occurrence of extreme events in the pre-instrumental period. The SPaDA closes the gap between existing paleo-reconstructions of point ENSO indices, and a spatially resolved drought atlas, allowing both the hydroclimate of individual islands and regional patterns of drought to be assessed. The benefit of a spatially resolved dataset to assess climate extremes in small Pacific islands is highlighted in the case of extreme El Niño events, which can have substantially different hydroclimatic impacts than more moderate events.

We used an Isolation Forest, an unsupervised machine learning algorithm, to identify anomalous hydroclimatic states in the SPaDA that may indicate the occurrence of an extreme event. Extreme El Niño events characterised by very strong southwest Pacific drought anomalies and a zonal South Pacific Convergence Zone orientation are shown to have occurred semi-regularly throughout the reconstruction interval, providing a valuable baseline to compare to climate model projections. By identifying the spatial patterns of drought resulting from extreme events, we can better understand the impacts these events may have on individual Pacific Islands in the future.

How to cite: Higgins, P., Palmer, J., Johnson, F., Andersen, M., and Turney, C.: Exploring Pacific Island hydroclimatic extremes using the South Pacific Drought Atlas, EGU General Assembly 2023, Vienna, Austria, 23–28 Apr 2023, EGU23-10570, https://doi.org/10.5194/egusphere-egu23-10570, 2023.

EGU23-13521 | ECS | Orals | CL1.1

Cloudy with a chance it rained: Progress towards a proxy for palaeocloud 

Tamara Fletcher, Julia Tindall, Jochen Voss, and Alan Haywood

Cloud has profound impacts on climate, thus accurate cloud simulation is critical for accurate climate modelling. As the greatest source of uncertainty in such models, cloud drives discrepancies in the prediction of future climate. Cloud simulations are validated against recent observations; however, these records do not capture the climate space we are entering this century, limiting our ability to test model accuracy under near future conditions.

The best analogue for the 21st Century climate trajectory comes from the Pliocene. Reconstructions of Pliocene cloud regimes would provide critical validation data for climate model performance with respect to cloud. However, despite the wealth ways to reconstruct other climate variables, no method has been developed for reconstructing cloud in deep time.

We are working towards proxies capable of reconstructing past cloud, with the goal of establishing a global cloud database for the Pliocene. Our initial results demonstrate the relationship between vegetation and large-scale patterns in cloud in the modern, and tests the model derived from the modern data against palaeoclimate model vegetation and cloud.

How to cite: Fletcher, T., Tindall, J., Voss, J., and Haywood, A.: Cloudy with a chance it rained: Progress towards a proxy for palaeocloud, EGU General Assembly 2023, Vienna, Austria, 23–28 Apr 2023, EGU23-13521, https://doi.org/10.5194/egusphere-egu23-13521, 2023.

EGU23-13661 | Posters on site | CL1.1

Development of new global lake brGDGT-temperature calibrations: advances, applications and challenges 

Emma Pearson, Steve Juggins, Stephen Roberts, Tony Phillips, Dominic Hodgson, David Naafs, Louise Foster, and Harry Allbrook

Quantitative paleoclimate reconstructions are fundamental to understand long-term trends in natural climate variability and to test climate models used to predict future climate change. Branched glycerol dialkyl glycerol tetrathers (brGDGTs) are bacterial cell membrane lipids, with a molecular structure that strongly depends on growth temperature, and global and regional lacustrine brGDGT-temperature calibrations have been used to reconstruct past temperatures using lake sediments from a range of environments.

Application of the global and regional Antarctic and sub-Antarctic brGDGT calibrations (Pearson et al., 2011; Foster et al., 2016) however, suggests a need to expand and improve reconstruction accuracy for cold, extreme environments (Roberts et al., 2017). We construct new global lacustrine brGDGT-temperature calibrations using datasets obtained via brGDGT analysis using two existing (single and dual column LCMS) analytical methods, and comprising Antarctic and sub-Antarctic samples, and other available published datasets.

Advancements in calibration studies principally comprise two main routes: one via expansion of calibration datasets, the other by improving reconstructions. We address both of these by both expanding existing datasets, and also by evaluating a range of different statistical approaches, all of which are subjected to rigorous cross-validation. For each of our calibration datasets we investigate a range of different statistical modelling approaches to predict mean annual temperature, mean summer temperature and mean temperature of months above freezing, where available, derived from field measurements and the gridded ERA5 dataset (Hersbach et al., 2019) across the whole and <15°C subset of the temperature range.

We apply our new calibrations to existing published lake sediment core records from contrasting environments to compare and evaluate the performance of the different analytical and statistical methods. Our findings highlight some of the complexities and caveats of the different methods and have important implications for the application of lacustrine brGDGT temperature calibrations to lakes at a global scale.


References

Foster LC, Pearson EJ, Juggins S, Hodgson DA, Saunders KM, Verleyen E, Roberts SJ. Development of a regional glycerol dialkyl glycerol tetraether (GDGT)–temperature calibration for Antarctic and sub-Antarctic lakes. Earth and Planetary Science Letters 2016, 433, 370-379.

Hersbach, H., Bell, B., Berrisford, P., Biavati, G., Horányi, A., Muñoz Sabater, J., Nicolas, J., Peubey, C., Radu, R., Rozum, I., Schepers, D., Simmons, A., Soci, C., Dee, D., Thépaut, J-N. (2019): ERA5 monthly averaged data on single levels from 1979 to present. Copernicus Climate Change Service (C3S) Climate Data Store (CDS). (Accessed on 08-Sep-2020, 29-Mar-2021), 10.24381/cds.f17050d7

Pearson EJ, Juggins S, Talbot HM, Weckström J, Rosén P, Ryves D, Roberts S, Schmidt R. A lacustrine GDGT-temperature calibration from the Scandinavian Arctic to Antarctic: Renewed potential for the application of GDGT-paleothermometry in lakes. Geochimica et Cosmochimica Acta 2011, 75(20), 6225-6238.

Roberts SJ, Monien P, Foster LC, Loftfield J, Hocking EP, Schnetger B, Pearson EJ, Juggins S, Fretwell P, Ireland L, Ochyra R, Haworth AR, Allen CS, Moreton SG, Davies SJ, Brumsack H-J, Bentley MJ, Hodgson DA. Past penguin colony responses to explosive volcanism on the Antarctic Peninsula. Nature Communications 2017, 8, 14914.

How to cite: Pearson, E., Juggins, S., Roberts, S., Phillips, T., Hodgson, D., Naafs, D., Foster, L., and Allbrook, H.: Development of new global lake brGDGT-temperature calibrations: advances, applications and challenges, EGU General Assembly 2023, Vienna, Austria, 23–28 Apr 2023, EGU23-13661, https://doi.org/10.5194/egusphere-egu23-13661, 2023.

EGU23-14517 | ECS | Posters on site | CL1.1

A Miocene (23–12.5 Ma) continental paleotemperature record from the northern Mediterranean region (Digne-Valensole Basin, SE France) 

Armelle Ballian, Maud J. M. Meijers, Katharina Methner, Isabelle Cojan, Damien Huyghe, Jens Fiebig, and Andreas Mulch

During the Middle Miocene the Earth’s climate shifted from a warm phase, the Miocene Climatic Optimum (MCO, 16.9–14.7 Ma), to a colder phase associated with the formation of major and permanent Antarctic ice sheets. This climatic shift, the Middle Miocene Climatic Transition (MMCT, 14.7–13.8 Ma), had significant impact on the composition and structure of major biomes (e.g. Jimenez-Moreno & Suc, 2007) and impacted worldwide ocean circulation (Holbourn et al., 2014) as well as terrestrial temperature and precipitation patterns (e.g. Methner et al., 2020). While the MCO and the subsequent MMCT are well described in marine records, quantitative continental paleoclimate records are still lacking when it comes to constraining the magnitude and rate of terrestrial environmental change. Collectively, δ18O, δ13C and Δ47 data from soil carbonates provide information about past environmental and climatic conditions, such as (seasonality of) precipitation, soil temperature as well as vegetation patterns. The formation of soil carbonates is mainly controlled by the interplay of environmental factors such as soil water composition, soil temperature, and soil CO2. We compare the stable (δ18O, δ13C) and clumped (Δ47) isotopic composition of pedogenic carbonate nodules of the Digne-Valensole Basin (SE France) with time equivalent counterparts from central Europe (Northern Alpine Molasse Basin, Switzerland) and present a ca. 23 – 12.5 Ma biostratigraphically-controlled clumped isotope paleotemperature record from the SW-foreland of the European Alps. Alluvial fan deposition and soil formation in the Digne-Valensole Basin occurred near sea level as documented by the intercalation of marine and continental facies (Cojan et al., 2013). Our Δ47 results from the Digne-Valensole Basin indicate relatively warm and stable carbonate formation temperatures (ca. 32°C) for the Early Miocene (23–19.5 Ma) followed by enhanced temperature fluctuations attaining maximum values at the onset of the MCO. The Digne-Valensole temperature pattern correlates with age-equivalent Δ47 temperatures from the Northern Alpine Foreland Basin. In both records, significant climatic changes can be observed at the onset of the MCO and the MMCT, which are documented by major rapid shifts in paleotemperatures (ca. 15°C within 300 ka). However, the proximity to the Mediterranean Basin is clearly visible in the Digne-Valensole records as expressed in rather high δ18O values of meteoric water that average ca. −3.5 ‰. Combining our data with the Northern Alpine foreland records results in a coherent climate pattern for the Alpine foreland during the Middle Miocene.


Cojan et al. (2013) https://doi.org/10.2113/gssgfbull.184.6.583

Holbourn et al. (2014) https://doi.org/10.1130/G34890.1

Jimenez-Moreno & Suc (2007) https://doi.org/10.1016/j.palaeo.2007.03.040

Methner et al. (2020) https://doi.org/10.1038/s41598-020-64743-5


How to cite: Ballian, A., Meijers, M. J. M., Methner, K., Cojan, I., Huyghe, D., Fiebig, J., and Mulch, A.: A Miocene (23–12.5 Ma) continental paleotemperature record from the northern Mediterranean region (Digne-Valensole Basin, SE France), EGU General Assembly 2023, Vienna, Austria, 23–28 Apr 2023, EGU23-14517, https://doi.org/10.5194/egusphere-egu23-14517, 2023.

We aimed to understand relationship between fire and mining activities over the late Holocene, to predict modifications in study area are conditioned by climate change, and ongoing global warming could lead to wildfire changes or mining can cause change in landscapes, in region especially peatlands at mid-altitude. The reconstruction of long-term (thousands of years) wildfire regime and activity is possible by analyzing the abundance of carbonaceous vegetation fragments (charcoal) preserved in sediments accumulated in different depositional environments (e.g., peatlands). Charcoal is proxy used for reconstructing regional changes in wildfire regime and anthropogenic activity such as mining history, local soil and bedrock erosion was also reconstructed using a multi-proxy method: geochemistry, magnetic mineral properties and particle size analysis. Was analyzed sedimentary macroscopic charcoal from the Taul Mare (TG) peat bog, located in Lapus Mountains, northern Carpathians, Romania. The statistically analyses use a variate ordination method principal component analysis (PCA). The PCA was used to correlate fire regime, charcoal accumulation rate (CHAR), geochemistry, magnetic mineral properties and particle size using PAST4.11 software. Our results show correlation between morphological charcoal (e.g., wood, grass, etc.) in opposition with magnetic mineral properties and particle size having the highest values. This may be interpreted as reflecting climate change caused by anthropogenic activity in special mining having consequence in landscapes with changes in wildfire regime. The main results of PCA point to conclude the following: wildfire increase following anthropogenic activities; increases in wildfire have generally been accompanied by episodes of increased landscape openness and pastoral activities; the study area followed the mid-elevation mountains and proximity to landscape resources, pasture and mining. In conclusion our results show direct connection with statistically significant link between fire severity and magnetic mineral concentration, and direct relation between fires and erosion (regardless of severity). This study can offer information about previously unstudied environmental history in mid-elevation mountains, of the Northern Carpathians and highlights the importance of studies that what can improve our understanding of the fire regime caused by mining activities.

How to cite: Petras, A.: Peat core sequence in the Northern Carpathians, Romania. Fire and mining activities relationship over the late Holocene, EGU General Assembly 2023, Vienna, Austria, 23–28 Apr 2023, EGU23-15079, https://doi.org/10.5194/egusphere-egu23-15079, 2023.

EGU23-16852 | ECS | Posters on site | CL1.1

A comparative study of cave system Ca isotope ratios with rainfall, δ13C, and trace element data: Implications for quantitative reconstructions of paleorainfall from speleothems 

Cameron de Wet, Elizabeth Griffith, Andrea Erhardt, Harold Bradbury, Alexandra Turchyn, and Jessica Oster

The development of quantitative records of past rainfall is an outstanding goal in the field of speleothem paleoclimatology and represents an essential step for benchmarking paleoclimate model simulations. However, most traditionally-employed speleothem proxies, including δ18O, δ13C, and trace-element-to-calcium ratios, respond to a number of complex climatic and environmental influences and typically provide only qualitative records of paleoclimate change. Variations in speleothem Ca isotope ratios (δ44Ca) are thought to be uniquely controlled by carbonate mineral precipitation above a drip site (prior carbonate precipitation, or PCP), which can be modeled as a Rayleigh fractionation process and calibrated with modern rainfall data. Thus, speleothem δ44Ca shows promise as a semi-quantitative proxy for past changes in local effective rainfall rates. However, few cave monitoring studies have focused specifically on the ways in which important factors, like host rock δ44Ca variability and geology, water flow path geometry, ventilation, and seasonal rainfall distribution affect δ44Ca signals in speleothems.

We present a comparative study of δ44Ca data and coeval measurements of δ13C and trace element ratios, established proxies for water infiltration, from cave drip waters, farmed calcite, and host rocks from three different cave systems in the United States- White Moon Cave (WMC) in coastal California, Lake Shasta Caverns (LSC) in northern California, and Blue Springs Cave (BSC) in east-central Tennessee. These cave systems are characterized by different hydroclimate, geology, flow path geometry, and seasonal infiltration characteristics.

To assess the relationship between Ca isotope variability and effective rainfall, we use Rayleigh fractionation equations to estimate the amount of PCP occurring at each cave site and compare these estimates with local rainfall rates, supplementing with drip rate information when possible.

The comparison of WMC, LSC, and BSC δ44Ca, δ13C, and trace element data from drip sites with different flow path geometry and from caves in different geologic and climate settings allows for these key factors to be assessed independently. This work, and the direct comparison between δ44Ca measurements and measured local rainfall rates in particular, aids in the refinement of speleothem δ44Ca as a new, semi-quantitative proxy for paleorainfall.

How to cite: de Wet, C., Griffith, E., Erhardt, A., Bradbury, H., Turchyn, A., and Oster, J.: A comparative study of cave system Ca isotope ratios with rainfall, δ13C, and trace element data: Implications for quantitative reconstructions of paleorainfall from speleothems, EGU General Assembly 2023, Vienna, Austria, 23–28 Apr 2023, EGU23-16852, https://doi.org/10.5194/egusphere-egu23-16852, 2023.

EGU23-16916 | ECS | Posters on site | CL1.1

High-resolution reconstruction of the hydroclimate and palaeoenvironment of the last 5500 years in the Apuseni Mountains (NW Romania) 

Agnes Ruskal, Andrei-Cosmin Diaconu, Andrei Panait, Mariusz Gałka, Angelica Feurdean, and Ioan Tanțău

In the present study, we analyzed an ombrotrophic peat sequence from NW Romania using a multi-proxy approach (lithology, radiocarbon dating, loss on ignition, magnetic susceptibility, testate amoebae and plant macrofossil) in order to reconstruct the environmental and hydroclimate changes that occurred in the last 5500 years.

The studied sequence (Molhașul Mare de la Izbuc, Apuseni Mountains) started to accumulate in 5520 cal yr BP, debutting with a lacustrine phase and evolving into an ombrotrophic Sphagnum peat bog. The palaeoenvironmental stages of the peat bog were confirmed by the lithology, loss on ignition and magnetic susceptibility results. A pan-european testate amoebae-based transfer function was used for the quantitative reconstruction of the water table levels in the peatland. The depth to water-table (DWT) values ranged between 7.3 and 28.5 cm, suggesting wetter conditions in the first 2500 years of the sequence and drier ones between 2500 cal yr BP and the present days. The occurred hydrological shifts and the changes of the surface wetness were also confirmed by the plant macrofossil analyses.

We identified and assessed the local effects of several rapid climate change events that occurred in Europe such as the Piora Oscillation, Middle Bronze Age Cold Event, Iron Age Cold Event, Roman Climate Optimum, Dark Age Cold Event, Medieval Warm Period, Little Ice Age, Great Famine in Europe, the Sporer, Maunder and Dalton Minimum Events and the Year Without Summer.

Our high resolution study is among the few quantitative DWT reconstructions in Romania. Our results contribute to obtaining a broader image and a better understanding of the palaeoenvironmental, palaohydrological and palaeoclimate changes in Romania and in Central Eastern Europe during the past 5500 years.

How to cite: Ruskal, A., Diaconu, A.-C., Panait, A., Gałka, M., Feurdean, A., and Tanțău, I.: High-resolution reconstruction of the hydroclimate and palaeoenvironment of the last 5500 years in the Apuseni Mountains (NW Romania), EGU General Assembly 2023, Vienna, Austria, 23–28 Apr 2023, EGU23-16916, https://doi.org/10.5194/egusphere-egu23-16916, 2023.

EGU23-1048 | Orals | CL1.2 | Highlight

The relative role of orbital, CO2 and ice sheet forcing on Pleistocene climate 

Charles Williams, Natalie Lord, Daniel Lunt, Alan Kennedy-Asser, David Richards, Michel Crucifix, Anne Kontula, Mike Thorne, Paul Valdes, Gavin Foster, and Erin McClymont

During the last ~2.5 million years, the Quaternary period, Earth's climate fluctuated between a series of glacials and interglacials, driven by long-term internal forcings such as those in atmospheric CO2 concentrations and ice sheet extent, and external forcings such as the orbital parameters of the Earth around the Sun.  Climate models provide a useful tool for addressing questions concerning the driving mechanisms, dynamics, feedbacks, and sensitivity of the climate system associated with these variations.  However, the structural complexity of such models means that they require significant computational resources, especially when running long (> one million year) transient simulations, and as such are not suitable for exploring orbital-scale variability on these timescales. 


Instead, here we use a climate model to calibrate a faster statistical model, or emulator, and use this to simulate the evolution of long-term palaeoclimate during the Quaternary period; firstly during the late Pleistocene (the last 800 thousand years) and secondly the entire Quaternary (the last 2.58 million years).  The emulator is driven by five forcing components: CO2, ice volume, and three orbital parameters.  We firstly compare the simulation with proxy records, and secondly investigate which forcing component is contributing the most to the simulation.


The results suggest that the emulator performs well and generally agrees with the proxy records available during the late Pleistocene, for both temperature and precipitation, especially concerning the timing and duration of the various glacial-interglacial cycles.  There are, however, some instances of discrepancies, especially concerning the minima and maxima of the cycles.  A factorial experiment shows that CO2 concentrations and ice volumes changes drive the most variability.  The efficiency of the emulator approach also allows us to carry out a quasi-transient simulation through the entire Quaternary period, and allows projections of possible future drilling results from deep Antarctic ice cores.  

How to cite: Williams, C., Lord, N., Lunt, D., Kennedy-Asser, A., Richards, D., Crucifix, M., Kontula, A., Thorne, M., Valdes, P., Foster, G., and McClymont, E.: The relative role of orbital, CO2 and ice sheet forcing on Pleistocene climate, EGU General Assembly 2023, Vienna, Austria, 23–28 Apr 2023, EGU23-1048, https://doi.org/10.5194/egusphere-egu23-1048, 2023.

EGU23-1311 | ECS | Orals | CL1.2 | Highlight

The role of dispersal limitation in the post-glacial forest expansion of southern and central Europe 

Deborah Zani, Heike Lischke, and Veiko Lehsten

The global vegetation cover underwent strong changes during the past glacial cycle. These have been driven by climatic fluctuations but also by spatiotemporal vegetation dynamics, including migration to new climatologically suitable areas and interactions with other species. However, how much migration lag contributed to the vegetation change after the Last Glacial Maximum (LGM) is often not clear. We used the newly-implemented model LPJ-GM 2.0 to simulate the vegetation change of southern and central Europe from the end of the LGM (18.5 ka) to the preindustrial era (1.5 ka). The model couples a migration module to the dynamic global vegetation model LPJ-GUESS, thus allowing species to migrate simultaneously while interacting with each other. We compared two dispersal settings (free dispersal and dispersal limitation) against pollen data to test the reliability of the migration module to provide realistic paleo-vegetation reconstructions for biome and species distributions. Furthermore, we calculated range shifts of the leading edges and centroids to detect potential species-specific migration lags and range filling delays across simulation time. Our results show that the setting with dispersal limitation is better at capturing the initial post-glacial expansion of non-boreal forests in southern and central Europe than the scenario assuming free dispersal. Range shift analysis shows significant migration lags for most tree species at times of sudden temperature rise (start of the Bølling–Allerød warming event and following the Younger Dryas). Overall, our study suggests that it is necessary to include migration processes when simulating vegetation range expansion under rapid climate change, with implications for future vegetation projections.

How to cite: Zani, D., Lischke, H., and Lehsten, V.: The role of dispersal limitation in the post-glacial forest expansion of southern and central Europe, EGU General Assembly 2023, Vienna, Austria, 23–28 Apr 2023, EGU23-1311, https://doi.org/10.5194/egusphere-egu23-1311, 2023.

EGU23-2372 | ECS | Posters on site | CL1.2

A model-based exploration of mid-Holocene anti-phase climate variations in the Central Andes 

Ardhra Sedhu-Madhavan, Sebastian G. Mutz, Daniel Boateng, and Todd A. Ehlers

The Andes’ elevation of ~4 km and great meridional extent of ~50°S to 10°N greatly influences the spatial climate patterns across the South American continent. Apart from latitude and altitude, quasi-stable pressure systems modify the climate of the region. The Bolivian high, an upper-level anticyclonic circulation over the central part of the continent, is one such feature and has a strong impact on atmospheric moisture transport and the regional hydroclimate of the Central Andes. Orbitally forced shifts in the Bolivian High have been hypothesised to be responsible for anti-phase palaeoclimate changes in Peru in the mid-Holocene, such as the increase in humidity in the Palpa region and synchronous extreme drought near Lake Titicaca [e.g., Mächtle et al. 2013]. However, this hypothesis has not been tested, and it has not been determined how much of the mid-Holocene hydroclimate change in the Central Andes can be explained by changes in regional pressure systems. Here, we test the hypothesis that mid-Holocene orbital variations and palaeogeographical changes modified pressure fields and regional moisture transport, and lead to anti-phase changes in regional hydroclimate. We test this hypothesis using the physics-based, isotope-tracking climate model ECHAM5-wiso. More specifically, we analyse pre-industrial and mid-Holocene paleoclimate simulations [Mutz et al. 2018]  to track changes in pressure fields and moisture transport. We then assess their impacts on regional hydroclimate in the Central Andes. Results indicate that: (a) the climate models reproduce the observed synchronous anti-phase (wetter and drier) climate changes documented in different parts of Peru, and (b) these can be explained by changes in the regional pressure and wind fields. Taken together, previous proxy-based observations and model results present here indicate that orbital variations drive changes in the regional pressure systems and lead to spatially heterogenous variations in hydroclimate across the Central Andes.

How to cite: Sedhu-Madhavan, A., G. Mutz, S., Boateng, D., and A. Ehlers, T.: A model-based exploration of mid-Holocene anti-phase climate variations in the Central Andes, EGU General Assembly 2023, Vienna, Austria, 23–28 Apr 2023, EGU23-2372, https://doi.org/10.5194/egusphere-egu23-2372, 2023.

EGU23-2586 | ECS | Orals | CL1.2

The last glacial cycle transiently simulated with a coupled climate-ice sheet model 

Frerk Pöppelmeier, Fortunat Joos, and Thomas F. Stocker

Understanding climate variability from millennial to glacial-interglacial timescales remains challenging due to the complex and non-linear feedbacks between ice, ocean, and atmosphere. Although the ever-increasing number of reconstructions has helped to form compelling hypotheses for the evolution of ocean and atmosphere circulation or ice sheet extent over the last glacial cycle, climate models, required for systematically testing these hypotheses, struggle to dynamically and comprehensively simulate such long time periods as a result of the large computational costs. Here, we therefore coupled a dynamical ice sheet model to the Bern3D Earth system model of intermediate complexity, that allows for simulating multiple glacial-interglacial cycles in reasonable time. To test the fully-coupled model, we explore the climate evolution over the entire last glacial cycle in a transient simulation forced by the orbital configuration and greenhouse gas and aerosol concentrations. We are able to simulate Global Mean Surface Temperature (GMST) in fair agreement with reconstructions exhibiting a gradual cooling trend since the last interglacial that is interrupted by two more rapid cooling events during the early Marine Isotope Stage (MIS) 4 and Last Glacial Maximum (LGM). The glacial-interglacial GMST and mean ocean temperature differences are 5 °C and 1.6 °C, respectively. Ice volume shows pronounced variability on orbital timescales mirroring northern hemispheric summer insolation. From early MIS3 to the LGM ice volume roughly doubles in good agreement with recent sea-level reconstructions. The Atlantic overturning circulation shows larger variability during the relatively warm MIS5 than during the cooler MIS3, however we note that Dansgaard-Oeschger events are not intrinsically simulated in our setup. At the LGM the Atlantic overturning has a strength of about 14 Sv, which is a reduction by about one quarter compared to the pre-industrial. We thus demonstrate that the new coupled model is able to realistically simulate glacial-interglacial cycles, which allows as to systematically investigate the sensitivities to parameters such as equilibrium climate sensitivity or aerosol radiative forcing during the last glacial cycle.

How to cite: Pöppelmeier, F., Joos, F., and Stocker, T. F.: The last glacial cycle transiently simulated with a coupled climate-ice sheet model, EGU General Assembly 2023, Vienna, Austria, 23–28 Apr 2023, EGU23-2586, https://doi.org/10.5194/egusphere-egu23-2586, 2023.

EGU23-2885 | ECS | Orals | CL1.2

Atmosphere-mediated response of the Southern Hemisphere hydroclimate in simulations of spontaneous Dansgaard-Oeschger-like oscillations 

Irene Trombini, Nils Weitzel, Muriel Racky, Paul Valdes, and Kira Rehfeld

Dansgaard-Oeschger (DO) events are the most iconic mode of millennial-scale variability during the last glacial period. The manifestation of DO events outside the North Atlantic region and mechanisms responsible for the propagation of the North Atlantic signal across the globe are still little understood. Propagation of DO events to the Southern Hemisphere (SH) has first been explained by oceanic processes, that result in a muted and delayed signal in the Antarctic ice core record, known as Antarctic Isotope Maxima (AIM). Recent ice core-based reconstructions found an additional short-timescale response (years-to-decades, compared to centuries for the oceanic processes) in phase with the climate changes in Greenland. This fast response has been interpreted as the result of atmospheric transport processes. Shifts in the intertropical convergence zone and SH mid-latitude westerlies are seen as mediators of this response.

Here, we investigate the propagation of abrupt climate changes in the North Atlantic region to the SH in general circulation model simulations with spontaneous DO-like oscillations under glacial conditions. We study the relative timing of changes in temperature, hydroclimate, and atmospheric circulation and compare our results with ice core and speleothem based reconstructions. In the simulations, the timing of changes in different elements of the climate system varies on a continuum of timescales from months to centuries. This indicates the existence of more complex propagation mechanisms than the simple separation into an atmospheric and an oceanic mode. Our work emphasizes that future analysis of simulations of DO-like events should focus not just on the mechanisms responsible for the spontaneous oscillations but also on the spatio-temporal fingerprint of the oscillations across the globe.

How to cite: Trombini, I., Weitzel, N., Racky, M., Valdes, P., and Rehfeld, K.: Atmosphere-mediated response of the Southern Hemisphere hydroclimate in simulations of spontaneous Dansgaard-Oeschger-like oscillations, EGU General Assembly 2023, Vienna, Austria, 23–28 Apr 2023, EGU23-2885, https://doi.org/10.5194/egusphere-egu23-2885, 2023.

EGU23-4683 | ECS | Orals | CL1.2

Reduction in ENSO variability during the mid-Holocene: a multi-model perspective 

Shivangi Tiwari, Francesco S. R. Pausata, Allegra N. LeGrande, Michael L. Griffiths, Hugo Beltrami, Anne de Vernal, Clay R. Tabor, Daniel Litchmore, Deepak Chandan, and W. Richard Peltier

Paleoclimatic reconstructions have suggested a reduction inthe variability of the El Niño Southern Oscillation (ENSO) during the mid-Holocene (MH). Model simulations have largely failed to capture thisreduction, potentially due to the inadequate representation of the Green Sahara.The presence of a vegetated Sahara has been shown to have significant impacts on both regional and remote climate but remains inadequately addressed in Paleoclimate Modelling Intercomparison Project / Coupled Model Intercomparison Project (PMIP/CMIP) boundary conditions. Specifically, the incorporation of a Green Sahara has been shown to impact ENSO variability through perturbations to the Walker Circulation. In this study, we evaluate the MH (6,000 years BP) ENSO signatures of simulations from four models, namely —EC-Earth 3.1, iCESM 1.2, University of Toronto version of CCSM4 and GISS Model E2.1-G. Two simulations are considered for each model—a standard PMIP simulation (MHPMIP) with the mid-Holocene orbital parameters and greenhouse gas concentrations with vegetation prescribed to preindustrial conditions, as well as a Green Sahara simulation (MHGS) which additionally incorporates factors such as enhanced vegetation, reduced dust, presence of lakes, and land and soil feedbacks. All models show a reduction in ENSO variability due to the incorporation of Green Sahara conditions. This variability is interpreted in the context of perturbations to the Walker Circulation, triggered by the strengthening of the West African Monsoon.

How to cite: Tiwari, S., Pausata, F. S. R., LeGrande, A. N., Griffiths, M. L., Beltrami, H., de Vernal, A., Tabor, C. R., Litchmore, D., Chandan, D., and Peltier, W. R.: Reduction in ENSO variability during the mid-Holocene: a multi-model perspective, EGU General Assembly 2023, Vienna, Austria, 23–28 Apr 2023, EGU23-4683, https://doi.org/10.5194/egusphere-egu23-4683, 2023.

EGU23-4963 | Orals | CL1.2

New insights of the East Asian summer monsoon variability over the past 800 kyr from a transient simulation with CLIMBER-2 

Liya Jin, Andrey Ganopolski, Matteo Willeit, Huayu Lu, Fahu Chen, and Xiaojian Zhang

The East Asian summer monsoon (EASM) is a major component of the global climate system with its variability closely associated with regional changes of rainfall, impacting the lives of over one sixth of the global population strongly. Understanding the periodicities of summer rainfall influenced by the EASM is beneficial to its future projections. However, the mechanism of the response of the EASM associated summer rainfall fluctuations to orbital-scale forcing during the late Pleistocene remains far from being well understood. Here, we provide an 800-kyr long series of EASM rainfall variations by extracting data from multiple transient simulations of CLIMBER-2 over the past 3 million years. Despite a coarse model resolution, the CLIMBER-2 captures a realistic spatial distribution and magnitude of present-day summer (June-July-August) rainfall, especially in East Asia. The CLIMBER-2 model simulates correct magnitude and timing of the last eight glacial cycles in respect to both global ice sheet volume (expressed in δ18O) and CO2 concentration. Both the simulation and reconstructions reveal predominant 100-ky and 41-ky cycles of global ice sheet volume and CO2 concentration, although precession (23- and 19-kyr) bands dominate high-latitude summer insolation. The EASM intensity is traditionally measured by the monsoonal circulation, i.e. the low-level southerly winds in summer over East Asia. Cross-spectral analysis confirms high coherence between model and proxy at 19-kyr and 41-kyr bands implying a strong low-latitude process modulated by precession. Unlike the EASM circulation from the CLIMBER-2, simulated boreal summer rainfall in East Asia, denoted as “EASM rainfall” shows pronounced 41- and 100-kyr cycles, resembling the loess record over the past 800 kyr. The simulation results reveal a decoupling between EASM rainfall and EASM circulation, which probably is a reasonable explanation for the conflicts in proxy records, and also reflects complicated mechanisms of the EASM system on glacial–interglacial timescales.

How to cite: Jin, L., Ganopolski, A., Willeit, M., Lu, H., Chen, F., and Zhang, X.: New insights of the East Asian summer monsoon variability over the past 800 kyr from a transient simulation with CLIMBER-2, EGU General Assembly 2023, Vienna, Austria, 23–28 Apr 2023, EGU23-4963, https://doi.org/10.5194/egusphere-egu23-4963, 2023.

EGU23-5982 | ECS | Posters on site | CL1.2

Vegetation Simulation from the Colonization of Land Plants to the Present 

Jiaqi Guo, Yongyun Hu, and Yonggang Liu

Climate affects vegetation growth and distribution, and vegetation affects climate by modifying the exchange of carbon, water, momentum, and energy between atmosphere and land throughout evolution history. Therefore, reproducing the vegetation distribution is of great significance for understanding climate evolution, vegetation evolution, and their interaction. However, a systematic map of global vegetation distribution since the colonization of land plants (about 480 million years ago; Ma) has remained to be determined. Here, Community Earth System Model (CESM) version 1.2.2 and BIOME4 vegetation model are applied to simulate vegetation during the past 480 million years based on modern vegetation parameters. First, the simulations reveal multiple maps of global vegetation from 480 Ma to pre-industrial (PI) period with a 10-million-year interval. 28 biomes show different distribution characteristics with the evolution of climate, and parts of characteristics are supported by palaeobotanical evidence. Second, the potential biomass as a measure of plant growth is analyzed to explore causes of vegetation variations here. The results illustrate plant growth and expansion is significantly affected by terrestrial temperature and CO2 concentration, followed by terrestrial precipitation. Besides, more land area in the middle and low latitudes can be more conducive to plant flourish in geological history. The simulations provide a reference for paleo-vegetation data and some insights into the interaction between climate and vegetation evolution.

How to cite: Guo, J., Hu, Y., and Liu, Y.: Vegetation Simulation from the Colonization of Land Plants to the Present, EGU General Assembly 2023, Vienna, Austria, 23–28 Apr 2023, EGU23-5982, https://doi.org/10.5194/egusphere-egu23-5982, 2023.

EGU23-6063 | Orals | CL1.2

Effects of LGM sea surface temperature and sea ice extent on the isotope-temperature slope at polar ice core sites 

Alexandre Cauquoin, Ayako Abe-Ouchi, Takashi Obase, Wing-Le Chan, André Paul, and Martin Werner

Stable water isotopes in polar ice cores are widely used to reconstruct past temperature variations over several orbital climatic cycles. One way to calibrate the isotope-temperature relationship is to apply the present-day spatial relationship as a surrogate for the temporal one. However, this method leads to large uncertainties because several factors like the sea surface conditions or the origin and the transport of water vapor influence the isotope-temperature temporal slope. In this study, we investigate how the sea surface temperature (SST), the sea ice extent and the strength of the Atlantic Meridional Overturning Circulation (AMOC) affect these temporal slopes in Greenland and Antarctica for Last Glacial Maximum (LGM, ~21 000 years ago) to preindustrial climate change. For that, we use the isotope-enabled atmosphere climate model ECHAM6-wiso [1, 2], forced with a set of sea surface boundary condition datasets based on reconstructions (GLOMAP [3] and Tierney et al. (2020) [4]) or MIROC 4m simulation outputs [5]. We found that the isotope-temperature temporal slopes in East Antarctic coastal areas are mainly controlled by the sea ice extent, while the sea surface temperature cooling affects more the temporal slope values inland. Mixed effects on isotope-temperature temporal slopes are simulated in West Antarctica with sea surface boundary conditions changes, because the transport of water vapor from the Southern Ocean to this area can dampen the influence of temperature on the changes of the isotopic composition of precipitation and snow. In the Greenland area, the isotope-temperature temporal slopes are influenced by the sea surface temperatures very near the coasts of the continent. The greater the LGM cooling off the coast of southeast Greenland, the larger the temporal slopes. The presence or absence of sea ice very near the coast has a large influence in Baffin Bay and the Greenland Sea and influences the slopes at some inland ice cores stations. We emphasize that the extent far south of the sea ice is not so important. On the other hand, the seasonal variations of sea ice distribution, especially its retreat in summer, influence the water vapor transport in this region and the modeled isotope-temperature temporal slopes in the eastern part of Greenland. A stronger LGM AMOC decreases LGM to preindustrial isotopic anomalies in precipitation in Greenland, degrading the isotopic model-data agreement. The AMOC strength does not modify the temporal slopes over inner Greenland, and only a little on the coasts along the Greenland Sea where the changes in surface temperature and sea ice distribution due to the AMOC strength mainly occur.

[1] Cauquoin and Werner, J. Adv. Model. Earth Syst., 13, https://doi.org/10.1029/2021MS002532, 2021.

[2] Cauquoin et al., Clim. Past, 15, 1913–1937, https://doi.org/10.5194/cp-15-1913-2019, 2019.

[3] Paul et al., Clim. Past, 17, 805–824, https://doi.org/10.5194/cp-17-805-2021, 2021.

[4] Tierney et al., Nature, 584, 569–573, https://doi.org/10.1038/s41586-020-2617-x, 2020.

[5] Obase and Abe-Ouchi, Geophys. Res. Lett., 46, 11 397–11 405, https://doi.org/10.1029/2019GL084675, 2019.

How to cite: Cauquoin, A., Abe-Ouchi, A., Obase, T., Chan, W.-L., Paul, A., and Werner, M.: Effects of LGM sea surface temperature and sea ice extent on the isotope-temperature slope at polar ice core sites, EGU General Assembly 2023, Vienna, Austria, 23–28 Apr 2023, EGU23-6063, https://doi.org/10.5194/egusphere-egu23-6063, 2023.

EGU23-6289 | Orals | CL1.2

Mid Holocene dynamic vegetation highlights unavoidable climate feedbacks 

Pascale Braconnot, Nicolas Viovy, and Olivier Marti

Green Sahara and a northern limit of forest in the northern hemisphere are key characteristics of the differences between the mid Holocene and present-day climate. However, the strength of vegetation feedback and the ability of state-of-the-art climate model to properly represent it still an issue. A reason is that vegetation lies at the critical zone between land and atmosphere. Its variations depend on interconnected factors such as light, energy, water and carbon and, in turn, affect climate and environmental factors. These interconnexions makes it difficult to disentangle the factors that affect the representation of vegetation in a fully interactive model. Dynamical vegetation introduces additional degrees of freedom in climate simulations, so that a model that produces reasonable results when vegetation is prescribed might not be able to properly reproduce the full coupled system, when feedbacks that are not dominant when the system is constraint induce first order cascading effects in coupled mode. Here we investigate the climate-vegetation feedback in mid-Holocene and pre-industrial simulation with the IPSL climate models using 3 different settings of the dynamical vegetation that combining differences in the choice of representation of photosynthesis, bare soil evaporation and parameters defining the vegetation competition and distribution. We show that whatever the set up the major differences expected between the mid-Holocene and preindustrial climates remains similar, but the realisms of the simulated climate can be very different due to cascading climate-vegetation feedbacks that trigger vegetation growth and snow-ice-temperature-soil feedbacks.  Interestingly, with this IPSLCM6 version of the IPSL model (Boucher et al., 2020) all the mid-Holocene simulations produce vegetation in the Sahara-Sahel region compatible with the green Sahara period, but the representation of boreal forests is strongly affected by the different vegetation modeling choices.

How to cite: Braconnot, P., Viovy, N., and Marti, O.: Mid Holocene dynamic vegetation highlights unavoidable climate feedbacks, EGU General Assembly 2023, Vienna, Austria, 23–28 Apr 2023, EGU23-6289, https://doi.org/10.5194/egusphere-egu23-6289, 2023.

EGU23-6376 | ECS | Posters on site | CL1.2

Response of East Asian summer monsoon climate to North Atlantic meltwater during the Younger Dryas 

Jie Wu, Zhengguo Shi, and Yongheng Yang

The Younger Dryas (YD) event, recognized as one of the most typical abrupt climate changes on the millennial time scale, results in striking cooling in most regions of the North Atlantic. The most acceptable hypothesis believes that this event is related to a large volume of meltwater fluxes injected into the North Atlantic. In remote Asia, various paleoclimate reconstructions have revealed that the East Asian summer monsoon (EASM) is significantly depressed during the cold YD episode. However, the effect of North Atlantic meltwater-induced cooling on the whole downstream Eurasian regions and its potential dynamics remains been not fully explored till now. In this study, the responses of Asian climate characteristics during the YD episode, especially the EASM, are evaluated based on modeling data from the Simulation of the Transient Climate of the Last 21,000 years (TraCE 21ka). The results show that the cooling signal during the YD, which is mainly caused by meltwater flux, spreads from the North Atlantic to the whole Eurasia. In agreement with the paleoclimatic proxies, the simulated EASM is obviously weakened. The summer precipitation is also suppressed over East, South, and Central Asia. Dynamically, the North Atlantic cooling produces an eastward propagated wave train across the mid-latitude Eurasia, which facilitates weaker EASM circulation. The weakened land-sea thermal contrast over East Asia also contributes to the monsoon decrease during YD cooling.

How to cite: Wu, J., Shi, Z., and Yang, Y.: Response of East Asian summer monsoon climate to North Atlantic meltwater during the Younger Dryas, EGU General Assembly 2023, Vienna, Austria, 23–28 Apr 2023, EGU23-6376, https://doi.org/10.5194/egusphere-egu23-6376, 2023.

EGU23-6514 | Orals | CL1.2 | Highlight

Northern Hemispheric extratropical cyclones during glacial times: impact of orbital forcing and ice sheet height 

Christoph C. Raible, Martina Messmer, Joanthan Buzan, and Emmanuele Russo

Extratropical cyclones are a major source of natural hazards in the mid latitudes as wind and precipitation extremes are associated to this weather phenomenon. Still the response of extratropical cyclones and their characteristics to strong external forcing changes is not yet fully understood. In particular, the impact of the orbital forcing as well as variations of the major ice sheets during glacial times on extratropical cyclones have not been investigated so far.  

Thus, the aim of this study is to fill this gap and to assess the impact of orbital forcing and northern hemispheric ice sheet height variations on extratropical cyclones and their characteristics during winter and summer. The main research tool is the Community Earth System Model CESM1.2. We performed a set of time slice sensitivity simulations under preindustrial (PI) conditions and for the following different glacial periods: Last Glacial Maximum (LGM), Marine Isotopic stage 4 (MIS4), MIS6, and MIS8. Additionally, we vary the northern hemispheric ice sheet height for all the different glacial periods by 33%, 66%, 100% and 125% of the ice sheet reconstructed for the LGM. For each of the simulations the extratropical cyclones are identified with a Lagrangian cyclone detection and tracking algorithm, which delivers a set of different cyclone characteristics, such as, cyclone frequency maps, cyclone area, central pressure, cyclone depth, precipitation associated to the extratropical cyclones as well as extremes in cyclone depth and extratropical cyclone-related precipitation. These cyclone characteristics are investigated for the winter and the summer season separately.

Preliminary results show that the extratropical cyclone tracks are shifted southwards on the Northern Hemisphere during the winter season. This has rather strong implication for the Mediterranean, with an increase of precipitation during glacial times over the western Mediterranean. This increase is modulated when changing the ice sheet height as extratropical cyclone tracks shift further south with increasing northern hemispheric ice sheet height. The orbital forcing shows a higher impact during the summer season, where mean precipitation is further reduced over Europe when comparing MIS4 and MIS8 with LGM. The role of the cyclones for these changes in summer needs to be assessed as well as the implication in the North Pacific.

How to cite: Raible, C. C., Messmer, M., Buzan, J., and Russo, E.: Northern Hemispheric extratropical cyclones during glacial times: impact of orbital forcing and ice sheet height, EGU General Assembly 2023, Vienna, Austria, 23–28 Apr 2023, EGU23-6514, https://doi.org/10.5194/egusphere-egu23-6514, 2023.

EGU23-6932 | Orals | CL1.2 | Highlight

The Warm Winter Paradox in the mid-Pliocene Warm Period - a focus on model parameterisations. 

Julia Tindall, Alan Haywood, and Paul Valdes

Modelling results from PlioMIP2 (Pliocene Model Intercomparison Project Phase 2) are in strong disagreement with terrestrial proxy data over the high latitudes for the winter season.  This disagreement is large:  models simulate winter temperatures ~20°C cooler than the data suggests.  We term this the ‘warm winter paradox’.

We have shown that the warm winter paradox cannot be easily resolved.  For example, changing model boundary conditions to account for orbital and CO2 uncertainty have only a small effect on winter temperatures.

Here we use the Hadley Centre General Circulation Model, HadCM3, to investigate whether accounting for uncertainties in model parameterisations could improve the model data agreement for the Pliocene winter.  A new set of parameters for HadCM3, which improve model-data agreement for the Eocene, will be used to investigate the Pliocene climate.  We will show that the new parameters in HadCM3 lead to additional winter Pliocene warming at some locations, although a large model-data disagreement remains.   The new model parameters do not improve the Pliocene data-model comparison as much as they do for the Eocene.  This may indicate that finding a single set of parameters capable of producing an optimised simulation of warm climate states in general is not possible, and that further exploration of model parameter uncertainty is warranted; or that the cause of model data disagreements in the high latitudes may be time period specific.   

How to cite: Tindall, J., Haywood, A., and Valdes, P.: The Warm Winter Paradox in the mid-Pliocene Warm Period - a focus on model parameterisations., EGU General Assembly 2023, Vienna, Austria, 23–28 Apr 2023, EGU23-6932, https://doi.org/10.5194/egusphere-egu23-6932, 2023.

EGU23-7448 | ECS | Orals | CL1.2

A multi-model assessment of the early last deglaciation (PMIP4 LDv1) 

Brooke Snoll, Ruza Ivanovic, Lauren Gregoire, and Sam Sherriff-Tadano and the PMIP4 Working Group

At the onset of the last deglaciation, beginning ~19 thousand years ago, ice sheets that covered the Northern Hemisphere at the Last Glacial Maximum started to melt, Earth began to warm, and sea levels rose. This time period is defined by major long-term, millennial-scale, climate transitions from the cold glacial to warm interglacial state, as well as many short-term, centennial- to decadal-scale warmings and coolings of more than 5 °C, sudden reorganisations of basin-wide circulations, and jumps in sea level of tons of meters. Long transient simulations of the deglaciation have been increasingly performed to better understand the long and short term processes, examine different possible scenarios, and compare model output to observable records. The Paleoclimate Modelling Intercomparison Project (PMIP) has provided a framework for an international coordinated effort in simulating the last deglaciation whilst encompassing a broad range of models and model complexities. This study is a multi-model intercomparison of 17 simulations of the last deglaciation from nine different climate models. Unlike other multi-model intercomparison projects, these simulations do not follow one particular experimental design but follow an intentionally flexible protocol suitable for all participants. The design of the protocol provides the opportunity to compare results from models using different forcings and examine a variety of scenarios, hence, representing the range of uncertainty in climate predictions of the time period. One particularly challenging choice to make in the experimental design is how to incorporate the resultant freshwater flux from the melting ice sheets. This research focusses on the divergence between climate trajectories in the simulations as a result of the meltwater scenario preferred by the modelling groups as well as other experimental design choices and their impact on the onset of the deglaciation. These results provide a better understanding of modelling this time period as well as model biases and uncertainty with respect to deglacial forcings and the observable proxy records. 

How to cite: Snoll, B., Ivanovic, R., Gregoire, L., and Sherriff-Tadano, S. and the PMIP4 Working Group: A multi-model assessment of the early last deglaciation (PMIP4 LDv1), EGU General Assembly 2023, Vienna, Austria, 23–28 Apr 2023, EGU23-7448, https://doi.org/10.5194/egusphere-egu23-7448, 2023.

EGU23-7454 | ECS | Posters on site | CL1.2

An oscillating Atlantic Meridional Overturning Circulation during the last glacial period 

Yvan Romé, Ruza Ivanovic, and Lauren Gregoire

Abrupt climate changes over the last glacial period (~ 115 to 12 thousand years ago) are often associated with reorganisation of the Atlantic Meridional Overturning Circulation (AMOC). It has been suggested that the AMOC can exist in more than one stable mode, but the mechanisms leading to switches between different regimes are still not understood. It is also unclear how disruptions of the ocean circulation are connected to millennial-scale climate variability, such as Dansgaard-Oeschger events or abrupt transitions during the late last deglaciation. 

Most attempts at theorising glacial millennial-scale variability have involved looking at heat and salt transfers between the subtropical and subpolar gyres. This is often referred to as the ‘salt oscillator’ mechanism, which in turn controlled the intensity of the North Atlantic current. We propose that the salt oscillator is in fact part of a larger motion combining harmonic and stochastic dynamics spanning through all components of the climate system when triggered by an initial excitation. Only under certain combinations of boundary conditions and forcings can multiple stable states coexist, sometimes leading to the activation of a pseudo-oscillating regime for thousands of years. 

Based on a new set of last glacial maximum (~21 thousand years ago) simulations that oscillate when forced with snapshots of the early last deglaciation meltwater history, we propose a new way of visualising the stability of the AMOC and its shifts between different stable modes. We provide a detailed analysis of the heat and salinity tendencies in a comprehensive description of the different oscillating modes. Finally, we discuss how the freshwater forcing framework fits into the broader theory of glacial abrupt climate changes.

How to cite: Romé, Y., Ivanovic, R., and Gregoire, L.: An oscillating Atlantic Meridional Overturning Circulation during the last glacial period, EGU General Assembly 2023, Vienna, Austria, 23–28 Apr 2023, EGU23-7454, https://doi.org/10.5194/egusphere-egu23-7454, 2023.

EGU23-8172 | ECS | Posters on site | CL1.2

Coupled climate-carbon simulations of the Penultimate Deglaciation and Last Interglacial in the PLASIM-GENIE model 

Tim Cutler, Philip Holden, Pallavi Anand, and Neil Edwards

Theoretical understanding of paleoclimate change such as deglaciations comes primarily from time slice simulations in state-of-the-art atmosphere-ocean general circulation models, where multimillennial transient simulations would be too computationally expensive. Such steady state runs may be missing long-timescale processes involving ocean circulation or the carbon cycle, which could be captured by long transient simulations. The PLASIM-GENIE (Planet Simulator – Grid-Enabled Integrated Earth System) model is capable of running fast, multimillennial climate-carbon cycle simulations, comprising a fully 3D spectral atmosphere and frictional geostrophic ocean with marine and terrestrial carbon cycle modules. Here, we present comparisons between steady state and pseudo-transient experiments in PLASIM-GENIE, starting from the Penultimate Glacial Maximum (140,000 years before present) through the Last Interglacial, applying the PMIP4 Penultimate Deglaciation protocol. In pseudo-transient simulations, the model is stopped at every 500 years and restarted with updated prescribed ice sheets, orbital forcings, meltwater fluxes and relaxed CO2 (with an active carbon cycle). These are compared to steady state time-slice simulations where the model is spun-up at each 500-year interval, to test for hysteresis in atmosphere, ocean and carbon cycle processes. Particular focus is on the timing of Atlantic Meridional Overturning Circulation weakening and recovery. We supplement these baseline simulations with a series of sensitivity experiments where individual forcings are varied.

How to cite: Cutler, T., Holden, P., Anand, P., and Edwards, N.: Coupled climate-carbon simulations of the Penultimate Deglaciation and Last Interglacial in the PLASIM-GENIE model, EGU General Assembly 2023, Vienna, Austria, 23–28 Apr 2023, EGU23-8172, https://doi.org/10.5194/egusphere-egu23-8172, 2023.

EGU23-8251 | Posters on site | CL1.2

Effects of glacial conditions on the circulation and water vapor sources of Indian monsoon precipitation 

Thejna Tharammal, Govindasamy Bala, Jesse Nusbaumer, and Andre Paul

Climate records suggest a weaker Indian monsoon circulation and drier conditions in the continent during the Last Glacial Maximum (LGM, ~19-23 ka BP). This is mainly due to circulation changes caused by high-latitude ice sheets, tropical and high-latitude SST changes, and lower atmospheric CO2 concentrations compared to pre-industrial (PI). Such changes in boundary conditions and circulation are likely to cause changes in the water vapor sources of monsoon precipitation, with implications for precipitation reconstructions using water isotope proxies. We use the water isotope/water tagging-enabled Community Earth System Model (iCESM) to study the effects of glacial conditions on the sources of water vapor and isotope ratios of precipitation for the Indian monsoon precipitation. We conduct time slice experiments for the PI and the LGM periods following the PMIP4 guidelines. iCESM was successful in identifying the water vapor sources of present-day Indian summer monsoon precipitation, namely the Indian Ocean sources and precipitation recycling. The detailed results of this study will be presented at the meeting.

How to cite: Tharammal, T., Bala, G., Nusbaumer, J., and Paul, A.: Effects of glacial conditions on the circulation and water vapor sources of Indian monsoon precipitation, EGU General Assembly 2023, Vienna, Austria, 23–28 Apr 2023, EGU23-8251, https://doi.org/10.5194/egusphere-egu23-8251, 2023.

EGU23-8404 | ECS | Orals | CL1.2 | Highlight

Multimodel comparison of weathering fluxes during the last deglaciation 

Fanny Lhardy, Bo Liu, Matteo Willeit, Nathaelle Bouttes, Takasumi Kurahashi-Nakamura, Stefan Hagemann, and Tatiana Ilyina

The global carbon cycle is a complex system with many drivers, including slow ones such as the chemical weathering of rocks. At long enough timescales, changes in weathering rates influence CO2 consumption, but also the river loads of carbon, nutrients, and alkalinity. In particular, the global ocean inventory of alkalinity is a critical driver of carbon sequestration into the ocean. Thus, any transitory imbalance between the sources and sinks of alkalinity can lead to changes in ocean chemistry and impact atmospheric CO2 concentration. During the last deglaciation (ca. 19-11 ka BP), the Earth’s climate transitioned from cold and arid to comparatively warmer and wetter conditions. Simultaneously, large ice sheets melted and led to a significant rise of sea level (ca. +120 m), which reduced the size of the exposed continental shelves. Loess deposits were also gradually eroded. These changes logically influenced the chemical weathering of rocks because weathering rates depend on climate variables (runoff and temperature), land-sea distribution and lithology. Some modelling studies and proxy reconstructions suggest little net changes over this period. Yet, the deglacial changes of weathering rates remain poorly constrained.

Most Earth System Models do not explicitly represent weathering and the consequent river fluxes. Moreover, the alkalinity inventory is often assumed constant in models, despite the fact that proxy data suggest an elevated total alkalinity at the Last Glacial Maximum (and the likely changes of its sources and sinks). These choices can potentially bias the model representation of the global carbon cycle, whose deglacial variations have been notoriously hard to simulate for decades. In this study, we calculate weathering fluxes of phosphorus and alkalinity (among others) using reconstructed lithological maps, and model results from transient runs of the last deglaciation and/or time-slice runs of the Last Glacial Maximum and pre-industrial period. To improve robustness, we compare the evolution and spatial distribution of weathering fluxes in different models. We demonstrate that while the increase of runoff during deglaciation enhances weathering, the rise of sea level and the erosion of loess deposits tend to have a counterbalancing effect on the river loads. Our model ensemble tends to show inconsistent deglacial changes of some river loads (e.g. for phosphorus), depending both on runoff biases and on the representation of land-sea distribution. Still, all models indicate a significant decrease of river alkalinity from the LGM to the pre-industrial. Using these findings, we discuss the implications of an explicit representation of weathering fluxes for the global carbon cycle in transient runs with Earth System Models.

How to cite: Lhardy, F., Liu, B., Willeit, M., Bouttes, N., Kurahashi-Nakamura, T., Hagemann, S., and Ilyina, T.: Multimodel comparison of weathering fluxes during the last deglaciation, EGU General Assembly 2023, Vienna, Austria, 23–28 Apr 2023, EGU23-8404, https://doi.org/10.5194/egusphere-egu23-8404, 2023.

EGU23-8546 | ECS | Orals | CL1.2

Transitions in the Northern Hemisphere glaciation process 

Stefanie Talento, Andrey Ganopolski, and Matteo Willeit

We use the new Earth system model of intermediate complexity CLIMBER-X to investigate pathways of Northern Hemisphere (NH) glaciation. We perform experiments in which different combinations of orbital forcing and atmospheric CO2 concentration are maintained constant in time. Each model simulation is run for 300 thousand years (kyr) starting from present-day conditions, and using an acceleration technique with asynchronous coupling between the climate and ice sheet model components.

We find that in the pathway to a NH glaciation, several bifurcations might occur. The bifurcations separate a diversity of stable configurations, which have different spatial and temporal prints. We identify four different bifurcations, separating five different equilibrium states: (i) completely ice-free conditions, (ii) present-day (ice only over Greenland), weak glaciation (with ice coverage north and west of Hudson Bay, Greenland and Scandinavia), (iv) Last Glacial Maximum – type of glaciation (with large North American and medium-size Eurasian ice sheets) and (v) mega-glaciation (full ice coverage over both North America and Eurasia).

The transitions are also clustered in terms of differential timescales. While the North-American continent full glaciation has a development timescale of ~ 100 kyr, an extensive ice coverage of the Eurasian continent involves a much longer time-frame of ~ 250 kyr. This could explain why a complete glaciation of the Eurasian continent was never observed. This result is also consistent with previous studies in the sense that one glaciation cycle is not long enough for the Eurasian ice sheet to fully grow.

How to cite: Talento, S., Ganopolski, A., and Willeit, M.: Transitions in the Northern Hemisphere glaciation process, EGU General Assembly 2023, Vienna, Austria, 23–28 Apr 2023, EGU23-8546, https://doi.org/10.5194/egusphere-egu23-8546, 2023.

EGU23-8827 | Orals | CL1.2 | Highlight

Are high sensitivity models compatible with the Last Glacial Maximum? 

Navjit Sagoo and Thorsten Mauritsen

The wide range of Effective Climate Sensitivity (ECS) values in climate models are driven by inter-model spread in cloud feedbacks. The most recent generation of models (CMIP6) show an increase in both average ECS values as well as the appearance of very high ECS values (> 4.5 K) compared to the previous generation which has been attributed to an increase in the strength of total cloud feedbacks in CMIP6. Constraining ECS and in particular the high range of ECS values is paramount for reliable predictions of future climate change. The Last Glacial Maximum (LGM) is an out-of-sample climate for modern models and thus provides a valuable evaluation test for these models. This work explores whether models with high ECS values are compatible with the Last Glacial Maximum (LGM) climate and whether we can use the LGM to constrain a plausible upper boundary of ECS. We create a single model ensemble with a wide range of ECS values by modifying cloud feedbacks in the MPI-ESM1.2 model. We simulate the LGM with this ensemble and compare it with four different paleo-reconstructions. Our results indicate models with an ECS > 4 K are incompatible with the existing LGM climate reconstructions: global surface air temperature (SAT) anomalies are too cold compared to reconstructions and ultimately become unstable due to sea ice dynamics in the model. Our study indicates that models with large total cloud feedbacks and high ECS values are not plausible during the LGM. This study highlights the value of using paleoclimates to benchmark models particularly in areas where existing validation techniques are not yet sufficient i.e. constraining cloud feedbacks.

How to cite: Sagoo, N. and Mauritsen, T.: Are high sensitivity models compatible with the Last Glacial Maximum?, EGU General Assembly 2023, Vienna, Austria, 23–28 Apr 2023, EGU23-8827, https://doi.org/10.5194/egusphere-egu23-8827, 2023.

EGU23-9705 | ECS | Posters on site | CL1.2

On the global synchronicity of glacial vegetation changes 

Nils Weitzel, Moritz Adam, Maria Fernanda Sanchez Goñi, Marie-Pierre Ledru, Vincent Montade, Coralie Zorzi, and Kira Rehfeld

Vegetation responds to local climate and carbon dioxide changes with response times ranging from decades to millennia, depending on location, spatial scale, and vegetation characteristic. Here, we focus on orbital timescales, for which all available estimates suggest an equilibrium of vegetation and climate. Over the course of the last glacial period, global mean temperature varied between minima during Marine Isotope Stage (MIS) 4 and MIS2, and a maximum in MIS3. If orbital-scale climate changes followed this global trend across most of the globe, we would expect vegetation changes to feature a similar temporal evolution.

Leveraging a global compilation of pollen records, we quantify the synchronicity of orbital-scale vegetation changes within and across regions during the last glacial period. We use the arboreal pollen fraction, statistical mode decompositions, and key taxa as indicators for forest cover changes. Our results suggest that a globally coherent forest cover minimum occurred during MIS2. However, we do not find evidence for other periods of coherent forest cover trends across the globe or either hemisphere. This indicates that vegetation changes were more regionally confined during earlier parts of the last glacial. As chronologies become more uncertain further back in time, we examine the likelihood of dating errors to explain the absence of globally coherent vegetation changes during MIS4 and MIS3. Finally, we compare our results with simulations of climate and vegetation to assess if models capture the diagnosed forest cover trends found in the pollen records. Moreover, this comparison allows us to infer the influence of temperature, moisture availability, and carbon dioxide on vegetation variations during the last glacial period.

How to cite: Weitzel, N., Adam, M., Sanchez Goñi, M. F., Ledru, M.-P., Montade, V., Zorzi, C., and Rehfeld, K.: On the global synchronicity of glacial vegetation changes, EGU General Assembly 2023, Vienna, Austria, 23–28 Apr 2023, EGU23-9705, https://doi.org/10.5194/egusphere-egu23-9705, 2023.

EGU23-9748 | Orals | CL1.2 | Highlight | Milutin Milankovic Medal Lecture

Milankovitch cycles and the Arctic: insights from past interglacials 

Bette L. Otto-Bliesner

The Arctic is warming at a rate greater than the global average. End-of-summer minimum sea ice extent is declining and reaching new minimums for the historical record of the last 4 decades. The Greenland ice sheet is now losing more mass than it is gaining, with increased surface melting. Earth System Models suggest that these trends will continue in the future. The geologic past can be used to inform what could happen in the future. Emiliani in his 1972 Science paper commented on the relevance of paleoclimate for understanding our future Earth.


Interglacials of the last 800,000 years, including the present (Holocene) period, were warm with low land ice extent. In contrast to the current observed global warming trend, which is attributed primarily to anthropogenic increases in atmospheric greenhouse gases, regional warming during these interglacials was driven by changes in Earth’s orbital configuration. Although the circumstances are different, understanding the behavior, processes, and feedbacks in the Arctic provides insights relevant to what we might expect during future global warming.


Data compilations suggest that despite spatial heterogeneity, Marine Isotope Stages (MIS) 5e (Last Interglacial, ~129 to 116 ka) was globally strong. The Last Interglacial (LIG) is characterized by large positive solar insolation anomalies in the Arctic during boreal summer associated with the large eccentricity of the orbit and perihelion occurring close to the boreal summer solstice. The atmospheric carbon dioxide concentration was similar to the preindustrial period.


Geological proxy data for the LIG indicates that Arctic latitudes were warmer than present, boreal forests extended to the Arctic Ocean in vast regions, summer sea ice in the Arctic was much reduced, and Greenland ice sheet retreat contributed to the higher global mean sea level. Model simulations provide critical complements to this data as the they can quantify the sensitivity of the climate system to the forcings, and the processes and interplay of the different parts of the Arctic system on defining these responses. As John Kutzbach explained in a briefing for science writers, "climate forecasts suffer from lack of accountability. Their moment of truth is decades in the future. But when those same computer programs are used to hindcast the past, scientists know what the correct answer to the test should be."


Significant attention and progress have been made in modeling the LIG in the last 2 decades. Earth System Models now capture more realism of processes in the atmosphere, ocean, and sea ice, can couple to models of the Greenland ice sheet, and include representations of the response of Arctic vegetation to the NH high-latitude summer warming. Increases in computing power has allowed these models to be run at higher spatial resolution and to perform transient simulations to examine the evolving orbital forcing during the LIG.  The international PMIP4 simulations for 127 ka illustrated the importance of positive cryosphere and ocean feedbacks for a warmer Arctic. A CESM2-Greenland ice sheet, transient LIG simulation from 127 ka to 119 ka, established a key role of vegetation feedbacks on Arctic climate change.

How to cite: Otto-Bliesner, B. L.: Milankovitch cycles and the Arctic: insights from past interglacials, EGU General Assembly 2023, Vienna, Austria, 23–28 Apr 2023, EGU23-9748, https://doi.org/10.5194/egusphere-egu23-9748, 2023.

Reliable projections of future climate change are vital for mitigation and adaptation efforts. Such efforts require not only projections of mean changes but of changes in variability, too, since those directly affect the occurrence of extremes. The evaluation of climate models regarding their ability to simulate expected changes in variability of temperature and precipitation relies on the comparison of observations with simulations of past and present-day climate. As such, studying past periods of warming furthers the understanding of the climate system and its projected changes. However, the response of the climate system to forcings depends on the background state. Thus, understanding how insights from studies of the past transfer to future projections and the limitations of this transfer is vital.

Here, we present an analysis of temperature and precipitation variability in transient simulations of the Last Deglaciation and projected future climate. To this end, we analyze how the distributions of temperature and precipitation change as exemplified by the moments of the distribution, i.e. variance, skewness and kurtosis. We identify trends in the projections and compare them to results for the Last Deglaciation and present commonalities and differences between the responses in these climate states. We further present how these changes relate to differences in the background state, forcings, and the timescales on which these forcings act as well as the limitations imposed by these differences. Based on this analysis of the state-dependency of variability and its change with a warming mean state, we present conclusions on how past climates can inform and support studies of future climate change.

How to cite: Ziegler, E. and Rehfeld, K.: Past and future changes of temperature and precipitation variability in climate model projections and transient simulations of the Last Deglaciation, EGU General Assembly 2023, Vienna, Austria, 23–28 Apr 2023, EGU23-9813, https://doi.org/10.5194/egusphere-egu23-9813, 2023.

EGU23-10048 | Posters on site | CL1.2

From the last interglacial to the future – new insights into climate change from the PalMod Earth System modelling framework 

Kerstin Fieg, Mojib Latif, Tatjana Ilyina, and Michael Schulz

The PalMod project funded by the German Federal Ministry of Education and Research (BMBF) aims at filling gaps in our understanding of the dynamics and variability of the Earth system during the last glacial-interglacial cycle. Major goals are to enhance Earth system models (ESMs), to identify potential tipping points that could become important in a warming world, and to perform long-term projections with the advanced the ESMs. 

In PalMod Phases I and II, we focussed on three key epochs, the last glacial inception, MIS3, and the last deglaciation. In PalMod Phase III, we will use the new insights from the first two phases to perform more advanced climate projections into the next millennia. Special focus areas are rapid climate transitions, permafrost melting, and ice-sheet instability and sea level rise.  

How to cite: Fieg, K., Latif, M., Ilyina, T., and Schulz, M.: From the last interglacial to the future – new insights into climate change from the PalMod Earth System modelling framework, EGU General Assembly 2023, Vienna, Austria, 23–28 Apr 2023, EGU23-10048, https://doi.org/10.5194/egusphere-egu23-10048, 2023.

EGU23-11127 | Orals | CL1.2 | Highlight

Rapid expansion of ice sheet area in transient simulations of the last glacial inception 

Matteo Willeit, Stefanie Talento, and Andrey Ganopolski

We present transient simulations of the last glacial inception using the Earth system model CLIMBER-X with interactive ice sheets and visco-elastic solid-Earth response. The simulations are initialized at the Eemian interglacial (125 ka) and run until 100 ka, driven by prescribed changes in orbital configuration and greenhouse gas concentrations from ice core data.
CLIMBER-X simulates a robust ice sheet expansion over North America and Scandinavia through MIS5d, in accordance with proxy data. However, we show that the crossing of a bifurcation point in the ice-covered area, which leads to a rapid (~7 million square km over a few centuries) expansion of ice sheets over North America, is critical to get a large enough ice volume to match the sea level drop of ~40 m indicated by reconstructions during the last glacial inception. As a consequence of the presence of this bifurcation point, the model results are highly sensitive to climate model biases. We also show that in the model the vegetation feedback plays an important role during glacial inception.
Further results suggest that, as long as the system responds almost linearly to insolation changes during the last glacial inception, the model results are not very sensitive to changes in the ice sheet model resolution and the acceleration factor used to speed-up the climate component. This is not valid, however, when the system response is characterized by strongly-nonlinear processes, such as a rapid increase in ice-covered area.

How to cite: Willeit, M., Talento, S., and Ganopolski, A.: Rapid expansion of ice sheet area in transient simulations of the last glacial inception, EGU General Assembly 2023, Vienna, Austria, 23–28 Apr 2023, EGU23-11127, https://doi.org/10.5194/egusphere-egu23-11127, 2023.

EGU23-11206 | Orals | CL1.2

Holocene forest-cover changes in Europe - a comparison of dynamic vegetation model results and pollen-based REVEALS reconstructions 

Anne Dallmeyer, Anneli Poska, Laurent Marquer, Andrea Seim, and Marie-José Gaillard-Lemdahl

We compare Holocene forest-cover changes in Europe derived from a transient MPI-ESM1.2 simulation with high spatial resolution time-slice simulations conducted in LPJ-GUESS and pollen-based quantitative reconstructions of forest cover based on the REVEALS model (pol-RVs). The dynamic vegetation models and pol-RVs agree with respect to the general temporal trends in forest cover for most parts of Europe, with a large forest cover during the mid-Holocene and substantially smaller forest cover closer to the present time. However, the age of the start of decrease in forest cover varies between regions, and is much older in the pol-RVs than in the models. The pol-RVs suggest much earlier anthropogenic deforestation than the prescribed land-use in the models starting 2000 years ago. While LPJ-GUESS generally overestimates forest cover compared to pol-RVs, MPI-ESM indicates lower percentages of forest cover than pol-RVs, particularly in Central Europe. A comparison of the simulated climate with chironomid-based climate reconstructions reveal that model-data mismatches in forest cover are in most cases not driven by biases in the climate. Instead, sensitivity experiments show that the model results strongly depend on the models tuning regarding natural disturbance regimes (e.g. fire and wind throw). The frequency and strength of disturbances are – like most of the parameters in the vegetation models – static and calibrated to modern conditions. However, these parameter values may not be valid during climate and vegetation states totally different from today’s. In particular, the mid-Holocene natural forests were probably more stable and less sensitive to disturbances than present day forests that are heavily altered by human interventions. Our analysis highlights the fact that such model settings are inappropriate for paleo-simulations and complicate model-data comparisons with additional challenges. Moreover, our study suggests that land-use is the main driver of forest decline in Europe during the mid- and late-Holocene.

How to cite: Dallmeyer, A., Poska, A., Marquer, L., Seim, A., and Gaillard-Lemdahl, M.-J.: Holocene forest-cover changes in Europe - a comparison of dynamic vegetation model results and pollen-based REVEALS reconstructions, EGU General Assembly 2023, Vienna, Austria, 23–28 Apr 2023, EGU23-11206, https://doi.org/10.5194/egusphere-egu23-11206, 2023.

EGU23-12139 | ECS | Orals | CL1.2

Sensitivity of the glacial marine biological pump to particle sinking and dust deposition in MPI-ESM 

Bo Liu, Joeran Maerz, and Tatiana Ilyina

The marine biological carbon pump substantially contributes to the glacial-interglacial CO2 change. Compared to the late Holocene, proxy data for the Last Glacial Maximum (LGM) generally agree on an increased export production, associated with an enhanced marine biological carbon pump, in the subantarctic region of the Southern Ocean (SO). By contrast, global export production during the LGM is poorly constrained due to the sparseness and uncertainty of proxy data. The efficiency of the biological pump is mainly controlled by phytoplankton growth, ocean circulation and the sinking and remineralisation of organic matter. Previous modelling studies primarily focused on the sensitivity regarding the former two factors. By far, few studies have discussed the impact of marine particle sinking on glacial ocean biogeochemistry.

In this study, we examine the impact of two different sinking schemes for biogenic particles on the LGM ocean biogeochemistry in the Max Planck Institute Earth System Model (MPI-ESM). In the default sinking scheme, sinking velocities of particulate organic matter (POM), biogenic minerals (CaCO3 and opal) and dust are prescribed and kept the same between LGM and pre-industrial (PI) state. Such a scheme is also widely applied in other ocean biogeochemical models. In a new Microstructure, Multiscale, Mechanistic, Marine Aggregates in the Global Ocean (M4AGO) sinking scheme, the size, microstructure, heterogeneous composition, density and porosity of marine aggregates, consisting of POM, CaCO3, opal and dust, are explicitly represented, and the sinking speed is prognostically computed. We discuss the effect of the two particle sinking schemes under two LGM circulation states: “deep LGM AMOC” with a similar NADW/AABW boundary compared to PI, which is produced in many existing models, and “shallow LGM AMOC” with a shallower NADW/AABW boundary, which agrees better with proxy data. Furthermore, we conducted sensitivity studies regarding LGM dust deposition as the latter is subject to considerable uncertainties.

We find that for the deep LGM AMOC, the difference between the impact of the two particle sinking schemes on the ocean biogeochemical tracers is small. On the contrary, for shallow LGM AMOC, the M4AGO scheme yields more remerineralised carbon in the deep ocean and, therefore, better agreement with δ13C data, suggesting the quantitative impact of particle sinking schemes strongly depends on the background LGM circulation state. For the default sinking scheme, increased glacial dust deposition increases iron fertilisation and thus leads to a rise in both primary production and export production. For the M4AGO scheme, however, the iron fertilisation effect is surpassed by the ballasting effect that reduces the surface nutrient concentration, and LGM primary production decreases with dust deposition. This preliminary result shows that the new marine aggregate sinking scheme adds further complexities to the marine biological carbon pump response to the climate states. Our further analysis will encompass the other nutrients and dissolved oxygen, as well as the comparison to corresponding proxy data. 

How to cite: Liu, B., Maerz, J., and Ilyina, T.: Sensitivity of the glacial marine biological pump to particle sinking and dust deposition in MPI-ESM, EGU General Assembly 2023, Vienna, Austria, 23–28 Apr 2023, EGU23-12139, https://doi.org/10.5194/egusphere-egu23-12139, 2023.

EGU23-12646 | ECS | Orals | CL1.2

On the sensitivity of the ocean response to LGM and MIS3-forcings 

Chetankumar Jalihal, Ute Merkel, Matthias Prange, and Uwe Mikolajewicz

The AMOC has undergone abrupt and quasi-periodic changes during the MIS-3. The prevailing background climatic conditions that produce such behavior in AMOC have yet to be fully understood. Previous studies have demonstrated that some climate models tend to have an oscillatory behavior in their AMOC under specific conditions that vary from model to model. A systematic study that compares these conditions across models is missing. Moreover, the relative impact of greenhouse gas and icesheet forcings on the mean strength of AMOC remain unresolved.


Here, we present our results from CMIP/PMIP style simulations with MIS-3 boundary conditions. This study has been carried out under the PalMOD project. Based on the minimum and maximum ice sheet extent and greenhouse gas radiative forcing, we carried out a set of 4 experiments. These experiments are the LGM, 38ka, LGM_38kaghg (LGM topography with 38ka greenhouse gas concentrations), and 38ka_LGMghg (38ka topography with LGM greenhouse gas concentrations). We have used two Earth system models (ESM), Viz. the MPI-ESM and the CESM. The experiments in MPI-ESM were carried out with two versions of the river run-off directions - one in which run-off directions are compatible with the topography and the other where run-off directions are set to that of the modern-day. Thus, we have three sets of simulations for each experiment.


A robust feature across these simulations is that during the MIS-3, the mean strength of AMOC is sensitive to changes in greenhouse gases, and the changes in ice sheets do not significantly affect the AMOC. The density of water in the North Atlantic Deep-Water formation (NADW) region does not change significantly in response to these forcings. However, the variations in the density in the Arctic and Southern Ocean deep-water formation region drive variations in AMOC strength. The AMOC in CESM undergoes Dansgaard-Oeschger (DO) like oscillations in the 38ka LGMghg simulation. No oscillations are found in any MPI-ESM experiments with the run-off adapted for topography. However, Bo-like oscillations appear in the LGM simulation with modern run-off. This highlights the importance of model parameters and the location of freshwater input into the ocean in determining the conditions that lead to oscillatory behavior in AMOC.

How to cite: Jalihal, C., Merkel, U., Prange, M., and Mikolajewicz, U.: On the sensitivity of the ocean response to LGM and MIS3-forcings, EGU General Assembly 2023, Vienna, Austria, 23–28 Apr 2023, EGU23-12646, https://doi.org/10.5194/egusphere-egu23-12646, 2023.

EGU23-13276 | Orals | CL1.2 | Highlight

A multi-centennial mode of North Atlantic climate variability throughout the Last Glacial Maximum 

Matthias Prange, Lukas Jonkers, Ute Merkel, Michael Schulz, and Pepijn Bakker

Paleoclimate proxy records from the North Atlantic region reveal substantially greater multi-centennial temperature variability during the Last Glacial Maximum (LGM) compared to the current interglacial. As there was no obvious change in external forcing, causes for the increased variability remain unknown. Here we provide a mechanism for enhanced multi-centennial North Atlantic climate variability during the LGM based on experiments with the coupled climate model CESM. The model simulates an internal mode of multi-centennial variability, which is associated with variations in the Atlantic meridional overturning circulation. In accordance with high-resolution proxy records from the glacial North Atlantic, this mode induces highest surface temperature variability in subpolar and mid latitudes and almost no variance in low latitudes. Greenland surface air temperature varies by up to 4°C, which is in line with multi-centennial variability reconstructed from ice cores. We show that this mode is based on a salt-oscillator mechanism and emerges only under full LGM climate forcing. Moderate deviations from full-glacial boundary conditions lead to its disappearance. We further argue that the multi-centennial mode has to be distinguished from millennial-scale Dansgaard-Oeschger oscillations.

How to cite: Prange, M., Jonkers, L., Merkel, U., Schulz, M., and Bakker, P.: A multi-centennial mode of North Atlantic climate variability throughout the Last Glacial Maximum, EGU General Assembly 2023, Vienna, Austria, 23–28 Apr 2023, EGU23-13276, https://doi.org/10.5194/egusphere-egu23-13276, 2023.

EGU23-13781 | ECS | Posters on site | CL1.2

Waterbelt states controlled by sea-ice thermodynamics 

Johannes Hörner and Aiko Voigt

Snowball Earth refers to multiple periods in the Neoproterozoic during which geological evidence indicates that Earth was largely covered in ice. A Snowball Earth results from a runaway ice-albedo feedback, but it is still under debate how the feedback stopped: with fully ice-covered oceans or with a strip of open water around the equator. 

The latter are called waterbelt states and are an attractive explanation for the Snowball Earth events because they provide a refugium for the survival of photosynthetic aquatic life, while still explaining Neoproterozoic geology. Waterbelt states can be stabilised by bare sea ice in the subtropical desert regions with lower surface albedo stopping the ice-albedo feedback. However, the sea-ice model used in climate simulations can have a significant impact on the snow cover of ice and hence the surface albedo. 

Here we investigate the robustness of waterbelt states with respect to the thermodynamical representation of sea ice. We compare two thermodynamical sea-ice models, an idealised 0-layer Semtner model and a 3-layer Winton model that takes into account the heat capacity of ice. We deploy the atmospheric part of the ICON-ESM model (ICOsahedral Nonhydrostatic - Earth System Model) in a comprehensive set of simulations to determine the extent of the waterbelt hysteresis. 

The thermodynamic representation of sea ice strongly influences snow cover on sea ice over the range of all climate states. Including heat capacity by using the 3-layer Winton model increases snow cover and enhances the ice-albedo feedback. The hysteresis of the stable waterbelt state found using the 0-layer model disappears when using the 3-layer model. This questions the relevance of a subtropical bare sea-ice edge for waterbelt states and might help explain drastically varying model results on waterbelt states in the literature.

How to cite: Hörner, J. and Voigt, A.: Waterbelt states controlled by sea-ice thermodynamics, EGU General Assembly 2023, Vienna, Austria, 23–28 Apr 2023, EGU23-13781, https://doi.org/10.5194/egusphere-egu23-13781, 2023.

EGU23-15633 | Posters on site | CL1.2 | Highlight

The impact of CO2 and ice sheet changes on the deglacial AMOC sensitivity to freshwater perturbations in three different Earth System Models 

Gregor Knorr, Marie Kapsch, Matthias Prange, Uwe Mikolajewicz, Dragan Latinovic, Ute Merkel, Lu Niu, Lars Ackermann, Xiaoxu Shi, and Gerrit Lohmann

During deglaciation disintegration of large-scale continental ice sheets represents a continuous threat to reduce the strength of the Atlantic meridional overturning circulation (AMOC) via meltwater perturbations to the northern high latitudes. Nevertheless, an abrupt AMOC recovery is detected half-way through the last deglaciation and  a growing number of studies using Earth System Models (ESMs) of varying complexity have shown that atmospheric CO2 concentrations and ice sheet volume can influence the operational mode of the AMOC, eventually including the coexistence of multiple states and associated threshold behavior for intermediate climate states between full glacial (e.g. Last Glacial Maximum, LGM) and full interglacial (e.g. pre-industrial, PD)  conditions. In this study we present results from coordinated sensitivity experiments conducted as part of the German climate modeling initiative (PalMod), using three complex ESMs (AWI-ESM, CESM and MPI-ESM). Besides differences in the impact of CO2 and ice volume changes, we also investigate how variations in these boundary conditions control the AMOC sensitivity to deglacial meltwater injections in the North Atlantic. We find that the AMOC strength responds to ice sheet and/or CO2 changes in all models, with partly opposing effects.  A similar AMOC strength for PD and LGM conditions is detected in AWI-ESM and MPI-ESM, while CESM shows a weaker LGM AMOC. This weaker LGM state is also characterized by a relatively pronounced AMOC sensitivity to freshwater perturbations. Our inter-comparison experiments suggest that this specific behavior in CESM can be detected for atmospheric concentrations between LGM and intermediate levels of ~220 ppm. This further corroborates in particular the impact of CO2 changes to modulate the trajectory of deglacial climate changes by an alteration of the AMOC susceptibility to meltwater injections as recently suggested (Sun et al., Glob. Planet. Change, 2021; Barker & Knorr, Nat. Commun., 2021).


References:

Sun, Y., Knorr, G., Zhang, X., Tarasov, L., Barker, S., Werner, M. and G. Lohmann (2022): Ice sheet decline and rising atmospheric CO2 control AMOC sensitivity to deglacial meltwater discharge. Global and Planetary Change 210. https://doi.org/10.1016/j.gloplacha.2022.10375

Barker, S. and G.  Knorr (2021): Millennial scale feedbacks determine the shape and rapidity of glacial termination. Nature Communications 12, 2273. https://doi.org/10.1038/s41467-021-22388-6

How to cite: Knorr, G., Kapsch, M., Prange, M., Mikolajewicz, U., Latinovic, D., Merkel, U., Niu, L., Ackermann, L., Shi, X., and Lohmann, G.: The impact of CO2 and ice sheet changes on the deglacial AMOC sensitivity to freshwater perturbations in three different Earth System Models, EGU General Assembly 2023, Vienna, Austria, 23–28 Apr 2023, EGU23-15633, https://doi.org/10.5194/egusphere-egu23-15633, 2023.

Paleo records indicate significant variation in sea level and temperature proxies between different glacial cycles. What is unclear is the extent to which these differences are due to noise in the physical system versus a robust response to external forcings. When one considers what is happening with each individual ice sheet, variations between glacial cycles are largely unknown, given the few relevant records available to constrain ice sheet extent before the Eemian. 

To explore both the controls on past ice sheet and climate evolution and explore bounds on what the evolution might actually have looked like, we are running ensemble simulations of the last two glacial cycles with the fully coupled ice/climate model LCice. LCice is a coupled version of the Loveclim EMIC and GSM glacial systems model with hybrid shallow shelf and shallow ice flow and global visco-elastic glacio-isostatic adjustment. The current configuration includes all 4 ice sheet complexes and is subject to only orbital and greenhouse gas forcing.

To answer the above questions, we present ensemble results for the last two glacial inceptions, focusing on what key ice sheet and climate characteristics are robust across the ensemble and what are not. The role of key forcings and feedbacks are also isolated through a set of sensitivity experiments.  

How to cite: Geng, M. and Tarasov, L.: A comparison of the last two glacial inceptions via fully coupled transient ice and climate modelling., EGU General Assembly 2023, Vienna, Austria, 23–28 Apr 2023, EGU23-16335, https://doi.org/10.5194/egusphere-egu23-16335, 2023.

EGU23-16377 | Orals | CL1.2 | Highlight

Angiosperms leaf evolution and the Cretaceous continental hydrological cycle : accounting for paleotraits in paleoclimate numerical simulations 

Pierre Sepulchre, Julia Bres, Quentin Pikeroen, Nicolas Viovy, and Nicolas Vuichard

Land cover, and thereby vegetation, can alter climate through biogeochemical and biogeophysical effects. Specifically, plants mediate radiative and turbulent fluxes between the surface and atmosphere and contribute to defining temperature and precipitation patterns in continental areas. In recent decades, pioneering works based both on fossil records and climate modelling have shown that vegetation parameterization is pivotal for accurately simulating past climates. Here, we focused on the Cretaceous, during which the radiation of angiosperms was accompanied by a physiological revolution characterized in the fossil record by an increase in the density of leaf veins and, ultimately, an unprecedented rise in their stomatal conductance. Emulating such an evolution of leaf traits, quantifying their consequences on plant productivity and transpiration, and identifying the associated feedbacks in the Cretaceous climate is a very challenging task. We addressed this triple problem by embedding the reconstruction of physiological paleotraits from the fossil record within the IPSL-CM5A2 earth system model, which land surface scheme allows for the interaction between stomatal conductance and carbon assimilation.

We built and evaluated vegetation parameterizations accounting for the increase in stomatal conductance during angiosperm radiation, which is consistent with the fossil record, by altering the hydraulic and photosynthetic capacities of plants in a coupled fashion. These experiments, combined with two extreme atmospheric pCO2 scenarios, show that a systematic increase in transpiration is simulated when vegetation shifts from a proto-angiosperm state to a modern-like state, and that its magnitude is related to primary productivity modulated by light, water stress, and evaporative demand. Under a high pCO2 scenario, only stomatal conductance plays a role, and the feedback of vegetation change consists mainly of more intense water recycling and rainfall over the continents. At low pCO2, the effect of the high stomatal conductance on transpiration is enhanced by the development of vegetation cover, resulting in more transpiration and higher precipitation rates at all latitudes. Enhanced turbulent fluxes lead to a surface cooling that outcompete the warming linked to the lower surface albedo. Our results suggest a larger impact of angiosperms on climate when atmospheric pCO2 is decreasing, and stresses the importance of accounting for fossil-based paleotraits in paleoclimate simulations.

How to cite: Sepulchre, P., Bres, J., Pikeroen, Q., Viovy, N., and Vuichard, N.: Angiosperms leaf evolution and the Cretaceous continental hydrological cycle : accounting for paleotraits in paleoclimate numerical simulations, EGU General Assembly 2023, Vienna, Austria, 23–28 Apr 2023, EGU23-16377, https://doi.org/10.5194/egusphere-egu23-16377, 2023.

EGU23-16871 | ECS | Orals | CL1.2

Species distribution models fail to predict paleozoological occurrences during the Holocene Green Sahara phase 

Ignacio Lazagabaster, Juliet Spedding, Irene Solano-Regadera, Chris Thomas, Salima Ikram, Severus Snape, and Jakob Bro-Jorgensen

Paleoclimatic simulations are powerful tools to investigate past faunal biogeographical patterns, but they can fail to capture complex climatic conditions at specific regional or temporal scales. Here we show that species distribution models (SDMs) do not predict the expansion of suitable habitats for mammals that were present in the Sahara during the African Humid Period (AHP) according to radiocarbon-dated paleozoological records. We illustrate this issue by modeling the current and past distribution of the hartebeest (Alcelaphus buselaphus), a typical African savanna antelope with a wide Sub-Saharan distribution. Its Holocene paleozoological record shows that its distribution during the AHP included large areas of the Sahara and the northern African Mediterranean coast, from Morocco to Egypt and the Levant. We use Bayesian additive regression trees (BARTs) with an MCMC algorithm in combination with current climate and occurrence data to generate posterior distributions of habitat suitability, evaluate variable importance, and generate variable partial-dependence plots. From these, we learn that annual precipitation is the most important climatic variable determining the hartebeest’s current distribution. We then projected habitat suitability onto various paleoclimatic scenarios during the AHP and found that the estimated precipitation did not reach the minimum required for the viability of hartebeest populations. These results highlight the potential of the fossil record to test the regional precision of paleoclimatic simulations, ultimately helping to generate more realistic past environmental scenarios.

How to cite: Lazagabaster, I., Spedding, J., Solano-Regadera, I., Thomas, C., Ikram, S., Snape, S., and Bro-Jorgensen, J.: Species distribution models fail to predict paleozoological occurrences during the Holocene Green Sahara phase, EGU General Assembly 2023, Vienna, Austria, 23–28 Apr 2023, EGU23-16871, https://doi.org/10.5194/egusphere-egu23-16871, 2023.

EGU23-17590 | Orals | CL1.2

Simulating Changes in Tropical Cyclone Activity During the Deglaciation 

Clay Tabor, Marcus Lofverstrom, Isabel Montañez, Jessica Oster, and Colin Zarzycki

How tropical cyclones respond to climate change remains an open question. Due to recent increases in computing power and climate model resolution, it is now possible to explicitly simulate tropical cyclone genesis and life cycle over long temporal and spatial scales. So far, most high-resolution simulations have explored tropical cyclones under present-day and future climate conditions. There has been little work on tropical cyclone activity in past climates. Here, we help fill in this gap with high resolution simulations of the last deglaciation including the Last Glacial Maximum (LGM; 21-ka), Heinrich Stadial 1 (HS1; 16-ka), and Preindustrial (PI; 1850 CE). We use the water isotope tracer enabled version of the Community Earth System Model version 1.3 (iCESM1.3) at ~0.25° horizontal resolution to simulate climate and the TempestExtremes algorithm to track tropical cyclone features. Our preliminary results show intriguing spatial changes in tropical cyclone activity at the LGM relative to PI. The Atlantic and Indian basins produce less tropical cyclones while the Western Pacific produces more tropical cyclones at the LGM. Furthermore, tropical cyclone frequency decreases in the southern hemisphere but remains similar in the northern hemisphere. The LGM simulation also produces fewer strong storms (greater than 49 m/s). Further investigation will explore the physical mechanisms for the simulated tropical cyclone responses during the deglaciation as well as the effects of freshwater flux into the North Atlantic on tropical cyclone activity.

How to cite: Tabor, C., Lofverstrom, M., Montañez, I., Oster, J., and Zarzycki, C.: Simulating Changes in Tropical Cyclone Activity During the Deglaciation, EGU General Assembly 2023, Vienna, Austria, 23–28 Apr 2023, EGU23-17590, https://doi.org/10.5194/egusphere-egu23-17590, 2023.

EGU23-157 | ECS | Posters on site | CL1.5

Excess methane, ethane, and propane production in Greenland ice core samples and a first characterization of the δ13C-CH4 and δD-CH4 signature 

Michaela Mühl, Jochen Schmitt, Barbara Seth, James E. Lee, Jon S. Edwards, Edward J. Brook, Thomas Blunier, and Hubertus Fischer

Air trapped in polar ice provides unique records of the past atmospheric composition ranging from key greenhouse gases such as methane (CH4) to short-lived trace gases like ethane (C2H6) and propane (C3H8). Interpreting these data in terms of atmospheric changes requires that the analyzed species accurately reflect the past atmospheric composition.

Recent comparisons of Greenland CH4 records obtained using different extraction techniques revealed discrepancies in the CH4 concentration for the last glacial. Elevated methane levels (excess methane or CH4(exs)) were detected in dust rich ice core sections measured by discrete melt extraction techniques pointing to an artefact sensitive to the measurement technique. To shed light on the underlying mechanism, we analyzed Greenland ice core samples for methane and other short-chain alkanes (ethane and propane) covering the time interval from 12 to 42 kyr using a classic wet extraction technique. The artefact production happens during the melting and extraction step (in extractu) and reaches 14 to 91 ppb CH4(exs) in dusty ice samples. For the first time in ice core analyses, we document a co-production of excess methane, ethane, and propane (excess alkanes) with the observed concentrations for ethane and propane exceeding, at least by a factor of 10, their past atmospheric concentration. Independent of the produced amounts, excess alkanes were produced in a fixed molar ratio of approximately 14:2:1, indicating a common production. We also discovered that the amount of excess alkanes scales generally with the amount of mineral dust (or Ca2+ as a proxy for mineral dust) within the ice samples. Moreover, applying the Keeling-plot approach we are able to isotopically characterize CH4(exs) revealing a relatively heavy carbon isotopic signature of (-46.4 ± 2.4) ‰ and a light deuterium isotopic signature of (-326 ± 57) ‰ of the excess methane in the samples analyzed.

The co-production ratios of excess alkanes and the isotopic composition of excess methane allows us to confine potential formation processes. We discovered that this specific alkane pattern is not in line with an anaerobic methanogenic origin but indicative for abiotic decomposition of organic matter as also found in sediments, soils, and plant leaves. From the present-day state of research little is known about this process and there is urgent need to improve our understanding for future ice core measurements. Moreover, the already existing discrete records of atmospheric CH4 in Greenland ice need to be corrected for excess CH4 contribution (CH4(exs), δ13C-CH4(exs), δD-CH4(exs)) in dust-rich intervals.

While the size of the excess methane production has little effect on reconstructed radiative forcing changes of CH4 in the past, it is in the same range as the Inter-Polar Difference (IPD) for CH4. Knowing the empirical relation of excess CH4(exs)/ Ca2+ and CH4(exs)/ C2H6 allows us to derive a first-order correction of existing CH4 data sets to revise previous interpretations of the relative contribution of high latitude northern hemispheric CH4 sources based on the IPD.

How to cite: Mühl, M., Schmitt, J., Seth, B., Lee, J. E., Edwards, J. S., Brook, E. J., Blunier, T., and Fischer, H.: Excess methane, ethane, and propane production in Greenland ice core samples and a first characterization of the δ13C-CH4 and δD-CH4 signature, EGU General Assembly 2023, Vienna, Austria, 23–28 Apr 2023, EGU23-157, https://doi.org/10.5194/egusphere-egu23-157, 2023.

EGU23-1327 | ECS | Orals | CL1.5

Non-target screening of organic aerosol tracers applied to a high-alpine firn core 

Carla Huber, Daniil Salionov, François Burgay, Anja Eichler, Theo Jenk, Sasa Bjelic, and Margit Schwikowski

Ice cores are unique natural archives that provide important information about the past evolution of the Earth’s atmosphere. Whereas the inorganic atmospheric aerosol fraction is well characterized, the organic composition is less understood. The organic aerosol burden is consistently underestimated in the current state-of-the-art models, thus highlighting major gaps in our understanding of the pathways by which organic aerosols accumulate and evolve in the atmosphere. So far, organic aerosols in ice cores have been primarily reported as either bulk (e.g., water insoluble or dissolved organic carbon) or specific parameters (e.g., biomass burning tracers).
To provide a more comprehensive characterization of the organic fraction, we applied a non-target screening approach optimised for determining oxidation products of volatile organic compounds to a firn core collected on the Corbassière glacier (Grand Combin, Swiss Alps), in 2020, covering the period 2008-2020. In comparison with a firn core drilled two years earlier (2018), we observe a drastic disturbance of seasonal trends for certain species, such as major ions at depths corresponding to the annual layers from 2008 to 2016, induced by meltwater percolation.

As organic tracers are present in low concentrations in the firn core, we performed solid phase extraction. The organic tracers were analysed with high-resolution mass spectrometry based on Orbitrap technology coupled with liquid chromatography. This technique makes it possible to study a wide range of individual compounds at low concentration and to identify them with MS/MS fragmentation. We can attribute molecular formulas to detected compounds by comparing the MS/MS spectra with spectral libraries (e.g., mzCloud) or reference standards. With this approach we will present a unique record of molecular composition of organic aerosol in the Corbassière firn core.
Furthermore, this firn core presents a unique opportunity to examine the effect of melting on the organic tracers. We found that specific burning tracers (e.g., vanillic acid, vanillin and syringaldehyde) are less affected than other biomass tracers (e.g., pinic acid) by meltwater percolation. In general, we observe a decrease in concentration of the organic tracers in the same firn core section where we also observe a decrease in major ion concentrations.

How to cite: Huber, C., Salionov, D., Burgay, F., Eichler, A., Jenk, T., Bjelic, S., and Schwikowski, M.: Non-target screening of organic aerosol tracers applied to a high-alpine firn core, EGU General Assembly 2023, Vienna, Austria, 23–28 Apr 2023, EGU23-1327, https://doi.org/10.5194/egusphere-egu23-1327, 2023.

EGU23-1684 | Posters on site | CL1.5

The next generation U.S. National Science Foundation Ice Core Facility: supporting state-of-the-art science. 

Lindsay Powers, Andrei Kurbatov, Charles Kershaw, Geoffrey Hargreaves, Curtis Labombard, and Tyler J. Fudge

The National Science Foundation Ice Core Facility (NSF-ICF, fka NICL) is in the process of building a new facility including freezer and scientist support space. The facility is being designed to minimize environmental impacts while maximizing ice core curation and science support. In preparation for the new facility, we are updating research equipment and integrating ice core data collection and processing by assigning International Generic Sample Numbers (IGSN) to advance the “FAIR”ness and establish clear provenance of samples, fostering the next generation of linked research data products. The NSF-ICF team, in collaboration with the US ice  core science community, has established a metadata schema for the assignment of IGSNs to ice cores and samples. In addition, in close coordination with the US ice core community, we are adding equipment modules that expand traditional sets of physical property, visual stratigraphy, and electrical conductance ice core measurements. One such module is an ice core hyperspectral imaging (HSI) system. Adapted for the cold laboratory settings, the SPECIM SisuSCS HSI system can collect up to 224 bands using a continuous line-scanning mode in the visible and near-infrared (VNIR) 400-1000 nm spectral region. A modular system design allows expansion of spectral properties in the future. The second module is an updated multitrack electrical conductance system. These new data will guide real time optimization of sampling for planned analyses during ice core processing, especially for ice with deformed or highly compressed layering. The aim is to facilitate the collection of robust, long-term, and FAIR data archives for every future ice core section processed at NSF-ICF. The NSF-ICF is fully funded by the National Science Foundation and operated by the U.S. Geological Survey.

How to cite: Powers, L., Kurbatov, A., Kershaw, C., Hargreaves, G., Labombard, C., and Fudge, T. J.: The next generation U.S. National Science Foundation Ice Core Facility: supporting state-of-the-art science., EGU General Assembly 2023, Vienna, Austria, 23–28 Apr 2023, EGU23-1684, https://doi.org/10.5194/egusphere-egu23-1684, 2023.

EGU23-2398 | ECS | Orals | CL1.5 | Highlight

A Novel Method for Quantifying Terrestrial SOA-Markers in Antarctic Ice 

Emilia Bushrod, Elizabeth Thomas, and Chiara Giorio

Terrestrially emitted biogenic volatile organic compounds (BVOCs) can be oxidised within the troposphere and become components in secondary organic aerosol (SOA). SOA can be transported and deposited at glacial regions. Due to Antarctica’s geography being removed from the terrestrial sources of BVOCs, it was unclear if SOA-markers of such BVOCs could become incorporated in Antarctic ice, at a detectable concentration. Terrestrial SOA-markers have never before been found to be present in Antarctic ice cores, until this study. The implementation of liquid chromatography coupled with triple quadrupole mass spectrometry has allowed for the development of a novel method that can detect targeted organic compounds at concentrations as low as 1.5ppt. Using this method, 2-methylerythritol, a SOA-marker of isoprene, has been detected in Jurassic, an ice core drilled in Antarctica. Though difficult to quantify due to the low concentration, this is the first time that such a compound has been found in Antarctic ice.

How to cite: Bushrod, E., Thomas, E., and Giorio, C.: A Novel Method for Quantifying Terrestrial SOA-Markers in Antarctic Ice, EGU General Assembly 2023, Vienna, Austria, 23–28 Apr 2023, EGU23-2398, https://doi.org/10.5194/egusphere-egu23-2398, 2023.

EGU23-2498 | ECS | Posters on site | CL1.5

239Pu concentrations reconstructed using three Antarctic ice cores during 1940-1980 CE 

Jinhwa Shin, Seungmi Lee, Heejin Hwang, and Yeongcheol Han

The radioisotope Plutonium-239 (239Pu) was artificially produced to the environment by atmospheric nuclear weapons tests during 1940-1980 CE. Although 239Pu is the most abundant one among isotopes of Plutonium, it exists in Antarctic ice cores at very low level of sub-fg g-1. Accordingly, the historical records of 239Pu fallout in Antarctica have not been well reconstructed. In this study, we determined 239Pu concentrations in three coastal ice cores in Northern Victoria Land, East Antarctica. Discrete samples with sub-annual resolution for the period 1940-1980 CE were analyzed using inductively coupled plasma sector field mass spectrometry (ICP-SFMS) without purification or preconcentration. The fallout records of the three sites showed consistent fluctuations and also agreed with the records recovered from inland dome sites (Hwang et al., 2019), which allowed for constructing an Antarctic composite record. The composite 239Pu record was characterized by two major peaks in 1954 and 1964 CE and a minor peak in 1970s, which could be ascribed to the major atmospheric nuclear test events. Those synchronous 239Pu peaks are expected to serve as useful age markers in other regions in Antarctica, which can improve depth-age relationships of ice core records and enable more precise interregional comparisons. In addition, it will contribute to a more precise comparison of ice core records with reanalysis data back to the 1950s (e.g., ERA5).

How to cite: Shin, J., Lee, S., Hwang, H., and Han, Y.: 239Pu concentrations reconstructed using three Antarctic ice cores during 1940-1980 CE, EGU General Assembly 2023, Vienna, Austria, 23–28 Apr 2023, EGU23-2498, https://doi.org/10.5194/egusphere-egu23-2498, 2023.

EGU23-3195 | Orals | CL1.5

Skytrain Ice Rise, Antarctica, during the last glacial period 

Eric Wolff, Mackenzie Grieman, Helene Hoffmann, Jack Humby, Robert Mulvaney, Christoph Nehrbass-Ahles, Sentia Goursaud Oger, Rachael Rhodes, and Isobel Rowell

Antarctic ice core records covering the last glacial cycle generally reflect a common climate and environmental history overlain with local influences such as changes in altitude, atmospheric circulation, local dust sources, or regional sea ice extent. Here we investigate records from the 651 m Skytrain Ice Rise core, drilled within the WACSWAIN (WArm Climate Stability of the West Antarctic ice sheet in the last Interglacial) project. This ice rise is adjacent to the Ronne Ice Shelf and the WAIS, and extends into the last interglacial period, including a continuous record of the last glacial cycle.   

The water isotope record shows the clearly recognisable pattern of all the Antarctic Isotopic Maxima of the last 100 kyr, but with different amplitudes to those seen in the well-known WAIS Divide or EPICA ice cores. We will consider what these differences in amplitude tell us about ice elevation at Skytrain, using total air content data to aid our interpretation. The information from sea salt ions can tell us about ice shelf extent, and taking the water isotopes and ions together will allow us to diagnose the status of the Ronne Ice Shelf throughout the glacial. Terrestrial material (Ca, dust) reflects both a common continent-wide input of dust from other continents (especially South America) but also local inputs. We will use the differences for terrestrial dust between Skytrain Ice Rise and other sites to diagnose the input of local dust from the Ellsworth Mountains.

Finally combining all three sources of information we expect to make statements about the wider advance and retreat of the West Antarctic Ice Sheet and Ronne Ice Shelf in the region surrounding Skytrain Ice Rise.

How to cite: Wolff, E., Grieman, M., Hoffmann, H., Humby, J., Mulvaney, R., Nehrbass-Ahles, C., Goursaud Oger, S., Rhodes, R., and Rowell, I.: Skytrain Ice Rise, Antarctica, during the last glacial period, EGU General Assembly 2023, Vienna, Austria, 23–28 Apr 2023, EGU23-3195, https://doi.org/10.5194/egusphere-egu23-3195, 2023.

EGU23-3787 | Orals | CL1.5

Sulfate isotopes over termination II - Source decomposition and Southern Ocean productivity changes 

Hubertus Fischer, Andrea Burke, James Rae, Eric Wolff, Helena Pryer, Emily Doyle, Mirko Severi, Bradley Markle, Maria Hörhold, Johannes Freitag, and Tobias Erhardt

An important ingredient in the glacial reduction of atmospheric CO2 is the increase of marine biological productivity in the Southern Ocean region due to an alleviation of Fe limitation in glacial times. This is indeed documented in marine sediments north of the modern Antarctic Polar Front (APF). In contrast, productivity south of it appears to be reduced, however the marine information is incomplete due to the prevalence of winter and summer sea ice in major parts of this region during glacial times. The high-resolution Antarctic ice core sulfate aerosol record, which, among other sources, is influenced by the marine biogenic emission of dimethylsulfide, was so far unable to provide unambiguous estimates of such productivity changes. In particular, sulfate deposition fluxes in the EPICA Dome C ice core (EDC) showed no glacial/interglacial changes whatsoever, while the same data in the EPICA Dronning Maud Land core (EDML) suggested a slight increase in the glacial, despite the fact that these records should be dominated by biogenic sources south of the APF.

New high-precision stable sulfur isotope measurements on ice core sulfate over termination II on the EDML core together with high-resolution sulfate, sea-salt and mineral dust aerosol concentration records allow us for the first time to perform a quantitative decomposition of the sea salt, terrestrial, volcanic and biogenic sulfate contributions. This shows that despite a significant increase in terrestrial sulfate in the glacial, marine biogenic emissions are still by far the dominating source of sulfate during that time at least for the Atlantic sector of Antarctica but likely for the entire Antarctic plateau.

Using a simple atmospheric aerosol transport model to correct for the loss of sulfate aerosol en route by wet and dry deposition, we are able to reconstruct the atmospheric sulfate aerosol concentrations changes over the Atlantic sector of the Southern Ocean source region mainly south of the APF. This shows that despite lower sulfate ice concentrations at EDML during interglacials, atmospheric aerosol concentration at the ocean source south of the APF - hence marine biogenic sulfur emissions - were up to a factor of 2 higher during the last interglacial and the late termination II than during the penultimate glacial maximum.

How to cite: Fischer, H., Burke, A., Rae, J., Wolff, E., Pryer, H., Doyle, E., Severi, M., Markle, B., Hörhold, M., Freitag, J., and Erhardt, T.: Sulfate isotopes over termination II - Source decomposition and Southern Ocean productivity changes, EGU General Assembly 2023, Vienna, Austria, 23–28 Apr 2023, EGU23-3787, https://doi.org/10.5194/egusphere-egu23-3787, 2023.

One of the primary proxies for ancient atmospheric air compositions is the fossil air occluded in polar ice sheets. Ice cores are significant archives for the atmospheric Greenhouse Gas (GHG) concentrations during the last 800 kyr (thousand years). GHG records from polar ice cores have provided valuable information on past climatic, atmospheric, and glaciological changes. For example, nitrous oxide (N2O) is a long-lived GHG and gives us information on nitrogen cycles. However, the time resolution and missing gaps of N2O records limit our understanding of the control mechanisms in the atmosphere. One of the well-known state-of-the-art methods is AI (Artificial Intelligence) techniques, and its main branch is ML (Machine Learning) method. To fill the N2O gaps during the last 800 kyr, we used CO2 and CH4 concentration data from Antarctic ice cores (Vostok and EPICA Dome C ice cores). The ML methods were run in two steps. First, the gap parts were deleted from the time series, and modeling was performed with CO2 and CH4 concentration data with six various ML methods (Linear, Support Vector Machine, Tree, Gaussian Process Regression (GPR), Artificial Neural Network (ANN), and Ensemble). Then, the best model was selected for the second step to reconstruct the N2O in the data gaps. Although other AI methods revealed acceptable results in the first step, the GPR method produced a high-quality simulation with R2= 0.86, RMSE= 7.38 ppb, and MAE= 4.15 ppb. Finally, the simulation for the N2O gaps was performed with the GPR method. Our results confirm that AI techniques have a high potential to produce continuous paleo atmospheric GHG concentrations. Future research includes modeling with other AI and ML methods and applying the AI techniques to other ice core records, such as water isotope ratios (temperature proxy) over various past periods.

How to cite: Salehnia, N. and Ahn, J.: Filling N2O data gaps during the last 800,000 years via Artificial Intelligence Techniques, EGU General Assembly 2023, Vienna, Austria, 23–28 Apr 2023, EGU23-4873, https://doi.org/10.5194/egusphere-egu23-4873, 2023.

EGU23-6627 | Orals | CL1.5

Bipolar volcanic ice-core synchronization of the last glacial cycle 

Anders Svensson and the Bipolar volcano team

Precise synchronization of climate records is essential for deducing the dynamics of the climate system. Ice cores from the Greenland and Antarctic ice sheets have previously been synchronized by the use of cosmogenic isotopes, gas concentrations, and traces of large volcanic eruptions. Identification of identical sequences of volcanic sulfate depositions at both poles have been applied to synchronize ice cores in the Holocene, in the last deglaciation, in Marine Isotope Stage 3 (MIS3) and around the Indonesian Toba eruption occurring close to 74 ka. We now extend this inter-hemispheric volcanic synchronization approach to also cover MIS2 (16.5-24.5 ka BP), MIS4 and part of MIS5 (60-110 ka BP) allowing for a precise bipolar synchronization of the entire last glacial period. The synchronization is based on some 250 volcanic eruptions that are identified as acidity spikes in both Greenland and Antarctica. Similar to previous work, the identification of volcanic sequences at the two poles is supported by annual layer counting in both Greenland and Antarctica, although the identification of annual layers becomes increasingly difficult with depth. To support the synchronization we investigate the deduced annual layer thicknesses (not requiring layer counting) and the inferred depth-depth relation between synchronized ice cores. The precise bipolar synchronization allows to determine the exact inter-hemispheric phasing of abrupt climate change during the last glacial, and to investigate a possible relation between abrupt climate change and volcanism. Furthermore, the frequency and magnitude of large volcanic eruptions of the last glacial can be established.

How to cite: Svensson, A. and the Bipolar volcano team: Bipolar volcanic ice-core synchronization of the last glacial cycle, EGU General Assembly 2023, Vienna, Austria, 23–28 Apr 2023, EGU23-6627, https://doi.org/10.5194/egusphere-egu23-6627, 2023.

EGU23-8369 | Posters on site | CL1.5

Optimal sampling resolution for water isotope records in ice cores 

Fyntan Shaw, Andrew Dolman, Torben Kunz, Vasileios Gkinis, and Thomas Laepple

Water isotopes in ice cores offer a window into the climate of the past. Often the measurement of these water isotopes is done discretely, with the ice cores cut into many regularly spaced samples. Determining the optimal sampling rate for these measurements is a question of balancing high temporal resolution with processing time and effort. Furthermore, the effect of isotopic diffusion smooths the record, attenuating high frequency variability far below the measurement noise level. This results in some climate information becoming unobtainable and limits the usefulness of very high resolution data. Deconvolving (un-diffusing) the time-series can further enhance the signal but strongly depends on the precision of the isotope data that is mainly determined by the measurement error.

Here, we discuss the optimal measurement specifications in terms of sampling resolution and precision for different uses of the water isotope data, such as the estimation of the diffusion length, the direct interpretation of the time-series and the interpretation of the time-series after it has been deconvolved. We do this theoretically, based on how we model diffusion, and empirically through simulations of surrogate ice core records. Our findings can provide guidance on how to process new deep ice cores such as the Oldest Ice Core record.

How to cite: Shaw, F., Dolman, A., Kunz, T., Gkinis, V., and Laepple, T.: Optimal sampling resolution for water isotope records in ice cores, EGU General Assembly 2023, Vienna, Austria, 23–28 Apr 2023, EGU23-8369, https://doi.org/10.5194/egusphere-egu23-8369, 2023.

EGU23-9346 | ECS | Posters on site | CL1.5

Analysis of organic aerosol markers and chiral compounds in an ice core from the Siberian Altai using UHPLC-HRMS 

Johanna Schäfer, Francois Burgay, Thomas Singer, Margit Schwikowski, and Thorsten Hoffmann

The assessment of global warming and its far-reaching influences on our planet necessitates reliable and accurate climate models. For this purpose, past atmospheric conditions like aerosol composition must be studied to understand their influence on the Earth’s climate. Ice cores are valuable climate archives that preserve organic compounds from atmospheric aerosols, which can be utilized as marker species for their respective emission sources.

Secondary organic aerosols (SOAs) are formed in the atmosphere by the oxidation of volatile organic compounds (VOCs), which can be either of anthropogenic or biogenic origin. The most common precursors of SOAs are monoterpenes, which are naturally emitted by vegetation in large amounts. Furthermore, organic compounds formed during biomass burning events contribute to the aerosol budget and allow the reconstruction of paleo-fire activity. Of great interest as a marker species is the anhydrosugar levoglucosan, which is formed during the combustion of cellulose. In addition to its combustion products, intact polymeric lignin, digested via alkaline oxidative degradation, can provide information about the type of vegetation which it originated from. A large variety of these markers were analyzed in an ice core extracted from the Belukha glacier located in the Altai region of Southern Siberia covering a time span of three centuries. A sample preparation method including multiple solid phase extractions and UHPLC-HRMS analysis was employed.

Chiral compounds have the same molecular formula and atom connectivity but act like mirror images of each other. In most environmental studies, no distinction is made between these so-called enantiomers. However, chirality can affect chemical and physical properties and thus influence particle formation reactions in the atmosphere. The enantiomeric ratio of a chiral compound can also further elucidate possible emission sources. Here we present the first chiral analysis of monoterpene oxidation products in ice cores and thus on a long-term scale. For this purpose, a multiple heartcut two-dimensional liquid chromatography method (mLC-LC) was developed that allows the simultaneous determination of the enantiomeric ratios of the monoterpene oxidation products cis-pinic acid and cis-pinonic acid in complex ice core samples. This novel method was successfully applied to Belukha ice core samples.

How to cite: Schäfer, J., Burgay, F., Singer, T., Schwikowski, M., and Hoffmann, T.: Analysis of organic aerosol markers and chiral compounds in an ice core from the Siberian Altai using UHPLC-HRMS, EGU General Assembly 2023, Vienna, Austria, 23–28 Apr 2023, EGU23-9346, https://doi.org/10.5194/egusphere-egu23-9346, 2023.

EGU23-10179 | Posters on site | CL1.5

Isotope diffusion in ice enhanced by vein-water flow 

Felix Ng

Diffusive smoothing of signals on the water stable isotopes in ice sheets limits the climatic information retrievable from these ice-core proxies. Previous theories explained how, in polycrystalline ice below the firn, fast diffusion in the network of intergranular water veins short-circuits the slow diffusion in crystal grains to cause “excess diffusion”, enhancing the signal smoothing rate above that implied by self-diffusion in ice monocrystals. However, the controls of excess diffusion remain poorly understood. I show that vein-water flow amplifies excess diffusion, by altering the three-dimensional field of isotope concentrations and isotope transfer between the veins and crystals. The rate of signal smoothing depends not only on temperature, vein and grain sizes, and signal wavelength, but also on vein-water flow velocity, which can increase the rate by 1 to 2 orders of magnitude. This modulation can significantly impact signal smoothing at ice-core sites in Greenland and Antarctica, as demonstrated by simulations for the GRIP and EPICA Dome C sites, which show sensitive modulation of their diffusion-length profiles when vein-water flow velocities reach ~ 101–102 m yr–1. Thus vein-flow mediated excess diffusion may help explain the mismatch between modelled and spectrally-derived diffusion lengths in other ice cores. I also show that excess diffusion biases the spectral estimation of diffusion lengths from isotopic signals and the reconstruction of surface temperature from diffusion-length profiles. These findings caution against using the single-crystal isotopic diffusivity to represent the bulk-ice diffusivity. The need to predict excess diffusion in ice cores calls for extensive study of isotope records for its occurrence and better understanding of vein-scale hydrology in ice sheets.

How to cite: Ng, F.: Isotope diffusion in ice enhanced by vein-water flow, EGU General Assembly 2023, Vienna, Austria, 23–28 Apr 2023, EGU23-10179, https://doi.org/10.5194/egusphere-egu23-10179, 2023.

EGU23-10308 | ECS | Orals | CL1.5 | Highlight

New ice core proxy for reconstructing past wind variability in the Atlantic sector of the Southern Hemisphere Westerly Wind belt 

Dieter Tetzner, Elizabeth Thomas, and Claire Allen

The Southern Hemisphere Westerly Winds play a critical role in the global climate system by modulating the upwelling and the transfer of heat and carbon between the atmosphere and the ocean. Since observations started, the core of the westerly wind belt has increased in strength and has contracted towards Antarctica. It has been proposed that these deviations are among the main drivers of the observed widespread warming in West Antarctica. However, the lack of long-term wind records in the Southern Hemisphere mid-latitudes hinders our ability to assess the wider context of the recently observed changes.

Here, we present the diatom record preserved in an ice core retrieved from the Ellsworth Land region, West Antarctica. The diatom abundances and species assemblages from this ice core represent the regional variability in wind strength and atmospheric circulation patterns over the Atlantic sector of the Southern Ocean. We use this novel proxy to produce an annual reconstruction of winds in the Atlantic sector of the Southern Hemisphere Westerly Wind belt over the last 300 years. This wind reconstruction allows tracking changes in the strength and position of the westerly winds during the late Little Ice age and exploring the link between the recent increase in wind strength, greenhouse gases and ozone depletion in the atmosphere.

How to cite: Tetzner, D., Thomas, E., and Allen, C.: New ice core proxy for reconstructing past wind variability in the Atlantic sector of the Southern Hemisphere Westerly Wind belt, EGU General Assembly 2023, Vienna, Austria, 23–28 Apr 2023, EGU23-10308, https://doi.org/10.5194/egusphere-egu23-10308, 2023.

EGU23-11819 | ECS | Posters virtual | CL1.5

Greenhouse gas (CO2, CH4) alteration in shallow ice at Larsen blue-ice area, Northern Victoria Land, East Antarctica 

Giyoon Lee, Jinho Ahn, Ikumi Oyabu, Kajal Kumari, and Kenji Kawamura

CO2 and CH4 records from polar ice cores have greatly enhanced our understanding of the control mechanisms of atmospheric greenhouse gas (GHG) concentrations and their relationship to surface temperature. However, multiple ice cores show offsets of 1–3 % and concerns about in situ production in trapped air were raised. Recently, GHGs in shallow ice cores from blue-ice areas (BIAs) in Antarctica show excess CO2 and CH4 concentration values and even extremely lower CH4 concentration than other non-contaminated ice core records at the same gas ages. We aim to decipher the processes of GHG production and CH4 destruction in the shallow ice at Larsen BIA. CH4 concentration records from the Larsen BIA generally show an increasing trend from the subsurface to a depth of ~0.35–1.15 m. Then gradually decreases until it reaches the true ancient atmospheric CH4 values at ~4.6 m depth. In contrast, CO2 concentration in the Larsen blue ice shows a gradual decrease from the subsurface until a depth of ~4.6 m where the concentration variation stabilizes, but still has a 10–20 ppm difference with other existing non-contaminated ice core records. These alterations might be due to mixing with modern air through cracks and/or microbial activity inside the occluded air bubbles. The vertical distribution of δ15N-N2 in several Larsen BIA ice cores indicates that alteration by modern atmospheric air is not significant at the top ~10 m. Depleted δ18Oatm in a depth of ~0.15–1.65 m might indicate in situ microbial activity consuming O2 gas in Larsen blue ice samples, but δ18Oatm values in a depth of 1.95–10 m might indicate little microbial activity. Our future study may include analysis of Pb concentration and isotopes to investigate the effect of modern aerosol intrusion. In addition, we may measure CH4 concentration in ice after receiving UV light in order to check whether UV photolysis is included in the mechanism for CH4 destruction.

How to cite: Lee, G., Ahn, J., Oyabu, I., Kumari, K., and Kawamura, K.: Greenhouse gas (CO2, CH4) alteration in shallow ice at Larsen blue-ice area, Northern Victoria Land, East Antarctica, EGU General Assembly 2023, Vienna, Austria, 23–28 Apr 2023, EGU23-11819, https://doi.org/10.5194/egusphere-egu23-11819, 2023.

EGU23-12369 | ECS | Orals | CL1.5

Lagrangian modeling used for improving ice core interpretation 

Andreas Plach, Sabine Eckhardt, Ignacio Pisso, Joseph R. McConnell, and Andreas Stohl

Atmospheric transport modeling with the Lagrangian Particle Dispersion Model (LPDM) FLEXPART has been used for the interpretation of ice core records in several studies in the recent past. Here we present (1) the methodology and results of a study looking into the historical black carbon (BC) emissions based on inverse modeling of ice core records, (2) discuss preliminary results and further plans for a similar study looking into the historical sulphur dioxide (SO2) emissions, (3) and give a short overview of other ice core studies using FLEXPART simulations.

Both, BC and SO2 emissions, are caused by anthropogenic as well as natural processes, e.g., (incomplete) combustion of fossil fuels / biomass and volcanic eruptions. And, both negatively influence our health and environment, e.g., causing premature mortality, lowering surface albedo, producing acid rain. However, both species also act as climate forcers, and therefore an accurate knowledge of past BC/SO2 emissions is essential to quantify and model associated global climate forcing. Nowadays, commonly used bottom-up BC/SO2 emission inventories for historical Earth System Modeling (ESM), e.g., for the Coupled Model Intercomparison Project Phase 5 / Phase 6 (CMIP5/CMIP6) are poorly constrained by observations prior to the late 20th century.

In a recent study, we revisit and evaluate these historical 1850 to 2000 BC emission inventories used for ESM simulations, based on an array of deposition ice core records, Lagrangian atmospheric modeling with the FLEXPART model, and an objective inversion technique in order to bring the spatial-temporal patterns of emission inventories in accordance with observed deposition at the ice core sites. We find substantial discrepancies between our reconstructed BC emissions and the existing bottom-up inventories which do not fully capture the complex spatial-temporal BC emission patterns. Our findings imply changes to existing historical BC radiative forcing estimates are necessary, with potential implications for observation-constrained climate sensitivity.

How to cite: Plach, A., Eckhardt, S., Pisso, I., McConnell, J. R., and Stohl, A.: Lagrangian modeling used for improving ice core interpretation, EGU General Assembly 2023, Vienna, Austria, 23–28 Apr 2023, EGU23-12369, https://doi.org/10.5194/egusphere-egu23-12369, 2023.

EGU23-12385 | Posters on site | CL1.5 | Highlight

Recent heavy metal pollution from the territory of the former Soviet Union (FSU) – ice core records and emission estimates 

Anja Eichler, Petr Nalivaika, Theo Jenk, Thomas Singer, Sergey Kakareka, Tamara Kukharchyk, Stella Eyrikh, Tatjana Papina, Andreas Plach, and Margit Schwikowski

Atmospheric heavy metal pollution caused by metal smelting, mining, waste incineration and fossil fuel combustion presents a significant issue for human health and the environment. Anthropogenic emissions from the territory of the former Soviet Union (FSU) considerably influenced atmospheric concentrations of heavy metals. However, due to scarce monitoring data and fragmentary reporting, emissions quantities from this region are not well-known and it is even unclear if emissions decreased or increased after collapse of the Soviet Union. This is underlined by the fact that existing ice-core records and emission estimates based on national inventories for the FSU reveal an opposing trend for the most recent ~30 years. 

Here we present new records of post-Soviet Union anthropogenic heavy metal  emissions (Bi, Cd, Cu, Pb, Sb, Zn) derived from three ice cores; from the Mongolian Altai (Tsambagarav ice core, period 1710-2009 AD) and the Siberian Altai (two Belukha ice cores, period 1680-2018 AD), covering a large regional footprint of emissions. The major source region of air pollution arriving at the Altai is primarily the territory of the FSU except for the eastern-most Siberian parts. Heavy metal concentrations at ultra-trace levels in the studied ice cores were analysed using inductively coupled plasma sector-field mass spectrometry (ICP-SF-MS). These records were complemented with new heavy metal emission estimates based on the available inventory data (1975-2015 AD) to derive a robust reconstruction of recent FSU heavy metal emissions. Consistent with the emission estimates, ice-core concentrations of Cd, Cu, Pb, Sb, Zn during the 2010s correspond to 20-40% of the maximum values in the 1970s and are comparable to their 1940s-1950s levels. A similar magnitude was also estimated for the decrease in Bi between 1975 and 2015, however, ice-core concentrations do not show a substantial downward trend.

How to cite: Eichler, A., Nalivaika, P., Jenk, T., Singer, T., Kakareka, S., Kukharchyk, T., Eyrikh, S., Papina, T., Plach, A., and Schwikowski, M.: Recent heavy metal pollution from the territory of the former Soviet Union (FSU) – ice core records and emission estimates, EGU General Assembly 2023, Vienna, Austria, 23–28 Apr 2023, EGU23-12385, https://doi.org/10.5194/egusphere-egu23-12385, 2023.

EGU23-12653 | ECS | Orals | CL1.5

Characterisation of multi-scale deformation in NEGIS from microstructure analysis of the EastGRIP ice core 

Johanna Kerch, Kyra Streng, Nicolas Stoll, Jan Eichler, Julien Westhoff, Daniela Jansen, Paul Bons, and Ilka Weikusat

We present the results from a microstructural analysis of more than 1000 thin section samples from the East Greenland Ice Core Project (EastGRIP) ice core that is being drilled at the onset of the fast-flowing North East Greenland Ice Stream (NEGIS) since 2017, focusing on the grain boundary network and bubbles.

The data were recorded directly at the drilling site with a Large Area Scanning Macroscope from the polished and sublimated surface of samples from between 0 and 2121 m ice depth. Most samples are cut vertically, along the core axis, but a selected number of perpendicular vertical and horizontal sections from volume samples are included, providing the opportunity to deduce the three-dimensional microstructure in these depths. Processing of the image data was done with the open source software Ice Microstructure Analyser, extracting a fully digitalized grain boundary network by applying machine learning for the classification of grain boundaries and air inclusions.

We analysed the shape-preferred orientation (SPO) of grains and bubbles based on statistically computed parameters from the data set under consideration of available azimuthal core-orientation data reconstructed from visual stratigraphy data. These SPO parameters include grain size distribution, grain shape and derived measures like perimeter ratio and aspect ratio, and grain boundary orientation angle.

The data show varying trends throughout the core and on different length scales, supporting and complementing earlier observations in the crystallographic-preferred orientation data from the same set of samples. We provide microstructural evidence for dynamic recrystallisation driven by deformation throughout the core. Specifically, we will discuss our findings of heterogeneities that point to internal deformation due to the occurrence of high strain localisation and link them to the observed complex pattern of anisotropy in the ice column.

How to cite: Kerch, J., Streng, K., Stoll, N., Eichler, J., Westhoff, J., Jansen, D., Bons, P., and Weikusat, I.: Characterisation of multi-scale deformation in NEGIS from microstructure analysis of the EastGRIP ice core, EGU General Assembly 2023, Vienna, Austria, 23–28 Apr 2023, EGU23-12653, https://doi.org/10.5194/egusphere-egu23-12653, 2023.

EGU23-14208 | Posters on site | CL1.5

Optimal coring locations for high resolution climate reconstructions from the East Antarctic Plateau 

Thomas Laepple, Remi Dallmayr, Maria Hörhold, Nora Hirsch, Daniela Jansen, Melanie Behrens, Thomas Münch, and Johannes Freitag

Oxygen isotopes of snow, firn, and ice cores provide valuable information on past climate variations. Yet, multiple processes, such as stratigraphic noise and the advection of spatial isotope variations linked to topographic anomalies create non-climatic variations (‘noise’) in the ice-core record and limit the quality of high-resolution climate reconstructions. All of these processes are site specific and vary depending on the environmental conditions at and around the ice-core location.  In the last years, based on field studies, numerical experiments and theoretical considerations, we improved our quantitative understanding of these noise generating processes and their dependency on the depositional conditions. Building on this work, we here ask the question how the potential quality of ice-core based climate reconstructions depends on the drilling site location.  Making use of digital elevation models,  ice flow-velocity maps and statistical relationships between the surface topography, accumulation anomalies,  isotopic anomalies and stratigraphic noise, we predict the site and time-scale dependent noise contribution to ice-core records of the last millennium. The created maps provide a step towards choosing optimal ice coring and  sampling locations for high-resolution climate reconstructions from Antarctic ice-cores and provide testable predictions for the quality of future ice-core records.


How to cite: Laepple, T., Dallmayr, R., Hörhold, M., Hirsch, N., Jansen, D., Behrens, M., Münch, T., and Freitag, J.: Optimal coring locations for high resolution climate reconstructions from the East Antarctic Plateau, EGU General Assembly 2023, Vienna, Austria, 23–28 Apr 2023, EGU23-14208, https://doi.org/10.5194/egusphere-egu23-14208, 2023.

EGU23-14700 | Posters on site | CL1.5

On the importance of atmosphere-snow humidity exchange for the climate signal stored in the snow isotopic composition 

Hans Christian Steen-Larsen, Laura Dietrich, Sonja Wahl, Michael Town, Abigail Hughes, Maria Hoerhold, Alexandra Zuhr, Melanie Behrens, Xavier Fettweis, and Martin Werner

Research over the last five years dedicated to identifying and quantifying the processes responsible for driving the climate signal in the isotopic composition of the snow have documented the role of the humidity exchange between the snow and atmosphere in changing the initial precipitation isotopic composition. Laboratory and field experiments combined with direct vapor isotope flux measurements have shown that not only does the depositional flux changes the surface snow isotopic composition, but sublimation from the snow surface induces isotopic fractionation leading to changes in the snow isotopic composition. Thus, it was shown that for the EastGRIP ice core location, including fractionation during sublimation, atmosphere-snow exchange processes explain between 35 and 50 % of the day-to-day variations in the snow surface signal when no precipitation occurs.

Until recently, it was unknown on which time scales these surface exchange processes are important for the isotope signal.

Here we combine direct accumulation and eddy-covariance humidity flux measurements with high resolution regional climate model simulations. Focusing on the EastGRIP ice core site, we find that during the summer season up to 40% of the accumulation is sublimated and about 10% is re-deposited. Such relative high fluxes compared to the amount of precipitated snow would naturally lead to an influence of the seasonal isotopic composition of the snow.

By combining outputs from an isotope-enabled general circulation model (ECHAMwiso) and a regional polar climate model (MAR) with the SNOWISO exchange and snowpack model, we find that the influence on the snowpack isotopic composition is not only isolated to the summer isotope signal but influences the full seasonal cycle. In fact, we find that that the atmosphere-snow exchange influence on the annual mean isotopic composition results in a significant bias in the source region condition deduced from the isotopic composition of the ice core.

How to cite: Steen-Larsen, H. C., Dietrich, L., Wahl, S., Town, M., Hughes, A., Hoerhold, M., Zuhr, A., Behrens, M., Fettweis, X., and Werner, M.: On the importance of atmosphere-snow humidity exchange for the climate signal stored in the snow isotopic composition, EGU General Assembly 2023, Vienna, Austria, 23–28 Apr 2023, EGU23-14700, https://doi.org/10.5194/egusphere-egu23-14700, 2023.

EGU23-14843 | ECS | Orals | CL1.5

New climate records from Sherman Island and insights into coastal West Antarctic climate variability over the last 1000 years 

Isobel Rowell, Robert Mulvaney, Dieter Tetzner, Liz Thomas, Mackenzie Grieman, Carlos Martin, Helena Pryer, Julius Rix, and Eric Wolff

The West Antarctic Ice Sheet (WAIS) is vulnerable to retreat as a result of climate change and has the potential to contribute several metres to global sea level in the coming centuries. Glaciers flowing into the Amundsen Sea, in particular the Thwaites and Pine Island Glaciers, are undergoing accelerated mass loss. Ice core records from the Amundsen coast in this region are lacking and WAIS cores typically extend back in time from a few decades, up to approximately 300 years before present. Here we present new climate records from Sherman Island, located in the Abbott Ice Shelf and close to Pine Island and Thwaites. These records extend to greater than 1000 years before present, more than doubling the length of existing coastal WAIS records. Trends in stable water isotopes are compared with proximal cores to set the Sherman Island data into a regional spatial context over the last few hundred years. We find that Sherman Island demonstrates no overall trend in stable water isotope ratios or in accumulation rate over the last 50 to 100 years, in contrast to other sites, and we relate this finding to previously identified changes in the Southern Annular Mode and Amundsen Sea. We investigate atmospheric transport to the site using reanalysis data and records of chemical impurities in the Sherman Island samples. The data present an exciting and significant new contribution to palaeoclimatic datasets and reconstructive efforts including the PAGES-2k network. Importantly, taken together the records from this unique site will help to set the current changes in this highly vulnerable sector of the WAIS into the context of the last millennium. 

How to cite: Rowell, I., Mulvaney, R., Tetzner, D., Thomas, L., Grieman, M., Martin, C., Pryer, H., Rix, J., and Wolff, E.: New climate records from Sherman Island and insights into coastal West Antarctic climate variability over the last 1000 years, EGU General Assembly 2023, Vienna, Austria, 23–28 Apr 2023, EGU23-14843, https://doi.org/10.5194/egusphere-egu23-14843, 2023.

EGU23-14910 | ECS | Posters on site | CL1.5

Interlaboratory Calibration for Laser Ablation of Ice Cores 

Lela Gadrani, Andrei V. Kurbatov, Elena Korotkikh, Pascal Bohleber, Paul A. Mayewski, and Michael Handley

We report interlaboratory comparisons of a methodology to measure and calculate concentrations of impurities in ice core samples using the Laser Ablation-Inductively Coupled Plasma-Mass Spectrometry (LA-ICP-MS) system developed at the W. M. Keck Laser Ice Facility at the Climate Change Institute, University of Maine (UMaine). Here, we will summarize results of measured artificial samples with known levels of  Ca, Al, Fe, Mg, Na, Cu, Pb. We adapted a method for LA-ICP-MS analysis of the frozen standard that was developed in the laboratory at Ca’ Foscari University of Venice, and we tested its applicability to the UMaine system. This work will help to measure and interpret very old and highly compressed ice core records from the Allan Hills Blue Ice Area, Antarctica, sampled with different analytical tools.  

How to cite: Gadrani, L., Kurbatov, A. V., Korotkikh, E., Bohleber, P., Mayewski, P. A., and Handley, M.: Interlaboratory Calibration for Laser Ablation of Ice Cores, EGU General Assembly 2023, Vienna, Austria, 23–28 Apr 2023, EGU23-14910, https://doi.org/10.5194/egusphere-egu23-14910, 2023.

EGU23-15249 | ECS | Posters on site | CL1.5

Investigating two possible schemes of Laser Ablation – Cavity Ring Down Spectrometry for water isotope measurements on ice cores 

Eirini Malegiannaki, Vasileios Gkinis, Simon Alexander Munk Wael Fassel, Daniele Zannoni, Giuliano Dreossi, Barbara Stenni, Hans Christian Steen-Larsen, Pascal Bohleber, Carlo Barbante, and Dorthe Dahl-Jensen

Thinning of the deep ice core layers must be considered when the water isotopic composition of the Oldest Ice Core is to be analyzed. From an experimental point of view, a novel instrument combining a micro-destructive cold femtosecond - Laser Ablation (LA) sampling system, that provides high spatial resolution together with minimal usage of ice sample, and a Cavity Ring Down Spectrometer is being built for high-quality water isotope measurements. Laser ablation results in crater formation and its morphology depends on the laser parameters used. Optical images that show crater morphology under different experimental conditions allow crater characterization towards an efficient cold LA sampling. An ablation chamber and a transfer line are both the connecting parts between the LA system and the CRDS instrument. They are to be designed and constructed in the optimal size and shape to collect the ablated mass and guarantee its smooth delivery to the CRDS analyzer with minimum disturbance. 

Coupling a Laser Ablation system with a CRDS analyzer has already been achieved using a laser operating at the nanosecond regime and a cryo-cell as the ablation chamber. Comparison of the two Laser Ablation systems, by the means of ice sampling and collection of the ablated material, will be of great importance to understand the ablation mechanism and post-ablation processes on ice and further develop a system dedicated to water isotope measurements. 

How to cite: Malegiannaki, E., Gkinis, V., Munk Wael Fassel, S. A., Zannoni, D., Dreossi, G., Stenni, B., Steen-Larsen, H. C., Bohleber, P., Barbante, C., and Dahl-Jensen, D.: Investigating two possible schemes of Laser Ablation – Cavity Ring Down Spectrometry for water isotope measurements on ice cores, EGU General Assembly 2023, Vienna, Austria, 23–28 Apr 2023, EGU23-15249, https://doi.org/10.5194/egusphere-egu23-15249, 2023.

EGU23-1312 | ECS | Posters on site | SSP1.5

Analyses of Heatwaves in Observational and Modelled Data for Africa 

Katrin Ziegler, Daniel Abel, Torsten Weber, Lorenz König, and Heiko Paeth

The WASCAL WRAP2.0 project LANDSURF aims to calculate and compare different climatological and agrometeorological indices to support stakeholders and farmers in adapting to climate change and its impact in Africa.

This study, which was conducted in the framework of LANDSURF, focuses on the number and duration of heatwaves as rising temperature and resulting heat were found to limit crop yield and thus lower food security in different African regions. We calculated the heat wave duration index (HWDI) for reanalysis data, three regional climate models (RCMs) (REMO2015, RegCM4-7, and CCLM5-0-15) from CORDEX CORE, and their respective forcing data to validate the models over a historical climatological period (1981-2010) and investigate the change of the HWDI for three climatologies of the near-, mid-, and long-term future until 2100 using the two Representative Concentration Pathways (RCPs) 2.6 and 8.5.

How to cite: Ziegler, K., Abel, D., Weber, T., König, L., and Paeth, H.: Analyses of Heatwaves in Observational and Modelled Data for Africa, EGU General Assembly 2023, Vienna, Austria, 23–28 Apr 2023, EGU23-1312, https://doi.org/10.5194/egusphere-egu23-1312, 2023.

EGU23-1586 | Orals | SSP1.5 | Highlight

When the desert was a lake: Tectonics, climate, river piracy and hominids in the Kalahari 

Liviu Giosan, Juan Pablo Canales, Sarah Ivory, Zhixiong Shen, Cindy De Jonge, Timothy Eglinton, Julie Lattaud, Nicole Russo, Negar Haghipour, Florin Filip, Nitesh Khonde, Andrew Carter, Eduardo Garzanti, Sergio Ando, Fulvio Franchi, Koobakile Kgosiemang, Sallie Burrough, David Thomas, Read Mapeo, and Kebabonye Laletsang and the OKAMAK Extended Team

The Okavango rift zone/delta and the Makgadikgadi paleo-megalake form a dynamic system in northern Kalahari, where tectonic activity, climate change, sedimentation, and biota have interacted in a complex pattern. Previous research suggested that the region may have been a hotspot for hominid evolution.

Here we present results from the first scientific deep drilling project (OKAMAK) in the northern Kalahari, Botswana. Two drill cores, OKA (230 meters) and MAK (210 m), were drilled in the Okavango delta and Makgadikgadi paleolake. Cores recovered shallow and deep-water sands, muds and evaporitic lithologies of the Cenozoic Kalahari Group extending across the unconformity into the Cretaceous/Jurassic Karoo Group sandstones.

We discuss initial stratigraphy, chronologies and paleoenvironmental information for this novel sedimentary record, present hypotheses to be tested on the complex climate of the region, history of river piracy, evolution of the delta and infilling phases of Makgadikgadi and assess the international collaborative potential of this yet to be fully understood region within a future multi-platform ICDP-IODP initiative.

How to cite: Giosan, L., Canales, J. P., Ivory, S., Shen, Z., De Jonge, C., Eglinton, T., Lattaud, J., Russo, N., Haghipour, N., Filip, F., Khonde, N., Carter, A., Garzanti, E., Ando, S., Franchi, F., Kgosiemang, K., Burrough, S., Thomas, D., Mapeo, R., and Laletsang, K. and the OKAMAK Extended Team: When the desert was a lake: Tectonics, climate, river piracy and hominids in the Kalahari, EGU General Assembly 2023, Vienna, Austria, 23–28 Apr 2023, EGU23-1586, https://doi.org/10.5194/egusphere-egu23-1586, 2023.

Tectonic activity impacts the environment and identifying the influence of active faulting on environmental factors, such as vegetation growth and soil formation patterns, is valuable in better understanding ecosystem functions. We applied remote sensing techniques to illustrate how tectonic activity and lithology of bedrock influence temporal and spatial patterns of vegetation and soil parameters in a climatically sensitive, fault-controlled river basin in the Kenya-Tanzania transboundary region.

The Mara River Basin lies in a region of previously unrecognised tectonic activity, characterised by subrecent extensional faulting along the Utimbara and Isuria faults. Faulting leads to spatially variable erosion and soil formation rates as well as disruption and modification of drainage systems. All these factors might be expected to exert controls on ecosystem dynamics on a range of lengths and timescales. We investigate tectonic controls on ecological processes in the Mara River Basin using a combination of geospatial mapping and multispectral image analysis. To map fault structures and to reveal signs of recent tectonic activity along the Utimbara and Isuria faults, we use high-resolution digital elevation models derived from 12m TanDEM-X data. To investigate spatiotemporal vegetation patterns and soil formation, we use a 5-year Normalised Difference Vegetation Index (NDVI) time-series, Clay Mineral Ratio (CMR) and Moisture Stress Index (MSI) derived from Sentinel 2 data. 

Whilst lithology does exert some control on ecological properties, we also observe that the downthrown hanging wall of the faults, especially directly adjacent to the escarpment, is consistently associated with a higher degree of vegetation, wetland formation and clay distribution. Analysis of spectral indices shows that the overall spatial pattern of vegetation cover is seasonally low in the flat plains and perennially high in the vicinity of more complex, tectonically influenced structures. The NDVI highlights several locations with permanently healthy vegetation along the escarpment which extend downslope for several kilometres. Our study shows that in the Mara River Basin, active normal faulting is an important stabiliser of vegetation growth patterns. We interpret this effect to be caused by favourable hydrological and pedological conditions along the escarpments and tectonically induced structures such as subrecent surface ruptures and a series of small, fault-bounded alluvial fans exposing systematically high vegetation and clay values. This implies that tectonic activity has a direct beneficial influence on ecological processes in this climatically sensitive region. As future climate change in the area is expected to lead to accelerated habitat desiccation and deterioration of vegetation quality, suitable habitats for wildlife will progressively reduce and will likely be limited to tectonically active locations. Long-term insights into tectonic processes and the interplay between geology and soils can thus be useful for recent and future ecosystem management since the understanding of an area from a geological perspective can complement the understanding of other natural processes within it.

How to cite: Ludat, A. L. and Kübler, S.: The influence of tectonic surface faulting on vegetation growth and soil formation of the Mara River Basin, East Africa, EGU General Assembly 2023, Vienna, Austria, 23–28 Apr 2023, EGU23-1589, https://doi.org/10.5194/egusphere-egu23-1589, 2023.

The study of the ancient anthropological sites of the Levantine Corridor is very significant for understanding the evolution of ancient hominins and the time of their dispersal from East Africa to the Caucasus and Eurasia (Eppelbaum and Katz, 2022a). In such geologically complex regions as the northern Levantine Corridor (in the area of ​​development of the Dead Sea Transform's pluvial basins in the Eastern Mediterranean), the application of single Earth Science methods, as a rule, is ineffective. Therefore, we analyzed in detail, for the first time, an integrated geological-geophysical data set: paleomagnetic correlation, magnetostratigraphy, and paleomagnetic and paleogeographic mapping (considering radiometric data) (e.g., Eppelbaum and Katz, 2022b), event, cyclic and eco-stratigraphy, lithological-facies analysis, and tectonic-geodynamic constructions with the attraction of the hydrospheric disturbances' data. One of the most important sites is the multi-layered site of 'Ubeidiya, located in the Kinnarot Basin. The age of this site was reviewed several times and is now determined as 1.6-1.2 Ma. Based on the numerous geological-paleomagnetic data analysis, the first integrated structural-paleomagnetic-event stratigraphic chart of the northern Levantine ancient hominin sites was developed. The results of the paleomagnetic mapping of the Sea of Galilee, Kinnarot, and Hula basins were used to construct the first palinspastic map for this region (for the period of 3.6 – 2.0 Ma). This map unmasked the tectonic-magmatic evaluation of this area and confirmed our assumption that the 'Ubeidiya Formation belonged to the Gelasian. It has been shown that the correlation of the 'Ubeidiya Formation with the Lower Matuyama Chron (C2r) is most likely correct than with its upper part (close in location to the strata with artifacts from the Evron quarry (Israel)). The correlation with the excellent radiometrically and paleomagnetically dated Zarqa section (western Jordan) (2.52 - 1.98 Ma) testifies that the 'Ubeidiya section most likely cannot be younger than this rock series. First, it follows from the event-stratigraphic and paleomagnetic correlation characteristics. The event-stratigraphic and rhythm-stratigraphic analyses indicate that the 'Ubeidiya and Erq El-Ahmar (Israel) formations do not contain a significant break and form a single sequence of the lacustrine-alluvial cycles of the Gauss and Matuyama Chrons. The analysis of finds of marine foraminifers confirms the paleogeographic relationship between the fluvial-lacustrine stratum (formation) of 'Ubeidiya and the transgressive Middle Akchagylian-Gelasian marine basin located nearby. Thus, the multifactor geological-geophysical analysis indicated that the ages of the most ancient archaeological sites of 'Ubeidiya and Zarqa correspond to the extremum of the Middle Akchagylian-Gelasian hydrospheric maximum (2.6–1.9 Ma) in contrast to the earlier suggested Middle Calabrian (1.6–1.2 Ma) age of the 'Ubeidiya site. The new proposed age may require revising the global process of dispersing hominins from Africa to the north.

References

Eppelbaum, L.V. and Katz, Y.I., 2022a. Combined Zonation of the African-Levantine-Caucasian Areal of Ancient Hominin: Review and Integrated Analysis of Paleogeographical, Stratigraphic and Geophysical-Geodynamical Data. Geosciences (Switzerland), 27, No. 1, 1-23.

Eppelbaum, L.V. and Katz, Y.I., 2022b. Paleomagnetic-geodynamic mapping of the transition zone from ocean to the continent: A review. Applied Sciences, 12, Advances in Applied Geophysics, 1-20.


How to cite: Eppelbaum, L. and Katz, Y.: Combined paleomagnetic, paleogeographic, and event stratigraphy studies increase the age of the anthropological site 'Ubeidiya in the Levantine Corridor (northern Israel) by 1.0 Ma, EGU General Assembly 2023, Vienna, Austria, 23–28 Apr 2023, EGU23-1598, https://doi.org/10.5194/egusphere-egu23-1598, 2023.

EGU23-2109 | ECS | Orals | SSP1.5

Response of benthic foraminiferal assemblages off NW Africa to climate change during the past 27.000 years 

Sofía Barragán-Montilla, Stefan Mulitza, Heather J. Johnstone, and Heiko Pälike

Benthic foraminifera (BF) typically constitute around 50% of the eukaryotic biomass of seafloor environments and are excellent recorders of bottom water environmental and geochemical changes in the past. In the last 27.000 years, major climatic oscillations including the Heinrich Stadial 1 (HS1), Bølling–Allerød (B-A) and Younger Dryas (YD) shaped the climate of a big part of the northern hemisphere. Although the response of the ocean surface to these events is well documented, information about the response of benthic ecosystems is still limited.

To better understand how BF responded to major climatic shifts in the last 27.000 years, we analyzed the benthic foraminifera content from core GeoB9512-5 (15°29.90'N/17°56.88'W, 793 m water depth) off NW Africa. Our high-resolution sediment record covers the last 27.000 years of the eastern North Atlantic, including the Heinrich Stadial 2 (HS2), Last Glacial Maximum (LGM), HS1, B-A and YD.

Taxonomic and quantitative analyses were used to reconstruct changes in bottom water oxygenation and organic matter fluxes and show that BF assemblages shifted in coincidence with the major climatic periods documented for the North Atlantic. After the LGM, Bottom water salinity, oxygenation and quantity/quality of organic matter played a major role in BF distribution and are linked to transient changes in BF diversity in the last 27.000 years.

The LGM showed no major diversity changes for thousands of years, while BF distribution shifted rapidly during HS1, B-A and YD. Low-diversity intervals during the HS1, B-A and the last 6.000 years are typically dominated by stress species in times of oxygen decrease and high organic matter content at bottom waters. These short intervals (typically lasting 500-1300 years) are commonly intercalated by low-duration high-diversity periods, associated with higher bottom water oxygenation and relatively lower organic matter content. Additionally, relatively abundant porcelaneous BF during HS1, LGM and HS1 indicate relatively higher salinity than the observed in the last 14.000 years.

Our results show that BF at intermediate depths at the NE Atlantic off NW Africa are strongly influenced by changes in bottom water paleoenvironmental conditions potentially linked to major climatic events. Bottom water oxygenation played a major role in BF diversity, observed by alternating low-diversity periods in times of low oxic conditions and high-diversity intervals in high oxic bottom waters. At the same time, bottom water salinity favored porcelaneous BF distribution during LGM and HS1 times and increasing hyaline-calcareous BF show decreased salinity in this part of the NE Atlantic after the end of the HS1.

How to cite: Barragán-Montilla, S., Mulitza, S., Johnstone, H. J., and Pälike, H.: Response of benthic foraminiferal assemblages off NW Africa to climate change during the past 27.000 years, EGU General Assembly 2023, Vienna, Austria, 23–28 Apr 2023, EGU23-2109, https://doi.org/10.5194/egusphere-egu23-2109, 2023.

The environmental and living conditions of a region are shaped by its relief, geology and climate, and control factors like hydrology and soil formation. While long-term climatic fluctuations and associated changes in environmental conditions are commonly viewed as the dominant natural factor in human evolution, the role of geological and pedological processes has so far received little attention. However, it makes a big difference to consider the effects of large-scale environmental changes in a homogeneous "static" landscape or to include the multitude of dynamic landscape factors that can lead to strong local effects with regard to the structure of the landscape and the availability of water and food.

The NE Aegean is a key region of Pleistocene hominin presence at the crossroad between Africa, Asia and Europe situated in a geologically highly unstable region. Rodafnidia, an open-air Lower Paleolithic site on Lesbos, has revealed a unique Acheulean assemblage from excavated fluvio-lacustrine deposits dated between 476 and 164 ka BP. This site and its surrounding region represent a key location to study hominin subsistence and mobility and to investigate potential trans-Aegean migration corridors during Pleistocene sea-level lowstands. Geologically, Rodafnidia is situated on middle Pleistocene fluvial sediments consisting mainly of reworked early Miocene ignimbrites, and Pliocene marly limestones and marls, whereas the wider region is characterized by strong geochemical and pedochemical contrasts including nutritionally depleted soils on ophiolitic rocks, highly productive soils on marshy coastal deposits along the Kalloni Gulf, and a series of fault-controlled thermal sulfur springs at Lisvori and Polichnitos. We hypothesize that the attractiveness of Rodafnidia site for hominin presence was influenced by the local geology and tectonic activity controlling the long-term soil nutritional status of the region. We employ a combined geological-pedological study to unravel the paleoenvironmental conditions of the wider region. Our approach offers, in return, valuable insights into hominin-landscape interaction, relevant to landuse, resource exploitation and dispersal potential.

Our systematic sampling and analysis of rocks, soil and water offers clues to the soil nutritional characteristics of the main lithological units exposed in the wider Rodafnidia area. Results reveal distinct differences in the nutritional status of soils developed on different geological substrates. While volcanic soils in the immediate Rodafnidia region and marshy soils along the coast comprise well-balanced nutritional levels, serpentinite soils dominating the ophiolitic highlands display highly problematic properties such as low Ca/Mg ratios and enhanced heavy metal concentrations. Soils on hot spring deposits are puzzling as they display both beneficial characteristics (high soil organic carbon, high calcium) and potentially harmful enhanced heavy metal levels.

In a pedological context, Rodafinidia is located in a narrow zone of highly productive, nutrient rich soils in a wider region of geologically induced nutrient deficiencies. During sea-level lowstands, hominins along with other continental fauna could have crossed terrestrial passages between western Asia and the Eastern Aegean, and sites like Rodafnidia emerge as likely beneficial locations for hominin subsistence strategies. 

How to cite: Kübler, S., Tsakanikou, P., Galanidou, N., and Iliopoulos, G.: Soil nutritional gradients as long-term proxy for hominin subsistence strategies in geologically dynamic settings: the case of Acheulean Rodafnidia on Lesbos island, NE Aegean, EGU General Assembly 2023, Vienna, Austria, 23–28 Apr 2023, EGU23-3287, https://doi.org/10.5194/egusphere-egu23-3287, 2023.

EGU23-4141 | ECS | Posters on site | SSP1.5

Future projection of the African easterly waves in a high-resolution AGCM 

Jerry Raj, Hamza Kunhu Bangalath, and Georgiy Stenchikov

African Easterly Waves (AEWs) are a significant control of West African rainfall and the associated Mesoscale Convective Systems (MCSs) and squall lines embedded within them. More than 40% of the total MCSs over the region are associated with AEWs and these MCSs account for approximately 80% of the total annual rainfall over the Sahel. Approximately 60% of all Atlantic hurricanes and 80% of major hurricanes have their genesis associated with AEWs. Simulating the features of AEWs, such as their westward propagation off the east Atlantic coast, is challenging for coarse-resolution climate models. In this study, we use High-Resolution Atmospheric Model (HiRAM) to simulate AEWs and analyze their future projections by the end of the 21st century. The simulations are performed globally at a horizontal resolution of 25km. The model uses shallow convective parameterization for moist convection and stratiform cloudiness. Future projections are conducted using representative concentration pathway 8.5. AEWs are separated with respect to their periods as 3–5 and 6–9-day period AEWs, and bandpass filtering is used to filter the waves from the mean flow. HiRAM simulates the structure and propagation of the waves well; however, it tends to overestimate the associated precipitation. In the future, the AEW precipitation and intensity of the circulation will considerably increase. The northward extent of the AEW track also shows a significant increase in the future. Enhanced baroclinic overturning and eddy available potential energy generated due to diabatic heating is also observed in the future.

How to cite: Raj, J., Bangalath, H. K., and Stenchikov, G.: Future projection of the African easterly waves in a high-resolution AGCM, EGU General Assembly 2023, Vienna, Austria, 23–28 Apr 2023, EGU23-4141, https://doi.org/10.5194/egusphere-egu23-4141, 2023.

EGU23-5277 | Orals | SSP1.5 | Highlight

Early Warning Signals for the Termination of the African Humid Period(s) 

Martin H. Trauth, Asfawossen Asrat, Markus L. Fischer, Peter O. Hopcroft, Verena Foerster, Stefanie Kaboth-Bahr, Henry F. Lamb, Norbert Marwan, Mark A. Maslin, Frank Schäbitz, and Paul J. Valdes

The study of the mid-Holocene climate tipping point in tropical and subtropical Africa is the subject of current research, not only because there is a comparatively simple but nonlinear relationship between the change in cause (orbital forcing) and the accelerated response of the monsoon system, but also because the African monsoon is an example of a potentially positive evolution of living conditions for humans: modeling results suggest that the Sahel is expanding northward in the wake of human-induced recent global warming, with green belts spreading northward. New literature distinguishes tipping elements such as the African monsoon according to the nature of the cause and the response of the climate system. Research here focuses primarily on tipping points of the type, which is characterized by a critical slowing down and a decreasing recovery from perturbations. The African monsoon, on the other hand, is an example of the tipping point of the type, which is characterized by flickering before the transition. The two types also differ in the nature of their early warning signals (EWS). These EWS are increasingly becoming the focus of research, as they are particularly important for predicting possible tipping of climate in the future of our planet. For the African monsoon system, flickering between two stable states near the transition has been predicted by modeling, but has not yet been demonstrated on paleoclimate time series.

The paleoenvironmental record from the Chew Bahir Basin in the southern Ethiopian Rift, which documents the climate history of eastern Africa of the past ~620 ka with decadal resolution in some parts provides the possibility to examine the termination of the African Humid Period (AHP, ~15–5 kyr BP) with regard to the possible occurrence of EWS. Thanks to six well-dated short sediment cores (<17 m, <47 kyr BP) and two long cores (~290 m, <620 ka BP) we can not only study the last climate transition at ~5.5 kyr BP in detail, but also similar transitions including possible EWS long before the first occurrence of Homo sapiens at ~318 ka BP on the African continent. The analysis of the Chew Bahir record reveals a rapid (~880 yr) change of climate at ~5.5 kyr BP in response to a relatively modest change in orbital forcing that appears to be typical of climate tipping points. If this is the case then 14 dry events at the end of the AHP and 7 wet events after the transition, each of them 20–80 yrs long and recurring every 160±40 yrs, could indeed indicate a pronounced flickering between wet and dry conditions at the end of the AHP, providing significant EWS of an imminent tipping point. Compared to the low-frequency cyclicity of climate variability before and after the termination of the AHP, the flickering occurs on time scales equivalent to a few human generations and it is very likely (albeit speculative) that people were conscious of these changes and adapted their lifestyles to the rapid changes in water and food availability.

How to cite: Trauth, M. H., Asrat, A., Fischer, M. L., Hopcroft, P. O., Foerster, V., Kaboth-Bahr, S., Lamb, H. F., Marwan, N., Maslin, M. A., Schäbitz, F., and Valdes, P. J.: Early Warning Signals for the Termination of the African Humid Period(s), EGU General Assembly 2023, Vienna, Austria, 23–28 Apr 2023, EGU23-5277, https://doi.org/10.5194/egusphere-egu23-5277, 2023.

Which routes did Homo sapiens take when spreading from Africa to Eurasia? The climatic conditions changed and with them the living conditions. Over the past twelve years, a research team has deciphered the complex interplay of cultural innovations, mobility and environmental changes funded by the German Research Foundation (Collaborative Research Center 806 "Our Way to Europe"). Our working group in Bonn specifically investigated when and where migration corridors or barriers existed  from a paleoecological and paleoclimatological point of view. It turned out that the Levant, as the only permanent land bridge between Africa and Eurasia during the Quaternary, was the key region as a migration corridor for modern humans. Cores from the Dead Sea Deep Drilling Project (ICDP) were investigated, in which the environmental and climate history of the last 200 ka is excellently preserved and documented. In particular, pollen analysis allows changes in vegetation cover to be identified and environmental and climatic conditions to be reconstructed. These data illustrate that the Levant could only have served as a corridor when, under more favorable conditions, for example, neither deserts nor dense forests impeded the spread of modern humans.

How to cite: Litt, T.: Paleoecology/paleoclimate of the Levant and its impact on the spread of modern humans from Africa to Europe, EGU General Assembly 2023, Vienna, Austria, 23–28 Apr 2023, EGU23-5707, https://doi.org/10.5194/egusphere-egu23-5707, 2023.

EGU23-5829 | Orals | SSP1.5

Holocene oceanographic variability linked to the Guinea Dome development recorded in a deep-sea sediment core off Cabo Verde 

Irene Pérez-Rodríguez, Thor H. Hansteen, Julie C. Schindlbeck-Belo, Dirk Nürnberg, Steffen Kutterolf, Veerle A.I. Huvenne, Kelsey Archer Barnhill, Erik Simon-Lledó, Susan Evans, Beatriz Vinha, Ángela Mosquera Giménez, and Covadonga Orejas

The Guinea Dome, located in the eastern tropical North Atlantic, is produced by cyclonic circulation associated with the eastward North Equatorial Countercurrent, the northward Mauritanian Current and the westward North Equatorial Current, which causes the uplift of the isotherms in the Guinea Dome. This oceanographic feature is important for the regional atmosphere-ocean dynamics, and its variability was suggested to be linked with precipitation changes in North Africa, at least at a decadal scale. Characterizing the development of the dome through the Holocene will contribute to understand the prominent environmental changes that occurred regionally during this period, as evidenced by the green-to-desert Sahara transition at the end of the African Humid Period (ca. 6,000 years ago).

A 35cm sediment multicore, extracted southwest off Cabo Verde during the iMirabilis2 scientific cruise, at a water depth of 4,394 m, is being investigated. We present planktonic foraminifera counts and X-ray fluorescence (XRF) scanning data to reconstruct palaeoceanographic and sediment input changes during the Holocene. An age-depth model for the sediment core was established with three samples dated by the radiocarbon method, indicating that the sediment was deposited from 11,180 to 1,257 calibrated years before present (cal. BP).

Planktonic foraminifera results show a gradual but important change in the assemblages throughout the core, where the abundance of species preferring warmer waters increase by 44% towards the top of the core. These results are interpreted as warming of the surface water masses during the Holocene, as a result of reduced influence of the Guinea Dome due to its change of location to a more southern position and/or as a consequence of a weakening of the dome. X-ray fluorescence scan variations along the core show that the faunal shift is encompassed by differences in the terrigenous sediment supply, indicating changes in the inland climate regime. For instance, changes in the Ti/Fe, Ti/Al and Al/Ca ratios are proxies for the fluvial/aeolian sedimentary input and the hinterland climate variability. An increase of the high river discharge indicators is displayed between 10 and 6 kyr BP, probably as a consequence of the increased precipitation that took place during the African Humid Period.

Further ongoing geochemical analyses of foraminifera shells will provide information regarding the temperature, salinity and productivity of both, the mixed layer and the sub-thermocline, which will improve the characterization of the variability that the Guinea Dome experienced during the Holocene.

How to cite: Pérez-Rodríguez, I., Hansteen, T. H., Schindlbeck-Belo, J. C., Nürnberg, D., Kutterolf, S., Huvenne, V. A. I., Barnhill, K. A., Simon-Lledó, E., Evans, S., Vinha, B., Mosquera Giménez, Á., and Orejas, C.: Holocene oceanographic variability linked to the Guinea Dome development recorded in a deep-sea sediment core off Cabo Verde, EGU General Assembly 2023, Vienna, Austria, 23–28 Apr 2023, EGU23-5829, https://doi.org/10.5194/egusphere-egu23-5829, 2023.

EGU23-6585 | ECS | Orals | SSP1.5

Influence of climate and atmospheric circulation changes on water balance of Mount Kenya and surroundings 

Martina Messmer, Santos J. González Rojí, Christoph C. Raible, and Thomas F. Stocker

Climate over Kenya is rather heterogeneous and exceptionally dry for a region located in the tropics. This is related to various large-scale drivers, such as Lake Victoria, the complex topography, and the vicinity to the ocean. In consequence water resources are scarce and several stakeholders depend on these. Hence, it is important to understand how precipitation amounts and patterns change under global warming. A special focus is on Mount Kenya, one of the most important freshwater towers in Kenya. To investigate these changes, we employ the Weather Research and Forecasting (WRF) model V3.8.1 to downscale a 30-year period for the present and the future climate, based on global climate simulations. The present period covers the years 1981–2010, and the future is run once for the mitigation scenario RCP2.6 and for the high-emission scenario RCP8.5 for the years 2071–2100.

Changes in precipitation and temperature are well noticeable in the region of Mount Kenya. The projection indicates an increase in precipitation for the two rainy seasons (March to May, and October to November), while precipitation is reduced in the dry season. Extreme precipitation around Mount Kenya shows increases in the future during the rainy season, whereby the two different scenarios show a similar increase in extreme precipitation. This result is a bit surprising and needs further investigation. As expected, temperatures are projected to increase over all of Kenya, and particularly along the slopes of Mount Kenya in all months. For temperature there is a clear difference in the warming between the two scenarios, as RCP8.5 shows a much stronger change in temperature than RCP2.6. The summit of Mount Kenya reaches temperatures in the future that today are found at an elevation of around 3,200 m above sea level (a.s.l.). This warming can substantially affect the endemic vegetation along the slopes of Mount Kenya. Assuming that the tree line is limited by temperature and not precipitation, as the latter is abundant, it could move from around 3,000 m a.s.l. up to 3,700 m a.s.l. The strong increase in temperature further affects the remaining glacier, which is currently an important water storage during dry months. The projected increase in precipitation over entire Kenya will therefore increase water availability and reduce fire danger. Nevertheless, the combined increase in temperature and precipitation could affect human and animal wellbeing, as heat stress may be increased.

All these results are based on a single regional and global climate model. Preliminary results indicate that the rainy season is clearly underestimated in the present simulation, compared to simulations obtained by a downscaling of the reanalysis ERA5. This indicates that important components of the atmosphere are not correctly captured by the model. These could include land-atmosphere interactions, misrepresentation of land cover, biases in sea surface temperatures and related changes in the atmospheric circulations. Thus, the atmospheric circulation and interactions with the land surface have to be assessed in further studies.

How to cite: Messmer, M., González Rojí, S. J., Raible, C. C., and Stocker, T. F.: Influence of climate and atmospheric circulation changes on water balance of Mount Kenya and surroundings, EGU General Assembly 2023, Vienna, Austria, 23–28 Apr 2023, EGU23-6585, https://doi.org/10.5194/egusphere-egu23-6585, 2023.

EGU23-8109 | ECS | Posters on site | SSP1.5

Arid occupation of south-eastern Arabia: A new Late Pleistocene site at Wadi Asklat, south-central Oman—dating and paleoenvironmental reconstruction. 

Roman Garba, Matthew Meredith-Williams, Stephanie Neuhuber, Susanne Gier, and Vitalii Usyk

The Arabian Peninsula was, up until recently, thought to have been depopulated during the more arid phases between MIS5 and Holocene interglacials, and in particular during MIS3 and MIS2. Within the last few years there have been five new sites dated to this arid phase, demonstrating that at the very least there were episodic occupation events on the Arabian Peninsula, and potentially refugial populations. The increasing number of sites potentially lends weight to the hypothesis for a more continuous refugial population on the Arabian Peninsula, as opposed to multiple-short lived events. The human adaptation to harsh environment during transition from humid period is a focus of this research project. Here we present preliminary dates from the newly recorded site at Wadi Asklat in Duqm, south-central Oman, where stratified lithic technology has been identified within a alluvial terrace sediment sequence. Two OSL samples at depth of 100 and 125 cm were taken to understand site chronology together with geomorphic processes. The paleoenvironmental samples were collected for palynological and pedological analyses. The preliminary clay mineral analysis identified palygorskite, illite, chlorite, smectite in layer at depth 90 to 110 cm suggesting a soil formation process. The lithic artifact at depth of 115 cm was preliminarily identified as Kombewa core with two bidirectional negatives made on crested flake. In addition, a several stratified sites have also been identified within the area, however except for the Wadi Asklat site these are at present undated. The association of many of the new sites with river terraces, including Wadi Asklat, indicate an important link between human activity and water which was no doubt heightened during arid phases. The results contribute to our knowledge of population dynamics and settlement patterns in this under-studied region of central Oman. The research is as a joint effort of ARDUQ expedition led by Archaeological Institute Prague (Czechia) and LARiO expedition led by La Trobe University Melbourne (Australia).

How to cite: Garba, R., Meredith-Williams, M., Neuhuber, S., Gier, S., and Usyk, V.: Arid occupation of south-eastern Arabia: A new Late Pleistocene site at Wadi Asklat, south-central Oman—dating and paleoenvironmental reconstruction., EGU General Assembly 2023, Vienna, Austria, 23–28 Apr 2023, EGU23-8109, https://doi.org/10.5194/egusphere-egu23-8109, 2023.

EGU23-10095 | Orals | SSP1.5 | Highlight

Did the North Atlantic Ocean play a role driving Green Sahara conditions during the Late Pliocene and Early Pleistocene? 

Anya Crocker, Amy Jewell, Bryce Mitsunaga, Solana Buchanan, Thomas Westerhold, Ursula Röhl, Chuang Xuan, James Russell, Timothy Herbert, and Paul Wilson

North Africa is one of the most vulnerable regions on Earth to anthropogenically-driven climate change, but also one of the least equipped to deal with the consequences. Predictions of precipitation levels over the forthcoming centuries diverge, not only in magnitude, but also in the sign of change. One key aspect of this uncertainty comes from the role of Atlantic Ocean sea surface temperatures (SST), which are known to exert a strong control over precipitation in North Africa and are implicated in both the major Sahelian drought of the late 20th century and extreme droughts associated with the Heinrich events of the last glacial period.


To better understand how African hydroclimate responds to SST variability across a range of climate states, we reconstruct changes in the ocean and atmosphere through the transition from the Pliocene epoch (when atmospheric CO2 levels were comparable to present) into the cooler Pleistocene. We present data from Ocean Drilling Project Site 659, which is situated in the subtropical North Atlantic beneath the major modern summer Saharan dust plume. Our dust accumulation and X-ray fluorescence core scan data record repeated shifts between highly arid conditions and humid intervals with vegetated or “Green Sahara” conditions over much of northern Africa. The amplitude of these humid events is modulated by both global climate state and variability in solar insolation, with three unusually long intervals of low dust emissions (each lasting ca. 100 kyr) occurring at times when insolation variability was weak. We also present new paired alkenone-derived SST estimates and multi-species planktonic foraminiferal isotope records from 3.5–2.3 Myr ago to explore the role of North Atlantic dynamics in driving African hydroclimate variability. Our records help to develop the environmental framework needed to assess evolutionary outcomes on land and improve our understanding of the mechanisms driving precipitation variability in North Africa.

How to cite: Crocker, A., Jewell, A., Mitsunaga, B., Buchanan, S., Westerhold, T., Röhl, U., Xuan, C., Russell, J., Herbert, T., and Wilson, P.: Did the North Atlantic Ocean play a role driving Green Sahara conditions during the Late Pliocene and Early Pleistocene?, EGU General Assembly 2023, Vienna, Austria, 23–28 Apr 2023, EGU23-10095, https://doi.org/10.5194/egusphere-egu23-10095, 2023.

EGU23-14071 | ECS | Orals | SSP1.5

Variable Hydroclimate in the Suguta-Turkana Valley, Kenya during the Early Middle-Pleistocene Transition 

Elena Robakiewicz, R. Bernhardt Owen, Alan Deino, Martin Trauth, and Annett Junginger

The Early Mid-Pleistocene Transition (EMPT) between 1,200–700 ka represents a major global climate transition from dominantly 41,000-year to 100,000-year glacial cycles. The forces and mechanisms behind this transition, and the response of African environments, is not well understood. The active volcanism and tectonics of the East African Rift System (EARS) add complexity to environmental systems and can erase important proxy records, inhibiting studies of lacustrine dynamics. As a result, there is minimal understanding of how this transition impacted the region’s lake systems, with implications for hominin migration. At paleolake Suguta in the northern Kenya Rift, however, flood basalts cap lacustrine EMPT-aged deposits and help preserve these strata and their valuable paleoenvironmental record. This research presents a high-resolution reconstruction of hydrological change from approximately 930 to 830 ka during the EMPT at the Suguta-Turkana Valley in the northern Kenya Rift. Paleolake dynamics are reconstructed from a 41 m sedimentary section using diatom morphology, sedimentology, and x-ray fluorescence analysis. Lake levels varied during the EMPT, particularly from ~885–830 ka, ranging from deep stratified lakes, shallow, well-mixed lakes, and complete desiccation. This record identifies hydroclimate variability at several thousand year-resolution within the Suguta-Turkana Valley during the EMPT, illuminating a period where generally little is known about terrestrial environmental change.

How to cite: Robakiewicz, E., Owen, R. B., Deino, A., Trauth, M., and Junginger, A.: Variable Hydroclimate in the Suguta-Turkana Valley, Kenya during the Early Middle-Pleistocene Transition, EGU General Assembly 2023, Vienna, Austria, 23–28 Apr 2023, EGU23-14071, https://doi.org/10.5194/egusphere-egu23-14071, 2023.

Climate change is often linked with evolutionary processes, but the effect of this driver is mediated by the environment in which the organisms live. In relation to hominins, climatic conditions play an important role in determining the availability of resources critical to development and evolution, including water, materials for tools, and food. Over the last c. 1 million years the spatial distribution of water and vegetative resources across Africa has shifted dramatically, and in tandem. The most significant change in this time period occurred c. 300,000 years ago when the predominance of wetter conditions, and relatively more abundant vegetative resources, shifted from western to eastern Africa. Around this time Homo sapiens and Middle Stone Age technologies emerged. While the changing landscape of Africa would not have necessarily have excluded hominins from occupying particular regions, they would have altered the chances for interaction between different populations through the creation of new geographic connections. These new connections between hominin populations would have promoted different cultural and genetic exchanges, which consequently could have driven development and evolutionary processes. To understand the environmental backdrop to hominin development and evolution we need to explore the changes that occurred within the landscapes in which they lived. Here landscape scale (site specific) changes in environmental resources are considered from key locations in western and eastern Africa. These insights are then placed within the context of climate and vegetation change across the continent to develop ideas about how the changing landscapes could have facilitated, and driven, cultural development and evolutionary processes in hominins during the Pleistocene.

How to cite: Gosling, W.: Hominin life and evolution across changing African landscapes in the Pleistocene, EGU General Assembly 2023, Vienna, Austria, 23–28 Apr 2023, EGU23-14725, https://doi.org/10.5194/egusphere-egu23-14725, 2023.

EGU23-14878 | Posters on site | SSP1.5

Track and trace: how aeolian dust can help to understand East African climate 

Inka Meyer, Dirk Verschuren, and Marc De Batist

Samples of present-day aeolian dust collected with the help of various kinds of dust sampling devices are currently a widely used resource to measure distinct characteristics of aeolian transported material, such as variations in the amount of dust flux over space and/or time, chemical and mineralogical composition and isotopic signatures of the material to ultimately infer the origin of the aeolian transported sediment, to understand transport pathways and to identify the sensitivity of aeolian dust to changes in local or global climate variability. However, so far the majority of samples captured by dust traps originate from classical desert environments, such as the Saharan desert or the Australian or Asian deserts. Due to smaller sample amounts, longer depositional periods, difficulties in installing the traps, and labor-intensive trap maintenance, continuous dust-trap records from semi-arid regions are rare.

In this study we present a record of aeolian dust deposits from the semi-arid region at Lake Chala, in SE Kenya/ NE Tanzania, comprising a nearly continuous sampling period of 5 years from three different locations. The first dust traps were installed in 2016 during the ICDP DeepCHALLA drilling and deliver a monthly record of dust characteristics in the area. A combination of microscopic investigations, detailed grain-size measurements, as well as mineralogical analysis allows us to infer changes in the amount and characteristics of the monthly deposited aeolian sediments and provide a first insight into seasonal changes and fluctuations of atmospheric forcing factors responsible for dust transport and the deposition in our study area.

How to cite: Meyer, I., Verschuren, D., and De Batist, M.: Track and trace: how aeolian dust can help to understand East African climate, EGU General Assembly 2023, Vienna, Austria, 23–28 Apr 2023, EGU23-14878, https://doi.org/10.5194/egusphere-egu23-14878, 2023.

EGU23-15774 | ECS | Posters on site | SSP1.5

Palaeoproteomics of skeletal fossils reveals hominins evolution and behaviours: several case studies from East Asia 

Huan Xia, Dongju Zhang, and Fahu Chen

The analysis of ancient DNA and paleoproteomics can identify biological materials, such as fossils, construct phylogenetic relationships between extinct and extant species, and has been widely applied in archaeology and paleontology. In general, proteins degrade more slowly than DNA and could be persevered in fossils over 60 million. Although less phylogenetic information was obtained than ancient DNA, paleoproteomics analysis becomes an indispensable method for studying biological evolution and hominins behaviours with its high throughput, low cost, and low contamination. Based on several cases of applying paleoproteomics analysis in archaeological and paleontological sites from East Asia, I will present two main methods, LC-MS/MS and MALDI-TOF MS, and how paleoproteomics reveals the evolutionary history and behaviours of hominins in East Asia, aiming to provide a research background of this field.

How to cite: Xia, H., Zhang, D., and Chen, F.: Palaeoproteomics of skeletal fossils reveals hominins evolution and behaviours: several case studies from East Asia, EGU General Assembly 2023, Vienna, Austria, 23–28 Apr 2023, EGU23-15774, https://doi.org/10.5194/egusphere-egu23-15774, 2023.

EGU23-17267 | Posters on site | SSP1.5

Mid-Pleistocene volcano-tectonic fragmentation of the Turkana-Suguta Megalake 

Annett Junginger, Simon Kuebler, Carolina Rosca, R. Bernhard Owen, Alan Deino, Craig Feibel, Martin. H. Trauth, and Hubert Vonhof

The East African Rift System (EARS) is a key location for studying Plio-Pleistocene paleoclimate and hominin inhabitance. The region experienced profound reorganization during this interval as a response to volcanism, tectonics and climate change, and arguably detailed spatiotemporally coherent climate datasets could provide evidence of causal links between geologic change and hominin evolution.  However, continued tectonism, erosion, burial and volcanism obscures much of this information. Despite its rich fossil record, the Turkana basin in the northern Kenya Rift is no exception. It has been hypothesized that Lake Turkana and paleo-Lake Suguta to its south formed one 530-650 km long mega-lake before 221 ka ago, and was a major barrier for E-W dispersal of hominids and other terrestrial fauna. Here we present new information on basin development based on paleolandscape modeling and 87Sr/86Sr analysis on microfossils of newly discovered paleo-lake sequences in the Suguta Valley, permitting reconstruction of volcano-tectonic processes 900-700 ka ago. Contrary to previous assumptions, results suggest that two to three lakes separated by tectono-volcanic barriers formed instead of one mega-lake. These results have implications for previously formulated hypotheses about mega-lakes preventing W-E migration and exchange and suggest that during the early Middle Pleistocene E-W migrations were possible.

How to cite: Junginger, A., Kuebler, S., Rosca, C., Owen, R. B., Deino, A., Feibel, C., Trauth, M. H., and Vonhof, H.: Mid-Pleistocene volcano-tectonic fragmentation of the Turkana-Suguta Megalake, EGU General Assembly 2023, Vienna, Austria, 23–28 Apr 2023, EGU23-17267, https://doi.org/10.5194/egusphere-egu23-17267, 2023.

Long-term and abrupt changes in precipitation (P) patterns remain ambiguous in a warmer climate. Modern studies project that a warmer climate will cause intensification of the hydrological cycle. However, paleoclimate evidence from the warm period, i.e., the Medieval Climate Anomaly (MCA; 800-1400 AD), contradicts this because, during MCA, some regions were humid (wet), while others had arid (dry) climates. Here, we investigated the P response to variations in the temperature (T) and Atlantic Meridional Overturning Circulation (AMOC) variation throughout the Northern Hemisphere (NH) using 75 for P, 17 for the AMOC, and 48 records for T from NOAA and PAGES paleoclimate databases.

Our results show a continuous weakening trend in AMOC from the 9th to 13th centuries. The weakened AMOC has probably altered the atmospheric heat and water vapor distribution, and consequently the hydroclimate around the NH. The hydroclimate over the eastern North America and the Western Europe looks more vulnerable to weak AMOC as it shifted from warm-humid to cold-arid climates. Weak AMOC induces motion in Inter-Tropical Convergence Zone (ITCZ) southwards. Our results show signals of an ITCZ shift over equatorial Africa and southern Asia with the warm and humid response. Although warm (cold) climates are not always associated with increased (decreased) P, they may also lead to arid (humid) climates. Overall, we found that when T is higher than their average, the hydrological conditions are arid, but when T is similar or close to the average level, the conditions are humid. However, these hydroclimate responses may vary according to the regionally available water resources. Therefore, an improved understanding of long-term T variability and AMOC trend changes, specifically during warmer periods, could provide relevant insights into the present and future climates.

How to cite: Pratap, S., Markonis, Y., and R. Blöcher, J.: Understanding Atlantic Meridional Overturning Circulation and linked variations in precipitation and temperature distribution during the warmer climate, EGU General Assembly 2023, Vienna, Austria, 23–28 Apr 2023, EGU23-129, https://doi.org/10.5194/egusphere-egu23-129, 2023.

EGU23-551 | ECS | Orals | SSP2.2

Eocene seismicity and paleogeography of the Central Crimea 

Ekaterina Chizhova, Ekaterina A. Lygina, Natalia V. Pravikova, Tatiana Yu. Tveritinova, and Elizaveta A. Krasnova

The nature of Cretaceous-Eocene boundary is one of the outstanding questions of Crimea Geology. The new data are presented to show that the Cretaceous-Eocene boundary can be established in the Central Crimea very accurately by using the method of quantitative genetic analyses including the Isotope Geochemistry. Integrated lithostratigraphic investigations and Isotope composition of Carbon/Oxygen were conducted on the Cretaceous -Eocene section of the western slope of Ak-Kaya mount (Belogorsk, Crimea). Four layers of different types of rocks were investigated, where the layer 1 and 2 belong to the Maastrichtian, 3 and 4 to the Eocene.

The top of the Maastrichtian layer is characterized by a differently oriented fracture system, including large paleoseismic dislocations or a seismogenic trench. The fracture networks are connected and filled with material similar to the Eocene basal horizon including fragments of various sizes of Maastrichtian rocks.

Five microfacial types of the collected rock samples were distinguished as a result of microscopic examination. Also X-ray phase analysis, δ13С and δ18О isotopic analysis and X-ray fluorescence analysis were made to specify and compare the mineral composition of Maastrichtian and Eocene rocks. These analyzes allowed to specify paleogeographic conditions. In addition, measurements of fractures in the Cretaceous–Eocene boundary deposits were made to determine the stages of deformation of the whole structure.

As a result of the research, it was obtained:

1) throughout the entire studied geological interval, sedimentation occurred in a shallow sea of normal salinity. However, conditions were probably more humid in the Eocene, based on lower salinity values.

2) Three major stages of deformation were identified: pre-Eocene, Eocene, and post-Eocene.

3) The average temperature of the formation of Maastrichtian rocks is 19-22°C, and Eocene rocks is 24-27°C. The increase in temperature up to 38°C during the formation of the Eocene basal horizon may be associated with the global climatic event EECO (Early Eocene Climate Optimum). The synchronicity of the formation of steep submeridional fractures and the basal horizon of the Eocene has been proved. It is shown that the Eocene deformation stage corresponds to the formation of paleoseismic dislocations during the main phase of tectonic activity in the Pontids (Eastern Turkey).

How to cite: Chizhova, E., Lygina, E. A., Pravikova, N. V., Tveritinova, T. Yu., and Krasnova, E. A.: Eocene seismicity and paleogeography of the Central Crimea, EGU General Assembly 2023, Vienna, Austria, 23–28 Apr 2023, EGU23-551, https://doi.org/10.5194/egusphere-egu23-551, 2023.

EGU23-2714 | Orals | SSP2.2 | Highlight

Exploring links between the North Atlantic Igneous Province and Paleocene–Eocene climate change using sedimentary mercury 

Joost Frieling, Tamsin Mather, Morgan Jones, Isabel Fendley, Weimu Xu, Christian Berndt, Sverre Planke, and Carlos Alvarez Zarikian and the IODP Expedition 396 scientists

The North Atlantic Igneous Province (NAIP), a large igneous province (LIP), was emplaced between ~62 and 50 million years ago (Ma), with a voluminous burst of volcanic activity centred around 56-54 Ma. Global paleoclimate reconstructions from this Paleocene and Early Eocene interval indicate progressively warmer conditions, with several superimposed warming events or ‘hyperthermals’, such as the PaleoceneEocene Thermal Maximum (PETM; 56 Ma). These hyperthermals represent transient massive perturbations to the carbon cycle, marked by substantial global warming, ocean acidification and negative stable carbon isotope excursions. International Ocean Discovery Program Expedition 396 to the Mid-Norwegian continental margin recovered a suite of PaleoceneEocene sedimentary and igneous materials. This notably includes a unique and extremely expanded succession comprising of up to ~80m of PETM (ash-rich) sediments and volcanic ash layers infilling a hydrothermal vent crater. The craters on the Mid-Norwegian margin and similar structures associated with other LIPs were previously identified as surface expressions of a potent carbon release mechanism: the venting of thermogenic carbon generated in the thermal aureoles around volcanic dikes and sills intruded into the underlying sedimentary basins.

In recent years, much progress has been made towards understanding the role of deep earth processes and particularly LIP volcanism on paleoclimate through the application and refinement of proxies as sedimentary mercury (Hg) content. Large scale and especially LIP volcanism are considered important Hg emitters that may result in increased sedimentary Hg content. Here, we present high-resolution bulk sedimentary Hg content data from the sedimentary strata within the hydrothermal crater, spanning the PETM. We use our new data with biostratigraphic, stable carbon isotope, and lithological constraints, to shed light on the timing of hydrothermal crater formation, duration and re-activation of hydrothermal activity within the crater after formation. Finally, these new findings are placed in a global Hg and carbon cycle framework to assess the timing, characteristics, and impact of NAIP activity during the PETM.

How to cite: Frieling, J., Mather, T., Jones, M., Fendley, I., Xu, W., Berndt, C., Planke, S., and Alvarez Zarikian, C. and the IODP Expedition 396 scientists: Exploring links between the North Atlantic Igneous Province and Paleocene–Eocene climate change using sedimentary mercury, EGU General Assembly 2023, Vienna, Austria, 23–28 Apr 2023, EGU23-2714, https://doi.org/10.5194/egusphere-egu23-2714, 2023.

EGU23-5618 | ECS | Posters on site | SSP2.2

A Novel Approach to Constraining Carboniferous Tidal Currents using Bedforms in Tidal Rhythmites 

Jennifer Hewitt, Jaco Baas, Justyna Bulawa, Amy Ewing, Brennan O'Connell, and Mattias Green

A novel methodology shows that the dimensions of current ripples within tidal rhythmites can be used as a proxy for tidal current velocity, allowing us to contribute to the validation of numerical tidal model simulations. Our understanding of changing tides through geological history is facilitated by tidal simulations, which are generally poorly constrained due to the limited availability of proxy data. We aim to rectify this by developing a new type of geological proxy for tides based on sedimentary textures and structures, as bedforms are widely reported but uncommonly measured in the literature. The Carboniferous is a particularly data-rich time period with globally abundant tidal lithofacies including tidal rhythmites; successions of rhythmically alternating coarser and finer layers which can be used to describe tidal cyclicity, changes in the Earth – Moon system, and palaeoenvironmental conditions. Using data collected from a previously unstudied succession of Late Carboniferous (318 Ma) tidal rhythmites in Pembrokeshire, South Wales, UK, and empirical relationships identified through a series of flume studies in the literature, we deducted that the current ripples in our studied outcrop were formed at tidal flow velocities ranging between 0.28 and 0.34 m s-1. The latest palaeogeographical reconstructions depict South Wales as entirely continental, however the studied section revealed evidence of deposition in a shallow-marine palaeoenvironment. Identifying these palaeoenvironmental inaccuracies such as these allows us to rectify the palaeogeographical reconstructions; once tuned, the numerical tidal model simulation matched well with our proxy results. These promising findings demonstrate proof-of-concept of utilising bedforms as a proxy for palaeotides as well as its feasibility to validate tidal model simulations of other geological time periods and areas.  

How to cite: Hewitt, J., Baas, J., Bulawa, J., Ewing, A., O'Connell, B., and Green, M.: A Novel Approach to Constraining Carboniferous Tidal Currents using Bedforms in Tidal Rhythmites, EGU General Assembly 2023, Vienna, Austria, 23–28 Apr 2023, EGU23-5618, https://doi.org/10.5194/egusphere-egu23-5618, 2023.

EGU23-5657 | ECS | Orals | SSP2.2

Planktonic Foraminiferal δ13Corg as a novel proxy for Carbon Cycling 

Tommaso Paoloni, Babette Hoogakker, Helen Grant, Patrick Keenan, and Helliot Hamilton

It has been hypothesized that lower atmospheric CO2 concentrations and lower temperatures during glacial times caused the enrichment of carbon isotopes of particulate organic material (δ13Corg-POM) produced in the surface ocean. Some downcore measurements of organic carbon isotopes of bulk sediments show such a trend, however, others do not. The lack of a coherent picture could be due to issues relating to the bulk sediments, including diagenetic alteration, the nature of the organic material, input of allochthonous material, and sediment redistribution.

Recent work by Hoogakker et al. (2022) shows that planktonic foraminifera-bound organic carbon δ13C values (δ13CFBOM) are remarkably similar to those of δ13Corg-POM. Here we present the first down-core organic carbon isotope record of planktonic foraminifera-bound organic carbon (δ13CFBOM) from the Southern Ocean (ODP Site 1088), to test for a glacial enrichment in δ13Corg-POM. The samples (Globigerina bulloides, Globorotalia truncatulinoides, and G. inflata) cover the last 20,000 years.

Our δ13CFBOM results show a slight positive trend toward the Last Glacial Maximum (LGM), in accordance with the hypothesized δ13Corg-POM trend, but not to the extent as shown in some bulk sediments from more tropical latitudes. We discuss our results in the context of predicted past δ13Corg-POM using ice core atmospheric pCO2 concentrations, G. bulloides calcification DIC (from inorganic carbon isotopes), and temperature (using Mg/Ca). 

How to cite: Paoloni, T., Hoogakker, B., Grant, H., Keenan, P., and Hamilton, H.: Planktonic Foraminiferal δ13Corg as a novel proxy for Carbon Cycling, EGU General Assembly 2023, Vienna, Austria, 23–28 Apr 2023, EGU23-5657, https://doi.org/10.5194/egusphere-egu23-5657, 2023.

EGU23-5912 | Posters on site | SSP2.2

A comparison study of Mg/Ca-, alkenone- and TEX86-derived temperatures for the Brazilian Margin during Marine Isotope Stages 6–5 

André Bahr, Andrea Jaeschke, Alicia Hou, Christiano M. Chiessi, Ana Luiza Spadano Albuquerque, Janet Rethemeyer, and Oliver Friedrich

The reconstruction of accurate sea-surface temperatures (SST) is of utmost importance due to the central role of the ocean in the global climate system. Yet SST-proxies might be influenced by a number of environmental processes that may potentially bias the accurate reconstruction of the target variable. Here, we investigate the fidelity of SST reconstructions for the Western Tropical South Atlantic (WTSA) for Marine Isotope Stages (MIS) 6–5, utilizing a core collected off eastern Brazil at ~20°S. This interval was selected as previous SST estimates based on Mg/Ca ratios of planktic foraminifera suggested a peculiar pooling of warm surface waters in the WTSA during MIS 6 despite glacial boundary conditions. To ground-truth the Mg/Ca-based SST data we generated SST reconstructions from the same core using both, alkenone and TEX86 paleothermometers. Comparison with alkenone-based temperature estimates corroborate the previous Mg/Ca-based SST reconstructions, supporting the presumed warm-water anomaly during MIS 6. In contrast, while core top samples indicate that TEX86-derived temperatures represent annual mean SST, the TEX86-derived paleo-temperatures are up to 6°C colder than Mg/Ca- and alkenone-based SST reconstructions. We interpret the periods of anomalously cold TEX86-temperatures as a result of a vertical migration of the TEX86 producers (heterotrophic marine Thaumarchaeota) to deeper water depths in response to an increase in food availability during phases of enhanced fluvial suspension input.

How to cite: Bahr, A., Jaeschke, A., Hou, A., Chiessi, C. M., Spadano Albuquerque, A. L., Rethemeyer, J., and Friedrich, O.: A comparison study of Mg/Ca-, alkenone- and TEX86-derived temperatures for the Brazilian Margin during Marine Isotope Stages 6–5, EGU General Assembly 2023, Vienna, Austria, 23–28 Apr 2023, EGU23-5912, https://doi.org/10.5194/egusphere-egu23-5912, 2023.

The ~1800–800 Ma period is known as the 'Boring Billion (BB)' because of the relative stasis of the carbon isotope record during this time. However, geochemical data from the Paleo-Mesoproterozoic strata deposited in different areas indicate heterogeneity and complexity of the oxygen contents in the oceans, which hampers paleoenvironmental reconstructions from this period. In addition, very little research has been carried out on the Palaeoproterozoic strata of the North China Craton (NCC). In this study, we report analyses of U-Pb isotopes, elemental abundances, Fe speciation, and molecular markers from the Huangqikou formation in the northwestern part of the Ordos Basin (OB), NCC. The Huangqikou formation was deposited in the rift valley at about 1736 Ma. Our new data, combined with previous analyses, suggest that the warm and humid depositional environment of the Huangqikou formation in the Helanshan area evolved from a marine foreshore setting to a marine backshore setting, with increasing degree of seawater hypoxia. But a relatively oxygenated environment corresponded to the lower part. On the other hand, the Huangqikou formation in the Zhuozishan area evolved from a terrestrial deltaic environment to a marine foreshore environment, with cumulatively reducing conditions. This study points out that the late Paleoproterozoic strata deposited in the western part of the NCC might mainly formed in reduced seawater. But some degree of oxidation had occurred in the surface water during this period, which proves the oxygenation of the surface environment during the early period of Earth evolution.

How to cite: Ma, Q., Zhou, Y., and Zerkle, A.: Sea water chemistry in the late Paleoproterozoic: Insight from the Huangqikou formation, western part of the North China Craton, EGU General Assembly 2023, Vienna, Austria, 23–28 Apr 2023, EGU23-5965, https://doi.org/10.5194/egusphere-egu23-5965, 2023.

EGU23-6265 | ECS | Posters virtual | SSP2.2

Geochemical and palynological analyses of the Shivee Ovoo coal deposit (Choir-Nyalga basin, Central Mongolia)-palaeoclimatic implications 

Nyamsambuu Odgerel, Niiden Ichinnorov, Hitoshi Hasegawa, Bat Orshikh Erdenetsogt, Luvsanchultem Jargal, and Sukhbat Purevsuren

The Shivee Ovoo is one of the big industrial mine of continental Choir-Nyalga basin in central Mongolia. The depositional environment and petroleum source rock potential of major coal-bearing strata in the Choir-Nyalga basin has been studied (Erdenetsogt et al., 2009, 2022), and age of the deposits (Khukhteeg Formation) has been assigned to Aptian-Albian on the basis of radiometiric age of intercalated tuff  (Hasegawa et al. 2018). We carried out a geochemical and palynological study on 10 samples (47 m mine wall) collected from Shivee Ovoo.

Geochemical analysis completed for major, trace, and rare earth elements (REE) in the SGS laboratory in Mongolia. Palynological study was carried out at the Basic Research Laboratory of National University of Mongolia. Fossil palynomorphs were investigated by LM using single grain technique (Hesse et al., 2009). As a result of geochemical analysis of major oxides, SiO2   hasthe highest content with 44.2%-66.9%. Following this Al2O3 (16.24%-19.14%), K2O (1.03%-4.09%) and TFe2O3 (total iron) (1.75%-3.36%) are the second most abundant oxides. The rest of the oxides (MgO, Na2O, P2 O5, MnO, CaO and TiO2) have concentration of less than 2.31%. The Al/Si ratio was between 0.26-0.41, SiO2 is related with quartz. The chemical weathering parameter CIA varies 71.3-81.6, with an average of 78.97, showing intermediate chemical weathering. Also, the Zr/Rb ratio 0.93 it can be seen the hydrodynamic force was weak. Generally, V/Cr:1.18, U/Th: 0.4, δU:1.68 implies oxidation environment. All weathering parameters show oxidation environment during sedimentation indicating that the paleoclimate is a warm and humid.

Palynological data,  6 of the 10 samples contain rich palynological fossils providing important information on the paleovegetation and paleoclimates. Sporomorph plants in the Khukhteeg formation contain 23 genera, 32 species. The palynological percentages of plants Cyathidites 32%, Baculatisporites 20%, Osmundacidites 11.1%, Gingkocycadopites 11%. Dominant plants mainly belong to the Filicales of the ferns represented by Osmundacidites and Dicksoniaceae. The plants 63.1% grow swamps, wet valleys, subtropical temperate zones. This palynological and geochemical data indicate that the at 47m depth Khukhteeg formation had a warm subtropical climate was at that time.

REFERENCES

Erdenetsogt, B. O., Lee, I., Bat-Erdene, D., & Jargal, L. (2009). Mongolian coal-bearing basins: geological settings, coal characteristics, distribution, and resources. International Journal of Coal Geology80(2), 87-104.

Erdenetsogt, B. O., Hong, S. K., Choi, J., & Lee, I. (2022). Depositional environment and petroleum source rock potential of Mesozoic lacustrine sedimentary rocks in central Mongolia. Marine and Petroleum Geology140, 105646.

Hasegawa, H., Ando, H., Hasebe, N., Ichinnorov, N., Ohta, T., Hasegawa, T., Yamamoto, M., Li, G.,  Erdenetsogt, B-O., Ulrich, H., Murata, T.,  Shinya, H.,  Enerel, G., Oyunjargal, G., Munkhtsetseg, O., Suzuki,N., Irino, T.,  Yamamoto, K., (2018). Depositional ages and characteristics of Middle–Upper Jurassic and Lower Cretaceous lacustrine deposits in southeastern Mongolia. Island Arc. 2018; e12243. 17 https://doi.org/10.1111/iar.12243

Hesse, M., Halbritter.H., Zetter, R., Weber, M., Buchner, R., Frosch-Radivo,A. & Ulrich,S. (2009). Pollen terminology-an illustrated handbook. Wein: Springer.


How to cite: Odgerel, N., Ichinnorov, N., Hasegawa, H., Erdenetsogt, B. O., Jargal, L., and Purevsuren, S.: Geochemical and palynological analyses of the Shivee Ovoo coal deposit (Choir-Nyalga basin, Central Mongolia)-palaeoclimatic implications, EGU General Assembly 2023, Vienna, Austria, 23–28 Apr 2023, EGU23-6265, https://doi.org/10.5194/egusphere-egu23-6265, 2023.

EGU23-6929 | Posters on site | SSP2.2

Aspects of the geomorphology of the Late Palaeozoic glaciated landscape of Namibia as revealed by photogrammetry 

Daniel Le Heron, Christoph Kettler, Pierre Dietrich, Neil Griffis, Isabel Montañez, and Ricarda Wohlschlägl

The geometry of unconformities carved by deep time ice sheets is often obscured and restricted by discontinuous exposure, or outcrop conditions that do not readily permit the examination of glacial unconformities (for example, steeply dipping strata). Here, we present new uncrewed aerial vehicle (UAV) data from selected outcrops across northern, central and southern Namibia to shed new light on the nature of the basal Dwyka unconformity. This includes the onlap relationship of basal diamictites onto the Gomatum palaeo-fjord system in northern Namibia, highly complex mapped ice flow orientations elsewhere in the northern Kaokoveld, previously undiscovered grooves along the Fish River area, and a spectacular set of subglacial grooves along the border with South Africa along the Orange River. In the latter two cases, photogrammetric methods integrating orthophotos and digital elevation models reveal the presence of subglacial grooves for the first time, since the features are too subtle to observed using conventional approaches at outcrop. Furthermore, subglacial grooves often show different orientations to striations and fabrics measured in overlying diamictites, raising fresh questions about the nature of small-scale flow variations beneath Late Palaeozoic ice sheets.

How to cite: Le Heron, D., Kettler, C., Dietrich, P., Griffis, N., Montañez, I., and Wohlschlägl, R.: Aspects of the geomorphology of the Late Palaeozoic glaciated landscape of Namibia as revealed by photogrammetry, EGU General Assembly 2023, Vienna, Austria, 23–28 Apr 2023, EGU23-6929, https://doi.org/10.5194/egusphere-egu23-6929, 2023.

EGU23-7230 | ECS | Posters on site | SSP2.2

Late Paleozoic glaciated landscape in northern Africa as an outstandingly well-preserved analogue to Quaternary deglaciated areas 

Ricarda Wohlschlägl, Christoph Kettler, Daniel Le Heron, and András Zboray

The Ennedi sandstone plateau in Chad in north-central Africa exposes an outstanding example of an ice stream paleo-landscape that is of Paleozoic age. This assemblage of paleo-glacial structures is of comparable quality to that found in Quaternary deglaciated landscapes. A wide range of exceptionally well-preserved proglacial, ice-marginal and subglacial features are visible due to the absence of vegetation in the desert environment. Paleo-ice stream pathways contain swarms of large-scale glacial lineations distributed over the whole plateau that tell the story of a dying ice sheet during the late Paleozoic. A putative grounding zone wedge within a paleo-ice stream pathway allows the position of the former coastline to be reconstructed as it is assumed that ice streams terminated into a former ocean basin. Based on the convex topography and its position orthogonal to the large-scale glacial lineations, we present the first geomorphological interpretation of a grounding zone wedge in the Paleozoic record. Additionally, a unique system of inverted channel sediments in close proximity to glacial structures might record different phases of meltwater release during ice retreat. In summary, the Ennedi paleo-glacial landscape provides an excellent natural laboratory to understand the spatial relationship between subglacial, ice-marginal and proglacial components of a former ice sheet, with emphasis on exceptional outcrop quality that can be used to further our understanding of some Quaternary glaciated landscapes.

How to cite: Wohlschlägl, R., Kettler, C., Le Heron, D., and Zboray, A.: Late Paleozoic glaciated landscape in northern Africa as an outstandingly well-preserved analogue to Quaternary deglaciated areas, EGU General Assembly 2023, Vienna, Austria, 23–28 Apr 2023, EGU23-7230, https://doi.org/10.5194/egusphere-egu23-7230, 2023.

EGU23-7618 | ECS | Posters virtual | SSP2.2

Disentangling regional and global signatures from benthic foraminifera records during the Late Miocene-Early Pliocene Biogenic Bloom (IODP Site U1506 and ODP Site 1085) 

Maria Elena Gastaldello, Claudia Agnini, Thomas Westerhold, Anna Joy Drury, Rupert Sutherland, Michelle K. Drake, Adriane R. Lam, Gerald R. Dickens, Edoardo Dallanave, Stephen Burns, and Laia Alegret

The Late Miocene-Early Pliocene Biogenic Bloom (~ 9-3.5 Ma) is a paleoceanographic event defined by anomalously high marine biological productivity and associated with changes in the marine carbon cycle. Marine sedimentary records in the Indian, Pacific, and Atlantic oceans, point to a significant increase in primary productivity across low-latitude oceanic regions maintained for several millions of years. Surface primary productivity is typically limited by the availability of nutrients; whose residence times are fairly short in the global ocean. Therefore, the global nature and the multimillion years duration of the Biogenic Bloom make this event a paleoceanographic puzzle. Two main explanations for these anomalously high productivity conditions have been proposed: a major redistribution of nutrients triggering an intensification of regional upwelling; or an absolute increase of nutrients delivery to the oceans. We investigated the Biogenic Bloom at IODP Site U1506 (Tasman Sea, southwest Pacific Ocean, 1505 m water depth) and at ODP Site 1085 (Cape Basin, southeast Atlantic Ocean, 1713 m water depth). For these sites we generated implemented age models and quantitative benthic foraminiferal records across an interval spanning from the Tortonian (Late Miocene) to the Zanclean (Early Pliocene). The benthic foraminiferal assemblage analysis shows that the Biogenic Bloom was a complex, multiphase event rather than a single uniform period of sustained high marine water productivity. Both sites record changes that can be interpreted in terms of modification of productivity conditions. Intervals with low diversity and abundant opportunistic and phytodetritus exploiting taxa (PET) are indicative of transient pulsed food supply, high oxygen levels, and oligotrophic conditions. Intervals characterized by increased diversity, higher relative abundance of uvigerinids and buliminids, and relative lower abundance of PET instead suggest lower oxygen and /or more eutrophic conditions. However, the two sites show a different taxonomic composition of the benthic foraminiferal assemblages. The dominating PET comprise distinct species at different the study sites, with Globocassidulina crassa and Globocassidulina subglobosa displaying high abundance at Site U1506, and Epistominella exigua and Alabaminella weddellensis at Site 1085. While showing common features, the Biogenic Bloom is also characterized by unique regional responses at different study sites which highlight the need for further high-resolution records to provide global mechanisms and dynamics for the Biogenic Bloom event.

Acknowledgments

The authors acknowledge funding from University of Padova DOR grant, CARIPARO Foundation Ph.D. scholarship, Fondazione Ing. Aldo Gini scholarship, and Spanish Ministry of Economy and Competitiveness and FEDER funds (PID2019-105537RB-I00).

How to cite: Gastaldello, M. E., Agnini, C., Westerhold, T., Drury, A. J., Sutherland, R., Drake, M. K., Lam, A. R., Dickens, G. R., Dallanave, E., Burns, S., and Alegret, L.: Disentangling regional and global signatures from benthic foraminifera records during the Late Miocene-Early Pliocene Biogenic Bloom (IODP Site U1506 and ODP Site 1085), EGU General Assembly 2023, Vienna, Austria, 23–28 Apr 2023, EGU23-7618, https://doi.org/10.5194/egusphere-egu23-7618, 2023.

EGU23-7830 | ECS | Posters on site | SSP2.2

Carbon and nitrogen isotope stratigraphy of the Cambrian SPICE record in the UK 

Francesca Warren, Darren R. Gröcke, Martin Smith, and Matthias Sinnesael

Carbon isotope fluctuations have been determined globally within the late Cambrian with particular focus on the Steptoean Positive Carbon Isotope Excursion (SPICE) and the negative Hellnmaria-Red Tops Boundary/Top of the Cambrian Excursion (HERB/TOCE). These events correspond to global anoxia/euxinia, increased global weathering of organic rich material and a shift in dissolved inorganic carbon availability. We have extended our knowledge of SPICE and HERB/TOCE in the UK by conducting coupled carbon and nitrogen isotope analysis of cores (Merevale 1, 3) and quarry samples from Warwickshire (Oldbury Quarry). Our organic δ13C record replicates the changes previously published for SPICE in other global records. The bulk sediment δ15N record reveals a rapid positive excursion at the start of SPICE followed by a gradual decline through the remaining SPICE interval. We interpret the δ15N record as reflecting expansion of the oxygen minimum zone into the upper water column and replacing nitrification with denitrification processes. Denitrification is also supported during the SPICE interval from previously published iron-speciation data from the same cores. The negative δ13C HERB/TOCE record is coupled with a more subtle δ15N positive excursion. There is a paucity of organic carbon isotope records through this time interval, and hence a lack of global comparability is possible. The shift in δ13C and δ15N, coupled with changes in redox conditions in Cambrian oceans may also reflect biological shifts between red and green phytoplankton superfamilies making up the upper water column community. Additional research on organic carbon, nitrogen and redox proxies are required to ascertain the link between phytoplankton superfamily dominance, species richness, diversity and/or the onset of the Phytoplankton Revolution and the Great Ordovician Biodiversity Event.

How to cite: Warren, F., Gröcke, D. R., Smith, M., and Sinnesael, M.: Carbon and nitrogen isotope stratigraphy of the Cambrian SPICE record in the UK, EGU General Assembly 2023, Vienna, Austria, 23–28 Apr 2023, EGU23-7830, https://doi.org/10.5194/egusphere-egu23-7830, 2023.

EGU23-8260 | ECS | Posters on site | SSP2.2

Climatic differences between Estonia and Svalbard during the second half of the Holocene 

Katre Luik and Hannes Tõnisson

This overview compares various environmental publications to find out the contrasts and similarities in climatic conditions in the last 6000 years in Estonia and Svalbard.

Both regions with their geographical differences are sensitive to climate change, Estonia on the meeting borderline with maritime and continental air masses and Svalbard at the end of the North Atlantic Cyclone track with very changeable climatic conditions. The study aims to find out how the colder and warmer periods differ in the larger time scale such as the Middle and Late Holocene.

The Holocene in Estonia and Svalbard experienced dramatic climate changes including several cold and warm episodes.  A variation of paleoclimatic records was compared with other geological proxies (lake sediments, glaciers, pollen, coastal and dune belt formation data presented in scientific publications) and a good correspondence between cold and warm climate periods was found in both areas. 

The climate conditions were warm and dry during the Middle Holocene with step wise cooling, no glacigenic input in Svalbard, water level in Estonian lakes extremely low; abrupt decrease in temperature appeared around 4000 BP and 2500 BP in both areas. Approximately 4500 years BP, North Atlantic Oscillation (NAO) changed its phase from primarily positive NAO conditions to weakly positive NAO roughly for the next 2500 years. Around 4000 BP dry conditions changed to humid in Estonia and remained so for a thousand years (broad-leaved trees declined and pine forests became dominant approximately 3000 BP; stormy period ∼3300 - 3000 BP recorded in ancient beach formations), the climate likely shifted towards maritime; in Svalbard more intense precipitation stages were recorded in lakes runoff ∼3150 – 3000 BP. The next 2000 years the temperature appeared stabilised, Estonia mostly dry (more continental climate again) with a strong storm period characterised by large beach ridges  in the NW of the country formed ∼2300 - 2000 BP, Svalbard cool and moist with possible glacier advance around 2000 BP and a 400-year humid phase in 1600 - 1350 BP. The Little Ice Age (LIA) occurred around 600 - 100 BP in Svalbard and 500 - 200 BP in Estonia. During the LIA, precipitation and storminess increased in Svalbard whereas the Estonian climate turned more continental (dry and cool) with prevailing northern storms, clearly reflecting in the morphology and shape of dunes formed during this period.

Despite the distinct climatic conditions between Estonia and Svalbard there's no major differences in climate in the last 6000 years, still some noticeable shifts occur. Several detectable changes taking place in both areas were noticed around 3300 - 3000 BP: weaker NAO+ phase, humid conditions in Svalbard, exceptionally stormy period in Estonia followed by explicit changes in dominant tree species. During LIA more continental climate was dominating in Estonia while maritime influence was increasing in Svalbard. Similar opposite  shifts in the past cannot be ruled out and need further investigations and more precise dating information. 

How to cite: Luik, K. and Tõnisson, H.: Climatic differences between Estonia and Svalbard during the second half of the Holocene, EGU General Assembly 2023, Vienna, Austria, 23–28 Apr 2023, EGU23-8260, https://doi.org/10.5194/egusphere-egu23-8260, 2023.

EGU23-8719 | ECS | Orals | SSP2.2

Extraterrestrial 3He-based reconstruction of sedimentation rates across the Paleocene-Eocene transition at ODP Site 1209 (North Pacific) 

Nicolas Pige, Guillaume Suan, Pierre Henri Blard, and Emanuela Mattioli

Numerous hyperthermal events have been documented through the Paleocene-Eocene transition. The best known hyperthermal event is the Paleocene-Eocene Thermal Maximum (PETM; around 56Ma), a period that led to surface and bottom water warming of about 5°C within a few millennia at tropical latitudes. It is therefore considered as one of the best analogues of current global warming. The PETM is also characterized by an abrupt 3-4 per mil negative δ13C excursion in deep marine core sediments and by a thin clay-rich layer associated with the PETM onset, most often interpreted as carbonate dissolution due to the shoaling of the CCD. The duration represented by these clays and carbonates is of peculiar interest to constrain the exported carbonate production dynamics of surface ocean and its dissolution throughout the water column. This is key to produce realistic carbon budgets across hyperthermal events.

To this end, we generated a new 4 Ma (57.5-53.5) record of extraterrestrial 3He-derived sedimentation rates from pelagic sediments recording at least 10 hyperthermal events at ODP Site 1209 (North Pacific). Our main results indicate that carbonate sedimentation dropped drastically during the PETM onset (minimum of 0.02 cm/ka) and recovered rapidly during the recovery phase of the event (around 0.7 cm/ka). Surprisingly, the sedimentation rate is low (0.3 cm/ka) after the recovery until the Eocene Thermal Maximum 2 (ETM2; around 54Ma). After this major event, the sedimentation rate increased abruptly (0.7 cm/ka) over the last 500 ka of the studied interval due to the overabundance of Zygrhablithus bijugatus a large rod-shaped nannofossil whose ecology is poorly understood yet.

Comparisons between the new record of extraterrestrial 3He-derived sedimentation rate and dissolution proxies from this and previous studies lead us to challenge the widely accepted model previously proposed for hyperthermal events, which assumes that the CaCO3 accumulation is mainly controlled by dissolution.

How to cite: Pige, N., Suan, G., Blard, P. H., and Mattioli, E.: Extraterrestrial 3He-based reconstruction of sedimentation rates across the Paleocene-Eocene transition at ODP Site 1209 (North Pacific), EGU General Assembly 2023, Vienna, Austria, 23–28 Apr 2023, EGU23-8719, https://doi.org/10.5194/egusphere-egu23-8719, 2023.

EGU23-8831 | Orals | SSP2.2

Sea surface temperature evolution of the North Atlantic Ocean across the Eocene-Oligocene Transition 

Kasia K. Sliwinska, David K. Hutchinson, Devika Varma, Tirza Weitkamp, Emma Sheldon, Diederik Liebrand, Helen K. Coxall, Agatha M. de Boer, and Stefan Schouten

When a permanent ice cap developed on Antarctica during the Eocene–Oligocene transition (EOT; ~34.44 to 33.65 million years ago (Ma)), Earth witnessed a transition from a greenhouse towards a glacially driven climate. Evidence of high-latitude cooling and increased latitudinal temperature gradients across the EOT has been found in both marine and terrestrial environments. However, the timing and magnitude of temperature change in the North Atlantic remains poorly constrained.

Here, we used two independent organic geochemical palaeothermometers derived from (i) alkenones and (ii) Glycerol Dialkyl Glycerol Tetraether (GDGT) lipids, to reconstruct sea surface temperature (SST) evolution across the EOT from the southern Labrador Sea (Sites: ODP 647 and DSDP 112). In the Labrador Sea alkenones do not appear until the earliest Oligocene (both sites) while GDGT lipids (analysed in Site 647 only) provides a well-constrained temperature record across the EOT.  

Our SST records provide the most detailed record for the northern North Atlantic through the 1 Myr leading up to the EOT onset, and reveals a distinctive cooling step of ~3 ºC (from 27 to 24 ºC), between 34.9 and 34.3 Ma, ~500 kyr prior to Antarctic glaciation. This cooling step, when compared visually to other SST records, is asynchronous across North and South Atlantic sites. This illustrates a considerable spatiotemporal variability in SST evolution in the northern sector of the North Atlantic and the Norwegian-Greenland Sea. Overall, the cooling step fits within a phase of general SST cooling recorded across sites in the North Atlantic in the 5 Myr interval bracketing the EOT.

We used a modelling study (GFDL CM2.1) to try and reconcile the observation of pre-EOT cooling with the hypothesis that Atlantic Meridional Overturning Circulation (AMOC) switched on or intensified on the lead up to the EOT, which would be expected to have warmed the North Atlantic region. Results suggest that a reduction in atmospheric CO2 from 800 to 400 ppm may be sufficient to counter warming from an AMOC start-up. In the model, the AMOC start-up is initiated during closure of the Arctic–Atlantic gateway.

While the model simulations applied here are not yet in full equilibrium, and the experiments are idealized, the results, together with the proxy data, highlight the heterogeneity of basin-scale surface ocean responses to the EOT thermohaline changes, with sharp temperature contrasts expected across the northern North Atlantic as positions of the subtropical and subpolar gyre systems shift in response to climatic and oceanic adjustments.

How to cite: Sliwinska, K. K., Hutchinson, D. K., Varma, D., Weitkamp, T., Sheldon, E., Liebrand, D., Coxall, H. K., de Boer, A. M., and Schouten, S.: Sea surface temperature evolution of the North Atlantic Ocean across the Eocene-Oligocene Transition, EGU General Assembly 2023, Vienna, Austria, 23–28 Apr 2023, EGU23-8831, https://doi.org/10.5194/egusphere-egu23-8831, 2023.

EGU23-10010 | ECS | Orals | SSP2.2

Alkenones confirmed in sediments from high southern latitudes during the Cretaceous and Paleocene: results from the Transkei Basin (IODP Site U1581) 

Kelsey Doiron, Simon Brassell, Peter Bijl, Thomas Wager, Jens Herrle, Gabriele Uenzelmann-Neben, Steven Bohaty, and Laurel Childress and the Expedition 392 Science Party

Preliminary examination of the biomarker composition of Paleocene to Campanian (~63-74 Ma) organic-rich sediments recovered from the Transkei Basin (Hole U1581B; 35° 41’S, 29° 39’E), offshore South Africa, during IODP Expedition 392 reveals suites of alkenones and alkyl alkenoates derived from haptophyte algae. This discovery augments evidence for the temporal continuity of their occurrence since the early Aptian and expands their paleogeographic range to high southern latitudes (~60°S) during the Cretaceous and Paleocene. In addition, the similarity of alkenone distributions between Maastrichtian and Danian samples suggests a conformity in the biosynthetic pathways for their production across the K/Pg boundary likely attesting to the survival of their source haptophytes and recovery after the extinction event. Alkenone distributions in the Transkei Basin sediments are dominated by series of C37 to C40 diunsaturated components and remain broadly consistent throughout the Cretaceous to Paleocene stratigraphic  succession. The presence of both the C38 alkadien-2-one and C39 alkadien-3-one represents the earliest recognition of these compounds thereby extending the advent for biosynthesis of both methyl and ethyl alkenones to the Campanian (~74 Ma). These sediments also contain C37 methyl and both C38 and C40 ethyl alkadienoates. No C37, C38 or C39 triunsaturated alkenones were detected in the Paleocene through Campanian succession but minor amounts of a C40 alkatrien-3-one were confirmed in Cretaceous samples based on its elution time and diagnostic mass spectrum. This finding raises the question why only the C40 triunsaturated component is observed, coupled with pervasive evidence that C37 to C39 triunsaturated alkenones emerge after the Early Eocene Climatic Optimum (EECO). Among extant haptophytes, C40 alkenones occur in species within phylogenic Group II, notably Isochrysis, but are absent in extant marine species comprising phylogenic Group III. These observed distributions of alkenones in the marine realm can be best explained as evidence for contributions from both Isochrysidaceae and Noelaerhabdaceae following their divergence in the early Cretaceous.  

How to cite: Doiron, K., Brassell, S., Bijl, P., Wager, T., Herrle, J., Uenzelmann-Neben, G., Bohaty, S., and Childress, L. and the Expedition 392 Science Party: Alkenones confirmed in sediments from high southern latitudes during the Cretaceous and Paleocene: results from the Transkei Basin (IODP Site U1581), EGU General Assembly 2023, Vienna, Austria, 23–28 Apr 2023, EGU23-10010, https://doi.org/10.5194/egusphere-egu23-10010, 2023.

EGU23-10905 | Posters on site | SSP2.2

Tracking climate changes in the Gulf of California and the Eastern Tropical Pacific Ocean during the past 18,000 yr 

Ligia Perez-Cruz, Mauricio Velázquez-Aguilar, Andrea Lefranc-Flores, Abdel Siffedine, and Jaime Urrutia-Fucugauchi

The location, sedimentology, and oceanographic characteristics of the southern Gulf of California make it suitable for investigating the Quaternary climate changes of the Eastern Tropical Pacific Ocean (ETPO). We investigate changes in precipitation, ocean patterns and variations in paleoproductivity in the Eastern Tropical Pacific Ocean related to insolation, migrations, and dynamics of the of Intertropical Convergence Zone (ITCZ), the North America Monsoon (NAM), and inter-hemispheric teleconnections. Proxy records are obtained from sediments in the marginal Alfonso Basin, situated in the southwestern sector of the Gulf of California near its junction with the Pacific Ocean. The age model was based on eleven radiocarbon dates, the MARINE 20 calibration curve, and a reservoir age of 253 + 18 years. 
High-resolution records of elemental geochemistry, magnetic properties, and radiolarian assemblages are used to track climate changes in the tropical climate system at millennial and centennial time scales over the past 18,500 yr. Geochemical and magnetic proxies revealed an increase of precipitation at  ~17,500 and 16,536 yr, in the Bolling Allerod (from ~14,988 to 14,057 yr), and during the early Holocene. Humid conditions predominated between ~7,404 and 5,200 cal yr BP. Records indicate a climatic shift at ~4,860 cal yr BP, suggesting increased aridity and the strength of winds to continue through the late Holocene. Roughly 4000 cal yr BP the productivity increased as a result of the intensification of the winds. Paleoprecipitation changes are associated with ITCZ latitudinal migration and the NAM responding to insolation changes during the Holocene. Aeolian and fluvial inputs, marked by variations in Ti, K, Fe, Zr/Ti and magnetic properties, indicate that precipitation-controlled changes in summer monsoon rainfall primarily forced terrigenous supply throughout the mid-Holocene. We propose that these conditions arise from the northern hemisphere's high insolation at low latitudes, with the average position of the ITCZ migrating northward. Development of the NAM amplifies the seasonality and promotes increased precipitation during summer seasons. 
During the late Holocene, terrigenous input appears mainly controlled by the intensification of the NW winds. The record indicates a drop-in precipitation and abrupt enhancement of Aeolian activity. 
Radiolarian assemblages reveal the upper layers of two water masses (TSW and GCW), suggesting that the advection of coastal currents and mesoscale features controlled these conditions. The dominance of  Phormostichoartus corbula, Lithomelissa thoracites, and Arachnocorallium calvata, surface dwellers species reveal the Gulf of California Water and relatively high productivity during the BA, and in the transition to the middle to late Holocene, Botryostrobus aquilonaris suggests that during the deglaciation, (~17,468 to 15,426 yr), and at ~12,604 yr the occurrence of the California Current in the Alfonso Basin. Tetrapyle octacantha group represents the dominance of Superficial Tropical Water in the Alfonso basin, associated with conditions of marked stratification in the water column and oligotrophic conditions in the superficial layer during the Holocene Climatic Optimum and the Medieval Warm Period. which fluctuated due to variations in mesoscale gyres and also coastal upwellings off the western coast could contribute.

How to cite: Perez-Cruz, L., Velázquez-Aguilar, M., Lefranc-Flores, A., Siffedine, A., and Urrutia-Fucugauchi, J.: Tracking climate changes in the Gulf of California and the Eastern Tropical Pacific Ocean during the past 18,000 yr, EGU General Assembly 2023, Vienna, Austria, 23–28 Apr 2023, EGU23-10905, https://doi.org/10.5194/egusphere-egu23-10905, 2023.

EGU23-11475 | Posters on site | SSP2.2

Effects of the Indian Ocean Monsoon oscillation during the Pleistocene-Holocene transition on the palinomorphic records in the NW Arabian Sea. 

Patricia Rodrigues, Hermann Behling, Gösta Hoffmann, and Wilfried Bauer

The Indian Ocean Monsoon is one of the largest land-ocean coupled events on Earth. Its occurrence is not only of climatic importance but also has a considerable economic impact on the livelihood of people/countries within its coverage zone. The monsoon winds travelling over the Arabian Sea (AS) carry moisture and bring rainfall to the southern part of the Sultanate of Oman and over a broad area of the Indian continent. In addition to rainfall, the monsoon also causes an intense and extensive deep-water upwelling along the coast and offshore of East Africa and the southern Arabian Peninsula. This intense and pronounced upwelling increases the productivity turning the western Arabian Sea into one of the most productive regions in the world.  In this poster we display partial results of a high-resolution study aiming at identifying monsoonal climatic changes recorded in marine sediments from the northwestern Arabian Sea during the late Pleistocene-Mid Holocene. It was carried out on 11 samples taken from an offshore core IODP Leg 117-721A-1H-1-W. An interval from 80 to 30 cm has been selected and samples have been taken every 3 cm.  We show here results obtained from 6 radiocarbon dating together with the study of palynomorphs. The main objective is to qualitatively identify and characterize pollen grains and spores, as well as the non-pollen palynomorphs (NPP) present in the samples, correlating them with other study sites in the AS. In addition, we evaluate their potential as paleoenvironmental indicators. Samples have presented a low number of pollen grains and spore, which has ranged from 3 to 27 identified specimens. The deeper/older samples have presented a higher concentration of pollen grains. However, due to the low content of specimens, quantitative paleoenvironmental conclusion could not be drawn. Nonetheless, non-pollen palynomorphs are relatively abundant throughout samples. Dinocysts represent the most abundant type of NPP, followed by fungi, microscopic remains of algae and others still not identified. Palynological studies carried on the NW Arabian Sea are scarce and NPP identification and characterization have not been done at the study site yet. Therefore, our work presents novelty on recognizing palinomorphic imprints left by Indian Ocean Monsoon oscillation during the transition Pleistocene-Holocene off the Omani coast.

How to cite: Rodrigues, P., Behling, H., Hoffmann, G., and Bauer, W.: Effects of the Indian Ocean Monsoon oscillation during the Pleistocene-Holocene transition on the palinomorphic records in the NW Arabian Sea., EGU General Assembly 2023, Vienna, Austria, 23–28 Apr 2023, EGU23-11475, https://doi.org/10.5194/egusphere-egu23-11475, 2023.

EGU23-12410 | Posters on site | SSP2.2

Late Quaternary climate variability in Madagascar and its connection to South-East Africa hydroclimate changes and atmospheric circulation patterns 

Elin Norström, Rienk Smittenberg, Anneli Ekblom, Simon Haberle, and Christos Katrantsiotis

Madagascar is characterized by high climatic heterogeneity and its topography plays a key role in modulating the regional hydroclimate variability in South and East Africa. However, knowledge on past climate of Madagascar very limited, in line with the general scarcity of paleoclimate records from the southern tropics and subtropics. We generated a 26 kyr paleoclimate record from Madagascar, located in the southwestern Indian Ocean spanning the Last Glacial Maximum (LGM) to the late Holocene. In particular, we present a deuterium/hydrogen isotopic ratio of terrestrial leaf waxes (δ2Hwax) from a sediment core taken from the central eastern part of the island near the capital Antananarivo. The δ2H records of both the aquatic and terrestrial plant derived n-alkanes exhibit similar long-term trends implying that they all record changes in the isotopic composition of source water, namely meteoric water that recharges soil and lake waters. In this tropical region, the δ2H variability of precipitation recorded by n-alkanes δ2H is mainly influenced by the amount effect resulting in lower values for periods with high rainfall. We observe five long-term trends: (i) stable and relatively dry conditions during the Last Glacial Maximum (LGM) (ii) gradually wetter conditions from 17.5 ka to 11.5 ka, especially during the Heinrich stadial 1 (HS1) and the Younger Dryas (YD) (iii) an arid interval from 11.5 ka to 8.5 ka, and (iv) a general trend to more humid climate until 3.0 ka, followed by (v) a drier interval until 1.0 ka. The Madagascar climatic signal is opposite to other records from South Africa and East Africa records especially during the YD and early to middle Holocene period. This regional dipole mode is consistent with the modern rainfall anomaly pattern associated with the variability of Mozambique Channel Trough and the migration of austral summer Intertropical Convergence Zone (ITCZ) position as a response to changes in local summer insolation orbital and/or Northern Hemisphere cold events, such as the YD and HS1.

How to cite: Norström, E., Smittenberg, R., Ekblom, A., Haberle, S., and Katrantsiotis, C.: Late Quaternary climate variability in Madagascar and its connection to South-East Africa hydroclimate changes and atmospheric circulation patterns, EGU General Assembly 2023, Vienna, Austria, 23–28 Apr 2023, EGU23-12410, https://doi.org/10.5194/egusphere-egu23-12410, 2023.

EGU23-12950 | Orals | SSP2.2

Sulphur isotopes in Permian–Triassic evaporites: an 80‐million‐year record of pyrite burial 

Jack Salisbury, Darren Gröcke, H.D.R. Ashleigh Cheung, Lee Kump, Tom McKie, and Alastair Ruffell

The Permian–Triassic time interval is associated with major perturbations in the biogeochemical cycling of several redox-sensitive elements. In particular, sulphur isotope ratios (δ34S) reveal substantial perturbations in sedimentary sulphates. Despite this, few studies utilise this δ34S variability for long-term high-resolution correlation. Through the sulphur isotope analysis of sedimentary evaporites of the Staithes S-20 borehole (northeast England), we have generated the most stratigraphically complete evaporite sulphur isotope (δ34Sevap) curve from a single stratigraphic section for the late Permian to Late Triassic. The Staithes S-20 record and its comparison with the global δ34Sevap curve demonstrate the utility of sulphur isotope data for stratigraphic correlation and dating, especially evaporite bearing sequences. The δ34Sevap data for the late Permian to Late Triassic were incorporated into a biogeochemical box model to yield estimates for the pyrite burial flux with time. We propose three significant pyrite burial events (i.e. PBEs) throughout the Triassic. Our model outputs predict a major increase in pyrite burial over the Permian/Triassic boundary, possibly driven by Siberian Traps volcanism. After ~10 million years, the pyrite burial flux achieves relative stability until the latest Triassic.  

How to cite: Salisbury, J., Gröcke, D., Cheung, H. D. R. A., Kump, L., McKie, T., and Ruffell, A.: Sulphur isotopes in Permian–Triassic evaporites: an 80‐million‐year record of pyrite burial, EGU General Assembly 2023, Vienna, Austria, 23–28 Apr 2023, EGU23-12950, https://doi.org/10.5194/egusphere-egu23-12950, 2023.

EGU23-13034 | ECS | Posters on site | SSP2.2

A Siderian Snowball Earth? Multiscale and interdisciplinary Analyses of the Makganyene Formation, South Africa 

Sabine Wimmer, Daniel P. Le Heron, Marie E. Busfield, and Albertus J.B. Smith

Snowball Earth events, or at least intense glaciations, belong to one of the most important types of events in Earth’s Deep Time climate record. The Siderian (2.45–2.22 Ga) contained several such events, during which a diamictite-dominated succession named the Makganyene Formation was deposited in the Griqualand West Basin, South Africa. By comparison to their younger cousins in the Cryogenian, Siderian diamictites have been subject to comparatively less sedimentological investigation, although they have much potential in terms of reconstructing aspects of paleoclimate and former ice-sheet behaviour. In this study, multiscale and interdisciplinary analyses of both field and core data provide new insights into the sedimentology and deposition of the Makganyene and thereby aspects of its associated glaciation in the Siderian. Outcrop and core descriptions were supplemented by polarised light microscopic and scanning electron microscopic analyses, including element distribution maps for Al, Ca, Fe, Mg, Si and Ti. We propose that the deposits are the record of grounding zone wedge (GZW) deposition at the ice margin, with a contribution of iceberg-rain out, subglacial deposition and localised mass flow deposition playing a role. We show how interdisciplinary perspectives enrich the overall picture and allow a more accurate interpretation of the Makganyene Formation as a glacigenic sediment. 

How to cite: Wimmer, S., Le Heron, D. P., Busfield, M. E., and Smith, A. J. B.: A Siderian Snowball Earth? Multiscale and interdisciplinary Analyses of the Makganyene Formation, South Africa, EGU General Assembly 2023, Vienna, Austria, 23–28 Apr 2023, EGU23-13034, https://doi.org/10.5194/egusphere-egu23-13034, 2023.

EGU23-13268 | Posters on site | SSP2.2

Devonian mass extinctions: cumulative or cataclysmic? 

David Bond, Sarah Greene, Jason Hilton, Gilda Lopes, Jing Lu, John Marshall, Ye Wang, Charles Wellman, and Runsheng Yin

The Late Devonian Mass Extinction is the least understood of the ‘Big 5’ extinctions in virtually every aspect: timing, effects and causes - and there is little knowledge of the coupling of events on land and in the ocean. At one extreme, the marine crisis is viewed as a rapid, cataclysmic event at the Frasnian/Famennian boundary (the “Kellwasser Event”) followed by another crisis 13 Myr later (the “Hangenberg Event”). Alternatively, these Late and end-Devonian extinctions are viewed as a cumulative series of minor events, drawn out over the entire Devonian. Our project aims to resolve these through study of the spectacular Devonian sedimentary succession in northern Spain that is both remarkably complete and laterally extensive, providing a transect across an entire Devonian marine shelf from deep marine to near terrestrial environments. We present initial results from Piedrasecha, north of Léon. We analysed 47 samples spanning the Frasnian Nocedo Formation, and the Famennian-Tournasian (Carboniferous) Fueyo, Ermita and Baleas Formations. Combined geochemical and palynological analyses reveal:

1) δ13Corg values are stable around -26‰ through the Frasnian and Famennian prior to a 2‰ negative shift associated with the onset of black mudstones at the base of the Baleas Formation (latest Famennian). This is likely a muted expression of the Hangenberg Event negative δ13Corg excursion.

2) Redox proxies (Th/U, Mo/Al, V/Al and U/Al) indicate bottom waters remained oxygenated until the latest Famennian, when weakly dysoxic (at worst) conditions developed. There is no obvious expression of Kellwasser Event anoxia in this offshore setting, and only a weak manifestation of Hangenberg oxygen restriction.

3) An order of magnitude shift in productivity proxy values (Ba/Al, Ni/Al, Zn/Al and P/Al) in the latest Famennian suggests that the Hangenberg Event is associated with increased primary productivity.

4) Mercury is enriched in the upper Frasnian Nocedo Formation where it withstands normalisation to TOC (Hg/TOC values reach 388 ppb/wt%, similar to those reported for the Upper Kellwasser Horizon elsewhere). This mercury might derive from large igneous province volcanism and is potentially a chemostratigraphic marker for the Kellwasser Event, though we require better stratigraphic control to evaluate this. Significant Hg enrichments (up to 160 ppb) in the latest Famennian Baleas Formation do not withstand normalisation, as TOC reaches 4.7 wt% at this level. The succession is thermally mature and since TOC drops with thermal maturity, Hg/TOC values might be elevated in comparison to original values.

5) Palynomorph assemblages are dominated by simple spores and Geminospora. The latter derives from the Mid-Late Devonian forest tree Archaeopteris. This suggests a rather homogenous vegetation typical of Late Devonian settings where successive extinctions stripped out diversity from terrestrial floras. However, it may be that in this distal section we are sampling spores that have been winnowed during transport. Work on other sections will enable us to test this.

We have sampled 14 further sections providing a complete Devonian succession and with >500 samples in preparation we hope to resolve whether the Late and end-Devonian crises were the result of cumulative stresses, or were indeed cataclysmic events.

How to cite: Bond, D., Greene, S., Hilton, J., Lopes, G., Lu, J., Marshall, J., Wang, Y., Wellman, C., and Yin, R.: Devonian mass extinctions: cumulative or cataclysmic?, EGU General Assembly 2023, Vienna, Austria, 23–28 Apr 2023, EGU23-13268, https://doi.org/10.5194/egusphere-egu23-13268, 2023.

The distribution of the bryozoans in the shallow-marine-estuarine sediments of the late Early–Late Eocene La Meseta Formation, Seymour Island shows a sharp decline in bryozoan biodiversity between the lower, basal transgressive facies of Telm1 and upper part of the formation (Telm6-7) at the end of Eocene (Hara 2001). In the lowermost part of LMF (Telm1) the cheilostome bryozoans, preserved as internal moulds systematically belonging to buguloids and catenicelloideans, at the present day are widely distributed in the tropical-warm temperate latitudes and deposited in the shallow-water settings (Hara 2015). Within a 2 meters thick interval of the basal transgressive facies of Telm1 unit, the most common are multilamellar colonies, showing a great variety of shapes dominated by celleporiforms and cerioporids.

The middle part of (LMF, Telm4-5) reveal a presence of the microporoideans and disc-shaped lunulitiform - warm-loving, free-living bryozoans. Environmentally, Recent, lunulitids are known to occur in warm, shallow-shelf conditions, at temperatures of 10-29˚C, on coarse, sandy to muddy bottom, what suggest the shallow-water setting for the middle part of the LMF.

10 million years older, the Cape Melville Formation on King George Island dated as Early Miocene is dominated by the infaunal bivalves, which provide a unique fossil record in the Antarctic Peninsula region during the latest Oligocene to earliest Miocene interglacial to glacial transition. Only one bryozoan was described identified as Aspidostoma melvillensis (Hara and Crame, 2004).

The shallow-marine, pectinid-rich biofacies of the Pecten Conglomerate of CIF, Cockburn Island, taxonomically shows the mosaic pattern in occurrence of bryozoan taxa, which are known from the Middle and Late Cretaceous, another originated in the Paleogene, as well as those which are solely common in the Neogene. Exclusively encrusting colony growth-form of the Pliocene biota suggests sedimentation in the shallow-water environment and indicates an interglacial palaeoenvironment of the CIF Formation (Hara & Crame, in revision).

The cold-water geographical distribution of the Recent bryozoans with dominant Neocheilostomatina of Buguloidea and the ascophoran lepraliomorphs of Smittinoidea and Schizoporelloidea, shows a dynamic history of this highly endemic fauna, which evolved over long period of time.

Hara, U. 2001. Bryozoa from the Eocene of Seymour Island, Antarctic Peninsula. Palaeontologia Polonica, In: Palaeontological Results of the Polish Antarctic Expeditions, Part III, 60, 33-156.

Hara U., 2015. Bryozoan internal moulds from the La Meseta Formation (Eocene) of Seymour Island, Antarctic Peninsula. Polish Polar Research, 36: 25-49.

  • Hara and J. A. Crame 2004. A new aspidostomatid bryozoan from the Cape Melville Formation (lower Miocene) of King George Island, West Antarctica. Antarctic Sciences, 16, 319-327.


How to cite: Hara, U.: Cenozoic bryozoan biota: their palaeoecology and climatic environmental significance  in Antarctic ecosystems , EGU General Assembly 2023, Vienna, Austria, 23–28 Apr 2023, EGU23-14043, https://doi.org/10.5194/egusphere-egu23-14043, 2023.

EGU23-14508 | Posters virtual | SSP2.2

Bathyal bivalve assemblages of the eastern Mediterranean record the Early-Middle Pleistocene transition 

Efterpi Koskeridou, Danae Thivaiou, Konstantina Agiadi, Frédéric Quillévéré, Pierre Moissette, and Jean-Jacques Cornée

Molluscs, and among them bivalves, are organisms known for their ability to precisely record paleoenvironmental changes, both in shallow and deep marine settings. When looking into the recent geological past, bivalve assemblages offer information on the climatic changes that have impacted their taxonomic compositions. In the eastern Mediterranean, assemblages of bathyal bivalves are scarce. In order to investigate the impact of climatic changes on deep-water bivalve communities during the Early-Middle Pleistocene Transition, we focus here on two well-dated sections on Rhodes Island (Greece) corresponding to the Lindos Bay Formation. The sections of Lindos and Lardos present a continuous sedimentation of fine, marly sediments, and cover the Marine Isotopic Stages (MIS) 32 to 18. A total of 15 samples were analysed, resulting in the recovery of 31 species of bathyal bivalves. The depositional depths of these samples are estimated to be between 150 and 500 m. All samples are dominated by Protobranch bivalves, with the larger diversity found in families Nuculanidae and Yoldiidae. Three species, found only in cool intervals, are now extinct: Ledella nicotrae, Katadesmia confusa, and Pseudoneilonella pusio. Differences in sample composition are thought to be due mainly to climatic rather than bathymetric conditions. Although the associations in most MIS are similar to those found in the Italian Pleistocene deposits, those of the MIS 21 interglacial (Nucula nucleusSaccella commutataCyclopecten hoskynsiLimea crassa) and the MIS 20 glacial (Saccella commutataBathyspinula excisaYoldiella curtaBathyarca spp.) are new for the Mediterranean region. These results imply that there were significant changes in bathyal bivalve associations during the climatic transitions of the Early-Middle Pleistocene and that modern bathyal associations of bivalves have been stabilized after the Middle Pleistocene.

How to cite: Koskeridou, E., Thivaiou, D., Agiadi, K., Quillévéré, F., Moissette, P., and Cornée, J.-J.: Bathyal bivalve assemblages of the eastern Mediterranean record the Early-Middle Pleistocene transition, EGU General Assembly 2023, Vienna, Austria, 23–28 Apr 2023, EGU23-14508, https://doi.org/10.5194/egusphere-egu23-14508, 2023.

EGU23-14596 | ECS | Orals | SSP2.2

Multiproxy constraints on recovery processes during the hyperthermal Toarcian Oceanic Anoxic Event 

Alicia Fantasia, Thierry Adatte, Jorge E. Spangenberg, Emanuela Mattioli, Marcel Regelous, Christian Salazar, Romain Millot, Stéphane Bodin, Thomas Letulle, Mikhail Rogov, and Guillaume Suan

Extreme and rapid climatic and environmental perturbations have punctuated Earth history. The causes and consequences of these past global-change events are relatively well constrained, but how the system can naturally recover through feedbacks remain largely unconstrained. The Toarcian in the Early Jurassic is an ideal time interval to understand the response of Earth system to rapid climate change. Indeed, it was marked by one of the most extreme hyperthermal events of the Phanerozoic accompanied by major environmental changes, named the Toarcian Oceanic Anoxic Event (T-OAE, ca. 183 Ma). Most studies have focused on the triggering mechanisms and the palaeoenvironmental response, whereas the recovery phase has been less studied. Increased chemical weathering of silicate rocks and burial of organic carbon are the two primary natural mechanisms generally proposed as negative feedbacks controlling the recovery. However, to date, the response of these feedbacks, their efficiency, and their timing are still uncertain, hampering an accurate view of the carbon cycle-climate dynamics. This study aims to tackle this lack of empirical data by providing a multi-proxy dataset combining sedimentological observations, mineralogical and geochemical analyses. Four worldwide distributed sites have been selected for this study: Fontaneilles in France (Grand Causses Basin), Vilyui in Siberia (Siberian Basin), Agua de la Falda in Chile (Andean Basin), and Ait Athmane in Morocco (High Atlas Basin). Our high-resolution carbon isotope records allow us to correlate the studied sites to trace the global carbon cycle dynamics in the aftermath of the Toarcian event. Lithium isotope ratios are used to trace global weathering rates and to understand processes that control the long-term carbon cycle. Our results indicate that higher silicate weathering rates during the Toarcian hyperthermal likely helped the climate system recover and return to cooler climatic conditions. High mercury and tellurium concentrations recorded after the T-OAE interval suggest that protracted Karoo-Ferrar volcanic activity may have played a role in the recovery.

How to cite: Fantasia, A., Adatte, T., Spangenberg, J. E., Mattioli, E., Regelous, M., Salazar, C., Millot, R., Bodin, S., Letulle, T., Rogov, M., and Suan, G.: Multiproxy constraints on recovery processes during the hyperthermal Toarcian Oceanic Anoxic Event, EGU General Assembly 2023, Vienna, Austria, 23–28 Apr 2023, EGU23-14596, https://doi.org/10.5194/egusphere-egu23-14596, 2023.

EGU23-15207 | Posters on site | SSP2.2

A climate perturbation at the Middle –Late Jurassic Transition? Evaluating the isotopic evidence 

Gregory Price, Bernát Heszler, Lauren-Marie Tansley Charlton, and Jade Cox

The Jurassic greenhouse is punctuated by short cooling intervals with at times postulated polar ice-sheet development. For example, oxygen isotope records of belemnite rostra and fish teeth from the Russian Platform, eastern France and western Switzerland have been interpreted to reveal a prominent decrease in seawater temperature during the Late Callovian–Early Oxfordian. This is in part the basis for a proposed an ice age at the Middle-Late Jurassic Transition. In contrast relatively constant oxygen isotope records and therefore seawater temperatures and carbon isotope values characterized by significant scatter but showing more positive values during the middle and late Callovian have been reported from elsewhere. The aim of this research has been to determine a stable isotope stratigraphy (from belemnites and oysters) principally from the Callovian-Oxfordian interval (from southern England) and integrate these data with existing data to assess the pattern of carbon and oxygen isotopic change.  Our marine macrofossil record reveals isotopic patterns that are generally comparable with other European basins. Carbon isotopic trends are consistent with bulk carbonate carbon isotope records displaying systematic fluctuations, the largest of which (Middle Callovian, Calloviense/Jason Zones to Early Oxfordian, Mariae Zone) corresponds to previously identified phases of environmental perturbation. Such a trend may have resulted from enhanced burial and preservation of organic matter, leaving the seawater more positive in terms of carbon. Cooling post-dates this positive carbon isotope excursion. Inferred cooling, derived from our oxygen isotope data from southern England, occurs within the Late Callovian and Oxfordian (Athleta to Mariae zones). Enhanced carbon burial and atmospheric carbon dioxide draw down may have induced cooling. In this study the analysis of a single region (southern England) allows some constraints on potential variable that may influence isotope records.


How to cite: Price, G., Heszler, B., Tansley Charlton, L.-M., and Cox, J.: A climate perturbation at the Middle –Late Jurassic Transition? Evaluating the isotopic evidence, EGU General Assembly 2023, Vienna, Austria, 23–28 Apr 2023, EGU23-15207, https://doi.org/10.5194/egusphere-egu23-15207, 2023.

EGU23-17352 | Orals | SSP2.2 | Highlight

Tracing ocean circulation using neodymium isotopes – promises and limitations 

Katharina Pahnke, Torben Struve, Mika Sutorius, Henning Waltemathe, and Martin Zander

Neodymium (Nd) isotopes have been applied for decades now to trace ocean circulation both in the present and past oceans. Their tracer utility stems from the characteristic Nd isotope signature of different rocks and their imprint on seawater as well as the biological inactivity of Nd and its appropriate residence time in the ocean, allowing for the determination of water mass provenance and flow paths. However, the application of this tracer, especially for the reconstruction of past ocean circulation changes, has been challenged based on uncertainties e. g. in the magnitude of the benthic flux of Nd to deep waters, Nd isotope exchange and input at ocean margins, and diagenetic alterations of the original bottom water Nd isotope signature in sediments.

Based on recent studies of dissolved Nd isotope distributions in surface to deep waters we show the power of Nd isotopes for tracing the provenance of currents and water masses particularly within restricted geographic regions. Using additional trace metal and isotope data from marine sediments analyzed alongside authigenic Nd isotopes, we explore the validity and limits of Nd isotopes as tracer of past ocean circulation changes.

How to cite: Pahnke, K., Struve, T., Sutorius, M., Waltemathe, H., and Zander, M.: Tracing ocean circulation using neodymium isotopes – promises and limitations, EGU General Assembly 2023, Vienna, Austria, 23–28 Apr 2023, EGU23-17352, https://doi.org/10.5194/egusphere-egu23-17352, 2023.

EGU23-17389 | Orals | SSP2.2

A millennial-scale record of mean annual air temperatures spanning 70 ka over the Cretaceous-Paleogene boundary 

Lauren O'Connor, Rhodri Jerrett, Gregory Price, Bart van Dongen, Emily Crampton-Flood, and Sabine Lengger

The Cretaceous-Paleogene (K-Pg) boundary experienced major environmental perturbations due to volcanism and bolide impact, as well as the most famous mass extinction in geologic history. However, the response of the climate system to these drivers at different timescales, and thus their relationship to the mass extinction is highly debated. In particular, the role of climate change in biodiversity patterns immediately preceding the boundary is poorly understood. 


Lipids from fossil peats (coals) provide an opportunity to reconstruct terrestrial temperatures across the Cretaceous–Paleogene boundary at a millennial-scale resolution. Here we present mean annual air temperature records spanning ~70 ka over the K-Pg boundary, from sites across North America (palaeolatitudes 45–55 degrees N). Our data show that temperatures ranged from 16–29 degrees C, more than 10 degrees C higher modern temperatures at equivalent latitudes in North America.


Using 5-ka temporal bins, our data show that MAATs peaked at ~26 degrees C in the last millennia of the Cretaceous, following 35 ka of warming from ~23 degrees C. Peak warmth was followed by ~5 degrees C cooling over the following 30 ka. We observe no “impact winter” nor a spike in temperature immediately following the boundary. If such phenomena occurred, their duration was below the resolution of our record: ~1 ka. Our record also shows a previously unrecognised brief interval of cooling from 10 to 5 ka pre-boundary.


Our study places new bounds on millennial-scale trends in MAAT change in the terrestrial realm and demonstrates large and rapid temperature swings across the K-Pg interval. These data allow for improved understanding of the role of climate in the decline of Cretaceous flora and fauna and may help elucidate the relative influence of volcanism and bolide impact on terrestrial temperatures.

How to cite: O'Connor, L., Jerrett, R., Price, G., van Dongen, B., Crampton-Flood, E., and Lengger, S.: A millennial-scale record of mean annual air temperatures spanning 70 ka over the Cretaceous-Paleogene boundary, EGU General Assembly 2023, Vienna, Austria, 23–28 Apr 2023, EGU23-17389, https://doi.org/10.5194/egusphere-egu23-17389, 2023.

EGU23-274 | ECS | Orals | SSP4.2

Late quaternary carbonate (pteropod) preservation in the Indian Ocean sediments: inferences on the paleoclimate and paleoceanography 

Sreevidya Edayiliam, Sijin Kumar Adukkam Veedu, and Nagender Nath Bejugam

To evaluate the preservation pattern of pteropods and their relationship with climatic and oceanographic history in the Laccadive Sea, a temporal variation analysis of pteropod abundance was done. For that, we employed preservation indices from calcite (Globigerina bulloides%, Globorotalia menardii abundance), as well as aragonite (e.g., total pteropod abundance, Limacina Dissolution Index (LDX), fragmentation ratio). To determine if pteropod shells have been preserved over time, we used estimated pteropod abundance. The pteropod preservation record displays excellent preservation during cold stadials, evidenced by the lower values of aragonite dissolution proxies than during the interglacials/interstadials, similar to the preservation records from other northern Indian Ocean cores evidenced by the lower values of aragonite dissolution proxies than during the interglacials/interstadials. The shallow aragonite compensation depth (ACD), weaker oxygen minimum zone (OMZ), and the lower southwest monsoon (SWM)-induced productivity are thought to be the cause of the basin-wide pteropod preservation events during the cold stadials (ACD). Additionally, during an intense northeast monsoon (NEM), the advection of cold, low-saline waters from the Bay of Bengal to the Laccadive Sea, as well as the intrusion of southern-sourced intermediate water ventilation, may have caused a deep vertical mixing of oxygen-rich surface waters, raised the pH of thermocline waters and deepened the ACD. However, the local fluctuations in the water mass properties, such as the increased productivity maxima, the intense OMZ, and shallow ACD, as well as changes in the aragonite, are responsible for the poor pteropod abundance, poor preservation and strong dissolution during the Holocene, Bølling-Allerød (B/A) and interstadial periods.

The calcification proxy indicates that the aragonite undersaturation and reduced calcification occurred during 19-16.5 kyr, preferably due to the depletion in the oceanic alkalinity caused by enhanced upwelling-induced carbonate ion exchange between the intermediate and deep water. In contrast, the preferential dissolution of smaller shells in the sediments (marked by increased average shell size and higher values of Limacina dissolution index (LDX) corresponds to strengthened OMZ and shallower ACD, pointing towards the post-depositional dissolution of aragonite shells. Therefore, the overall decrease of pteropod content of the deposits in the stadial/interstadials suggests a combination of monsoon-associated changes in water column properties, variability in aragonite saturation, intermediate water ventilation and sediment rate.

How to cite: Edayiliam, S., Adukkam Veedu, S. K., and Bejugam, N. N.: Late quaternary carbonate (pteropod) preservation in the Indian Ocean sediments: inferences on the paleoclimate and paleoceanography, EGU General Assembly 2023, Vienna, Austria, 23–28 Apr 2023, EGU23-274, https://doi.org/10.5194/egusphere-egu23-274, 2023.

EGU23-618 | ECS | Posters virtual | SSP4.2

Reconstruction of a paleo-seagrass ecosystem using molluscan paleoecology and stable isotope geochemistry: A case study from the Quilon Limestone (Miocene), India. 

Venu Gopal Kella, Amitaprajna Mallik, Devapriya Chattopadhyay, and Naveen Gandhi

Seagrasses are a vital part of the marine ecosystem, owing to their contribution to oceanic primary productivity and supporting highly diverse marine ecosystems. The fossil record of seagrasses is rare because of their poor preservation potential. Sedimentological and taphonomic indicators are generally used to identify the paleo seagrass habitat. The fossil record of seagrass-associated taxa such as foraminifera, corals, bryozoans, molluscs, and sirenians can also provide indirect evidence of this specific habitat. These constitute Indirect Paleo-Seagrass Indicators (IPSIs). The early Miocene (Burdigalian) fossil assemblage of Quilon limestone of Kerala, India, has been interpreted as a seagrass habitat based on the species association of gastropods, bryozoans, and foraminifera. This is the only reported seagrass ecosystem from West Indian Province (WIP). In our study, we attempt to develop a new multi-proxy approach using morphology, ecology, and geochemical signatures of seagrass-associated molluscs from the Quilon Formation and evaluate its potential to reconstruct a paleo-seagrass ecosystem.

Our sample consisted of ~2000 specimens of microbivalves representing nine families of bivalves. We also included previously reported 16 families of macrobivalves in our ecological analysis. The molluscan community of the Quilon Formation is dominated by families that are mobile (67%), infaunal (65%), and suspension feeders (78%) in comparison to other ecological guilds. The seagrass ecosystem, characterized by soft substratum and high suspension load, favors these ecological strategies. The high proportional abundance of Lucinidae bivalves (8.9%) in the assemblage agrees with the expectation of dominance of chemosymbionts in the seagrass meadows. The small body size (<10mm ) and low predation intensity (drilling frequency 0.06, repair scar frequency 0.04) reported from this community also match the expected pattern of a seagrass ecosystem serving as a nursery.

We analyzed molluscan shells from Quilon limestone for stable isotope ratios. We also supplemented this data with published data of present and past seagrass-associated molluscs. Using this data, we evaluated the influence of ecological variables in shaping the stable isotope signature of molluscs in the seagrass ecosystem. The 𝛅13C values of bivalves ranged from -3 to 3 ‰  and of gastropods ranged from -1 to 4 ‰. Our results show that deposit feeders and grazers have 𝛅13C values in comparison to chemosymbionts. The herbivores and carnivores have comparable 𝛅13C and 𝛅18O isotopic values implying a limited role of diet in shaping the isotopic signature of seagrass molluscs. 

The multi-proxy results support the previous interpretation of Quilon limestone as a seagrass ecosystem. This study provides insight into using a multi-proxy approach of combining molluscan taxonomy, morphology, ecology, and geochemistry in developing a reliable IPSI for identifying paleo-seagrass ecosystems.

How to cite: Kella, V. G., Mallik, A., Chattopadhyay, D., and Gandhi, N.: Reconstruction of a paleo-seagrass ecosystem using molluscan paleoecology and stable isotope geochemistry: A case study from the Quilon Limestone (Miocene), India., EGU General Assembly 2023, Vienna, Austria, 23–28 Apr 2023, EGU23-618, https://doi.org/10.5194/egusphere-egu23-618, 2023.

EGU23-635 | ECS | Posters virtual | SSP4.2

Deglacial- Holocene carbonate preservation in the Bay of Bengal 

Gayathri Narath Meethal, Sreevidya Edayiliam, Bhoi Subhakanta, Sahoo Subham Kesari, and Sijinkumar Adukkam Veedu

Deep-sea carbonate dissolution/preservation history is important to better understand marine carbonate system and surface ocean productivity. To understand carbonate dissolution during the last deglacial and Holocene periods in the Eastern BoB, we analyzed foraminifera carbonate dissolution indices viz., perfect test ratio (PTR) of Globorotalia menardii, Menardii fragmentation index (MFI), percentage of total resistant species (RSP), and percentage of total susceptible species (SSP). The core yielded rich assemblages of planktonic foraminifera though retrieved from deeper water depth (3019 m) of the Eastern Bay of Bengal. In general, the preservation is better during last glacial period on record (16-11.7 ka) and poor during Holocene. During Holocene, carbonate dissolution is intense in the early Holocene (12.5 to 8 ka), marked by increased MFI, and decreased PTR values along with less abundance of susceptible species. A slight decrease in the MFI was seen from 8 to 4.9 ka. The late Holocene period was characterized by less MFI and high PTR values. In general, MFI (PTR) was high (low) during the early Holocene compared to the deglacial and mid to late Holocene periods. Interestingly, the dissolution record shows a good relationship with Indian summer monsoon variability. The intense dissolution of the early Holocene might be due to changes in water column chemistry due to the increased river runoff and direct precipitation. We compared our data with existing records from the Andaman Sea and the Central Indian Ocean. The assemblages from the Bay of Bengal show a high degree of dissolution and low preservation during interglacial periods. The result of this study explains that dissolution is more pronounced during the warm interglacial and interstadials and MFI and PTR can be a potential proxy for quantitatively tracking deep marine CaCO3 dissolution in the Bay of Bengal.


Keywords: Carbonate dissolution; Planktonic foraminifera, Globorotalia Menardii, deglacial, Holocene.


How to cite: Narath Meethal, G., Edayiliam, S., Subhakanta, B., Subham Kesari, S., and Adukkam Veedu, S.: Deglacial- Holocene carbonate preservation in the Bay of Bengal, EGU General Assembly 2023, Vienna, Austria, 23–28 Apr 2023, EGU23-635, https://doi.org/10.5194/egusphere-egu23-635, 2023.

Stable isotope (δ18O and δ13C) record of the shells of Crassostrea has served as trusted sclerochronological recorders for deciphering the life history and the interannual ambient seawater conditions including temperature and salinity. Several species of Crassostrea are found in modern estuarine system throughout the world. The Bay of Bengal (BOB) in the northern Indian ocean is one such region which experiences the lowest salinity in the tropics due to exceptional and complex hydrological dynamics associated to the Indian monsoon. In this study, we utilized three shells of the endemic species, that are cemented together.  We collected the specimens from Chandipur-on-sea BOB, in the eastern coast of India to understand the relationship between isotope signatures of the shells (δ18Oshell and δ13Cshell), growth history and the environmental parameters (temperature and salinity).

In terms of the microstructural variation within the shells, samples collected from the foliated layer as compared to the chalky calcite layer of the cross sectional hinge region demonstrates no significant difference in their isotopic values. The theoretical isotope profile model based on the satellite data for monthly temperature and salinity data provided the background pattern which when compared to the observed isotope values demonstrated no significant difference for Cha 2 and Cha 3, however, the isotope value of Cha 1 shifted significantly towards negative values. The isotope profile for all the individuals are sinusoidal with repeating δ18Oshell and δ13Cshell minima in the form of relatively sharper and narrower negative half cycles and demonstrates negative offset from the predicted model someimes. We infer the negative shifts and offset of the isotope minimas to be attributed to the lower salinity due to river runoff and precipitation during summer monsoon in this region which also leads to slow or limited growth of the oysters. The grey foliated calcitic bands within the chalky calcitic layers do not incorporate the amplitudes or a particular trend of the isotopic profiles representing no seasonal signature and hence cannot be utilised as age indicators for C.cuttackensis. However, the count of minimas in the isotope profiles revealed the age to be slightly more than 1 year for Cha1 and Cha3 whereas Cha 2 lived for three years atleast. The corresponding growth rates for length and height of the shells decreases with ontogeny, more so for the length than height validating the elongated shape of C.cuttackensis in their adulthood. When compared, the calculated growth rates for C.cuttackensis is highest among all other present and past Crassostrea species globally.

How to cite: Dutta, S. and Chattopadhyay, D.: Signature of monsoon driven salinity fluctuations in stable isotope (oxygen and carbon) record of bivalve shells: Insights from the sclerochronology of three confluent individuals from the Bay of Bengal, India, EGU General Assembly 2023, Vienna, Austria, 23–28 Apr 2023, EGU23-796, https://doi.org/10.5194/egusphere-egu23-796, 2023.

The Precambrian stromatolites are essential proxies for early life on earth. However, recent studies on abiogenic features having gross similarity with biogenic forms have made it difficult to prove their unequivocal biogenecity. Key morphological indicators of stromatolite biogenecity include- its morphological variations, biostrome development, growth through high-energy conditions, and lamina accretion through microbial precipitation, trapping, and binding. A representative outcrop of the Proterozoic stromatolites belonging to the Bhander Limestone and a small horizon present at the base of Sirbu Shale Member, Upper Vindhyan Group of Vindhyan Basin, central India is studied during the present endeavor. Six different stromatolite morphotypes were identified within the studied intervals. Among them, five morphotypes are present within the Bhander Limestone such as large laterally-linked domal stromatolites (S1), columnar stromatolites (both bioherm (S2) and biostrome (S3) type), small-headed stromatolites (S4) and stratiform stromatolites (S5).

Numerous cycles are observed between these morphotypes, especially between the columnar and the small-headed stromatolites. The thickness of the individual cycle varies between 32 cm to 162 cm. The cycles always start with the columnar morphotype (average thickness~57.71 cm) and end with the small-headed morphotype (average thickness ~16.90 cm). The former morphotype (average column height and diameter 7.39 cm and 3.38 cm) shows different variety-branched patterns, vertical and inclined nature. Vertically oriented columns are parallel in nature. The width of the inter-columnar area between the individual parallel columns is variable (average thickness~1.33 cm). The filling material is carbonate cement, stromatolite debris, and chunks. The presence of stromatolite debris within the inter-columnar area indicates agitation within the depositional site. The inclined and branched columnar morphotypes tend to develop bioherm (S2), while the vertically oriented, parallel-natured columnar stromatolites form the biostrome (S3). At the end of each cycle, microbial laminites (thickness ranging from 1 to 8.5 cm) is frequently observed. Occasionally microbial laminites are also present when columnar stromatolites transit to small-headed stromatolites. The latter morphotype has an average column diameter of 1.84 cm. The cyclic alternation of columnar and small-headed stromatolite morphotypes indicates a shift in water depth within the depositional zone, which could be caused by seasonal fluctuation, diurnal cycles, or tectonic factors. Gradual thickness increment of the small-headed morphotypes within the individual cycles towards the upper part of the studied interval indicates a progressive shallowing. A petrographic study reveals the presence of alternate dark-colored micritic and light-colored spar-bearing laminae. The dark micritic laminae attest deposition took place under microbial influence. The sixth morphotype is cabbage-shaped domal stromatolite (S6) (average column height and diameter are 27.11 cm and 20.75 cm, respectively), present only at the basal part of the Sirbu Shale. These domal stromatolites occur above an alternating sand-shale sequence bearing emergence features and form bioherms. Under the microscope, this morphotype shows the presence of ooids and peloids within the dark micritic laminae. Both macro and micro scale variations recorded within the studied stromatolites of the Meso-Neoproterozoic Vindhyan Basin are inkling towards their biogenic origin.

How to cite: Choudhuri, A., Jambhule, D., Sinha, S., and Srimani, S.: Morphological variability of stromatolites and their cyclicity as an indicator of biogenicity- example from a Proterozoic carbonate platform of Vindhyan Supergroup, India, EGU General Assembly 2023, Vienna, Austria, 23–28 Apr 2023, EGU23-2272, https://doi.org/10.5194/egusphere-egu23-2272, 2023.

EGU23-2432 | ECS | Posters virtual | SSP4.2

Paleoclimate and paleoenvironment reconstructions from Middle Eocene successions in Egypt: Geochemical and micropaleontological approaches 

Mostafa Mohamed Sayed, Petra Heinz, Ibrahim Mohamed Abd El-Gaied, and Michael Wagreich

Forty-three rock samples have been collected from two sections, exposed at south east Beni-Suef area, Egypt. These samples showed richness in benthic foraminiferal assemblages and only rare occurrences of index planktonic foraminifera. The studied outcrops were lithologically subdivided into two Middle Eocene rock units named from base to top as follow: (1) the Qarara Formation (Lutetian) and (2) the El Fashn Formation (Bartonian). The investigated rock samples yielded 160 foraminifera species and subspecies which belonging to 4 suborders, 19 superfamilies, 34 families and 59 genera. The stratigraphic distribution of the identified species allowed us to construct four local benthic biozones which are: (1) Bolivina carinata Lowest Occurrence Zone (Lutetian), (2) Bulimina jacksonensis Lowest Occurrence Zone, (3) Nonion scaphum Lowest Occurrence Zone and (4) Brizalina cooki / Nonionella insecta Concurrent-Range Zone (Bartonian). These biozones were described and discussed in detail and correlated to equivalents recorded before in Egypt. The rareness of index planktonic foraminifers through the studied sections did not allow a biozonation. The shale samples showed low TOC values which may be related to high sediment influx and/or subjected to oxidation conditions. Bulk rock geochemistry, consistend with the benthic foraminifera ecological preferences, showed that the studied sections were deposited in moderate to high oxygen levels, warm climatic conditions and typical shelf marine settings. The identified species showed strong similarities with southern Tethys areas such as Libya, reflecting migration via trans-Sahara seaway, and minor similarities with those identified from the northwestern Tethys (Italy, France, Spain, England) province attributed to the benthic nature which limit their ability to move for a long distance and related to cooler, latitudinal zoned climatic conditions which was unsuitable for their biological demands.

How to cite: Mohamed Sayed, M., Heinz, P., Mohamed Abd El-Gaied, I., and Wagreich, M.: Paleoclimate and paleoenvironment reconstructions from Middle Eocene successions in Egypt: Geochemical and micropaleontological approaches, EGU General Assembly 2023, Vienna, Austria, 23–28 Apr 2023, EGU23-2432, https://doi.org/10.5194/egusphere-egu23-2432, 2023.

EGU23-4915 | ECS | Posters on site | SSP4.2 | Highlight

A data-model comparison of shallow marine seasonality during the Mid-Pliocene 

Niels de Winter, Julia Tindall, Andy Johnson, Barbara Goudsmit, Nina Wichern, Fynn Huygen, Stijn Goolaerts, Frank Wesselingh, Philippe Claeys, and Martin Ziegler

Accurate projections of future climate scenarios require a detailed understanding of the behavior of Earth’s climate system under varying radiative forcing scenarios. The mid-Piacenzian Warm Period (mPWP; 3.3 – 3.0 Ma) was characterized by atmospheric CO2 concentrations comparable to present-day values (~400 ppmV), while global mean annual temperatures were roughly 2-3 degrees warmer compared to pre-industrial climate (Haywood et al., 2020). Seasonally resolved climate records from fossil bivalve shells offer a snapshot of short-term variability in temperature and salinity under the mild greenhouse conditions of the mPWP (Wichern et al., 2022).

In this study, we combine a large dataset of clumped isotope measurements incrementally sampled in fossil shells from the North Sea area during the mPWP with climate model simulations for the same time period using the PlioMIP model comparison framework. This combination of data and models allows us to test whether the climate models in PlioMIP can pick up the sub-annual scale variability in temperature and salinity (reconstructed via the oxygen isotope composition of the paleo-seawater). We show that, in contrast to continental reconstructions used in previous PlioMIP data-model comparisons (Tindall et al., 2022), our shallow marine data is reproduced well by PlioMIP models. On average, both model and data show considerably (4-5°C) warmer summer sea surface temperatures during the mPWP while winter temperatures remain relatively close to pre-industrial values. This suggests that the North Sea region can expect warming concentrated in the summer season in response to elevated atmospheric CO2 conditions.

References

Haywood, A. M., Tindall, J. C., Dowsett, H. J., Dolan, A. M., Foley, K. M., Hunter, S. J., Hill, D. J., Chan, W.-L., Abe-Ouchi, A., Stepanek, C., Lohmann, G., Chandan, D., Peltier, W. R., Tan, N., Contoux, C., Ramstein, G., Li, X., Zhang, Z., Guo, C., Nisancioglu, K. H., Zhang, Q., Li, Q., Kamae, Y., Chandler, M. A., Sohl, L. E., Otto-Bliesner, B. L., Feng, R., Brady, E. C., Von der Heydt, A. S., Baatsen, M. L. J., and Lunt, D. J.: A return to large-scale features of Pliocene climate: the Pliocene Model Intercomparison Project Phase 2, Climate of the Past, 2020.

Tindall, J. C., Haywood, A. M., Salzmann, U., Dolan, A. M., and Fletcher, T.: The warm winter paradox in the Pliocene northern high latitudes, Climate of the Past, 18, 1385–1405, https://doi.org/10.5194/cp-18-1385-2022, 2022.

Wichern, N. M. A., de Winter, N. J., Johnson, A. L. A., Goolaerts, S., Wesselingh, F., Hamers, M. F., Kaskes, P., Claeys, P., and Ziegler, M.: The fossil bivalve <em>Angulus benedeni benedeni</em>: a potential seasonally resolved stable isotope-based climate archive to investigate Pliocene temperatures in the southern North Sea basin, EGUsphere, 1–53, https://doi.org/10.5194/egusphere-2022-951, 2022.

How to cite: de Winter, N., Tindall, J., Johnson, A., Goudsmit, B., Wichern, N., Huygen, F., Goolaerts, S., Wesselingh, F., Claeys, P., and Ziegler, M.: A data-model comparison of shallow marine seasonality during the Mid-Pliocene, EGU General Assembly 2023, Vienna, Austria, 23–28 Apr 2023, EGU23-4915, https://doi.org/10.5194/egusphere-egu23-4915, 2023.

EGU23-5544 | ECS | Orals | SSP4.2

Developing a robust biogeochemical framework of the coccolith vital effects for more reliable paleoclimatic reconstructions 

Goulwen Le Guevel, Fabrice Minoletti, Carla Geisen, and Michael Hermoso

The major climatic forcing parameters on Earth climate are temperature and the atmospheric concentrations of CO2. Even if their evolutions covaried to the first-order, the geological record show periods with non-linear evolution between those two parameters. Such delinking requires accurate paleoclimate reconstructions with implications for the modelling studies of our future climate.

pCO2 and Sea Surface Temperature (SST) reconstructions are usually quantified using proxies relying on both the organic matter produced by coccolithophores (UK37’ index and δ13Calkenones) and calcite of foraminiferal tests (δ11B, δ18O, Mg/Ca). These proxies have been very useful for a variety of paleoclimatic advances, yet present unresolved and potentially important biases. As an example, alkenone carbon isotopes are not able to register low to moderate pCO2 levels (Badger et al., 2019). This is notoriously a major issue for paleoclimate reconstructions of the last 6 My (Plio-Pleistocene period).

Our approach is to use a unique archive – the coccoliths – for determination of coeval SST and pCO2. Coccoliths are small calcite plates produced by unicellular photosynthetic algae called coccolithophores. They are a very promising substrate to analyse for paleoclimate studies because they calcify in the uppermost water column and because their isotopic ratios are sensitive to both photosynthesis and calcification (Hermoso et al. 2020). Therefore, these isotopic ratios provide physiological and metabolic information about coccolithophores of the past. In order to infer paleoclimates from the sedimentary archives, we have to deconvolve the isotopic biological imprint (vital effect) from the environment signal. For the evaluation of the vital effects, we have undertaken a large-scaled culture experiments with various strains of coccolithophore grown under various CO2 concentrations and pH (Le Guevel et al. in prep). Even if we have managed culture until 1400ppm and 7.55 unit of pH, we were particularly interested in low pCO2 and high pH conditions because the bibliography is lacking of vital effect for Plio-Pleistocène applications. All the selected strains produce coccoliths within the size range of the one we find predominantly in the marine sediments throughout geological times.

We document a large decrease of the carbon differential vital effect with the CO2 concentration increase between Gephyrocapsa oceanica and Coccolithus braarudii. This is consistent with previous studies but the absolute values are slightly different and we provide a more precise dataset at low to moderate pCO2 than the previous ones (Rickaby et al., 2010; Hermoso et al., 2016). We propose the first study of the oxygen and carbon vital effect of the Helicosphaera carteri group with combined CO2/pH changes. Taken together, the culture data and measurements of the isotopic composition of the calcite biominerals allows better paleoreconstructions of SST and aqueous CO2.

How to cite: Le Guevel, G., Minoletti, F., Geisen, C., and Hermoso, M.: Developing a robust biogeochemical framework of the coccolith vital effects for more reliable paleoclimatic reconstructions, EGU General Assembly 2023, Vienna, Austria, 23–28 Apr 2023, EGU23-5544, https://doi.org/10.5194/egusphere-egu23-5544, 2023.

EGU23-6697 | ECS | Orals | SSP4.2

Reconstructing Holocene body size changes of Adriatic gobies using radiocarbon dating and sclerochronological analyses of modern and fossil otoliths 

Isabella Leonhard, Konstantina Agiadi, Rafal Nawrot, Emilia Jarochowska, and Martin Zuschin

Climate warming is expected to lead to a reduction in the body size of marine organisms, a trend already observed in commercial fishes, but the effects of temperature rise on size distribution in exploited populations are difficult to separate from the impact of overfishing and other anthropogenic stressors. We aim to test the hypothesis that fish body sizes, as well as growth rates changed during the late Holocene and Anthropocene in the northern Adriatic Sea due to environmental perturbations caused by climate warming. We perform sclerochronological analysis on modern otoliths from fish sampled alive, as well as radiocarbon-dated fossil otoliths of non-commercial, demersal gobies (Gobius niger Linnaeus, 1758) sampled from a sediment core taken off Piran (Slovenia) to quantify changes in body size and growth parameters throughout the Holocene. Otoliths are the aragonitic structures of the fish’ inner ear with species-specific morphology, and thanks to their incremental growth, they serve as unique environmental and life-history archive. Moreover, otolith size correlates with fish size. We use otoliths cut in half to perform both sclerochronology and radiocarbon dating, obtaining a high-resolution time series of changes in fish body size, growth dynamics and life history parameters. We employ backscatter electron (BSE) imaging and electron probe microanalysis (EPMA) to identify body sizes and growth dynamics, as well as to correlate their growth increments with climatic and other environmental parameters. The reconstructed changes in body size and growth rates of very common, non-commercial fish species over the last 7.000 years, can serve as an ecological baseline for evaluating the magnitude of ongoing temperature rise and future shifts in fish populations in response to global warming.

How to cite: Leonhard, I., Agiadi, K., Nawrot, R., Jarochowska, E., and Zuschin, M.: Reconstructing Holocene body size changes of Adriatic gobies using radiocarbon dating and sclerochronological analyses of modern and fossil otoliths, EGU General Assembly 2023, Vienna, Austria, 23–28 Apr 2023, EGU23-6697, https://doi.org/10.5194/egusphere-egu23-6697, 2023.

EGU23-9157 | ECS | Posters on site | SSP4.2

Mineralogical, elemental, stable and clumped isotope composition of modern bryozoan skeletons. 

Marie Pesnin, Thaler Caroline, Daëron Mathieu, Kadda Medjoubi, Nomade Sebastien, and Rollion-Bard Claire

Bryozoans are one of the most invasive phyla on Earth. Since their appearance in the Upper Ordovician period, a fair proportion of these colonial organisms have developed innovative adaptation strategies, like the ability to form a carbonate skeleton. Despite the fact that these reef builders can represent up to 80% of the carbonate production of some sedimentary formation, bryozoans have been poorly studied compared to other bio-carbonate archives. The diversity of bryozoan morphology is an impediment to their identification and their use for paleoenvironmental reconstruction. The morphology of the carbonate chambers (zoecium) varies not only from one species to another, but also as a function of physiological or environmental parameters. Moreover, depending on the species, bryozoan carbonate skeleton can be polycrystalline. The abundance of each carbonate polymorph can vary spatially within the colony, which has implications for the interpretation of the geochemical record. In order to retrieve useful paleoenvironmental information from this extensive record, we thus need to fill the gaps in our knowledge of bryozoan mineralization mechanisms.

In this contribution, we characterized the mineralogical and isotopic composition of different species of bryozoan living in the same microenvironments and identical species from different locations. Samples were collected from the Western Mediterranean (Marine station of Banyuls sur Mer, France) and North Atlantic (Marine station of Roscoff, France) coasts, where environmental parameters are continuously measured. Mineral characterization by XRD measurements were done on portions of each bryozoan colonies from base to the top and completed by 3D X-Ray diffraction imaging at a nanometric scale on a single zoecium. These mineralogical characterizations were matched with δ18O, δ13C analysis and clumped isotope (Δ47) measurements. Using environmental data (T, pH, S, δ18Ow and δ13CDIC) collected in situ, the measured isotopic signatures were compared to their respective expected values (assuming pseudo-equilibrium carbonate precipitation). This comparative work yields some unexpected discrepancies from the “equilibrium” line and between different species originated from the same site in both δ18O and δ13C compositions. Δ47measurements, performed on 4 selected species (Pentapora foliacea, Cellaria fistulosa, Sertella beaniana, Tubicellepora avicularis) revealed that the magnitude of apparent isotopic disequilibrium observed in bryozoan is not related to the mineralogical composition of the skeleton nor to the species but rather to the living environment of the organisms. Surprisingly only bryozoan originated from the Mediterranean Sea seems to precipitated their skeleton out of isotopic equilibrium for Δ47. These results permit to discuss the origin of this “isotopic vital effect”, its relation to environmental conditions, and the use of bryozoan as a new paleo-tracer.

Key words: Bryozoan – 3D X-Ray map - Clumped isotopes – Stable isotopes - Isotopic disequilibrium.

How to cite: Pesnin, M., Caroline, T., Mathieu, D., Medjoubi, K., Sebastien, N., and Claire, R.-B.: Mineralogical, elemental, stable and clumped isotope composition of modern bryozoan skeletons., EGU General Assembly 2023, Vienna, Austria, 23–28 Apr 2023, EGU23-9157, https://doi.org/10.5194/egusphere-egu23-9157, 2023.

EGU23-10717 | ECS | Orals | SSP4.2

The fate of Arsenic during early microbialite taphonomy: Implications for chemical biosignature preservation 

Clément G.L. Pollier, Caroline H. Koschik, Brooke E. Vitek, Zhenghui Wu, Erica P. Suosaari, R. Pamela Reid, and Amanda M. Oehlert

Organo-sedimentary structures built by benthic microbial communities, known as microbialites, dominated the fossil record for the first 3 billion years of Earth’s history. Various microbial metabolisms contribute to microbialite lithification, each of which can be based on biogeochemical cycling of elements capable of supporting life. Arsenic (As), a common element on the surface of Precambrian Earth, has been proposed to have supported the development of early life associated with the construction of primitive microbial carbonates. These As-based metabolisms have left evidence of their existence within the 2.7 Ga old Tumbiana stromatolites, showing the potential of this metalloid to serve as an archive of the dynamic interplay between microbes, minerals, and their environment of deposition throughout Earth’s history. However, significant changes in the geochemical composition of microbialites likely occur during early taphonomic modification and later diagenetic alteration. Therefore, establishing the mechanisms driving the arsenic geochemistry of ancient microbialites can be challenging.

Motivated by these challenges, our objective was to evaluate the mechanisms controlling the initial incorporation of arsenic into actively accreting microbialites, as well as the preservation of the [As] signal during early taphonomic alteration of the structure. Hamelin Pool (Western Australia) is one of the few modern systems that host As-based metabolisms in the microbial communities involved in microbialite accretion. Conventional terminology recognizes four types of microbial mats that produce recognizable internal microfabrics in Hamelin Pool microbialites: pustular, smooth, colloform, and transitional mat types. Over time, these initial microfabrics all follow a similar evolution subdivided into two successive stages: (1) precipitation of micrite along laminations and around clots and; (2) precipitation of aragonitic marine cement. Therefore, Hamelin Pool microbialite fabrics provide a unique and step-wise window into the processes that form ancient microfabrics, particularly highlighting the importance of their early taphonomic evolution in the fate of the As biosignal originally incorporated during initial accretion of the structure.

Based on microbialites collected from Hamelin Pool that have been characterized petrographically, we evaluated the evolution of [As] recorded in the Hamelin Pool microbialites at all stages of deposition and early taphonomic modifications. Results were interpreted in relation to the distinct microbial mats and their metabolisms, as well as the physicochemical and geological variability of the depositional environment. To accomplish this, we conducted a sequential leaching experiment to chemically isolate the organic matter and carbonate fractions, and measured As concentrations on a triple-quadrupole inductively coupled mass spectrometer (Agilent 8900 ICP-QQQ). Preliminary results show that elevated As concentrations are initially incorporated into microbial organic matter before being transferred to the carbonate fraction through successive stages of early taphonomic alteration. Because the carbonate fraction is diagenetically more resistant than the organic matter, this discovery could have major implications for the preservation of geochemical biosignatures in the geological record of microbialites. Our results serve as a first step towards improving the utility of [As] as an indicator of biogenicity in the fossil record of early Earth and, possibly, other planets such as Mars.

How to cite: Pollier, C. G. L., Koschik, C. H., Vitek, B. E., Wu, Z., Suosaari, E. P., Reid, R. P., and Oehlert, A. M.: The fate of Arsenic during early microbialite taphonomy: Implications for chemical biosignature preservation, EGU General Assembly 2023, Vienna, Austria, 23–28 Apr 2023, EGU23-10717, https://doi.org/10.5194/egusphere-egu23-10717, 2023.

EGU23-12060 | Posters on site | SSP4.2 | Highlight

Tropical Climate Variability and Coral Reefs - A Past to Future Perspective on Current Rates of Change at Ultra-High Resolution 

Thomas Felis, Miriam Pfeiffer, and Jessica Hargreaves and the SPP2299 Programme

Climate change, in particular the rise in tropical sea surface temperatures, is the greatest threat to coral reef ecosystems today and causes climatic extremes affecting the livelihood of tropical societies. Assessing how future warming will change coral reef ecosystems and tropical climate variability is therefore of extreme urgency. Ultra-high resolution (monthly, weekly) coral geochemistry provides a tool to understand the temporal response of corals and coral reefs to ongoing climate and environmental change, to reconstruct past tropical climate and environmental variability, and to use these data in conjunction with advanced statistical methods, earth system modelling and observed ecosystem responses for improved projections of future changes in tropical climate and coral reef ecosystems. The recently established Priority Programme “Tropical Climate Variability and Coral Reefs - A Past to Future Perspective on Current Rates of Change at Ultra-High Resolution” (SPP 2299, https://www.spp2299.tropicalclimatecorals.de/) of the German Research Foundation (DFG) aims to enhance our current understanding of tropical marine climate variability and its impact on coral reef ecosystems in a warming world, by quantifying climatic and environmental changes during both the ongoing warming and past warm periods on timescales relevant for society. The programme aims to provide an ultra-high resolution past to future perspective on current rates of change to project how tropical marine climate variability and coral reef ecosystems will change in a warming world. Information on the organisational structure and research topics of this collaborative programme, which involves ten universities and five research centres from all over Germany, will be provided.

How to cite: Felis, T., Pfeiffer, M., and Hargreaves, J. and the SPP2299 Programme: Tropical Climate Variability and Coral Reefs - A Past to Future Perspective on Current Rates of Change at Ultra-High Resolution, EGU General Assembly 2023, Vienna, Austria, 23–28 Apr 2023, EGU23-12060, https://doi.org/10.5194/egusphere-egu23-12060, 2023.

EGU23-12307 | ECS | Orals | SSP4.2

Novel investigative techniques on calcareous red algae build-ups: photogrammetry and CT-scan on Coralligenous from Marzamemi (Sicily) 

Pietro Bazzicalupo, Valentina Alice Bracchi, Andrea Giulia Varzi, Luca Fallati, Alessandra Savini, Antonietta Rosso, Rossana Sanfilippo, Adriano Guido, Mara Cipriani, and Daniela Maria Basso

Crustose coralline algae (CCA) form Coralligenous build-ups, which are ranked among the most important ecosystems in the Mediterranean shelf. Their skeletal framework hosts a variety of epi- and infaunal communities, which compete for space, contributing to the reef growth, or weaken the structure throughout bio-erosive activities. Investigating the relationship between the algal framework and these hosted communities is of extreme importance for ecological and palaeoecological purposes and monitoring goals. 

In this frame, the Italian project “CRESCIBLUREEF - Grown in the blue: new technologies for the knowledge and conservation of the Mediterranean reefs”, is aimed at investigating coralligenous reefs present in the  area off the Marzamemi village (South-East Sicily). 

Two build-ups have been collected: the first one at 37 m depth, from an area rich in coralligenous cover, and the second one at 36 m depth, from a submarine channel with sparsely distributed build-ups. We present here two new investigative techniques, so far seldom applied for the characterization of the Coralligenous. The first approach involved the quantification of the surficial cover, with the use of an image analysis software, both before and after the removal of their ephemeral canopy of unmineralized organisms.These models were then analysed using Object-Based Image Analysis (OBIA) algorithms that allowed the quantification of the surficial cover. Moreover, the analysis allowed the identification and categorisation of the organisms and materials on the external part of the build-ups, confirming the primary role of CCA as the major component of the samples. Afterwards, a Computed-Tomography (CT) scan was used - for the first time with Coralligenous - to reconstruct the inner structure of the build-ups and, together with radiocarbon dating, to infer the build-ups age and growth rate. CT analysis divided the framework into four main categories based on their density (Low, Medium, High and Ultra High). The structure’s cavities, either primary or developed through taphonomic processes, have been measured as porosity. The overall highly-resolved analysis points to a complex and nonlinear growth of the build-ups. The understanding of the structural density, porosity, growth rate, and surficial cover of the build-ups is shedding some light on the Coralligenous inception and growth. 

How to cite: Bazzicalupo, P., Bracchi, V. A., Varzi, A. G., Fallati, L., Savini, A., Rosso, A., Sanfilippo, R., Guido, A., Cipriani, M., and Basso, D. M.: Novel investigative techniques on calcareous red algae build-ups: photogrammetry and CT-scan on Coralligenous from Marzamemi (Sicily), EGU General Assembly 2023, Vienna, Austria, 23–28 Apr 2023, EGU23-12307, https://doi.org/10.5194/egusphere-egu23-12307, 2023.

EGU23-12561 | ECS | Posters virtual | SSP4.2 | Highlight

Multi-specific calibration of the B isotope proxy in calcareous red algae for pH reconstruction 

Giulia Piazza, Eduardo Paredes, Valentina Alice Bracchi, Leopoldo David Pena, Jason M. Hall-Spencer, Chiara Ferrara, Isabel Cacho, and Daniela Basso

Calcareous red algae have calcified cell walls constituted by high-Mg calcite or aragonite (Morse et al., 2006). They are considered suitable paleoclimate archives due to their worldwide distribution and their longevity through indeterminate growth (Kamenos et al., 2008). Boron isotopes (δ11B) measured in their calcified thallus are considered a pH proxy (Hemming and Hanson, 1992). In seawater, boron occurs as boric acid and borate ion. Both species are enriched in 11B as pH increases, with boric acid characterized by an enrichment factor of 27‰ compared to borate. The boron isotope proxy theory states that borate is exclusively incorporated in the mineral lattice (Hemming and Hanson, 1992). Therefore, if we measure δ11B in carbonates, we can derive the seawater pH at the time of precipitation. Literature data on δ11B in calcareous red algae are sparse, and the mechanisms of boron incorporation are still poorly known (Piazza et al., 2022). We tested the boron isotope-pH proxy on calcareous red algae grown at 1 m depth close to CO2 seeps off the coasts of Ischia (Italy), and Methana (Greece), which are both characterized by a broad range of natural pH in seawater (from 6.80 ± 0.43 to 8.08 ± 0.07 units). Environmental data characterizing the seawater during the algal growth were extracted from CMEMS products (Marine Copernicus Service Information), or provided by literature. The δ11B values in the algae (δ11Balgae) analysed by Multi Collector Inductively-Coupled Plasma Mass Spectrometry ranged from 22.23‰ to 26.59‰, calibrated over a range of δ11B in aqueous borate (δ11Bborate) extending from 12.68‰ to 18.05‰. A crystallographic control over boron incorporation was shown by the difference in the isotopic composition of carbonate polymorphs, with Mg-calcite enriched in 11B compared to aragonite. Values of δ11Balgae higher than δ11Bborate could be attributed to the up-regulation of the calcifying fluid pH exerted by the algae. We proposed a multi-specific calibration using literature data of boron isotopes in cultured coralline algae combined with our new data on wild-grown specimens, widening the range of pH considered for δ11B calibrations so far. The proposed calibration is particularly useful when experimental calibration is not possible, such as in the fossil record and in the case of ambiguous identifications.

References

Hemming N. G. & Hanson G. N. 1992. Boron isotopic composition and concentration in modern marine carbonates. Geochim. Cosmochim. Acta, 56, 537-543.

Kamenos N. A., Cusack M. & Moore P. G. 2008. Coralline algae are global paleothermometers with bi-weekly resolution. Geochim. Cosmochim. Acta, 72, 771-779.

Morse J. W., Andersson A. J. & Mackenzie F. T. 2006. Initial responses of carbonate-rich shelf sediments to rising atmospheric pCO2 and ‘‘ocean acidification’’: role of high Mg-calcites. Geochim. Cosmochim. Acta, 70, 5814-5830.

Piazza G., Bracchi V. A., Langone A., Meroni A. N. & Basso D. 2022. Growth rate rather than temperature affects the B / Ca ratio in the calcareous red alga Lithothamnion corallioides. Biogeosciences, 19, 1047-1065.

How to cite: Piazza, G., Paredes, E., Bracchi, V. A., Pena, L. D., Hall-Spencer, J. M., Ferrara, C., Cacho, I., and Basso, D.: Multi-specific calibration of the B isotope proxy in calcareous red algae for pH reconstruction, EGU General Assembly 2023, Vienna, Austria, 23–28 Apr 2023, EGU23-12561, https://doi.org/10.5194/egusphere-egu23-12561, 2023.

EGU23-15203 | ECS | Orals | SSP4.2 | Highlight

A new clumped isotope-temperature calibration of cultured coccoliths under different pCO2 and temperature conditions 

Alexander J. Clark, Ismael Torres Romero, Madalina Jaggi, Stefano M. Bernasconi, and Heather Stoll

Carbonate clumped isotope thermometry, based on the temperature-dependence of clumping of 13C and 18O in the carbonate molecule (Δ47) is a promising tool for paleoclimate reconstruction. In the last few years many discrepancies among Δ47-temperature calibrations have been resolved across the range of relevant paleoclimate temperatures (Meinicke et al., 2020; Anderson et al., 2021). However, there might be other environmental effects on biogenic carbonates from parameters such as the pCO2 and growth rates of the organisms that are still unresolved. We provide a new assessment of the temperature dependence of clumped isotopes in laboratory grown biogenic carbonate at well-constrained experimental conditions, with results from three species of coccolithophores across a growth temperature range of 6-27°C. The three cultured species cover a range of growth rates, growth conditions and species-specific carbon and oxygen vital effects. Because variations in pCO2 and media carbon chemistry are known to trigger vital effects in carbon and oxygen isotopes in coccoliths, we decoupled the temperature solubility effect on CO2 by manipulating culture CO2 independently. Three pCO2 levels at reduced, present day and elevated levels; 200, 400 and 1000 ppm respectively, were kept constant for at least two different temperatures through a continuous culturing set-up. Our new multi-parameter comparison, using updated standardization approaches, provides a critical test of previous conclusions (Katz et al., 2017) that coccolithophore clumped isotopes show little to no vital effects and are close to abiotic equilibrium. Thus, we have performed the first calibration of coccolith calcite and clumped isotopes combining different temperature and pCO2 conditions.

References:

Anderson, N. T., J. R. Kelson, S. Kele, M. Daëron, M. Bonifacie, J. Horita, T. J. Mackey, et al. 2021. "A Unified Clumped Isotope Thermometer Calibration (0.5–1,100°C) Using Carbonate‐Based Standardization." Geophysical Research Letters 48 (7).

Katz, A., M. Bonifacie, M. Hermoso, P. Cartigny, D. Calmels. 2017. “Laboratory-grown coccoliths exhibit no vital effect in clumped isotope (Δ47) composition on a range of geologically relevant temperatures.” Geochimica et Cosmochimica Acta 208: 335-353.

Meinicke, N., S.L. Ho, B. Hannisdal, D. Nürnberg, A. Tripati, R. Schiebel, and A.N. Meckler. 2020. "A robust calibration of the clumped isotopes to temperature relationship for foraminifers." Geochimica et Cosmochimica Acta 270: 160-183.

How to cite: Clark, A. J., Torres Romero, I., Jaggi, M., Bernasconi, S. M., and Stoll, H.: A new clumped isotope-temperature calibration of cultured coccoliths under different pCO2 and temperature conditions, EGU General Assembly 2023, Vienna, Austria, 23–28 Apr 2023, EGU23-15203, https://doi.org/10.5194/egusphere-egu23-15203, 2023.

EGU23-16355 | ECS | Posters on site | SSP4.2

Evaluation of the effect of calcification intensity on the isotopical composition of coccolith calcite 

Alba Gonzalez-Lanchas and Rosalind E.M. Rickaby

To understand how coccolithophore calcification rates evolved, it is critical to disentangle which environmental parameters controls the flow of energy from photosynthesis to calcification.

The values of coccolith vital effects, the offset of the isotopic composition of coccoliths from abiogenic calcite equilibrium, are not yet unilaterally understood. Models from observations in cultures indicate that such geochemical value is controlled, in some extent, by the changes in calcification intensity (McClelland et al., 2017). However, confirmation from observations in the natural environment remains scarce, up to date.

In order to explore the suitability of coccolith isotopical values to produce consistent estimations of calcification intensity, we analyze d13C values measured in size separated coccoliths from natural assemblages in core top records across different latitudes of the Atlantic Ocean. Micro separation of coccoliths and extraction from sediments are carried out with the application of the method by Minoletti et al. (2009) and serve to produce nearly monospecific size-separated coccolith fractions.

Our preliminary results allow investigation on the variance of size-separated coccolith vital effects together with independent estimations of PIC/POC production (Particulate Inorganic Carbon/Particulate Organic Carbon) and regional changes in environmental conditions trough the Atlantic Ocean.

References:

McClelland, H. L. O., Bruggeman, J., Hermoso, M., & Rickaby, R. E. M. (2017). The origin of carbon isotope vital effects in coccolith calcite. Nature communications, 8(1), 1-16.

Minoletti, F., Hermoso, M., & Gressier, V. (2009). Separation of sedimentary micron-sized particles for palaeoceanography and calcareous nannoplankton biogeochemistry. Nature protocols, 4(1), 14-24.


How to cite: Gonzalez-Lanchas, A. and Rickaby, R. E. M.: Evaluation of the effect of calcification intensity on the isotopical composition of coccolith calcite, EGU General Assembly 2023, Vienna, Austria, 23–28 Apr 2023, EGU23-16355, https://doi.org/10.5194/egusphere-egu23-16355, 2023.

EGU23-2364 | ECS | Orals | GMPV8.5

Measuring volcanic ash optical properties with high-spectral resolution infrared sounders: role of refractive indices 

Alexandre Deguine, Lieven Clarisse, Hervé Herbin, and Denis Petitprez

Hyperspectral infrared sounders like IASI are used to track and quantify volcanic ash in the atmosphere. The retrieval process of physical quantities like particle radius and mass depends critically on the assumed spectrally dependent complex refractive indices that are used. Traditionally, the Pollack et al. (1973) dataset were used almost exclusively. These indices are however based on measurements of rock slabs and in recent years two datasets have become available from laboratory measurements of ash in suspension, the Reed et al. (2018) and Deguine et al. (2020) dataset. In this work, we compare for the first time the three most important datasets of CRI with respect to the three most common ash types (basaltic, andesitic and rhyolitic). The results show significant influence of the dataset used on the retrieved physical quantities. When it comes to basaltic and andesitic ash, both the Deguine and Reed samples outperform Pollack in terms of able to reconstruct the satellite observed spectra. However, all datasets overestimate the extinction near 1250 cm−1, which could possibly be related to the lack of sensitivity of spectrometers (water vapour continuum) leading to a poor signal over noise ratio in this spectral region. While this is not a guarantee that the retrieved quantities are closer to the physical reality, being able to reconstruct the observed spectra is a prerequisite of constructing a consistent physical model. Finally, a case study on the 7 May 2010 plume of the Eyjafjallajokull eruption is presented. For this case study, the differences are found to be mostly related in retrieved altitudes. It is clear that while the availability of CRI based on ash suspended in air is an important milestone, a lot of further research is needed to strengthen the theoretical basis of infrared retrievals of volcanic ash. A comprehensive database of reliable in-situ measurements of volcanic clouds would in this perspective be most welcome.

A. Deguine, D. Petitprez, L. Clarisse, S. Gudmundsson, V. Outes, G. Villarosa, and H. Herbin, “Complex refractive index of volcanic ash aerosol in the infrared, visible, and ultraviolet,” Applied Optics, vol. 59, no. 4, p. 884, jan 2020.

J. B. Pollack, O. B. Toon, and B. N. Khare, “Optical properties of some terrestrial rocks and glasses,” Icarus, vol. 19, no. 3, pp. 372–389, jul 1973.

B. E. Reed, D. M. Peters, R. McPheat, and R. G. Grainger, “The complex refractive index of volcanic ash aerosol retrieved from spectral mass extinction,” Journal of Geophysical Research, vol. 123, no. 2, pp. 1339–1350, jan 2018.

How to cite: Deguine, A., Clarisse, L., Herbin, H., and Petitprez, D.: Measuring volcanic ash optical properties with high-spectral resolution infrared sounders: role of refractive indices, EGU General Assembly 2023, Vienna, Austria, 23–28 Apr 2023, EGU23-2364, https://doi.org/10.5194/egusphere-egu23-2364, 2023.

Volcanic eruptions used to cause huge disasters which usually bring about many fatalities and property damages, especially a big city near the volcanoes. The Taipei metropolitan city is located at the foot of Tatun Volcano Group (TVO), which has been identified as an active volcano. Meanwhile, several volcanic islands are distributed in the offshore of northern Taiwan, which may be the active volcanoes. Thus, the past eruptive behaviors and mechanisms, characteristics of products, volcanic history and activity, etc.

Based on the field observations, geomorphologic analyses, characteristics of ejecta, as well as the cases of world volcanoes, the explosive craters distributed in both sides of Chihsingshan volcano were produced by the phreatic eruption. Generally, two models of phreatic eruption have been proposed. One is a deeper hydrothermal system fed by magmatic gases being sealed and produces overpressure sufficient to drive explosive eruptions, and the other where magmatic gases are supplied via open-vent degassing to a near-surface hydrothermal system, vaporizing liquid water which drives the phreatic eruptions. The mechanism of Chihsingshan phreatic eruption is similar to the type I, which has hydrothermal reservoir underneath the volcano. Comparing other types of phreatic eruption in the world, for example, Mt. Ontake (Japan)、Inyo Craters (USA) and Tarawera Rift (New Zealand), they have similar common characteristics, (i) occurred in rifting conditions, (ii) heat source from magma intruded along the faults, (iii) had water body, such as groundwater, lakes or hydrothermal fluids, etc. near the conduit of magma. The geology and mechanism of phreatic eruption in the Chihsingshan volcano is more or less similar to the 2014 phreatic eruption of Mt. Ontake, Japan.

How to cite: Song, S.-R.: Characteristics of Latest Eruption in the Tatun Volcano Group, North Taiwan, EGU General Assembly 2023, Vienna, Austria, 23–28 Apr 2023, EGU23-3795, https://doi.org/10.5194/egusphere-egu23-3795, 2023.

EGU23-4626 | ECS | Orals | GMPV8.5

A millennial-scale tephra event-stratigraphic record of the South China Sea since the penultimate interglacial 

Deming Kong, Weijia Feng, jiawen Yang, Chuang Bao, and Min-Te Chen

Large volcanic eruptions have significant impacts on climate and environmental changes. The deposition of tephra in marine sediments may serve as an eruption recorder, but it has not been extensively studied in the western Pacific. This study explored a millennial-scale tephra event-stratigraphy with multiple indicators in a sediment core collected from the eastern South China Sea (SCS) basin. The magnetic susceptibility (MS), Fe and Mn concentration determined by X-ray fluorescence (XRF), and identification of individual ash particles were used to identify tephra layers and reconstruct the history of volcanic activity. Nine visible volcaniclastic units (VVU) and two cryptotephra layers have been identified based on their distinct features, as manifested by high MS, Fe, and Mn concentrations, and single-peak grain size distribution. The VVUs and cryptotephra layers reveal elevated volcanic activities. Using the radiocarbon age model and oxygen isotope stratigraphy, these episodes could roughly correspond to the following periods: 1-11 ka, 16-17 ka, 27-31 ka, 41-42 ka, 45-46 ka, 49-50 ka, 77-80 ka, 90-91 ka, 97-99 ka, 116-126 ka, and 132-140 ka. The alkenone-derived SST has significant glacial cycles and good synchronicity with other SCS SST records, which could partially help build the preliminary age model. Despite possible age errors larger than 1 kyr, the discovery and timing of tephra layers provide a preliminary framework to further investigate the impact of historical volcanic eruptions on climate changes.

How to cite: Kong, D., Feng, W., Yang, J., Bao, C., and Chen, M.-T.: A millennial-scale tephra event-stratigraphic record of the South China Sea since the penultimate interglacial, EGU General Assembly 2023, Vienna, Austria, 23–28 Apr 2023, EGU23-4626, https://doi.org/10.5194/egusphere-egu23-4626, 2023.

Volcanic sulfur dioxide (SO2) is a gaseous precursor that is transformed into secondary sulfate aerosols (SO42-) by several intricate chemical and physical atmospheric processes. It is currently unclear how quickly sulfate aerosols are produced in volcanic plumes, particularly in tropospheric plumes. We jointly analyze Aura/OMI SO2 observations to constrain the sulfur-rich emissions and identify the volcanic plume dispersion pattern as well as multi-angle, multi-wavelength, and polarizing PARASOL/POLDER-3 observations that are particularly sensitive to fine mode particles to gain a better understanding of the lifecycle of volcanic sulfate aerosols. The GRASP/Component[1] (Generalized retrieval of Aerosol and Surface Properties) algorithm gives us details about the soluble and insoluble aerosol components in both fine and coarse modes based on their complex refractive indices in addition to standard optical characteristics. In order to provide insight into SO2 to particle conversion rate, we analyze the degassing of the Kilauea volcano (Hawaii, USA) between 2006 to 2012, which includes periods of passive and eruptive degassing.

We demonstrate that Kilauea SO2-rich pixels from OMI measurements are broadly collocated with poorly-absorbing fine aerosol-rich pixels from POLDER measurements (fine AOD (440nm) ranging from 0.1 to 0.4, SSA (440nm) ranging from 0.95 to 1.0). We show that these volcanic particles also differ from long-distance transported man-made and natural fine-absorbing particles seen across the Kilauea domain from the Asian region in terms of their absorption characteristics. We, therefore attribute these fine mode particles to sulfate aerosols that result from the conversion of Kilauea SO2 emissions.

In comparison to SO2-rich plumes, Kilauea aerosol-rich plumes have a significantly wider spread and are characterized by an excess anomaly in fine AOD and high SSA values. Irrespective of the degassing strength, a pattern consistent with the oxidation of SO2 to secondary sulfate aerosols is observed where the SO2 concentration gradually drops with plume dispersion while the fine AOD gradually increases, peaking at a distance of around 800–3000 km from the Kilauea source. Depending on the intensity of volcanic activity, the season, and enduring local meteorological conditions, different time scales for oxidation of SO2 and geographical dispersion of the Kilauea aerosol plumes are observed. We conducted additional analysis on the coarse AOD and coarse components to look for ash signals inside the plume. Furthermore, the complex refractive index of Kilauea particles, retrieved by the GRASP/Component algorithm, indicates an imaginary part (0.003-0.005) that is slightly higher than that of volcanic basaltic ash, as determined by laboratory experiments, while the real part (1.49-1.52) lies well in between pure sulfate (1.40-1.46) and basaltic ash (1.56-1.63). These refractive index values imply that Kilauea particles are not pure sulfate aerosols but instead contain some spectrally absorbing elements that may point to the existence of fine ash or sulfate-coated ash particles within the plume.

[1] Li, L., Dubovik, O., Derimian, Y., Schuster, G. L., Lapyonok, T., Litvinov, P., Ducos, F., Fuertes, D., Chen, C., Li, Z., Lopatin, A., Torres, B., and Che, H.: Retrieval of aerosol components directly from satellite and ground-based measurements, Atmos. Chem. Phys., 19, 13409–13443, https://doi.org/10.5194/acp-19- 13409-2019, 2019.

How to cite: Panda, S. R., Boichu, M., Derimian, Y., Dubovik, O., and Behera, A. K.: Insight into the conversion of SO2 to sulphate aerosols in volcanic plumes from the joint analysis of hyperspectral OMI and multi-angular polarimetric POLDER satellite observations, EGU General Assembly 2023, Vienna, Austria, 23–28 Apr 2023, EGU23-5423, https://doi.org/10.5194/egusphere-egu23-5423, 2023.

EGU23-7027 | ECS | Posters on site | GMPV8.5

First archive of extensive N-fixation by volcanic lightning and implications for the prebiotic Earth 

Adeline Aroskay, Erwan Martin, Slimane Bekki, Joël Savarino, Jean-Luc Le Pennec, Abidin Temel, Nelida Manrique, Rigoberto Aguilar, Marco Rivera, and Sophie Szopa

On Earth, most of the nitrogen (N) accessible for life is trapped in dinitrogen (N2), which is the most stable atmospheric molecule. In order to be metabolised by living organisms, N2 has to be converted into assimilable forms, also called fixed N. Nowadays, nearly all the N-fixation is achieved through biological and anthropogenic processes. However, in early environments of the Earth, before the emergence of life, N-fixation must have occurred via natural abiotic processes. Electrical discharges, including from thunderstorms and also lightning associated with volcanic eruptions is one of the most invoked processes. The occurence of volcanic lightning during explosive eruptions is frequent, and convincing laboratory experimentations support the role of this phenomenon, however no evidence of substantial N-fixation has been found in volcanic records.
Here we report on the discovery of large amounts of nitrates in volcanic deposits from Neogene caldera-forming eruptions, which are well correlated with the concentrations of species directly emitted by volcanoes such as sulphur and chlorine. The multi-isotopic composition (δ18O, Δ17O) of the nitrates reveals that they originate from the atmospheric oxidation of nitrogen oxides formed by volcanic lightning that occur during the eruption. According to these volcanic nitrate records, our first estimates suggest that about 60 Tg of N can be fixed during a large explosive event. Our findings hint at a unique role potentially played by subaerial explosive eruptions in supplying essential ingredients for the emergence of life on Earth.

How to cite: Aroskay, A., Martin, E., Bekki, S., Savarino, J., Le Pennec, J.-L., Temel, A., Manrique, N., Aguilar, R., Rivera, M., and Szopa, S.: First archive of extensive N-fixation by volcanic lightning and implications for the prebiotic Earth, EGU General Assembly 2023, Vienna, Austria, 23–28 Apr 2023, EGU23-7027, https://doi.org/10.5194/egusphere-egu23-7027, 2023.

EGU23-7268 | ECS | Orals | GMPV8.5

Dispersion modeling of the volcanic sulfur dioxide plumes from the simultaneous eruptive activity of Stromboli and Mt Etna on 28 August 2019 

Giuseppe Castorina, Agostino Semprebello, Alessandro Gattuso, Francesco Italiano, Giuseppe Salerno, Pasquale Sellitto, and Umberto Rizza

During the summer of 2019, both Mt. Etna and Stromboli volcanoes in Sicily were in the stage of no ordinary activity. Mt. Etna was featured by mild strombolian activity from the summit South East Crater producing a moderate SO2–ash rich plume 4 km above sea level (asl). Meanwhile, at 120 km far from Etna, on 3 July and 28August, the ordinary and typical mild explosive eruptive activity of Stromboli was interrupted by two paroxysms. Both events were characterized by pyroclastic flows and consistent emission of ash–SO2 rich plume, which spread up to height of 5–6 km asl.
In this work, we explored the spatial dispersion of the volcanic plumes released by both Mt. Etna and Stromboli on August 28 by employing the Weather Research and Forecasting Chemistry (WRF–Chem) model. The simulation was specifically configured and run by considering the time-variable Eruptive Source Parameters (ESPs) related to the SO2 flux data for Stromboli and Mount Etna observed from ground by the FLAME DOAS scanning spectrometers network.
In order to assess the predictive performance of the WRF–Chem model, the simulated SO2 dispersion maps were compared with data retrieved on 28 August from TROPOMI and OMI sensors onboard Sentinel–5p and Aura satellites. The results show a good agreement between WRF–Chem and satellite data. In fact, the simulated total mass of the emitted SO2 from the two volcanoes has the same order of magnitude as the satellite data. However, for the case of Stromboli, the total SO2 mass predicted by the WRF–Chem simulation is underestimated; this is likely due to inhibition of the real syn-eruptive SO2 detection by FLAME due to the extreme ash–rich volcanic plume released during the paroxysm.
In conclusion, the results of these two test–cases demonstrate the feasibility of WRF–Chem model with a time-variable ESPs in reproducing different levels of volcanic SO2 and their dispersion into the atmosphere. For these reasons, our approach could represent an effective support for the assessment of local–to-regional air quality and flight security and, in case of particularly intense events, also on a global scale.

How to cite: Castorina, G., Semprebello, A., Gattuso, A., Italiano, F., Salerno, G., Sellitto, P., and Rizza, U.: Dispersion modeling of the volcanic sulfur dioxide plumes from the simultaneous eruptive activity of Stromboli and Mt Etna on 28 August 2019, EGU General Assembly 2023, Vienna, Austria, 23–28 Apr 2023, EGU23-7268, https://doi.org/10.5194/egusphere-egu23-7268, 2023.

EGU23-7369 | ECS | Orals | GMPV8.5 | Highlight

The evolution and dynamics of the sulfate aerosol plume in the stratosphere after the exceptional Tonga eruption of 15 January 2022 

Clair Duchamp, Bernard Legras, Pasquale Sellitto, Aurélien Podglajen, Elisa Carboni, Richard Siddans, Jens-Uwe Grooss, Felix Ploeger, and Sergey Khaykin

We use a combination of seven space-borne instruments to study the unprecedented stratospheric plume after the Tonga eruption of 15 January 2022.

The aerosol plume was initially formed of two clouds at 30 and 28 km mostly composed of submicron-sized sulfate particles, without ashes washed-out within the first day following the eruption. The large amount of injected water vapour led to a fast conversion of SO2 to sulfate aerosols and induced a descent of the plume to 24-26 km over the first 3 weeks by radiative cooling. Whereas SO2 has returned to background levels by the end of January, volcanic sulfates and water still persisted after 6 months, mainly confined between 35°S and 20°N until June due to the zonal symmetry of the summer stratospheric circulation at 22-26 km. Sulfate particles, undergoing hygroscopic growth and coagulation, sediment and gradually separate from the moisture anomaly entrained in the ascending branch Brewer-Dobson circulation. Sulfate aerosol optical depths derived from the IASI infrared sounder show that during the first two months the aerosol plume was not simply diluted and dispersed passively but rather organized in concentrated patches. Space-borne lidar winds suggest that those structures, generated by shear-induced instabilities, were associated with vorticity anomalies that may have enhanced the duration and impact of the plume.

Reference: ACP Highlight, DOI: 10.5194/acp-22-14957-2022

How to cite: Duchamp, C., Legras, B., Sellitto, P., Podglajen, A., Carboni, E., Siddans, R., Grooss, J.-U., Ploeger, F., and Khaykin, S.: The evolution and dynamics of the sulfate aerosol plume in the stratosphere after the exceptional Tonga eruption of 15 January 2022, EGU General Assembly 2023, Vienna, Austria, 23–28 Apr 2023, EGU23-7369, https://doi.org/10.5194/egusphere-egu23-7369, 2023.

EGU23-7516 | ECS | Posters on site | GMPV8.5

Rapid gas measurements in volcanic plumes with UAVs: online and offline measurements of various trace gases with light UAVs 

Niklas Karbach, Bastien Geil, Jonas Blumenroth, Heiko Bozem, Christian von Glahn, Peter Hoor, Nicole Bobrowski, and Thorsten Hoffmann

To protect people and infrastructures in the immediate vicinity of active volcanoes, monitoring the gas composition of the emitted plume is crucial. In order to react quickly to sudden changes in this composition, frequent measurements are key, as different ratios like the halogen/sulfur or the CO2/SO2 ratio can give hints on changing volcanic activity due to their different solubility in magma.   

However, monitoring the chemical composition of the volcanic plume is not an easy task, especially since stationary ground-based gas monitoring stations do not always measure the concentration in the plume, only under certain meteorological conditions, and remote sensing methods are not available for all gases of interest. In this case, human interaction is required to move the measurement equipment to the location of interest, which is close to the active vent. Not only does this pose a serious health risk, it is also burdensome, as the researcher must climb the volcano, take the measurements, climb back down, and analyze the results. This lengthy procedure can be sped up and facilitated by using lightweight drones to take the measurements. Sensors and various other instruments, such as miniaturized alkaline traps or impregnated syringe filters that employ an electrophilic addition to a double bond to selectively absorb halogen species in the oxidation states -1, ±0 and +1, can be mounted on the drone and controlled via a radio link to a ground station. The online results can then be used during the flight to locate the plume to ensure efficient sampling with the absorbers. The landing site of the drone is usually located far away from active vents, which significantly reduces health hazards and speeds up the process.

This poster presents such a drone with its advanced sensor system and absorbers for the determination and quantification of CO2, SO2, acidic gases and halogen species and its deployment during a measurement campaign on Etna in July 2022.

How to cite: Karbach, N., Geil, B., Blumenroth, J., Bozem, H., von Glahn, C., Hoor, P., Bobrowski, N., and Hoffmann, T.: Rapid gas measurements in volcanic plumes with UAVs: online and offline measurements of various trace gases with light UAVs, EGU General Assembly 2023, Vienna, Austria, 23–28 Apr 2023, EGU23-7516, https://doi.org/10.5194/egusphere-egu23-7516, 2023.

EGU23-8281 | Posters on site | GMPV8.5

A case study of two simultaneous extreme aerosol events in the Mediterranean: The Mount Etna series of eruptions and major Saharan dust event in February 2021 

Pasquale Sellitto, Giuseppe Salerno, Stefano Corradini, Irène Xueref-Remy, Aurélie Riandet, Clémence Bellon, Sergey Khaykin, Gerard Ancellet, Simone Lilli, Ellsworth J. Welton, Antonella Boselli, Alessia Sannino, Juan Cuesta, Henda Guermazi, Maxim Eremenko, Luca Merucci, Dario Stelitano, Lorenzo Guerrieri, and Bernard Legras

During the extended activity of Mount Etna volcano in February-April 2021, three distinct paroxysmal events took place from 21 to 26 February, which were associated with a very uncommon transport of the injected upper-tropospheric plumes towards the north. A major Saharan dust outbreak to central Europe occurred in the same period. Using a synergy of observations and modelling, we characterise the three-dimensional dispersion of these volcanic plumes and we disentangle their optical and radiative signature from the simultaneous Saharan dust transport. In the region of interest for our study, the volcanic and the dust plumes remain completely vertically-separated, thus facilitating the detection and spatiotemporal characterisation of the dispersion, properties and radiative impacts of these two different aerosol plumes, using vertically-resolved observations. With a satellite-based source inversion, we estimate the emitted sulphur dioxide (SO2) mass at an integrated value of 55 kt and plumes injections at up to 12 km altitudes, which qualifies this series as an extreme event for Mount Etna activity spectrum. Then, we combine Lagrangian dispersion modelling, initialised with measured temporally-resolved SO2 emission fluxes and altitudes, with satellite observations to track the dispersion of the individual volcanic and dust plumes. The general transport towards the north allowed the height-resolved downwind monitoring of the volcanic and dust plumes at selected observatories in France, Italy and Israel, using LiDARs and photometric aerosol observations. A specific effort has been dedicated to the characterisation of the volcanic aerosol plumes. Volcanic-specific aerosol optical depths in the visible spectral range ranging from about 0.004 to 0.03 and local daily average shortwave radiative forcing ranging from about -0.2 to -1.2 W/m2 (at the top of atmosphere) and from about -0.2 to -3.0 W/m2 (at the surface) are found. The composition (possible presence of ash), aerosol optical depth and radiative forcing of the volcanic plumes has a large inter- and intra-plume variability and thus depend strongly on the position of the sampled section of the plumes. The dust optical depth and radiative impact largely outweigh volcanic aerosols when the two plumes are co-located, for this event. This case study points at the complexity of the Mediterranean aerosol environment and pave the way to future studies at longer timescales, exploiting the available observational and modelling capabilities and their synergies.

How to cite: Sellitto, P., Salerno, G., Corradini, S., Xueref-Remy, I., Riandet, A., Bellon, C., Khaykin, S., Ancellet, G., Lilli, S., Welton, E. J., Boselli, A., Sannino, A., Cuesta, J., Guermazi, H., Eremenko, M., Merucci, L., Stelitano, D., Guerrieri, L., and Legras, B.: A case study of two simultaneous extreme aerosol events in the Mediterranean: The Mount Etna series of eruptions and major Saharan dust event in February 2021, EGU General Assembly 2023, Vienna, Austria, 23–28 Apr 2023, EGU23-8281, https://doi.org/10.5194/egusphere-egu23-8281, 2023.

EGU23-8559 | ECS | Orals | GMPV8.5

Laki 1783-84 AD tephra linked mercury enrichment in peat at Brackloon Wood, Mayo, Ireland. 

Lucy Blennerhassett and Dr. Emma Tomlinson

Mercury is a significant volcanic volatile species from effusive and explosive activity1. Understanding its emission to the atmosphere from volcanic activity, aids our understanding of the global mercury cycle and its environmental impacts. Sedimentary and ice core records can be archives of these mercury enrichments2,3.

The Laki 1783-84 AD fissure eruption in Iceland was significant due to its voluminous outpouring of basaltic lava, copious sulphur emissions and widespread environmental effects locally and across the Northern Hemisphere4,5. Extreme weather events were recorded in Europe and North America, owing to a veil of sulphur dioxide that remained at the tropopause for over a year5. Due to the phreatomagmatic and thus explosive nature of Laki, a significant eruption plume was produced4. As such, cryptotephra shards have been located at distal locations from Iceland including ice cores in Svalbard and Greenland6,7 and in an Irish woodland peat at Brackloon Wood, Co. Mayo8. There is evidence to suggest significant heavy metal emission to the atmosphere during the Laki eruption, however these records are currently restricted to Greenland ice cores9. Previous heavy metal findings linked to Laki do not include mercury, despite its significance as a volcanic volatile, and a potentially environmentally damaging heavy metal. Therefore, to expand our knowledge of the Laki 1783-84 AD eruption plume, its associated emissions, and environmental consequences we returned to the woodland peat site in Brackloon Wood, Co. Mayo, Ireland.

Analysis of a 50 cm peat core using an AMA 254 mercury analyser was combined with a novel technique to find tephra using BSE (back scattered electron) imaging and geochemical discrimination using SEM-EDX (scanning electron microscopy-energy dispersive x-ray). The Laki tephra is successfully located using this method and coincides with a visible enrichment in mercury relative to background concentrations and organic matter. An age-depth model developed using the tephra layer and two radiocarbon dates indicate a strong likelihood that such enrichments are a product of volcanic emission. Such a finding can expand our understanding of heavy metal deposition during Laki 1783-84 AD away from the poles and to our knowledge, demonstrates the first direct exploration of mercury enrichment in distal peat for this eruption. As a secondary test of volcanic volatile enrichment, trace element analysis of the same bulk peat will be conducted to explore enrichments in other volcanic volatiles such as sulphur, cadmium, lead, copper and zinc.


1. Pyle, D. M. & Mather, T. A. Atmos. Environ. 37, 5115–5124 (2003).

2. Schuster, P. F. et al.,. Environ. Sci. Technol. 36, 2303–2310 (2002).

3. Roos-Barraclough, F. et al.,. Earth Planet. Sci. Lett. 202, 435–451 (2002).

4. Thordarson, T. & Self, S. Bull. Volcanol. 55, 233–263 (1993).

5. Thordarson, T. & Self, S., J. Geophys. Res 108, 4011 (2003).

6. Kekonen, T. et al., Polar Res. 24, 33–40 (2005).

7. Wei, L. et al., Geophys. Res. Lett. 35, L16501 (2008).

8. Reilly, E. & Mitchell, F. J., Holocene 25, 241–252 (2015).

9. Hong, S. et al., Earth Planet. Sci. Lett. 144, 605–610 (1996).


How to cite: Blennerhassett, L. and Tomlinson, Dr. E.: Laki 1783-84 AD tephra linked mercury enrichment in peat at Brackloon Wood, Mayo, Ireland., EGU General Assembly 2023, Vienna, Austria, 23–28 Apr 2023, EGU23-8559, https://doi.org/10.5194/egusphere-egu23-8559, 2023.

EGU23-9128 | Posters on site | GMPV8.5

Ground-based volcanic ash detection with low-cost sensors – a case study at the 2021 Cumbre Vieja eruption 

Jose Pacheco, Diogo Henriques, Sérgio Oliveira, Alexandra Moutinho, Fátima Viveiros, Diamantino Henriques, Pedro Hernández, and Nemesio Pèrez

The Tajogaite eruption of Cumbre Vieja volcano, in 2021, was a basaltic fissure eruption characterised by a variety of eruptive styles ranging from the predominantly strombolian activity, to lava fountaining, ash emission and effusive activity. The eruption lasted nearly 3 months, produced an extensive lava field and about 45.106 m3 of tephra. Although its intensity varied throughout the entire duration of the eruption, the eruptive plume had a typical height of about 3500 m asl and reached a maximum of 8500 m asl just hours before the end of the eruption, on the 13th of December. Ash is, therefore, a significant hazard to consider not only during the eruption, but also on the post-eruption phase.

To measure ash in the air around the volcano, during the last stage of the eruption and the following weeks, an experiment was devised based on a proximal network of several ground-based low-cost sensors, measuring suspended particulate matter (PM10, PM2.5) concentration, air temperature, and relative humidity.

The results showed that, during the documented period, the daily mass concentration of particulate matter in the air reproduced the peak on the eruptive column high at the end of the eruption. After the eruption several significant resuspension events were detected simultaneously in several stations; in addition, after the eruption, a major event of “calima” dust intrusion largely exceeded all recorded eruptive events. Overall, even after the eruption, the 24-hour average exposure to PM2.5 surpassed the guidelines of the World Health Organization.


This work was partially funded by FCT – Fundação para a Ciência e Tecnologia, under project SONDA - Synchronous Oceanic and Atmospheric Data Acquisition (PTDC/EME-SIS/1960/2020) and INTERREG MAC under the project VOLRISKMAC-II - Fortalecimiento de las capacidades de I+D+i para el desarrollo de la resiliencia frente a emergencias volcánicas en la Macaronesia.

How to cite: Pacheco, J., Henriques, D., Oliveira, S., Moutinho, A., Viveiros, F., Henriques, D., Hernández, P., and Pèrez, N.: Ground-based volcanic ash detection with low-cost sensors – a case study at the 2021 Cumbre Vieja eruption, EGU General Assembly 2023, Vienna, Austria, 23–28 Apr 2023, EGU23-9128, https://doi.org/10.5194/egusphere-egu23-9128, 2023.

EGU23-9143 | Orals | GMPV8.5

Quantifying volcanic gas emission rates from infrasound and SO2 cameras: potentials, limitations, and volcanological implications. 

Dario Delle Donne, Giorgio Lacanna, Marcello Bitetto, Giacomo Ulivieri, Maurizio Ripepe, and Alessandro Aiuppa

Volcanic degassing, a persistent manifestation of active volcanoes, provides crucial information on the dynamics of the magmatic feeding systems, and allows identifying the phases of volcanic unrest in the runup to volcanic eruptions. While thus determining volcanic degassing rates is a central topic in modern Volcanology, direct volcanic gas flux observations by classic spectroscopic techniques are challenged by (i) the need of adequate illumination (by sunlight) and clear weather conditions (ii) difficulties in robustly estimating plume speed velocity and transport direction, and (iii) a variety of optical and radiative transfer issues. Because of these, volcanic gas flux records are often sparse and incomplete, and affected by intrinsic noise that may prevent from fully resolving the gas emission changes associated with changing volcanic activity. To overcome such limitations, measuring the infrasound produced by the expansion of over-pressurized volcanic gas in the atmosphere, using infrasonic arrays, offers as a promising alternative/complementary tool to quantify and locate degassing at active volcanoes. Here, we report on 2-year long (April 2017—March 2019) period of combined measurements of the SO2 flux and of volcano-acoustic emissions produced by regular mild persistent strombolian activity and passive degassing of Stromboli Volcano (Sicily, Italy). These were obtained by a permanent monitoring SO2 camera and a five-element short-aperture (~300 m) infrasonic array. Our results highlight substantial temporal changes in degassing activity, that reflect the recurrent episodes of activations/inactivation of multiple distinct degassing sources within the crater area, as coherently tracked by SO2 and infrasound together. A simple waveform modeling of the infrasonic record, assuming a monopole acoustical source, suggests that infrasonic degassing, comprising of explosive events and continuous puffing activity, dominates the total persistent degassing budget as tracked by the SO2 camera.

How to cite: Delle Donne, D., Lacanna, G., Bitetto, M., Ulivieri, G., Ripepe, M., and Aiuppa, A.: Quantifying volcanic gas emission rates from infrasound and SO2 cameras: potentials, limitations, and volcanological implications., EGU General Assembly 2023, Vienna, Austria, 23–28 Apr 2023, EGU23-9143, https://doi.org/10.5194/egusphere-egu23-9143, 2023.

Sulfate aerosols are a primary driver of climate impacts during and following volcanic eruptions and form from erupted SO2 gas. However, the amount of SO2 that is delivered to the stratosphere is not clearly related to the amount dissolved in the magma (the ‘sulfur excess problem’). Therefore, magma properties and eruption magnitude are not necessarily predictive of climate impacts from eruptions, which is exacerbated by the as-yet unknown importance of the insulated, hot transport pathway. During a magnitude 6 explosive volcanic eruption there is up to 100 seconds of transport between the magma fragmentation depth – where volcanic ash is formed and the mixture accelerates – and the Earth’s surface. Here, we present a numerical implementation of a theoretical framework which predicts the rapid reactions between gases and volcanic ash in this transport interval, which include: (1) iron oxidation state changes; (2) SO2 uptake via calcium sulfate surface crystallization; (3) HCl uptake via NaCl surface crystallization; and (4) incipient nanolite crystallization that may be related to (1). In all cases, these processes are rate-limited by a suite of diffusive exchanges between the ash bulk and surface, for which our model solves. To demonstrate the upscaled importance of these processes, we couple our models to volcanic plume simulations (using a 1991 Pinatubo baseline simulation), and output the bulk SO2 that can be captured by ash. We find that depending on the source parameters of the eruption, anywhere between 30 and 100 wt.% of the total erupted SO2 can be removed from the plume gas and captured by ash. This effectively changes the sink of SO2 from the stratosphere to the hydrosphere, as CaSO4 crystals are soluble and ultimately wash into the environment following ash deposition. We propose that these hot sulfur scrubbing processes may be crucial in mediating SO2 delivery to the atmosphere, and therefore may explain much of the complexities associated with correlating eruption magnitude with climate impacts in the recent past or back into the Last Glacial period.

How to cite: Vasseur, J., Wadsworth, F., Paine, A., and Dingwell, D.: Hot volcanic ash filters eruptive SO2 during hot transport in conduits and the lower plume: A predictive model with implications for the climate impacts of volcanic eruptions, EGU General Assembly 2023, Vienna, Austria, 23–28 Apr 2023, EGU23-11407, https://doi.org/10.5194/egusphere-egu23-11407, 2023.

EGU23-11832 | Orals | GMPV8.5

Remote SO2 flux by UV and TIR ground based cameras at Sabancaya volcano (Peru), cross comparison and validation with satellite data 

Stefano Corradini, Giuseppe Salerno, Robin Campion, Lorenzo Guerrieri, Luca Merucci, and Dario Stelitano

During the 14th IAVCEI Field Workshop held in Peru from 6 to 14 November 2022, SO2 plume measurements were carried out remotely in the volcanic plume of Sabancaya volcano. Sabancaya is an active stratovolcano located in southern Peru (15.787°S, 71.857°W), Sabancaya’s first historical record of an eruption dates to 1750 and the most recent eruption began in November 2016. Volcanic activity consist of rhythm vulcanian explosions, which produce a gas-ash rich plumes which rose few km above the summit terrace. On 10 and 11 November 2022, side-by-side observation by UV and TIR ground-based cameras were remotely carried out with the object to observe the passive and active SO2 burden from the volcanic plume of Sambacaya. Two UV cameras systems were employed observing the volcanic plume at 2- and 5-seconds time steps and calibrating SO2 amounts by coupling SO2 DOAS inverted column densities ad and SO2-quartz cell amounts. The TIR camera (named VIRSO2) is a novel system developed for the detection of volcanic plumes, the estimation of the height and the determination of columnar content and the SO2 flux. It allows acquisition of high frequency data both during the day and at night. It is equipped with 3 cameras, two broadband TIR (7-14 micron) and a VIS, capable of acquiring data simultaneously. For the quantitative estimation of SO2, an 8.7 μm filter is installed in front of one of the TIR camera. Retrieved cameras products were cross-compared and validated in order to determinate limit an uncertainty of both methods and results were also compared with those obtained by S5p-TROPOMI instrument.

Preliminary results show a feasible strength between the three ground and space-based techniques. Within the uncertainties of each method, differences between inverted SO2 column densities and emission rates arise from field of view geometrical sampling set-up and radiative transfer. Results gathered in this study prove the promising application of ground-based TIR in volcanic plume SO2 observation.

How to cite: Corradini, S., Salerno, G., Campion, R., Guerrieri, L., Merucci, L., and Stelitano, D.: Remote SO2 flux by UV and TIR ground based cameras at Sabancaya volcano (Peru), cross comparison and validation with satellite data, EGU General Assembly 2023, Vienna, Austria, 23–28 Apr 2023, EGU23-11832, https://doi.org/10.5194/egusphere-egu23-11832, 2023.

EGU23-12069 | ECS | Orals | GMPV8.5

Explicit simulation of volcanic eruption plumes in atmospheric models: first results and implications 

Sascha Bierbauer, Gholam Ali Hoshyaripour, Julia Bruckert, Daniel Reinert, and Bernhard Vogel

Explosive volcanic eruptions emit large amounts of solid and gaseous materials into the atmosphere, thereby affect weather and climate and pose hazards to human health and aviation. To constrain those impacts it is important to understand dynamical, microphysical and chemical evolution of the eruption plumes. Especially the density of a plume and atmospheric conditions control the dynamical development of an eruption plume. To simulate those plumes correctly the flow field has to be described as a multi-constituent multiphase flow system. This is realized in eruption plume models but not in the conventional atmospheric models. The latter neglect the partial density of ash particles in relation to total air mass and cannot treat for the effect of ash particles on dynamics during simulations. To overcome this limitation, we use a modified version of ICOsahedral Nonhydrostatic model with Aerosols and Reactive Trace gases (ICON-ART) in which we extended the existing equation set. This version of ICON-ART can consider a source of total mass during the eruption as well as a mass sink due to sedimentation of ash and other constituents. The mass source is accounted by an additional source term for total density, and the mass sink is accounted by implementing the lower boundary condition of the vertical velocity at the surface. This leads to a conserved dry air mass and changing total air mass, which affects dynamics and is crucial for handling multiphase flows correctly. Additionally, a momentum forcing as well as a temperature forcing cause the strong updraft within the plume region.

We simulated the real case of the Raikoke eruption in 2019 in a LES-mode for more detailed investigations of the plume. In this experiment, in addition to ash, we also emit water vapor which might lead to an additional upward motion in the convective plume region due to latent heat release when clouds develop. The results show that the model is able to reproduce the observed plume geometry vertically and horizontally. Moreover, we simulated gravity waves that developed during the eruption around the volcano. In combination with microphysics and aerosol dynamics, the new implementations in ICON-ART enable detailed investigations of volcanic plume development across scales.

How to cite: Bierbauer, S., Hoshyaripour, G. A., Bruckert, J., Reinert, D., and Vogel, B.: Explicit simulation of volcanic eruption plumes in atmospheric models: first results and implications, EGU General Assembly 2023, Vienna, Austria, 23–28 Apr 2023, EGU23-12069, https://doi.org/10.5194/egusphere-egu23-12069, 2023.

EGU23-13755 | ECS | Posters on site | GMPV8.5

Inversion techniques on volcanic emissions and the use for quantitative dispersion modeling: The case of Etna eruption on 12 March 2021 

Anna Kampouri, Vasilis Amiridis, Ondřej Tichý, Nikolaos Evangeliou, Stavros Solomos, Anna Gialitaki, Eleni Marinou, Antonis Gkikas, Emmanouil Proestakis, Simona Scollo, Luca Merucci, Lucia Mona, Nikolaos Papagiannopoulos, and Prodromos Zanis

Modeling the dispersion of volcanic particles released during explosive eruptions is crucially dependent on the knowledge of the source term of the eruption and the source strength as a function of altitude and time. Forecasting volcanic ash transport is vital for aviation but rather inaccurate for quantitative predictions of the fate of volcanic particle emissions. Here we demonstrate an inverse modeling framework that couples the output of a Lagrangian dispersion model with remote sensing observations to estimate the emission rates of volcanic particles released from the Etna eruption. We use an inversion algorithm (Tichy et al., 2020) where the distance between the model and observations is optimized under the assumption that the source term is either sparse or smooth. The Bayesian formalism allows the algorithm to estimate these characteristics together with the source term itself and thus normalize the inversion problem. This methodology uses source receptor relationships as an input from the FLEXPART (flexible particle dispersion) model constrained by ground-based Lidar measurements and satellite observations of SO2 and ash emissions. The case study analyzed here refers to the Etna eruption on 12 March 2021, with the volcanic plume being well captured by the lidar measurements of the PANGEA observatory located at Antikythera island in southwest Greece. A dense aerosol layer, suspending in the height range between 7.5 and 12.5 km (19:30 - 21:30 UTC), has been captured by the PollyXT lidar. For the inversion simulations, we also use data acquired by the Spin-stabilised Enhanced Visible and Infrared Imager (SEVIRI) instrument, mounted on the Meteosat Second Generation (MSG) geostationary satellite. The aforementioned observations serve as a priori source information to estimate the volcanic ash and SO2 source strength, depending on altitude and time, coupled with the output of the FLEXPART model. Our results are efficient for real-time application and could supply ash forecasting models with an accurate estimation of the mass rate of very fine ash during explosive eruptions. Improved forecasts of the dispersed volcanic plumes following the suggested inverse modeling framework would then allow for more effective emergency preparedness for aviation to ensure safety during volcanic eruptions.


This research was also supported by the following projects: ERC grant D-TECT (agreement no. 725698); EU H2020 E-shape project (Grant Agreement n. 820852); PANCEA project (MIS 502151) under the Action NSRF 2014-2020, co-financed by Greece and the European Union. The research was supported by data and services obtained from the PANhellenic Geophysical Observatory of Antikythera (PANGEA) of the National Observatory of Athens (NOA), Greece. O. Tichy was supported by the Czech Science Foundation, grant no. GA20-27939S.


Tichy, O.; Ulrych, L.; Smidl, V.; Evangeliou, N.; Stohl, A. On the tuning of atmospheric inverse methods: comparisons with the European Tracer Experiment (ETEX) and Chernobyl datasets using the atmospheric transport model FLEXPART, Geosci. Model Dev. (2020), 13, 5917-5934.

How to cite: Kampouri, A., Amiridis, V., Tichý, O., Evangeliou, N., Solomos, S., Gialitaki, A., Marinou, E., Gkikas, A., Proestakis, E., Scollo, S., Merucci, L., Mona, L., Papagiannopoulos, N., and Zanis, P.: Inversion techniques on volcanic emissions and the use for quantitative dispersion modeling: The case of Etna eruption on 12 March 2021, EGU General Assembly 2023, Vienna, Austria, 23–28 Apr 2023, EGU23-13755, https://doi.org/10.5194/egusphere-egu23-13755, 2023.

EGU23-14820 | ECS | Posters on site | GMPV8.5

Pattern of volcanic degassing at open-vent volcanoes using TROPOMI SO2 time-series from COBRA retrievals 

Jordi Van Mieghem, Hugues Brenot, Benoît Smets, and Nicolas Theys

Sensitive and accurate detection of SO2 from remote sensing is essential to monitor volcanic degassing. The main objective of this study is to understand the dynamics of SO2 gas emissions at open-vent volcanoes between major eruptive events, using Sentinel-5P TROPOMI-based SO2 measurements.

Time-series of SO2 mass are analysed at 10 open-vent volcanoes (Ambrym, Erebus, Erta Ale, Kilauea, Masaya, Nyamuragira, Nyiragongo, Stromboli, Villarica, Yasur) using a newly developed TROPOMI SO2 product generated by the Covariance Based Retrieval Algorithm (COBRA; Theys et al., 2021). Compared to the current operational SO2 TROPOMI product (which uses the Differential Optical Absorption Spectroscopy technique), the COBRA dataset has improved performances and reduce both the noise and bias on the data, allowing a more refined study of degassing from open-vent volcanoes.

Time-series have been obtained for SO2 emissions over a period from 2018 to early 2023. For the 10 selected persistently active volcanoes, the SO2 behaviours are analysed and compared, showing cyclic and sporadic variations, as well as peaks of emission when a flank or major eruption occur. Patterns in SO2 time-series during and between major eruptive events are discussed to assess the potential use (and limitations) of these measurements as a tool for early warning and volcanic crisis management.

Reference:

Theys, N., Fioletov, V., Li, C., De Smedt, I., Lerot, C., McLinden, C., Krotkov, N., Griffin, D., Clarisse, L., Hedelt, P., Loyola, D., Wagner, T., Kumar, V., Innes, A., Ribas, R., Hendrick, F., Vlietinck, J., Brenot, H., Van Roozendael, M. (2021). A sulfur dioxide Covariance-Based Retrieval Algorithm (COBRA): application to TROPOMI reveals new emission sources. Atmospheric Chemistry and Physics, 21(22), 16727-16744.

How to cite: Van Mieghem, J., Brenot, H., Smets, B., and Theys, N.: Pattern of volcanic degassing at open-vent volcanoes using TROPOMI SO2 time-series from COBRA retrievals, EGU General Assembly 2023, Vienna, Austria, 23–28 Apr 2023, EGU23-14820, https://doi.org/10.5194/egusphere-egu23-14820, 2023.

EGU23-15216 | ECS | Posters on site | GMPV8.5

Trace element transport processes in volcanic gases 

Celine Mandon and Andri Stefansson

Despite our perception of gold as a shiny precious metal, a small amount of gold is actually transported by magmatic gases and emitted in the atmosphere at most volcanoes on Earth. This gaseous transport is made possible by the very nature of volcanic gases: high-temperature non-ideal water vapor-dominated mixture of gases, also containing other major constituents such as sulfur, carbon dioxide and halogens. This combination allows for volatile transport of virtually all elements from the periodic table, through the formation of gaseous compounds between trace elements and major gas species. However, the complexity of volcanic gases also makes them difficult to apprehend; little is known on the solubility and behavior of trace elements. Moreover, the gas composition varies from one volcano to another, while changes in pressure and temperature occur between gas exsolution from the magma and emission at the surface. Interactions between the gas phase and surrounding rocks and fluids can furthermore affect volcanic gases on their way to the surface. In this work, we explore the transport processes controlling the abundance of trace elements in volcanic gases. We use major and trace element composition from fumarolic gases from Vulcano, Italy sampled over a 14-year period and during both background emissions and unrest. We also work with a compilation of high-temperature gas compositions, from fumaroles and volcanic plumes, from various tectonic settings. This data is then used for thermochemical calculations using the HSC Chemistry software. We will explore the factors that affect the trace element transport in volcanic gases, such as 1) cooling of the gas from the exsolution temperature to the emission temperature at the surface, 2) pressure decrease from the depth of exsolution to atmospheric pressure, 3) composition of the gas and therefore ligand availability, 4) transport rate and its effect on mineral deposition from the gas.

How to cite: Mandon, C. and Stefansson, A.: Trace element transport processes in volcanic gases, EGU General Assembly 2023, Vienna, Austria, 23–28 Apr 2023, EGU23-15216, https://doi.org/10.5194/egusphere-egu23-15216, 2023.

EGU23-15716 | Posters on site | GMPV8.5

Tephrochronology and geochemical correlation of Middle Pleistocene distal tephra deposits in Armenia 

Edmond Grigoryan, Khachatur Meliksetian, Hripsime Gevorgyan, Ivan Savov, Gevorg Navasardyan, Marina Bangoyan, and Tatevik Boyakhchyan

Widespread volcanism played significant role in geological history of Anatolian-Armenian-Iranian orogenic plateau formed as a result of continental collision of Arabian and Eurasia. Among diverse chemical compositions and eruption styles, reported for volcanoes of Armenian highlands, noteworthy are distal tephra fallout deposits and voluminous ignimbrite shields resulted from violent explosive volcanic eruptions with VEI estimations ranging form 4 to 6. Obviously, such eruptions had significant impact on climate, human occupation and migrations in the entire region and provide insights to volcanic hazards in the region.  One difficulty in the identifying and studying explosive eruptions during Pleistocene, is that many tephra fallout deposits are not preserved in the geologic records, since unconsolidated deposits erode rapidly, particularly in mountain topography. In Armenia, there is a sparse geologic record of tephra fallouts, except where these deposits are preserved beneath pyroclastic flows, which presumably occurred very soon after tephra deposition. Such tephra deposits, are known in Armenia in underlying ignimbrite units related to activity of Aragats stratovolcano (Gevorgyan et al., 2018), beneath Ani ignimbrite in western part of Armenia and activity of Irind and Pemzashen volcanoes. Alternatively, tephra deposits can be preserved if layers are rapidly covered by loess deposits or colluvium deposits or landslides shortly after the eruption and tephra deposition occurs. Such conditions are known for distal tephra fall deposits from Ararat volcano in Ararat depression and in NE Armenia near Ijevan. A big number of finds of  Paleolithic stone tools, and resent achievements in studying Paleolithic archeology in south Caucasus region provide evidences of early human occupation in the territory of south Caucasus.  This contribution  aims to fill gaps in our knowledge of distal tephra layers identified in Armenia, namely in  north-east, south and central parts of Armenia.  New data based on detailed geochemical investigations and 40Ar/39Ar age determinations of distal tephra layers originated from violent explosive eruptions, reported in this study, can contribute to establish chronostratigraphic horizons as marker layers for paleoclimate and archaeological records during Middle-Upper Pleistocene in the entire region. Tephra layers preserved in Pleistocene sedimentary sequences in Armenia provide important information about these violent explosive eruptions that are significant for the geological evolution and the human geography of the entire region.

How to cite: Grigoryan, E., Meliksetian, K., Gevorgyan, H., Savov, I., Navasardyan, G., Bangoyan, M., and Boyakhchyan, T.: Tephrochronology and geochemical correlation of Middle Pleistocene distal tephra deposits in Armenia, EGU General Assembly 2023, Vienna, Austria, 23–28 Apr 2023, EGU23-15716, https://doi.org/10.5194/egusphere-egu23-15716, 2023.

CL1.1 – Deep Time

The Miocene Climatic Optimum (MCO) is an intriguing period of global climate history. Spanning from approximately 17 to 14 Ma, the MCO saw increased concentrations of greenhouse gasses and a rise in global temperature of 6 to 7 degrees Celsius. The MCO disrupted the long-term cooling trend of the Cenozoic and is often invoked as a potential analogue for understanding contemporary global climate change. It is not well understood, however, if and how the dynamics that drove the MCO (e.g., orbital pacing) may have conditioned regional-scale climate phenomena, particularly those associated with the interior of continents. Here we establish detailed, orbital-scale, terrestrial environmental responses to the MCO using magneto-cyclostratigraphic chronology. We identify six drought events in the Asian interior that are associated with prominent δ13C positive excursions, δ18O cooling Mi-events, global SST and sea-level fluctuations, as well as with the 405-kyr eccentricity band. We also document antiphase variability of precipitation across the monsoon-westerly influenced boundary. We contend that a predominant long eccentricity signal was of overriding significance as an orbital factor in regulating the rhythm of climatic change during the MCO.

How to cite: cao, Y.: Predominant orbital forcing on Asian hydroclimate linked with deep-sea records during the Miocene Climate Optimum, EGU General Assembly 2023, Vienna, Austria, 23–28 Apr 2023, EGU23-194, https://doi.org/10.5194/egusphere-egu23-194, 2023.

EGU23-227 | ECS | Orals | CL1.1.1

Orbital control of relative sea level changes in the Plio-Pleistocene of the Northeast Brazilian Equatorial Margin. 

Lucas Tortarolo, Marina Rabineau, Christian Gorini, Slah Boulila, Damien Do Couto, Tadeu Dos Reis, and Cleverson Guizan Silva

We address the evolution of the shelf architecture of the Northeast Brazilian Equatorial Margin during the Plio-Pleistocene, using a coupled approach of sequence stratigraphy based on 3D seismic data, and cyclostratigraphy based on well-log data. The main purpose of this study is to highlight the major forcing processes that control evolution and architecture of the shelf during the Plio-Pleistocene.

Our results reveal nine pronounced seismic sequences within the Plio-Pleistocene series, which are correlated to the long 405-kyr eccentricity cycles. Inside the two youngest 405-kyr cycles, we observe nine Falling Stage System Tracts (FSST) matching the short (97-128 kyr) eccentricity cycles. Finally, we identify three major depositional episodes (mega-sequences) in the Plio-Pleistocene: (i) the first episode (from ~4 to ~2.4 Ma) is characterized by small amplitudes of sea-level variations with low to none erosive structures and the absence of clear transgressive series, (ii) the second phase (from ~2.4 to ~0.9 Ma) records a drastic increase of erosional features as well as the apparition of thicker transgressive series and slope failures, and (iii) the third phase (from ~0.9 to present-day) is characterized by a dramatic change in the shelf geometry, most of the sediments are deposited on the slope during FSST while the outer shelf is greatly exposed and eroded during low sea levels. Our results suggest that long-term increase in amplitude of sea level variation is the main driver of the geometrical changes of the Brazilian shelf.  

Boundaries of mega-sequences at 0.9 and 2.4 Ma likely reflect major climatic phases at respectively the Intensification of Northern Hemisphere Glaciation and the Mid-Pleistocene Transition. A significant change in the shelf architecture at around 0.4 Ma, acting as a prominent shift in the depositional system from one prograding to another aggrading, is likely related to the substantial sea-level rise together with the long-lasting Marine Isotopic Stage 11. We conclude that changes in the Brazilian shelf geometry during the Plio-Pleistocene was likely paced by orbitally forced sea-level cycles superimposed on long-term trends and phases in the climate and sea level.

How to cite: Tortarolo, L., Rabineau, M., Gorini, C., Boulila, S., Do Couto, D., Dos Reis, T., and Guizan Silva, C.: Orbital control of relative sea level changes in the Plio-Pleistocene of the Northeast Brazilian Equatorial Margin., EGU General Assembly 2023, Vienna, Austria, 23–28 Apr 2023, EGU23-227, https://doi.org/10.5194/egusphere-egu23-227, 2023.

When astronomical cycles can be reliably identified in the sedimentary record, they can provide a basis for paleoclimatic interpretations and the construction of an astrochronology. However, different paleoclimate proxies carry different astronomical-climatic-depositional information, which can display distinct orbital frequency features in strata. How to evaluate response of varied sedimentary environments to astronomical forcing remains a mystery. Here, we developed the Random-length Average Orbital Power Ratio calculation (RAOPR) method to evaluate the average power ratio distributions within a specific time interval. We have applied this new method to the theoretical eccentricity-tilt-precession (ETP) plus noise series and a ~24 million-year-long Cretaceous terrestrial stratigraphic record. From the merged ETP plus noise series and geological record, we observed different orbital signal component distributions. For the Cretaceous terrestrial Songliao Basin, we combined the integratePower method to retrieve the long-term orbital variations and used the RAOPR method to evaluate the orbital signal distribution in different lithological formations (or depositional environment intervals). We found that in different sedimentary environments, orbital signals show significant discrepancy both in magnitudes and ratios, indicating different depositional processes and local geological events have resulted in emergence, amplification, displacement and suppression of orbital frequency. Our study highlights the interaction between the external orbital forcing and internal climatic and/or depositional feedbacks and their influence on assessing the orbital signals from the stratigraphic successions.

How to cite: Huang, H.: Evaluation of the terrestrial sedimentary system response to astronomical forcing, EGU General Assembly 2023, Vienna, Austria, 23–28 Apr 2023, EGU23-1588, https://doi.org/10.5194/egusphere-egu23-1588, 2023.

EGU23-2331 | Orals | CL1.1.1

The long-term stability of the deep ocean carbon storage feedback mechanisms across the Plio- and Pleistocene 

David Naafs, Rich Pancost, Jerome Blewett, Vittoria Lauretano, Jens Hefter, Simon Pounton, Ruediger Stein, and Gerald Haug

Storing carbon in the deep ocean is a key-feedback mechanism that allows astronomical forcing to drive the late Pleistocene glacial/interglacial variations. As carbon storage is intrinsically linked to oxygenation, proxies for sediment oxygenation have been used to quantify changes in carbon storage during the late Pleistocene. However, evidence for astronomically-paced changes in carbon storage beyond the late Pleistocene is limited, hindering our understanding of the stability of this feedback mechanisms.

Here we used molecular fossils (biomarkers) in marine sediment cores that span the last ~3.5 million years to assess the long-term impact of astronomical forcing on deep ocean oxygenation, and hence carbon storage, and explore the stability of this deep ocean feedback mechanism. Using high-resolution records from three independent cores from the North Atlantic, we find that the concentration of biomarkers from anaerobic bacteria is eccentricity paced during the middle and late Pleistocene with high abundances during glacials and absence during interglacials. We interpret this data to reflect a decrease in oxygenation and hence increase in carbon storage during the most recent glacials. Across the MPT this pacing changes to obliquity forcing and we show that this forcing is persistent into the late Pliocene, highlighting the stability of this feedback mechanism. However, prior to 2.7 Myr we find no biomarkers of anaerobic bacteria across the North Atlantic, suggesting reduced carbon storage prior to the intensification of the glaciation of the Northern Hemisphere. Our findings indicate that the lowering of atmospheric CO2 by the sequestration of carbon in the deep ocean in response to astronomical forcing persisted throughout the Quaternary and was essential for the development of Plio/Pleistocene ice ages, but this feedback mechanisms did not persist into the warm Pliocene.

How to cite: Naafs, D., Pancost, R., Blewett, J., Lauretano, V., Hefter, J., Pounton, S., Stein, R., and Haug, G.: The long-term stability of the deep ocean carbon storage feedback mechanisms across the Plio- and Pleistocene, EGU General Assembly 2023, Vienna, Austria, 23–28 Apr 2023, EGU23-2331, https://doi.org/10.5194/egusphere-egu23-2331, 2023.

EGU23-3597 | ECS | Orals | CL1.1.1

A wavelet-based workflow for cyclostratigraphic studies using the WaverideR R package 

Michiel Arts and Anne-Christine Da Silva

Cyclostratigraphic studies are based on accurately identifying astronomical cycles in the geological record. In excellent geological records, observed cycles can be directly coupled to their corresponding astronomical cycles. In more complex records spectral analysis techniques are needed to identify astronomical cycles. Most cyclostratigraphic studies utilise spectral analysis techniques based on the Fast Fourier transform (FFT). FFT-based spectral analysis techniques are excellent in identifying orbital cycles when the signal is stationary (e.g., the sedimentation rate is constant). To track changes in the sedimentation rate, a sliding window-based FFT analysis is often implemented, resulting in a frequency versus depth/time plot highlighting frequency changes and/or changes in the sedimentation rate. Windowed FFT-based techniques have one significant drawback: the window size has a fixed length, which limits the frequency range that can be analysed. The Continuous Wavelet Transform (CWT) avoids this drawback because the wavelet scales proportionally to the length of the analysed period. Current wavelet-based software/packages lack the features needed to complete a cyclostratigraphic study; therefore, the WaverideR R package (https://stratigraphy.eu/downloads) was developed, which contains all the essential functions required to do a CWT-based cyclostratigraphic analysis. To highlight the functionalities and versatility of the functions of the WaverideR R package, set functions are applied to three records; the Holocene Total Solar Irradiance (TSI) record, the Miocene ODP 926 greyscale record, and the Devonian Sullivan core magnetic susceptibility record.  The TSI record analysis highlights the WaverideR package's ability to change the omega (cycles within a wavelet) and extract cycles from the wavelet directly. The study of the Miocene ODP 926 greyscale shows how the WaverideR package can directly extract astronomical cycles in the depth domain and anchor this astronomical cycle to the astronomical solution. The analysis of the Devonian Sullivan core magnetic susceptibility record shows how the WaverideR package can trace the 405 kyr eccentricity cycle in a wavelet spectrum and create a floating age model, identify cycles in the time domain and then extract those cycles and the features of those extracted cycles such as its spectral power and its amplitude from the wavelet spectra. 

How to cite: Arts, M. and Da Silva, A.-C.: A wavelet-based workflow for cyclostratigraphic studies using the WaverideR R package, EGU General Assembly 2023, Vienna, Austria, 23–28 Apr 2023, EGU23-3597, https://doi.org/10.5194/egusphere-egu23-3597, 2023.

The dynamical evolution of the solar system is chaotic with a Lyapunov time of only ~5 Myr for the inner planets. Due to the chaos it is fundamentally impossible to accurately predict the solar system's orbital evolution beyond ~50 Myr based on present astronomical observations. We recently developed a method to overcome the problem by using the geologic record to constrain astronomical solutions in the past. Our resulting optimal astronomical solution (called ZB18a) shows exceptional agreement with geologic records to ~58 Ma (Myr ago) and a characteristic resonance transition around 50~Ma. Here we show that ZB18a and integration of Earth's and Mars' spin vector based on ZB18a yield reduced variations in Earth's and Mars' orbital inclination and Earth's obliquity (axial tilt) from ~58 to ~48 Ma. The changes in the obliquities have important implications for the climate histories of Earth and Mars. For instance, reduced variations in Earth's obliquity from ~58 to ~48 Ma would have affected Earth's climate across the late Paleocene - early Eocene (LPEE). Remarkably, a nearly ubiquitous phenomenon in long-term geologic records across the LPEE is a very weak or absent obliquity signal. We propose here that the reduced amplitude in Earth's obliquity, as predicted by our astronomical solution ZB18a, contributed to the weak/absent obliquity signal in geologic records from ~58 to ~48 Ma. Dynamical chaos in the solar system hence not only affects its orbital properties, but also the long-term evolution of planetary climate through eccentricity and the link between inclination and axial tilt.

How to cite: Zeebe, R.: Missing Obliquity Signal in Late Paleocene and Early Eocene Climate Records due to Solar System Chaos, EGU General Assembly 2023, Vienna, Austria, 23–28 Apr 2023, EGU23-3965, https://doi.org/10.5194/egusphere-egu23-3965, 2023.

EGU23-4198 | ECS | Orals | CL1.1.1 | Highlight

Response of the Snowball Earth Climate to Orbital Forcing at High CO2 Level 

Jiacheng Wu and Yonggang Liu

It is commonly accepted that the Milankovitch cycles have modulated the glacial-interglacial cycles during the Quaternary Period. However, how the climate during the Neoproterozoic snowball Earth events, the most extreme glaciations that have occurred on Earth, was affected by the orbital forcings remains largely unclear. Especially, whether the snowball Earth deglaciation might occur more easily at some orbital configurations than others is an important question. Here a coupled atmosphere-land model (CAM3 and CLM3) is used to investigate the response of temperature and hydrological cycle during a snowball Earth to this forcing at an atmospheric CO2 level of ~0.1 bar. To simplify the analysis, we have chosen to remove the continents. The results show that the climate is very different under different orbital configurations. The globally averaged annual surface temperature can differ by 2.4 °C while the difference in the monthly mean can reach 3.7 °C in the subtropical region. Surprisingly, we find that the Milankovitch theory does not only work in the extratropical region but also in the tropics; the snow thickness in the tropical region is inversely proportional to the summer insolation received in this region. After adding an explicit meltpond module, we find that the threshold CO2 that is needed to trigger the deglaciation may be reduced from 0.12 bar (low eccentricity) to 0.07 bar (high eccentricity). Moreover, the summer insolation in the tropics is more important than that in the subtropical region for the formation of a perennial meltwater belt. Hence, we conclude that the orbital forcing is important to the snowball Earth climate at its late stage and would assist Earth to get out of this state when the eccentricity was high.

How to cite: Wu, J. and Liu, Y.: Response of the Snowball Earth Climate to Orbital Forcing at High CO2 Level, EGU General Assembly 2023, Vienna, Austria, 23–28 Apr 2023, EGU23-4198, https://doi.org/10.5194/egusphere-egu23-4198, 2023.

EGU23-4300 | ECS | Orals | CL1.1.1

Simulated cycles of East Asian temperature and precipitation over the past 425 ka 

Gaowen Dai and Zhongshi Zhang

Records from a wide range of geological archives covering the last few glacial-interglacial cycles show large inconsistencies in the East Asian summer monsoon variability, which severely hampers our understanding of the evolution and potential mechanisms of the regional East Asian climate on orbital timescales. Here, we examine the simulated temperature and precipitation in East Asia based on a series of equilibrium simulations conducted for the past 425 ka, and we investigate the sensitivity of temperature and precipitation to potential forcings. Our simulations show that, in East Asia, the seasonal mean temperature is dominated by a ∼20-kyr cycle, and the annual mean temperature (AMT) is dominated by a ∼100-kyr cycle, which is consistent with previous modeling efforts and geological reconstructions. Additional sensitivity experiments indicate that the greenhouse gas concentration, in combination with the ice volume, is the dominant force for the variations of AMT in East Asia on orbital timescales. For the precipitation in East Asia, our equilibrium simulations and additional sensitivity experiments, together with comprehensive model-data intercomparison analysis, suggest that the cycles of simulated annual mean precipitation over East Asia are highly model-dependent, although the dominant ∼20-kyr cycle in summer precipitation appears to be a robust feature. Overall, the results highlight the large model uncertainty with regard to the relative roles of forcings in hydroclimate variations in East Asia on orbital time scales. There is, therefore, an urgent need to implement more realistic precipitation schemes in models in order to decrease the model spread in simulated precipitation.

How to cite: Dai, G. and Zhang, Z.: Simulated cycles of East Asian temperature and precipitation over the past 425 ka, EGU General Assembly 2023, Vienna, Austria, 23–28 Apr 2023, EGU23-4300, https://doi.org/10.5194/egusphere-egu23-4300, 2023.

EGU23-5479 | ECS | Orals | CL1.1.1

North African Humid Periods over the past 800000 years – Timing, Amplitude and Forcing 

Edward Armstrong, Miikka Tallavaara, Peter Hopcroft, and Paul Valdes

The Sahara region has experienced periodic wet periods over the Quaternary and beyond. These North African Humid Periods (NAHPs) are astronomically paced by precession which controls the position of the African monsoon system. However, most IPCC-class climate models cannot generate enough precipitation to reconcile the magnitude of these events and so the driving mechanisms remain poorly constrained. Here, we present an 800kyr climate dataset produced using a recently developed version of the HadCM3B coupled climate model that simulates 20 NAHPs over the past 800kyr which have good agreement with the timing and amplitude of NAHPs identified in proxy data. Our results confirm that precession determines their pacing, but we identify that their amplitude is strongly linked to eccentricity via its control over ice sheet extent. During glacials, cooling due to enhanced ice-sheet albedo suppresses the amplitude of the NAHPs during periods of precession minima. Our results highlight the importance of both precession and eccentricity, and the role of high latitude processes in determining the timing and amplitude of the NAHPs. This may have implications for the out of Africa dispersal of plants and animals throughout the Quaternary.

How to cite: Armstrong, E., Tallavaara, M., Hopcroft, P., and Valdes, P.: North African Humid Periods over the past 800000 years – Timing, Amplitude and Forcing, EGU General Assembly 2023, Vienna, Austria, 23–28 Apr 2023, EGU23-5479, https://doi.org/10.5194/egusphere-egu23-5479, 2023.

EGU23-6175 | ECS | Posters on site | CL1.1.1

Strengthened East Asian winter monsoon associated with insolation and Arctic sea ice since the middle Holocene 

Peng Zhou, Zhengguo Shi, and Xinzhou Li

The East Asian winter monsoon (EAWM) is one of the most important Asian climate systems, with a huge influence on social, agricultural productivity, and economic development. Sub-orbital-scale variations of the East Asian winter monsoon (EAWM) since the mid-Holocene and its associated mechanisms, however, are still not fully understood. Based on a high-resolution transient simulation, here we present a continuous climate evolution of EAWM in response to orbital forcing. Similar to the record proxy, the simulated EAWM variations exhibit a strengthening trend since the mid-Holocene, especially in the spring. Following the orbitally-induced decay of Northern Hemisphere summer insolation during the Holocene, growing Arctic Sea ice persists into winter and increases the latitudinal temperature gradient between low- and high latitudes, which lead to the strengthening of wintertime EAWM. While the intensified springtime EAWM can be attributed to the enhanced temperature gradient caused by solar insolation at different latitudes, rather than local insolation. Our results indicate that insolation forcing and Arctic Sea ice have played a key role in driving Holocene EAWM changes by enhancing temperature gradient between low and high latitudes.

How to cite: Zhou, P., Shi, Z., and Li, X.: Strengthened East Asian winter monsoon associated with insolation and Arctic sea ice since the middle Holocene, EGU General Assembly 2023, Vienna, Austria, 23–28 Apr 2023, EGU23-6175, https://doi.org/10.5194/egusphere-egu23-6175, 2023.

EGU23-9202 | ECS | Orals | CL1.1.1 | Highlight

Orbital pacing of Southeast Atlantic carbonate deposition since the Oligocene (30-0 Ma): tracing entwined climate and carbon cycle interactions 

Anna Joy Drury, Diederik Liebrand, Thomas Westerhold, Helen M. Beddow, David De Vleeschouwer, David A. Hodell, Nina Rohlfs, Roy H. Wilkens, Mitchell Lyle, David B. Bell, Dick Kroon, Heiko Pälike, and Lucas J. Lourens

The last 30 million years (Myr) of Cenozoic climate change broadly charted the transformation from a world with solitary Antarctic ice sheets through to a bipolar glaciated Earth. Highly resolved records of carbonate content (%CaCO3) provide insight into regional impacts of ever shifting climate, cryosphere and carbon cycle interactions. Here, we use X-ray fluorescence (XRF) ln(Ca/Fe) data collected at Ocean Drilling Program Site 1264 (Angola Basin side of Walvis Ridge, SE Atlantic Ocean) to generate the first SE Atlantic %CaCO3 record spanning 30-0 Myr ago (Ma). Minimal changes in terrigenous-derived XRF data supports that the %CaCO3 reflects the balance between productivity and dissolution in this region. This XRF data also helped to formulate a comprehensive and continuous depth and age model for the entirety of Site 1264 (~316 m; 30-0 Ma). These verified depth and age models constitute a key framework for future palaeoceanographic studies at this location.

We identify three phases with distinctly different orbital imprints of CaCO3 deposition in the SE Atlantic. The shifts between these phases broadly occur across major developments in climate, the cryosphere and/or the carbon cycle: 1) strong ~110 kyr eccentricity pacing prevails during Oligo-Miocene global warmth (~30-13 Ma); 2) eccentricity-modulated precession imprints more strongly after the mid Miocene Climate Transition (mMCT) (~14-8 Ma); 3) strong obliquity pacing prevails in the late Miocene (~7.7-3.3 Ma) following widespread cooling and the increasing influence of high-latitude processes.

The lowest %CaCO3 (92-94%) occur between 18.5-14.5 Ma, potentially reflecting increased dissolution or decreased productivity driven by widespread early Miocene warmth. Deposition recovered after the mMCT (~14 Ma), likely associated with changes in regional surface and/or deep-water circulation following Antarctic reglaciation. The highest Site 1264 %CaCO3 and MARs indicate the late Miocene Biogenic Bloom (LMBB) occurs between ~7.8-3.3 Ma. The LMBB’s onset (~7.8 Ma) and peak productivity (~7 Ma) at 1264 are contemporaneous with the LMBB in the equatorial Pacific Ocean; however the termination is ~1 Myr later in the Atlantic compared to the Pacific. Globally synchronous patterns in the LMBB, including the onset and peak, may be driven by an increased nutrient input into the global ocean, for instance from enhanced aeolian dust and/or weathering fluxes. Regional diachrony and variability in the LMBB’s expression may be driven by regional differences in cooling, continental aridification and/or changes in ocean circulation during the latest Miocene.

How to cite: Drury, A. J., Liebrand, D., Westerhold, T., Beddow, H. M., De Vleeschouwer, D., Hodell, D. A., Rohlfs, N., Wilkens, R. H., Lyle, M., Bell, D. B., Kroon, D., Pälike, H., and Lourens, L. J.: Orbital pacing of Southeast Atlantic carbonate deposition since the Oligocene (30-0 Ma): tracing entwined climate and carbon cycle interactions, EGU General Assembly 2023, Vienna, Austria, 23–28 Apr 2023, EGU23-9202, https://doi.org/10.5194/egusphere-egu23-9202, 2023.

EGU23-9980 | ECS | Orals | CL1.1.1 | Highlight

Recurrent humid phases interrupt an overall aridity trend in Arabia over the past 8 million years creating windows of opportunity for biogeographic dispersals 

Monika Markowska, Hubert B. Vonhof, Huw S. Groucutt, Michael D. Petraglia, Denis Scholz, Michael Weber, Axel Gerdes, Alfredo Martinez-Garcia, Matthew Stewart, Ashley N. Martin, Nicholas Drake, Paul S. Breeze, Samuel L. Nicholson, Dominik Fleitmann, and Gerald Haug

The Saharo-Arabian desert is part of the largest near-continuous chain of drylands stretching from north-western Africa to the northern China. This harsh and often hyper-arid belt acts as a transition zone separating major biogeographic realms, including the Palearctic, Afrotropics and Indomalayan. This aridity is thought responsible for the creation of unique geographic endemism between Africa and Eurasia. However, there are no direct hydroclimate records from the Arabian hyper-arid interior before the mid-Pleistocene, leaving the terrestrial hydroclimate and the role of Arabia as a biogeographic crossroads or barrier largely unknown.

We use desert speleothems preserved from the northern Arabian interior to identify past humid phases over the last 8 million years. These are particularly useful terrestrial climate archives as they act as underground rain gauges, requiring a minimum of ~300 mm a-1 precipitation, pedogenesis and vegetation cover to form. Moreover, they can be accurately and precisely dated and are subsequently a valuable tool in identifying past large-scale hydrological and vegetation changes in ancient drylands. Our data reveal evidence of multiple ‘windows of opportunity’ of climate amelioration, allowing biogeographic exchange and dispersals to occur across the Arabian hyper-arid zone. Further, the novel analyses of the isotopic composition (d18O and d2H) of speleothem fluid inclusion waters, representing ‘fossil rainwater’, reveal the diminishing influence of tropical rain-belt precipitation in Arabia across Earth’s transition from a largely ‘ice-free’ northern hemisphere to an ‘ice-age’ world. The extent of Arabian aridity may thus be important in controlling biogeographic dispersals through the Arabian corridor, becoming increasingly less favourable through time. This is supported by fossil evidence which suggest that exchange between biogeographic regions across the Old World Savannah Biome were favoured in the Late Miocene, but became increasingly latitudinally fragmented from the Pliocene onwards. These results have significant implications for understanding the drivers of dryland aridity in non-polar deserts globally. 

How to cite: Markowska, M., Vonhof, H. B., Groucutt, H. S., Petraglia, M. D., Scholz, D., Weber, M., Gerdes, A., Martinez-Garcia, A., Stewart, M., Martin, A. N., Drake, N., Breeze, P. S., Nicholson, S. L., Fleitmann, D., and Haug, G.: Recurrent humid phases interrupt an overall aridity trend in Arabia over the past 8 million years creating windows of opportunity for biogeographic dispersals, EGU General Assembly 2023, Vienna, Austria, 23–28 Apr 2023, EGU23-9980, https://doi.org/10.5194/egusphere-egu23-9980, 2023.

EGU23-10022 | Posters on site | CL1.1.1

Global carbon cycle response to Milanković forcing 

Miho Ishizu, Axel Timmerman, and Kyung-Sook Yun

To gain a deeper understanding of why atmospheric CO2 varied on Milanković timescales, we conducted a 3 million-year transient carbon cycle simulation with the intermediate-complexity Grid Enabled Integrated Earth System (cGENIE). To this end we nudged ocean temperature and salinity obtained from a previously conducted 3 million-year climate simulation conducted with the Community Earth System Model (CESM1.2) into the cGENIE ocean model. The cGENIE model captures key processes relevant for the longterm behaviour of the carbon cycle, including ocean biogeochemistry, vegetation, land surface weathering and sedimentary dynamics. Here we will present the first results from a series of transient glacial-interglacial simulations cGENIE simulations which identify the role of ocean circulation, sea ice, solubility and land vegetation changes as drivers of low frequency pCO2 variability. We will further discuss the effects of iron fertilization and carbonate compensation.  

How to cite: Ishizu, M., Timmerman, A., and Yun, K.-S.: Global carbon cycle response to Milanković forcing, EGU General Assembly 2023, Vienna, Austria, 23–28 Apr 2023, EGU23-10022, https://doi.org/10.5194/egusphere-egu23-10022, 2023.

EGU23-10195 | ECS | Orals | CL1.1.1

Last Interglacial Saharo-Arabian palaeoclimate variability and Homo sapiens dispersal: insights from the speleothem record of Southern Arabia 

Samuel Nicholson, Matthew Jacobson, Huw Groucutt, Monika Markowska, Hubert Vonhof, Rob Hosfield, Alistair Pike, Stephen Burns, Albert Matter, and Dominik Fleitmann

The fluctuating climatic conditions of the Saharo-Arabian desert belt are increasingly important for both palaeoclimatic and palaeoanthropological debates. Currently, Saharo-Arabia acts as a vast biogeographic barrier between the Afrotropical and Palaearctic realms. On orbital timescales, northward incursions of the African (ASM) and Indian (ISM) Summer Monsoons activated fluvio-lacustrine systems and led to the formation of grassland habitats. The formation of these habitats has been considered a crucial factor in Homo sapiens dispersals into the Saharo-Arabian deserts and beyond. The so-called “northern route” favours a terrestrial dispersal through green palaeohydrological corridors. However, a maritime “southern route” during the sea-level low-stand of Glacial Termination-II (T-II) has also been proposed. The precise phasing between the onset of wetter conditions and rising sea-levels may thus be a crucial factor for testing these alternative hypotheses. Here, we present a precisely dated high-resolution (<100 yrs) stalagmite record from Mukalla Cave, Yemen, at a key location on the “southern route”. Wetter conditions in Southern Arabia prevailed from ~127.7 to ~121.1 ka BP and occurred when sea-levels were already higher than at present, revealing a phase-lag of several thousand-years between sea-level rise and the onset of pluvial conditions. This lag is likely related to the colder conditions of Heinrich Stadial-11, which supressed the interhemispheric pressure gradient and the ASM and ISM throughout T-II despite rising insolation. δ18Oca values indicate rainfall intensity during the ~127.7 to ~121.1 ka BP interval 1) followed low-latitude insolation, and 2) was the greatest in the last 130,000 years.  Additionally, a mixed C3/C4 grassland environment, as revealed by stalagmite δ13Cca values, was present in the now desert interior of Yemen. Combined with archaeological evidence, we discuss the potential implications our results have for H. sapiens biogeographical shifts and dispersal processes across Saharo-Arabia during early MIS 5.


How to cite: Nicholson, S., Jacobson, M., Groucutt, H., Markowska, M., Vonhof, H., Hosfield, R., Pike, A., Burns, S., Matter, A., and Fleitmann, D.: Last Interglacial Saharo-Arabian palaeoclimate variability and Homo sapiens dispersal: insights from the speleothem record of Southern Arabia, EGU General Assembly 2023, Vienna, Austria, 23–28 Apr 2023, EGU23-10195, https://doi.org/10.5194/egusphere-egu23-10195, 2023.

The geometry of the Earth's orbit, and the movements around its axis, result in periodic changes in the solar radiation received by the Earth's surface. These cyclic variations throughout geologic time cause climatic changes that manifest in the hydrologic cycle and atmospheric and oceanic circulation. In turn, these processes result in sedimentary cycles that, although masked by diagenetic processes, record the Earth's orbital rhythm.

In the Middle Magdalena Valley Basin (VMM), the Cenomanian-Turonian interval is represented by the rocks of the La Luna Formation, which has a cyclic lithological character, since it consists of intercalation of limestones and shales rich in organic matter. 

This work seeks to understand the mechanisms that control cyclic sedimentation and organic matter accumulation in the Middle Magdalena Valley basin, as well as to calculate the temporal duration of stratigraphic cycles and determine whether these are related to eccentricity, obliquity, or precession. Also, We will compare with intervals in the tropical belt where previous studies have been carried out to determine whether the observed pattern is local (controlled by basin geometry) or regional (changes in the hydrological cycle caused by orbital parameters).

We present lithologic information from the Cenomanian-Turonian interval at Pozo la Luna-1, which has a thickness of 573 ft and consists of a succession of limestones with wackestone texture, locally with foraminiferal packstones, interbedded with thin to medium layers of marls and bentonites (<1cm).

Results from the δ13Corg content suggest that OAE2 is recorded in this section and is 69.18 ft thick with δ13C values between -27.18 and -23.94. Four phases of the OAE2 are interpreted: 1) build-up 2) Trough 3) Plateau and 4) Recovery. The time series analyses are developed in the "Astrochron" package (22). They are run on 1146 data of K/Th and Th/K ratios, distributed every 0.5ft. The methods "multi-taper method spectrogram of evolutive harmonic analysis", and "Evolutive average spectral misfit (eASM)" will be applied to detect the presence of cycles along the stratigraphic profile and to estimate their statistical significance compared to a noise level at different confidence intervals.

How to cite: Valencia Arias, C.: Orbital variations in the Cenomanian-Turonian, paleoclimatic implications and their relationship with the accumulation of organic-rich intervals in the Middle Magdalena Valley basin, Colombia., EGU General Assembly 2023, Vienna, Austria, 23–28 Apr 2023, EGU23-10761, https://doi.org/10.5194/egusphere-egu23-10761, 2023.

EGU23-11747 | ECS | Posters on site | CL1.1.1

Cyclostratigraphic calibration of the Miaolingian Series (Middle Cambrian, Southern Scandinavia, Sweden) 

Valentin Jamart, Damien Pas, Jorge E. Spangenberg, Thierry Adatte, Arne T. Nielsen, Niels H. Schovsbo, Nicolas R. Thibault, and Allison C. Daley

The Cambrian Period recorded critical evolutionary events and geochemical changes. These changes, such as the “Cambrian Explosion” (Briggs, 2015; Peng et al., 2020) and the “Cambrian Substrate Revolution” (Mángano & Buatois, 2017; Peng et al., 2020) can persist for many millions of years or can be a short carbon isotopic excursion or anoxic event. Despite the significance of this period for the history of life on Earth, it features a remarkably poorly defined time scale owing to 1) the paucity of high-precision radioisotope age data, 2) the generalized endemism (especially during the lower Cambrian) and 3) the lack of well-preserved exposures.

Recent advances in time-series methods for identifying Milankovitch cycles have accelerated the refinement of the Phanerozoic GTS and the invariant set of periods for the Earth’s orbital eccentricity for at least the last 600 Ma have allowed for the building of high-resolution floating astronomical time scales (ATS) for Mesozoic and Paleozoic sequences.

A crucial issue in unraveling Milankovitch cyclicity in Paleozoic successions is the selection of suitable sedimentary sequences, which are able to record orbitally-forced climatic cycles continuously. A recent cyclostratigraphic study by Zhao et al. (2022) on the middle and upper portion of the Albjära-1 drill core confirmed the record of such cycles in a time interval that extends from the lower Guzhangian to the Lower Ordovician. In this study, we conducted a high-resolution (1 mm) XRF core scanning on the lower portion (27 m) of the Albjära-1 drill-core to assess Milankovitch cyclicity recorded by variations in detrital input proxies and built a floating ATS for the middle Wuliuan-lower Guzhangian interval. Our ATS is in stratigraphic continuity with Zhao et al.’s (2022) ATS, thus allowing us to use the U/Pb absolute age anchor below the Cambrian-Ordovician boundary (486.78 ± 0.53 Ma) and expand their ATS to the middle Wuliuan.

The core recovery is close to 100%. The first 5 m are characterized by sandy limestone of the Gislöv Formation, and the overlying 22 m consist of deep-water black shales of the Alum Shale Formation, from which 151 samples were taken each 15 cm for δ13Corg analysis.

The combination of both δ13Corg and XRF elemental analyses allows for precise integration of the ATS in the global Cambrian geochemical framework and provides better insight into the timing and origin of geochemical fluctuations during the studied time interval.


REFERENCES

Briggs, D. E. G. (2015). The Cambrian explosion. Current Biology, 25 (19), R864-R868. https://doi.org/10.1016/j.cub.2015.04.047

Mángano, M. G., & Buatois, L. A. (2017). The Cambrian revolutions: Trace-fossil record, timing, links and geobiological impact. Earth-Science Reviews,173, 96-108. https://doi.org/10.1016/j.earscirev.2017.08.009

Peng, S.-C., Babcock, L. E., & Ahlberg, P. (2020). The Cambrian Period. In F. Gradstein, J. G. Ogg, M. D. Schmitz, & G. M. Ogg (Eds.), Geological Time Scale 2020 (Vol. 2, pp. 565-629). Elsevier. https://doi.org/10.1016/B978-0-12-824360-2.00019-X

Zhao, Z., Thibault, N.R., Dahl, T.W., Schovsbo, N.H., Sørensen, A.L., Rasmussen, C.M.Ø., and Nielsen, A.T. (2022). Synchronizing rock clocks in the late Cambrian. Nature Communications, 13, 1-11. https://doi.org/10.1038/s41467-022-29651-4

How to cite: Jamart, V., Pas, D., Spangenberg, J. E., Adatte, T., Nielsen, A. T., Schovsbo, N. H., Thibault, N. R., and Daley, A. C.: Cyclostratigraphic calibration of the Miaolingian Series (Middle Cambrian, Southern Scandinavia, Sweden), EGU General Assembly 2023, Vienna, Austria, 23–28 Apr 2023, EGU23-11747, https://doi.org/10.5194/egusphere-egu23-11747, 2023.

EGU23-12603 | ECS | Posters on site | CL1.1.1

Patterns and cyclicity of Quaternary sedimentation above a subducting seamount at Rock Garden (central Hikurangi Margin, New Zealand) 

Cornelius Schwarze, Peter Frenzel, and Nina Kukowski

Rock Garden (RG), located east off the North Island of New Zealand, is part of an accretionary ridge that is influenced by seamount subduction. Two ∼37m long sediment cores, drilled with the seafloor drill rig (MeBo200) from RG, provide a continuous sedimentary record of the period between 1.95-0.4 Ma. This period, the Early-Middle Pleistocene transition (EMPT), was marked by a progressive increase in the amplitude of climate oscillations and a shift of Milanković cycles from 41 ka towards a quasi-100 ka frequency in the absence of any significant change in orbital forcing. From the recovered core material of cores GeoB20824-4 and GeoB20846-1, we determined sediment physical properties, oxygen isotope (δ18O) values, and element concentrations based on X-ray fluorescence (XRF) measurements. The element ratios were used as proxies for sediment composition and as paleoenvironmental indices. In sediment physical properties, δ18O values, and geochemical properties, evidence for glacial and interglacial cycles and cyclicities of 405 ka, 100 ka, 41 ka were found. A shift of the cyclicity from 41 to 100 ka took place in sediment cores during (1.4-0.4 Ma). Numerical ages obtained from tephra layers included in the sedimentary record enabled to estimate sedimentation rates from both cores. Although both drill sites are only 1800 m away from each other, sedimentation rates of 2.15-2.96 cmka−1 (GeoB20824-4) and 5.49-6.77 cmka−1 (GeoB20846-1), respectively, differ by a factor of two. This may be the reason why two facies-units were identified in core GeoB20824-4, whereas sediments of core GeoB20846-1 all belonged to the same facies. A change of lithofacies in core GeoB20824-4 between Unit I and Unit II in ∼20 mbsf at 1.5-1.4 Ma marks the initiation of the EMPT.

How to cite: Schwarze, C., Frenzel, P., and Kukowski, N.: Patterns and cyclicity of Quaternary sedimentation above a subducting seamount at Rock Garden (central Hikurangi Margin, New Zealand), EGU General Assembly 2023, Vienna, Austria, 23–28 Apr 2023, EGU23-12603, https://doi.org/10.5194/egusphere-egu23-12603, 2023.

EGU23-12664 | ECS | Orals | CL1.1.1

A song of ice and friction: the impact of basal friction and proglacial lakes on Pleistocene glacial cycles 

Meike D.W. Scherrenberg, Roderik S.W. van de Wal, and Constantijn J. Berends

During the Mid Pleistocene Transition (MPT; 1.2-0.7 Ma) the periodicity of glacial cycles changed from 40 ka to ~100 ka, without a coinciding change in orbital forcing. The MPT therefore results from feedback and changes in the climate system and ice dynamics triggered by the changes in radiative forcing. However, it remains unclear which physical processes are critical for the transition.

Here we explore the role of basal sliding and glacial isostatic adjustment (GIA) in the MPT. Basal sliding is thought to have changed across the MPT due to the erosive action of the ice sheets gradually removing the regolith cover and exposing the underlying bedrock, therefore increasing the friction at the base. GIA modulates this effect by enabling the formation of large proglacial lakes, changing the ice margin from a land-based to a marine environment. We simulate the evolution of the Northern Hemisphere ice sheets during the past 1.5 million years, using an ice-sheet model forced by a climate matrix method.

We show that changing the basal friction has an effect on glacial terminations and consequentially glacial cycle periodicity. Larger friction leads to thicker ice sheets that are more likely to survive a climatic optimum. However, we show that using an unchanging friction coefficient through the Pleistocene, our model still produces change from 40 ka to 100 ka periodicities signifying the MPT. This suggest that the regolith hypothesis is not necessary to explain the MPT.

In addition, we show that the formation of proglacial lakes is required for achieving a full deglaciation of the large Late Pleistocene ice sheets. Ice that floats on water experiences no friction at the base, resulting in high ice velocities. This results in more ice in lower regions and enhances the melt of ice. Here, we find a strong modulating role of GIA. When neglecting bedrock adjustment, thus preventing the formation of large proglacial lakes, we fail to simulate a full deglaciation.

How to cite: Scherrenberg, M. D. W., van de Wal, R. S. W., and Berends, C. J.: A song of ice and friction: the impact of basal friction and proglacial lakes on Pleistocene glacial cycles, EGU General Assembly 2023, Vienna, Austria, 23–28 Apr 2023, EGU23-12664, https://doi.org/10.5194/egusphere-egu23-12664, 2023.

EGU23-12739 | Orals | CL1.1.1

North Atlantic Drift Sediments Constrain Eocene Tidal Dissipation and the Evolution of the Earth-Moon System. 

David De Vleeschouwer, Donald Penman, Simon D'haenens, Fei Wu, Thomas Westerhold, Maximilian Vahlenkamp, Carlotta Cappelli, Claudia Agnini, Wendy Kordesch, Daniel King, Robin van der Ploeg, Heiko Pälike, Sandra Kirtland-Turner, Paul Wilson, Richard D. Norris, James C. Zachos, Steven Bohaty, and Pincelli Hull

Cyclostratigraphy and astrochronology are leading methods for determining geologic time. While this technique is dependent on the accuracy of astronomical calculations, the chaos of the solar system limits the confidence of these calculations when applied to ancient periods. High-resolution paleoclimate records, such as those found in Middle Eocene drift sediments from the Newfoundland Ridge (Integrated Ocean Drilling Program Sites (IODP) Expedition 342), offer a unique opportunity to reverse this approach. These sediments, with their high sedimentation rates and distinct lithological cycles, provide an ideal setting for this type of study. However, the stratigraphies of IODP Sites U1408-U1410 are complex and contain several hiatuses. We have overcome this challenge by creating a composite of the two sites and constructing a conservative age-depth model. This has allowed us to create a reliable chronology for this high-resolution sedimentary archive. We have used two different techniques to extract astronomical components (g-terms and precession constant) from proxy time-series, which have produced consistent results. Our study has found that astronomical frequencies are up to 4% lower than those reported in astronomical solution La04. These results provide new constraints on the variability of g-term on million-year timescales, as well as evidence that the g4-g3 "grand eccentricity cycle" may have had a 1.2-Myr period around 41 Ma, instead of its current 2.4-Myr periodicity. Our estimates of the precession constant also confirms previous indications of a relatively low rate of tidal dissipation in the Paleogene. The Newfoundland Ridge drift sediments thus offer a reliable means of reconstructing astronomical components, providing a new target for future astronomical calculations.

How to cite: De Vleeschouwer, D., Penman, D., D'haenens, S., Wu, F., Westerhold, T., Vahlenkamp, M., Cappelli, C., Agnini, C., Kordesch, W., King, D., van der Ploeg, R., Pälike, H., Kirtland-Turner, S., Wilson, P., Norris, R. D., Zachos, J. C., Bohaty, S., and Hull, P.: North Atlantic Drift Sediments Constrain Eocene Tidal Dissipation and the Evolution of the Earth-Moon System., EGU General Assembly 2023, Vienna, Austria, 23–28 Apr 2023, EGU23-12739, https://doi.org/10.5194/egusphere-egu23-12739, 2023.

EGU23-12750 | ECS | Orals | CL1.1.1

Terrestrial West African climate and environmental responses to orbital forcing across Neogene boundary condition changes 

Rachel Lupien, Kevin Uno, Maria Kuzina, and Peter de Menocal

The Sahel is highly sensitive to both floods and droughts, risking food and other resources on which nearly 100 million people depend. Understanding how natural variations of precipitation and vegetation fluctuate in response to orbital forcing across major shifts in boundary conditions, like temperature, ice volume, and land surface, can help constrain the regional sensitivity to a wide range of external forcings. However, these interactions between climate and ecosystem changes remain uncertain for sub-Saharan Africa due to the lack of long, highly resolved, quantitative, terrestrial records that span major global and regional shifts in deep time. Here we present leaf wax precipitation and vegetation records from targeted study windows throughout the last 25 million years, derived from long-chain n-alkane hydrogen (δDwax) and carbon (δ13Cwax) isotopes, respectively, in a sediment core from ODP Site 959 in the Gulf of Guinea, where westerly winds and major river systems transport Western Sahel-sourced leaf waxes. Analyses of trend, amplitude of variability, and periodicity document a range of rainfall and vegetation responses to orbital forcings, depending on the specific boundary conditions of the study window. We find that the Western Sahel got wetter, yet more C4-rich, over the Neogene. Orbital-scale precipitation was highly variable throughout the study periods, but particularly strong during the warm Miocene. While unlike many East African leaf wax isotope records that are precessionally driven, obliquity appears to play a role in the late Pleistocene, suggesting that climate-driving orbital parameters may vary regionally. Further, because of the high resolution and temporal coverage of these new biomarker isotope records, we can examine nonlinear relationships between precipitation and vegetation fluctuations, including prior to C4-expansion when we find strong correlation despite minimal variation in δ13Cwax, advancing our understanding of climate and ecosystem feedbacks millions of years ago.

How to cite: Lupien, R., Uno, K., Kuzina, M., and de Menocal, P.: Terrestrial West African climate and environmental responses to orbital forcing across Neogene boundary condition changes, EGU General Assembly 2023, Vienna, Austria, 23–28 Apr 2023, EGU23-12750, https://doi.org/10.5194/egusphere-egu23-12750, 2023.

EGU23-12815 | ECS | Posters on site | CL1.1.1

Orbital chronology of Early Eocene hyperthermals from Site RH-323, Northern Negev (Israel) 

Agnese Mannucci, Chris Fokkema, Liam Kelly, Or Bialik, Gerald Dickens, Appy Sluijs, and Simone Galeotti

The early Eocene (~56-49 Ma) is punctuated by several transient global warming events, known as hyperthermals, superimposed on very high mean global temperatures and elevated atmospheric CO2 levels. Hyperthermal events, such as the well-documented Paleocene-Eocene Thermal Maximum (PETM; ~56 Ma), are characterized by negative carbon isotope excursions. These are interpreted as perturbations in the global exogenic carbon pool and deep ocean carbonate dissolution - signifying massive carbon injection into the ocean-atmosphere system. High resolution analysis of sedimentary archives has evidenced that hyperthermals initiated during maxima in orbital eccentricity, suggesting a climatic trigger for carbon input. Cyclostratigraphy, therefore, provides a unique tool to complement proxy records in the characterization of hyperthermal. Indeed, the identification of an orbital signature in marine and continental sedimentary succession provides an ideal trait-d’union between stratigraphic observation and paleoceanographic/paleoclimatic interpretation.

Here we present a cyclostratigraphic study of early Eocene marls and chalks from core RH-323, collected from the northern Negev Desert in Israel. The PETM in this region is well described but other hyperthermals are essentially unexplored. The unique location of this sedimentary succession, accumulated on a continental slope of the South Tethys at ~ 500–700 m paleo-depth, provides new insights into the relationship between global oceanic perturbation and local variability in a relatively arid region. Eccentricity-dependent variation in magnetic susceptibility and bulk stable oxygen and carbon isotope data from this locality allowed us to develop an astronomically tuned age model, which contributes to the identification of important hyperthermals, including the PETM, ETM2 and ETM3. The patterns also allow for cycle and event-based correlation to and comparison with oceanic records such as Ocean Drilling Program (ODP) Sites 1262 (Atlantic Ocean) and 1209 (Pacific Ocean) and with outcropping sections of the Tethys such as those of Contessa Road and Bottaccione (Gubbio, Italy). Emerging from these comparisons are remarkable patterns in the occurrence of cherts, with potential relevance for the global silicon cycle.

How to cite: Mannucci, A., Fokkema, C., Kelly, L., Bialik, O., Dickens, G., Sluijs, A., and Galeotti, S.: Orbital chronology of Early Eocene hyperthermals from Site RH-323, Northern Negev (Israel), EGU General Assembly 2023, Vienna, Austria, 23–28 Apr 2023, EGU23-12815, https://doi.org/10.5194/egusphere-egu23-12815, 2023.

EGU23-13463 | ECS | Orals | CL1.1.1 | Highlight

Phanerozoic Cyclostratigraphy in North Africa: Case studies from Tunisia 

Hamdi Omar, Chokri Yaich, Hela Fakhfakh, Dhouha Boukhalfa, Mariem Ben Ameur, Boutheina Lahmer, Wassim Akermi, Najoua Gharsalli, and Imen Arfaoui

Astronomical insolation forcing is an important driver of past and future climate and environmental change and acts on time scales from seasonality to millions of years. The amount of insolation the Earth’s surface receives affects, e.g., surface temperature, polar- and mountainous ice dynamics and oceanic circulation, which all shape Earth’s surface and climate variability on different time scales. Astrchronology is the field that uses geologic records of climate rhythms to quantify, with unprecedented accuracy, the transit of time through deep Earth history acting as powerful geo-chronometers for major geologic events.

Rhythmic sedimentary successions are very frequent in the geological records of North Africa, namely in Tunisia, which can often be attributed to cyclicities of orbital parameters driving Earth’s climate variability. Unlike Europe, China and USA, where cyclostratigraphic studies have extensively been carried out, examples of significant studies in North Africa are scares (e.g., Ben Ameur et al., 2022; Omar et al., 2021; Omar & Yaich, 2022; Thibault et al., 2016). Other studies were carried out but have almost exclusively been done using very classic and weakly significant paleoclimate proxies. Southern, central and northern Tunisia, where strongly cyclic sedimentary series were developed from the Ordovician to the Holocene, provides a powerful candidate for cyclostratigraphy with many Formations that were deposited during these times, and are amenable for integrated stratigraphy.

In this study, we investigate the feasibility of cyclostartigraphy on Phanerozoic cyclic strata in North Africa from outcropping series and well-logging data, covering a wide variety of paleoenvironments from continental deposits to deep basin sequences through hemi-pelagic sediments. The targeted geologic intervals are thoroughly chosen from Paleozoic, Mesozoic, Cenozoic and Quaternary. The main objectives are to (1) develop floating orbital scales for several Phanerozoic sedimentary rocks constituting potential source rocks feeding most of Tunisian petroleum reservoirs, (2) highlight currently under-investigated geologic intervals for cyclostratigraphy in Tunisia and (3) testify the most advanced techniques for astrochronology to decode the orbital periodicities potentially recorded within the studied sections.


Ben Ameur, Mariem et al. 2022. “Middle to Late Holocene Sedimentary Filling History of the Sebkha El Melah in South-Eastern Tunisia.” Sedimentology 69(5): 2348–66.

Messaoud, Jihede Haj, Nicolas Thibault, Chokri Yaich, and Johannes Monkenbusch. 2020. “The Eocene ‐ Oligocene Transition in the South ‐ Western Neo ‐ Tethys ( Tunisia ): Astronomical Calibration and Paleoenvironmental Changes Paleoceanography and Paleoclimatology.” : 1–25. https://doi.org/10.1029/2020PA003887.

Omar, Hamdi, Anne Christine Da Silva, and Chokri Yaich. 2021. “Linking the Variation of Sediment Accumulation Rate to Short Term Sea-Level Change Using Cyclostratigraphy: Case Study of the Lower Berriasian Hemipelagic Sediments in Central Tunisia (Southern Tethys).” Frontiers in Earth Science 9(March): 1–20.

Omar, Hamdi, and Chokri Yaich. 2022. Advances in Science, Technology and Innovation Orbital Tuning of the Berriasella Jacobi Ammonite Zone in Central Tunisia (Southern Paleotethys). Springer International Publishing. http://dx.doi.org/10.1007/978-3-030-72547-1_42.

Thibault, Nicolas et al. 2016. “The End-Cretaceous in the Southwestern Tethys (Elles, Tunisia): Orbital Calibration of Paleoenvironmental Events before the Mass Extinction.” International Journal of Earth Sciences 105(3): 771–95.

How to cite: Omar, H., Yaich, C., Fakhfakh, H., Boukhalfa, D., Ben Ameur, M., Lahmer, B., Akermi, W., Gharsalli, N., and Arfaoui, I.: Phanerozoic Cyclostratigraphy in North Africa: Case studies from Tunisia, EGU General Assembly 2023, Vienna, Austria, 23–28 Apr 2023, EGU23-13463, https://doi.org/10.5194/egusphere-egu23-13463, 2023.

EGU23-13598 | ECS | Orals | CL1.1.1

Deciphering the role of terrestrial/atmospheric interactions in Late Devonian Kellwasser black shale deposition: A High-Resolution Cyclostratigraphic study of the Winsenberg section (Rhenish Massif, Germany) 

Nina Wichern, Or Bialik, Lawrence Percival, Pim Kaskes, Theresa Nohl, Thomas Becker, and David De Vleeschouwer

The Late Devonian oceans were susceptible to the development of anoxic conditions, as evidenced by repeated widespread organic-rich shale deposition. Understanding how these anoxic facies were deposited will provide insight into Devonian climatic modes. To this end, we constructed a high-resolution cyclostratigraphic model based on portable XRF-generated elemental ratio records from a Frasnian-Famennian (~372 Ma) black shale section. These black shales are associated with the Kellwasser Crisis, one of the largest mass extinctions of the Phanerozoic, which is not fully understood to this day. The studied section at Winsenberg is located in the Rhenish Massif in Germany and represents a basinal setting at southern low paleolatitudes. Spectral analysis was carried out on the Si/Ca ratios generated by XRF, which is interpreted as the detrital (distal) vs carbonaceous (local) input. The resulting astrochronology suggests a duration of ca. 1 Myr from the base of the Lower Kellwasser to the F-F boundary at the top of the Upper Kellwasser level. This corresponds to an average sedimentation rate of 0.9 cm/kyr. Both the Lower and Upper Kellwasser shales occur at the onset of a 405 kyr eccentricity cycle. We further interpret the Ti/Al record as a riverine runoff signal, as Ti is associated with the coarse-grained fraction, and K/Al as a chemical weathering signal, as K is leached easier than Al. Both tuned records exhibit eccentricity-modulated precession cycles. On precession and short eccentricity timescales, Ti/Al and K/Al are positively correlated, suggesting an orbitally forced wet/dry monsoonal climate in the region where the section was deposited. On longer timescales, the weathering signal becomes decoupled from the riverine runoff signal, highlighting that K/Al (chemical weathering) decreased even during wetter periods. This decoupling is linked to soil maturation in the hinterland, as potassium leaching from mature soils became increasingly limited. Soil build-up and maturation forms a potential mechanism for nutrient storage and subsequent release into the ocean, potentially triggering eutrophication and anoxia.

How to cite: Wichern, N., Bialik, O., Percival, L., Kaskes, P., Nohl, T., Becker, T., and De Vleeschouwer, D.: Deciphering the role of terrestrial/atmospheric interactions in Late Devonian Kellwasser black shale deposition: A High-Resolution Cyclostratigraphic study of the Winsenberg section (Rhenish Massif, Germany), EGU General Assembly 2023, Vienna, Austria, 23–28 Apr 2023, EGU23-13598, https://doi.org/10.5194/egusphere-egu23-13598, 2023.

EGU23-13774 | ECS | Posters on site | CL1.1.1

Numerical simulations of the effects of astronomical forcing on nutrient supply and oxygen levels during the Devonian 

Loïc Sablon, Yves Goddéris, Anne-Christine Da Silva, and Michel Crucifix

Declining oxygen levels in the ocean since the middle of the 20th century have been linked to increasing temperatures, CO2 concentrations, and nutrient inputs. In the geological past, numerous oceanic anoxic events have occurred under similar conditions. These events, during which dissolved oxygen in the ocean drop to potentially harmful levels, can have serious consequences for marine life and can also alter the geochemistry of the ocean.

Specifically, we focus here on the Devonian (419 and 359 Ma), a warmer-than-present geological period. The sixty million years Devonian stage was the theatre of at least 29 identified anoxic events (Becker et al., 2020), marked most of the time by the deposition of black shales, associated with carbon isotopic excursion. It is understood that concurrent trends in CO2 and silicate weathering during the Devonian period have generated a context prone to ocean anoxia. On the other hand, there is growing evidence that their periodic recurrences in sedimentary records may have been influenced by astronomical forcing, such as changes in Earth's axis rotation and orbit geometry (De Vleeschouwer et al., 2017; Da Silva et al. 2020)

In the umbrella project WarmAnoxia, we combine climate models and geological observations to explore and test proposals linking astronomical forcing to Devonian anoxia. Through this presentation, we focus specifically on the hypothesis that astronomical forcing influenced precipitation and temperature patterns in a way that significantly modified soil weathering dynamics, with enough effects on nutrient fluxes toward the ocean to promote oceanic anoxia.

To test this proposal, we performed 81 experiments with the global atmosphere-slab model HadSM3. Experiments have been designed to span the range of astronomical forcing and CO2 concentrations experienced during the Devonian. The output was used to calibrate an emulator. With the latter, we estimate the transient evolutions of temperature and precipitation over 5 million-year periods, for which we assumed both simplified and realistic astronomical forcing scenarios. In turn, these transient evolutions force the GEOCLIM model (Maffre et al. 2022), which simulates soil dynamics, estimates nutrient fluxes from the continents to the oceans, and the response on the oceanic chemistry and atmospheric oxygen levels.

References:

Da Silva A. et al., (2020), Scientific Reports, 10 (12940) doi:10.1038/s41598-020-69097-6; Maffre P. et al., (2022) American Journal of Science, (322) 461–492, doi:10.2475/03.2022.02; Becker R.T. et al. (2020), The Geological Time scale, 10.1016/B978-0-12-824360-2.00022-X

How to cite: Sablon, L., Goddéris, Y., Da Silva, A.-C., and Crucifix, M.: Numerical simulations of the effects of astronomical forcing on nutrient supply and oxygen levels during the Devonian, EGU General Assembly 2023, Vienna, Austria, 23–28 Apr 2023, EGU23-13774, https://doi.org/10.5194/egusphere-egu23-13774, 2023.

EGU23-14200 | Orals | CL1.1.1 | Highlight

Past Evolution of the Earth-Moon System. The AstroGeo tools for geological proxies. 

Jacques Laskar, Mohammad Farhat, Gwenaël Boué, Pierre Auclair-Desrotour, Matthias Sinnesael, Mickaël Gastineau, and Sem Bendjeddou

In recent years, several groups have analyzed or re-analyzed stratigraphic data in order to derive astronomical information on the past evolution of the Earth-Moon system. Depending on the approach and on the type of sediment that is analyzed, the retrieved data are of different nature. For tidal deposits, one may attempt to obtain the number of lunar days in a lunar month, or the number of lunar months per year (e.g. Williams, 2000), or even retrieve the nodal period of the Moon (Walker & Zahnle, 1986). In contrast, for cyclostratigraphic analyses, the derived quantity is the precession frequency of the Earth (e.g. Meyers and Malinverno, 2018). The problem for the geologist is then to derive all the other parameters of the Earth-Moon system from this single initial observation. 
The AstroGeo tools (www.astrogeo.eu) are designed to help the geologists in this task by providing conversions from one geological proxy  to all the remaining parameters of the Earth-Moon system  that can be derived from this single observation.  These tools developed in the AstroGeo project rely on the physical model recently developed in Farhat et al. (2022). The AstroGeo lunar tool is the first of a series that will be available for the geologists and astronomers community. It allows to input any of the possible observables of the Earth-Moon system (age, semi-major axis, length of the day, precession frequency and angle of obliquity), with some uncertainty, and to derive all the other parameters by interpolating the results of Farhat et al. (2022). At the same time, new data can be plotted versus the nominal solution, together with the already known data that will be kept in an evolving data base. These tools will be available on the AstroGeo website (www.astrogeo.eu). I will present these new tools along with the recent progress of the AstroGeo project.

Ref : Farhat, M., Auclair-Desrotour, P., Boué, G., Laskar, J., 2022, The resonant tidal evolution of the Earth-Moon distance
 Astronomy & Astrophysics, 665, L1
https://www.aanda.org/articles/aa/pdf/2022/09/aa43445-22.pdf

How to cite: Laskar, J., Farhat, M., Boué, G., Auclair-Desrotour, P., Sinnesael, M., Gastineau, M., and Bendjeddou, S.: Past Evolution of the Earth-Moon System. The AstroGeo tools for geological proxies., EGU General Assembly 2023, Vienna, Austria, 23–28 Apr 2023, EGU23-14200, https://doi.org/10.5194/egusphere-egu23-14200, 2023.

EGU23-16726 | ECS | Orals | CL1.1.1

Observationally Constrained Cloud Phase Unmasks Orbitally Driven Climate Feedbacks 

Lily Hahn, Navjit Sagoo, Trude Storelvmo, Ivy Tan, James Danco, Bryan Raney, and Anthony Broccoli

The mechanisms that amplify orbitally-driven changes in insolation and drive the glacial cycles of the past 2.6 million years, the Pleistocene, are poorly understood. Previous studies indicate that cloud-phase feedbacks oppose ice sheet initiation when orbital configuration supports ice sheet growth. Cloud phase was observationally constrained in a recent study and provides evidence for a weaker negative cloud feedback in response to carbon dioxide doubling. We observationally constrain cloud phase in the Community Earth System Model and explore how changes in orbital configuration impact the climate response. Constraining cloud phase weakens the negative high latitude cloud phase feedback and unmasks positive water vapor and cloud feedbacks (amount and optical depth) that extend cooling to lower latitudes. Snowfall accumulation and ablation metrics also support ice sheet expansion as seen in proxy records. This indicates that well-known cloud and water vapor feedbacks are the mechanisms amplifying orbital climate forcing.

How to cite: Hahn, L., Sagoo, N., Storelvmo, T., Tan, I., Danco, J., Raney, B., and Broccoli, A.: Observationally Constrained Cloud Phase Unmasks Orbitally Driven Climate Feedbacks, EGU General Assembly 2023, Vienna, Austria, 23–28 Apr 2023, EGU23-16726, https://doi.org/10.5194/egusphere-egu23-16726, 2023.

EGU23-17045 | ECS | Orals | CL1.1.1

Obliquity-forced aquifer-eustasy during the late-Cretaceous greenhouse world 

Zhifeng Zhang, Yongjian Huang, and Chengshan Wang

The mechanism of short-term and high-magnitude sea-level oscillation has long been debated between glacio- and aquifer-eustasy (Miller et al., 2005; Haq, 2014), largely due to the sparse robust evidence for the aquifer-eustasy, and the little knowledge about hydrological dynamics behind it. Non-marine/ continental greenhouse archives (e.g. lake level) and their temporal correlation to marine successions (e.g. sea level) could give clue to aquifer-eustasy (Wagreich et al., 2014). The Songliao Basin (SLB), in Northeast China, is one of the largest Mesozoic terrestrial inland basins and has deposited the near whole Cretaceous successions (Wang et al., 2013). The greenhouse Late Santonian-Early Campanian Lower Nenjiang Formation (K2n1+2), recovered from three boreholes in SLB provides a unique opportunity for validating and decoding the aquifer-eustasy. Initially the cyclostratigraphy of logging gamma ray (GR) and Thorium (Th) series from three boreholes was implemented, which in junction with the radioactive ages renewed the chronology framework of SLB. Using the astronomically tuned GR and Th series, the lake level of SLB, which is recovered from sedimentary noise modeling (Li et al., 2019) and presents the water table of groundwater reservoir, shows a clear out-of-phase relationship with the coeval sea level, validating the aquifer-eustasy hypothesis. The lake level shows prominent ~1.2Myr cycles and a well-coupled relationship with sea level and obliquity modulation, indicating that the orbital obliquity drove the lake level and modulated the water exchange between ocean and continent during the Cretaceous greenhouse period. The strong precipitation indicated by the negative excursion of Ostracods δ18O (Chamberlain et al., 2013) well correlates to the high lake level, high obliquity, and low sea level, suggesting that during obliquity modulation maxima, more moisture was precipitated into the high-latitude continents, consequently recharging the aquifer and raising the lake level while drawing down the sea level and vice versa. The close correspondence between reported marine incursion layers (Hu et al., 2015) and lowstand of sea level casts a doubt on marine incursion hypothesis in the SLB, more work is needed to reconcile this paradox. Overall, this study gives robust geological evidence for aquifer-eustasy and firstly decodes its role on Cretaceous short-term eustasy.

How to cite: Zhang, Z., Huang, Y., and Wang, C.: Obliquity-forced aquifer-eustasy during the late-Cretaceous greenhouse world, EGU General Assembly 2023, Vienna, Austria, 23–28 Apr 2023, EGU23-17045, https://doi.org/10.5194/egusphere-egu23-17045, 2023.

EGU23-1631 | ECS | Orals | CL1.1.2

Thermal niche determines marine assemblage change during Early Jurassic warming pulses 

Carl Reddin, Jan Landwehrs, Gregor Mathes, Erin Saupe, Clemens Ullmann, Georg Feulner, and Martin Aberhan

Marine assemblages are expected to undergo substantial reorganization under anthropogenic climate change but some species may be better situated to track their preferred conditions. Assemblage vulnerability can thus be indicated by the thermal niches of its component species. However, the link between this vulnerability and extinction risk of its species is unclear and cannot yet be tested with modern species since widespread climate-driven extinctions are not yet manifest. To address this gap, we inferred fossil species’ thermal niches based on observed distributions on paleoclimate maps over the hyperthermal pulses of the Late Pliensbachian to Early Toarcian. We tested whether species extirpated from fossil invertebrate assemblages after warming, alongside those species that went extinct, were most likely from the pool of species that could not maintain upper thermal safety margins, in contrast to assemblage immigrants. The fossil record has the potential to reveal unique information about natural system responses to climate change. We discuss how much can it tell us about marine ectotherm vulnerability to extinction under climate change.

How to cite: Reddin, C., Landwehrs, J., Mathes, G., Saupe, E., Ullmann, C., Feulner, G., and Aberhan, M.: Thermal niche determines marine assemblage change during Early Jurassic warming pulses, EGU General Assembly 2023, Vienna, Austria, 23–28 Apr 2023, EGU23-1631, https://doi.org/10.5194/egusphere-egu23-1631, 2023.

Anthropogenic carbon emission rate has exceeded 10 Pg C yr-1 in 2020 (1), which is likely unprecedented in the last 252 million years. Studying ancient hyperthermal events may help us better understand the natural processes of carbon emission and sequestration, informing policy and decision-making to cope with climate change. Two ancient hyperthermals that occurred at the end of the Permian period and the end of the Paleocene Epoch have been studied extensively, but a key question remains: why is the end-Permian hyperthermal related to the largest mass extinction and a much-delayed recovery, yet the PETM is associated with only extinction of benthic foraminifera and a rapid recovery? I hypothesize that the life extinction and recovery patterns across these two hyperthermals are regulated by the carbon emission and sequestration rates, and the cumulative quantities of CO2 released. Emission rate is dependent on COsource (e.g., methane hydrate, thermogenic methane, marine or terrestrial organic matter, or volcanic CO2), and sequestration rate is dependent on the location (marine vs. terrestrial) and processes (silicate weathering vs. organic carbon burial) of carbon sequestration, which are largely uncertain. These uncertainties pose difficulties in unraveling the underlying mechanisms of the different extinction patterns. Here, I quantitatively compare the carbon emission and sequestration rates of the two hyperthermals, which allows for hypothesis regarding carbon sources and sinks to be tested.

How to cite: Cui, Y.: Comparing carbon emission and sequestration during two ancient hyperthermal events: the PETM and the end-Permian mass extinction, EGU General Assembly 2023, Vienna, Austria, 23–28 Apr 2023, EGU23-2127, https://doi.org/10.5194/egusphere-egu23-2127, 2023.

Wetlands and lakes represent the largest natural source of methane to Earth’s atmosphere, where this powerful greenhouse gas influences Earth’s radiative budget. The flux of methane from wetlands and lakes to the atmosphere ultimately depends on the balance between methanogens that produce methane and methanotrophs that consume methane. However, the balance of these biological processes and hence the operation of the terrestrial methane cycle in the geological past are poorly constrained. 

To address this problem, I will present novel biomarker data that record the relative contribution of methanotrophs to the bacterial pool in ancient wetlands and lakes. I will use a unique dataset that consist of >400 samples from across the world and which span most of the Cenozoic, including key hyperthermals like the PETM and ETMs, as well as Toarcian OAE hyperthermal. The aim is to explore the operation of the terrestrial methane cycle during different climate state, including hyperthermals that are characterized by rapid environmental change. 

The data show that the contribution of methanotrophs to the terrestrial bacterial pool has been remarkably stable through time, including across major climatic events like the K/Pg boundary, the Eocene – Oligocene transition, and the mid-Miocene climatic optimum. These results indicate that the terrestrial methane cycle is robust to long-term climatic perturbations and does not operate fundamentally different during greenhouse periods. However, during hyperthermals such as the PETM and the T-OAE, etc, the data indicate a significant perturbation of the terrestrial methane cycle. This means that transient warming events have the potential to destabilize this key biogeochemical cycle, which suggests that the terrestrial methane cycle will be impacted by anthropogenic climate change.

How to cite: Naafs, D.: Intensification of the terrestrial methane cycle during hyperthermal intervals of the Meso- and Cenozoic, EGU General Assembly 2023, Vienna, Austria, 23–28 Apr 2023, EGU23-2375, https://doi.org/10.5194/egusphere-egu23-2375, 2023.

The latest Permian mass extinction (LPME) was triggered bymagmatism of the Siberian Traps Large Igneous Province (STLIP), which left an extensive record of sedimentary Hg anomalies at Northern Hemisphere and tropical sites. Here, we present Hg records from terrestrial sites in southern Pangea, nearly antipodal to contemporaneous STLIP activity, providing insights into the global distribution of volcanogenic Hg during this event and its environmental processing. These profiles (two from Karoo Basin, South Africa; two from Sydney Basin, Australia) exhibit significant Hg enrichments within the uppermost Permian extinction interval as well as positive Δ199Hg excursions (to ~0.3‰), providing evidence of long-distance atmospheric transfer of volcanogenic Hg. These results demonstrate the far-reaching effects of the Siberian Traps as well as refine stratigraphic placement of the LPME interval in the Karoo Basin at a temporal resolution of ~105 years based on global isochronism of volcanogenic Hg anomalies.

How to cite: Shen, J.: Mercury evidence  global volcanic effects during the Permian-Triassic transition, EGU General Assembly 2023, Vienna, Austria, 23–28 Apr 2023, EGU23-2487, https://doi.org/10.5194/egusphere-egu23-2487, 2023.

EGU23-2862 | Orals | CL1.1.2 | Highlight

Early Triassic hothouse conditions limited marine productivity 

Stephen Grasby

The Early Triassic represents a period of prolonged recovery following the most severe extinction of the Phanerozoic. Records show this to be a period of extremely high global temperatures, likely driven by Siberian Traps eruption induced global warming. How this hothouse impacted marine ecosystems and prolonged the recovery process remains uncertain. Across northwestern Pangea, Early Triassic marine sediments are characterized by low organic matter content, despite recurrent anoxia which would create conditions more suitable for preservation, and being located on the western continental margins were the majority of primary productivity in the Panthalassa Ocean would occur. Geochemical proxies suggest the paucity of organic matter reflects a productivity collapse rather than changes in preservation. Nitrogen isotopes show a progressive negative shift starting at the Permian/Triassic extinction and continuing through to the Smithian, indicating progressively growing nutrient limitation. High ocean temperatures likely deepened the thermocline, limiting nutrient recycling and upwelling into the photic zone driving nutrient stress. Finally ocean cooling in the Anisian is marked by widespread deposition of organic rich black shales and return of N isotopes to values consistent with active nutrient upwelling. A hyperthermal driven nutrient-limited Early Triassic ocean was likely a key inhibiter of marine recovery.

How to cite: Grasby, S.: Early Triassic hothouse conditions limited marine productivity, EGU General Assembly 2023, Vienna, Austria, 23–28 Apr 2023, EGU23-2862, https://doi.org/10.5194/egusphere-egu23-2862, 2023.

EGU23-3800 | ECS | Orals | CL1.1.2

Astronomical calibration of the Paleocene-Eocene Thermal Maximum on the Atlantic Coastal Plain 

Mingsong Li, Timothy Bralower, Lee Kump, Jean Self-Trail, James Zachos, William Rush, and Marci Robinson

The chronology of the Paleocene-Eocene Thermal Maximum (PETM, ~56 Ma) remains disputed, hampering complete understanding of the possible trigger mechanisms of this event. Here we present an astrochronology for the PETM carbon isotope excursion from Howards Tract, Maryland a paleoshelf environment, on the mid-Atlantic Coastal Plain. Statistical evaluation of variations in calcium content and magnetic susceptibility indicates astronomical forcing was involved and the PETM onset lasted about 6 kyr. The astrochronology and Earth system modeling suggest that the PETM onset occurred at an extreme in precession during a maximum in eccentricity, thus favoring high temperatures, indicating that astronomical forcing could have played a role in triggering the event. Ca content data on the paleo-shelf, along with other marine records, support the notion that a carbonate saturation overshoot followed global ocean acidification during the PETM.

How to cite: Li, M., Bralower, T., Kump, L., Self-Trail, J., Zachos, J., Rush, W., and Robinson, M.: Astronomical calibration of the Paleocene-Eocene Thermal Maximum on the Atlantic Coastal Plain, EGU General Assembly 2023, Vienna, Austria, 23–28 Apr 2023, EGU23-3800, https://doi.org/10.5194/egusphere-egu23-3800, 2023.

The Toarcian Oceanic Anoxic Event (T-OAE, ~183 Ma) was a profound short-term environmental perturbation associated with the large-scale release of 13C-depleted carbon into the global ocean-atmosphere system, which resulted in a significant negative carbon-isotope excursion (CIE). The general lack of characteristic T-OAE records outside of the northern hemisphere means that the precise environmental effects and significance of this event are uncertain. Many biotic carbonate platforms of northern hemisphere from the western Tethys drowned or shifted to comparatively unfossiliferous oolitic platforms during the early Toarcian. However, southern hemisphere records of Toarcian carbonate platforms are rare, and thus the extent and significance of biotic platform demise during the T-OAE is unclear. Here we present high-resolution biostratigraphical, sedimentological, and geochemical data across two Pliensbachian–Toarcian shallow-water carbonate-platform sections exposed in the Tethys Himalaya. These sections were located paleogeographically on the open southeastern tropical Tethyan margin in the southern hemisphere. The T-OAE in the Tethys Himalaya is marked by a negative CIE in organic matter. Our sedimentological analysis of the two sections reveals an abundance of storm deposits within the T-OAE interval, which emphasizes a close link between warming and tropical storms during the T-OAE, in line with evidence recently provided from western Tethyan sections of the northern hemisphere. In addition, our analysis also reveals extensive biotic carbonate-platform crisis by drowning or changing to unfossiliferous carbonates coincident with the onset of the CIE where the proxies of continental weathering (e.g. Ti, Sc, Th) and redox (e.g. Mn, Ce and Ce) show obviously increase. Taken together, the drastically enhanced terrigenous flux and deoxygenation likely played a pivotal role in the more severe crisis for benthic carbonate producers during the negative phase of the CIE.

How to cite: Han, Z.: Carbonate-platform response to the Toarcian Oceanic Anoxic Event in the Tethys Himalaya, EGU General Assembly 2023, Vienna, Austria, 23–28 Apr 2023, EGU23-4571, https://doi.org/10.5194/egusphere-egu23-4571, 2023.

EGU23-4645 | ECS | Posters virtual | CL1.1.2

Assessing volcanism during the PETM based on mercury isotope and abundance data 

Simin Jin, David Kemp, Runsheng Yin, Ruiyang Sun, Jun Shen, David Jolley, Manuel Vieira, and Chunju Huang

The Paleocene-Eocene Thermal Maximum (PETM, ∼56 Ma) was an abrupt hyperthermal event that has been linked to carbon release from volcanism associated with the North Atlantic Igneous Province (NAIP). Anomalously high sedimentary mercury (Hg) concentrations, a proxy for volcanism, have been recorded across the PETM from some locations, supporting this link. Nevertheless, Hg concentration data alone offer little insight into emplacement mechanisms and carbon source(s), and can be influenced by depositional conditions and post-depositional alteration. To help address this issue, and more critically evaluate the efficacy of Hg as a volcanism proxy, Hg-isotope data have been obtained across a thick, deep-marine sedimentary record of the PETM from the North Sea that was deposited in close proximity to active NAIP volcanism. These data are combined with a new global compilation of Hg concertation data across the PETM, which includes new Hg concentration data obtained from five globally distributed sites. Analysis of all the data demonstrates extensive and at least intercontinental Hg enrichments during the onset of the PETM carbon-isotope excursion, and that this was related to a major transient pulse of extrusive volcanism. Hg-isotope data support protracted volcanism through the PETM, but the evidence for sustained Hg enrichment from volcanism through the entirety of the PETM is equivocal. Towards the end of, and after, the PETM, the data suggest an overall waning influence of volcanogenic Hg.

How to cite: Jin, S., Kemp, D., Yin, R., Sun, R., Shen, J., Jolley, D., Vieira, M., and Huang, C.: Assessing volcanism during the PETM based on mercury isotope and abundance data, EGU General Assembly 2023, Vienna, Austria, 23–28 Apr 2023, EGU23-4645, https://doi.org/10.5194/egusphere-egu23-4645, 2023.

EGU23-4791 | ECS | Posters on site | CL1.1.2

Hydroclimatic change regulated fluvial sediment supply in southern North China during the early Permian deglacial warming 

Rui Ma, Jianghai Yang, Jia Liu, and Yuan Wang

  The early Permian deglacial warming is the critical period in the last icehouse to greenhouse transition in the Phanerozoic and provides an opportunity to investigate the interactions among terrestrial ecosystem evolution, regional tectonics, and climatic perturbations during climate warming. This climate change has been documented by climate modelling and geological proxies, however, its effect on fluvial sediment dispersal remains unknown. During this period, there were a southwardly diachronous aridification in North China. We here employ detrital provenance data to track the changes in continental-scale drainage system and fluvial sediment supply in southern North China. Combing detrital zircon U-Pb age and sandstone petrographic data from the early Permian sedimentary successions in southern North China defined three major sources in the Qinling orogenic belt (P1) to the south, the uplifted Paleoproterozoic-Archean basement in the northern North China margin (P2) and in the Inner Mongolia Orogen (P3) to the north. In the high-resolution chronostratigraphic framework established for North China, we use DZ mixing modeling method to quantitatively estimate the relative sediment contributions of source regions to the early Permian southern North China basin. Our modeling results suggest that the relative contribution of northly sourced detritus (from P2 and P3) increased from ~4 % in the late Gzhelian to early Asselian (ca 301−297 Ma) to ~95 % in the late Asselian to Sakmarian (ca 297−290 Ma), then declined to ~70 % in the early Artinskian (ca 290−286 Ma), finally returned to ~95% in late Artinskian (ca 286−284 Ma), whereas the estimated relative sediment contribution of the these northerly sources remained in high, stable level (~95 %) for the corresponding successions in northern North China .The increase in northerly derived sediment fraction in southern North China through the Asselian-Sakmarian can be interpreted in terms of the enhanced erosion associated with the tectonic evolution of Central Asian Orogenic Belt which caused uplifting in the northern margin of North China. In contrast, the subsequent reduction in the Artinskian is abnormal considering the persistent tectonic activities in the northern margin of North China. It can be linked instead to the climate aridification in the northern North China and resultant decrease in fluvial sediment supply from the northerly sources to the southern North China. This work highlighted the regulation of hydroclimatic change on low-latitude fluvial sediment supply during the early Permian deglacial warming.


How to cite: Ma, R., Yang, J., Liu, J., and Wang, Y.: Hydroclimatic change regulated fluvial sediment supply in southern North China during the early Permian deglacial warming, EGU General Assembly 2023, Vienna, Austria, 23–28 Apr 2023, EGU23-4791, https://doi.org/10.5194/egusphere-egu23-4791, 2023.

EGU23-4793 | Posters on site | CL1.1.2

Rapid recycling of Gondwana-derived sedimentary rocks in western South China during the Artinskian warming 

Ao Liu, Jianghai Yang, Juntong Ren, and Liang Cheng

Climatic conditions are important factors controlling landscape erosion and weathering. Distinguishing climate forced landscape erosion is critical to understand the interactions between climate change and landscape evolution, but it is usually complicated by other influences. Artinskian warming is an important climate event during the Permian icehouse demise and characterized by a high atmospheric pCO2, a major eustatic sea-level rise, a sudden biotic replacement and hydroclimatic change in low latitude regions. During this climate warming period, South China evolved as a stable continental block and has preserved a unique siliciclastic sedimentary succession of the Liangshan Formation. We conducted a sedimentary provenance analysis on the Liangshan Formation to understand the response of landscape erosion to the Artinskian warming event. Four sections of Liangshan Formation in western South China were selected for comprehensive analysis. Detrital zircon and rutile U-Pb ages were analyzed for provenance in combination with sedimentary facies, sandstone petrography, mudstone mineral and chemical compositions. Detrital zircon U-Pb age spectra show two major age groups of 1100−900 Ma and 700−500 Ma with subordinate ones of 2600−2400 Ma and 850−700 Ma. Detrital rutile U-Pb age spectra only show one dominant age group of 700−500 Ma. These detrital zircon and rutile U-Pb age patterns present a remarkable Gondwana affinity as comparing with the corresponding records in northeast margin of Gondwana. However, during the early Permian South China block was isolated from Gondwana by the wide Tethys Ocean and unlikely to have direct sedimentary influx from the far-away Gondwana continents. In this paleogeography, the Liangshan Formation could only derive from a provenance in South China itself. In western South China, the Liangshan Formation is disconformably overlying the Carboniferous-earliest Permian carbonates, Devonian quartzose sandstones, Silurian quartzose sandstones and mudstones, and Cambrian-Ordovician carbonate and mudstones, of which the sandstones and mudstones have been suggested to have a possible Gondwana derivation when South China located close to the northern Gondwana margin during the early Paleozoic to Devonian. The Liangshan Formation mainly composed of massive mudrocks and quartzose fine sandstones with high maturity showing strong weathering and forming multiple cycles. Detrital zircon U-Pb age data were collected from the Cambrian-Ordovician, Silurian, Devonian and Carboniferous successions in western South China. They were used for quantitatively fitting the provenance of the Liangshan Formation by Dzmix method. The Dzmix fitting analysis shows that the relative contribution of Cambrian-Ordovician, Silurian, Devonian and Carboniferous are 23.6%, 24.6%, 50.3% and 1.5%, respectively. This result indicates that the siliciclastic sediments of Artinskian Liangshan Formation were mainly recycled from the Devonian, Silurian and Cambrian-Ordovician sedimentary rocks. Considering the carbonate dominated successions in the Carboniferous to earliest Permian, the deposition of the Liangshan Formation would indicate a sudden input of terrigenous materials and thus a rapid recycling of Gondwana-derived pre-Carboniferous sediments. Therefore, during the Artinskian warming, the climate became more humid with increased precipitation in South China to drive intense erosion and promote river transportation of sediments into the coastal areas, forming the Liangshan Formation.

How to cite: Liu, A., Yang, J., Ren, J., and Cheng, L.: Rapid recycling of Gondwana-derived sedimentary rocks in western South China during the Artinskian warming, EGU General Assembly 2023, Vienna, Austria, 23–28 Apr 2023, EGU23-4793, https://doi.org/10.5194/egusphere-egu23-4793, 2023.

EGU23-4897 | Posters on site | CL1.1.2

Conodont biostratigraphically constrained eruptive duration of Emeishan Large Igneous Province and implication for the end-Capitanian warming 

Yinsheng Zhou, Jianghai Yang, Dongxun Yuan, Ao Liu, and Liang Cheng

The emplacement and subsequent weathering of Emeishan large igneous province (LIP) have been linked to the climate change at the Guadalupian-Lopingian transition. Though lots of magneto-stratigraphic analysis and radio-isotopic dating works were conducted on the Emeishan LIP, the temporal correlation between Emeishan LIP and climate change is still in debate for the climatic records generally being archived in biostratigraphically dated marine successions. We here logged a Guadalupian-Lopingian limestone dominated succession in the Youjiang Basin located to the southeast of Emeishan LIP. A high-resolution conodont biostratigraphy was obtained for succession and constrained the studied succession in the conodont biozones of J. xuanhanensis, J. granti, and C. dukouensis. There developed multiple tuff and tuffaceous layers in this succession with stratigraphically lower ones geochemically akin to the high-Ti basalt and higher ones akin to the rhyolites of the Emeishan LIP. Analyzed zircons give average U-Pb ages at around 260 Ma and have chemical compositions like those recovered from Emeishan LIP. In coming the paleogeographic location, our petrological, geochemical, Nd-Sr isotopic and zircon U-Pb age and trace element data indicate the identified tuff materials were derived from the volcanic eruption of the Emeishan LIP. According to the established conodont biostratigraphy, the high-Ti basalt volcanism can be constrained in the conodont biozones of J. granti. Based on this biostratigraphically constrained eruption duration of Emeishan LIP, high-Ti basalt eruption can be confidently corrected with the conodont oxygen isotope indicated end-Guadalupian climate warming. Comparing with the rhyolitic tuff rocks, basaltic tuff layers contain a large population of older zircons which might indicate the addition of crustal materials into the basaltic magma enroute to the surface. There might be voluminous CO2 degassing from the crustal rocks including the carbonates and organic rich mudstones. This degassing in combination with the magmatic CO2 release and oxidation of buried organic materials in the coastal regions during the regression at that time could increase the atmospheric pCO2 and resulted in the climate warming.

How to cite: Zhou, Y., Yang, J., Yuan, D., Liu, A., and Cheng, L.: Conodont biostratigraphically constrained eruptive duration of Emeishan Large Igneous Province and implication for the end-Capitanian warming, EGU General Assembly 2023, Vienna, Austria, 23–28 Apr 2023, EGU23-4897, https://doi.org/10.5194/egusphere-egu23-4897, 2023.

EGU23-5063 | Posters virtual | CL1.1.2 | Highlight

Pangea is a complete supercontinent: paleomagnetic evidence from North China 

Zhiyu Yi, Yushu Liu, and Joseph Meert

Alfred Wegener proposed the idea of a supercontinent, which he called Pangea about one century ago. The idea led directly to the hypothesis of continental drift, which eventually evolved into the theory of plate tectonics. Pangea is traditionally represented by ~75% of continental crust in which the East Asian blocks (EABs) are typically omitted. Climate models developed using an outboard position of the East Asian blocks led to the hypothesis of a mega-monsoon.

Aiming to refine the paleogeography of Pangea, this study reports a new late Triassic paleopole for North China based on dykes and sills sampled from two localities that were ~500 km apart. Laser-ablation–inductively coupled plasma–mass spectrometry (LA-ICP-MS) U-Pb dating on zircons selected from the sills yields a mean age of 224.4 ± 1.4 Ma. The characteristic remanent magnetizations isolated from the two localities are consistent and pass reversal and baked-contact tests suggesting a primary origin. The high-quality paleomagnetic pole positioned the EABs at 75.6° ± 6.8° N at ~220 Ma using Beijing as a reference site, which is in good agreement with the paleolatitude resolved from the apparent polar wander path of Eurasia. Along with the ages newly-reported from the “stitching pluton” that intruded the Mongol-Okhotsk suture, our study reveals a full amalgamation between the EABs and Pangea by ~220 Ma, indicating that Pangea comprises ~99% of available continental crust and was perhaps the largest of all known supercontinents.

The refined reconstruction of East Asia provides an opportunity to reevaluate the paleogeography and climatic patterns of Pangea. The climate-sensitive lithofacies in East Asia indicate a humid-temperate climate during the Late Triassic and Early Jurassic. The wet conditions were typically explained via a mega-monsoon model. However, according to our new reconstruction, much of the EABs are positioned above ~40° N (within the humid-temperate to subpolar humid zones) during the Late Triassic and early-Middle Jurassic. The humid-temperate conditions are therefore consistent with a zonal climate pattern. To better evaluate climatic patterns of Pangea from a global perspective, we further restore the climate-sensitive lithofacies of the Late Triassic according to our Pangea reconstruction. The distribution of lithofacies is compatible with a zonal climate when Pangea reached its maximum size and optimal equatorial symmetry for developing a monsoon climate, which obviates the need for the Pangean mega-monsoon hypothesis.

How to cite: Yi, Z., Liu, Y., and Meert, J.: Pangea is a complete supercontinent: paleomagnetic evidence from North China, EGU General Assembly 2023, Vienna, Austria, 23–28 Apr 2023, EGU23-5063, https://doi.org/10.5194/egusphere-egu23-5063, 2023.

EGU23-5383 * | Posters on site | CL1.1.2 | Highlight

The coming extinction of land mammals - The next great mass extinction 

Alexander Farnsworth, Eunice Lo, Paul Valdes, Jonathan Buzan, Hannah Wakeford, and Chris Scotese

Mammals have dominated the Earth for the last ~55 Myr. Mammals have shown remarkable adaptation and resilience to climate change. However, it is unknown how long the Earth will be able to continue to sustain mammalian life. Estimates suggest the ultimate demise of all life will be in a ‘Venusian’ style runaway greenhouse climate ~1.5 billion years where increasing solar luminosity (L) will raise temperature beyond that able to sustain life. However, conditions may develop sooner that will render the Earth naturally inhospitable to mammals. In ~250 million years all the continents of the world come together to form the Earth's fourth supercontinent, Pangea-Ultima. A natural consequence of the creation and decay of Pangea-Ultima will be extremes in pCO2, both low (silicate weathering) and high (volcanic degassing). Here we show that variations in pCO2, increased solar luminosity (~2% greater than now), and extreme continentality will lead to extreme climate states that are inhospitable to mammalian life. We assess the impact of these climate states on mammalian physiological limits using dry-bulb, wet-bulb, and Humidex stress indicators as well as planetary habitability index. Although low pCO2 states will increase habitability, snowball Earth conditions may occur if the silicate weathering-pCO2 burial feedback becomes too strong (resulting in low pCO2 values <280ppm) under increased L. Likewise, small short-term spikes in pCO2 (≥1120ppm) outgassing will lead to extremes in heat. Under such conditions, thermal tolerances of endotherms will exceed physiological limits leading to mass extinction. The results reported here also show that global landmass configuration, pCO2, and solar luminosity play a critical role in planetary habitability.

How to cite: Farnsworth, A., Lo, E., Valdes, P., Buzan, J., Wakeford, H., and Scotese, C.: The coming extinction of land mammals - The next great mass extinction, EGU General Assembly 2023, Vienna, Austria, 23–28 Apr 2023, EGU23-5383, https://doi.org/10.5194/egusphere-egu23-5383, 2023.

EGU23-6037 | Orals | CL1.1.2 | Highlight

Extinction cascades, community collapse, and recovery across a Mesozoic hyperthermal event 

Alexander Dunhill, Jack Shaw, Karolina Zarzyczny, Jed Atkinson, Crispin Little, and Andrew Beckerman

Biotic interactions and community structure are seldom examined in mass extinction studies but must be considered if we are to truly understand extinction and recovery dynamics at the ecosystem scale. Here, we model shallow marine food web structure across a Mesozoic hyperthermal event, the Toarcian extinction, in the Cleveland Basin, UK using a trait-based inferential modelling framework. We subjected our pre-extinction community to extinction cascade simulations in order to identify the nature of extinction selectivity and dynamics. We then tracked the pattern and duration of the recovery of ecosystem structure and function following the extinction event. In agreement with postulated scenarios, we found that primary extinctions targeted towards infaunal and epifaunal benthic guilds reproduced the empirical post-extinction community. These results are consistent with geochemical and lithological evidence of an anoxia/dysoxia kill mechanism for this extinction event. Structural and functional metrics show that the extinction event caused a switch from a diverse, stable community with high levels of functional redundancy to a less diverse, more densely connected, and less stable community of generalists. Ecological recovery appears to have lagged behind the recovery of biodiversity, with most metrics only beginning to return to pre-extinction levels ~7 million years after the extinction event. This protracted pattern supports the theory of delayed benthic ecosystem recovery following mass extinctions even in the face of seemingly recovering taxonomic diversity and gives stark warnings for present day marine ecosystems affected by warming temperatures and dysoxia.

How to cite: Dunhill, A., Shaw, J., Zarzyczny, K., Atkinson, J., Little, C., and Beckerman, A.: Extinction cascades, community collapse, and recovery across a Mesozoic hyperthermal event, EGU General Assembly 2023, Vienna, Austria, 23–28 Apr 2023, EGU23-6037, https://doi.org/10.5194/egusphere-egu23-6037, 2023.

EGU23-6337 | Orals | CL1.1.2

Carbonate-platform changes response to the Paleocene-Eocene Thermal maximum 

Xiumian Hu, Juan Li, Jingxin Jiang, Eduardo Garzanti, and Marcelle BouDagher-Fadel

The Paleocene–Eocene Thermal Maximum (PETM, ~56 Ma) is a large negative carbon isotope excursion that testifies to a massive perturbation of the global carbon cycle and has been considered to be the best deep-time analogue for present and future climate change. However, most studies of the response of shallow-water carbonates to climate change during PETM have focused on individual sites and sections. To get a broader perspective we compiled published records of carbonate-platform environments across the Paleocene-Eocene transition in Tethys ocean. The shallow-marine benthic ecosystems during PETM were largely distinct in composition from those in the latest Paleocene or/and early Eocene. No obvious impact on biota and specifically on larger benthic foraminifera is observed at PETM onset, whereas the major biotic change occurs later on at PETM recovery, suggesting that biotic changes lag behind climate warming and carbon cycle perturbations in shallow-water ecosystem. We also inferred sedimentary responses at each site from direct or indirect indicators of sedimentological and relative sea-level change at the PETM. A transgressive trend that began at PETM onset, and continued through the CIE core, followed by a relative sea-level fall around the PETM recovery, implying the response of the relative sea-level to climate warming is characterized by a gradual rise, and a rapid fall. The demise of carbonate platform, increased terrestrial inputs and tropical storms has been widely observed in carbonate-platform environments across the PETM, suggesting enhanced erosion/chemical weathering and hydrological changes during the climate warming.

How to cite: Hu, X., Li, J., Jiang, J., Garzanti, E., and BouDagher-Fadel, M.: Carbonate-platform changes response to the Paleocene-Eocene Thermal maximum, EGU General Assembly 2023, Vienna, Austria, 23–28 Apr 2023, EGU23-6337, https://doi.org/10.5194/egusphere-egu23-6337, 2023.

Providing empirical evidence about the response of tropical shallow-water organisms to past warming and hyperthermal events is particularly important considering that they are severely threatened by current global warming. Stratigraphic resolution in shallow-water sections cannot be as precise as in pelagic environments and the empirical evidence is usually limited to a “before-and-after” comparison to assess the biological effects of events.

During the early Paleogene, the Neothetyan circum-Mediterranean region was the global center of reef coral diversity. Our compilation of Paleocene to Eocene reef coral occurrences allows for an analysis of reef coral responses to the major climatic changes of this time interval in unprecedented temporal detail, including the Paleocene-Eocene Thermal Maximum (PETM), when global mean temperatures reached more than 5°C above pre-industrial levels.

Reef corals were negatively affected by the PETM as we document a small decrease in diversity at both species and genus level and an increase of extinction rate across the hyperthermal event. During the onset of the Early Eocene Climate Optimum (EECO), diversity gradually increased as also documented by a peak of origination rate. The EECO diversity high is mainly related to the rich coral fauna recently described from NE Italy where the EECO and post-EECO phases are characterized by an accurate specimen-based systematic revision of museum collections associated to a detailed biostratigraphic calibration.

The Late Eocene cooling was accompanied by an increase in diversity, with the origination of several Oligocene coral taxa and the extinction of Eocene ones. The Late Eocene is also the time when coral reefs started to flourish again after the crisis of Late Paleocene-Early Eocene.


This study was funded by the Italian Ministry of Education and Research (MIUR), funds PRIN 2017: project “Biota resilience to global change: biomineralization of planktic and benthic calcifiers in the past, present and future” (prot. 2017RX9XXY).

How to cite: Bosellini, F., Benedetti, A., and Kiessling, W.: The Neothetyan circum-Mediterannean record as a suitable archive to understand the response of reef corals to the warming events of the Early Paleogene, EGU General Assembly 2023, Vienna, Austria, 23–28 Apr 2023, EGU23-6441, https://doi.org/10.5194/egusphere-egu23-6441, 2023.

EGU23-7633 | Orals | CL1.1.2 | Highlight

Life in a dark environment – what was the physiological and calcification response of benthic foraminifera to the environmental changes of the Paleogene hyperthermals 

Daniela N. Schmidt, Monsuru Adebowale, Ellen Thomas, Andy Ridgewell, and Laura Cotton

The Paleocene encompasses a series of hyperthamls including the Paleocene–Eocene Thermal Maximum (PETM) and the ETM2 which represent severe disturbances of global carbon cycling and the Earth system. Responses of marine organisms included extinction, migration and evolutionary turnover, but the role of ocean acidification on deep-sea foraminiferal calcification has not yet been quantified. Using computed tomography (CT) we investigate morphological (surface area, test volume, calcite volume, chamber number) and hence calcification response in two benthic foraminiferal species, at central Pacific Site 1210 (PaleoDepth 2100m), and Southern Ocean Maud Rise Site 690 (PD 1900m), Walvis Ridge Site 1264,  and Kerguelen Plateau Site 1135 (PD ~800m) for the PETM and ETM2.

The relative warming during the event was the same at all sites, suggesting that biotic differences are not likely related to differential warming. The environmental change led to reduction of test volume of both species, negatively impacting their potential ability to generate gametes. Epifaunal Nuttallides truempyi increased its surface area relative to volume in the Southern Ocean, potentially increasing its ability to forage and take up oxygen. In contrast, there is no clear pattern of change in shallow infaunal Oridorsalis umbonatus which, given sufficient food, can thrive at lower oxygen conditions. Calcite volume/test volume ratio decreased in both species during the PETM in the Southern Ocean, with the lack of response at upper abyssal depth in the Pacific possibly driven by severe oligotrophy even before the excursion. Therefore, changes in food supply during hyperthermals might have been less pronounced at upper abyssal depths in the Pacific than at the other two sites. These results contrast with published results from Walvis Ridge which showed an increase in calcification in small specimens of O. umbonatus. Food availability at the Southern Ocean sites may have supported growth as indicated by test volumes, but did not supply enough energy for calcification to mitigate against lower carbonate ion saturation during the PETM CIE.

How to cite: Schmidt, D. N., Adebowale, M., Thomas, E., Ridgewell, A., and Cotton, L.: Life in a dark environment – what was the physiological and calcification response of benthic foraminifera to the environmental changes of the Paleogene hyperthermals, EGU General Assembly 2023, Vienna, Austria, 23–28 Apr 2023, EGU23-7633, https://doi.org/10.5194/egusphere-egu23-7633, 2023.

Climatic effects on erosion is usually covered up by tectonics and not well understood in active mountains. The Dabie Mountains in central China evolved from a collisional orogen between North China and South China with development of Triassic ultrahigh pressure metamorphic (UHPM) rocks. In the Late Triassic these UHPM rocks experienced a rapid cooling after peak metamorphism and has been linked to compressional uplift during the collisional orogenesis. During this period, the climate changed from arid-semi arid to humid in the northern South China. This climate change is clearly recorded in the Late Triassic successions of upper Puqi and Jigongshan formations in the Huangshi Basin to the south of the Dabie Mountains. Combining tuff zircon U-Pb dating and magneto-stratigraphy, the upper Puqi Formation with arid climate was constrained in the early Norian (~228−221 Ma) with the overlying Jigonghsan Formation with humid climate in the late Rhaetian according to youngest detrital zircon ages. Detrital zircon and rutile U-Pb ages were combined with paleocurrents and sandstone petrography to determine the sedimentary provenance. For the upper Puqi Formation the deposited sediments were likely recycled from the Paleozoic sedimentary rocks in the Dabie Mountains. However, the Jiligang Formation has sediment mainly derived from the middle Neoproterozoic and late Paleoproterozoic basement rocks in the northern South China and Dabie Mountains. This rapid shift in provenance is associated with and plausibly resulted from the Late Triassic climate change, which may force rapid erosion in the southern Dabie Mountains. The deposition of the upper Puqi Formation was temporally overlapping with the rapid cooling and tectonic uplift of the Dabie Mountains, but there were no large changes in sedimentary provenance. This observation suggests low erosion rates in active mountains under a under an arid-semi arid climate.

How to cite: Yang, J., Li, H., Zhou, Y., Liu, A., and Cheng, L.: Climate controlled erosion during the Late Triassic rapid exhumation of the ultrahigh pressure metamorphic rocks in the Dabie Mountains, EGU General Assembly 2023, Vienna, Austria, 23–28 Apr 2023, EGU23-7970, https://doi.org/10.5194/egusphere-egu23-7970, 2023.

EGU23-8192 | Orals | CL1.1.2

A biogeographic model of thermal habitat loss during global temperature change 

Adam T. Kocsis, Carl J. Reddin, Erin E. Saupe, and Georg Feulner

Global warming has been implicated as a trigger of mass extinctions in the past. Although species track their thermal niches as isotherms move poleward, systematic changes in the area of habitable space (i.e., their thermal habitat) are expected to influence their extinction risk. Quantifying thermal habitat changes is difficult in the geological past, where information about geography and the distributions of species are highly incomplete. We therefore present a formalized model of thermal habitat change, resulting from the interaction of spherical geometry, thermal niche preference, latitudinal temperature profile, and global temperature change. Our results suggest an overall decrease in available thermal habitat during global warming. Thermal habitat is lost primarily from lower latitude and polar areas, whereas temperate areas are less affected. Although patterns of extinction are ultimately dependent on the geography of available habitat space, the extent to which species occupy their thermal niches, additional abiotic parameters, and biotic interactions, our simple theoretical model provides the basic expectation for spatial patterns of habitat loss, and therefore potentially species loss, during global warming.

How to cite: Kocsis, A. T., Reddin, C. J., Saupe, E. E., and Feulner, G.: A biogeographic model of thermal habitat loss during global temperature change, EGU General Assembly 2023, Vienna, Austria, 23–28 Apr 2023, EGU23-8192, https://doi.org/10.5194/egusphere-egu23-8192, 2023.

EGU23-9692 | Orals | CL1.1.2

Intraspecific decline in shell size of the bivalve Harpax spinosus across the Pliensbachian/Toarcian transition 

Adam Tomašových, Luís Vítor Duarte, Tamas Müller, and Ján Schlögl

Abrupt changes in seawater temperature during the late Pliensbachian and early Toarcian significantly influenced not only species and functional diversity of marine benthic ecosystems, but also affected body size at intraspecific and community levels. Although community-level trends in body size driven by selectivity in species extinctions are well-documented, intraspecific trends in size and life-history strategies remain poorly explored. Harpax spinosus is an Early Jurassic plicatulid, bimineralic bivalve that was abundant during the Pliensbachian but went extinct at the onset of the Toarcian oceanic anoxic event. Here, we evaluate temporal changes in size-frequency distributions of this species at high stratigraphic resolution at Peniche and Fonte Coberta sections in the Lusitanian Basin. Analyses of H. spinosus at these sections document that this bivalve typically achieved 10-15 mm in length during the deposition of the margaritatus and spinatum zones, with left-skewed or bimodal size distributions. However, its median size significantly declines to < 10 mm within the spinatum Zone (in the upper part of the apyrenum Subzone), coinciding with the appearance of small koninckinid brachiopods. This size reduction is followed by a return to larger sizes in the upper part of the spinatum Zone. A second decline in size occurs in the lowermost Toarcian where Harpax co-occurs with small-sized Koninckella-Nannirhynchia assemblage (Koninckella fauna), immediately above the mirabile Subzone. Although this abrupt decline in size can be accentuated by condensation, the size distribution at bedding plane is strongly left-skewed (with infrequent small-sized individuals), in contrast to the size distribution in the overlying marl. Harpax assemblages in the lowermost Toarcian semicelatum Subzone are characterized by right-skewed or symmetric size-frequency distributions, with median size < 10 mm. Sclerochronological analyses of growth rings and stable isotopes indicate that the decline in size was not associated with any decline in lifespan and was rather associated with a decline in the von Bertalanffy growth coefficient.

How to cite: Tomašových, A., Duarte, L. V., Müller, T., and Schlögl, J.: Intraspecific decline in shell size of the bivalve Harpax spinosus across the Pliensbachian/Toarcian transition, EGU General Assembly 2023, Vienna, Austria, 23–28 Apr 2023, EGU23-9692, https://doi.org/10.5194/egusphere-egu23-9692, 2023.

The Phanerozoic Eon is littered with high temperature perturbations which relate to large igneous province (LIP) volcanism. Each of these events occurred against a different climatic and biogeochemical backdrop, and had biotic effects ranging from negligible to extreme. In this talk I will cover the progress we have made with the climate-biogeochemical model SCION, which aims to reconstruct the long-term Phanerozoic climate state as well as these individual hyperthermal events. I will investigate the differences in the amount of carbon that is required to drive the events in the model, versus what is known from the geology of the LIPs themselves. I will then try to suggest solutions to these problems, which may lie in the biotic or biogeochemical responses to climate warming.

How to cite: Mills, B.: How well do we understand Phanerozoic hyperthermals? Investigations with a climate-biogeochemical model, EGU General Assembly 2023, Vienna, Austria, 23–28 Apr 2023, EGU23-9922, https://doi.org/10.5194/egusphere-egu23-9922, 2023.

Several typical Oceanic Anoxic Events (OAEs) occurred in the greenhouse period of the Mesozoic. These OAEs were characterized by low seawater sulfate concentration ([SO42‒]) before and during the events, suggested by sulfur-cycle, which have been considered to play a significant role in their formation and evolution. However, there is still lack of reliable sedimentary evidence for the low [SO42‒] and the details how the low [SO42‒] impact the OAEs. Here, we present integrated sedimentologcal, mineral and geochemical study of black shale and siderites hosted in black shale and concretions during the early Aptian in the Gucuo Ⅱ section (Tibetan Himalaya). The siderites were observed throughout the section and share the similar characteristics in the black shale and concretion, which can be divided into dominant disseminated and rhombus crystals in early diagenesis and minor spherical crystals in the late diagenesis. The multiple evidence of relatively high V/Al and V/ (V+ Ni), MREE bulge pattern, minor occurrence of pyrites and the extremely low carbon-isotope values of carbonate concretion that close to organic matter indicate that siderites were formed in the Fe reduction zones by the process of Dissimilatory Iron Reduction (DIR) which required strict conditions of low [SO42‒], reducing environment, abundant iron and high alkalinity. Additionally, the symbiosis of siderite and pyrite may indicate that the DIR occurred close to the Microbial Sulfate Reduction (MSR) zone, and the extremely low seawater [SO42‒] hovered around the tipping point where pyrites could form once the seawater sulfate increase by pulse input of enhanced continental weathering and/or volcanism. Our observations supported the previous hypothesis that under the background of low [SO42‒], enhanced volcanic-derived sulfate input could have promoted the MSR and organic matter mineralization, which likely further enhanced nutrient recycling, and increased primary productivity and organic carbon burial, leading to more oxygen consumption and subsequently driving an expansion of the oxygen minimum zones.

How to cite: Meng, F.: Early Aptian mineral and geochemical evidence of siderites from the Tibetan Himalaya: implications for the low sulfate concentration of Oceanic Anoxic Event, EGU General Assembly 2023, Vienna, Austria, 23–28 Apr 2023, EGU23-10349, https://doi.org/10.5194/egusphere-egu23-10349, 2023.

EGU23-10485 | ECS | Posters virtual | CL1.1.2

Paleocene-Eocene carbon isotope excursion recorded in the western Jianghan Basin, China 

Xingyu Luo, Ping Wang, Cairong Luo, Miao Lv, Shanying Li, and Xiaochun Wei

Paleocene-Eocene Thermal Maximum (PETM), occurring at Paleocene/Eocene boundary, was a rapid global warming event caused by the release of massive carbon into ocean-atmosphere system. The western Jianghan Basin in central China was documented as a sedimentary archive spanning the Paleocene/Eocene boundary, but the PETM event has never been well constrained. Here, we report the carbon isotope results of pedogenic carbonate and lacustrine carbonate from a newly exposed section in the western Jianghan Basin (close to Yidu city). The ~80-m-thick section consists of Gongjiachong and Yangxi Formations, which can be interpreted as being deposited in a marginal lacustrine environment, dominated by interlayered, medium to thick-bedded gray limestone, calcareous sandstone, and red siltstone with minor conglomerate. From bottom upward, the carbon isotope of total carbon (δ^13 C) shows a rapid decrease from -6.5‰ to -13‰, while the carbon isotope of organic matter (δ^13 C_org) decreases from -24.5‰ to -27.4‰, suggesting a carbon isotope excursion in a short period of time. The carbon isotope records, like the ocean record, clearly show a “Three-Phase Model”: it starts with a rapid carbon isotope negative excursion from about 15 to 20 meters, followed by a slow decline trend from 20 to 36 meters, and then a gradual recovery to the pre-PETM level from 36 to 46 meters. This pattern of carbon isotope change corresponds to a positive feedback process of carbon in the Earth's surface system. Our findings indicate a possible records of PETM events and provide a new perspective for studying early Cenozoic climate change in central China.

How to cite: Luo, X., Wang, P., Luo, C., Lv, M., Li, S., and Wei, X.: Paleocene-Eocene carbon isotope excursion recorded in the western Jianghan Basin, China, EGU General Assembly 2023, Vienna, Austria, 23–28 Apr 2023, EGU23-10485, https://doi.org/10.5194/egusphere-egu23-10485, 2023.

EGU23-10503 | ECS | Posters virtual | CL1.1.2

The Carnian Pluvial Episode in the Yanyuan Basin (Southwestern China) 

Shixin Li, Tingshan Zhang, Zhiheng Ma, Jianli Zeng, Xi Zhang, and Mihai Emilian Popa

As one of the hyperthermal events in the Mesozoic, the Carnian Pluvial Episode (CPE) was a global perturbation of the C-cycle and a strong enhancement of the hydrological cycle associated with global warming resulting in significant changes in sedimentary environments from Pangaea to deep water Panthalassa. In this paper, we make research on biostratigraphy, petrology, cyclostratigraphy and geochemistry of the Shemulong Formation in the Yanyuan Basin, at the southwestern of the Yangtze Platform. This strata record the complete deposition of the Carnian stage and preserve the signal of the astronomical orbital period. It also provides good paleontological information which was identified clear biostratigraphic framework. New redox proxies and stable isotopes are analyzed and compare the δ13C data with existing data from other sections of the CPE. In this section, there are at least four terrigenous input pulses which are consisted of sandstone and mudstone, causing the abrupt shutdown of carbonate production during the CPE period. Meanwhile, biodiversity data like bivalves, conodonts and ammonoids in the study area show a major change in abundance and variability during the CPE period. These are also coincident with negative carbon isotope excursions (NCIE), proving the close correspondence between the perturbation of the carbon cycle (and related hyperthermal events occur) and the turnover of depositional systems and ecosystems. Furthermore, we found differences in the recovery of carbonate production after each terrigenous input. The degree of recovery decreases and then increases upwards (bioclastic limestones - oolitic limestones - bioclastic limestones - biostrome - reef mound). It may link to the intensity of the terrigenous input pulse. In summary, this research provides more comparative schemes in the eastern Tethys for the collaborative study of environment biological co-evolution relationship within the CPE interval and is of positive significance for the in-depth understanding of climate and biodiversity changes through hyperthermal intervals in Earth history.

Acknowledgements

This work was supported by the National Natural Science Foundation of China (No. 41972120; 42172129), by the State Key Laboratory of Palaeo-biology and Stratigraphy (Nanjing Institute of Geology and Palaeontology, CAS) (No.173131).

How to cite: Li, S., Zhang, T., Ma, Z., Zeng, J., Zhang, X., and Popa, M. E.: The Carnian Pluvial Episode in the Yanyuan Basin (Southwestern China), EGU General Assembly 2023, Vienna, Austria, 23–28 Apr 2023, EGU23-10503, https://doi.org/10.5194/egusphere-egu23-10503, 2023.

EGU23-10979 | ECS | Posters on site | CL1.1.2

Hyperthermal events have a greater effect on body size origination selectivity than extinction 

Pedro M. Monarrez, Jood A. Al Aswad, Noel A. Heim, Erik A. Sperling, and Jonathan L. Payne

Ancient hyperthermal events in Earth’s history are ideal to isolate the evolutionary consequences of climate change and other environmental factors from other anthropogenic influences. A key biological trait hypothesized to be sensitive to climate change and straightforward to quantify in fossil data is body size. Most ectotherms modulate their physiological response to temperature and oxygen change in part through their body size. As hyperthermal events include both temperature increases and ocean deoxygenation, these events can have a deleterious effect on ectotherms on the ends of the body size spectrum. Large bodied ectotherms are particularly at risk, as oxygen demand increases with both body size and temperature. Previous work has assessed extinction selectivity of body size across hyperthermal events, but origination selectivity has not been assessed, which may be as important as extinction selectivity. Here, we measure extinction and origination selectivity with respect to body size for genera in six Linnean classes with robust fossil records (Rhynchonellata, Cephalopoda, Echinoidea, “bony fish” [an informal class consisting of Osteichthyes, Actinopteri, and Actinopterygii], Bivalvia, and Gastropoda). We compare selectivity during background intervals with those during hyperthermal events and their associated recovery intervals spanning the Middle Triassic to the Recent. We use capture-mark-recapture statistical models to measure extinction and origination selectivity while addressing the effects of variable sampling completeness with respect to time and body size. We find that genera with smaller body size are preferentially lost to extinction during background intervals, whereas body size is not associated with extinction probability during hyperthermal events. Conversely, originating genera are larger than average during background intervals across all size classes, but vary among classes in their body size pattern immediately following hyperthermal events. Rhynchonellate brachiopods, cephalopods, and echinoids exhibit originators that are smaller, on average, than the survivors after hyperthermal events, whereas originating bivalves and gastropods tend to be larger than the survivors. Bony fish do not exhibit size bias in origination after hyperthermal events. Overall, these results show that hyperthermal events affect both extinction and origination dynamics but have a greater effect on body size origination selectivity than extinction. The exact cause(s) for the greater effect of hyperthermal events on body size in origination versus extinction is not certain, but these results are consistent with previous findings spanning the Phanerozoic that compared body size selectivity patterns during background intervals to those associated with the Big Five mass extinction events. These results show that climate-associated perturbations change extinction and origination dynamics relative to background intervals, suggesting that climate-associated extinction and origination in the modern and future ocean may differ from geological background.

How to cite: Monarrez, P. M., Al Aswad, J. A., Heim, N. A., Sperling, E. A., and Payne, J. L.: Hyperthermal events have a greater effect on body size origination selectivity than extinction, EGU General Assembly 2023, Vienna, Austria, 23–28 Apr 2023, EGU23-10979, https://doi.org/10.5194/egusphere-egu23-10979, 2023.

The Toarcian Oceanic Anoxic Event (T-OAE, ~ 183 Ma), also known as Jenkyns Event, was one of the most important hyperthermal events of the Mesozoic, marked by a prominent negative carbon-isotope excursion (CIE) in both terrestrial and marine material. Although the T-OAE has been widely studied in the western Tethyan and Boreal regions, only relatively few investigations about the T-OAE have been conducted in other sites. Here we present new carbon-isotope, element geochemical and sedimentological data from a lower Toarcian open-marine section in the northern margin of eastern Tethys (Qiangtang Basin). This study section shows a negative CIE, which accords with other well-preserved sedimentary successions, and thus our data provide the evidence of the T-OAE from an open-marine setting in the northern margin of eastern Tethys. Elemental, mineralogical and sedimentological data indicate that mainly oxic bottom water conditions prevailed during the T-OAE interval in the section. Therefore, anoxia is not a significant feature of the T-OAE in the study area. Combined with previous studies, redox conditions in the bottom water show a clearly spatially variable and mainly depend on local conditions (e.g., water depth and basin hydrography). Sedimentological and geochemical analyses reveal an intensified chemical weathering and an increased coarse-grained detrital flux during the T-OAE, which is a regional response to global warming occurring in this interval.

How to cite: Nie, Y. and Fu, X.: A Toarcian Oceanic Anoxic Event record from an open-ocean setting in the northern margin of eastern Tethys: Implications for redox and weathering conditions, EGU General Assembly 2023, Vienna, Austria, 23–28 Apr 2023, EGU23-11617, https://doi.org/10.5194/egusphere-egu23-11617, 2023.

EGU23-12439 | ECS | Posters virtual | CL1.1.2

Storm deposits prior to the Triassic – Jurassic boundary in terrestrial Sichuan Basin, east Tethyan margin, China 

Jianli Zeng, Tingshan Zhang, Mihai E. Popa, Yongdong Wang, Xi Zhang, Liqin Li, Yuanyuan Xu, Ning Lu, and Xiaoqing Zhang

Abstract:

The coal-bearing Xujiahe Formation is the upmost Triassic lithological units in Sichuan Basin, Southwest China, where located in east Neo-Tethyan margin during the late Triassic. More than 30 years core drill and outcrop investigation of Xujiahe Formation shows the storm deposits were widely distributed in Sichuan Basin, characterized by the irregular muddy gravel associated with hummocky/swaley cross stratification. In particular, the irregular muddy gravel commonly found in upmost Xujiahe Formation, just below the Triassic – Jurassic lithological boundary.

Recent two Xujiahe Formation outcrop were investigated from section Zilanba and section Xindianzi were further provided the new evidence of storm  in both north and south Sichuan Basin during the latest Triassic. In north Sichuan Basin Zilanba section, the in-situ wood trunks from paleosol surface (28.7m below Tr-J lithological boundary) at 5 member of Xujiahe Formation shows 6 of 9 trunk fossils lodging direction (NWW) is opposite to the paleocurrent direction (SSE)(data from gravel in 4th member of Xujiahe Formation). It is suggested that a strong southeasterlies prevail in the northern Sichuan Basin at that time. In south Sichuan Basin Xindianzi section, massive muddy gravels were found under the lithological Triassic – Jurassic boundary. These muddy gravels were poorly rounded or shaped with plastic deformation, shows no evidence of transport, similar with storm retention deposit.

The sedimentary interpretation of Xujiahe Formation is mainly composed of braided delta and lacustrine facies. However, the formation of a storm theoretically requires a water depth more than 60m and the temperature above 26.5℃, therefore, compare with the ocean environment, inland lakes such as Sichuan Basin are less likely to form tempestite due to the limited width and surface temperature during the latest Triassic.

Although terrestrial storm deposition is not well theorized. But on a global scale, the distinctive paleogeographic pattern of Pangea gave rise to a global scale monsoon system, the “megamonsoon”, with seasonal reversal of circulation and large-scale migration of the ITCZ (Inter-Tropical Convergence Zone, ITCZ) over the Tethys Ocean at a maximum latitude of 60º N/S in winter and summer. In fact, tempestites also occurred in year-round migration range of ITCZ during the Triassic – Jurassic transition, such as England, East Greenland, Italy, the United Arab Emirates, and South Tibet. Similar with above locates, storms in terrestrial Sichuan Basin should interpreted in the context of global surface wind background, i.e., ITCZ year-round migrate belt.

Meanwhile, in geological past, tempestites also occurred in T-OAE (Toarcian Oceanic Anoxic Event, T-OAE). Consider that There was no significant change in global paleogeographic pattern during the TJB (Triassic – Jurassic boundary) and T-OAE. In addition, by comparing the storm-deposition records of T-OAE associate with the present climate simulation, we propose that the storm-deposition records at the upmost of the Xujiahe Formation, which just below the Triassic Jurassic boundary in the Sichuan Basin, were probably forced by atmospheric CO2 concentration arising.

Acknowledgements

This study is financially co-supported by the National Nature Science Foundation of China (41972120; 42172129) and the State Key Laboratory of Palaeobiology and Stratigraphy (Nanjing Institute of Geology and Palaeontology, CAS) (No. 173131).

How to cite: Zeng, J., Zhang, T., E. Popa, M., Wang, Y., Zhang, X., Li, L., Xu, Y., Lu, N., and Zhang, X.: Storm deposits prior to the Triassic – Jurassic boundary in terrestrial Sichuan Basin, east Tethyan margin, China, EGU General Assembly 2023, Vienna, Austria, 23–28 Apr 2023, EGU23-12439, https://doi.org/10.5194/egusphere-egu23-12439, 2023.

The hothouse climate in the Early Triassic has been recognised for a decade. Yet it remains the most recently discovered hothouse and is poorly understood in many aspects. Initially triggered by the Siberian Traps in the latest Permian, the Early Triassic represents one of the most extreme and long-lasting greenhouses in the Phanerozoic. Although the outgassing of the Siberian Traps probably already decreased in the late Griesbachian, the Equatorial SSTs peaked at ~40 ℃ later in the late Smithian. The late Smithian thermal maximum coincided with resumed volcanic activities of a smaller scale. However, why lesser volcanism triggered Phanerozoic’s warmest hyperthermal is puzzling. The extreme warmth ameliorated in the latest Spathians, marking the termination of a ~5 Myr hothouse.

Many key questions about the Early Triassic climate remain unanswered. These include how warm the poles were, how flat the latitudinal SST gradient was, and how climate interacted with the global ocean circulation. However, the most fundamental question is how to maintain such an extreme hothouse climate for such a long time.

As most shelly fossils died out during the end-Permian mass extinction and the Early Triassic oceans were dominated by aragonite-shelled mollusks, reconstruction of Early Triassic seawater temperatures relies almost solely on oxygen isotope thermometer in conodont bioapatite. One of the key challenges is that Early Triassic conodonts are rare, small, and cannot be found everywhere due to the subduction of old ocean floors. These hinder the acquisition of proxy data in a broader palaeogeographic context. Future work combining proxy data with state-of-the-art Earth system modelling would be an ideal solution to better understand the hottest time in the Phanerozoic.

How to cite: Sun, Y.: The Early Triassic hothouse: what we know and what we don’t, EGU General Assembly 2023, Vienna, Austria, 23–28 Apr 2023, EGU23-12795, https://doi.org/10.5194/egusphere-egu23-12795, 2023.

EGU23-12972 | ECS | Posters on site | CL1.1.2

Novel reef coral communities emerging after deep-time hyperthermal events 

Danijela Dimitrijevic, Timothy L. Staples, Nussaȉbah B. Raja, John M. Pandolfi, and Wolfgang Kiessling

Modern coral reefs are among the most vulnerable ecosystems to climate change. Accordingly, we hypothesize that past hyperthermal events had lasting impacts on reef coral communities. Specifically, novel communities are expected to emerge after ancient warming events, where novel communities are those that document a rapid and irreversible shift into a new state that differs in composition and/or function from past systems. To test our hypothesis, we used a global compilation of reef coral occurrences from the middle Triassic to modern times (244.08 Ma) and applied a rigorous novel community detection framework at 0.1 Myr time bins. Novelty is quantified based on two components – cumulative novelty (i.e., the deviation from historical baselines and instantaneous novelty (i.e., the magnitude of change relative to the previous state). A novel community state is identified when both cumulative and instantaneous novelty match in a time series of ecological change. Surprisingly, over the entire evolutionary history of scleractinian corals, there were only two novelty events at global scales, and they both occurred in the aftermath of hyperthermal events: The first in the Hettangian stage and the second in the Toarcian. Our results underscore the hypothesis that profound global warming can have lasting consequences on coral reef ecosystems. 

How to cite: Dimitrijevic, D., Staples, T. L., Raja, N. B., Pandolfi, J. M., and Kiessling, W.: Novel reef coral communities emerging after deep-time hyperthermal events, EGU General Assembly 2023, Vienna, Austria, 23–28 Apr 2023, EGU23-12972, https://doi.org/10.5194/egusphere-egu23-12972, 2023.

The largest mass extinction on Earth with an estimated 90% loss of species occurred at the Permian-Triassic Boundary (~252 Ma). The end-Permian mass extinction coincides with extreme temperature increases and changes in ocean circulation and biogeochemistry. These climate perturbations are associated with carbon emissions linked to Siberian Trap volcanism. Fully-coupled Earth System Models can be applied to investigate the feedbacks and sensitivities of the background latest Permian climate to such carbon emissions. Past studies have focussed on constraining the magnitude of these carbon emissions without examining the sensitivity of palaeo-configured Earth System models designed for modern simulations. We modified a version of the Max Planck Earth System Model v1.2, similar to that used in the 6th-phase of the Coupled Model Intercomparison Project, to simulate the latest Permian climate-carbon system and use geochemical and palaeobiological proxy data to constrain the boundary conditions of the modelled climate state.
We first characterise the latest Permian climate state before presenting first results on a sensitivity study of the latest Permian climate-carbon state to CO2 emission pulses. A 100 year global mean 2 m surface air temperature of 17.5°C is simulated, rising up to 34.7°C in the low-latitude continental interior. The continental interior is also largely arid from ~50°N to ~50°S with a total precipitation maximum of 11.1 mm day-1 at the equatorial boundary of the Tethys and Panthalassic Oceans. The prevailing hydrological regime drives woody single-stemmed evergreens and soft-stemmed plant functional groups to dominate in the dynamic vegetation model. The 100 year global mean surface ocean of the latest Permian illustrates a warm-pool across the equatorial boundary between the Tethys and Panthalassic Oceans with a maximum temperature of 30.2°C decreasing to temperatures as low as -1.9°C near the poles. Surface salinities vary broadly across the global oceans with 100 year global mean values ranging from 22.9, in well-flushed regions of strong freshwater flux, to 48.6, in low-latitude regions of restricted exchange. Large-scale seasonal mixing below 60°S in the Panthalassic Ocean dominates the global meridional overturning circulation. These model data fit within the bounds represented by the available proxy data for the Late Permian. The widespread shallow ocean mixed-layer also restricts recirculation of nutrients, driving a high gross primary production with weak seasonality. Furthermore, regions of seasonal deep mixing correlate with seasonal pCO2 patterns at high latitudes. I will also present further analyses of the simulated ocean biogeochemical cycles in the Hamburg Ocean Carbon Cycle model with a focus on the novel extended Nitrogen-cycle processes.

How to cite: Burt, D. and Ilyina, T.: The sensitivity of the latest Permian climate-carbon state to CO2 emissions in an Earth System Model, EGU General Assembly 2023, Vienna, Austria, 23–28 Apr 2023, EGU23-13712, https://doi.org/10.5194/egusphere-egu23-13712, 2023.

EGU23-14328 | ECS | Posters on site | CL1.1.2

Stepwise recovery of vegetation from Permian–Triassic mass extinction in North China and implications for changes of palaeoclimates 

Wenchao Shu, Jinnan Tong, Daoliang Chu, Jianxin Yu, Jason Hilton, and José B. Diez

The Permian–Triassic was a major transition in the evolution of life in the earth history, when happened the greatest mass extinction during the Phanerozoic and an unusually prolonged or delayed recovery. Most studies have been carried in the marine facies while very few in the continental facies. On land, plants play a great role in the interaction of climate and terrestrial ecosystems. Here we present a regional case of stepwise recovery of vegetation in North China. Prior to the Permian–Triassic mass extinction, the voltzialean conifer forest community dominated in the Changhsingian. Consequently, the extinction event wiped out of the voltzialean conifer forest community, probably conciding with the extension of the red beds. The first post-crisis flora was an Induan herbaceous lycopsid community, succeeded by the PleuromeiaNeocalamites shrub marsh community. A pteridosperm shrub woodland community dominated for a short time in the late Early Triassic along with the reappearance of insect herbivory. In the early Middle Triassic, gymnosperm forest communities gradually rose to predominate in both uplands and lowlands along with other diverse plant communities, indicating the beginning of the establishment of the Mesophytic Flora. In the late Middle Triassic–Late Triassic, it was occupied by the DanaeopsisSymopteris flora and the opportunism elements gradually were replaced by the advanced taxa, which represents the complete establishment of the Mesophytic Flora.

How to cite: Shu, W., Tong, J., Chu, D., Yu, J., Hilton, J., and Diez, J. B.: Stepwise recovery of vegetation from Permian–Triassic mass extinction in North China and implications for changes of palaeoclimates, EGU General Assembly 2023, Vienna, Austria, 23–28 Apr 2023, EGU23-14328, https://doi.org/10.5194/egusphere-egu23-14328, 2023.

EGU23-14942 | Orals | CL1.1.2 | Highlight

Quantifying carbon cycle feedbacks to past hyperthermal events 

Sarah Greene, Stephen Jones, Markus Adloff, Daniel Doherty, and Andy Ridgwell

The magnitude of future climate change depends on how Earth's natural carbon reservoirs respond to the changing climate via carbon cycle feedbacks. Yet many of these feedbacks are poorly constrained and are widely acknowledged as a major source of uncertainty in climate projections, particularly into the long-term future. Whilst we can measure carbon cycle feedbacks over the historical period, the future pacing and strength of carbon cycle feedbacks remains uncertain. We do not yet know whether they will collectively amplify or dampen anthropogenic climate change in future or whether carbon cycle tipping point events will be triggered, releasing geologically sequestered carbon to the ocean-atmosphere. Hyperthermal events can serve as partial analogues to anthropogenic climate change and allow us to better constrain carbon cycle behaviour in response to global warming. However, most sedimentary proxy records of hyperthermals at the Earth’s surface record the net environmental change caused by both an initial ‘forcing’ and all subsequent ‘feedbacks’ to that forcing. Disentangling forcing and feedbacks signals across hyperthermals requires further independent constraints on some aspect of the system. The geological record is peppered with examples of past carbon emissions events from large igneous province (LIP) activity, many of which coincide with mass extinction and/or hyperthermal events. Here we show how carbon emissions from a large igneous province (the North Atlantic Igneous Province or NAIP) can be constrained at high resolution entirely independently from environmental proxy records. We further show how an Earth system modelling approach comparing NAIP carbon emissions predictions with proxy records of the Paleocene-Eocene Thermal Maximum (PETM, ~56 Ma) can be employed to constrain net global carbon cycle feedbacks to NAIP carbon emissions. Lastly, we show how the addition of carbon and trace metal isotope systems in this Earth system modelling framework has the potential to allow us to disentangle individual global carbon cycle feedbacks across events like the PETM, ‘fingerprinting’ the carbon reservoirs and quantifying their response to a known exogenic carbon input.

How to cite: Greene, S., Jones, S., Adloff, M., Doherty, D., and Ridgwell, A.: Quantifying carbon cycle feedbacks to past hyperthermal events, EGU General Assembly 2023, Vienna, Austria, 23–28 Apr 2023, EGU23-14942, https://doi.org/10.5194/egusphere-egu23-14942, 2023.

EGU23-15404 | Orals | CL1.1.2 | Highlight

Temperature-related stresses as a unifying principle in ancient extinctions (TERSANE) 

Wolfgang Kiessling and the TERSANE consortium

Climate change is increasingly being recognized as a driver of modern ecological changes including local extinctions. However, global species extinctions are still rarely attributed to climate change. In contrast, the fossil record offers a rich suite of examples of climate-driven extinctions including mass extinctions. Temperature, oxygen and pH were the dominant climate-related extinction drivers in the marine realm.

Over the last six years, the Germany-based TERSANE research unit with nine collaborating research teams has explored the role of climate changes over timescales ranging from hours to millions of years and genealogical scales from individual organisms to ecosystems. We focused empirically on physiological responses of bivalves, the abiotic and biotic changes across the end-Permian and Pliensbachian-Toarcian hyperthermals, and Phanerozoic-scale patterns focusing on extinction selectivity, body size changes, the role of climate history, and the vulnerability of reef systems across ancient warming events. This talk will summarize TERSANE’s accomplishments focusing on the relevance of results for current climate warming with special reference to different time scales.

How to cite: Kiessling, W. and the TERSANE consortium: Temperature-related stresses as a unifying principle in ancient extinctions (TERSANE), EGU General Assembly 2023, Vienna, Austria, 23–28 Apr 2023, EGU23-15404, https://doi.org/10.5194/egusphere-egu23-15404, 2023.

EGU23-15648 | ECS | Orals | CL1.1.2

Cd isotopes in carbonates deposited during ‘OAE 2’: Assessment of a novel palaeo-productivity tracer 

Sophie Gangl, Claudine Stirling, Matthew Druce, Matthew Clarkson, and Hugh Jenkyns

Cadmium (Cd) displays nutrient-type patterns in the modern ocean and has potential as a tracer of the efficiency of the ‘biological pump’ and its ability to transport CO2 from the atmosphere to the deep ocean during intervals of extreme environmental change. This potential arises because phytoplankton preferentially incorporate lighter Cd isotopes under many oceanic conditions, leaving surface waters relatively enriched in heavier isotopes. As a consequence of this fractionation, Cd-isotope ratios have been shown to reflect nutrient availability and the intensity of primary productivity in the modern ocean. However, the ability of the Cd stable-isotope system to serve as a robust palaeo-productivity tracer is not yet well established.

Oceanic Anoxic Event 2 (OAE 2; ~94 Ma) represents a period of widespread environmental degradation and oceanic de-oxygenation, likely the result of increased volcanic activity, intensified marine and continental silicate weathering, augmented nutrient input to the ocean and elevated primary productivity. However, direct evidence for the availability of bio-limiting nutrients in the oceans and the role of primary productivity as a feedback mechanism to eventually re-stabilise climate is limited. Here we present the first Cd-isotope record for OAE 2, from the well-preserved and biostratigraphically well-constrained organic-lean pelagic carbonate section through the English Chalk at Eastbourne (UK). Contrary to expectations, Cd isotopes at Eastbourne do not seem to be controlled by surface ocean productivity, but likely reflect global sub-surface signatures. The isotopic record suggests an active biological pump during OAE 2 coupled with changes in ocean circulation on a global scale. Our new record proposes that the Cd-isotope proxy is powerful and potentially very important for unravelling environmental changes during deep time events.

How to cite: Gangl, S., Stirling, C., Druce, M., Clarkson, M., and Jenkyns, H.: Cd isotopes in carbonates deposited during ‘OAE 2’: Assessment of a novel palaeo-productivity tracer, EGU General Assembly 2023, Vienna, Austria, 23–28 Apr 2023, EGU23-15648, https://doi.org/10.5194/egusphere-egu23-15648, 2023.

EGU23-15831 | Posters on site | CL1.1.2 | Highlight

Ephemeral aeolian activity and harsh paleoenvironments in North China related to the late Guadalupian extinction event on land 

Zhicai Zhu, Yongqing Liu, Hongwei Kuang, Alex Farnworth, Andrew J. Newell, and Michael J. Benton

The patterns and causes for the Guadalupian-Lopingian extinctions on land remain puzzling. Here, we reconstruct palaeoenvironments based mainly on the sedimentary environments from the eastern Ordos Basin, North China. Ephemeral aeolian activity in alluvial plains, as a critical marker of intermittent drought conditions, has been identified from the middle Sunjiagou Formation and can be well correlated between the Baode and Liulin areas in the eastern Ordos Basin. Thick dark red siltstones/mudstones with intercalated fine-grained sandstones rest above the aeolian sandstones, and were deposited on floodplains or oxbows adjacent to meandering channel belts. They can also be correlated by comparable mass burials of key tetrapod fossils including the pareiasaurs Shihtienfenia from Baode and Shansisaurus xuecunensis and Huanghesaurus liulinensis from Liulin, respectively. Notably, the fossil horizon at Baode shows a synchronous sharp carbon isotope negative excursion, decreased CIA, and a mercury peak, suggesting that the harsh paleoenvironment (reduced weathering intensity, arid and cool conditions) and potential influence of volcanism might have been important causes. A sandstone sample from the fossil horizon at Baode yields youngest detrital zircon ages of 266 ± 4 Ma, suggesting the maximum depositional age as late Guadalupian. Here, for the first time, we have identified late Guadalupian aeolian activity in North China based on field observations. We demonstrate that the harsh palaeoenvironment in North China may have caused the late Guadalupian tetrapod extinction events on land, before an event of sharp global warming related to the massive Emeishan large igneous province.

How to cite: Zhu, Z., Liu, Y., Kuang, H., Farnworth, A., Newell, A. J., and Benton, M. J.: Ephemeral aeolian activity and harsh paleoenvironments in North China related to the late Guadalupian extinction event on land, EGU General Assembly 2023, Vienna, Austria, 23–28 Apr 2023, EGU23-15831, https://doi.org/10.5194/egusphere-egu23-15831, 2023.

EGU23-16724 | ECS | Posters on site | CL1.1.2

Metabolic rate and the vulnerability of mollusks to hyperthermal-driven extinction events 

Siddharth Gavirneni, Linda Ivany, and Carl Reddin

Climate change can be a major driving mechanism behind mass extinctions. The combined multistressor effects of rapid global warming, ocean acidification, and hypoxia are devastating to marine faunas. Such episodes in Earth’s history, dubbed ‘hyperthermals’, serve as natural experiments that can provide insight into the effects of climate warming on marine ecosystems in the past as well as today. As water temperatures rise and oxygen solubility decreases, metabolic rates, and, consequently, the oxygen demands of organisms increase. This suggests that organisms with higher metabolic rates, already requiring more oxygen overall, should be more vulnerable to deoxygenation associated with rapid climate warming. However, more active organisms generally have physiologies less vulnerable to hypercapnia resulting from CO2 buildup in the oceans during hyperthermal conditions. Previous work on activity levels of fossil taxa disagree whether more active organisms are selected for (i.e., less vulnerable) or selected against during major hyperthermal-driven extinction events.

Here, we explore the effects of resting metabolic rate, body size, and temperature preference on extinction vulnerability in gastropods and bivalves during post-Paleozoic hyperthermals. We estimate metabolic rates with a general model of metabolic rate originally derived by Gillooly et al. (2001), using published biomass estimates and location-specific sea surface temperatures from published climate models. Following Reddin et al. (2020), we then calculate relative hyperthermal vulnerability (RHV), the difference between the risk of extinction at intervals associated with hyperthermal conditions versus baseline conditions, in order to determine how an organism’s metabolism may affect patterns of taxonomic extinction and survival across hyperthermal-driven extinction events. RHV can be preferable to more direct comparisons of extinction selectivity in that it allows for comparisons among groups with very disparate basal turnover rates. Preliminary results for bivalves indicate that a higher metabolic rate is associated with a reduced risk of extinction during hyperthermal conditions. These results also seem to suggest that the driving force behind this pattern of selectivity is the B0 standard metabolic rate coefficient, estimated using experimental data on respiration rates in modern bivalve and gastropod clades. Future work will focus on whether the range of variation in the experimental data underlying the B0 estimates lines up with what is expected of fossil taxa, and ultimately, whether these data can be used to evaluate how metabolic rate can affect species vulnerability to stress or extinction risk.

How to cite: Gavirneni, S., Ivany, L., and Reddin, C.: Metabolic rate and the vulnerability of mollusks to hyperthermal-driven extinction events, EGU General Assembly 2023, Vienna, Austria, 23–28 Apr 2023, EGU23-16724, https://doi.org/10.5194/egusphere-egu23-16724, 2023.

EGU23-17096 | ECS | Orals | CL1.1.2

An unexpected fossil lagerstätte under the Early Triassic hyperthermal event showing a modern-type marine ecosystem 

Xu Dai, Joshua H.F.L. Davies, Arnaud Brayard, and Haijun Song and the Guiyang Biota research team

Following the most severe mass extinction event during the Phanerozoic, the Permian-Triassic mass extinction (PTME, ~251.9 Ma), Early Triassic marine fossil communities were thought to be depauperate, poorly diversified, and dominated by abundant and cosmopolitan disaster or opportunistic taxa. Full re-establishment of complex marine ecosystems was thought to have not occurred until, ~8 million years after the PTME, being represented by the Luoping Biota. The highly suppressed Early Triassic marine ecosystem has been thought to be a consequence of recurrent environmental stresses, including high sea surface temperature, episodes of oceanic acidification, and anoxic/euxinic events mainly occurring during the Permian-Triassic transition, the late Dienerian and late Smithian. Alternatively, it can also result from preservation and sampling biases, which are often neglected in many previous works. Here, we report an exceptionally preserved Early Triassic fossil assemblage, the Guiyang Biota, from the Daye Formation near Guiyang, South China. The Guiyang Biota comprises at least 12 classes and 19 orders, including diverse fish fauna and malacostracans, revealing a trophically-complex marine ecosystem. High-precision U-Pb dating shows that the age of the Guiyang Biota is 250.83 +0.07/-0.06 million years ago. This is only 1.08 ± 0.08 million years after the severe Permian-Triassic mass extinction, and this assemblage therefore represents the oldest known Mesozoic lagerstätte so far. The Guiyang Biota indicates the rapid rise of modern-type marine ecosystems after the Permian-Triassic mass extinction.

How to cite: Dai, X., Davies, J. H. F. L., Brayard, A., and Song, H. and the Guiyang Biota research team: An unexpected fossil lagerstätte under the Early Triassic hyperthermal event showing a modern-type marine ecosystem, EGU General Assembly 2023, Vienna, Austria, 23–28 Apr 2023, EGU23-17096, https://doi.org/10.5194/egusphere-egu23-17096, 2023.

EGU23-17503 | Orals | CL1.1.2

Permafrost in the Cretaceous supergreenhouse 

Dr Juan Pedro Rodríguez López, Chihua Wu, Tatiana A. Vishnivetskaya, Julian B. Murton, Wenqiang Tang, and Chao Ma

During the archetypal supergreenhouse Cretaceous Earth, an active cryosphere with permafrost existed in Chinese plateau deserts (astrochonological age ca. 132.49–132.17 Ma). Permafrost wedges have been identified in three different outcrops of the Luohe Fm.  Most of the wedges are concentrated in two discrete horizons bounding three draa successions representing composite-wedge pseudomorphs. A late Pleistocene analogue for the Cretaceous aeolian–permafrost system of the Luohe Fm is provided by the composite wedges and sand wedges within aeolian dune deposits of the Kittigazuit Fm., Hadwen Island, NT, Canada. A modern analogue for these Cretaceous plateau cryospheric conditions is the aeolian–permafrost system we report from the Qiongkuai Lebashi Lake area, Xinjiang Uygur Autonomous Region, China. Significantly, Cretaceous plateau permafrost was coeval with marine cryospheric indicators in the Arctic and Australia, indicating a strong coupling of the ocean–atmosphere system. The Cretaceous permafrost contained a rich microbiome at subtropical palaeolatitude and 3–4 km palaeoaltitude, analogous to recent permafrost in the western Himalayas. Global permafrost thaw during the Cretaceous released significant volumes of greenhouse gases to the atmosphere as well as dissolved organic carbon (DOC) and other nutrients into watersheds, and marine waters affecting aquatic systems through carbon and nutrient additions. The contribution of permafrost thaw to the Cretaceous global C balance, including during oceanic anoxic events (OAE) will have to be determined in future research dealing with ocean–continental cryosphere coupling associated with events of cryosphere degradation in the aftermaths of supergreenhouse cold snaps. A mindset of persistent ice-free greenhouse conditions during the Cretaceous has stifled consideration of permafrost thaw as a contributor of C and nutrients to the palaeo-oceans and palaeo-atmosphere.

How to cite: Rodríguez López, D. J. P., Wu, C., Vishnivetskaya, T. A., Murton, J. B., Tang, W., and Ma, C.: Permafrost in the Cretaceous supergreenhouse, EGU General Assembly 2023, Vienna, Austria, 23–28 Apr 2023, EGU23-17503, https://doi.org/10.5194/egusphere-egu23-17503, 2023.

EGU23-41 | Orals | CL1.1.3 | Highlight

Variability of the Indonesian Throughflow and Australian monsoon dynamism across the Mid Pleistocene Transition (IODP 363, Site U1483) 

Kenji Matsuzaki, Ann Holbourn, Wolfgang Kuhnt, Li Gong, and Masayuki Ikeda

The Mid-Pleistocene Transition (MPT) between ~1200 and ~800 ka was associated with a major shift in global climate and was marked by a change in glacial/interglacial periodicity from ~41 to ~100 kyr that resulted in higher-amplitude sea-level variations and intensified glacial cooling. The Indonesian Throughflow (ITF), which controls the exchange of heat between the Pacific and Indian Oceans, is a major component of the global climate system. On the other hand, Asian-Australian Monsoon dynamics play a key role in regional primary productivity. Therefore, reconstruction of ITF and Asian-Australian Monsoon variability during the MPT could potentially clarify the impact of the glacio-eustatic sea level changes on the climate and ecosystem of Northwest Australia. The International Discovery Program (IODP) Expedition 363 retrieved an extended, continuous hemipelagic sediment succession spanning the past two million years at Site U1483 on the Scott Plateau off Northwestern Australia.

In this study, we analyzed radiolarian assemblages in core top samples retrieved during the RV Sonne Expedition 257 and downcore samples from IODP Site U1483 to estimate the variability in regional sea surface temperatures (SSTs) during the MPT, and to explore ITF dynamics in relation to glacio-eustatic sea-level variations and tropical monsoon strength. We suggest that glacio-eustatic sea-level variations have been a key factor affecting changes in SSTs at Site U1483, primarily because the shallow and hydrogeographically complex nature of the sea means that SSTs are highly sensitive to glacio-eustatic sea-level variation. Based on comparisons with SST data from the mid latitudes off Northwest Australia and the South China Sea, we suggest that the SSTs at Site U1483 are highly dependent on prevailing climate changes in the northern hemisphere rather than changes in the climate of the Southern hemisphere. In addition, comparisons of radiolarian total abundances with X-ray fluorescence-scanning elemental data suggested that, until the onset of the MPT (~1200 ka), radiolarian productivity was higher during strong summer monsoons during interglacial periods, probably because of the high riverine runoff generated by heavy summer monsoonal precipitation. However, since ~900 ka, there appears to have been a shift in the mode of radiolarian productivity that has resulted in increased radiolarian productivity during glacial periods when the delivery of nutrients is increased due to the enhanced mixing of the upper water column in the shallow sea caused by strong trade winds. 

How to cite: Matsuzaki, K., Holbourn, A., Kuhnt, W., Gong, L., and Ikeda, M.: Variability of the Indonesian Throughflow and Australian monsoon dynamism across the Mid Pleistocene Transition (IODP 363, Site U1483), EGU General Assembly 2023, Vienna, Austria, 23–28 Apr 2023, EGU23-41, https://doi.org/10.5194/egusphere-egu23-41, 2023.

EGU23-464 | ECS | Posters on site | CL1.1.3

Effects of the Pacific Antarctic Circumpolar Current on the extant coccolithophore Emiliania huxleyi 

Ellis Morgan, Mariem Saavedra-Pellitero, and Elisa Malinverno

During the last decades, the Southern Ocean (SO) has been experiencing physical and chemical drastic changes which are affecting the distribution and composition of pelagic plankton communities. Coccolithophores (small-sized haptophyte algae) are the most prolific carbonate-producing phytoplankton group, playing a key role in biogeochemical cycles at high latitudes.

In this work we investigated the biogeographical distribution and calcification patterns of the ecologically dominant species Emiliania huxleyi across a latitudinal transect in the Pacific sector of the SO (from ~40°S to ~54°S). We aimed to assess the response of E. huxleyi to steep environmental gradients across the frontal system of the Antarctic Circumpolar Current.

The plankton samples were collected during International Ocean Discovery Program Expedition 383: Dynamics of Pacific Antarctic Circumpolar Current (DYNAPACC, May-July, 2019) onboard the R/V JOIDES Resolution (https://iodp.tamu.edu/scienceops/expeditions/dynamics_of_pacific_ACC.html). In situ environmental data (such as sea surface temperature, total alkalinity and pH) were measured at each sampling location.

The samples were prepared and analysed at the University of Portsmouth using a combination of electron backscatter diffraction (EBSD), Scanning Electron Microscope (SEM) and light microscopy techniques.

How to cite: Morgan, E., Saavedra-Pellitero, M., and Malinverno, E.: Effects of the Pacific Antarctic Circumpolar Current on the extant coccolithophore Emiliania huxleyi, EGU General Assembly 2023, Vienna, Austria, 23–28 Apr 2023, EGU23-464, https://doi.org/10.5194/egusphere-egu23-464, 2023.

EGU23-1105 | Posters on site | CL1.1.3

The start of the Great Barrier Reef is a result of the increased stability of Temperatures in the Mid to Late Pleistocene. 

Benjamin Petrick, Lars Reuning, Alexandra Auderset, Miriam Pfeiffer, and Lorenz Schwark

The Great Barrier Reef is a unique environmental resource threatened by future climate change. However, it has always been unclear how this ecosystem developed in the Mid to Late Pleistocene. Work has shown that the reef developed between ~ 600-500 ka during MIS 15-13, although some records suggest a start at MIS 11 at 400 ka. There is a lack of Sea Surface Temperature (SST) records for this time for the area around the Great Barrier Reef. Furthermore, the few existing SST records do not show temperature changes during these key periods, leading researchers to suggest that factors other than temperature, such as sea-level change or sediment transport, explain the start of the reef. We used the TEX86 proxy to produce a new SST record starting at 900 ka from ODP Site 820. This core is located next to the northern Great Barrier Reef. In this new record, there are SST changes that seem to match both dates for the start of the Great Barrier Reef. First, there is a period of stable SST between 700-500 ka, with no glacial cooling during this time. This could promote the development of a reef system during this time, allowing the reef more time to evolve from isolated smaller reefs to a continuous barrier reef. However, there is some suggestion based on facies analyses that even though the barrier system developed around MIS 15, the modern coral reef system was not yet fully established. Our records show that glacial temperatures during MIS 14 still are similar to SSTs from records further south. However, this trend shifts around MIS 11 when glacials became warmer. In fact, while before MIS 11, SST at ODP 820 was colder than records from the Western Pacific Warm Pool, afterwards SST was either the same or sometimes warmer than at these sites. Also, unlike other nearby records, the difference in SSTs between glacials and interglacials is reduced after MIS 11. This suggests that the northern Coral Sea might have been protected from the extremes of glacial temperature changes after the MPT. This process might have allowed the development of a continuous coral reef system by encouraging the growth of reefs even during glacials. Therefore, our research suggests that major steps in the development of the Great Barrier Reef system are linked to changes in the SSTs. Our SST record suggests that SST changes are the primary driver of reef development and other non-SST factors are less important.

How to cite: Petrick, B., Reuning, L., Auderset, A., Pfeiffer, M., and Schwark, L.: The start of the Great Barrier Reef is a result of the increased stability of Temperatures in the Mid to Late Pleistocene., EGU General Assembly 2023, Vienna, Austria, 23–28 Apr 2023, EGU23-1105, https://doi.org/10.5194/egusphere-egu23-1105, 2023.

EGU23-1997 | Orals | CL1.1.3

Chemical Weathering in New Guinea since the Mid Miocene 

Peter Clift and Mahyar Mohtadi

Chemical weathering of silicate rocks is a well recognized method by which carbon dioxide is removed from the atmosphere and fixed as calcium carbonates in the sedimentary record. For many years the long term cooling of the Earth during the Cenozoic has been linked to uplift, erosion and weathering of the Himalayas and Tibetan Plateau, however following scientific ocean drilling of the submarine fans in the Asian marginal seas it now seems that this region could not be responsible for cooling, at least during the Neogene. Although other factors such as burial of organic carbon and the rates of degassing during seafloor spreading may also be important, erosion and weathering of other regions may also be important in controlling global CO2 concentrations. In this study we focus on the role of New Guinea, the large (>2500 km long) orogen formed as Australia collided with Indonesia since the Mid Miocene. New Guinea comprises slices of arc and ophiolite rocks that are susceptible to weathering, and is located in the tropics where warm, wet conditions favor rapid weathering. Rainfall exceeds >4 m annually in the island center. Analyses of sediment from Deep Sea Drilling Project Sites 210 and 287 in the Gulf of Papua now allow the weathering and erosion history of the island to be reconstructed. A trend to more continental erosion since 15 Ma reflects uplift and erosion of tectonics slices of the Australian plate. At the same time chemical weathering shows increasing intensity, especially since 5 Ma, as proxied by major element ratios (K/Rb, K/Al) and clay minerals. Greater proportions of kaolinite point to more tropical weathering since the Mid Miocene. Trends to more weathering contrast with Himalayan records that show the reverse, and suggest that New Guinea may be an important component in controlling global climate in the past 15 Ma.

How to cite: Clift, P. and Mohtadi, M.: Chemical Weathering in New Guinea since the Mid Miocene, EGU General Assembly 2023, Vienna, Austria, 23–28 Apr 2023, EGU23-1997, https://doi.org/10.5194/egusphere-egu23-1997, 2023.

EGU23-2105 | Orals | CL1.1.3

Changes in intermediate circulation waters along the tropical eastern Indian Ocean during quaternary climatic oscillations 

Sandrine Le Houedec, Maxime Tremblin, Amaury Champion, and Elias Samankassou

The Indo-Pacific Warm Pool (IPWP) is the warmest and most dynamic ocean-atmosphere-climate system on Earth and has undergone significant climatic changes during the Pleistocene glacial periods (De Deckker et al., 2012; Lea et al., 2000; Russell et al., 2014). During the Last Glacial Maximum, the latitudinal position of the Southern Ocean fronts, both south of Africa and Australia, was shown to be critical in controlling the outflow of warm water of the Agulhas Current from the Indian Ocean and the IPWP area. Yet, there is no direct evidence for such oceanic change on the scale of the Late Pleistocene glacial-interglacial transitions.

Here, we combine sea surface temperature proxies (d18O and Mg/Ca) with the neodymium (Nd) isotopic signature to reconstruct changes in climate and oceanic circulation in the eastern tropical Indian Ocean over the last 500 ka. The most striking feature of our dataset is the oscillating Nd signal that mimics the glacial-interglacial cycles. While interglacial periods are characterized by a more significant contribution from the less radiogenic Antarctic intermediate water mass (AAIW, ~ -7 εNd), glacial periods are marked by more radiogenic water mass of Pacific origin (~ -5 εNd). We argue that under global cooling, the northward penetration of the AAIW has weakened due to the general slowdown of the global thermohaline circulation. Furthermore, the oscillating pattern is also recorded in the sea surface temperature and salinity, indicating the settlement of cooler and more saline surface water masses probably linked to a less expanded IPWP and weaker Leeuwin Current during glacial intervals.

We suggest that under low AAIW a less intense advective mixing occurred, allowing a deepening of both halocline and thermocline in the tropical eastern Indian Ocean. Our new proxy-derived dataset confirms results from models (DiNiezo et al., 2018), suggesting that these ocean conditions could amplify the externally forced climate changes resulting from drier atmospheric conditions and weaken the monsoon during glacial periods in the Indonesian region.

How to cite: Le Houedec, S., Tremblin, M., Champion, A., and Samankassou, E.: Changes in intermediate circulation waters along the tropical eastern Indian Ocean during quaternary climatic oscillations, EGU General Assembly 2023, Vienna, Austria, 23–28 Apr 2023, EGU23-2105, https://doi.org/10.5194/egusphere-egu23-2105, 2023.

EGU23-2802 | Orals | CL1.1.3 | Highlight

The Cenozoic sea surface temperature evolution offshore Tasmania 

Peter Bijl, Frida Hoem, Suning Hou, Lena Thöle, Isabel Sauermilch, and Francesca sangiorgi

During the Cenozoic (66–0 Ma) Tasmania has continuously been at a crucial geographic location. It represented the final tectonic connection between Australia and Antarctica before complete separation of both continents in the late Eocene, and therefore a barrier for circumpolar flow. Since the Eocene-Oligocene transition, the northward drifting Tasmania was bathed by the throughflow of the subtropical front, but remained an obstacle of the ideal flow path of strengthening ocean currents. The sedimentary record around Tasmania thus represents a perfect archive to record the oceanographic consequences of this regional tectonic change. We here present a new TEX86 and UK37-based SST compilation from 4 sediment cores: ODP Site 1172 (East Tasman Plateau), Site 1170 and 1171 (South Tasman Rise) and Site 1168 (western Tasman margin). We paired these reconstructions with microplankton (dinoflagellate cyst) assemblage data which reflect qualitatively the surface water conditions: nutrients, temperature, salinity. Together, the >1.300 samples portray the SST evolution around the island, from the time it was still connected to the Antarctic continent in the Paleocene to its near-subtropical location today. Trends in the SST compilation broadly follow those in benthic foraminiferal stable isotope compilations, but with some interesting deviations. Differences in SSTs on either side of the Tasmanian Gateway are small in the early Paleogene (66–34 Ma), even when the Tasmanian Gateway is considered closed. Widening of the Tasmanian Gateway around the Eocene-Oligocene transition (34Ma) immediately allows throughflow of what later becomes the Leeuwin Current, which warms the sw Pacific. Oligocene and Neogene SST trends follow those of the benthic d18O, and with continuous influence of the proto-subtropical front. While the SST evolution of Tasmania is remarkably stable in most of the Oligocene, prominent cooling steps are inferred in the Late Oligocene (26 Ma), at the MMCT (~14 Ma), in the mid-to-late Miocene (9 Ma, 7 Ma and 5.3 Ma) and in the Pliocene (2.8 Ma). The remarkably strong Neogene cooling of the subtropical front implies expansion of subpolar temperate conditions and probably gradual strengthening of the Antarctic circumpolar current. Pliocene-Pleistocene SST variability is strong over glacial-interglacial cycles. Taken together, the sites portray a complete overview of local environmental change of the subtropical front area, and provides crucial context to the history of Southern Ocean heat transport and regional climate.

How to cite: Bijl, P., Hoem, F., Hou, S., Thöle, L., Sauermilch, I., and sangiorgi, F.: The Cenozoic sea surface temperature evolution offshore Tasmania, EGU General Assembly 2023, Vienna, Austria, 23–28 Apr 2023, EGU23-2802, https://doi.org/10.5194/egusphere-egu23-2802, 2023.

Late Quaternary clay mineral assemblages, radiogenic isotope, and siliciclastic grain size records collected from high sedimentation Site U1483 of the International Ocean Discovery Program (IODP), beneath the path of the modern-day Indonesian Throughflow (ITF) and Leeuwin Current of northwest Australia are studied to reconstruct sediments provenance, transport processes and ocean current behavior, and to evaluate the Australian summer monsoon over the last 500 kyr. Clay minerals are primarily composed of smectite (41–70 %), followed by kaolinite (10–28 %), illite (13.5–25 %), and minor chlorite (3–14 %). Our reconstructed model based on the clay minerals source comparison and radiogenic isotope (Sr-Nd-Pb) records suggest the Victoria and Ord rivers of the Kimberley region as the source over the past 500 kyr for Site U1483. Smectite is mainly derived from the mafic volcanic and smectite-rich Bonaparte Gulf, whereas kaolinite and illite are primarily derived from felsic igneous and metamorphic rocks, respectively, found in the drainage areas of these rivers. Chlorite is primarily contributed by the Indonesian Throughflow (ITF), with a minor contribution from the northwest Australian rivers. Variations in the clay mineral assemblages and grain size records indicate strong glacial-interglacial cyclicity, with small grain size, high smectite, and low kaolinite and illite during glacial periods, while interglacial intervals are marked by a relative increase in kaolinite and illite, mean grain size, and decrease in smectite content. (Kaolinite+illite+chlorite)/smectite and kaolinite/smectite ratios are adopted as proxies for the ITF strength and Australian summer monsoon, respectively. High values of kaolinite/smectite and (kaolinite+illite+chlorite)/smectite ratios during the interglacial intervals indicate a wet summer monsoon with high river discharge and a strong ITF and Leeuwin Current, which has the capacity to transport a relatively high percentage of large-size kaolinite and illite sediments to Site U1483. In contrast, during glacials, the low values of kaolinite/smectite and (kaolinite+illite+chlorite)/smectite ratios imply a dry summer monsoon with low sediment discharge and weak ITF and Leeuwin Current, which can majorly carry the small smectite size particles in its suspension. The mean grain size and clay/silt ratio also indicate that the strength of ITF and Leeuwin Current was weak during glacials and gained high strength during the interglacials. The proxy records’ spectral analysis indicates a strong eccentricity period of 100-kyr, an obliquity period of 41-kyr, and a precession period of 23-kyr, implying that the clay mineral input along the northwest Australian margin is influenced by both high-latitude ice sheet forcing and low-latitude tropical processes.

How to cite: Sarim, M. and Xu, J.: Late Quaternary glacial-interglacial variability of the Indonesian Throughflow and Australian summer monsoon: Evidences from clay mineral and grain size records at IODP Site U1483 of northwest Australia, EGU General Assembly 2023, Vienna, Austria, 23–28 Apr 2023, EGU23-3430, https://doi.org/10.5194/egusphere-egu23-3430, 2023.

EGU23-5655 | ECS | Orals | CL1.1.3

Astronomically-paced changes in paleoproductivity, winnowing, and mineral flux over Broken Ridge (Indian Ocean) since the Early Miocene 

Jing Lyu, Sofía Bar­ra­gán-Mon­til­la, Gerald Auer, Or Bialik, Beth Christensen, and David De Vleeschouwer

Earth’s climate during the Neogene period changed in several steps from a planet with unipolar ice sheets to today’s bipolar configuration. Yet, time-continuous and well-preserved sedimentary archives from this time interval are scarce. This is especially true for those records that can be used for tracing the role of astronomical climate forcing. Ocean Drilling Program (ODP) Site 752 was drilled on Broken Ridge (Indian Ocean) and provides a time-continuous sedimentation history since the early Miocene in its upper portion.  To date, no astronomical-scale paleoclimate research has been conducted on this legacy ODP site. Here, we use X-ray fluorescence (XRF) core scanning data and benthic foraminifera (BF) taxonomic and quantitative analyses to reconstruct the paleoceanographic changes in the Indian Ocean since 23 Ma. Productivity-related elements from the XRF dataset, show higher productivity during the early Miocene and late Pliocene/early Pleistocene. Moreover, we found strong 405-kyr and ~110-kyr eccentricity imprints in the spectral analysis result of this XRF-derived paleoproductivity proxy. Although the precession signal is also quite remarkable in the spectral analysis results, the 4-cm resolution may not be adequate to further test the precession contribution. Bottom water oxygenation reconstructed using BF, suggest no oxygen minimum zone conditions for the late Miocene on site 752. Dissolved oxygen concentrations (DOC) indicate low oxic conditions (⁓ 2 ml/L) during this time, and relatively low stress species distribution (< 32%) along with abundant oxic species like H. boueana, C. mundulus, L. pauperata and Gyroidinoides spp. suggest predominantly high oxic conditions during the late Miocene (DOC > 2 ml/L). Meanwhile, the grain size (> 425µm) record shows an increasing trend at ~5 Ma, which indicates more current winnowing. Therefore, we argue that the drop in Mn is the result of the increase in the current winnowing, instead of the OMZ expansion. On the other hand, high-amplitude changes in Fe content from the lower Miocene to the middle Miocene, cannot be explained by eolian input, suggesting the source might be the neighbor-distanced Amsterdam-St. Paul hot spot. The source of Fe might be the neighbor-distanced Amsterdam-St. Paul hot spot. We conclude that the legacy ODP Site 752 constitutes an excellent paleoceanographic archive that allows us to reconstruct Indian Ocean dynamics since the early Miocene. New drillings on Broken Ridge with state-of-the-art scientific ocean drilling techniques will provide more detailed information and be highly beneficial for paleoclimatic and paleoceanographic research.

How to cite: Lyu, J., Bar­ra­gán-Mon­til­la, S., Auer, G., Bialik, O., Christensen, B., and De Vleeschouwer, D.: Astronomically-paced changes in paleoproductivity, winnowing, and mineral flux over Broken Ridge (Indian Ocean) since the Early Miocene, EGU General Assembly 2023, Vienna, Austria, 23–28 Apr 2023, EGU23-5655, https://doi.org/10.5194/egusphere-egu23-5655, 2023.

The Early Middle Pleistocene Transition (EMPT) represents a fundamental reorganization in Earth’s climate system as the obliquity-dominated glacial/interglacial rhythmicity characterizing the Quaternary got progressively replaced by a high-amplitude, quasi-periodic 100 kyr cyclicity. This critical change in the climatic response to orbital cycles occurred without proportional modifications in the orbital-forcing parameters before or during the EMPT, implying a substantial change internal to the climate system. The EMPT had a severe impact on marine ecosystems. However, the trigger mechanisms and the components of the climate system involved in this global reorganization are still under debate, and high-resolution studies from the equatorial to mid-latitude shelf regions are at present rarely available.

In this study, we analyze the benthic foraminifera assemblage of an expanded section from Site U1460 (eastern Indian Ocean, 27°22.4949′S, 112°55.4296′E, 214.5 meters water depth), collected during International Ocean Discovery Program (IODP) Expedition 356 on the southwestern Australian shelf covering the EMPT. At this site, we provide a new benthic and planktonic foraminifera dataset to better define the response of the Leeuwin Current System during the EMPT on low to mid latitude shelf regions that are strongly sensitive to glacial/interglacial sea-level oscillations. Specifically, benthic foraminifera assemblage and the plankton/benthos (P/B) ratio are used to understand the bottom water community and its reaction to the Leeuwin Current System variations during the EMPT. Additionally, these data will untangle the local impact of eustatic sea-level changes in a highly dynamic setting.

Preliminary data of the microfossil content revealed a polyspecific benthic foraminifera assemblage with high diversity. The most abundant taxa are trochospiral forms (e.g., Cibicides, Cibicidoides, Heterolepa, Nuttallides, Eponides). Triserial and biserial taxa are abundant (e.g., Textularia, Spirotextularia, Gaudryina, Bolivina, Uvigerina). Planispiral tests such as Melonis and Lenticulina are also commonly present, as well as uniserial ones such as Siphogenerina, Lagena, and Cerebrina. Preservation varies significantly between glacial and interglacial intervals. Particularly, benthic foraminifera are poorly to moderately preserved during glacial stages while exhibiting moderate to good preservation in the interglacials. The variations in the P/B ratio allowed to constrain the sea-level changes along the Australian shelf. Specifically, higher and lower values of this ratio indicate highstand and lowstand phases, respectively. In this regard, foraminifera data will be integrated in a multiproxy dataset available for Site U1460 to obtain new insights on sea-level-driven environmental changes in the area during the EMPT. This, in turn, will allow to resolve the impact of local versus global climatic change across the studied interval.

How to cite: Arrigoni, A., Auer, G., and Piller, W. E.: The Leeuwin Current System during the Early Middle Pleistocene Transition (EMPT): foraminiferal assemblage and sea level reconstruction, EGU General Assembly 2023, Vienna, Austria, 23–28 Apr 2023, EGU23-5891, https://doi.org/10.5194/egusphere-egu23-5891, 2023.

EGU23-7477 | Orals | CL1.1.3 | Highlight

Pliocene-Pleistocene evolution of the Agulhas leakage to the Atlantic Ocean 

Erin McClymont, Thibaut Caley, Christopher Charles, Aidan Starr, Maria Luisa Sanchez Montes, Martin West, Linda Rossignol, Ian Hall, and Sidney Hemming

The Agulhas leakage is an important contributor to the global thermohaline conveyor system, adding warm and saline subtropical waters from the Indian Ocean to the South-east Atlantic Ocean. It has been proposed that weaker Agulhas leakage occurred during glacial stages, but that leakage was reinvigorated during deglaciations and was, in turn, potentially important for the development of interglacial warmth.

Little is known about the longer-term evolution of Agulhas leakage during the Pliocene and Pleistocene (the last 5.3 Ma). In the Pliocene, the continental ice sheets were smaller in size, and the position and strength of key ocean and atmosphere circulation systems in the South Atlantic region were different. The Pliocene is also characterised by a series of gateway changes which are argued to have affected North Atlantic climate, but the response of the Agulhas leakage system remains unclear. It is also unclear whether the ‘early deglaciation’ signal is a specific component of the late Pleistocene 100 kyr cycles. Identifying how and when this signal developed could have important implications for understanding the impact of ocean circulation changes on the development of the mid-Pleistocene climate transition (MPT) ~1.2-0.6 Ma, when the period of the glacial-interglacial cycles shifted from ~41 kyr to ~100 kyr.

Here we present initial results from a new Cape Basin site (Site U1479, 35°03.53′S; 17°24.06′E), which was recovered by IODP Expedition 361 in 2016 from the western slope of the Agulhas Bank (Hall et al., 2016). We combine reconstructions of sea surface temperatures (using the alkenone-derived UK37’ index) and sea surface salinity (from alkenone dD analysis) with details of planktonic foraminifera assemblages, to identify and understand variability in Agulhas leakage operating across both orbital and longer timescales. There is an overall cooling of ~4°C since the Pliocene, but it is focussed around ~2 Ma and from 1.2 Ma. Orbital scale and longer-term variability in SST, sea surface salinity and Agulhas leakage fauna are also determined, demonstrating that the Agulhas leakage system has evolved across a range of timescales through the Plio-Pleistocene, especially in association with the MPT.

References

Hall, I.R., Hemming, S.R., LeVay, L.J., and the Expedition 361 Scientists, 2016. Expedition 361 Preliminary Report: South African Climates (Agulhas LGM Density Profile). International Ocean Discovery Program. http://dx.doi.org/10.14379/iodp.pr.361.2016

How to cite: McClymont, E., Caley, T., Charles, C., Starr, A., Sanchez Montes, M. L., West, M., Rossignol, L., Hall, I., and Hemming, S.: Pliocene-Pleistocene evolution of the Agulhas leakage to the Atlantic Ocean, EGU General Assembly 2023, Vienna, Austria, 23–28 Apr 2023, EGU23-7477, https://doi.org/10.5194/egusphere-egu23-7477, 2023.

EGU23-7924 | ECS | Orals | CL1.1.3

Mid-Pliocene subtropical front variability in the Southern Ocean 

Suning Hou, Malte Stockhausen, Leonie Toebrock, Francesca Sangiorgi, Aidan Starr, Melissa Berke, Martin Ziegler, and Peter Bijl

The mid-Pliocene (3.3-3.0 Ma) is a time when the Earth's climate fluctuated between cold glacial conditions (marine isotope stage M2; 3.3 Ma) and periods when global temperatures were ~3°C warmer than the pre-industrial (Mid-Pliocene warm period; 3.3-3.025 Ma) when CO2 concentrations reached ~400 ppm. Thus, the paleoclimate reconstruction of this time interval provides an analogue of the present-day and near-future climate change in a moderate pCO2 increase scenario. Although fluctuations in benthic δ18O in the mid-Pliocene were predominantly associated with Northern Hemisphere glacial dynamics, the contribution of Antarctic ice to mid-Pliocene glacial-interglacial cyclicity is unknown. Moreover, the surface oceanographic response of the Southern Ocean to Pliocene glacial-interglacial climate change is poorly documented

We studied 2 sedimentary records from offshore west Tasmania (ODP Site 1168) and the Agulhas Plateau (IODP Site U1475), both located close to the modern position of the subtropical front (STF) in the Southern Ocean and encompassing the mid-Pliocene. The STF is a crucial surface water mass boundary separating cold, fresher subantarctic waters and warm, more saline subtropical waters and plays a key role in global ocean circulation, ocean-atmosphere CO2 exchange and meridional heat transport.

We use lipid biomarkers, dinoflagellate cyst assemblages and benthic foraminiferal clumped isotopes to reconstruct surface and bottom oceanographic conditions over the mid-Pliocene including the M2 glaciation. We identify similar sea surface temperature (SST) changes at the two sites. Site 1168 SST cools from 18°C to 12°C and at Site U1475 from 21°C to 18°C across the M2 glaciation. Dinoflagellate cyst assemblages suggest strong latitudinal shifts of the subtropical front associated to Pliocene glacial-interglacial climate changes. However, the most profound assemblage shift occurs at the M2 deglaciation stage at both sites, suggesting strong and unprecedented surface water freshening. Preliminary clumped isotope results suggest bottom water temperatures at Site 1168 are stable around 9°C between M2 and mid-Piacenzian warm period, indicating that the enrichment in δ18O across the M2 is mainly contributed by large ice volume changes. We interpret the surface water freshening of the subantarctic zone as signaling major iceberg calving following the M2 glaciation, suggesting that the Antarctic contribution to the M2 glaciation was profound.

How to cite: Hou, S., Stockhausen, M., Toebrock, L., Sangiorgi, F., Starr, A., Berke, M., Ziegler, M., and Bijl, P.: Mid-Pliocene subtropical front variability in the Southern Ocean, EGU General Assembly 2023, Vienna, Austria, 23–28 Apr 2023, EGU23-7924, https://doi.org/10.5194/egusphere-egu23-7924, 2023.

EGU23-9653 | Posters on site | CL1.1.3

Using Legacy Data to Explore the Onset and Development of the Southern Hemisphere Supergyre 

Beth Christensen, Anna Joy Drury, Gerald Auer, David DeVleeschouwer, and Jing Lyu

The Southern Hemisphere Supergyre refers to the strong connections and intertwining of the southern subtropical gyres. Tasman Leakage is a fundamental part of the supergyre, as well as of the  global thermohaline circulation, as it provides a return flow from the Pacific and Indian Oceans to the North Atlantic at intermediate depths.   However, both are only relatively recently documented, and the timing and conditions of onset are not well understood.

This study characterizes the newly identified onset of Tasman Leakage in sedimentary records in and around the Indian Ocean using core descriptions and data derived from sediments.  Since much of this is legacy core material, core photographs were used to develop complementary and more continuous records to help refine the timing of onset.  These newly constructed time series based on core photographs are compared with X-ray Fluorescence time series based on core scanning provide both insight into onset of Tasman Leakage and a first test of the utility of time series based on core photos.

This effort will focus on the intermediate water pathway associated with Tasman Leakage and identify conditions at critical around the basin from at least 8 Ma at Broken Ridge and Mascarene Plateau to understand the role of Indian Ocean intermediate waters in the Southern Hemisphere Supergyre in major climate events of the late Miocene. 

This proposed work provides the first synoptic view of SHS onset using intermediate depth cores, which in turn will provide an important framework for basin-wide synthesis of Indian Ocean drilling, much of which is outside of the main pathway of the SHS.  It will also serve as a test of the utility of legacy material as primary data.

How to cite: Christensen, B., Drury, A. J., Auer, G., DeVleeschouwer, D., and Lyu, J.: Using Legacy Data to Explore the Onset and Development of the Southern Hemisphere Supergyre, EGU General Assembly 2023, Vienna, Austria, 23–28 Apr 2023, EGU23-9653, https://doi.org/10.5194/egusphere-egu23-9653, 2023.

A collapse of the Atlantic Meridional Overturning Circulation (AMOC) could drive widespread changes in tropical rainfall, but the underlying physical mechanisms are poorly understood. Numerical simulations validated against hydroclimate changes during Heinrich Stadial 1(HS1) – the most recent, best-documented AMOC collapse – show a global response driven by cooling over the tropical North Atlantic. This pattern of ocean cooling is key to link changes in rainfall across the tropics with the reductions in AMOC strength. Cooling over the tropical North Atlantic drives changes over the Pacific and Indian oceans that uniquely explain the paleoclimatic evidence. A similar response is active in simulations of future greenhouse warming, but model disagreement regarding the pattern of AMOC-induced tropical cooling produces divergent rainfall predictions across the tropics. Models with responses consistent with the paleodata predict more pronounced rainfall reductions across the tropics, revealing a heightened risk of drought over vulnerable societies and ecosystems worldwide.

How to cite: DiNezio, P.: The tropical response to a collapse of the Atlantic Meridional Overturning Circulation, EGU General Assembly 2023, Vienna, Austria, 23–28 Apr 2023, EGU23-10410, https://doi.org/10.5194/egusphere-egu23-10410, 2023.

EGU23-11089 | Posters on site | CL1.1.3

Understanding the Changes in the Post-Glacial Depositional Environments through High-resolution Geochemical Proxies in the Central Yellow Sea 

Jin Hyung Cho, Byung-Cheol Kum, Seok Jang, Cheolku Lee, Seunghun Lee, Young Baek Son, and Seom-Kyu Jung

Sediment cores (A10 and I06) were analyzed using a high-resolution X-ray fluorescence (XRF) core scanner to understand changes in paleo-sedimentary environments of the study area. Age dating reflects environmental changes from interglacial marine isotope stage 3 (MIS 3) through the last glacial maximum (LGM; MIS 2) to the Holocene. Three layers were identified in the seismic profiles as follows: unit 1 (thickness = ca. 5 m) in a homogeneous sedimentary phase; unit 2 formed by erosion; unit 3, which is parallel and continuous. XRF elemental proxy data indicate anomalous distributions of Ca/Fe, Ca/K, and Fe/Ti caused by organic substances that appear at several depths in the A10 core. Results show that the seafloor was exposed to air during the LGM. The I06 core shows characteristic anomalies at depths of 0.8, 1.5, and 2.5 m, which were caused by sediments supplied from surrounding rivers.

How to cite: Cho, J. H., Kum, B.-C., Jang, S., Lee, C., Lee, S., Son, Y. B., and Jung, S.-K.: Understanding the Changes in the Post-Glacial Depositional Environments through High-resolution Geochemical Proxies in the Central Yellow Sea, EGU General Assembly 2023, Vienna, Austria, 23–28 Apr 2023, EGU23-11089, https://doi.org/10.5194/egusphere-egu23-11089, 2023.

EGU23-11804 | ECS | Posters on site | CL1.1.3

Late Cenozoic oxygenation of the Pacific Ocean, a perspective from planktic foraminiferal I/Ca 

Katrina Nilsson-Kerr, Babette Hoogakker, Dharma Andrea Reyes Macaya, and Helge Arne Winkelbauer

The Pacific Ocean hosts one of the most extensive areas of oxygen deficient waters at present with well-defined areas of oxygen minima existing both north and south of the equator along the eastern basin. This deficiency in oceanic O2 concentrations is mainly due to a combination of upwelling induced high primary productivity and poorly ventilated intermediate waters. Across the Miocene-Pliocene the Pacific Ocean is thought to have been distinctly different with an elevated water column temperature profile, reduced Walker circulation, active deep-water formation in the north Pacific, high primary productivity, and differences in its fundamental configuration with gateway changes occurring at the eastern and western margins. Collectively, and individually, these different factors will have had implications on Pacific Ocean O2 distribution. To better understand the past oxygenation of Pacific waters amidst this backdrop of climatic and geographical changes we reconstruct iodine/calcium ratios from planktic foraminifera across multiple Pacific Ocean sites. Our I/Ca records extending from the mid-late Miocene through to Pleistocene show the progressive reduction in oceanic O2 content across the Pacific. We place these records in the context of changes in the Central American Seaway and the resultant changes in oceanic circulation.

How to cite: Nilsson-Kerr, K., Hoogakker, B., Reyes Macaya, D. A., and Winkelbauer, H. A.: Late Cenozoic oxygenation of the Pacific Ocean, a perspective from planktic foraminiferal I/Ca, EGU General Assembly 2023, Vienna, Austria, 23–28 Apr 2023, EGU23-11804, https://doi.org/10.5194/egusphere-egu23-11804, 2023.

EGU23-12026 | Posters on site | CL1.1.3

Microfossil-based reconstruction of latitudinal thermal gradients in the Southern Ocean during MIS11c 

Iván Hernández-Almeida, Janik Hirt, and Johan Renaudie

The Southern Ocean (SO) is a region particularly sensitive to the anthropogenic global warming because of the raising ocean temperatures, leading to latitudinal shifts of oceanographic fronts which govern the position of the South Westerly Winds (SWW) in the SO. Sediments represent a natural climate archive that allows to observe changes in Earth’s systems only affected by natural forcing. In this sense, Marine Isotope Stage (MIS) 11c (∼426–396 ka) is the most similar climate state to the ongoing climate warming that we are facing today, but quantiative climate reconstructions in the SO for this period are scarce. Radiolarians (zooplankton) live in a wide range of depths in the water column and are very abundant in sediments throughout the Neogene in the SO.  Recent radiolarian databases and transfer functions for the SO (Lawler et al. 2021; Civel-Mazens et al. 2022) enable reconstructing quantitatively past climate. For this, three sediment cores, drilled during IODP Expedition 382 and located along latitudinal gradient in the Atlantic sector of the SO (between 53.2°S and 59.4°S), were studied for their fossil radiolarian assemblage composition for the interval corresponding to MIS 11c. Application of the newly developed radiolarian transfer functions to the fossil radiolarian assemblages in these three cores enabled the reconstruction of ocean temperatures and thermal gradients in the SO during MIS 11c. These reconstructions will be used also to infer the position of the oceanographic frontal zones and the position of the SWW in this sector of the SO in the past, which are important for promoting upwelling nutrient rich bottom waters and degassing of deeply sequestered CO2 during the interglacial maxima.

References:

Civel-Mazens, M., Cortese, G., Crosta, X., Lawler, K. A., Lowe, V., Ikehara, M., & Itaki, T. (2022). New Southern Ocean transfer function for subsurface temperature prediction using radiolarian assemblages. Marine Micropaleontology, 102198.

Lawler, K. A., Cortese, G., Civel-Mazens, M., Bostock, H., Crosta, X., Leventer, A., & Armand, L. K. (2021). The Southern Ocean Radiolarian (SO-RAD) dataset: a new compilation of modern radiolarian census data. Earth System Science Data, 13(11), 5441-5453.

How to cite: Hernández-Almeida, I., Hirt, J., and Renaudie, J.: Microfossil-based reconstruction of latitudinal thermal gradients in the Southern Ocean during MIS11c, EGU General Assembly 2023, Vienna, Austria, 23–28 Apr 2023, EGU23-12026, https://doi.org/10.5194/egusphere-egu23-12026, 2023.

EGU23-12214 | Posters on site | CL1.1.3

Middle to Late Miocene responses of primary producers to monsoonal upwelling in the western Arabian Sea 

Gerald Auer, Or M Bialik, Mary-Elizabeth Antoulas, and Werner E Piller

Today, the western Arabian Sea represents one of the most productive marine areas in the world. The high productivity in this region is governed by upwelling related to the intensity of the South Asian Monsoon (SAM). Previous studies show that high productivity has prevailed since the late Early Miocene (~15 Ma) after establishing a favorable tectonic configuration in the region. Existing productivity records have further demonstrated that upwelling intensity varied in the western Arabian Sea over different time scales. This variability has been attributed mainly to changing monsoonal upwelling intensity linked to global climatic changes. However, the abundance and contribution of individual primary producers (calcareous nannoplankton and diatoms) have never been studied in the context of upwelling and SAM changes. To fully disentangle the variability in the context of local upwelling changes and nutrient availability at ODP Site 722B, we link assemblage-based primary productivity records to the established multi-proxy framework in the region. Quantitative nannofossil assemblage records and absolute diatom abundances are examined in conjunction with existing and new planktonic foraminifer data to better constrain the temporal variation in productivity in the western Arabian Sea.

In our record, the first increase in cool and eutrophic nannofossil taxa (i.e., Coccolithus pelagicus and Reticulofenestra pseudoumbilicus) corresponds to the initial phase of sea surface temperatures (SST) cooling ~13.4 Ma. By ~12 Ma, rare occurrences of diatoms frustules correspond to the maximum abundances of Reticulofenestra haqii and Reticulofenestra antarctica, indicating higher upwelling derived nutrient levels. However, these changes ~12 Ma occur in the absence of coeval high latitude cooling, as shown by deep-sea benthic oxygen isotope records. By 11 Ma, diatom abundance increases significantly, leading to alternating blooms of upwelling sensitive diatom species (Thalassionema spp.) and eutrophic nannoplankton species (e.g., R. pseudoumbilicus). These changes in primary producers are also well reflected in geochemical proxies with increasing δ15Norg. values (> 6‰) and high C/N ratios also confirming high productivity and beginning denitrification at the same time.

Our multi-proxy-based evaluation of Site 722B primary producers thus indicates a stepwise evolution of productivity in the western Arabian Sea related to the intensity of upwelling and forcing SAM dynamics throughout the Middle to Late Miocene. The absence of full correspondence with existing deep marine climate records also suggests that local processes, such as lateral nutrient transport, likely played an important role in modulating productivity in the western Arabian Sea. We show that using a multi-proxy record provides novel insights into how fossil primary producers responded to changing nutrient conditions through time in a monsoon-wind-driven upwelling zone.

How to cite: Auer, G., Bialik, O. M., Antoulas, M.-E., and Piller, W. E.: Middle to Late Miocene responses of primary producers to monsoonal upwelling in the western Arabian Sea, EGU General Assembly 2023, Vienna, Austria, 23–28 Apr 2023, EGU23-12214, https://doi.org/10.5194/egusphere-egu23-12214, 2023.

EGU23-13273 | Posters on site | CL1.1.3

Late Pleistocene-Holocene coccolithophore variations in the Subantarctic South Pacific 

Elisa Malinverno, Mariem Saavedra-Pellitero, Amy Jones, Sofia Cerri, and Tom Dunkley Jones and the IODP-383 Scientific Party

International Ocean Discovery program (IODP) Expedition 383 Dynamics of the Pacific Antarctic Circumpolar Current (DYNAPACC) (Lamy et al., 2019; 2021) drilled a series of cores from the Pacific sector of the Southern Ocean in order to explore atmosphere-ocean-cryosphere glacial-interglacial dynamics their implications for regional and global climate changes. IODP Expedition 383 sites constitute the first continuous drill cores at key locations of the Subantarctic Pacific Southern Ocean extending through the Pleistocene and back into the Pliocene.

Here we focus on coccolith relative and absolute abundance as well as productivity variations for the last 0.5 Million year, in order to understand the nannofloral response to glacial-interglacial cycles and related changes in carbonate production and export. Our data has been generated at IODP Sites U1539 (56°09.0655′S, 115°08.038′W, ~1600 nmi west of the Strait of Magellan at 4070 m water depth) and U1540 (55°08.467′S, 114°50.515′W, ~1600 nmi west of the Strait of Magellan at 3580 m water depth), drilled at a southern and northern location in the central Pacific within the ACC, respectively. Coccolithophore diversity and coccolith numbers change dramatically in the studied cores, ranging from high values during interglacials (up to ca. 1011 coccoliths per gram of sediment, as in MIS11, Saavedra-Pellitero et al., 2017) to low values during the glacials, where they are outcompeted by siliceous microfossils, mostly diatoms.

References

Lamy, F., Winckler, G., Alvarez Zarikian, C.A., and the Expedition 383 Scientists, 2019. Expedition 383 Preliminary Report: Dynamics of the Pacific Antarctic Circumpolar Current. International Ocean Discovery Program. https://doi.org/10.14379/iodp.pr.383.2019

Lamy, F., Winckler, G., Alvarez Zarikian, C.A., and the Expedition 383 Scientists, 2021. Dynamics of the Pacific Antarctic Circumpolar Current. Proceedings of the International Ocean Discovery Program, 383: College Station, TX (International Ocean Discovery Program). https://doi.org/10.14379/iodp.proc.383.2021

Saavedra-Pellitero M., Baumann K.-H., Lamy F., and Köhler P., 2017. Coccolithophore variability across Marine Isotope Stage 11 in the Pacific sector of the Southern Ocean and its potential impact on the carbon cycle. Paleoceanography, 32, 864–880, doi:10.1002/2017PA003156.

How to cite: Malinverno, E., Saavedra-Pellitero, M., Jones, A., Cerri, S., and Dunkley Jones, T. and the IODP-383 Scientific Party: Late Pleistocene-Holocene coccolithophore variations in the Subantarctic South Pacific, EGU General Assembly 2023, Vienna, Austria, 23–28 Apr 2023, EGU23-13273, https://doi.org/10.5194/egusphere-egu23-13273, 2023.

EGU23-17081 | ECS | Posters on site | CL1.1.3

The early to mid-Pliocene latitudinal migration of the Southern Ocean subtropical front (IODP Site U1475, Agulhas Plateau) 

Deborah Tangunan, Ian Hall, Luc Beaufort, Melissa Berke, Leah LeVay, Luz Maria Mejia, Heiko Palike, Aidan Starr, and Jose Abel Flores

The latitudinal migration of the Southern Ocean hydrographic fronts has been suggested to influence oceanographic conditions within the Indian-Atlantic Ocean gateway by restricting the amount of warm, saline water from the Indo-Pacific, transported by Agulhas Current, feeding into the South Atlantic via the Agulhas leakage. The Agulhas Current is an integral part of the global thermohaline circulation system as it acts as potential modulator of the Atlantic Meridional Overturning Circulation, which drives changes in regional and global climate, over at least the last 1.4 million years. However, the dynamics of this frontal system and associated changes in surface ocean biogeochemistry have not been explored beyond this time period due to absence of long continuous records spanning the Pliocene. Using International Ocean Discovery Program Site U1475 located on the southwestern flank of the Agulhas Plateau (41°25.61′S; 25°15.64′E; 2669 m water depth), we present high-resolution palaeoclimate records spanning the early to mid-Pliocene (~2.8 to ~5 Ma), from assemblage composition and morphometry of coccoliths, combined with oxygen and carbon stable isotopes from the bulk coccolith fraction. Our new Pliocene reconstructions offer evidence of the changing position of the subtropical front in the Southern Indian Ocean, driving variations in surface ocean conditions (e.g., nutrients, temperature, stratification), and thus biological productivity. We also explore expressions of coccolith δ13C vital effects from size-separated coccolith fractions together with planktic foraminifer carbon and oxygen stable isotopes from co-registered samples, that have been linked to cell size, growth rate, and calcification degree, providing empirical correlation with aqueous and atmospheric CO2 concentrations.

How to cite: Tangunan, D., Hall, I., Beaufort, L., Berke, M., LeVay, L., Mejia, L. M., Palike, H., Starr, A., and Flores, J. A.: The early to mid-Pliocene latitudinal migration of the Southern Ocean subtropical front (IODP Site U1475, Agulhas Plateau), EGU General Assembly 2023, Vienna, Austria, 23–28 Apr 2023, EGU23-17081, https://doi.org/10.5194/egusphere-egu23-17081, 2023.

EGU23-1862 | ECS | Posters on site | CL1.1.4

Steady subtropical terrestrial aridity since Pangea 

Zhibo Li and Yongyun Hu

Modern terrestrial aridity affects billions of peoples’ lives and is projected to be severe in a warming future. Former works concentrated on aridity changes in the future, while deep-time paleoclimate simulations and proxies provide a new perspective for us to fully understand the evolution of terrestrial aridity. Distributions of arid and humid regions have strong implications for the existence of geological proxies, such as evaporites and coals. A systematic study of the land-sea distribution and aridity evolution has strong benefits to both science and industry. Here, we use Community Earth System Model version 1.2.2 (CESM 1.2.2) to investigate the evolution of terrestrial aridity since the supercontinent Pangea period. Simulation results show that the terrestrial arid regions are always concentrated in the subtropics, and the larger the subtropical land, the larger the arid region. During the Cretaceous when the Pangea breaks up completely, the arid/semi-arid area decreases evidently. The semi-arid area is proven to significantly expand under CO2-induced global warming, which is due to the dominant contribution from enhanced potential evapotranspiration. It is concluded that the geologic evolution of terrestrial aridity is dominated by subtropical land area, then by land fragmentation and CO2 concentrations.

How to cite: Li, Z. and Hu, Y.: Steady subtropical terrestrial aridity since Pangea, EGU General Assembly 2023, Vienna, Austria, 23–28 Apr 2023, EGU23-1862, https://doi.org/10.5194/egusphere-egu23-1862, 2023.

EGU23-2017 | ECS | Orals | CL1.1.4

On the climatic influence of CO2 forcing in the Pliocene 

Lauren Burton, Alan Haywood, Julia Tindall, Aisling Dolan, and Daniel Hill and the PlioMIP2 participants

The Pliocene (~3 million years ago) is of great interest to the palaeoclimate community as a potential palaeoclimate analogue for future climate change. It was the most recent period of sustained warmth above pre-industrial levels, was recent enough to have similar-to-modern continental configuration, and had similar-to-modern atmospheric CO2 concentrations around 400 ppm. If we are to use the Pliocene as a palaeoclimate analogue for our warmer future, it is important to consider the drivers of Pliocene climate change as well as its comparable large-scale climate features.  

We implement a novel, simple linear factorisation method to assess the relative influence of CO2 forcing in Pliocene climate change compared to non-CO2 forcings such as changes to ice sheets, orography and vegetation. Outputs of this method are termed “FCO2” and reflect the relative influence of CO2, where 1 represents wholly dominant CO2 forcing and 0 represents wholly dominant non-CO2 forcing.

The accuracy of the FCO2 method is evidenced by comparison to an energy balance analysis using a method previous used in Pliocene climate research, and the energy balance analysis also adds nuance to the FCO2 results and highlights feedbacks that arise from CO2 forcing.

We apply the FCO2 method to seven models from the PlioMIP2 ensemble (CCSM4-UoT, CESM2, COSMOS, HadCM3, IPSLCM5A2, MIROC4m and NorESM1-F) which are found to be representative of the ensemble in terms of the modelled climate sensitivity and global mean surface air temperature anomaly.

CO2 forcing is found to be the most important driver of surface air temperature change in six of the seven models (global mean FCO2 of ensemble = 0.56), and five of the seven models for sea surface temperature (global mean FCO2 of ensemble = 0.56). CO2 forcing is also the most important driver for precipitation change (global mean FCO2 of ensemble = 0.51), but spatial patterns in precipitation change are predominantly driven by non-CO2 forcings and the effects of these must not be overlooked.

CO2 forcing being the most important driver of change in the climate variables considered here suggests that the Pliocene is a relevant analogue for our warmer future, but attention must also be paid to the significant effects of non-CO2 forcing in the Pliocene which may be less analogous to the present and near-term future.

Our results also have implications for the interpretation of Pliocene proxy data and data-model comparison. For example, by assessing FCO2 in regions with large data-model discord it could become possible to highlight where the implementation of boundary conditions is largely responsible for the discord and, hence, where model boundary conditions should be modified. Given the spatial and latitudinal patterns seen in the FCO2 results, it may also be possible to suggest new sites from which additional proxy data would be most useful.

How to cite: Burton, L., Haywood, A., Tindall, J., Dolan, A., and Hill, D. and the PlioMIP2 participants: On the climatic influence of CO2 forcing in the Pliocene, EGU General Assembly 2023, Vienna, Austria, 23–28 Apr 2023, EGU23-2017, https://doi.org/10.5194/egusphere-egu23-2017, 2023.

One of the prominent features of the Cretaceous/Paleocene (K-Pg) mass extinction is the highly selective extinction of marine phytoplankton. It is generally thought that the disturbances in the marine biogeochemical processes were caused by the asteroid impact in the Yucatan and/or the Deccan volcanism. However, which one is dominant remains debated. Here, we use Community Earth System Model (CESM1.2.2) to explore their influences on the latest Cretaceous marine biosphere. It is found that the asteroid impact led to a decrease by ~32% in the calcareous algae but an increase of ~95% in the diatom, consistent with the divergent trends of the abundance of calcium carbonate and biogenic silica archived in marine sediments. The rapid decline of the calcareous algae was because of lowered temperature and decreased light due to the asteroid impact, whereas the increase of diatoms was induced by the input of impact-generated debris and enhanced vertical mixing of the surface ocean, both of which increased nutrient supply. The counteraction between calcareous algae and diatom, to some extent, ensured the resilience of the bulk ocean biogeochemical cycle to the asteroid impact in the latest Cretaceous, with the total biomass increasing by ~2.7%. In comparison, the long-term forcing  (CO2-induced warming) due to Deccan volcanism reduced 10-20% of all types of phytoplanktons. The trend and magnitude of this change are significantly different from that triggered by the asteroid impact, suggesting that asteroid impact was more likely the primary driver of the selective phytoplankton extinction at the K-Pg boundary.

How to cite: Chen, Y., Zhang, J., Liu, Y., and Hu, Y.: Distinct Responses of Marine Phytoplanktons to the Asteroid Impact and Volcanism at the Cretaceous-Paleogene Boundary (K-Pg), EGU General Assembly 2023, Vienna, Austria, 23–28 Apr 2023, EGU23-2778, https://doi.org/10.5194/egusphere-egu23-2778, 2023.

EGU23-3438 | ECS | Orals | CL1.1.4

High-biased climate sensitivity estimates from mid-Pliocene Warm Period temperatures 

Martin Renoult, Navjit Sagoo, and Thorsten Mauritsen

The warm Pliocene epoch is used to estimate Earth's equilibrium climate sensitivity (ECS), which is the long-term temperature change after a sustained doubling of atmospheric CO2 over pre-industrial levels. Using an emergent constraint on the relationship between mid-Pliocene Warm Period simulated temperatures and ECS, we estimate ECS to be 4.8 K, which is higher than previous studies on the Pliocene. This is partly due to using warmer SST reconstruction than before; a consequence of focusing modelling efforts on the mid-Pliocene warm period. Using the temperatures of a broader period within the Pliocene, we quantify ECS to be 3.1 K. Further uncertainties on proxy data and data-model disagreements are expected to affect ECS estimates. We find that CO2 uncertainties are the main driver of variations in ECS estimates, followed by biases from seasonal temperatures. The bias from polar amplification is apparently small, but could be an overlooked source of error. We conclude that the Pliocene-based emergent constraint is nonetheless robust and is likely to improve further as geological reconstructions improve.

How to cite: Renoult, M., Sagoo, N., and Mauritsen, T.: High-biased climate sensitivity estimates from mid-Pliocene Warm Period temperatures, EGU General Assembly 2023, Vienna, Austria, 23–28 Apr 2023, EGU23-3438, https://doi.org/10.5194/egusphere-egu23-3438, 2023.

EGU23-3804 | Orals | CL1.1.4 | Highlight

The hot and dry climate of the supercontinent Pangea 

Yongyun Hu

The Pangea era was an exceptional phase in Earth’s history. It was characterized by its hothouse climate state and the latest supercontinent. And the supercontinent is South-North oriented, nearly extending from South Pole to North Pole. Geological evidence shows that the climate of the supercontinent Pangea was not only hot but also dry. In this talk, I will show simulation results that the dry climate condition of Pangea was largely due to the broad landmass and its South-North orientation. Such a particular continental configuration resulted in much weaker precipitation in the tropics and extratropics, not only over land but also over ocean, compared with other hot periods in the Phanerozoic. Associated mechanisms of the slower hydrological cycle of the supercontinent Pangea will also be discussed. 

How to cite: Hu, Y.: The hot and dry climate of the supercontinent Pangea, EGU General Assembly 2023, Vienna, Austria, 23–28 Apr 2023, EGU23-3804, https://doi.org/10.5194/egusphere-egu23-3804, 2023.

EGU23-3808 | Posters on site | CL1.1.4

Abnormal local warming after reducing solar constant under special paleogeography configurations 

Mengyu Wei, Jun Yang, Yongyun Hu, Xiang Li, Jiawenjing Lan, Jiaqi Guo, and Shineng Hu

In the deep past the solar constant was lower than present. In this study, we employ the Community Earth System Model version 1.2.2 (CESM1.2.2) to examine the effect of reduced solar constant on the climate of the past 250 million years. Two groups of slice experiments (fixed pre-industrial solar constant versus decreased solar constant) with 26 different paleogeography configurations and with fixed CO2 concentration (2800 ppmv) were run. In all the experiments, the global-mean surface temperature decreases as reducing the solar constant, consistent with previous studies. However, there is significant local surface warming in the experiments of 70 Ma, 90 Ma, and 150 Ma. The warming has a magnitude of about 2 K and occurs in the sub-polar ocean region. At 70 Ma and 90 Ma, the dominant mechanism is atmospheric teleconnection between tropics and sub-polar regions. Cooling in the tropics induces abnormal atmospheric waves, and the waves propagate to the sub-polar region and subsequently change surface winds there. The abnormal winds cause an increased poleward ocean heat transport, warming the regional surface. The second mechanism is that the reducing solar constant shifts the westly jets equatorward and causes an eastern wind anomaly, which also explains the warming at 150 Ma. Moreover, positive thermohaline feedback related to enhanced surface evaporation enhances the thermohaline circulation and thereby acts to further warm the surface. The phase of the atmospheric waves and their propagation path strongly depend on the land-sea configurations, so the abnormal local warming occurs in special periods only.

How to cite: Wei, M., Yang, J., Hu, Y., Li, X., Lan, J., Guo, J., and Hu, S.: Abnormal local warming after reducing solar constant under special paleogeography configurations, EGU General Assembly 2023, Vienna, Austria, 23–28 Apr 2023, EGU23-3808, https://doi.org/10.5194/egusphere-egu23-3808, 2023.

EGU23-3814 | ECS | Orals | CL1.1.4

South Asian summer monsoon enhanced by the uplift of Iranian Plateau in Middle Miocene 

Meng Zuo, Yong Sun, Yan Zhao, Gilles Ramstein, Lin Ding, and Tianjun Zhou

The South Asian summer monsoon (SASM) remarkably strengthened during the Middle Miocene (16-11 Ma), coincident with the rapid uplifts of the Iranian Plateau (IP) and the Himalaya (HM). Although the development of the SASM has long been linked to the topographic changes in the Tibetan Plateau (TP) region, the effects of the HM and IP uplift are still vigorously debated, and the underlying mechanisms remain unclear. Based on Middle Miocene paleogeography, we employ the fully coupled earth system model CESM to perform a set of topographic sensitivity experiments with altered altitudes of the IP and the HM. Our simulations reproduce the strengthening of the SASM in northwestern India and over the Arabian Sea, largely attributing to the thermal effect of the IP uplift. The elevated IP insulates the warm and moist airs from the westerlies in the south of the IP and produces a low-level cyclonic circulation around the IP, which leads to the convergence of the warm and moist air in the northwestern India and triggers positive feedback between the moist convection and the large-scale monsoon circulation, further enhancing the monsoonal precipitation. Whereas the HM uplift produces orographic precipitation without favorable circulation adjustment for the SASM. We thus interpret the intensification of the Middle Miocene SASM in the western part of the South Asia as a response to the IP uplift while the subtle SASM change in eastern India reflects the effects of the HM uplift.

How to cite: Zuo, M., Sun, Y., Zhao, Y., Ramstein, G., Ding, L., and Zhou, T.: South Asian summer monsoon enhanced by the uplift of Iranian Plateau in Middle Miocene, EGU General Assembly 2023, Vienna, Austria, 23–28 Apr 2023, EGU23-3814, https://doi.org/10.5194/egusphere-egu23-3814, 2023.

The warmer-than-present (5-10 ℃) climate during the Miocene Climate Optimum (MMCO, approximately 16.9-14.7 Ma) is likely to serve as a reference for the future pessimistic warming scenarios. Forced with MMCO boundary conditions, the warming and ocean circulation changes are simulated by the fully-coupled climate model FGOALS-g3. Under 400 ppmv CO2 concentration, the model generally simulates the MMCO temperature well with the small biases in the mid and low latitudes compared to proxy data. Large biases in the high latitudes show that FGOALS-g3 fails to reproduce the weak meridional gradient indicated by proxy. MMCO surface albedo decreases significantly owing to changes in worldwide forest cover in the boundary condition and the amount of sea ice melt due to the warming climate compared with the PI run. Accompanied by global ocean warming and land-sea distribution changes in MMCO, both oceanic wind-driven and thermohaline circulations strengthen. The intensified MMCO Atlantic Meridional Overturning Cell (AMOC) relative to PI is likely linked to the altered ocean-gateway configuration, particularly at low and middle latitudes. When the MMCO Panama Seaway and Tethys Seaway open, waters from the Pacific and the Indian Ocean converge and mix in the west of the North Atlantic. Joined by this water supplement (~30 Sv) from other ocean basins, the Gulf Stream enhances and flows more poleward, more heat and salinity are carried to the Subpolar North Atlantic. Consequently, the sea ice retreats and the Atlantic Meridional Overturning Cell enhances in the North Atlantic in the MMCO.

How to cite: Wei, J., Liu, H., and Zhao, Y.: Simulation of the climate and ocean circulations in the Middle Miocene Climate Optimum by a coupled model FGOALS-g3, EGU General Assembly 2023, Vienna, Austria, 23–28 Apr 2023, EGU23-4102, https://doi.org/10.5194/egusphere-egu23-4102, 2023.

EGU23-4227 | ECS | Orals | CL1.1.4

Variations in the amplitude of El Niño–Southern Oscillation in the past 250 million years 

Xiang Li, Shineng Hu, Yongyun Hu, Jiaqi Guo, Jiawenjing Lan, Qifan Lin, and Shuai Yuan

The El Niño–Southern Oscillation (ENSO), originating in the central and eastern equatorial Pacific, is a defining mode of interannual climate variability with profound impact on global climate and ecosystems. Although ongoing coordinated community efforts have offered insights into how ENSO will change in the future under anthropogenic warming, the geological history of ENSO remains intricate. In particular, there is a clear lack of systematic study on how ENSO has evolved in response to vast variations in land-sea distributions and climate mean states over geological timescales. To unravel this, we analyze a series of time-slice coupled climate simulations forced by changes of paleogeography, atmospheric CO2 concentrations, and solar radiation in the past 250 million years (Myr). Our simulations for the first time demonstrate that ENSO is the leading mode of tropical Pacific sea surface temperature (SST) in the past 250 Myr. Further, the amplitude of ENSO is predominantly captured by the zonal advective feedback and thermocline feedback, both of which are primarily regulated by eastern equatorial Pacific climatological SST. These findings highlight the significance of climate mean states in interpretation of the amplitude of ENSO during the deep past, and provide enlightening implications for constraining future climate change.

How to cite: Li, X., Hu, S., Hu, Y., Guo, J., Lan, J., Lin, Q., and Yuan, S.: Variations in the amplitude of El Niño–Southern Oscillation in the past 250 million years, EGU General Assembly 2023, Vienna, Austria, 23–28 Apr 2023, EGU23-4227, https://doi.org/10.5194/egusphere-egu23-4227, 2023.

EGU23-6249 | ECS | Orals | CL1.1.4

Bipolar deep-water formation during the climatic warmth of the early-middle Eocene 

Andrew McIntyre, Philip Sexton, and Pallavi Anand

The Atlantic meridional overturning circulation (AMOC) is a major component of global ocean circulation and through the distribution of heat, salt, and nutrients exerts a fundamental influence on global and regional climates. However, there is limited understanding of AMOC stability or its sensitivity, under acute climatic warmth that is marked for Earth’s future. To tackle this important gap in our understanding, the climatic warmth of the Eocene (~34-56 Ma) offers a unique opportunity and setting to investigate existence, structure, stability, and operation of AMOC. These fundamental gaps in our knowledge and understanding limit the ability to ground-truth ocean model simulations of past warm climates, and thus also diminish our confidence in the capabilities of these models to predict ongoing changes to our oceans.

Here, we present the first reconstruction of the early-middle Eocene AMOC using a meridional transect of Atlantic and Southern Ocean drill sites. Across sites, detailed chemostratigraphic correlations provide a common, high resolution age model spanning a 500 kyr interval (46.7-47.2 Ma). During this interval, high-resolution (~10 ka) carbon (δ13C), oxygen (δ18O), and neodymium (εNd) proxies were used to determine ocean ventilation state, temperature and salinity, and deep-water mass flow pathways. We find an early-middle Eocene AMOC, which consisted of bipolar deep-water formation forming two major cells, a southern and a northern cell. We will discuss characteristics of these water mass cells and their origin and operation using δ13C, δ18O, and εNd isotopic signatures. Evidence of deep-water mass formation in the North Atlantic is supported by sedimentological evidence from Hohbein et al. (2012) and Boyle et al., (2017), suggesting deep Nordic seas overflows at ~49 Ma and deep-water current flow forming contourite drifts on the Newfoundland Ridges at 47.8 Ma respectively.

Ocean circulation modelling of intervals of past extreme warmth, such as DeepMIP, provide understanding into potential ocean structures that could have existed during the early-middle Eocene. The most common feature of model predictions is a global meridional overturning circulation with strong deep convection in the Southern Ocean and no deep convection in the North Atlantic (Zhang et al., 2022). This study provides compelling evidence to bolster the Southern Ocean findings, yet a major data-modelling discrepancy exists within the North Atlantic, where most current model simulations don’t reproduce the proxy derived deep northern cell. This could point to non-CO2 boundary conditions, such as North Atlantic bathymetry and gateways, as a cause of this discrepancy. Further proxy and modelling work is warranted to resolve the temporal extent of deep-water convection in the North Atlantic during the Eocene.

References

Boyle et al., 2017. Marine Geology, 385, 185–203.

Hohbein et al., 2012, Geology, 40, 3, 255–258.

Zhang et al., 2022, Paleoceanography and Paleoclimatology, 37, 3, 1–22.

How to cite: McIntyre, A., Sexton, P., and Anand, P.: Bipolar deep-water formation during the climatic warmth of the early-middle Eocene, EGU General Assembly 2023, Vienna, Austria, 23–28 Apr 2023, EGU23-6249, https://doi.org/10.5194/egusphere-egu23-6249, 2023.

EGU23-6599 | ECS | Orals | CL1.1.4

Modelling the early Cenozoic Antarctic ice sheet oxygen isotope ratio and implications for the benthic δ18O change 

Jonas Van Breedam, Philippe Huybrechts, and Michel Crucifix

At the Eocene-Oligocene Transition (~34 Ma), ephemeral ice sheets grew into a large continental-scale Antarctic ice sheet. During the late Eocene there is evidence for short-lived, continental-scale glaciations in the benthic oxygen isotope record, as well as geomorphic evidence pointing towards large-scale glaciations on Antarctica. Here, the modelled mean oxygen isotope ratio of these early Cenozoic Antarctic ice sheets is presented. Since benthic oxygen isotopes are a proxy for both the deep sea temperature and the ice volume stored on land, it is possible to estimate the benthic oxygen isotope change once the mean oxygen isotope content of the ice sheet is known.

The modelled ice sheet oxygen isotope ratio of the late Eocene Antarctic ice sheets are strongly dependent on the size of the modelled continental-scale ice sheet, which in turn is determined by the bedrock. The ice sheet volume expansion during the Priabonian Oxygen Isotope Maximum (at around 37.2 Ma during the late Eocene) results in a modelled benthic oxygen isotope change between 0.3‰ and 0.55‰, sufficient to explain the observed excursions in the benthic oxygen isotope records. At the Eocene-Oligocene Transition, the modelled benthic oxygen isotope change due to ice sheet growth is found to be between 0.65‰ and 0.75‰. The remainder 0.45‰ to 0.55‰ of the observed benthic oxygen isotope change should therefore have been caused by oceanic cooling.

How to cite: Van Breedam, J., Huybrechts, P., and Crucifix, M.: Modelling the early Cenozoic Antarctic ice sheet oxygen isotope ratio and implications for the benthic δ18O change, EGU General Assembly 2023, Vienna, Austria, 23–28 Apr 2023, EGU23-6599, https://doi.org/10.5194/egusphere-egu23-6599, 2023.

EGU23-6695 | ECS | Orals | CL1.1.4

Steady states and bifurcation diagram for the Permian-Triassic paleogeography  

Charline Ragon, Christian Vérard, Jérôme Kasparian, and Maura Brunetti

The climate relaxes toward a steady state under a permanent inhomogeneous forcing from solar radiation and dissipative mechanisms. As a highly nonlinear system, the Earth’s climate can exhibit multiple steady states at a given forcing. Multistability has been observed in numerical models of different complexities, including fully coupled general circulation models with an aquaplanet configuration (Ragon et al. 2022), and we show here multistability also applies for the Earth in deep time.

We use the MIT general circulation model in a coupled atmosphere-ocean-sea ice-land configuration to perform simulations at a constant forcing i.e., fixed solar constant and atmospheric partial pressure of CO2. We let the system relax for thousands of years, which is the typical timescale of ocean dynamics. Considering the paleogeography of the Permian-Triassic reconstructed after PANALESIS (Vérard 2015), we find multiple competing steady states, representing alternative potential climates for that period.

Then, we construct the corresponding bifurcation diagram by varying the atmospheric CO2 content. This allows us to identify the stability range of each steady state, the position of tipping points and the required conditions for the system to shift from one state to another, which may help to understand the climatic oscillations observed, e.g., during the Early Triassic.

References

Ragon C., Lembo V., Lucarini V., Vérard C., Kasparian J. & Brunetti M., Robustness of competing climatic states. Journal of Climate, 35, 2769-2784. (2022)

Vérard C., PANALESIS: Towards global synthetic palæogeographies using integration and coupling of manifold models. Geological Magazine, 156, 320-330. (2015) 

How to cite: Ragon, C., Vérard, C., Kasparian, J., and Brunetti, M.: Steady states and bifurcation diagram for the Permian-Triassic paleogeography , EGU General Assembly 2023, Vienna, Austria, 23–28 Apr 2023, EGU23-6695, https://doi.org/10.5194/egusphere-egu23-6695, 2023.

EGU23-6749 | ECS | Orals | CL1.1.4

Meridional Heat Transport in the DeepMIP Eocene ensemble: non-CO2 and CO2 effects 

Fanni Dora Kelemen, Sebastian Steinig, Agatha de Boer, Jiang Zhu, Wing-Le Chan, Igor Niezgodzki, David K. Hutchinson, Gregor Knorr, Ayako Abe-Ouchi, and Bodo Ahrens

The total meridional heat transport (MHT) is relatively stable across different climates. Nevertheless, the strength of individual processes contributing to the total transport are not stable. Here we investigate the MHT and its main components especially in the atmosphere, in five coupled climate model simulations from the Deep-Time Model Intercomparison Project (DeepMIP). These simulations target the Early Eocene Climatic Optimum (EECO), a geological time period with high CO2 concentrations, analogous to the upper range of end-of-century CO2 projections. Preindustrial and early Eocene simulations at a range of COlevels (1x, 3x and 6x preindustrial values) are used to quantify the MHT changes in response to both CO2 and non-CO2 related forcings. We found that atmospheric poleward heat transport increases with CO2, while the effect of non-CO2 boundary conditions (e.g., paleogeography, land ice, vegetation) is causing more poleward atmospheric heat transport on the Northern and less on the Southern Hemisphere. The changes in paleogeography increase the heat transport via transient eddies at the mid-latitudes in the Eocene. The Hadley cells have an asymmetric response to both the CO2 and non-CO2 constraints. The poleward latent heat transport of monsoon systems increases with rising CO2 concentrations, but this effect is offset by the Eocene topography. Our results show that the changes in the monsoon systems’ latent heat transport is a robust feature of CO2 warming, which is in line with the currently observed precipitation increase of present day monsoon systems.

How to cite: Kelemen, F. D., Steinig, S., de Boer, A., Zhu, J., Chan, W.-L., Niezgodzki, I., Hutchinson, D. K., Knorr, G., Abe-Ouchi, A., and Ahrens, B.: Meridional Heat Transport in the DeepMIP Eocene ensemble: non-CO2 and CO2 effects, EGU General Assembly 2023, Vienna, Austria, 23–28 Apr 2023, EGU23-6749, https://doi.org/10.5194/egusphere-egu23-6749, 2023.

EGU23-7084 | ECS | Orals | CL1.1.4

Sensitivity of Neoproterozoic Snowball-Earth inceptions to continental configuration, orbital geometry, and volcanism 

Julius Eberhard, Oliver E. Bevan, Georg Feulner, Stefan Petri, Jeroen van Hunen, and James U.L. Baldini

The Cryogenian period (720–635 million years ago) in the Neoproterozoic era featured two phases of global or near-global ice cover, termed ‘Snowball Earth’. Climate models of all kinds indicate that the inception of these phases must have occurred in the course of a self-amplifying ice–albedo feedback that forced the climate from a partially ice-covered to a Snowball state within a few years or decades. The maximum concentration of atmospheric carbon dioxide (CO2) allowing such a drastic shift is difficult to determine because it depends on the choice of model and the boundary conditions prescribed in the model. Many previous studies report values or ranges for this CO2 threshold but typically test only very few different boundary conditions. Furthermore, most studies include some kind of variability internal to the climate system but exclude variability due to volcanism. Here we present a comprehensive sensitivity study considering different scenarios for the Cryogenian continental configuration, orbital geometry, and short-term volcanic cooling effects in a consistent model framework, using the climate model of intermediate complexity CLIMBER-3α. The continental configurations comprise palaeogeography reconstructions for both Snowball-Earth periods from two different sources, as well as two idealised configurations with either uniformly dispersed continents or a single polar supercontinent. Orbital geometries are sampled as multiple different combinations of the parameters obliquity, eccentricity, and argument of perihelion. For volcanic eruptions, we differentiate between single and globally homogeneous perturbations, single and zonally resolved perturbations, and random sequences of globally homogeneous perturbations with realistic statistics. The CO2 threshold lies between 10 and 250 ppm for all simulations. While the idealized continental configurations span a difference of around 200 ppm for the threshold, the continental reconstructions differ by only 20–40 ppm. Changes in orbital geometry account for variations in the CO2 threshold by up to 32 ppm. The effects of volcanic perturbations largely depend on the orbital geometry. A very large peak reduction of net solar radiation by around –20 W/m2 can shift the CO2 threshold by the same order of magnitude as the orbital geometry. Even larger eruptions of up to –40 W/m2 may shift the threshold by up to 50 ppm. However, the smaller, more frequent eruptions mostly have much lower impacts than the changes in continental configuration and orbital geometry. Eruptions near the equator tend to, but do not always, cause larger shifts than eruptions at high latitudes. Realistic sequences of eruptions lower the long-term temperature and have a bigger effect on the CO2 threshold than single large eruptions of comparable magnitude.

How to cite: Eberhard, J., Bevan, O. E., Feulner, G., Petri, S., van Hunen, J., and Baldini, J. U. L.: Sensitivity of Neoproterozoic Snowball-Earth inceptions to continental configuration, orbital geometry, and volcanism, EGU General Assembly 2023, Vienna, Austria, 23–28 Apr 2023, EGU23-7084, https://doi.org/10.5194/egusphere-egu23-7084, 2023.

EGU23-7320 | Orals | CL1.1.4

Effect of tectonic closure of the American Seaway on oxygen minimum zone in the tropical Pacific from model simulations 

Viacheslav Khon, Babette Hoogakker, Birgit Schneider, Joachim Segschneider, and Wonsun Park

The world’s largest oxygen minimum zone (OMZ) resides in the eastern tropical Pacific where poorly ventilated “shadow zone”, created by stagnant tropical cyclonic gyre is complemented by intensive biological consumption of dissolved oxygen, thereby promoting oxygen deficiency in this region. The present-day continental configuration with the presence of the Isthmus of Panama prevents water mass exchange between the tropical Pacific and the Caribbean Sea, shaping the climate and marine biogeochemistry features in the eastern tropical Pacific. The tectonic closure of the American Seaway during the mid-Miocene to mid-Pliocene epoch (~16-3 Ma BP) is thought to be a key factor for the development of stagnating conditions in the eastern equatorial Pacific leading to emergence of tropical Pacific OMZs . 

This study aims at investigating the impact of the CAS opening on the large-scale ocean circulation and oxygen minimum zone in the tropical Pacific. To this end, we performed a series of sensitivity experiments with the global climate model KCM where a sill of the open CAS was set at different depths, ranging from shallow to deep levels. Our results confirm previous studies that Panamanian gateway closure during the Pliocene may have led to an intensification of the Atlantic Meridional Overturning Circulation (AMOC) due to a termination of fresh-water supply from the tropical Pacific to the North Atlantic. It was found that the CAS opening drives eastward subsurface flow in the northern tropical Pacific. This, in turn, facilitates stronger west-to-east oxygen supply and subsequent overall oxygen enrichment in the subsurface Pacific waters with strongest anomalies observed in the eastern tropical Pacific. In addition, the marine net primary production is slightly weakened in this region due to an export of nutrients to the Caribbean Sea through the open Panamanian gateway. This, in turn, leads to a weaker export of particulate organic carbon towards the ocean interior, and, therefore, to lower biological consumption of oxygen in this region.

How to cite: Khon, V., Hoogakker, B., Schneider, B., Segschneider, J., and Park, W.: Effect of tectonic closure of the American Seaway on oxygen minimum zone in the tropical Pacific from model simulations, EGU General Assembly 2023, Vienna, Austria, 23–28 Apr 2023, EGU23-7320, https://doi.org/10.5194/egusphere-egu23-7320, 2023.

EGU23-8237 | ECS | Orals | CL1.1.4

Investigating the role of temperatures in proxy-based pCO2 estimates: An integrated model-proxy approach 

Caitlyn Witkowski, Alex Farnsworth, and Paul Valdes

Atmospheric concentrations of carbon dioxide (pCO2) play a critical role in a number of earth system components, including the biosphere, geosphere, and atmosphere. Understanding how pCO2 has changed over geologic time may provide critical context for predicting future climate scenarios. However, constraining past pCO2 values remain a challenge in paleoclimate studies due to difficulties in constraining proxy calculation parameters. Marine-based pCO2 proxies rely on at least one temperature parameter (i.e., via Henry’s Law to convert dissolved CO2 concentrations from the ocean into atmospheric pCO2), which is difficult to constrain in deep-time. Here, we highlight the importance of temperature and propose a new method of model-derived temperatures based on the paleo-location of the sample site. This methodology can be applied to any pCO2 proxy with temperature input; here we use the example of the pCO2 proxy based on the stable carbon isotopic composition of phytane, the diagenetic product of chlorophyll-a, due to its spatial and temporal ubiquity over the past ca. 465 million years.

How to cite: Witkowski, C., Farnsworth, A., and Valdes, P.: Investigating the role of temperatures in proxy-based pCO2 estimates: An integrated model-proxy approach, EGU General Assembly 2023, Vienna, Austria, 23–28 Apr 2023, EGU23-8237, https://doi.org/10.5194/egusphere-egu23-8237, 2023.

EGU23-8420 | ECS | Posters on site | CL1.1.4

Simulation of Arctic sea ice within the Eocene Deep-Time Model Intercomparison Project: thresholds, seasonality and factors controlling sea ice development 

Igor Niezgodzki, Gregor Knorr, Gerrit Lohmann, Daniel Lunt, Christopher Poulsen, Sebastian Steinig, Jiang Zhu, Agatha de Boer, Wing-Le Chan, Yannick Donnadieu, David Hutchinson, Jean-Baptiste Ladant, and Polina Morozova

The early Eocene greenhouse climate driven by high atmospheric CO2 concentrations serves as a testbed for future climate changes dominated by increasing CO2 forcing. Especially, the early Eocene Arctic region is important in light of future CO2-driven climate warming in the northern polar region. Here, we present early Eocene Arctic sea ice simulations carried out by coupled climate models within the framework of the Deep-Time Model Intercomparison Project. We find differences in sea ice responses to CO2 changes across the ensemble and compare the results with existing proxy-based sea ice reconstructions from the Arctic Ocean. Most of the models simulate winter sea ice presence at high CO2 levels (≥ 840 ppmv = 3x pre-industrial (PI) level of 280 ppmv). However, the threshold when sea ice permanently disappears from the ocean varies significantly between the models (from < 840 ppmv to > 1680 ppmv). Based on a one-dimensional energy balance model analysis we find that the greenhouse effect plays an important role in the inter-model spread in Arctic winter surface temperature changes in response to a CO2 rise from 1x to 3x the PI level. We link this greenhouse effect to increased atmospheric water vapour concentration. Furthermore, differences in simulated surface salinity in the Arctic Ocean play an important role in controlling local sea ice formation. These inter-model differences result from differences in the exchange of waters between a brackish Arctic and a more saline North Atlantic Ocean that are controlled by the width of the gateway between both basins. As there is no geological evidence for Arctic sea ice in the early Eocene, its presence in most of the simulations with 3x PI CO2 level indicates either a higher CO2 level and/or models miss important mechanism/feedback.

How to cite: Niezgodzki, I., Knorr, G., Lohmann, G., Lunt, D., Poulsen, C., Steinig, S., Zhu, J., de Boer, A., Chan, W.-L., Donnadieu, Y., Hutchinson, D., Ladant, J.-B., and Morozova, P.: Simulation of Arctic sea ice within the Eocene Deep-Time Model Intercomparison Project: thresholds, seasonality and factors controlling sea ice development, EGU General Assembly 2023, Vienna, Austria, 23–28 Apr 2023, EGU23-8420, https://doi.org/10.5194/egusphere-egu23-8420, 2023.

EGU23-8997 | ECS | Orals | CL1.1.4

Simulating the terrestrial biosphere in the high CO2 world of the early Eocene 

Julia Brugger, Nick Thompson, Torsten Utescher, Ulrich Salzmann, and Thomas Hickler

The early Eocene is a warm period suitable for studying the influence of high atmospheric CO2 concentrations on climate, the terrestrial biosphere, and their interaction. Here, we simulated the terrestrial biosphere of the early Eocene with a dynamic global vegetation model (LPJ-GUESS), driven by climate input from the Deep-Time Model Intercomparison Project (DeepMIP). We find a strong expansion of tropical and temperate forests to higher latitudes, which is more pronounced when assuming CO2 concentrations at the high end of plausible values. The modeled vegetation distribution is compared to a recently compiled extensive early Eocene paleobotanical global dataset. Simulated and reconstructed vegetation show good agreement, which improves with higher CO2 concentrations. In contrast to earlier vegetation modeling studies our simulations are able to accurately simulate the expansion of tropical forests under CO2 concentrations larger than 4-times pre-industrial CO2. Given the good agreement between modeled vegetation and paleobotanical data our simulations allow us to gain a more comprehensive understanding of the early Eocene terrestrial biosphere, including the global carbon cycle and the role of wildfires. In addition, our comparison of modeled vegetation and paleobotanical data is an important test of the performance of the climate and vegetation models used, which are also used to simulate future impacts of climate change.

How to cite: Brugger, J., Thompson, N., Utescher, T., Salzmann, U., and Hickler, T.: Simulating the terrestrial biosphere in the high CO2 world of the early Eocene, EGU General Assembly 2023, Vienna, Austria, 23–28 Apr 2023, EGU23-8997, https://doi.org/10.5194/egusphere-egu23-8997, 2023.

EGU23-9574 | Orals | CL1.1.4

Changes in climate sensitivity and polar amplification over the last 500 million years 

Dan Lunt, Paul Valdes, and Chris Scotese

During the Phanerozoic (the last ~0.5 billion years), the Earth has experienced massive changes in climate, spanning the extensive glaciations of the Permo-Carboniferous (~300 million years ago), to the mid-Cretaceous super-greenhouse (~100 million years ago). Recently, several studies have used geological data to reconstruct global mean temperatures through this period, as a way of characterising the zeroth-order response of the Earth system to its primary forcings.

Here we use two new ensembles of model simulations covering the entire Phanerozoic, consisting of 2× >100 simulations at a 5 million year resolution, to explore the key metrics of climate sensitivity and polar amplification using the HadCM3 climate model.  The model version we use has undergone a substantial development process and can simulate the climate of the Eocene, where extensive observations exist, at least as well as much more recent (CMIP5) models, but at a fraction of the computational cost.

The two ensembles explore uncertainty in the CO2 forcing during the Phanerozoic, being forced by (a) a published CO2 curve based on proxy reconstructions, and (b) a derived CO2 curve that results in global mean temperatures in agreement with temperature reconstructions.  Comparison of the ensembles indicates that the climate sensitivity is both temperature and paleogeography dependent, increasing with increasing temperatures, and varying as a function of the supercontinent configuration.  We also explore polar amplification, and again find that this is dependent on background climate and paleogeography.  We apply energy balance methods to explore the reasons for the varying polar amplification, and also find a key role for the ocean circulation state.

How to cite: Lunt, D., Valdes, P., and Scotese, C.: Changes in climate sensitivity and polar amplification over the last 500 million years, EGU General Assembly 2023, Vienna, Austria, 23–28 Apr 2023, EGU23-9574, https://doi.org/10.5194/egusphere-egu23-9574, 2023.

EGU23-10201 | ECS | Orals | CL1.1.4

How does Eocene warming affected elevation-dependent warming? 

Manuel Tobias Blau, Pratik Kad, Kyung-Ja Ha, and Jiang Zhu

Elevation-dependent temperature change is a phenomenon found in mountain regions with complex terrain, mostly in the Himalayas and the high terrain of the Tibetan Plateau, where regions in high elevation feature high rates of warming than the region in lower elevation. This pattern referred to as elevation-dependent warming. However, does elevation-dependent warming exist in Eocene hothouse without Tibetan Plateau as well and lower altitude mountain ranges?

The Eocene era is considered a replication of the future climate with high atmospheric carbon dioxide. We utilized CESM1.2 as part of the DeepMIP simulations to analyze elevation-dependent temperature change in different mountain ranges in the Eocene and explained the findings using a linear surface energy balance decomposition. The results feature a land-sea contrast with amplification over land and elevation-dependent temperature changes in all mountain ranges with distinct seasonality and pattern. The results suggest that radiative feedback processes have a strong contribution to elevation-dependent warming in the warming climate. Our modeling results provide relevant information for mountain climate change in a past hot climate. Further, the analysis opens new mystery and perspectives related to elevation-dependent warming.


Keywords: Eocene, paleoclimate modeling, elevation-dependent warming, CO2


Related Publication:

Kad P, Blau M T, Ha K-J, and Zhu J (2022) Elevation-dependent temperature response in early Eocene using paleoclimate model experiment. Environmental Research Letters, 17(11), 114038. (https://doi.org/10.1088/1748-9326/ac9c74)

How to cite: Blau, M. T., Kad, P., Ha, K.-J., and Zhu, J.: How does Eocene warming affected elevation-dependent warming?, EGU General Assembly 2023, Vienna, Austria, 23–28 Apr 2023, EGU23-10201, https://doi.org/10.5194/egusphere-egu23-10201, 2023.

EGU23-10673 | ECS | Orals | CL1.1.4

Exploring the role of Mantle and Paleomagnetic Reference Frames with Intermediate Complexity Climate Models 

Jonathon Leonard, Sabin Zahirovic, Tristan Salles, and Claire Mallard

The distribution of continents and oceans through deep-time has shaped the Earth’s changing climate and geography in a way that is vital for understanding processes ranging from the evolution and migration of living organisms to the distribution of economic mineral deposits, and the precise contribution of anthropogenic CO2 to the present climate. Despite this, producing climate models of an evolving Earth across long periods of geological time have been challenging due to the immense computational resources required, and as a result, deep-time paleo-climate models have tended to focus on single ages. Here we demonstrate the use of an intermediate-complexity atmosphere-ocean Plasim-Genie tool to produce a suite of models that illustrate the evolving climate with evolving continents over hundreds of millions of years.

Using this approach, we explore the impact of modelling paleoclimate with a pure paleomagnetic plate reference frame versus a plate motion model that uses a mantle reference frame. These two plate reference frames may have latitudinal differences of up to 15 degrees even in the well-constrained timeframe of the last 100 Myr. We demonstrate with Plasim-Genie that these latitudinal differences result in significant discrepancies in climate in a range of key regions. Users of paleoclimate model data, particularly those studying biology and geography of the past should be aware of the plate reference frame used in generating the climate data. As the Earth’s magnetic field averages to align with the Earth’s spin axis, we suggest that a paleomagnetic reference frame is the preferred reference frame to use for paleoclimate modelling.

How to cite: Leonard, J., Zahirovic, S., Salles, T., and Mallard, C.: Exploring the role of Mantle and Paleomagnetic Reference Frames with Intermediate Complexity Climate Models, EGU General Assembly 2023, Vienna, Austria, 23–28 Apr 2023, EGU23-10673, https://doi.org/10.5194/egusphere-egu23-10673, 2023.

EGU23-10724 | ECS | Orals | CL1.1.4

The Global Meridional Overturning Circulation of the Paleozoic Ocean 

Shuai Yuan, Yongyun Hu, Yonggang Liu, and Dan Lunt

  The global meridional overturning circulation (GMOC) plays an important role in transporting oceanic heat from one hemisphere to the other. At present, the AMOC descends in the North Atlantic and is responsible for transporting large amount of heat from the Southern Hemisphere (SH) to the Northern Hemisphere (NH). In the early Paleozoic, the continental configuration was nearly opposite to that of the present, with most of the landmass located in the SH and an ocean world of the NH. Here, we present simulation results to demonstrate that the GMOC in the Paleozoic was anticlockwise, with upwelling in the NH and descending in the SH, which is opposite to that of the present. The anticlockwise GMOC in the Paleozoic is mainly due to hemispheric asymmetry of wind stresses and freshwater input into the ocean. Stronger wind stress in the NH drives upwelling in the NH extratropics. Less freshwater input into the SH ocean causes saltier and heavier seawater, which is conducive to deep water formation in the SH ocean. These hemispheric asymmetries of wind stresses and freshwater are because of land-sea distribution in the Paleozoic. Two datasets are used, which show consistent results in general.

How to cite: Yuan, S., Hu, Y., Liu, Y., and Lunt, D.: The Global Meridional Overturning Circulation of the Paleozoic Ocean, EGU General Assembly 2023, Vienna, Austria, 23–28 Apr 2023, EGU23-10724, https://doi.org/10.5194/egusphere-egu23-10724, 2023.

EGU23-10963 | ECS | Orals | CL1.1.4

Recognizing the Role of Tropical Seaways in Modulating the Pacific Circulation 

Ning Tan, Zhongshi Zhang, Zhengtang Guo, Chuncheng Guo, Zijian Zhang, Zhilin He, and Gilles Ramstein

During the late Miocene and the Pliocene, changes in the Central American and Indonesian seaway geometry are very important for ocean circulation and global climate. Various modelling studies have examined the separate effects of these two tropical seaways, especially their link to the onset of the Northern Hemisphere ice sheets through changes in the Atlantic meridional overturning circulation and associated heat and moisture transport. Although the existence of dual tropical seaways is closer to reality, there are very scarce modelling studies exploring the co-effects of dual tropical seaway changes, especially on the Pacific ocean circulation. Here we provide the results of a modelling study on this issue. Our results show that the combined shallow opening of tropical seaways can generate an active Pacific meridional overturning circulation (that is absent in modern conditions) by which the meridional and zonal sea surface temperature gradient in the Pacific largely reduce. In contrast, a deeper opening of tropical seaways cannot produce these changes in the Pacific ocean circulation. This study provides insights into and a better understanding of the role of tropical seaways in shaping the Pacific climate and highlights the importance of the sill depth of each seaway.

How to cite: Tan, N., Zhang, Z., Guo, Z., Guo, C., Zhang, Z., He, Z., and Ramstein, G.: Recognizing the Role of Tropical Seaways in Modulating the Pacific Circulation, EGU General Assembly 2023, Vienna, Austria, 23–28 Apr 2023, EGU23-10963, https://doi.org/10.5194/egusphere-egu23-10963, 2023.

Polar amplification is the phenomenon that external radiative forcing produces a larger change in surface temperature at high latitudes than the global average, which is one of the most robust in climate changes with historical and future increases in atmospheric CO2. Also, it is known that, polar amplifications occurred during past warm periods due to atmospheric CO2 concentrations and orbital parameters different from those in the present day. The Cretaceous is known as one of the warmest periods in the Phanerozoic (Foster et al., 2017). The Cretaceous proxy data indicate remarkable temperature amplifications in the high-latitude and polar region (e.g., Jenkyns et al. 2004), resulting in small equator-to-polar temperature difference. Many previous studies using global climate models have invested the relationship between the polar temperatures and the greenhouse gasses, geography, vegetation, and cloud property in order to elucidate the mechanism (e.g., Otto-Bliesner and Upchurch 1997; Upchurch et al., 2015; Niezgodzki et al., 2017). On the other hand, it is not well understood that differences in polar amplifications between present day and Cretaceous with changes in atmospheric CO2 concentration and orbital parameters. In this study, we systematically investigated the responses of the polar temperatures in the present-day Cretaceous to changes in atmospheric CO2 concentration and the orbital parameters using an atmospheric-ocean-vegetation fully coupled model MIROC4m-LPJ. Our Cretaceous simulations succeeded in reproducing the polar temperature amplification at that time by considering variations in atmospheric CO2 concentration and orbital parameters. Furthermore, it was clarified that, due to the differences in geographical conditions between the modern and the Cretaceous, the temperature of the polar regions responded more sensitively to external radiative forcing such as changes in atmospheric CO2 concentration and orbital parameters in the Cretaceous than in the present-day.

How to cite: Higuchi, T., Abe-Ouchi, A., Chan, W.-L., and O'ishi, R.: Differences in polar amplifications between present day and Cretaceous with changes in atmospheric CO2 concentration and orbital parameters, EGU General Assembly 2023, Vienna, Austria, 23–28 Apr 2023, EGU23-11277, https://doi.org/10.5194/egusphere-egu23-11277, 2023.

EGU23-12176 | ECS | Orals | CL1.1.4

Eastern Equatorial Atlantic paleoceanographic conditions of the Oligocene and early Miocene 

Dominique Jenny, Evalien Baas, Wouter Stouthamer, Jakub Witkowski, Isabella Raffi, Peter Bijl, Francien Peterse, and Appy Sluijs

The Oligocene (33.9 – 23.03 Ma ago) and early Miocene (23.03 – 19 Ma) experienced large climate and ice sheet fluctuations in a most likely unipolar icehouse, with glaciation limited to the Southern Hemisphere. This time interval provides a useful test case for studying polar amplification patterns under atmospheric greenhouse gas concentrations similar to those projected for the future. Large-amplitude climate variability has been recorded close to Antarctica during this time interval, but climatic and environmental conditions and variability in the tropical band are poorly knownpaleoceanographic conditions and sea (sub)surface temperatures (SSTs) will deliver an insight into the climate variability and sensitivity of the lower latitudes under unipolar conditions.

Reconstructed surface oceanographic conditions and variations in the depositional environment are based on bulk carbonate stable isotope ratios (δ18O, δ13C), weight% carbonate, magnetic susceptibility and dinoflagellate cyst assemblages at Ocean Drilling Program Site 959, offshore Ghana.. In addition, long term SSTs reconstructions for the Oligocene and early Miocene equatorial Atlantic are derived from lipid biomarker-based paleothermometry (TEX86). Lastly, long term (~31 Ma – 19Ma) atmospheric CO2 concentrations based on stable carbon isotopic fractionation of marine organic carbon and alkenones were generated.

The organic carbon isotopic fractionation showshat pCO2 ranged from 280 – 570ppm between ~19 – 33 Ma and shows no signs of large variability, which is consistent with previous findings. The TEX86 indicates that the average SSTs during the Oligocene was ~27℃ which is ~1 – 4℃ colder than in the west Equatorial Atlantic (e.g., ODP Site 929, Ceara Rise), using the same transfer function. Dinoflagellate cyst assemblages indicate upwelling alternated with strong stratification events on ~50 to 100 kyr timescale. Monsoonal upwelling could explain the lower SSTs at Site 959 which is consistent with modern east-west gradients. Subsequent comparison of our equatorial SST record with general circulation modelling studies and SST records from high latitudes should reveal the polar amplification of warming and climate sensitivity on long and short (orbital) timescales during the Oligocene.

How to cite: Jenny, D., Baas, E., Stouthamer, W., Witkowski, J., Raffi, I., Bijl, P., Peterse, F., and Sluijs, A.: Eastern Equatorial Atlantic paleoceanographic conditions of the Oligocene and early Miocene, EGU General Assembly 2023, Vienna, Austria, 23–28 Apr 2023, EGU23-12176, https://doi.org/10.5194/egusphere-egu23-12176, 2023.

EGU23-12549 * | Orals | CL1.1.4 | Highlight

Hominoid dispersal during Neogene, from tectonics to Milankovich forcings as major driving factors to explain the spread of population 

Gilles Ramstein, Corentin Gibert, Diane Segalla, Frédéric Fluteau, William Banks, Doris Barboni, Anaïs Vignoles, Camille Contoux, Jean-Renaud Boisserie, Olivier Chavasseau, Franck Guy, Olga Otero, Pierre Sepulchre, Antoine Souron, and Florence Colleoni

During the Neogene, major tectonics events occurred: uplift of mountain ranges (including the Tibetan Plateau and surrounding regions), opening and closing of seaways, and large variations of atmospheric CO2 and sea level. What were the consequences of such changes on the dispersal of hominoid populations? We focus on the Miocene to Pliocene time interval (23 Ma-2.6 Ma). First, we analyze the spread of hominoids from their original geographic range, the tropical forests of Africa during the Early Miocene to the first expansion to Eurasia during the mid-Miocene Climate Optimum. Niche modelling combined with paleoclimatic simulations, provides means to circumvent the fragmentary nature of this record. We identify how the large climatic changes during Miocene Transition impact the potential habitats of hominoids and compare our findings to both the related fossil records and paleoenvironmental proxies.

Second, we analyze human distribution during the Mid to Late Pliocene (4-3 Ma), i.e. before the triggering of the large perennial Greenland ice sheet, and of huge amplitude northern hemisphere glacial interglacial cycles, while CO2 evolved between 400 and 300 ppm. In Africa, tropical areas experienced drastic hydrological changes, mainly driven by precession cycles, which deeply modulated monsoon intensity and precipitation patterns, as illustrated by the paleoshore level record of Mega Lake Chad. To explore how orbital parameters strongly modify hydrological cycles over tropical Africa and, the associated dispersion of the genus Australopithecus, we simulated the response of climate, vegetation, and hydrological cycles of the mid to Late Pliocene conditions.

For both geological contexts, we provide and analyze a series of Earth System models (IPSL-CM5A2 LR-low resolution-) coupled simulations. Moreover, we associate these fully-coupled simulations with high resolution atmosphere-only model simulations, and a dynamic vegetation model (ORCHIDEE). Both models were used to estimate ecological niches with a spatial resolution of 50 km.

We describe the imprint of slow climate changes during the Miocene Climate Transition (MCT) as well as more rapid climate evolution during mid to Late Pliocene, associated with higher frequency oscillation of orbital parameters.

This study demonstrates how, for these periods, climate and especially hydrological variations were pivotal to the understanding of hominoid migrations. We compare our findings to fossil records and paleoenvironmental proxy reconstructions.

To conclude, we discuss the strengths and limitations of such approaches, which were made possible through a large trans-disciplinary effort between paleontologists, paleoanthropologists, paleoenvironmentalists, paleoclimatologists, and niche modelers.

How to cite: Ramstein, G., Gibert, C., Segalla, D., Fluteau, F., Banks, W., Barboni, D., Vignoles, A., Contoux, C., Boisserie, J.-R., Chavasseau, O., Guy, F., Otero, O., Sepulchre, P., Souron, A., and Colleoni, F.: Hominoid dispersal during Neogene, from tectonics to Milankovich forcings as major driving factors to explain the spread of population, EGU General Assembly 2023, Vienna, Austria, 23–28 Apr 2023, EGU23-12549, https://doi.org/10.5194/egusphere-egu23-12549, 2023.

EGU23-13112 | ECS | Posters on site | CL1.1.4

A new high resolution stable isotope record from the North Atlantic Ocean: a detailed insight into the mid-Maastrichtian event 

Alexa Fischer, Oliver Friedrich, André Bahr, and Silke Voigt

The long-term global cooling trend during the latest Cretaceous was interrupted by an intense global warming episode at ~69 Ma known as the mid-Maastrichtian event (MME). The MME is characterized by two positive 13C excursions with an overall magnitude of 0.6‰ to 1.5‰ separated by a negative inflection. The 13C excursions are accompanied by the extinction of inoceramid bivalves, an abrupt increase in deep-sea and sea-surface temperatures as well as terrestrial mean annual temperatures between 21 and 23 °C at a paleolatitude of ~35° N. Changes in oceanic circulation, particularly a change in thermohaline circulation patterns, have been identified to be one of the main drivers of the MME. Nevertheless, the driving mechanisms, timing, character, and consequences of the circulation change are still up for debate. In this study, a 2 Myr-long time interval of the Mid to Late Maastrichtian has been analyzed at a ~2.5 to 5 kyr-resolution with the aim to improve the understanding of the climatic patterns leading to the MME. For IODP Core U1403 in the North Atlantic (J-Anomaly Ridge), XRF core scanning, wt% CaCO3 analyses, and stable oxygen and carbon isotope records of benthic foraminifera were generated. Bottom-water temperatures were reconstructed through Mg/Ca measurements of the same foraminiferal tests. Preliminary data reveal a warming of North Atlantic deep-sea temperatures by ~2–3°C between ~68.5 and 69 Ma, accompanied by several CaCO3 dissolution events as well as 13C excursions of up to 0.8 ‰. These findings point towards a major perturbation in the global carbon cycle accompanying the overall change in ocean circulation whose causes appear to be more complex than previously thought.

How to cite: Fischer, A., Friedrich, O., Bahr, A., and Voigt, S.: A new high resolution stable isotope record from the North Atlantic Ocean: a detailed insight into the mid-Maastrichtian event, EGU General Assembly 2023, Vienna, Austria, 23–28 Apr 2023, EGU23-13112, https://doi.org/10.5194/egusphere-egu23-13112, 2023.

EGU23-14151 | ECS | Posters on site | CL1.1.4 | Highlight

Archean Earth Climate Drivers 

Anya Taylor, Sophie-Berenice Wilmes, Nathan Mayne, Michael Way, and Mattias Green

The Archean Eon (4.0 - 2.5 Ga) is a very important time period: it spans roughly one third of Earth’s history, likely hosted the earliest lifeforms, and was critical for the development and long-term maintenance of a habitable climate and surface conditions on Earth. There are very few physical proxy records stretching all the way back to the Archean, meaning that early Earth climate research is centered on computer modeling with proxy data as validation. This kind of research has built a solid understanding of what atmospheric and surface conditions were like on Archean Earth, and now we can shift focus and investigate why the climate changed so drastically during this period. This project aims to identify the primary drivers of Archean climate change by completing a large parameter sweep with Isca - a highly configurable framework designed for idealized terrestrial planetary atmospheres. Working back from present day Earth, boundary conditions will be changed one at a time in order to isolate their specific role in the climate change over the Archean period. Simulations with interesting results will then be passed to ROCKE-3D, to further evaluate with a fully-coupled earth system model. The first suite of simulations will investigate the roles of three parameters that are intrinsic to Archean conditions: reduced solar luminosity, enhanced rotation rate, and a vastly different atmospheric composition. In later work more complexities will be added, and the role of land type, continental configuration, and orbital parameters (plus many more) will be investigated. The preliminary results of the initial suite of simulations will be presented here. By isolating the role of an extensive set of atmosphere, ocean, geologic, and orbital parameters using a simple model framework, we hope to identify the primary drivers of Archean climate change. This will help to quantify the relative importance of each variable in terms of planetary habitability, and can potentially be extrapolated to benefit the search for habitable planets outside of our solar system. 

How to cite: Taylor, A., Wilmes, S.-B., Mayne, N., Way, M., and Green, M.: Archean Earth Climate Drivers, EGU General Assembly 2023, Vienna, Austria, 23–28 Apr 2023, EGU23-14151, https://doi.org/10.5194/egusphere-egu23-14151, 2023.

EGU23-15740 | ECS | Orals | CL1.1.4

Exploring Cenozoic vegetation cover and paleobiodiversity evolution induced by paleogeography and climate change 

Delphine Tardif, Pierre Sepulchre, Fabien Condamine, and Couvreur Thomas

Paleogeographic evolution is a major forcing of climate on long (multi-million years) time scales, which in turn can drive important vegetation cover variations. While recent studies have shown the important role played by abiotic factors on species diversification and on the establishment of modern biodiversity gradients, and although climate models are designed to simulate increasingly realistic vegetation cover, it remains difficult to estimate the accuracy of the results obtained. Indeed, the fossil record available to estimate the evolution of the paleovegetation cover remains heterogenous and fragmentary in some regions.  

Here, we present climate and vegetation cover response to paleogeography evolution throughout the Cenozoic as simulated with IPSL-CM5A2 Earth System Model. In a second time, we wish to explore means of using temperature and precipitation values extracted from such models simulations, in order to constrain birth-death diversification models. While the use of regionally-averaged abiotic parameters seems a potentially considerable improvement, as opposed to current methods based on global climate curve temperature, this methodology presents some technical challenges that remain to be tackled.

How to cite: Tardif, D., Sepulchre, P., Condamine, F., and Thomas, C.: Exploring Cenozoic vegetation cover and paleobiodiversity evolution induced by paleogeography and climate change, EGU General Assembly 2023, Vienna, Austria, 23–28 Apr 2023, EGU23-15740, https://doi.org/10.5194/egusphere-egu23-15740, 2023.

EGU23-15801 | ECS | Orals | CL1.1.4

Tropical Atlantic Ocean climate variability during the Miocene Climatic Optimum 

Evi Wubben, Bianca Spiering, Tjerk Veenstra, Remco Bos, Joost van Dijk, Joyce den Hollander, Zongyi Wang, Isabella Raffi, Jakub Witkowski, Frits Hilgen, Francesca Sangiorgi, Francien Peterse, and Appy Sluijs

The Miocene Climatic Optimum (MCO, ~17-15 Ma) was a relatively warm interval that interrupted the Cenozoic cooling trend and bears analogies with projected end-of-the-century climate. Proxy data and model simulations indicate temperatures were on average ~7 – 8°C higher than present day and atmospheric pCO2 values were 500-600 ppmV. At high latitudes, upper ocean temperatures were ~10 – 15°C warmer than present day, but available tropical temperature records are limited. Importantly, to be able to use Miocene paleoclimate records to quantify key climate parameters like the polar amplification of climate change, accurate reconstructions of tropical surface oceans are required.

We present high resolution Early to Middle Miocene (~15 – 18 Ma) records of tropical sea surface temperature (SST) variability based on the lipid biomarker paleothermometer TEX86 at Ocean Drilling Program (ODP) Site 959 in the eastern equatorial Atlantic Ocean and at ODP Site 1007 at Bahama Bank in the western tropical Atlantic Ocean. The age model for both sites is based on chemo- and biostratigraphy. Moreover, analyses of bulk carbonate oxygen- (δ18O) and stable carbon (δ13C) isotope ratios at ~2 – 4 kyr resolution at Site 959 facilitated orbital tuning to eccentricity, obliquity and precession. Bulk elemental composition records, total organic carbon concentrations and dinoflagellate cyst assemblages were also generated to assess paleoenvironmental change.

At both sites, warming associated with the onset of the MCO (~17 Ma) was identified as an average SST increase of ~2°C (using the TEX86-H calibration). At ~16.8 Ma, bulk carbonate δ13C gradually increased by ~1‰ at both sites, indicating the onset of the Monterey carbon isotope excursion. Combined with available temperature information from the high latitudes and deep ocean, we assess meridional temperature gradients across the MCO.

At ODP Site 959, sediments are characterized by alternations of biogenic silica, carbonates, and terrigenous material (i.e., clays). Following the onset of the MCO (~17 – 16.5 Ma), high variability in the oceanographical setting is reflected in striking Babio peaks, indicating productivity changes. These peaks coincide with lowest SSTs (~28°C) and increased dust supply (increased Fe and Ti) on precession and obliquity timescales. In the same interval, (inner-) neritic dinoflagellate species indicate increased water column stratification. Heterotrophic dinocyst groups vary on timescales coherent with the other geochemical records, relative to comparably stable background abundances of oceanic genera throughout the MCO. Combined, this suggests that a highly dynamic monsoon-driven upwelling regime was present at Site 959 during the MCO. Combined, these patterns imply a highly dynamic African monsoon-driven upwelling regime that intensified at the onset of the MCO.

How to cite: Wubben, E., Spiering, B., Veenstra, T., Bos, R., van Dijk, J., den Hollander, J., Wang, Z., Raffi, I., Witkowski, J., Hilgen, F., Sangiorgi, F., Peterse, F., and Sluijs, A.: Tropical Atlantic Ocean climate variability during the Miocene Climatic Optimum, EGU General Assembly 2023, Vienna, Austria, 23–28 Apr 2023, EGU23-15801, https://doi.org/10.5194/egusphere-egu23-15801, 2023.

EGU23-15934 | Posters on site | CL1.1.4

Impacts of tidally-driven mixing on the Early Eocene Ocean 

Jean-Baptiste Ladant, Jeanne Millot-Weil, Yannick Donnadieu, Casimir de Lavergne, and Mattias Green

Mixing in the ocean interior is largely fueled by internal tides that bring energy available for the irreversible mixing of the deep ocean. However, the inclusion of mixing schemes to represent the breaking of internal waves is not always included in ocean and earth system models, a fortiori in models applied to the deep-time for which estimates of the energy dissipated by the tides are not always available. Here, we present and analyze two IPSLCM5A2 earth system model simulations of the Early Eocene made under the framework of DeepMIP, which differ by the inclusion of the tidally-driven dissipation estimates of Green and Huber (2013) in one of the simulations. We particularly focus on possible changes in the intensity of the ocean circulation and water mass characteristics and pathways as well as on the implications of the absence of tidally-driven mixing for the marine biogeochemistry.

How to cite: Ladant, J.-B., Millot-Weil, J., Donnadieu, Y., de Lavergne, C., and Green, M.: Impacts of tidally-driven mixing on the Early Eocene Ocean, EGU General Assembly 2023, Vienna, Austria, 23–28 Apr 2023, EGU23-15934, https://doi.org/10.5194/egusphere-egu23-15934, 2023.

EGU23-16108 | ECS | Orals | CL1.1.4

Resilience and implications of an Antarctic monsoon during the Eocene 

Michiel Baatsen, Anna von der Heydt, Peter Bijl, Appy Sluijs, and Henk Dijkstra

High latitude warmth during the Eocene greenhouse climate has posed many challenges for climate modelling studies. Recent improvements in both the proxy records and model simulations are bringing these closer together, particularly regarding the meridional temperature gradient. Yet, it remains difficult to understand the climatic conditions around the greenhouse-icehouse transition which involved the glaciation of Antarctica. How can we explain indications of ice near the Antarctic coast well before the transition, especially since Antarctic glaciation is thought to express strong hysteresis? How did Antarctica remain mostly ice-free and vegetated through large climatic swings during the Eocene? If Antarctic warmth was so resilient, which process was responsible for its eventual demise?

We consider a set of existing climate simulations for the middle-to-late Eocene (42-34Ma) using the CESM model (Baatsen et al. 2020)1. The original set of simulations was expanded to include possible scenarios of orbital forcing, atmospheric composition, and the continental geometry. In addition, we look at the output from DeepMIP simulations for the early Eocene. Using these results, we make a detailed study of the Antarctic climate and find that most of the continent saw monsoonal conditions during the Eocene. Only a small corridor near the coast experienced perennially mild and wet conditions, explaining the presence of temperate to paratropical vegetation. Further inland, we see a rapid increase in temperature seasonality along with the appearance of a summer monsoon. Summertime warmth made most of the Antarctic continent a hostile place for any significant ice growth. Meanwhile, mountainous regions near the coast were suitable candidates for the formation of ice caps that may have grown substantially during cooler intervals.

Our simulations can explain seemingly contradictory indications from proxy records, as well as strong regional variations in the Antarctic climate. The monsoonal nature of this climate during the Eocene proves to be particularly resilient to the changes in external forcing considered here. Identifying the potential mechanism to break up the monsoonal regime and eventually lead to Antarctic glaciation remains the subject of ongoing work.

1. Baatsen, M., von der Heydt, A. S., Huber, M., Kliphuis, M. A., Bijl, P. K., Sluijs, A., & Dijkstra, H. A. (2020). The middle to late Eocene greenhouse climate modelled using the CESM 1.0.5. Climate of the Past, 16(6), 2573–2597. doi: 10.5194/cp-16-2573-2020.

How to cite: Baatsen, M., von der Heydt, A., Bijl, P., Sluijs, A., and Dijkstra, H.: Resilience and implications of an Antarctic monsoon during the Eocene, EGU General Assembly 2023, Vienna, Austria, 23–28 Apr 2023, EGU23-16108, https://doi.org/10.5194/egusphere-egu23-16108, 2023.

We discuss the construction of a global climatological reconstruction of the mid-Pliocene Warm Period, which is the focus of the current PlioMIP (around 3.2 Ma BP). Our method uses an ensemble Kalman smoother to blend fields of model output, generated here by two generations of the PlioMIP project, with sparse proxy-based estimates of temperature. The methodology was previously presented by Annan et al 2022 in application to the Last Glacial Maximum. In this presentation we contrast results obtained from two different data compilations. Firstly we use the PRISM proxy estimates for sea surface temperature from an interval 15ka either side of MIS KM5c (Foley and Dowsett 2019, Haywood et al 2020), that is 3.205+-0.015Ma. This contains 34 data points on the 5x5 degree grid that we use for our analysis. We contrast this with analyses performed in the PlioVAR project (McClymont et al 2019) covering a slightly narrower interval of 3.205+-0.01Ma. These analyses are based on a different age model and multiple calibrations of UK37 and Mg/Ca. The full data set contains 31 gridded data points.

Using the PRISM data, our estimate of the global temperature anomaly is considerably warmer than most previous estimates, suggesting a significant discrepancy between the models and the data. Further calculations suggest that the PlioVAR data show more consistency with the models, but uncertainty remains high. We discuss the implications of this for the creation of reliable climate reconstructions.

How to cite: Hargreaves, J., Annan, J., Mauritsen, T., and McClymont, E.: Reconstructing the surface temperature fields of the mid-Pliocene Warm Period using climate models and a variety of climate proxy data sets., EGU General Assembly 2023, Vienna, Austria, 23–28 Apr 2023, EGU23-16121, https://doi.org/10.5194/egusphere-egu23-16121, 2023.

EGU23-16165 | ECS | Orals | CL1.1.4

Hydrological upheaval across multiple early Eocene hyperthermal events in the north African arid zone 

Chris Fokkema, Tobias Agterhuis, Liam Kelly, Agnese Mannucci, Basse Theijse, Or Bialik, Peter Bijl, Henk Brinkhuis, Gerald Dickens, Simone Galeotti, Francien Peterse, and Appy Sluijs

Rapid climatic and carbon cycle upheavals in the early Eocene have been of strong interest for the past decades. Multiple of these events represent global warming events (i.e. hyperthermals), including the Paleocene Eocene Thermal Maximum (PETM; 56 Ma), but global data coverage is still too limited to fully resolve the spatial patterns of climate, ecosystems and hydrology for the other hyperthermals. This is particularly due to the lack of continuous continental margin sequences suitable for high-resolution paleoclimate reconstructions.

We present high-resolution, multi-proxy records of climatic and environmental changes across multiple hyperthermals from Core RH-323, Northern Negev Desert, Israel. Lower Eocene sediments, dominantly orbitally paced alternations of marls and chalk, were deposited in the Tethys Ocean at a latitude of ~15º N, on the northward dipping slope of the presumably dry northern bound of the African continent. They provide a unique opportunity to capture tropical climate variability and continental-hydrological response to hyperthermals. We reconstruct regional variability of (sub)surface temperature, plankton ecology and continental hydrology by TEX86 paleothermometry, bulk carbonate isotope ratios, magnetic susceptibility, bulk-XRF and dinoflagellate cyst (dinocyst) assemblages.

We identify various hyperthermal events, including the PETM, ETM2 and ETM3, based on combined chemo- and biostratigraphy. During the PETM, TEX86-based temperatures indicate a warming of 3­–4 ºC, coinciding with a high abundance of representatives of the classic warm water dinocyst genus Apectodinium. The PETM is marked by a thin marl-rich interval at the onset, followed by a carbonate-rich interval during the body, suggesting very different hydrological forcing of siliciclastic input than recorded at mid-latitude sites. We interpret this to reflect strong seasonality (possibly monsoon like) with periods of intense precipitation followed by prolonged drought. Interestingly, subsequent smaller hyperthermals seem to predominantly coincide with increased siliciclastic content, thus representing episodes of increased (seasonal) precipitation.

How to cite: Fokkema, C., Agterhuis, T., Kelly, L., Mannucci, A., Theijse, B., Bialik, O., Bijl, P., Brinkhuis, H., Dickens, G., Galeotti, S., Peterse, F., and Sluijs, A.: Hydrological upheaval across multiple early Eocene hyperthermal events in the north African arid zone, EGU General Assembly 2023, Vienna, Austria, 23–28 Apr 2023, EGU23-16165, https://doi.org/10.5194/egusphere-egu23-16165, 2023.

EGU23-16774 | ECS | Orals | CL1.1.4

Long term Paleogene increase in precipitation intermittency and intensity at mid-latitudes 

Jacob Slawson and Piret Plink-Bjorklund

As the world warms due to rising greenhouse gas concentrations, the Earth system moves toward a climate state without societal precedent. Unmitigated scenarios of emissions produce climates like those of the Early Eocene by 2150 CE. Terrestrial records of rivers and floodplains from numerous Paleogene sedimentary basins in the US Western interior and Europe indicate an increase in flash floods and droughts at paleo mid latitudes, indicating increased precipitation intensity and intermittency. A global synthesis of Paleogene precipitation proxies allows us to reconstruct the timing of changes in hydroclimate from Paleocene to the Paleocene-Eocene Thermal Maximum (PETM) and through the Early Eocene Climatic Optimum (EECO). We observe that the largest shifts in hydroclimate are not linked to the PETM but rather occur during the warm late Paleocene and then at the end of the EECO. This is indicated by sedimentological proxies from paleo rivers and floodplains, paleosol geochemical proxies, and biological proxies. The sedimentological proxies indicate a shift from normal rivers, such as are characteristic at mid-latitudes today, to flood-prone rivers in late Paleocene, such as are characteristic in subtropics today. In the flood-prone Paleogene rivers sediment transport occurred during flashy floods. The rivers shifted back to normal at the end of the EECO. Paleocene and early Eocene paleosols indicate sustained droughts and intermittent seasonal rains. Biological proxies indicate large water table fluctuations and shifts in vegetation types. At PETM there is no change in the state of hydroclimate, but rather a further intensification of floods and droughts. These results show that current global warming is likely to cause intensification of precipitation intermittency and intensity at mid-latitudes with significant effects on water availability and agriculture. The most dramatic shifts in hydroclimate were not linked to the largest amplitude of atmospheric drivers at the PETM, but rather suggest a threshold-driven relationship between the atmospheric drivers and hydroclimate. This may suggest that significant changes in hydroclimate are to be expected already before 2150 CE. 

How to cite: Slawson, J. and Plink-Bjorklund, P.: Long term Paleogene increase in precipitation intermittency and intensity at mid-latitudes, EGU General Assembly 2023, Vienna, Austria, 23–28 Apr 2023, EGU23-16774, https://doi.org/10.5194/egusphere-egu23-16774, 2023.

The erosion of mountain landscapes is the greatest source of terrestrial sediment to global ocean basins and a critical part of the global carbon cycle regulating Earth’s climate over geologically relevant timescales. In particular, the expansion of mountain glaciers may accelerate bedrock erosion and rapidly increase the flux of terrestrial sediment from source areas. However, the mechanisms by which glaciation augments sediment flux are complex, and understanding them requires further research. Our research adopts a novel approach to determine the source of sediment in rivers exiting a glaciated landscape, combining detrital zircon fission-track “tracer” thermochronology and Raman spectroscopy of carbonaceous material (RSCM). Our research focuses on the Southern Alps of New Zealand as a model landscape with well-constrained lithology and a predictable exhumation gradient. In 5 west-draining transverse river catchments, we test the hypothesis that modern sediment is preferentially derived from glaciated, high-elevation areas of the catchment. Our 5 rivers span a range of glacial coverage, allowing us to further test the hypothesis that glacially-sourced sediment increases with the degree of glaciation in the catchment. Our preliminary results suggest that sediment is not exclusively derived from glaciated areas of the catchment, but may instead reflect additional deglaciated source areas affected by landsliding, possibly induced by seismicity along the Alpine Fault. Our research demonstrates a powerful and novel approach to tracing sediment sources within an individual catchment area and highlights complex interrelationships between mountain glaciation and changes in the magnitude and sources of sediment fluxes.

How to cite: Harris, D.-A., Lang, K., Roda Boluda, D., and Kurth, M.: Tracing sediment source within a glaciated landscape: new observations from detrital thermochronology and Raman spectroscopy in the Southern Alps of New Zealand, EGU General Assembly 2023, Vienna, Austria, 23–28 Apr 2023, EGU23-581, https://doi.org/10.5194/egusphere-egu23-581, 2023.

EGU23-1082 | ECS | Orals | GMPV1.2

Shocker: xenotime can date impacts 

Cilva Joseph, Denis Fougerouse, Aaron J. Cavosie, Hugo K. H. Olierook, Steven M. Reddy, Raiza R. Quintero, Allen Kennedy, David W. Saxey, and William D.A. Rickard

Constraining precise ages for impact events is crucial in establishing Earth’s history, and several geochronometers have been developed to date impacts. We present electron backscatter diffraction (EBSD), sensitive high-resolution ion microprobe (SHRIMP) and atom probe tomography (APT) data from shocked xenotime [(Y,HREE)PO4] collected from two impact sites to investigate the potential of xenotime as an impact geochronometer. A detrital xenotime grain from the Vredefort dome (South Africa) contains planar fractures, planar deformation bands and {112} twinning, the latter of which are diagnostic shock microstructures. However, APT analysis from the twin domains and also from the host yielded no evidence of Pb mobility at the nanometer scale during the impact. SHRIMP analysis (n=24) on the grain yielded a discordia with an upper intercept of 3136 ± 110 Ma and an imprecise lower intercept of 1793 ± 280 Ma. These correspond, respectively, to the bedrock age and a post-impact, cryptic terrane-wide fluid infiltration event. Three neoblastic grains from the Araguainha dome (Brazil) experienced partial to complete recrystallisation. The least recrystallised grain yields the oldest 238U/206Pb age of 479 ± 26 Ma, whereas a completely recrystallised neoblastic grain gave an age of 257 ± 11 Ma.  APT analysis on the latter grain showed different nanoscale features that shed light on Pb mobility during shock deformation and recrystallisation.  Based on observations of nanoscale Pb mobility and the correlation between recrystallisation and isotopic resetting, and prior published ages, we interpret 257 ± 11 Ma to date the impact event. These data confirm that recrystallised neoblastic xenotime is a useful impact geochronometer. 

How to cite: Joseph, C., Fougerouse, D., J. Cavosie, A., K. H. Olierook, H., M. Reddy, S., R. Quintero, R., Kennedy, A., W. Saxey, D., and D.A. Rickard, W.: Shocker: xenotime can date impacts, EGU General Assembly 2023, Vienna, Austria, 23–28 Apr 2023, EGU23-1082, https://doi.org/10.5194/egusphere-egu23-1082, 2023.

EGU23-1147 | ECS | Orals | GMPV1.2

A detective duo; an apatite–zircon case study of the Johnston Complex, Wales 

Anthony Clarke, Chris Kirkland, and Stijn Glorie

Determining the crystallization of S-type granitic material can be challenging due to a lack of neoblastic zircon growth (e.g. thin overgrowths) and the potential of large inherited zircon cargos. Coupled apatite–zircon geochronology can help address such complexities and also clarify post-magmatic thermal history, given the disparate Pb closure temperatures in these minerals. Here we present a case study on the Johnston Complex, a rare outcrop of the Precambrian basement in southern Britain, representing a window into the tectonic regime of Avalonia. Zircon and apatite yield identical U-Pb ages, within uncertainty, of 569 ± 2 Ma and 576 ± 11 Ma, respectively. A minor antecrystic zircon core component is identified at 615 ± 11 Ma. Given the previously reported zircon U-Pb age of 643 Ma, these results demonstrate that the Complex represents a composite suite of plutons along its ca. 20 km length. Zircon Lu-Hf data imply a broadly chondritic source, with model ages consistent with crustal extraction during Rodinia formation. Zircon trace elements are consistent with a calc-alkaline continental magmatic arc setting. Whilst, apatite trace elements demonstrate a sedimentary component within the melt. Combined, these results support arc granite production within the peri-Gondwanan realm during amalgamation of Eastern Avalonia and associates the Johnston Complex to the Cymru subterrane. Importantly, congruent zircon–apatite ages imply rapid cooling after crystallisation, and that subsequent thermal heating did not exceed the apatite Pb closure temperature.

How to cite: Clarke, A., Kirkland, C., and Glorie, S.: A detective duo; an apatite–zircon case study of the Johnston Complex, Wales, EGU General Assembly 2023, Vienna, Austria, 23–28 Apr 2023, EGU23-1147, https://doi.org/10.5194/egusphere-egu23-1147, 2023.

EGU23-1262 | ECS | Orals | GMPV1.2

Revealing the hidden Mesozoic exhumation history of the Qinling orogenic belt, Central China: insights from multiple geochronological and geochemical data of the molasse granitic gravels 

Heng Peng, Jianqiang Wang, Chiyang Liu, Jiaoli Li, Xiaoqin Jiao, Liying Zhang, and Massimiliano Zattin

Qinling Orogenic Belt with its Meso-Cenozoic intracontinental orogeny and uplift, is a key physiographic element that characterized the differential evolution of the geology, geography and climate in continental China (Dong et al., 2022). However, numerous thermochronological dates of the Qinling bedrocks (Dong et al., 2011; Yang et al., 2017) show that there is a wide cooling gap between Triassic and Early Cretaceous. In this study, we studied this gap by multiple geochronology and geochemistry on Lower Cretaceous molasse granitic gravel samples, with the aim to recover the hidden Mesozoic exhumation history. We report the first detailed zircon U-Pb ages, whole-rock major and trace elements and Sr-Nd-Pb isotopic data, which suggest that these clasts derive from Late Triassic I-type granites which were emplaced in a syn-collisional setting during a subduction phase. Their provenances were also determined by comparison with the geochemical fingerprint of Qinling granitic bedrocks. New zircon and apatite U-Pb, (U-Th)/He and fission-track data, as well as biotite 40Ar-39Ar, were performed on the granitic gravels dated between ca. 222 Ma to 110 Ma. Thermal history modeling, based on the multiple geochronological data, shows rapid cooling from ca. 700 °C to 200 °C during Late Triassic-Early Jurassic, then followed by a period of slow cooling from Middle Jurassic to Early Cretaceous.

As a whole, our new multiple geochronological and geochemical data and the related thermal history modeling results provide new insights on the prolonged pre-Cenozoic cooling history as well as the intracontinental deformation of the Qinling, which were mostly related to Paleo-Tethyan subduction and Late Triassic North China-South China Block collision.

Reference:

Dong, Y., Genser, J., Neubauer, F., Zhang, G., Liu, X., Yang, Z. and Heberer, B., 2011. U-Pb and 40Ar/39Ar geochronological constraints on the exhumation history of the North Qinling terrane, China. Gondwana Research, 19(4): 881-893.

Dong, Y., Sun, S., Santosh, M., Hui, B., Sun, J., Zhang, F., Cheng, B., Yang, Z., Shi, X., He, D., Yang, L., Cheng, C., Liu, X., Zhou, X., Wang, W. and Qi, N., 2022. Cross Orogenic Belts in Central China: Implications for the tectonic and paleogeographic evolution of the East Asian continental collage. Gondwana Research, 109: 18-88.

Yang, Z., Shen, C., Ratschbacher, L., Enkelmann, E., Jonckheere, R., Wauschkuhn, B. and Dong, Y., 2017. Sichuan Basin and beyond: Eastward foreland growth of the Tibetan Plateau from an integration of Late Cretaceous-Cenozoic fission track and (U-Th)/He ages of the eastern Tibetan Plateau, Qinling, and Daba Shan. Journal of Geophysical Research: Solid Earth, 122(6): 4712-4740.

How to cite: Peng, H., Wang, J., Liu, C., Li, J., Jiao, X., Zhang, L., and Zattin, M.: Revealing the hidden Mesozoic exhumation history of the Qinling orogenic belt, Central China: insights from multiple geochronological and geochemical data of the molasse granitic gravels, EGU General Assembly 2023, Vienna, Austria, 23–28 Apr 2023, EGU23-1262, https://doi.org/10.5194/egusphere-egu23-1262, 2023.

EGU23-1407 | Posters on site | GMPV1.2

Rift propagation in south Tibet controlled by under-thrusting of India: A case study at the Tangra Yumco graben (south Tibet) 

Ralf Hetzel, Reinhard Wolff, Kyra Hölzer, István Dunkl, Qiang Xu, Aneta Anczkiewicz, and Zhenyu Li

Active graben systems in south Tibet and the Himalaya are the expression of ongoing E-W extension, however, the cause and spatio-temporal evolution of normal faulting remain debated. We reconstruct the history of normal faulting at the southern Tangra Yumco graben by using new thermochronological data and thermo-kinematic modelling (Wolff et al., 2022). The Miocene cooling history of the footwall of the main graben-bounding fault is constrained by zircon (U-Th)/He ages between 16.7±1.0 and 13.3±0.6 Ma, apatite fission track ages (15.9±2.1 to 13.0±2.1 Ma), and apatite (U-Th)/He ages (7.9±0.4 to 5.3±0.3 Ma). Thermo-kinematic modelling of the data indicates that normal faulting began 19.0±1.1 Ma ago at a rate of ~0.2 km/Myr and accelerated to ~0.4 km/Myr at ~5 Ma. In the northern Tangra Yumco rift, re-modelling of published thermochronological data (Wolff et al., 2019) shows that faulting started ~5 Ma later at 13.9±0.8 Ma. The age difference and the distance of 130 km between the two sites indicates that rifting and normal faulting propagated northward at an average rate of ~25 km/Myr. As this rate is similar to the Miocene convergence rate between India and south Tibet, we argue that the under-thrusting of India beneath Tibet has exerted an important control on the propagation of rifts in south Tibet.

References

Wolff, R., Hetzel, R., Hölzer, K., Dunkl, I., Xu, Q., Anczkiewicz, A.A., Li, Z. (2022). Rift propagation in south Tibet controlled by underthrusting of India: A case study at the Tangra Yumco graben (south Tibet). J. Geol. Soc. Lond., https://doi.org/10.1144/jgs2022-090.

Wolff, R., Hetzel, R., Dunkl, I., Xu, Q., Bröcker, M. & Anczkiewicz, A.A. (2019). High-angle normal faulting at the Tangra Yumco graben (southern Tibet) since ~15 Ma. J. Geology, 127, 15–36, http://doi.org/10.1086/700406.


How to cite: Hetzel, R., Wolff, R., Hölzer, K., Dunkl, I., Xu, Q., Anczkiewicz, A., and Li, Z.: Rift propagation in south Tibet controlled by under-thrusting of India: A case study at the Tangra Yumco graben (south Tibet), EGU General Assembly 2023, Vienna, Austria, 23–28 Apr 2023, EGU23-1407, https://doi.org/10.5194/egusphere-egu23-1407, 2023.

Silicic magma flare-up episodes are characterized by the addition of large volumes of evolved magma (>65 wt% SiO2) to the continental crust in geologically short time intervals (106-107 years). Flare-up events are often associated with (trans-)extensional tectonics and contribute to crustal differentiation and critical metal mineralization. Related volcanic aerosol dispersion in the atmosphere can also trigger global environmental changes. During flare-up episodes, long-lived caldera complexes are thought to be primary eruptive sources at the Earth’s surface. However, a substantial proportion of the overall mobile magma can be trapped in extra-caldera dikes, fissures and monogenetic edifices controlled by the extensional stress regime.

In the Southern Alps of Northern Italy, a post-Variscan magmatic flare-up is recorded in a ca. 400 km long array of largely undeformed magmatic bodies of Early Permian age (285-275 Ma; [1]), then located along the northern margin of Gondwana. In the Southern Alps this flare-up produced more than 5*104 km3 of rhyolitic volcanic and cogenetic intrusive rocks. Two major caldera complexes (Sesia Caldera; Ora Caldera) were capable of ejecting volumes >103 km3 of magma during individual catastrophic eruptive events. However, magmatic activity also resulted in numerous scattered volcanic centers with relatively small eruptions (0.1 – 1 km3 each) and punctuated by quiescent intervals.

In this study we focus on two Early Permian fault-bounded basins, ca. 40 km apart, in the central Southern Alps: the Orobic Basin (Bergamo) and the Collio Basin (Brescia). The stratigraphic records of both basins preserve proximal and distal volcanic products and both successions terminate with erosional unconformities of Middle- to Late Permian age. New zircon LA-ICP-MS U-Pb ages indicate that the onset of explosive, rhyolitic magmatism was essentially coeval at ~284 Ma. The Collio Basin contains just a few ignimbrite sheets dispersed in an essentially (fluvio)-lacustrine sedimentary fill and recording a pulsated volcanic activity of nearly 5 Myr (youngest ignimbrite ~280 Ma). After an initial phase (1-2 Myr) of a similar pulsed nature, the Orobic Basin became the locus of extrusion of much larger volumes of rhyolitic magma (probably in excess of 100 km3) in less than 1 Myr (283-282 Ma). This was followed by a depositional style similar to the Collio but with a scarcer pyroclastic contribution.

The contrasting volcanic record in these two basins, which share size and tectonic environment but not magmatic evolution, provides a striking example of magmatic architecture diversity in the midst of a silicic flare-up event. Further investigation into the timing (CA-ID-TIMS U-Pb geochronology) and compositional evolution (e.g., zircon d18O, eHf) of volcanic products in the Collio and Orobic basins is expected to provide a much better resolved comparison and open a window into the combined tectono-magmatic processes that ultimately regulate the size and frequency of catastrophic, caldera-forming eruptions in silicic flare-up provinces.

[1] Schaltegger, U., & Brack, P. (2007). International Journal of Earth Sciences, 96(6), 1131-1151.

How to cite: Tavazzani, L., Szymanowski, D., Forni, F., Cadel, G., and Brack, P.: Magmatic architecture and basin evolution in the midst of a silicic flare-up: U-Pb zircon geochronology of volcanic deposits from two Early Permian, Collio-type basins of Southern Alps (Italy), EGU General Assembly 2023, Vienna, Austria, 23–28 Apr 2023, EGU23-1426, https://doi.org/10.5194/egusphere-egu23-1426, 2023.

EGU23-1931 | Orals | GMPV1.2

Ultra-slow cooling of ultra-hot orogens 

Chris Clark, Michael Brown, Tim Johnson, Ruairidh Mitchell, and Saibal Gupta

The rate of cooling of metamorphic rocks provides a first-order constraint on the tectonic processes controlling heat flow and exhumation. For example, for small crustal terranes that were subducted to ultrahigh pressure conditions during the early stages of collisional orogenesis, exhumation is generally fast with rates similar to plate velocities, such that cooling is also rapid. Similarly, rates of cooling are commonly fast (generally ~20–30°C/Myr) during exhumation of metamorphic core complexes or due to transpression. By contrast, cooling in some granulite terranes can be slow and close-to-isobaric, leading to time-integrated cooling rates of <5°C/Myr. The implication of such slow rates of cooling is that these granulite terranes were close to isostatic equilibrium as a result of sustained high mantle heat flow that limited exhumation by erosion. However, constraining initial cooling rates in granulite terranes can be difficult, particularly where the rocks reached ultrahigh temperatures (>900 °C) that exceed the closure temperature of many geochronometers. In order to overcome this difficulty, we combine U–Pb zircon geochronology with Ti-in-zircon thermometry to investigate the thermal history of metapelitic rocks from the Eastern Ghats Province of eastern India. For the combined dataset of metamorphic zircon from the samples, concordant dates decrease continuously within 2σ uncertainty from around 950 Ma to 800 Ma, consistent with c. 150 Ma of zircon crystallization. Ti-in-zircon temperatures for each dated spot during this period decrease with age, corresponding to linear cooling rates ranging from 0.26 to 0.90°C/Myr. We propose that retention of heat producing elements in the lower crust of the Eastern Ghats Province and a low net erosion rate were responsible for c. 150 Myr of ultra-slow cooling. The location of the Eastern Ghats Province on the margin of the supercontinent Rodinia may have been a contributing factor enabling the region to remain relatively undisturbed until it was exhumed during the formation of Gondwana.

How to cite: Clark, C., Brown, M., Johnson, T., Mitchell, R., and Gupta, S.: Ultra-slow cooling of ultra-hot orogens, EGU General Assembly 2023, Vienna, Austria, 23–28 Apr 2023, EGU23-1931, https://doi.org/10.5194/egusphere-egu23-1931, 2023.

EGU23-1954 | Orals | GMPV1.2

Statistical analysis of Europium anomalies in detrital zircons record major transitions in Earth geodynamics at 2.5 Ga and 0.9 Ga 

Antoine Triantafyllou, Mihai Ducea, Gilby Jepson, Alex Bisch, and Jerome Ganne

Trace elements in zircon are a promising proxy to quantitatively study long-term Earth’s lithospheric processes and its geodynamic regimes. The zircon Eu anomaly reflects the crystallization environment of its felsic or intermediate parental magma. It specifically provides insight into the water content, magmatic redox conditions, and the extent of pla­gioclase fractionation in the source rock or its occurrence as a cogenetic crystallizing phase from the magma. We performed a statistical analysis of Eu anomaly from a global compilation of detrital zircons and display it as a timeseries and found a major decrease in Eu anomaly ca. 2.5 Ga and an important increase ca. 0.9 Ga. Combining these trends with thermodynamic modelling, we suggest that these variations could be due to long-term change in the chemical system of the mafic source from which the intermediate to felsic melt and derived zircons are produced. The 2.5 Ga drop was likely associated with an enrichment in incompatible elements in the mafic source, which extended the pressure-temperature field of plagioclase stability as a cogenetic melt phase. We interpret the 0.9 Ga rise to record increasing hydration of magmagenetic sites due to the general development of cold subduction systems, which would delay and/or suppress the saturation of plagioclase in hydrous magmagenetic sites.

How to cite: Triantafyllou, A., Ducea, M., Jepson, G., Bisch, A., and Ganne, J.: Statistical analysis of Europium anomalies in detrital zircons record major transitions in Earth geodynamics at 2.5 Ga and 0.9 Ga, EGU General Assembly 2023, Vienna, Austria, 23–28 Apr 2023, EGU23-1954, https://doi.org/10.5194/egusphere-egu23-1954, 2023.

EGU23-2154 | ECS | Orals | GMPV1.2

Multiple dates in millimetres; diffusion as an explanation for Rb-Sr age discrepancies in biotite 

Riley Rohrer, Chris Clark, Chris Kirkland, and Tim Johnson

In situ analysis of the Rb–Sr isotopic composition of biotite via triple quadropole LA–ICPMS is an increasingly popular method for constraining the time through the Sr closure temperature in rocks. Although interpreting the radiogenic product can be complicated by various factors that can affect diffusion of Rb and Sr, the role of the different minerals that may be in contact with biotite in regard to local diffusion gradients is poorly understood. In this study, we show the importance of analysing Rb–Sr isotopic data in the context of detailed petrographic observations, which reveals that the ratios obtained are affected by various diffusion pathways between like material and minerals that preferentially incorporate Sr. The studied samples are metapelites from the Fraser Zone (Western Australia) that have peak metamorphic conditions of about 850 °C and 9 kbar and a history of cryptic biotite Ar-Ar ages of ~1205 Ma, which on face value could imply exhumation rates that are some of the fastest recorded in Earth’s history. However, new biotite data from in-situ Rb-Sr analysis highlights differences in Sr retentivity. While calculated isochrons may at first yield large errors, sorting based on the location of the grains in terms of surrounding minerals yields a possible solution for varying Sr values skewing the ages in the sample. This results in an average age of 1205 Ma for biotite and sillimanite surrounded grains and 1107 Ma, from biotite and sillimanite surrounded grains and quartz and K-feldspar surrounded grains. This shows that the diffusive properties of Sr between biotite and the surrounding minerals creating variable re-equilibration between the different domains surrounding biotite. The complexities of Sr diffusion within between the various phases are still unknown, but the apparent effect between the surrounding material on the biotite and the measured initial Sr values does play a key factor in the final calculated ages and the interpretations they represent.

How to cite: Rohrer, R., Clark, C., Kirkland, C., and Johnson, T.: Multiple dates in millimetres; diffusion as an explanation for Rb-Sr age discrepancies in biotite, EGU General Assembly 2023, Vienna, Austria, 23–28 Apr 2023, EGU23-2154, https://doi.org/10.5194/egusphere-egu23-2154, 2023.

The Austroalpine nappes in the Eastern European Alps have preserved the record of two orogenic phases in the Cretaceous and Tertiary but their cooling and exhumation history remains poorly constrained. Here we use new low-temperature thermochronological data and thermokinematic modeling to unravel the exhumation history of the Austroalpine nappes in the Nock Mountains east of the Tauern Window (Wölfler et al., submitted). Our data show that the central Nock Mountains (Ötztal-Bundschuh and Drauzug-Gurktal nappes) cooled through the zircon fission track closure temperature (~240 °C) already in the Late Cretaceous. Apatite fission track ages cluster around 35-30 Ma, indicating that the rocks have been at depths of ≤5-6 km since the Eocene-Oligocene boundary. In contrast, the Radenthein and Millstatt Complexes, which are located south of the Hochstuhl Fault, cooled below 240 °C during the Eocene and show apatite fission track ages of ~15 Ma. Thermokinematic modeling of an age-elevation profile in the central Nock Mountains (near Innerkrems) revealed a phase of enhanced exhumation (~0.62 km/Ma) between ~100 and ~85 Ma, which we relate to syn- to late-orogenic Late Cretaceous extension. After a period of slow exhumation (~0.03 km/Ma), the exhumation rate increased to ~0.16 km/Ma at ~32 Ma. In contrast, thermokinematic modeling of an age-elevation profile near Millstatt shows that rocks of the Radenthein and Millstatt Complexes were rapidly exhumed (~0.78 km/Ma) from ~44 Ma to ~38 Ma during the initial Europe-Adria collision. After a phase of slow exhumation (~0.07 km/Ma) between ~38 and ~19 Ma, the exhumation rate increased to ~0.3 km/Ma with the onset of Miocene lateral extrusion in the Eastern Alps. Altogether, ~16 km of rock have been removed since ~100 Ma in the Innerkrems region, whereas ~11 km of rock have been removed in the last ~44 Ma in the Millstatt area. These findings are consistent with pressure-temperature estimates for the Ötztal-Bundschuh nappe and the Radenthein/Millstatt Complexes, respectively (Koroknai et al., 1999; Schuster, 2003; Krenn et al., 2003, 2011). The distinct differences in the cooling histories north and south of the Hochstuhl Fault further suggest that this fault, which has hitherto been considered as a dextral strike-slip fault during Miocene lateral extrusion (Polinski & Eisbacher, 1992; Linzer et al., 2002), also accommodated a considerable amount of thrust movement. The difference between the amount of exhumation north and south of the Hochstuhl Fault indicates ca. 5 km of vertical offset between ~44 and ~38 Ma.

How to cite: Wölfler, A., Hampel, A., Wolff, R., Hetzel, R., and Dunkl, I.: Phases of enhanced exhumation during the Cretaceous and Tertiary orogenies in the Eastern European Alps: new insights from thermochronological data and thermokinematic modeling, EGU General Assembly 2023, Vienna, Austria, 23–28 Apr 2023, EGU23-2925, https://doi.org/10.5194/egusphere-egu23-2925, 2023.

EGU23-3132 | ECS | Orals | GMPV1.2

A new calibration of radiation damage control on He diffusivity in apatite: implications for (U-Th)/He thermochronology 

Alexis Derycke, Kerry Gallagher, and Cécile Gautheron

In low temperature thermochronology, reliable interpretation of (U-Th)/He data is controlled by our understanding of helium diffusion in a crystal. The diffusion kinetics can be simulated through the classic Arrhenius-type equation, with parameters frequency factor Do and activation energy Ea (Farley, 2000). For apatite, it has been demonstrated that accumulated radiation damage perturbed the Arrhenius-type equation and exerts a strong control on He diffusion. Two models have been developed to parameterise the evolution of diffusion kinetics in apatite in terms of accumulated radiation damage: one based on the physical phenomenon (Gautheron et al., 2009) and the other calibrated on empirical observations (Flowers et al., 2009). As the amount of radiation damage depends on both time (U and Th decay producing damage) and temperature (annealing of radiation damage), both of these models are routinely used to interpret apatite (U-Th)/He data in terms of thermal histories. However, results obtained from inverse thermal history modelling with these two models can differ and be inconsistent with other low thermochronological data (e.g., apatite fission tracks). In this contribution we present a new radiation damage-based diffusion model that combines the approaches of both the Gautheron et al. and Flowers et al. models.

Our new model is based on the theoretical diffusion model proposed by Gerin et al. (2017) but incorporates a new calibration from the available He diffusion experiment results. The Gerin et al. model is built on a theoretical understanding of the fundamental physical processes and predicts diffusion parameters for different levels of crystal lattice damage, using quantum calculus. We recalibrated this model through an empirical law based on real crystal mesh damage calculated from available experimental data. To test the reliability of the revised model and to compare it to the existing models, it was implemented in the modelling software, QTQt (Gallagher, 2012). Here we present results of both forward and inverse modelling to highlight the benefits of the new model. The results are assessed in terms of the impact for “deep time” (>500 Ma) thermochronology, in which accumulated radiation damage can have a significant control on the inferred thermal history models.


Farley, K.A., 2000. Helium diffusion from apatite: General behavior as illustrated by Durango fluorapatite. J. Geophys. Res. 105, 2903–2914. https://doi.org/10.1029/1999JB900348

Flowers, R.M., Ketcham, R.A., Shuster, D.L., Farley, K.A., 2009. Apatite (U–Th)/He thermochronometry using a radiation damage accumulation and annealing model. Geochimica et Cosmochimica Acta 73, 2347–2365. https://doi.org/10.1016/j.gca.2009.01.015

Gallagher, K., 2012. Transdimensional inverse thermal history modeling for quantitative thermochronology. Journal of Geophysical Research: Solid Earth 117, n/a-n/a. https://doi.org/10.1029/2011JB008825

Gautheron, C., Tassan-Got, L., Barbarand, J., Pagel, M., 2009. Effect of alpha-damage annealing on apatite (U–Th)/He thermochronology. Chemical Geology 266, 157–170. https://doi.org/10.1016/j.chemgeo.2009.06.001

Gerin, C., Gautheron, C., Oliviero, E., Bachelet, C., Mbongo Djimbi, D., Seydoux-Guillaume, A.-M., Tassan-Got, L., Sarda, P., Roques, J., Garrido, F., 2017. Influence of vacancy damage on He diffusion in apatite, investigated at atomic to mineralogical scales. Geochimica et Cosmochimica Acta 197, 87–103. https://doi.org/10.1016/j.gca.2016.10.018

How to cite: Derycke, A., Gallagher, K., and Gautheron, C.: A new calibration of radiation damage control on He diffusivity in apatite: implications for (U-Th)/He thermochronology, EGU General Assembly 2023, Vienna, Austria, 23–28 Apr 2023, EGU23-3132, https://doi.org/10.5194/egusphere-egu23-3132, 2023.

EGU23-3705 | ECS | Orals | GMPV1.2

Finding Quaternary Seismogenic Activity Along the Eastern Periadriatic Fault System: Dating of Fault Gouges via Trapped Charge Methods 

Erick Prince, Tsukamoto Sumiko, Grützner Christoph, Vrabec Marko, and Ustaszewski Kamil

The Periadriatic Fault System (PAF) is among the largest and most important post-collisional structures of the Alps; it accommodated between 150-300 km of right-lateral strike-slip motion between the European and Adriatic plates from about 35 until 15 Ma. Recent GPS data suggest that Adria-Europe convergence is still being accommodated in the Eastern Alps. However, according to instrumental and historical seismicity records, seismotectonic deformation is mostly concentrated in the adjacent Southern Alps. In this contribution, we present our first results for dating earthquakes along the PAF during the Quaternary by applying two trapped charge dating methods. Both Electron Spin Resonance (ESR) and Optically Stimulated Luminescence (OSL) are especially useful as ultra-low temperature thermochronometers due to their dating range (a few decades to ~1 Ma) and low closing temperature (below 100°C). We aim to show which segments of the PAF system accommodated seismotectonic deformation by directly dating quartz and feldspar from fault gouges. For ESR, we measure the signals from the Al center in quartz following the single aliquot additive (SAAD) and single aliquot regenerative (SAR) protocols, focusing on the 100-150 µm grain size fraction. For OSL, we measure the IRSL signal at 50°C (IR50) and the post-IR IRSL signal at 225°C (pIRIR225) on potassium feldspar aliquots of the 100-150 µm grain size fraction. Our ESR results indicate the PAF system accommodated seismotectonic deformation during the last 1 Ma, while the OSL signals for all samples were in saturation. The minimum ages obtained from OSL suggest that the events are likely not younger than 0.4 Ma. We also studied a segment of the nearby Lavanttal Fault, for which our ESR results suggest that the last earthquakes strong enough to produce sufficient shear heating to produce a partial reset on the geochronometer probably happened before 4 Ma.

How to cite: Prince, E., Sumiko, T., Christoph, G., Marko, V., and Kamil, U.: Finding Quaternary Seismogenic Activity Along the Eastern Periadriatic Fault System: Dating of Fault Gouges via Trapped Charge Methods, EGU General Assembly 2023, Vienna, Austria, 23–28 Apr 2023, EGU23-3705, https://doi.org/10.5194/egusphere-egu23-3705, 2023.

The Paricutin-Tancítaro region (PTR), located in the SW sector of the Michoacán-Guanajuato monogenetic field, in central Mexico, is characterized by a high spatial density of monogenetic scoria cones around Tancítaro, a stratovolcano active in the middle Pleistocene. The PTR area has been active for around one million years, and the latest eruption, beginning in 1943, formed the Paricutin volcano. We use the Average Erosion Index (AEI) to estimate the relative ages of 170 PTR scoria cones located within latitudes 19°N and 20°N and longitudes -102.0° E and -102.7° E. The AEI quantifies the erosional state of scoria cones from a morphological analysis of their level contours extracted from a high-resolution DEM (the 12-m TanDEM-X in this case). The analysis provides a metric for the undulations along the level contour curves at different altitudes, reflecting the width and amplitude of erosional rills and gullies on the cone’s surface. We compute a functional relationship between AEI and age by correlating 10 published radiometric ages with the measured AEIs of those cones. Then, using that function, we assign an age to each of the 170 cones, assuming that all the monogenetic volcanoes in the analysis have been exposed to similar erosive conditions. Finally, we tessellate the study area with a 0.1° x 0.1° grid and identify the number of events per grid module to compute the probability of at least one eruption occurring in the module in a specific time, using a Poisson process distribution obtained from the count of the number of events per 20 ky time intervals. Our results suggest that the dispersed volcanic activity in the PTR started to increase after the last eruption of Tancitaro (~237 ka), with a further activity increase during the Holocene, mainly concentrated on the NE sector of Tancítaro, where Paricutin is located. Holocene vents align to the NE, parallel to the Tepalcatepec-Tangancícuaro normal fault system. Furthermore, our results suggest a spatial coincidence between the regions with a higher probability of an eruption, based on the obtained eruption history, and the location of the recent seismic swarms in the PTR, the last two in 2020-2021, suggesting an increase in volcanic and seismic hazards in that area. To what extent? It is the subject of our forthcoming research.

How to cite: De la Cruz-Reyna, S.: Temporal and Spatial distribution of scoria cones in the Paricutin-Tancítaro volcanic region, Mexico: A morpho-chronometric approach to monogenetic hazard evaluation, EGU General Assembly 2023, Vienna, Austria, 23–28 Apr 2023, EGU23-4567, https://doi.org/10.5194/egusphere-egu23-4567, 2023.

40Ar/39Ar dating has been a valuable and widely used method for dating orogenic processes such as prograde and retrograde metamorphism and brittle and ductile deformation, through the analysis of K-bearing rock-forming minerals such as white mica. The in situ 40Ar/39Ar method, in which a short wavelength laser is used to ablate an analyte and deliver the liberated Ar to a noble gas spectrometer, is particularly valuable as an approach to dating deformation or metamorphism because it allows for targeting of specific chemical and structural domains, and the mapping of intragrain age distributions. Rb-Sr dating can also be applied to K-bearing minerals because of Rb’s propensity to substitute for K. The Rb-Sr method has been under-used in recent decades because the isobaric interference between parent 87Rb and daughter 87Sr has necessitated the chemical separation of Rb from Sr via ion exchange chromatography prior to mass spectrometric analysis, and hence bulk sampling of the target analyte. New tandem mass spectrometers, in which two quadrupoles are separated by an intervening reaction chamber into which a reactive gas can be introduced, have opened up the opportunity of applying laser-based in situ sampling approaches to beta decay geochronometers, including Rb-Sr (Zack and Hogmalm, 2016).

We have collected new in situ Rb/Sr data for white mica from three different tectono-metamorphic settings previously dated using the in situ 40Ar/39Ar method: recrystallization of white mica in a Paleozoic low-temperature ductile shear zone; development of multiple cleavage domains in low-temperature metamorphic rocks deformed in the Paleozoic, and; slow cooling of rocks following regional amphibolite-facies metamorphism in a Paleoproterozoic orogeny. , This allows a direct comparison between these two approaches, with the goal of exploring the functionality and utility of in situ Rb-Sr data, and testing geological interpretations based upon the in situ 40Ar/39Ar method. Our results show that the in situ Rb-Sr method is a highly complementary approach to the 40Ar/39Ar method for white mica, particularly in cases for which the target mica population has a large internal spread in Rb/Sr. allowing for the rigorous testing of assumptions and hypotheses about timing and conditions of rock cooling, deformation, and fluid events developed using 40Ar/39Ar datasets.


Zack, T. and Hogmalm, K.J., 2016. Laser ablation Rb/Sr dating by online chemical separation of Rb and Sr in an oxygen-filled reaction cell. Chemical Geology, 437, pp.120-133.

How to cite: Kellett, D., Larson, K., and Skipton, D.: Integration of in situ Rb-Sr and in situ 40Ar/39Ar dates under diverse tectono-metamorphic scenarios, EGU General Assembly 2023, Vienna, Austria, 23–28 Apr 2023, EGU23-5290, https://doi.org/10.5194/egusphere-egu23-5290, 2023.

EGU23-6766 | ECS | Posters on site | GMPV1.2

New high-resolution step heating experiments using a coupled Diode laser and thermocouple for thermochronology applications 

Julien Amalberti, Peter van der Beek, Cody Colleps, Maxime Bernard, and Isabel Wapenhans

Step-heating experiments constitute a key technique to study the release of volatile elements from geological materials as a function of temperature. In the case of noble gases (He, Ne, Ar, Kr, and Xe), step-heating is particularly useful to determine diffusion kinetics, structural defects, or spatial homogeneity within the material. These parameters are critical in the application of diffusion-based thermochronology such as the apatite (U-Th)/He system, where mapping out the spatial distribution of natural 4He provides crucial information on the thermal history of apatite crystals. Characterizing the diffusion and distribution of 4He via step-heating additionally has the potential to detect anomalously behaved grains and to directly constrain grain-to-grain variability in diffusivities within samples with significant radiation damage-induced age dispersion.

Within the ERC-funded COOLER project, we aim to further the development of high-resolution, ultra-low temperature 4He/3He thermochronology. To this end, we developed a new technique for precise step-heating experiments coupled with a diode laser including an inline single-wavelength pyrometer. The new protocol uses an all-alumina ceramic crucible fitted with a K-thermocouple ~0.1 mm below the center of the crucible pit. The head of the thermocouple is located directly below the sample within the ceramic matrix, allowing precise temperature measurements of the sample. The crucible is mounted on an alumina rod connected to a noble-gas preparation line. Gas released from the sample is purified and analyzed by a Thermo Scientific Helix SFT™ multi-collector mass spectrometer. The sample is wrapped in Pt foil and indirectly illuminated with a diode laser. Laser and PID temperature controls are carried out by a custom LabVIEW program. Temperature calibration is performed by comparing measured and theoretical melting points of well-known materials loaded in the alumina crucible pit.

Our initial results show very short response times for the thermocouple (a few seconds) and excellent agreement with the melting point of Indium (Tmelt = 157°C). Although the current design is limited to hold only a single sample, it enables precise calibration of the emissivity value for a specific capsule assembly, which is a key parameter for pyrometer control of the temperature. Consequently, by calibrating the Pt capsule emissivity prior to the step-heating experiment, they can then be mounted in a multiple laser sample holder (up to 36 samples per chamber). The single-wavelength pyrometer of our system enables temperature measurements for large sample batches. Temperature is also cross-calibrated between the pyrometer and the thermocouple to ensure its correct reading.  This new approach, coupled with analytical automation, will lead to significant improvement in the accessibility and efficiency of routine 4He/3He analyses for geologic applications.

How to cite: Amalberti, J., van der Beek, P., Colleps, C., Bernard, M., and Wapenhans, I.: New high-resolution step heating experiments using a coupled Diode laser and thermocouple for thermochronology applications, EGU General Assembly 2023, Vienna, Austria, 23–28 Apr 2023, EGU23-6766, https://doi.org/10.5194/egusphere-egu23-6766, 2023.

EGU23-6959 | Orals | GMPV1.2

Timescale of pervasive melt migration in the continental crust 

Pavlina Hasalová, Karel Schulmann, Urs Schaltegger, Pavla Štípská, Andrew Kylander-Clark, Robert Holder, Roberto Weinberg, and Petra Maierová

Movement of a large volume of granitic melt is an important factor in the compositional differentiation of the continental crust and the presence of melt in rocks profoundly influences their rheology. Different mechanisms controlling melt migration through crust were proposed. We suggest that pervasive melt flow, analogous to reactive porous melt flow in mantle, could be possibly one of them. It is generally accepted that migration of felsic melts in continental crust starts with short distance pervasive microscopic flow into segregation veins which extract melt. However, we show that pervasive melt flow may be a regional mode of melt migration in continental crust. In such scenario, melt driven by deformation passes pervasively along grain boundaries through the whole rock volume. And the term pervasive melt flow is used for grain-scale, diffuse, porous and reactive flow of felsic silicate melt through rocks. This is effectively an open-system process that thoroughly reworks the resident rock mass. Through-flow of melt destroys pre-existing fabrics and the original chemical and isotopic nature of the protolith. Melt segregation is inefficient and protolith become isotropic granite-like, with partly preserved relics of the original, without ever containing more than a few melt percent at any time. The fabric and geochemical nature of these granites encapsulates the complex history of hybridization.

In order to decipher duration of pervasive melt migration we used precise U-Pb monazite ID-TIMS (isotope dilution thermal ionization mass spectrometry) and U-Pb monazite Laser Ablation Split Stream (LASS) geochronology in combination with monazite chemistry as well as U-Pb zircon SHRIMP geochronology. Monazite reveal continuous chemical equilibration with passing melt. They are getting progressively enriched in HREE and depleted in Eu. Monazites in the least affected rock preserve original magmatic zoning in Th and U, in contrast to more with melt equilibrated rock types, where this zoning is lost. Data for each migmatite type reveal  similar date spread for both cores and the Y-rich well defined rims of single monazite grains, indicating a disconnect between U-Pb dates and chemical zoning. There is also no correlation between U-Pb ages and Yb/Gd ratio. This suggest perturbance of the isotopic system. We interpret these random distribution within-grain date variations as a result of dissolution-reprecipitation reactions between monazite grains and melt. During the coupled dissolution-reprecipitation radiogenic Pb was redistributed within the grain. This is supported by dissolution of apatite into silicate melts that stabilizes monazite during migmatitization, preventing their dissolution but not reaction with passing melt. Redistribution of radiogenic Pb resulted in meaningless individual ages from different migmatite types, but gave overall duration of the thermal event – pervasive melt flow. Duration of pervasive melt flow was dated 8-10myr. This suggest that porous flow of silicate melts in continental crust is a process which can operate over a long time and impacts on the rheology of the crust during orogeny.

How to cite: Hasalová, P., Schulmann, K., Schaltegger, U., Štípská, P., Kylander-Clark, A., Holder, R., Weinberg, R., and Maierová, P.: Timescale of pervasive melt migration in the continental crust, EGU General Assembly 2023, Vienna, Austria, 23–28 Apr 2023, EGU23-6959, https://doi.org/10.5194/egusphere-egu23-6959, 2023.

EGU23-7367 | ECS | Orals | GMPV1.2

40Ar/39Ar dating of pseudotachylytes: a case study on post-metamorphic brittle fault in the NW Alps 

Zeno G. Lugoboni, Gloria Arienti, Valentina Barberini, Andrea Bistacchi, Christian Cannella, Simona Caprarulo, and Igor M. Villa

Pseudotachylytes are solidified frictional melts produced by seismic fault slip. Being melts that solidified in seconds or minutes after the seismic slip event, they have always been considered a very favourable tool to date brittle deformation. However, since all pseudotachylytes are composed of inherited clasts, melt-derived matrix and (quite often) also alteration products, it is necessary to discriminate the Ar contribution of these three reservoirs to obtain meaningful ages. This can be done by analyzing Ca/K and Cl/K signatures provided by Ar systematics. Furthermore, microstructural analysis and microCT allow quantifying the clast-to-pseudotachylyte matrix ratios for each sample, and XRPD allows detecting potential alteration phases. Here we present the results of step-heating 40Ar/39Ar analyses performed on pseudotachylytes of the Trois Villes Fault and the Quart Fault, which crop out in a region of the Western Alps (Aosta Valley) affected by three different post-metamorphic brittle deformation phases: D1 characterized by NW-SW extension, D2 with NE-SW extension, and D3 showing N-S extension. The relative chronology of these deformation phases is based on consistent cross-cutting relationships. D1 ages of 29–32 Ma have been inferred from syn-kinematic magmatic dikes and hydrothermal veins. However, no absolute ages were so far available for D2 and D3, as direct radiometric dating of fault rocks has never been performed before in the area. Our results are consistent with the relative chronology and greatly improve our understanding of the tectonics of this area.

How to cite: Lugoboni, Z. G., Arienti, G., Barberini, V., Bistacchi, A., Cannella, C., Caprarulo, S., and Villa, I. M.: 40Ar/39Ar dating of pseudotachylytes: a case study on post-metamorphic brittle fault in the NW Alps, EGU General Assembly 2023, Vienna, Austria, 23–28 Apr 2023, EGU23-7367, https://doi.org/10.5194/egusphere-egu23-7367, 2023.

EGU23-7959 | ECS | Posters on site | GMPV1.2

Developing techniques and reference materials for LA-ICP-MS U-Pb geochronology of Sn-W minerals 

Dawid Szymanowski, Lorenzo Tavazzani, Yannick Buret, Marcel Guillong, Alejandro Cortes Calderon, and Cyril Chelle-Michou

Tin-tungsten magmatic-hydrothermal deposits are sources of critical raw materials (Sn, W, Nb, Ta, Li), key to the development of technologies involved in the green transition. However, the current and projected supply of many of these mineral commodities is often dominated by entities whose practices or geopolitical setting may raise issues from a social, political, or environmental standpoint. To meet a steadily increasing demand, new responsible mineral extraction projects must therefore be developed. Successful exploration and economic appraisal of newly identified mineral deposits require (1) an understanding of the ore-forming processes to build an exploration model, and (2) an early estimate of the deposit size to facilitate well-targeted investments. One key parameter that helps to achieve both goals is the knowledge of absolute timing and duration of the mineralisation process.

We present new analytical developments in U-Pb dating of strategic Sn-W ore minerals (cassiterite, wolframite, scheelite) using laser ablation inductively coupled plasma mass spectrometry (LA-ICP-MS). We used a suite of Sn-W mineral specimens to characterise U/Pb downhole fractionation behaviour and polyatomic interference patterns for these three matrices, allowing the optimisation of ablation and ICP-MS settings. In parallel with technical developments, we compiled a large library of potential primary and secondary cassiterite, wolframite, and scheelite reference materials (RMs) which we characterised for major and trace elements. To further our understanding of geochemistry of Sn-W phases, we also performed high-resolution compositional mapping of key trace elements (e.g. U, Pb, REE) with an ultra-fast washout laser ablation system.

Promising RM candidates will be developed into primary RMs with a careful characterisation of compositional homogeneity and precise age determination by isotope dilution-thermal ionisation mass spectrometry (ID-TIMS). Thus characterised RMs and a set of analytical best practices will be made available to laboratories wishing to test and further develop such methods. The ultimate goal of this effort is to build a set of community shared materials and techniques that will allow precise and accurate temporal characterisation of Sn-W mineralisation.

How to cite: Szymanowski, D., Tavazzani, L., Buret, Y., Guillong, M., Cortes Calderon, A., and Chelle-Michou, C.: Developing techniques and reference materials for LA-ICP-MS U-Pb geochronology of Sn-W minerals, EGU General Assembly 2023, Vienna, Austria, 23–28 Apr 2023, EGU23-7959, https://doi.org/10.5194/egusphere-egu23-7959, 2023.

EGU23-8495 | Posters on site | GMPV1.2

From sedimentation to multiple tectono-thermal events: U/Pb zircon and allanite dating in the Eastern Alps 

Sebastian Stumpf, Etienne Skrzypek, Kurt Stüwe, and Christoph Iglseder

The affiliation of the Ennstal Phyllite Zone (EPZ) to either the micaschist units of the Koralpe-Wölz nappe system (KW-NS) to its south or to nappes of the “Greywacke Zone” to its north and east is still debated. Due to similarities with phyllites of the “Greywacke Zone” in the north and phyllonitic micaschists in the south, no clear lithological boundary between these units is observable. Petrographic observations suggest a continuous eoalpine metamorphic gradient with no metamorphic gap between the KW-NS and the EPZ. In order to clear this debate and further constrain the tectonic and temporal evolution of these units, we present new LA-MC-ICP-MS U/Pb age dating results for metapelite samples from the EPZ as well as for the adjacent units of the KW-NS.

Two samples (EA09 and SP02) from the central EPZ and one sample (SP62) from the northernmost part of the Wölz-Complex of the KW-NS were selected for detrital zircon age dating. The distribution of approximately 150 dates per sample reveals major peaks at the Ediacaran-Cryogenian boundary (624 – 646 Ma), a smaller peak at the Neoproterozoic-Mesoproterozoic boundary (~1000 Ma) followed by a hiatus and a smaller peak in the mid-Paleoproterozoic (~2000 Ma). All samples show similar mid-Paleoproterozoic and Neoproterozoic-Mesoproterozoic peaks. Sample SP62 contains one grain of Cambrian age (523 Ma) and one grain of mid-Ordovician age (460 Ma) whereas the youngest zircons from the EPZ samples yield Ediacaran ages of 629 Ma and 625 Ma. The lack of zircons of Ordovician age in samples EA09 and SP02 indicate an affiliation of the EPZ with the basal units of the “Greywacke Zone”.

We also dated metamorphic allanite and REE-bearing epidote rims which are interpreted to form at low pressure and temperature conditions in metapelites. Allanites from the EPZ yield metamorphic ages of 105 ± 3.5 Ma in the northern part of the unit and 279 ± 6 Ma in the southern part. Allanite cores from two micaschist samples from the northern and central Wölz-Complex yield ages of 316 ± 21 Ma and 286 ± 11 Ma. Their respective epidote rims yield eoalpine ages of 98 ± 2 Ma and 96 ± 2 Ma. One micaschist sample from the Rappold-Complex yields ages of 326 ± 9 Ma for the allanite cores and 101 ± 1 Ma for the epidote rims. These ages are interpreted as prograde crystallization of allanite and epidote and give us petrochronological information about three distinct metamorphic events: Variscan, Permian and Eoalpine. By gathering three distinct eoalpine ages within the EPZ and the KW-NS, we can further constrain the metamorphic evolution of the eoalpine lower plate.

How to cite: Stumpf, S., Skrzypek, E., Stüwe, K., and Iglseder, C.: From sedimentation to multiple tectono-thermal events: U/Pb zircon and allanite dating in the Eastern Alps, EGU General Assembly 2023, Vienna, Austria, 23–28 Apr 2023, EGU23-8495, https://doi.org/10.5194/egusphere-egu23-8495, 2023.

Interpreting cooling ages from multiple thermochronometric systems and/or from steep elevation transects with the help of a thermal model can provide unique insights into the spatial and temporal patterns of rock exhumation. Several well-established thermal models allow for a detailed exploration of how cooling or exhumation rates evolved in a limited area or along a transect. However, integrating large, regional datasets in such models remains challenging due to the difficulty of extracting exhumation rates from ages that are affected by variable effective cooling temperatures, sampling elevations, and surface temperatures. Here we present a thermal model that can be used to rapidly provide a synoptic overview of exhumation rates from thermochronologic data spread over wide regions. The model incorporates surface temperature based on a defined lapse rate and sample elevation relative to a mean relief value that is dependent on the thermochronometric system of interest. Other inputs include sample age, thermochronometric system, and an initial (unperturbed) geothermal gradient. The model is simplified in that it assumes steady, vertical rock-uplift when calculating exhumation rates. For this reason, it does not replace more powerful and versatile thermal-kinematic models like PECUBE, but it has the advantage of simple implementation and rapidly calculated results. In our example dataset, we show the results of exhumation rates calculated from 1785 thermochronologic ages from the Himalaya associated with five different thermochronometric systems; results were calculated in under a second on a standard laptop. Despite the synoptic nature of the results, we show how they illustrate several fundamental features of the mountain belt, including strong regional differences that reflect known segmentation patterns and changing exhumation rates in areas of newly developed ramp structures. The results can also be correlated with geomorphic metrics to probe potential controls on surface morphology.

How to cite: van der Beek, P. and Schildgen, T.: Age2exhume: A Matlab/Python script to calculate steady-state vertical exhumation rates from thermochronologic ages in regional datasets, EGU General Assembly 2023, Vienna, Austria, 23–28 Apr 2023, EGU23-8741, https://doi.org/10.5194/egusphere-egu23-8741, 2023.

EGU23-8976 | Orals | GMPV1.2

How useful is the initial Pb composition of magmatic allanite ? 

Etienne Skrzypek, Daniela Gallhofer, Christoph Hauzenberger, and Isabella Haas

Allanite-group minerals are known to incorporate not only U and Th but also initial, non-radiogenic Pb. Allanite can therefore be analyzed in order to assess its crystallization age as well as the ambient Pb composition at the time of crystallization. Whereas allanite age dating has been the focus of many studies, constraining its initial Pb composition has received much less attention. We collected a series of Phanerozoic, allanite-bearing magmatic rock samples (volcanic, plutonic, pegmatite) and measured both the age and initial Pb composition of allanite by laser ablation-multi collector-inductively coupled plasma-mass spectrometry. We show that allanite data can be corrected for mass bias and fractionation using zircon (for U/Pb and Th/Pb ratios) and glass (for Pb/Pb ratios) as reference material as long as allanite is not metamict. A lower intercept age and y-axis intercept Pb composition can be determined by linearly regressing U-Pb data in a Tera-Wasserburg diagram, and a 230Th disequilibrium correction is highly recommended. We find a good agreement between our allanite U-Pb dates and published U-Pb zircon ages for the same localities. Our initial Pb compositions are validated by a fair agreement with Pb isotopic data measured on co-genetic feldspars from the same samples. The initial Pb composition of samples ranging from ca. 530 to 18 Ma reveals fluctuations in initial 207Pb/206Pb ratio, which points to different degrees of crustal (elevated μ=238U/204Pb) contribution. These variations could be due to post-magmatic deformation, weathering or metamorphism, but we believe that they rather reflect differences in initial magma composition. We thus emphasize the usefulness of allanite initial Pb compositions to discuss the source of igneous rocks.

How to cite: Skrzypek, E., Gallhofer, D., Hauzenberger, C., and Haas, I.: How useful is the initial Pb composition of magmatic allanite ?, EGU General Assembly 2023, Vienna, Austria, 23–28 Apr 2023, EGU23-8976, https://doi.org/10.5194/egusphere-egu23-8976, 2023.

EGU23-9864 | Orals | GMPV1.2

Luminescence chronology and thermometry studies of plant opal phytoliths 

Joel Spencer and David Sanderson

In this work we have been investigating the luminescence properties of plant opal phytoliths to assess their suitability for determination of age and/or thermometric information from soil and sediment sequences. Opal phytoliths, or bio-opal, form when monosilicic acid from soil-waters is taken up by plants and chemically altered to silica, producing intra- or extra- cellular structures that give grasses and stems their strength. Opal phytoliths are usually considered to be non-crystalline and referred to as silica mineraloid structures, with ~4-9% water, <5% other elements, and specific gravity ranging from ~1.5-2.3. They are known to be resistant to degradation and hence preserved in soil or sediment even after decomposition of organic matter. Our earlier work examined a <2.37 g/cm3 density fraction in parallel with quartz grains from samples collected from fluvial terraces and soil pits on Konza Prairie Biological Station native tall grass prairie a few km from Kansas State University. We observed generally similar luminescence characteristics from the phytolith fractions to quartz, with bright blue optically stimulated luminescence (OSL) signals and good single-aliquot regenerative-dose characteristics. In two hours the OSL signal is ~90% bleached by white light, whereas red fluorescence lab lighting has a negligible effect over the same exposure time. Thermoluminescence (TL) data suggested the presence of feldspatic-like minerals or perhaps thermal degradation of the phytoliths during TL measurement; the phytolith fractions were also stimulated by low-temperature infrared stimulated luminescence (IRSL50) perhaps also indicating presence of contaminant minerals. Initial SEM analyses identify what appear to be weathered silica grains, but also highly weathered, pitted concretions with silicate-like structures according to element mapping but actual mineral identification is presently unclear.

Most recently we have begun analyzing samples collected from a suite of stratified paleosols from the mid-continent stream type-site of Claussen, Mill Creek, Wabaunsee County, Kansas. This site has documented phytolith examples and a radiocarbon framework. We are continuing luminescence characterization studies, incorporating screening of prepared fractions with SEM and IRSL50 evaluation, and pulsed time domain analysis measurements are being explored.

We think luminescence from opal phytoliths shows great promise as an alternative target to quartz or feldspar, but moreover as a sensitive recorder of climatic change or fire exposure on plant communities. This presentation will review our earlier work on phytoliths and discuss most recent findings from the Claussen site.

How to cite: Spencer, J. and Sanderson, D.: Luminescence chronology and thermometry studies of plant opal phytoliths, EGU General Assembly 2023, Vienna, Austria, 23–28 Apr 2023, EGU23-9864, https://doi.org/10.5194/egusphere-egu23-9864, 2023.

EGU23-11638 | Posters on site | GMPV1.2

Using detrital thermochronology on moraine deposits to infer glacial erosion patterns and rock thermal history : insights from the Arve and Maurienne valleys (Western European Alps) 

Benjamin Guillaume, Nathan Cogné, Kerry Gallagher, Pierre G. Valla, and Christian Crouzet

This study tests the application of combined detrital apatite fission track (AFT) and U-Pb dating to infer both glacial erosion spatial patterns and long-term rock cooling histories in Alpine mountainous settings. We have dated 716 detrital apatite grains from glacial sediments collected in the Maurienne and Arve valleys (Western European Alps, France) from moraine deposits corresponding to different stages of glacial retreat since the Last Glacial Maximum (LGM, ca. 24-21 ka).
The Maurienne valley crosses the internal and external Alps, which exhibit contrasting in-situ AFT and U-Pb ages. Here, we present the measured distribution of both detrital AFT and U-Pb ages at 6 locations along the valley, with catchment elevations ranging from 390 to 1740 m. We show that during glacial retreat, erosion is mainly concentrated in the downstream part of the glacier, near the sampled moraine deposits. This inference suggests that during glacial retreat, glacial erosion is more effective below the ELA (Equilibrium Line Altitude) and specifically close to the glacier front, in areas where ice flow velocity is high and subglacial water is abundant, as predicted by ice-dynamics reconstructions in the European Alps over the last 20 ka.
In the Arve valley, previous studies showed that in situ AFT ages are systematically younger than 7 Ma for the Mont-Blanc massif. We compare the thermal history obtained from these literature bedrock-derived data to that derived from the new detrital AFT data collected in the Little Ice Age (LIA) moraine, just at the front of the Bossons glacier (~1300 m elevation). We also compare our results with 5 other samples down the valley at catchment elevations between 460 and 1050 m to evaluate potential changes in the detrital AFT signal as well as the consistency in the retrieved long-term cooling history.
Based on these first results, we plan to extend our study to other areas (e.g., Patagonia) to investigate both (1) spatial patterns of glacial erosion for older glacial periods (pre-LGM), and (2) long-term rock cooling histories from moraine deposits where modern bedrock is inaccessible (e.g. under modern glaciers or ice fields).

How to cite: Guillaume, B., Cogné, N., Gallagher, K., Valla, P. G., and Crouzet, C.: Using detrital thermochronology on moraine deposits to infer glacial erosion patterns and rock thermal history : insights from the Arve and Maurienne valleys (Western European Alps), EGU General Assembly 2023, Vienna, Austria, 23–28 Apr 2023, EGU23-11638, https://doi.org/10.5194/egusphere-egu23-11638, 2023.

Low temperature thermochronology is a field of research in which the thermally controlled retention of radioactive decay products in geological materials is measured to reconstruct mineral and rock temperature-time histories, especially in regard to their passage through the upper crust (i.e., <350 °C). Such temperature-time histories are most often constructed by inverting low temperature thermochronological data using geological constraints in order to identify envelopes of plausible rock thermal histories. While such inversions are highly informative models of the thermal history of rocks, the ultimate goal of most low temperature thermochronological studies is to relate thermal histories to geological processes in order to reconstruct upper crustal tectonic activity and/or landscape evolution. To do this, the (evolving) depths of thermochronometer effective closure temperatures must be estimated, as both heat transfer processes and crustal rock composition/thermal properties will affect the crustal thermal field. 

Here we present an exploration of the relationships between low temperature thermochronometers, temperature-time histories, and geological processes produced using the software Tc1D (https://doi.org/10.5281/zenodo.7124271). Tc1D is a new, open-source thermal and thermochronometer age prediction model for simulating the competing effects of tectonic and surface processes on thermochronometer ages. The Tc1D software is written in Python and uses the finite difference method to solve the heat transfer equation in 1D including the effects of heat conduction, advection (e.g., erosion, sedimentation), and radiogenic heat production on the thermal profile of the lithosphere. The flexibility of the software means that it can be used to explore the effects of a variety of geological processes, including magmatic intrusion and lithospheric delamination, for example. Thermochronometer ages (U-Th/He and fission track ages for apatite and zircon) are predicted by tracking the thermal history of rock particles in the model as they travel from depth to the surface during their exhumation history, both for samples at the modern-day surface and those reaching the surface at past times. The thermal histories are input to age prediction algorithms, including those that account for the effects of radiation damage in minerals (e.g., Flowers et al., 2009; Guenthner et al., 2013), making the software applicable to thermochronometer age interpretation in a wide variety of geological scenarios.  

In this contribution, we present a selection of results using Tc1D, demonstrating potential applications and providing some examples of unintuitive temperature and age relationships. These examples include cases where sample depth does not correlate with temperature, where variations in predicted effective closure temperatures produce unexpected age relationships, and where the thickness of the layer of exhumed rocks can significantly affect predicted ages. We hope that these illustrative examples demonstrate the role for Tc1D in the thermochronologist’s interpretational toolbox. 

How to cite: Whipp, D. M. and Kellett, D. A.: Exploring the relationships between low-temperature thermochronometers, temperature-time histories, and geological processes using Tc1D, EGU General Assembly 2023, Vienna, Austria, 23–28 Apr 2023, EGU23-12472, https://doi.org/10.5194/egusphere-egu23-12472, 2023.

EGU23-12637 | Posters on site | GMPV1.2

Erosion patterns in the European Alps from zircon fission-track tracer thermochronology 

Christoph Glotzbach and Sarah Falkowski

Applications of tracer thermochronology exploit a known or assumed surface thermochronometric age map (based on either interpolated observed or modelled bedrock ages) to determine the provenance of detrital grains within fluvial or glacial catchments. The goal is to interpret the erosion pattern and processes within the sampled catchment. So far, most studies focused on modern sediments and glacial deposits.

We extend this approach to several time slices (between 28 and 12 Ma) of well-dated stratigraphic sections of pro- and retro-foreland basins of the European Alps. Foreland basin deposits represent a rich archive of erosional processes that were controlled by tectonics, climate, and lithology. However, importantly, before we reconstruct and interpret past erosion patterns and exhumation from detrital zircon fission-track (ZFT) age distributions and modelled bedrock ZFT ages back in time, we produce a frame of reference of today's situation. We do this by investigating signals from modern river samples and the present-day erosion pattern and mineral fertility in the Alps.

Here, we focus on 26 modern river samples (21 previous samples from the Western and Central Alps, and 5 new samples from the Eastern Alps) and discuss observed and predicted (based on possible erosion scenarios) ZFT age distributions, as well as potential pitfalls of the method (such as poor bedrock control in some areas of the Alps). We also show preliminary results from stratigraphic sections.

How to cite: Glotzbach, C. and Falkowski, S.: Erosion patterns in the European Alps from zircon fission-track tracer thermochronology, EGU General Assembly 2023, Vienna, Austria, 23–28 Apr 2023, EGU23-12637, https://doi.org/10.5194/egusphere-egu23-12637, 2023.

EGU23-12969 | Posters on site | GMPV1.2

Characterization of zircon megacrysts from an atypical occurrence of carbonatite at Kawisigamuwa, Sri Lanka 

Daniela Gallhofer, Etienne Skrzypek, Christoph Hauzenberger, Andreas Möller, Joseph Andrew, Luis A. Parra-Avila, Laure Martin, Anthony Kemp, Rohan Fernando, and He Dengfeng

Zircon megacrysts are unusually large crystals (> 5 mm) that are commonly associated with mantle-derived kimberlites, carbonatites, alkali basalts and syenitic pegmatites (e.g., Hoskin and Schaltegger 2003). Such zircons form during relatively short timespans and therefore, are often used as reference material for U-Pb geochronology. Here, we determine the geochemical and isotopic (U-Pb, Hf, O) characteristics of a little-known occurrence of zircon megacrysts at Kawisigamuwa, Sri Lanka.

The dark brown megacrysts are euhedral, commonly elongate crystals with double pyramidal terminations and have faintly corroded crystal surfaces. The zircons consist of oscillatory zoned and nearly featureless cathodoluminescence-bright patches, some of which appear to follow sealed cracks. All zircon domains show a low to moderate FWHM of the ν3 (SiO4) Raman band (2.5 to 7.3 cm-1), have a low to moderate radiation damage (total α-dose mainly <0.5 x 10¹⁸ events/g) and therefore are intermediate to well crystalline. Contents of most trace element (U, Th, REE, P) are elevated in the oscillatory zoned domains, while Hf content is elevated in the CL-bright domains and seems to be grain-dependant. The oscillatory zoned domains yielded a TIMS weighted mean 206Pb/238U age of 532.39 ± 0.66 Ma (2sd). The206Pb/238U dates within the CL-bright domains are partially reset by a single event of recrystallisation at ~518 Ma. The mean Hafnium isotopic compositions of the tested grains show a narrow range of 176Hf/177Hf from 0.281969 to 0.282003. Oxygen isotopes determined on two oscillatory zoned zircon megacrysts are homogeneous (mean δ18O of 12.1 and 12.2).    

While some of the trace and major element characteristics (Th/U, Zr/Hf, Hf content) of the Kawisigamuwa megacrysts resemble those of carbonatite zircons, their hafnium and oxygen isotope ratios are clearly different from mantle values. The isotopic values indicate that a significant amount of a crustal component must be involved in the formation of the zircons. Recently, several studies have found evidence for melting of carbonate rocks under high grade metamorphic conditions in Sri Lanka (e.g., Wang et al. 2021). It might be feasible that zircons grow from interaction of crustal derived carbonate melts and silicate melts or wall rocks under high grade metamorphic conditions.

Hoskin P.W.O. and Schaltegger U. (2003). The Composition of Zircon and Igneous and Metamorphic Petrogenesis. Reviews in Mineralogy and Geochemistry, 53 (1), 27–62.

Wang J., Su B.-X., Chen C., Ferrero S., Malaviarachchi S.P.K., Sakyi P.A., Yang Y.-H. and Dharmapriya P.L. (2021). Crustal derivation of the ca. 475-Ma Eppawala carbonatites in Sri Lanka. Journal of Petrology, 62 (11), 1-18.

How to cite: Gallhofer, D., Skrzypek, E., Hauzenberger, C., Möller, A., Andrew, J., Parra-Avila, L. A., Martin, L., Kemp, A., Fernando, R., and Dengfeng, H.: Characterization of zircon megacrysts from an atypical occurrence of carbonatite at Kawisigamuwa, Sri Lanka, EGU General Assembly 2023, Vienna, Austria, 23–28 Apr 2023, EGU23-12969, https://doi.org/10.5194/egusphere-egu23-12969, 2023.

EGU23-13440 | ECS | Orals | GMPV1.2

Partially decoupled magmatic and hydrothermal events in porphyry copper systems? 

Adrianna Virmond, David Selby, Jörn-Frederik Wotzlaw, and Cyril Chelle-Michou

Porphyry Copper Systems (PCS) represent a significant source of metals, and will continue to play a key role in future with the development of green technology. Despite being one the most studied mineral systems, the primary controls on the ore tonnage of deposits (that varies up to 5 orders of magnitude in nature) remain poorly constrained. The Eocene Chuquicamata Intrusive Complex (CIC) in northern Chile hosts one of the world’s largest porphyry copper deposits and represent a perfect natural laboratory to explore the influence of timescales in controlling the formation and size of PCS.

Here we investigate the tempo of multiple magmatic-hydrothermal events in the CIC applying molybdenite geochronology (Re-Os ID-NTIMS) and high precision zircon petrochronology (U-Pb CA-ID-TIMS geochronology in tandem with LA-ICPMS trace element composition). Preliminary geochronological results may suggest a partial decoupling of the magmatic and hydrothermal events. Zircon U-Pb geochronology results point to a multi-million-year protracted magmatic history with at least two discrete pulses separated by 500 kyrs. The hydrothermal event appears slightly younger than the youngest magmatic pulse and lasted for ca. 1 Myrs.

The extensive duration of the mineralization scales with the behemothian size of the Chuquicamata deposit (more than 110 Mt of contained copper) and corresponds to predictions from numerical modelling of magma degassing. Interestingly, the apparent temporal decoupling between magmatism and hydrothermal activity at Chuquicamata suggests that syn-mineralization ore-forming magmas might not always intrude as dyke or stock at mineralization depth and can remain hidden at upper to mid-crustal depth. In the absence of high-precision geochronological data, this may bear consequences when assuming a direct genetic link between spatially associated porphyritic rocks and the mineralization.

How to cite: Virmond, A., Selby, D., Wotzlaw, J.-F., and Chelle-Michou, C.: Partially decoupled magmatic and hydrothermal events in porphyry copper systems?, EGU General Assembly 2023, Vienna, Austria, 23–28 Apr 2023, EGU23-13440, https://doi.org/10.5194/egusphere-egu23-13440, 2023.

EGU23-14643 | ECS | Orals | GMPV1.2

Out-of-sequence fault activity in the High Himalaya revealed by luminescence thermochronometry 

Chloé Bouscary, Georgina King, Jérôme Lavé, Djordje Grujic, György Hetényi, Rafael Almeida, Ananta Gajurel, and Frédéric Herman

Two end-member competing models have been proposed to describe the kinematics of the central Nepal Himalayas in the last few Myr. They differ in their interpretations of which surface breaking faults accommodate current shortening and the kinematics responsible for driving rapid exhumation in the topographic transition zone around the Main Central Thrust (MCT). These locally higher uplift and erosion rates in the High Himalaya could reflect (1) thrusting over a midcrustal ramp with the growth of a Lesser Himalaya duplex at midcrustal depth causing underplating along the Main Himalayan Thrust ramp, or (2) out‐of-sequence thrusting along the front of the High Himalaya, possibly driven by climatically controlled localized exhumation.

To decipher between the two tectonic models, we compare existing low and medium-temperature thermochronometric data (40Ar/39Ar on muscovite, apatite (U-Th)/He - AHe, zircon (U-Th)/He - ZHe, apatite fission track - AFT, and zircon fission track - ZFT), extracted from the world thermochronometric data file of Herman et al. (2013), to luminescence thermochronometry data from 61 newly collected rock samples along transhimalayan rivers between the Kali Gandaki and the Trisuli. The luminescence thermochronometry data provide a new perspective on Late Pleistocene exhumation rates (timescales of 104 to 105 years) of the Nepalese Himalayas, by offering quantitative high-resolution constraints of rock cooling histories within the upper kilometres of the Earth’s crust.

All of the thermochronometric data show younger ages and higher exhumation rates around the topographic transition and the MCT zone through central Nepal. For the higher temperature thermochronometers, there is a continuous trend towards younger ages from the Lesser Himalaya through the topographic transition and the MCT zone. These data suggest that the in-sequence model, with exhumation rates linked to increased erosion and the formation of a duplex below the Higher Himalayas, coincident with the MCT location in some areas, is the model that best describes the thermochronometric ages of this study area on Myr timescales. However, the luminescence thermochronometry data reveal a spatial and temporal variability of the higher exhumation rates at different timescales, suggesting an intermittency of exhumation signal due to geomorphological processes. The luminescence thermochronometry data also highlight a systematic sharp transition at the MCT, pointing to out-of-sequence activity at this tectonic boundary on 100-kyr timescales. Whether this difference in tectonic model between the two timescales is due to low resolution of the higher temperature thermochronometers, shallow isotherms deflected by fluid circulation and hot spring activity near the MCT, or to a change in tectonic regime during the last 200 kyr, out-of-sequence activity of the MCT needs to be considered in seismic hazard models as it could put the local population at risk.

How to cite: Bouscary, C., King, G., Lavé, J., Grujic, D., Hetényi, G., Almeida, R., Gajurel, A., and Herman, F.: Out-of-sequence fault activity in the High Himalaya revealed by luminescence thermochronometry, EGU General Assembly 2023, Vienna, Austria, 23–28 Apr 2023, EGU23-14643, https://doi.org/10.5194/egusphere-egu23-14643, 2023.

EGU23-16555 | Orals | GMPV1.2

In-situ, U-Pb dating of titanite in phonolitic dykes from the Dolomites area (Southern Alps, Italy): new insights on the timing of the Middle Triassic magmatism 

Massimo Coltorti, Nicolò Nardini, Federico Casetta, Lorenzo Tavazzani, Stefano Peres, Theodoros Ntaflos, and Elio Dellantonio

Due to the complex geodynamic framework and the excellent state of preservation of the stratigraphic relationships towards the host metamorphic and sedimentary rocks, the Permo-Triassic magmatic sequences of the Southern Alps (Italy) are intensely studied. Throughout the Southalpine domain, the main peaks of the volcano-plutonic activity are both pre- and post-dated by the emplacement of small volume of magmas with variable chemical affinity. These magmas, preserved as dykes and veins intruded into the plutonic bodies and/or the overlying volcanites, are powerful tools for tracing the evolution of the magma source and reconstructing the temporal evolution of the magmatic episode. Here, we present a detailed geochemical and geochronological study of phonolitic dykes (SiO2 from 56.8 to 57.8 wt.%; Na2O + K2O from 11.1 to 15.3 wt.%) cropping out near Predazzo (Southern Alps; Italy) and intruded into the basaltic to trachyandesitic Middle Triassic lavas. The phonolites are mostly aphyric with a porphyricity index <10%. The main mineral phases are concentric-zoned clinopyroxene, ranging in composition from diopside-hedenbergite, to aegirine (Wo13-51; En2-29; Fs20-85), K-feldspar and rare sodalite. Accessory phases are titanite, apatite and magnetite embedded in a aphyric matrix. Titanite has a highly variable U-Th concentration (U from 24 to 478 ppm and Th from 170 to 4328 ppm) and is characterized by a chondrite-normalized REE pattern with a convex-upward shape (La/YbN from 18.9 to 41.5) with enrichment in LREE and depletion in HREE. Thermometry through Zr-in-Titanite calculations (Hayden et al., 2008) indicate crystallisation temperatures between 860.3 and 942.8 ± 57 °C. In-situ, U-Pb dating on titanite phenocrysts performed by laser ablation-inductively coupled-mass spectrometry (LA-ICP-MS) shows that the age of phonolite dykes is comprised between 240.4 ± 3.2 Ma and 242.0 ± 3.6 Ma, partially overlapping with the emplacement of the Middle-Triassic plutonic bodies of the Dolomites (238.190 ± 0.050 - 238.075 ± 0.087; Storck et al. 2019).

These results provide new insights into the timing of the Middle Triassic magmatic event in the Southern Alps, fostering the debates about the temporal and chemical evolution of the magmatism in between the Variscan orogeny and the opening of the Alpine Tethys.

References:

Hayden, L. A., Watson, E. B., & Wark, D. A. (2008). A thermobarometer for sphene (titanite). Contributions to Mineralogy and Petrology, 155(4), 529-540.

Storck, J. C., Brack, P., Wotzlaw, J. F., & Ulmer, P. (2019). Timing and evolution of Middle Triassic magmatism in the Southern Alps (northern Italy). Journal of the Geological Society, 176(2), 253-268.

How to cite: Coltorti, M., Nardini, N., Casetta, F., Tavazzani, L., Peres, S., Ntaflos, T., and Dellantonio, E.: In-situ, U-Pb dating of titanite in phonolitic dykes from the Dolomites area (Southern Alps, Italy): new insights on the timing of the Middle Triassic magmatism, EGU General Assembly 2023, Vienna, Austria, 23–28 Apr 2023, EGU23-16555, https://doi.org/10.5194/egusphere-egu23-16555, 2023.

CL1.2 – Last ~2.6 Ma

EGU23-871 | ECS | Orals | CL1.2.1

Isotopomers as tools to unravel forest carbon balance over decades 

Lenny Haddad, Pieter Zuidema, Benjamin Smith, John Marshall, and Jürgen Schleucher

Carbon dioxide [CO2] has reached almost 420 ppm in 2022 (Friedlingstein et al. 2022) and may increase to 600 ppm by the year 2100. Understanding plant responses to increasing CO2 is essential for predictions of plant productivity and of future climate (Ehlers et al. 2015). The hydrogen isotopes protium (1H) and deuterium (2H or D) exhibit the largest isotope effects, and D is fractionated by both physical and biochemical processes. Thus, hydrogen isotope compositions of plant compounds have a remarkable potential to further our knowledge about plant physiological and environmental processes. However, whole-molecule δD depends on the δD of the plant’s water source, fractionation by transpiration, and enzyme isotope effects. To disentangle these influences, isotopomer analysis is required since enzyme isotope effects influence stable isotope abundance in specific intramolecular positions (Ehlers et al. 2015), called isotopomers. As CO2 increases over decades, plant responses to T and CO2 over decades are important. For forests, opposing effects of CO2 and T determine if forests will in the future be a sink or source of CO2 (Van der Sleen et al. 2015; Sperry et al. 2019). Furthermore, a mechanistic understanding of physiological responses is essential to be able to estimate future C assimilation using ecosystem models. Photorespiration is a side reaction of photosynthesis that reduces C assimilation in most vegetation, and photorespiration is reduced by increasing CO2 yet exacerbated by rising T (Van der Sleen et al. 2015; Sperry et al. 2019). Therefore, we aim to unravel how photorespiration will develop under scenarios of rising CO2 and climate change.

Tree rings help us understand interactions of plants and environmental drivers over decades-millennia. Variables that can be measured on tree rings fall into two groups. Variables like ring width are valuable for integrating effects of several environmental drivers on tree growth. In contrast, isotopomers depend on individual biochemical events and are therefore better for mechanistic studies.

We use an NMR (nuclear magnetic resonance) method to analyze isotopomers of the glucose units of tree-ring cellulose, to elucidate physiological changes in trees during past decades of increasing CO2. In this contribution, we will report results of two kinds of experiments to investigate long-term tree responses.

First, in manipulation experiments we calibrate isotopomer responses to environmental drivers, in particular CO2 and T. Second, we analyse tree-ring series over previous decades of rising CO2, and use the calibrations from the manipulation experiments to deduce shifts in photosynthetic metabolism over decades. For selected tree species, we will present combined results from both kind of experiments, conclusions on physiological changes of these trees over past decades, and implications for future C assimilation by broadleaved trees.   


References

Ehlers et al., 2015. https://doi.org/10.1073/pnas.1504493112.

Friedlingstein et al., 2022. https://doi.org/10.5194/essd-14-1917-2022.

Sleen et al., 2015.  https://doi.org/10.1038/ngeo2313.

Sperry et al., 2019. https://doi.org/10.1073/pnas.1913072116.


How to cite: Haddad, L., Zuidema, P., Smith, B., Marshall, J., and Schleucher, J.: Isotopomers as tools to unravel forest carbon balance over decades, EGU General Assembly 2023, Vienna, Austria, 23–28 Apr 2023, EGU23-871, https://doi.org/10.5194/egusphere-egu23-871, 2023.

The development of urban areas, industrialization and increasing traffic intensity is a problem of air, soil and water contamination worldwide with various pollutants, some of which are heavy metals. The most significant sources of heavy metal pollution are industrial factories, processing of non-ferrous materials, mining activity and traffic intensity, with negative effects on both forest ecosystems and wildlife. This study was carried out in forest ecosystems affected by industrial pollution in the Baia Mare region (Maramureș). The study provides an analysis of the chemical elements accumulated in tree rings over 60 years, making it possible to analyze the dynamics of these elements over time. The sampling design was carried out systematically in order to make a comparison between trees in the intensively polluted area and those located at a fairly large distance, where local pollution had no effect. Thirteen chemical elements were analyzed, including heavy metals such as Cu, Pb, Zn, Fe and Mn. Higher concentrations of the elements Pb, Zn, Fe, Mn, Al, K, Si and Sr were found in tree rings from the intensively polluted area compared to those from the area unaffected by local pollution. Significant differences were found at 95% confidence interval for Zn, K and Ca concentrations.

How to cite: Cuciurean, C. and Sidor, C. G.: Chemical composition of Fagus Silvatica annual rings affected by local industrial pollution in northern Romania (Baia Mare region), EGU General Assembly 2023, Vienna, Austria, 23–28 Apr 2023, EGU23-1512, https://doi.org/10.5194/egusphere-egu23-1512, 2023.

EGU23-1516 | ECS | Posters on site | CL1.2.1

Early warning signals of Norway spruce decline in Eastern Europe 

Andrei Popa, Ernst van der Maaten, Ionel Popa, and Marieke van der Maaten-Theunissen

Climate change is affecting forest ecosystems all around the globe, in particular through warming as well as increases in drought frequency and intensity. Possible impacts range from effects on the provisioning of ecosystem services such as carbon sequestration to tree mortality.

Norway spruce (Picea abies (L.) H. Karst.) is one of the most important coniferous species at the European level. In the actual context of climate change, especially with the increase in drought severity and frequency Norway spruce is likely to be at risk. Severe droughts during the vegetation period may, for example, negatively affect the resilience of Norway spruce and its’ ability to resist bark-beetle attacks. In recent extremely dry years in Central Europe, this has been observed through the large dieback of Norway spruce forests. In Eastern Europe, however, no extensive Norway spruce decline has been reported so far, posing the question how these forests will develop in the future?

To address this question, we present and analyze a tree-ring network consisting of 155 Norway spruce chronologies from Eastern Europe (Romania). As sites were selected along elevational transects in the Carpathians, our network allows to assess future impacts of climate change using a space for time substitution. The focus of our analysis is on the early warning signals of climate-change induced stress: negative trends in basal area increment and increased sensitivity of tree growth, assessed over the statistics first-order autocorrelation and standard deviation. A clear decrease in basal area increment was observed over the last two decades in the northern part of the Eastern Carpathians, which was more pronounced for younger stands and at lower elevations. At the same time, the first-order autocorrelation showed a sharp decrease at lower elevations. Our results highlighted increasing stress conditions of Norway spruce-based forests in Eastern Europe. In the current climatic scenarios, we may expect high mortality and forest diebacks also in the eastern part of Europe. Mitigation solutions are required as soon as possible.

How to cite: Popa, A., van der Maaten, E., Popa, I., and van der Maaten-Theunissen, M.: Early warning signals of Norway spruce decline in Eastern Europe, EGU General Assembly 2023, Vienna, Austria, 23–28 Apr 2023, EGU23-1516, https://doi.org/10.5194/egusphere-egu23-1516, 2023.

EGU23-3377 | Orals | CL1.2.1

The mixed severity disturbance regime of primary beech-dominated forests and its trends of 200 years development 

Pavel Janda, Marek Svitok, Ondřej Vostárek, Martin Mikoláš, Radek Bače, Vojtěch Čada, Jakob Pavlin, Thomas Nagel, Krešimir Begović, Ecaterina Fodor, Karol Ujházy, Michal Frankovič, Michal Synek, Martin Dušátko, Tomáš Kníř, Daniel Kozák, Ondřej Kameniar, Arne Buechling, and Miroslav Svoboda

Primary beech-dominated forests are rare in Central Europe, while the knowledge of natural processes of these ecosystems is crucial for understanding the forest dynamics providing complex of ecosystem services. In order to understand these ecosystems better, which were one of the most widespread in this region, we decided to study their disturbance regimes and their long-term and recent trends driven mostly by natural disturbances.

The study was conducted within the region of Carpathian Mountains including 14 stands and 210 permanent study plots. All living and dead trees were inventoried on these plots, while selected trees were cored. Disturbances were reconstructed by examining individual tree growth patterns: (1) rapid juvenile growth rate (open canopy recruitment), and (2) abrupt, sustained increases in radial growth (release). From these disturbance patterns we reconstructed other disturbance parameters as disturbance severities, patch sizes and plot proportions of disturbed plots on the stand scale characterizing disturbance regime. Further, generalized linear mixed effect models were used to asses long-term and recent trends in these disturbance parameters.

Studied ecosystems were driven by mixed severity disturbance regime. The disturbance events revealed continuous gradient from low-severity, small-scale events to higher-severity, larger-scale events, and this gradient was progressively increasing with the rotation period. The low severity class was the most frequent, but it had similar canopy area disturbed (23.9 %) as moderate and high severity class (34.4 %, 27.1 %), respectively. The very high severity class had the longest rotation period and it affected only 14.7 % of overall canopy area disturbed. Long-term and recent trends in disturbance severities and patch areas were not detected. Plot proportions of disturbed plots on the stand scale had slightly declining trend in time over last two centuries, but the recent trend was not detected.

Analysis of the recent trends in disturbance characteristics have not shown increasing trend, as it was reversely observed in Europe proving the value and stability of these ecosystems under pressure of climate changes. Based on our findings we highly recommend to localize and protect primary and old-growth forests for their high conservation values, high and stable carbon stock, and provision of other ecosystem services. For enhancement of the managed forests´ stability we could recommend to support natural species composition and nature-based forest management mimicking natural disturbance regimes as retention silvicultural system combining irregular shelterwood and selection systems with occasional clear cuts.

The study and its authors were supported by the Czech Science Foundation (project No. 21‐27454S). We thank all staff involved in the data collection and their processing.


How to cite: Janda, P., Svitok, M., Vostárek, O., Mikoláš, M., Bače, R., Čada, V., Pavlin, J., Nagel, T., Begović, K., Fodor, E., Ujházy, K., Frankovič, M., Synek, M., Dušátko, M., Kníř, T., Kozák, D., Kameniar, O., Buechling, A., and Svoboda, M.: The mixed severity disturbance regime of primary beech-dominated forests and its trends of 200 years development, EGU General Assembly 2023, Vienna, Austria, 23–28 Apr 2023, EGU23-3377, https://doi.org/10.5194/egusphere-egu23-3377, 2023.

Our understanding of wood formation is poor. Key anatomical properties in conifer and ring-porous tree species that have not been explained include the overall anatomy of growth rings (with consistent transitions from low-density earlywood to high density latewood), strong relationships between latewood density and temperature (used for historical temperature reconstructions), the regulation of cell size, and overall growth-temperature relationships. We have developed a theoretical framework based on observations on Pinus sylvestris L. in northern Sweden. These observed anatomical properties emerge from our framework as a consequence of interactions in time and space between the production of new cells, the dynamics of developmental zones, and the distribution of carbohydrates across the developing wood. Here we find that the diffusion of carbohydrates is critical in determining the final ring anatomy, potentially overturning current understanding of how tree growth responds to environmental variability and transforming our interpretation of tree rings as proxies of past climates.

How to cite: Friend, A., Eckes-Shephard, A., and Tupker, Q.: Latewood density and overall ring anatomy responses to temperature in Scots pine explained by carbohydrate diffusion and cellular kinetics, EGU General Assembly 2023, Vienna, Austria, 23–28 Apr 2023, EGU23-3515, https://doi.org/10.5194/egusphere-egu23-3515, 2023.

EGU23-3790 | ECS | Posters on site | CL1.2.1

Modelling secondary tree growth of European forests based on high resolution satellite observations and climate data 

Jernej Jevšenak, Marcin Klisz, Jiří Mašek, Vojtěch Čada, Pavel Janda, Miroslav Svoboda, Ondřej Vostarek, Vaclav Treml, Ernst van der Maaten, Andrei Popa, Ionel Popa, Marieke van der Maaten-Theunissen, Tzvetan Zlatanov, Tobias Scharnweber, Svenja Ahlgrimm, Juliane Stolz, Irena Sochová, Catalin Roibu, Hans Pretzsch, and Allan Buras and the TREOS

Under climate change, modelling forest productivity is gaining increasing attention since forests on the one hand contribute to climate change mitigation by carbon sequestration and provide wood as an important renewable resource, and on the other hand increasingly suffer from extreme events such as droughts, late-frosts, and other disturbances. Despite major advancements in tree-growth modelling over the past decade, we still lack observation-based (in contrast to simulated) high-resolution, gridded forest growth products that could help to provide a better mechanistic understanding of forest responses to climate change, potentially improving mechanistic model parameterization.

Within this context, tree-ring measurements render an invaluable source of information since they approximate annual above-ground tree growth – and thus net primary production (NPP) – fairly well. Yet, tree-ring records represent local tree growth, which implies the necessity to upscale these NPP-proxies to stand and landscape levels to achieve gridded products. A well-known means to model tree growth is based on climate data, since tree growth to a large degree is governed by environmental conditions. However, local site-conditions modulate how climate translates into growth, therefore site-specific information is required to improve models based on gridded climate data. Here, earth observation from satellites (EOS) may render a valuable and relatively easy-to-obtain source of additional, site-specific information. This is because canopy reflectance in different bands (e.g. near infrared, red-edge, red) is closely related to the photosynthetic activity and thus NPP. Consequently, deploying gridded, open-access EOS data for improving growth predictions into space appears to be a promising research avenue. To date, the existing studies combining tree-ring data with EOS are mostly constrained to high latitudes (due to a very distinct growing season) and typically deployed EOS featuring coarse to moderate resolution. Consequently, assessing the potential of high-resolution (10 m – 20 m) remote-sensing missions such as Sentinel-1 and Sentinel-2 in mid-latitude forests will provide novel insights.

Within this framework, we recently assembled the TREOS-network. TREOS represents a sub-continental tree-ring network for eight common tree species in Central and Eastern Europe comprising 697 sites and spanning the region between 41.0 and 59.6° latitude and 5.6 and 27.9° longitude. For all sites, we extracted Sentinel-1 and Sentinel-2 time series of various bands along with gridded climate products and used various combinations of these explanatory variables to model tree growth as approximated by stand-level tree-ring chronologies. Species-specific models explained up to 70% of tree-growth variance, whereas clade-specific (i.e. gymnosperms vs. angiosperms) models performed worse (up to 30%), indicating the necessity to account for species-specific relationships. When implementing EOS data within multiple regressions model performance improved by up to 45%. In conclusion, these results indicate EOS- and climate-based gridded growth simulations to be generally feasible. Yet, problems related to species-specificity have to be solved, e.g. by deploying EOS-based tree-species classifications as a required source of information when projecting our models into space.

How to cite: Jevšenak, J., Klisz, M., Mašek, J., Čada, V., Janda, P., Svoboda, M., Vostarek, O., Treml, V., van der Maaten, E., Popa, A., Popa, I., van der Maaten-Theunissen, M., Zlatanov, T., Scharnweber, T., Ahlgrimm, S., Stolz, J., Sochová, I., Roibu, C., Pretzsch, H., and Buras, A. and the TREOS: Modelling secondary tree growth of European forests based on high resolution satellite observations and climate data, EGU General Assembly 2023, Vienna, Austria, 23–28 Apr 2023, EGU23-3790, https://doi.org/10.5194/egusphere-egu23-3790, 2023.

Tropical forests have been least studied for dendrochronology following the general perception that tropical trees do not form growth rings, exacerbated by the limited number of scientists focusing on tropical trees. This has created a gap in global dendrochronological studies. Through the two successful Africa Dendrochronological Fieldschools that were conducted in 2021 and 2022 in Zambia, we identified 32 tree species in 3,200m2 area of plots from the wet Miombo woodlands. 72% of these species demonstrated good potential for annual ring formation. Julbernardia and Brachystegia species where the oldest and dominant tree species. We developed chronologies from Julbernardia paniculata (140 years), Brachystegia longifolia (series Intercorrelation = 0.42, oldest tree = 160 years), and Brachystegia boehmii (series Intercorrelation = 0.49, oldest tree = 140 years). We also developed a strong multi-species chronology with thirteen wet Miombo woodland species (series Intercorrelation = 0.41, chronology length = 143 years). We found the average monthly precipitation of September to May and the maximum temperature of March to be the main climate variables driving tree growth. Through the two field schools, we trained 48 people from 10 countries (Belgium, Brazil, Cameroon, Colombia, DRC, Ghana, Namibia, South Africa, USA, and Zambia) of four continents (Africa, Europe, North America, and South America).

How to cite: Ngoma, J. and the Justine Ngoma: Tree-Ring Formation of Zambia’s Wet Tropical Miombo Woodlands- Exploratory Research Through African Dendrochronology Fieldschools, EGU General Assembly 2023, Vienna, Austria, 23–28 Apr 2023, EGU23-3917, https://doi.org/10.5194/egusphere-egu23-3917, 2023.

EGU23-4254 | ECS | Orals | CL1.2.1

Exploring the climatic and non-climatic fingerprints of the hydrogen isotope signals in tree rings. 

Valentina Vitali, Richard Peters, Marco Lehmann, Markus Leuenberger, Kerstin Treydte, Ulf Büntgen, Philipp Schuler, and Matthias Saurer

The analysis of a Europe-wide network of tree-ring stable isotopes has shown that the climatic signal of δ2H in tree-ring cellulose (C6H10O5), is far weaker compared to those recorded in carbon (δ13C) and oxygen (δ18O)isotopes. Furthermore, the δ2H and δ18O relationships were shown to be site dependent and significantly deviated from the Global Meteoric Water Line. These results suggest that non-climatic effects are modifying the hydrological signature of δ2H. Recent experiments have underlined the potential of δ2H in tree-ring cellulose as a physiological indicator of shifts in autotrophic versus heterotrophic processes. However, the impact of these processes has not yet been quantified under natural conditions.

Defoliating insect outbreaks can disrupt photosynthetic production and carbon allocation, stimulating the remobilization of stored carbohydrates. Such disturbance events, therefore, provide unique opportunities to evaluate the impact of changes in the use of fresh versus stored non-structural carbohydrates, i.e., of non-climatic signals stored in δ2H. By exploring a 700-year tree-ring record from Switzerland, we assess the impact of 79 larch budmoth (LBM, Zeiraphera griseana) outbreaks on the growth of its Larix decidua host trees.

LBM outbreaks significantly altered the tree-ring isotopic signature, creating a 2H-enrichment and a depletion in 18O 13C. Changes in tree physiology during outbreak years are shown by the decoupling of δ2H and δ18O (O–H relationship), in contrast to the positive correlation in non-outbreak years. The O–H relationship in outbreak years was not significantly affected by temperature, indicating that non-climatic physiological processes dominate over climate in determining δ2H variations. We conclude that the combination of these isotopic parameters may serve as a metric for assessing changes in physiological mechanisms over time and that hydrogen isotopes can be considered as a proxy for non-climatic disturbance signals in dendrochronological research.

How to cite: Vitali, V., Peters, R., Lehmann, M., Leuenberger, M., Treydte, K., Büntgen, U., Schuler, P., and Saurer, M.: Exploring the climatic and non-climatic fingerprints of the hydrogen isotope signals in tree rings., EGU General Assembly 2023, Vienna, Austria, 23–28 Apr 2023, EGU23-4254, https://doi.org/10.5194/egusphere-egu23-4254, 2023.

EGU23-4392 | ECS | Orals | CL1.2.1

Large volcanic eruptions elucidate source vs sink limitations to tree growth 

Antoine Cabon and William R L Anderegg

Forest productivity projections remain highly uncertain, notably because underpinning physiological controls are delicate to disentangle. Whereas photosynthesis (carbon source) has been commonly assumed to drive tree growth, growing evidence show that direct limitations to cambial activity (sink limitation) represent a substantial control of tree growth. It nevertheless remains unclear to which extent source and sink limitations interact to determine tree growth because these processes mostly respond to the same environmental cues. Radiation is a notable exception, but its annual variations are typically small and covary with multiples cofactors in natural settings. Large volcanic eruptions, which have been suggested to enhance forest photosynthesis globally through diffuse light fertilization, provide a unique opportunity to retrospectively isolate source and sink activities. Here, we use a multi-proxy dataset of tree-ring records distributed over the extra-tropical Northern Hemisphere to investigate the effect of eruptions on tree photosynthesis and growth. Dual tree-ring isotope records (13C and 18O) denoted a widespread 2–4 years increase of photosynthesis following eruptions, likely as a result of diffuse light fertilization. We found evidence that enhanced photosynthesis transiently drove ring width, but the latter further exhibited an independent decadal anomaly. Our results provide empirical evidence of essentially decoupled photosynthesis and tree growth response to large volcanic eruptions, hence suggesting widespread sink limitation to tree growth over the Northern Hemisphere.

How to cite: Cabon, A. and Anderegg, W. R. L.: Large volcanic eruptions elucidate source vs sink limitations to tree growth, EGU General Assembly 2023, Vienna, Austria, 23–28 Apr 2023, EGU23-4392, https://doi.org/10.5194/egusphere-egu23-4392, 2023.

EGU23-4413 | Orals | CL1.2.1

From wood anatomy to satellites: new frontiers for the upscaling of climate change in the Alpine tundra 

Marco Vuerich, Giacomo Trotta, Enrico Braidot, Petrussa Elisa, Valentino Casolo, Giorgio Alberti, and Francesco Boscutti

Tree ring growth is strictly bound to annual environmental conditions. Therefore, dendrochronology represents a solid tool for investigating the relationship between the whole plant growth and climate at high temporal resolution, especially in the context of ongoing climate change.

The temperature increase in the Alpine and Arctic ecosystems has been proven to enhance shrub growth contributing to the Arctic/Alpine greening, while the effects of the interaction between temperature and other climatic variables (e.g. precipitation/snowfall regime) on the shrub growth have often been neglected.

With the aim of parsing the relationships between the annual growth of Vaccinium myrtillus L., a key species in the Alpine tundra, temperature, precipitation, snowfall regime (i.e., in terms of temperature-based snowfall, known as snow water equivalent) and their interaction, we analyzed the xylem rings of 100 cross sections of underground bilberry stem, collected along a 500 meters altitude gradient above the tree line and corresponding over a period of 20 years (1995-2015). Furthermore, aiming at linking different ecological scales, we have adopted an ecological upscaling approach. With reference to the area and the period considered, we calculated NDVI using satellite images, and we studied the relationships between this vegetation index, climate, and the anatomical parameters.

Our results showed that both number (i.e. ramet age) and mean width of the rings were negatively affected by altitude. The mean annual temperature and snowfall showed significant interaction effects on mean ring width and xylem mean lumen area. Cold years (i.e. low mean annual temperature) and abundant snowfall led to a reduction in the mean ring width, while the snowfall regime did not affect annual ring width in warm years. Xylem mean lumen area was affected by precipitation only in cold years. The mean growth season NDVI increased significantly in the time span considered and showed a positive relationship with the average age of the bilberry community. The interaction between rainfall and average temperature of the vegetative season influenced the NDVI: a negative relationship between vegetation index and rainfall was observed in cooler vegetative seasons, while the relationship was specular in the case of higher temperatures.

These results suggest that future scenarios should not overlook the precipitation regime effect by virtue of its possible role in snowpack permanence and drought during the growth season. In this light the shrub expansion could also be curbed by the change of precipitation regime and the increased frequency of extreme climate events (e.g., shift of snowfall regime and intensification of heat waves). Moreover, our findings confirmed the potential use of the remote sensing tool for the understanding of the response of dwarf shrub communities to climate change also for long-term monitoring of these plant communities.

How to cite: Vuerich, M., Trotta, G., Braidot, E., Elisa, P., Casolo, V., Alberti, G., and Boscutti, F.: From wood anatomy to satellites: new frontiers for the upscaling of climate change in the Alpine tundra, EGU General Assembly 2023, Vienna, Austria, 23–28 Apr 2023, EGU23-4413, https://doi.org/10.5194/egusphere-egu23-4413, 2023.

EGU23-7234 | Posters on site | CL1.2.1

Atmospheric drying across Europe is unprecedented in a pre-industrial context 

Kerstin Treydte and the 67 co-authors

Vapour pressure deficit (VPD) represents the desiccation strength of the atmosphere, fundamentally impacting evapotranspiration, ecosystem functioning and vegetation productivity. Its spatial patterns and long-term changes under natural versus human-induced climate change are poorly understood but are essential for predicting its future ecological and socio-economic effects, e.g., on crop yield, bioclimatic comfort or wildfires. We combine regional reconstructions of pre-industrial summer VPD variability from a European tree-ring oxygen-isotope network with excellent climate sensitivity with observations and Earth System Model simulations. We demonstrate a recent human-induced intensification of atmospheric drying across Europe that exceeds natural variability specifically in the Alps and Pyrenees, but also in western, central and southern Europe. A less distinct increase occurs in Fennoscandia. This VPD increase may cause an enhanced risk of tree mortality, forest decline and yield reductionsevenin the temperate lowland regions of Europe, particularly when considering the extreme drought events in the recent years.

How to cite: Treydte, K. and the 67 co-authors: Atmospheric drying across Europe is unprecedented in a pre-industrial context, EGU General Assembly 2023, Vienna, Austria, 23–28 Apr 2023, EGU23-7234, https://doi.org/10.5194/egusphere-egu23-7234, 2023.

EGU23-7502 | ECS | Orals | CL1.2.1

Modelling the change in tree ring 13C discrimination as a response to selection harvest in a drained peatland forest 

Olli-Pekka Tikkasalo, Kersti Leppä, Samuli Launiainen, Mikko Peltoniemi, Raisa Mäkipää, Katja Rinne-Garmston, Elina Sahlstedt, Giles Young, Aleksandra Bokareva, Annalea Lohila, Mika Korkiakoski, Pauliina Schiestl-Aalto, and Aleksi Lehtonen

Studies on physiological response of suppressed trees to selection harvest are scarce. Understanding how trees respond to changes in environmental factors following harvest is needed for continuous cover forestry that aims to optimize both environmental impacts and economical gain. The physiological response of the trees can be understood by measuring stable carbon isotope composition (δ13C) which records the changes in photosynthesis and water use of the tree. The processes that determine the response can be further elaborated by comparing the measured isotopic signal to process-level model simulations.

We studied the response of Norway spruce (Picea abies) trees to selection harvesting on a fertile drained peatland forest located in southern Finland. The studied area consisted of a control plot which was left intact and of harvested plot which was thinned in March 2016. We measured intra-annual δ13C from tree-rings covering the period from 2010 to 2020 at the Stable Isotope Laboratory of Luke (SILL) (Lehtonen et al., accepted). The measured δ13C was compared to modelled 13C discrimination (Δ13C) simulated with a vertically resolved ecosystem model describing tree photosynthesis (Launiainen et al., 2015).

The δ13C measurements showed that after the harvest Δ13C decreased already on the following growing season. The overall decrease was ca. 3.3 ‰ on average between pre- and post-harvest periods. The decrease was caused by both changes in CO2 assimilation of the spruce trees and differences in meteorological conditions between pre- and post-harvest years. We simulated Δ13C with three different models with increasing number of fractionation processes considered. All three models predicted that as a response to harvest the Δ13C would decrease, however, none of the models could replicate the observed 3.3‰ drop in Δ13C. The most complex Δ13C model that included 13C fractionation in mitochondrial and photorespiration as well as transport of CO2 from stomata to mesophyll was the closest to the measurements.

The vertically resolved model allowed us to estimate that the changes in photosynthetically active radiation, relative humidity and needle temperature following the harvest contributed the most to the observed decrease in Δ13C. Further, model sensitivity analysis showed that the modelled Δ13C is the most sensitive to g1 parameter and mesophyll conductance. The g1 parameter is related to calculation of stomatal conductance (Launiainen et al., 2015; Medlyn et al., 2011). By tuning the g1 parameter and mesophyll conductance we were able to bring the modelled Δ13C closer to the observations.

References

Launiainen et al., Ecological Modelling, 312, 385-405, 2015.
Lehtonen et al., Forest Ecology and Management, accepted.
Medlyn et. al., Global Change Biology 17, 2134–2144, 2011

How to cite: Tikkasalo, O.-P., Leppä, K., Launiainen, S., Peltoniemi, M., Mäkipää, R., Rinne-Garmston, K., Sahlstedt, E., Young, G., Bokareva, A., Lohila, A., Korkiakoski, M., Schiestl-Aalto, P., and Lehtonen, A.: Modelling the change in tree ring 13C discrimination as a response to selection harvest in a drained peatland forest, EGU General Assembly 2023, Vienna, Austria, 23–28 Apr 2023, EGU23-7502, https://doi.org/10.5194/egusphere-egu23-7502, 2023.

EGU23-8180 | ECS | Orals | CL1.2.1

Holocene-long climate signals in tree-ring stable isotopes from the European Alps 

Tito Arosio, Kurt Nicolussi, Markus Leuenberger, Paul J. Krusic, Jan Esper, and Ulf Büntgen

It has recently been argued that tree-ring stable isotopes (TRSI) can reveal persistent long-term hydroclimate trends that are usually not captured by more traditional dendroclimatic studies using tree-ring width or density (Büntgen 2022). Since the putative long-term discrepancy between ‘growth-dependent’ ring width and density versus ‘growth-independent’ TRSI proxies is likely unrelated to biases from age-trend removal (Büntgen et al. 2021; Yang et al. 2021), we propose a re-evaluation of the predictive power of various tree-ring parameters for reconstructing climate variability at interannual to multimillennial timescales. We analyse 7800 high-resolution δ18O, δ13C, δD measurements from about 200 high-elevation conifers of the Alpine Holocene Triple Tree Ring Isotope Record (AHTTRIR; Arosio et al. 2022) to assess ultra-long climate trends well beyond the segment length of individual tree-ring samples. Despite the spatiotemporal data heterogeneity, and associated signal complexity of AHTTRIR, we show that δ18O values contain a reasonable level of coherency with summer hydroclimate variability. In line with two independent TRSI studies from central Europe and monsoon Asia (Büntgen et al. 2021; Yang et al. 2021), our new δ18O Alpine chronology reveals a significant long-term drying trend over the past 6000 years. We interpret this multimillennial hydroclimate trajectory as a response to long-term negative orbital forcing (i.e., insolation changes due to the Earth’s axial precession). Our findings advise caution when applying corrections to TRSI data in order to preserve Holocene long trends. Considering the unique paleoclimatic values of TRSI, more such records are needed from a wide range of species and regions in both hemispheres.


Arosio Tito, Malin Ziehmer, Kurt Nicolussi, Christian Schluechter, Andrea Thurner, Andreas Österreicher, Peter Nyfeler, and Markus Christian Leuenberger,. 2022. “Alpine Holocene Triple Tree Ring Isotope Record.” PANGAEA, 2022. https://doi.pangaea.de/10.1594/PANGAEA.941604.

Büntgen Ulf. 2022. “Scrutinizing Tree-Ring Parameters for Holocene Climate Reconstructions.” Wiley Interdisciplinary Reviews: Climate Change, e778.

Yang Bao, Chun Qin, Achim Bräuning, Timothy J. Osborn, Valerie Trouet, Fredrik Charpentier Ljungqvist, Jan Esper, Lea Schneider, Jussi Grießinger, and Ulf Büntgen. 2021. “Long-Term Decrease in Asian Monsoon Rainfall and Abrupt Climate Change Events over the Past 6,700 Years.” Proceedings of the National Academy of Sciences 118 (30): e2102007118.

How to cite: Arosio, T., Nicolussi, K., Leuenberger, M., Krusic, P. J., Esper, J., and Büntgen, U.: Holocene-long climate signals in tree-ring stable isotopes from the European Alps, EGU General Assembly 2023, Vienna, Austria, 23–28 Apr 2023, EGU23-8180, https://doi.org/10.5194/egusphere-egu23-8180, 2023.

In recent decades, visual identification of flood rings (event years) has been successfully used to document historic high-magnitude spring floods. In Fraxinus spp., flood rings usually have more numerous earlywood vessels and/or earlywood vessels with smaller cross-sectional area than observed in "normal" years. Visual identification of flood rings has also shown to be reproductible.  In more recent times, quantitative wood anatomy of earlywood features (continuous time series) has, among other, been successfully used to reconstruct spring flow and associated flood conditions. In Interior North America, most paleoflood studies have focused on visually identifying flood rings in bur oak (Quercus macrocarpa Michx.) trees growing along river terraces; the idea being that in these “high” elevation sites only high-magnitude floods may be recorded. In this study, we reexamined tree-ring samples collected in 2004-2005 from 87 green ash (Fraxinus pennsylvanica Marsh.) trees growing in four floodplain sites (~20 trees per site) located in the central Assiniboine river watershed i.e., in Spruce Wood Provincial Park, Manitoba. Flood rings were visually searched in all samples and compiled during the crossdating procedure. Earlywood vessels (area ≥ 1000 µ2) were measured in five trees selected from each of the four floodplain sites. In addition, we determined from a subset of these trees the blue intensity from high-resolution scans of tree-rings and compared them, among others, to the earlywood vessel characteristics. Developed chronologies were compared to both regional climate and hydrological records. They were also compared to former flood-ring studies using bur oak trees growing on terraces in the upper Assiniboine river and/or the lower and upper Red river. Results indicated that visual identification of flood rings in F. pennsylvanica was reproductible. Both the relative frequency of flood rings and earlywood mean vessel area were significantly associated with winter precipitations, spring snow cover, spring temperatures and spring runoff records. Some of the years recording the most flood rings were 1948, 1955, 1956, 1976 and 1995. These years corresponded to documented major floods for the central Assiniboine river. They, however, poorly coincided to those observed in bur oak trees growing on terraces along the upper Assiniboine river and the Red river (e.g., 1950, 1979, 1997). These results highlight, among others, the differences between tree species, habitat selection as well as between the rivers’ flood dynamics. We argue that floodplain trees compared to terrace trees, and especially when old individuals are available, may provide a clearer overall picture of flood dynamics and of long-term hydroclimatic changes as they capture conditions leading to both small and large floods. At this time, blue intensity analyses of the floodplain trees remain to be completed. Given than flood rings have been associated with low density earlywood, it is hypothesized that blue intensity (a proxy for tree-ring density) may yield potential in paleoflood studies.

How to cite: Tardif, J. C., Conciatori, F., and Smith, D. L.: Fraxinus pennsylvanica trees growing along the central Assiniboine river floodplain, Central Canada: Flood rings, quantitative wood anatomy and blue intensity., EGU General Assembly 2023, Vienna, Austria, 23–28 Apr 2023, EGU23-8464, https://doi.org/10.5194/egusphere-egu23-8464, 2023.

Tree-rings are a valuable proxy for reconstructing past environmental conditions such as climate at annual or intra-annual resolutions. Tree-ring dating has an enormous potential for better understanding climate dynamics under a changing climate. In Alpine regions, changes in climate may well lead to switches between temperature-limitation and precipitation-limitation. However, such changes cannot be separated from local environmental influences such as altitude and aspect. In this study, we applied the standard statistical approaches of dendrochronology to understand climate-growth relationships as a function of elevational gradients to understand how altitude conditions the impacts of climate change impacts on tree growth. For the growth of European Larch (Larix decidua) trees in the Turtmann river basin (2000 m a.m.s.l.), a glacier-fed river basin in the Swiss Alps, located in south-western Switzerland, we find that climate warming is leading to some switching from temperature limitation to precipitation limitation and vice-versa according to altitude. The climate-growth relationship further reveals that the growth of Larix decidua in this river basin is positively correlated with the October and November temperature of the previous year (r= 0.46, α=0.01). Comparing these changes with other tree-ring chronologies from the international tree-ring data bank (ITRDB) for the same species at much lower elevation transects  (e.g. 1500 m and 900 m a.m.s.l) show that the tree growth switches from temperature limitation to precipitation limitation. The growth of Larix decidua for these lower elevation trees correlates positively with the current year June-July precipitation (r= 0.40, α=0.01). A number of factors including differences in micro-climate and the effects of aspect (i.e. north versus south facing) across the elevational gradient are most likely to be responsible for these differences. Therefore, in the context of Swiss Alps where the temperature is rising at more than twice the global average, there is likely a breakpoint where the signal changes from temperature-limitation to precipitation-limitation across the elevational gradient and that climate change is causing this breakpoint to rise with altitude through time.

Keywords: Tree-rings, Larix decidua, Climate change, Turtmann river, Swiss Alps 

How to cite: Islam, N., Lane, S., Vennemann, T., and Meko, D.: Identification of an elevational breakpoint where climatic signal changes for the growth of Larix decidua tree rings in a glacier-fed river basin in the Swiss Alps, EGU General Assembly 2023, Vienna, Austria, 23–28 Apr 2023, EGU23-8493, https://doi.org/10.5194/egusphere-egu23-8493, 2023.

EGU23-8963 | ECS | Posters on site | CL1.2.1

A ~700 years perspective on the 21st century drying in the eastern part of Europe based on δ18O in tree ring cellulose 

Viorica Nagavciuc, Monica Ionita, Zoltán Kern, Danny McCarrol, and Ionel Popa

Numerical simulations indicate that extreme climate events (e.g. droughts, floods, heat waves) will increase in a warming world, putting enormous pressure on society and political decision-makers. To provide a long-term perspective on the variability of these extreme events, here we use a ~700 years tree-ring oxygen isotope chronology from Eastern Europe, in combination with paleo-reanalysis data, to show that the summer drying over Eastern Europe observed over the last ~150 years is to the best of our knowledge unprecedented over the last 700 years. This drying is driven by a change in the pressure patterns over Europe, characterized by a shift from zonal to a wavier flow around 1850CE, leading to extreme summer droughts and aridification. This is the first and longest reconstruction of drought variability, based on stable oxygen isotopes in the tree-ring cellulose, for Eastern Europe, helping to fill a gap in the spatial coverage of paleoclimate reconstructions (Nagavciuc et al., 2022). Nagavciuc, V., Ionita, M., Kern, Z., McCarroll, D. and Popa, I.: A ~700 years perspective on the 21st century drying in the eastern part of Europe based on δ18O in tree ring cellulose, Commun. Earth Environ., 3, 277, doi:10.1038/s43247-022-00605-4, 2022.

How to cite: Nagavciuc, V., Ionita, M., Kern, Z., McCarrol, D., and Popa, I.: A ~700 years perspective on the 21st century drying in the eastern part of Europe based on δ18O in tree ring cellulose, EGU General Assembly 2023, Vienna, Austria, 23–28 Apr 2023, EGU23-8963, https://doi.org/10.5194/egusphere-egu23-8963, 2023.

EGU23-9286 | Orals | CL1.2.1

Impact of gas emissions from oil and gas reservoirs on stable carbon isotope variability in tree rings 

Olga Churakova (Sidorova), Georgy Batalin, Bulat Gareev, Gazinur Mingazov, Andrey Terekhin, Denis Tishin, Dilyara Kuzina, and Danis Nurgaliev

Accelerated development of energy resources around the world has significantly increased forest change associated with oil and gas activities, leading to both carbon dioxide and methane emissions. The impacts of these anthropogenic indirect greenhouse gases play a significant role on forest ecosystems at the regional and global scales.

In this study we aim to reveal site-specific differences in stable carbon isotope (δ13С) variability of pine trees (Pinus sylvestris) growing on the territory of (i) oil and gas reservoirs located in Almetyevsk and Leninogorsk regions (Tatarstan Republic, Russian Federation) classified as “disturbed”; and (ii) in a remote “undisturbed” site in Raifa, which is located ca. 250 km away from the oil and gas deposits.

Tree cores were sampled from the south- and north-facing sides of each of the nine trees for both study sites using a Pressler increment borer. The state-of-the-art classical dendrochronological method was applied for the tree-ring width measurements and cross-dating. Each annual ring was split using a sharp BA-170P NT blade under the Leica M50 microscope. Stable carbon isotope measurements were performed for each year separately using a Delta V Plus isotope mass spectrometer (Thermo Fisher Scientific, Germany) via a Flash HT Plus in constant flow mode. Based on the nine individual trees stable carbon isotope chronologies were developed from 1930 to 2022. Tree-ring δ13C in wood chronologies were corrected according to δ13C atmospheric CO2 for both study sites.

Results of our study indicate significant differences between carbon isotope variability in tree rings from “disturbed” the oil and gas deposits site, which is rapidly developed over the recent decades compared to the “undisturbed” natural forest site.

This work was funded by the Kazan Federal University Strategic Academic Leadership Program (PRIORITY-2030).


How to cite: Churakova (Sidorova), O., Batalin, G., Gareev, B., Mingazov, G., Terekhin, A., Tishin, D., Kuzina, D., and Nurgaliev, D.: Impact of gas emissions from oil and gas reservoirs on stable carbon isotope variability in tree rings, EGU General Assembly 2023, Vienna, Austria, 23–28 Apr 2023, EGU23-9286, https://doi.org/10.5194/egusphere-egu23-9286, 2023.

EGU23-10257 | Orals | CL1.2.1

The potential of tree-ring chronologies to global-change studies in the tropics: a quantitative review 

Peter Groenendijk, Flurin Babst, Daniela Granato Souza, Giuliano Locosselli, Mulugeta Mokria, Natshuda Pumijumnong, Valerie Trouet, Shankar Panthi, Fan Zexin, and Pieter Zuidema and the Tropical Tree-ring Network

Tropical forests and woodlands are key components of global carbon and water cycles and due to their importance we need to better understand present and future tropical tree growth responses to climatic variation. Tree-ring analyses provide long-term datasets from which such responses can be derived. A substantial number of tropical tree-ring chronologies exist with hundreds of topical tree species showing potential for tree-ring analyses. Despite this large potential, a quantitative analysis of the distribution and characteristics of tropical tree-ring chronologies is missing. We compiled a network of >490 tropical ring-width chronologies to assess their geographic and climatic distribution, and the gaps therein. To evaluate the potential for climate reconstructions we assessed the timespan covered by these chronologies, the strength of their common growth signal (rbar), where the strongest climate-growth correlations are found, and how these chronology attributes correlate with mean climatic conditions per site. Finally, we used species-distribution modelling to identify regions with high potential for building long chronologies. We answer these questions at pantropical level and address important differences between continents and between angiosperms and gymnosperms. Tropical chronologies have been built in all continents and tropical climate types but chronology building is biased towards high-elevation locations and gymnosperms, with clear gaps in warmer and wetter climates, on the African continent and for angiosperm species. Chronology length correlated negatively with mean annual temperature (MAT), while the common growth signal decreases with increasing mean annual precipitation (MAP) and MAT. Drier sites have the most responsive chronologies: the strength of the precipitation-growth correlations decreases with increasing MAP, but showed no correlation with MAT. Tropical dendrochronological studies already cover a substantial part of the tropics and most areas are expected to have 5 to 15 species with potential to generate centennial chronologies. This study wil provide an important basis to select species and areas to expand dendrochronological studies to underrepresented areas and improve our understanding of the climatic drivers of tropical forest tree growth. 

How to cite: Groenendijk, P., Babst, F., Granato Souza, D., Locosselli, G., Mokria, M., Pumijumnong, N., Trouet, V., Panthi, S., Zexin, F., and Zuidema, P. and the Tropical Tree-ring Network: The potential of tree-ring chronologies to global-change studies in the tropics: a quantitative review, EGU General Assembly 2023, Vienna, Austria, 23–28 Apr 2023, EGU23-10257, https://doi.org/10.5194/egusphere-egu23-10257, 2023.

EGU23-10684 | Orals | CL1.2.1

Environmental drivers of observed photosynthetic carbon isotope discrimination in trees 

Soumaya Belmecheri, Paul Szejner, David Frank, Steve Voelker, Alienor Lavergne, and Rossella Guerrieri

Under elevated CO2, photosynthetic carbon isotope discrimination is expected to increase in response to photosynthesis stimulation driven by the growth of atmospheric CO2. While this response is widely documented in laboratory, field experiments and short-term observations, long-term proxies indicate that such response is not universally observed in forested ecosystems. We investigated historical trends of  photosynthetic carbon isotope discrimination derived from carbon isotope measurements of tree rings (Δ13C) from a large set of chronologies across a variety of climate regions and biomes. We first predicted Δ13C response to CO2 as reconstructed from a recent meta-analysis of paleo and elevated CO2 data to detect and quantify the magnitude of Δ13C change-if any driven solely by increases in atmospheric CO2. In a second step we assessed the deviation of observed tree-ring Δ13C from the that predicted in response to CO2 only. We found that the majority of tree-ring chronologies (~80%) exhibited a negative deviations from the expected Δ13C if driven by a CO2 stimulation of photosynthesis (A). Chronologies with negative deviations were negatively correlated with vapor pressure deficit (VPD), and correspond to sites with a  maximum of 30% increase in VPD over the period of record. The widespread negative Δ13C deviations are consistent with a reduction of stomatal conductance (gs) or A having not increased as much as expected for a given CO2-driven stimulation of A.

How to cite: Belmecheri, S., Szejner, P., Frank, D., Voelker, S., Lavergne, A., and Guerrieri, R.: Environmental drivers of observed photosynthetic carbon isotope discrimination in trees, EGU General Assembly 2023, Vienna, Austria, 23–28 Apr 2023, EGU23-10684, https://doi.org/10.5194/egusphere-egu23-10684, 2023.

EGU23-11557 | Posters on site | CL1.2.1

Progress in high-resolution isotope-ratio analysis of tree rings using laser ablation 

Matthias Saurer, Elina Sahlstedt, Katja Rinne-Garmston, Marco Lehmann, Manuela Oettli, Arthur Gessler, and Kerstin Treydte

Stable isotope ratio analysis of tree rings has been widely and successfully applied in recent decades for climatic and environmental reconstructions. These studies were mostly conducted at an annual resolution, considering one measurement per tree ring, often focusing on latewood. However, much more information could be retrieved with high-resolution intra-annual isotope studies, based on the fact that the wood cells and the corresponding organic matter are continuously laid down during the growing season. Such studies are still relatively rare, but have a unique potential for reconstructing seasonal climate variations or short-term changes in physiological plant properties, like water-use efficiency. The reason for this research gap is mostly technical, as on the one hand sub-annual, manual splitting of rings is very tedious, while on the other hand automated laser ablation for high-resolution analyses is not yet well established and available. Here, we give an update on the current status of laser ablation research for analysis of the carbon isotope ratio (δ13C) of wood, describe an easy-to-use laser ablation system, its operation and discuss practical issues related to tree core preparation, including cellulose extraction. The results show that routine analysis with up to 100 laser shot-derived δ13C-values daily and good precision and accuracy (ca. 0.1‰) comparable to conventional combustion in an elemental analyser are possible. Measurements on resin-extracted wood is recommended as most efficient, but laser ablation is also possible on cellulose extracted wood pieces. Considering the straightforward sample preparation, the technique is therefore ripe for wide-spread application. With this work, we hope to stimulate future progress in the promising field of high-resolution environmental reconstruction using laser ablation.

How to cite: Saurer, M., Sahlstedt, E., Rinne-Garmston, K., Lehmann, M., Oettli, M., Gessler, A., and Treydte, K.: Progress in high-resolution isotope-ratio analysis of tree rings using laser ablation, EGU General Assembly 2023, Vienna, Austria, 23–28 Apr 2023, EGU23-11557, https://doi.org/10.5194/egusphere-egu23-11557, 2023.

EGU23-11606 | Orals | CL1.2.1

On the role of soil water storage capacity and soil nutrients on tree growth of selected tree species in Central Europe. 

Josef Gadermaier, Elisabeth Wächter, Michael Grabner, Sonja Vospernik, and Klaus Katzensteiner

While numerous correlational studies on the impact of climatic variation on tree ring formation consider plant functional traits, masting cycles and stochastic disturbances, the role of soil properties is frequently neglected due to insufficient data availability. Using a homogenous dataset of increment cores collected in mature stands at 1562 different forest sites with detailed plot specific climate, stand and soil information in the province of Styria in Austria we are focusing on the role of soil water storage (plant available water capacity – AWC) and soil nutrient status on tree ring formation. The study area covers a wide altitudinal and climate gradient with mean annual temperatures ranging from 2.1°C to 10.2°C and mean annual precipitation ranging from 695 mm to 2024 mm. Generalized Additive Mixed Models (GAMM) for annual tree ring width over 38 years (1980 to 2018) were fitted for six tree species (Abies alba, Fagus Sylvatica, Larix decidua, Picea abies, Pinus sylvestris, Quercus robur/petrea). Individual tree characteristics, stand attributes, general site characteristics (terrain information calculated from high resolution ALS), downscaled climate information in high temporal resolution, and soil information were used as independent variables. Soil data was derived from a morphological description of 80 cm soil pits dug on each corresponding forest site. Via pedo-transfer-functions (using functions available from the literature as well as derived from laboratory analyses of approximately 25% of the pits), soil characteristics such as AWC and soil nutrient status were calculated.

In a two-step procedure, we first developed a general tree growth model, including solely tree and stand attributes (e.g. age, competition) and general site specific information available in high spatial resolution (e.g. slope, aspect, irradiance, mean annual temperature, precipitation). Subsequently, we added soil attributes to the model and checked for their effect on model parameters. AWC and soil nutrient status do have significant influence on tree ring formation when added to the tree ring model. However, this effect varies amongst tree species. The results are consistent with tree species specific traits as available from literature: E.g. deep rooting species like Quercus benefit more from high water storage capacity than shallow rooting Picea abies; the effect of soil nutrient status is most pronounced for Fagus sylvatica, which has high nutritional requirements and more negligible for Pinus sylvestris, with low nutritional requirements. As soil formation itself depends upon geological substrate, landform and climate, the improvement of model quality when adding additional soil information is moderate.

How to cite: Gadermaier, J., Wächter, E., Grabner, M., Vospernik, S., and Katzensteiner, K.: On the role of soil water storage capacity and soil nutrients on tree growth of selected tree species in Central Europe., EGU General Assembly 2023, Vienna, Austria, 23–28 Apr 2023, EGU23-11606, https://doi.org/10.5194/egusphere-egu23-11606, 2023.

Variation in life-history and ecophysiological traits has key ecological significance in plants, in which environmental changes play a central role throughout their life cycles. Stone pine (Pinus pinea L.) is one of the most characteristic species of the Mediterranean basin that is able to grow under harsh, limiting conditions and is typically defined as a masting species. Considering the high economical value associated with edible nut production, the masting habit of stone pine has been a main concern for forest management of the species. Here, we investigate the masting mechanism through characterization of temporal changes in tree ring-width (TRW), ecophysiological (cellulose Δ13C and δ18O) and cone yield patterns for five monospecific stands in north-central Spain. The regional positive (r = 0.41, SE = 0.25) and negative (r = –0.89, SE = 0.49) relationships involving tree growth vs. Δ13C and δ18O, respectively, suggest drought impairing carbon uptake via stomatal regulation for water saving occurring in the area during the period of 1960–2016. Increasingly positive relationships between TRW and Δ13C indicate intensifying impacts of drought on tree performance over time. By analyzing Δ13C–yield interannual dynamics, we found variable coupling of cone production with leaf-level gas exchange during the 4-year reproductive cycle of the stone pine. Particularly, the strongly positive relationships between Δ13C and yield with a 3-year lag, corresponding to strobili development and pollination, vanished and became non-significant in the recent decades. Thus, weather conditions during conelet emergence are not driving anymore cone production, which initially was sink-limited. In contrast, the relationships between Δ13C and a 1-year lagged yield, i.e. when cone enlargement and seed maturation occur, largely increased over the study period running from nearly zero (1960–1989 period) to above 0.50 (1987–2016 period) indicating a recent source limitation of reproduction driven by a harsher climate. Our results provide evidence that, although cone yield does not impose a penalty on aboveground biomass increments, it is becoming progressively limited by warming-induced effects of drought on tree ecophysiological performance.

How to cite: Shestakova, T. A., Sin, E., and Voltas, J.: Long-term physiological insights of cone production as related to carbon isotope fractionation in stone pine forests of northern Spain, EGU General Assembly 2023, Vienna, Austria, 23–28 Apr 2023, EGU23-11894, https://doi.org/10.5194/egusphere-egu23-11894, 2023.

EGU23-13858 | Posters on site | CL1.2.1

International education and research during the pandemic: 31st European Dendroecological Fieldweek 2021 in Val Mustair, Switzerland 

Ryszard Kaczka, Kerstin Treydte, Elisabet Martínez-Sancho, Isabel Dorado-Liñán, Anne Verstege, Alma Piermattei, and Alan Crivellaro and the Participants of the 31st European Dendroecological Fieldweek

The European Dendroecological Fieldweek (EDF) provides an intensive learning experience in tree-ring research for anyone approaching or working in dendrochronology. Here we present an overview of scientific activities of the 31st EDF, held in Val Müstair, Switzerland, in summer 2021. Despite the COVID-19 pandemic, the EDF gathered 20 participants and 10 instructors (7 dendrochronologists and 3 local experts) from 10 European countries and provided valuable outcomes for the local stakeholders such as Biosfera, the forest service and the private-public of Val Müstair.

During the eight days of the EDF, six groups developed different tree-ring projects, carefully designed with respect to the loal environmental setting. The dendroarchaeology group dated two buildings, an abandonned stable and a house in Val Müstair, providing private owners with accurate construction dates. The dendroclimatology group explored the potential of a relict Scots pine forest growing at ~2000 m asl for climate reconstruction, and created a chronology from 1648 to 2020 CE. The wood anatomy group found that the larger vessel sizes and and higher radial growth rates of two alpine shrub species at moist compared to dry sites, while tree ages were similar at both sites. The Blue Intensity group identified a robust climate signal in the BI chronology of high-elevation Norway spruce trees, which was significantly stronger than in the tree-ring width chronology. One dendroecology group found that growth of local larch trees recorded outbreaks of the grey larch budmoth between 1880 and 1980, a stop of outbreaks after and its return in 2018. A second dendroecology group investigated larch trees along an abandoned irrigation channel and could not detect a significant effect of the irrigation stop on growth.

The EDFs continuously provide an essential service to the dendrochronological community, and this even during challenging times. The 31st EDF was again an educational, scientific and multi-cultural experience in a unique environmental setting. It resulted in highly interesting and valuable scientific outreach and opened up new avenues for future tree-ring research in Val Mustair. 

How to cite: Kaczka, R., Treydte, K., Martínez-Sancho, E., Dorado-Liñán, I., Verstege, A., Piermattei, A., and Crivellaro, A. and the Participants of the 31st European Dendroecological Fieldweek: International education and research during the pandemic: 31st European Dendroecological Fieldweek 2021 in Val Mustair, Switzerland, EGU General Assembly 2023, Vienna, Austria, 23–28 Apr 2023, EGU23-13858, https://doi.org/10.5194/egusphere-egu23-13858, 2023.

EGU23-13879 | ECS | Orals | CL1.2.1

The History of Fire, Human Influence and Climate in Black Pine Forests, Western Anatolia 

Evrim A. Şahan, Bedirhan Gürçay, and H. Tuncay Güner

Wildfire is a dynamic natural phenomenon the causes and consequences have changed for millions of years. We previously found out and discussed the fire history of Western Anatolia to understand the drivers of fires over 600 years. In that study, we find out that simultaneous fires occurred in multiple sites and this period overlapped with the longest and most severe drought period of the past 550 years and the fire frequency decline after 1934 coincided with the period of the first forest protection law in 1937. Dry, as well as prior wet conditions were the main drivers of fires in the black pine forests in western Anatolia. On the other hand, to highlight the direct human influence in a high-risk fire region, we sampled one additional site from Antalya (Türkiye) and collected fire-scarred wood samples from both living trees and remnant woods. In this study, we developed a 519-year-long site-level composite chronology using dendrochronological methods with low frequency and no significant relationship was found between dry and major fire years. The recorded fire years for each individual showed that a fire in one tree did not spread and grow to other neighbouring trees. Despite the high risk of fire, fires occurred less frequently can be interpreted as an intense human influence in the area, also observed axe marks in the catface formations and the nomadic tents right next to the site highlight the human influence. These forests were used extensively by the Turkish tribes also called “Yörüks”, who led a nomadic life in the Taurus Mountains for centuries. Although this area is under a high fire risk, the low fire frequency may be due to the reduced amount of combustible materials by goat grazing. Since goats feed not only on grass but also on fresh sprouts, helps to reduce the frequency of fires by consuming both the combustible material under the forest and the branches of the trees closer to the forest ground. Due to the grazing, shoots close to the ground decrease that also decreases the probability of the shift in fire regime from surface to crown fire. We believe that protecting and promoting the culture of Yörüks in the Taurus Mountains will be an important way to protect not only the culture but also the forests.

This research was funded by the Scientific and Technological Research Council of Turkey (TÜBİTAK) (Project number: 118O306). 

How to cite: Şahan, E. A., Gürçay, B., and Güner, H. T.: The History of Fire, Human Influence and Climate in Black Pine Forests, Western Anatolia, EGU General Assembly 2023, Vienna, Austria, 23–28 Apr 2023, EGU23-13879, https://doi.org/10.5194/egusphere-egu23-13879, 2023.

EGU23-14680 | ECS | Orals | CL1.2.1

European hydroclimate variability of the past 400 years based on tree-ring isotopes 

Mandy Freund, Gerhard Helle, Daniel Balting, Natasha Ballis, Gerhard Schleser, and Ulrich Cubasch

In recent decades, Europe has experienced more frequent flood and drought events. However, little is known about the long-term, spatiotemporal hydroloclimatic changes across Europe. We show the first climate field reconstruction spanning the entire European continent based on tree-ring stable isotopes. A pronounced seasonal consistency in climate response across Europe leads to a unique, well-verified spatial field reconstruction of European summer hydroclimate back to 1600. We find distinct phases of European hydroclimate variability as possible fingerprints of solar activity (coinciding with the Maunder Minimum and the end of the Little Ice Age), pronounced decadal variability and a long-term drying trend from the mid 20th century. The recent European summer conditions are highly unusual in a multi-century context and unprecedented for large parts of central and western Europe.

How to cite: Freund, M., Helle, G., Balting, D., Ballis, N., Schleser, G., and Cubasch, U.: European hydroclimate variability of the past 400 years based on tree-ring isotopes, EGU General Assembly 2023, Vienna, Austria, 23–28 Apr 2023, EGU23-14680, https://doi.org/10.5194/egusphere-egu23-14680, 2023.

EGU23-14702 | Orals | CL1.2.1

Late spring frost impacts on radial growth of European beech near its upper elevational limit 

Yann Vitasse, Frederik Baumgarten, Joann Reim, Arthur Gessler, and Elisabet Martinez-Sancho

Global warming has considerably advanced the start of the growing season of temperate trees. However, the rate of this phenological change does not necessarily track the changes in the date of the last spring frost, also induced by climate change, which may result in a higher risk of false spring. When a late spring frost (LSF) occurs during tree leaf emergence, it can lead to complete tree defoliation. Although the impacts of LSFs are rarely fatal for a tree, they may play a decisive role in combination with extreme droughts in determining species distribution limits in the near future.

Here we aimed at assessing the impact of LSFs on tree growth of a frost-sensitive species, European beech (Fagus sylvatica L.), and retrospectively quantify the LSF regime in two sites of the Swiss Jura mountains. We collected increment cores of beech and a more freezing tolerant species, Norway spruce (Picea abies (L.) Karst) from a site where LSF damage was observed in May 2020 located at 1,365 m asl and in a second site where no frost damage was observed in 2020 at 1,065 m asl. Climate-growth relationships were established at both sites and for two different periods (1953–1986 and 1987–2020) to identify species-specific climatic drivers and potential temporal shifts. To further distinguish years with LSF impacts on beech radial growth, climatic signals not related to LSF recorded in the spruce series were removed from the beech chronologies.

Our preliminary analyses indicated that tree growth was dominated by different climatic factors in the two study sites: tree growth was limited by cold temperatures during both study periods in the higher elevation site whereas drought signals were apparent in tree growth during the second study period in the lower elevation site. Interestingly, beech growth was initially negatively and then positively related to spring minimum temperature at the higher elevation site. At the lower elevation site, warm temperatures in spring promoted tree growth of both species only during the second period (1987–2020). By subtracting the climatic signals of spruce on beech chronologies, we identified five and two years potentially affected by LSF during the last 30 years at the upper and lower sites, respectively. We are currently calibrating phenological models to climatically identify the years with potential frost damage and verify if these years are consistent with the ones identified with the previous dendrochronological analyses.

We further hypothesized that a damaging spring frost followed by a severe drought during summer may have a much larger impact than drought alone. Further investigations should be conducted on this aspect as the frequency and severity of extreme droughts are expected to increase while spring onset will continue to advance under a warmer climate, potentially increasing the risk of frost damage. 

How to cite: Vitasse, Y., Baumgarten, F., Reim, J., Gessler, A., and Martinez-Sancho, E.: Late spring frost impacts on radial growth of European beech near its upper elevational limit, EGU General Assembly 2023, Vienna, Austria, 23–28 Apr 2023, EGU23-14702, https://doi.org/10.5194/egusphere-egu23-14702, 2023.

EGU23-152 | ECS | Posters on site | CL1.2.2

Quantifying Holocene relative sea-level changes and paleoclimate using the Scottish speleothem record 

Kang Xie, Martin Lee, Cristina Persano, and John Faithfull

Speleothems, secondary cave carbonates, are valuable archives for reconstructing paleoclimate and relative sea-level changes where the caves are in coastal locations. Unlike the typical speleothems found in carbonate caves, speleothems were recently discovered in a meta-silicate sea cave in Iona, on the west coast of Scotland. Although speleothems have previously been reported from caves in volcanic rocks, speleothems in metamorphic caves have rarely been reported. The Iona speleothems are potentially crucial because paleoclimate reconstructions spanning the Holocene are scarce in Scotland due to a lack of material, particularly speleothems, which can be dated precisely using geochemical dating methods. In this research, the U-Th and 14C dating techniques will be used to constrain the precise age and growth history of the Iona speleothem. Results from pilot U-Th dating of the first speleothem sampled show it is about 1760 ~ 4780 years old (the data, however, have uncertainties up to 69.9%, due to the presence of non-authigenic Th). As for paleoclimate, oxygen isotopes indicate that the amount of precipitation was at a relatively low level between 3000 and 2000 years ago, then increased dramatically from ~2000 to 1760 years ago. These preliminary data indicate that the Iona speleothem has the potential to provide important insights into the Late Holocene relative sea-level changes and climate.

How to cite: Xie, K., Lee, M., Persano, C., and Faithfull, J.: Quantifying Holocene relative sea-level changes and paleoclimate using the Scottish speleothem record, EGU General Assembly 2023, Vienna, Austria, 23–28 Apr 2023, EGU23-152, https://doi.org/10.5194/egusphere-egu23-152, 2023.

EGU23-584 * | Posters on site | CL1.2.2 | Highlight

Extreme rain event during November 1617: from the eastern Iberian Peninsula to Balearic Islands. Speleothem records and historical documents. 

Mercè Cisneros, Mariano Barriendos, Javier Sigro, Josep Barriendos, and Enric Aguilar

Under the current climate change situation, the Mediterranean region has been identified as one of the primary hot-spots, expecting not only to become warmer, but also drier during the twenty-first century. Changing conditions also include an increase in the frequency of intense torrential rainfall events, whose occurrence has already caused increasing flash flood events with catastrophic impacts and human casualties. The understanding of the past extreme events is challenging and useful to deal with the current situation.

During November 1617 an extreme rain event has been documented by previous studies in a large latitudinal region from southern France to eastern river basins of the Iberian Peninsula (Thorndycraft et al., 2006). Here we present new evidences of the large-scale impact of this extreme event based on a multi-proxy approach. On the one hand, the occurrence of this event is interpreted by means of a flood cave horizon detected in a speleothem from Mallorca (Balearic Islands). On the other hand, historical documents depict this event also in some localities of Pyrenees, enhancing its longitudinal occurrence.

Through the integration with previous climate, paleohydrological and qualitative hydrometeorological reconstructions, we try to understand the complex atmospheric mechanisms that caused this event during the Little Ice Age.

How to cite: Cisneros, M., Barriendos, M., Sigro, J., Barriendos, J., and Aguilar, E.: Extreme rain event during November 1617: from the eastern Iberian Peninsula to Balearic Islands. Speleothem records and historical documents., EGU General Assembly 2023, Vienna, Austria, 23–28 Apr 2023, EGU23-584, https://doi.org/10.5194/egusphere-egu23-584, 2023.

EGU23-688 | ECS | Posters on site | CL1.2.2

Update to the SISAL speleothem database -- links to monitoring data, additional palaeoenvironmental proxies and enhanced accessibility 

Nikita Kaushal, Micah Wilhelm, Franziska Lechleitner, Kerstin Braun, Kira Rehfeld, Istvan Gabor Hatvani, Peter Tanos, Magdalena Ritzau, Vanessa Skiba, Khalil Azennoud, Jozsef Gabor Szucs, Zoltan Kern, Yuval Burstyn, and Yassine Ait Brahim

Speleothems (cave carbonates) are widely distributed in terrestrial regions, and provide highly resolved records of past changes in climate and ecosystem conditions, encoded in the oxygen and carbon isotope proxies. The SISALv2 database, created by the PAGES-SISAL  Phase 1 Working Group, provided 700 speleothem records from 293 cave sites, 500 of which have standardized chronologies. The database provided access to records that were hitherto unavailable in the original publications and/or repositories, and enabled regional-to-global scale analysis of climatic patterns using a variety of approaches such as data-model comparisons. 

During the three  year run of SISAL Phase 2,  the working group members have: 

(i) explored ways to synthesize modern cave monitoring data to provide robust modern baselines and improve proxy interpretations

(ii) added trace element proxies of Mg, Sr, Ba, and U concentrations, and Sr isotopes to a new SISAL database version to increase our understanding of regional climatic variability.

(iii) updated the SISAL database to incorporate an additional ~100 speleothem stable isotope datasets 

(iv) and created an online interface web app (The SISAL App) with a user-friendly GUI to increase SISAL data accessibility.

Here, we present ongoing work synthesizing cave monitoring data, a summary of speleothem proxy records available in the SISALv3 database update and of ongoing Working Group research projects and a simple use case of The SISAL App. We briefly present a synopsis of the SISAL-community level discussions on best practices for reporting trace element data, and reducing data measured with high resolution laser ablation methods. 

We conclude with a short discussion on research projects based on the latest SISAL database update and discuss ideas for potential future SISAL phases and projects. For this, we encourage participation and collaboration from researchers in different stages of their academic career and working in different geographical regions and allied disciplines interested in exploiting the new SISAL database version. 


How to cite: Kaushal, N., Wilhelm, M., Lechleitner, F., Braun, K., Rehfeld, K., Gabor Hatvani, I., Tanos, P., Ritzau, M., Skiba, V., Azennoud, K., Gabor Szucs, J., Kern, Z., Burstyn, Y., and Ait Brahim, Y.: Update to the SISAL speleothem database -- links to monitoring data, additional palaeoenvironmental proxies and enhanced accessibility, EGU General Assembly 2023, Vienna, Austria, 23–28 Apr 2023, EGU23-688, https://doi.org/10.5194/egusphere-egu23-688, 2023.

EGU23-853 | ECS | Orals | CL1.2.2 | Highlight

A stalagmite-based multiproxy reconstruction of local environmental changes in the 20th century from Normandy, France 

Ingrid Bejarano Arias, Carole Nehme, Sebastian F.M. Breitenbach, Hanno Meyer, Sevasti Modestou, Edwige Pons-Branchu, and Damase Mouralis

Speleothems are increasingly widely studied globally, but some regions remain poorly covered, including NW France. The cave-quarry of Caumont, located in Normandy develops in chalk limestone and contains speleothem formations from different time intervals. Chalk was extracted from this quarry for building stone since Roman times well into the 20th century. We collected several stalagmites from one of the excavated chambers with the aim to investigate their sensitivity to environmental signals. Of particular interest is stalagmite CCB-1 which was deposited over the last century and likely holds highly detailed climatic signals. We have tested whether stalagmite CCB-1 records hydrological or thermal seasonality, and if atmospheric circulation patterns can be reconstructed from this sample. To establish modern baselines we monitored temperature, drip rate, drip water isotopes, and collected modern carbonate precipitates between November 2019 and July 2021. The monitoring revealed that in-cave conditions are very stable all year round (Tcave air= 10.4 ±0.3°C; δ18Odrip and δDdrip change is ~0.1‰ and <0.8‰ respectively). Modern calcite samples fall mostly on the Coplen (2007) equilibrium regression line, suggesting that modern precipitation occurs near isotope equilibrium.


From sample CCB-1 we obtained three U/Th dates, counted 114 growth laminae and analysed 750 samples for stable isotope composition. The age model was constrained with laminae counting, historical inscriptions, and grey value based annual growth counting measurements and provides an annually resolved record for the last 114 years (1905 to 2019). The δ18O and δ13C signals from CCB-1 were compared with surface climatic parameters including precipitation, temperature, and the standardised precipitation evapotranspiration index (SPEI) for the last century. While δ18O of carbonate is influenced by surface temperature and the original isotopic composition in precipitation, the δ13C signal is governed by effective moisture supply and prior carbonate precipitation. Our reconstruction analysis reveals a significant change in the isotope record after ca. 1960. This change is best seen when comparing the δ13C time series with the SPEI and might be related to increasingly drier local conditions. A trend to stronger local evapotranspiration in recent decades is most likely linked to an increasing lack of effective rainfall. 

How to cite: Bejarano Arias, I., Nehme, C., Breitenbach, S. F. M., Meyer, H., Modestou, S., Pons-Branchu, E., and Mouralis, D.: A stalagmite-based multiproxy reconstruction of local environmental changes in the 20th century from Normandy, France, EGU General Assembly 2023, Vienna, Austria, 23–28 Apr 2023, EGU23-853, https://doi.org/10.5194/egusphere-egu23-853, 2023.

The glaciokarst of the Yorkshire Dales National Park, situated in the English Pennine hills, provides an under realised opportunity for paleo climate studies in mid latitudes. It was marginal to the Last Glacial Maximum British and Irish Ice Sheet which has been reappraised over recent decades as being a dynamic and unstable body. The caves were extensively excavated by Victorian (1837-1901) and Edwardian (1901-1910) antiquarians/archaeologists but was then largely ignored until the development of radiometric dating in the late 1970 and early 1980s. Since then scientific and archaeological attention has been sporadic and piecemeal with studies often being driven by the findings of the very active cave exploration community which have been responsible for the discovery of the approximately 90 km long Three Counties System in the west of the area.

The hills and valleys to the east of the area are less visited by both cavers and cave scientists though there is great potential for discovering new caves. A detailed study was undertaken on the complex Stump Cross cave system beneath one of the wide interfluves in the 1980s which has been subject to a recent reappraisal but otherwise scientific attention has been limited and sporadic. In this study a dendritic cave system dissected by the glaciated trough valley of Littondale has been subjected to study by an ad-hoc group of scientists, both citizen and academic, along with a team of cavers and cave divers. The now perched valley side caves reveal a complex record of drainage and flooding presumably related to the reoccupation of the valley by successive ice sheets and the resulting episodic down cutting. Speleothem damage provides the first evidence for the existence of ice bodies within the regions caves. Archaeological findings have shown Roman use of caves in the region is geographically more extensive than previously thought and have provided constraining evidence for the ongoing investigation of an early medieval murder mystery. This study highlights the potential of the area for future detailed paleo climate studies.


The work was supported by funding from the British Cave Research Association Cave Science and Technology Research Initiative.

How to cite: Murphy, P.: Ice, Incision and Execution in the eastern Yorkshire Dales – citizen cave science and climate studies in the karst of northern England., EGU General Assembly 2023, Vienna, Austria, 23–28 Apr 2023, EGU23-1461, https://doi.org/10.5194/egusphere-egu23-1461, 2023.

EGU23-1792 | Orals | CL1.2.2

Climate and environmental changes during the past 19,000 years reflected d18O, d13C and scanning XRF elements of a 14C dated stalagmite from south Altai, Russia 

Hong-Chun Li, You-Syuan Chen, Tatiana Blyakharchuk, Jian-Jun Yin, Horng-Sheng Mii, and Chuan-Chou Shen

A 22-cm long stalagmite (L2) from Lunnaya Cave (52º41’ N, 88º44’ E, 481 m a.s.l.) located in south Altai mountains of Russia was dated by AMS 14C because 230Th/U dating was not successful due to low U but high Th contents. The stalagmite grew since 19 kyr BP with very slow rate before 12 kyr BP and a growth hiatus during 5.5~7 kyr BP. A total of 1150 samples have been measured for δ18O and δ13C, revealing climatic and vegetation changes under the influence of Westerly, Polar Front and Siberian High. Although the δ18O trends show a depletion trend from early Holocene to middle Holocene, reached the lightest values between 7 and 8.5 kyr BP, and then an enrichment trend from 7 kyr BP toward the late Holocene, the δ18O trends are complicated for interpretation of climatic conditions. High-resolution (0.2-mm interval) scanning XRF Sr/Ca, Fe and Ti profiles illustrate that the weathering condition of overlying soil and limestone bedrock had significant change from pre-Holocene to late Holocene. The long-term trends of δ18O and δ13C records were related to moisture source and seasonal precipitation. Thus, both δ18O and δ13C records are needed to be de-trended in order to reflect precipitation amount effect and vegetation development, being negative values representing wet condition with more abundant vegetation, and vice versa. The growth hiatus of the stalagmite during 5.5~7 kyr BP was probably due to arid condition. Based on the δ18O, δ13C and scanning XRF elemental records, the climatic condition was very cold with only summer-month stalagmite growth during 19-13 kyr BP; cold and dry between 13-12 kyr BP (Younger Dryas); wet during 12-11.5 kry BP; mainly dry between 11.5 and 9.5 kyr BP; mainly warm and wet between 9.5 and 7 kyr BP. During 2.8~5.5 kyr BP, the climate was strongly fluctuated on centennial scales around an average condition. Dry climates were prevailed during 2.8~1.8 and 1~0.2 kyr BP, whereas wet climates were dominated during 1.8~1 and 0.2~0 kyr BP. The climatic conditions shown by the stalagmite agree well with the lake records in western and central Siberia.

How to cite: Li, H.-C., Chen, Y.-S., Blyakharchuk, T., Yin, J.-J., Mii, H.-S., and Shen, C.-C.: Climate and environmental changes during the past 19,000 years reflected d18O, d13C and scanning XRF elements of a 14C dated stalagmite from south Altai, Russia, EGU General Assembly 2023, Vienna, Austria, 23–28 Apr 2023, EGU23-1792, https://doi.org/10.5194/egusphere-egu23-1792, 2023.

EGU23-1891 | ECS | Posters on site | CL1.2.2 | Highlight

A 13,500 year speleothem record from southeastern Alaska 

Paul Wilcox, Christoph Spötl, Lawrence Edwards, and Jessica Honkonen

Under Anthropocene warming, Alaska is one of the fastest warming regions on Earth. To place this warming in better context, it is important to extend a high-resolution paleoclimate record throughout the Holocene. However, few such records exist in Alaska, with the majority limited to low-resolution lake sediment studies. Here, we provide a continuous, precisely dated, and high-resolution speleothem record that extends from modern-day to 13,500 yr BP. This represents the first Holocene speleothem record from Alaska, and sheds light on important paleoclimate changes at this high-latitude location. We find that the speleothem oxygen isotope record is largely controlled by changes in the tropical Pacific Ocean, with a significant mean state shift change occurring after ~1970 CE. The mean state shift at ~1970 CE has no similar anolog during the 13,500 year speleothem record, and we attribute the shift to anthropogenic forcing.

How to cite: Wilcox, P., Spötl, C., Edwards, L., and Honkonen, J.: A 13,500 year speleothem record from southeastern Alaska, EGU General Assembly 2023, Vienna, Austria, 23–28 Apr 2023, EGU23-1891, https://doi.org/10.5194/egusphere-egu23-1891, 2023.

EGU23-2494 | Orals | CL1.2.2

Abrupt cooling event over Asia due to North Atlantic climate instability ~16 ka 

Axel Timmermann, Nitesh Sinha, Kyoung-nam Jo, Jasper Wassenburg, Jiaoyang Ruan, and Hyuna Kim

The last glacial termination was marked by a series of millennial-scale hemispheric climate change events. One of the most prominent examples is Heinrich event  1, which was caused by ice-sheet instabilities of the Laurentide ice-sheet between 18,000-15,000 years ago (ka) and corresponding shifts in global climate. Recent speleothem oxygen isotope data suggest the presence of yet another much more abrupt and shorter event around 16 ka.  The global extent and the origin of this elusive 16-ka event have remained a mystery. Here we present new resolution clumped isotope data from a South Korean speleothem that shed new light on this phenomenon. Combined with LA-ICPMS trace element analysis, we demonstrate that the 16-ka event likely caused abrupt cooling over Eastern Asia of ~5-7oC and massive shifts of both the winter and summer monsoon systems.  Using an isotope-enable earth system model, we show the observed oxygen isotope evolution is consistent with an abrupt meltwater lake surge into the North Atlantic, of unknown origin, with impacts on ocean stratification, sea-ice and northern hemispheric climate.

How to cite: Timmermann, A., Sinha, N., Jo, K., Wassenburg, J., Ruan, J., and Kim, H.: Abrupt cooling event over Asia due to North Atlantic climate instability ~16 ka, EGU General Assembly 2023, Vienna, Austria, 23–28 Apr 2023, EGU23-2494, https://doi.org/10.5194/egusphere-egu23-2494, 2023.

EGU23-2667 | ECS | Orals | CL1.2.2

Numerical Modeling of Heat Transfer and Thermal Attenuation Lengths in Ventilated Caves 

Amir Sedaghatkish, Claudio Pastore, Pierre-Yves Jeannin, Marc Luetscher, and Frédéric Doumenc

Atmospheric temperature variations are characterized by different frequency-modes including yearly and daily fluctuations as well as yearly average temperatures. In a ventilated cave, the thermal amplitude is attenuated with increasing distance from the upper and/or lower cave entrance. Convective heat flux for dry air is exchanged with cave wall and the heat transferred by conduction to the surrounding rock is attenuated within a certain distance. Here, we aim at determining the thermal attenuation length for the different modes along a cave and the surrounding rock. Distribution of amplitude of fluctuations along the cave is specified by using Fourier series expansion for dominant modes. In next steps, the effect of latent heat exchange at the cave wall due to evaporation or condensation will be studied. The main variables controlling thermal perturbations in ventilated caves are recognized and compared with field data by developing a numerical model based on the heat and mass transfer between the rock and the air. Moreover, our model aims to quantify the air and wall temperature profile along the conduit for a one-year. The model calculates water-vapor exchange rate along the cave showing the amount of consumed or produced water by evaporation or condensation along the cave and provides the rock temperature distribution in the surrounding hostrock. Our preliminary results contribute to a better understanding of the long-term cave dynamics and may support a quantitative interpretation of speleothem records.

How to cite: Sedaghatkish, A., Pastore, C., Jeannin, P.-Y., Luetscher, M., and Doumenc, F.: Numerical Modeling of Heat Transfer and Thermal Attenuation Lengths in Ventilated Caves, EGU General Assembly 2023, Vienna, Austria, 23–28 Apr 2023, EGU23-2667, https://doi.org/10.5194/egusphere-egu23-2667, 2023.

EGU23-2915 | ECS | Posters virtual | CL1.2.2

Stable isotope and fluid-inclusion evidence of hydrothermal speleogenesis (Kryštálová cave, Western Carpathians) 

Petronela Ševčíková, Yuri Dublyansky, Pavel Herich, Mário Olšavský, Stanislava Milovská, Emma Kluge, Gabriella Koltai, and Christoph Spötl

The stable isotopic composition of wall rock and cave minerals is a sensitive tool to recognize the hypogene component of speleogenesis (Spötl et al., 2021; Temovski et al., 2022), to elucidate the cave evolution (Dublyansky, 1995, 2013), and to characterize the paleo-fluids (Dublyansky & Spötl, 2009). Here, we report evidence of water-rock interaction associated with hydrothermal speleogenesis at a site that shows the prevalence of brittle deformation in cave formation.

Kryštálová cave located in the Krivánska Malá Fatra (Western Carpathians) is a 57 m-long cave hosted in Triassic limestones, with walls covered by phreatic calcite spar. We conducted laser scanning of the cave and the immediate surroundings, as well as small-scale geological mapping. High-resolution stable isotope profiling was applied to the calcite spar and two wall rock cores overgrown by calcite. Calcite crystals were also studied by fluid inclusion microthermometry.

Field evidence, cave mapping, and laser scanning showed that the cave follows an extension fracture which begins and terminates in larger rooms. Several small-diameter, short, blind branches are present in the far end of the cave. In the cave and the surrounding area, we observed jointing, conjugate fracture sets, as well as some fracture planes displaying linear features, which we interpret as slickensides. Solutional forms suggest hypogene dissolution; there are no signs of epigene karst overprint. Part of the cave is filled with brown detrital sediment, presumably an insoluble bedrock residue, largely removed during exploration of the cave. The sediment (in places) and the cave walls (entirely) are lined by a layer of sparry calcite. The wall rock immediately underneath the crystals and along the fractures is stained brown.

Temperatures of calcite-depositing waters (based on fluid inclusion homogenization temperatures) were 53 ± 5°C (n=129). Assuming equilibrium precipitation and combined with the calcite δ18O values of -14.2 to -16.5 ‰ (VPDB) suggests paleo-water δ18O values of -8.4 to -10.9 ‰ (VSMOW), similar to modern meteoric water in the area (Holko, 2012). Unaltered limestone bedrock shows δ18O values of -3.4 to -6.5 ‰ (VPDB) and δ13C values of 2.7 to 2.1 ‰ (VPDB). Isotope wall rock alteration was detected in both cores (C1, C2), showing a strong depletion in δ18O near the cave wall (-7.6 to -14 ‰, and -7.3 to -13.2 ‰ for C1 and C2, respectively). Depletion in δ13C was minor: 1.8 to -0.8 ‰ (C1), and 0.1 to 2.1 ‰ (C2). Covariation between δ18O and δ13C in the cores is significant (R² = 0.68). 

Kryštálová cave formed as an extensional fissure, subsequently enlarged by hypogene dissolution. Heated meteoric groundwater interacted with the wall rock in the cave and along fractures, producing an isotopic alteration “halo” and eventually precipitated calcite crystals.

“Crystal caves” such as Kryštálová cave are widespread in the central Western Carpathians, sharing the same host rock lithology and similarities in their cave deposits (detrital sediments and calcite crystal linings). Calcite spar can – in principle – be radiometrically dated and represents a largely untapped archive of the local and regional paleohydrogelogy and related processes of cave formation.

How to cite: Ševčíková, P., Dublyansky, Y., Herich, P., Olšavský, M., Milovská, S., Kluge, E., Koltai, G., and Spötl, C.: Stable isotope and fluid-inclusion evidence of hydrothermal speleogenesis (Kryštálová cave, Western Carpathians), EGU General Assembly 2023, Vienna, Austria, 23–28 Apr 2023, EGU23-2915, https://doi.org/10.5194/egusphere-egu23-2915, 2023.

EGU23-2947 | Orals | CL1.2.2

Embracing the karst hydrological control on speleothem oxygen isotope variability 

Pauline Treble, Andy Baker, Stacey Priestley, and Alan Griffiths

The influence of karst hydrology or ‘flowpaths’ on speleothem oxygen isotopic (δ18O) values has been simulated using karst forward models.  Cave monitoring studies have also shown that variability in dripwater δ18O can be directly related to whether flowpaths are dominated by preferential/quick flow or diffuse/slow flow which challenges the paradigm of speleothems as archives of past variability in mean rainfall δ18O.  Yet it is not known how common this flowpath effect is and whether it should be considered in the interpretation of speleothem δ18O records.  Recently, Treble et al. (2022) analysed two global databases: SISAL v2 (Comas-Bru et al., 2020) and an extended compilation of dripwater from Baker et al. (2019).  It was demonstrated that within-cave variability in mean δ18O values were common worldwide in both datasets.  An analysis of cave meta-data demonstrated that the flowpath effect is unrelated to climate, cave depth or lithology; further supporting the ubiquitous nature of flowpaths, i.e., there is (1) a mixture of preferential and diffuse flow for all karstified carbonate rocks due to its triple-porosity nature (primary=matrix, secondary=fracture, tertiary=pipes and conduit); and (2) differences in soil/epikarst water storage and drainage characteristics.

We demonstrate how a mechanistic understanding of flowpaths can lead to a more robust interpretation using a case study that is also relevant for managing water resources in the Mediterranean-type climate of south-west Australia.  Using seven modern stalagmite records from four caves, plus dripwater data, we demonstrate that the cave δ18O record shows a common response to a sustained decrease in rainfall that impacted the region in the 1970s, characterised by a rise or ‘uptick’ in δ18O (Priestley et al., 2022).  Mean annual rainfall δ18O values over the same period were quantified using observed and modelled data to have varied by −0.4 to +0.1 ‰ whereas the speleothem uptick is +1.5 ‰.  The much larger magnitude of the uptick is consistent with a reduction in the preferential-flow component to these caves driven by reduced rainfall recharge.  Preferential flow is an important contribution to groundwater.  The ‘uptick’ or reduction in preferential flow implies that rainfall recharge to groundwater across the study region may no longer be reliably occurring.  The longer paleo-record for south-west Australia confirms that no replicated upticks are seen in the last 800 years in stalagmites from the region and highlights the impact of climate change to water security in a region heavily dependent on groundwater.


Comas-Bru, L. et al. SISALv2 (2020). A comprehensive speleothem isotope database with multiple age-depth models. Earth Syst. Sci. Data 12, 2579–2606 (2020).

Priestley, S., et al. (2022). Caves provide early warning of unprecedented decrease in rainfall recharge of groundwater. Research Square. doi:https://doi.org/10.21203/rs.3.rs-1556439/v1

Treble, P. C., et al. (2022). Ubiquitous karst hydrological control on speleothem oxygen isotope variability in a global study. Communications Earth & Environment, 3(1), 29. doi:10.1038/s43247-022-00347-3.

How to cite: Treble, P., Baker, A., Priestley, S., and Griffiths, A.: Embracing the karst hydrological control on speleothem oxygen isotope variability, EGU General Assembly 2023, Vienna, Austria, 23–28 Apr 2023, EGU23-2947, https://doi.org/10.5194/egusphere-egu23-2947, 2023.

EGU23-3191 | ECS | Orals | CL1.2.2 | Highlight

Paleoclimatic and paleoenvironmental changes in the Pantanal region during the Holocene based on speleothem records 

Valdir Novello, Magdalena Ritzau, Francisco Cruz, Janica Buehler, and Kira Rehfeld

The Pantanal is a large region located in the central parts of South America (140,000 km2) with a unique climate and vegetation setting. This region is subjected to seasonal floods, which makes the Pantanal one of the most important wetlands on the planet. In this region occur transitions between different biomes, such as the Amazon Forest, Cerrado (Brazilian Savanna), and Atlantic Forest, located to the North, East, and South of this region, respectively. The area also serves as a moisture pathway for the South American Summer Monsoon (SASM), which connects the Amazon Basin with the La Plata Basin. The two major drainage basins of South America. Due to the complex hydrology of the rivers and lakes of this region, it is necessary to combine multiple proxy archives from different parts of the Pantanal basin to understand its climate and vegetation evolution during the Holocene.

Here we present isotope records from stalagmites collected at sites located at the northern and southern borders of the Pantanal. Hiatuses in speleothem deposition during the mid-Holocene identified in several stalagmites indicate overall dry conditions in the region at this period. However, the drier conditions recorded in the northern portion of the basin precede similar conditions in the South by approximately two thousand years. Furthermore, summer insolation seems to drive the intensity of the SASM at the North Pantanal, while its influence is weaker in the southern part. During the late Holocene, this establishes a moisture gradient between a wetter North and drier South. Our record also shows a strong multidecadal to centennial variability, which was probably responsible for the high hydrology complexity of the rivers of the Pantanal, which are subject to seasonal floods and migration of its channels and tributaries.

How to cite: Novello, V., Ritzau, M., Cruz, F., Buehler, J., and Rehfeld, K.: Paleoclimatic and paleoenvironmental changes in the Pantanal region during the Holocene based on speleothem records, EGU General Assembly 2023, Vienna, Austria, 23–28 Apr 2023, EGU23-3191, https://doi.org/10.5194/egusphere-egu23-3191, 2023.

EGU23-4389 | Posters on site | CL1.2.2

The suddenly occurring Mesoamerican megadrought during the Little Ice Age (1400 to 1600 AD) 

Amos Winter, Davide Zanchettin, Matthew Lachniet, Allison Burnett, Sophie Warken, Hai Cheng, Angelo Rubino, and Thomas Miller

The Little Ice Age (LIA), a multicentennial period of predominant anomalously cold conditions on Earth, is among the most important periods that characterized climate evolution during the pre-industrial part of the last millennium. However, LIA remains enigmatic in many aspects, including its magnitude, timing, duration, and spatial extent, especially concerning the response of tropical hydroclimates.  Here we focus on Mesoamerica, where many proxy-based reconstructions show one or more Major Drying Events (MDEs) during the LIA.   We present new results from speleothem GU-Xi-1, which was recovered in 2007 from Xibalba cave (approx. 16.5˚N, 89˚W, near the Belize - Guatemala border) and was active and dripping at the time of collection. 

The most salient feature of GU-Xi-1 is a prolonged period of persistently heavy oxygen isotope values between around 1400 and 1600 CE. This positive isotope incursion was most likely a major drying event based on the well-known amount effect common in the tropics. In this contribution, we will illustrate the extensive drought described by our record during the LIA and propose a mechanism explaining its rapid initiation (within perhaps 20 years), possibly connected with natural forcing.

How to cite: Winter, A., Zanchettin, D., Lachniet, M., Burnett, A., Warken, S., Cheng, H., Rubino, A., and Miller, T.: The suddenly occurring Mesoamerican megadrought during the Little Ice Age (1400 to 1600 AD), EGU General Assembly 2023, Vienna, Austria, 23–28 Apr 2023, EGU23-4389, https://doi.org/10.5194/egusphere-egu23-4389, 2023.

EGU23-4539 | ECS | Posters on site | CL1.2.2

Coeval stalagmite records from the Rocky Mountains record Holocene climate change   

Bryce Belanger, Cameron de Wet, Warren Sharp, Christopher Kinsley, Yanjun Cai, and Jessica Oster

Tree ring records show cool-season droughts in the western US have been characterized by three spatial patterns over the past 500 years: “western-wide drought”, “wet north/dry south”, and “dry north/wet south”. Previous work shows that these drought patterns can persist on timescales of decades to centuries and are driven by internal climate variability, with secondary influence by sea surface temperatures. However very few high-resolution records of western US precipitation extend beyond the tree ring record (~1400 CE), limiting our understanding of the occurrence and persistence of these patterns of natural climate variability on longer timescales and further in the past. Here we use trace element (Mg/Ca, Sr/Ca, Ba/Ca, P/Ca) and stable isotope (δ18O, δ13C) data from two coeval stalagmites to construct a Holocene paleoclimate record for Titan Cave (TC), northern Wyoming, extending the hydroclimate record of the northern Rockies and providing the opportunity to assess longer-term natural climate variability in the northern Rockies. The TC-2 and TC-7 speleothems grew over the past ~5.7 ka and ~3.1 ka, respectively. Proxies from both stalagmites exhibit strong correlations with several coeval climate records, including regional snowpack as recorded by tree rings during the past ~600 years, suggesting the speleothems record winter precipitation patterns in the northern Rockies. Decreased snowpack and dry conditions at TC correlate to warmer sea surface temperatures in the Gulf of Alaska and the positive phase of the Pacific Decadal Oscillation. Comparison of speleothem δ18O with the δ18O of Bison Lake sediments from central Colorado suggests all three patterns of western US drought occurred during intervals of the late Holocene. Specifically, the wet north/dry south and dry north/wet south winter precipitation dipoles in the Rocky Mountains with a boundary near 40° N latitude, were established by approximately 3 ka. Multiple, centuries-long “western-wide” droughts occurred throughout the record, most notably from 2.2 – 2 ka during the Roman Warm Period. Other dated TC stalagmites grew during the mid-Holocene and Last Interglacial, providing records of winter precipitation in the northern Rockies during past warm intervals, which may serve as analogs for future anthropogenically-warmed climate states.

How to cite: Belanger, B., de Wet, C., Sharp, W., Kinsley, C., Cai, Y., and Oster, J.: Coeval stalagmite records from the Rocky Mountains record Holocene climate change  , EGU General Assembly 2023, Vienna, Austria, 23–28 Apr 2023, EGU23-4539, https://doi.org/10.5194/egusphere-egu23-4539, 2023.

Temperature changes in the middle reaches of the Yangtze River (MRYR) have affected more than one billion people. In contrast to the warming trend in the Northern Hemisphere (NH), there was a sustained cooling trend of mean annual temperatures in the MRYR from 1930s to 1980s. Due to long-term mean annual temperature record has so far been lacking in the MRYR, it remains unclear to what extent regional peculiarities reflect region-specific internal climate variability or differences in driving mechanisms. Here, we present a reconstruction of temperature variability over the MRYR for the period CE 800-1998 using a laminated stalagmite (HS4) from Heshang cave, Yichang region, China. Observations of Heshang cave suggest that the growth of HS4 stalagmite is mainly affected by the temperature because of the stability of dripping water composition. Based on a significant positive correlation between the growth rate and the observed temperature, we reconstructed the mean annual temperature (MAT) for Yichang region with an explained variance of 39.8%, the correlation in interdecadal scale (10-yr low pass) was significantly improved (r=0.86). The new MAT reconstruction shows an almost similar trend with existing low resolution mean annual temperature records from historical document, which confirms the credibility of the reconstruction. Four warm (800s-880s, 1260-1450s, 1650s-1800s, 1900s-1950s) and three cold (890s-1250s, 1460s-1640s, 1810s-1890s) period were identified in MAT record. Our reconstruction shows a significant cooling in the MRYR during the MCA period, which may differ from previous NH temperature records. We suggested that the unique temperature variation in the MRYR may be driven by El Niño-Southern Oscillation (ENSO), as there was a significant positive correlation between MAT record and ENSO over the past 1200 years on the multidecadal scale. When sea surface temperatures in the eastern Pacific rise, so do temperatures in the MRYR, and vice versa. Our study provided the longest mean annual temperature record in the MRYR, and we also highlight that ENSO may be related to the temperature variation of the East Asian monsoon region, which has generally been ignored in past studies.

How to cite: Hu, Z. and Hu, C.: Laminated stalagmite - based mean annual temperature reconstruction for middle reaches of the Yangtze River during the past 1200 years, EGU General Assembly 2023, Vienna, Austria, 23–28 Apr 2023, EGU23-4546, https://doi.org/10.5194/egusphere-egu23-4546, 2023.

EGU23-4748 | ECS | Posters on site | CL1.2.2

Stalagmite-inferred hydroclimate changes in northern Italy during Allerød/Younger Dryas transition 

Chieh-Ju Hsieh, Hsun-Ming Hu, Chuan-Chou Shen, Véronique Michel, Patricia Valensi, Elisabetta Starnini, and Marta Zunino

The Younger Dryas (YD), a 1200-year-long cooling event interrupting the warm Bølling-Allerød period, started from 12,870 ± 30 yr BP (2σ, before 1950 C.E.). Here we present decadal-resolved stalagmite BA18-2 multi-proxy records from Bàsura cave, northern Italy. The StalAge age-depth model with 8 U-Th dates with 2-sigma errors of ± 26-193 yrs shows that BA18-2 encompasses Allerød/YD transition, from 14,038 ± 92 to 12,090 ± 54 yr BP. Oxygen isotope data fluctuate between -7.16‰ and -3.68‰, with a clear 2.4‰ increase during the YD onset at 12,870 ± 30 yr BP. Stalagmite BA18-2 Sr/Ca and Ba/Ca linger from 0.060-0.085 mmol/mol and 6.4-9.1 µmol/mol, respectively, from 14,038 ± 92 to 12,681 ± 55 yr BP, ~ 2 centuries after the beginning of YD. A clear 160-year-long two-step increase in both Sr/Ca and Ba/Ca records started from 12,681 ± 55 yr BP, which is a 200-yr lag relative to the timing of BA18-2 oxygen isotope increasing trend. We argue that the oxygen isotope could be governed by temperature, moisture source, and/or rainfall amount; while, the Sr/Ca and Ba/Ca ratios predominantly reflect precipitation change. Our results might suggest asynchronous thermal and hydrological changes in northern Italy during the Allerøod/YD transition.

How to cite: Hsieh, C.-J., Hu, H.-M., Shen, C.-C., Michel, V., Valensi, P., Starnini, E., and Zunino, M.: Stalagmite-inferred hydroclimate changes in northern Italy during Allerød/Younger Dryas transition, EGU General Assembly 2023, Vienna, Austria, 23–28 Apr 2023, EGU23-4748, https://doi.org/10.5194/egusphere-egu23-4748, 2023.

EGU23-6205 | ECS | Posters on site | CL1.2.2

Determining SISALv2-speleothem growth rates during the Holocene 

Janica C. Buehler, Valdir F. Novello, Nils Weitzel, Denis Scholz, and Kira Rehfeld

Speleothems are terrestrial paleoclimate archives that occur abundantly in the low and mid latitudes. They archive changes in the past hydroclimate in many ways, including the rate of calcium carbonate accumulation – their growth rate. However, determining speleothem growth rates, and in particular growth rate changes, is challenging due to speleothem inherent features such as growth hiatuses, and large and abrupt growth rate changes. Low dating resolution poses an additional problem, as the U/Th measurements that allow for precise dating are time-consuming and expensive.

Here, we analyze speleothem growth rates during the Holocene – an ideal period for method testing due to the high abundance of speleothem records in the SISALv2 database. In particular, we compare speleothem growth rates in the early (12-8 kyr BP), mid (8-4 kyr BP) and the late Holocene (4-0 kyr BP). Using synthetically-modelled stalagmites, we test the strengths and weaknesses of state-of-the-art age-depth modelling methods to determine a set of necessary requirements to quantify speleothem growth rates and growth rate changes. Using these, we find slightly higher growth rates in the early Holocene within speleothems that cover at all periods. Comparing growth rates of speleothems that cover only one of the respective periods in the Holocene did not distinguish any period of highest or lowest growth rate. Detailed regional studies and comparison to model data are used to further interpret these results. Reliably determining growth rate changes in the Holocene may help in further understanding and characterizing hydroclimate changes as archived in speleothems also beyond the Holocene.

How to cite: Buehler, J. C., Novello, V. F., Weitzel, N., Scholz, D., and Rehfeld, K.: Determining SISALv2-speleothem growth rates during the Holocene, EGU General Assembly 2023, Vienna, Austria, 23–28 Apr 2023, EGU23-6205, https://doi.org/10.5194/egusphere-egu23-6205, 2023.

EGU23-8194 | ECS | Posters on site | CL1.2.2 | Highlight

Speleothem growth and stable carbon isotopes as proxies of last glacial glacier coverage and thermo-dynamical states in the Alps 

Vanessa Skiba, Guillaume Jouvet, Christoph Spötl, and Jens Fohlmeister

For more than a century, a major focus of Quaternary research has been the investigation of glacier advances and retreats during ice age cycles. The cradle for these studies are the European Alps. In recent years, glacier modelling permitted to produce long-term transient simulations of the European Alps glacier evolution. However, only sparse empirical data, e.g. geological reconstructions of glacier margins in the foreland of the Alps of the Last Glacial Maximum, are available to validate these simulations.

Speleothems from the Alps are a widespread palaeoclimate archive. They provide stable carbon isotope records, which can potentially inform about soil and vegetation conditions above a cave site but also about the lack of soil during times of glacier coverage. In addition, speleothem growth in cold, high-elevation cave sites during glacials are a strong indicator of temperatures in the soil-karst-cave system above the freezing point, which is only likely to occur if the cave is covered by a temperate glacier. We here utilise existing speleothem data (growth histories and stable carbon isotopes) from Alpine caves to infer glacier coverage and thermo-dynamical state during the last glacial cycle and to assess the compatibility with modelled reconstructions. We compare data from the last glacial cycle from multiple cave sites located at different elevations (785 to 2319 m a.s.l.) in the Alps with simulations obtained with the Parallel Ice Sheet Model (PISM). We find a general agreement between speleothem-derived soil presence or absence and modelled glacier coverage. However, the speleothem data provide evidence of temperate glacier coverage which is not shown by all of the PISM simulations. Our work demonstrates the value of speleothem-based reconstructions from the Alps as proxies for assessing performance of palaeo-ice flow models.

How to cite: Skiba, V., Jouvet, G., Spötl, C., and Fohlmeister, J.: Speleothem growth and stable carbon isotopes as proxies of last glacial glacier coverage and thermo-dynamical states in the Alps, EGU General Assembly 2023, Vienna, Austria, 23–28 Apr 2023, EGU23-8194, https://doi.org/10.5194/egusphere-egu23-8194, 2023.

EGU23-9601 | Orals | CL1.2.2

Climate variability from Hot cave (Cyprus) for the last 700 years: implications for speleothem proxies in determining long-term paleoclimate signals 

Carole Nehme, Tobias Kluge, Gabriella Koltai, R. Lawrence Edwards, Salih Gucel, Ozge Ozden, Jocelyne Adjizian-Gérard, and Christoph Spoetl

The HIGH-PASM project studies the climate variability on the Island of Cyprus for the last millennium. We combine highly resolved speleothem records with archived weather data for the last 140 years in order to corroborate and understand climate signals recorded in speleothems over the last millennium. An active stalagmite of 8 cm length was collected from Hot cave in 2021 along with other secondary carbonate deposits from Lapithos Qanat, and Amiandos and Argaka Dam tunnels. U-Th dating and lamina counting were combined to produce an age model for Hot cave and Lapithos Qanat. 800 stable isotope measurements were conducted on the Hot cave stalagmite, 250 on the Lapithos sample and 45 on each of the Amiandos and Argaka deposits. Meteorological data collected since 1885 from four stations were consolidated and compared to the yearly resolved Hot cave and Lapithos records.

The Hot cave stalagmite grew continuously from 1330 to 2021 AD, the Lapithos sample covers the last 150 years and both Amiandos and Argaka deposits provide a continuous record for the last ca. 50 years. There is a general correspondence between the ẟ18O signal and precipitation peaks over the last 140 years, showing more negative ẟ18O values corresponding to times of high precipitation. The ẟ13C signal co-varies in general with ẟ18O, except during ~1970-1980, ~1930, ~1680, ~1650, ~1490, ~1400-1410 and ~1360-1370 AD. During these periods an anti-correlation is observed. During the 20th century, periods of instrumental temperature rise are reflected by rising ẟ18O and ẟ13C values. A trend towards less negative ẟ18O values since 2000 AD is attributed to reduced rainfall amount and increased evapotranspiration as a consequence of steeply rising temperatures. During the instrumental period, the ẟ18O is a proxy of precipitation amount, and we assume that this relationship was valid for the last millennium. Strong temperature rises during certain intervals might also have affected the ẟ18O signal, reducing the sensitivity of this precipitation proxy.

Comparing the Hot cave record with global and regional records, periods with less negative ẟ18O values correspond generally to intervals of a negative NAO index and high total solar irradiance. Wet periods with more negative ẟ18O values correspond to intervals of a positive NAO index and low solar irradiation. The Hot cave record shows that the Little Ice Age (1300-1870 AD) begun with long dry intervals lasting until 1520 AD, followed by wetter intervals from 1520 to 1800 AD, and later followed by again long dry intervals until the present-day. The climate variability trend recorded in Hot cave during the last 700 years agrees generally well with the dry index reconstructed from tree-ring records in Troodos (Cyprus) and stalagmite data from Kocain cave in Southern Turkey

How to cite: Nehme, C., Kluge, T., Koltai, G., Edwards, R. L., Gucel, S., Ozden, O., Adjizian-Gérard, J., and Spoetl, C.: Climate variability from Hot cave (Cyprus) for the last 700 years: implications for speleothem proxies in determining long-term paleoclimate signals, EGU General Assembly 2023, Vienna, Austria, 23–28 Apr 2023, EGU23-9601, https://doi.org/10.5194/egusphere-egu23-9601, 2023.

EGU23-12002 | Orals | CL1.2.2

A Gibraltar speleothem record of environment and regional climate for the last glacial period 

Dirk L. Hoffmann, David P. Mattey, Tim C. Atkinson, Meighan Boyd, and Wolfgang Müller

Gibraltar climate is influenced by the Mediterranean Sea and the Atlantic Ocean in a boundary area between polar and subtropical air masses. Speleothem proxy records from Gibraltar caves provide opportunities to improve understanding of the long-term interplay of climatic features of this key location at the southern limit of tracks presently taken by the North Atlantic depressions delivering rainfall to Europe.

Deployment of logging instruments from 2004 to 2012 plus water and air sampling in two Gibraltar caves - St. Michaels and Ragged Staff - revealed that seasonality in speleothem growth rates is most strongly influenced by seasonally reversing convective ventilation that permeates the entire Rock. Average rates over longer timescales depend on drip rates (reflecting hydroclimate at the surface), combined with conversion into dissolved inorganic carbon of organic matter washed down by deep percolation into the epikarst and bedrock. The geochemistry of calcite precipitation is thus regulated by environmental conditions including net organic production by vegetation, temperatures and water balance. The monitoring results provide a robust foundation for palaeoclimate research. Data from twenty-four dated speleothems provide a palaeoclimatic framework with insights into regional climate as recorded by chemical proxies over seasonal to multimillennial timescales, over the last half-million years.

Here, we concentrate on the last glacial period and present a composite record based on four speleothems: two from near present sea level in Ragged Staff (Gib 10d and Gib 10e) and two (Gib 06a and Gib 06b) from an altitude of 255 masl in St. Michaels Cave. The composite chronology is constrained by over 170 U-Th dates and provides a continuous δ13Ocalcite, δ18Ocalcite and trace element proxy record of palaeoclimate from 100 ka to 10 ka, at a resolution that varies between ~5 and ~100 years. The Gibraltar δ18O record is strikingly similar to NGRIP but with a range of variation notably more subdued than other long speleothem records such as Soreq and Hulu that appear to have insolation forcing of monsoon strength as their dominant control. Our δ18Ocalcite data show clear imprints of Alboran Sea SST associated with D-O cycles during MIS 2-5, superimposed on a general trend of higher δ18O during stadials and lower values in interstadials and interglacials. The latter trend may have multiple causes including changes in cave temperatures, ocean δ18O and isotopic disequilibrium during calcite deposition. Changes in atmospheric circulation are another possibility but currently difficult to evaluate as neither δ18O of individual rainfall events nor the GNIP monthly record show any relationship to modern synoptic circulation patterns. The δ13C record is interpreted as signaling changes in vegetation and water balance. Higher δ13C values are caused by greater degassing due to lower drip rates and/or weakened net organic matter production and downwash during cooler periods with less recharge. The trace element records across DO events provide supporting observations.

How to cite: Hoffmann, D. L., Mattey, D. P., Atkinson, T. C., Boyd, M., and Müller, W.: A Gibraltar speleothem record of environment and regional climate for the last glacial period, EGU General Assembly 2023, Vienna, Austria, 23–28 Apr 2023, EGU23-12002, https://doi.org/10.5194/egusphere-egu23-12002, 2023.

EGU23-12527 | ECS | Posters on site | CL1.2.2

Tropical cyclone frequency and infiltration changes recorded by speleothem trace metal signatures 

Sophie F Warken, Aaron Mielke, Nils Schorndorf, Judith Gafriller, Frank Keppler, Amos Winter, Sebastian N. Höpker, Adam Hartland, Rolf Vieten, Andrea Schröder-Ritzrau, and Norbert Frank

Trace element abundances such as Mg/Ca ratios are frequently used in speleothems to support climate reconstructions or karst processes. However, signals of short-lived extreme events (e.g., droughts or strong rainfall events and tropical cyclones) are often concealed within the record of the classical stable isotope and elemental records due to dissolution and mixing processes within the soil and karst zone. On the contrary, drip water transition metal ratios and their binding affinities to particles and organic ligands, suggested faster transport in response to strong infiltration events and thus possibly reflect seasonal and/or even event-based rainfall variations (Warken et al., 2022). Here we assess replicated LA-ICPMS records of elemental abundances in two modern speleothems from Larga Cave, Puerto Rico, to explore their potential as indicators of extreme precipitation events. Speleothem Mg/Ca ratios show a broad co-variability with δ18O and δ13C values, and are interpreted as sensitive indicators of regional hydrology (δ18O) and local water balance (Mg/Ca, δ13C). Analogous to the drip water signature, we identify a common pattern of element ratios typically associated with particle and/or organic ligand fluxes (e.g., Cu/Ca, Ni/Ca, Zn/Ca, Al/Ca, Cu/Ni, Cu/Co, …), which differs from the δ18O and Mg/Ca records. In particular, we observe a similarity of the infiltration-sensitive proxies to historic Hurricane and tropical cyclone occurrence since 1850 AD. This suggests that the trace metal pattern observed in the drip water is recorded by the stalagmites, and that these elements are most promising candidates as indicators for fast infiltration changes, and possibly even tropical cyclone frequency. Furthermore, we explore a long speleothem record covering the last glacial period between 40.8 and 12.2 ka BP. In line with the modern interpretation, trace elements such as Cu/Ca or Zn/Ca indicate higher cyclone activity during the Holocene as compared to the glacial cold phase. In addition, the record reveals strong variations on the millennial scale which coincide with the onsets of warm and wet interstadial phases associated with abrupt warming events in the northern hemisphere and northward shifts of the Intertropical Convergence Zone. These observations support that mobilization and transport of organic ligands and associated elements is effectively coupled to infiltration.

Reference:

Warken, S. F., Kuchalski, L., Schröder-Ritzrau, A., Vieten, R., Schmidt, M., Hoepker, S., Hartland, A., Spötl, C., & Frank, N. (2022). The impact of seasonal and event-based infiltration on transition metals (Cu, Ni, Co) in tropical cave drip waters. Rapid Communications in Mass Spectrometry e9278. https://doi.org/10.1002/rcm.9278

How to cite: Warken, S. F., Mielke, A., Schorndorf, N., Gafriller, J., Keppler, F., Winter, A., Höpker, S. N., Hartland, A., Vieten, R., Schröder-Ritzrau, A., and Frank, N.: Tropical cyclone frequency and infiltration changes recorded by speleothem trace metal signatures, EGU General Assembly 2023, Vienna, Austria, 23–28 Apr 2023, EGU23-12527, https://doi.org/10.5194/egusphere-egu23-12527, 2023.

EGU23-13007 | Posters on site | CL1.2.2 | Highlight

Towards a high-resolution speleothem fluid inclusion water isotope record for the Holocene from Milandre Cave, Switzerland 

Stéphane Affolter, Elisa Hofmeister, Timon Kipfer, Hai Cheng, and Dominik Fleitmann

Speleothem fluid inclusions contain relics of past precipitation water, which constitute a powerful tool for studying the past hydrological cycle. Analyses of hydrogen and oxygen isotopes of the water stored in fluid inclusions allow the reconstruction of paleoclimate information such as temperature. A previous study has shown the potential of speleothems from Milandre Cave to address temperature-related issues such as the so-called “Holocene temperature conundrum”. It additionally shows the main Holocene climate feature such as the cooling occurring at the Younger Dryas or the 8.2 ka event. The mean temporal resolution achieved for the samples is relatively high, with sampling intervals ranging between 10 years for the most recent times and 50-70 years for the early Holocene. Using our new analytical line at the Department of Environmental Sciences at the University of Basel, we aim to increase the temporal resolution of the record by a factor two to four in order to provide highly-resolved water isotope and inferred temperature records for the entire Holocene. The revised Milandre Cave Fluid Inclusion temperature (MC-FIT) allows us to gain more detailed information on shorter scale events such as the 8.2 ka cooling and other prominent Holocene climatic events. The new MC-FIT record, supported by additional speleothems from neighboring caves, allows a better understanding of the central European annual temperature variability during the Holocene.

How to cite: Affolter, S., Hofmeister, E., Kipfer, T., Cheng, H., and Fleitmann, D.: Towards a high-resolution speleothem fluid inclusion water isotope record for the Holocene from Milandre Cave, Switzerland, EGU General Assembly 2023, Vienna, Austria, 23–28 Apr 2023, EGU23-13007, https://doi.org/10.5194/egusphere-egu23-13007, 2023.

EGU23-13027 | ECS | Posters on site | CL1.2.2

Drivers of speleothem carbon isotope and radiocarbon variability explored using Earth System Model output as input of a dripwater and speleothem chemistry model  

Pauline Seubert, Norbert Frank, Alexander Hubig, Thomas Kleinen, and Sophie Warken

Interpreting carbon isotopes in speleothems is challenging due to the multiple interacting in-soil and in-cave chemical processes. The degree of free soil CO2, the relative abundance of aged soil organic matter (SOM) and bedrock dead carbon modifies the carbon isotopic composition in speleothems in addition to fractionation during speleothem formation or prior calcite precipitation. Knowledge of the relevant drivers of DCF and stable C isotope variability may help deciphering the climate impact imprinted on speleothem carbon isotopes. 

Here, we combine Earth System Model output (Max Planck Institute Earth System Model version 1.2, Kleinen et al. 2020), a simplistic soil model, IntCal20, and the speleothem chemistry and isotope equilibrium model CaveCalc (Owen et al., 2018) to produce 25'000 yearlong DCF and d13C time series for numerous speleothems and several cave environments.

The modelling results are tuned to reasonable agreement with the respective DCF and d13C mean measurement values at each cave location for intermediate openness values of 5-120 L/kg. However, all model tuning attempts fail to reproduce fast (centennial) isotope and DCF variability. To overcome this limitation, we explore possibilities to include climate driven changes in vegetation, aged SOM, and how water availability drives the openness of the dissolution system. Extending the modelling framework to include vegetation changes produces d13C time series with more small-scale variability. Interestingly, accounting for aged SOM not only results in higher modelled DCF values, but also adds small-scale variability, assuming 20% higher fractions of aged SOM with mean soil ages for each cave location from Shi et al. (2020). Thus, our modelling efforts permit exploring the role of climate and Karst chemical processes to investigate DCF and d13C variability in speleothems over millennial time scales.

References:

Kleinen, T., Mikolajewicz, U., and Brovkin, V.: Terrestrial methane emissions from the Last Glacial Maximum to the preindustrial period, Clim. Past, 16, 575–595, doi:10.5194/cp-16-575-2020, 2020.

Owen, R., Day, C. C., and Henderson, G. M.: CaveCalc: A new model for speleothem chemistry & isotopes, Computers & Geosciences, 119, 115–122, doi:10.1016/j.cageo.2018.06.011, 2018.

Shi, Z., Allison, S.D., He, Y. et al.: The age distribution of global soil carbon inferred from radiocarbon measurements, Nature Geoscience, 13, 555–559, doi:10.1038/s41561-020-0596-z, 2020.

How to cite: Seubert, P., Frank, N., Hubig, A., Kleinen, T., and Warken, S.: Drivers of speleothem carbon isotope and radiocarbon variability explored using Earth System Model output as input of a dripwater and speleothem chemistry model , EGU General Assembly 2023, Vienna, Austria, 23–28 Apr 2023, EGU23-13027, https://doi.org/10.5194/egusphere-egu23-13027, 2023.

EGU23-15313 | Posters on site | CL1.2.2 | Highlight

Timing and duration of Termination IV using stable isotope records of four stalagmites from Dechencave (western Germany) 

Dana Felicitas Christine Riechelmann, Bernd Reinhard Schöne, and Denis Scholz

Four stalagmites were sampled from different excavations in Dechencave (western Germany) and dated to Marine Isotope Stage (MIS) 9. MIS 9 is a very interesting interglacial due to its comparatively high concentration of greenhouse gasses (Lang & Wolff, 2011) and high temperatures (Petit et al., 1999), which are on the same level as during early industrial times (Robertson et al., 2001). Speleothem records from this time period are rare, in particular from central Europe. The stalagmites were precisely dated by the 230Th/U-method using MC-ICP-MS (Mainz University) and stable carbon and oxygen isotope composition were measured using CF-IRMS (Mainz University).

The stalagmites grew from 343 to 326 ka BP including Termination IV and MIS 9e. The stable oxygen isotope records of the four stalagmites show rapidly increasing values reflecting the temperature increase during the termination. The timing of this increase agrees well with the timing of Termination IV in the LR04 benthic foraminifera stack (Lisiecki & Raymo, 2005). However, the duration of the termination is shorter in the stalagmites than in the LR04 benthic foraminifera stack (Lisiecki & Raymo, 2005). The stable carbon isotope data decrease, but later and more gradually than the stable oxygen isotope data. This indicates a delayed and more gradual response of the evolving vegetation in response to the warming during Termination IV.


Lang, N., Wolff, E.W., 2011. Interglacial and glacial variability from the last 800 ka in marine, ice and terrestrial archives. Climate of the Past 7, 361-380.

Lisiecki, L.E., Raymo, M.E., 2005. A Pliocene-Pleistocene stack of 57 globally distributed benthic δ18O records. Paleoceanography 20.

Petit, J.R., Jouzel, J., Raynaud, D., Barkov, N.I., Barnola, J.M., Basile, I., Bender, M., Chappellaz, J., Davis, M., Delaygue, G., Delmotte, M., Kotlyakov, V.M., Legrand, M., Lipenkov, V.Y., Lorius, C., Pépin, L., Ritz, C., Saltzman, E., Stievenard, M., 1999. Climate and atmospheric history of the past 420,000 years from the Vostok ice core, Antarctica. Nature 399, 429.

Robertson, A., Overpeck, J., Rind, D., Mosley-Thompson, E., Zielinski, G., Lean, J., Koch, D., Penner, J., Tegen, I., Healy, R., 2001. Hypothesized climate forcing time series for the last 500 years. Journal of Geophysical Research: Atmospheres 106, 14783-14803.

How to cite: Riechelmann, D. F. C., Schöne, B. R., and Scholz, D.: Timing and duration of Termination IV using stable isotope records of four stalagmites from Dechencave (western Germany), EGU General Assembly 2023, Vienna, Austria, 23–28 Apr 2023, EGU23-15313, https://doi.org/10.5194/egusphere-egu23-15313, 2023.

EGU23-15550 | ECS | Posters on site | CL1.2.2

Exploring a new Central European site of paleoclimate reconstruction: First results from Erdmannshöhle (Southern Germany) 

Aaron Mielke, Sophie Warken, Andrea Schröder-Ritzrau, Nils Schorndorf, Frank Keppler, Arnfried Becker, Karsten Piepjohn, and Norbert Frank

Here we show preliminary cave monitoring and speleothem results from Erdmannshöhle in Hasel, one of the oldest show caves in Germany. The comprehensive monitoring programme of drip water and cave air started in late summer 2022 and is still ongoing. In addition, we present precise 230Th/U, petrography, and proxy data from several speleothems. 

Cave temperature and relative humidity loggers show constant values of 10.7 +- 0.5 °C and 100.0% humidity. First results of the cave air CO2 mapping show a strong seasonal ventilation pattern with summer values reaching >6000 ppmV. During winter time, CO2 drops to values < 1700 ppmV, favoring carbonate precipitation during the cold season. Drip water is collected bi-monthly from 10 drip sites located in three chambers of the second horizontal cave level where speleothem growth is still active. First data of drip water stable isotope values agree with the local meteoric water line. In addition, abundances of dissolved minor and trace elements such as Mg, Ba, Sr, K, and Na, as well as anions (e.g., Cl, NO3, PO4, SO4) are analyzed. The data will be compared to the recently precipitated carbonate collected on watch glasses which are mounted on top of drip rate loggers.

230Th/U dating of speleothems from Erdmannshöhle is promising due to relatively high U contents in the range of 0.05 - 1 µg/g, and low detrital Th contamination. Analysis of drill cores from 25 stalagmites and flowstones from different cave chambers and cave levels extend the preliminary survey of Becker et al. (2020). The data shows that speleothem growth was active in Erdmannshöhle at least for the last 162 ka (Becker et al. 2020), in particular during past warm interglacial periods and the Holocene. Preliminary exploration of proxy data from two speleothems covering several parts of the Holocene demonstrate the high potential of Central European paleoclimate reconstruction. Stable oxygen records suggest a strong link to North Atlantic climate variability. In addition, carbon isotope and high resolution laser ablation ICPMS trace element records are explored for their paleoclimatic significance.

In summary, Erdmannshöhle has excellent preconditions for the continuous reconstruction of past Central European climate, and this comprehensive monitoring effort will provide an important step towards interpreting speleothem proxy data.


Reference

Becker, A., Piepjohn, K., & Schröder-Ritzrau, A. (2020). The Erdmannshöhle near Hasel, SW Germany: karst environment and cave evolution. Swiss Journal of Geosciences, 113(1), 1-25.

How to cite: Mielke, A., Warken, S., Schröder-Ritzrau, A., Schorndorf, N., Keppler, F., Becker, A., Piepjohn, K., and Frank, N.: Exploring a new Central European site of paleoclimate reconstruction: First results from Erdmannshöhle (Southern Germany), EGU General Assembly 2023, Vienna, Austria, 23–28 Apr 2023, EGU23-15550, https://doi.org/10.5194/egusphere-egu23-15550, 2023.

EGU23-322 | ECS | Posters on site | CL1.2.4

Assessing North Atlantic climate variability since the early 1800s through historical New England whaling ship logbooks and reanalyses 

Neele Sander, Caroline C. Ummenhofer, Bastian Münch, and Timothy D. Walker

Historical wind patterns in the North Atlantic are assessed using U.S. whaling logbooks of voyages from the 19th century, a time when instrumental wind observations were not widely available. The recordings from whaling ship logbooks provide systematic daily to sub-daily information about wind force, wind direction, and other weather observations (e.g., precipitation, sea state) over a period from ca. 1785-1915 and are housed in the New England archives by the New Bedford Whaling Museum, Nantucket Historical Association, and Providence Public Library. The extracted data from the whaling logbooks is quality checked, and the qualitative wind descriptions transferred to the Beaufort wind force scale to better compare it to the 20th-Century-Reanalysis.  Specifically, the whaling ship logbook-sourced wind recordings are used in conjunction with several indices of North Atlantic climate variability, such as North Atlantic Oscillation, East Atlantic Pattern, and Atlantic Multidecadal Oscillation, to explore variations and change in predominant North Atlantic wind patterns in the past. Here we demonstrate that the wind data from the whaling ship logbooks agrees with mean wind patterns and climate variability reconstructed for the North Atlantic and therefore provides valuable insights into the past wind patterns in this area complementing existing reanalysis products. We further demonstrate how qualitative descriptive wind information can be turned into quantitative information that can be directly compared with numerical data from reanalysis models. Since the comparison of the historical logbook data with the 20th-Century-Reanalysis data shows overall good agreement, it can be used to gain a further understanding of the dominant climate patterns in the North Atlantic and might aid development of improved indices of North Atlantic climate variability, such as the North Atlantic Oscillation or Azores High index.

How to cite: Sander, N., Ummenhofer, C. C., Münch, B., and Walker, T. D.: Assessing North Atlantic climate variability since the early 1800s through historical New England whaling ship logbooks and reanalyses, EGU General Assembly 2023, Vienna, Austria, 23–28 Apr 2023, EGU23-322, https://doi.org/10.5194/egusphere-egu23-322, 2023.

EGU23-386 | Orals | CL1.2.4

ModE-RA - the Modern Era Reanalysis 

Jörg Franke, Valler Veronika, Ralf Hand, Eric Samakinwa, Angela-Maria Burgdorf, Elin Lundstad, Yuri Brugnara, Laura Hövel, and Stefan Brönnimann

The Modern Era Reanalysis (ModE-RA) extends current re-analysis back until the year 1420 CE at monthly resolution. It combines our understanding of physics coming from an ensemble of atmospheric model simulations with all available direct and indirect climate observations of monthly to annual resolution. A 20-member ensemble of atmospheric model simulations (ModE-Sim) driven by an ensemble of external forcings and an ensemble of new sea surface temperature reconstructions serves as a prior estimate of the possible climate states at each assimilation time step. After the entire simulations were completed, we assimilated multiple data sources using an offline Kalman filtering technique. We include up to ~100000 monthly to annual observations per year. These consist of thousands of existing and newly digitised instrumental measurements of temperature, precipitation, wet days per months, and pressure, including measurements made on ships over the ocean and in harbours. Earliest instrumental station data go back to the year 1658. Additionally, we collected and digitised climate information from historical documents, including phenological data. These are especially valuable for the autumn, winter and spring season and go back to the year 1420. Finally, we assimilate annually resolved climate proxies. The vast majority are tree-ring observations, which represent growing season conditions on the continents. In otherwise data sparse regions, we supplemented ice and coral data at high latitudes and the tropical oceans, respectively. ModE-RA offers especially  insides into interannual to multidecadal variability such as phases of accelerated warming, monsoon strength or subtropical droughts as well as rare events such as volcanic eruptions. 

How to cite: Franke, J., Veronika, V., Hand, R., Samakinwa, E., Burgdorf, A.-M., Lundstad, E., Brugnara, Y., Hövel, L., and Brönnimann, S.: ModE-RA - the Modern Era Reanalysis, EGU General Assembly 2023, Vienna, Austria, 23–28 Apr 2023, EGU23-386, https://doi.org/10.5194/egusphere-egu23-386, 2023.

EGU23-574 | Posters on site | CL1.2.4

Hadley Cell Variability during the Last Millenium and response to volcanism in the PMIP4/CMIP6 models 

Paulo Silva, Ilana Wainer, and Myriam Khodri

In the Tropics, the Hadley Cell plays a key role in controlling precipitation patterns, since it is related to the position of the ITCZ, which is also a main component of the South America Monsoon System (SAMS). Several studies have documented a poleward expansion of the Hadley Cell over the historical period and a shift in the position of its subsiding branches and the expansion of the subtropical dry zones. This widening has largely been attributed to anthropogenic forcing, such as greenhouse gases (GHG) and stratospheric ozone depletion. However, prior to the industrial period, the extent of the Hadley Cell is dominated by internal variability and the radiative effects of volcanic eruptions. Understanding this natural variability is key to better predict the possible combined effects with anthropogenic external forcing. Thus, in this study we to investigate the variability of the Hadley Cell during the Last Millennium and its response to volcanic eruptions. We rely on the simulations of the Last Millennium provided by the Paleoclimate Modeling Intercomparison Project (PMIP4) contribution to the Climate Model Intercomparison Project phase 6 (CMIP6).

How to cite: Silva, P., Wainer, I., and Khodri, M.: Hadley Cell Variability during the Last Millenium and response to volcanism in the PMIP4/CMIP6 models, EGU General Assembly 2023, Vienna, Austria, 23–28 Apr 2023, EGU23-574, https://doi.org/10.5194/egusphere-egu23-574, 2023.

Proxy records (corals, marine sediments, etc.) documenting the last 2000 years (2K) provide evidences for the wide range of natural variability not captured by recent direct observations. Assessing climate models ability to reproduce such natural variations is crucial to understand climate sensitivity and impacts of future climate change. The length of record is relatively short for investigating slow climate features, especially when considering coupled ocean-atmosphere variability. In order to extend the information contained in proxies from the locations and times to which they pertain, additional information is needed to create a climate field reconstruction. Paleoclimate data assimilation offers a powerful way to extend the instrumental period and better characterize the decadal to secular natural ocean variability by optimally combining the physics described by climate models with information from available observations while taking into account their uncertainties. Here we present a new Proxy Data Assimilation product based on a sequential importance resampling particle filter (PF-SIR) that uses Linear Inverse Modeling as an emulator of GCMs, providing dynamical ocean memory and improving the reconstruction of low-frequency climate variability. The climate reconstructions include robust uncertainty quantification and a set of physically consistent spatial fields useful for dynamical inquiry beyond what is feasible from proxies or climate models alone. We use these new results to explore low-frequency aspects of main coupled variability modes and provide some constrains on climate model simulations for the last millennium.

How to cite: Jebri, B. and Khodri, M.: Large ensemble particle filter for proxy-based spatial reconstructions of the last 2000-years climate variability, EGU General Assembly 2023, Vienna, Austria, 23–28 Apr 2023, EGU23-654, https://doi.org/10.5194/egusphere-egu23-654, 2023.

EGU23-2148 | Orals | CL1.2.4

Strong volcanic and climatic shocks on early modern wine production 

Fredrik Charpentier Ljungqvist, Bo Christiansen, Lea Schneider, and Peter Thejll

Wine is a particularly climate-sensitive crop for which long documentary series are available in much of Europe. Most studies of climate–wine growth relationships have hitherto utilised grape harvest date series. We instead investigate the climatic signature, and impact from volcanic forcing, on two long annual wine harvest quantity records from the Moselle Valley, in present-day Luxembourg, close to the latitudinal limit of commercial wine agriculture in Europe. A strong positive relationship between reconstructed temperature, especially summer temperature, and wine production quantities is found in our data that extend from the mid-fifteenth century until the end of the eighteenth century. Extremely cold or wet years show clear imprints on the wine harvest quantities. Large declines in the wine harvest – sometimes even total harvest failures – occurred after volcanic forcing events. The most significant decline in wine production quantities occurred during the first year after a volcanic forcing event. However, persistent wine production decline is evident over several consecutive years following larger volcanic forcing events. We compare the signature of Moselle Valley wine production declines following volcanic forcing events with corresponding tree-ring growth declines in different regions of Europe. It is evident that wine production shows a stronger and more distinct downturn following volcanic forcing events, even more minor ones, than tree-ring growth does in central Europe. Possible mechanisms for this behaviour are explored and discussed.

How to cite: Charpentier Ljungqvist, F., Christiansen, B., Schneider, L., and Thejll, P.: Strong volcanic and climatic shocks on early modern wine production, EGU General Assembly 2023, Vienna, Austria, 23–28 Apr 2023, EGU23-2148, https://doi.org/10.5194/egusphere-egu23-2148, 2023.

EGU23-2170 | ECS | Posters on site | CL1.2.4

Northwestward migration of the East Asian monsoonal limit during the Medieval Warm Period 

Jiawei Jiang, Lin Chen, Aifeng Zhou, and Zhonghui Liu

The East Asia summer monsoon variability and changes in monsoonal rainfall are critical for hydrology and ecology conditions in water-stressed regions of northern China. Due to complex interactions of monsoonal and westerlies circulation, hydroclimatic conditions at the boundary between two circulation systems, commonly defined as the 300 mm annual rainfall line, remain poorly understood. Here we report alkenone records (UK'37, %C37:4, and RIK37) from Lake Eastern Juyanze in northern China to assess temperature and hydrological changes in marginal monsoon region over the last millennium. Our records show wet conditions during the Medieval Warm Period, with the presence of alkenone C37:3 isomer at the interval of ~ 700-1,050 AD and thus evident freshening of lake water, and dry conditions during the Little Ice Age. The paired records follow the warm-wet and cold-dry association in monsoonal regions over the last millennium, opposite to the warm-dry and cold-wet association in westerlies region, although Lake Eastern Juyanze is located to the northwest of current monsoonal limit. Our results, together with other hydrological records from marginal monsoon regions, collectively indicate northwestward migration of East Asia monsoonal limit during the Medieval Warm Period associated with relatively high solar irradiance and enhanced summer monsoon circulation. Findings in this study highlight the complexity of hydroclimatic changes in marginal monsoonal regions, and further investigations focusing on the Holocene epoch are highly recommended.


How to cite: Jiang, J., Chen, L., Zhou, A., and Liu, Z.: Northwestward migration of the East Asian monsoonal limit during the Medieval Warm Period, EGU General Assembly 2023, Vienna, Austria, 23–28 Apr 2023, EGU23-2170, https://doi.org/10.5194/egusphere-egu23-2170, 2023.

EGU23-2600 | ECS | Posters on site | CL1.2.4

Reconstructing climate fields with terrestrial climate archives, isotope-enabled GCMs and Data Assimilation 

Mathurin A. Choblet, Janica C. Bühler, Nathan J. Steiger, Valdir F. Novello, and Kira Rehfeld

Data Assimilation in paleoclimatology (PaleoDA) is a method that has been used in several climate reconstructions for the last millennium. By fusing information from both climate proxies and general circulation models (GCMs), PaleoDA provides statistical estimates of climate fields that are dynamically consistent. However, existing reconstructions mostly rely on calibrated tree ring data and assimilate proxy records on a single, annual time scale. Ice cores and speleothems, which record past variations in the oxygen isotope ratio of precipitation, often have a lower and irregular time resolution, but reliably record climate variations on decadal to centennial time scales. 

Here, we implemented a computationally efficient DA algorithm that enables the assimilation of proxy records on multiple timescales. The algorithm has been applied to speleothem and ice core records from the SISALv2 and Iso2k database and five isotope-enabled GCMs. Reconstructions of global mean temperature changes during the last millennium compare well in both amplitude and uncertainty to recent studies. The potential of incorporating speleothems is shown with a reconstruction of hydroclimatic changes in tropical South America, where speleothems represent the most abundant type of hydroclimate archive. The experiments performed suggest an increased reconstructed decadal to centennial variability by using proxy records on multiple timescales. Making use of different climate models shows the influence of model biases on the reconstructions. Future PaleoDA reconstructions could be improved from more proxy records and the multiple time scale approach to provide a globally complete picture of past climate changes. 

How to cite: Choblet, M. A., Bühler, J. C., Steiger, N. J., Novello, V. F., and Rehfeld, K.: Reconstructing climate fields with terrestrial climate archives, isotope-enabled GCMs and Data Assimilation, EGU General Assembly 2023, Vienna, Austria, 23–28 Apr 2023, EGU23-2600, https://doi.org/10.5194/egusphere-egu23-2600, 2023.

The project ROPEWALK, funded by the AP Møller Mærsk Fund, is a joint initiative of the Danish National Archive and the Danish Meteorological Institute over the period 2023-2026. The aim of the project is to digitize and transcribe all weather observations in ship journals and logbooks stored in the Danish National Archive.

The collection in the archive is remarkable for several reasons. A huge amount of data (more than 750 shelf metres) is stored, beginning as early as the 1680s. With the exception of the Napoleonic wars and the Danish state bankruptcy in 1814, the data is complete. In particular, there were no losses during the Second World War.

In the archive, logbooks from Danish ships over large parts of Northern Hemisphere are found. Of particular interest are observations from two regions, the Øresund and Greenland.

In connection with the Sound duties which every ship passing the sound or belts had to pay between 1426 and 1857, weather observations were made on board of war ships placed at strategic locations near Copenhagen, Helsingør and Nyborg. These ships had to ensure that no one passed without paying the duties. Probably for practical reasons, weather observations were tabulated as early as the first half of the 18th century. In several cases, observations were conducted every time the ship bell was struck, resulting in 48 observations in the course of one day. The early part of the logbook collection is from the Little Ice Age, and numerous ice observations in the Danish waters have been preserved.

The other group of logbooks which are of particular interest are from voyages to the colonies, in particular to (western) Greenland. The Greenlandic Trade Company had a monopoly for commerce with Greenland for nearly 200 years, and foreign ships would not be allowed to call a port. These "Greenland Voyages" were conducted several times per year. In many cases, detailed sea ice observations have been made.

The original logbooks are being scanned by the National Archive in highest possible resolution. The scans will then be transcribed by means of machine learning. This is possible, since the political system in Denmark was absolutistic between 1660 and 1848, and logbooks from different periods resemble each other much more than is the case for the nautical heritage in other seafaring nations. Where this is not possible, the data will be transcribed with the help of volunteers. For the oldest logbooks, which are in free text rather than in tabular form, we could locate older transcriptions which are much easier to read tahn the original data, either by machine or manually.

All transcribed data will be made publicly available. They can be used for future research or as input for reanalysis projects. We will present first results of our analysis.

How to cite: Stendel, M. and Kronegh, A. J.: ROPEWALK (Rescuing Old data with People's Efforts: Weather and climate Archives from LogbooK records) - a digitization project for three centuries of weather observations on board of Danish ships, EGU General Assembly 2023, Vienna, Austria, 23–28 Apr 2023, EGU23-3407, https://doi.org/10.5194/egusphere-egu23-3407, 2023.

EGU23-3587 | ECS | Orals | CL1.2.4 | Highlight

Global changes in the hydroclimate of the Last Millennium: Evidences from reconstructions and simulations 

Pedro Roldán, Jesús Fidel González-Rouco, Jason Smerdon, and Félix García-Pereira

Global changes have been found in simulated and reconstructed temperatures during the Last Millennium (LM), mainly associated to changes in the Earth’s energy balance like those during the periods of the Medieval Climate Anomaly (MCA; ca. 950-1250 CE) and the Little Ice Age (LIA; ca. 1450-1850 CE), respectively characterized by warmer and cooler conditions over many regions. Even if the impact of these changes in the hydroclimate is not fully understood, evidences of coordinated changes in the hydroclimate of distant regions can be also found in reconstructions from areas of North America, Europe and the Mediterranean basin, South America, Eastern Africa and Monsoon Asia. The timing of such changes suggests a link to the MCA and the LIA, while other areas like Southeast Asia and the Indo-Pacific also show coordinated changes in the hydroclimate of the LM, but without a patent link to the periods of MCA and LIA.

To better assess these coordinated changes in the hydroclimate of distant regions, and whether they also extend to other periods of the LM different from the MCA and the LIA, evidences from reconstructions and simulations have been compiled, including: a compilation of 92 reconstructions reporting changes from wetter to drier or from drier to wetter conditions in the transition from MCA to LIA; reconstruction-based products like the Drought Atlases for Europe (OWDA), North America (NADA), Asia (MADA), Mexico (MXDA) and Eastern Australia and New Zealand (ANZDA); hybrid products like the Paleo Hydrodynamics Data Assimilation product (PHYDA) and the Last Millennium Reanalysis (LMR); and model simulations from the Community Earth System Model - Last Millennium Ensemble (CESM-LME) and the Coupled Model Intercomparison Project Phase 5 (CMIP5) and 6 (CMIP6).

The comparison between proxy-based datasets and model simulations has allowed to obtain robust conclusions regarding the behavior of the hydroclimate of different regions and to deeply analyze the impact of external forcing and internal variability on hydroclimate changes. In tropical areas, changes have been mainly associated to alterations in the position and intensity of the Intertropical Convergence Zone (ITCZ), while in extratropical areas the alteration of variability modes like the Northern (NAM) and Southern Annular Modes (SAM) may have had a major role in the response of hydroclimate to changes in external forcing.


How to cite: Roldán, P., González-Rouco, J. F., Smerdon, J., and García-Pereira, F.: Global changes in the hydroclimate of the Last Millennium: Evidences from reconstructions and simulations, EGU General Assembly 2023, Vienna, Austria, 23–28 Apr 2023, EGU23-3587, https://doi.org/10.5194/egusphere-egu23-3587, 2023.

EGU23-3969 | ECS | Orals | CL1.2.4 | Highlight

Agroclimatic relationships in Central Scandinavia, c. 1560–1920 

Martin Skoglund

For the region of central Scandinavia, there exists high-quality tree-ring based temperature reconstructions that cover the last 1200 years. This paper utilizes climate reconstructions in tandem with historical sources to estimate the relationships between climatic variability and agriculture in central Scandinavia between the 16th and 20th centuries, with a specific focus on temperatures, harvests and agricultural dates. Using historical sources on agriculture importantly allows for evaluation of different climate reconstructions before the era of instrumental measurements. Thus, this paper not only sheds light on the societal relevance of past and present climatic change and variability, but also provides insights into the climate of the past.

While historical harvest dates in many parts of Europe have been employed to reconstruct growing season temperatures, this paper also includes virtually unique long time-series of sowing and hay-cutting dates going back to the late 17th and 18th century, respectively, and shows how these type of agricultural dates also had significant relationships with temperature variability in central Scandinavia. Furthermore, agriculture in this region, located in the northern boreal zone, was heavily constrained by growing season temperatures, and harvests exhibits much clearer relationships with climatic variability compared with less marginal regions of Europe. Climate-harvest relationships are studied at a local level, allowing for spatial anlaysis of micro-climatological differences within the larger regional context.

How to cite: Skoglund, M.: Agroclimatic relationships in Central Scandinavia, c. 1560–1920, EGU General Assembly 2023, Vienna, Austria, 23–28 Apr 2023, EGU23-3969, https://doi.org/10.5194/egusphere-egu23-3969, 2023.

EGU23-3976 | Posters on site | CL1.2.4

Drought variability in the Spanish Mediterranean Basin during the Dalton Solar Minimum period (1790-1830) 

Mariano Barriendos, Josep Barriendos, María Hernández, Salvador Gil-Guirado, and Jorge Olcina-Cantos

The current climate change scenario is increasing concerns about the frequency of droughts in the Mediterranean region and the management of water resources. For this reason, it is interesting to study the most severe droughts of the recent past in order to better characterise the current phenomenon and future adaptive strategies.

One of these episodes of great magnitude and significant impact on economic and social activity were the droughts that occurred in the first third of the 19th century in the Mediterranean basins of the Iberian Peninsula. This relatively brief period, placed at the end of the Little Ice Age, contains up to four episodes of drought that affected the Spanish Mediterranean Basins. Their occurrence can be linked to known climatic forcing factors. On the one hand, the effects of the Dalton Solar Minimum (1790-1830). On the other hand, the effects of three different volcanic eruptions produced in the intertropical latitudes with a VEI equal or greater than 5: the Unknown eruption of 1809, the Tambora eruption of 1815 and the Galunggung eruption of 1822.

The climatic characterisation of the drought in this period is proposed with the use of historical proxy-data based on rogation ceremonies to monitor situations of rainfall deficit at high temporal resolution (daily/monthly). For drought assessment, a drought information classification system is proposed based on an index that takes into account the basic characteristics of each episode (duration, extent and severity). This classification will be tested to determine the behaviour of the droughts that affected the Spanish Mediterranean Basin during the period of the Dalton Solar Minimum.

The results obtained from the application of these methodologies and materials allow the identification of severe droughts that affected the Spanish Mediterranean Basin during this period. Some of these years with severe droughts are 1807, 1812, 1817-1818, the most severe drought in the overall of the series, and 1822-1825. The description and cartographic representation of the historical data about these droughts allows us to assess their severity due to the extraordinary persistence of the rainfall deficits and their capacity to affect simultaneously distant regions.

Finally, in order to compare the results obtained from the historical data recorded in Barcelona about rainfall deficits, we use the instrumental meteorological series of Barcelona. This data series begun in 1780 recording data on temperature and pressure and begun recording precipitation in 1786. The information from those records allows the comparison with the historical data.

How to cite: Barriendos, M., Barriendos, J., Hernández, M., Gil-Guirado, S., and Olcina-Cantos, J.: Drought variability in the Spanish Mediterranean Basin during the Dalton Solar Minimum period (1790-1830), EGU General Assembly 2023, Vienna, Austria, 23–28 Apr 2023, EGU23-3976, https://doi.org/10.5194/egusphere-egu23-3976, 2023.

EGU23-4841 | Posters on site | CL1.2.4

DOCU-CLIM: A global documentary climate dataset for climate reconstructions 

Stefan Bronnimann and Angela-Maria Burgdorf

Documentary climate data describe evidence of past climate arising from predominantly written historical documents such as diaries, chronicles, newspapers, or logbooks. Over the past decades, historians and climatologists have generated numerous document-based time series of local and regional climate. However, a global dataset of documentary climate time series has never been compiled, and documentary data are rarely used in large-scale climate reconstructions. Here, we present the first global multi-variable collection of documentary climate records. The dataset DOCU-CLIM comprises 621 time series (both published and hitherto unpublished) providing information on historical variations in temperature, precipitation, and wind regime. The series are evaluated by formulating proxy forward models (i.e., predicting the documentary observations from climate fields) in an overlapping period. Results show strong correlations particularly for the temperature sensitive series. Correlations are somewhat lower for precipitation sensitive series. Overall, we ascribe considerable potential to documentary records as climate data, especially in regions and seasons not well represented by early instrumental data and palaeoclimate proxies.

How to cite: Bronnimann, S. and Burgdorf, A.-M.: DOCU-CLIM: A global documentary climate dataset for climate reconstructions, EGU General Assembly 2023, Vienna, Austria, 23–28 Apr 2023, EGU23-4841, https://doi.org/10.5194/egusphere-egu23-4841, 2023.

EGU23-5734 | ECS | Posters on site | CL1.2.4

Analysis of wind direction measurements made by the Rospini family in Graz (Austria), 1822-1850 CE 

Thomas Pliemon and Ulrich Foelsche

The Austrian National Library has digitized several volumes of the newspaper "Grätzer Zeitung", which contains daily measurements (morning, noon and evening) of temperature, pressure, short simple weather descriptions, wind direction, and wind strength, recorded in the historic center of Graz by Mr. Rospini (and later by his son and grandsons). Other volumes of the newspaper are available on microfilm or have been found in archives. The measurement series of the Rospini family started as early as 1781, and have been continuously published in the "Grätzer Zeitung" from 1795 onwards. However, in the first years only temperature and pressure data were published and the first publications of wind directions began in March 1822. Thus, we analyze an almost uninterrupted record of wind directions from 1822 to 1850. The measurement times for this period are given as 7 a.m., 3 p.m. and 10 p.m. To assert the validity of the data, we compare it with modern data as well as with the other measurements of the Rospinis. Initial analysis reveal an improvement in measurement accuracy during the measurement period. I.e. the year-round seasonal distributions of the main wind directions differ significantly in the 1820s with respect to modern data, whereas those of the 1840s are comparable.

How to cite: Pliemon, T. and Foelsche, U.: Analysis of wind direction measurements made by the Rospini family in Graz (Austria), 1822-1850 CE, EGU General Assembly 2023, Vienna, Austria, 23–28 Apr 2023, EGU23-5734, https://doi.org/10.5194/egusphere-egu23-5734, 2023.

The decade 1531-1540 was characterized by a high number of dry summer episodes making it the driest summer decade of the past 500 years in some areas of Central Europe. In addition to established climate reconstructions, we use the ModE-RA (Modern Era Reanalysis) and ModE-Sim (Modern Era Simulations) data sets which provide gridded climate information of the past 600 years to analyse the summers of 1531-1540 and compare it with other decadal dry spells over Europe.

While most previous studies focus on the variability of individual drought events or multi-decadal mega droughts, our aim is to identify decadal scale dry spells similar to the 1531-1540 decade. With our three-dimensional reanalysis and the model simulations forced with observed volcanic forcings and prescribed SST we can then investigate the atmospheric and oceanic drivers of such events as well as the influence of the volcanic forcings.

Our first results show that the magnitude and distribution of observed decadal dry spells in ModE-RA is realistic and comparable to other climate reconstructions. In the ModE-Sim ensemble mean the drying signal for the 1531-1540 event is less strong but still visible. Overall, with our ongoing analysis we contribute to the evaluation of past and future decadal dry spells over Europe that are driven by both natural and anthropogenic forcings.

How to cite: Hövel, L., Hand, R., Franke, J., and Brönnimann, S.: The 1531-1540 dry summers in Europe - Identifying potential drivers of decadal dry spells using climate reconstructions and ensemble simulations of the past 600 years, EGU General Assembly 2023, Vienna, Austria, 23–28 Apr 2023, EGU23-6604, https://doi.org/10.5194/egusphere-egu23-6604, 2023.

EGU23-6648 | ECS | Posters on site | CL1.2.4

Polar climate variability during the Holocene as archived in ice core water isotopes 

Nora Hirsch, Maria Hörhold, and Thomas Laepple

Understanding natural climate variability, its fluctuations throughout the Holocene, and its dependency on the mean climate state can provide valuable insights into driving mechanisms and potentially allow for a better prediction of a plausible range of future climates. However, polar climate variability and its changes remain uncertain due to a lack of thorough analysis across the Holocene. Ice core water isotope records are a temperature proxy which covers both high resolutions as well as long timescales and thus enable us to resolve variability changes across a large range of frequencies. By consolidating a multitude of such records from Greenland and Antarctica and using our knowledge how the ice-core signal is recorded, we distinguish signal from noise in the spectral domain. Based on this, we examine spatial and temporal changes of the polar climate signal variability, its relationships to earth system processes and its representation in climate models.

How to cite: Hirsch, N., Hörhold, M., and Laepple, T.: Polar climate variability during the Holocene as archived in ice core water isotopes, EGU General Assembly 2023, Vienna, Austria, 23–28 Apr 2023, EGU23-6648, https://doi.org/10.5194/egusphere-egu23-6648, 2023.

EGU23-8040 | Posters on site | CL1.2.4

A new 1523-year-long varve sequence reveals the influence of the Atlantic Multidecal Variability on Eastern Canada hydroclimate 

Pierre Francus, Antoine Gagnon-Poiré, and François Lapointe

Grand Lake, Labrador, is a 245-m deep and 55 km long fjord lake deglaciated c.a. 8000 years ago, located at the eastern margin of North America in the high boreal forest ecozone. The lake is fed by two large rivers that transport a substantial amount of sediments, mainly during the snowmelt season. As a result, up to 13 mm thick varves are preserved in the proximal zone of the two main tributaries, while distal varves are 1.26 mm thick on average. Proximal and distal varves can be correlated thanks to cross-correlation of distinctive varves. Varve counts were made from high-resolution images of thin sections at the scanning electron microscope, and from 100 µm-resolution µXRF profiles. The age model was validated by 210Pb, 137Cs and 14C dating. The proximal varves are composed of 3 distinct laminae, while the distal varves contain 2 layers. This paper outlines how the proximal and distal sequences were combined to produce a 1523-year-long record allowing a very long reconstruction of past river mean discharge (Q-mean). The river discharge was higher during the Medieval Climate Anomaly (1050–1225 CE) and lower during the Little Ice Age (15th–19th centuries). The reconstructed Q-mean shows a significant co-variability with Atlantic Multidecadal Variability reconstructions and with reconstructed summer Northern Hemisphere temperature based on tree rings. This suggests that river discharge in Labrador was influenced by ocean-atmosphere interactions across the North Atlantic, and that a longer varved record from Grand Lake has the potential to reconstruct the supra-regional modes of climatic variability for most of the Holocene.

How to cite: Francus, P., Gagnon-Poiré, A., and Lapointe, F.: A new 1523-year-long varve sequence reveals the influence of the Atlantic Multidecal Variability on Eastern Canada hydroclimate, EGU General Assembly 2023, Vienna, Austria, 23–28 Apr 2023, EGU23-8040, https://doi.org/10.5194/egusphere-egu23-8040, 2023.

EGU23-8871 | ECS | Posters on site | CL1.2.4

Phase 4 of PAGES 2k: Hydroclimate of the Common Era 

Georgina Falster, Hussein Sayani, Anais Orsi, Helen McGregor, Nikita Kaushal, Lukas Jonkers, Matthew Jones, Benjamin Henley, Sarah Eggleston, and Alyssa Atwood

The climate of the past two thousand years (2k) provides context for current and future changes, and as such is vital for developing our understanding of the modern climate system. Building on previous phases of the PAGES 2k network, Phase 4 of the PAGES 2k Network paves the way for a new level of understanding of the global water cycle, including enhanced science-policy integration. 

Previous PAGES 2k network phases emphasised temperature reconstructions, fundamentally improving our understanding of global climate changes over the Common Era. These reconstructions received widespread recognition and were featured in the Summary for Policymakers of the IPCC’s Sixth Assessment Report. Integration of this data with state-of-the-art Earth systems models, proxy system models and data assimilation yielded a more comprehensive understanding of the associated physical drivers and climate dynamics.  

Phase 4 challenges our community to turn its focus towards hydroclimate. Our aim is to reconstruct hydroclimatic variability over the Common Era, from local to global spatial scales, at sub-annual to multi-centennial time scales, developing a process-level understanding of past hydroclimate events and variability. Our multi-faceted approach includes (1) developing new hydroclimate syntheses that are well-suited for data-model comparisons, (2) improving the interoperability and scope of existing data and model products, and (3) facilitating the translation of our science into evidence-based policy outcomes. In this presentation, we report on our activities and progress to date, particularly highlighting the early stages of our data synthesis efforts.

How to cite: Falster, G., Sayani, H., Orsi, A., McGregor, H., Kaushal, N., Jonkers, L., Jones, M., Henley, B., Eggleston, S., and Atwood, A.: Phase 4 of PAGES 2k: Hydroclimate of the Common Era, EGU General Assembly 2023, Vienna, Austria, 23–28 Apr 2023, EGU23-8871, https://doi.org/10.5194/egusphere-egu23-8871, 2023.

EGU23-9075 | ECS | Posters on site | CL1.2.4

Climate of the 6th Century based on the Fully Forced Regional Climate Model COSMO-CLM over the Eastern Mediterranean and the Nile Basin 

Mingyue Zhang, Eva Hartmann, Sebastian Wagner, Muralidhar Adakudlu, and Elena Xoplaki

The interactions and feedbacks between climate stress and social systems are currently the focus of interest for the scientific community and the general public. Understanding how paleo societies responded to extreme climate conditions is important for gaining insight into current and future climate concerns. The East Mediterranean (EM) and the Nile River basin (NR) are ideal areas for scientific and historical studies and modelling experiments due to the abundance of proxy and historical data. The 6th century AD is of particular interest from both a historical and scientific perspective, as it coincides with a period of prosperity for the Eastern Byzantine Empire and political stability, but which also experienced a plague pandemic and significant climate variability in parallel or as a result of a major cluster of volcanic eruptions. To investigate these events and the climate variability in the 6th century in more detail, a transient paleo-simulation is carried out with the appropriately adjusted regional climate model COSMO-CLM (COSMO 5.0 clm16). The regional climate model is driven by the global MPI-ESM-LR at 0.44° for the last 2500 years. The state-of-the-art external forcings of the CMIP6 compliant Earth System Model comprise of volcanic (stratospheric aerosol optical depth), orbital (eccentricity, obliquity, longitude), solar (irradiance), land-use (leaf area index and plant coverage) and greenhouse-gas (CO2 equivalent) changes, implemented in the regional climate model. The simulated temperature and precipitation will be compared with those of other CMIP6 models, and proxy records. This research will provide a comprehensive interpretation of the regional climate and its impacts during the 6th century AD in the Mediterranean.


Reference

Jungclaus, J. H., Bard, E., Baroni, M., Braconnot, P., Cao, J., Chini, L. P., Egorova, T., Evans, M., González-Rouco, J. F., Goosse, H., Hurtt, G. C., Joos, F., Kaplan, J. O., Khodri, M., Klein Goldewijk, K., Krivova, N., LeGrande, A. N., Lorenz, S. J., Luterbacher, J., Man, W., Maycock, A. C., Meinshausen, M., Moberg, A., Muscheler, R., Nehrbass-Ahles, C., Otto-Bliesner, B. I., Phipps, S. J., Pongratz, J., Rozanov, E., Schmidt, G. A., Schmidt, H., Schmutz, W., Schurer, A., Shapiro, A. I., Sigl, M., Smerdon, J. E., Solanki, S. K., Timmreck, C., Toohey, M., Usoskin, I. G., Wagner, S., Wu, C.-J., Yeo, K. L., Zanchettin, D., Zhang, Q., and Zorita, E.: The PMIP4 contribution to CMIP6 – Part 3: The last millennium, scientific objective, and experimental design for the PMIP4 past1000 simulations, Geoscientific Model Development, 10, 4005–4033, https://doi.org/10.5194/gmd-10-4005-2017, 2017.

How to cite: Zhang, M., Hartmann, E., Wagner, S., Adakudlu, M., and Xoplaki, E.: Climate of the 6th Century based on the Fully Forced Regional Climate Model COSMO-CLM over the Eastern Mediterranean and the Nile Basin, EGU General Assembly 2023, Vienna, Austria, 23–28 Apr 2023, EGU23-9075, https://doi.org/10.5194/egusphere-egu23-9075, 2023.

EGU23-10323 | Posters on site | CL1.2.4

Reconstruction of solar radiation in Tokyo since 1720 based on historical weather records 

Mika Ichino, Kooiti Masuda, and Takehiko Mikami

The impact of climate change on human society has been a significant issue in historical studies and is also vital for future adaptation to climate change. To understand climate change and its devastating impacts on societies in the past, before the start of meteorological observations, the spatial patterns of climate variation must be reconstructed with a higher temporal resolution than those provided by the annual data. Japan has a large volume of records, including those related to daily weather conditions (e.g., "fine", "cloudy", and "rainy"), from the 17th to 19th century.

This study has developed a method for estimating solar radiation using daily weather descriptions recorded. Using this method and the daily weather records in historical diaries of Tokyo, Japan, we reconstructed solar radiation fluctuations for the period 1720–1912, pertaining to the Little Ice Age. We compared our estimations with the observed sunshine duration records of the Japan Meteorological Agency to validate our findings. This method is effective in reconstructing solar radiation for all seasons and allows for the reconstruction of historical climate fluctuations with higher temporal resolution compared with that reconstructed using other methods or proxy data often used previously. In addition, solar radiation is a fundamental factor for not only the energy balance of the Earth but also the hydrological cycle and agricultural productivity.

Here, we created a long-time series of solar radiation for the period 1720–2022 in Tokyo, thereby providing insights into low and high solar radiation for this practical 300-year period. Furthermore, the reconstruction of historical solar radiation fluctuations could enable the exploration of the correlation between climate variations and social changes.

How to cite: Ichino, M., Masuda, K., and Mikami, T.: Reconstruction of solar radiation in Tokyo since 1720 based on historical weather records, EGU General Assembly 2023, Vienna, Austria, 23–28 Apr 2023, EGU23-10323, https://doi.org/10.5194/egusphere-egu23-10323, 2023.

EGU23-12593 | ECS | Orals | CL1.2.4

Atmospheric Analysis in the 1810s by Assimilating Diary-based Weather Category 

Xiaoxing Wang, Kinya Toride, Mika Ichino, and Kei Yoshimura

Daily atmospheric conditions before 1900 have been rarely investigated due to the limited availability of instrumental meteorological records. The documentary evidence is an alternative source that archives the atmospheric state. In Japan, the Historical Weather Database (HWDB, accessible by: http://tk2-202-10627.vs.sakura.ne.jp) provides descriptive daily weather information recorded in diaries at many stations since the 1660s. We utilize data assimilation to achieve high-temporal reconstructions by optimally combining observations with climate model forecasts. This study reconstructs daily weather conditions in the 1810s by assimilating diary weather information for the first time. We first categorize the descriptive records into “sunny”, “cloudy”, and “rainy”, and then assimilate these diary-based weather categories into the Global Spectral Model (GSM) through a local ensemble transform Kalman filter (LETKF) scheme. The reconstructed precipitation corresponds well with the daily synoptic pattern illustrated by documentary evidence in Japan. In a single-day case in August, 80% of non-assimilated diary categories are consistent with precipitation results. The atmospheric characteristics are also well reproduced in the Meiyu-Baiu season. Our results show better accuracy than the Twentieth Century Reanalysis (20CR) dataset due to their weak constraint in the Japan region. In addition, the Tambora eruption in April 1815 was among the largest in recent history, leading to the temperature decrease in Europe in the following year, commonly known as the “Year Without a Summer”. In our results, the surface air temperature anomaly indicates significant cooling also occurred in Japan in the summer of 1816, demonstrating the climate response to the Tambora eruption. This study shows the capability of diary data assimilation to reproduce daily atmospheric conditions, providing the basis to understand the cause of short-term variability in the past climate.

How to cite: Wang, X., Toride, K., Ichino, M., and Yoshimura, K.: Atmospheric Analysis in the 1810s by Assimilating Diary-based Weather Category, EGU General Assembly 2023, Vienna, Austria, 23–28 Apr 2023, EGU23-12593, https://doi.org/10.5194/egusphere-egu23-12593, 2023.

Stable water isotopes are widely used to reconstruct past temperature and precipitation variations in many regions of the Earth. While the general physical processes of how isotope variations are controlled by temperature and water amounts is well understood, quantifying past isotope changes as a proxy for temperature and precipitation is much more difficult. An explicit simulation of water isotopes in current Earth system models is one possibility to approach this problem.
In this study we present new results of a transient fully-coupled simulation of the climate of the last two millennia, using the isotope-enabled model MPI-ESM-wiso. We analyze long-term trends, variability and extremes of the simulated isotope changes in precipitation, compare model results to available data compilations (e.g. PAGES Iso2k) and quantify the relations with associated temperature and hydrological changes. Our analyses show that for many regions of the Earth, the surface warming starting with the beginning of the industrialization period is clearly imprinted in the oxygen-18 isotope signal of precipitation, e.g., over Greenland, North America, and the Atlantic Ocean. However, in some regions recent temperature, precipitation and isotope changes seem to be decoupled, e.g., over West Antarctica, Oceania, and the Indian Ocean. In our presentation, we will discuss this regional varying imprint of the Anthropocene on the water isotope signal in detail. Further analyses focus on changes in isotope variability in different regions over the last two millennia, as well as the possible detection of past climate extremes in different isotope records.

How to cite: Werner, M. and Cauquoin, A.: Climate trends, variability and extremes recorded by water isotopes during the last two millennia, EGU General Assembly 2023, Vienna, Austria, 23–28 Apr 2023, EGU23-13169, https://doi.org/10.5194/egusphere-egu23-13169, 2023.

EGU23-13374 | Orals | CL1.2.4

Central European temperature variations over the past two millennia recorded in a stalagmite from western Switzerland 

Dominik Fleitmann, Anamaria D. Häuselmann, Hai Cheng, Markus Leuenberger, and Stèphane Affolter

Almost all of the Central European temperature reconstructions covering the last two millennia reflect summer rather than mean annual air or cold season temperatures. To address the seasonal bias, we developed highly resolved 2000 year-long calcite isotope (δ18O) and fluid inclusion water isotope (δ2O and δ18O) records from a stalagmite from Milandre Cave in the Swiss Jura Mountains. Present-day climate in this region is strongly influenced by westerly air masses, making it an ideal site to record climate variability in the North Atlantic and European realm. Calibration of the Milandre Cave isotope records with historical and observational temperature and isotope data enables us to reconstruct mean annual air temperatures.  Our new temperature reconstruction shows temperature variations of approximately 2°C during the past two millennia, the temperature difference between the warmest decade of the Medieval Climate Anomaly (950–1250 CE) and the coldest decade of the Little Ice Age (1400–1700 CE) is around ~1.7°C. In general, higher central European temperatures were reconstructed in the periods 450–600 CE and 1000–1150 CE, and relatively low temperatures were recorded in the intervals 650–900 CE and 1350–1700 CE. Modelled cold season temperatures for the past millennium compare remarkably well with our reconstruction, and confirm the importance of both solar and internal forcing on Central European temperature.

How to cite: Fleitmann, D., Häuselmann, A. D., Cheng, H., Leuenberger, M., and Affolter, S.: Central European temperature variations over the past two millennia recorded in a stalagmite from western Switzerland, EGU General Assembly 2023, Vienna, Austria, 23–28 Apr 2023, EGU23-13374, https://doi.org/10.5194/egusphere-egu23-13374, 2023.

EGU23-14248 | Posters on site | CL1.2.4

The first tree-ring reconstruction of streamflow variability over the last ~250 years in the Lower Danube 

Monica Ionita-Scholz, Viorica Nagavciuc, Catalin Roibu, Andrei Mursa, Marian-Ionut Stirbu, and Ionel Popa

Paleoclimate reconstructions are increasingly used to characterize climate variability and change prior to the instrumental record, in order to improve our estimates of climate extremes and to provide a baseline for climate change projections. Most of these reconstructions are focused on temperature, precipitation, and/or drought indices and, to a lesser extent, reconstruct streamflow variability. In this study, the first regional tree-ring width chronology (i.e. Quercus sp.), from the Caraorman forest (Danube Delta, Romania), was used to reconstruct the last ~250 years of annual (from November previous year to July of the current year) streamflow of the Lower Danube River. The obtained results indicate a stable and significant correlation between the tree-ring width index from the Caraorman forest and the Danube streamflow at the Ceatal Izmail hydrologic station situated in the southeastern part of Europe. Interannual streamflow variation for the analyzed period indicates 14 extremely high flow years, with streamflow greater than 8780 m3/s (1770, 1771, 1799, 1836, 1838, 1839, 1871, 1876, 1877, 1879, 1940, 1941, 1997 and 2010) and 14 extremely low flow years, with streamflow lower than 5300 m3/s (1741, 1745, 1750, 1753, 1773, 1794, 1812, 1832, 1843, 1882, 1899, 1921, 1964 and 1994). Periods characterized by pluvials in the lower Danube Delta are associated with a low-pressure system centered over Europe, positive sea surface temperature (SST) anomalies over the Atlantic Ocean, and negative SST anomalies over the Baltic, North, and Mediterranean Seas. These large-scale conditions favor the advection of moist air from the Mediterranean and the Black Sea towards the southeastern part of Romania, which in turn leads to high precipitation rates over this region. Opposite to this, low streamflow years are associated with a high-pressure system centered over Europe, characterized by a northward shift of the storm tracks and negative SST anomalies over the Atlantic Ocean, and positive SST anomalies over the Baltic, North, and Mediterranean Seas. Based on our results, we argue that the reconstruction of river streamflow data based on the tree-ring width has important scientific and practical implications for a better understanding of the streamflow variation of the past, necessary for water resource management and environmental-hydrological protection.

How to cite: Ionita-Scholz, M., Nagavciuc, V., Roibu, C., Mursa, A., Stirbu, M.-I., and Popa, I.: The first tree-ring reconstruction of streamflow variability over the last ~250 years in the Lower Danube, EGU General Assembly 2023, Vienna, Austria, 23–28 Apr 2023, EGU23-14248, https://doi.org/10.5194/egusphere-egu23-14248, 2023.

EGU23-16901 | Orals | CL1.2.4

Reconstructing Earth Energy Imbalance over the Common Era 

Gregory Hakim, Anna Black, and Kyle Armour

Many aspects of climate change are related to the net energy imbalance at top of Earth's atmosphere. This measures the difference between incoming solar radiation and outgoing radiation from emission and reflected solar radiation; the net imbalance must be reflected in changes to global energy storage. While the net imbalance has been measured by satellites in recent decades and constrained by ocean heat-content estimates from Argo floats, long-term changes are poorly constrained, even in the 20th century. Here we test the hypothesis that the planetary energy imbalance can be estimated from observations, and proxies, of surface temperature using data assimilation over the Common Era.

We present and evaluate a method for reconstructing outgoing radiation at the top of the atmosphere from assimilation of surface temperature observations. The method is first tested during the satellite era by assimilating HadCRUT surface temperature observations using prior estimates drawn from historical climate-model simulations outside the validation period. Results show higher skill in the reconstructions compared to AMIP simulations for interannual variability in both the outgoing infrared, and reflected solar radiation fields, when compared to CERES measurements. Over longer periods of time, the effective radiative forcing (ERF) from changing greenhouse gases and aerosols must be considered since ERF is, by definition, the radiative response independent of surface temperature changes. Adding estimates of ERF from climate simulations to the reconstructed radiation fields shows good agreement with AMIP simulations over the historical period. We extend the method to the Common Era using PAGES2K temperature-sensitive proxies and the Last Millennium Reanalysis assimilation framework.

How to cite: Hakim, G., Black, A., and Armour, K.: Reconstructing Earth Energy Imbalance over the Common Era, EGU General Assembly 2023, Vienna, Austria, 23–28 Apr 2023, EGU23-16901, https://doi.org/10.5194/egusphere-egu23-16901, 2023.

EGU23-828 | ECS | Posters virtual | SSS3.1

"Paleopedology of Siwalik Paleosols of Kangra Sub-Basin, NW Himalaya: Implication for Weathering and Climate change 11 Ma to 6 Ma" 

Pooja Yadav, Abdul Hameed, Rohit Kumar, and Pankaj Srivastava

The Himalayan Mountain range is the most prominent and active intracontinental range in the world. The outer part of this range is marked by the Himalayan foreland basin (HFB) in south that resulted due to the thrust loading and subsidence with synorogenic sedimentation from the hinterland. The lowermost part of the HFB is marked by the molassic sediments of “Siwalik” which thins out to the south. The time frame between 11Ma to 6 Ma (mid to late Miocene) is critical to understand the changes related to monsoon and vegetation as there is no detailed record or systematic study of late Cenozoic weathering and paleopedogenesis in fluvial sediments of the HFB. In the present study, we present a high-resolution paleopedological record of the paleosols along a traverse of ~ 1.8 km in the Kotla-Brail section of the Kangra sub-basin of the HFB. In the field, the paleosols are characterized by 1-2 m thick Bw, Bt, Bk, Bss, Bk horizons, rhizocretions, pedogenic carbonates (PC), and Fe/Mn mottles and concretions. The paleosols in the Lower Siwaliks show a dominance of 2.5 Y and 5 YR hue, whereas in the Middle Siwaliks they are defined by 5 YR and 7.5 YR hue. Micromorphology of these paleosols confirmed varying degrees of weathering, and paleopedogenesis showing a blocky structure, clay coatings, biogenic activity, and diffused impure micritic nodules as PC in the Bw and Bt, Btk horizons. These pedofeatures are more strongly developed in paleosols of the Lower Siwaliks than in comparison to weakly-moderately paleosols of the Middle Siwaliks.

Clay mineralogy determined based on XRD study of the total (<2 µm) fine clay (<0.2 µm) fractions of these paleosols is characterized by the dominance of smectite, vermiculite, and mixed-layer minerals in paleosols of the Lower Siwalik. The clay mineral assemblage shows a  decrease in the abundance of smectite and increase of kaolinite towards the transitions to Middle Siwalik at ~10 Ma. This also shows transformation of the smectite and vermiculite to interstratified clays at about ~8 Ma. After ~8.5 – 8.0 Ma, the paleosols are again marked an increase of the amount of smectite, vermiculite, and mixed-layer minerals in paleosols of the Middle Siwalik towards their transitions to Upper Siwalik. The varying intensity of weathering, paleopedogenesis, and clay mineral assemblage of the paleosols in the Lower and Middle Siwalik suggest fluctuating climatic conditions that evolved from initial semi-arid to sub-humid at ~11 Ma that to higher precipitation at ~8.5 to 8 Ma then again to semi-arid to arid conditions at ~6.5 Ma.


Keywords: Himalayan Foreland Basin (HFB), Siwalik, Paleosols, Micromorphology, Clay Minerals

How to cite: Yadav, P., Hameed, A., Kumar, R., and Srivastava, P.: "Paleopedology of Siwalik Paleosols of Kangra Sub-Basin, NW Himalaya: Implication for Weathering and Climate change 11 Ma to 6 Ma", EGU General Assembly 2023, Vienna, Austria, 23–28 Apr 2023, EGU23-828, https://doi.org/10.5194/egusphere-egu23-828, 2023.

In the present study we report paleopedology of the fluvial sequences of the Siwalik Group in the Himalayan Foreland Basin, NW Himalaya that formed during ~12 Ma -5.5 Ma. The paleosols formed during this time period are critical to understand weathering and paleopedogenic processes during the evolution of foreland basin over the entire Himalayan range. This work highlights field-characteristics, micromorphology, clay mineralogy, and geochemistry of the ~0.5 km thick Lower Siwalik and ~1.7 km thick Middle Siwalik successions along the Katilu Khad, Kangra sub-basin. In the field, the paleosols are characterized by 1-2 m thick Bw, Bt, Bk, Bss, and BC horizons, blocky and wedge-shaped pedogenic structures, root traces, color mottling, Fe-Mn oxide concretions, slickensides, pedogenic CaCO3 (PC), and bioturbation features. 

Micromorphological observations show the dominance of moderate to well-developed paleopedofeatures in paleosols of the Lower Siwalik in contrast to the moderately to weakly-developed paleopedofeatures in paleosols of the Middle Siwalik. The comparative analysis of various pedogenic features i.e., PC, illuvial clay, mottles, Fe-Mn concretions, microstructures, and bioturbation features confirmed varying degree of the paleopedogenic maturity in the paleosols at different intervals of the Siwalik successions.

Clay mineralogy of the total clay (<2 μm) and fine clay fraction (< 0.2 μm) of the Lower and Middle Siwalik paleosols suggests varying chemical weathering of silicates and change of paleoclimatic conditions during paleopedogenic processes during this time period. The clay mineral assemblage of the total clay and fine clay fraction show the varying distribution of illite, chlorite, kaolinite, smectite, vermiculite and interstratified clay minerals in these paleosols. Large amounts of smectite together with pedogenic carbonates in part of the Lower Siwalik at 12.0 Ma, and at 10.9 Ma and in Middle Siwalik at 9.2 Ma, and at 5.5 Ma suggest arid to semiarid dry climatic conditions Whereas, dominance of kaolin, illuvial features, and dissolution of pedogenic carbonates suggests sub-humid to humid climatic condition at 11.6 Ma, 8.5 Ma, 7.1 Ma, and at 6.5 Ma.

The bulk geochemistry of the paleosols also confirmed varying degree of pedogenic weathering showing high CIA and CIA-K (CIW) values and ~ 800 mm to 1400 mm MAP for paleosols of the Lower and Middle Siwalik. The high MAP (~ 1200 mm to 1400 mm) at ~11.6 Ma, ~8.5 to 8.0 Ma, and 7.1 to 6.5 Ma in paleosols of the Lower Siwalik and Middle Siwalik correspond to increased chemical weathering and paleopedogenesis. While the intervening periods correspond to less MAP (~800 mm to 1100 mm) with large amount PC and less chemical weathering. Based on micromorphology, clay mineralogy, and geochemical characteristics of the paleosols it is interpreted that climate change during ~12 Ma to 5.5 Ma is characterized by humid (11.6 Ma) to semiarid (11.0 Ma to 8.5 Ma), and humid-subhumid (8.5 Ma to 6.5 Ma) in response to Himalayan orogeny and its linkage to regional and global atmospheric conditions.

Keywords: Himalayan Foreland Basin, Paleosols, Siwalik, Micromorphology, Clay mineralogy, Geochemistry

How to cite: Hameed, A., Yadav, P., Kumar, R., and Srivastava, P.: Paleopedological evolution of Siwalik succession from Kangra sub-Basin, NW Himalayan: Implications for climate change and weathering conditions, EGU General Assembly 2023, Vienna, Austria, 23–28 Apr 2023, EGU23-838, https://doi.org/10.5194/egusphere-egu23-838, 2023.

EGU23-2241 | Posters on site | SSS3.1

Post-sedimentary pedogenesis in colluvial soils in the context of the landscape sedimentary history (Czechia) 

Tereza Zádorová, Vít Penížek, Magdalena Koubová, Lenka Lisá, Daniel Žížala, Lenka Pavlů, Václav Tejnecký, and Ondřej Drábek

Colluvisols, representing a significant part of the erosional catena in undulating landscapes, often changed by long-term agricultural management, undergo a complex development with alternating phases of material deposition and slope stability, with subsequent initiation of soil formation processes. The presented study focuses on the detailed description of the post-depositional evolution of four up to 4m-deep colluvial profiles, formed in different colluvial positions in two environmentally and historically distinct areas of Czechia, situated in the loess region of South Moravia and Central Bohemian Upland, built on plutonic rocks. A multi-proxy approach consisting of analyses of clay mineralogy, micromorphology, humic acids and geochemical parameters was applied to distinguish the inherited and in-situ developed pedogenetic features and link them with the sedimentary history of the studied soils, assessed using optically stimulated luminescence dating and 137Cs activity. Marked differences in the type and maturity of pedogenetic features were identified not only in individual plots but also in different colluvial positions within the same plot. While signs of bioturbation, mainly related to root activity and soil fauna, were observed even in recent colluvial layers after a short period of stabilization, more advanced processes of weathering, organic matter stabilisation and clay illuviation are typical only for early-sedimented layers with long post-depositional development. Redoximorphic features were more pronounced in the side valleys compared to the toe-slope colluvial positions; similarly marked differences between colluvial positions were observed for humus quality, with significantly more stable organic matter concentrated within side valleys. In both sites, distinct and largely contradictory trends in the transformation of clay minerals, reflected in the proportions of different phyllosilicate layers, were observed, corresponding to the specific conditions of soil development. 

Study was supported by grant nr. 21-11879S of the Czech Science Foundation.

How to cite: Zádorová, T., Penížek, V., Koubová, M., Lisá, L., Žížala, D., Pavlů, L., Tejnecký, V., and Drábek, O.: Post-sedimentary pedogenesis in colluvial soils in the context of the landscape sedimentary history (Czechia), EGU General Assembly 2023, Vienna, Austria, 23–28 Apr 2023, EGU23-2241, https://doi.org/10.5194/egusphere-egu23-2241, 2023.

As one of the soil types, peat is an important soil carbon storage and archive of past environmental changes. Here we used multi-core and multi-proxy records from a peatland near Da’erbin Lake in the Arxan region of Northeast China to reconstruct peatland development and carbon accumulation history and to understand their responses to past climate changes during the last 2500 years. Our macrofossil results show that the peatland was characterized by a sedge-dominated fen from 490 BCE to 1450 CE, changed to a Sphagnum-dominated poor fen or bog with abundant shrubs (mostly Ericaceae) during the period of 1450–1960 CE, and finally became predominated by Sphagnum after 1960 CE. The time-weighted mean apparent carbon accumulation rate (aCAR) from three cores range from 19.5 to 53.0 g C m-2 yr-1 with a mean value of 32.4 g C m-2 yr-1, but increase rapidly to 139.2 g C m-2 yr-1 during last several decades. During the early stage of the past 2500 years, three coring sites that are only 50 m apart were all in the fen phase but they had highly variable peat properties. The fen-bog transition occurred at different times at these sites due to local influences of autogenic process, permafrost dynamics, or fire disturbance. These observations suggest that fens are highly heterogeneous, not only in peat properties but also in ecosystem dynamics. The dramatic increase in aCAR during the late stage of bog phase after 1960 CE cannot be explained entirely by limited decomposition of recently-accumulated peat. Instead, this was likely due to increasing Sphagnum dominance and resultant low decomposition of Sphagnum-derived organic matter, suggesting the important role of vegetation change in controlling carbon accumulation rates. Around the 1990s CE, an increase in allogenic CAR—after removing the age-related long-term autogenic effect—seems to correspond with a period of increase in regional summer precipitation, revealing a sensitive response of ombrotrophic bog ecosystem to climate change at decadal timescale.

How to cite: Xia, Y., Yang, Z., and Yu, Z.: Responses of peatland development and carbon accumulation to climate change over the past 2500 years in the Arxan region, Northeast China, EGU General Assembly 2023, Vienna, Austria, 23–28 Apr 2023, EGU23-2515, https://doi.org/10.5194/egusphere-egu23-2515, 2023.

EGU23-2822 | Posters on site | SSS3.1 | Highlight

Neolithic Agronomists shaped Chernozem in South-Eastern Bavaria 

Jörg Völkel, Prof. Dr., Anna Sophia Holmer, Ildikó Bösze, and Günther Moosbauer, Prof. Dr.

Up to today, the reason for the genesis of chernic horizons in Germany is a matter of discussion. Recent literature is strongly suggesting a purposeful anthropogenic soil management from neolithic times as an origin of these soils. Here we provide another example of neolithic activities meliorating the soil from a calcic Luvisol to a Chernozem with a dimension of several hectares. This is striking, since it is the first finding of a chernic horizon of this extensiveness in Bavaria, Germany.

The Chernozem has been discovered close to the city of Straubing (48°53′N, 12°34′O, MAP 757 mm, MAT 8,6°C), which is situated in the highly arable Danubian Gäuboden and part of the so called Altsiedelland. It has been home to human settlers ever since the first settlers belonging to the Linearbandkeramik (LBK) culture immigrated, among other things like the optimal climatic conditions due to its very favorable soil characteristics (luvisols) developed on Loess. The neolithic Chernozem is located directly next to a graveyard with graves dating in early neolithic times and later as well as neolithic settlements 500 m away. Collected 14C and OSL-data strongly suggest that part of the Chernozem was covered by a roman colluvium probably eroded from the former graveyard hill by roman ploughing activities. Our obtained 14C data places the chernic horizon itself into the early LBK and onwards. Nowadays the chernic horizon is mostly overprinted by the ongoing soil genesis as an argic horizon. Small charcoal flakes (< 0.5 mm) make the chernic horizon appear greyish-black up to today, with carbon-contents of around 1%. The colour intensifies in the center of the Chernozem area closely by the settlements and graveyard and fades out to a distinct grey shadow in the argic horizon of the calcic luvisol above around 2 km away.

These findings leave no room for doubt: The Chernozem has an anthropogenic origin and was created by the neolithic settlers, following a purpose in managing and meliorating the soil.

How to cite: Völkel, Prof. Dr., J., Holmer, A. S., Bösze, I., and Moosbauer, Prof. Dr., G.: Neolithic Agronomists shaped Chernozem in South-Eastern Bavaria, EGU General Assembly 2023, Vienna, Austria, 23–28 Apr 2023, EGU23-2822, https://doi.org/10.5194/egusphere-egu23-2822, 2023.

The Volyn’ Upland is a “loess island” in the middle of the European loess belt. In the previously studied sections of this region, the Pleistocene palaeosols are mainly polygenetic; therefore, the pedocomplexes comprise no more than two soils. The study of the sections located both on the slopes of the river valleys and in the buried gullies, contributed to detailed stratigraphy of the pedocomplexes.  

Three pedocomplexes have been distinguished in the sections, which, according to palaeopedological and palynological data, were tentatively correlated with MIS 5, 7 and 9, respectively. The lower pedocomplex (S3, MIS 9) comprises two soils. The lower soil (S3-II) is a Luvisol with multi-phased clay coatings in the Bt horizon. However, micromorphology detects a clear primary A horizon with abundant coprolites. The upper soil (S3-I) has a well-developed A horizon and Ag horizon in the depression. However, clay coatings in the Bt horizon testify to the clay translocation.

The middle pedocomplex (S2, MIS 7) comprises two welded soils separated by a thin loess bed. The lower soil (S2-II) is a Luvisol, in places marked by a pronounced A horizon, in which clay coatings occur, whereas in the E horizon secondary carbonate nodules appear.  In places, the upper soil (S2-I) turns into two separate soils: the lower Haplic Chernozem and the upper Cambisol, both densely dissected by soil veins. These soils are dark, leached of carbonates, with crumby and granular microstructure. Many krotovinas occur in the subsoil.

The upper pedocomplex (S1, MIS 5) is subdivided into three sub-pedocomplexes, interbedded with sandy facies in depressions and thin loess-like deposits at the topographically higher positions. The lower sub-pedocomplex (S1-III, MIS 5e) is represented, depending on the parent material, by Luvisol, Retisol or Podzol with abundant clay coatings in the Bt horizon. In places, the forest soil is overlain by Entic Podzol with a more pronounced A horizon and is underlain by a Gleysol in depression. The middle sub-pedocomplex (S1-II, MIS 5c) comprises three soils: the lower Entic or Albic Podzol, the middle Chernozem and the upper Cambisol. A distinguished feature of these soils is the rapid increase in sand content in almost all studied sections. The upper sub-pedocomplex (S1-I, MIS 5a) is interpreted as a Cambisol, in places with a well-developed A horizon. In the upper soils of S1, pale brown spots occur.

Three Gleysols have been distinguished in the upper thick loess unit (L1, MIS 2-4). The lower Gleysol (MIS 3) is better developed and mostly polygenetic; in places the soil turns into a pedocomplex consisting of two or three soils: the lower Gleysol, the middle Gleyic Cambisol and the upper Calcaric Cambisol. The middle Gleysol appears to be polygenetic, as evidenced by palynology and micromorphology. Large ice-wedge pseudomorphs are associated with the upper Gleysol, which makes it possible to interpret soil as tundra-gley.

The study was supported by the National Research Foundation of Ukraine, grant number 2020.02/0406.

How to cite: Bonchkovskyi, O.: A detailed palaeosol record of Middle and Upper Pleistocene from the central part of the Volyn’ Upland (the NW Ukraine), EGU General Assembly 2023, Vienna, Austria, 23–28 Apr 2023, EGU23-3857, https://doi.org/10.5194/egusphere-egu23-3857, 2023.

EGU23-5502 | ECS | Posters on site | SSS3.1

Using advanced geophysical data processing to improve low detection data in archaeological sites 

Rui Jorge Oliveira, Bento Caldeira, José Fernando Borges, and Mourad Bezzeghoud

Geophysical data with noise issues are quite common, resulting in low detection conditions. This prevents the ground content from being evaluated to determine the existence of structures buried in the ground in an archaeological site. Standard processing on ground-penetrating radar and magnetic data does not effectively eliminate or mitigate this effect. The use of advanced and customized data processing is a viable solution to the problem. This processing can be applied using mathematical transforms in conjunction with data decomposition techniques, allowing for easier and less computationally intensive data manipulation. The circular symmetry of the data is enabled by the 2D Fourier transform, making operations like filtering easier to implement. In the transformed domain, factoring techniques such as singular value decomposition can be used (SVD). After analyzing the decomposed signal, the components can be matched to the signal and noise. The 2D wavelet transform allows for data decomposition, with operations such as multiresolution SVD and multidirectional gradient calculation applied to each channel to select the most informative content from a dataset. The chain application of these operations allows for the improvement of geophysical data despite an apparent lack of information. Testing on field data obtained at Villa Romana de Pisões (Beja, Portugal) is an example of successful application. Advanced geophysical data processing operations can improve the data and should be used in conjunction with standard operations.

Acknowledgment: The work was supported by the Portuguese Foundation for Science and Technology (FCT) project UIDB/04683/2020 - ICT (Institute of Earth Sciences).

How to cite: Oliveira, R. J., Caldeira, B., Borges, J. F., and Bezzeghoud, M.: Using advanced geophysical data processing to improve low detection data in archaeological sites, EGU General Assembly 2023, Vienna, Austria, 23–28 Apr 2023, EGU23-5502, https://doi.org/10.5194/egusphere-egu23-5502, 2023.

As sea levels rose since the end of Last Glacial Maximum (LGM) ancient coastal communities were often forced to abandon their settlements and move inland. Today, many of these abandoned sites are covered by sand or lay in shallow water. Examining these can shed light on past coastal communities as well as settlement patterns in ancient times. Archaeological excavation along the coast is particularly tricky and often sporadic in nature. Thus, high‐resolution shallow geophysical methods, which have become a standard in archaeological studies since they provide a noninvasive way of imaging the subsurface before an excavation, would seem like a perfect solution. However, most methods are limited in their ability to work near the shoreline – the transitional zone between classical land-based methods and standard marine ones. Ground penetrating radar (GPR), for example, is greatly affected by moisture and salinity and is therefore limited in its ability to work in areas saturated with seawater. Seismic reflection is time consuming to overcome issues of poor vertical and spatial resolution and sensitive to urban noise, while magnetics would provide poor results for sand covered sandstone. Other techniques, such as electrical resistivity tomography (ERT) have been shown to work in coastal areas and in shallow water. However, this method can be slow, as it involves setting up complex arrays for each cross section measured. This study will present the frequency domain electromagnetic (FDEM) method, which has the potential to overcome these problems and can bridge the gap in knowledge by measuring in the nearshore environment. The ease of use and quick scanning capability means that large areas can be covered in a relatively short time. There are no electrodes or loops to set up. Since it measures swaths, results are obtained in map-view and not cross-section, with little interpolation. Different frequencies penetrate to different depths (lower frequencies corresponding to deeper penetration). Therefore, the result is a series of frequency maps corresponding to the integration of all subsurface data in a specific sampled volume (i.e. down to the frequency-related depths), providing important information on shallow subsurface properties. The use of multiple frequencies allows for the resolving of internal structures within the depth range. Overall, the FDEM method has proven to be a valuable tool for studying coastal archaeology, and it is likely to continue to play an important role in the field in the coming years. Its ability to detect buried objects and structures and to study the geomorphology of submerged landscapes makes it an essential tool for researchers working in this field.

How to cite: Lazar, M. and Basson, U.: Frequency domain electromagnetic methods for coastal archaeology – a new(ish) approach for the detection of ancient settlements, EGU General Assembly 2023, Vienna, Austria, 23–28 Apr 2023, EGU23-5919, https://doi.org/10.5194/egusphere-egu23-5919, 2023.

EGU23-8737 | ECS | Orals | SSS3.1 | Highlight

Geophysical characterization of the shallow subsoil at a heavily urbanized archaeological site: the Roman Amphitheater and the Scrovegni Chapel in Padua. 

Giorgio Cassiani, Ilaria Barone, Mirko Pavoni, Jacopo Boaga, and Rita Deiana

The characterization of the shallow subsoil at complex archaeological sites requires sufficient spatial coverage and resolution as to provide the necessary information. This is all but trivial, particularly where historical superposition of layers requires also sufficient depth investigation and resolution. The Scrovegni Chapel in Padua, with its Giotto's fourteen century frescoes, and recently added to the list of UNESCO World Heritage Sites, stands on the remains of the local Roman amphitheater. The hypogeum located under the chapel shares its western wall with a part of the wall of the amphitheater. To date, no information is available about the soil below the apse of the chapel. Over the past decade, several ERT and GPR measurements have been conducted outside the chapel, straddling the amphitheater structure for archaeological and geomorphological characterization of the area. In 2021, a first 3D active and passive seismic survey was conducted using about 1500 wireless sensors, aiming at using surface waves to provide a 3D image of the subsurface in terms of shear wave velocity. In 2022 three 20 m deep boreholes were drilled around the chapel and equipped with fiber optics, ground deformation sensors, and electrodes for cross-hole ERT, and about 200 1-C and 3-C wireless seismic sensors were placed around the drilling area. During the drilling, additional 3D seismic data were acquired from the surface, which completed the datasets acquired in 2021. The geophysical data thus acquired and the time-lapse monitoring that will be possible around the area of the Scrovegni Chapel in Padua will allow reconstructing the geomorphology of the subsurface on which the chapel rests, but also to better study and analyze the possible interactions between the structure of the chapel and the buried structure of the Roman amphitheater from the mechanical point of view as well as from the perspective of the seismic response of this specific site.

How to cite: Cassiani, G., Barone, I., Pavoni, M., Boaga, J., and Deiana, R.: Geophysical characterization of the shallow subsoil at a heavily urbanized archaeological site: the Roman Amphitheater and the Scrovegni Chapel in Padua., EGU General Assembly 2023, Vienna, Austria, 23–28 Apr 2023, EGU23-8737, https://doi.org/10.5194/egusphere-egu23-8737, 2023.

EGU23-9663 | Posters on site | SSS3.1

Khalat al-Saharij - An Iron Age Small Site and Long Anthropogenic Effect on the Soil 

Oren Ackermann, Jenny Marcus, Jan Fišer, Gilad Itach, Martin Janovský, and Nimrod Wieler

Ancient anthropogenic long-term effects on soil chemical composition is a well-known phenomenon in large archaeological sites. In the current presentation, this effect will be shown in Khalat al-Saharij, a small site located in central Israel, in the footslope of the main highlands of the country. The site served as a farmhouse during the Neo Assyrian rule and was dated to the second half of the 8th century BCE.

Archaeological excavations of the site revealed a building that included two strips of rooms built around a square courtyard, a rock-hewn water reservoir, and agricultural facilities scattered in the area east and west of the building, including agricultural terraces.

The main aim of the current research was to find an anthropogenic signature in the sediments of the site, and in the sediments of the surrounding fields. 

POSL, PXRF and XRF methods were applied in order to achieve this aim.

The results showed that a significant anthropogenic signature was recorded on the sediments of the building and its square courtyard. This is reflected in the chemical composition that was enriched by phosphorus (P) and calcium (Ca), and by the mixed pOSL signal values. In the anthropogenic fields, the chemical signature is typical of natural soil with a high amount of Iron (Fe) and Manganese(Mn) which reflect high water availability.  

It is interesting that although the site is small in size and was inhabited for a short period of time, the human imprint has remained hundreds of years after its abandonment.

How to cite: Ackermann, O., Marcus, J., Fišer, J., Itach, G., Janovský, M., and Wieler, N.: Khalat al-Saharij - An Iron Age Small Site and Long Anthropogenic Effect on the Soil, EGU General Assembly 2023, Vienna, Austria, 23–28 Apr 2023, EGU23-9663, https://doi.org/10.5194/egusphere-egu23-9663, 2023.

EGU23-10838 | ECS | Orals | SSS3.1

Geophysical investigation of kurgans in Uzun Rama steppe, Goranboy region, Azerbaijan 

Kamal Bayramov, Clara Jodry, Gunel Alizada, Sarvar Mammadov, Vusal Azimov, and Malik Abdullayev

Kurgans are funeral chambers, evidence of burial tradition dating back to the first thousand years BCE, of nomadic populations that covered a vast area in-between Europe and Asia. In Azerbaijan, past archaeological explorations revealed numerous large kurgans from the Early Bronze, which correspond to Kura-Arexed period (ca. 3500-3000 BCE), and relatively smaller burials of Late Bronze/Early Iron Ages. To improve the efficiency of the excavation process, geophysical methods have been widely and effectively applied for many years to provide clear and useful images of archeological targets hidden underground such as kurgans.

In this work, we introduce a multi-method archaeo-geophysical survey done in May 2022 to investigate Early Bronze Age kurgans located in Uzun Rama Steppe of Goranboy region in Azerbaijan. Applied method cover different depth of investigation and resolution to provide a wealth of information on the structure of three kurgans aligned in a North-South direction. It comprises coincidental DC-resistivity and seismic refraction tomographies of 70.5 m with a 1.5 m spacing going over all kurgans, a Ground Penetrating Radar (GPR) 40 m long profile using a 500 MHz antenna on the northern kurgans going from East to West and a magnetic map 24 x 25 m on the southern one.

The DC-resistivity profile shows two layers, a medium resistivity layer (500 to 600 W.m) from the surface to 6 m depth and a very conductive layer (> 10 W.m) under it. The first layer contains three areas of lower resistivity (~ 60 W.m) that are limited in thickness and length. As these three spots are marked by higher height on-site, we interpret them as the three kurgans. The coincidental seismic profile is a lot less detailed (due to physical properties and higher spacing between receiver) and define only three homogeneous layers, a first layer from the surface to 1 m depth with a P-wave velocity of 300 m/s, a second layer of higher velocity (1000 m/s) from 1 m depth to approximately 6 m depth and a final third layer of 2000 m/s velocity. Even though, the resolution is lower, we interpret the first layer as an attempt of the model to represent the kurgans. The GPR profile give a high attenuate image due to low resistive layer. However multiple diffractions can be seen in the first meter of the subsurface that can indicate the presence of ancient artefact related to the kurgans. Finally, the magnetic map defines the limit of the kurgan as a positive-negative anomaly probably due to the burning ritual that ended the implementation of a kurgan.

This geophysical campaign allowed us to accurately locate the kurgans as well as provide information on the environment. DC-resistivity and magnetic mapping seem to get the best results in our case. A future archaeological investigation will be put in place based on these results.

How to cite: Bayramov, K., Jodry, C., Alizada, G., Mammadov, S., Azimov, V., and Abdullayev, M.: Geophysical investigation of kurgans in Uzun Rama steppe, Goranboy region, Azerbaijan, EGU General Assembly 2023, Vienna, Austria, 23–28 Apr 2023, EGU23-10838, https://doi.org/10.5194/egusphere-egu23-10838, 2023.

EGU23-10982 | Orals | SSS3.1 | Highlight

Construction and Agriculture in Sand at the Early Islamic Plot-and-Berm Groundwater Harvesting Agroecosystem South of Ancient Caesarea 

Lotem Robins, Joel Roskin, Elle Grono, Revital Bookman, and Itamar Taxel

Based on surveys and three excavation seasons, we report details on one of the first major utilizations of loose aeolian sand for construction and (hypothesized) vegetable agriculture at the Early Islamic Plot-and-Berm (P&B) agroecosystem south of Caesarea Maritima, along the Mediterranean coast of Israel. P&B agroecosystems are an innovative initiative to reconstruct sand bodies and dunefields into agricultural plots sunken between sand berms. These agroecosystems are sporadically found between Iran and Iberia and some are still in use. The plots, usually ~1 m above the groundwater table allowed easy access to the water via shallow wells for irrigation.

Research methods included pedological and sedimentological analyses, micromorphology and compositional analyses such as Fourier Transform Infrared Spectroscopy to detect heating of cultural additives (e.g., fired clays, pyrogenic lime); plant ashes (e.g., deliberate enrichment of fuel and/or recycling of former crop cycles as part of plot maintenance); and pollen and phytolith analysis to detect micro-botanical proxies of crops. Relative chronologies were obtained from portable luminescence profiling (pOSL). OSL ages along with artifacts analysis indicate that the agroecosystem was established during the late 9th or 10th century and functioning until the early decades of the 12th.

Refuse, including ash, carbonate, trace elements and artifacts, extracted from the dumps of Caesarea was combined with local sand to stabilize the berm surface but also partly altered the physical and chemical properties of the sand and increased its fertility, mainly in the plots, to form grey sandy to sandy loam anthrosols. This refuse was combined in different mixtures along the ~5 m thick berm fill and upon its slope and crest surface to stabilize the earthwork and comprise an anti-erosive agent. Similar mixtures were used to support berms and foundations of structures that served for lime production, agroecosystem management and local farming utilities. A 5 m high mound constructed out of interchanging anthrosediments was also piled up within a plot to support a presumable guarding structure. 

Plot anthrosols appear to include a basal, dark grey 20-40 m thick unit, ~ 1 m above the groundwater table that was enrichened with carbonate overlaid by a ~1 m thick grey sand anthrosol. The lower unit probably served for preserving infiltrating irrigation water that was applied to the crops grown atop the light grey anthrosol.

The agroecosystem remained well-preserved and untouched until the mid-20th century. Its pristine preservation is evidence of the ingenious and widespread utilization of refuse for construction and agriculture in sand. The untouched shape of this agrotechnological earthwork in the last millennia is intriguing and may be due to either lack of knowledge, or resources per revenue for similar endeavors.

How to cite: Robins, L., Roskin, J., Grono, E., Bookman, R., and Taxel, I.: Construction and Agriculture in Sand at the Early Islamic Plot-and-Berm Groundwater Harvesting Agroecosystem South of Ancient Caesarea, EGU General Assembly 2023, Vienna, Austria, 23–28 Apr 2023, EGU23-10982, https://doi.org/10.5194/egusphere-egu23-10982, 2023.

Soil marks are detectable by airborne images due to the difference in soil colour between the archaeological feature and the surrounding background soil. Colour of the soil only represents the visible part of the soil spectrum which contains physical and chemical information of the soil. This study will present a spectral analysis method to prospect soil mark features and buried archaeological remains using airborne image data. This method statistically calculates the difference between the targeted spectrum and the background (non-archaeological) soil spectrum. The difference is quantified by an R-value. If the R value is larger than 1, then the spectral behaviour of the targeted spectrum is different from the spectrum of the background soil and, thus, likely to be an archaeological soil spectrum (soil mark). In this study, the spectral analysis method will be applied to APEX imaging spectroscopy data collected from an archaeological site in Sárvíz Valley, Hungary. Previously, the method was successfully applied to the same archaeological site using soil spectra gathered by a portable hand-held VIS-NIR spectrometer. Here, the results showed clear spectral difference between soil mark features and background soil. This study will 1) compare the results of the method from hyperspectral image and ground-based spectral data, and 2) investigate the most effective waveband for identifying archaeological spectral signatures to verify the effectiveness of the method.

How to cite: Choi, Y. J.: Detection of archaeological soil marks using airborne hyperspectral images, EGU General Assembly 2023, Vienna, Austria, 23–28 Apr 2023, EGU23-11168, https://doi.org/10.5194/egusphere-egu23-11168, 2023.

EGU23-12360 | Posters on site | SSS3.1

Intense pedogenic development and large carbon contents in soils above the Pleistocene trimline (NW Italian Alps) 

Michele D'Amico, Emanuele Pintaldi, Dario Melacarne, Andrea Benech, Nicola Colombo, and Michele Freppaz

Most of the Alpine range was influenced by glacier movement or by intense erosive processes during Pleistocene glacial periods, which erased previously existing soils and landforms. Thus, most of the soils in the Alps began developing since at least the end of the Last Glacial Maximum (LGM). However, some surfaces located above the trimline (the upper limit reached by valley and cirque glaciers) still retain “old” morphologies and can be considered paleosurfaces, often covered by fossil or active periglacial features.

After having found very well developed Umbrisols hidden inside blockfields at 3030 m a.s.l. on the Stolenberg Plateau, Monte Rosa Massif – NW Italian Alps (Pintaldi et al. 2021a, 2021b, 2022), we explored other relict cryogenic landforms located above the Pleistocene trimline, such as blockfields and blockstreams, observing the soils hidden below the surface stone layers.

In most cases, we found extremely well-developed soils, such as Podzols with extremely thick E horizons or Umbrisols with A-Bh horizons up to more than 1-m thick. One of the most important properties was the large organic carbon content, up to 10-13% in soils located inside barren blockstreams and blockfields presently devoid of vegetation, at elevations between 1000 and 2950 m a.s.l..

The age of this organic matter is likely very old. For instance, inside the blockfield on the Stolenberg Plateau (3030 m a.s.l.), the organic matter was up to 22 ka old, corresponding to the early retreat glacial phase after the LGM. The age and nature of the organic matter in the other soils is still being analyzed, and it will be able to give important information on past environmental condition in understudied high-elevation areas in the Alps.


References

Pintaldi E., D’Amico M.E., Colombo N., Colombero C., Sambuelli L., De Regibus C., Franco D., Perotti L., Paro L., Freppaz M. (2021a). Catena. https://doi.org/10.1016/j.catena.2020.105044

Pintaldi E., D’Amico M.E., Colombo N., Martinetto E., Said-Pullicino D., Giardino M., Freppaz M. (2021b). https://doi.org/10.1016/j.gloplacha.2021.103676

Pintaldi E., Santoro V., D’Amico M.E., Colombo N., Celi L., Freppaz M. (2022). European Journal of Soil Science. https://doi.org/10.1111/ejss.13328

How to cite: D'Amico, M., Pintaldi, E., Melacarne, D., Benech, A., Colombo, N., and Freppaz, M.: Intense pedogenic development and large carbon contents in soils above the Pleistocene trimline (NW Italian Alps), EGU General Assembly 2023, Vienna, Austria, 23–28 Apr 2023, EGU23-12360, https://doi.org/10.5194/egusphere-egu23-12360, 2023.

EGU23-14081 | ECS | Orals | SSS3.1

Morphology, distribution and origin of soil biogenic carbonates “queras” presents in Loess-palaeosols of Ebro Valley 

Daniela Alvarez, Carlos A. Torres-Guerrero, Rosa M. Poch, and Frank Preusser

Several types of secondary carbonate accumulations have been reported, but some of them are not completely well defined in the field due to unclear nomenclature. This is the case of the “queras”, reported in several Loess-palaeosol sequences of the Ebro Valley, which have often been described as pseudomycelia. Micromorphologically, they are complex pedofeatures (including calcified root cells, infillings and hypocoatings of carbonates and a decarbonated zone), resulting from calcification/decalcification processess at a microscale. They are composed of a central channel (1-2 mm wide and 2-3 cm long) filled with biosparite crystals (Herrero et al., 1992). The study of these secondary carbonate bioaccumulations are important archives for climatic reconstructions in terrestrial environments and can be used for paleoenvironmental reconstructions. The aims of this research are the characterization (morphological, optical and isotopically) of the biocalcifications present in Loess-palaeosols sequences, OSL-dated, to determine the main factors that originate them and their possible use as a palaeoenvironmental proxy. We collected soil samples from seven profile of Loess-palaeosols where the presence of these biocalcifications was recorded. We isolated and manually cleaned complete fragments of queras to describe them and to determine their isotopic composition. For that purpose, we used the queras fraction (sieved fraction of bulk soil between 100-250 µm) removing the residues of micrite with a buffer solution and manually separating the quera fragments with the help of a stereoscope. Thin sections were made to analyse the micromorphology in a petrographic microscope and cathodoluminescence techniques to determine the origin of the calcite. The micromorphology of these biocalcifications is similar in most cases: they present the same number of rows around the central channel (4 to 5), and a decarbonated hypocoating around it, supporting the hypothesis that their origin is derived from the calcification of cells of the root tips as a strategy to acidify the soil surrounding to absorb nutrients. Under cathodoluminescence biosparite has a different behaviour than non-biological calcite crystals. The age of the queras was similar in most horizons and their formation is independent of the age of the loess deposit. The isotopic composition of δ13C correspond mainly to CAM plants and the temperatures of precipitation calculated correspond to a Mediterranean template climate (Cerling and Quade, 1993), implying that the biocalcifications developed in warm environments. Finally, we hope to gain some more certainty of their origin and formation processes from the ongoing analyses of DNA sequencing and pollen recording.

How to cite: Alvarez, D., Torres-Guerrero, C. A., Poch, R. M., and Preusser, F.: Morphology, distribution and origin of soil biogenic carbonates “queras” presents in Loess-palaeosols of Ebro Valley, EGU General Assembly 2023, Vienna, Austria, 23–28 Apr 2023, EGU23-14081, https://doi.org/10.5194/egusphere-egu23-14081, 2023.

EGU23-14576 | ECS | Orals | SSS3.1

Geochemical analysis in the area of a medieval Cistercian manorial farm 

Martin Janovský, Jan Horák, Tomáš Klír, and Laszlo Ferenczi

A multi-element and multivariate geochemical analysis has been carried out at a medieval farm site and village settlement, which belonged to the Cistercian monastery of Plasy (in W Bohemia). The results of our geochemical survey have been evaluated in context of the LiDAR survey covering the same area and the available historic maps (Habsburg Military surveys), which helped to locate relict landscape features and land-use changes. Approximately 300 samples were taken in a grid point pattern within the courtyard of the farm, as well as randomly, in the surrounding areas, in order to identify geochemical signals related to the observable surface phenomena. We have applied different analytical techniques, including PCA, log-transformation and isometrical log-transformation, and through spatial interpolation (IDW) it was possible to link  signals of both anthropogenic and geogenic character to archaeological, cultural and land-use phenomena. The results illuminated more intensive anthropogenic impact in connection to the courtyard area, and the intravillain area of the village, and additionally helped to locate different land-use activities in the  surrounding area (agricultural and possibly industrial). In that regard, this methodology was successfully applied to trace anthropogenic impact beyond narrowly defined archaeological sites. This abstract has been reformulated on the basis of our recently published paper (Horák et al 2023).

Horák, J., Janovský, M.P., Klír, T., Malina, O., Ferenczi, L., 2023. Multivariate analysis reveals spatial variability of soil geochemical signals in the area of a medieval manorial farm. Catena 220. https://doi.org/10.1016/j.catena.2022.106726

This abstract is part of the research project: “Monastic manors and the landscape impact of Cistercian estate management: A landscape archaeological and historical ecological study on Plasy Abbey“ financed by the GAČR - Czech Science Foundation, grant No. 21-25061S.

How to cite: Janovský, M., Horák, J., Klír, T., and Ferenczi, L.: Geochemical analysis in the area of a medieval Cistercian manorial farm, EGU General Assembly 2023, Vienna, Austria, 23–28 Apr 2023, EGU23-14576, https://doi.org/10.5194/egusphere-egu23-14576, 2023.

EGU23-15478 | Posters on site | SSS3.1

Elemental and isotopic composition of silver in selected peat profiles of the Czech Republic 

Martin Mihaljevič, Aleš Vaněk, Mária Vaňková, and Vojtěch Ettler

Silver content and isotopic composition were studied in 3 selected 210Pb-dated profiles of ombrotrophic peat bogs in the Jizera Mountains, Ore Mountains and Sumava. The individual peat bogs differ in the rate of peat accumulation and intensity of immission load.

All peat bogs show a peak in the 1970s, which is related to the peak of industrial production in Europe and the associated coal burning. This peak is found at a depth of 7-12 cm in the peatlands studied.

In peat bogs in the Jizera and Ore Mountains, a smaller peak at a depth of 22-25 cm is followed by a peak in Pb concentration, probably related to Ag metallurgy in the 17th century.  This peak is not evident in the Šumava profile, where it is suppressed by elevated Ag concentrations in the underlying rocks.

The individual sources of silver are documented by isotopic composition that appears in the studied geochemical archives.

How to cite: Mihaljevič, M., Vaněk, A., Vaňková, M., and Ettler, V.: Elemental and isotopic composition of silver in selected peat profiles of the Czech Republic, EGU General Assembly 2023, Vienna, Austria, 23–28 Apr 2023, EGU23-15478, https://doi.org/10.5194/egusphere-egu23-15478, 2023.

Paleosol horizons preserved in loess-palaeosol sections (LPS) provide valuable archives of Quaternary palaeoenvironmental changes over time and spatial palaeoenvironmental gradients during the same period. Here, we present the characteristics of paleosol horizons in two LPS near the western edge of the Rhône Rift Valley in southeastern France: (1) the LPS “Baix” (total thickness: 14 m), located about 17 km north of Montélimar (44°42’36”N, 4°43’21”E), thus, in the transition zone between the presently temperate and the Mediterranean region of Europe; (2) the LPS “Collias” (total thickness: 9 m), located in the Uzès Basin, about 15 km northeast of Nîmes (43°57’11.94”N, 4°27’56.71”E), thus, in presently fully Mediterranean climate. Investigation of the paleosol horizons in the main profile at Collias was complemented by those of three smaller nearby LPS, “Collias-North_D112” (43°57’12.55”N, 4°27’55.83”E), “Collias-South_D112” (43°57’12.44”N, 4°27’53.36”E), and “Collias-North” (43°57’21.67”N, 4°28’6.99”E), in order to capture the spatial variability of the characteristics of some key horizons.

To our knowledge, no LPS have been analysed yet in such a transitional position between the presently temperate and Mediterranean climate. Primarily the LPS Baix may provide a crucial link between the rigorously analysed LPS in the presently temperate regions further north (e.g., in northern France, the Alsace region and Germany) and the LPS in the Mediterranean region (e.g., in southern France, Catalonia, Italy and Croatia), including the LPS Collias. Therefore, we aimed to decipher the paleoenvironmental record of the LPS Baix and Collias, and to identify similarities and differences between them. Optically stimulated luminescence (OSL) dating provided a chronological frame for both LPS.

The basal part of the LPS Baix starts with reddish Bt(g) horizons of a Stagnic Luvisol, representing the remains of an Eemian to Early Würmian (MIS 5) pedocomplex formed under warm and - at least temporarily - relatively moist conditions. The corresponding pedocomplex in the profile Collias-North_D112 displays an intensive red (chromic) Bt horizon overlain by several Bw horizons formed in reworked soil sediment and underlain by a massive calcrete. In the main profile at Collias, this red horizon has been entirely reworked by slope processes and has regained an angular blocky structure afterwards. Thus, it appears as a dark orange-red Bw horizon. Both, the LPS Baix and Collias include a prominent brown Bw horizon of a truncated Cambisol that developed in middle Pleniglacial (MIS 3) deposits. It is associated with large, elongated, vertically oriented calcium carbonate nodules, indicating that considerable amounts of calcium carbonate must have been leached from the former middle Pleniglacial Cambisol and accumulated in the underlying loess unit. No distinct palaeosols were observed in the Late-Pleniglacial deposits of the LPS Baix and Collias; a slightly brownish colour indicates very weak weathering (several BCk horizons) in the Late-Pleniglacial sediments of both LPS.

How to cite: Sauer, D., Pfaffner, N., Kadereit, A., Kreutzer, S., Karius, V., Kolb, T., Bertran, P., and Bosq, M.: Palaeosols in the loess section of Baix (Rhône Rift Valley, SE-France), compared to those of Collias: a unique Late-Pleistocene record of the transition zone between the presently temperate and the Mediterranean region of Europe, EGU General Assembly 2023, Vienna, Austria, 23–28 Apr 2023, EGU23-15899, https://doi.org/10.5194/egusphere-egu23-15899, 2023.

EGU23-16684 | Posters on site | SSS3.1

Using biomarker lipids to reconstruct soil fertility through time 

Cindy De Jonge, Jingjing Guo, Petter Hallberg, Marco Griepentrog, Rienk Smittenberg, Francien Peterse, Pascal Boeckx, and Gerd Dercon

Glycerol dialkyl glycerol tetraethers (GDGTs) are ubiquitous membrane-spanning lipids with a wide environmental distribution. In soils, branched GDGTs are produced by a possibly large diversity of bacteria. The relative abundance of methyl groups attached to the central alkyl chains is at the basis of the paleotemperature proxy MBT’5ME. However, MBT’5ME values in soils can also be directly influenced by pH (De Jonge et al., 2021). A second group of compounds, the isoprenoid GDGTs, are produced by archaea. They have been used only sparsely as environmental proxies in soils, although they are at the base of the marine paleotemperature proxy TEX86. In soils, a recent compilation by Yang et al. (2016) illustrates that the temperature dependency of TEX86 is sometimes present, but potentially influenced by other soil (chemistry) parameters.

In addition to temperature, other soil parameters are expected to vary with time, even on a Holocene timescale. For instance, soil mineral fertility (specifically, the concentration of exchangeable cations) will vary following climate or land use changes. As soil mineral fertility will impact the soil nutrient status for vegetation, and impact the soil capacity to store organic carbon (von Fromm et al., 2021), it is a relevant parameter to reconstruct over time. However, as soil fertility of surface soils will decrease during eroision or burial, this parameter can currently not be reconstructed quantitatively.

To investigate the potential of GDGTs as soil fertility proxies, branched and isoprenoid GDGTs were measured in soils from 5 elevation transects (Austria, Bolivia, China, Indonesia and Tanzania, n=74) that cover a large gradient in mean annual temperature (0-28 ℃), seasonality, and soil chemical parameters. Supplemented with climate (temperature and precipitation) data, we evaluate both changes in absolute concentration and relative distribution of the GDGTs. Of the chemical parameters, exchangeable calcium and exchangeable iron are shown to correlate with the absolute abundance of several branched (6 methyl brGDGTs) and isoprenoid (crenarchaeol isomer) GDGT compounds. Based on these relations we have developed ratios to quantify calcium (and summed bases) and iron (and summed metals) [r2=0.61-0.68, p<0.001] using GDGTs in soils. As GDGTs are stable on geological timescales, their presence in paleosoil sequences will thus allow us to reconstruct changes in surface soil fertility (specifically, calcium and iron) through time, even after the mineralogy of the original topsoil has changed.

Based our promising preliminary data we propose that GDGT ratios to reconstruct soil mineral fertility should be developed further using well-characterized modern soils. In addition, we look forward to testing our proxies on paleosoils by starting new collaborations.


De Jonge, C. et al. The influence of soil chemistry on branched tetraether lipids in mid- and high latitude soils: implications for brGDGT- based paleothermometry. Geochimica et Cosmochimica Acta (2021).

von Fromm, S.F., et al. Continental-scale controls on soil organic carbon across sub-Saharan Africa. SOIL 7, 305–332 (2021).

Yang, H., et al. The Response of Archaeal Tetraether Membrane Lipids in Surface Soils to Temperature: A Potential Paleothermometer in Paleosols. Geomicrobiology Journal 33, 98–109 (2016).

How to cite: De Jonge, C., Guo, J., Hallberg, P., Griepentrog, M., Smittenberg, R., Peterse, F., Boeckx, P., and Dercon, G.: Using biomarker lipids to reconstruct soil fertility through time, EGU General Assembly 2023, Vienna, Austria, 23–28 Apr 2023, EGU23-16684, https://doi.org/10.5194/egusphere-egu23-16684, 2023.

EGU23-17056 | ECS | Posters on site | SSS3.1

Studying the water supply system of the Roman villa of Pisões (Beja, Portugal) using ground-penetrating radar and geospatial methods 

Pedro Trapero, Rui Oliveira, Bento Caldeira, Jose Fernando Borges, and André Carneiro

The Roman villa of Pisões (Beja, Portugal), was part of the Lusitanian colony of Pax Iulia. This place stands out for the predominance of the water element in several structures of the villa, highlighting the balneum and the large natatio, one of the largest known in Roman Hispania. The records of the initial excavations that took place since 1967 do not allow the establishment of clear functionalities of the villa. The University of Évora, owner of the site, conceived an action plan for the requalification and enhancement of the archaeological site. One of the tasks aims to investigate using Applied Geophysics. This work analyses the landscape directly related to the villa, given that it is in the flooded area of a river, with a Roman containment dam. It is uncertain whether the water supply comes from this structure or other nearby springs. The use of ground-penetrating radar, combined with unnamed aerial vehicles, all integrated in a geographic information system, allows us to know the location of underground water connections and create a topographic model with high resolution. Considering all the information, we propose a model for the water transport inside the villa and estimate the location of the water supply.

Acknowledgment: The work was supported by the Portuguese Foundation for Science and Technology (FCT) project UIDB/04683/2020 - ICT (Institute of Earth Sciences).

How to cite: Trapero, P., Oliveira, R., Caldeira, B., Borges, J. F., and Carneiro, A.: Studying the water supply system of the Roman villa of Pisões (Beja, Portugal) using ground-penetrating radar and geospatial methods, EGU General Assembly 2023, Vienna, Austria, 23–28 Apr 2023, EGU23-17056, https://doi.org/10.5194/egusphere-egu23-17056, 2023.

EGU23-412 | ECS | Orals | BG1.2

Assessing changes in post-fire vegetation resilience in Mediterranean basin over the past 22 years 

Tiago Ermitão, Célia Gouveia, Ana Bastos, and Ana Russo

Fire is an integral component of ecological dynamics, playing an important role in biome distribution and biomass variability. Nonetheless, fires can also pose a  threat to both ecosystems and humans, by imposing severe economic and social consequences, and potentially contributing to biodiversity loss, carbon loss and soil erosion, whose effects can last from months to years.

The Mediterranean basin is a fire-prone region where vegetation is in general well adapted to fire, with several species showing resistance to fire itself or being able to recover quickly following fire events. However, as a consequence of climate change, more intense and frequent summer hot and dry conditions are expected to occur, which can promote more frequent and severe wildfires, with return periods potentially outpacing recovery times. Understanding recovery dynamics is therefore crucial to assess the impact of changing fire regimes in ecological dynamics and stability of ecosystems. 

In our study, we use the “Enhanced Vegetation Index” (EVI), remotely-sensed by MODIS sensor with a temporal span of 22 years, to evaluate vegetation dynamics before, during and following large fire seasons. We use a mono-parametric recovery model to assess recovery times in different burn scars across the Mediterranean basin, covering different fire regimes and land cover types. We find a tendency for slower recovery in areas that burned more often, which may indicate a decrease in ecosystems’ resilience in the past 22 years.

This study was performed under the frameworks of the 2021 FirEUrisk project (funded by European Union’s Horizon 2020 research and innovation programme under the Grant Agreement no. 101003890) and of the PhD MIT Portugal MPP2030-FCT programme (Grant no.22405886350).

How to cite: Ermitão, T., Gouveia, C., Bastos, A., and Russo, A.: Assessing changes in post-fire vegetation resilience in Mediterranean basin over the past 22 years, EGU General Assembly 2023, Vienna, Austria, 23–28 Apr 2023, EGU23-412, https://doi.org/10.5194/egusphere-egu23-412, 2023.

EGU23-1406 | ECS | Orals | BG1.2 | Highlight

Large-scale fire events substantially impact plant-soil water relations across ecosystem types 

Martin J. Baur, Andrew D. Friend, and Adam F. A. Pellegrini

Wildfire is a global scale ecosystem phenomenon with substantial impact on the carbon cycle, climate warming, and ecosystem resilience. Fire and the hydrological cycle are strongly interlinked, with water availability determining the amount and combustibility of fuel, and fire influencing infiltration, runoff rates and evapotranspiration. Consequently, understanding soil moisture (SM) and vegetation water content (VWC) dynamics pre- and post-fire is fundamental for predicting fire occurrence, fire severity, and ecosystem recovery. Fire can modulate SM and VWC dynamics by influencing interception of rainfall, soil porosity, plant water uptake, and runoff; however, much evidence for fire effects on the hydrological cycle is obtained at the field- to watershed-scale. Therefore, we ask the following research question: What are the effects of large-scale fire events on SM and VWC dynamics across biomes globally?

Here we use over six years of global SM, VWC and vapor pressure deficit (VPD) derived from different remote sensing datasets to investigate the effects of large-scale fires on SM and VWC dynamics. We apply a dry down framework, only analyzing consecutive observations of decreasing soil moisture, to describe post-fire response rates for SM, VWC and VPD relative to a pre-fire reference state.

We find large scale evidence that the post-fire rate of change of SM over time is more negative, indicating faster water loss. Vegetation recovery, indicated by a positive change in VWC over time, exceeds the pre-fire reference state, which suggests that post-fire recovery is predominantly faster than undisturbed seasonal vegetation growth, likely due to succession of fast-growing plant species. Furthermore, fire affects ecosystem hydrology on shorter timescales as well, reducing diurnal VWC variation over a wide range of SM and VWC conditions. Our findings confirm several trends previously only observed at smaller scales and suggest global remote sensing of SM and VWC can substantially contribute to understanding the dynamics of post-fire plant and soil water status.

How to cite: Baur, M. J., Friend, A. D., and Pellegrini, A. F. A.: Large-scale fire events substantially impact plant-soil water relations across ecosystem types, EGU General Assembly 2023, Vienna, Austria, 23–28 Apr 2023, EGU23-1406, https://doi.org/10.5194/egusphere-egu23-1406, 2023.

EGU23-1412 | Posters on site | BG1.2

PyroCbs from Australia Fires and its Impact Study Using Satellite Observations from CrIS and TROPOMI and Reanalysis Data 

Xiaozhen Xiong, Xu Liu, Wan Wu, Liqiao Lei, Qiguang Yang, Daniel Zhou, and Allen Laura

Australia’s unprecedented fire disasters at the end of 2019 to early 2020 emitted huge amounts of carbon monoxide (CO) and fire aerosol particles to the atmosphere, particularly during the Pyrocumulonimbus (pyroCb) outbreak that occurred in southeast Australia between 29 December 2019 and 4 January 2020. It was estimated that at least 18 pyroCbs were generated during this episode, and some of them injected ice, smoke, and biomass burning gases above the local tropopause.  An unprecedented abundance of H2O and CO in the stratosphere, and the displacement of background ozone (O3) and N2O from rapid ascent of air from the troposphere and lower stratosphere were found from satellite observations. Some other studies also found that the fire emissions and their long-range transport resulted in stratospheric aerosol, temperature, and O3 anomalies after the 2020 Australian bushfires and altered the Antarctic ozone and vortex, posing great impact to local air qality and climate change.

            This study will focus on the thermodynamic state of atmosphere associated with these pyroCbs, and its impact on the change of the cloud properties and trace gases during this unprecedented Australia fires, mainly based on a new single Field of View (SFOV) Sounder Atmospheric Products (SiFSAP) and TROPOMI. SiFSAP was developed by NASA using the Cross-track Infrared Sounder (CrIS) and Advanced Technology Microwave Sounder (ATMS) onboard SNPP and JPSS-1, and will soon be available to the public at NASA DAAC. Since this product has a spatial resolution of 15 km at nadir, which is better than most global weather and climate models and other current operational sounding products, a process-oriented analysis of the dynamic transport of CO and fire plumes during this unprecedented fire disasters will be made in this study.  Based on a Principal Component Radiative Transfer Model (PCRTM) and an optimized estimation retrieval algorithm, a simultaneously retrieval is made using the whole spectral information measured by CrIS,  and the derived SiFSAP include temperature, water vapor, trace gases (such as O3, CO2, CO, CH4 and N2O), cloud properties and surface properties. Use of ATMS together with CrIS allows SiFSAP to get accurate retrieval products under thick pyroCb conditions. An algorithm to detect pyroCb based on the hyperspectral infrared sounder spectrum from CrIS will be developed and verified. In addition to SiFSAP sounding products,  CO, O3, NO2 from TROPOMI and O3 from OMPS will be used. The wind fields from the NASA’s Modern-Era Retrospective Analysis for Research and Applications Version-2 (MERRA-2) and ERA5 will be used to characterize the transport, and the SiFSAP temperature and water vapor profiles within and around pyroCbs will be compared with MERRA-2 and ERA5 products.     

How to cite: Xiong, X., Liu, X., Wu, W., Lei, L., Yang, Q., Zhou, D., and Laura, A.: PyroCbs from Australia Fires and its Impact Study Using Satellite Observations from CrIS and TROPOMI and Reanalysis Data, EGU General Assembly 2023, Vienna, Austria, 23–28 Apr 2023, EGU23-1412, https://doi.org/10.5194/egusphere-egu23-1412, 2023.

EGU23-1975 | ECS | Orals | BG1.2

Drivers of spatial and temporal variability in savanna fire emission factors 

Roland Vernooij, Tom Eames, Jeremy Russel-Smith, Cameron Yates, Robin Beatty, Jay Evans, Andrew Edwards, Natasha Ribeiro, Martin wooster, Tercia Strydom, Marcos Giongo, Marco Borges, Carol Barradas, Maximo Menezes, Dave van Wees, and Guido van der Werf

Roughly half of global fire emissions originate from savannas, and emission factors (EF) are used to quantify the amount of trace gases and aerosols emitted per unit dry matter burned. It is well known that these EFs vary substantially even within a single biome but so far quantifying their dynamics has been hampered by a lack of EF measurements. Therefore, global emission inventories currently use a static averaged EF for the entire savanna biome. To increase the spatiotemporal coverage of EF measurements, we collected over 4500 EF bag measurements of CO2, CO, CH4 and N2O using an unmanned aerial system (UAS) and measured fuel parameters and fire severity proxies during 129 individual landscape fires. These measurements spanned various widespread savanna ecosystems in Africa, South America and Australia, with early and late dry season campaigns. We trained random forest (RF) regressors to estimate daily dynamic EFs for CO2, CO, CH4 and N2O at 500×500-meter resolution based on satellite and reanalysis data. The RF models reduced the difference between measured and modelled EFs by 60-85% compared to static biome averages. The introduction of EF dynamics resulted in a spatial redistribution of CO, CH4 and N2O emissions compared to the Global Fire Emissions Database version 4 (GFED4s) with higher emissions in higher rainfall savanna regions. While the impact from using dynamic EFs on the global annual emission estimates from savannas was relatively modest (+2% CO, -5% CH4 and -18% N2O), the impact on local EFs may exceed 60% under dry seasonal conditions.

How to cite: Vernooij, R., Eames, T., Russel-Smith, J., Yates, C., Beatty, R., Evans, J., Edwards, A., Ribeiro, N., wooster, M., Strydom, T., Giongo, M., Borges, M., Barradas, C., Menezes, M., van Wees, D., and van der Werf, G.: Drivers of spatial and temporal variability in savanna fire emission factors, EGU General Assembly 2023, Vienna, Austria, 23–28 Apr 2023, EGU23-1975, https://doi.org/10.5194/egusphere-egu23-1975, 2023.

EGU23-2097 | Orals | BG1.2

Linked fire activity and climate whiplash in California during the early Holocene 

Jessica Oster, Julia Homann, Cameron de Wet, Sebastian Breitenbach, and Thorsten Hoffmann

Recent wildfire activity in semi-arid regions like western North America exceeds the range of historical records. High-resolution paleoclimate archives such as stalagmites could illuminate the link between hydroclimate, vegetation change, and fire activity in pre-anthropogenic climate states beyond the timescale of existing tree-ring records. Here we present an analysis of levoglucosan, a combustion-sensitive anhydrosugar, and lignin oxidation products (LOPs) in a stalagmite from White Moon Cave in the California Coast Range in order to reconstruct fire activity and vegetation composition across the 8.2 kyr event. Elevated levoglucosan concentrations suggest increased fire activity while altered LOP compositions indicate a shift toward more woody vegetation during the event, with the shift in vegetation preceding the increase in fire activity. These changes are concurrent with increased hydroclimate volatility as shown by carbon and calcium isotope proxies. Together, these records suggest that climate whiplash (oscillations between extreme wetness and aridity) and fire activity in California, both projected to increase with anthropogenic climate change, were tightly coupled during the early Holocene.

How to cite: Oster, J., Homann, J., de Wet, C., Breitenbach, S., and Hoffmann, T.: Linked fire activity and climate whiplash in California during the early Holocene, EGU General Assembly 2023, Vienna, Austria, 23–28 Apr 2023, EGU23-2097, https://doi.org/10.5194/egusphere-egu23-2097, 2023.

EGU23-2233 | ECS | Orals | BG1.2

Fire impacts on soil carbon in a non-fire adapted alpine forest 

Melissa Torres, Caroline Poyntner, Sampriti Chaudhuri, Marc Pignitter, Hannes Schmidt, Thilo Hofmann, and Gabriel Sigmund

An increase in fire-prone conditions in non-fire adapted regions is rooted in climatic and anthropogenic changes. Such pyrogeographical shifts are observable, for example, in alpine regions. In 2021, Austria, experienced a fire larger than 100 ha for the first time in a century in the Schneeberg-Rax mountain region. In depth understanding of post-fire effects on carbon cycling at such non-fire adapted sites is still scarce. To help close this knowledge gap, post-fire changes were investigated at the abovementioned site, including soil organic matter composition and soil chemical conditions. 

Samples were taken immediately after the fire, 3 months, 6 months and 12 months thereafter from four sampling sites. Selected sites consisted of 1. a pine forest affected by a crown fire, 2. a pine and beech mixed forest affected by a surface fire, and two non-fire affected controls with similar site conditions (vegetation, slope, altitude, and exposition). Samples were analyzed for pH, carbon content, elemental composition, leachable dissolved organic carbon and trace elements, organic matter composition, and environmentally persistent free radical concentrations. 

pH increased after the fire at both sites investigated. This increase was the strongest (up to 1.5 units) immediately after the fire but was still substantial 1 year after the fire. Carbon contents decreased approximately 2fold in the crown fire affected soil compared to the control soil, but remained similar between surface fire affected soil and the respective control. However, aromaticity of bulk carbon and the leachable fraction increased in both fire-affected soils, which can be related to the formation of pyrogenic carbon during the fire. Pyrogenic carbon is a highly aromatic and recalcitrant carbon pool produced during incomplete combustion of biomass. Pyrogenic carbon can also contain substantial amounts of environmentally persistent free radicals (EPFR), which can form reactive oxygen species, which can induce oxidative stress on microbiota. Our EPFR measurements showed an increase by at least 1.5 orders of magnitude of EPFR in fire affected soils. This study suggests that changes in soil carbon cycling can be expected following fires in non-adapted alpine forests. 

How to cite: Torres, M., Poyntner, C., Chaudhuri, S., Pignitter, M., Schmidt, H., Hofmann, T., and Sigmund, G.: Fire impacts on soil carbon in a non-fire adapted alpine forest, EGU General Assembly 2023, Vienna, Austria, 23–28 Apr 2023, EGU23-2233, https://doi.org/10.5194/egusphere-egu23-2233, 2023.

EGU23-2932 | Posters on site | BG1.2

Hydrological conceptual model for reconstructing fire history from cave stalagmites 

Pauline Treble, Campbell Micheline, Andy Baker, McDonough Liza, and Kosarac Nevena

Cave stalagmites (speleothems) are highly-valued archives of environmental information owing to their preservation of climate sensitive proxies and well-defined chronologies.  Yet the reconstruction of fire history from stalagmites is a relatively unexplored approach, with some advantages over traditional fire proxy archives.  For example, stalagmites may contain annual laminae (visible or chemical) which can be exploited for seasonal to annual proxy information with precise chronologies.  Thus stalagmites have the potential to yield annually-resolved records of fire and climate that could be used to (1) better understand the fire-climate relationship, (2) fire recurrence interval information, (3) understand ecosystem resilience and (4) inform land management policy.

The development of fire proxies from stalagmites is still in its infancy. Robust interpretations of any proxy information relies on an understanding of the environmental processes that lead to the preservation of proxies in the archive.  Cave stalagmites may record fire history via dripwater, or via the cave entrance as aerosols.  The focus here is on the transportable constituents in dripwater such as solutes, colloids and suspended matter.  A fire event produces ash (a source of leachates) and can alter soil properties (hydrophobicity, pH, organic matter etc) producing temporary enrichments (or depletions) in transported constituents via dripwater.  The resulting signal may be detected in stalagmites using high-resolution methods such as laser ablation mass spectrometry, fluorescence and infrared microscopy techniques.  Cave depth is an important factor in the preservation process with the detection of a fire signal more likely to be observed in dripwater from shallow caves (e.g. 5-10 m) owing to the potential for attenuation and mixing that may occur in deeper caves (Campbell et al., 2022).  However, owing to the karstification of carbonate rocks which host caves, there commonly exists different flow types: diffuse/slow flow through the matrix, preferential/fast flow through fractures and conduits.  Fracture (or conduit) influenced flowpaths have higher permeability and enhance rapid and deep percolation of water from the surface towards the cave.  Several studies have shown that stalagmites fed by dripwater with a fracture-flow component contain higher concentrations of soil-derived trace metals and organics indicating a stronger hydrological connection with the surface.  It logically follows that fracture-influenced flowpaths are more likely to transmit proxies for fire.  Furthermore, flowpaths may be a more important factor than cave depth in some settings, e.g., Campbell et al. (2022) presented a case study of a historical fire event recorded in a stalagmite that was located ~40 m below the surface.  

Understanding the hydrological setting of a cave system including rainfall recharge and flowpaths is valuable in the interpretation of speleothem records in general.  This contribution presents a conceptual model illustrating how these factors influence the preservation of fire proxies in stalagmites and makes recommendations for ideal sample selection for fire proxy records based on cave characteristics as well as stalagmite attributes such as morphology and colour.

Campbell. M. et al., Speleothems as Archives for Palaeofire Proxies. ESS Open Archive. July 24, 2022. DOI:10.1002/essoar.10511989.1

How to cite: Treble, P., Micheline, C., Baker, A., Liza, M., and Nevena, K.: Hydrological conceptual model for reconstructing fire history from cave stalagmites, EGU General Assembly 2023, Vienna, Austria, 23–28 Apr 2023, EGU23-2932, https://doi.org/10.5194/egusphere-egu23-2932, 2023.

EGU23-3238 | ECS | Orals | BG1.2

Feeding the flames: how colonialism led to unprecedented wildfires across SE Australia 

Michela Mariani, Simon Connor, Michael-Shawn Fletcher, Simon Haberle, Janelle Stevenson, Peter Kershaw, Annika Herbert, Martin Theuerkauf, and David Bowman

The Black Summer bushfires (2019-2020) cost the Australian economy over 100 billion dollars and burnt a total of 18 million hectares. In just one season, around 20% of Australia's Eucalyptus forests burnt down and billions of animals perished. Recent catastrophic fires in Australia and North America have made scientists and policymakers question how the disruption of First Nations' burning practices has impacted fuel loads. For instance, we have learnt from modern Australian Indigenous communities, historical literature, and art works that Indigenous peoples have used cultural burning to rejuvenate patches of land and preserve open vegetation for hunting and cultural purposes. The advent of British invasion brought a change in the type of fire regimes and landscape management across much of the continent, which may have led to an increase in flammable fuels in forest settings. However, the actual degree of land-cover modification by early settlers has only been often debated in the academic literature and within management stakeholders.

The quantification of past land cover is needed to address such debates. Pollen is the key proxy to track past vegetation changes, but pollen spectra suffer from some important biases e.g. taphonomy, pollen productivity, dispersal capability. Estimating past vegetation cover from sedimentary pollen composition requires to correct for productivity and dispersal biases using empirical-based models of the pollen-vegetation relationship. Such models for quantitative vegetation reconstruction (e.g. REVEALS) have yet been mostly applied in the Northern Hemisphere in the last 15 years - here we present recent applications of this methodology from Australia. We show the quantification of land cover changes through pre- and post- British invasion on multiple records (n=51) across the southeastern Australian region. This represents the first regional application of REVEALS within the Australian continent.

We provide the first empirical evidence that the regional landscape before British invasion was a cultural landscape with limited tree cover as it was maintained by Indigenous Australians through cultural burning. Our findings suggest that the removal of Indigenous vegetation management has altered woodland fuel structure and that much of the region was predominantly open before colonial invasion. The post-colonial land modification has resonance in wildfire occurrence and management under the pressing challenges posed by climate change.

How to cite: Mariani, M., Connor, S., Fletcher, M.-S., Haberle, S., Stevenson, J., Kershaw, P., Herbert, A., Theuerkauf, M., and Bowman, D.: Feeding the flames: how colonialism led to unprecedented wildfires across SE Australia, EGU General Assembly 2023, Vienna, Austria, 23–28 Apr 2023, EGU23-3238, https://doi.org/10.5194/egusphere-egu23-3238, 2023.

EGU23-3310 | ECS | Orals | BG1.2

PEAT-FWI: Improving the Fire Weather Index for peatlands with Hydrological Modeling and L-band Microwave Observations 

Jonas Mortelmans, Anne Felsberg, Gabriëlle De Lannoy, Sander Veraverbeke, Robert Field, Niels Andela, and Michel Bechtold

The Fire Weather Index (FWI) is used worldwide to estimate the danger of wildfires. The FWI system integrates meteorological parameters and empirically combines them into several moisture codes, each representing a different fuel type. These moisture codes are then used in combination with wind speed to estimate a fire danger. Originally, the FWI system was developed for a standard jack pine forest, however, it is widely used by fire managers to assess the fire danger in different environments as well. Furthermore, it is often also used to assess the vulnerability of organic soils, such as peatlands, to ignition and depth of burn. The utility of which is often questioned.


This research aims at improving the original FWI for northern peatlands by replacing parts of the original, purely weather-based FWI system with satellite-informed model estimates of peat moisture and water level. These come from a data assimilation output combining the NASA catchment model, including the peat modules PEATCLSM, and Soil Moisture and Ocean Salinity (SMOS) L-band brightness temperature observations. The predictive power of the new, peat-specific FWI (PEAT-FWI) is evaluated against the original FWI against fire data of the global fire atlas from 2010 through 2018 over the major northern peatlands areas. For the evaluation, the fires are split up in early and late season fires, as it is hypothesized that late fires are more hydrological driven, and the predictive power of the PEAT-FWI will thus differ between the two types of fires. Our results indeed indicate that the PEAT-FWI improves the predictive capability of estimating fire risk over northern peatlands in particular for late fires. By using a receiver operating characteristics (ROC) curve to evaluate the predictive power of the FWI against a random estimate, the area under the curve increases by up to 10% for the PEAT-FWI compared to the original FWI. The recent version 7 release of the operational Soil Moisture Active Passive (SMAP) Level-4 Soil Moisture Data Assimilation Product now includes PEATCLSM, thus, the proposed PEAT-FWI is straightforward to include in operational FWI products.

How to cite: Mortelmans, J., Felsberg, A., De Lannoy, G., Veraverbeke, S., Field, R., Andela, N., and Bechtold, M.: PEAT-FWI: Improving the Fire Weather Index for peatlands with Hydrological Modeling and L-band Microwave Observations, EGU General Assembly 2023, Vienna, Austria, 23–28 Apr 2023, EGU23-3310, https://doi.org/10.5194/egusphere-egu23-3310, 2023.

EGU23-3332 | ECS | Orals | BG1.2

How changes in ignition sources influence fire probability in the Amazon and Cerrado biomes: a perspective based on frontier age 

Andreia F. S. Ribeiro, Lucas Santos, Maria R. Uribe, Rafaella A. Silvestrini, Ludmila Rattis, Marcia N. Macedo, Douglas C. Morton, James T. Randerson, Sonia I. Seneviratne, Jakob Zscheischler, and Paulo M. Brando

Agricultural expansion and ongoing climate change are rapidly altering the fire regime of natural ecosystems along the Cerrado-Amazon biome boundary. While agricultural intensification has driven a decrease in fire ignitions in some regions, agricultural expansion has increased fire usage in other landscapes for deforestation and managing pasturelands. These contrasting patterns of fire activity across different land-use frontiers limits our ability to accurately predict where and when fires may occur, particularly under the context of climate change.

To predict fire activity with land-use transitions, we modelled fire probability as a function of the age of different land-use transitions across the Amazon and Cerrado. We investigated annual land-use and associated burned areas based on the MapBiomas Collection 6.0 and MapBiomas Fire Collection 1.0 data, respectively, from 1986 to 2020. This allowed us to quantify how the time-since conversion of native vegetation (forest, savanna, and grassland) to pasture and farming influence fire occurrence. Additionally, we explored the joint impact of land-use change and climate extremes in fire activity in terms of estimated vapor pressure deficit (VPD) and maximum cumulative water deficit (MCWD), two common measures of flammability and drought impact. 

Our results confirm that transition age is a strong predictor of fire probability. They also suggest that fire probability increases (decreases) at different rates before (after) clearing in Amazon and Cerrado. The role of climate extremes in modulating burning activity associated with land-use transitions varied by biome, post-fire land use, and the size of the burned area associated with the conversion. These findings provide insight into incorporating the effect of land-use transition age on ignition probability for fire modelling in combination with climate drivers. From an operational point of view, our results aim to contribute to environmental policies capable of sustaining ecosystem integrity at the ecotone between the Amazon and Cerrado biomes.

How to cite: Ribeiro, A. F. S., Santos, L., Uribe, M. R., Silvestrini, R. A., Rattis, L., Macedo, M. N., Morton, D. C., Randerson, J. T., Seneviratne, S. I., Zscheischler, J., and Brando, P. M.: How changes in ignition sources influence fire probability in the Amazon and Cerrado biomes: a perspective based on frontier age, EGU General Assembly 2023, Vienna, Austria, 23–28 Apr 2023, EGU23-3332, https://doi.org/10.5194/egusphere-egu23-3332, 2023.

EGU23-3632 | ECS | Posters virtual | BG1.2

BPCA-derived PyC may reflect fire signals over regional scales from the western Amazon Basin fire record 

Jing Lyu, Andrew Zimmerman, Mark Bush, and Crystal McMichael

Fire alters the biogeochemical cycling of important elements, plays a role in climate change, and shapes the composition of global biological communities. Detection of past fires has long been used to reconstruct human settlement and climate records. Charcoal and phytolith abundance has been the most commonly used paleofire proxies but may only represent evidence of local fires. Chemical analyses of pyrogenic carbon (PyC) have been more recently used, but are also not without controversy. Thus far, very few intercomparisons of these proxies have been conducted. Here, the fire records contained in soil and lake sediments of Western Amazon (at lakes Ayauchi, Parker, Gentry, and surrounding regions) were determined by charcoal microscopy, chemical thermal oxidation (CTO), and benzene polycarboxylic acids (BPCA) molecular biomarkers. Charcoal represented a smaller portion of PyC and, with its patchy distribution, likely indicated local or larger regional fire events. With a median value of about 15% of organic carbon, PyC via CTO oxidation was of the highest concentrations, which suggests a larger PyC detection window and lower sensitivity of reflecting regional fire. With a median value of about 3% of organic carbon, the BPCA-derived PyC distributions bore the closest resemblance to both spatial and temporal regional fire variations, established via archeological, pollen and phytolith records, thus may be a more sensitive indicator of fire over larger regional scales. Molecular ratios of BPCA molecules in Lake Ayauchi soils indicated higher temperature fires (> 600°C) and suggested a history of more human occupation and human-caused fire in the Lake Ayauchi region compared with the Lake Gentry & Parker region. However, our findings suggest that the use of a combination of fire proxy methods provides a fuller picture of the fire history of a region than any single approach. Establishing a better understanding the differences in the information provided by various paleofire proxies will allow a more complete understanding of the drivers, history and ecological and biogeochemical effects of fire, both regionally and globally.

How to cite: Lyu, J., Zimmerman, A., Bush, M., and McMichael, C.: BPCA-derived PyC may reflect fire signals over regional scales from the western Amazon Basin fire record, EGU General Assembly 2023, Vienna, Austria, 23–28 Apr 2023, EGU23-3632, https://doi.org/10.5194/egusphere-egu23-3632, 2023.

EGU23-3695 | ECS | Orals | BG1.2

Wildfires alter nitrifier communities and increase soil emissions of NOx but not N2O in California chaparral 

Elizah Stephens, Aral Greene, Alexander Krichels, and Peter Homyak

Background:

Fires burn roughly 3% of Earth’s land surface each year and are predicted to become more frequent and severe as human-caused climate change progresses. Fires can drive ecosystem N loss by volatilizing N bound in plant biomass to the atmosphere and by leaving behind ash rich in ammonium (NH4+) and organic N that can run off when it rains. While N volatilization and runoff account for a large fraction of N loss after fires, budget imbalances suggest soil emissions of nitric oxide (NO) and nitrous oxide (N2O) may also be significant N loss pathways after fire. Identifying sources of NO and N2O is important because NO is a precursor for tropospheric O3 which causes high rates of asthma hospitalizations,and N2O is a powerful greenhouse gas with 300× the warming potential of CO2. Soil emissions of NO and N2O are largely governed by the microbial processes of nitrification and denitrification. Under aerobic conditions typical of dry soils, nitrifying organisms such as ammonia-oxidizing bacteria (AOB) and ammonia-oxidizing archaea (AOA) oxidize NH4+ to nitrate (NO3-) and release NO and N2O as byproducts. AOA and AOB process N with different efficiencies, suggesting shifts in AOA:AOB ratios may change N emissions. Specifically, AOB are dominant in soils with high NH4+and pH and produce higher NO and N2O emissions. Since such soil conditions are frequently observed after fires, we hypothesize NO and N2O emissions will increase as AOB communities become dominant. To test this, we collected soil cores from 5 plots in the Sequoia National Park, CA over a time series starting two weeks after a high severity chaparral fire. We selectively inhibited AOA and AOB communities to measure their contributions to NO and N2O emissions. We also measured the isotopic composition of N2O emissions from these soils using an LGR isotopic N2O analyzer to better understand the processes responsible for post-fire N2O production.

Results/Conclusions

One month after the fire, soil bulk emissions of NO over 72hrs were 1.5 times higher in the burned plots (101.4 ± 22.4 µg N-NO/g soil burned; 67.1 ± 19.3 µg N-NO/g soil unburned; ±SE). Bulk soil emissions of N2O over 72hrs were 7.5 times lower in burned plots compared to before the fire (0.0616 ± 0.04 ng N-N2O/g soil burned; 0.463 ± 0.19 ng N-N2O/g soil unburned; ±SE). Although the effects of fire on nitrifier communities were not significant at one month post-fire (Control: p=0.14, AOA: p=0.09, AOB: p=0.162), both AOA and AOB contributions to NO emissions increased in response to fire. Results for nitrifier contributions to N2O emissions were highly variable and non-significant with no clear trends as all N2O emissions were near zero. Further analysis over the time series may yield clearer results as microbial communities have more time to recover. Pairing these data with isotopic information (in progress) may yield one of the most in-depth understandings of post-fire NO and N2O emissions to date.

How to cite: Stephens, E., Greene, A., Krichels, A., and Homyak, P.: Wildfires alter nitrifier communities and increase soil emissions of NOx but not N2O in California chaparral, EGU General Assembly 2023, Vienna, Austria, 23–28 Apr 2023, EGU23-3695, https://doi.org/10.5194/egusphere-egu23-3695, 2023.

EGU23-4520 | ECS | Orals | BG1.2

Examining the response of different wildfire properties to changes in climate and CO2 levels at the Last Glacial Maximum 

Olivia Haas, Iain Colin Prentice, and Sandy P. Harrison

Climate change and atmospheric CO2 levels can influence wildfire properties through separate and potentially contrasting impacts on vegetation and climate. One way to examine the sensitivity of global wildfire properties to changes in climate and CO2 levels is using an out-of-sample experiment, such as the Last Glacial Maximum (LGM; 21 ka BP). Charcoal records show reduced burning at the LGM, when CO2 levels were ~ 185 ppm and the climate was cooler and drier. In this analysis, we isolated out the potential effects of LGM CO2 levels and LGM climate on the spatial patterns of global wildfire properties.

Using three statistical models, we conducted simulations of the spatial distribution of global burnt area, fire size and fire intensity under four scenarios: modern climate/modern CO2 levels, LGM climate/LGM CO2 levels, modern climate/LGM CO2 levels and LGM/ modern CO2 levels. We used outputs from three coupled ocean–atmosphere models representative of the range of simulated LGM climates. The ecophysiological effect of CO2 levels was explicitly accounted for through vegetation inputs. Gross primary productivity (GPP) and land cover were derived for the LGM and modern climate keeping either CO2 levels at 395 ppm (modern), or setting them to 185 ppm, using the P Model, a first-principles model of GPP which allows continuous acclimation of photosynthetic parameters to environmental variations, and the BIOME4 equilibrium global vegetation model.

Our results show a reduction in burnt area under LGM CO2 levels, both with modern and LGM climate inputs. In the case of the warmest of the LGM climate scenarios, this reduction was of the same magnitude as the combined LGM climate/LGM CO2 levels scenario. However, the driest and coldest LGM climate scenario produced a reduction in burnt area even with modern CO2 levels, and the largest reduction in burnt area with LGM CO2.  The reduction was primarily driven by changes in vapour pressure deficit (VPD). Fire size increased under LGM climates, due to changes in wind and VPD. The lower CO2 values at the LGM had no impact on fire size. Fire intensity increased under LGM climates and LGM CO2 levels, with both effects of similar amplitude and changes driven primarily by VPD, GPP and diurnal temperature range. 

We compared our outputs with sedimentary charcoal records from the Reading Palaeofire Database (RPD). Overall, the burnt area LGM CO2 levels/LGM climate scenario showed the greatest agreement, though depending on how cold and dry the LGM climate was, this agreement was either equal to LGM CO2 levels or LGM climate alone. These results suggest that whilst there was reduced global burning at the LGM, there may have been larger and more intense fires. They also highlight the importance of the ecophysiological effect of CO2 levels on fuels, a major control of burnt area and fire intensity regardless of climate. They point to the importance of including this effect in process-based fire models, as well as the importance of accurately estimating the amplitude of projected change for different climate variables in order to increase the reliability of future projections.

How to cite: Haas, O., Prentice, I. C., and Harrison, S. P.: Examining the response of different wildfire properties to changes in climate and CO2 levels at the Last Glacial Maximum, EGU General Assembly 2023, Vienna, Austria, 23–28 Apr 2023, EGU23-4520, https://doi.org/10.5194/egusphere-egu23-4520, 2023.

EGU23-5113 | ECS | Orals | BG1.2

Speleothem organic biomarkers trace last millennium fire history at near-annual resolution in northwestern Australia 

Elena Argiriadis, Rhawn F. Denniston, Stefania Ondei, and David Bowman

Recent developments in speleothem science are showing their potential for paleofire reconstruction through a variety of inorganic and organic proxies including trace metals (1) and the pyrogenic organic compound levoglucosan (2). Previous work by Argiriadis et al. (2019) presented a method for the analysis of trace polycyclic aromatic hydrocarbons (PAHs) and n-alkanes in stalagmites (3). These compounds reflect biogeochemical processes occurring at the land surface, in the soil, and in the cave. PAHs are primarily related to combustion of biomass while n-alkanes, with their potential for vegetation reconstruction (4), provide information on fuel availability and composition, as well as fire activity. These organic molecules are carried downward by infiltrating water and incorporated into speleothems (5), thereby creating the potential to serve as novel paleofire archives.

Using this approach, we developed a high-resolution stalagmite record of paleofire activity from cave KNI-51 in tropical northwestern Australia. This site is well suited for high resolution paleofire reconstruction as bushfire activity in this tropical savanna is some of the highest on the continent, the cave is shallow and overlain by extremely thin soils, and the stalagmites are fast-growing (1-2 mm yr-1) and precisely dated. We analyzed three stalagmites which grew continuously in different time intervals through the last millennium - KNI-51-F (CE ~1100-1620), KNI-51-G (CE ~1320-1640), and KNI-51-11 (CE ~1750-2009). Samples were drilled continuously at 1-3 mm resolution from stalagmite slabs, processed in a stainless-steel cleanroom to prevent contamination.

Despite a difference in resolution between stalagmites KNI-51-F and -G, peaks in the target compounds show good replication in the overlapping time interval of the two stalagmites, and PAH abundances in a portion of stalagmite KNI-51-11 that grew from CE 2000-2009 are well correlated with satellite-mapped fires occurring proximally to the cave.

Our results suggest an increase in the frequency of low intensity fire in the 20th century relative to much of the previous millennium. The timing of this shift is broadly coincident with the arrival of European pastoralists in the late 19th century and the subsequent displacement of Aboriginal peoples from the land. Aboriginal peoples had previously utilized “fire stick farming”, a method of prescribed, low intensity burning, that was an important influence of ecology, biomass, and fire.  Prior to the late 1800s, the period with the most frequent low intensity fire activity was the 13th century, the wettest interval of the entire record. Peak high intensity fire activity occurred during the 12th century.

Controlled burn and irrigation experiments capable of examining the transmission of pyrogenic compounds from the land surface to cave dripwater represent the next step in this analysis. Given that karst is present in many fire-prone environments, and that stalagmites can be precisely dated and grow continuously for millennia, the potential utility of a stalagmite-based paleofire proxy is high.


(1) L.K. McDonough et al., Geochim. Cosmochim. Acta. 325, 258–277 (2022).

(2) J. Homann et al., Nat. Commun., 13:7175 (2022).

(3) E. Argiriadis et al., Anal. Chem. 91, 7007–7011 (2019).

(4) R.T. Bush, F. A. McInerney, Geochim. Cosmochim. Acta. 117, 161–179 (2013).

(5) Y. Sun et al., Chemosphere. 230, 616–627 (2019).

How to cite: Argiriadis, E., Denniston, R. F., Ondei, S., and Bowman, D.: Speleothem organic biomarkers trace last millennium fire history at near-annual resolution in northwestern Australia, EGU General Assembly 2023, Vienna, Austria, 23–28 Apr 2023, EGU23-5113, https://doi.org/10.5194/egusphere-egu23-5113, 2023.

EGU23-5429 | ECS | Posters on site | BG1.2

Smoke self-lofting towards the lower stratosphere: an alternative process to pyroCb-lofting 

Kevin Ohneiser, Albert Ansmann, Jonas Witthuhn, Hartwig Deneke, Alexandra Chudnovsky, Gregor Walter, and Fabian Senf

Wildfire smoke is known as a highly absorptive aerosol type in the shortwave wavelength range. The absorption of Sun light by optically thick smoke layers results in heating of the ambient air. This heating is translated into self-lofting of the smoke up to more than 1 km in altitude per day. The main goal is to demonstrate that radiative heating of intense smoke plumes is capable of lofting them from the lower and middle free troposphere (injection heights) up to the tropopause without the need of pyrocumulonimbus (pyroCb) convection. The further subsequent ascent within the lower stratosphere (caused by self-lofting) is already well documented in the literature. Simulations of heating rates which are then converted into lofting rates are conducted by using the ECRAD (European Centre for Medium-Range Weather Forecasts Radiation) scheme. As input parameters thermodynamic profiles from CAMS (Copernicus Atmosphere Monitoring Service) reanalysis data, aerosol profiles from ground-based lidar observations, radiosonde potential temperature profiles, CALIOP (Cloud Aerosol Lidar with Orthogonal Polarization) aerosol measurements, and MODIS (Moderate Resolution Imaging Spectroradiometer) aerosol optical depth retrievals were used. 


The sensitivity analysis revealed that the lofting rate strongly depends on aerosol optical thickness (AOT), layer thickness, layer height, and black carbon (BC) fraction. We also looked at the influence of different meteorological parameters such as cloudiness, relative humidity, and potential temperature gradient. Lofting processes in the stratosphere observed with CALIOP after major pyroCb events (Canadian fires, 2017, Australian fires 2019-2020) are compared with simulations to demonstrate the applicability of our self-lofting model. We analyzed long-term CALIOP observations of Siberian smoke layers and plumes evolving in the troposphere and UTLS (upper troposphere and lower stratosphere) region over Siberia and the adjacent Arctic during the summer season of 2019 and found several indications (fingerprints) that self-lofting contributed to the vertical transport of smoke. We hypothesize that the formation of a near-tropopause aerosol layer, observed with CALIOP over several months, was the result of self-lofting processes because this is in line with the self-lofting simulations. 


We will show a detailed analysis of tropospheric and stratospheric smoke lofting rates based on simulations and observations.

How to cite: Ohneiser, K., Ansmann, A., Witthuhn, J., Deneke, H., Chudnovsky, A., Walter, G., and Senf, F.: Smoke self-lofting towards the lower stratosphere: an alternative process to pyroCb-lofting, EGU General Assembly 2023, Vienna, Austria, 23–28 Apr 2023, EGU23-5429, https://doi.org/10.5194/egusphere-egu23-5429, 2023.

EGU23-5803 | ECS | Orals | BG1.2 | Highlight

Which is the role of post-fire SOC erosion in the C cycle? 

Antonio Girona-García, Cristina Santín, Diana Vieira, and Stefan Doerr

Wildfires burn on average 448 million hectares globally every year, releasing around 2.2 Pg of carbon (C) into the atmosphere [1, 2]. The net effect of wildfires in the C cycle goes, however, beyond emissions and involves many other interacting processes. Among those, there is a significant knowledge gap on the role of post-fire soil organic carbon (SOC) erosion as a carbon sink mechanism.

Post-fire erosive response is greatly enhanced by the direct and indirect effects of wildfires on soil and vegetation, such as the loss of protective cover and soil structure or the development of a water-repellent layer [3]. In addition, biomass and soil organic matter undergo quantitative and qualitative changes during wildfires, such as the formation of pyrogenic carbon, highly resistant to degradation. The resulting PyC and non-PyC carbon fractions, with contrasting physical properties and chemical stability, will be differently redistributed and mineralized during the erosion process [4]. Ultimately, post-fire SOC erosion will act as a carbon sink when the post-fire burial and stabilization of eroded carbon, together with the recovery of net primary production and soil organic carbon content, exceed the SOC losses during its post-fire transport [5]. All these processes have been scarcely investigated and poorly quantified to the date. In this presentation, we will provide new insights into this potential C sink mechanism, critically reviewing the state of the art and highlighting key research gaps.

References

[1] Boschetti et al., 2021. Global Wildfire Information System (GWIS). https://gwis.jrc.ec.europa.eu/apps/country.profile/downloads

[2] Randerson et al., 2012. J Geophys Res. https://doi.org/10.1029/2012JG002128

[3] Shakesby & Doerr, 2006. Earth-Sci Revs. https://doi.org/10.1016/j.earscirev.2005.10.006

[4] Doetterl et al., 2016. Earth-Sci Revs. https://doi.org/10.1016/j.earscirev.2015.12.005

[5] Santín et al., 2015. Glob Change Biol. https://doi.org/10.1111/gcb.12800

How to cite: Girona-García, A., Santín, C., Vieira, D., and Doerr, S.: Which is the role of post-fire SOC erosion in the C cycle?, EGU General Assembly 2023, Vienna, Austria, 23–28 Apr 2023, EGU23-5803, https://doi.org/10.5194/egusphere-egu23-5803, 2023.

EGU23-6083 | ECS | Posters on site | BG1.2

Representing Northern High Latitude Peat Fires in the JULES-INFERNO Fire Model 

Katie Blackford, Apostolos Voulgarakis, Colin Prentice, Chantelle Burton, and Matthew Kasoar

Anthropogenic activities and climate change are increasing the vulnerability of carbon rich peatlands to wildfires. Peat fires, which are dominated by smouldering combustion, are some of the largest and most persistent wildfires on Earth. Across the northern high latitudes, peat fires have the potential to release vast amounts of long term stored carbon and other greenhouse gases and aerosols. Consequently, peat fires can have huge implications on the carbon cycle and result in a positive feedback effect on the climate system. Peat fires also impact air quality and can lead to haze events, with major impacts on human health. Despite the importance of peat fires they are currently not represented in most fire models, leading to large underestimations of burnt area and carbon emissions in the high latitudes. Here, I present a representation of peat fires in the JULES-INFERNO fire model (INFERNO-peat). INFERNO-peat improves the representation of burnt area across the high latitudes, with notable areas of improvement in Canada and Siberia. INFERNO-peat also highlights a large amount of interannual variability in carbon emissions from peat fires. The inclusion of peat fires into JULES-INFERNO demonstrates the importance of representing peat fires in models, and not doing so may heavily restrict our ability to model present and future fires and their impacts across the northern high latitudes.

How to cite: Blackford, K., Voulgarakis, A., Prentice, C., Burton, C., and Kasoar, M.: Representing Northern High Latitude Peat Fires in the JULES-INFERNO Fire Model, EGU General Assembly 2023, Vienna, Austria, 23–28 Apr 2023, EGU23-6083, https://doi.org/10.5194/egusphere-egu23-6083, 2023.

EGU23-6184 | ECS | Orals | BG1.2 | Highlight

A global model for estimating fuel consumption and fire carbon emissions at 500-m spatial resolution 

Dave van Wees, Guido R. van der Werf, James T. Randerson, Brendan M. Rogers, Yang Chen, Sander Veraverbeke, Louis Giglio, and Douglas C. Morton

Fires constitute a key source of emissions of greenhouse gasses and aerosols. Fire emissions can be quantified using models, and these estimates are influenced by the spatial resolution of the model and its input data. Here we present a novel global model based on the Global Fire Emissions Database (GFED) modelling framework for the estimation of fuel consumption and fire carbon emissions at a spatial resolution of 500 m. The model was primarily based on observation-derived data products from MODIS, reanalysis data for meteorology, and an updated field measurement synthesis database for constraining fuel load and fuel consumption. Compared to coarser models, typically with a resolution of 0.25°, the 500-m spatial resolution allowed for increased spatially resolved emissions and a better representation of local-scale variability in fire types. The model includes a separate module for the calculation of emissions from fire-related forest loss, using 30-m Landsat-based forest loss data. We estimated annual carbon emissions of 2.1 Pg C yr-1, of which around 24% was from fire-related forest loss. Fuel consumption was on average a factor 10 higher in case of fire-related forest loss compared to fires without forest loss. Up to now, emission estimates from our new model are based on MODIS burned area with a 500-m resolution, leading to global emissions similar to GFED4s. However, novel high-resolution burned area datasets based on the Landsat and Sentinel-2 missions reveal substantially more global burned area. Our 500-m global fire model provides a suitable framework for converting these burned area products to emissions, with the prospect of substantially higher global emissions.

How to cite: van Wees, D., van der Werf, G. R., Randerson, J. T., Rogers, B. M., Chen, Y., Veraverbeke, S., Giglio, L., and Morton, D. C.: A global model for estimating fuel consumption and fire carbon emissions at 500-m spatial resolution, EGU General Assembly 2023, Vienna, Austria, 23–28 Apr 2023, EGU23-6184, https://doi.org/10.5194/egusphere-egu23-6184, 2023.

EGU23-6286 | ECS | Posters on site | BG1.2

Hysteresis of fire-prone weather to CO2 forcing 

Jin-Soo Kim, Hyo-Jeong Kim, and Soon-Il An

CO2 emission from biomass burning (BB) is one of the essential elements of the global carbon budget, with its annual mean of about 2.0 PgC/year equivalent to 15 % of 2020 fossil fuel emissions. However, while a global increase in fire-prone weather is projected alongside climate change, a quantitative understanding of how much carbon will further be released due to increased fires is highly limited, which could result in large uncertainty in meeting the net zero target. Thus, in this study, we evaluate future changes in fire-prone weather based on the fire weather index (FWI) and estimate the potential fire-induced emissions on a global scale that could be induced by climate change. To this end, 28 ensembles of idealized CO2 reduction simulations with the CESM climate model were analyzed. The results show that when CO2 in the atmosphere is doubled (2xCO2) from 367 ppm by 1 % per year, the additional emission due to increased fire weather could reach about 1.7 PgC/year, which corresponds to 82% of the current BB emission. Moreover, even if the atmospheric CO2 concentration further peaks and is reduced back to 2xCO2, the lagged response of the climate system can cause fire-prone weather and its resulting C emissions to remain higher than its previous state in many countries. These results highlight that more focus is required on the climate-fire-carbon feedback not only for more accurate future predictions but also for achieving net zero emissions in each country through a proper wildfire management strategy.

How to cite: Kim, J.-S., Kim, H.-J., and An, S.-I.: Hysteresis of fire-prone weather to CO2 forcing, EGU General Assembly 2023, Vienna, Austria, 23–28 Apr 2023, EGU23-6286, https://doi.org/10.5194/egusphere-egu23-6286, 2023.

EGU23-6777 | ECS | Posters on site | BG1.2

Characterisation of large-scale urban fire emissions by inverse modelling 

Emilie Launay, Virginie Hergault, Marc Bocquet, Joffrey Dumont Le Brazidec, and Yelva Roustan

Large-scale fires such as warehouse fires that have occurred in recent years or dramatic accidents like the Paris Notre-Dame Cathedral fire in 2019 have stressed the need to develop means of assessing the toxicity risks to the population and the environment of smoke plumes. A key challenge is to quickly provide the authorities with information on the areas impacted by the plume and the pollutant concentration levels to which the population is likely to be or to have been exposed. The Laboratoire Central de la Préfecture de Police (LCPP) aims to deploy a number of devices for measuring pollutants and tracers of smoke combustion during a fire. Subsequently, the application of an atmospheric dispersion model within the framework of a data assimilation approach should provide a source characterisation and a finer estimate of the concentration levels at points of interest.

To characterise the source, noticeably the released mass of pollutants and the emission height linked to a plume rise, an inverse problem method has been implemented. It is based on a Bayesian Markov Chain Monte Carlo (MCMC) technique meant to quantify the uncertainties associated with the emission estimation. Since the emission height strongly influences the atmospheric dispersion in the vicinity of the source, two approaches are used to estimate it. The first one consists in finding the emission time rate for each considered height and the second one consists in focussing on a single emission height and its associated emission time rate using a discrete distribution to describe the vertical profile. We use the Lagrangian Parallel Micro Swift Spray (PMSS) model developed by AriaTechnologies fed with meteorological fields provided by Météo-France to represent the atmospheric dispersion of smoke.

Our inverse method is applied to a large warehouse fire that occurred in Aubervilliers near Paris in 2021 using real observations. Abnormal concentrations of particulate matter were recorded, with a peak at 160 µg.m-3, located in the centre of Paris about 6 km from the source. They were collected by the LCPP and AirParif, the local air quality agency, and are used to retrieve the emission with a quantification of uncertainties and a sensitivity analysis of model error. The resulting emission height of the source, mainly between 200 and 300 m, coincides with the terrain observation for an emission rate of less than 1000 kg/h throughout the duration of the fire. A sensitivity analysis to the initial approximation of the source (the prior) shows its importance. It suggests to improve our method by incorporating the statistical parameters of the observation error into the MCMC method.

How to cite: Launay, E., Hergault, V., Bocquet, M., Dumont Le Brazidec, J., and Roustan, Y.: Characterisation of large-scale urban fire emissions by inverse modelling, EGU General Assembly 2023, Vienna, Austria, 23–28 Apr 2023, EGU23-6777, https://doi.org/10.5194/egusphere-egu23-6777, 2023.

EGU23-6797 | ECS | Posters on site | BG1.2

Variability of CO and aerosols plumes from wildfires in the Northern Hemisphere in 2008-2022 using satellite observations. 

Antoine Ehret, Solène Turquety, Maya George, and Cathy Clerbaux

Wildfires are responsible for significant emissions of greenhouse gases, pollutants and aerosols. In addition to being a large source of carbon monoxide (CO) and carbon dioxide (CO2), they alone account for more than half of black carbon emissions and the majority of primary organic aerosol emissions.

Despite proactive fire suppression policies in the Northern Hemisphere (NH), allowing a decrease in fires, especially in Europe, an increase in the number of extreme fires can be noted in recent years. In the NH, this increase is mainly in Western America and boreal regions. The pollution plumes produced during extreme fires can be transported over thousands of kilometers, impacting background pollutant levels on a hemispheric scale. Thus, variability in fire intensity may explain a large part of the spatial and temporal variability of many atmospheric pollutants. For longer lived pollutants, wildfires may significantly increase background levels.

In this study, the link between extreme fire weather (high temperature), large fires and background pollution in the Northern Hemisphere is analyzed based on satellite observations. The impact of large wildfires on background levels of CO and aerosols above Europe is studied more specifically. We present the variability of fire frequency in the NH, their intensity and the related emissions using 20 years (2003-2022) of MODIS fire observations analyzed with the APIFLAME model. The link between large events and fire weather is studied using the ERA5 reanalyses and the Canadian Fire Weather Index (FWI). The related impact on the variability of total CO and AOD in the NH is analyzed using 15 years (2008-2022) of satellite observations from IASI/Metop and MODIS/Terra and Aqua, respectively. Finally, plume retro trajectories are computed in order to assess the contribution of the different geographical areas of the NH on the CO and AOD variability.

How to cite: Ehret, A., Turquety, S., George, M., and Clerbaux, C.: Variability of CO and aerosols plumes from wildfires in the Northern Hemisphere in 2008-2022 using satellite observations., EGU General Assembly 2023, Vienna, Austria, 23–28 Apr 2023, EGU23-6797, https://doi.org/10.5194/egusphere-egu23-6797, 2023.

EGU23-7379 | Orals | BG1.2 | Highlight

Changes in global fire regimes under idealized overshoot scenarios 

Lars Nieradzik, Hanna Lee, Paul Miller, Jörg Schwinger, and David Wårlind

Within the framework of the project IMPOSE (Emit now, mitigate later? IMPlications of temperature OverShoots for the Earth system) six idealized emission-overshoot simulations have been performed with the Earth System Model NorESM2-LM2 and used as forcing for the 2nd generation dynamic global vegetation model LPJ-GUESS with its fire-model SIMFIRE-BLAZE to investigate the impact of different CO2 overshoots on global wildfire regimes.

The simulations describe a set of scenarios with high, medium, and low accumulative CO2 emissions and each of which has a short (immediate) and a long (100 years) peak of accumulative CO2 emissions before declining towards a baseline simulation of 1500 PgC accumulatively emitted within the first 100 years.

The results show that the height of the overshoot has an impact on global fire regimes while its duration does not seem to play a significant role 200 years after peak CO2. Overall, we can see that changes in vegetation composition following the temperature anomaly are the main driver for changes in global wildfire frequency. While in the low overshoot scenarios burnt area has almost converged towards the baseline simulation, the extremest scenarios show the lowest burnt area at the end of the simulation period, indicating that vegetation changes, especially in low latitudes, have been most significant and/or are still ongoing.

How to cite: Nieradzik, L., Lee, H., Miller, P., Schwinger, J., and Wårlind, D.: Changes in global fire regimes under idealized overshoot scenarios, EGU General Assembly 2023, Vienna, Austria, 23–28 Apr 2023, EGU23-7379, https://doi.org/10.5194/egusphere-egu23-7379, 2023.

EGU23-7449 | ECS | Orals | BG1.2

The role of vegetation in UK upland wildfires: Risk, Resilience, and Remote Sensing 

Kirsten Lees and Tim Lenton

Wildfires are becoming a growing concern in the UK, as climate change increases the occurrence and persistence of periods of hot, dry weather. Vegetation type and management play an important but contested role in UK fire risk and resilience, and questions remain over the best ways to prevent large fires developing. Remote sensing can provide vital data on fire size, severity, and recovery times, but method effectiveness is dependent on understanding specific ecosystems. This research uses ground validation of four wildfires in the UK Peak District National Park to deliver insights which improve interpretation of satellite data in wildfire monitoring. These insights are then applied to a three-year remote sensing database of large wildfires in England and Wales, to give novel results on the links between vegetation type and management, and fire size and severity. Ecosystem resilience and recovery is further explored through analysing the vegetation growth post-fire at three of the four Peak District study sites. This project therefore develops and validates remote sensing methodology in wildfire research by combining field data with satellite imagery to yield new understandings of the relationships between vegetation and fire. 

How to cite: Lees, K. and Lenton, T.: The role of vegetation in UK upland wildfires: Risk, Resilience, and Remote Sensing, EGU General Assembly 2023, Vienna, Austria, 23–28 Apr 2023, EGU23-7449, https://doi.org/10.5194/egusphere-egu23-7449, 2023.

EGU23-7853 | Posters on site | BG1.2

Current Operational Implementation of the Canadian Forest Fire Weather Index System in the Republic of Ireland 

Klara Finkele, Padraig Flattery, Ciaran Nugent, and Paul Downes

Since 2006 the Canadian Forest Fire Weather Index System (FWI) has been employed operationally at Met Éireann to predict the risk of forest fires in Ireland (Walsh, S, 2006). Around 11% or 770,000 ha of the total land area of Ireland is afforested, but there are also large areas of open mountain and peatlands covered in grasses, dwarf-shrub and larger woody shrub type vegetation which can provide fuel for spring wildfires under suitable conditions. Following winter, vegetation can be dead or have a very low live moisture content, and the flammability of this vegetation can be readily influenced by prevailing weather, especially following prolonged dry periods.

The Department of Agriculture, Food and Marine is the Forest Protection authority in Ireland responsible for issuing Fire Danger Notices. These notices improve preparedness for fire responses and are based on information provided by Met Éireann who calculate the FWI and FWI components using observation data at synoptic stations, and the predicted FWI for the next five days ahead based on numerical weather prediction data.

The FWI is determined based on the types of forest fuel and how quickly they dry out/get rewetted, and components of fire behaviour. The FWI represents the fire intensity as the rate of energy per unit length of fire front (kW/m). The components which provide the most accurate indication of risk under Irish conditions are the Fine Fuel Moisture Code and Initial Spread Index, based on the fuels involved and ignition patterns observed to date. Since 2022 Met Eireann provide the FWI as well as the individual components Fine Fuel Moisture Content and Initial Spread Index via the public website for synoptic stations. These indices are based on observations and a seven-day forecast into the future using ECMWF predictions. This allows all county councils responsible for wildfire preparedness to access this information swiftly and directly.

Met Éireann also use the ANYWHERE multi-hazard warning tool which allows for visualisation of multiple fire-related risk factors and warning indices to be viewed simultaneously. The ANYWHERE system, in combination with our station-based forecast and antecedent conditions, provide fire managers and response teams with excellent information with which to make decisions. 

How to cite: Finkele, K., Flattery, P., Nugent, C., and Downes, P.: Current Operational Implementation of the Canadian Forest Fire Weather Index System in the Republic of Ireland, EGU General Assembly 2023, Vienna, Austria, 23–28 Apr 2023, EGU23-7853, https://doi.org/10.5194/egusphere-egu23-7853, 2023.

EGU23-7913 | ECS | Posters on site | BG1.2

Fate of Fire altered Organic Carbon in the arctic river-to-ocean continuum: Resolving Mackenzie River Black Carbon in the Beaufort Sea 

Linn G. Speidel, Lisa Bröder, Julie Lattaud, Negar Haghipour, Timothy I. Eglinton, and Alysha I. Coppola

Keywords: Black carbon, Dissolved organic carbon, BPCAs, Mackenzie River, Beaufort Sea, Climate change

Climate change is amplified in the arctic and boreal regions. This causes higher average temperatures and less precipitation in the summer months and is resulting in longer wildfire seasons, severity, frequency and extent. This increases the relies of carbon into the atmosphere as greenhouse gases and aerosols, amplifying climate change even further. Black carbon (BC) is a fraction of organic carbon, resulting from the incomplete combustion of biomass and fossil fuels. BC may be inaccessible for biodegradation, because of its highly condensed aromatic molecular structure and therefore stores carbon on long timescales on land and in the ocean. BC is produced on land, but is transported as dissolved BC (DBC) by the rivers to the oceans, where it cycles on millennial timescales, sequestering BC. Thus, it is important to understand the significance of BC in the context of increased fires in this vulnerable region in the face of climate change.

The Mackenzie River is a major source of terrestrial dissolved organic carbon (DOC) and the largest source of sediments to the Arctic Ocean. Here, we resolve the cycling of riverine DBC from the Mackenzie River to its fate in the Beaufort Sea, and the influence of mixing with Pacific water masses entering from the Chukchi Sea. We present DBC concentration data in ocean water, which was collected on two cruises in the Beaufort Sea in 2021 and 2022 covering the outflow of the Mackenzie River.

For DBC concentrations, we digested solid phase extracts of DOC with nitric acid to oxidize BC molecules into benzenepolycarboxylic acids (BPCAs), which were then quantified on High Performance Liquid Chromatography (HPLC). We compare the concentrations of the DBC and DOC to trace the mixing of DBC river outflow with the ocean water. Since DBC originates on land and is relatively stable to biodegradation we can resolve the pathways of DBC from the Mackenzie River to the Arctic Ocean.


How to cite: Speidel, L. G., Bröder, L., Lattaud, J., Haghipour, N., Eglinton, T. I., and Coppola, A. I.: Fate of Fire altered Organic Carbon in the arctic river-to-ocean continuum: Resolving Mackenzie River Black Carbon in the Beaufort Sea, EGU General Assembly 2023, Vienna, Austria, 23–28 Apr 2023, EGU23-7913, https://doi.org/10.5194/egusphere-egu23-7913, 2023.

EGU23-7937 | ECS | Orals | BG1.2

A New Method for Nowcasting Wildfire Risk 

Theodore Keeping, Sandy Harrison, and Iain Prentice

Wildfire risk prediction relies on the often-heuristic assessment of diverse fire potential indices, fuel maps, fire weather indices and prior fire activity data. Here we present a model nowcasting daily wildfire genesis probability and expected wildfire sizes in the contiguous US.

Predictors were selected and developed to account for climate, vegetation, topographic and human effects on wildfire genesis. Climate factors are represented by multiple fuel wetting and drying processes at daily to seasonal-scale antecedences, snowpack, and wind. We use GPP to predict fuel mass and recent growth, and dominant vegetation type. Human factors include population, landscape accessibility and ignition sources such as powerlines.

The first stage of the model predicts wildfire genesis probability as a zero-inflated process with an explicit probability of fire preclusion, whilst the second stage models fire sizes according to a generalised extreme value distribution. Nonlinear effects are accounted for via global optimisation for the domain for which each variable drives changes in fire genesis behaviour and the appropriate variable transform.

The model has good predictive and explanatory power, as shown by various performance metrics and the meaningful nonlinear relationships identified in the optimisation process. We show that this method can resolve seasonal wildfire risk dynamics well over smaller ecoregions than the observational record permits, allowing us to quantify the extent to which fire risk is determined by seasonal-scale versus daily-scale effects.

How to cite: Keeping, T., Harrison, S., and Prentice, I.: A New Method for Nowcasting Wildfire Risk, EGU General Assembly 2023, Vienna, Austria, 23–28 Apr 2023, EGU23-7937, https://doi.org/10.5194/egusphere-egu23-7937, 2023.

EGU23-8075 | Posters on site | BG1.2

Impact of socio-economic factors in burnt area for future climate scenarios 

João Teixeira, Chantelle Burton, Douglas I. Kelley, Gerd Folberth, Fiona M. O'Connor, Richard Betts, and Apostolos Voulgarakis

Fire processes are a complex component of the Earth System processes and their full representation has proven to be difficult to represent Earth System Models (ESM). Because of this, these processes are often simplified in fire enabled ESMs, for instance ignitions are usually modelled to increase at low population densities up to a threshold, and reduce thereafter, as suppression effects become dominant with the increase of population density. However, socio-economic, and cultural factors can play a significant role in shaping the behaviour of fire ignitions. This study aims to address this by implementing a socio-economic factor in the fire ignition and suppression parametrisation in the INteractive Fire and Emission algoRithm for Natural envirOnments (INFERNO) based on the Human Development Index (HDI). The inclusion of this factor reduced a large long-standing positive bias found in regions of Temperate North America, Central America, Europe, and Southern Hemisphere South America. This change also leads to improvements in the model representation of fire weather and anthropogenic drivers in tropical regions, by reducing the influence of population density changes. Therefore, this framework can be used to improve understanding of the anthropogenic impacts of fire in future scenarios based on different Shared Socioeconomic Pathways.

How to cite: Teixeira, J., Burton, C., Kelley, D. I., Folberth, G., O'Connor, F. M., Betts, R., and Voulgarakis, A.: Impact of socio-economic factors in burnt area for future climate scenarios, EGU General Assembly 2023, Vienna, Austria, 23–28 Apr 2023, EGU23-8075, https://doi.org/10.5194/egusphere-egu23-8075, 2023.

EGU23-9361 | ECS | Posters on site | BG1.2

Investigating Emergency Room Visits for Cardiorespiratory Diseases in Alberta and Ontario, Canada in Relation to Wildfires 

Victoria Flood, Kimberly Strong, Rebecca Buchholz, Sheryl Magzamen, and Grace Kuiper

Carbon monoxide (CO) is released during biomass burning events, resulting in decreased air quality and leading to the formation of climate forcing pollutants. An increase in wildfires has resulted in a change to the CO seasonal cycle of the North American Pacific Northwest, when comparing 2012-2018 to 2002-2011. This trend was reported using data from the Measurements of Pollution in the Troposphere (MOPITT) instrument on NASA’s Terra satellite. Similarly, an increase in summertime CO values was identified with the Fourier Transform Infrared (FTIR) spectrometer at the University of Toronto Atmospheric Observatory (TAO), over the same time period. Studies have shown correlations between wildfire smoke exposure and healthcare utilization for cardiovascular and respiratory conditions. Monthly counts of Emergency Department admissions for cardiovascular and respiratory diseases for Alberta and Ontario are investigated in relation to wildfire events in Canada and the USA. MOPITT and TAO FTIR CO columns, the Moderate Resolution Imaging Spectroradiometer (MODIS) burned area product, and provincial burned areas from Natural Resources Canada are assessed to estimate wildfire smoke exposure in the study region. This work aims to evaluate if CO can be used as a complementary tracer for health impacts from wildfire smoke exposure. 


How to cite: Flood, V., Strong, K., Buchholz, R., Magzamen, S., and Kuiper, G.: Investigating Emergency Room Visits for Cardiorespiratory Diseases in Alberta and Ontario, Canada in Relation to Wildfires, EGU General Assembly 2023, Vienna, Austria, 23–28 Apr 2023, EGU23-9361, https://doi.org/10.5194/egusphere-egu23-9361, 2023.

EGU23-9575 | Orals | BG1.2

FRYv2.0 : a global fire patch morphology database from FireCCI51 and MCD64A1 

Florent Mouillot, Wentao Chen, Manuel Campagnolo, and Philippe Ciais

The assessment of global burned area from remote sensing is an essential climate variable driving land surface GHG emissions and energy/water budget. Gridded 0.25° or 0.5° monthly burned area have been largely used for biosphere/atmosphere interactions modelling, while recent fire/weather analysis or model developments increasingly request fire events, defined as a fire patch with intrinsic fire spread properties. Pixel level information, the finest resolution from global burned area, defined by their burn date, can be aggregated within a spatio-temporal threshold and delineate these fire events. Uncertainties in burn date, the coarse resolution of pixel resolution, multiple ignition points, or the specified values in spatio-temporal thresholds can however lead to various final fire event delineation. Currently, three major global fire event database exist (FRY, Fire Atlas, GlobFire), mostly derived from MCD64A1 pixel level 500m-resolution burned area. We propose here a new version of FRY, based on MCD64A1 and FireCCI51 at 250m, with an updated pixel aggregation method allowing for single ignition fire patches. Fire patch morphology indicators as elongation, direction, complexity have been conserved from v1.0, with additional information as ignition points from minimum burn date from burned area and more timely-accurate hotspots (VIIRS and MCD14ML), rate of spread, fire Radiative power and burn severity, as well as fraction of land cover affected, based on user requirements. The dataset is delivered as a yearly shapefile, with an attribute table referencing all information on ignition, spread and final shape. Global comparison of major information from FRYv2.0 (fire size distribution, fire number, ROS) will illustrate the effects of increasing spatial resolution and better timing from hotspots provided in this new version, freely available for the scientific community for the period 2001-2020.

How to cite: Mouillot, F., Chen, W., Campagnolo, M., and Ciais, P.: FRYv2.0 : a global fire patch morphology database from FireCCI51 and MCD64A1, EGU General Assembly 2023, Vienna, Austria, 23–28 Apr 2023, EGU23-9575, https://doi.org/10.5194/egusphere-egu23-9575, 2023.

EGU23-9791 | Orals | BG1.2 | Highlight

Lightning in a changing climate and its impacts on fire area burned 

Cynthia Whaley, Courtney Schumacher, Montana Etten-Bohm, Vivek Arora, David Plummer, Jason Cole, Michael Lazare, and Ayodeji Akingunola

Lightning is an important atmospheric process for igniting forest fires – often in remote locations where they are not easily suppressed – which results in potentially large emissions of many pollutants and short-lived climate forcers. Lightning also generates reactive nitrogen, resulting in the production of tropospheric ozone, the third most important greenhouse gas. Furthermore, the changing climate is expected to change the frequency and location of lightning. As such, lightning is an important component of climate models. The Canadian Atmospheric Model, CanAM, is one such climate model that did not contain an 'online' lightning parameterization. Fire ignition in CanAM was done via an unchanging climatological lightning input. In this study, we have added a new logistical regression lightning model (Etten-Bohm et al, 2021) into CanAM, creating the capacity for future lightning predictions with CanAM under different climate scenarios. The modelled lightning and fire area burned were evaluated against measurements in a historical period with good results. Then we simulate lightning and fire area burned in a future climate scenario in order to provide an estimate on how lightning and its impacts will change in the future. This study also presents the first time that CanAM’s land fire model was used online with its atmosphere to fully simulate fires in the global earth system.

Reference:

Etten-Bohm, M., J. Yang, C. Schumacher, and M. Jun : Evaluating the relationship between lightning and the large-scale environment and its use for lightning prediction in global climate models, JGR-atmospheres, 126, e2020JD033990, 2021.

How to cite: Whaley, C., Schumacher, C., Etten-Bohm, M., Arora, V., Plummer, D., Cole, J., Lazare, M., and Akingunola, A.: Lightning in a changing climate and its impacts on fire area burned, EGU General Assembly 2023, Vienna, Austria, 23–28 Apr 2023, EGU23-9791, https://doi.org/10.5194/egusphere-egu23-9791, 2023.

EGU23-10336 | Posters on site | BG1.2

A hybrid deep learning framework for predicting point-level Alaskan fires 

Hocheol Seo and Yeonjoo Kim

Fires in high latitudes are becoming more critical in terrestrial ecosystem modeling. With climate warming and dry weather condition, the fires have spread more, and widespread burning has severely damaged the ecosystem. As the fire dynamics cannot be described with the mass or energy balance equations, the fire models have been developed with different input variables, linked with different vegetation models, and widely coupled with the earth system models (ESMs) or land surface models (LSMs) with different complexities of parameterization. Here, we designed a new approach using hybrid deep learning [Long Short-Term Memory (LSTM) - Artificial Neural Network (ANN)] for predicting Alaskan natural fires and aimed to understand the impacts of fires with from the NCAR community land model 5 – biogeochemistry (CLM5-BGC). This study was conducted based on fire information provided by Alaska Interagency Coordination Center (AICC), which provides the data for each fire point, start date, end date, and total burned area from 2016-2020. As the fire duration was identified as the most important in predicting the burned area, we first trained the LSTM for predicting fire duration (i.e., fire ignition and fire persistence period) with ERA5 atmospheric forcings. Also, we trained ANN to predict the burned area with both ERA5 atmospheric forcings and fire duration. Then, we combined two models (LSTM and ANN) to simultaneously predict the fire days and burned area with climate and vegetation datasets. This hybrid model has the strength to capture large fires (>10000ha), comparing the burned area from CLM5-BGC (Correlation: 0.79). When this hybrid model is coupled with CLM5-BGC, we found that the carbon fluxes changed over Alaska. In particular, total net ecosystem exchange (NEE) increased by more than two times that of only CLM5-BGC, which could primarily affect terrestrial carbon exchanges.

Acknowledgement

This work was supported by the Korea Polar Research Institute (KOPRI, PE22900) funded by the Ministry of Oceans and Fisheries and the Basic Science Research Program through the National Research Foundation of Korea, which was funded by the Ministry of Science, ICT & Future Planning (grant no. 2020R1A2C2007670) and by the Ministry of Education (2022R1A6A3A13073233).

How to cite: Seo, H. and Kim, Y.: A hybrid deep learning framework for predicting point-level Alaskan fires, EGU General Assembly 2023, Vienna, Austria, 23–28 Apr 2023, EGU23-10336, https://doi.org/10.5194/egusphere-egu23-10336, 2023.

EGU23-10389 | Orals | BG1.2

Towards mechanistic representation of wildfire effects on soil – downscaling to quantify subsurface heat fluxes 

Dani Or, Hamid Vahdat-Aboueshagh, Eden Furtak-Cole, and Sean A. McKenna

Advances in wildfire modeling have focused on refining atmospheric interactions for obvious links between local airflows, combustion dynamics, fire line advance and smoke plume transport. Yet, lasting impacts of wildfires on landscapes are linked primarily with changes in soil characteristics and alteration of ecological and hydrologic processes. Quantitative assessment of wildfire impacts requires metrics for fire-surface thermal interactions beyond qualitative surrogates such as burn severity used for ecological assessment. The highly transient and localized nature of wildfire intensity and its coarse spatial and temporal representation hinder quantitative translation of wildfire dynamics to soil heat fluxes even with the most advanced wildfire models (e.g., QuicFire, WRF-Fire, WFDS). Inspired by the pioneering works of Byram, Rothermel and Albini, we seek to derive high resolution information on fire line intensities from highly resolved fuel maps informed by fire line dynamics derived from numerical wildfire model representation. This hybrid downscaling approach (limited by the quality and resolution of fuel maps) offers a means for constraining soil surface heat fluxes at resolutions relevant to quantifying critical temperatures and duration at depth to estimate pyrolysis of soil organic carbon and the degree of soil structure alteration. Examples will be presented and discussed. 

How to cite: Or, D., Vahdat-Aboueshagh, H., Furtak-Cole, E., and A. McKenna, S.: Towards mechanistic representation of wildfire effects on soil – downscaling to quantify subsurface heat fluxes, EGU General Assembly 2023, Vienna, Austria, 23–28 Apr 2023, EGU23-10389, https://doi.org/10.5194/egusphere-egu23-10389, 2023.

EGU23-10651 | ECS | Posters on site | BG1.2

An annually resolved stalagmite record of fire frequency for the last 250 years in south west Australia 

Liza McDonough, Pauline Treble, Andy Baker, Andrea Borsato, Silvia Frisia, Micheline Campbell, Gurinder Nagra, Katie Coleborn, Michael Gagan, Jian-xin Zhao, and David Paterson

Stalagmites provide records of past changes in climate, vegetation, and surface events, which can be identified through variability in their chemical composition over time. This variability is the result of changes in surface environmental properties, which are reflected in the physical and chemical properties of the water that percolates into the cave, ultimately affecting the composition of the speleothem calcite. Wildfires have the potential to alter soil properties and soluble element concentrations. Consequently, stalagmite compositions have been shown to respond to increases in soil nutrients, trace metal concentrations, and changes in soil/karst bedrock hydraulic conductivity. It is, therefore, likely that stalagmites, and particularly those grown in shallow caves for which transmission of the surface signal is rapid, capture the environmental effects of wildfires in their chemical and physical properties.

We analysed a stalagmite from a shallow cave in a region known to be affected by wildfires in south-west Western Australia. Fire proxies were assessed using a multi-proxy approach. This includes water isotopes via stable-isotope ratio mass spectrometry and trace element analyses via synchrotron X-ray fluorescence microscopy and laser ablation inductively coupled plasma mass spectrometry. This approach shows that the timing of known fire events coincided with a multi-proxy response in stalagmite chemistry, including increased concentrations of phosphorus, copper, aluminium, lead, and zinc, which are interpreted to be derived from leaching of ash from burned vegetation above the cave. We also identified lower and less variable peaks in phosphorus concentrations during the pre-colonisation period, suggesting that Indigenous land management resulted in more frequent but low intensity burning. This contrasted with less frequent but more intense fires associated with post-colonisation land-management. A particularly large paleo-fire identified in 1897 appears to coincide with a peak in 𝛿18O, interpreted to have resulted from evaporation of sub-surface water during the heat of the fire. This large fire was preceded by a multi-decadal dry period identified by trace element proxies. The intensity of the 1897 fire was then exacerbated by the combination of a multi-decadal drought and a transition away from cultural burning practices by Indigenous Australians, which resulted in build-up of vegetation and dry combustible material on the forest floor.

This research is a world-first demonstration of fire events recorded in stalagmites and shows their potential to provide accurate records of both fire frequency intervals and changes in climate. Further records of past fire events from stalagmites will help to understand how past fire regimes have varied with climate, land-use change and colonisation, and will help to better guide land management practices in the future.

How to cite: McDonough, L., Treble, P., Baker, A., Borsato, A., Frisia, S., Campbell, M., Nagra, G., Coleborn, K., Gagan, M., Zhao, J., and Paterson, D.: An annually resolved stalagmite record of fire frequency for the last 250 years in south west Australia, EGU General Assembly 2023, Vienna, Austria, 23–28 Apr 2023, EGU23-10651, https://doi.org/10.5194/egusphere-egu23-10651, 2023.

EGU23-11016 | ECS | Posters on site | BG1.2

Speleothems as archives for palaeofire proxies 

Micheline Campbell, Liza McDonough, Pauline Treble, Andy Baker, Nevena Kosarac, Katie Coleborn, Peter Wynn, and Axel Schmitt

Environmental proxy archives such as tree rings, sediment cores, and ice cores are commonly used to investigate past fire regimes. Speleothems, naturally forming cave decorations mainly comprising of stalagmites, stalactites, and flowstones, have been extensively used as palaeoenvironmental archives as their physical attributes and chemical composition change with changed environment. Research has shown that cave drip water chemistry responds to fire events, and more recently, that speleothems can record past fire events due to physical and chemical processes which alter speleothem composition. These processes include changes to water stores due to evaporation, fracturing of the host rock, changed soil hydrophobicity, production of highly soluble lime, changes in soil CO2 production, destruction of vegetation and deposition of ash above the cave. These changes can result in shifts in δ18O and δ13C, altered concentrations of vegetation, soil and bedrock-derived elements, and incorporation of soluble ash derived elements (including phosphorus, aluminium, copper, zinc, and lead) in speleothems (McDonough et al., 2022; Campbell et al., 2022).

Changes in speleothem chemistry are typically determined using micro-analytical techniques (such as Synchrotron X-ray Fluorescence Microscopy and laser ablation inductively coupled plasma mass spectrometry) and isotope ratio mass spectrometry. These changes can be precisely and absolutely dated via uranium-series and carbon dating, and can often be resolved at high resolution via manual counting of seasonal fluctuations in organic matter and trace element concentration. This makes speleothems, particularly those grown in shallow caves in highly seasonal climates, ideal for identifying both short-lived events such as wildfires, and longer-term changes such as shifts in climate. This novel application of speleothems as archives for coupled climate and palaeofire proxies is still in its infancy but holds great potential.

Here, we present a review of this new sub-discipline. We cover its origins in cave dripwater monitoring, discuss site and sample selection, and describe the current analytical and statistical approaches used to extract fire information from speleothems. Such records will enable land managers to develop improved methods for managing fire regimes.

McDonough, L.K., Treble, P.C., Baker, A., Borsato, A., Frisia, S., Nagra, G., Coleborn, K., Gagan, M.K., Zhao, J., Paterson, D., 2022. Past fires and post-fire impacts reconstructed from a southwest Australian stalagmite. Geochimica et Cosmochimica Acta. https://doi.org/10.1016/j.gca.2022.03.020
 
Campbell, M., McDonough, L., Treble, P., Baker, A., Kosarac, N., Coleborn, K., Wynn, P.M., Schmitt, A., 2022. Speleothems as Archives for Palaeofire Proxies [preprint], https://www.authorea.com/doi/full/10.1002/essoar.10511989.1
 

How to cite: Campbell, M., McDonough, L., Treble, P., Baker, A., Kosarac, N., Coleborn, K., Wynn, P., and Schmitt, A.: Speleothems as archives for palaeofire proxies, EGU General Assembly 2023, Vienna, Austria, 23–28 Apr 2023, EGU23-11016, https://doi.org/10.5194/egusphere-egu23-11016, 2023.

EGU23-11297 | Orals | BG1.2

Effects of land use, fuel loads and fuel moisture on fire intensity and fire emissions in South America derived by reconciling bottom-up and top-down satellite observations 

Matthias Forkel, Niels Andela, Vincent Huijnen, Christine Wessollek, Alfred Awotwi, Daniel Kinalczyk, Christopher Marrs, and Jos de Laat

Emissions from vegetation fires in tropical forests have the potential to turn the global land carbon sink into a source, affect atmospheric chemistry, and hence air quality. While natural forest fires are a rare phenomenon in tropical forests of South America and are usually of rather low intensity, deforestation fires and small land clearings in systems with high fuel loads can cause intense fires and high emissions. However, the high moisture content in tropical forests causes incomplete combustion and higher emissions of carbon monoxide (CO) than of carbon dioxide. The interacting effects of land use change, fuel load and moisture on fire intensity and emissions is, however, difficult to quantify at large scales because not all of those components are readily available from Earth observations in a consistent way. 

Here, we make use of several satellite products on vegetation, fire activity and atmospheric composition to quantify the effects of land use, fuel loads, fuel moisture on fuel consumption, emission factors and hence on emissions and atmospheric trace gas concentration. First, we use observations of active fires and fire radiative power from the VIIRS and Sentinel-3 SLSTR sensors to map different fire types (forest fires, deforestation fires, small land clearing and agricultural fires, savannah fires). Second, we integrate satellite products of canopy height, above-ground biomass, leaf area index, land cover and soil moisture in a novel data-model fusion framework to estimate fuel loads and moisture in vegetation, surface litter and woody debris. We then combine in a bottom-up approach the fire types with fuel loads and moisture to estimate fuel consumption and fire emissions using default emission factors. Third, we use observations from Sentinel-5p TROPOMI and the Integrated Forecast Systems (IFS) of the Copernicus Atmosphere Monitoring Service to compare the bottom-up estimates with distributions of CO and NOx in the atmosphere, which allows optimising emissions and associated emission factors.

Our reconciled estimates of fire emissions outperform previous CO estimates e.g. from the Global Fire Assimilation System, which demonstrates an improved estimation of fire carbon emissions. The results show that the high fire intensity and emissions in tropical deforestation fires originate from the burning of high loads of woody biomass and coarse woody debris. The high fuel moisture content causes higher emission factors of CO in tropical forests than in savannah fires and hence higher absolute emissions of CO. Our new model approaches and satellite products allow to provide an integrated assessments on the effects of fuel and fire behaviour on fire emissions.

How to cite: Forkel, M., Andela, N., Huijnen, V., Wessollek, C., Awotwi, A., Kinalczyk, D., Marrs, C., and de Laat, J.: Effects of land use, fuel loads and fuel moisture on fire intensity and fire emissions in South America derived by reconciling bottom-up and top-down satellite observations, EGU General Assembly 2023, Vienna, Austria, 23–28 Apr 2023, EGU23-11297, https://doi.org/10.5194/egusphere-egu23-11297, 2023.

EGU23-11559 | ECS | Orals | BG1.2

Identifying the limits to fire growth in Eastern Siberia 

Thomas Janssen and Sander Veraverbeke

Boreal forests store about one third of the world’s forest carbon and may store even more carbon in the future because of the positive effects of rising atmospheric CO2 concentrations on photosynthesis and plant growth. However, fire frequency and severity have also been increasing in boreal forests in the last decades, which might offset their carbon sink potential. In Eastern Siberia, the dry and hot summers of 2020 and 2021 showed exceptionally high fire activity. However, even large fires that can spread for several months, eventually come to an end. This can be because of a change in the weather or because fires run out of fuels. Here, we aim to quantify the controls of fire growth in Eastern Siberia using high resolution landscape variables and hourly ERA-5 meteorological variables. We harmonized the burned area product from the Fire Climate Change Initiative and active fire product from the Visible Infrared Imaging Radiometer Suite, and derived fire perimeters from them for the period between 2012 and 2021. Along these fire perimeters, we then identified spatial changes in landscape variables (i.e. a decline in tree cover or increase in surface water) and temporal changes in hourly vapor pressure deficit and wind. By doing so, we could attribute causes of why fires stopped spreading.

How to cite: Janssen, T. and Veraverbeke, S.: Identifying the limits to fire growth in Eastern Siberia, EGU General Assembly 2023, Vienna, Austria, 23–28 Apr 2023, EGU23-11559, https://doi.org/10.5194/egusphere-egu23-11559, 2023.

EGU23-11992 | Orals | BG1.2

Assessing the feasibility of prescribed burning as a fire risk reduction tool for The Netherlands 

Niels van Manen, Albert Buxó, Linde Egberts, Laura Houwaard, Lennard Jacobsen, Jip Keesom, Martijn Reijners, David van Slooten, Anneloes Teunisse, and Anoek van Tilburg

Climate change is expected to cause prolonged and more severe droughts in Europe, increasing landscape fire occurrence. Since The Netherlands has a high population density in areas typified as ‘Wildland-Urban Interface’, a genuine risk for Dutch society arises. Landscape management, such as prescribed burning, can reduce fire risk. Prescribed burning is executed by intentionally burning the low and understory vegetation, limiting fuel for a landscape fire, under controlled conditions. In this interdisciplinary research, conducted by a team of (early career) researchers from climate science, cultural studies, hydrology, mathematics and spatial economics, we aim to assess whether prescribed burning can be used in The Netherlands as a fire risk reduction tool in natural areas with a high fire risk.


The Netherlands has a well-developed flood management system. However, it lacks such holistic approaches to landscape fire management. Landscape managers and researchers can learn from Dutch flood management by applying the secondary objective, improvement of spatial quality, to prescribed burning. In this research we assess the potential for improving spatial quality through prescribed burning, by adapting the spatial quality framework of the Dutch Room for the River project. Our framework looks at the three pillars burning effectiveness, ecological robustness, and cultural meaning at the potential prescribed burning sites. Burning effectiveness is highest in natural areas (Natura 2000 sites), with high fire risk and the presence of low vegetation. Ecological robustness measures the disturbance prescribed burning could cause in a landscape. Disturbance depends on the burning frequency and intensity, as well as on the type of vegetation that is burned and the usage of the area. In groundwater protection areas, seepage of harmful elements could cause more disturbance. These areas are therefore excluded from the analysis. From the perspective of cultural meaning, social perceptions influence the measure’s performance. Cultural significance and landscape identification provide various perspectives on fires and prescribed burning. Categorizing the different levels of engagement, based on an engagement pyramid, can deliver a basis for implementing prescribed burning.


Preliminary analyses result in a selection of 15 Natura 2000 sites in The Netherlands where prescribed burning could be feasible, varying from the Voornes Duin (14 km2) to the Veluwe (885 km2). These areas are mostly vegetated with coniferous and mixed forests. Prescribed burning potentially causes more disturbance in grasslands. However, since none of the 15 areas contain more than 24% grassland, prescribed burning could still be feasible at all locations. In the area of the Veluwe, qualitative interviews with the local population indicate support for fire management, such as prescribed burning, as they are aware of the risks imposed by landscape fires.


The final research results can contribute to the improvement of fire management in both The Netherlands and other North-Western European countries with similar vegetation and climate change effects.

How to cite: van Manen, N., Buxó, A., Egberts, L., Houwaard, L., Jacobsen, L., Keesom, J., Reijners, M., van Slooten, D., Teunisse, A., and van Tilburg, A.: Assessing the feasibility of prescribed burning as a fire risk reduction tool for The Netherlands, EGU General Assembly 2023, Vienna, Austria, 23–28 Apr 2023, EGU23-11992, https://doi.org/10.5194/egusphere-egu23-11992, 2023.

EGU23-12559 | ECS | Posters on site | BG1.2

High-latitude wildfires, atmospheric composition, and climate 

Eirini Boleti, Katie Blackford, Stelios Myriokefalitakis, and Apostolos Voulgarakis

In high-latitude regions, larger and more frequent fires have been occurring over recent years, a tendency that is expected to continue in the coming decades due to warmer temperatures and regionally decreased precipitation imposed by climate change (IPCC,2019). Boreal wildfires in general are a significant source of CO2 emissions, as well as other greenhouse gases and aerosols (Akagi et al. 2011; Van Der Werf et al. 2010), e.g. emissions from boreal forests between 1997 and 2016 accounted for 7.4% of the global emissions (van der Werf et al. 2017). The effects of boreal fires on future climate have not been investigated and are potentially of great importance since climate change is occurring more rapidly in those high-latitude areas. More flammable forests in addition to the large carbon-rich peatlands, will potentially lead to devastating consequences.

The overall goal of our project is to quantify the effects of high-latitude wildfire emissions on atmospheric composition as well as climate. For this purpose, simulations with the EC Earth Earth System Model (ESM) are being employed to characterize the past, present and future variability and changes of wildfires especially in high latitudes. In the results presented here, we demonstrate how the EC Earth model performs when forced with prescribed fire emissions (GFED4) and with a more detailed peat fire module developed by our team. The mean state, seasonality, and interannual variability of fire emissions and key atmospheric constituent abundances (black carbon, organic carbon, NOx, CO, ozone, amongst others) are validated in the model, using a range of observational datasets. This validation exercise is a key step before employing the EC-Earth model for quantifying future impacts of high-latitude fires on atmospheric composition and climate.


IPCC,2019: Jia, G., E. Shevliakova, P. Artaxo, N. De Noblet-Ducoudré, R. Houghton, J. House, K. Kitajima, C. Lennard, A. Popp, A. Sirin, R. Sukumar, L. Verchot, 2019: Land–climate interactions. In: Climate Change and Land: an IPCC special report on climate change, desertification, land degradation, sustainable land management, food security, and greenhouse gas fluxes in terrestrial ecosystems [P.R. Shukla, J. Skea, E. Calvo Buendia, V. Masson-Delmotte, H.-O. Pörtner, D.C. Roberts, P. Zhai, R. Slade, S. Connors, R. van Diemen, M. Ferrat, E. Haughey, S. Luz, S. Neogi, M. Pathak, J. Petzold, J. Portugal Pereira, P. Vyas, E. Huntley, K. Kissick, M, Belkacemi, J. Malley, (eds.)]. In press.

Akagi, S.K. et al., 2011: Emission factors for open and domestic biomass burning for use in atmospheric models. Atmos. Chem. Phys., 11, 4039–4072, doi:10.5194/acp-11-4039-2011.

Van Der Werf, G.R. et al., 2010: Global fire emissions and the contribution of deforestation, savanna, forest, agricultural, and peat fires (1997–2009). Atmos. Chem. Phys., 10, 11707–11735, doi:10.5194/acp-10-11707-2010.

Van Der Werf, G.R. et al., 2010: Global fire emissions and the contribution of deforestation, savanna, forest, agricultural, and peat fires (1997–2009). Atmos. Chem. Phys., 10, 11707–11735, doi:10.5194/acp-10-11707-2010.

How to cite: Boleti, E., Blackford, K., Myriokefalitakis, S., and Voulgarakis, A.: High-latitude wildfires, atmospheric composition, and climate, EGU General Assembly 2023, Vienna, Austria, 23–28 Apr 2023, EGU23-12559, https://doi.org/10.5194/egusphere-egu23-12559, 2023.

EGU23-12604 | Orals | BG1.2

Causes of uncertainty in simulated burnt area by fire-enabled DGVMs 

Matthew Forrest, Chantelle Burton, Markus Drüke, Stijn Hantson, Fang Li, Joe Melton, Lars Nieradzik, Sam Rabin, Stephen Sitch, Chao Yue, and Thomas Hickler

Fire-enabled dynamic global vegetation models (DGVMs) can be used to study how fire activity responds to its main drivers, including climate/weather, vegetation and human activities, at coarse spatial scales. Such models can also be used to examine the effects of fire on vegetation, and, when embedded in Earth system models, investigate the feedback of fire on the climate system. Thus they are valuable tools for studying wildfires. Accordingly, the Fire Model Intercomparison Project (FireMIP) was established to evaluate and utilise these models using consistent protocols.

Here we present the second round of FireMIP simulations to focus historic wildfire drivers (1901 to present). A six-member ensemble of simulations from fire-enabled DGVMs was compared to remotely-sensed burnt area observations and to the previous round of historical FireMIP simulations. We found that the model skill when simulating spatial patterns of burnt area shows modest improvements compared to the previous FireMIP round, and that the simulations mostly reproduce the decreasing trend in global burnt area found over the last two decades. However, whilst the broad global patterns are reasonable, there are considerable discrepancies with regards to regional agreement and timing of burnt area. Furthermore, the models show diverging trends in the pre-satellite era.

To investigate further and inform future model development, we explored the residuals between simulated burnt area from the FireMIP models and remotely-sensed burnt area as a function of climate, vegetation, anthropogenic and topographic variables using generalised additive models (GAMs). We found some common responses across the models, with many over-predicting fire activity in arid/low productivity areas and all models under-predicting at low road density. However, with respect to other variables, such as wind speed and cropland fraction, the models residuals showed divergent responses. It is anticipated that these results should aid further development of global fire models in terms of driving variables, process representations and model structure.

How to cite: Forrest, M., Burton, C., Drüke, M., Hantson, S., Li, F., Melton, J., Nieradzik, L., Rabin, S., Sitch, S., Yue, C., and Hickler, T.: Causes of uncertainty in simulated burnt area by fire-enabled DGVMs, EGU General Assembly 2023, Vienna, Austria, 23–28 Apr 2023, EGU23-12604, https://doi.org/10.5194/egusphere-egu23-12604, 2023.

EGU23-12731 | ECS | Posters on site | BG1.2

Quantifying the direct influence of climate change on the rate of spread of wildfires in the Iberian Peninsula 

Martín Senande-Rivera, Damián Insua-Costa, and Gonzalo Míguez-Macho

Due to its strong connection with meteorological conditions and vegetation structure, fire activity is affected by anthropogenic climate change. As a direct effect, climate regulates fuel moisture, so warmer and drier conditions are linked to higher fuel flammability, increasing fire risk. We use data from ERA5 and different CMIP6 models to build a database of fuel moisture (for both live and dead fuels) under real conditions (factual) and modified conditions without the influence of global warming (counterfactual). We then calculate the rate of spread of some observed wildfires in the Iberian Peninsula from 2001 to 2021, from both factual and counterfactual data. We find that climate change influence is already noticeable and significant. We also identify the areas most vulnerable to the impacts of climate change and the time of the year when these impacts are strongest. 

How to cite: Senande-Rivera, M., Insua-Costa, D., and Míguez-Macho, G.: Quantifying the direct influence of climate change on the rate of spread of wildfires in the Iberian Peninsula, EGU General Assembly 2023, Vienna, Austria, 23–28 Apr 2023, EGU23-12731, https://doi.org/10.5194/egusphere-egu23-12731, 2023.

Tropospheric ozone (O3) is a key greenhouse gas and pollutant that is receiving increasing attention globally.  While there are many sources of tropospheric O3, precursors from human activity (Anthro) and open biomass burning (BB) are the only ones that can be controlled. As such, it is crucial for policymakers to understand the relative contributions of the two. However, determining the contribution of O3 can be challenging as it cannot be directly observed. It must be calculated by chemical transportation model (CTM) simulation which could be biased for unreal emission inventory, or estimated by real observations that assumes too simple chemical and transportation processes.

In this paper, we propose a solution by developing a deep learning (DL) model that combines both CTM simulations and observations. The DL model is able to learn a generalized relationship between unobservable O3 contribution from Anthro or BB sectors and observable mixing ratio of tracers simulated by CTM with full chemistry and transportation processes. The DL model then, when applied to observed tracers, could avoid the bias from model to provide an accurate estimation of the contributions in reality.

Our results indicate the contribution from BB to tropospheric remote ozone mixing ratio is no larger than that from Anthro emission from a global perspective, even when uncertainties are deliberately tuned to bias BB. Therefore, the reduction of anthropogenic emissions should be the top priority for controlling global background O3 levels, at least for the time period of 2016-2018 studied.

How to cite: Ma, C., Cheng, Y., and Su, H.: Biomass Burning Contributes Less to Remote Tropospheric Ozone than Human Activity, Indicated by a Deep Learning Approach, EGU General Assembly 2023, Vienna, Austria, 23–28 Apr 2023, EGU23-13307, https://doi.org/10.5194/egusphere-egu23-13307, 2023.

EGU23-13544 | ECS | Posters on site | BG1.2

Seasonal skew of tropical savanna fires 

Tom Eames, Jeremy Russell-smith, Cameron Yates, Roland Vernooij, and Guido van der Werf

Tropical savannas and grasslands are the most frequently burned biome in the world, and fire constitutes an important part of the ecosystem. In this ecosystem it can have both rejuvenating and destructive effects, depending on several factors including fuel conditions, weather conditions, and time of year. For centuries humanity has used fire in these landscapes for hunting, land clearance, agriculture, and most recently carbon offsetting. Land managers in locations with a monsoonal climate and frequent fire regimes such as tropical savannas use prescribed burning as a management tool in the ‘early dry season’ (EDS) shortly after the last rains of the year. Fires at this time tend to be cooler, restricted to surface level and less severe, meaning they can be controlled more easily and tend to go out at night without external input. Commonly a specific, fixed date is used to indicate when this window of safe burning has expired, set based on experience of the local or regional authority. In this work, we have defined a method of determining when this window expires on the basis of active fire hotspot data from the twin MODIS instruments from 2001 through to 2021. By using the relationship between day and night-time active fire detections, we set a flexible date for the transition between the early and late dry seasons in fire-prone savannas globally in the five major tropical savanna regions - Northern & Southern hemisphere South America (NHSA & SHSA), Northern & Southern hemisphere Africa (NHAF & SHAF), and Australia (AUST). The variability across each region was high (lowest mean standard deviation annually was 24 days in NHAF and highest was 56 in AUST). The fraction of area burned in the late dry season ranged from 15% (SHSA) to as high as 85% (AUST) on average, with many parts of Africa and Australia especially showing a significant skew towards the late dry season. This suggests potential for implementation of prescribed burning programmes to increase the amount of desirable fire in the global savanna ecosystems.

How to cite: Eames, T., Russell-smith, J., Yates, C., Vernooij, R., and van der Werf, G.: Seasonal skew of tropical savanna fires, EGU General Assembly 2023, Vienna, Austria, 23–28 Apr 2023, EGU23-13544, https://doi.org/10.5194/egusphere-egu23-13544, 2023.

EGU23-13603 | ECS | Orals | BG1.2

Simulating wildfire impacts on boreal forest structure over the past 20,000 years since the Last Glacial Maximum in Central Yakutia, Siberia 

Ramesh Glückler, Josias Gloy, Elisabeth Dietze, Ulrike Herzschuh, and Stefan Kruse

Even though wildfires are an important ecological component of larch-dominated boreal forests in eastern Siberia, intensifying fire regimes may induce large-scale shifts in forest structure and composition. Recent paleoecological research suggests that such a state change, apart from threatening human livelihoods, may result in a positive feedback on intensifying wildfires and increased permafrost degradation [1]. Common fire-vegetation models mostly do not explicitly include detailed individual-based tree population dynamics. However, setting a focus on patterns of forest structure emerging from interactions among individual trees in the unique forest system of eastern Siberia may provide beneficial perspectives on the impacts of changing fire regimes. LAVESI (Larix Vegetation Simulator) has been previously introduced as an individual-based, spatially explicit vegetation model for simulating fine-scale tree population dynamics [2]. It has since been expanded with wind-driven pollen dispersal, landscape topography, and the inclusion of multiple tree species. However, until now, it could not be used to simulate effects of changing fire regimes on those detailed tree population dynamics.

We present simulations of annually computed tree populations during the past c. 20,000 years in LAVESI, while applying a newly implemented fire module. Wildfire ignitions can stochastically occur depending on the monthly fire weather. Within the affected area, fire intensity is mediated by surface moisture. Fire severity depends on the intensity, with scaled impacts on trees, seeds and the litter layer. Each tree has a chance to survive wildfires based on a resistivity estimated from its height and species-specific traits of bark thickness, crown height, and their ability to resprout. The modelled annual fire probability compares well with a local reconstruction of charcoal influx in lake sediments. Simulation results at a study site in Central Yakutia, Siberia, indicate that the inclusion of wildfires leads to a higher number of tree individuals and increased population size variability compared to simulations without fires. In the Late Pleistocene forests establish earlier when wildfires can occur. The new fire component enables LAVESI to serve as a tool to analyze effects of varying fire return intervals and fire intensities on long-term tree population dynamics, improving our understanding of potential state transitions in the Siberian boreal forest.

References:

[1] Glückler R. et al.: Holocene wildfire and vegetation dynamics in Central Yakutia, Siberia, reconstructed from lake-sediment proxies, Frontiers in Ecology and Evolution 10, 2022.

[2] Kruse S. et al.: Treeline dynamics in Siberia under changing climates as inferred from an individual-based model for Larix, Ecological Modelling 338, 101–121, 2016.

How to cite: Glückler, R., Gloy, J., Dietze, E., Herzschuh, U., and Kruse, S.: Simulating wildfire impacts on boreal forest structure over the past 20,000 years since the Last Glacial Maximum in Central Yakutia, Siberia, EGU General Assembly 2023, Vienna, Austria, 23–28 Apr 2023, EGU23-13603, https://doi.org/10.5194/egusphere-egu23-13603, 2023.

EGU23-13941 | Orals | BG1.2 | Highlight

Wildfires, chromium and freshwater quality at tropical ultramafic catchments : A prospective study on laboratory-heated soils from New Caledonia 

Farid Juillot, Gael Thery, Cecile Quantin, Quentin Bollaert, Michael Meyer, Thomas Quiniou, Philippe Jourand, Marc Ducousso, Emmanuel Fritsch, and Guillaume Morin

During the last decade, the world faced record-breaking giant fires as observed in Australia and California, a trend that is expected to increase in the forthcoming years due to climate change (Palinkas, 2020; Sharples et al., 2016; van Oldenborgh et al., 2021). In addition to their large ecological impacts, wildfires are more and more regarded for their potential threat to human health through air pollution (Xu et al., 2020). However, water pollution resulting from wildfires represents an underestimated pathway for wildfires-induced health risk (Abraham et al., 2017). This latter impact is related to the heat generated by wildfires that can propagate towards several centimeters in the soil and transform/destroy soil components. In addition to weakening soil physical stability, such transformation/destruction can change the speciation of potentially toxic elements (PTEs) that are associated with these soil components, leading to enhanced mobility towards waterways (Abraham et al., 2017; Terzano et al., 2021). One notable PTE is chromium, which is naturally present in soils mostly as trivalent Cr(III), but can represent an environmental and health issue when occurring as hexavalent Cr(VI). Recent studies reported Cr(III) oxidation to Cr(VI) upon laboratory-heating of Cr(III)-doped Fe-oxyhydroxides (Burton et al., 2019a; 2019b). Besides, Cr(III) oxidation to Cr(VI) upon controlled heating was also demonstrated for different types of soils (Burton et al., 2019b; Rascio et al., 2022; Thery et al., 2023). All these considerations suggest a significant effect of wildfires on Cr(III) oxidation to Cr(VI) in soils, with a possible influence on Cr mobility that could further impact freshwater quality. This risk of freshwater Cr(VI) pollution is expected to particularly concern ultramafic catchments because of the related occurrence of Cr-rich soils.

We have tried to address this question by performing laboratory-heating of several soils types (Ferralsols, Cambisols and Vertisols) developed on various geological settings (ultramafic, mafic and volcano-sedimentary) in New Caledonia, a French overseas territory which is a good representative of wildfires-threatened tropical ultramafic catchments (Toussaint, 2020). The results obtained revealed a significant influence of soil heating on Cr(III) oxidation to Cr(VI), followed by an enhanced Cr(VI) mobility, in all soil types. However, the magnitude of Cr(III) to Cr(VI) oxidation and Cr mobility depended on the actual nature of the soil, Ferralsols showing the highest Cr(VI) release compared to Cambisols and Vertisols. These differences were further interpreted on the basis of the changes in Cr speciation (including redox) induced by laboratory-heating of the investigated soils, as revealed by synchrotron-based X-ray absorption spectroscopy analyses. Finally, a simple risk assessment relying on the hypothesized concentration of suspended particulate matter (SPM) issued from burned soils in the related waterways allowed to emphasize a risk of wildfires-induced freshwater Cr(VI) pollution for ultramafic catchments composed of Ferralsols (Thery et al., 2023). Beyond the single case of New Caledonia, the results of this study point to the need to foster collaborative studies in order to further evaluate this risk of wildfires-induced freshwater Cr(VI) pollution at tropical ultramafic catchments on a global scale.

How to cite: Juillot, F., Thery, G., Quantin, C., Bollaert, Q., Meyer, M., Quiniou, T., Jourand, P., Ducousso, M., Fritsch, E., and Morin, G.: Wildfires, chromium and freshwater quality at tropical ultramafic catchments : A prospective study on laboratory-heated soils from New Caledonia, EGU General Assembly 2023, Vienna, Austria, 23–28 Apr 2023, EGU23-13941, https://doi.org/10.5194/egusphere-egu23-13941, 2023.

EGU23-14211 | ECS | Posters on site | BG1.2

Impact of biomass burning on the chemical composition of Arctic aerosols using mass spectrometry 

Yvette Gramlich, Karolina Siegel, Sophie L. Haslett, Radovan Krejci, Paul Zieger, and Claudia Mohr

Biomass burning releases numerous aerosol particles into the air, influencing the radiative budget by scattering or absorbing solar radiation and by influencing cloud properties through acting as cloud condensation nuclei. These aerosol particles contain black and organic carbon and can be transported over large distances, reaching also pristine environments such as the Arctic. Due to the rising global temperature the fire activity has increased, and record-breaking black carbon concentrations have been observed in the Arctic (Stohl et al., 2007). Biomass burning events reaching the Arctic have been observed to increase the aerosol number concentration by about one to two orders of magnitude (Lathem et al., 2013). Although a lot of attention has been drawn to the physical characteristics of fire plumes, changes in chemical composition, specifically in the Arctic, are studied to a lesser extent. In this study we report molecular-level information on the chemical characteristics of biomass burning aerosol particles measured during different plumes reaching the island of Svalbard during 2020. These measurements were part of the year-long NASCENT (Ny-Ålesund aerosol cloud experiment; Pasquier et al., 2022) campaign, and were conducted using a filter inlet for gases and aerosols coupled to a high-resolution time-of-flight mass spectrometer (FIGAERO-CIMS) using iodide as reagent ion. We use the particle-phase levoglucosan, a well-known tracer for biomass burning released from cellulose combustion, obtained from the FIGAERO-CIMS to identify biomass burning events, and will discuss the chemical characteristics of the properties of the events compared to non-events and implications for aerosol radiative and hygroscopic properties. In addition to a better understanding of the chemical composition of aged fire plumes reaching the Arctic, our study will also give insights on the time scales on which the background Arctic air can be disturbed by fire activity. 

References:
Stohl et al., Atmospheric Chem. Phys., 7, 511–534, 2007
Lathem et al., Atmospheric Chem. Phys., 13, 2735–2756, 2013
Pasquier et al., Bull. Am. Meteorol. Soc., 103, E2533–E2558, 2022

How to cite: Gramlich, Y., Siegel, K., Haslett, S. L., Krejci, R., Zieger, P., and Mohr, C.: Impact of biomass burning on the chemical composition of Arctic aerosols using mass spectrometry, EGU General Assembly 2023, Vienna, Austria, 23–28 Apr 2023, EGU23-14211, https://doi.org/10.5194/egusphere-egu23-14211, 2023.

EGU23-15549 | ECS | Posters on site | BG1.2

Regional precipitation variability modulates Holocene fire history of Iceland 

Nicolò Ardenghi, Gifford H Miller, Áslaug Geirsdóttir, David J Harning, Jonathan H Raberg, Thor Thordarson, and Julio Sepúlveda

We present the first continuous Holocene fire record of Iceland from a lacustrine archive in the northeast region. We use pyrogenic PAHs (polycyclic aromatic hydrocarbons) to trace shifts in fire regimes, paired to a continuous record of n-alkanes, faecal sterols, perylene, biogenic silica, and 13C, as proxies for soil erosion, lake productivity, and human presence.

Paleoclimate research across Iceland provides a template for changes in climate across the northern North Atlantic. The role of orbitally driven cooling, volcanism, and human impact as triggers of local environmental changes, such as fire and soil erosion, is debated. While there are indications that human impact could have reduced environmental resilience in a context of deteriorating climatic conditions, it is still difficult to resolve to what extent human and natural factors affected Iceland landscape instability, due also to a lack of data on natural fire regime prior and during human colonisation.

Pyrogenic PAHs can be formed during the incomplete combustion of biomass initiated by humans or natural wildfires. Factors such as fire temperature, biomass typology, and source distance can strongly affect pyrogenic PAH molecular weight and spatial distribution.
Faecal sterols/stanols and their ratios have been used in archaeological and paleoclimate studies to detect human and/or livestock/herbivore waste. The absence of large herbivorous mammals and humans in Iceland prior to settlement means that increases in the occurrence of faecal sterols and bile acids over natural background values should mark the arrival of humans and associated livestock in the catchment, which could be traced regionally.

Our results indicate that the Icelandic fire regime during the Holocene followed four main phases. Among these, a very long period centred around the Holocene climatic optimum (ca 9.5 – 4.5 ka BP) was characterised by a generally low frequency fire regime, both in the lake catchment as in the whole north-eastern Iceland. This same period was also marked by relatively low background levels of faecal sterols/stanols. At 4.5 ka BP a new phase started, with a general increase of all PAHs values. According to both our PAH and sterol data, there is no apparent human signal around the 9th century C.E., where an increase in man-made fires would likely be expected in connection to the historical data of Viking colonisation of Iceland (870s C.E.), suggesting that fire regimes have primarily been controlled by natural factors.
In addition, the pyrogenic PAHs record also differs from the trend of a general stepwise climatic “deterioration” previously highlighted by other lake proxies throughout Iceland, linked to decreasing summer insolation and related cooling, as highlighted also by our other proxies.

A comparison to recent palynological data from a nearby site and to δD data from the NW region suggest shifts in NAO regimes as the main forcing behind shifting fire regimes in Iceland. Changes in precipitation regimes would have determined shifts in the composition of the regional vegetational community, increasing fuel availability and flammability with decreasing precipitation, leading to widespread low temperature fires, easily trigged by frequent volcanic episodes.

How to cite: Ardenghi, N., Miller, G. H., Geirsdóttir, Á., Harning, D. J., Raberg, J. H., Thordarson, T., and Sepúlveda, J.: Regional precipitation variability modulates Holocene fire history of Iceland, EGU General Assembly 2023, Vienna, Austria, 23–28 Apr 2023, EGU23-15549, https://doi.org/10.5194/egusphere-egu23-15549, 2023.

EGU23-15670 | ECS | Orals | BG1.2 | Highlight

Identifying tipping points and threshold values for ecosystem functioning in northern peatlands during the climate crisis (PEATFLAMES) 

Luke Andrews, Michał Słowiński, Harry Roberts, Katarzyna Marcisz, Piotr Kołaczek, Agnieszka Halaś, Dominika Łuców, and Mariusz Lamentowicz

Peatlands are globally important carbon sinks and stores. Climate change threatens to alter carbon cycling in some regions of the Northern Hemisphere, causing them to become net sources of atmospheric carbon, exerting a positive feedback upon global climate. Furthermore, enhanced drying, increased human activity and vegetation succession in response to a warming climate have increased the frequency of wildfires in some peat-bearing regions, including areas underlain by permafrost. Such events can cause thousands of years’ worth of formerly stable carbon to be rapidly released into the atmosphere, imparting further climate warming.


The future response of peatlands to climate warming and wildfire remains uncertain, and as a result peatlands are rarely included in Earth System Models, despite their importance in the global carbon system. Understanding how changes in climate and anthropogenic activity in the past affected peatland ecosystem functioning will improve our understanding of how these sensitive ecosystems may respond to future projected changes and thus reduce this uncertainty.


Our project aims to assess how warming, drought and wildfire have impacted the resilience of peatlands and permafrost in the Northern Hemisphere over the past c. 2000 years. Several peat cores spanning a latitudinal gradient covering several regions including Russia, Poland, the Baltic states and Scandinavia will be analysed using multiple palaeoecological proxies at high resolution to reconstruct past changes in wildfire frequency, hydrology and vegetation. This will allow us to define baselines and threshold values for ecosystem shifts relevant to future projected changes in climate.


How to cite: Andrews, L., Słowiński, M., Roberts, H., Marcisz, K., Kołaczek, P., Halaś, A., Łuców, D., and Lamentowicz, M.: Identifying tipping points and threshold values for ecosystem functioning in northern peatlands during the climate crisis (PEATFLAMES), EGU General Assembly 2023, Vienna, Austria, 23–28 Apr 2023, EGU23-15670, https://doi.org/10.5194/egusphere-egu23-15670, 2023.

EGU23-16152 | Posters on site | BG1.2

Temporal analysis of wildfire emissions in the Northwest of Spain using ESA CCI data 

Patricia Oliva and César Quishpe

The Northwest of the Iberian Peninsula is one of the European regions with the highest frequency of forest fires. However, in the last decade fires in this region have burned larger areas and later in the fire season. Assessing the damage caused by fire and the pollutants released in the burning process is important to understand the effects on ecosystems and the carbon cycle, the recurrence of fires, and the effect on human health. In this work, we performed the estimation of emissions released in Galicia (Northwest Spain) in the last six years combining existing ESA CCI products. To quantify the area burned, we used the products from the Burned Area Algorithm developed within the Fire Climate Change Initiative (FireCCI) project. Then, the characterization and quantification of the total biomass were obtained from the Biomass CCI project at 100 m resolution by extracting the mean biomass by vegetation type from CORINE Land cover 2018. The burning efficiency factor was fitted using burn severity estimates from the dNBR calculation on the Sentinel-2 data. The emissions factors were selected from the literature. Our results show that during the last few years, there is a positive trend of annual emissions in Galicia. The sporadic maximums were registered in the years 2017 and 2022 when the climatic conditions aggravated the fire behaviour. In addition, Galicia is the region of Spain that registers the highest average estimates of emissions from fires since a high percentage of the affected area is occupied by pine and eucalyptus forests. These emissions contribute to a drastic decrease in air quality influencing the climate and affecting public health. Finally, we verified that adapting the burning efficiency factors to the specific conditions of the affected ecosystem generates more precise emission estimates.

How to cite: Oliva, P. and Quishpe, C.: Temporal analysis of wildfire emissions in the Northwest of Spain using ESA CCI data, EGU General Assembly 2023, Vienna, Austria, 23–28 Apr 2023, EGU23-16152, https://doi.org/10.5194/egusphere-egu23-16152, 2023.

EGU23-16241 | ECS | Posters virtual | BG1.2

Characterizing the fire regime evolution and land-use change in the Dry and Wet Chaco between 2001 and 2019 

Rodrigo San Martin, Catherine Ottle, and Anna Sörensson

Wildfires play an essential role in the biogeophysical cycles of different world ecosystems, from dry savannas to humid wetlands. During the last decades, fire regimes of several global regions began to present significant alterations due to climate change and human land-use pressure. The South American Gran Chaco ecoregion contains one of the most important reservoirs of native forests and biodiversity in the world, including the largest continuous dry tropical forest and some of the most extensive wetlands. The area presents a marked precipitation gradient from the East (wet) to the West (dry), which is manifested in vegetation (from wetlands to dry forests and shrublands). In this work, we mapped natural vegetation with the European Space Agency (ESA) Climate Change Initiative (CCI) medium-resolution land cover maps (MRLC v2.0.7; annual - 300m) and fires with the ESA CCI Fire product (FireCCI51; monthly - 250m) in the Gran Chaco between 2001 and 2019 to establish the past and current effects and dynamics of fires in the area (which are primarily human ignited). To assess the region’s climatology, we used the ERA5 bias-corrected reanalysis dataset (WFDE5; daily - 0.5º). Our results highlight the distinct dynamics of fires in the wet and dry areas of the Gran Chaco, showing two fire seasons - summer and winter - in the wet areas (where grasses predominate) and one fire season - winter - in the dry areas (where shrubs and trees are more abundant). Examining the correlations between annual rain anomalies and burnt area, we find that precipitation anomalies have different effects in dry and wet areas throughout the region’s precipitation gradient. Correlations change from positive in the drier areas to negative in the wetter areas. These results may reflect that summer and winter fires do not have the same drivers and the key role of the available biomass limiting the fire expansion. Since biomass is more dependent on precipitation in dry areas compared to wetter ones, the correlation of winter fires with precipitation is positive in the drier regions. The negative correlations obtained in the summer season could be explained by the fact that summer fires essentially occurred in the wetter part of the Chaco and are intended (through human ignition) to increase the grasslands’ productivity; this practice could be more frequent during negative precipitation anomalies compared to positive ones. Further analysis will try to confirm these findings with biomass satellite data.   

How to cite: San Martin, R., Ottle, C., and Sörensson, A.: Characterizing the fire regime evolution and land-use change in the Dry and Wet Chaco between 2001 and 2019, EGU General Assembly 2023, Vienna, Austria, 23–28 Apr 2023, EGU23-16241, https://doi.org/10.5194/egusphere-egu23-16241, 2023.

EGU23-16504 | Posters on site | BG1.2

History of fire regime shifts during the last 1000 years in Northeastern Mongolia 

Michał Słowiński, Milena Obremska, Dashtseren Avirmed, Michał Woszczyk, Saruulzaya Adiya, Dominika Łuców, Agnieszka Mroczkowska, Agnieszka Halaś, Witold Szczuciński, Andrzej Kruk, Mariusz Lamentowicz, Joanna Stańczak, and Natalia Rudaya

Recent years have seen rapid climatic changes in Central Asia, particularly Mongolia. An increase in the thickness of the active layer above permafrost and considerable changes to the vegetation structure are likely outcomes of the long-term temperature rise and precipitation changes. The management of future habitats or the biodiversity of northern Mongolia faces significant difficulties from rising temperatures, prolonged and frequent droughts, and gradual permafrost degradation. Our knowledge of the historical processes involved in permafrost degradation and the ensuing ecological effects is still mostly incomplete. These connections may be used to explain changes in the fire regime, permafrost melting, and plant distribution in the Khentii mountains region. Therefore, based on a multiproxy study of peat archive data, we provide the first high-resolution fire history from northeastern Mongolia over the last 1000 years (micro- and macroscopic charcoals, charcoal size classes and morphotypes, peat geochemistry). We examined microscopic and macroscopic charcoal particles as a proxy for fire activity. We also tracked changes in regional and local plant composition using pollen data. To investigate how changes in fire regimes and the climate affect the functioning of the peatland ecosystem, we also conducted a geochemical analysis.

Additionally, to better comprehend the changes in earlier fire regimes and fire-vegetation connections, we employed the morphotypes of macrocharcoal to pinpoint vegetation burning. This study's primary objective is to evaluate the impact of human behavior, vegetation, and prolonged droughts on the incidence of fire regime transitions during the past 1000 years in Central Asia permafrost marginal zone (Mongolia). The findings showed that most of the fires in the area were probably started by natural causes, presumably connected to heatwaves that resulted in prolonged droughts. We have established a connection between increased fires and the local weather phenomena known as "dzud", a catastrophic confluence of winter snowfall and droughts that impacts fire intensity.

The study is the result of research project No. 2017/01/X/ST10/01216 and 2018/31/B/ST10/02498 funded by the Polish National Science Centre.

How to cite: Słowiński, M., Obremska, M., Avirmed, D., Woszczyk, M., Adiya, S., Łuców, D., Mroczkowska, A., Halaś, A., Szczuciński, W., Kruk, A., Lamentowicz, M., Stańczak, J., and Rudaya, N.: History of fire regime shifts during the last 1000 years in Northeastern Mongolia, EGU General Assembly 2023, Vienna, Austria, 23–28 Apr 2023, EGU23-16504, https://doi.org/10.5194/egusphere-egu23-16504, 2023.

EGU23-16912 | ECS | Posters on site | BG1.2

Fire, Work with Me: A PAH record from a Southwestern US speleothem 

Jonathan Smolen, Isabel Montañez, and Michael Hren

Polycyclic aromatic hydrocarbons (PAHs) are molecules produced during incomplete combustion of organic matter and have been increasingly utilized as paleo-proxies for wildfires. More recently, their incorporation from drip water into speleothems has been utilized in conjunction with the stable isotopic and trace elemental measurements of host carbonate and fluid inclusions in order to assess a coupled record of fire and hydroclimate. Numerous studies have focused on cave systems in the Southwestern U.S., which has experienced highly variable hydroclimate and massive wildfires with past climate changes. Here, we present a PAH record covering ~19-11.5 ka obtained from a precisely dated and well-studied ML-1 stalagmite obtained from McLean’s Cave in the central Sierran foothills, CA. Total concentrations of four-ring PAHs reach maximum values from ~16.8-15 ka, associated with the first stage (1a) of Heinrich Stadial 1 (HS1) interval – this is interpreted as increased levels of soil PAHs produced from regional wildfires. Covariance of isomeric diagnostic ratios with total concentration indicates a shift in the nature of the associated fires, separating effects of PAH mobility in altered soils as well as shifts in soil water transport, stalagmite growth rates, and precipitation amounts. Paired climate signals from independent regional proxies are discussed, as well as factors affecting the interpretation of PAH signals in speleothems. Considerations and methods using small (~1g) speleothem samples are presented, with a focus on simultaneous extraction of useful paleoenvironmental information from other molecular biomarkers entombed within speleothems.

How to cite: Smolen, J., Montañez, I., and Hren, M.: Fire, Work with Me: A PAH record from a Southwestern US speleothem, EGU General Assembly 2023, Vienna, Austria, 23–28 Apr 2023, EGU23-16912, https://doi.org/10.5194/egusphere-egu23-16912, 2023.

EGU23-17450 | ECS | Orals | BG1.2 | Highlight

First results of a field campaign focused on overwintering zombie fires 

Thomas D. Hessilt, Sander Veraverbeke, Emily Ogden, Jason Paul, Merritt Turetsky, Max van Gerrevink, Raquel Alfaro-Sanchez, Oleg Melnik, Rebecca C. Scholten, and Jennifer Baltzer

Fire is a major disturbance in the boreal forests of the high northern latitude. Fire extent and severity have been increasing in recent decades, and the occurrence of overwintering ‘zombie’ fires has been linked to recent fire extremes. Overwintering fires are fires which were seemingly extinguished at the end of the boreal fire season yet smolder during winter to re-emerge as a flaming fire in the subsequent spring. So far, overwintering fires have only been investigated using satellite imagery. Here, for the first time, we show preliminary results from a field campaign that measured in situ impacts of fires that overwintered from 2014 to 2015 in the Canadian Northwest Territories. We measured among other the burn depth in organic soils, and characterized micro-topography. We also qualitatively assessed how fires may have overwintered. We compared nine overwintering fire sites, which burned during both 2014 and 2015, with six sites that only burned in 2014 and five nearby unburned sites. The average burn depth (±SD) of the overwintering fires was 6.8 ± 1.6 cm and significantly deeper compared to 6.1 ± 1.2 cm in the single fire sites (P < 0.01). Somewhat surprisingly, the majority of overwintering fires occurred in mesic sites with large productive trees. Only two overwintering sites were sampled in mesic-subhygric to subhygric sites dominated by black spruce (Picea mariana). The unburned control sites often featured a micro-topography of hummocks and hollows. This micro-topography was leveled in overwintering fires sites because of severe burning in organic soils. In overwintering sites, most of the organic layer was consumed. This may have led to prolonged smoldering in the root systems of trees. Our results are the first to quantify the burn depth of overwintering fires, and also show that overwintering does not only happen through deep smoldering in organic soils, yet can also occur from smoldering in tree boles and root systems of burned and fallen trees.

How to cite: Hessilt, T. D., Veraverbeke, S., Ogden, E., Paul, J., Turetsky, M., van Gerrevink, M., Alfaro-Sanchez, R., Melnik, O., Scholten, R. C., and Baltzer, J.: First results of a field campaign focused on overwintering zombie fires, EGU General Assembly 2023, Vienna, Austria, 23–28 Apr 2023, EGU23-17450, https://doi.org/10.5194/egusphere-egu23-17450, 2023.

The Arabian Sea, a productive oceanic region in the North Indian Ocean, is under the direct influence of monsoon winds that impact the surface ocean processes. High biological productivity occurs due to natural nutrient enrichment events via coastal and open ocean upwelling (summer monsoon) and convective mixing (winter monsoon). Ample studies from this basin addressed the diatom community from the surface ocean, yet the key contributing diatom frustules to sedimentary phytodetritus has been overlooked. These microscopic biosilcifiers play an important role in the biological carbon pump by exporting significant organic carbon from the surface waters to the deep sea due to their ballasted silica shell (frustule). Hence, this is imperative to document the diatom genera that are transported efficiently to the sediment. The present study analyzed diatom frustule abundance (valves g-1) and identified the major diatom genera in core top sediments (0.5cm) of 10 locations from the Central (21, 19, 15, 13, and 11 °N along 64 °E) and Eastern Arabian Sea (21, 17, 15, 13, and 11 °N at 200 m isobath).  This is the first of this kind and found a comparable frustule distribution from the surface sediments of both Central (av. 5.16±1.23×10⁴ valves g-1) and Eastern Arabian Sea (av. 5.80±7.14×10⁴ valves g-1). Size-based classification revealed that the contributions of medium-sized (30-60 µm) frustules from both the central (49 %) and eastern (51%) Arabian Sea were quite high. And the contribution of large-sized frustules (>60 µm) was higher in the central Arabian Sea (39%) compared to the eastern part (19%). A total of 40 diatom genera with 18 in common from both locations were detected from the sedimentary phytodetritus with Coscinodiscus and Thalassiosira being the dominating ones. In the north-central (21, 19, 15 °N) Arabian Sea, the prevalence of large-sized diatoms (Coscinodiscus) was attributed to open ocean upwelling as well as convective mixing during summer and winter monsoons, respectively. Such large species can easily escape grazing and sink rapidly due to higher ballasting. Further, the presence of the oxygen minimum zone at the intermediate depth in this region might reduce the remineralization and grazing pressure within the mesopelagic during their transport to the abyss. Whereas relatively smaller diatoms (Thalassiosira, Pseudo-nitzschia, Fragilaria, Nitzschia) were in high abundance towards the south-central (13, 11 °N) that area remains nutrient-poor. In the Eastern Arabian Sea, Thalassiosira was noticed in high abundance towards the southeast (15, 13, 11 °N), whereas the northeast (17, 21 °N) was dominated by Coscinodiscus and mostly due to the prevalence of coastal upwelling and convective mixing, respectively. Likely, these diatoms (Coscinodiscus, Thalassiosira, Pseudo-nitzschia, Fragilaria, Nitzschia) play a key role in transferring the organic matter from the surface to sediments and thus actively contribute to carbon capture, elemental cycling, and supplying food source for the benthic biota. This study highlights for the first time the biogeochemical significance of these diatoms from this highly productive oceanic province.

How to cite: Pandey, M. and Biswas, H.: An account of the key diatom frustules from the surface sediments of the Central and Eastern Arabian Sea and their biogeochemical significance., EGU General Assembly 2023, Vienna, Austria, 23–28 Apr 2023, EGU23-131, https://doi.org/10.5194/egusphere-egu23-131, 2023.

EGU23-264 | ECS | Orals | OS1.7

Seasonality and distribution of Persian Gulf Water and its impact on ventilation: a high resolution view from gliders 

Estel Font, Bastien Y. Queste, Sebastiaan Swart, and Gerd Bruss

The decline in ocean oxygen content is one of the most alarming consequences of anthropogenic-driven climate change. A key challenge is that global climate models do not currently reproduce observed changes in deoxygenation, showing high inter-model variability and uncertainty. This uncertainty is partially due to the models’ inability to resolve features smaller than their computational grid cells resulting in large biases in ventilation. The Persian Gulf Water outflow has been pointed out by several studies as one of the sources of ventilation in the Arabian Sea Oxygen Minimum Zone (OMZ). This oxygenated water mass flows eastward along the shelf edge of the northern Omani coast at 200m depth and is fragmented by the mesoscale eddy field and rough topography, generating small “peddies”. These peddies and their relatively high oxygen concentrations have potential to ventilate the OMZ, yet this has been poorly investigated due to a lack of adequate observations. We use multi-month glider campaigns off the coast of Oman with a SeaExplorer glider equipped with an ADCP to resolve the contribution of the Persian Gulf Water outflow to oxygen supply within the Arabian Sea OMZ. We characterize its properties, seasonality, and spatial distribution and estimate mixing rates from double diffusion, salt-fingering, and shear-driven mixing to understand water mass transformations and oxygen fluxes into the OMZ.

How to cite: Font, E., Y. Queste, B., Swart, S., and Bruss, G.: Seasonality and distribution of Persian Gulf Water and its impact on ventilation: a high resolution view from gliders, EGU General Assembly 2023, Vienna, Austria, 23–28 Apr 2023, EGU23-264, https://doi.org/10.5194/egusphere-egu23-264, 2023.

The biogeochemistry of the Arabian Sea, the northwestern part of the Indian Ocean, is directly impacted by monsoonal wind reversal and is an area of strong ocean-atmospheric interaction. During the summer monsoon, coastal as well as open ocean upwelling occurs in the western, southeastern, and central parts of the Arabian Sea. The highest primary productivity rates are documented in these areas compared to the global oceans. Phytoplankton-derived particulate organic matter (POM) [Particulate organic carbon (POC) and nitrogen (PN)] play a central role in supporting the food chain as well as carbon export flux to the deep sea. Hence understanding the dynamics of POM concentrations and its stable carbon (δ13CPOC) and nitrogen (δ15NPN) isotopic ratios are important in delineating its sources and recycling. However, such studies are scarce from the Indian Ocean region. Here we present the first study describing the POM dynamics during the summer monsoon from the central Arabian Sea, addressing the interannual variability. We studied the monsoonal changes in POM and its isotopic signatures in the central Arabian Sea (21–11°N; 64°E) during August 2017 and 2018. A strong, low-lying atmospheric jet (Findlater Jet) blows across the basin during the southwest (SW) monsoon. Positive wind stress curl resulted in “open ocean upwelling” to the north of the jet’s axis, characterized by substantially shallower Mixed Layers Depths (MLDs) and higher POM contents relative to the jet’s axis and its south. The highest wind speeds were observed in the center of the transect due to the presence of the jet’s axis. And the negative curl to the south of the jet’s axis resulted in downwelling and, consequently, the deepest MLDs. The molar ratio between POC and PN (6.2 ± 1.9 in 2017; 6.4 ± 0.9 in 2018) was close to the canonical Redfield ratio (6.63). The δ13CPOC values (−26.3 ± 1.4‰ in 2017; 25.5 ± 1.4‰ in 2018) exhibited typical marine signature and a noticeable inter-annual difference. Relatively higher δ15NPN values in the north (7.68 ± 2.6‰ in 2017; 9.24 ± 3‰ in 2018) indicated the uptake of regenerated dissolved inorganic nitrogen from the oxygen minimum zone (OMZ). The lower δ15NPN values along the jet’s axis and to its south were attributed to the eastward advection of upwelled waters from the western Arabian Sea. Higher wind speeds and jet-induced wind stress curl in 2018 resulted in lower sea surface temperatures (SST) and higher nutrient concentrations. Despite the higher nutrient availability in 2018, POC contents did not exceed the values in 2017. However, considering the total nitrogen consumption (according to C:N: P = 106:16:1), the potential POC development in 2018 could be double the value in 2017. The interannual differences in SW monsoon onset and wind speeds seemed to directly control the nutrient supply, affecting plankton community structure and POM variability. Thus, any future changes in the physical forcing may directly influence the POC pool and consequent export flux to the mesopelagic.

How to cite: Silori, S., Biswas, H., and Cardinal, D.: Interannual variability in particulate organic matter associated with physical forcing in the central Arabian Sea assessed from (stable) carbon and nitrogen isotopes., EGU General Assembly 2023, Vienna, Austria, 23–28 Apr 2023, EGU23-358, https://doi.org/10.5194/egusphere-egu23-358, 2023.

EGU23-1671 | Orals | OS1.7 | Highlight

New perspective on the overturning dynamics in the Indian Ocean 

Lei Han

The Indian Ocean Meridional Overturning Circulation (IMOC) is well known for its remarkable seasonal variation, which was attributed to Ekman flow plus its barotropic compensation (Lee and Marotzke, 1998). However, by tracking the isopycnal displacement, I defined a  sloshing MOC streamfunction, which was found highly resembling the Eulerian MOC streamfunction (see the attached figure). It was thus concluded that the IMOC is predominantly a sloshing mode, associated with the isopycnal displacement. Recognizing that these isopycnal signals were dominated by the first-baroclinic long Rossby waves, I found the IMOC strength was determined by the zonally-integrated Ekman pumping anomaly. As a result, the deep inflow into the Indian Ocean also had seasonal variation that could be attributed to this sloshing mode of overturning circulation. This could be partly verified by the cross-basin transect survey across 32oS that were fully occupied three times in history. The diffusivity dichotomy problem can be also explained by this new perspective. The importance of the Indian Ocean overturning in the global conveyor-belt was therefore challenged. This result has been published in Han (2021, JPO).

How to cite: Han, L.: New perspective on the overturning dynamics in the Indian Ocean, EGU General Assembly 2023, Vienna, Austria, 23–28 Apr 2023, EGU23-1671, https://doi.org/10.5194/egusphere-egu23-1671, 2023.

EGU23-2164 * | Posters virtual | OS1.7 | Highlight

Mid-Holocene Monsoon Weakening: A major cause for societal change in the Indian subcontinent 

Hema Achyuthan and Nagasundaram Mohan

A sediment core retrieved from a water depth of 250 m near the Andamans Forearc Basin (AFB), the Landfall Island, North Andaman, reflects a record of sediment provenance and monsoonal shift since the mid to late Holocene. The core represents radiocarbon ages ranging from 6,078 to 1,658 yrs BP (from~ 6,500 yrs BP to the present). The core is dominantly clayey silt with incursions of coarser components that occur around 6,000, 5,400, and 3,400 yrs BP. Grain size variation indicates a cyclic variation of wetter and drier conditions matching changes in the intensity of the Indian Summer Monsoon (ISM), which was at its greatest intensity around 6,400, 5,300, and 3,300-3,000 yrs BP. Geochemical parameters including higher CaCO3 content, εNd, and 18O in Globigerinoides ruber are consistent with the long-term trend from cooler, wetter conditions to warmer, drier conditions at present. Chemical weathering intensity, which lags behind climate changes on land, shows a pulse of highly weathered sediment deposited at about 4,000 BP. Clay minerals represented by smectite, illite, kaolinite, and chlorite in varying amounts indicate high kaolinite content and K/C ratio specify intense Southwest Monsoon (SWM) and stronger bedrock weathering in the hinterland (~6,500–5,400 years BP). Incidence of smectite (48.82 to 25.09 %) and chlorite/illite (C/I) ratio (0.56 to 0.28) indicate an overall weakened southwest monsoon since 6,000 to 2,000 years BP with a brief incursion of extremely reduced SWM around 4,400 to 4,200 years BP. This is corroborated by the oxygen isotope on G. ruber that indicates a significant shift in the isotopic values ~4,300 years BP (−3.39‰), indicating a weak SWM. Fluctuations in the intensity of SWM are also observed for 2,000 years to the present. Sandy sediment was supplied from the Andaman Islands, Irrawaddy, and the Salween sea. Since the Mid Holocene period, longer periods of aridification and shorter periods of wetter conditions increased in the region after approximately 4,300 yrs BP. A correlation of monsoonal events using the Godhavari marine sediment core (Ponton et al.,2012)  and our data is noted that Bronze Age Harappan urbanism flourished since 4,500 yrs BP along the river banks in the western region of the present semi-arid Desert and the Deccan owing to intensified rain-fed agriculture. Since approximately 3,900 yrs ago, the total settled area and many settlement sizes declined, abandoned, and a significant shift in site numbers and density towards the southeast and west is recorded. During the Iron Age, after ca. 3,200 yrs BP, adaptation to semi-arid conditions in western Rajasthan, central and south India appears to have been well established with a significant number of sites in areas receiving <500 mm of rainfall. Weak monsoon precipitation led to conditions adverse to both inundation and rain-based farming and encouraged pastoralism. Monsoonal-fed rivers were active during the short-wet periods and gradually dried or became seasonal, affecting habitability along their courses. 

How to cite: Achyuthan, H. and Mohan, N.: Mid-Holocene Monsoon Weakening: A major cause for societal change in the Indian subcontinent, EGU General Assembly 2023, Vienna, Austria, 23–28 Apr 2023, EGU23-2164, https://doi.org/10.5194/egusphere-egu23-2164, 2023.

EGU23-2165 | ECS | Posters on site | OS1.7

Main drivers of Indian Ocean dipole asymmetry revealed by a simple IOD model 

Hyo-Jin Park, Soon-Il An, Soong-Ki Kim, Wenju Cai, Agus Santoso, Daehyun Kim, and Jong-Seong Kug

Indian Ocean Dipole phenomenon (IOD) refers to a dominant zonal contrast pattern of sea surface temperature anomaly (SSTA) over tropical Indian Ocean (TIO) on interannual time scales. Its positive phase, characterized by anomalously warm western TIO and anomalously cold southeastern TIO, is usually stronger than its negative phase, namely a positively skewed IOD. Here, we investigate causes for the IOD asymmetry using a prototype IOD model, of which physical processes include both linear and nonlinear feedback processes, El Nino’s asymmetric impact, and a state-dependent noise. Parameters for the model were empirically obtained using various reanalysis SST data sets. The results reveal that the leading cause of IOD asymmetry without accounting seasonality is a local nonlinear process, and secondly the state-dependent noise, the direct effect by the positively skewed ENSO and its nonlinear teleconnection; the latter two have almost equal contribution. However, the contributions by each process are season dependent. For boreal summer, both local nonlinear feedback process and the state-dependent noise are major drivers of IOD asymmetry with negligible contribution from ENSO. The ENSO impacts become important in boreal fall, along with the other two processes.


This work was supported by the National Research Foundation of Korea (NRF) grant funded by the Korea government (MSIT) (NRF-2018R1A5A1024958)

How to cite: Park, H.-J., An, S.-I., Kim, S.-K., Cai, W., Santoso, A., Kim, D., and Kug, J.-S.: Main drivers of Indian Ocean dipole asymmetry revealed by a simple IOD model, EGU General Assembly 2023, Vienna, Austria, 23–28 Apr 2023, EGU23-2165, https://doi.org/10.5194/egusphere-egu23-2165, 2023.

The middepth zonal velocity resembles a system of eastward/westward jets with a considerably smaller width than the larger-scale ocean surface circulation. Such a phenomenon always occurs in a turbulent ocean that presents eddy or eddy–mean flow interactions. In this study, the upper-ocean absolute geostrophic currents in the southern Indian Ocean are constructed using Argo temperature and salinity data from the middepth (1000 m) zonal velocity derived from the Argo float trajectory. The results reveal alternating quasi-zonal striation-like structures of middepth zonal velocity in the equatorial and southern tropical Indian Ocean, with a meridional scale of 300 km. The triad of baroclinic Rossby wave instability plays a significant role in near-equatorial striations. In the south, the  unstable vertical structure leads to strong baroclinic instability, which increases the eddy kinetic energy in the middepth layer, thus contributing to a turbulent PV gradient. The convergence/divergence of the eddy PV flux generates the quasi-zonal striations. The meridional scale of the striations is controlled by the most unstable wavelength of baroclinic instability, which explains the observations.

How to cite: Xia, Y. and Du, Y.: Middepth Zonal Velocity in the Southern Tropical Indian Ocean: Striation-Like Structures and Their Dynamics, EGU General Assembly 2023, Vienna, Austria, 23–28 Apr 2023, EGU23-2472, https://doi.org/10.5194/egusphere-egu23-2472, 2023.

This study analyzed the downwelling Rossby waves in the south Indian Ocean induced spring asymmetric mode and the relationship with the Indian Ocean Dipole (IOD) event based on observations and reanalysis data sets. The westward downwelling Rossby waves favor significant sea surface temperature (SST) warming in the Seychelles thermocline dome that triggers atmosphere response and the asymmetric mode in spring. The zonal sea level pressure gradient causes anomalous easterly winds in the central and eastern equatorial IO, cooling the SST off Sumatra-Java. Meanwhile, the remainder of the downwelling Rossby waves reach the west coast, transform to northward coastal-trapped waves, and then reflect as eastward downwelling Kelvin waves along the equator. The downwelling Kelvin waves reach the Sumatra-Java coast during late spring to early summer, favoring SST warming in the southeastern tropical Indian Ocean. Thus, there are two types of ocean-atmosphere response almost at the same time along the equator. The final SST status depends on which process is stronger, and as a consequence, triggers a negative or a positive phase of the IOD event in the fall season. The results show four positive and three negative IOD events related to the above processes from 1960 to 2019. The strong downwelling Rossby waves are easier to induce intense asymmetric mode and negative IOD event, usually associated with preceding strong El Niño in the Pacific. In contrast, the weak downwelling Rossby waves tend to induce weak asymmetric mode and positive IOD event, usually associated with preceding weak El Niño or anomalous anti-cyclonic atmospheric circulation in the southeastern IO.

How to cite: Zhang, Y. and Du, Y.: Oceanic Rossby waves induced two types of ocean-atmosphere response and opposite Indian Ocean Dipole phases, EGU General Assembly 2023, Vienna, Austria, 23–28 Apr 2023, EGU23-2528, https://doi.org/10.5194/egusphere-egu23-2528, 2023.

EGU23-2532 | Posters on site | OS1.7

Effect of mesoscale eddies on the transport of low-salinity water from the Bay of Bengal into the Arabian Sea during winter 

Jiechao Zhu, Yuhong Zhang, Xuhua Cheng, Xiangpeng Wang, Qiwei Sun, and Yan Du

Abstract: The distribution of sea surface salinity (SSS) in the Arabian Sea (AS) and Bay of Bengal (BoB) is in contrast due to differences in air-sea freshwater fluxes and river runoff inputs.The monsoon-induced inter-basin water exchange plays an important role in regional salinity balance and atmosphere-ocean feedback in the North Indian Ocean. The satellite SSS dataset reveals that significant intraseasonal variability of SSS occurs in the region south of the Indian Peninsula with the strongest amplitude in winter. A case study in autumn-winter of 2016 showed that the Northeast Monsoon Current (NMC) and mesoscale eddies play a dominant role in the intraseasonal variability of the SSS in the region south of the Indian peninsula. In November, the East India Coastal Current (EICC) transports the low-salinity water southward to the region east of Sri Lanka. Meanwhile, a cyclonic eddy develops and propagates westward south of the NMC. Both NMC and the cyclonic eddy advects the low-salinity water westward to the region south of the Indian Peninsula. Then, an anticyclonic eddy generates in the north of the NMC. Thus, an eddy pair forms for more than one and a half months, which develops and propagates westward, transporting low-salinity water westward. The perturbation of mesoscale eddies and SSS gradient leads to the significant intraseasonal variability of SSS there.

Key words: Sea Surface Salinity; intraseasonal variability; mesoscale eddies; North Indian Ocean;

How to cite: Zhu, J., Zhang, Y., Cheng, X., Wang, X., Sun, Q., and Du, Y.: Effect of mesoscale eddies on the transport of low-salinity water from the Bay of Bengal into the Arabian Sea during winter, EGU General Assembly 2023, Vienna, Austria, 23–28 Apr 2023, EGU23-2532, https://doi.org/10.5194/egusphere-egu23-2532, 2023.

EGU23-3426 | ECS | Posters on site | OS1.7

Eddy activity and its role in barrier layer thickness variability in the southeast Indian Ocean 

Marina Azaneu, Adrian Matthews, Karen Heywood, and Rob Hall

Ocean stratification can modulate the upper ocean response and its feedback to atmospheric forcing. Surface freshwater input by advection and precipitation, for example, can change the upper ocean stratification and produce barrier layers. The existence of a barrier layers can affect SST in several ways, for example by reducing entrainment of cooler water at the base of the mixed layer, and consequently may impact air--sea interactions. In the southeastern Indian Ocean, eddies are abundant and can act on transporting warm and fresh waters westward, thus possibly contributing to the formation of barrier layers. Here we initially evaluate the importance of eddy activity in contributing to barrier layer formation and intraseasonal variability in the southern Indian Ocean. Using 15 years (2005-2019) of ocean reanalysis daily data, we estimate how much of the spatial and time variability of barrier layer thickness is related to eddy activity, which is determined by calculating eddy kinectic energy. With the establishment of a relationship between eddy activity and barrier layer thickness, we then proceed to estimate the relationship between barrier layer thickness and local SST anomalies. This way, we seek to infer the significance of eddy activity in affecting SST through barrier layer formation, and thus its potential impact in air--sea interactions and coupled weather systems such as the MJO.

How to cite: Azaneu, M., Matthews, A., Heywood, K., and Hall, R.: Eddy activity and its role in barrier layer thickness variability in the southeast Indian Ocean, EGU General Assembly 2023, Vienna, Austria, 23–28 Apr 2023, EGU23-3426, https://doi.org/10.5194/egusphere-egu23-3426, 2023.

EGU23-3967 | ECS | Orals | OS1.7 | Highlight

Ecosystem impacts due to thermocline depression by the 2019 extreme Indian Ocean Dipole event 

Edward Robinson, Philip Hosegood, Vasiliy Vlasenko, Nataliya Stashchuk, Clara Diaz, Nicola Foster, Joanna Harris, Clare Embling, and Kerry Howell

Tropical atoll habitats are often key conservation targets due to being inhabited by several vulnerable species such as reef manta rays and tropical coral species. These atolls are subject to both basin scale forcing through the Indian Ocean Dipole (IOD), monsoonal variation, and local processes. The steep slopes surrounding these atolls support highly dynamic, energetic nearshore ecosystems which vary over sub-kilometre spatial scales that are poorly resolved in general circulation models. Improving our understanding of how physical oceanographic processes control these local ecosystems, through both in-situ observations, and fine scale models, is critical for enabling informed policy decisions and efficient use of conservation resources. Here we summarise the impact of the local fine scale processes, which are heavily modulated by the monsoon and Indian Ocean Dipole (IOD), on a tropical atoll ecosystem in the central Indian Ocean (IO).

The IOD is experiencing increasingly extreme fluctuations with direct impacts on the depth of the thermocline throughout the western IO. In our observations from 2019, the IOD deepened the thermocline to an unprecedented depth of 100 m, subjecting mesophotic corals to temperatures typical of surface waters and causing significant bleaching. High resolution numerical modelling shows that internal waves, rather than alleviating bleaching, further exacerbate the heating effects preferentially advecting high temperature surface water to increased depths. The wave influence is, however, highly localised, necessitating designated studies at individual sites to understand the spatial heterogeneity in internal wave impacts.

At smaller sub-atoll scales, the IOD also influences the feeding behaviour of reef manta rays, which are more frequently detected in the presence of tidally forced surface-to-bottom temperature gradients. The site of most manta ray detections in the study area is a lipped gully, situated at 60-70 m depth, and colloquially named 'Manta Alley'. During deeper thermoclines, the cooling events within Manta Alley, with which increased reef manta presence is associated, are precluded from occurring due to the deep thermocline, impacting feeding behaviour.

Our results highlight the inherent dynamical complexity in these environments, with the impacts of basin scale processes cascading down to local scales. Improving our understanding of how these dynamics cross-interact with each other, as well as the local ecosystem, enhances the value of biological observations, presenting the opportunity for better informed and more effective conservation strategy.

How to cite: Robinson, E., Hosegood, P., Vlasenko, V., Stashchuk, N., Diaz, C., Foster, N., Harris, J., Embling, C., and Howell, K.: Ecosystem impacts due to thermocline depression by the 2019 extreme Indian Ocean Dipole event, EGU General Assembly 2023, Vienna, Austria, 23–28 Apr 2023, EGU23-3967, https://doi.org/10.5194/egusphere-egu23-3967, 2023.

Using mooring observations and reanalysis, we show that anomalously strong westward Equatorial Undercurrent (wEUC) developed in June–July in 2016 and 1998 in the Indian Ocean, which coincided with extreme Indian Ocean Dipole (IOD) and El Niño events. Simulations show that equatorial Kelvin and Rossby waves were excited by winds associated with El Niño and positive IOD events during 2015 and 1997, and their negative phases during 2016 and 1998. The constructive relationship between the delayed-time contributions of eastern-boundary-reflected-waves that excited by the easterlies in 2015 and 1997 and the direct contributions of wind-forced-waves that excited by the westerlies in 2016 and 1998 resulted in the intensified wEUC. Slow intermediate-order baroclinic-modes, rather than fast low-order baroclinic-modes, dominated the strong wEUC. The eastern-boundary-reflected-waves dominated in 1997–1998 and directly wind-forced-waves dominated in 2015–2016. Our results emphasize the importance of constructive interactions of the directly-wind-forced and boundary-reflected waves in driving the interannual variability of Indian Ocean wEUC.

How to cite: Huang, K.: Successive Co-occurring IOD and ENSO Unprecedentedly Intensify Indian Ocean Westward Equatorial Undercurrent During the Summers of 1998 and 2016, EGU General Assembly 2023, Vienna, Austria, 23–28 Apr 2023, EGU23-5143, https://doi.org/10.5194/egusphere-egu23-5143, 2023.

EGU23-6736 | ECS | Posters on site | OS1.7

How well do CMIP6 models simulate salinity barrier layers in the North Indian Ocean? 

Shanshan Pang, Xidong Wang, and Jérôme Vialard

Previous studies have hypothesized that climatologically thick salinity-stratified Barrier Layers (BL) in the North Indian Ocean (NIO) could influence the upper ocean heat budget, sea surface temperature (SST) and monsoon. Here, we investigate the performance of state-of-the-art climate models from the Coupled Model Intercomparison Project phase 6 (CMIP6) in simulating the barrier layer thickness (BLT) in the NIO. CMIP6 models generally reproduce the main features of the BLT seasonal cycle and spatial distribution, but with a shallow November-February (NDJF) BLT bias in regions with thick observed BLT (eastern equatorial Indian Ocean [EEIO], Bay of Bengal [BoB] and southeastern Arabian Sea [SEAS]). CMIP6 models display an easterly equatorial zonal surface wind bias linked to dry rainfall and cold SST biases in the southern BoB, through the Bjerknes feedback loop. The easterly equatorial bias is also responsible for the shallow isothermal layer depth (ILD) and BLT bias in the EEIO. The underestimated rainfall over the BoB leads to higher sea surface salinity (SSS) and too deep mixed layer depth (MLD), resulting in the BoB BLT bias. The intensity of the easterly equatorial bias also contributes to the inter-model spread in BoB BLT bias, through the propagation of EEIO ILD signals into the coastal waveguide. Finally, the SEAS BLT bias is due to a too deep MLD, which is predominantly controlled by the high SSS related to attenuated monsoonal currents around India and a reduced inflow of BoB low-salinity water. The BL effect on the mixed layer entrainment cooling does not seem to operate in CMIP6 simulations. Rather, deep salinity-related MLD biases in the BoB result in a diminished cooling rate in response to winter negative surface heat fluxes, and hence alleviate cold BoB SST biases. This suggests that salinity effects alleviate the biases that develop through the positive Bejrknes feedback loop between BoB SST, BoB rainfall and equatorial wind stresses in CMIP6.

How to cite: Pang, S., Wang, X., and Vialard, J.: How well do CMIP6 models simulate salinity barrier layers in the North Indian Ocean?, EGU General Assembly 2023, Vienna, Austria, 23–28 Apr 2023, EGU23-6736, https://doi.org/10.5194/egusphere-egu23-6736, 2023.

EGU23-6781 | ECS | Posters on site | OS1.7

On the influence of the Bay of Bengal’s sea surface temperature gradients on rainfall of the South Asian monsoon 

Peter Sheehan, Adrian Matthews, Benjamin Webber, Alejandra Sanchez-Franks, Nicholas Klingaman, and Pn Vinayachandran

The southwest monsoon delivers over 70% of India’s annual rainfall and is crucial to the success of agriculture across much of South Asia. Monsoon precipitation is known to be sensitive to sea surface temperature (SST) in the Bay of Bengal (BoB). Here, we use a configuration of the Unified Model of the UK Met Office coupled to an ocean mixed layer model to investigate the role of upper-ocean features in the BoB on southwest monsoon precipitation. We focus on the pronounced zonal and meridional SST gradients characteristic of the BoB; the zonal gradient in particular has an as-yet unknown effect on monsoon rainfall. We find that the zonal SST gradient is responsible for a local decrease in rainfall over the southern BoB of approximately 5 mm day−1, and an increase in rainfall over Bangladesh and northern India of approximately 1 mm day−1. This increase is remotely forced by a strengthening of the monsoon Hadley circulation. The meridional SST gradient acts to decrease precipitation over the BoB itself, similarly to the zonal SST gradient, but does not have comparable effects over land. The impacts of barrier layers and high-salinity sub-surface water are also investigated, but neither has significant effects on monsoon precipitation in this model; the influence of barrier layers on precipitation is felt in the months after the southwest monsoon. Models should accurately represent oceanic processes that directly influence BoB SST, such as the BoB cold pool, in order to faithfully represent monsoon rainfall.

How to cite: Sheehan, P., Matthews, A., Webber, B., Sanchez-Franks, A., Klingaman, N., and Vinayachandran, P.: On the influence of the Bay of Bengal’s sea surface temperature gradients on rainfall of the South Asian monsoon, EGU General Assembly 2023, Vienna, Austria, 23–28 Apr 2023, EGU23-6781, https://doi.org/10.5194/egusphere-egu23-6781, 2023.

EGU23-6879 | ECS | Orals | OS1.7

Suitability of ocean reanalyses for monitoring of oceanic exchanges through the Indonesian Throughflow 

Magdalena Fritz, Leopold Haimberger, and Michael Mayer

The Indonesian Seas are characterized by numerous narrow channels connecting basins and seas of varying sizes and depths that serve as a transition between the Pacific and the Indian Ocean, known as the Indonesian Throughflow (ITF). The interaction between the ITF and important climate anomalies such as the El Niño Southern Oscillation (ENSO), the Indian Ocean Dipole (IOD), or the Australian-Indonesian monsoon indicates the high relevance for monitoring the ITF region. In situ observations of ITF transports are highly valuable but are temporally and spatially limited. Hence, near real-time monitoring is only possible with reanalyses, yet their quality needs to be evaluated. Here we present an assessment of oceanic transports in the ITF diagnosed from the Copernicus Marine Service (CMEMS) Global Reanalysis Ensemble Product (GREP) and the higher-resolution product GLORYS12V1. Validation data comes from several moorings in Makassar strait, Lombok strait, Ombai strait, and Timor passage, obtained as part of the well-known INSTANT (2004-2006) and MITF (2006-2011 and 2013-2017 in Makassar) campaigns. The campaigns provide a total of 11.5 years of in situ observations in Makassar, therefore allowing the assessment of the mean seasonal cycle of ITF transport and a thorough investigation of the shorter sampled outflow passages. The results showcase that reanalysis-based volume transports agree reasonably well with in situ observations, however, some aspects, such as asymmetries in the flow through each strait, are more accurately represented by GLORYS12V1. Also, in terms of mean integrated transports, the increased horizontal resolution of GLORYS12V1 leads to a better performance in the narrower straits of Lombok and Ombai. Furthermore, we draw attention to an apparent one-month lag between reanalyses and observations in Makassar strait transports, which we assess by studying the influence of the monsoon-driven (vertically varying) pressure gradient on the ITF.

How to cite: Fritz, M., Haimberger, L., and Mayer, M.: Suitability of ocean reanalyses for monitoring of oceanic exchanges through the Indonesian Throughflow, EGU General Assembly 2023, Vienna, Austria, 23–28 Apr 2023, EGU23-6879, https://doi.org/10.5194/egusphere-egu23-6879, 2023.

EGU23-7577 | ECS | Orals | OS1.7

Nutrient fluxes in the greater Agulhas Current region: signals of local and remote Indian Ocean nitrogen cycling 

Tanya Marshall, Daniel Sigman, Lisa Beal, Alan Foreman, Alfredo Martínez-García, Stéphane Blain, Ethan Campbell, François Fripiat, Robyn Granger, Eesaa Harris, Gerald Haug, Dario Marconi, Sergey Oleynik, Patrick Rafter, Raymond Roman, Kolisa Sinyanya, Sandi Smart, and Sarah Fawcett

The Agulhas Current in the southwest Indian Ocean is the strongest western boundary current on Earth. The major role of the Agulhas Current in driving significant heat and salt fluxes is well known, yet its biogeochemical fluxes remain largely uncharacterised. Here, we use nitrate isotopes (δ15N, δ18O, and Δ(15-18) = δ15N-δ18O) to evaluate nutrient supply mechanisms that ultimately support new production in the southwest Indian Ocean. Across the greater Agulhas region, thermocline nitrate-δ15N is lower (4.9-5.8‰) than the underlying Subantarctic Mode Water source (δ15N of 6.9‰) and the upstream source regions (where nitrate-δ15N ranges from 6.4-7.0‰), which we attribute to local N2 fixation. Using a one-box model to simulate the newly-fixed nitrate flux, we estimate a local N2 fixation rate of 7-25 Tg N.a-1, amounting to ~30-95% of the whole Indian Ocean nitrogen gain estimated by models. Thermocline and mixed-layer nitrate Δ(15-18) is also low, due to both N2 fixation and coupled partial nitrate assimilation and nitrification. This local nitrogen cycling imprints an isotopic signal on Indian Ocean nitrate that persists in Agulhas rings that “leak” into the South Atlantic and are subsequently transported northwards. If this signal is retained in calcifying organisms (e.g., foraminifera) deposited on the seafloor, it could be used to trace past Agulhas leakage, yielding quantitative insights into the strength of the Atlantic Meridional Overturning Circulation over time. In addition to local N2 fixation, the nitrate isotopes reveal three physical mechanisms of subsurface nitrate supply: i) inshore upwelling driven by the current and winds, ii) entrainment at the edges of a mesoscale eddy, and iii) density-driven overturning at the current edge induced by strong horizontal velocity and density shears. All these nitrate supply mechanisms are evident as incidences of relatively high-Δ(15-18) nitrate in the thermocline and surface yet the intensity and subsurface expression of some of them is not apparent in the physical data, highlighting the utility of the nitrate isotopes for exploring physical ocean processes. The high mesoscale variability that likely drives subsurface nitrate supply to Agulhas Current surface waters is common to all western boundary currents, implying that vertical nitrate entrainment is quantitatively significant in all such systems. We posit that along with N2 fixation, physical mechanisms of upward nitrate supply enhance ocean fertility and possibly carbon export in the South Indian Ocean. Higher rates of warming, and thus thermal stratification, are expected to decrease Indian Ocean productivity more rapidly in the future than that of other ocean basins. However, a coincident increase in eddy kinetic energy across boundary currents may enhance the upward nutrient supply, partially offsetting the stratification-driven decline in productivity.

How to cite: Marshall, T., Sigman, D., Beal, L., Foreman, A., Martínez-García, A., Blain, S., Campbell, E., Fripiat, F., Granger, R., Harris, E., Haug, G., Marconi, D., Oleynik, S., Rafter, P., Roman, R., Sinyanya, K., Smart, S., and Fawcett, S.: Nutrient fluxes in the greater Agulhas Current region: signals of local and remote Indian Ocean nitrogen cycling, EGU General Assembly 2023, Vienna, Austria, 23–28 Apr 2023, EGU23-7577, https://doi.org/10.5194/egusphere-egu23-7577, 2023.

EGU23-8672 | Posters on site | OS1.7

Exploring the Climate-change induced dissolved inorganic carbon trends in the Indonesian Seas and their link to a changing Indonesian Throughflow using a regional downscaling of future climates 

Anna Katavouta, Jeff Polton, Jennifer Jardine, Dale Partridge, Svetlana Jevrejeva, and Jason Holt

The Indonesian Seas act as a main pathway of water transport from the Pacific to the Indian Ocean, known as the Indonesian Throughflow (ITF). Climate-induced changes in the regional water properties within the Indonesian Seas could have extensive impacts on the large-scale ocean budgets, as the ITF will carry these signals from the Indonesian Seas across the Indian Ocean’s upper thermocline. Here, we investigate the impacts of climate change on the Indonesian Seas’ dissolved inorganic carbon (DIC) budget using a regional ocean physics/biogeochemistry model for South East Asia that downscales climate projections from an Earth System Model under the RCP 8.5 scenario. The regional model has a horizontal resolution of about 9 km, uses a hybrid depth-terrain following vertical coordinate system and explicitly includes tides so as to better resolve the shelf-seas processes. A transport-based framework is used to explore the role of climate-induced changes of the ITF on the carbon storage within the Indonesian Seas. Specifically, the DIC trends are separated into: (i) an “added contribution” associated with the uptake of additional carbon from the atmosphere due to carbon emissions, and (ii) a “dynamic redistribution” of the pre-existing ocean DIC associated with changes in the circulation due to climate change. Our analysis reveals that in the next decades, although carbon emissions will lead to an ocean carbon uptake and an increase in the DIC within the Indonesian Seas, a plausible climate-induced weakening in the ITF can lead to either an increase or a decrease in the DIC at different depths associated with different water masses. Hence, the effects of global carbon emissions on the carbon budget within the Indonesian Seas, and particularly whether local waters will experience a lower or higher increase in DIC than the rest of the ocean, are controlled by the dynamical redistribution associated with the response of the ITF to climate change.   

How to cite: Katavouta, A., Polton, J., Jardine, J., Partridge, D., Jevrejeva, S., and Holt, J.: Exploring the Climate-change induced dissolved inorganic carbon trends in the Indonesian Seas and their link to a changing Indonesian Throughflow using a regional downscaling of future climates, EGU General Assembly 2023, Vienna, Austria, 23–28 Apr 2023, EGU23-8672, https://doi.org/10.5194/egusphere-egu23-8672, 2023.

EGU23-9682 | ECS | Posters on site | OS1.7

Relative contribution of eddies ant atmospheric forcing to the Bay of Bengal non-seasonal Sea Surface Salinity Variability 

Marie Montero, Clément de Boyer Montégut, Jérôme Vialard, William Llovel, Thierry Penduff, Jean-Marc Molines, Stephanie Leroux, Nicolas Reul, and Jean Tournadre

The Bay of Bengal (BoB) Sea Surface Salinity (SSS) is highly contrasted and variable, in response to the large monsoonal wind and freshwater forcing. In addition to this strong seasonal cycle, previous studies have underlined strong SSS non-seasonal variations associated with the Indian Ocean Dipole (IOD) and mesoscale eddies. In this study, we quantify the relative contributions of externally forced (wind, freshwater) and internally generated (mesoscale eddies) SSS non-seasonal variability in the BoB. To that end, we use Ocean General Circulation Model 10-member ensemble experiments from the IMHOTEP (IMpacts of freshwater discHarge interannual variability on Ocean heaT-salt contents and rEgional sea-level change over the altimetry Period) project.
The model reproduces the large forced interannual SSS signals in the Northernmost part of the BoB and along the east coast of India, associated with the East Indian Coastal Current (EICC) modulation by the IOD. The internal SSS variability is largest in boreal fall in the North-Western BoB and more tightly controlled by the climatological SSS gradient distribution than by that of eddy kinetic energy. The external atmospheric forcing dominates the total variability in the regions of strongest variability, near the Ganges mouth and along the east coast of India in boreal fall and winter. Internal variability, however, contributes to 50-70% of the variability further offshore in boreal fall and winter. This confirms the strong role of eddies in controlling the freshwater extension up to ~700 km away from the coast, through stirring of the intense gradient between the coastal fresh and offshore saltier water. We finally discuss the consequences of these findings for comparing model and observations, in view of the chaotic nature of internal eddy variability.

How to cite: Montero, M., de Boyer Montégut, C., Vialard, J., Llovel, W., Penduff, T., Molines, J.-M., Leroux, S., Reul, N., and Tournadre, J.: Relative contribution of eddies ant atmospheric forcing to the Bay of Bengal non-seasonal Sea Surface Salinity Variability, EGU General Assembly 2023, Vienna, Austria, 23–28 Apr 2023, EGU23-9682, https://doi.org/10.5194/egusphere-egu23-9682, 2023.

EGU23-11289 | ECS | Posters on site | OS1.7 | Highlight

Characteristics and Drivers of Marine Heatwaves in the Western Equatorial Indian Ocean 

Ruisi Qi, Ying Zhang, Yan Du, and Ming Feng

The spatio-temporal characteristics of the interannual variability and long-term trend of the marine heatwaves (MHWs) and related dynamic mechanisms in the western equatorial Indian Ocean (WEIO) are investigated using satellite observations. A prominent MHW hot spot is found in a region of the WEIO (48°E-54°E, 2°S-2°N), with a mean MHWs' intensity, duration, and frequency of 1.54°C, 13.33 days, and 1.97 times, respectively. MHWs in the hot spot region have significant interannual variability after removing the long-term trend, associated with Indo-Pacific major climate modes. In 1982/1983, 1983/1984, 1987/1988, 1997/1998, 2006/2007, 2009/2010, 2011/2012, 2012/2013, 2014/2015, 2015/2016, and 2019/2020, the MHWs occurred with longer duration, higher frequency, and more total days. These years correspond to a positive Indian Ocean Dipole, or an El Niño event, or both. The occurrence of MHWs accompanied by anomalous positive sea surface height suggests that oceanic planetary wave processes modulate MHWs in the WEIO. Westward-propagating downwelling equatorial Rossby waves triggered by anomalous equatorial easterly winds drive the convergence of warm upper-ocean water and weaken the upwelling of cool subsurface water, which favor anomalously warm sea surface temperature (SST) and the occurrence of MHWs. In addition, the westward-propagating off-equatorial downwelling Rossby waves in the southern tropical Indian Ocean also affect MHWs in the WEIO through the propagation and reflection of waves. The annual MHW frequency, duration, and total days in the hot spot region increase up to 1.56 times, 4.95 days, and 31.72 days per decade, respectively, related to the significant increase in mean SST under global warming.

How to cite: Qi, R., Zhang, Y., Du, Y., and Feng, M.: Characteristics and Drivers of Marine Heatwaves in the Western Equatorial Indian Ocean, EGU General Assembly 2023, Vienna, Austria, 23–28 Apr 2023, EGU23-11289, https://doi.org/10.5194/egusphere-egu23-11289, 2023.

EGU23-11965 | ECS | Posters on site | OS1.7

118-year hydroclimate reconstruction from Christmas Island (Indian Ocean); an extended record of variability in the Indonesian Throughflow 

Jessica A. Hargreaves, Nerilie Abram, and Jennie Mallela

Future climate trends indicate that changes in temperature and precipitation are likely to influence global supply chains, agricultural productivity, water security, health and well-being; particularly in densely populated nations across the southeast Indian Ocean region. The Indonesian Throughflow is an ocean current that transports low-latitude, warm and relatively fresh water from the western Pacific into the eastern Indian Ocean. It is thought that variability and changes in the Indonesian Throughflow have significant impacts on the climate and oceanography of the Indo-Pacific region. The short coverage of observational records makes assessments of hydrological changes across the region challenging on longer timescales, with changes before the 1970s being particularly unreliable. An extended record of Indonesian Throughflow variability needs to be established to contextualise changes and improve model projections of future variability.

Christmas Island, located in the southeast Indian Ocean (not to be confused with the Pacific Ocean Kiritimati Island), is located along an outflow of the Indonesian Throughflow. This Island is an ideal location to develop new palaeo-reconstructions of sea surface temperature and hydroclimate, extending our understanding of Indonesian Throughflow variability. Here we present a newly developed coral palaeoclimate reconstruction for Christmas Island, covering the last 118 years at approximately monthly-fortnightly resolution. Corals are sensitive recorders of critical environmental variables, including sea surface temperature and hydroclimate through the analysis of paired stable oxygen isotopes (δ18O) and trace element (Sr/Ca) ratios. This reconstruction consists of a composite of four newly developed coral records and one previously published record and provides a newly developed δ18Osw variability record for the region. The newly developed δ18Osw coral reconstruction correlates strongly with salinity variability, however, presents a weak relationship to in-situ precipitation, indicating that coral hydroclimate reconstructions from Christmas Island likely isolate salinity variability associated with changes in the strength of the Indonesian Throughflow. This relationship highlights the importance that ocean advection plays on δ18Osw variability at this site. Comparisons to both observational records of the Indonesian throughflow, and previously published coral δ18Osw records from the Ombai Strait (Timor), a major outflow passage, reveal strong relationships to variability at Christmas Island. The Christmas Island reconstruction provides a unique opportunity to extend current knowledge of the Indonesian Throughflow beyond the observational record. This Christmas Island record also provides an opportunity to evaluate the impact that interannual to multidecadal variability has on the climate across the southeast tropical Indian Ocean.

How to cite: Hargreaves, J. A., Abram, N., and Mallela, J.: 118-year hydroclimate reconstruction from Christmas Island (Indian Ocean); an extended record of variability in the Indonesian Throughflow, EGU General Assembly 2023, Vienna, Austria, 23–28 Apr 2023, EGU23-11965, https://doi.org/10.5194/egusphere-egu23-11965, 2023.

EGU23-12048 | ECS | Orals | OS1.7

An asymmetric change in circulation and nitrate transports around the Bay of Bengal 

Jenny Jardine, Sarah Wakelin, Jason Holt, Anna Katavouta, and Dale Partridge

The Bay of Bengal is a dynamic region that experiences intense freshwater runoff, extreme meteorological events, and seasonal reversing surface currents. The region is particularly susceptible to anthropogenic climate change, driven in part by large air-sea fluxes, persistent freshwater stratification, and low overturning rates. Predicting how this ecosystem is likely to change in the future is paramount for planning effective mitigation strategies. Using a relocatable, coupled physics-ecosystem model (NEMO-ERSEM), we investigate the future changes in surface circulation and coastal nitrate pathways in the Bay of Bengal from 1980 to 2060, using a “business-as-usual" (RCP 8.5) climate change scenario. We find that future surface currents during the Summer and Fall Inter-monsoon seasons are reduced in the north/north-eastern Bay and strengthened in the south-western Bay. Coastal nitrate transports around the Bay mirror this asymmetric change, with coastal nitrate transports at 17.5oN decreasing by 185.7 mol N s-1, despite increased riverine runoff from the Ganges and Irrawaddy River systems. This results in a positive feedback loop whereby the northern Bay becomes progressively fresher and more nutrient-rich, strengthening the barrier layer and increasing the risk of toxic algal blooms and eutrophication events. Conversely, in the south-western Bay (12oN), coastal nitrate transports increase by 1317.8 mol N s-1, driven primarily by an intensified Sri Lanka Dome, that promotes localised diatom blooms despite negligible changes in regional river runoff. This work highlights the need for more rigorous ecosystem modelling and future scenario testing. 

How to cite: Jardine, J., Wakelin, S., Holt, J., Katavouta, A., and Partridge, D.: An asymmetric change in circulation and nitrate transports around the Bay of Bengal, EGU General Assembly 2023, Vienna, Austria, 23–28 Apr 2023, EGU23-12048, https://doi.org/10.5194/egusphere-egu23-12048, 2023.

EGU23-12052 | Posters on site | OS1.7

The occurrence and distribution of microplastics in epipelagic zone of the western Indian Ocean 

Eun-Ran Baek, Minju Kim, Dong-Jin Kang, and Jung-Hoon Kang

This study investigated the occurrence and distribution of microplastics utilizing zooplankton samples collected in the Western Indian Ocean because there is no information concerning epipelagic zone in the open ocean. We collected microplastics from three water layers [surface mixed layer(SML), middle layer(ML), lower layer(LL)] within 200 m using a Multiple Opening/Closing Net and Environmental Sensing (opening: 1 ㎡) at 22 stations of 1 degree interval between 5°N and 16°S along the 67°E of Western Indian Ocean in 2017. The microplastics were consistently found in almost all samples and the microplastic abundance ranged between 0.00-2.01 particles/㎥ from the 3 layers. And the average microplastic abundance was highest in the lower layer (0.30±0.09 particles/㎥) and lowest in middle layer (0.26±0.08 particles/㎥). The percentage of fiber was highest in the SML (55.7%) and the LL (45.9%), and the percentage of film was highest in ML (46.8%). The microplastic abundance in the size of 1.0-5.0 ㎜ was highest in SML (42.0%), while the abundance in the size of 0.2-0.5 ㎜ was highest in ML(56.8%) and LL(54.5%). The stations can be divided into four sections including upwelling characterized by Seychelles-Chagos Thermal Ridge (SCTR) based on the 20℃-isotherm depth (D20). The average microplastic abundance was the highest in SML (0.23±0.06 particles/㎥) in 1°S~5°S, and in LL (0.50±0.25 particles/㎥) at latitudes of 10°S~16°S and in LL (0.32±0.16 particles/㎥) at latitudes between 5°N~EQ. However, the average microplastic abundance at latitudes of 6°S ~9°S corresponding to the upwelling zone was highest in the ML (0.65±0.38 particles/㎥) with the high percentage of film (68.7%). Cluster analysis by microplastics occurred in each water layers showed that the stations were divided into 3 groups in each layer. Groups in SML and LL were mainly clustered by fiber, whereas groups in ML was mainly clustered by film, which was associated with the upwelled region of Seychelles-Chagos Thermal Ridge (SCTR). Fourier transform infrared spectroscopy analysis showed that the main types of microplastics were dominated by fiber (40.6%) and film (73.2%) characterized by polycarbonate. Present results showed that meridional and vertical distribution of microplastics in the epipelagic zone varied with the physical characteristics of upwelling zone characterized by Seychelles-Chagos Thermal Ridge (SCTR) in the Western Indian Ocean.

How to cite: Baek, E.-R., Kim, M., Kang, D.-J., and Kang, J.-H.: The occurrence and distribution of microplastics in epipelagic zone of the western Indian Ocean, EGU General Assembly 2023, Vienna, Austria, 23–28 Apr 2023, EGU23-12052, https://doi.org/10.5194/egusphere-egu23-12052, 2023.

EGU23-15102 | ECS | Orals | OS1.7

Indian Ocean mean state biases and IOD behaviour in CMIP6 multimodel ensemble 

Marimel Gler, Andy Turner, Linda Hirons, Caroline Wainwright, and Charline Marzin

The Indian Ocean Dipole (IOD) is the main coupled mode of interannual variability in the equatorial Indian Ocean. The largest IOD event in 2019 is thought to have influenced the strong Indian monsoon precipitation, widespread Australian bushfires, and extreme rainfall and flooding in East Africa during that year. Despite its socio-economic importance, the region suffers large biases in weather and climate models used for seasonal forecasts and climate projections.

In this study, the performance of 42 models from the sixth phase of the Coupled Model Intercomparison Project (CMIP6) in reproducing the observed climate over the Indian Ocean is examined. Model simulations of precipitation and 850 hPa winds in the Atmospheric Model Intercomparison Project (AMIP) experiments for the period 1979-2014 are compared to observational and reanalysis data. Biases in the mean state during boreal summer (JJA) in the AMIP models are analysed to determine whether biases in the seasonal cycle established in JJA impact the IOD behaviour. Skill metrics are calculated to quantify the model performance in reproducing the observed JJA mean state and cluster analysis on the mean state biases is performed to characterise bias patterns in summer that may affect the Indian Ocean seasonal cycle and IOD. Results show that AMIP models simulate varying bias patterns in JJA and that the AMIP multi-model mean outperforms all individual models in reproducing the observed JJA mean state. For comparison, the Indian Ocean mean state biases are investigated in coupled models from the 20th-century all-forcings (CMIP) experiments to determine the impact of ocean-atmosphere coupling and coupled sea surface temperature biases on model performance. The IOD behaviour in the AMIP and CMIP models is assessed and the response of the atmospheric circulation to IOD forcing is examined by performing regression analysis. We investigate whether the ability of a model to capture characteristics of the IOD and simulate IOD teleconnection patterns is related to its representation of the mean state. We expand this work to investigate the variability in the Indian Ocean in the Met Office Global Seasonal Forecasting System version 6, GloSea6, with a focus on examining the systematic errors that develop in the region. The work will contribute to our understanding of Indian Ocean biases in weather and climate models, and their likely sources, and thus the wider implications for predictability of the IOD.  

How to cite: Gler, M., Turner, A., Hirons, L., Wainwright, C., and Marzin, C.: Indian Ocean mean state biases and IOD behaviour in CMIP6 multimodel ensemble, EGU General Assembly 2023, Vienna, Austria, 23–28 Apr 2023, EGU23-15102, https://doi.org/10.5194/egusphere-egu23-15102, 2023.

EGU23-15432 | ECS | Orals | OS1.7 | Highlight

Multi-decadal changes in the Indian Ocean heat content from a grand ensemble perspective 

Lukas Fiedler, Vimal Koul, Eduardo Alastrué de Asenjo, Sebastian Brune, and Johanna Baehr

Ocean heat content observations in the Indian Ocean have revealed distinctive periods of significant multi-decadal trends — for example a cooling between 1990 and 1999 followed by an unprecedented warming between 2000 and 2009. However, a systematic assessment of the relative importance of anthropogenic forcings versus natural variability in driving such trends is still missing. Here, we utilise four state-of-the-art Single Model Initial- Condition Large Ensembles with MPI-ESM1.2-LR containing different factual and counterfactual forcing scenarios to address the problem. We are able to robustly attribute the unprecedented warming of the Indian Ocean between 2000 and 2009 to the increasing anthropogenic greenhouse gas emissions. Our results also reveal that the preceding cooling is likely to be intrinsic to Indian Ocean heat content variability, since none of the applied counterfactual scenarios exhibits such an observed decrease in Indian Ocean heat content. Furthermore, we trace the underlying reasons for the observed inherent cooling between 1990 and 1999 to a significant reduction in heat transported into the Indian Ocean from the Pacific Ocean by the Indonesian Throughflow. These results have implications for decadal predictions of Indian Ocean heat content.

How to cite: Fiedler, L., Koul, V., Alastrué de Asenjo, E., Brune, S., and Baehr, J.: Multi-decadal changes in the Indian Ocean heat content from a grand ensemble perspective, EGU General Assembly 2023, Vienna, Austria, 23–28 Apr 2023, EGU23-15432, https://doi.org/10.5194/egusphere-egu23-15432, 2023.

EGU23-37 | Orals | AS1.24

Nonlinear intensification of monsoon low pressure systems by the BSISO 

Kieran Hunt and Andrew Turner

More than half of the rainfall brought to the Indian subcontinent by the summer monsoon is associated with low-pressure systems (LPSs). Yet their relationship with the Boreal Summer Intraseasonal Oscillation (BSISO) – the dominant intraseasonal forcing on the monsoon – is only superficially understood. Using reanalysis data, we explore the relationship between the BSISO and LPS intensity, propagation, and precipitation, and associated underlying mechanisms.

The BSISO has a large impact on mean monsoon vorticity and rainfall as it moves northward – maximising both in phases 2-3 over southern India and phases 5-6 over northern India – but a much weaker relationship with total column water vapour. 
We present evidence that LPS genesis also preferentially follows these phases of the BSISO.
We identify significant relationships between BSISO phase and LPS precipitation and propagation: for example, during BSISO phase 5, LPSs over north India produce 51% heavier rainfall and propagate northwestward 20% more quickly.
Using a combination of moisture flux linearisation and quasigeostrophic theory, we show that these relationships are driven by changes to the underlying dynamics, rather than the moisture content or thermodynamic structure, of the monsoon.

Using the example of LPSs over northern India during BSISO phase 5, we show that the vertical structure of anomalous vorticity can be split into contributions from the BSISO background circulation and the nonlinear response of the LPS to anomalous BSISO circulation. Complementary hypotheses emerge about the source of this nonlinear vorticity response: nonlinear frictional convergence and secondary barotropic growth. We show that both are important. The BSISO imparts greater meridional shear on the background state, supporting LPS intensification. The BSISO background and nonlinear LPS response both contribute significantly to anomalous boundary layer convergence, and we show through vortex budget arguments that the former supports additional LPS intensification in boundary layer while the latter supports faster westward propagation.

This work therefore yields important insights into the scale interactions controlling one of the dominant synoptic systems contributing to rainfall during the monsoon.

How to cite: Hunt, K. and Turner, A.: Nonlinear intensification of monsoon low pressure systems by the BSISO, EGU General Assembly 2023, Vienna, Austria, 23–28 Apr 2023, EGU23-37, https://doi.org/10.5194/egusphere-egu23-37, 2023.

EGU23-49 | ECS | Posters on site | AS1.24

Subseasonal strength reversal of the East Asian winter monsoon 

Wogu Zhong and Zhiwei Wu

As one of the most significant circulation systems over the Northern Hemisphere in the cold season, the East Asian winter monsoon (EAWM) has been broadly investigated from the seasonal-mean perspective, while subseasonal variations in the EAWM still remain ambiguous. Based on Season-reliant Empirical Orthogonal Function (S-EOF) analysis, this study shows that the subseasonal strength reversal of the EAWM (SR-EAWM), featuring a weaker (or stronger) EAWM in early winter (December) and a stronger (or weaker) EAWM in late winter (January-February), is a distinct leading mode of the month-to-month variation of the EAWM. The weak-to-strong SR-EAWM is characterized by an anomalous low over Eurasia and a weakened East Asian major trough (EAT) in early winter, with an intensified Siberian High and a deepened EAT in late winter. The SR-EAWM is preceded by surface air temperature anomalies over Davis Strait (DST) and those over central-eastern North America (CENAT) in September-October. The DST mainly influences the SR-EAWM in early winter through a “sea ice bridge” of the November Baffin Bay sea ice concentration anomaly (BBSIC). The BBSIC could intensify the DST in December by altering surface heat flux, thus exciting a downstream atmospheric response and modulating the strength of the EAT in early winter. The preceding CENAT affects the SR-EAWM in late winter by inducing an “ocean bridge” of the western North Atlantic sea surface temperature anomaly (WNASST). The WNASST can persist into late winter and then significantly affects the SR-EAWM by regulating Eurasian circulation anomalies and the downstream EAT. The bridge roles of the BBSIC and WNASST can be further verified by a linear baroclinic model. Finally, two physical-empirical models are established using the DST/BBSIC and the CENAT indices, respectively. Both exhibit promising prediction skills. The results highlight that the DST, BBSIC, and CENAT are crucial predictability sources for the SR-EAWM.

How to cite: Zhong, W. and Wu, Z.: Subseasonal strength reversal of the East Asian winter monsoon, EGU General Assembly 2023, Vienna, Austria, 23–28 Apr 2023, EGU23-49, https://doi.org/10.5194/egusphere-egu23-49, 2023.

Understanding the natural variability of Indian summer monsoon (ISM) is a crucial aspect relevant for decadal climate predictions and climate change studies. The multidecadal variability of ISM is known to have a close association with the Atlantic multidecadal oscillations (AMO). Several teleconnection pathways have been suggested to explain the co-variability of the AMO and ISM in multidecadal timescales. One hypothesis is that the AMO modulates the interannual North Atlantic Oscillation (NAO) mode and there by influences the monsoon via Eurasian temperature modulations. Direct atmospheric teleconnection, across Eurasia, through upper-level circulation anomalies has also been attributed to the observed AMO-ISM relationship. Another possibility is the AMO modulating the monsoon via the Pacific pathway through the atmospheric bridge mechanism and associated modulations of the Hadley-Walker circulations. The Last millennium (LM) (851-1848) climate simulations part of the PMIP3/CMIP5 gives an opportunity to better understand the fidelity of climate models in capturing the AMO-ISM teleconnection mechanisms. In this study we explore how well the proposed mechanisms are represented in eight global climate models (GCM) LM simulations. Such a study, assessing the validity of different AMO-monsoon teleconnection mechanisms in different model climates provides crucial information about how reliable the respective GCMs may be in making decadal climate predictions.

How to cite: Dutta, A., Sivankutty, R., and Joseph Mani, N.: Investigating the Atlantic-Indian summer monsoon multidecadal teleconnections in the PMIP3/CMIP5 Last Millennium simulations, EGU General Assembly 2023, Vienna, Austria, 23–28 Apr 2023, EGU23-191, https://doi.org/10.5194/egusphere-egu23-191, 2023.

EGU23-426 | ECS | Orals | AS1.24

Role of background moisture in dictating the Intraseasonal Rainfall over Bay of Bengal 

Aditya Kottapalli and Vinayachandran Pn

The northward propagating intraseasonal Oscillation (ISO) is one of the dominant modes of tropical variability during Boreal summers. Several mechanisms have been proposed to explain northward propagation. Yet the factors that decide the ISO rainfall over a particular region remains elusive. in this  study we show that the ISO rainfall anomalies weaken across the south Bay of Bengal (SBoB) before they re-strengthen over the north Bay of Bengal (NBoB). We use the moisture budget to understand the reason for the same. We find that the horizontal moisture flux convergence predominantly controls the ISO rainfall anomalies over the two regions. Further analyses reveal that the convergence of background moisture by the ISO wind perturbations decides the ISO rainfall structure. We hypothesize that the weaker rainfall anomalies in the SBoB result from the weaker background column relative humidity and moisture, which do not allow the initial dynamic perturbations to grow as fast as they do in an environment with stronger background relative humidity and moisture (NBoB). 

How to cite: Kottapalli, A. and Pn, V.: Role of background moisture in dictating the Intraseasonal Rainfall over Bay of Bengal, EGU General Assembly 2023, Vienna, Austria, 23–28 Apr 2023, EGU23-426, https://doi.org/10.5194/egusphere-egu23-426, 2023.

EGU23-436 | ECS | Orals | AS1.24

Role of thermodynamic processes in driving Monsoon Intraseasonal Oscillations (MISO) away from the Equator 

Rajat Masiwal, Vishal Dixit, and Ashwin K Seshadri

Monsoon intraseasonal oscillation (MISO) is an important aspect of the monsoon variability on various timescales, accounting for short-term variability as well as about 40% of total seasonal rainfall variance. MISO plays an important role in modulating the active (wet) and break (dry) spells of monsoon, and its low-frequency component has a time period of 30-60 days and exhibits northward propagation from the equatorial Indian Ocean to the Himalayan foothills. This northward propagation is generally attributed to generation of positive barotropic vorticity to the north of the previous convection centre. However, using ERA5 reanalysis composites we show that the relation between convection centre and positive barotropic vorticity undergoes significant change as MISO propagates away from the equator. Close to the equator (0-15°N), barotropic voriticty is either in-phase or leads rainfall, whereas further poleward (15°N-25°N), this relationship reverses and rainfall leads vorticity by 1-2 days. This contrast is closely tied to changes in the vertical structure of vorticity: near the equator, the vorticity maximum lies in the middle troposphere, while poleward of 15°N it is in the lower troposphere. The vorticity budget at each pressure level reveals the importance of vertical advection of vorticity for its near-barotropic structure, together with the importance of thermodynamic influences on vorticity, especially poleward where the vortex stretching term grows. Such findings point to the central role of feedback on the dynamics from the thermodynamic processes away from the equator. Furthermore, it closely ties the ability of models to reproduce MISO to their ability to represent convective processes.


How to cite: Masiwal, R., Dixit, V., and Seshadri, A. K.: Role of thermodynamic processes in driving Monsoon Intraseasonal Oscillations (MISO) away from the Equator, EGU General Assembly 2023, Vienna, Austria, 23–28 Apr 2023, EGU23-436, https://doi.org/10.5194/egusphere-egu23-436, 2023.

EGU23-546 | ECS | Posters on site | AS1.24

Precipitation and temperature variability in Vietnam during Marine Isotope Stage 3 from terrestrial biomarkers 

Trang Tran, Lora Stevens-Landon, Jessica Tierney, Patrick Murphy, and Tich Vu-Van

Southeast (SE) Asia is located in a transitional zone where hydroclimate is controlled by both the Indian and East Asian summer monsoon branches. Recent proxy-based studies and climate models suggest that the hydroclimate of SE Asia may be out of phase with neighboring regions, such as India and China. However, we lack sufficient proxy records to verify this postulation or to identify spatial and temporal variations. This study reconstructs both past temperatures and effective moisture in Central Vietnam during Marine Isotope Stage 3 (approximately 50,00 to 30,000 years BP) to determine how these two climate variables relate in the past. Terrestrial temperatures and precipitation are reconstructed using biomarkers (branched glycerol dialkyl glycerol tetraethers, brGDGT) and compound-specific isotope analyses (carbon and hydrogen-isotopic values of leaf wax n-acids, δ13Cwax, and δDwax) from a buried peat deposit in the Central Highlands of Vietnam. The brGDGTs-derived annual temperatures range from 22.9 to 26.2°C and show a warming trend coincident with a weakening of summer insolation. A coincident and gradual enrichment of δ13Cwax from 47 to 33 kyr BP suggests a transition from C3 to C4 vegetation dominance. Such a response could signal an overall decrease in precipitation or a shift in the seasonality of precipitation. The δDwax data, however, do not indicate an overall drying trend, which supports the idea that a shift in the seasonality of rainfall, along with higher annual temperatures, is driving the vegetation change. In addition, the δDwax records may exhibit a trend opposite to a site in Thailand. We argue that the isotopic variability in the precipitation of Central Vietnam reflects the shift in moisture sources along with the shift in seasonality. In this case, an increase in amount of precipitation derived from the South China Sea in winter months is marked by rain enriched in δ2H-which could also be interpreted as a decrease in precipitation. The increase in rainfall during winter monsoon months (e.g. winter) in the Central Highlands of Vietnam does not appear to reach Thailand. We recommend that the precipitation proxies should be applied with knowledge of regional climate context and argue that better geographic representation of monsoonal climates is necessary to fully understand and model this critical climate system.

How to cite: Tran, T., Stevens-Landon, L., Tierney, J., Murphy, P., and Vu-Van, T.: Precipitation and temperature variability in Vietnam during Marine Isotope Stage 3 from terrestrial biomarkers, EGU General Assembly 2023, Vienna, Austria, 23–28 Apr 2023, EGU23-546, https://doi.org/10.5194/egusphere-egu23-546, 2023.

EGU23-658 | ECS | Posters on site | AS1.24

The complexity of South China Sea summer monsoon onset 

Tian Ma and Weidong Yu

The complexity of the South China Sea (SCS) summer monsoon (SCSSM) onset is mainly reflected in the interaction of multiscale processes that include the seasonal cycle, 10-25-day ISO (HISO), 30-60-day ISO (LISO). In this study, the characteristics and mechanism of the HISO and LISO and their interaction with the background field are investigated when they trigger the SCSSM onset base on newly released reanalysis and remote sensing data for the period of 1979–2020.

The SCSSM onsets always are triggered by the second westward HISO or first northward LISO when the control of subtropical high pressure weakens on the SCS. The first HISO can be seen as a signal that the control is weak enough, and the SCSSM is about to onset. The SCSSM can also be established without the effects of the HISO or LISO, but the date would be put off. Based on the budget analysis of column-integrated moist static energy (MSE), the interaction between the easterly trade winds and the zonal gradient of MSE anomalies is considered the dominant reason for the HISO that can successively propagate westward from the western North Pacific. The SSTa-induced turbulent heat flux and the interaction between the mean southerly and the meridional gradient of the MSE anomaly are both important for the northward LISO from the equatorial Indian Ocean when it triggers the SCSSM onset. For the simulation and forecasting of the SCSSM onset, we put more emphasis on the role of the HISO because it is a more active process.

How to cite: Ma, T. and Yu, W.: The complexity of South China Sea summer monsoon onset, EGU General Assembly 2023, Vienna, Austria, 23–28 Apr 2023, EGU23-658, https://doi.org/10.5194/egusphere-egu23-658, 2023.

The study addresses the role of climate change on the interaction between the Indian Summer monsoon rainfall (ISMR) and western north Pacific (WNP) convective activities. We have examined two high-resolution climate model simulations, with and without anthropogenic forcing (i.e., HIST and HISTNAT), using a variable resolution model. The study is supplemented by detailed diagnostics and innovative techniques like causal network analysis which bring out the interaction of convective activities between the two regions which is altered by the influence of anthropogenically forced climate change. Our results shows that the weakening of ISMR re-orient the cross-equatorial winds along with large-scale moisture transport towards the western tropical Pacific which significantly increase the genesis potential index (GPI) over the region by 9.6%. Further we noted the probability of the occurrence of extremely low sea-level pressure (SLP) i.e., SLP < 995.5 hPa around areas near Taiwan and part of Chinese mainland is significantly higher by 10.3 % in the HIST simulation as compared to that of HISTNAT. The use of causal effect network analysis showed a significant causative link between the Indian monsoon circulation index (IMI), WNP tropical cyclone activity (GPI) and winds over the tropical Indo-Pacific (IPWND). The results show a weakening of the IMI can lead to possible enhancement of GPI and IPWND, with a certain time-lag. It is noteworthy to mention that the time lag of interaction between the IMI, GPI and IPWND are different in the two simulations with a significantly shorter time scales in HIST (~ 5 days) compared to that of HISTNAT where it is significantly larger (>20 days).

How to cite: Sagar, A., Krishnan, R., and Sabin, T. P.: Weakening of South Asian monsoon circulation and its interaction with western north Pacific tropical convective activities in a changing climate, EGU General Assembly 2023, Vienna, Austria, 23–28 Apr 2023, EGU23-696, https://doi.org/10.5194/egusphere-egu23-696, 2023.

EGU23-715 | Orals | AS1.24

CMIP6 projections of the South American Monsoon Lifecycle: comparison with pre and post statistical downscaling 

Michelle Reboita, Glauber Ferreira, and João Gabriel Ribeiro

The climate of a great part of South America presents two well-defined seasons: one dry, in general, from April to September, and another wet, from October to March, which characterizes a monsoon regime. As most of the energy generation in this monsoon region is hydroelectric, precipitation is a target of several studies. In this context, the South America Monsoon (SAM) lifecycle (onset, demise, and duration) in projections of eight global climate models (GCMs) of the Coupled Model Intercomparison Project Phase 6 (CMIP6) is analyzed in this study using two approaches: (a) the original GCM outputs downloaded from the Earth System Grid Federation (ESGF) and (b) after application of the statistical downscaling (SD) technique. Daily precipitation data from the Climate Prediction Center (CPC), with a horizontal resolution of 0.5o, are used as a reference. So, the final resolution of the GCMs after applying the Quantile Delta Mapping (QDM) is the same as CPC. SAM lifecycle is identified with a similar methodology from Liebman and Marengo published in 2001, which is based on the accumulated daily precipitation anomalies. The rainy season is considered to be the period during which precipitation exceeds its climatological annual average, then a positive slope indicates the rainy season. Note that this methodology is proper to be applied in projections because it does not assume any threshold. Initial results indicate a shorter lifetime of SAM at the end of the century.  The authors thank the Programa de P&D regulado pela ANEEL: empresa Engie Brasil Energia e Companhia Energética Estreito, MC&E, FAPEMIG, CAPES and CNPq for the financial support.

How to cite: Reboita, M., Ferreira, G., and Ribeiro, J. G.: CMIP6 projections of the South American Monsoon Lifecycle: comparison with pre and post statistical downscaling, EGU General Assembly 2023, Vienna, Austria, 23–28 Apr 2023, EGU23-715, https://doi.org/10.5194/egusphere-egu23-715, 2023.

In this study, we present the results of a regional model (regional spectral model-regional ocean model [(RSM-ROMS]) simulation of the South Asian Summer Monsoon (SASM). The RSM-ROMS integration is carried out at 20 km grid spacing over a period of 25 years (1986–2010). The simulation is forced by global atmospheric and oceanic reanalysis. The RSM-ROMS simulation shows a realistic alignment of the simulated rainfall along the orographic features of the domain. Furthermore, the RSM-ROMS simulates the observed feature of convection over continental SASM region being more vigorous with dominance of mixed warm and cold phase hydrometeors in contrast to the dominance of the warm rain process in the neighboring tropical oceans. Similarly, the upper ocean features of contrasting mixed layer and thermocline depths between the northern and equatorial Indian Ocean are also simulated in the RSM-ROMS. Intra-Seasonal Oscillation (ISO) of the SASM at 10–20 and 20–70 days are also simulated in the RSM-ROMS with many of its features verifying with observations. For example, the 20–70 days ISO are of higher amplitude and its meridional propagation is slower in Bay of Bengal compared to that over Arabian Sea. Additionally, RSM-ROMS shows 12.3 Monsoon Low Pressure Systems (LPSs) per season that is comparable to 14.6 per season from observations. Furthermore, the observed intraseasonal contrasts of LPS between the wet and dry spells of ISO is also reproduced in the RSM-ROMS.

How to cite: Misra, V. and Jayasankar, C. B.: Dynamic Downscaling the South Asian Summer Monsoon From a Global Reanalysis Using a Regional Coupled Ocean-Atmosphere Model, EGU General Assembly 2023, Vienna, Austria, 23–28 Apr 2023, EGU23-1014, https://doi.org/10.5194/egusphere-egu23-1014, 2023.

Tibet plateau plays very crucial roles in globle climate system, and the precipitation is  one of the main factors in Tibet plateau climate system, Based on GPCC monthly precipitation data and ERA5 monthly precipitation reanalysis data from 1961 to 2016, this study analyzes the spatio-temporal distribution and evolution of plateau precipitation during the May-September monsoon period under the background of global warming. Try to analyze the mechanism reason affecting precipitation variation in different regions. The precipitation in the South part of Tibet plateau began to increase in May, and advance to the northwest part of Tibet plateau during the July and August, and began to back to the south in September. According to The decomposition of the empirical orthogonal function (EOF), we divided the Tibet plateau into north and south two parts by the mount tunggula, on the interannual variability, percentage of precipitation in the monsoon plateau exists reverse change relation, precipitation showed a trend of slight decrease in the south part of plateau, plateau in northern precipitation shows ascendant trend on decadal scale, rate of precipitation in the plateau there are shocks between 3 to 5 years in 7-9 or 11 years. There is a north-south inverse change rate in the precipitation in the plateau during the monsoon period. The analysis of the relationship between the monthly precipitation data and the atmospheric circulation in the south and north of the Plateau shows that the precipitation in the south of the Plateau is affected by the South Asian monsoon, while the precipitation in the north of the plateau is related to the Rossby wave of the subtropical westerly jet. In other words, the precipitation in the southern part of the plateau is mainly controlled by summer risk, while the precipitation in the northern part of the plateau is affected by subtropical westerly winds.


Keyword: Tibetan Plateau,Precipitation,Circulation,South asia monsoon,Jet stream

How to cite: Wang, H. and Hu, Z.: The North-South variation and mechanism of the precipitation over the Tibetan Plateau during the monsoon in the past 60 years, EGU General Assembly 2023, Vienna, Austria, 23–28 Apr 2023, EGU23-1193, https://doi.org/10.5194/egusphere-egu23-1193, 2023.

EGU23-2011 | Posters on site | AS1.24

Increased intra-seasonal variability in Indian summer monsoon precipitation in a warming climate 

Sukumaran Sandeep and Neelesh Kumari

The characteristics of Indian summer monsoon (ISM) precipitation have been changing in a warming climate. We examined the intra-seasonal variability of daily mean ISM rainfall over central India in 20 CMIP6 models. The daily precipitation variance is found to have increased in the last 20 years of SSP585 runs compared to the 1981 – 2000 period of historical all forcing simulations. The mean ISM precipitation also shows an increase in the same period. The future changes in seasonal mean precipitation and the intra-seasonal variance in daily precipitation with respect to the historical period are scaled with the corresponding change in the surface temperature over the ISM domain. The changes in the seasonal mean precipitation do not show any significant relationship with the surface temperature change. However, the changes in the daily variance of ISM precipitation scale linearly with the changes in temperature. These results suggest that the ISM precipitation will become more erratic in a warming environment.

How to cite: Sandeep, S. and Kumari, N.: Increased intra-seasonal variability in Indian summer monsoon precipitation in a warming climate, EGU General Assembly 2023, Vienna, Austria, 23–28 Apr 2023, EGU23-2011, https://doi.org/10.5194/egusphere-egu23-2011, 2023.

EGU23-2025 | Orals | AS1.24

Processes controlling the South American Monsoon response to Climate Change 

Robin Chadwick, Jorge Garcia-Franco, and Lincoln Alves

CMIP6 future climate projections consistently show a drying trend during the onset of the South American monsoon, which has the potential for large ecological and societal impacts in this region. This trend is also present in a high-resolution regional convection-permitting simulation over the South American domain. Here, the processes responsible for this drying trend are examined using a number of idealised experiments and analysis techniques. The main driver is shown to be remote sea surface temperature (SST) warming - rather than local radiative or plant physiological responses to increased CO2 - with both large-scale uniform SST warming and patterned regional warming playing important roles. The role of uniform SST warming on the South American monsoon onset is examined in more detail using a moist static energy budget approach, building on hypotheses from a previous single model study. The atmospheric circulation response to patterned SST warming is examined using a local overturning circulation partioning technique, allowing a link between the South American monsoon region and specific regions of ocean warming to be identified.

How to cite: Chadwick, R., Garcia-Franco, J., and Alves, L.: Processes controlling the South American Monsoon response to Climate Change, EGU General Assembly 2023, Vienna, Austria, 23–28 Apr 2023, EGU23-2025, https://doi.org/10.5194/egusphere-egu23-2025, 2023.

Monsoon influences the well-being of billions of people in tropical and subtropical regions. The accelerated climate change and monsoon coupling with other large-scale climatic phenomena make their prediction challenging. Therefore, improvement in understanding and prediction of monsoons has become essential. Recent studies have emphasized the role of arctic region in influencing the tropical climate and its potential to cause more persistent extreme events. Therefore, it is imperative to explore the arctic region for its strategic advantage and combat climate change. In this direction, our work aims to unravel the association between the Arctic region and the Indian summer monsoon (ISM). We quantify the influence of the Arctic region on Indian summer monsoon rainfall (ISMR) using statistical parameters. The sea ice extent and Arctic Oscillation Index were correlated with the precipitation in India at seasonal and monthly scale. The Arctic Oscillation index was able to explain around 7-10% of variability in precipitation. The increased magnitude and frequency of precipitation in India are significantly related to decreased sea ice extent indicated by negative correlation coefficient ranging from 0.3-0.6.

How to cite: kulkarni, S. and Agarwal, A.: Unraveling the association between artic region and Indian summer monsoon – an empirical study, EGU General Assembly 2023, Vienna, Austria, 23–28 Apr 2023, EGU23-2111, https://doi.org/10.5194/egusphere-egu23-2111, 2023.

EGU23-2159 | ECS | Posters virtual | AS1.24

Climatic effects of the Indian Ocean tripole on the western United States in boreal summer 

Yazhou Zhang and Jianping Li

The Indian Ocean tripole (IOT) is an independent mode of ocean–atmosphere circulation centered on the tropical Indian Ocean. This study explores the physical mechanisms of the IOT affecting the western United States climate variation during the boreal summer. We find that the IOT is significantly correlated with both western United States summer surface temperature and precipitation anomalies. During positive IOT events, the westerly wind anomalies over the northern Indian Ocean are intensified by two cross-equator airflows over the tropical eastern Indian Ocean and the east coast of Africa. The resulting convergence of air over the northern Bay of Bengal–Indochina Peninsula–northern South China Sea (NBB–IP–NSCS) region (80°–125°E, 15°–25°N) exacerbates the surplus precipitation there. Serving as a heat source, these NBB–IP–NSCS precipitation anomalies can excite a circum-global teleconnection-like (CGT–like) pattern that propagates eastward from west-central Asia towards North America along the Asia subtropical westerly jet, further influencing local circulation anomalies. Development of strong anticyclonic circulation over the western United States enhances descending motion and divergence there, resulting in negative precipitation anomalies. This circulation anomaly also induces the diabatic heating anomalies through allowing more solar radiation to reach the ground surface, further increasing the surface temperature anomalies. Meanwhile, the increased tropospheric temperature also raises local surface temperatures by modulating the adiabatic air expansion and compression. Ultimately, the CGT-like pattern associated with NBB–IP–NSCS precipitation anomalies sets up an atmospheric bridge by which the IOT can impact summer climate in the western United States.

How to cite: Zhang, Y. and Li, J.: Climatic effects of the Indian Ocean tripole on the western United States in boreal summer, EGU General Assembly 2023, Vienna, Austria, 23–28 Apr 2023, EGU23-2159, https://doi.org/10.5194/egusphere-egu23-2159, 2023.

EGU23-2322 | ECS | Orals | AS1.24

Extratropical Stratospheric Air Intrusions Over the Western North Pacific and the Genesis of Downstream Monsoon Low-Pressure Systems 

Vishnupriya Selvakumar, Suhas Ettamal, and Sandeep Sukumaran

Low-pressure systems (LPS) are convectively coupled vortices that contribute nearly half of the summer monsoon rainfall over the Indian subcontinent. About one-third of the boreal summer monsoon LPS are caused by downstream amplification of westward propagating disturbances from the western North Pacific (WNP). Analysis of downstream LPS events from 1979 to 2017 reveals that 43% of them are caused by extratropical stratospheric air intrusions over the WNP. Stratospheric air intrusions lead to high tropospheric potential vorticity (PV), and the downstream vortex seeds are observed to initiate and intensify to the southwest of the PV anomalies. The PV anomalies can deform the temperature in its neighborhood and cause adiabatic lifting, which in turn can induce and intensify low-level cyclonic vortices. The subsequent intensification of the low-level vortex is aided by deep convection, observed to the southwest of the PV anomaly, through vortex stretching and low-level PV generation by diabatic heating.

How to cite: Selvakumar, V., Ettamal, S., and Sukumaran, S.: Extratropical Stratospheric Air Intrusions Over the Western North Pacific and the Genesis of Downstream Monsoon Low-Pressure Systems, EGU General Assembly 2023, Vienna, Austria, 23–28 Apr 2023, EGU23-2322, https://doi.org/10.5194/egusphere-egu23-2322, 2023.

EGU23-2469 | ECS | Orals | AS1.24

Australian Summer Monsoon Bursts: A Moist Static Energy Budget Perspective 

Sarthak Mohanty, Christian Jakob, and Martin Singh

The Australian monsoon's wet season is associated with sequences of wet and dry conditions known as bursts and breaks, which usually have timescales of a week or two. There are several hypotheses for the physical processes involved in monsoon bursts, ranging from the effects of the Madden-Julian Oscillation to extratropical influences.

We analyse rainfall bursts in Northern Australia using a moist static energy (MSE) budget framework. First, we separate the bursts into pre-monsoon, monsoon, and post-monsoon based on simple monsoon onset and retreat criteria. We then apply ERA5 data to calculate the MSE budget for each burst and construct composite bursts for each of the three types.

We find that the horizontal advection of MSE over the tropical northern Australian convergence zone is the most critical term in the budget for the day-to-day precipitation variation. An analysis of the MSE-related gross moist stability (GMS) reveals that the GMS framework is able to predict periods of convective growth and decay before and after monsoon bursts, with the exception of the pre-monsoon bursts which do not follow the characteristic evolution of tropical convective systems. We hypothesise that this is because pre-monsoon bursts have a stronger extratropical influence. We find that the growth phase of convection in monsoon and post-monsoon bursts is associated with a notable reduction of the advection of dry air into the monsoon region. We show that this is likely the result of a rearrangement of the circulation ahead of the burst.  

How to cite: Mohanty, S., Jakob, C., and Singh, M.: Australian Summer Monsoon Bursts: A Moist Static Energy Budget Perspective, EGU General Assembly 2023, Vienna, Austria, 23–28 Apr 2023, EGU23-2469, https://doi.org/10.5194/egusphere-egu23-2469, 2023.

EGU23-2580 | ECS | Orals | AS1.24

Land evaporation biases link to East Asian rainfall shifts across AMIP simulations 

Ruth Geen, Marianne Pietschnig, Shubhi Agrawal, Dipanjan Dey, F. Hugo Lambert, and Geoffrey Vallis

State-of-the-art models show significant climatological biases in their simulation of East Asian Summer Monsoon (EASM) rainfall, with biases even more pronounced in atmosphere-only simulations versus simulations with a coupled-ocean. It has further been noted that systematic evapotranspiration biases occur locally over East Asia, and globally over land, in simulations both with and without a coupled ocean. Here, we explore a possible role for evapotranspiration in EASM precipitation biases.

Idealized model simulations are presented in which the parameterization of land evaporation is modified. The results suggest a feedback whereby excessive evapotranspiration over East Asia can result in cooling of land, a weakened monsoon low, and a shift of rainfall from the Philippine Sea to China, moistening land and further fueling evapotranspiration. Cross-model regressions against evapotranspiration over China indicate that a similar pattern of behavior is seen in Atmosphere Model Intercomparison Project (AMIP) simulations.

In AMIP, the feedback is not explained by a too-intense global hydrological cycle or by differences in radiative processes. Analysis of land-only simulations indicates that evapotranspiration biases are present even when models are forced with prescribed meteorological conditions. These biases are strengthened when the land model is coupled to the atmosphere, suggesting a role for land-model errors in driving atmospheric biases. Coupled atmosphere-ocean models are shown to have similar evapotranspiration biases to those in AMIP over China, but different precipitation biases, including a northward shift in the Intertropical Convergence Zone over the Pacific and Atlantic oceans.

How to cite: Geen, R., Pietschnig, M., Agrawal, S., Dey, D., Lambert, F. H., and Vallis, G.: Land evaporation biases link to East Asian rainfall shifts across AMIP simulations, EGU General Assembly 2023, Vienna, Austria, 23–28 Apr 2023, EGU23-2580, https://doi.org/10.5194/egusphere-egu23-2580, 2023.

EGU23-3466 | Posters on site | AS1.24

Understanding changes in West African monsoon precipitation in response to increased CO2 

Harry Mutton, Robin Chadwick, Matthew Collins, and Hugo Lambert

Projections of future West African monsoon (WAM) precipitation change in response to increased greenhouse gases are uncertain, and an improved understanding of the drivers of WAM precipitation change is needed to help aid model development and better inform adaptation policies in the region. Here, we address two of these drivers: the direct radiative effect of increased CO2 (referring to the impact of increased CO2 in the absence of SST changes), and the impact of a uniform SST warming. Atmosphere only models are used to investigate the response, finding that these two drivers have opposing impacts on WAM precipitation. In response to the direct radiative effect, an increase in precipitation is caused by a northward shift and a weakening of the shallow meridional circulation over West Africa, advecting less dry air into the monsoon rainband. In contrast, the uniform SST warming causes a decrease in precipitation due to a strengthening of the shallow meridional circulation and enhanced moisture gradients between the moist monsoon airmass and the dry desert airmass. These changes in the shallow meridional circulation are shown to be caused by large scale temperature changes as well as the more localised impact of a soil moisture feedback mechanism over the Sahel. It is then shown that the processes discussed are relevant to the intermodel uncertainty in WAM projections across a range of CMIP6 models.

How to cite: Mutton, H., Chadwick, R., Collins, M., and Lambert, H.: Understanding changes in West African monsoon precipitation in response to increased CO2, EGU General Assembly 2023, Vienna, Austria, 23–28 Apr 2023, EGU23-3466, https://doi.org/10.5194/egusphere-egu23-3466, 2023.

EGU23-3747 | ECS | Orals | AS1.24

Impact of vegetation on the boreal summer monsoon precipitation over India: an energetics viewpoint. 

Jerry B Samuel, Arindam Chakraborty, and Anagha Paleri

The heterogeneities arising out of surface variabilities, land-sea contrasts, aerosol concentrations, and the influence of orography define the intricate characteristics of regional monsoon systems. The amount of precipitation India receives during the boreal summer monsoon season can be modulated by land surface processes due to its influence on moisture availability and atmospheric stability. This study investigates the impact of vegetation changes on the seasonal mean precipitation over Indian land using fully coupled global climate model (GCM) simulations with idealized land cover. In addition, an  energetics framework is employed to unravel the physical mechanisms/pathways connecting vegetation and rainfall. In general, evaporation enhances with an increase in forest cover. However, this does not translate to a similar increase in all-India averaged precipitation. Using the energetics approach, we find that precipitation changes primarily happens via three different thermodynamic pathways. We also find the regions where each pathway is dominant. The relative dominance of these pathways in various areas leads to spatial inhomogeneities in the precipitation response due to vegetation changes. Human intervention, including agricultural expansion, has reshaped the landscape of India in the last century, altering the nature of land-atmosphere interactions. The results from this study, that land cover plays a significant role in modulating the regional characteristics of seasonal monsoon precipitation, are particularly important in this context. The findings in this study also have broader ramifications since the dominant region-specific mechanisms identified are expected to be valid for other forcings and are not just limited to the scenarios considered here. A unified framework connecting these various forcings with monsoon variability would be of great practical importance, and the present study is an advancement in this regard.

How to cite: Samuel, J. B., Chakraborty, A., and Paleri, A.: Impact of vegetation on the boreal summer monsoon precipitation over India: an energetics viewpoint., EGU General Assembly 2023, Vienna, Austria, 23–28 Apr 2023, EGU23-3747, https://doi.org/10.5194/egusphere-egu23-3747, 2023.

The Indo-Pacific warm pool (IPWP) is enclosed by a 28 ◦C isotherm and plays a vital role in controlling tropical circulations. However, the effects of changes in regional warm pool sea surface temperatures (SSTs) on the circulations remain unexplored. To do this, we divided the IPWP into the Indian and Pacific sectors and distinguished their responses to natural variability and global warming. And then, we examined the impacts of the interannual variability (IAV) in warm pool SST on the tropical Hadley, Walker, and monsoon circulations. The Hadley circulation was affected by warm pool SST warming, i.e., warmer SSTs over the warm pool strengthened the upward branch of Hadley circulation, whereas the downward branch was weakened and strengthened in the Northern and Southern Hemispheres. Walker circulation was strengthened (weakened) in the warming (natural) mode. Consequently, the Walker circulation is weakened since the natural variability of warm pool SST plays a more dominant role than the warming trend of SSTs over the warm pool. It is notable that warm pool warming has little impact on monsoon circulation. Our findings highlight the different roles of the IAV of warm pool regions in each tropical circulation as part of the warming trend and natural variability. Furthermore, an increase in precipitation is limited up to a specific SST, although SST becomes warmer. We defined this specific SST as Saturation Threshold SST (STT). Under a warming climate, future changes in STT over the IPWP and its mechanism will be shortly shown in this presentation.

How to cite: Kim, H.-R. and Ha, K.-J.: Impact of the Indo-Pacific Warm Pool on the Tropical Circulations and Changes in Saturation Threshold SST, EGU General Assembly 2023, Vienna, Austria, 23–28 Apr 2023, EGU23-4743, https://doi.org/10.5194/egusphere-egu23-4743, 2023.

The Himalayas are an essential driver of the monsoon and climate system. However, river flooding during the monsoon impacts the most densely populated region of Himalayan downstream regions annually. Previous studies also reported elevation-dependent warming, rainfall changes, ice-sheet melting, and extremes in the Himalayas. Nevertheless, due to complicated orography, Himalayan precipitation dynamics remain quantitatively limited on a spatial scale compared to other monsoon regions. In the context of climate change, recent studies show how melting glaciers and snow, along with monsoonal rains causing recurrent floods, play a role. This study examined the last 43 years (1979-2021) to emphasize the interannual variability. We found a robust signal over in the Eastern Himalayas, where the orographic features and process plays a dominant role. Further analysis indicates Monsoonal rainfall is the main factor, rather than melting snow for these unusually extreme years. Regional monsoonal circulation connected to Walker circulation controls the variability of Himalayan monsoonal rainfall via circulation linkages. Our findings illustrate the wet and dry response mechanisms in the eastern Himalayas. The conclusions are drawn from this work highlight the role of natural variability, which might help understand Himalayan floods and their predictability.


Keywords Himalayas, Interannual variability, Monsoon dynamics, Orographic features, River floods

How to cite: Kad, P. and Ha, K.-J.: Dynamics and characteristics of monsoonal orographic rainfall variability over Eastern Himalaya, EGU General Assembly 2023, Vienna, Austria, 23–28 Apr 2023, EGU23-4950, https://doi.org/10.5194/egusphere-egu23-4950, 2023.

The changes in the Indian summer monsoon rainfall under anthropogenic climate change would have a large socio-economic impact. The thermodynamic effect of the climate change on future monsoon rainfall is well understood with an overall increase in precipitation as the atmosphere moistens. Understanding the dynamical effect of climate change especially from the changes in the drivers of the monsoon remains challenging. Here we show that the observed western Indian monsoon rainfall has an increasing trend over the last 120 years. We find this observed trend is connected with the trend in the tropical Pacific zonal sea surface temperature (SST) gradient, where the western tropical Pacific or the warm pool region of the Pacific Ocean is warming faster than the eastern side. Applying a storyline approach to the future evolution of the zonal tropical Pacific SST gradient in 38 global climate models from the latest Coupled Model Intercomparison Project phase 6, we find a consistent connection in the models between the western Indian monsoon rainfall change and the strength of the change in the zonal tropical Pacific SST gradient under global warming. The models which warm more in the western compared to the eastern side of the tropical Pacific have higher rainfall increases over western India during the monsoon season. This link is associated with an anomalous easterly wind coming from the western tropical Pacific and converging over western India, leading to higher rainfall in both observations and models. This result suggests that future changes in the western Indian monsoon rainfall would depend on the changes in the strength of the zonal gradient of the tropical Pacific Ocean SST.

How to cite: Ghosh, R. and Shepherd, T. G.: Strengthening tropical Pacific zonal temperature gradient linked with increasing West Indian Monsoon rainfall, EGU General Assembly 2023, Vienna, Austria, 23–28 Apr 2023, EGU23-5985, https://doi.org/10.5194/egusphere-egu23-5985, 2023.

EGU23-6151 | Posters on site | AS1.24

Response of the Indian monsoon to a warming Indian ocean 

Bidyut Bikash Goswami

The Indian summer monsoon rainfall (ISMR) has been declining since the middle of the last century. However, recently (since about 2002) it is reported to have revived. For these observed changes in the ISMR, several explanations have been reported. Among these explanations, the warming of the Indian Ocean is considered a major one. However, we still do not fully understand the response of the atmosphere to this warming. Here we report that warming in the Indian Ocean (focusing on the eastern side of it where the sea surface temperatures are climatologically very warm) drives atmospheric responses that oppose Indian summer monsoon circulation and reduces ISMR. 

How to cite: Goswami, B. B.: Response of the Indian monsoon to a warming Indian ocean, EGU General Assembly 2023, Vienna, Austria, 23–28 Apr 2023, EGU23-6151, https://doi.org/10.5194/egusphere-egu23-6151, 2023.

EGU23-6573 | Orals | AS1.24

Why is there a systematic bias in the Asian Monsoon in the Met Office Unified Model? 

Kalli Furtado, Gill Martin, David Sexton, John Rostron, and Paul Field

Many global-climate models have substantial biases in their predictions of the Asian monsoon. For example, the Met Office Unified Model predicts a  monsoon trough that is too zonal and therefore underestimates summer rainfall over south and east Asia. These errors have persisted over many cycles of research-to-operations, and appear robust to significant developments in all major parametrizations in the model. Here, we address a simple question: why are these biases systematic? That is, why have they not been removed by optimization of parameters in the model's physics? Using a Perturbed Parameter Ensemble of AMIP simulations, we show that a strong constraint exists which prevents the Unified Model from simultaneously producing an unbiased monsoon and unbiased global top-of-atmosphere radiation fluxes. We use this constraint to define a scalar parameter, the "structural bias"  of the ensemble, the magnitude of which measures the conflict between the constraints and therefore how "untunable" the model is. We identify the drivers of this parameter, show that it is related to an inability to independently affect the properties of tropical and extra-tropical clouds, and suggest ways in which it could be reduced in future model versions.

How to cite: Furtado, K., Martin, G., Sexton, D., Rostron, J., and Field, P.: Why is there a systematic bias in the Asian Monsoon in the Met Office Unified Model?, EGU General Assembly 2023, Vienna, Austria, 23–28 Apr 2023, EGU23-6573, https://doi.org/10.5194/egusphere-egu23-6573, 2023.

EGU23-6671 | ECS | Orals | AS1.24

Boreal Summer Intraseasonal Oscillation extreme rainfall propagation modulated by Pacific sea surface temperatures 

Felix Strnad, Jakob Schlör, Ruth Geen, Niklas Boers, and Bedartha Goswami

Intraseasonal variability of extreme rainfall events (EREs) during the South Asian Summer Monsoon season is dominated by the Boreal Summer Intraseasonal Oscillation (BSISO). However, deviations from its canonical north-eastward propagation are poorly understood, posing challenges to the prediction of EREs and climate modeling. Here, we combine a climate network-based approach determining regions of synchronously occurring EREs with
a clustering analysis of zonal and meridional BSISO propagation patterns which reveals three distinct modes: canonical north-eastward, eastward-blocked, and stationary propagation. We show that Pacific sea surface temperature background states determine the propagation mode. In particular, El Niño (La Niña)-like conditions favor the stationary (eastward-blocked) mode by modifying the zonal and meridional overturning circulation structures and the strength of the BSISO Kelvin wave component. The uncovered mechanism for BSISO diversity has implications for the predictability of large, spatially extensive EREs in South Asia and the development of early warning signals on a time horizon of 3-5 weeks.

How to cite: Strnad, F., Schlör, J., Geen, R., Boers, N., and Goswami, B.: Boreal Summer Intraseasonal Oscillation extreme rainfall propagation modulated by Pacific sea surface temperatures, EGU General Assembly 2023, Vienna, Austria, 23–28 Apr 2023, EGU23-6671, https://doi.org/10.5194/egusphere-egu23-6671, 2023.

EGU23-7258 | Orals | AS1.24

Uncertainty in Sahel precipitation change: a storyline approach 

Paul-Arthur Monerie, Michela Biasutti, Juliette Mignot, Elsa Mohino, Benjamin Pohl, and Guiseppe Zappa

Future changes in Sahel precipitation are uncertain because of large differences between projections of various climate models. We assess the effect of climate change on Sahel precipitation in summer and for the end of the 21st century. We show that uncertainty in Sahel precipitation is associated with uncertainty at simulating future changes in surface air temperature over the northern Hemisphere. We point out the Atlantic Ocean and Euro-Mediterranean surface air temperature as drivers of the Sahel precipitation change uncertainty. We use a storyline approach, a statistical method, to construct scenarios of changes in Sahel precipitation, whose differences only depend on future changes in Atlantic Ocean and Euro-Mediterranean surface air temperature. We show that uncertainty in changes in Atlantic Ocean and Euro-Mediterranean surface air temperature explains up to 50% of Sahel precipitation change uncertainty. The approach also allows selecting models to better understand uncertainty in Sahel precipitation change, focusing on the mechanisms at play. We suggest that reducing uncertainty in the future warming of the North Atlantic and the Euro-Mediterranean areas would then allow reducing uncertainty in future changes in Sahel precipitation.

How to cite: Monerie, P.-A., Biasutti, M., Mignot, J., Mohino, E., Pohl, B., and Zappa, G.: Uncertainty in Sahel precipitation change: a storyline approach, EGU General Assembly 2023, Vienna, Austria, 23–28 Apr 2023, EGU23-7258, https://doi.org/10.5194/egusphere-egu23-7258, 2023.

It has been argued in recent studies that the source of dry air originating over the desert regions of the West Asia i.e. Middle East intrudes over the continental India during the boreal summer resulting in more prolonged dry spells over India. Singh and Sandeep (2021, Clim Dyn) showed the existence of a huge reservoir of moist deficit air over the northern Arabian Sea at 850-hPa. In addition to this, it has been argued that low level jet undergo weakening and broadening prior to monsoon break phase in feedback to an increased barotropic instability. Furthermore, the monsoon low-level jet which transports the moisture to the continental landmass in the active phase acts as a main carrier in transporting this dry air towards the continental India during the break phase of the summer monsoon. In order to investigate the thermodynamic effects of dry air intrusion activity during dry phases of the Indian Summer Monsoon (ISM), isentropic analysis is performed on climate models simulations of Coupled Model Intercomparison Project Phase 6 (CMIP6). Here, we analyze the specific humidity and wind fields at 316 K isentropic level. The negative specific humidity anomalies of multi models average (MMA) signifies the pattern of dry air advection which shows that a large fraction of the moisture deficit is being transported to the continental India from the northern Arabian Sea, and only a small contribution comes from West Asia. The lead-lag composites of anomalous wind vectors and relative vorticity of MMA at 316 K isentrope clearly show a weakening of the monsoon circulation associated with the break conditions. The anomalous anti-cyclonic circulation pattern propagates westwards from the Bay of Bengal which is a well known feature of the monsoon break spells.  

KEYWORDS: Low level jet; Dry air intrusion; Indian Summer Monsoon 

How to cite: Singh, R. and Sandeep, S.: A thermodynamical study of dry air intrusion activity over India during dry phases of summer monsoon in CMIP6 models, EGU General Assembly 2023, Vienna, Austria, 23–28 Apr 2023, EGU23-7948, https://doi.org/10.5194/egusphere-egu23-7948, 2023.

EGU23-8550 | ECS | Posters on site | AS1.24

Indian Ocean heat transport and its role in developing SST pattern in the post-monsoon season in CMIP6 models 

Rajendran Saran and Sukumaran Sandeep

The cross-equatorial oceanic heat transport (OHT) in the Indian Ocean during boreal summer is an integral component of the Indian summer monsoon (ISM). This OHT is believed to be a crucial factor in the interannual variability of ISM. Thus, a deeper understanding of OHT in climate model simulations is needed for the understanding of the simulated interannual variability of monsoon. Here we examine the Indian Ocean meridional OHT and how the OHT in the summer monsoon season impacts the development of SST patterns in the post-monsoon season. Our results show that the post-monsoon SST positively correlates with OHT during the summer monsoon in western IO and negatively correlates in the southeastern Indian Ocean. Further, it reveals that the OHT during summer monsoon explains the dipole pattern of SST in the post-monsoon over the equatorial Indian Ocean. This study also investigates how anomalous OHT during monsoon months contributes to the persistence of marine heat waves (MHW) in the post-monsoon season. Both CMIP6 models and observations suggest enhanced and persistent MHWs in the post-monsoon season are linked to stronger OHT during the summer season.

How to cite: Saran, R. and Sandeep, S.: Indian Ocean heat transport and its role in developing SST pattern in the post-monsoon season in CMIP6 models, EGU General Assembly 2023, Vienna, Austria, 23–28 Apr 2023, EGU23-8550, https://doi.org/10.5194/egusphere-egu23-8550, 2023.

EGU23-9295 | Posters on site | AS1.24

Mid-Latitude Controls on Monsoon Onset and Progression (the MiLCMOP project) 

Andrew Turner, Ambrogio Volonte, and Marlene Kretschmer

The Indian monsoon is critical since it supplies most of the water for drinking, sanitation, industry and agriculture for a billion people.  The onset of monsoon typically starts in southern India by 1 June, taking up to 6 weeks to cover the country.  Meanwhile, during the monsoon, variations on time scales of a week or more give rise to periods of excess and reduced rainfall, known as active and break events.

Being able to better predict the onset of the rains, their progression, and of active and break events in the monsoon would be of great.  The timing of monsoon onset is already known to be influenced by tropical variability such as the Madden-Julian Oscillation.  New research has shown that the mid-latitudes also exert a powerful control, but the full extent of this extratropical role in monsoon onset progression and in the timing of active and break periods is poorly quantified and understood.

The team behind the new MiLCMOP project earlier led the INCOMPASS field campaign to India, taking new measurements and generating new hypotheses on how the monsoon is controlled, including the concept that monsoon progression can be described as a “tug-of-war” between tropical and extratropical airmasses.  This "tug-of-war" is an unsteady process, with a back and forth of the two airmasses before the moist tropical flow takes over for the rest of the season.

This poster describes some of the preliminary results on which the project is designed and explains the approach that MiLCMOP will use, including established techniques and development of new metrics to quantify the interactions between monsoon progression and extratropical forcing.  These methods will include use of vorticity budgets and Lagrangian feature tracking, applied to reanalysis and model data in case study years of fast and slow onset behaviour, to determine the dominant mechanisms controlling monsoon progression.  New model experiments will be designed and performed to isolate the mechanisms by which extratropical drivers affect monsoon onset and its progression.  Finally, novel causal inference techniques will be used to disentangle the effects of extratropical drivers from those in the tropics.

The MiLCMOP project will eventually answer the following key questions:  (1) How are the pace and steadiness of Indian monsoon progression affected by interactions with the extratropics?  (2) What are the mechanisms of extratropical control on monsoon progression and variability?  (3) In what way do the causal extratropical and tropical drivers of ISM progression offset or reinforce each other and can the competing roles of tropical and extratropical processes be generalised to other monsoons?

How to cite: Turner, A., Volonte, A., and Kretschmer, M.: Mid-Latitude Controls on Monsoon Onset and Progression (the MiLCMOP project), EGU General Assembly 2023, Vienna, Austria, 23–28 Apr 2023, EGU23-9295, https://doi.org/10.5194/egusphere-egu23-9295, 2023.

EGU23-9398 | ECS | Orals | AS1.24

Monsoon Planet: Bimodal rainfall distribution due to barrier-structure in pressure field 

Anja Katzenberger, Anders Levermann, Georg Feulner, and Stefan Petri

Monsoon systems are transporting water vapour and energy across the globe, making them a central component of the global circulation system. Changes in different forcing parameters have the potential to fundamentally change the monsoon characteristics as indicated in various paleoclimatic records. Here, we use the Atmosphere Model version 2 developed at the Geophysical Fluid Dynamics Laboratory (GFDL-AM2) and couple it with a slab ocean to analyse the monsoon's sensitivity to changes in different forcing parameters on a planet with idealized topography. This Monsoon Planet concept of an Aquaplanet with a broad zonal land stripe allows to reduce the influence of topography and to access the relevant meridional monsoon dynamics. In the simulations that enable monsoon dynamics, a bimodal rainfall distribution develops during the monsoon months with one maximum over the tropical ocean and the other one over land. The intensity and expansion of the land monsoon depends on the relative height of a local maximum in the surface pressure field that is acting as a barrier and determines the landward moisture transport. This dynamic is emerging during the course of one year, but also occurs when varying different parameters in a sensitivity analysis (slab ocean depth, sulfate aerosols, carbon dioxide, solar constant, land albedo). This structure of a bimodal rainfall distribution and a pressure-barrier located between the two maxima is also present in the Westafrican monsoon.

How to cite: Katzenberger, A., Levermann, A., Feulner, G., and Petri, S.: Monsoon Planet: Bimodal rainfall distribution due to barrier-structure in pressure field, EGU General Assembly 2023, Vienna, Austria, 23–28 Apr 2023, EGU23-9398, https://doi.org/10.5194/egusphere-egu23-9398, 2023.

EGU23-9428 | ECS | Posters on site | AS1.24

East Asian summer precipitation in AWI-CM3: Comparison with observations and CMIP6 models 

Jian Shi, Christian Stepanek, Dmitry Sein, Jan Streffing, and Gerrit Lohamnn

Owing to the complicated spatial-temporal characteristics of East Asian precipitation (EAP), climate models have limited skills in simulating the modern Asian climate. This consequently leads to large uncertainties in simulations of the past EAP variation and future projections. Here, we explore the performance of the newly developed Alfred Wegener Institute Climate Model, version 3 (AWI-CM3) in simulating the climatological summer EAP. To test whether the model’s skill depends on its atmosphere resolution, we design two AWI-CM3 simulations with different horizontal resolutions. The result shows that both simulations have acceptable performance in simulating the summer mean EAP, generally better than the majority of individual models participating in the Climate Modelling Intercomparison Project (CMIP6). However, for the monthly EAP from June to August, AWI-CM3 exhibits a decayed skill, which is due to the sub-seasonal movement of the western Pacific subtropical high bias. The higher resolution AWI-CM3 simulation shows an overall improvement relative to the one performed at a relatively lower resolution in all aspects taken into account regarding the EAP. We conclude that AWI-CM3 is a suitable tool for exploring the EAP for the observational period. Having verified the model’s skill for modern climate, we suggest employing the AWI-CM3, especially with high atmosphere resolution, also for applications in paleoclimate studies and future projections.

How to cite: Shi, J., Stepanek, C., Sein, D., Streffing, J., and Lohamnn, G.: East Asian summer precipitation in AWI-CM3: Comparison with observations and CMIP6 models, EGU General Assembly 2023, Vienna, Austria, 23–28 Apr 2023, EGU23-9428, https://doi.org/10.5194/egusphere-egu23-9428, 2023.

EGU23-9482 | Orals | AS1.24

Where the north wind meets the sea: rainfall variability and change and its implications for food security in the Sahel 

Timmo Gaasbeek, Ruud van der Ent, Dim Coumou, Rein Haarsma, and Sander Keulers

Many factors have been suggested to explain variability and change in Sahel rainfall. Of those, sea surface temperature (SST) in the Eastern Mediterranean Sea (EMS) and zonal moisture flux south of the Sahel show strong correlations. Based on observational and reanalysis data on temperature, pressure, wind and moisture flux, this paper identifies a mechanism that explains both correlations. The mechanism hinges on the Jebel Marra massif and the Ethiopian highlands, where the mesoscale convective systems (MCSs) develop that bring most of the rain to the Sahel. We find that cold SST anomalies in the EMS between June and September cause a greater trans-Sahara temperature contrast and coincide with high pressure over Libya, resulting in stronger northerlies towards Sudan. This prevents Tropical Atlantic moisture from reaching the MCS genesis region, which reduces the seasonal northward spread of Sahel rainfall and of the Atlantic intertropical convergence zone, which in turn suppresses the development of the west-African westerly jet and the African westerly jet and inhibits Atlantic moisture from reaching the MCS genesis region, thus further reducing Sahel rainfall. Anomalous moisture transport from the Mediterranean does not play a role. Mediterranean SST variability raises questions about the future development of Sahel rainfall. If a new dry period materialises, this will have substantial implications on food production in the region. There are however opportunities for mitigating against the effects of such a dry period.

How to cite: Gaasbeek, T., van der Ent, R., Coumou, D., Haarsma, R., and Keulers, S.: Where the north wind meets the sea: rainfall variability and change and its implications for food security in the Sahel, EGU General Assembly 2023, Vienna, Austria, 23–28 Apr 2023, EGU23-9482, https://doi.org/10.5194/egusphere-egu23-9482, 2023.

The phase shift of climatic systems in decadal or interdecadal scale, also called as regime shift has occurred in East Asian Summer Monsoon (EASM) in the past. For example, the shifts of the late 1970s, mid 1990s, and early 2000s are the typical examples. Before and after these shifts, dominant teleconnection mode affecting the EASM had changed. On the other hand, the shift of early 2000s has not extensively investigated. Here, it is examined the characteristics of this particular shift in relation to variability of East Asian jet during summer. First, regime shifts earlier and in the early 2000s are detected based on the variance of summer East Asian jet. Second, the teleconnection pattern that influence summer East Asian jet was changed from the Atlantic-Eurasian (AEA) pattern to distinctly different zonal pattern around extratropical region of Eurasian. Finally, it was found that after this regime shift the land-atmosphere coupling induced by variability of soil moisture also strengthened. It is hypothesized that enhanced linkage between jet in the upper atmosphere and surface heat flux over Inner East Asia is a key mechanism of enhancing variability of the East Asian summer jet, i.e., the regime shift in 2000s. These results imply that over drier region, the regional climatic system might response more sensitively to regional-scale change on surface level than large-scale influence, such as wave-train.

How to cite: Nam, J. and Yoon, J.-H.: Regime shift of Jet over East Asian summer Monsoon in the early 2000s: its detection and dynamical driver, EGU General Assembly 2023, Vienna, Austria, 23–28 Apr 2023, EGU23-11107, https://doi.org/10.5194/egusphere-egu23-11107, 2023.

The present study is aimed to investigate the rainfall characteristics of Monsoon Deep Depressions (MDD) originating over the Bay of Bengal (BoB) basin using a coupled ocean-atmospheric model (COAWST) and a stand-alone atmospheric (WRF) model with a lead time of up to 72h. It is found that though the tracks of the four MDDs considered in the study have been reasonably simulated, the intensity was overestimated in both sets of simulations compared to India Meteorological Department (IMD) best estimates. Upon decomposition of the contributors to the rainrate for the composite of the storms in the deep depression (DD) phase, it was found that the moisture sources/sinks play a more important role than the cloud sources/sinks in modulating the rainfall processes. Further analysis of the moisture sources/sinks showed that the horizontal and vertical advection are the major drivers in modulating the contribution of the moisture sources/sinks. The validation of rainfall using CMORPH datasets suggested that the coupled simulations had a higher skill in rainfall prediction. Furthermore, the composite of different components of moisture sources/sinks (especially vertical advection) was found to be more realistically simulated in COAWST compared to WRF upon validation with MERRA datasets. Analysis of the composite energetics showed that scarcity of bulk kinetic energy in the later hours of the DD phase in COAWST led to the dissipation of the storm core, which led to better prediction of rainfall. On the other hand, a re-intensification of the storm core by means of condensational heating led to an overestimation of rainfall in WRF, which finally resulted in lower skill in rainfall prediction. In spite of the stand-alone atmospheric model capturing the horizontal moisture incursion in the lower levels significantly, the better representation of the vertical structure enabled the coupled model to capture the precipitation features more realistically, increasing skill in rainfall prediction.

How to cite: Chakraborty, T., Pattnaik, S., and Baisya, H.: A Numerical Study to Investigate Precipitation Features of Monsoon Deep Depressions over Bay of Bengal: Comparison of Coupled and Control Simulations, EGU General Assembly 2023, Vienna, Austria, 23–28 Apr 2023, EGU23-11257, https://doi.org/10.5194/egusphere-egu23-11257, 2023.

EGU23-12313 | ECS | Posters on site | AS1.24

Zonal Momentum Balance in South Asian Summer Monsoon: Forces and Changing Winds 

Pankaj Upadhyaya and Saroj K. Mishra

The balance of forces for the South Asian Summer Monsoon (SASM) gives valuable insights for the understanding of the mean circulation and the changes it has undergone in the past. In this study, we have analyzed the zonal momentum balance for SASM for the last few decades (1950-2010) using reanalysis data to understand the changes in different forces and relate them with the changes in the associated circulation. In the lower level (925 hPa), the Pressure Gradient Force (PGF), Coriolis Force (CF), and Residual Force (RF, which includes the unresolved sub-grid scale process and frictional terms) are found to be the dominant terms of the zonal momentum balance for SASM with a magnitude of order 10-4m sec-2 whereas, horizontal advection and eddy force terms are negligible with one or more order lesser in magnitude. The residual force can be estimated by Rayleigh friction induced by turbulence, particularly over ocean points, which, however, is not a good measure of the same over the land points because of high irregularity. The momentum balance at the upper level (200 hPa) is between the PGF, CF, and the advection term, unlike the lower level, where the residual force does not seem to be dominant. In the free troposphere, the Convective Momentum Transfer or in other words convective friction is a good estimator of the RF, which represents the vertical transport of momentum. The changes in SASM circulation in the past can be apprehended by looking into the changes in these vital forces that drive the motion.

How to cite: Upadhyaya, P. and Mishra, S. K.: Zonal Momentum Balance in South Asian Summer Monsoon: Forces and Changing Winds, EGU General Assembly 2023, Vienna, Austria, 23–28 Apr 2023, EGU23-12313, https://doi.org/10.5194/egusphere-egu23-12313, 2023.

EGU23-12760 | ECS | Posters on site | AS1.24

Developed a climate modeling framework for India                  

Debi Prasad Bhuyan and Saroj Kanta Mishra

A better representation of the poorly understood sub-grid scale processes in the Global Circulation Model is imperative for the skilful simulation of the Indian Summer Monsoon (ISM). We customized the parametrizations for deep convection, gravity wave, and surface layer; incorporated them into the NCAR Community Atmosphere Model 5.0 (NCAR CAM5, base model). The modified deep convective parametrization includes dynamic tau (dynamic convective adjustment timescale), which allows a spatiotemporally varying tau instead of constant tau and the stochastic entrainment rate in place of a fixed entrainment rate. Similarly, the modified gravity wave parametrization facilitates estimating the response of upper-level gravity wave drag induced from secondary sources. Likewise, the modified surface layer parametrization enables a better representation of near-surface variables as well as surface fluxes. The simulations of default and customized NCAR CAM5 have been carried out for eleven years (one year for spin-up and the rest ten years considered for analysis). The analysis has been performed for two major climate change indicators, i.e., temperature and precipitation for the ISM season (June to September). The model simulated near-surface temperature and precipitation during ISM were evaluated against observation (Indian Meteorological Department). A significant improvement has been noted in simulating the total precipitation pattern and magnitude over India, as well as for surface air temperature, particularly over northern India. In addition, based on performance, the customized model alleviates some of the long-standing biases evident in the default NCAR CAM5 simulation over India. Furthermore, compared to the base model, the customized model realistically simulates the annual cycle of precipitation, medium and extreme precipitation rates, meridional tropospheric temperature gradient, upper (200 hPa) and lower (850 hPa) tropospheric winds, Madden Julian Oscillation, and equatorial waves. The study’s findings illustrate the significance of model parametrizations towards improving the ISM simulation. Meanwhile, the modeling framework would be essential for credible future climate projections of India and would become a vital tool for policymakers and diverse stakeholders.

Keywords: Indian Summer Monsoon, NCAR CAM5, Deep convection, Gravity wave, Surface layer

How to cite: Bhuyan, D. P. and Mishra, S. K.: Developed a climate modeling framework for India                 , EGU General Assembly 2023, Vienna, Austria, 23–28 Apr 2023, EGU23-12760, https://doi.org/10.5194/egusphere-egu23-12760, 2023.

EGU23-12805 | Orals | AS1.24

Indian summer monsoon versus mid-latitude drivers of boreal summer tropospheric circulation and heat extremes in the eastern Mediterranean 

Giorgia Di Capua, Dominik Diedrich, Evangelos Tyrlis, Daniela Matei, and Reik V. Donner

The lower tropospheric circulation over the eastern Mediterranean during boreal summer is markedly characterized by northerly winds known as the Etesians (Tyrlis et al., 2013). These winds are accompanied by large scale subsidence and clear skies, and can mitigate the emergence of heat waves by bringing colder air from the Eurasian landmass. Here, we employ Causal Effect Networks, obtained by applying the Peter and Clark Momentary Conditional Independence (PCMCI) causal discovery algorithm (Runge, 2018), to identify causal precursors of the Etesians both in mid-latitude circulation fields and tropical convective activity at two different intraseasonal time scales (3 and 7-day average). We identify wave train activity over the North Atlantic and North American region and convective activity over the Arabian Sea and western coast of the Indian peninsula to be causal precursors of Etesians winds defined as 850 hPa meridional wind variations over the eastern Mediterranean at a lag of 3-to-6 days. In general, the influence of tropical drivers, i.e. the Indian summer monsoon (ISM) system,  is found to be stronger than that of the mid-latitude wave train, thus corroborating the hypothesis that the ISM affects the circulation over the Mediterranean and Northeast Africa, as suggested by the monsoon-desert mechanisms (Rodwell and Hoskins, 1996). Moreover, at longer time scales (7 to 14-day lag), the main causal influence comes from tropical convective activity over the Indian peninsula, while the effect of the mid-latitude circulation weakens and becomes not significant. We finally employ event coincidence analysis to explore the relationship between Etesians and heat extremes in the eastern Mediterranean and assess the presence of trends in the strength of Etesians outbreaks at intraseasonal variability in the historical period.

References

Rodwell, M. J. and Hoskins, B.: Monsoons and the dynamics of deserts, Q. J. R. Meteorol. Soc., 122, 1385–1404, 1996.

Runge, J.: Causal network reconstruction from time series: From theoretical assumptions to practical estimation, 28, 075310, https://doi.org/10.1063/1.5025050, 2018.

Tyrlis, E., Lelieveld, J., and Steil, B.: The summer circulation over the eastern Mediterranean and the Middle East: Influence of the South Asian monsoon, Clim. Dyn., 40, 1103–1123, https://doi.org/10.1007/s00382-012-1528-4, 2013.

How to cite: Di Capua, G., Diedrich, D., Tyrlis, E., Matei, D., and Donner, R. V.: Indian summer monsoon versus mid-latitude drivers of boreal summer tropospheric circulation and heat extremes in the eastern Mediterranean, EGU General Assembly 2023, Vienna, Austria, 23–28 Apr 2023, EGU23-12805, https://doi.org/10.5194/egusphere-egu23-12805, 2023.

EGU23-13539 | ECS | Posters on site | AS1.24

Characteristics of spectral energetics during excess and deficient rainfall years in India 

Ravi Dhishana and Sarvesh Kumar Dubey

Significant spatial and temporal deviations from the seasonal mean precipitation, such as severe droughts (deficient rainfall) and floods (excess rainfall), have a major influence on India. The non-linear energy interactions between the various scale atmospheric systems are important as they play a crucial role in the Indian summer monsoon variability. Since studies have yet to look at the whole energy budget of the southwest monsoon, it is necessary to accurately capture these energy exchanges to represent the monsoon circulation better. In this study, we found the exact nature of complex non-linear energy interactions of synoptic-scale mainly low-pressure systems (LPSs) and Intraseasonal Oscillation (lSO) 30-60 day scale with other scales, including the seasonal mean, Indian Ocean Dipole (IOD), and El Niño–Southern Oscillation (ENSO) using the in-scale and out of scale energetics. These energy interactions are calculated in the frequency domain for the Indian monsoon region using the ECMWF ERA-5 data for 72 years (1950-2021) during the monsoon season (JJAS). Since the seasonal mean kinetic energy is highly correlated with the seasonal mean rainfall, we explored how these energy exchanges vary during excess and deficient rainfall years. We also found that the ISO and synoptic scale systems influence the interannual variability of the Indian Summer Monsoon mainly through the interactions with the mean flow. In addition, the monsoon mean flow and most energy exchanges show a significant relationship at the upper level (200 hPa) and lower level (850 hPa) atmosphere.

How to cite: Dhishana, R. and Dubey, S. K.: Characteristics of spectral energetics during excess and deficient rainfall years in India, EGU General Assembly 2023, Vienna, Austria, 23–28 Apr 2023, EGU23-13539, https://doi.org/10.5194/egusphere-egu23-13539, 2023.

EGU23-13727 | ECS | Orals | AS1.24

Characteristics of African Sahel Precipitation in global storm-resolving Climate Models 

Dorian Spät, David Schuhbauer, and Aiko Voigt

The simulation of precipitation in the African Sahel region is challenging for current global climate models. These models conventionally work with grids with horizontal resolution larger than 100 km and therefore must use parametrization schemes to simulate deep convection. The nextGEMS project, on the other hand, performs global simulations with two new climate models (adapted versions of ICON and IFS) with fine resolutions of a few kilometers. At such high resolution, deep convection is resolved, which allows for a much more realistic representation of precipitation. This is particularly promising for simulating convection in the African Sahel, where most precipitation originates from mesoscale convective systems resolved at these simulation scales. 

We present a preliminary analysis of the cycle two nextGEMS simulations focusing on Sahel precipitation and the West African monsoon. We show that some characteristics of precipitation, such as low autocorrelation with one day lag, are much closer to measurements compared to conventional climate models. We also discuss some of the problems that still persist in the simulations and compare the two models depending on different features of Sahel precipitation.

How to cite: Spät, D., Schuhbauer, D., and Voigt, A.: Characteristics of African Sahel Precipitation in global storm-resolving Climate Models, EGU General Assembly 2023, Vienna, Austria, 23–28 Apr 2023, EGU23-13727, https://doi.org/10.5194/egusphere-egu23-13727, 2023.

EGU23-13868 | ECS | Orals | AS1.24

Causal Drivers Behind Enhanced Rainfall Activity OverNorthern Indian 

Luisa E. Aviles Podgurski, Giorgia Di Capua, and Reik V. Donner

The Western (WHF) and Eastern Himalayan foothills (EHF) are two densely populated regions that experience extreme precipitation events during the Indian summer monsoon (ISM) season lasting typically from June to September [1, 2]. Therefore, a better understanding of the processes controlling ISM intraseasonal variability is of great relevance.

In our present work we identify and quantify causal relationships at short lead-times (three to nine days) between characteristic remote and local climate patterns and the precipitation over the WHF and EHF. More specifically we apply the so-called response-guided causal precursor detection (RGCPD) scheme that builds on the Peter and Clark momentary conditional dependence (PCMCI) algorithm [3]. The employed method is based on concepts of information theory and statistical mechanics, and allows to identify strongly interdependent climate patterns associated with the ISM and to distinguish between spurious and truly causal links. Finally, causal effect networks (CENs) visually summarise the identified causal links between different variables, indicating the directionality, time lag and magnitude of the causal effect.

Our analysis reveals that WHF rainfall variability is influenced by mid-latitude teleconnections such as the circumglobal teleconnection index and seems to be driven by similar precursors and time scales as the precipitation over central India [4]. In contrast, CENs indicate that the EHF rainfall is characterised by faster dynamics compared to the WHF and whilst it is also driven by mid-latitude teleconnections, a different set of atmospheric processes appears to play a major role in its variability. Specifically, a unique and strong causal connection to the tropical western Pacific is revealed, manifesting itself in the geopotential height at 500 hPa and the mean sea-level pressure. A thorough analysis of this signal indicates a Gill-type response to a heat sink over the equatorial Pacific, that may be associated with the Madden-Julian oscillation (MJO) and suggests a link between suppressed MJO phases and enhanced rainfall activity over the EHF region. Thus, our analysis hints to a connection between break spells of the ISM, where large parts of the Indian landmass experience reduced precipitation activity, and enhanced rainfall activity over the EHF region.

References
[1] Vellore, R., et al., On the anomalous precipitation enhancement over the Himalayan foothills during monsoon breaks, Clim. Dynam. 43, 2009-2031 (2014).
[2] Vellore, R., et al., Monsoon - extratropical circulation interactions in Himalayan extreme rainfall, Clim. Dynam. 46, 3517-3564 (2016).
[3] Runge, J., Causal network reconstruction from time series: From theoretical assumptions to practical estimation, Chaos 28, 075310 (2018).
[4] Di Capua, G., et al., Tropical and mid-latitude teleconnections interacting with the Indian summer monsoon rainfall: a theory-guided causal effect network approach, Earth Syst. Dyn., 11, 17-34 (2020).

How to cite: Aviles Podgurski, L. E., Di Capua, G., and Donner, R. V.: Causal Drivers Behind Enhanced Rainfall Activity OverNorthern Indian, EGU General Assembly 2023, Vienna, Austria, 23–28 Apr 2023, EGU23-13868, https://doi.org/10.5194/egusphere-egu23-13868, 2023.

EGU23-14204 | ECS | Orals | AS1.24

Modeling the impact of the urban land-use on the Indian Summer Monsoon precipitation 

Renaud Falga and Chien Wang

The urban areas can modify the local and regional climate through various processes. They can indeed modify the water cycle and precipitations, either through the modification of land-use, or through effects induced by the emissions of anthropogenic aerosols. The thermodynamical perturbations induced by the presence of urban land-use, including the urban heat island effect, are known to induce rainfall modification due to perturbation of the flow and enhancement of the convective activity. However, this impact has yet to be clarified in a large scale, highly energetic system like the Asian Monsoon system. Using the high resolution meso-scale atmospheric model Meso-NH, we investigated the impact of urban land-use on the precipitation during the Indian Summer Monsoon, including the influence on extreme events. The results of this study will be presented and discussed.

How to cite: Falga, R. and Wang, C.: Modeling the impact of the urban land-use on the Indian Summer Monsoon precipitation, EGU General Assembly 2023, Vienna, Austria, 23–28 Apr 2023, EGU23-14204, https://doi.org/10.5194/egusphere-egu23-14204, 2023.

EGU23-14372 | ECS | Posters on site | AS1.24

Investigating the Causes of Poleward Shift in Monsoon Low-level Jet 

Sukumaran Sreepriya, Krishna Mirle AchutaRao, and Sukumaran Sandeep

Recent studies using coupled model simulations and observation datasets suggest a poleward shift and overall weakening of Indian Summer Monsoon (ISM) circulation (Sandeep and Ajayamohan, 2015). Their investigation using experiments from the fifth phase of coupled model Inter-comparison project (CMIP5) indicate a poleward migration of the monsoon low-level jet (LLJ), with the magnitude of shift  linked to the degree of warming. 

Here we investigate the changes in monsoon LLJ in multiple reanalysis datasets as well as historical and future scenario simulations of the sixth phase of coupled model Inter-comparison project (CMIP6). The latitudinal location of LLJ is defined as the latitude of zero absolute vorticity over the Arabian Sea, following Tomas and Webster (1997). Although all reanalysis datasets show a poleward shift in LLJ since late 1970s, the magnitude of shift varies among them. The multi model ensemble of CMIP6 historical simulations show a northward shift of 0.4 degrees in LLJ. The ensemble mean of SSP585 simulations show a northward shift in LLJ by 0.8 degrees in the 2081 - 2100 period. The changes in the latitudinal position of LLJ and the land-sea temperature difference are significantly correlated, with a Pearson correlation coefficient of 0.81 and 0.67 for the ensemble means of historical and SSP585 runs, respectively. This suggests that the underlying dynamics of the monsoon circulation is changing in a warming climate.

References

Sandeep, S., & Ajayamohan, R. S. (2015). Poleward shift in Indian summer monsoon low level jetstream under global warming. Climate Dynamics, 45(1), 337-351.

Tomas, R. A., & Webster, P. J. (1997). The role of inertial instability in determining the location and strength of near‐equatorial convection. Quarterly Journal of the Royal Meteorological Society, 123(542), 1445-1482.

How to cite: Sreepriya, S., Mirle AchutaRao, K., and Sandeep, S.: Investigating the Causes of Poleward Shift in Monsoon Low-level Jet, EGU General Assembly 2023, Vienna, Austria, 23–28 Apr 2023, EGU23-14372, https://doi.org/10.5194/egusphere-egu23-14372, 2023.

EGU23-16193 | ECS | Orals | AS1.24

Rise in Rainfall of South Asian Monsoon Low-Pressure Systems 

Vishnu Sasidharan Nair, William R. Boos, Mark D. Risser, Travis A. O’Brien, Paul A. Ullrich, and William D. Collins

Cyclonic low‐pressure systems (LPS) are the dominant synoptic‐scale rain-bearing system of the South Asian summer monsoon. Traditionally categorized by intensity as monsoon lows, monsoon depressions, and more intense cyclonic storms, LPS produce intense rainfall and floods in some of the world’s most densely populated regions. Yet the contribution of the relatively weak lows vs. the stronger depressions to extreme rainfall and its trends remains unknown; this knowledge gap is particularly troubling because historical trends in LPS have been difficult to assess due to changes in the observing network. Future projections have also remained highly uncertain due to the inability of many coarse-resolution climate models to accurately simulate LPS.

Here we use satellite and gauge-based precipitation estimates with atmospheric reanalyses to show that precipitation in monsoon depressions has become more intense in recent decades. This intensification has occurred as humidity over parts of India increased more rapidly than nearly anywhere else on Earth. Precipitation in depressions has risen at a relative rate larger than that of specific humidity, suggesting that upward motion in depressions has become more intense; vertical motion trends in a state-of-the-art reanalysis, which incorporates nearly all long-term climate forcings, are consistent with this hypothesis. We also examine changes in South Asian LPS precipitation simulated by an ensemble of high-resolution global models, which we find skillfully represent these storms. Future trends in total LPS precipitation, including in monsoon depressions, lie near an approximate Clausius–Clapeyron rate (7%/K) in the multi-model mean. This change in LPS rain rates contributes to a projected future increase in seasonal mean and extreme precipitation over South Asian land. Adaptation to future changes in human exposure to hydrological extremes thus requires careful monitoring, accurate multi-decadal projections, and skilful short-term forecasts of the interaction of the humidity field with the dynamics of monsoon LPS.

How to cite: Sasidharan Nair, V., R. Boos, W., D. Risser, M., A. O’Brien, T., A. Ullrich, P., and D. Collins, W.: Rise in Rainfall of South Asian Monsoon Low-Pressure Systems, EGU General Assembly 2023, Vienna, Austria, 23–28 Apr 2023, EGU23-16193, https://doi.org/10.5194/egusphere-egu23-16193, 2023.

CL2 – Present Climate – historical and direct observations period

EGU23-2 | Posters on site | CL2.1

State of a challenge – Third annual review 

Miklos Zagoni

We announced a public challenge at the EGU 2020 General Assembly against CMIP6 models predicting an increase of downward longwave radiation (DLR) in the range of 10 – 40 Wm-2 during the 21st century as a result of human greenhouse gas emissions. We based our challenge on observed facts, supported by long-known but rarely referred theoretical constraints. 22 years of CERES data show +0.11 Wm-2/decade increase in DLR, equivalent to +0.36 Wm-2 increase (+0.06 °K) until 2050 (in contrast to IPCC AR6, predicting +2 Wm-2/decade).

Supporting our prediction, we repeat here the deduction of the constraint equations, and control them on the recently available data sets. — Our best tool the compute the transfer of radiation in the atmosphere is Schwarzschild’s (1914) equation; its early, two-stream form is given in Schwarzschild (1906, Eq. 11), appropriate for global-mean energy flow computations. The equation consists of three terms; the difference of the second and first terms gives the net radiation at the surface as constrained to half of the outgoing longwave radiation (OLR), independently of the optical depth.  In the literature it was observed early (Emden 1913) that there is a discontinuity at the surface in radiative equilibrium, balanced by the turbulent fluxes in radiative-convective equilibrium. The formula for this net radiation is given for example in the textbook of Goody (1964, Atmospheric radiation: theoretical basis); repeated by Houghton (1977, Eq. 2.13), graphically represented in Chamberlain (1979, Fig. 1.4); and verified by the data (without explicitly describing the equation) of Hartmann (1994, pp. 61-63) within 0.3 Wm-2. The equation is verified by the CERES EBAF Ed2.8 (16 years of clear-sky global mean data) within 0.6 Wm-2. We use the second term of Schwarzschild (1906, Eq.11) with a particular optical depth of τ = 2 to compute the total energy absorption (and emission) at the surface, verified by the same satellite data product within the same difference (0.6 Wm-2) in the clear-sky annual global mean. — We created the all-sky versions of these two equations by introducing longwave cloud radiative effect (LWCRE), and justified the four individual equations on the most recent 22 years of CERES EBAF Edition 4.1 global mean data within ±3 Wm-2; while the mean bias of the four equations together is 0.0007 Wm-2. These equations form the boundary conditions of every valid climate prediction.

Reference:
Zagoni, M.: Challenging CMIP6 model predictions, EGU General Assembly 2020, Online, 4–8 May 2020, EGU2020-1, https://doi.org/10.5194/egusphere-egu2020-1


How to cite: Zagoni, M.: State of a challenge – Third annual review, EGU General Assembly 2023, Vienna, Austria, 23–28 Apr 2023, EGU23-2, https://doi.org/10.5194/egusphere-egu23-2, 2023.

EGU23-6 | Posters on site | CL2.1

Nitrous Oxide and Climate 

William van Wijngaarden, Cornelis de Lange, James Ferguson, and Will Happer

Higher concentrations of atmospheric nitrous oxide are expected to slightly warm Earth's surface because of an increase in radiative forcing.  For current concentrations of greenhouse gases, the radiative forcing per added N2O molecule, is about 230 times larger than the forcing per added carbon dioxide molecule.  This is due to the heavy saturation of the absorption band of the relatively abundant greenhouse gas, CO2, compared to the much smaller saturation of the absorption bands of the trace greenhosue gas N2O.  But the rate of increase of CO2 molecules, about 2.5 ppm/year is about 3000 times larger than the rate of increase of N2O molecules, which has held steady at around 0.85 ppb/year since 1985.  So the contribution of nitrous oxide to the annual increase in forcing is 230/3000 or about 1/13 that of CO2.  If the main greenhouse gases, CO2, CH4 and N2O have contributed about 0.1 K/decade of the warming observed over the past few decades, this would correspond to about 0.00064 K per year or 0.064 K per century of warming from N2O.  This rather small warming does not support placing harsh restrictions on nitrous oxide emissions, which could seriously jeopardize world food supplies.

How to cite: van Wijngaarden, W., de Lange, C., Ferguson, J., and Happer, W.: Nitrous Oxide and Climate, EGU General Assembly 2023, Vienna, Austria, 23–28 Apr 2023, EGU23-6, https://doi.org/10.5194/egusphere-egu23-6, 2023.

EGU23-12 | Orals | CL2.1

Evidence for Hemispheric Spectral Albedo Inequality 

William Collins and Daniel Feldman

In this study, we examine whether the interhemispheric symmetry observed
in broadband shortwave albedos also applies to the
hemispheric-mean visible and near-infrared albedos.  While
several recent exploratory studies have examined this question
using climate models, we explore this
question using direct observations of the visible and
near-infrared albedos collected by the Nimbus-7 satellite. This
study builds upon earlier intercomparisons of cloud spectral
albedos from Nimbus-7 and from climate models using the same
combinations of Nimbus-7 measurements used here (Collins, 1998).

We find that the hemispheric-mean spectral partitioning of albedo is
consistently and statistically significantly different between the two
hemispheres.  Consistent with prior studies, the origin of these
differences is due to interhemispheric differences in cloud cover.
Over oceans, the regional daily-mean differences between visible and
near-IR albedos are closely correlated with cloud amount.  The
relative differences are maximized for clear-sky conditions and
minimized for overcast conditions.

Background: The shortwave broadband albedo is a weighted sum of the albedos
in the visible and near-infrared bands.  Under condensate-free
conditions, the interactions of solar insolation in these bands
with the atmosphere and surface are quite different.  To an
excellent approximation, the condensate-free atmosphere is a
conservative Rayleigh-scattering medium in the visible.  Solar
radiation that is not reflected back to space is, to leading
order, transmitted to the surface.  In the near-infrared, the
interactions of sunlight with the atmosphere are dominated by
absorption, primarily with water vapor.  Additional absorption is
contributed by well-mixed greenhouse gases, oxygen, and other
gaseous constituents. The solar radiation
reaching the surface has therefore been reduced both by
reflection to space (from atmospheric condensates and the surface
albedo) and by absorption in the atmosphere. Hence, the relative
partitioning of net TOA insolation between the visible and
near-infrared bands will affect the relative partitioning between
atmospheric absorption and transmission to the surface.


How to cite: Collins, W. and Feldman, D.: Evidence for Hemispheric Spectral Albedo Inequality, EGU General Assembly 2023, Vienna, Austria, 23–28 Apr 2023, EGU23-12, https://doi.org/10.5194/egusphere-egu23-12, 2023.

EGU23-1015 | Orals | CL2.1

State Dependence of CO2 Forcing and Its Implications for Climate Sensitivity 

Brian Soden, Haohe He, Ryan Kramer, and Nadir Jeevanjee

Instantaneous radiative forcing (IRF) is a fundamental metric for measuring the extent to which anthropogenic activities and natural events perturb the Earth's energy balance. This perturbation initiates all other forced climate responses. Among all the anthropogenic forcing agents, CO2 is the dominant driver of warming over the past century and the defining forcing variable for quantifying climate sensitivity. When evaluating the effect of CO2 changes on the earth’s climate, it is universally assumed that the IRF from a doubling of a given CO2 concentration (IRF2×CO2) is constant and that variances in climate sensitivity arise from differences in radiative feedbacks, or a dependence of these feedbacks on the climatological base-state. In this paper, we show that the IRF2×CO2 is not constant, but also depends on the climatological base-state, increasing by ~25% for every doubling of CO2, and has increased by ~10% since the pre-industrial era, implying a proportionate increase in climate sensitivity. This base-state dependence also explains about half of the intermodel spread in IRF2×CO2, a problem that has persisted among climate models for nearly three decades. It may also have important implications for elucidating the causes and consequences of deep-time paleoclimates, where changes in the climatological base-state can strongly modulate the magnitude of the CO2 IRF.

How to cite: Soden, B., He, H., Kramer, R., and Jeevanjee, N.: State Dependence of CO2 Forcing and Its Implications for Climate Sensitivity, EGU General Assembly 2023, Vienna, Austria, 23–28 Apr 2023, EGU23-1015, https://doi.org/10.5194/egusphere-egu23-1015, 2023.

The slope of the quasi-linear relation between planetary outgoing longwave radiation (OLR) and surface temperature (TS) is an important parameter measuring the sensitivity of the Earth climate system. The main goal of this study is to seek a general explanation for the quasi-linear OLR-TS relation that does not require the narrowing of “atmospheric window” of planetary thermal radiation. The physical understanding on the quasi-linear OLR-TS relation and its slope is gained from observation analysis, climate simulations with radiative-convective equilibrium and general circulation models, and a series of online feedback suppression experiments.

The observed quasi-linear OLR-TS relation manifests a climate footprint of radiative (such as greenhouse effect) and non-radiative processes (poleward energy transport). The former acts to increase the meridional gradient of surface temperature and the latter decreases the meridional gradient of atmospheric temperatures, causing the flattening of the meridional profile of the OLR. Radiative processes alone can lead to a quasi-linear OLR-TS relation that is more steeply sloped. The atmospheric poleward energy transport alone can also lead to a quasi-linear OLR-TS relation by rerouting part of the OLR to be emitted from the warmer place to colder place. The combined effects of radiative and non-radiative processes make the quasi-linear OLR-TS relation less sloped with a higher degree of linearity. In response to anthropogenic radiative forcing, the slope of the quasi-linear OLR-TS relation would be further reduced via stronger water vapor feedback and enhanced poleward energy transport.

How to cite: Cai, M., Sun, J., Ding, F., Kang, W., and Hu, X.: The quasi-linear relation between planetary outgoing long wave radiation and surface temperature: a climate footprint of radiative and non-radiative processes, EGU General Assembly 2023, Vienna, Austria, 23–28 Apr 2023, EGU23-1078, https://doi.org/10.5194/egusphere-egu23-1078, 2023.

EGU23-1130 | ECS | Posters on site | CL2.1

Analyzing Spatio-temporal variability of clouds over the Arabian Sea using ERA5 reanalysis dataset 

Jaswant Moher, Vimlesh Pant, and Sagnik Dey

Clouds cover 67% of the earth's surface hence they play an essential role in governing the energy balance of the earth. The combined effect of two properties, i.e., emissivity and albedo of clouds, defines the net radiative effect and their relative importance changes from day to night. In this study, we analyze four decades (1979-2018) of high-resolution (0.25°×0.25°) hourly cloud data from ECMWF fifth-generation reanalysis ERA5 dataset to study the long-term changes in Spatio-temporal variability of clouds over the Arabian Sea. The rationale behind choosing the ERA5 data is that, unlike any other climate variables, the long-term ground truth data for clouds do not exist, and satellite datasets have discrepancies. Ship-observation compiled Extended Edited Synoptic Cloud Reports Archive (EECRA) is a multidecadal data but has a coarse resolution (10°×10°) and suffers from human observational error. In this study, we used a combination of wind speed, air temperature, sea surface temperature (SST), and cloud cover data from ERA5  to explain the observed diurnal behavior and long-term changes in diurnal amplitude and local time of maximum clouds. The clouds over the Arabian Sea show two distinct diurnal peaks during June - August (JJA), but a single diurnal peak is found during the rest of the year. The seasonal and spatial variability in the diurnal behavior of clouds can be characterized in terms of the local thermodynamics of the Arabian Sea. The diurnal amplitude and local time of a maximum of low, mid, and high-level clouds have changed from 1979 to 2018, and the changes are spatially heterogeneous across all seasons. The diurnal amplitude of high-level clouds has increased through all seasons except during JJA. During the JJA season, the entire Arabian Sea shows a decrease in the diurnal amplitude of high-level clouds, with the largest decrease, observed in the eastern Arabian Sea along the west coast of India.

How to cite: Moher, J., Pant, V., and Dey, S.: Analyzing Spatio-temporal variability of clouds over the Arabian Sea using ERA5 reanalysis dataset, EGU General Assembly 2023, Vienna, Austria, 23–28 Apr 2023, EGU23-1130, https://doi.org/10.5194/egusphere-egu23-1130, 2023.

Fossil-fuel combustion now outweighs solar variations in driving climate change (Higgs 2022, GSA, www.researchgate.net/publication/362103181). Remarkably, land (near-surface-air) warming is three times faster than ocean-surface warming, and Northern Hemisphere (NH; land-ocean average) three times Southern. This aberrant behavior began abruptly in 1985 (contrast pre-1985 lockstep warming-cooling; data.giss.nasa.gov/gistemp/graphs_v4). Moreover, over land and over the NH, warming is significantly slower at altitude (UAH satellite-measured lower-troposphere average temperature).

These strong lateral- and vertical warming gradients incriminate airborne soot (warms atmosphere by absorbing solar radiation). Soot’s poor dispersal causes strong concentration gradients, both (A) laterally, toward its main sources, which are predominantly on-land and NH (diesel engines, cooking woodfires, coal-fired powerplants/industries), e.g. over intensely industrialized nations (USA, Europe, China, etc.), average atmospheric soot concentration is ~1000% (i.e. 10 times) greater than over adjacent oceans (NASA 2011 global black carbon video https://svs.gsfc.nasa.gov/3844), starkly contrasting with CO2’s 1% difference (NASA global CO2 video); and (B) vertically, e.g. year-round average soot concentration above rural Siberia is ~500% higher at 0.5km than at 3km (doi: 10.3390/atmos12030351), far exceeding CO2’s 4% difference above Tokyo (10.3390/s18114064).

Two further observations implicate diesel- and coal-sourced soot specifically. Firstly, 25 years (y) before the 1985 decouplings (above), world annual oil consumption tripled in 1960, then remained high almost continuously (OurWorldinData, GlobalPrimaryEnergyConsumptionBySource graph). Secondly, coal’s distinctively stepwise growth (same graph) is mimicked, with a similar time-lag (10-20y), by stepwise land-air warming (data.giss.nasa.gov/gistemp/graphs_v4): COAL GROWTH fast 1974-1989 (tripled in 1974, due to 1973 oil crisis), nil 1989-1999, fast 1999-2014 (mainly China; OurWorldinData, CoalConsumptionByRegion graph); LAND WARMING fast 1994-2005, nil 2005-2011 (famed ‘hiatus’), fast since 2011.

CO2 cannot explain the observed strong lateral and vertical warming gradients, because its efficient dispersal produces near-homogenous atmospheric concentration. Even heavily industrial regions barely (<0.5%) exceed the global average (10.1038/s41598-019-53513-7). Furthermore, no leap in CO2 concentration occurred ~1985 or any other time; instead, CO2 grew by gradual acceleration, not stepwise (keelingcurve.ucsd.edu). Evidently, CO2 has negligible effect on climate, implying that its greenhouse effect is nullified by unknown and/or underestimated feedbacks (e.g. 10.1007/978-94-007-6606-8_17). If so, hyper-expensive CO2 capture is misconceived, besides counter-productive (today’s 420ppm is well below ~1,000ppm optimum for crop- and forest growth).

In the literature, the global-warming contribution of soot (‘black carbon’) is very uncertain. According to an influential review (10.1002/jgrd.50171; italic emphasis added here): “The best estimate of industrial-era climate forcing of black carbon ... is +1.1 W m-2 with 90% uncertainty bounds of +0.17 to +2.1 W m-2 (sic) ... We estimate that black carbon ... is the second most important human emission in terms of its climate forcing”. Black carbon’s warming effect was estimated to be 70% as strong as CO2. Recent IPCC estimates are 35% and 12% (2013, Physical Science Basis, Summary for Policymakers, fig.SPM.5; 2021, ditto, fig.SPM.2c). On the contrary, the data presented above suggest black carbon is overwhelmingly the dominant anthropogenic-warming agent. Helping to explain previous underestimates, two additional soot-induced warming mechanisms, via its effects on clouds, were recently recognised (10.1038/s41561-020-0631-0). Moreover, developing-world powerplants possibly emit far more soot (10.1029/1999JD900187) than the review assumed.

How to cite: Higgs, R.: Global land-surface warming much faster than ocean surface, and Northern Hemisphere faster than Southern: incriminates soot from burning oil and coal, exonerates CO2, EGU General Assembly 2023, Vienna, Austria, 23–28 Apr 2023, EGU23-1416, https://doi.org/10.5194/egusphere-egu23-1416, 2023.

EGU23-2384 | ECS | Orals | CL2.1

Optimising water vapour retrievals by exploiting sensitivity within the far-infrared: A study in support of the ESA FORUM mission. 

Sanjeevani Panditharatne, Helen Brindley, Caroline Cox, and Richard Siddans

Theoretical models suggest that ∼55% of the outgoing longwave radiation from Earth is within the far-infrared region, 100-666 cm−1. Nevertheless, the top-of-atmosphere radiation spectrum in this region has never been measured, something that will change with ESA’s Far-infrared Outgoing Radiation Understanding and Monitoring (FORUM) mission, launching in 2027. Studies have indicated that absorption within this region is dominated by tropospheric water vapour, significantly impacting Earth’s radiation budget. Quantifying these concentrations plays a vital role in estimating its radiative effects and associated feedbacks.

The Infrared and Microwave Sounding (IMS) retrieval scheme developed at RAL Space is an optimal estimation scheme currently using channels within the mid- and near-infrared as well as the microwave region to obtain simultaneous retrievals of the vertical atmospheric profile and cloud properties. Current retrievals using this scheme have been performed on observations from Infrared Atmospheric Sounding Interferometer (IASI), Microwave Humidity Sounder (MHS) and the Advanced Microwave Sounding Unit (AMSU) onboard the MetOp satellites. Temperature and water vapour retrievals using this framework have been validated against radiosonde data with biases within 1 K and 10% of the reference respectively.

This work seeks to extend IMS into the far-infrared and exploit the known sensitivity of upwelling radiation within this region to improve current retrievals of water vapour. This would enhance our understanding of the spatial and temporal variations of water vapour within the atmosphere, and its role in Earth's radiation budget. Unique clear-sky airborne measurements will be used to analyse channel sensitivity within this region and maximise the information content for the retrieval. This retrieval capability would be the first of its kind to be thoroughly validated in this way and would be available for use on FORUM observations.

How to cite: Panditharatne, S., Brindley, H., Cox, C., and Siddans, R.: Optimising water vapour retrievals by exploiting sensitivity within the far-infrared: A study in support of the ESA FORUM mission., EGU General Assembly 2023, Vienna, Austria, 23–28 Apr 2023, EGU23-2384, https://doi.org/10.5194/egusphere-egu23-2384, 2023.

EGU23-2448 | ECS | Orals | CL2.1

Including Ice-Cloud Longwave Scattering and Surface Spectral Emissivities in Climate Models Leads to More Impacts on Mean-State Climate than Climate Feedbacks 

Chongxing Fan, Yi-Hsuan Chen, Xiuhong Chen, Wuyin Lin, Xianglei Huang, and Ping Yang

Climate models often ignore cloud scattering and surface emissivity in the longwave (LW) for computational efficiency. Such approximations can cause biases in radiative fluxes and affect simulated climate, especially in the Arctic because of its large sensitivity to perturbations. We implemented treatments to both physics into the Energy Exascale Earth System Model (E3SM) version 2 by DoE and assessed their impacts on the simulated mean-state global climate as well as climate feedback and sensitivity.

By turning on and off the switches in the modified E3SMv2 model, we studied the changes in mean-state climate due to cloud LW scattering and surface emissivity effects by comparing four 35-year fully-coupled simulations. Cloud LW scattering warms the entire global troposphere by ~0.4 K on average; the warming is stronger in the Arctic (~0.8 K) than in the tropics, which is a manifestation of the polar amplification phenomenon. When realistic emissivity is incorporated into the model, the surface skin temperature increases by 0.36 K instantaneously on a global average, especially in the Sahara Desert (~0.7 K) where the surface emissivity is low. Surface skin temperature, as well as surface air temperature and tropospheric temperature, further increases by 0.19 K due to the inclusion of surface spectral emissivity. The mean-state climate changes due to both effects are linearly additive. The latitudinal and seasonal pattern of surface air temperature warming resulting from both effects is very similar to the response due to CO2 increase in the standard E3SMv2 model.

We also carried out four 35-year simulations under the abrupt 4xCO2 scenario, with cloud LW scattering and/or surface emissivity effects on and off. Based on standard radiative kernel analysis, we found that total global-mean climate feedback does not change significantly after including either or both physics. Nevertheless, lapse rate feedback, water vapor feedback, and cloud feedbacks in the tropics have changes by up to 10%. They are primarily associated with high cloud fraction response in the upper troposphere. Our study suggests that both the cloud LW scattering effect and the surface spectral emissivity effect should be included in climate models for a faithful representation of the radiative process in the atmosphere, especially at regional scales.

How to cite: Fan, C., Chen, Y.-H., Chen, X., Lin, W., Huang, X., and Yang, P.: Including Ice-Cloud Longwave Scattering and Surface Spectral Emissivities in Climate Models Leads to More Impacts on Mean-State Climate than Climate Feedbacks, EGU General Assembly 2023, Vienna, Austria, 23–28 Apr 2023, EGU23-2448, https://doi.org/10.5194/egusphere-egu23-2448, 2023.

The incoming surface solar radiation is an essential climate variable as defined by GCOS. Long term monitoring of this part of the earth’s energy budget is required to gain insights on the state and variability of the climate system. In addition, climate data sets of surface solar radiation have received increased attention over the recent years as an important source of information for solar energy assessments, for crop modeling, and for the validation of climate and weather models.

Gridded regional and global data records of the surface irradiance are available based on satellite measurements as well as derived from numerical models, e.g., reanalysis systems. For climatological analyses, long-term data records, covering about multiple decades, are required. Recently generated satellite-based climate data records from the EUMETSAT Satellite Application Facility on Climate Monitoring (CM SAF), i.e., SARAH-3 and CLARA-A3, as well as the GEWEX SRB data set, fulfill this requirement. Corresponding reanalysis data are also available, i.e., ERA-5, MERRA-2.

Here we will assess the quality of these satellite-based and reanalysis-derived climate data records of the surface irradiance by comparison with monthly surface reference data from the Global Energy Balance Archive (GEBA). The quality assessment will include the accuracy of the gridded data as well as their ability to realistically reproduce the anomalies and temporal trends as derived from the surface observations. The inter-comparison of the gridded data records allows to identify regions of high / low confidence in our knowledge of the surface irradiance and the surface radiation budget.  

How to cite: Trentmann, J. and Pfeifroth, U.: Assessing the quality of gridded Climate Data Records of the Surface Irradiance using global Reference Data Sets, EGU General Assembly 2023, Vienna, Austria, 23–28 Apr 2023, EGU23-2563, https://doi.org/10.5194/egusphere-egu23-2563, 2023.

EGU23-2608 | ECS | Orals | CL2.1

Global ground heat flux from remote sensing data: preliminary results and evaluation 

Francisco José Cuesta-Valero and Jian Peng

Ground heat flux constitutes the conductive component of the surface energy budget. Quantifying this energy component is important to close the surface energy balance and to understand the energy exchanges between the lower atmosphere and the shallow subsurface. Furthermore, ground heat storage accounts for approximately 90 % of the continental heat storage, and 4-5 % of the total Earth heat storage. Therefore, monitoring changes in ground heat flux at global scale is of critical importance to quantify and understand the evolution of the Earth heat inventory, and thus climate change. However, the main sources of information about past and present ground heat flux are measurements of subsurface temperature profiles and micrometeorological observations, which are incomplete records biased towards northern extratropical latitudes.

Here, we present preliminary estimates of global ground heat flux derived from remote sensing products from the European Space Agency (ESA) Climate Change Initiative (CCI). Estimates from four land surface temperature (LST) products (MODIS-Terra, MODIS-Aqua, ENVISAT-AATSR, and SSMI-SSMIS) are evaluated against FLUXNET observations, obtaining a range of root mean squared errors from 3.8 to 5.2 W m-2 at monthly resolution. Nevertheless, there are some spatial inconsistencies among estimates from different LST products, as well as in long-term trends during the period 2003-2013. Several factors affecting the estimated ground heat flux are analyzed, with soil water and land cover having the largest effect on the retrieved values. These results suggest that land surface temperature from satellite observations may be able to provide global long-term ground heat flux estimates, although some issues still need to be solved.

How to cite: Cuesta-Valero, F. J. and Peng, J.: Global ground heat flux from remote sensing data: preliminary results and evaluation, EGU General Assembly 2023, Vienna, Austria, 23–28 Apr 2023, EGU23-2608, https://doi.org/10.5194/egusphere-egu23-2608, 2023.

EGU23-2796 | ECS | Orals | CL2.1

A novel approach for assessing regionally differentiated ocean contributions to Earth Energy Imbalance from GRACE(-FO) and multi-mission altimetry 

Bernd Uebbing, Kristin Vielberg, Bene Aschenneller, Roelof Rietbroek, Armin Köhl, and Jürgen Kusche

Earth Energy Imbalance (EEI) results from a net positive radiative flux at the top of atmosphere. Over 90% of this excess energy is stored as heat in the ocean causing present day ocean heat content (OHC) change. This in turn leads to volumetric or steric expansion of the water column and sea level rise. Utilizing observed bias-corrected short- and long-wave energy fluxes from the CERES project, it is possible to estimate EEI at the top of atmosphere. However, bias corrections rely on reanalysis OHC, potentially resulting in overestimation of ocean heat uptake (OHU).

Combining GRACE(-FO) and altimetry observations and constructing global sea level budgets allows to derive (thermo-)steric sea level change and convert this to OHU; the latter is generally achieved considering a literatute-based ocean-mean expansion efficiency of 0.52 [W/m^2 / mm/yr]. Nonetheless, this approach is valid for global mean steric sea level change only and it is unclear to what extent one can use it for investigating regional OHU.

Here, we develop a novel approach for deriving global and regional observation based OHC and OHU, which consists of three steps. (1) Fitting mass and steric spatial patterns, so called fingerprints, to GRACE(-FO) and altimetry data in a joint least-squares inversion. (2) Projecting reanalysis OHC onto the same spatial patterns that we use to explain steric variability. (3) Rescaling reanalysis OHC based on the observed steric sea level changes and reconstruction of spatial maps of OHC. These can then be further analyzed in order to derive global and regional OHU.

Based on preliminary results for years 2005-01 till 2015-12, we find ~1.2 mm/yr (thermo-)steric sea level change. Global-mean OHU of 0.62 [W/m^2] can be derived from the literature expansion efficiency above, while we find 0.63 [W/m^2] from the novel rescaling approach and 0.87 [W/m^2] based on ORAS5 ocean model data only. Regionally analyzing these results regarding individual ocean contributions reveals that the ocean model seems to significantly overestimate the uptake of the Atlantic and Pacific oceans, while slightly underestimating the Indian ocean contribution.

How to cite: Uebbing, B., Vielberg, K., Aschenneller, B., Rietbroek, R., Köhl, A., and Kusche, J.: A novel approach for assessing regionally differentiated ocean contributions to Earth Energy Imbalance from GRACE(-FO) and multi-mission altimetry, EGU General Assembly 2023, Vienna, Austria, 23–28 Apr 2023, EGU23-2796, https://doi.org/10.5194/egusphere-egu23-2796, 2023.

EGU23-2962 | Orals | CL2.1 | Highlight

Observational Assessment of Changes in Earth’s Energy Imbalance Since 2000 

Norman Loeb, Tyler Thorsen, Sueng-Hee Ham, Fred Rose, and Seiji Kato

Observations from the Clouds and the Earth’s Radiant Energy System (CERES) show a marked increase in Earth’s energy imbalance (EEI) since 2000. At the same time, we’ve seen marked changes in numerous geophysical variables that influence EEI. While observations alone cannot quantify the anthropogenic and natural contributions to changes in these quantities, they can provide insight into how changes in different components of the climate system have led to the observed EEI trend. Using additional data from MODIS, CALIPSO, Cloudsat, and reanalysis, we find the increase in EEI to be due to decreased reflection by clouds and sea-ice, which cause a pronounced increase absorbed solar radiation (ASR), and a decrease in outgoing longwave radiation (OLR) due to increases in trace gases and water vapor. The ASR increases are largest over the subtropics and mid-latitudes in regions with decreases in low and middle cloud fraction, which likely occur in response to observed increases in sea-surface temperature (SST) in those locations. We diagnose the SST changes by performing an ocean mixed layer energy budget analysis at regional, hemispheric, and global scales using TOA and surface radiation observations from CERES, SST and temperature/humidity fields from ERA-5, and ocean mixed layer depth from ocean reanalysis. This analysis suggests that heating of the mixed layer and the subsequent increase in SST stems from ocean mixing/advection rather than from surface forcing. 

How to cite: Loeb, N., Thorsen, T., Ham, S.-H., Rose, F., and Kato, S.: Observational Assessment of Changes in Earth’s Energy Imbalance Since 2000, EGU General Assembly 2023, Vienna, Austria, 23–28 Apr 2023, EGU23-2962, https://doi.org/10.5194/egusphere-egu23-2962, 2023.

EGU23-3268 | Orals | CL2.1

Aerosol Radiative Forcing 

Steven Dewitte

The long term global temperature rise caused by increased greenhouse gas radiative forcing is partially masked by temporary aerosol radiative cooling, which remains poorly known.

I present a new purely observation based estimate of Aerosol Radiative Forcing (ARF) due solely to the direct radiative effect of aerosols over clear sky ocean, and its time variation over the period 2003-20204 from combined MODIS and CERES aerosol, cloud, and radiation measurements. The resulting mean 2003-2020 ARF is -1.16 +/- 0.39 W/m2 , with no significant trend within an uncertainty of +/- 0.025 W/m2dec.

Combining this ARF with the best estimate of the greenhouse gas and solar radiative forcing, and the most likely value of the Equilibrium Climate Sensitivity, produces a plausible Earth Energy Imbalance as a residual of the energy balance equation at the top of the atmosphere.

How to cite: Dewitte, S.: Aerosol Radiative Forcing, EGU General Assembly 2023, Vienna, Austria, 23–28 Apr 2023, EGU23-3268, https://doi.org/10.5194/egusphere-egu23-3268, 2023.

EGU23-3896 | ECS | Orals | CL2.1

Constraining the tropical anvil cloud "iris" feedback 

Brett McKim, Sandrine Bony, Marion Saint-Lu, and Jean-Louis Dufresne

An outstanding question in climate science is how much the change in tropical anvil cloud clover with warming influences Earth's climate sensitivity. Here, we construct a simple model of cloud radiative effects to obtain an analytical equation for the tropical anvil area “iris” feedback. Our equation shows how the feedback is constrained by the fractional change in anvil cloud area, the anvil cloud radiative effect, and the radiative masking of low clouds that live beneath anvils.  We then look at satellite observations to diagnose these quantities. We find that the inferred values of anvil cloud radiative effect and low cloud masking effects sum to 1 Wm-2. Owing to this small radiative effect, the observed changes in anvil cloud cover in interannual variability implies an iris feedback that is wholly insufficient to strongly influence climate sensitivity. We then extend our equation to address whether anvil clouds might affect climate sensitivity through their masking of other forcings  or feedbacks.

How to cite: McKim, B., Bony, S., Saint-Lu, M., and Dufresne, J.-L.: Constraining the tropical anvil cloud "iris" feedback, EGU General Assembly 2023, Vienna, Austria, 23–28 Apr 2023, EGU23-3896, https://doi.org/10.5194/egusphere-egu23-3896, 2023.

EGU23-4469 | ECS | Orals | CL2.1

Impacts of the Ocean Modes on the Surface Solar Radiation decadal variability over the western Pacific 

Lucas Ferreira Correa, Doris Folini, Boriana Chtirkova, and Martin Wild

Sea Surface Temperature (SST) plays a major role in the unforced variability of the climate system on decadal scales via the interplay between ocean and atmosphere, and associated changes in cloud cover and water vapor. The ocean modes, such as El Nino Southern Oscillation (ENSO) and Interdecadal Pacific Oscillation (IPO), are major coherent manifestations of SST variability. This means that the impacts of the ocean modes might be reflected in several components of the climate system, such as the energy budget. At the surface, this can be observed in the decadal trends in surface solar radiation (SSR). In this study we investigated the impacts of IPO and ENSO and associated cloud cover and water vapor variability on the decadal trends in SSR at 6 island stations scattered in the western Pacific (two stations in Fiji, one in New Caledonia, Nauru, Papua New Guinea and Marshall Islands). We combined between 15 and 40 years of daily SSR observations (depending on the station) with cloud cover from ERA5 reanalysis, aerosol optical depth (AOD) from CAMS reanalysis, and time series of IPO and ENSO. The comparison between clear-sky and all-sky SSR trends show that the all-sky trends strongly dominate in 5 out of the 6 stations. The exception is New Caledonia, where the clear-sky seems to also play an important role in the overall trend. This is the least cloudy station, and also the closest station to eastern Australia, an important source of aerosols in the region. Maps of cloud cover trends show two distinct regions which can be approximately separated by the average climatological position of the South Pacific Convergence Zone (SPCZ): one where cloud cover trends follow the phase of the IPO (positive IPO phase = positive cloud cover trend; N-NE of the SPCZ) and one where the opposite happens (positive IPO phase = negative cloud cover trend; S-SW of the SPCZ). The direct comparison between annual time series of all-sky SSR and IPO shows correlations stronger than 0.5 at two stations in Fiji and the one in New Caledonia (SW of the SPCZ). At the station in Nauru (North of the SPCZ) there is a negative correlation stronger than -0.5. When comparing annual all-sky SSR to the ENSO index, significant negative correlations are found at Momote-Papua New Guinea (-0.41) and at Nauru (-0.96), both located in the Western Pacific Warm Pool, near the Equator. In all cases strong negative correlations (<-0.7) between SSR and cloud cover using both annual and 11-year moving means time series support the hypothesis of strong cloud control over SSR interannual and decadal variability. The results indicate that IPO and ENSO play a major role in the SSR variability over the Western Pacific by controlling different cloud cover regimes in the region. This reveals a real world case of the importance of unforced internal variability to the SSR decadal and sub decadal changes.

How to cite: Ferreira Correa, L., Folini, D., Chtirkova, B., and Wild, M.: Impacts of the Ocean Modes on the Surface Solar Radiation decadal variability over the western Pacific, EGU General Assembly 2023, Vienna, Austria, 23–28 Apr 2023, EGU23-4469, https://doi.org/10.5194/egusphere-egu23-4469, 2023.

EGU23-5155 | ECS | Orals | CL2.1

Low-frequency modes in internal variability of surface solar radiation 

Boriana Chtirkova, Doris Folini, Lucas Ferreira Correa, and Martin Wild

We investigate potential reasons for decadal-scale internal variability of surface solar radiation (SSR) using model data from the Coupled Model Intercomparison Project - Phase 6. We compare unforced coupled atmosphere-ocean (piControl) to atmosphere-only (piClim) simulations with prescribed climatological sea surface temperatures (SSTs) to access the relevance of SSTs for unforced SSR inter-annual variability. Further, the connection between SSTs and known climate modes of variability is exploited. We focus on coupled and ocean-only modes of variability such as El Niño–Southern Oscillation (ENSO), Pacific Decadal Oscillation (PDO) and Atlantic Multidecadal Oscillation (AMO). Using the climate indices which describe these modes, we relate the SST field to SSR trends in different regions and we find a relationship between periods with strongly changing SSTs and decadal SSR depending on the regions. Unforced clear-sky SSR trends appear to mimic the SST trend pattern, while all-sky trends show a complex spatial structure with trends opposite in sign in different regions. These results are based only on pre-industrial control simulations (CMIP6 piControl) and can be used to infer in which direction internal variability has affected SSR in the historical period and whether it has enhanced or suppressed the anthropogenic signal from aerosols.

How to cite: Chtirkova, B., Folini, D., Ferreira Correa, L., and Wild, M.: Low-frequency modes in internal variability of surface solar radiation, EGU General Assembly 2023, Vienna, Austria, 23–28 Apr 2023, EGU23-5155, https://doi.org/10.5194/egusphere-egu23-5155, 2023.

EGU23-5372 | ECS | Orals | CL2.1

Direct observation of Earth’s spectral longwave feedback parameter 

Florian E. Roemer, Stefan A. Buehler, Manfred Brath, Lukas Kluft, and Viju O. John

The spectral longwave feedback parameter λν represents how Earth’s outgoing longwave radiation adjusts to temperature changes and is thus the detailed fingerprint of all longwave feedbacks, directly impacting Earth’s climate sensitivity. Most research so far has focused on the spectral integral of λν. Spectrally resolving λν permits inferring information about the vertical distribution of longwave feedbacks, thus gaining a better understanding of the underlying processes. However, investigations of λν have so far been largely limited to model studies, and no observational study we are aware of has inferred the global all-sky λν.

Here we show that it is possible to directly observe the global all-sky λν using satellite observations of seasonal and interannual variability taken by the Infrared Atmospheric Sounding Interferometer (IASI). We find that spectral bands subject to strong water vapour absorption exhibit a substantial stabilising net feedback. We demonstrate that this stabilising feedback is partly caused by changes in relative humidity with warming, the radiative fingerprints of which can be directly observed. Therefore, our findings emphasise the importance of better understanding processes affecting future trends in relative humidity. This first observational constraint on the global all-sky λν can be used as a powerful tool to evaluate the representation of longwave feedbacks in global climate models and to better constrain Earth’s climate sensitivity.

How to cite: Roemer, F. E., Buehler, S. A., Brath, M., Kluft, L., and John, V. O.: Direct observation of Earth’s spectral longwave feedback parameter, EGU General Assembly 2023, Vienna, Austria, 23–28 Apr 2023, EGU23-5372, https://doi.org/10.5194/egusphere-egu23-5372, 2023.

EGU23-5727 | ECS | Orals | CL2.1

Aerosol Radiative Forcing Over Indian Subcontinent for 2000-2021 using satellite observations 

Shreya Srivastava, Sushovan Ghosh, and Sagnik Dey

Aerosols directly affect Earth’s radiation budget by scattering and absorbing incoming solar radiation and outgoing terrestrial radiation. While the uncertainty in aerosol radiative forcing (ARF) has decreased over the years, it is still higher than that of greenhouse gas forcing, particularly in the South Asian region, due to high heterogeneity in aerosols’ chemical properties. India has been identified as an aerosol hotspot. Understanding the Spatiotemporal heterogeneity of aerosol composition is critical in improving ARF estimation.                            

In this study, we have taken aerosol data from Multi-angle Imaging Spectro-Radiometer (MISR) level-2 version 23 aerosol products retrieved at 4.4 km and radiation data from Clouds and the Earth’s Radiant Energy System (CERES, spatial resolution=1ox1o), for 21 years (2000-2021) over the Indian subcontinent. MISR aerosol product includes size and shapes segregated aerosol optical depth (AOD), Angstrom exponent (AE), and single scattering albedo (SSA). Additionally, 74 aerosol mixtures included in version 23 data are used for aerosol speciation. In addition, we have used CERES radiation data in four different atmospheric conditions: all-sky (AS), clear-sky (CS), pristine (PR) and no aerosol (NAER), for estimating aerosol radiative forcing in different aerosol-cloud conditions.

We have seasonally mapped aerosol optical and microphysical properties from MISR for India at quarter degrees resolution. Results show strong Spatio-temporal variability, with a constant higher value of AOD for the Indo-Gangetic Plain (IGP). The fractional contribution of small-size particles to AOD is higher (>0.4) throughout the year, spatially during post-monsoon and winter seasons (October to February). SSA is found to be overestimated by MISR, where absorbing particles are present. The climatological map of short wave (SW) ARF at the top of the atmosphere (TOA) shows a strong cooling except in only a few places (values ranging from +2.5W/m2 to -22.5 W/m2). Cooling due to aerosols is higher in the absence of clouds. Higher aerosol cooling is found over the IGP region, given the high aerosol concentration over the region. Aerosols are causing a surface cooling effect over our study domain, which is higher in clear conditions. The results strongly correlate with AOD from MISR and ARF from CERES. 

How to cite: Srivastava, S., Ghosh, S., and Dey, S.: Aerosol Radiative Forcing Over Indian Subcontinent for 2000-2021 using satellite observations, EGU General Assembly 2023, Vienna, Austria, 23–28 Apr 2023, EGU23-5727, https://doi.org/10.5194/egusphere-egu23-5727, 2023.

EGU23-6217 | Orals | CL2.1

Concept and validation of a Meteosat based dataset for Surface Radiative Balance 

Quentin Bourgeois, Anke Tetzlaff, Reto Stöckli, Nicolas Christen, John Viju, William Moutier, Nicolas Clerbaux, Françoise Gellens-Meulenberghs, Jörg Trentmann, and Isabel Trigo

During the Third Continuous Development and Operations Phase (CDOP-3) of EUMETSAT, the Satellite Application Facility (SAF) on Climate Monitoring (CM SAF) extends its product portfolio with a Thematic Climate Data Record (TCDR) of Regional Land Fluxes based on two sensors of the Meteosat suite of geostationary satellites: the Meteosat Visible and InfraRed Imager (MVIRI) and the Spinning Enhanced Visible and InfraRed Imager (SEVIRI). The Regional Land Fluxes TCDR will provide various parameters depicting the surface states and radiation fluxes, including the Surface Radiative Balance (SRB), the Cloud Fractional Cover (CFC), the Land Surface Temperature (LST), the Evapotranspiration (ET) and the Latent (LE) and Sensible (H) Heat Fluxes. The TCDR is achieved by consolidating and unifying previously separated developments in CM SAF, LSA SAF and the EUMETSAT Secretariat, and running them in a joint retrieval using the Meteosat Fundamental Climate Data Record. This unique concept ensures consistency among the TCDR parameters.

We focus here on the SRB product of the Regional Land Flux TCDR. All components of the SRB - including the Surface Incoming Solar radiation (SIS, or solar irradiance), the Surface Albedo (SAL), the Surface Outgoing Longwave radiation (SOL) and the Surface Downward Longwave radiation (SDL) - are jointly retrieved using the CM SAF software “GeoSatClim” over the period 1983-2020. The SRB data record covers area up to 65°N/S and 65°W/E. The TCDR consists in hourly, daily and monthly means with a spatial resolution of 0.05 degree.

In this presentation, we show the detailed concept of the SRB algorithm. The SRB product and its single components are validated with BSRN, GEBA, ASRB and SwissMetNet ground based stations and they are compared with other global SRB products such as ERA5-Land, ISCCP-FH and CLARA. Overall, the SRB monthly mean absolute bias reaches the target accuracy of 15 W.m-2, and the SRB stability falls below the requirement of 2 W/m2/decade.

How to cite: Bourgeois, Q., Tetzlaff, A., Stöckli, R., Christen, N., Viju, J., Moutier, W., Clerbaux, N., Gellens-Meulenberghs, F., Trentmann, J., and Trigo, I.: Concept and validation of a Meteosat based dataset for Surface Radiative Balance, EGU General Assembly 2023, Vienna, Austria, 23–28 Apr 2023, EGU23-6217, https://doi.org/10.5194/egusphere-egu23-6217, 2023.

EGU23-6759 | Posters on site | CL2.1

The Global Energy Balance as represented in CMIP6 climate models 

Martin Wild, Doris Folini, and Donghao Li

A plausible simulation of the global energy balance is a first-order requirement for a credible climate model. Therefore we investigate the representation of the global energy balance in the latest generation of global climate models (CMIP6). In the multi-model global mean, the magnitudes of the energy balance components of the CMIP6 models are often in better agreement with our reference estimates (Wild et al. 2015, 2019 Clim Dyn) as well as those from CERES/EBAF and NASA/NEWS than in earlier model generations (Wild 2020). However, the inter-model spread in the representation of many of the components remains substantial, often on the order of 10-20 Wm-2 globally, except for the shortwave clear-sky budgets, which are now more consistently simulated by the CMIP6 models. The substantial inter-model spread in the simulated global mean latent heat fluxes in the CMIP6 models, exceeding 20% (18 Wm-2), further implies also large discrepancies in their representation of the global water balance. From a historic perspective of model development over the past decades, the largest adjustments in the magnitudes of the simulated present-day global mean energy balance components occurred in the shortwave atmospheric clear-sky absorption and the surface downward longwave radiation. Both components were gradually adjusted upwards over several model generations, on the order of 10 Wm-2, to reach 73 and 344 Wm-2, respectively in the CMIP6 multi-model means. Thereby, CMIP6 has become the first model generation that largely remediates long-standing model deficiencies related to an overestimation in surface downward shortwave and compensational underestimation in downward longwave radiation in its global multi-model mean. There are also indications for an overall improvement in the representation of the energy budgets in the CMIP6 models compared to CMIP5 on regional scales (regions considered here as defined by the NASA/NEWS project). Still substantial spreads between the energy balance components of individual CMIP6 models appear also on regional scales (Li et al. 2022).


Related references:

Wild, M., 2020: The global energy balance as represented in CMIP6 climate models. Clim Dyn., 55, 553–577

Li, D., Folini D., Wild, M., 2022: Assessment of regional energy budgets in CMIP6 models, submitted


How to cite: Wild, M., Folini, D., and Li, D.: The Global Energy Balance as represented in CMIP6 climate models, EGU General Assembly 2023, Vienna, Austria, 23–28 Apr 2023, EGU23-6759, https://doi.org/10.5194/egusphere-egu23-6759, 2023.

EGU23-7024 | ECS | Posters on site | CL2.1

Assessment of land energy uptake in the industrial period from observation and simulation-based products 

Félix García-Pereira, Jesús Fidel González-Rouco, Norman Julius Steinert, Camilo Melo-Aguilar, Philipp de Vrese, Johann Jungclaus, Stephan Lorenz, Stefan Hagemann, and Elena García-Bustamante

Under increased warming from ongoing anthropogenic climate change, the land acts as an energy sink for the climate system, interacting with the atmosphere at a wide range of time scales. Based on CMIP multi-model comparisons, the latest estimates of the global energy budget quantify the land contribution to be 2% in the last six decades, whereas other studies based on borehole temperature profiles scale it up to 5%. This discrepancy is suspected to stem from state-of-the-art CMIP land surface models using a shallow zero flux bottom boundary condition placement (BBCP) that severely constrains land energy storage by halting ground heat flux penetration at the BBCP depth and biasing subsurface thermal structure. A 2000-year-long (past2k) forced simulation using a version of the Max Planck Institute (MPI) Earth System Model (ESM) with a deep BBCP (1417 m) was performed to assess the behavior of subsurface temperature and energy storage at long-term scales. Results show that land energy uptake is 4 times higher in a coupled MPI-ESM simulation with a deep version of the land component compared to standard shallow (~10m) simulations. These estimates are well above those provided by CMIP6 models and are much closer to observations, underlining the importance of BBCP-depth in correctly representing the role of the land component in the global energy budget. The results of the analysis of the past2k simulation also allow for deriving reliable estimates of land energy uptake from other observational and reanalysis products as well as providing corrected estimates for the shallow LSM CMIP6 historical and scenario simulations. Land energy uptake estimates rendered from this new approach are much closer to previous BTP-based estimates and agree with the value derived from MPI-ESM deep simulation.

How to cite: García-Pereira, F., González-Rouco, J. F., Steinert, N. J., Melo-Aguilar, C., de Vrese, P., Jungclaus, J., Lorenz, S., Hagemann, S., and García-Bustamante, E.: Assessment of land energy uptake in the industrial period from observation and simulation-based products, EGU General Assembly 2023, Vienna, Austria, 23–28 Apr 2023, EGU23-7024, https://doi.org/10.5194/egusphere-egu23-7024, 2023.

Anthropogenic aerosol particles affect clouds by serving as cloud condensation nuclei, thus significantly influencing Earth’s energy balance. The magnitude of aerosol-induced changes in cloud properties is still uncertain. This is primarily due to the meteorological covariability between aerosols and clouds, which hinders inferring causal relationships. Industrial air pollution sources serve as natural experiments to study strong anthropogenic cloud perturbations (Toll et al. 2019 Nature https://doi.org/10.1038/s41586-019-1423-9) and allow us to infer causal relationships between aerosols and clouds.


We use geostationary satellite observations to study the temporal evolution of polluted clouds. Polluted clouds are usually thinner than nearby unpolluted clouds. But in some cases, the polluted clouds grow much thicker in the afternoon than the nearby unpolluted clouds. We find that continental polluted cloud tracks are relatively long-lived, with a median lifetime of 18 hours. Moreover, there are many cases where polluted cloud tracks are visible for multiple consecutive days. This means polluted cloud tracks live long enough for clouds to fully adjust to aerosol-increased cloud droplet numbers. Future work is needed to combine geostationary and polar orbiting satellite observations of polluted cloud tracks to develop stronger observational constraints for aerosol-cloud interactions.

How to cite: Rahu, J. and Toll, V.: Novel insights into aerosol-cloud interactions enabled by analysing the temporal evolution of strong anthropogenic cloud perturbations, EGU General Assembly 2023, Vienna, Austria, 23–28 Apr 2023, EGU23-7090, https://doi.org/10.5194/egusphere-egu23-7090, 2023.

Multidecadal dimming and brightening of solar radiation at Earth’s surface has been shown to occur over all continents. Trends have been especially well documented over the Northern Hemisphere (NH) with dimming from the 1950s through the middle 1980s followed by brightening through the first decade of the 2000s in the United States, Europe, and parts of Asia. Trends in Europe and China have been attributed to both aerosols and clouds, but in the U.S. cloud variability has been dominant. A recent analysis shows that U.S. brightening of 7.4 Wm-2/decade peaked in 2012 and then dramatically dropped to near normal values in 2013. Since then, surface solar radiation in the U.S. has remained within 1 Wm-2 of the long-term average. However, in Europe surface solar radiation has remained high, at least through 2017.


It has been shown that the direct effect of aerosols cannot account for the magnitude of the latest brightening in the U.S. It has also been shown that the second indirect effect of aerosols may explain brightening into the first decade of the 2000s, but is in opposition to the observed dimming after 2012. High aerosol content does explain perpetual dimming in India and industrial parts of China, but, given that the magnitude and period of dimming and brightening trends from the 1950s through the first decade of the 2000s are similar over North America, Europe, and parts of Asia, I speculate the primary cause is meteorological. A recent study documents a strong association between multidecadal surface solar radiation trends over NH continents and long-term North Pacific and North Atlantic sea surface temperature (SST) patterns. For example, the reversal of the Pacific Decadal Oscillation (PDO) index in the mid-1980s is nearly simultaneous with the change from dimming to brightening over NH continents. A similar association is shown between Atlantic SST patterns and continental surface solar radiation trends but with a decade lag. Using reanalysis and observed SST patterns it is demonstrated that persistent warm SST anomalies support overlying semipermanent geopotential height ridges at tropospheric mid-levels that dynamically induce persistent troughs downstream over adjacent continents, if positioning is favorable. Semipermanent troughs over the continents cause greater than average cloud cover and dimming. Conversely, long-term cool SSTs produce the opposite scenario and yield less clouds and brightening downstream over the continents. Further, marine heat waves on either side of North America are shown to be associated with the recent dimming in the midcontinent from 2013 to the present, and warm SSTs in the Mediterranean and North Seas in the last decade are likely responsible for a persistent midlevel geopotential ridge pattern and continued high surface solar radiation there. Recent studies present evidence that the observed increase in frequency and variability of marine heat waves in the past few decades may be associated with global warming, possibly linking warming to trends in surface solar radiation.

How to cite: Augustine, J.: Contributors to multidecadal dimming and brightening of surface solar radiation over Northern Hemisphere continents, EGU General Assembly 2023, Vienna, Austria, 23–28 Apr 2023, EGU23-8365, https://doi.org/10.5194/egusphere-egu23-8365, 2023.

EGU23-8463 | ECS | Orals | CL2.1

Global energy budget changes from underestimated land heat uptake in CMIP6 models 

Norman Julius Steinert, Jesús Fidel González-Rouco, Philipp de Vrese, Francisco José Cuesta-Valero, Félix García Pereira, and Camilo Andrés Melo Aguilar

Under current climate-change conditions, the energy imbalance at the top of the atmosphere results in an uptake of energy by the Earth system. Previous efforts have identified the magnitude and proportions of this energy excess and how it is distributed among the different components of the climate system. However, the bulk of the Earth System Models (ESMs) participating in CMIP5/6 deliver Earth energy inventory estimates that differ substantially from recent observations. Particularly for the land component, there is a significant underestimation of simulated continental energy uptake, which was hypothesized to be caused by too shallow land surface model components in current-generation ESMs. Support for the latter was given by previous modeling estimates based on analytical heat conduction models and standalone land surface model simulations. Here we use a suite of current-generation fully-coupled CMIP6 ESMs and a version of the MPI-ESM that includes a deep land model component, accommodating the required space for increased terrestrial energy storage. The simulations show that a sufficiently deep land model leads to more realistic subsurface energy storage - correlating with model depth rather than climate sensitivity, and an adjusted estimate of energy uptake ratios among the Earth system components compared to observational estimates. However, the impact of changes in the land energy budget from the perspective of the entire Earth system appears to have only a marginal influence due to its relatively small fraction of the Earth energy inventory.

How to cite: Steinert, N. J., González-Rouco, J. F., de Vrese, P., Cuesta-Valero, F. J., García Pereira, F., and Melo Aguilar, C. A.: Global energy budget changes from underestimated land heat uptake in CMIP6 models, EGU General Assembly 2023, Vienna, Austria, 23–28 Apr 2023, EGU23-8463, https://doi.org/10.5194/egusphere-egu23-8463, 2023.

EGU23-8983 | Orals | CL2.1

Aerosol Radiative Forcing time development in the CMIP6 historical experiment 

Ragnhild Bieltvedt Skeie and Gunnar Myhre

In this study, radiative forcing time series on a component basis from the historical experiment in CMIP6 are presented. For each aerosol component (sulphate, black carbon, organic aerosols, nitrate) aerosol radiative forcing for aerosol-radiation interaction (RFari) is calculated from 1850 to 2014 using a radiative kernel and modelled changes in aerosol mass. The radiative kernel has been generated using the DISORT radiative transfer model. Aerosol radiative forcing for aerosol-cloud interaction (RFaci) is calculated offline based on the monthly fields from CMIP6 and simulate changes in the effective radius. For the individual models the time development of total aerosol radiative forcing is compared to aerosol effective radiative forcing (ERF) time series calculated within RFMIP, that take into account the adjustments. The radiative forcing trend will be presented on a global and a regional scale. The calculations are also done for the AeroCom phase III historical experiment. Both the AeroCom phase III and CMIP6 historical experiment use the CMIP6 CEDS emissions. These emissions are recently updated and extended. Using results from a chemistry transport model (OsloCTM3) we show how the updated emissions have changed the radiative forcing trends in the model. The emissions used to drive the models play an important role for determining the time development of the aerosol radiative forcing. At the end we will discuss uncertainties in the trend based on available historical global emission inventories for aerosol and aerosol precursors.

How to cite: Skeie, R. B. and Myhre, G.: Aerosol Radiative Forcing time development in the CMIP6 historical experiment, EGU General Assembly 2023, Vienna, Austria, 23–28 Apr 2023, EGU23-8983, https://doi.org/10.5194/egusphere-egu23-8983, 2023.

EGU23-9084 | ECS | Posters on site | CL2.1

Determining Earth’s outgoing radiative flux from a Moon-Based Wide Field-of-view Radiometer 

yuan zhang, Shengshan Bi, and Steven Dewitte

Observing the Earth radiation budget (ERB) at top of the atmosphere (TOA) from space is crucial for monitoring and understanding Earth’s climate. The accurate estimation of Earth’s outgoing radiative flux is of critical importance to studying ERB at TOA. The Moon-based wide field-of-view radiometer (MWFVR) can provide long-term, continuous full-disk broadband irradiance measurements, which provides an important data source for studying the ERB. Within this context, the lunar surface site 0° E 0° N is selected as the position of the Moon-based wide field-view radiometer, and based on the radiation transfer function, the entrance pupil irradiances time series are obtained by utilization of the CER_SYN1deg-1Hour_Edition4 data products and ERBE ADMs, which is used as the substitute for the truth of the measurements. In this work, the Earth outgoing radiative flux estimating model from the MWFVR measurements is established, and according to the framework, the entrance pupil irradiances are converted to full-disk LW and daytime SW outgoing radiative fluxes. By comparing the results from Moon-based radiometer measurements with those from NISTAR data and CERES SYN1deg data, the results show the moon-based data a much better agreement with those from the satellite data. Besides, The Moon-based SW fluxes oscillate around 194 and 205 W∙m-2, and the range of LW fluxes is 251 ~ 287 Wm−2. Therefore, the complementary advantages and cooperative work of platforms at different altitudes will be an important way for future research on the ERB.


How to cite: zhang, Y., Bi, S., and Dewitte, S.: Determining Earth’s outgoing radiative flux from a Moon-Based Wide Field-of-view Radiometer, EGU General Assembly 2023, Vienna, Austria, 23–28 Apr 2023, EGU23-9084, https://doi.org/10.5194/egusphere-egu23-9084, 2023.

EGU23-10334 | ECS | Posters on site | CL2.1

Using Brutsaert’s Equation to Understand the Spatiotemporal Variations of Downwelling Longwave Radiation 

Yinglin Tian, Axel Kleidon, Sarosh Alam Ghausi, Deyu Zhong, and Guangqian Wang

Downwelling longwave radiation (Rld) is a dominant term in the surface energy balance and is central to global warming. It is influenced by the radiative properties in the whole atmospheric column, particularly greenhouse gases, water vapor, clouds, and atmospheric heat storage. To reveal the leading terms responsible for the spatiotemporal climatological variations in Rld, we use the semi-empirical equation derived by Brutsaert (1975, “B75”), which only needs near-surface observations of air temperature and humidity. We first evaluated B75 and its extension by Crawford and Duchon (1999, "C&D99") with FLUXNET observations, NASA-CERES satellite data, and ERA5 reanalysis. We found a strong agreement, with R2 being 0.87, 0.97, and 0.99, respectively. We then used the equations to show that diurnal and seasonal variations in Rld are predominantly controlled by changes in atmospheric heat storage. Variations in atmospheric emissivity form a secondary contribution to the variation of Rld, and are mostly controlled by anomalies in cloud cover. We also found that with increased aridity, the contributions by changes in atmospheric heat storage and emissivity acted to compensate each other (20~30 W/m2 and ~-40 W/m2, respectively), thus explaining the relatively little variation in Rld with aridity (-20~-10 W/m2). The equations further indicate that under global warming, the amplification of water vapor is stronger in arid regions because clear-sky conditions are more sensitive to an increase in greenhouse gases. These equations thus provide a firm, physical basis to understand the spatiotemporal variability of downwelling longwave radiation at the surface. This should be helpful to better understand and interpret climatological changes, for instance those associated with global warming and extreme events.

How to cite: Tian, Y., Kleidon, A., Alam Ghausi, S., Zhong, D., and Wang, G.: Using Brutsaert’s Equation to Understand the Spatiotemporal Variations of Downwelling Longwave Radiation, EGU General Assembly 2023, Vienna, Austria, 23–28 Apr 2023, EGU23-10334, https://doi.org/10.5194/egusphere-egu23-10334, 2023.

The outgoing longwave radiation (OLR) at the top of the atmosphere is a critical component of the Earth's radiation energy budget. A substantial portion of the OLR energy lies in the far-infrared (FIR) spectrum, which has not been directly measured for understanding weather and climate variations. Several satellite projects under development, including the Thin Ice Cloud in Far Infrared Experiment (TICFIRE, Blanchet et al. 2011) funded by the Canadian Space Agency, the Polar Radiant Energy in the Far Infrared Experiment (PREFIRE, L’Ecuyer et al., 2021) of U.S. NASA, and the Far-Infrared Outgoing Radiation Understanding and Monitoring (FORUM, Palchetti et al., 2020) of the European Space Agency, are being developed to fill this observation gap. Given that the FIR observation data is not available yet, we use simulations to acquire prior knowledge of the climatological mean distribution of the OLR in FIR, by using a rapid radiative transfer model, RRTMG, to simulate spectrally decomposed OLR in different spectral bands from global instantaneous atmospheric profiles of the fifth generation European Centre for Medium-Range Weather Forecasts atmospheric reanalysis (ERA5). Based on the radiative transfer equation, we dissect the OLR by attributing its distribution and variation to spectrally and vertically decomposed contributions of the atmosphere and Earth surface. Our results disclose that the relatively higher far-infrared fraction of the OLR in polar region is due to stronger surface contribution and identify a minimum atmospheric contribution layer around the tropopause. On the other hand, the variability of the spectrally decomposed OLR field is dissected with the aid of a new set of radiative sensitivity kernels. This analysis discovers that the non-cloud longwave climate feedback, as well as its inter-climate model discrepancy, mainly results from the upper tropospheric thermodynamic fields (temperature and water vapor) and their effects on the FIR radiation.

How to cite: Huang, H. and Huang, Y.: The spectrally and vertically decomposed outgoing longwave radiation and its climate trends in the far-infrared, EGU General Assembly 2023, Vienna, Austria, 23–28 Apr 2023, EGU23-10455, https://doi.org/10.5194/egusphere-egu23-10455, 2023.

EGU23-10502 | Posters virtual | CL2.1

From Quantum Mechanics to Climate Change: Global Warming From First Principles 

Robin Wordsworth, Jacob Seeley, and Keith Shine

Although the scientific principles of anthropogenic climate change are now extremely well-established, all existing descriptions of the physics of global warming are either partly empirical or rely on the results of complex numerical models. Here, we present a description of radiative forcing and climate sensitivity that begins from the basic quantum properties of the CO2 molecule. The shape of the CO2 15 micron band, which is so critical to the strength of CO2 radiative forcing, can be understood in terms of vibrational-rotational states and a quantum resonance effect (Fermi resonance). We discuss how classical analogy to the coupled pendulum experiment can be used to understand the nature of this phenomenon in simple terms. We finish by deriving a new analytic equation for CO2 radiative forcing expressed in terms of basic molecular properties such as bond strength and atomic mass. Our aim is for this analysis to elucidate the fundamental physics of climate change for both climate scientists and for physicists working in other fields.

How to cite: Wordsworth, R., Seeley, J., and Shine, K.: From Quantum Mechanics to Climate Change: Global Warming From First Principles, EGU General Assembly 2023, Vienna, Austria, 23–28 Apr 2023, EGU23-10502, https://doi.org/10.5194/egusphere-egu23-10502, 2023.

EGU23-11280 | ECS | Orals | CL2.1

Contribution of cloudy/clear-sky partitions and aerosol variability to the solar irradiance measured over 2010-2020 in Northern France 

Gabriel Chesnoiu, Nicolas Ferlay, Frédérique Auriol, Maxime Catalfamo, Isabelle Jankowiak, and Isabelle Chiapello

The absorption and scattering by aerosols and clouds greatly affect surface solar irradiance and the Earth's energy budget. Large uncertainties still remain on the current estimates of these radiative effects because of an incomplete knowledge of their spatial and temporal variabilities.


We analyze coincident daytime ground-based measurements of aerosol optical properties from AERONET photometer and of direct and diffuse horizontal surface irradiances from a set of pyrheliometer and pyranometer routinely performed at the ATOLL (Atmospheric Observations in LiLle) platform in north of France over the period 2010-2020. The site is located in a highly populated area greatly influenced by clouds and aerosol pollution. In order to isolate the radiative effect of aerosols from that of cloud occurences, a separation between cloudy-sun, clear-sun with surrounding clouds and clear-sky moments is performed using two cloud detection algorithms at 1-min resolution. The measurements are further analyzed using a radiative transfer code to simulate the spectrally integrated solar global horizontal irradiance and its components in clear-sky conditions with and without aerosols (pristine like conditions).


Our analysis shows that on average in ATOLL over the period 2010-2020, the sky is cloudy 89% of the time with around 67% of cloudy-sun situations and 22% of clear-sun with clouds moments. The proportion of clear-sky conditions is relatively low (11%) with a minimum in winter (6%) and a maximum in spring (15%).


In summer, we observe over the period a robust increasing trend in measured total irradiances in all-sky conditions of +5.2 ± 1.8 W/m²/year. This evolution is mainly explained by a positive trend in the occurrence of clear-sky situations (+0.7 ± 0.3% per year) to the detriment of cloudy-sun moments.


In spring, we highlight a high variability of cloud occurences and mean solar irradiances. Indeed, the mean proportion of clear-sky moments varies more than fourfold between 2013 (8%) and 2020 (35%), leading to corresponding all-sky irradiance extrema of 285 and 389 W/m² respectively. Moreover, in clear-sky conditions, an important variability is observed between the maximum of seasonal global irradiance of spring 2018 (522 W/m²) and the minimum of spring 2014 (435 W/m²). The latter variability is emphasised by a significative positive trend in direct irradiances observed for springtime clear-sky conditions of +5.3 ± 2.3 W/m²/year. A sensitivity analysis based on our radiative simulations shows that it is partly explained by a significant decrease in measured AOD440 nm (-0.006 ± 0.002 per year) and a change in the proportion of high aerosol loads over 2010-2020. This is also consistent with a negative trend of the diffuse component (-1.2 ± 0.4 W/m²/year) observed for clear-sky conditions in spring.


Finally, besides showing the highest proportion of clear-sky moments, spring is also the most polluted season in aerosol, with more than 80% of AOD440 nm higher than 0.1. This translates to an average seasonal maximum of aerosol direct radiative effect in spring of -22.6 W/m² (-6.1%), with a loss of -69.3 W/m² (-19.2%) of direct irradiance partially compensated by an increase of the diffuse radiation of +46.6 W/m² (101.0%).

How to cite: Chesnoiu, G., Ferlay, N., Auriol, F., Catalfamo, M., Jankowiak, I., and Chiapello, I.: Contribution of cloudy/clear-sky partitions and aerosol variability to the solar irradiance measured over 2010-2020 in Northern France, EGU General Assembly 2023, Vienna, Austria, 23–28 Apr 2023, EGU23-11280, https://doi.org/10.5194/egusphere-egu23-11280, 2023.

Downwelling longwave irradiance (LW) is challenging and expensive to measure and is often estimated indirectly with parametric modeling of routinely measured surface-level meteorological variables.  Modeling LW under all-sky conditions typically involves “correcting” a clear- (or non-overcast) sky model estimate using solar-irradiance-based proxies of cloud cover in lieu of actual cloud cover given uncertainties and measurement challenges of the latter.  While such approaches are deemed sound, their application in time and space is inherently limited.  Here, we present a correction model free of cloud variables applicable at the true daily (24-hr.) and global scale that – irrespective of the underlying clear-sky model – yields errors over land that are lower than those from stand-alone models and on par with daytime errors from the prevailing solar-based cloud proxy corrections (rRMSD = ~7%; rMAD = ~5.5%).  We document and critically assess its performance over land and ocean independently, as well as in high elevation and cold environments representing two notoriously challenging conditions.  The cloud-free correction is found to perform better than stand-alone approaches at all subsets; however, within-subset performance differences were evident and attributable to the underlying clear-sky model, reinforcing previous findings surrounding performance thresholds of parametric models with globally-tuned parameters. 

How to cite: Bright, R. and Eisner, S.: Modeling downwelling longwave irradiance at daily resolution under all skies:  A cloud-free approach, EGU General Assembly 2023, Vienna, Austria, 23–28 Apr 2023, EGU23-11494, https://doi.org/10.5194/egusphere-egu23-11494, 2023.

EGU23-11930 | Orals | CL2.1 | Highlight

Fingerprint of CO2 and other gases on the greenhouse effect from direct satellite observation 

Chris Rentsch and Gunnar Myhre

We use 19 years of continuous near-global land and ocean direct AIRS satellite measurements combined with detailed atmospheric radiative transfer modelling to demonstrate strong strengthening in the greenhouse effect caused by CO2 and detectable, but comparatively smaller strengthening, by CH4 and N2O. An increase in the outgoing longwave radiation is found in the 800-1000 cm−1 atmospheric window resulting from the Planck response to surface heating. The combined use of satellite measurements and the radiative transfer model also demonstrate that reductions in concentrations of prohibited ozone depleting substances have weakened the greenhouse effect in the spectral region where these gases absorb thermal infrared radiation. The strong greenhouse effect strengthening signal in the satellite data in the spectral region 710-720 cm−1 is a fingerprint of CO2 increase since we demonstrate that other factors could not cause such a robust spectral feature. We show how the spectral clear sky instantaneous change in TOA flux relates to the greenhouse gas radiative forcing over the 19-year period.

How to cite: Rentsch, C. and Myhre, G.: Fingerprint of CO2 and other gases on the greenhouse effect from direct satellite observation, EGU General Assembly 2023, Vienna, Austria, 23–28 Apr 2023, EGU23-11930, https://doi.org/10.5194/egusphere-egu23-11930, 2023.

EGU23-12198 | Posters on site | CL2.1

Advances in ISCCP-based Surface Fluxes at Higher Spatial Resolution from the Surface Radiation Budget Project 

Paul Stackhouse, Stephen Cox, J. Colleen Mikovitz, and Taiping Zhang

The NASA Langley Research Center (LaRC) Surface Radiation Budget (SRB) project produced 3-hourly shortwave and longwave surface and top of atmosphere radiative fluxes for the 1983-2017 in its most recent version, Release 4 Integrated Product (IP) in collaboration with other GEWEX collaborators (Kummerow et al., 2019, Stackhouse et al., 2020, ATBD). This version uses the newly recalibrated and processed ISCCP HXS product as its primary input for cloud and radiance data, replacing ISCCP DX with a ninefold increase in pixel count (10 km instead of 30 km).  Previous work showed comparisons to BSRN and to ocean buoy measurements showed ensemble agreement for monthly averaged shortwave (SW or solar) wavelengths to be ~1 W m-2 bias with an RMS of 14.7 W m-2 RMS and longwave (LW or thermal infrared) ~+1 W m-2 bias with a 15.9 W m-2 RMS.  However, we also found that utilizing the Tselioudis (2020) weather state analysis with ISCCP to partition fluxes by cloud state over the BSRN sites showed that particular cloud states, such as the convective cloud state, showed much larger biases, particularly in the SW.

To address such issues, and to better resolve surface radiative flux spatial variability, this talk describes advances to the SRB inputs and algorithms towards the next release, referred to as LaRC SRB future Release 5. Since the resolution of ISCCP HXS is 10 km (excluding pixels within 25 km of coast lines), the ISCCP data products have enough sampling to grid cloud properties at the 0.5°x0.5°on a global basis.  In the shortwave, the Pinker-Laszlo lookup table approach with a forward call to the Fu-Liou radiative transfer model as modified by the CERES team (Rose et al., 2006).  In addition to being a proven radiation code, Fu-Liou allows the calculation of fluxes at different atmospheric levels and spectral bands, which will provide more insight into the surface radiation budget, its variability and attribution.  Updates to various inputs are described such as surface spectral albedos, emissivities, surface skin and near-surface temperatures, atmospheric profiles, and aerosols optical properties.  

This talk presents the results of early versions of the new products from grid boxes containing BSRN and ocean buoy measurement sites and compare these surface fluxes to the previous version and also to other prominent available data products in the literature.  Key regional differences over oceans and land are assessed to evaluate the changes in the resolving the flux variability.  Although the Tselioudis “weather states” are classified for a 1°x1° resolution, an initial flux partitioning is made at both full and a degraded 1°x1° resolution to assess the new algorithms under different cloud state conditions. The newer algorithms rely on the Fu-Liou based radiative transfer for both the SW and LW providing fluxes within the atmosphere and at the surface and for spectral band fluxes. 

How to cite: Stackhouse, P., Cox, S., Mikovitz, J. C., and Zhang, T.: Advances in ISCCP-based Surface Fluxes at Higher Spatial Resolution from the Surface Radiation Budget Project, EGU General Assembly 2023, Vienna, Austria, 23–28 Apr 2023, EGU23-12198, https://doi.org/10.5194/egusphere-egu23-12198, 2023.

EGU23-12792 | ECS | Posters on site | CL2.1

Investigating the role of 3D radiative effects in contrail cirrus and ice clouds. 

Julie Carles, Jean-Louis Dufresne, and Nicolas Bellouin

The aviation sector contributes to anthropogenic radiative forcing via impacts from well-known CO2 effects and more uncertain non-CO2 effects. The largest contributor to aviation radiative forcing is one of the non-CO2 effects: induced cirrus cloudiness evolved from contrails generated by aircrafts that persist in the atmosphere. The latest assessment of the impacts of aviation on climate attributes a forcing of 149.1 (90% confidence range: 70, 229) mW/m² to global aviation, including 111.4 (33, 189) mW/m² from contrail cirrus (Lee et al, 2021). Those estimations are based on results from global climate models which use approximations for the description of clouds and radiative transfer, resulting in uncertainties of about 70% in aviation induced cloudiness radiative forcing. As of today, the 3D nature of clouds and the corresponding 3D radiative effects are neglected in climate models, as well as the size and shape of ice crystals in contrails.

In this poster, we present work aimed at improving the estimation of the radiative effect of ice clouds and contrail cirrus by studying its dependence on cloud geometry and size. This work uses a Monte Carlo radiative transfer code that takes into account the full 3D interactions between clouds and radiation (Villefranque et al 2019). Results are compared to a 1D, plane parallel calculation, which is the common assumption in climate models used to estimate radiative forcing.

Results show that 3D effects play a substantial role in the radiative effect of cirrus clouds. The plane parallel calculations always under-estimate cloud radiative effect compared to Monte Carlo calculations when the Sun is at zenith. We discuss the dependence of the results to solar angle. We find that the optical depth of the contrail is not the only driver of its radiative forcing, contrary to behavior in plane parallel calculations. This work contributes to reducing uncertainty in the radiative forcing of aviation, and may over ways to correct estimates of contrail cirrus radiative forcing and high clouds radiative effect in climate models.

How to cite: Carles, J., Dufresne, J.-L., and Bellouin, N.: Investigating the role of 3D radiative effects in contrail cirrus and ice clouds., EGU General Assembly 2023, Vienna, Austria, 23–28 Apr 2023, EGU23-12792, https://doi.org/10.5194/egusphere-egu23-12792, 2023.

EGU23-13064 | ECS | Orals | CL2.1

The Global Dimming & Brightening based on FORTH radiative transfer model during 1984-2018 and its evaluation against GEBA & BSRN ground-based networks 

Michael Stamatis, Nikolaos Hatzianastassiou, Marios Bruno Korras Carraca, Christos Matsoukas, Martin Wild, and Ilias Vardavas

The Earth’s energy balance and radiation budget, which play a key role in the Earth’s climate system, are driven by the incident solar radiation at surface (surface solar radiation, SSR). Over the past few decades, changes in the SSR (ΔSSR) have been observed that are dependent on the transparency of the terrestrial atmosphere. This phenomenon, called global dimming and brightening (GDB), is a significant factor in climate change and modulates global warming. This study examines the interdecadal variability of SSR based on computations of the FORTH radiative transfer model, using as input data cloud optical properties taken from the International Satellite Cloud Climatology Project H Series (ISCCP-H) and aerosol optical properties and meteorological data taken from the Modern-Era Retrospective analysis for Research and Applications, version 2 (MERRA-2) Reanalysis. Ground-based measurements of SSR from the Global Energy Balance Archive (GEBA) and Baseline Surface Radiation Network (BSRN) networks are utilized to evaluate the FORTH’S SSR fluxes and GDB. The FORTH RTM computations are made on a monthly basis from 01/1984 - 12/2018 at 51 atmospheric levels and a spatial horizontal resolution of 0.5°×0.625° (with a conversion of the original input data to the same spatio-temporal resolution). Firstly, the FORTH SSR fluxes are evaluated against ground measurements from GEBA and BSRN. This comparison reveals a general underestimation of the FORTH SSR fluxes, with a satisfactory evaluation metrics, such as the relative bias, which is equal to –2.9% and –7.7% against GEBA and BSRN, respectively or the correlation coefficient values, computed using deseasonalized SSR anomalies, being equal to 0.72 and 0.8 against GEBA and BSRN, respectively. Then, the SSR changes (or GDB) for each pixel, also calculated using deseasonalized SSR anomalies, were compared with the GDB from the corresponding GEBA/BSRN station, lying in that pixel, for their common time period. This comparison reveals an agreement between the sign of the FORTH’s pixels and the corresponding stations’ GDB equal to 63.5% for the GEBA and 54.5% for the BSRN sites. Finally, the GDB was also calculated on global (land & ocean), hemispherical and regional scales, either for the entire period and for sub-periods too. The computed GDB for the period 01/1984-12/2018 is equal to –2.22 ± 0.38 W/m2 for the Globe, -0.48 ± 0.39 W/m2 for the Northern Hemisphere and -2.73 ± 0.54 W/m2 for the Southern Hemisphere. Larger GDB values are estimated over oceans than land (-2.56 ± 0.44 versus -1.04 ± 0.47 W/m2, respectively), suggesting that the atmosphere over oceans got less transparent than over continents during the 35-year study period. During this period, a brightening has taken place over Europe, Middle East, Mexico against a dimming over India, Maritime Continent, Australia and Southern Ocean.

How to cite: Stamatis, M., Hatzianastassiou, N., Korras Carraca, M. B., Matsoukas, C., Wild, M., and Vardavas, I.: The Global Dimming & Brightening based on FORTH radiative transfer model during 1984-2018 and its evaluation against GEBA & BSRN ground-based networks, EGU General Assembly 2023, Vienna, Austria, 23–28 Apr 2023, EGU23-13064, https://doi.org/10.5194/egusphere-egu23-13064, 2023.

EGU23-13198 | Posters on site | CL2.1

Spectral Aerosol Radiative Forcing and Efficiency of the La Palma Volcanic Plume over the Izaña Observatory 

Omaira García, Rosa Delia García, Emilio Cuevas-Agulló, África Barreto, Victoria Eugenia Cachorro, Carlos Marrero, Fernando Almansa, Ramón Ramos, Óscar Álvarez, and Mario Pó

By injecting aerosols and gases into the atmosphere, volcanoes significantly affect global climate, force changes in atmospheric dynamics, and influence many distinct cycles such as hydrological, carbon, and biogeochemical cycles. However, the irregular temporal and spatial distributions of volcanic processes and their effects are still poorly characterised. The volcanic eruption on La Palma (Canary Islands, Spain), which occurred in the autumn of 2021, presented an outstanding opportunity to improve the current understanding of these natural phenomena. The special conditions at the Izaña Observatory (IZO, Tenerife) and its proximity to La Palma (∼140 km) make it a strategic site for the comprehensive study of the almost unperturbed volcanic plume including the climate effects.

In this context, the present work deals with the experimental estimation of the solar spectral direct radiative forcing (ΔF) and efficiency (ΔFEff) during the volcanic eruption based on radiation measurements performed with an EKO MS-711 grating spectroradiometer during three events characterised by the presence of different types of aerosols: fresh volcanic aerosols, Saharan mineral dust, and a mixture of volcanic and Saharan dust aerosols. Three case studies were identified using ground-based (lidar) data, satellite-based (Sentinel-5P Tropospheric Monitoring Instrument, TROPOMI) data, reanalysis data (Modern-Era Retrospective Analysis for Research and Applications, version 2, MERRA-2), and backward trajectories (Flexible Trajectories, FLEXTRA), and subsequently characterised in terms of optical and micro-physical properties using ground-based sun-photometry measurements. Despite the ΔF of the volcanic aerosols being greater than that of the dust events (associated with the larger aerosol load present), the ΔFEff was found to be lower. The spectral ΔFEff values at 440 nm ranged between −1.9 and −2.6 Wm−2nm−1AOD−1 for the mineral dust and mixed volcanic and dust particles, and between −1.6 and −3.3 Wm−2nm−1AOD−1 for the volcanic aerosols, considering solar zenith angles between 30 and 70, respectively.

How to cite: García, O., García, R. D., Cuevas-Agulló, E., Barreto, Á., Cachorro, V. E., Marrero, C., Almansa, F., Ramos, R., Álvarez, Ó., and Pó, M.: Spectral Aerosol Radiative Forcing and Efficiency of the La Palma Volcanic Plume over the Izaña Observatory, EGU General Assembly 2023, Vienna, Austria, 23–28 Apr 2023, EGU23-13198, https://doi.org/10.5194/egusphere-egu23-13198, 2023.

EGU23-14330 | Orals | CL2.1 | Highlight

Earth’s energy imbalance trend strengthened by recent aerosol emission reductions 

Øivind Hodnebrog, Gunnar Myhre, Hailing Jia, Johannes Quaas, Caroline Jouan, and Piers M. Forster

The Earth’s energy imbalance (EEI) is the difference in the net solar radiative flux and outgoing longwave radiative flux at the top-of-atmosphere. It has been shown that the positive EEI trend in the previous two decades is unexplained by internal variability and caused by anthropogenic forcing and response, such as that resulting from anthropogenic CO2 emissions. In this work we apply two state-of-the-art global climate models, the CESM2 and ICON-HAM, forced with observed (evolving) sea-surface temperature fields for the period 2000-2019 and with multiple ensemble members, to explore causes for the positive trend in EEI. Both models are able to reproduce the observed EEI trend from the CERES satellite product relatively well. Sensitivity simulations with aerosol emissions kept constant at year 2000 values indicate a relatively strong influence of recent aerosol emission reductions on the EEI trend. Preliminary results further indicate a considerable effect of using the latest CEDS emission version, as opposed to the CMIP6 CEDS version, on the EEI trend.

How to cite: Hodnebrog, Ø., Myhre, G., Jia, H., Quaas, J., Jouan, C., and Forster, P. M.: Earth’s energy imbalance trend strengthened by recent aerosol emission reductions, EGU General Assembly 2023, Vienna, Austria, 23–28 Apr 2023, EGU23-14330, https://doi.org/10.5194/egusphere-egu23-14330, 2023.

Aerosols are known to play an important role in regulating the Earth’s energy budget, by directly interacting with solar and terrestrial radiation and modifying the cloud properties. Radiative forcing is commonly used as an index for quantifying such imbalances in the Earth’s radiation budget by any factor. Quantifying aerosol radiative forcing is an initial step towards understanding the response of the Earth’s climate system to changes in emissions of aerosols from anthropogenic sources from pre-industrial (year 1850) to present day.

Our present study is designed to understand implications of changing emissions of aerosols over the historical period (1985-2014) on the evolution of aerosol and cloud radiative forcing using a state of art global chemistry-climate model named CAM6. The estimates of evolution of aerosol radiative forcing and its decomposition into direct radiative forcing (DRF or ERFARI), cloud radiative forcing (CRF or ERFACI) and surface albedo radiative forcing (SARF) on a global scale with special emphasis over the Indian region is being investigated. For this purpose, simulations are performed by CAM6 model for the 30-year period from 1985 to 2014 with model meteorology nudged towards the ERA5 reanalysis data using CMIP6 global emission inventory. We are trying to understand the implications of changing emissions of aerosols on the estimates of ERFARI, ERFACI and SARF to understand the contribution of each pathway through which changes in emissions of aerosols from PI to PD perturb the radiation budget of the earth-atmosphere system. We follow the methodology of Ghan et al. (2012) and use various combinations of additional radiative diagnostics with neglected absorption and scattering of aerosols and clouds along with all sky fluxes of shortwave (SW) and longwave (LW) radiation at top of the atmosphere (TOA) to decompose the total aerosol radiative forcing into ERFARI, ERFACI, and SARF.

Our results show that although the overall effect of changing emissions aerosols and their precursors from anthropogenic sources is to produce a negative radiative forcing at the top of atmosphere (TOA) thereby resulting in cooling over the south Asian region, we find that the aerosol-radiation interaction (ari) leads to warming while aerosol-cloud interaction (aci) results in cooling over the same region. The results from our CAM6 simulations show that the annual mean shortwave aerosol direct radiative forcing (DRF or ERFARI) averaged across the Indian land mass due to major aerosol species has increased from 0.46 W/m2 to 0.76 W/m2 during the 30-year period from 1985 to 2014. More results with greater details on the contribution of individual aerosol towards the temporal evolution of ERFARI and ERFACI will be presented.


Keywords: aerosols, Radiative forcing, ARI, ACI, CAM6


How to cite: Sharma, A. K. and Ganguly, D.: Temporal evolution of the aerosol radiative forcing due to changing emissions of individual aerosol species and their precursors over the Indian region as estimated using a global climate model CAM6., EGU General Assembly 2023, Vienna, Austria, 23–28 Apr 2023, EGU23-14393, https://doi.org/10.5194/egusphere-egu23-14393, 2023.

EGU23-14718 | ECS | Orals | CL2.1

Low opaque clouds formed over Baffin Sea enhances Greenland's west coast surface cloud warming 

Jean Lac, Hélène Chepfer, Michael R. Gallagher, and Assia Arouf

Greenland Ice Sheet (GrIS) melt plays a major role in the global sea level rise. Surface melting is driven by changes in the radiative budget at the surface which is modulated by clouds. However, relatively little is known on the influence of local atmospheric processes on the fragile GrIS coast. Here we used space based lidar cloud profile observations with complementary data to show that low clouds formed in response to the Arctic sea ice retreat in September are transported over the GrIS west coast and warm radiatively the GrIS surface. Previous works have shown that low liquid clouds are formed in response to arctic sea ice retreat in September. We first showed the existence of continuous stratiform low liquid clouds between the Baffin Sea and the GrIS west coast in September using 12 years space lidar data at full resolution (instantaneous time scale and less than 500m spatial scale). Secondly, we analyzed wind profiles from re-analyis and from recent Doppler wind space lidar data and found that westerlies transport these stratiform clouds from the Baffin Sea to the GrIS west coast. Then, we used Surface LongWave Cloud Radiative Effect data derived from space-based active sensors for days that correspond to these specific situations where clouds are transported from the Baffin Sea, to quantify how much they warm radiatively the GrIS coast. We found that clouds coming from the Baffin Sea warm radiatively the GrIS west coast surface by +80W/m2 during the month of September. This contributes to an increase of +10W/m2 of cloud surface warming in average between July and September on the GrIS west coast. Overall, this study suggests that processes independent from large-scale circulation also influence the GrIS mass balance. 

How to cite: Lac, J., Chepfer, H., Gallagher, M. R., and Arouf, A.: Low opaque clouds formed over Baffin Sea enhances Greenland's west coast surface cloud warming, EGU General Assembly 2023, Vienna, Austria, 23–28 Apr 2023, EGU23-14718, https://doi.org/10.5194/egusphere-egu23-14718, 2023.

EGU23-14872 | Posters on site | CL2.1

Changes in cloudiness cause a changing seasonality in the Baltic Sea region 

Piia Post and Margit Aun

In the Baltic Sea region, a significant decrease and subsequent increase in solar radiation have been detected during the past half-century. But the rise in shortwave irradiance is not seen for all seasons; significant changes appear in the seasonality of the cumulative sum of daily shortwave irradiance and the sea surface temperature of the Baltic Sea. Kahru et al. (2016) show that the accumulated surface incoming shortwave (SIS) energy has decreased in winter and increases during the spring and summer. The cumulative thresholds of surface incoming shortwave irradiance up to 1000 W/m2 are reached later in the season, but higher thresholds are reached earlier. The shift from later towards earlier cumulative thresholds occurs in spring, around March 15.

Changes in shortwave irradiance are associated with atmospheric transparency and cloudiness parameters like cloud fraction and albedo. The more substantial factor here is cloudiness, and therefore, we concentrate on reasons for changes in cloud properties. One of the most important reasons here is the synoptic-scale atmospheric circulation. The satellite-based cloud climate data record CLARA-A2 has been used to analyse regional time series and trends in the Baltic Sea region, from 1982-2019. The investigated cloud parameters were total fractional cloud cover (CFC) and SIS.

In March the interannual variability in CFC is high. The Increasing trend in incoming shortwave radiation could be explained by the decrease in CFC. The decrease in CFC is due to a smaller number of overcast days, that vary in the same rhythm with “cloudy” circulation patterns. This shows, that the shift in seasons that is connected to the earlier accumulated sums of SIS is at least partly explained by the changes in synoptic-scale atmospheric circulation.


How to cite: Post, P. and Aun, M.: Changes in cloudiness cause a changing seasonality in the Baltic Sea region, EGU General Assembly 2023, Vienna, Austria, 23–28 Apr 2023, EGU23-14872, https://doi.org/10.5194/egusphere-egu23-14872, 2023.

EGU23-15351 | Orals | CL2.1 | Highlight

Unmasking the Effects of Aerosols on Greenhouse Warming Over Europe 

Paul Glantz

Unmasking the Effects of Aerosols on Greenhouse Warming Over Europe

P. Glantz1, O. G. Fawole2, J. Ström1, M. Wild3 and K. J. Noone1

1Department of Environmental Science, Stockholm University, Stockholm, Sweden

2Dept. of Physics and Engineering Physics, Obafemi Awolowo University, Ile-Ife, Nigeria

3Institute for Atmospheric and Climate Science, ETH Zurich, Zurich, Switzerland


This work with corresponding publication in Journal of Geophysical Research: Atmospheres, 127, e2021JD035889. https://doi.org/10.1029/2021JD035889 is supported by FORMAS, grant 2018-01291.


Aerosol optical thickness (AOT) has decreased substantially in Europe in the summer half year (April–September) since 1980, with almost a 50% reduction in Central and Eastern Europe, according to Modern-Era Retrospective analysis for Research and Applications, Version 2 (MERRA-2) reanalysis. At the same time, strong positive trends in ERA5 reanalysis surface solar radiation downward for all-sky and clear-sky conditions (SSRD and SSRDc, respectively) and temperature at 2 m are found for Europe in summer during the period 1979–2020. The Global Energy Balance Archive (GEBA) observations show as well strong increases in SSRD during the latest four decades. Estimations of changes in SSRDc, using the Santa Barbara DISORT Atmospheric Radiative Transfer (SBDART) model, show similarly strong increases when fed by MERRA-2 AOT. The estimates of warming in this study, caused by increases in SSRD and SSRDc, are based on energy budget approximations and the Stefan Boltzmann law. The increases in near surface temperature, estimated both for clear-sky and all-sky conditions, are up to about 1°C for Central and Eastern Europe. The total warming over large parts of this region for clear-sky conditions is however nearly double the global mean temperature increase of 1.1°C, while somewhat less for all-sky conditions. Although the largest effects from aerosols on the radiation balance occurred in the 1980s and 1990s, the total warming has continued to increase more or less at the same rates during the latest four decades over large parts of Europe, considering both all-sky and clear-sky situations. Thus, decline in aerosols can certainly not explain all warming observed and particularly not considering the southern Iberian Peninsula where the aerosol effects on warming are weaker compared to countries further north. The largest increases in sensible heat flux at the expense of latent heat flux have occurred in Iberian Peninsula, which is probably a result of drier surface conditions. This means a positive feedback associated with reduced evaporate cooling and warming of the lowest air layers. Decline in water vapor in combination with the warming may have contributed to decreased cloud cover, which is found for large parts of Europe in the summer half year during the latest four decades. Anthropogenic aerosols over large parts of Europe have thus temporarily masked, until around 1980, parts of rapid warming from increases in greenhouse gases. CO2 from fossil fuels is of particularly serious concern, since it can continue to affect climate for thousand years.

How to cite: Glantz, P.: Unmasking the Effects of Aerosols on Greenhouse Warming Over Europe, EGU General Assembly 2023, Vienna, Austria, 23–28 Apr 2023, EGU23-15351, https://doi.org/10.5194/egusphere-egu23-15351, 2023.

Addressing the cause of intermodel spread in carbon dioxide (CO2) radiative forcing is essential for reducing uncertainty in estimates of climate sensitivity. Recent studies demonstrate that a large proportion of this spread arises from variance in model base state climatology, particularly the specification of stratospheric temperature, which itself plays a dominant role in determining the magnitude of CO2 forcing.

Here we investigate the significance of intermodel differences in stratospheric ozone (O3) as a cause of intermodel differences in stratospheric temperature, and hence its role as a contributing factor to intermodel spread in CO2 radiative forcing. We use the Community Earth System Model 2 and the Norwegian Earth System Model 2 to analyse the impact of systematic increases/decreases in stratospheric O3 on the magnitude of 2xCO2 and 4xCO2 effective radiative forcing (ERF). Corresponding rapid adjustments and instantaneous radiative forcing (IRF) are diagnosed using radiative kernels and the Parallel Offline Radiative Transfer code, respectively.

We demonstrate that differences in base state stratospheric O3 lead to significant differences in base state stratospheric temperature, ranging from +6 K to -8 K given a 50% increase and decrease in stratospheric O3 concentration. However, this does not result in a correspondingly large spread in CO2 IRF and ERF due to the compensating greenhouse effect of CO2 and O3. Intermodel differences in stratospheric O3 concentration are therefore not predominantly responsible for intermodel spread in CO2 IRF and ERF.

How to cite: Byrom, R. and Myhre, G.: Investigating the relationship between stratospheric temperature and intermodel CO2 radiative forcing spread, EGU General Assembly 2023, Vienna, Austria, 23–28 Apr 2023, EGU23-15880, https://doi.org/10.5194/egusphere-egu23-15880, 2023.

EGU23-16873 | Posters on site | CL2.1

Understanding Water Temperature Regulating of Lakes Through the Energy Balance Approach: Direct Observations (Agamon Hula, Israel) and Analytical Solutions 

Guy Tau, Yehouda Enzel, Hamish McGowan, Vladimir Lyakhovsky, and Nadav Lensky

Air-water interactions regulate lake-water temperature by balancing the rate of change of water temperature (stored heat) with the incoming and outgoing heat fluxes, which are functions of water temperature and external forcing. Yet, there is a large knowledge gap in quantifying the thermoregulation of a lake, and especially managed lakes, which is hypothesized to be related to both external environmental forcing and management decisions on the lake depth and water discharge. Here we explore the thermoregulation of a restored and managed Mediterranean lake (Agamon Hula, Israel), by direct measurements of all major heat fluxes and interpret the results with a rigorous analysis of the energy balance equation. We provide general solutions of (i) the steady-state water temperature under given constant external conditions and show that it is unrelated to water depth, (ii) the time response of the lake’s temperature to reach a steady-state following an abrupt change in various environmental conditions and show its relation to water depth and thermal properties of water, and (iii) the response of the lake’s temperature to a pre-defined oscillations of the environmental forcing (diurnal, seasonal or other cycles). The amplitude of water temperature fluctuations, and the time delay from steady-state are functions of the environmental conditions oscillations and the ratio of the forcing’s time period over the thermal response time of the lake. The summertime measured CO2 fluxes of Agamon Hula revealed the lake acts as a CO2 source to the atmosphere, overpassing similar water bodies from different climates.

How to cite: Tau, G., Enzel, Y., McGowan, H., Lyakhovsky, V., and Lensky, N.: Understanding Water Temperature Regulating of Lakes Through the Energy Balance Approach: Direct Observations (Agamon Hula, Israel) and Analytical Solutions, EGU General Assembly 2023, Vienna, Austria, 23–28 Apr 2023, EGU23-16873, https://doi.org/10.5194/egusphere-egu23-16873, 2023.

The Libera Mission, named for the daughter of Ceres in Roman mythology, will provide continuity of the Clouds and the Earth’s Radiant Energy System (CERES) Earth radiation budget (ERB) observations from space. Libera’s attributes enable a seamless extension of the current 23-year ERB climate data record from CERES. Libera will acquire spectrally integrated radiance over the CERES FM6-heritage broad spectral bands in the shortwave (0.3 – 5 μm), longwave (5 – 50 μm) and total (0.3 – beyond 100 μm) and adds a split-shortwave band (0.7 – 5 μm) to provide deeper insight into shortwave energy deposition. Libera leverages advanced detector technologies using vertically aligned black-carbon nanotubes with closed-loop electrical substitution radiometry to achieve radiometric uncertainty of approximately 0.2%. Libera will also employ a wide field-of-view camera to provide scene context and accelerate the development of the split-shortwave angular distribution models.

Libera’s stewardship of the ERB record begins in the latter part of this decade, at an important juncture in the monitoring of climate trends. Libera is currently slated for a launch aboard JPSS-3 in December 2027, when the probability of a CERES data gap will be approaching 50%. The Libera science objectives associated with continuity and extension of the ERB data record are to identify and quantify processes responsible for ERB variability on various times scales. Beyond data continuity, Libera’s new and enhanced observational capabilities will advance our understanding of spatiotemporal variations of radiative energy flow in the visible and near-infrared spectral regions in addition to facilitating the rapid development of new angular distribution models for near-infrared and visible radiance-to-irradiance conversion.

This talk provides an overview of the Libera’s observational strategy, its measurements, science goals and objectives. We discuss the importance of climate data record continuity in the context of the current climate state and anticipated changes over the next decade and beyond.

How to cite: Pilewskie, P., Hakuba, M., and Stephens, G.: The Future of Earth Radiation Budget Observations Beyond CERES: Libera and Continuity of the ERB Climate Data Record, EGU General Assembly 2023, Vienna, Austria, 23–28 Apr 2023, EGU23-17097, https://doi.org/10.5194/egusphere-egu23-17097, 2023.

EGU23-408 | ECS | Posters on site | CL2.2

El Niño Southern Oscillation influence over the Orinoco low-level jet variability 

Alejandro Builes, Johanna Yepes, and Hernán D. Salas

We studied the most active season of the Orinoco Low-Level jet (OLLJ), December-January-February (DJF), during the El Niño-Southern Oscillation canonical phases, El Niño and La Niña. In particular, we studied the occurrence days of the jet in each month, wind speed, moisture transport and precipitation over northern south America. In terms of the occurrence of the OLLJ, during El Niño in January, the jet exhibits its highest reduction with changes up to 24% in the eastern Colombian plains. On the contrary, during La Niña, the jet exhibits an increase between 6–16% in the frequency of occurrence mainly located in the eastern Colombian plains and the border between Colombia, Ecuador and Peru. Although the diurnal cycle of the OLLJ windspeed remains unaltered during the ENSO phases the maximum decrease (increase) up to -2m/s (up to 1 m/s) during El Niño (La Niña). Regarding moisture transport there is a gradual reduction during the season in both ENSO phases reaching up to 18 gm-1 kgm-1 during El Niño, and the precipitation also shows a reduction of around 5 mm/day. In conclusion, during DJF at the ENSO canonical phases the OLLJ shows changes in its occurrence along the jet corridor, and the region experiences changes in both moisture transport and precipitation.

How to cite: Builes, A., Yepes, J., and Salas, H. D.: El Niño Southern Oscillation influence over the Orinoco low-level jet variability, EGU General Assembly 2023, Vienna, Austria, 23–28 Apr 2023, EGU23-408, https://doi.org/10.5194/egusphere-egu23-408, 2023.

EGU23-410 | Orals | CL2.2

Phase-Locking between precipitation and El Niño-Southern Oscillation over northern South America 

Hernán D. Salas, Germán Poveda, Óscar J. Mesa, Alejandro Builes-Jaramillo, Niklas Boers, and Jürgen Kurths

We study phase-locking between the El Niño - Southern Oscillation (ENSO) and precipitation at inter-annual time scales over northern South America. To this end, we characterize the seasonality of the regional patterns of sea surface temperature, surface pressure levels, and precipitation anomalies associated with the states of the canonical ENSO. We find that the positive (negative) precipitation anomalies experienced in northern South America differ from those previously reported in the literature in some continental regions. In particular, the Orinoco Low-level Jet corridor separates two regions with negative (positive) rainfall anomalies during El Niño (La Niña), which are located in the Guianas (northeastern Amazon) and the Caribbean. Moreover, we show that the ENSO signal is phase-locked with the inter-annual rainfall variability in most of the study regions although some areas exhibit phase-locking without a significant change in the anomalies of precipitation. This suggests that ENSO could induce changes only in terms of phases and not so in terms of magnitude. This work provides new insights into the non-linear interactions between ENSO and hydro-climatic processes over the tropical Americas.

How to cite: Salas, H. D., Poveda, G., Mesa, Ó. J., Builes-Jaramillo, A., Boers, N., and Kurths, J.: Phase-Locking between precipitation and El Niño-Southern Oscillation over northern South America, EGU General Assembly 2023, Vienna, Austria, 23–28 Apr 2023, EGU23-410, https://doi.org/10.5194/egusphere-egu23-410, 2023.

EGU23-1522 | ECS | Orals | CL2.2

Future climate response to observed extreme El Niño analogues 

Paloma Trascasa-Castro, Yohan Ruprich-Robert, and Amanda Maycock

Model simulations show a robust increase in ENSO-related precipitation variability in a warmer climate, but there remains uncertainty in whether the characteristics of ENSO events themselves may change in the future. Our study aims to disentangle these effects by addressing how the global impacts of observed large El Niño events would change in different background climate states covering the preindustrial, present and future periods.

Pacemaker simulations with the EC-Earth3-CC model were performed replaying the 3 strongest observed El Niño events from the historical record (1982/83, 1997/98, 2015/16). Model tropical Pacific sea surface temperature (SST) anomalies were restored towards observations, while imposing different background states, mimicking past, present and future climate conditions (following the SSP2-4.5). All variables outside the restoring region evolve freely in a coupled-atmosphere ocean transient simulation. For each start date, 30 ensemble members with different initial conditions were run for 2 years. Using this approach we ask ‘what impacts would arise if the observed El Niño occurred in the past or future’?

In response to the same imposed El Niño SST anomalies, precipitation anomalies are shifted towards the Eastern equatorial Pacific in the future compared to the present day, leading to changes in the extratropical response to El Niño. Some examples are an amplification of the surface temperature response over north-eastern North America, northern South America and Australia in boreal winter. We link the changes of El Niño related tropical Pacific precipitation to a decrease in the climatological zonal SST gradient in the equatorial Pacific, as we move from past to future climatologies, which potentially leads to a higher convection sensitivity to SST anomalies over the Central and Eastern equatorial Pacific in the future. Interestingly, the simulations indicate there has already been an intensification of El Niño impacts between present day and preindustrial, which is comparable to the differences found between future and present. This nonlinear behaviour highlights the need to understand potential changes to convection thresholds in the tropical Pacific to be able to explain El Niño teleconnections under climate change scenarios. Ongoing work is exploring the changes in atmospheric circulation that lead to the overall intensification of El Niño impacts that we show in our study.

How to cite: Trascasa-Castro, P., Ruprich-Robert, Y., and Maycock, A.: Future climate response to observed extreme El Niño analogues, EGU General Assembly 2023, Vienna, Austria, 23–28 Apr 2023, EGU23-1522, https://doi.org/10.5194/egusphere-egu23-1522, 2023.

EGU23-1960 | Posters on site | CL2.2

Two regimes of inter-basin interactions between the Atlantic and Pacific Oceans on interannual timescales 

Jae-Heung Park, Sang-Wook Yeh, Jong-Seong Kug, Young-Mean Yang, Hyun-Su Jo, Hyo-Jeong Kim, and Soon-Il An

Understanding the inter-basin interactions between the Atlantic and Pacific Oceans is of great concern due to their substantial global climatic implications. By analyzing observational reanalysis datasets (1948-2020), we found that there are two regimes in Atlantic–Pacific inter-basin interactions: (i) the Pacific-driven regime, and (ii) the Atlantic-driven regime. In the Pacific-driven regime before the mid-1980s, the El Niño-Southern Oscillation (ENSO) in winter effectively drives the primary mode of sea surface temperature anomaly (SSTA) in the tropical Atlantic (i.e., NTA mode) in boreal spring. The NTA mode has a meridional contrast of SSTA along the Atlantic Intertropical convergence zone due to the ENSO effect, similar to the Atlantic Meridional Mode. Whereas, in the Atlantic-driven regime after the mid-1980s, the ENSO effect on the NTA becomes remarkably weaker, so that the NTA mode is featured with a SSTA monopole. Notably, the NTA mode without the meridional contrast of SSTA is capable of modulating an ENSO event. Our analyses of the latest climate models participating in the Coupled Model Intercomparison Project (CMIP) phases 6 support the hypothesis that the two regimes engendered by the Atlantic-Pacific inter-basin interactions are likely due to natural variability.

How to cite: Park, J.-H., Yeh, S.-W., Kug, J.-S., Yang, Y.-M., Jo, H.-S., Kim, H.-J., and An, S.-I.: Two regimes of inter-basin interactions between the Atlantic and Pacific Oceans on interannual timescales, EGU General Assembly 2023, Vienna, Austria, 23–28 Apr 2023, EGU23-1960, https://doi.org/10.5194/egusphere-egu23-1960, 2023.

EGU23-2136 | ECS | Posters on site | CL2.2

A multi-modal representation of El-Niño Southern Oscillation Diversity 

Jakob Schlör, Antonietta Capotondi, and Bedartha Goswami

Sea surface temperature anomalies (SSTA) associated with the El-Niño Southern Oscillation (ENSO) show strong event-to-event variability, known as ENSO diversity. El Niño and La Niña events are typically divided into Eastern Pacific (EP) and Central Pacific (CP) types based on the zonal location of peak SSTA. The separation of these types is usually based on temperature differences between pairs of predefined indices, such as averages over boxes in the Eastern and Central Pacific or the two leading Principal Components of tropical SSTA. 
Using results from unsupervised learning of SSTA data, we argue that ENSO diversity is not well described by distinctly separate classes but rather forms a continuum with events grouping into "soft'' clusters. We apply a Gaussian mixture model (GMM) to a low-dimensional projection of tropical SSTA to describe the multi-modal distribution of ENSO events. We find that El-Niño events are best described by three overlapping clusters while La-Niña events only show two "soft'' clusters. The three El-Niño clusters are described by i) maximum SSTA in the CP, ii) maximum SSTA in the EP, and iii) strong basin-wide warming of SSTA which we refer to as the "super El-Niño'' cluster. The "soft'' clusters of La-Niña correspond to i) anomalous cool SST in the CP and ii) anomalously cool SST in the EP. We estimate the probability that a given ENSO event belongs to a chosen cluster and use these probabilities as weights for estimating averages of atmospheric variables corresponding to each cluster. These weighted composites show qualitatively similar patterns to the typically used averages over EP and CP events. However, the weighted composites show a higher signal-to-noise ratio in the mid-latitudes for the "super El-Niño'' events. 
We further apply our approach to CESM2 model data and discuss the potential of GMM clustering for evaluating how well ENSO diversity is captured in Global Circulation models.

How to cite: Schlör, J., Capotondi, A., and Goswami, B.: A multi-modal representation of El-Niño Southern Oscillation Diversity, EGU General Assembly 2023, Vienna, Austria, 23–28 Apr 2023, EGU23-2136, https://doi.org/10.5194/egusphere-egu23-2136, 2023.

An information theory based framework is developed to assess the predictability of the ENSO complexity, which includes different types of the ENSO events with diverse characteristics in spatial patterns, peak intensities and temporal evolutions. The information theory advances a unique way to quantify the forecast uncertainty and allows to distinguish the predictability limit of each type of event. With the assistance of a recently developed multiscale stochastic conceptual model that succeeds in capturing both the large-scale dynamics and many crucial statistical properties of the observed ENSO complexity, it is shown that different ENSO events possess very distinct predictability limits. Beyond the ensemble mean value, the spread of the ensemble members also has remarkable contributions to the predictability. Specifically, while the result indicates that predicting the onset of the eastern Pacific (EP) El Ninos is challenging, it reveals a universal tendency to convert strong predictability to skillful forecast for predicting many central Pacific (CP) El Ninos about two years in advance. In addition, strong predictability is found for the La Nina events, corresponding to the effectiveness of the El Nino to La Nina transitions. In the climate change scenario with the strengthening of the background Walker circulation, the predictability of sea surface temperature in the CP region has a significant response with a notable increase in summer and fall. Finally, the Gaussian approximation exhibits to be accurate in computing the information gain, which facilitates the use of more sophisticated models to study the ENSO predictability.

How to cite: Fang, X. and Chen, N.: Quantifying the Predictability of ENSO Complexity Using a Statistically Accurate Multiscale Stochastic Model and Information Theory, EGU General Assembly 2023, Vienna, Austria, 23–28 Apr 2023, EGU23-2209, https://doi.org/10.5194/egusphere-egu23-2209, 2023.

EGU23-2470 | ECS | Orals | CL2.2

The Dynamics of the El-Niño Southern Oscillation (ENSO) Diversity 

Priyamvada Priya, Dietmar Dommenget, and Shayne McGregor

This study investigates the observed El-Niño Southern Oscillation (ENSO) dynamics for the eastern Pacific (EP) and central Pacific (CP) events. Here we use the recharge oscillator (ReOsc) model concept to describe the ENSO phase space, based on the interaction of sea surface temperatures in the eastern equatorial Pacific (T) and thermocline depth (h), for the different types of ENSO events. We further look at some important statistical characteristics, such as power spectrum and cross-correlation, as essential parameters for understanding the dynamics of ENSO. The results show that the CP and EP events are very different in the ENSO phase space and less well described by the ReOsc model than a T index-based model. The EP events are closer to the idealised ReOsc model, with clear propagation through all phases of the ENSO cycle and strongly skewed towards the El-Niño and subsurface ocean heat discharge states. The CP events, in turn, do not have a clear propagation through all phases and are strongly skewed towards the La-Nina state. Also, the CP events have a slower cycle (67 months) than the EP events (50 months). Further, the CP events collapse after the La-Nina phase, whereas the EP events appear to collapse after the discharging phase. The characteristics out-of-phase cross-correlation between T and h is nearly absent for the CP events, suggesting that the interaction between T and h is not as important as for the EP or the canonical ENSO events. Furthermore, the coupling factor of T and h is smaller for the CP events than the EP events, implying that the CP events are not influenced much by T and h interactions. This study will provide new insight to understand these events by developing a dynamical approach to explain the observed ENSO dynamics for the EP and CP events in the ReOsc model framework.

How to cite: Priya, P., Dommenget, D., and McGregor, S.: The Dynamics of the El-Niño Southern Oscillation (ENSO) Diversity, EGU General Assembly 2023, Vienna, Austria, 23–28 Apr 2023, EGU23-2470, https://doi.org/10.5194/egusphere-egu23-2470, 2023.

EGU23-2477 | Posters on site | CL2.2

ENSO phase space dynamics with an improved estimate of the thermocline depth 

Dietmar Dommenget and Priyamvada Priya

The recharge oscillator model of the El Niño Southern Oscillation (ENSO) describes the ENSO dynamics as an interaction and oscillation between the eastern tropical Pacific sea surface temperatures (T) and subsurface heat content (thermocline depth; h), describing a cycle of ENSO phases. h is often approximated on the basis of the depth of the 20oC isotherm (Z20). In this study we will address how the estimation of h affects the representation of ENSO dynamics. We will compare the ENSO phase space with h estimated based on Z20 and based on the maximum gradient in the temperature profile (Zmxg). The results illustrate that the ENSO phase space is much closer to the idealised recharge oscillator model if based on Zmxg than if based on Z20. Using linear and non-linear recharge oscillator models fitted to the observed data illustrates that the Z20 estimate leads to artificial phase dependent structures in the ENSO phase space, which result from an in-phase correlation between h and T. Based on the Zmxg estimate the ENSO phase space diagram show very clear non-linear aspects in growth rates and phase speeds. Based on this estimate we can describe the ENSO cycle dynamics as a non-linear cycle that grows during the recharge and El Nino state, and decays during the La Nina states. The most extreme ENSO states are during the El Nino and discharge states, while the La Nina and recharge states do not have extreme states. It further has faster phase speeds after the El Nino state and slower phase speeds during and after the La Nina states. The analysis suggests that the ENSO phase speed is significantly positive in all phases, suggesting that ENSO is indeed a cycle. However, the phase speeds are closest to zero during and after the La Nina state, indicating that the ENSO cycle is most likely to stall in these states.

How to cite: Dommenget, D. and Priya, P.: ENSO phase space dynamics with an improved estimate of the thermocline depth, EGU General Assembly 2023, Vienna, Austria, 23–28 Apr 2023, EGU23-2477, https://doi.org/10.5194/egusphere-egu23-2477, 2023.

EGU23-3263 | ECS | Orals | CL2.2

Model Resolution Effects on ENSO and its Teleconnections 

Ned Williams, Adam Scaife, and James Screen

The El Niño-Southern Oscillation (ENSO) influences climate on a global scale and is a source of long-range predictability. Accurate modelling of the impact of ENSO requires accurate representation of teleconnections as well as of ENSO itself. We consider a set of CMIP6 models and assess the effect of increasing model resolution on ENSO and its boreal winter teleconnections. The spatial structure, strength and asymmetry of both ENSO and its teleconnection to the extratropical North Pacific are considered. We find evidence of an improved El Niño teleconnection in high resolution models, but this effect is weaker for La Niña. We aim to establish whether ocean or atmospheric resolution is the primary driver of resolution-based trends, and we evaluate the relevance of mean state biases on these trends. 

How to cite: Williams, N., Scaife, A., and Screen, J.: Model Resolution Effects on ENSO and its Teleconnections, EGU General Assembly 2023, Vienna, Austria, 23–28 Apr 2023, EGU23-3263, https://doi.org/10.5194/egusphere-egu23-3263, 2023.

EGU23-3278 | ECS | Posters on site | CL2.2

Oceanic and Atmospheric Feedbacks Associated with the Spreading of Pacific Coastal Niño Events 

Daniel Rudloff and Joke Lübbecke

In early 2017 a very strong coastal warming occurred off the coast of Peru. This event, which caused heavy rainfalls and flooding over land, marked the strongest so called ‘Pacific Coastal Niño Event’ observed. Most intriguing about this event was the fact that the central Pacific was not showing any significant anomalies during that time. Since then several studies have investigated Pacific Coastal Niños but the exact mechanisms of how such events behave are still not clear. While most studies focus on their onset mechanisms, we here analyze their evolution and decay and in particular their connection to the central equatorial Pacific.

To address those questions, we are using the coupled climate model FOCI (Flexible Ocean Climate Infrastructure). Starting from a long control simulation with pre-industrial conditions we perform sets of 2-year long sensitivity experiments in which a coastal warming is generated by a local wind stress anomaly utilizing a partial coupling approach. Once the warming is initiated by reduced upwelling the wind forcing is switched off and the model can evolve freely, which enables us to investigate the evolution and decay of the warming. The approach allows to vary the forcing in strength, location and timing. By starting from different conditions in terms of equatorial heat content and applying the forcing during different months, the influences of both the background state of the equatorial Pacific during the Coastal Niño and the seasonality of the coastal warming are investigated. To understand which factors influence the spreading of the warm anomaly we analyze both local coastal feedbacks, which lead to an alongshore extension of the anomaly, and equatorial feedbacks that are crucial for a spreading along the equator.

How to cite: Rudloff, D. and Lübbecke, J.: Oceanic and Atmospheric Feedbacks Associated with the Spreading of Pacific Coastal Niño Events, EGU General Assembly 2023, Vienna, Austria, 23–28 Apr 2023, EGU23-3278, https://doi.org/10.5194/egusphere-egu23-3278, 2023.

EGU23-3440 | ECS | Posters on site | CL2.2

New insight into multi-year La Niña dynamics from the perspective of a near-annual ocean process 

Fangyu Liu, Wenjun Zhang, Fei-Fei Jin, Feng Jiang, Julien Boucharel, and Suqiong Hu

The El Niño-Southern Oscillation (ENSO) exhibits highly asymmetric temporal evolutions between its warm and cold phases. While El Niño events usually terminate rapidly after their mature phase and show an already established transition into the cold phase by the following summer, many La Niña events tend to persist throughout the second year and even re-intensify in the ensuing winter. While many mechanisms were proposed, no consensus has been reached yet and the essential physical processes responsible for the multi-year behavior of La Niña remain to be illustrated. Observations show that a unique ocean physical process operates during multi-year La Niña events. It is characterized by rapid double reversals of zonal ocean current anomalies in the equatorial Pacific which exhibits a fairly regular near-annual periodicity. Analyses of mixed-layer heat budget reveal comparable contributions of the thermocline and zonal advective feedbacks to the SST anomaly growth for the first year of multi-year La Niña events; however, the zonal advective feedback plays a dominant role in the re-intensification of La Niña events. Furthermore, the unique ocean process is identified to be closely associated with the preconditioning heat content state in the central to eastern equatorial Pacific before the first year of La Niña, which sets the stage for the future re-intensification of La Niña. The above-mentioned oceanic process can be largely reproduced by state-of-the-art climate models despite systematic underestimation, providing a potential predictability source for the multi-year La Niña events.

How to cite: Liu, F., Zhang, W., Jin, F.-F., Jiang, F., Boucharel, J., and Hu, S.: New insight into multi-year La Niña dynamics from the perspective of a near-annual ocean process, EGU General Assembly 2023, Vienna, Austria, 23–28 Apr 2023, EGU23-3440, https://doi.org/10.5194/egusphere-egu23-3440, 2023.

EGU23-3598 | Orals | CL2.2 | Highlight

Prediction Challenges from Errors in Tropical Pacific Sea Surface Temperature Trends 

Michelle L'Heureux, Michael Tippett, and Wanqiu Wang

Initialized, monthly mean predictions of the tropical Pacific Ocean are made against the backdrop of a warming climate, and it is unclear to what extent these predictions are impacted by trends.  Here, we analyze the forecast models that comprise the North American Multi-Model Ensemble (NMME) and uncover significant linear trend errors that have consequences for the tropical Pacific basin and ENSO variability.  All models show positive trend errors over the eastern equatorial Pacific over the 1982-2020 hindcast and real-time period.  These positive trend errors interact with the mean bias of each respective model, reducing, over time, the bias of models that are too cold and increasing the bias of models that are too warm.  These trend errors lead to a tropical Pacific that is too warm and too wet over the basin, and is significantly correlated with an increase in El Niño false alarms.  Finally, we explore the consequences of these tropical Pacific Ocean trend errors on predictions of global precipitation anomalies. 

How to cite: L'Heureux, M., Tippett, M., and Wang, W.: Prediction Challenges from Errors in Tropical Pacific Sea Surface Temperature Trends, EGU General Assembly 2023, Vienna, Austria, 23–28 Apr 2023, EGU23-3598, https://doi.org/10.5194/egusphere-egu23-3598, 2023.

EGU23-3631 | Posters on site | CL2.2

Multiyear ENSO dynamics as revealed in observations, CMIP6 models, and linear theory 

Tomoki Iwakiri and Masahiro Watanabe

El Niño–Southern Oscillation (ENSO) events occasionally recur one after the other in the same polarity, called multiyear ENSO. However, the dynamical processes are not well understood. This study aims to elucidate the unified mechanisms of multiyear ENSO using observations, CMIP6 models, and the theoretical linear recharge oscillator (RO) model. We found that multiyear El Niño and La Niña events are roughly symmetric except in some cases. The composite multiyear ENSO reveals that anomalous ocean heat content (OHC) in the equatorial Pacific persists beyond the first peak, stimulating another event. This prolonged OHC anomaly is caused by meridional Ekman heat transport counteracting geostrophic transport induced recharge–discharge process that otherwise acts to change the OHC anomaly. A meridionally wide pattern of sea surface temperature observed during multiyear event is responsible for the Ekman heat transport. CMIP6 multi-model ensemble shows a significant correlation between the ENSO meridional width and the occurrence ratio of multiyear ENSO. A multiyear ENSO-like oscillation was simulated using the linear RO model that incorporates a seasonally varying Bjerknes growth rate and a weak recharge efficiency representing the effect of Ekman transport. When the recharge efficiency parameter was estimated using reanalysis data based on geostrophic transport alone, a multiyear ENSO rarely occurred, confirming the importance of Ekman transport in retarding the recharge–discharge process.

How to cite: Iwakiri, T. and Watanabe, M.: Multiyear ENSO dynamics as revealed in observations, CMIP6 models, and linear theory, EGU General Assembly 2023, Vienna, Austria, 23–28 Apr 2023, EGU23-3631, https://doi.org/10.5194/egusphere-egu23-3631, 2023.

EGU23-3637 | ECS | Posters on site | CL2.2

Is a Preceding Strong El Niño Required to Generate Multi-year La Niña? 

Ji-Won Kim, Jin-Yi Yu, and Baijun Tian

By analyzing observational data covering the period from 1900 to 2021, we show that the known mechanism linking multi-year La Niña with a preceding strong El Niño has been overemphasized. A majority of multi-year La Niña (64%; 7 out of 11 events) do not require a preceding strong El Niño to generate their 2nd-year La Niña. We find that the negative phase of the Pacific Meridional Mode (PMM) during 1st-year La Niña’s decaying spring, rather than the preceding strong El Niño, offers the key mechanism to produce 2nd-year La Niña, resulting in a multi-year La Niña. It is further found that the westward extension of the 1st-year La Niña cold sea surface temperature anomalies, which interacts with the eastern edge of the western Pacific warm pool, is a key factor inducing the negative PMM. The negative PMM mechanism to generate multi-year La Niña is also applied to the 3rd-year La Niña of multi-year La Niña, giving rise to a triple-dip event. The possible reason(s) how and why a multi-year La Niña can become either a double-dip or a triple-dip event will be discussed.

How to cite: Kim, J.-W., Yu, J.-Y., and Tian, B.: Is a Preceding Strong El Niño Required to Generate Multi-year La Niña?, EGU General Assembly 2023, Vienna, Austria, 23–28 Apr 2023, EGU23-3637, https://doi.org/10.5194/egusphere-egu23-3637, 2023.

EGU23-4180 | Orals | CL2.2

Why is El Nino warm? 

Stephan Fueglistaler, Laure Resplandy, and Allison Hogikyan

El Nino years stand out in the global average temperature time series as record-warm years. The coupled atmosphere-ocean dynamics leading to warming in the climatologically cold equatorial Eastern Pacific are well understood, but cannot be the cause for the very strong signal in global average temperarture. The latter must be caused by an increase in subcloud Moist Static Energy (MSE) in the domain of highest subcloud MSE where atmospheric deep convection couples the surface, boundary layer and free troposphere. Transformation of the data from geographical space to sea-surface temperature (SST) percentiles eliminates the large spatial see-saws in all variables arising from the geographic reorganization of the general circulation, and brings to light the mechanism: While in the Eastern Pacific region oceanic heat uptake is reduced (corresponding to a heat flux out of the ocean), the deep convective domain sees a heat flux from the atmosphere into the ocean. We show that this heat flux into the ocean at the high end of SSTs - the opposite of the canonical perspective of a warming due to a heat flux from the ocean to the atmosphere - is mechanically forced: surface wind speeds are lower in regions of active deep convection than in ENSO neutral (and La Nina) years. The resulting reduced evaporation leads to the increase in subcloud MSE that causes the global temperature signal.

How to cite: Fueglistaler, S., Resplandy, L., and Hogikyan, A.: Why is El Nino warm?, EGU General Assembly 2023, Vienna, Austria, 23–28 Apr 2023, EGU23-4180, https://doi.org/10.5194/egusphere-egu23-4180, 2023.

The equatorial Atlantic zonal sea surface temperature (SST) gradient, which has significant climatic and biogeochemical effects, is closely associated with the equatorial Pacific zonal SST gradient through Walker circulation on seasonal and interannual time scales. However, discrepancies in current SST datasets mean that its long-term trend is not well understood. Here, using multiple datasets, we find a robust weakening long-term trend (i.e., greater warming in the east than west) in the equatorial Atlantic zonal SST gradient over the period 1900–2010 in all datasets. We also find that this weakening trend is closely linked to the tropical Pacific cold tongue mode (CTM), which corresponds to a strong increasing long-term trend of zonal SST gradient along the equatorial Pacific (i.e., warming in the west and cooling in the east). Specifically, the long-term cooling SST anomalies associated with the CTM modify the Walker circulation, and leads to weaker trade winds over the western equatorial Atlantic. These in turn deepen the thermocline in the eastern equatorial Atlantic, and cause the weakening long-term trend of SST gradient along the equatorial Atlantic. The long-term trend of the CTM is induced by ocean dynamical feedback in response to global warming, suggesting that global warming could affect the equatorial Atlantic zonal SST gradient via the CTM. Our results provide a novel explanation of the linkages between the long-term trend of equatorial Atlantic zonal SST gradient and the CTM under global warming, which carries important implications for the relationship between global warming and the equatorial Atlantic zonal SST gradient.

How to cite: Li, Y.: Long-term trend of equatorial Atlantic zonal SST gradient linked to the tropical Pacific cold tongue mode under global warming, EGU General Assembly 2023, Vienna, Austria, 23–28 Apr 2023, EGU23-4360, https://doi.org/10.5194/egusphere-egu23-4360, 2023.

EGU23-4971 | ECS | Orals | CL2.2

Indo-Pacific teleconnection changes during the Holocene: model-proxy comparison 

Isma Abdelkader Di Carlo, Pascale Braconnot, Mary Elliot, and Olivier Marti

The teleconnections between the Indian and Pacific Oceans are very complex, involving multiple modes of variability and phenomena such as the El Niño-Southern Oscillation, Indian Ocean Dipole, Indian Ocean Basin mode, and the Asian monsoon. Their interactions are complex because changes in one of these phenomena affect the others. Insufficient agreement exists on the predicted evolution of mean states of both basins and the impacts of climate variability in this region in response to increasing CO2 emissions. To better constrain Indo-Pacific interactions, we have studied the Holocene period. We consider four transient simulations from three General Circulation Models (GCM) and a collection of paleo-archives from the Holocene in the Indo-Pacific region. Our study allows us to put into perspective the links between long-term changes in variability and in the mean state. The main driver is insolation and trace gases (CO2) that have increased the mean sea surface temperature of the tropical ocean over the last 6,000 years. Our first results show that modeled trends in the regional long-term variability are in agreement, but differences are observed when we analyze the data at shorter interannual timescales. We also explain why the simulations differ or agree with the paleoclimate reconstructions. One way is to look at the relative role of temperature and salinity in determining the changes in δ18O recorded by the various climate archives. 

How to cite: Abdelkader Di Carlo, I., Braconnot, P., Elliot, M., and Marti, O.: Indo-Pacific teleconnection changes during the Holocene: model-proxy comparison, EGU General Assembly 2023, Vienna, Austria, 23–28 Apr 2023, EGU23-4971, https://doi.org/10.5194/egusphere-egu23-4971, 2023.

EGU23-5205 | ECS | Posters on site | CL2.2

Impact of tropical SSTs on the monthly signal over the North Atlantic-European region 

Sara Ivasić, Ivana Herceg Bulić, and Margareta Popović

Targeted numerical simulations were designed to test the potential impact of tropical sea surface temperatures (SSTs) on the geopotential heights at 200 hPa (GH200) signal over the North Atlantic-European region. Five experiments with SST anomalies prescribed in different areas, acting as lower boundary forcing, were created with an intermediately complex atmospheric general circulation model (ICTP AGCM). In the AGCM experiments, the SST forcing was prescribed globally, in the tropical zone of all oceans, only in the tropical Atlantic, tropical Indian Ocean and limited to the tropical Pacific. All of the simulations covered a 156-year-long period.

The monthly GH200 signal was calculated based on the difference between the ensemble mean of each experiment and the climatological mean for the considered period. In addition, to inspect the impact of the El Niño-Southern Oscillation (ENSO), the signal was calculated for ENSO and non-ENSO years, respectively. Here, the ENSO years were classified according to the value of the late-winter Niño3.4 index.

Additionally, each experiment’s monthly signal was averaged over the signal maximum over the North Atlantic-European region. The characteristics of the spatially averaged signal were compared to the signal averaged over a similar signal maximum observed over the Pacific North American region.

Results have shown that the GH200 signal is the strongest in the late-winter months in all experiments. The AGCM experiment with SST boundary forcing prescribed only in the tropical Atlantic consistently had the smallest signal amplitude. The strongest signal linked to ENSO events was found in the experiment with the SST forcing prescribed only in the tropical Pacific. The signal averaged over the NAE maximum generally yields smaller values than the PNA maximum average. Also, the differences between the (non) ENSO signal and the signal for all years are less pronounced in the case of the NAE maximum average.

How to cite: Ivasić, S., Herceg Bulić, I., and Popović, M.: Impact of tropical SSTs on the monthly signal over the North Atlantic-European region, EGU General Assembly 2023, Vienna, Austria, 23–28 Apr 2023, EGU23-5205, https://doi.org/10.5194/egusphere-egu23-5205, 2023.

EGU23-5310 | ECS | Orals | CL2.2

Distinct and reproductible northem hemisphere winter teleconnection pattern during strong El Niño events : relative roles of Sea Surface Temperature forcing and atmospheric nonlinearities 

Margot Beniche, Jérôme Vialard, Matthieu Lengaigne, Aurore Voldoire, Srinivas Gangiredla, and Nicholas Hall

The strengthening and north-eastward shift of El Niño Northern hemisphere winter teleconnections relative to those of La Niña is a well-known asymmetry of ENSO (El Niño Southern Oscillation). It is generally attributed to atmospheric nonlinearities associated with the Sea Surface Temperature (SST) threshold for tropical deep convection. Here, we re-examine these teleconnection asymmetries in the context of ENSO SST pattern diversity. We find that the asymmetries are mainly attributable to strong El Niño events (eg. 1982-83, 1997-98, 2015-16), both in observations and in ensemble simulations with the atmospheric component of the CNRM-CM6 model. This strong El Niño teleconnection pattern also results in specific impacts, characterized by enhanced rainfall along the United States (US) west coast and warm anomalies over Canada and the Northern US. Our ensemble simulations further indicate that moderate “Eastern Pacific” El Niño events exhibit teleconnection patterns that are similar to those of “Central Pacific” El Niño, or to the opposite of La Niña events. We also find that the teleconnection spread between ensemble members or events is reduced for strong El Niño relative to moderate El Niño or La Niña events, with important implications for predictability. Sensitivity experiments in which the atmospheric model is forced by the opposite of observed SST anomalies are used to assess the mechanisms inducing the strong El Niño teleconnection pattern. In addition to the well-known influence of atmospheric nonlinearities, these experiments reveal an important contribution from the Eastward-shifted SST pattern during strong El Niño events.


How to cite: Beniche, M., Vialard, J., Lengaigne, M., Voldoire, A., Gangiredla, S., and Hall, N.: Distinct and reproductible northem hemisphere winter teleconnection pattern during strong El Niño events : relative roles of Sea Surface Temperature forcing and atmospheric nonlinearities, EGU General Assembly 2023, Vienna, Austria, 23–28 Apr 2023, EGU23-5310, https://doi.org/10.5194/egusphere-egu23-5310, 2023.

The amplitude of El Niño/Southern Oscillation (ENSO) varied considerably over the last 140 years, for which we have relatively reliable Sea Surface Temperature (SST) observations over the tropical Pacific. The difference between periods of high and low ENSO amplitude results mainly from the number of strong Eastern Pacific (EP) El Niños, while the amplitude of Central Pacific (CP) El Niños is comparable in both periods. Further, the asymmetry of ENSO, i.e. that the SST anomalies during El Niño are on average stronger and located further to the east than during La Niña, covaries with ENSO amplitude in observations, indicating that the number of strong EP El Niño events dominates both ENSO amplitude and asymmetry variations.

We find similar relations in the 40 historical runs of the Large Ensemble with the CESM1-CAM5-BGC model that can simulate the ENSO asymmetry quite realistically.  Further, there is a strong relation between the ENSO amplitude and the tropical Pacific mean state, indicating that a warmer eastern equatorial Pacific favors more EP El Niños due to a lower convective threshold in that area. We also analyze the spatial asymmetry and amplitude asymmetry of the atmospheric and oceanic feedbacks and show that the spatial asymmetry is more pronounced in the atmospheric feedbacks, while the amplitude asymmetry is more pronounced in the oceanic feedbacks, and that both together form the observed asymmetry of ENSO.  A comparison with 360 years-long CESM1 experiments with a -4.0 K colder and +3.7 K warmer mean state indicates that the present-day ENSO may be in a transition zone between a CP El Niño dominated ENSO state and an EP El Niño dominated ENSO state and that ENSO may lock-in into the EP El Niño dominated state under global warming.

Finally, our analysis of ENSO-amplitude variability in preindustrial control simulations of the CMIP6 database supports a strong relation of ENSO amplitude and asymmetry with the number of strong EP El Niño events.

How to cite: Bayr, T., Lübbecke, J. F., and Latif, M.: The role of strong Eastern Pacific El Nino events in ENSO-amplitude variability in Observations and Climate Models, EGU General Assembly 2023, Vienna, Austria, 23–28 Apr 2023, EGU23-6109, https://doi.org/10.5194/egusphere-egu23-6109, 2023.

Using observational analysis and numerical experiments, we identify that the dipole mode of 
spring surface wind speed (SWS) over the Tibetan Plateau (TP) could act as a trigger for subsequent winter El 
Niño–Southern Oscillation events. During the positive phase of spring SWS dipole mode (south-positive and 
north-negative), a self-sustaining “negative sensible heating–baroclinic structure” prevails over the western TP, 
which is characterized by negative surface sensible heating anomalies, anomalous low-level anticyclones, and 
mid–high-level cyclones. The “negative sensible heating–baroclinic structure” stimulates the surface westerly 
wind anomalies over the tropical western Pacific in May through two pathways, favoring the occurrence of 
subsequent El Niño events. One is through weakening the zonal monsoon circulation over the tropical Indian 
Ocean and the Walker circulation over the tropical western Pacific. The other is modulating the air–sea 
interaction over the North Pacific through triggering Rossby waves. The negative SWS dipole mode tends to 
induce La Niña events.

How to cite: Yu, W.: Potential Impact of Spring Thermal Forcing Over the Tibetan Plateau on the Following Winter El Niño–Southern Oscillation, EGU General Assembly 2023, Vienna, Austria, 23–28 Apr 2023, EGU23-6401, https://doi.org/10.5194/egusphere-egu23-6401, 2023.

EGU23-7693 | Orals | CL2.2

Atmospheric nonlinearities strong contribution to the skewed ENSO amplitude and phase transition 

Jérôme Vialard, Srinivas Gangiredla, Matthieu Lengaigne, Aurore Voldoire, Takeshi Izumo, and Eric Huilyardi

ENSO features prominent asymmetries, in terms of amplitude, spatial pattern and phase-transition between warm and cold events. Here we examine the contribution of atmospheric nonlinearities to ENSO asymmetries through a set of forced experiments with the CNRM-CM6 AGCM and the NEMO OGCM. Control experiments can reproduce the major atmospheric and oceanic asymmetries of ENSO, with stronger signals east of the dateline for strong El Niño events, and west of it for strong La Niñas. Ensemble atmospheric experiments forced by observed ENSO SST anomalies and their opposites allow diagnosing asymmetries in air-sea heat and momentum fluxes directly attributable to atmospheric nonlinearities. They indicate that atmospheric nonlinearities are largely attributable to nonlinearities in the rainfall-SST relation and act to enhance El Niño atmospheric signals east of the dateline and those of La Niña west of it. An ocean simulation where the non-linear signature of air-sea fluxes is removed from the forcing reveals that asymmetries in the ENSO SST pattern are primarily due to atmospheric nonlinearities, and result in a doubling of eastern Pacific warming during the peak of strong El Niño events and a 33% reduction during that of strong La Niña events. Atmospheric nonlinearities also explain most of the observed prolonged eastern Pacific warming into boreal summer after the peak of strong El Niño events. Overall, these results imply that properly simulating the nonlinear relationship between SST and rainfall in CGCMs is essential to accurately simulate asymmetries in ENSO amplitude, spatial pattern and phase transition. Finally, we discuss the inherent limitations to our two-tier forced approach.

How to cite: Vialard, J., Gangiredla, S., Lengaigne, M., Voldoire, A., Izumo, T., and Huilyardi, E.: Atmospheric nonlinearities strong contribution to the skewed ENSO amplitude and phase transition, EGU General Assembly 2023, Vienna, Austria, 23–28 Apr 2023, EGU23-7693, https://doi.org/10.5194/egusphere-egu23-7693, 2023.

EGU23-7791 | Posters on site | CL2.2

The multiverse future of ENSO diversity in large ensembles of climate models 

Bastien Dieppois, Nicola Maher, Antonietta Capotondi, and John O'Brien

El Niño Southern Oscillation (ENSO) shows large differences from one event to another in terms of its intensity, spatial pattern, and temporal evolution, which are typically referred to as “ENSO diversity”. While such differences in ENSO patterns are associated with different regional climate impacts throughout the world, influencing the skill of impact prediction systems, large uncertainties remain concerning its potential future evolution and trends. The location and intensity of ENSO events are indeed strongly influenced by internal/natural climate variations, limiting the detection of forced changes.

Here, we exploit the power of single model initial-condition large ensembles (SMILEs) from 13 fully coupled climate models from both CMIP5 and CMIP6 (totalling 580 realizations in historical and SSP-RCP scenarios) to first examine the ability of climate models to simulate realistic diversity of ENSO events compared to multiple observational datasets, and then use those models to characterize future trajectories in the location and intensity of El Niño and La Niña events. We define the location of ENSO events as the longitude of the absolute maximum (the intensity) of sea-surface temperature anomalies (SSTa) during boreal Winter (December-February) in the equatorial Pacific. Future projections of ENSO diversity are assessed in terms of joint probability distributions of ENSO events’ location and intensity.

While some models show a degree of diversity in the location and intensity of events that are comparable with observed statistics, other models tend to favour the occurrence of eastern or central Pacific events. Such contrasting performances during the historical period are found to be associated with different future trajectories of ENSO diversity: i) models favouring the occurrence of eastern Pacific events (e.g., ACCESS-ESM1-5, CanESM2, and 5) show a westward shift in event location over the 21st century; ii) models simulating ENSO events anomalously westward tend to show an eastward shift in event locations and an increased intensity in the 21st century (e.g., CESM1 and 2, CSIRO-MK3-6-0, GFDL-CM3, GFDL-ESM2M, MIROC-ES2L, MIROC6). Nevertheless, we note that models showing the closest match to observed statistics during the historical period also present a westward shift in ENSO locations and a slight increase in intensity in the 21st century (e.g., GFDL-SPEAR and IPSL-CM6-LR).

Although the physical cause of model discrepancies remains unclear, this study provides a broader perspective on expected ENSO changes over the 21st century in different models and highlights the spread of projections among models.

How to cite: Dieppois, B., Maher, N., Capotondi, A., and O'Brien, J.: The multiverse future of ENSO diversity in large ensembles of climate models, EGU General Assembly 2023, Vienna, Austria, 23–28 Apr 2023, EGU23-7791, https://doi.org/10.5194/egusphere-egu23-7791, 2023.

EGU23-8299 | ECS | Orals | CL2.2

Effect of Indian Ocean Dipole on ocean meridional heat transport depends on ENSO 

Kay McMonigal and Sarah Larson

Meridional heat transport within the Indian Ocean can drive climate and ecosystem impacts, by changing ocean temperature. Previous studies have linked variability in meridional heat transport to Indian Ocean Dipole (IOD) and El Niño-Southern Oscillation (ENSO). Recent studies have shown that some IOD events are caused by ENSO (termed “ENSO forced IOD”), while other events occur without ENSO (termed “internal IOD”). It is unclear whether these different kinds of IOD have different effects on the ocean. By comparing a climate model that includes ENSO to the same climate model but with ENSO dynamically removed, we show that internal IOD does not lead to variability in Indian Ocean meridional heat transport. However, ENSO forced IOD does lead to meridional heat transport variability. This is due to differing wind patterns associated with each kind of IOD event. These results suggest that the ecosystem and climate effects of IOD likely depend upon whether the IOD occurs with or without ENSO. 

How to cite: McMonigal, K. and Larson, S.: Effect of Indian Ocean Dipole on ocean meridional heat transport depends on ENSO, EGU General Assembly 2023, Vienna, Austria, 23–28 Apr 2023, EGU23-8299, https://doi.org/10.5194/egusphere-egu23-8299, 2023.

EGU23-8733 | ECS | Orals | CL2.2

Stochastic perturbations of El Nino Southern Oscillations (ENSO) : a Wiener chaos approach 

Yusuf Aydogdu, Peter Baxendale, and N. Sri Namachchivaya

The phenomena of El Nino Southern Oscillations (ENSO) is modeled by coupled atmosphere-ocean mechanism together with sea surface temperature (SST) budget at the equatorial Pacific and has a significant impact on the global climate.  We consider a modeling framework that was originally developed by Majda and co-workers in (Chen et al. 2018; Thual et al. 2016), which is physically consistent and amenable to detailed analysis. The coupled model is mainly governed by the equatorial atmospheric and oceanic Kelvin and Rossby waves and it is shown that stochastic forcing gives rise to the model anomalies and unpredictable behavior. The purpose of our work is to investigate the influence of randomness on the model dynamics,  construct the appropriate model components with stochastic noise and calculate the statistical properties. We also provide analytical and numerical solutions of the model to prove the convergence of the numerical scheme developed in our work. 

We use Wiener-Chaos Expansion (WCE) to study stochastic ENSO models. The WCE method is based on reducing stochastic partial differential equations (SPDEs) into an infinite hierarchy of deterministic PDEs called propagators-Fourier modes (Lototsky and Rozovsky, 2006) and represents the stochastic solution as a spectral decomposition of deterministic components with respect to a set of random Hermite bases. We solve the WCE propagators, which are forced by a set of complete orthonormal bases,  by applying numerical integration and finite-difference methods. We compare WCE-based results with Monte Carlo simulations of SPDEs.

Our results depict that the mean and variance of the solutions obtained from the WCE method provide remarkably accurate results with a reasonable convergence rate and error range.  We first test the WCE-based method on the ocean  model with white noise and show that 10-Fourier modes are able to approach the theoretical variance values. We also show that the OU process with a specific noise strength and dissipation over a one-time period can be recovered with less than 50-Fourier modes for the ENSO model.  To illustrate the particular weight of variance, we also generate the ensembles of solutions by using different stochastic bases. We also derive the analytical formulation of propagators for the coupled model with nonlinear SST by using the properties of Wick polynomials that construct the foundation of numerical schemes. 

How to cite: Aydogdu, Y., Baxendale, P., and Namachchivaya, N. S.: Stochastic perturbations of El Nino Southern Oscillations (ENSO) : a Wiener chaos approach, EGU General Assembly 2023, Vienna, Austria, 23–28 Apr 2023, EGU23-8733, https://doi.org/10.5194/egusphere-egu23-8733, 2023.

EGU23-8904 | Orals | CL2.2

Forecasting the El Niño type well before the spring predictability barrier 

Josef Ludescher, Armin Bunde, and Hans Joachim Schellnhuber

The El Niño Southern Oscillation (ENSO) is the most important driver of interannual global climate variability and can trigger extreme weather events and disasters in various parts of the globe. Depending on the region of maximal warming, El Niño events can be partitioned into 2 types, Eastern Pacific (EP) and Central Pacific (CP) events. The type of an El Niño has a major influence on its impact and can even lead to either dry or wet conditions in the same areas on the globe. Here we show that the zonal difference ΔTWP-CP between the sea surface temperature anomalies (SSTA) in the equatorial western Pacific and central Pacific is predictive of the type of an upcoming El Niño. When at the end of a calendar year, ΔTWP-CP is positive, an El Niño event developing in the following year will probably be an EP event, otherwise a CP event. Between 1950 and present, the index correctly indicates the type of 18 out of 21 El Niño events (p = 9.1⋅10-4).
For early actionable forecasts, the index has to be combined with a forecast for the actual onset of an El Niño event. The previously introduced climate network-based forecasting approach provides such forecasts for the onset of El Niño events also by the end of the calendar year before onset. Thus a combined approach can provide reliable forecasts for both the onset and the type of an event: at a lead time of about one year, 2/3 of the EP El Niño forecasts and all CP El Niño forecasts in the regarded period are correct. The combined model has considerably more predictive power than the current operational type forecasts with a mean lead time of about 1 month and should allow early mitigation measures.

How to cite: Ludescher, J., Bunde, A., and Schellnhuber, H. J.: Forecasting the El Niño type well before the spring predictability barrier, EGU General Assembly 2023, Vienna, Austria, 23–28 Apr 2023, EGU23-8904, https://doi.org/10.5194/egusphere-egu23-8904, 2023.

Since the early 1990s the Pacific Walker circulation has strengthened, while SSTs in the eastern equatorial Pacific became colder, which is opposite to future model projections. Whether these trends, evident in many climate indices especially before the 2015 El Niño, reflect the coupled ocean-atmosphere response to global warming or the negative phase of the Pacific Decadal Oscillation (PDO) remains debated. Here we show that sea surface temperature (SST) trends during 1980-2020 are dominated by three signals: a spatially uniform warming trend, a negative PDO pattern, and a Northern Hemisphere/Indo-West Pacific warming pattern. The latter pattern, which closely resembles the transient ocean thermostat-like response to global warming emerging in a subset of CMIP6 models, shows cooling in the central-eastern equatorial Pacific but warming in the western Pacific and tropical Indian ocean. Together with the PDO, this pattern drives the Walker circulation strengthening. CMIP6 historical simulations appear to underestimate this pattern, contributing to the models’ inability to replicate the Walker cell strengthening. We further discuss how such changes in the Walker circulation can effect ENSO.

Reference:  Heede, U. and A.V. Fedorov, 2023: Colder eastern equatorial Pacific and stronger Walker circulation in the early 21st century: separating the forced response to global warming from natural variability. In press, GRL

How to cite: Fedorov, A. and Heede, U.: Colder eastern equatorial Pacific and stronger Walker circulation in the early 21st century: an Indo-Pacific ocean thermostat  versus natural variability, EGU General Assembly 2023, Vienna, Austria, 23–28 Apr 2023, EGU23-10347, https://doi.org/10.5194/egusphere-egu23-10347, 2023.

EGU23-10801 | Orals | CL2.2 | Highlight

Causes and Consequences of the Prolonged 2020-2023 La Niña 

Michael J. McPhaden, Nahid Hasan, and Yoshimitsu Chikamoto

The tropical Pacific has witnessed three successive years of unusually cold sea surface temperatures, with peak anomalies in late 2020, 2021 and 2022.  These conditions represent the first "triple dip" La Niña of the 21st century with major climatic impacts felt around the world.  Three year La Niña events are rare but not unprecedented; similar events occurred in 1998-2001 and in 1973-76.  A leading hypothesis for multi-year La Niñas is that they occur on the rebound from preceding extreme El Niños which, through recharge oscillator dynamics, drain the equatorial band of upper ocean heat content leaving a large heat deficit that takes multiple years to recover. The current multi-year La Niña does not conform to this scenario--antecedent conditions in the tropical Pacific in 2019 were characterized by a borderline El Niño that did not lead to a large upper ocean heat content discharge. What caused the this La Niña is thus a topic of considerable interest.  In this presentation we hypothesize that tropical inter-basin interactions were instrumental in initiating and prolonging the event. In particular, we suggest that the event was triggered from the Indian Ocean by a record Indian Ocean Dipole in late 2019, then boosted in 2021 by unusually warm conditions in the tropical Atlantic involving the strongest Atlantic Niño since the 1970s. Whether climate change may have played a role in these developments will be discussed.

How to cite: McPhaden, M. J., Hasan, N., and Chikamoto, Y.: Causes and Consequences of the Prolonged 2020-2023 La Niña, EGU General Assembly 2023, Vienna, Austria, 23–28 Apr 2023, EGU23-10801, https://doi.org/10.5194/egusphere-egu23-10801, 2023.

EGU23-11500 | Orals | CL2.2

Representation of tropical SST trends in ECMWF seasonal hindcasts and implications for recent ENSO forecasts 

Michael Mayer, Magdalena Alonso Balmaseda, and Steffen Tietsche

Operational seasonal forecasts are routinely issued with their bias removed, which is estimated from hindcasts covering a sufficiently long period. An increased number of false alarms for the occurrence of El Nino by various dynamical forecasting systems in recent years challenges the view that forecast biases are stationary. Here we assess the ability of ECMWF’s operational seasonal prediction system SEAS5 to represent observed trends in tropical SSTs since 1993, with a focus on the Pacific.

SEAS5 hindcasts overestimate SST warming in the equatorial Pacific when compared to observations. Although present for all start dates, the trend error is most pronounced for May starts. As a result, SEAS5 forecasts in recent years tended to predict too warm ENSO states despite bias correction. The hindcasts also fail to reproduce the observed meridional dipole in SST trends in the eastern Pacific, with warming in the northern and cooling in the southern subtropics. We assess several numerical experiments to investigate the role of the evolving ocean observing system, the ocean data assimilation system, and the atmospheric model. Results show that the increase in Argo observations amplifies the spurious trends in the hindcasts, which points to biases in the ocean initial conditions when observational constraints are lacking prior to Argo. Furthermore, observed-SST experiments show that the atmospheric model is unable to reproduce the magnitude of increasingly northward winds that are observed in the eastern equatorial Pacific, which are associated with the meridional structure of observed SST trends and have been speculated to reduce ENSO variability. This suggests that shortcomings of the atmospheric model physics further contribute to the system’s inability to predict the recent triple La Nina period. The results call for more sophisticated calibration methods of seasonal forecasts and ultimately improved models and initialization to provide more reliable ENSO forecasts under varying background conditions.

How to cite: Mayer, M., Alonso Balmaseda, M., and Tietsche, S.: Representation of tropical SST trends in ECMWF seasonal hindcasts and implications for recent ENSO forecasts, EGU General Assembly 2023, Vienna, Austria, 23–28 Apr 2023, EGU23-11500, https://doi.org/10.5194/egusphere-egu23-11500, 2023.

There are large interannual variations in the area integral of the Pacific-wide annual-mean net surface heat fluxes within 5o of the equator. They are shown to be very well correlated (r2 = 0.75) with the zonal-mean, annual-mean, zonal component of the surface wind stress on the equator, both in UK-HadGEM3 coupled climate simulations and in the ERA5 wind-stress and DEEPC net surface heat flux re-analyses. For the model data the corresponding correlations are small for monthly means (r2 = 0.25) but are large (r2 > 0.6) for time-mean periods between 6 months and 10 years (the latter being calculated from 700 year pre-industrial control simulations). The amplitude of these annual mean fluctuations in the DEEPC net surface heat fluxes is almost twice as large as that in the UK-HadGEM3 simulations. Comparison of the area-mean fields in the Nino3 and Nino4 regions from 4 member ensembles of N216O025 historical simulations with the ERA5 winds, DEEPC heat fluxes and EN4 ocean re-analyses shows that the model’s mean values and seasonal cycle of the zonal wind stress and net surface heat flux agree well with the re-analyses. In the Nino3 region however the model’s surface temperature is 1.5oC colder than the re-analyses and the depth of the 20oC isotherm (t20d) is between 10 and 15 m shallower than that in EN4.  Comparison of the amplitudes of El Nino and La Nina composite anomalies in the Nino3 and Nino4 regions shows that the surface temperature anomalies are well simulated but that the amplitudes of the wind stress anomalies in Nino4 and the t20d anomalies and surface heat flux anomalies in Nino3 are about half those in ERA5, EN4 and DEEPC respectively. These findings are somewhat similar to those from the (lower resolution)  Kiel Climate Model. The characteristic spatial patterns of the surface fields might be used to attribute the differences between the model and re-analysis net surface fluxes to particular component fluxes (e.g. the surface latent heat flux and the surface solar flux). It is also a plausible hypothesis that the under-estimation of these variations in the net surface heat fluxes is a significant contributor to the signal-to-noise paradox.       


How to cite: Bell, M.: HadGEM3  underestimates interannual variations in heat fluxes, zonal winds and thermocline displacements  in the tropical Pacific, EGU General Assembly 2023, Vienna, Austria, 23–28 Apr 2023, EGU23-12824, https://doi.org/10.5194/egusphere-egu23-12824, 2023.

EGU23-13335 | ECS | Posters on site | CL2.2

Using Causal Discovery to Clarify Observed and Simulated Relationships Between ENSO and Other Ocean Basins 

Rebecca Herman and Jakob Runge

Observed sea-surface temperatures in various ocean basins are confounded by anthropogenic and natural radiative forcing and by teleconnections to modes of internal variability, especially the El Nino Southern Oscillation (ENSO). While confounding due to anthropogenic and natural forcing can be removed in coupled simulations, confounding due to ENSO is unavoidable. When not appropriately characterized and quantified, this confounding can obscure causal relationships between various ocean basins and atmospheric phenomena of huge humanitarian import, such as monsoon rainfall, with implications for attribution of past disasters and prediction of the future. These relationships have been difficult to characterize in part because observational data is limited and simulated data may not represent the observed climate system. This study uses causal discovery to examine the coupled relationships between ENSO and other ocean basins in simulations and observations. We begin by evaluating the (L)PCMCI(+) causal discovery algorithms under various conditions and assumptions on data generated by two continuous idealized models of ENSO: the classic Zebiak-Cane model and a simple stochastic dynamical model proposed by Thual, Majda, Chen, and Stechmann. We then apply the causal discovery algorithms to seasonally and spatially-averaged sea surface temperature (SST) indices for ENSO and other ocean basins in preindustrial control simulations from the Coupled Model Intercomparison Project Phase 6. We discuss the robustness of the results, and the differences between the causal relationships in different General Circulation Models. Finally, we apply the causal learning algorithm to observed SST, and discuss to what extent simulated relationships can be used to learn about the observed climate system. We additionally demonstrate the implications of this study for other scientific questions, specifically for understanding variability in Sahel Monsoon rainfall.

How to cite: Herman, R. and Runge, J.: Using Causal Discovery to Clarify Observed and Simulated Relationships Between ENSO and Other Ocean Basins, EGU General Assembly 2023, Vienna, Austria, 23–28 Apr 2023, EGU23-13335, https://doi.org/10.5194/egusphere-egu23-13335, 2023.

EGU23-13812 | ECS | Orals | CL2.2

ENSO–IOD Inter-Basin Connection Is Controlled by the Atlantic Multidecadal Oscillation 

Jiaqing Xue, Jing-Jia Luo, Wenjun Zhang, and Toshio Yamagata

The interactions between El Niño-Southern Oscillation (ENSO) and Indian Ocean Dipole (IOD) are known to have great implications for global climate variability and seasonal climate predictions. Observational analysis suggests that the ENSO–IOD inter-basin connection is time-varying and related to the Atlantic Multidecadal Oscillation (AMO) with weakened ENSO–IOD relationship corresponding to AMO warm phases. A suite of Atlantic pacemaker simulations successfully reproduces the decadal fluctuations in ENSO–IOD relationship and its link to the AMO. The warm sea surface temperature (SST) anomalies associated with the AMO drive a series of Indo-Pacific mean climate changes through tropical-wide teleconnections, including the La Niña-like mean SST cooling over the central Pacific and the deepening of mean thermocline depth in the eastern Indian Ocean. By modulating ocean–atmosphere feedback strength, those mean state changes decrease both ENSO amplitude and the Indian Ocean sensitivity to ENSO forcing, therefore decoupling the IOD from ENSO.

How to cite: Xue, J., Luo, J.-J., Zhang, W., and Yamagata, T.: ENSO–IOD Inter-Basin Connection Is Controlled by the Atlantic Multidecadal Oscillation, EGU General Assembly 2023, Vienna, Austria, 23–28 Apr 2023, EGU23-13812, https://doi.org/10.5194/egusphere-egu23-13812, 2023.

EGU23-15824 | ECS | Orals | CL2.2

Future Changes in the early winter ENSO teleconnections to the North Atlantic European region 

Muhammad Adnan Abid and Fred Kucharski

North Atlantic European (NAE) winter climate variability is strongly modulated through the stratospheric and tropospheric pathways, where El Niño-Southern Oscillation (ENSO) teleconnections play an important role. Recent studies showed intra-seasonal changes of the ENSO response in the NAE circulation anomalies from early to late winter.  One mechanism for this behavior is that the Indian Ocean (IO) dominate over the direct ENSO teleconnections in early winter favoring an in-phase North Atlantic Oscillation (NAO) response over NAE region. On the other hand, the direct ENSO response dominates in latter half of winter, where it projects onto the opposite phase of the NAO. In present study, we analyze the early to late winter ENSO-NAE teleconnections in future climate projections by adopting the sixth assessment report Coupled Model Intercomparison Project (CMIP6) model datasets. During early winter, we noted an increase in the ENSO-induced precipitation variability in the Pacific as well as over western and central Indian Ocean, while decrease is noted over the eastern IO. Moreover, a strengthening of the ENSO and Indian connections are noted in almost all models except few, where these connections are not well represented in the present climate. Interestingly, the changes in ENSO forced wave train are noted, which may lead to the negative NAO like circulation anomalies over the NAE region in future compared to the present climate. 

How to cite: Abid, M. A. and Kucharski, F.: Future Changes in the early winter ENSO teleconnections to the North Atlantic European region, EGU General Assembly 2023, Vienna, Austria, 23–28 Apr 2023, EGU23-15824, https://doi.org/10.5194/egusphere-egu23-15824, 2023.

EGU23-16921 | Orals | CL2.2

The role of spatial shifting in El Niño/Southern Oscillation complexity 

Sulian Thual and Boris Dewitte

The El Niño-Southern Oscillation (ENSO) represents the most consequential fluctuation of the global climate system, with dramatic societal and environmental impacts. Here we show that the spatial shifting movements of the Walker circulation control the ENSO space-time complexity in a major way. First, we encapsulate the process in a conventional recharge-discharge oscillator for the ENSO by replacing the regionally fixed sea surface temperatures (SST) index against a warm pool edge index. By doing so, we can model essential ingredients of ENSO diversity and nonlinear behavior without increasing the complexity of the dynamical model. Second, we propose a data-driven method for estimating equatorial Pacific SST variability resulting from spatial shifting. It consists in time-averaging conditions respective to the evolving warm pool edge position, then generating back SST data with reduced dimensionality (one degree of freedom) from the movements of the resulting "shifted-mean" profile. It is shown that the shifted-mean SST generated in this fashion reasonably reconstructs observed interannual SSTs both in terms of amplitude and pattern diversity. We discuss implications of the present paradigm of spatial shifting for understanding ENSO complexity, including tropical basins interactions.

How to cite: Thual, S. and Dewitte, B.: The role of spatial shifting in El Niño/Southern Oscillation complexity, EGU General Assembly 2023, Vienna, Austria, 23–28 Apr 2023, EGU23-16921, https://doi.org/10.5194/egusphere-egu23-16921, 2023.

Over the past decades, global warming has led to a lengthening of the time window during which temperatures remain favorable for carbon assimilation and tree growth, resulting in a lengthening of the green season. The extent to which forest green seasons have tracked the lengthening of this favorable period under climate warming, however, has not been quantified to date. Here, we used remote sensing data and long-term ground observations of leaf-out and coloration for six dominant species of European trees at 1773 sites, for a total of 6060 species-site combinations, during 1980-2016 and found that actual green season extensions (GS: 3.1 ± 0.1 d decade-1) lag four times behind extensions of the potential thermal season (TS: 12.6 ± 0.1 d decade-1). Similar but less pronounced differences were obtained using satellite-derived vegetation phenology observations, i.e., a lengthening of 4.4 ± 0.13 d decade-1 and 7.5 ± 0.13 d decade-1 for GS and TS, respectively. This difference was mainly driven by the larger advance in the onset of the thermal season compared to the actual advance of leaf-out dates (spring mismatch: 7.2 ± 0.1 d decade-1), but to a less extents caused by a phenological mismatch between GS and TS in autumn (2.4 ± 0.1 d decade-1). Our results showed that forest trees do not linearly track the new thermal window extension, indicating more complex interactions between winter and spring temperatures and photoperiod and a justification of demonstrating that using more sophisticated models that include the influence of chilling and photoperiod are needed to accurately predict spring phenological changes under warmer climate. They urge caution if such mechanisms are omitted to predict, for example, how vegetative health and growth, species distribution, and crop yields will change in the future.

How to cite: Fu, Y. H. and Chen, S.: Global warming is increasing the discrepancy between green (actual) and thermal (potential) seasons of temperate trees, EGU General Assembly 2023, Vienna, Austria, 23–28 Apr 2023, EGU23-1433, https://doi.org/10.5194/egusphere-egu23-1433, 2023.

EGU23-1743 | ECS | Orals | CL2.3

Spatial differences in the response of Ginkgo spring leaf phenology to climate change 

Zhaofei Wu, Yongshuo Fu, and Constantin Zohner

Climate change-induced spring phenological shifts exert significant effects on terrestrial carbon, water and nutrient cycles as well as the climate system. Spring leaf-out of temperate trees is triggered by a combination of winter chilling, spring temperature and photoperiod. Yet, the effects of these cues along elevation and latitude remain poorly understood due to the lack of experiments. Here we test for elevational and latitudinal differences in the responses of spring leaf phenology to climate by conducting a manipulative experiment with four temperature (5, 10, 15, and 20 °C) and two photoperiod (8 and 16 h) treatments, using twigs from mature Ginkgo trees at two latitudes in China (39° 54′ N and 30°19′ N) and three elevations at the low latitude site (344, 826, 1098 m). We found that the responsiveness of leaf unfolding to temperature and photoperiod decreases with increasing elevation. Specifically, the temperature sensitivity of leaf unfolding (defined as the leaf-out advance per degree warming, ST) was higher (4.17 days °C−1) and the photoperiod effect on ST was larger (decrease of 1.15 days °C−1) at the lowest elevation than at the highest elevation (ST = 3.26 days °C−1; decrease of 0.48 days °C−1). This may be related to adaptation to local environments and self-protection mechanisms of trees at high elevations to avoid frost damage. In addition, we found that photoperiod only affected leaf unfolding at low latitudes, with long (16-h) days advancing leaf unfolding in low-latitude individuals by, on average, 8.1 days relative to short (8-h) days. Field phenological observations supported the experimental results. Our results suggest that, for a given species, populations growing under different climate conditions may exhibit different phenological responses to climate change, with individuals in warmer regions likely becoming increasingly limited by photoperiod as the climate warms further. We thus provide empirical evidence of spatial differences in the relative effects of spring temperature and photoperiod on spring leaf phenology, which is not yet accounted for in models of spring phenology.

How to cite: Wu, Z., Fu, Y., and Zohner, C.: Spatial differences in the response of Ginkgo spring leaf phenology to climate change, EGU General Assembly 2023, Vienna, Austria, 23–28 Apr 2023, EGU23-1743, https://doi.org/10.5194/egusphere-egu23-1743, 2023.

EGU23-1924 | ECS | Posters on site | CL2.3 | Highlight

Testing the relative importance of the various environmental triggers of spring leaf-out 

Constantin Zohner

The timing of spring leaf-out in temperate and boreal trees greatly affects ecosystem functioning and global biogeochemical cycles. Yet, spring phenological responses to climate change remain uncertain due to the complex, interacting effects of environmental triggers. While spring temperature, winter chilling and day length have traditionally been accepted as the main drivers of spring phenology, recent research suggests that additional factors, such as solar radiation and air humidity in spring and leaf-out timing and temperatures in the preceding year, play an important role, too, further complicating predictions of spring phenology. Here, I test for the relative importance of each driver using ground-sourced and satellite-derived phenology observations from the Northern Hemisphere. The results show that, consistent with the ongoing advances in spring leaf-out, spring temperature remains the dominant driver of spring phenology across the vast majority of temperate and boreal forests. By contrast, winter temperatures played only a minor role, suggesting that, despite generally warmer winters, trees’ chilling requirements are mostly met. After controlling for spring climate and temporal autocorrelation in the data, spring phenology and climate of the preceding year did not affect leaf-out timing, contradicting recent observational studies. Overall, the strong and consistent effect of spring temperature predicts that the arrival of spring will continue to advance in the future, with multiple cascading effects on species interactions, forest productivity and other ecosystem functions.

How to cite: Zohner, C.: Testing the relative importance of the various environmental triggers of spring leaf-out, EGU General Assembly 2023, Vienna, Austria, 23–28 Apr 2023, EGU23-1924, https://doi.org/10.5194/egusphere-egu23-1924, 2023.

EGU23-2045 | Orals | CL2.3

Divergent leaf phenology trends between boreal and temperate species in the Acadian Forest Region 

Lynsay Spafford, Andrew H. MacDougall, and James Steenberg

The Acadian Forest Region is a temperate-boreal transitional zone in eastern North America. Therein, both forest types are vulnerable to environmental changes due to their proximity to biogeographical range limits. Using four growing seasons of phenocam-derived leaf phenology observations for the species Acer rubrum, Betula papyrifera, and Abies balsamea from across the Acadian Phenocam Network as well as multiple growing season observations from the North American PhenoCam Network we parameterized eight leaf emergence and six leaf senescence models for each species which together span a range in process and driver representation. With climate models from the Fifth Phase of the Coupled Model Intercomparison Project (CMIP5) we simulated future patterns in leaf emergence, senescence, and season length (senescence minus emergence) for these species at sites within the Acadian Phenocam Network. Model performances were similar across models. By the late 21st century, leaf emergence could be about two to three weeks earlier for both boreal and temperate species. The timing of leaf senescence may become continuously delayed for boreal species like Betula papyrifera and Abies balsamea, though remain relatively constant for temperate species like Acer rubrum. This has important implications for carbon uptake, nutrient resorption, ecology, and ecotourism for the Acadian Forest Region. Phenocams have the potential to rapidly advance process-based model development and predictions of leaf phenology in the context of climate change.

How to cite: Spafford, L., MacDougall, A. H., and Steenberg, J.: Divergent leaf phenology trends between boreal and temperate species in the Acadian Forest Region, EGU General Assembly 2023, Vienna, Austria, 23–28 Apr 2023, EGU23-2045, https://doi.org/10.5194/egusphere-egu23-2045, 2023.

EGU23-2988 | Posters on site | CL2.3

Four Decades of Trends in Snowmelt and Greenup over High-latitude Terrestrial Ecosystems 

JiHyun Kim and Yeonjoo Kim

The ongoing climate change has primarily affected snowmelt and greenup timings, which are the two crucial regulators for every component of biogeochemical cycles of the terrestrial ecosystems in high-latitude regions. Previous studies, using various datasets at different regional scales, have focused on either trend, therefore not thoroughly analyzing relative long-term changes in both timings over the entire high-latitudes. In this study, we assessed the four decades (1982-2021) of trends in those two timings for the regions (latitude > 45°N). First, we used Google Earth Engine to derive snowmelt and greenup timings based on normalized indices (i.e., normalized difference snow index and normalized difference vegetation index) that were retrieved from the surface reflectance of Advanced Very High Resolution Radiometer (AVHRR, daily at 0.05°) from National Oceanic and Atmospheric Administration (NOAA) Climate Data Record (CDR). Then, we evaluated those timings against various ground datasets and remote sensing-based estimates, such as PhenoCam, PEP725, SNOTEL, and MODIS. Finally, we investigated the meteorological and geographical effects on the long-term trends of the two timings across the high-latitude regions. Our results imply that the increases in the spatial heterogeneity on snow-free days may considerably alter the spatiotemporal pattern of the vegetation growth and, therefore, the relevant carbon cycle across the high-latitudes.

This study is supported by the National Research Foundation of Korea (NRF) grants funded by the Korea government (MSIT) (2020R1A2C2007670, 2020R1C1C1014886 and 2022R1C1C2009543).

How to cite: Kim, J. and Kim, Y.: Four Decades of Trends in Snowmelt and Greenup over High-latitude Terrestrial Ecosystems, EGU General Assembly 2023, Vienna, Austria, 23–28 Apr 2023, EGU23-2988, https://doi.org/10.5194/egusphere-egu23-2988, 2023.

EGU23-4224 | ECS | Posters on site | CL2.3

Evaluating the capacity of PlanetScope satellites for fine-scale phenology monitoring across temperate forests in eastern North America 

Yingyi Zhao, Calvin K.F. Lee, Zhihui Wang, Jing Wang, Yating Gu, Jing Xie, Ying Ki Law, Guangqin Song, Timothy C. Bonebrake, Xi Yang, Bruce W. Nelson, and Jin Wu

In temperate forests, leaf phenology – the study of the timing of periodic and recurring events in leaves – is a sensitive indicator of climate change and a main regulator of carbon and water cycling. Many studies have evidenced large intra-site leaf phenology variability across individual trees. However, monitoring individual tree-scale leaf phenology with conventional approaches (e.g., field observations and phenoCam observations) is often restricted to a small spatial extent and sample size. The availability of PlanetScope data with high spatial and temporal resolution offer opportunities to overcome this limitation, but comprehensive assessments of its capacity for individual tree-scale phenology monitoring is lacking. To fill this knowledge gap, we proposed a method that integrates 0.1 m resolution airborne imagery and ground phenology records of individual trees with time-series PlanetScope observations to monitor fine-scale phenology. We tested this method at six NEON forest sites in eastern North America. Our results show that PlanetScope-derived land surface phenology is able to 1) characterize significant individual tree-scale leaf phenology variability across different forest sites and years, with r ranging from 0.21 to 0.42 when comparing PlanetScope-derived phenological metrics with their ground correspondences at the individual tree scale. The relationship between PlanetScope-derived phenology and ground phenology observations is stronger at the species level (r=0.57-0.82) when more PlanetScope pixels are included; and 2) capture more variability in fall phenology but also with larger uncertainties (e.g., r=0.82 and RMSE=2.14; species level) compared with spring phenology (r=0.76 and RMSE=0.72). Additionally, when comparing with ground methods, PlanetScope satellites are also advantageous for providing spatially explicit information across large spatial coverages. These findings collectively demonstrate that PlanetScope data displays the capacity for fine-scale leaf phenology monitoring, and it also has the potential to provide rich fine-scale phenology information to advance the field of plant phenology research.

How to cite: Zhao, Y., Lee, C. K. F., Wang, Z., Wang, J., Gu, Y., Xie, J., Law, Y. K., Song, G., Bonebrake, T. C., Yang, X., Nelson, B. W., and Wu, J.: Evaluating the capacity of PlanetScope satellites for fine-scale phenology monitoring across temperate forests in eastern North America, EGU General Assembly 2023, Vienna, Austria, 23–28 Apr 2023, EGU23-4224, https://doi.org/10.5194/egusphere-egu23-4224, 2023.

EGU23-4616 | ECS | Orals | CL2.3

The underappreciated importance of solar radiation in constraining spring phenology of temperate ecosystems in the Northern and Eastern United States 

Yating Gu, Yingyi Zhao, Zhengfei Guo, Lin Meng, Kun Zhang, Jing Wang, Calvin K.F. Lee, Jing Xie, Yantian Wang, Zhengbing Yan, He Zhang, and Jin Wu

Spring phenology of temperate ecosystems displays high sensitivity to the recent climate change, and has generated various impacts on plant growth, biotic interactions, ecosystem productivity, and local environmental conditions. Although various prognostic models relying on environmental variables, mainly including temperature and photoperiod, have been developed for spring phenology, comprehensive ecosystem-scale evaluations over large geographical extents and long-time periods remain lacking.  Further, environmental variables other than temperature and photoperiod might also importantly constrain spring phenology modelling but remain under-investigation. To address these issues, we leveraged 20-years datasets of environmental variables (Daymet) and the spring phenology metric (i.e., the greenup date) respectively derived from MODIS and PhenoCams across 108 sites in the Northern and Eastern United States. We firstly cross-compared MODIS-derived greenup date with PhenoCams with high accuracy (R2=0.75). Then, we evaluated the three prognostic models (e.g., Growing Degree Date (GDD), Sequential (SEQ) and optimality-based (OPT)) with MODIS-derived spring phenology, assessed the model residuals and their associations with soil moisture, rainfall, and solar radiation, and improved and re-evaluated the models by including the variable contributing to high model residuals. We found that 1) all models demonstrated good capability in characterizing spring phenology, with OPT performing the best (RMSE=8.04±5.05 days), followed by SEQ (RMSE=10.57±7.77 days) and GDD (RMSE=10.84±8.42 days), 2) all models displayed high model residuals showing tight correlation with solar radiation (r=0.45-0.75), and 3) the revised models that included solar radiation significantly performed better with an RMSE reduction by 22.08%. Such results are likely because solar radiation better constrains early growing season plant photosynthesis than photoperiod, supporting the hypothesis of spring phenology as an adaptive strategy to maximize photosynthetic carbon gain (approximated by solar radiation) while minimizing frost damage risk (captured by temperature). Collectively, our study reveals the underappreciated importance of solar radiation in constraining spring phenology of temperate ecosystems, and suggests ways to improve spring phenology modelling and other phenology-related ecological processes.

How to cite: Gu, Y., Zhao, Y., Guo, Z., Meng, L., Zhang, K., Wang, J., Lee, C. K. F., Xie, J., Wang, Y., Yan, Z., Zhang, H., and Wu, J.: The underappreciated importance of solar radiation in constraining spring phenology of temperate ecosystems in the Northern and Eastern United States, EGU General Assembly 2023, Vienna, Austria, 23–28 Apr 2023, EGU23-4616, https://doi.org/10.5194/egusphere-egu23-4616, 2023.

EGU23-5743 | ECS | Orals | CL2.3

Elevation-dependent advance of Alpine plant phenology 

Michael Zehnder, Beat Pfund, Jake Alexander, Janneke Hille Ris Lambers, and Christian Rixen

Global warming causes increased temperatures and a reduction of snow cover in the European Alps. These rapid environmental changes are more pronounced at higher elevations due to a phenomenon called elevation-dependent warming. As a consequence, alpine plant communities are undergoing severe changes in spring phenology and elevational range shifts. However, long-term in-situ monitoring in these fast-changing ecosystems is scarce and time-consuming. Here, we investigate trends of Alpine plant growth, and phenological shifts over the past 25 years (1998 –2022) using ultrasonic plant height measurements from 32 automatic weather stations from 1500 to 2700 m. Our analysis revealed increased Alpine plant growth and advancing phenology over the past 25 years. At higher elevations, the start and peak of growing season happened approximately one month earlier in 2022 compared to 1998. Yet, this effect was not present at lower elevations, indicating strong patterns of elevation-dependency. The observed changes are more pronounced than previously forecasted and are reflecting findings from remote-sensing studies in other mountain ranges. This study provides compelling evidence of the radical impact of climate change on Alpine vegetation phenology based on a unique long-term measurement series.

How to cite: Zehnder, M., Pfund, B., Alexander, J., Hille Ris Lambers, J., and Rixen, C.: Elevation-dependent advance of Alpine plant phenology, EGU General Assembly 2023, Vienna, Austria, 23–28 Apr 2023, EGU23-5743, https://doi.org/10.5194/egusphere-egu23-5743, 2023.

EGU23-6899 | Posters on site | CL2.3

Genetic analysis of fruit trees and cereals observed in the Phenological Network of Catalonia (Fenocat) 

Montserrat Busto, Jordi Cunillera, and Xavier de Yzaguirre

The Phenological Network of Catalonia is a citizen science organization formed by 60 observers who constantly monitor 25 plants (wild and cultivated species), 14 birds and 6 butterflies. The first event of the phenophases related to plant species is submitted annually to the Pan-European Phenological Database, PEP725.

Since we were unaware of most of the varieties observed, we launched a project to improve the information on the varieties of cultivated plant species and improve the quality of the data sent to PEP725. Besides, this genetic analysis of fruit trees would help us to discriminate those early blooming varieties from the late ones; knowing if a fruit tree variety is early or late allows us to discriminate the phenological behavior due to environmental answer from the genetic predisposition to an early or late bloom.

The Meteorological Service of Catalonia has a collaboration agreement with the Institute of Agrifood Research and Technology (IRTA), which is related to the Center for Research in Agricultural Genomics (CRAG). We have developed a project to know the varieties of the 135 fruit and cereal samples of cultivated species observed in the Fenocat network through genetic analyzes conducted by the CRAG.

To carry out this project, we designed a system so that the observer himself could take the vegetal sample from the observed vegetal individual and send it directly to the CRAG laboratory in the shortest possible time in order to avoid sample damage due to the delay.

The CRAG laboratory analyzed the DNA of each sample and studied the genetic markers. With this, it has been possible to establish the similarity matrix of the samples analyzed with those of the IRTA database.

We have been able to find out the variety of the cultivated plant samples in some cases, while in other ones no identical result to any known variety has been found -only the degree of similarity to a specific variety has been determined-.

How to cite: Busto, M., Cunillera, J., and de Yzaguirre, X.: Genetic analysis of fruit trees and cereals observed in the Phenological Network of Catalonia (Fenocat), EGU General Assembly 2023, Vienna, Austria, 23–28 Apr 2023, EGU23-6899, https://doi.org/10.5194/egusphere-egu23-6899, 2023.

EGU23-8348 | Posters on site | CL2.3

PEP725, the European phenological database 

Helfried Scheifinger, Hans Ressl, Thomas Hübner, and Markus Ungersböck

“Phenology – the timing of seasonal activities of animals and plants – is perhaps the simplest process in which to track changes in the ecology of species in response to climate change” (IPCC 2007). PEP725, the Pan-European Phenological Database, is thought as a European research infrastructure to promote and facilitate phenological research. Its main objective is to build up and maintain a European-wide phenological database with an open, unrestricted data access for science, research and education. So far, 20 European meteorological services and 6 partners from different phenological network operators have joined PEP725. The PEP725 phenological data base (www.pep725.eu) now offers close to 13 million phenological observations, essentially starting with 1951, comprising more than 200 species and 69 growing stages based on the BBCH scale. The data base grows with about 100000 additional observations per year. Having accepted the PEP725 data policy and finished the registration, the data can be downloaded according to various criteria, e.g. by a specific plant or all data from one country.

To date (January 2023) we could count at least 115 peer - reviewed publications based on the PEP725, 17 of them published in Nature and one in Science. It appears that new avenues are entered in plant phenological research. Since remote sensing technology has been making big leaps forward with improved instruments and increasing resolution, Land Surface Phenology (LSP) is exploring its capabilities, especially experimenting with new and improved methods to correlate LSP with Ground Phenology (GP). A small but very active community continues to produce high quality research on plant physiological mechanisms and their relation with the atmospheric environment. Prominent appears the increase in the number of atmospheric variables, which have been related with plant phenology, for instance atmospheric brightening, light pollution, humidity, wind, day-time versus night-time trends. Strong interdisciplinarity combined with an increasing range of topics characterise the recent developments in phenological research. Just to cite a few: phenology in a future climate, agrometeorological questions, the role of plant energy budget, climate warming and fruit phenology, winter warming versus spring phenology, drought effects on phenology, carbon cycle, temperature sensitivity of various phenological phases and many more.

Download statistics and the rapidly growing number of PEP725 based publications demonstrate the great demand and potential of the PEP725 phenological data set, which urgently needs development including a facilitated access, gridded versions and near real time products to attract a greater range of users.

Finally, we would invite all, who have already used PEP725, to give us feedback!!! (markus.ungersboeck@geosphere.at; helfried.scheifinger@geosphere.at)

Reference: Intergovernmental Panel on Climate Change (IPCC). 2007. Climate Change 2007: Impacts, Adaptation, and Vulnerability. Contribution of Working Group II to the Fourth Assessment Report of the Intergovernmental Panel on Climate Change. Cambridge University Press, Cambridge, UK.

How to cite: Scheifinger, H., Ressl, H., Hübner, T., and Ungersböck, M.: PEP725, the European phenological database, EGU General Assembly 2023, Vienna, Austria, 23–28 Apr 2023, EGU23-8348, https://doi.org/10.5194/egusphere-egu23-8348, 2023.

EGU23-8536 | ECS | Posters on site | CL2.3

Remote Sensing Vegetation Indices to study migratory insect seasonal movements and population outbreaks. 

Roger López Mañas, Joan Pere Pascual Díaz, Clément P. Bataille, Cristina Domingo Marimon, and Gerard Talavera

Dispersal and migratory movements of phytophagous insects are strongly tight to vegetation phenology. The succeeding broods of seasonally migrating species connect distant regions that differ in the timing of plant growth. Also, the overall plant production and the extent of the growing season determine the breeding capacity of the insects, and thus influence their demographic trends. The use of photosynthetic activity proxies based on remote sensing observations, such as NDVI or EVI, opens new avenues to study migratory patterns of insects, a largely understudied field. Here, we present two applications of NDVI to study the migration of the Painted Lady butterfly, Vanessa cardui, an obligate migratory species with a large migratory range encompassing the Palaearctic and the Afrotropics.

We develop a spatio-temporal Species Distribution Model (SDM) to determine monthly suitable areas for reproduction across its migratory range. We use a comprehensive dataset of V. cardui breeding occurrences and time-series of climatic and vegetation growth variables, including EVI and monthly difference (EVI change). Vegetation indexes proved to be relevant variables explaining V. cardui breeding suitability, having higher importance in the Afrotropical region. Moderate EVI values showed best conditions for breeding. EVI change had a better fit with slight increases of vegetation growth, discarding sharp changes in greening. These patterns agree with the phenology of V. cardui herbaceous hostplants in the growing season, distributed in open-areas such as meadows, weeds and bushland. In the temperate zone, vegetation growth was not a limiting factor and suitability was mostly explained by variables related to temperature.

At a temporal scale, we assess the role that anomalies in photosynthetic activity might have in modulating demographic trends of V. cardui. We performed a pixel-based time-series analysis of monthly NDVI values from 2000 to 2022. We observe that four demographic outbreaks of the butterfly observed in Europe are immediately preceded by anomalous vegetation growth events in suitable breeding regions in Africa and/or the Middle East, suggesting a strong association between both events. We investigate in higher detail the largest of the outbreak episodes in 2019. The resulting maps of anomalies showed high signal in regions of the Middle East from December 2018 to May 2019. The highest anomalies were detected in rocky deserts and arid and semi-arid shrublands, while sand deserts were not affected. The large extent found with exceptional greening could have functioned as massive breeding grounds for V. cardui. This hypothesis strongly matches massive citizen science data of V. cardui observations that were first observed in the Arabian Peninsula in March, and that further spread all over Europe in unprecedented numbers.

Taken together, we highlight the potential of remote-sensing vegetation indices to study seasonal migratory movements of phytophagous insects. We show how NDVI can inform models about the potential shifting distributions of migratory species, and how NDVI anomalies can be used to predict potential population outbreaks. In a world where insects represent the majority of terrestrial diversity, the use of vegetation indices may become standard in the fields of insect movement ecology and population dynamics.

How to cite: López Mañas, R., Pascual Díaz, J. P., P. Bataille, C., Domingo Marimon, C., and Talavera, G.: Remote Sensing Vegetation Indices to study migratory insect seasonal movements and population outbreaks., EGU General Assembly 2023, Vienna, Austria, 23–28 Apr 2023, EGU23-8536, https://doi.org/10.5194/egusphere-egu23-8536, 2023.

Land surface phenology (LSP) has been increasingly retrieved from satellite observations over past two decades. It plays an important role in understanding atmosphere-vegetation carbon and energy exchanges. Although LSP has been frequently compared with in-situ observations in a simple way, their difference and comparability are poorly understood. We in this study investigated the scalability, consistency, and representativeness of in-situ observations of species-specific phenology from national phenology networks and PhenoCam networks and compared them with LSP from Visible Infrared Imaging Radiometer Suite (VIIRS) at 500m pixels. Specifically, we investigated four methods (mean, median, 30th percentile, and minimum bias) to upscale in-situ observations collected from the Pan European Phenological database (PEP725, 9664 site-years) and the USA National Phenology Network (USA-NPN, 3144 site-years) spanning 2013–2020. The up-scaled in-situ observations were compared with the VIIRS LSP to address the optimal method of upscaling. The comparison differences were analyzed by associating with land cover and land surface heterogeneity to reveal the fundamental impact factors. Further, interannual variations and long-term trends in the species-specific phenological timing in the PEP725 and USA-NPN observations were correlated to VIIRS LSP, which was to expose the similarity of phenological variations under the same or similar weather conditions. Moreover, the daily variations in species-specific plant development were extracted from PhenoCam observations in the USA. The daily PhenoCam observations were fused with temporal trajectories obtained from harmonized Landsat and Sentienal-2 (HLS) at 30m pixels, which bridged field observations with satellite time series. The fused HLS-PhenoCam time series were applied to identify the phenometrics at 30m pixels, which were then linked to VIIRS LSP. Finally, we discussed the scalability and comparability of in-situ phenology observations to the LPS from moderate satellite pixels.


How to cite: Zhang, X., Ye, Y., and Tran, K.: Discrepancy and linkage of Satellite-derived Land Surface Phenology with in-situ Observations from National Phenology Networks and PhenoCam Networks, EGU General Assembly 2023, Vienna, Austria, 23–28 Apr 2023, EGU23-9227, https://doi.org/10.5194/egusphere-egu23-9227, 2023.

EGU23-11233 | Posters on site | CL2.3

Phenology and competitiveness of three temperate tree species in the juvenile stage under warmer springs and drier summers 

Manuel Gabriel Walde, Barbara Moser, and Yann Vitasse

Vegetation period of temperate tree species was projected to lengthen with climate warming by both advancing leaf-out during spring and delaying leaf senescence during autumn. However, this longer vegetation period does not necessarily translate into higher growth and carbon sequestration due to the increase in adverse weather conditions (e.g., severe drought) that occur during the growing season. Further, it remains unclear how species mixing might help benefit from a longer season and cope with extreme droughts compared to monocultures, i.e., whether diverse ecosystems are more resilient than monocultures. To tackle these questions, we set up experimental mesocosms using saplings from three species (i.e., Fagus sylvatica, Quercus petraea and Tilia cordata) grown either as monocultures or mixtures of two species. Each experimental unit was exposed to either (i) increased spring temperatures using a passive warming method, (ii) reduced precipitation (~ 50%) using rain shelters all year along, (iii) a combination of the two first treatments, or (iv) ambient conditions.

In spring 2022 we observed significantly earlier leaf-out of Quercus compared to Fagus and Tilia at ambient conditions and advanced leaf-out by about 4 days for all species when exposed to the passive warming treatment. In autumn 2022 we observed 50% senescence of Tilia several weeks before Fagus and Quercus at ambient conditions. Advanced leaf-out due to increased spring temperature and drought exposure did not affect senescence of any species growing in monocultures. However, the presence of Tilia in the same experimental unit delayed senescence of Fagus by 4 days and senescence of Quercus by 5 days, whereas neither species changed senescence when growing in Fagus-Quercus mixtures compared to growing in monocultures. A potential explanation could be the competition release for water and nutrients due to Tilia’s much earlier senescence. Although we expected saplings with earlier leaf-out to grow stronger and saplings exposed to drought to grow less, height increment of neither species was affected by any treatment.

How to cite: Walde, M. G., Moser, B., and Vitasse, Y.: Phenology and competitiveness of three temperate tree species in the juvenile stage under warmer springs and drier summers, EGU General Assembly 2023, Vienna, Austria, 23–28 Apr 2023, EGU23-11233, https://doi.org/10.5194/egusphere-egu23-11233, 2023.

EGU23-11562 | ECS | Posters on site | CL2.3

Flowering dynamics of nectar and pollen sources in Hungary based on Sentinel-2 satellite data 

Csilla Vincze, Ádám Leelőssy, Ferenc Vincze, and Róbert Mészáros

Knowledge of the phenological dynamics of various flowering plants is important for food supply and essential for analysing and modelling adaption of pollinators, especially the honey bees, Apis melifera. The increased frequency of extreme events associated with climate change has resulted in new challenges for farmers as well as beekeepers, and has made research on this issue a priority for adaptation planning. Satellite products can be used for phenological monitoring and detection with good spatial coverage providing valuable information for agriculture and beekeeping. In this study, we investigated the flowering period and dynamics of the two most important honey crops in Hungary, Sunflower (Helianthus annuus L.) and Oil Seed Rape (Brassica napus L.). To generate flowering time series data from Sentinel-2 we used the MSIL2A product in 20-meter resolution, which contains 10 spectral bands with 5 days revisit days. This product also contains additions mapping data helping the classification of the studied area. The research has been created using the Ecosystem Map of Hungary, which also a 20-meter-resolution map helping us to describe the agricultural land developed in 2020. To find the honey producing crops, we used machine learning applications for classification of the arable lands and these desired parcels. Subsequently, flowering timeline was estimated from NDVI and NDYI fields obtained from Sentinel-2 satellite data. Hive weight time series was measured locally with automatic hive scales during the flowering seasons of 2021-2022. The scales grants the apiarists supplementary information like weight in a 10-minute interval. This provide essential information about the health and productivity of the colony and enables information to be gathered before winter season or swarming events. We examined the results of the satellite data against the hive weight data during the honey collecting period and investigated with the actual meteorological conditions to determine a multiplex relationship between the parameters. A method is presented to apply local honey collection data to evaluate and downscale satellite-based phenological estimates for applications in beekeeping.

How to cite: Vincze, C., Leelőssy, Á., Vincze, F., and Mészáros, R.: Flowering dynamics of nectar and pollen sources in Hungary based on Sentinel-2 satellite data, EGU General Assembly 2023, Vienna, Austria, 23–28 Apr 2023, EGU23-11562, https://doi.org/10.5194/egusphere-egu23-11562, 2023.

EGU23-12473 | ECS | Orals | CL2.3

Extended duration of the budburst period under future climate warming: insights from a model 

Jianhong Lin, Daniel Berveiller, Christophe François, Heikki Hänninen, Alexandre Morfin, Gaëlle Vincent, Cyrille Rathgeber, Rui Zhang, and Nicolas Delpierre

Spring phenology is a key indicator of the terrestrial ecosystems’ response to climate change. However, most phenological studies only focus on the analysis of the average date of a particular phenological event in tree populations, and largely overlook the variability of this date within the populations, resulting in large uncertainties in projecting phenological change and the stability of community under ongoing climate warming. Here, we constructed a model able to simulate the within-population variability (WPV) of budburst dates in tree populations using budburst data observed from 2000 to 2021, and we used the model to evaluate the response of WPV to climate warming in five temperate deciduous tree species (Carpinus betulus, Quercus petraea, Fraxinus excelsior, Fagus sylvatica and Castanea sativa). The WPV model received support for all five species, with a RMSE of 8.6 ± 2.9 days over validation data, which is near the observation resolution. Retrospective simulations using past climate suggested that the beginning (i.e., date at which 20 % trees burst their buds, BP20) and end (i.e., date at which 80 % trees burst their buds, BP80) of budburst in the population advanced over 1961-2021 of 1.3 ± 0.4 days decade-1 and 1.4 ± 0.4 days decade -1, as a consequence of climate warming. However, the duration of the budburst period (DurBB, time interval between BP20 and BP80) did not change significantly. Using three climate models, we found BP20 and BP80 to occur later by 3.1 ± 1.3 days decade-1 and 3.8 ± 1.5 days decade-1 in populations of Quercus, Fraxinus and Carpinus along the 21st century, which was caused by insufficient chilling accumulation, contrasting with a continuous trend towards earlier budburst by 0.9 ± 0.6 days decade-1 and 0.5 ± 0.7 days decade-1 in Fagus and Castanea. Importantly, the duration of the budburst period (DurBB) in the population was projected to increase in the future, especially for Quercus and Fraxinus, due to a stronger temperature sensitivity of the end of budburst in the population. Furthermore, our model suggests modifications at the community scale, with shifts in the budburst sequence for some species. Our work provides a novel model, simulating the continuity of budburst in tree populations in spring. This phenological model can be adapted to the study of other stages of the tree phenological cycle, which are all of continuous nature in tree populations (e.g., leaf senescence, wood formation etc.). Furthermore, based on this approach, our study projects a delayed, and extended duration of budburst in the population under climate warming for two out of the five species investigated. If confirmed in natura, these differential changes in budburst duration could influence the competition among species in forest communities.

How to cite: Lin, J., Berveiller, D., François, C., Hänninen, H., Morfin, A., Vincent, G., Rathgeber, C., Zhang, R., and Delpierre, N.: Extended duration of the budburst period under future climate warming: insights from a model, EGU General Assembly 2023, Vienna, Austria, 23–28 Apr 2023, EGU23-12473, https://doi.org/10.5194/egusphere-egu23-12473, 2023.

EGU23-13011 | Posters on site | CL2.3 | Highlight

Monitoring phenology as part of university education 

Lenka Bartošová, Petra Dížková, Milan Fischer, Filip Sedláček, Miroslav Trnka, and Zdeněk Žalud

Systematic and regular monitoring phenology over a larger area is often based on cooperation with volunteers or workers who monitor the onset of phenophases and are thus part of phenological societies or national phenological networks. As part of our work and teaching at Mendel University in Brno (Bioclimatology courses) we have been cooperating with students since 2015 till now and one of the parts of their required semester work is the observation of the phenological development of selected species. At the beginning of the semester, students are thoroughly familiarized with the observation methodology and choose the plant species they will observe at regular visits during the semester (field crops, trees, shrubs or vineyards). Each student observes at least two trees or shrubs and one field crop and needs to visit the localities every three days (or more frequently if possible) and record the phenological development with cameras (using personal smartphones). During the semester or at the end of the semester, students upload pictures and terms of phenophases through the website www.fenofaze.cz. On this website, students' results and observations are displayed in real-time and are open to the general public. Student observations are strictly controlled and unusable data are taken out. We cooperate with c. 200 students each semester (i. e. 600 observations) and the first outputs showed that 50% of all observations are usable. Terms of phenophases are observed at the cadastre level and are aggregated to the district level to evaluate the long-term changes. In most cases, students approach vegetation phenological monitoring responsibly and with enthusiasm, and we consider it a reliable way of recording phenological changes and dates.

Acknowledgment: This research was funded by the Ministry of Education, Youth and Sports of the Czech Republic the project SustES—Adaptation strategies for the sustainability of ecosystem services and food security in adverse natural conditions (CZ.02.1.01/0.0/0.0/16_019/0000797). 


How to cite: Bartošová, L., Dížková, P., Fischer, M., Sedláček, F., Trnka, M., and Žalud, Z.: Monitoring phenology as part of university education, EGU General Assembly 2023, Vienna, Austria, 23–28 Apr 2023, EGU23-13011, https://doi.org/10.5194/egusphere-egu23-13011, 2023.

Understanding grassland phenology responses to climate change is of crucial importance for revealing regional and species differences in ecosystem processes. By means of thousands of ground observations and the counterparts derived from long-term remote sensing data, the spatiotemporal patterns of grassland phenology and its links to climate changes and biotic factors were investigated over the Northern Hemisphere. In site-species scale, the leaf-out date did not show significant variation trend for 68.6% of the site-species, while the leaf senescence date has significantly delayed for 31% of the site-species during 1982-2011 over China. Sunshine hours, temperature, precipitation, and the leaf-out date primarily explained the variation of leaf senescence for 36.6%, 31.7%, 22.0%, and 9.8% of the investigated site-species, respectively. Sunshine hours were the foremost factor in controlling leaf senescence for 60.1% of graminoid species and temperature for 42.3% of forb species. Specifically, in the Inner Mongolia Grassland, a predominant significant positive correlation between the leaf-senescence date and previous precipitation in 54.6% of site species. In pixel-landscape scale, a significant advance (P < 0.05) of the start of growing season (SOS) was detected in 23.2% of grid cells, while a predominantly and significantly delaying trend (P < 0.05) of the end of growing season (EOS) was identified in 20.5% of grid cells during 1981–2014 over the grasslands in the Northern Hemisphere. They jointly resulted in a primarily significant prolongation trend of growing season length in 22.7% of grid cells. Meanwhile, the time span of SOS/EOS (from the earliest SOS/EOS to the last SOS/EOS) and the growing season length (from SOS to EOS) have extended for the entire study region. For the Inner Mongolia Grassland, SOS was mainly controlled by pre-SOS precipitation with the sensitivity being largest in desert steppe. EOS was closely connected with pre-EOS air temperature in meadow steppe and typical steppe, but more closely related to pre-EOS precipitation in desert steppe. Moreover, a significant negative correlation between EOS and SOS was observed in part of grassland areas, but no significant relationship between NPP and EOS was observed. Aside from correlation analysis, a newly model by incorporating the effect of drought stress (CDDP) into the traditional chilling-degree-days (CDD) model was developed to simulate the leaf senescence. CDDP model was selected as the optimal model for 73% of site species with insufficient water supply in preseason, while CDD model was selected as the optimal model for 18% of site species with a relatively wet but cold preseason. Overall, they highlight the diverse responses in the timing of spring and autumn phenology to preceding temperature and precipitation in different grassland types and their dependence on species, functional-types, and geographical gradients. 

How to cite: Ren, S.: Divergent responses of grassland vegetation phenology to climate change at different scales, EGU General Assembly 2023, Vienna, Austria, 23–28 Apr 2023, EGU23-13150, https://doi.org/10.5194/egusphere-egu23-13150, 2023.

EGU23-13305 | Posters on site | CL2.3

Identifying late spring frost impacts on European beech near its upper elevational limit using climatic and dendrochronology data 

Elisabeth Martínez-Sancho, Frederik Baumgarten, Joanna Reim, Arthur Gessler, and Yann Vitasse

Global warming has considerably advanced the start of the growing season of temperate trees. However, the rate of this phenological change does not necessarily track the changes in the date of the last spring frost, also induced by climate change, which may result in a higher risk of false spring. When a late spring frost (LSF) occurs during tree leaf emergence, it can lead to complete tree defoliation. Although the impacts of LSFs are rarely fatal for a tree, it is essential to identify those years to understand its effect on tree performance and vitality.

Here we aimed at identifying the years with potential frost damages, i.e., when frost have occurred around the time of leaf emergence of European beech (Fagus sylvatica L.) growing at two different elevations (1,065 and 1,365 m asl) at the Weissenstein (Swiss Jura mountains). We calibrated several phenological models using the Phenology Modeling Platform gathering various models considering forcing temperatures only or with a combination of chilling and photoperiod using high-resolution climate datasets and available phenological observations from a nearby station conducted from 2005 to 2022 (9 km away from our study sites, 1,120 m asl). The analyses are ongoing and will be compared to dendrochronology data collected from the same sites and be used to disentangle the pure effect of LSF from drought impacts on beech growth. Further investigations should be conducted on this aspect as the frequency and severity of extreme droughts are expected to increase while spring onset will continue to advance under a warmer climate, potentially increasing the risk of frost damage.

How to cite: Martínez-Sancho, E., Baumgarten, F., Reim, J., Gessler, A., and Vitasse, Y.: Identifying late spring frost impacts on European beech near its upper elevational limit using climatic and dendrochronology data, EGU General Assembly 2023, Vienna, Austria, 23–28 Apr 2023, EGU23-13305, https://doi.org/10.5194/egusphere-egu23-13305, 2023.

EGU23-13704 | ECS | Posters on site | CL2.3

Phenological responses of Alpine snowbed communities to advancing snowmelt 

Harald Crepaz, Elena Quaglia, Giampiero Lombardi, Michele Lonati, Mattia Rossi, Stefan Dullinger, Ulrike Tappeiner, and Georg Niedrist

In recent decades climate warming accelerated substantially and consequences were especially pronounced in alpine ecosystems. Among others, alpine grasslands characterized by long lasting snow cover e.g., snowsbeds, will be especially threatened, as they are subjected to substantial shifts in phenological timing and development due to earlier snowmelt. To assess the impact of advancing snowmelt on the phenology of alpine snowbed communities, we have monitored two study sites in the Italian Alps for 3-years. While both study sites are characterized by the same vegetation community (Salicetum herbaceae), altitude, and topography, they differed in the amount of winter precipitation and as a consequence in the timing of snowmelt. We monitored the phenological development of five shared plant species between both study sites by deriving the “green chromatic coordinate” (gcc) from images of the Phenocams, installed at both study sites and in-situ phenological assessment, following a standardized protocol. We then compared results between the early and the late snowmelt site and related the results of the community level to those of the species level. The gcc identified the start of growing season (SOS), peak of growing season (POS) and end of growing season (EOS) at both study sites but failed to grasp the interspecific and inter-site differences on the species level. We found that a three-week earlier snowmelt at the early snowmelt site (DOY 176 vs. 197) did not extend (25 vs. 26 days) but only advance the POS by 20 days and resulted in a approx. 10% lower gcc-values at the early snowmelt site. At the same time, the in-situ monitoring highlighted species-specific responses of the study species. Within the study period we could identify changes in the speed of the phenological development for each study species in at least one year, with the interannual differences being greater than the differences between the study sites. Nevertheless, when compared to the late snowmelt site, the phenological development at the early snowmelt site was slower for some species (e.g., Poa alpina -24.2%) and faster for others (e.g., Euphrasia minima +70.4%). This indicates the ability of these species to modulate their phenology in response to shifting snowmelt dates. Relating the results of both approaches to each other led to mixed results, as the species-based approach only partially supported the results of the community-based approach and vice versa, with -values ranging from 0.1 (Euphrasia minima) up to 0.61 (Veronica alpina). These results highlight the importance of multi-level approaches when trying to identify the effects of climate change on alpine vegetation communities, as species specific results in most cases don’t represent the results on a community level and results on community level mostly fail to address the single species’ responses in these complex and heterogeneous habitats.

How to cite: Crepaz, H., Quaglia, E., Lombardi, G., Lonati, M., Rossi, M., Dullinger, S., Tappeiner, U., and Niedrist, G.: Phenological responses of Alpine snowbed communities to advancing snowmelt, EGU General Assembly 2023, Vienna, Austria, 23–28 Apr 2023, EGU23-13704, https://doi.org/10.5194/egusphere-egu23-13704, 2023.

EGU23-14031 | ECS | Orals | CL2.3

Climate warming by open-top chambers enhances the flowering and fruit development of bog cranberry (Vaccinium oxycoccos L.) 

Michal Antala, Radosław Juszczak, Marcin Stróżecki, and Anshu Rastogi

Changes in plant phenology belong to the important consequences of climate change. Earlier start of the bud bursting, leaf development, or root growth are reported for many species, including those growing in northern peatlands. The next generation of plants depends on the production of generative organs; therefore, flower and fruit development are essential stages of ontogenesis, which are strongly regulated by ambient temperature. In this work, we focused on the generative organs’ development of bog cranberry (Vaccinium oxycoccos L.) under climate manipulation. The study was carried out in a nutrient-poor fen located in Western Poland, where two climate manipulation sites with different hydrology and vegetation composition were established in 2017. The site with a more stable water-table depth (WTD) and higher abundance of Carex spp. is named CL, and the site with a more fluctuating WTD and lower abundance of Carex spp. is named CR. Each site consists of three control (C) and six manipulated (M). The climate manipulation was induced by open-top chambers with the addition of 100 W infrared heaters that were switched on during nighttime. This manipulation resulted in an average annual increase of the air temperature 30 cm above ground in the period April-June of the studied year 2022 by 0.44°C at the CL site and 1.07°C at the CR site. The flower and fruit appearance and the flowering dynamics were analyzed from high-resolution images. We observed that flowering in M plots started on average 3.5 days sooner at CL and 14.5 days sooner at the CR site compared to respective Cs. The peak of flowering in warmed plots occurred 7.5 and 14 days earlier for CL and CR sites, respectively. The first fruit developed on average 11 days sooner in M plots of the CL site and 19 days sooner in M plots of the CR site than in respective Cs. In addition to the shifts in phenophases, the flowering dynamic was changed. The slow flower opening at the beginning and the faster opening towards the peak of flowering in C were changed to the fast opening at the beginning and slower towards the peak in M plots.

Our results show the earlier onset of the generative stages of bog cranberry with the warming climate. Additionally, a comparison of the two vegetation sites suggests that the vegetation community mediates the magnitude of the climate manipulation impact.

 The Research was co-founded by the National Science Centre of Poland (NCN) within grants No. 2016/21/B/ST10/02271 and 2020/37/ B/ST10/01213.


How to cite: Antala, M., Juszczak, R., Stróżecki, M., and Rastogi, A.: Climate warming by open-top chambers enhances the flowering and fruit development of bog cranberry (Vaccinium oxycoccos L.), EGU General Assembly 2023, Vienna, Austria, 23–28 Apr 2023, EGU23-14031, https://doi.org/10.5194/egusphere-egu23-14031, 2023.

EGU23-14577 | Orals | CL2.3

Compound effects of extreme spring temperature fluctuations on vegetation phenology 

Guohua Liu, Mirco Migliavacca, Christian Reimers, Ana Bastos, Nora Linscheid, Markus Reichstein, and Alexander J. Winkler

Strong spring temperature anomalies can have major impacts on the phenological development of vegetation throughout the season. In particular, an unusually warm spring can lead to premature plant development, while late-spring frost events can damage plants and result in reduced growth. However, the effects of early-spring warming and late-spring frost events on the seasonal development of vegetation, as well as their compound effect, still need to be investigated. Here, we apply a data-driven phenological model that accounts for meteorological memory to assess the effects of early-spring warming and late-spring frost events on key metrics of the phenological cycle, including the timing of spring green-up, peak greenness and autumn green-down for various vegetation types using ground-based observations of vegetation greenness (PhenoCam network). We find that early-spring warming leads to an advancement of all key metrics, i.e.,spring green-up, peak greenness and autumn green-down. Late-spring frost events, on the other hand, delay the entire seasonal cycle of vegetation development. The compound effect of both reveals that early-spring warming can compensate for the adverse impacts of late-spring frost events. Our study suggests that large fluctuations in spring temperature and compound events, which could increase in intensity and frequency in a warming climate, need to be considered when predicting the vegetation phenology under climate change.

How to cite: Liu, G., Migliavacca, M., Reimers, C., Bastos, A., Linscheid, N., Reichstein, M., and Winkler, A. J.: Compound effects of extreme spring temperature fluctuations on vegetation phenology, EGU General Assembly 2023, Vienna, Austria, 23–28 Apr 2023, EGU23-14577, https://doi.org/10.5194/egusphere-egu23-14577, 2023.

EGU23-14824 | Posters on site | CL2.3

Analysis of changes in the timing of the growing season in the Europe using remote sensing data 

Petra Dížková, Lenka Bartošová, Jan Balek, Daniela Semerádová, Zdeněk Žalud, and Miroslav Trnka

The most reliable method for monitoring plant phenology and changes in vegetation development is ground observation (in-situ). However, this method is difficult to implement on a larger spatial scale. For that reason, remote sensing data have begun to be used to quantify vegetation phenology in recent decades. Information about phenology is derived from remote sensing data using ie. phenological metrics. In this study, we used 3 base metrics - the start of the growing season (SOS), the end of the growing season (EOS), and the length of the growing season (LGS) for evaluating changes in the phenology of four land covers (coniferous forest, broadleaf forest, field, and grassland) in the European region (approx. 30 countries). For their determination, Enhanced Vegetation Index2 (EVI2) was used based on images from The Moderate Resolution Imaging Spectroradiometer (MODIS) sensor. Satellite images were obtained at a spatial resolution of 5 x 5 km in the time period from 2000 to 2022. For four land covers within the 22-year period, it was evaluated that the SOS significantly shifted to an earlier date in about half of the evaluated states. The EOS significantly shifted to a later date in almost all evaluated states. Based on these results, we evaluated the whole length of the growing season and found a significant shift to a later date also in almost all evaluated states.

Acknowledgement: This work was supported by an individual IGA project - Determination of vegetation time and its spatiotemporal variability using remote sensing of the Earth (AF-IGA2022-IP-067) and by SustES project – Adaptation strategies for sustainable ecosystem services and food security under adverse environmental conditions (CZ.02.1.01/0.0/0.0/16_019/0000797), which provided essential data and software access.

How to cite: Dížková, P., Bartošová, L., Balek, J., Semerádová, D., Žalud, Z., and Trnka, M.: Analysis of changes in the timing of the growing season in the Europe using remote sensing data, EGU General Assembly 2023, Vienna, Austria, 23–28 Apr 2023, EGU23-14824, https://doi.org/10.5194/egusphere-egu23-14824, 2023.

EGU23-16286 | Posters on site | CL2.3

Phenology across scales: an intercontinental analysis of budburst in temperate tree populations 

Nicolas Delpierre, Suzon Garnier, Hugo Treuil-Dussouet, Jianhong Lin, Koen Hufkens, Matthew Wilkinson, and Kamel Soudani

The seasonality of development (phenology) of vegetation is sensitive to temperature. It is one of the most prominent biological markers of current global warming. The budburst period is of particular interest because the budburst date is decisive for the development and survival of deciduous trees. It reflects a trade-off between the need to maximize the growth period and the risks associated with late frost. Our study analyses the intra-community variability (ICV) of budburst dates acquired over 107 site-years in temperate deciduous forests located in the USA (67 site-years) and Europe (40 site-years) using phenological cameras. The average date of budburst shows a virtually identical sensitivity to temperature in American and European forests. The annual ICV of budburst was not significantly different in both continents (with an average value of 3 days, computed as the standard deviation of budburst across the community), despite a lower species richness in European forests (2 species on average) than in American forests (4.5 species on average). Earlier budburst and lower temperatures increased the ICV, which could reach up to 10 days. We suggest that the ecological consequences of the ICV of budburst should be investigated further. We show that over a growing season, the earliest trees of the community absorbed on average 10% more radiation than the latest trees (no difference across continents). This corresponds to a photosynthesis difference of 120 gC m-2 yr-1, the impacts of which in terms of individual growth, nutrient and water acquisition and/or exposure to water stress should be further investigated.

How to cite: Delpierre, N., Garnier, S., Treuil-Dussouet, H., Lin, J., Hufkens, K., Wilkinson, M., and Soudani, K.: Phenology across scales: an intercontinental analysis of budburst in temperate tree populations, EGU General Assembly 2023, Vienna, Austria, 23–28 Apr 2023, EGU23-16286, https://doi.org/10.5194/egusphere-egu23-16286, 2023.

EGU23-16892 | ECS | Posters on site | CL2.3

Impact of a damaging spring frost followed by a summer drought on saplings of four temperate species 

Na Luo, Manuel Walde, Yann Vitasse, and Arthur Gessler

Climate warming leads to earlier leaf-out which may put trees at higher risks of late spring frost (LSF) damage. Moreover extreme droughts in summer are increasing in frequency and magnitude. The probability that a damaging LSF and an extreme summer drought occur in the same year will therefore increase. Although the impact of LSF and extreme drought on tree vitality has been in depth investigated separately, the response and recovery of trees after a combination of these two stresses remain largely unknown, yet it might be crucial for tree persistence in the future.

Here, we exposed 2-year-old saplings of four species (Quercus petraea, Quercus robur, Fagus sylvatica and Acer campestre) to an artificially LSF (trees exposed to -5.5℃ for 3 hours) shortly after leaf emergence (at the beginning of May). Then we applied a 2-month summer drought treatment from early July to end of August (well-watered vs. drought, 50% reduction of water). During the entire growing season we measured seedling growth, gas exchange and nonstructural carbohydrates (NSC) to examine how trees respond to and recover from single and double stress.

The artificial SLF severely damaged 90% of Quercus robur, 70% of Fagus sylvatica, 40% of Quercus petraea and 20% of Acer campestre. After 1.5 months, biomass and specific leaf area (SLA) of late-frost treated trees still differed significantly from the control in Quercus petraea, Fagus sylvatica, Acer campestre. Assimilation (A) was lower in late frost treated trees before the drought traetments for all four species.

LSF strongly damaged leaves and reduced tree growth. The lag effect of frost damage may interact with the following summer drought damage, and we expect stronger impact of the drought when following an SLF than alone. However, it is also possible that reduced canopy size due to previous LSF mitigates the drought damages. Data analysis is ongoing that evaluates the lag effect of late-spring frosts on the resilience of trees to drought.


How to cite: Luo, N., Walde, M., Vitasse, Y., and Gessler, A.: Impact of a damaging spring frost followed by a summer drought on saplings of four temperate species, EGU General Assembly 2023, Vienna, Austria, 23–28 Apr 2023, EGU23-16892, https://doi.org/10.5194/egusphere-egu23-16892, 2023.

EGU23-17072 | Orals | CL2.3

Tree roots lack dormancy and can advance budburst when warmed 

Andrey Malyshev, Juergen Kreyling, and Gesche Blume-Werry

The initiation of tree growth in spring is typically linked to leaf-out. Bud dormancy drives budburst timing while dormancy of tree roots has largely remained unexplored, although the latter can shape below-ground growth and carbon dynamics. As roots experience different temperatures from buds, their dormancy dynamics and growth timing can differ and need to be studied, in order to better understand above- and below-ground growth responses to climate warming.

We evaluated differences in dormancy dynamics between roots and buds in Fagus sylvatica and Populus nigra by quantifying the amount of warmth required to initiate above and below-ground growth from October to February. We furthermore carried out seven experiments, manipulating only the soil temperature prior to or during tree leaf-out to evaluate the potential of warmer roots to advance budburst timing. Soil temperature was manipulated via snow removal, heating buried wires, insulated pots, soil as well as chamber soil warming, using tree seedlings and adult trees of Fagus sylvatica as well as tree seedlings of Betula pendula.

Root dormancy was virtually absent in comparison to the much deeper and variable bud dormancy, with roots being able to start growing immediately after being exposed to warm temperatures during the winter. Furthermore, warmer soil temperature advanced budburst in the meta-analysis of all soil temperature manipulation experiments. Therefore, differences in root and bud dormancy dynamics and their interaction likely explain the non-synchronized below and above-ground growth periods, both processes requiring separate predictions under climate warming.

How to cite: Malyshev, A., Kreyling, J., and Blume-Werry, G.: Tree roots lack dormancy and can advance budburst when warmed, EGU General Assembly 2023, Vienna, Austria, 23–28 Apr 2023, EGU23-17072, https://doi.org/10.5194/egusphere-egu23-17072, 2023.

EGU23-17353 | ECS | Posters on site | CL2.3

The spatio-temporal dynamics of the peak of the growing season and its responses to climatic driving factors in Africa 

Siqi Shi, Peiqi Yang, and Christiaan van der Tol

Vegetation phenology characterizes the periodic plant life cycle events across a growing season. It is sensitive to climate change and thus important for the understanding of vegetation-climate interactions. Previous studies have revealed the importance of the start and end of the growing season, and investigated their dynamics with climate change. However, the spatio-temporal dynamics of the peak of the growing season (POS), which is also important to understand the response of plants to climate change, has not been well documented. Here, we applied three methods (Savitzky-Golay filtering, SG; Asymmetric Gaussian function, AG; and Double Logistic function, DL) in TIMESAT to estimate the latitudinal and longitudinal gradients and temporal trends of the peak of the growing season (POS) in Africa based on normalized difference vegetation index (NDVI) during 1982-2015. We investigated the relationships of POS with mean temperature, accumulative precipitation, and accumulative insolation over the preseason periods by computing temporal partial correlation coefficients. The results showed similar patterns and minor differences in POS based on the three methods. The averaged differences overall less than 0.4 days (MEANSG-AG = -0.1427 days, MEANSG-DL = 0.307 days, MEANAG-DL = 0.1983 days). For the spatio-temporal dynamics of POS, the latitudinal variations in POS were not very obvious but significant in both northern and southern Africa. In northern Africa, there was no clear longitudinal gradient in POS, while a significant west-east gradient in the temporal trends of POS was exhibited with POS change rate from 0.48 days/year to 0.19 days/year. From the temporal trends, we found an overall delayed trend of POS with 0.28 days/year on average in northern Africa and 0.25 days/year on average in southern Africa. In northern Africa, preseason precipitation was the most important factor controlling POS with a positive correlation, followed by temperature with a positive correlation. The correlations between preseason temperature and POS exhibited spatial heterogeneity, with more areas showing positive relationship than negative relationship. Compared to northern Africa, the response of POS to climatic factors is more complex in southern Africa. The three climate factors all showed significant correlations to POS for most areas. Both decreased accumulative precipitation and radiation over preseason overall delayed POS for most areas. The temperature was also significantly associated with POS changes, while had different effects on POS, i.e., POS can be resulted from lower temperature and higher temperature (depending on the location), implying the complicated interactions between POS changes and temperature in southern Africa. Our study deepens the understanding between phenology and climate change in Africa.

How to cite: Shi, S., Yang, P., and van der Tol, C.: The spatio-temporal dynamics of the peak of the growing season and its responses to climatic driving factors in Africa, EGU General Assembly 2023, Vienna, Austria, 23–28 Apr 2023, EGU23-17353, https://doi.org/10.5194/egusphere-egu23-17353, 2023.

EGU23-296 | ECS | Posters on site | CL2.4

Summer winds over the Iberian Peninsula related to thermal low conditions from COSMO-REA6 (1995-2018) high-resolution reanalysis 

María Ortega, Enrique Sánchez, Claudia Gutiérrez, Noelia López-Franca, Miguel Ángel Gaertner, and María Ofelia Molina

Thermal low pressure systems are typically generated over continental mid-latitudes and subtropical regions during summer, related to a strong heating over land caused by the long lasting solar radiation during this part of the year. They present a clear diurnal cycle, being more intense during the afternoon, and weakens at nighttime. In Europe, a thermal low forms frequently over the Iberian Peninsula. As strong pressure gradients are generated from the coastal regions to the interior of the Peninsula, wind characterization is a relevant feature to describe the Iberian thermal low. In particular, wind typically enters from the north (the Basque Country) and the east (the Mediterranean coast of Murcia and Valencia) through gaps between mountain ranges, and move respectively in a southwestward or westward direction. In the northern area, the wind flows into the regions of Burgos and Valladolid after channeling across the Duero valley, while in the southeast it reaches a large part of Castilla-La Mancha and even Extremadura. These winds are known in the Iberian Peninsula, for example, the regional wind from the Mediterranean to the Castilla-La Mancha plateau is typically named as Solano. Nevertheless, no systematic effort has been made to fully characterize and quantify its frequency or intensity, so no objective thresholds of wind speed, direction or spatial extension have been defined so far. A first effort to define such objective values is then proposed here. Hourly 10-m wind and 2-m specific humidity fields from COSMO-REA6 very high resolution (0.055º) reanalysis covering the 1995-2018 period are used. This high resolution, both temporal and spatial, will allow us to inspect the orographic aspects that seem to be relevant for these regional winds, together with its clear diurnal cycle and the moisture transport from coastal to inner regions. Humidity is a relevant variable for characterizing these flows, as there are marked differences between the moist air entering from the sea and the dry summer air characteristic of the inner regions of the Iberian Peninsula. The climatic perspective allows to study if interannual variability or trends are also relevant. First results indicate that these regional winds, with mean hourly speeds above 5 m/s for several hours per day, appear during most of the summer days, with important variations in spatial extension and strength. Strong moisture gradients are frequently observed during such episodes. Maximum speed and humidity jumps occur during the afternoon. This analysis is just a starting point, which will be followed by a deeper examination of these flows.

How to cite: Ortega, M., Sánchez, E., Gutiérrez, C., López-Franca, N., Gaertner, M. Á., and Molina, M. O.: Summer winds over the Iberian Peninsula related to thermal low conditions from COSMO-REA6 (1995-2018) high-resolution reanalysis, EGU General Assembly 2023, Vienna, Austria, 23–28 Apr 2023, EGU23-296, https://doi.org/10.5194/egusphere-egu23-296, 2023.

EGU23-615 | ECS | Posters on site | CL2.4

Convection-Permitting Future Climate Simulation Based on SSP3-7.0 Scenario Over the Black Sea Basin 

Mehmet Baris Kelebek and Barış Önol

The regional climate models are recently run at grid spacings of 4 km or less, so-called the convection-permitting scale, over different regions of the world. The previous studies highlighted the added value of the convection-permitting simulations, especially in representing the daily and sub-daily precipitation over complex topography. The Black Sea Basin, including the coastal areas of the Black Sea and a broad part of the Anatolian Peninsula, is one of the climate change hot-spots with its complex topographical features and where strong air-sea interactions occur. Previously, this region has become a subject of regional climate modelling studies at horizontal resolutions on the order of 10 km. In this study, we performed a decade-long convection-permitting climate simulation at 3 km horizontal resolution between 2061-2070 based on the SSP3-7.0 greenhouse gas emission scenario over the Black Sea Basin. To this end, we downscaled the last generation CMIP6 MPI-ESM1.2-HR outputs by using the WRF model. The results indicate that the daily 2m mean, minimum, and maximum air temperatures increase in the spring, summer, and autumn by about 3°C compared to the 2005-2014 reference period over the study area. Nevertheless, the increase in the cloud cover suppresses the warming in the winter. In terms of precipitation, the total precipitation amount decreases in spring and summer over the Black Sea Basin. On the other hand, the total precipitation amount increases significantly by about 3 mm/day in winter over the Eastern Black Sea region due to the positive change in evaporation of around 15%. The maximum daily precipitation amount reaches 350 mm over the northeast of Turkey and over the Caucasus. The intensification of the daily precipitation is most pronounced in the coastal subregions of the Black Sea Basin. Furthermore, the results highlight the intensification of sub-daily precipitation in these regions. In particular, the afternoon precipitation increases in autumn over the coastal regions of Turkey.

How to cite: Kelebek, M. B. and Önol, B.: Convection-Permitting Future Climate Simulation Based on SSP3-7.0 Scenario Over the Black Sea Basin, EGU General Assembly 2023, Vienna, Austria, 23–28 Apr 2023, EGU23-615, https://doi.org/10.5194/egusphere-egu23-615, 2023.

EGU23-2428 | Posters on site | CL2.4

The use of regional climate models for estimating past and future precipitable water vapor and extreme precipitation over Ethiopia 

Bert Van Schaeybroeck, Abdisa Kawo, Roeland Van Malderen, and Eric Pottiaux

There exist well known relations between Precipitable Water Vapor (PWV) and extreme rainfall which are of prominent importance in the context of climate change. These relations, however, are mostly established in mid-latitudes and for flat terrain. Ethiopia, however, is located in the tropics and features a complex orography, both of which may modulate these relations. We investigate PWV and extreme precipitation over Ethiopia by use of Regional Climate Models (RCMs) from the Coordinated Regional Climate Downscaling Experiment (CORDEX). We first evaluate the RCMs by comparing their annual PWV cycles with the ones obtained from Global Positioning System observations and reanalysis in the past. Additionally, we focus on the behaviour of PWV before and after a heavy-rainfall event. It is found that there are two characteristic timescales, both for the build-up and for the decline around the event of the heavy precipitation: a timescale of about 2 days and a longer timescale that extends beyond ten days which seems unreported in the literature. The RCMs are capable of reproducing the PWV annual cycle and the spatial variability. However, there is a predominantly dry bias that strongly increases with elevations. The RCMs reproduce well the spatial differences of the PWV anomaly peak during a heavy-rainfall event but overestimate the timescales of build-up and decline. Future PWV-changes scale linearly with the near-surface temperature changes at a rate of 7.7% per degree warming and locally increase up to 40% for the end-of-the-century RCP8.5 scenario. Changes in rainfall extremes, on the other hand, do not follow this trend especially in north-western Ethiopia, potentially caused by an overall decrease in rainfall in that region.

How to cite: Van Schaeybroeck, B., Kawo, A., Van Malderen, R., and Pottiaux, E.: The use of regional climate models for estimating past and future precipitable water vapor and extreme precipitation over Ethiopia, EGU General Assembly 2023, Vienna, Austria, 23–28 Apr 2023, EGU23-2428, https://doi.org/10.5194/egusphere-egu23-2428, 2023.

Abstract
Assessing agricultural drought is of great importance as it is viewed as the most serious problem in most
countries in terms of food security, economy, and social stability. Various drought indices have been
developed in order to describe the characteristics of drought such as severity, extent, frequency and
duration. These indices can be classified into two categories: ground-based and remotely-sensed indices.
Ground-based drought indices are more accurate but limited in coverage, while remote sensing drought
indices cover large areas but have poor precision. Therefore there is need to apply advanced data fusion
methods based on satellite data and ground-based drought indices to fill this gap. However there is a lag
time between drought events and the impacts they cause.
Due to the semi arid conditions of Botswana, the country is prone to the occurrence of droughts and has
a great influence on agriculture and economy of the country at large. In order to monitor droughts in
Botswana this paper proposes that it is necessary to link the pre meteorological observations and the
consequential vegetation drought. This is neededed for effective monitoring of agricultural drought and
early warning. In this study, MODIS reflectance data and data from recent satellites such as landsat OLI,
Sentinel will be used to discover relationships between vegetative drought and meteorological drought
using vegetation condition index (VCI) derived from NDVI and NDWI, and meteorological drought
derived from SPI and SPEI in Botswana. Dataset derived from Soil Moisture Active Passive (SMAP)
will be used to generate %soil moisture content. The %moisture content will be compared with
experimental results from the field. Pearson correlation analyses were performed between single remote
sensing drought indices and in-situ drought indices, NDVI and SPEI. Preliminary studies show that VCI
derived from NDWI (VCI-2) over Southern District of Botswana can be used as an approach to monitor
and provide early warnings. However, there is weak correlation SPEI and VCI-1 and VCI-2 ranging
from -1 to 0.2.

How to cite: Matsuokwane Manyothwane, T. and Mengistu Tsidu, G.: Dryland land crop yield sensitivity to drought in Botswana: Development ofstatistical tools based on satellite remote sensing, observation and climate models foruse in risk assessment, EGU General Assembly 2023, Vienna, Austria, 23–28 Apr 2023, EGU23-3481, https://doi.org/10.5194/egusphere-egu23-3481, 2023.

EGU23-3516 | Posters on site | CL2.4

Improved bias-adjustment methods for subdaily precipitation extremes 

Hans Van de Vyver, Bert Van Schaeybroeck, Lesley De Cruz, Rafiq Hamdi, and Piet Termonia

Extreme precipitation events are responsible for severe damage to various aspects of human society and ecosystems. Short-term extremes especially affect people in urban areas through flash floods. Extremely heavy precipitation is increasing in frequency and intensity due to global warming and Regional Climate Models (RCMs) of high-resolution are needed to estimate associated increased risks. However, even the RCMs that explicitly resolve deep convection are known to significantly underestimate subdaily precipitation extremes. Impact modellers and other users of climate projections therefore often use some form of bias correction. 

In this study, we propose bias adjustment methods especially designed for the estimation of future subdaily extreme precipitation return levels. These methods take into account the scaling intensity-duration-frequency (IDF) relationship between different levels of accumulation, and jointly estimate extreme rainfall over multiple rainfall durations (i.e. from hourly to multi-day extreme precipitation events). After comparison with established methods, we identify only one method that preserves the scaling IDF relationship, which is a necessary condition to have bias-adjusted return levels consistent among the different durations. A comparative analysis in a multi-model pseudo-reality setting shows that this method is superior to existing bias adjustment methods.

Finally, future projections of bias-adjusted subdaily precipitation return levels for Belgium are obtained in the form of an ensemble of 28 EURO-CORDEX simulations at 0.11° spatial resolution, under the RCM8.5 emission scenario.

How to cite: Van de Vyver, H., Van Schaeybroeck, B., De Cruz, L., Hamdi, R., and Termonia, P.: Improved bias-adjustment methods for subdaily precipitation extremes, EGU General Assembly 2023, Vienna, Austria, 23–28 Apr 2023, EGU23-3516, https://doi.org/10.5194/egusphere-egu23-3516, 2023.

EGU23-4462 | ECS | Posters on site | CL2.4

Lagrangian analysis of convective rainfall under different synoptic forcing 

Edmund P Meredith, Uwe Ulbrich, and Henning W Rust

Precipitation is commonly analysed from an Eulerian perspective, in which rainfall is considered at a fixed location. Lagrangian analysis of precipitation represents an alternative approach. Here, precipitation objects – for example, convective cells – are identified in a precipitation field and are then tracked through space and time, allowing object properties over the whole life of a convective cell to be collected. This approach offers additional insights into the mechanisms by which convective cells develop and behave across their lifecycle, which would not be evident from standard analysis methods.

In this study, we perform Lagrangian analysis of convective cells under different large-scale circulation regimes. Tracking is based on convection-permitting simulations with the COSMO-CLM at 0.025° resolution over central Europe. All identified precipitation objects are tracked through space and time, collecting cell characteristics for each object, e.g. cell area, intensity, distance travelled, etc. Here we associate precipitation objects with categorical synoptic-scale circulation patterns and compare the cell properties between the different categories.

How to cite: Meredith, E. P., Ulbrich, U., and Rust, H. W.: Lagrangian analysis of convective rainfall under different synoptic forcing, EGU General Assembly 2023, Vienna, Austria, 23–28 Apr 2023, EGU23-4462, https://doi.org/10.5194/egusphere-egu23-4462, 2023.

EGU23-5185 | ECS | Posters on site | CL2.4 | Highlight

Linking future Gulf Stream warming and increased European winter precipitation in an eddy-rich model 

Eduardo Moreno-Chamarro, Louis-Philippe Caron, Pablo Ortega, Saskia Loosveldt Tomas, Malcolm J. Roberts, Aude Carreric, Amanda Frigola, and Eneko Martín Martínez

This contribution discusses future changes in Gulf Stream temperatures, winter precipitation over northwestern Europe, and their connection. We compare HighResMIP historical and ssp5-8.5 scenario simulations generated with five different configurations of the global coupled model HadGEM3-GC3.1, including one at a pioneering 50-km-atmosphere–1/12°-ocean global resolution. The highest resolution model projects an increase in winter rainfall over Europe outside or to the extremes of multimodel ensembles, such as CMIP6 and HighResMIP, for which both the highest ocean and atmosphere resolutions are essential: on the one hand, only the eddy-rich ocean (1/12°) projects a progressive northward shift of the Gulf Stream and substantial surface warming of the region; on the other, only the 50-km atmosphere translates such warming into strengthened extratropical cyclone activity over the North Atlantic and, hence, increased rainfall over Europe. The results suggest that climate projections relying on traditional ~100-km-resolution models might underestimate climate changes in the North Atlantic and Europe, demonstrating the importance of improved Gulf Stream representation for robust uncertainty estimates of climate risk.

We also present the first results of the STREAM project, which aims to study the role of the ocean mesoscale in driving North Atlantic and European climate variability and predictability. We describe the results of the HighResMIP simulations generated with the EC-Earth global climate model at the T1270-ORCA12 resolution (about 15 km in both the atmosphere and the ocean) and explore the main model biases and response to climate change, as well as the variability in the North Atlantic circulation associated with subpolar oceanic deep mixing. 

How to cite: Moreno-Chamarro, E., Caron, L.-P., Ortega, P., Loosveldt Tomas, S., Roberts, M. J., Carreric, A., Frigola, A., and Martín Martínez, E.: Linking future Gulf Stream warming and increased European winter precipitation in an eddy-rich model, EGU General Assembly 2023, Vienna, Austria, 23–28 Apr 2023, EGU23-5185, https://doi.org/10.5194/egusphere-egu23-5185, 2023.

EGU23-6121 | Orals | CL2.4

Modeling present-day and future extreme events in the Lake Victoria Basin 

Nicole van Lipzig, Jonas Van de Walle, Matthias Demuzere, Andreas H. Fink, Patrick Ludwig, Grigory Nikulin, Joaquim Pinto, Andreas F. Prein, Dave Rowell, Minchao Wu, and Wim Thiery

The population in the Lake Victoria Basin (LVB) is affected by extreme weather both on land, where flooding regularly occurs and on the lake, where nightly storms often catch fishermen by surprise. The CORDEX Flagship Pilot Study ELVIC investigates how extreme weather events will evolve in this region of the world and to provide improved information for the climate impact community. Here we evaluate the performance of five regional climate models at convection-permitting resolution and present projections for the future using COSMO-CLM in a pseudo global warming approach. Most substantial systematic improvements were found in metrics related to deep convection in convection-permitting models compared to their coarser scale counterparts. For the future, extreme precipitation and wind gusts are expected to increase over the lake due to an thermodynamically induced increase in water vapor whereas the impacts of weaker meso-scale circulation over the lake and stronger thunderstorm dynamics compensate each other. More compound events are expected for the future during which both rainfall and wind gusts are intense. Interestingly, the mean precipitation is strongly affected by uncertainties in large-scale dynamics whereas thermodynamics dominate extreme precipitation. This might imply that uncertainties in future projected extremes are smaller than those in mean precipitation.

How to cite: van Lipzig, N., Van de Walle, J., Demuzere, M., Fink, A. H., Ludwig, P., Nikulin, G., Pinto, J., Prein, A. F., Rowell, D., Wu, M., and Thiery, W.: Modeling present-day and future extreme events in the Lake Victoria Basin, EGU General Assembly 2023, Vienna, Austria, 23–28 Apr 2023, EGU23-6121, https://doi.org/10.5194/egusphere-egu23-6121, 2023.

EGU23-6228 | Posters on site | CL2.4

Pseudo-global-warming experiments for West Africa 

Beth Woodhams, Peter Knippertz, and Andreas Fink

With a rapidly growing population, West Africa is particularly vulnerable to the effects of climate change. While results from the Coupled Model Intercomparison Project (CMIP) experiments cannot agree on the sign of the end-of-century mean precipitation change over West Africa, there is consistent agreement that the most extreme precipitation events will become more intense. Indeed, an increase in the intensity of the most extreme events has already been observed in rain gauge and satellite datasets. These events are vital to understand since heavy rain can cause flooding as well as resulting property, infrastructure and crop damage, spread of disease and ultimately loss of life.

In West Africa, the majority of rainfall is delivered via Mesoscale Convective Systems (MCSs). Convection associated with the land–sea breeze circulation is also significant along the Guinea Coast. It is well understood that coarse climate models are unable to accurately represent systems on the meso- and local-scale and that high-resolution ‘convection-permitting’ models are required to represent the diurnal cycle, intensity, and organisation of convection. However, such models are expensive to run, especially for the long periods required for climate simulations. One solution is to run pseudo-global-warming (PGW) simulations, where 4D (x,y,z,t) climate ‘deltas’ from CMIP models are added to high-resolution reanalysis. The resulting dataset is then used as a boundary condition for high-resolution model runs of case study events in the future climate. In this work, the ERA5 reanalysis is used as the base, and the simulations are performed using the ICOsahedral Nonhydrostatic (ICON) model.

Initial results from bespoke PGW case studies for West Africa will be presented to show how the character of present-day extreme events might change if they were to occur in a future climate. In particular, the work will look at the thermodynamic and dynamic contributions to changes in intensity. Furthermore, changes in storm evolution, propagation and organisation will be analysed.

How to cite: Woodhams, B., Knippertz, P., and Fink, A.: Pseudo-global-warming experiments for West Africa, EGU General Assembly 2023, Vienna, Austria, 23–28 Apr 2023, EGU23-6228, https://doi.org/10.5194/egusphere-egu23-6228, 2023.

EGU23-6829 | ECS | Orals | CL2.4

Land-atmosphere coupling in km-scale climate modeling: effects of resolution vs. land-surface model sophistication 

Lorenzo Sangelantoni, Stefan Sobolowski, Rossella Ferretti, Gianluca Redaelli, Antonio Ricchi, and Enrico Scoccimarro

Recent studies exhibit a considerable reduction of summer season precipitation frequency in the new generation of convection-permitting (CP) climate simulations. This seems to over-correct non-CP wet biases with a knock-on effect on summer temperatures via soil moisture-atmosphere feedbacks. However, it is difficult to elucidate which part of the warmth/dryness in CP simulations can be ascribed to land-atmosphere coupling and/or "atmosphere-only" processes. Another layer of uncertainty belongs to the still crude representation of land surface/sub-surface processes that become especially relevant when approaching such high resolution.

In this study we explore the modulation of land-atmosphere coupling when moving from a non-CP to a CP-scale climate modeling, considering increasingly sophisticated land surface model configurations. We perform a two-step dynamical downscaling at ~15 km (convection-parameterized) and ~ 3km (convection-permitting) resolutions with the WRF-4.2.1 regional climate model driven by ECMWF-ERA5 reanalysis. The greater alpine region and the extended summer season (May to September) of 2003 are the spatial and temporal domains of interest. A mini multi-physics ensemble is generated with four Noah-MP land-surface model configurations to examine if, and how, including crucial land processes (e.g., vertical soil water transport) modifies hot-temperature forcing mechanisms in the two resolutions. Moreover, each ensemble member is run according to three different initial soil moisture levels, defining reference, anomalously dry- and wet-initialization experiments.

Preliminary results show an improved representation of precipitation statistics (seasonal cumulative, frequency, and 99th percentile) from CP simulations, particularly over complex orography. Generally, maximum temperature reproduction benefits from the CP scale. However, localized warm biases persist over flat terrains regardless of the land surface model configuration. Finally, the two resolutions show a substantially different decay of the initial soil moisture state. At CP scale all three runs converge to similar soil moisture at the end of the integration. Conversely, non-CP runs preserve large soil moisture differences until the end of the summer season, signaling longer soil moisture memory and different soil moisture-precipitation feedback.

These factors might significantly affect the reproduction and predictability of environmental and societal relevant hydroclimatic extremes on a wide-ranging temporal scale, from seasonal climate predictions to long-term climate projections.

How to cite: Sangelantoni, L., Sobolowski, S., Ferretti, R., Redaelli, G., Ricchi, A., and Scoccimarro, E.: Land-atmosphere coupling in km-scale climate modeling: effects of resolution vs. land-surface model sophistication, EGU General Assembly 2023, Vienna, Austria, 23–28 Apr 2023, EGU23-6829, https://doi.org/10.5194/egusphere-egu23-6829, 2023.

EGU23-7501 | Orals | CL2.4 | Highlight

The Dutch heat wave of July 2019 in a warmer world: How much hotter could it get? 

Hylke de Vries, Geert Lenderink, Erik van Meijgaard, Wim de Rooij, and Bert van Ulft

Summertime heat waves are extreme meteorological events with a high impact. Three defining aspects are their intensity, duration and spatial extent. All three will change for the worse in a warming world. We illustrate how these changes could play out for the heat wave that produced the hottest day to date in the Netherlands (40.7C, Gilze-Rijen 25 July 2019, a record-shattering event of more than 2 degrees). This is done using a chain of hydrostatic and non-hydrostatic regional climate models of increasing horizontal resolution (12km-2.5km-500m-150m) in combination with the Pseudo Global Warming (PGW) approach. Various scenarios are explored using an ensemble approach to examine robustness. Results indicate that if the 2019 July heat wave were to occur in a +2K warmer world: (i) temperatures would likely reach 45C in many places; (ii) the cumulative heat-wave intensity sum would double; (iii) the time to “cool off” in between heat waves would reduce to a level where the total number of days spent in heat waves roughly equals the number of cool days (Tx<25C); (iv) the area where the 40C threshold is passed will increase strongly; (v) the heat wave will last longer as a simple consequence of the higher temperatures (i.e., an earlier start and a later end). Further persistence increases occur if large-scale circulation changes are supportive; (vi) the temperature response is between 1.5-2 degree per degree global warming, with higher values occurring in scenarios with a stronger future drying. (vii) Finally, during heat waves cities become ‘islands of heat’ where the daily maximum temperatures and the night-time minima are 1-5C higher than in nearby more rural areas. A first impression of these differences is obtained from experimental simulations with the convection permitting model HCLIM43 in ultra-high ‘resolution-of-the-future’ mode (500-150m).

How to cite: de Vries, H., Lenderink, G., van Meijgaard, E., de Rooij, W., and van Ulft, B.: The Dutch heat wave of July 2019 in a warmer world: How much hotter could it get?, EGU General Assembly 2023, Vienna, Austria, 23–28 Apr 2023, EGU23-7501, https://doi.org/10.5194/egusphere-egu23-7501, 2023.

The intensity of precipitation extremes across Europe is expected to increase through the 21st century under a warming climate . Current coarse-resolution global climate models broadly project increased variability of both wet and dry extremes; however, they rely on parametrizations schemes of crucial processes controlling extreme precipitation such as convection. These methods often introduce errors and thereby induced uncertainties in projections of extremes in the water cycle that are relevant for policy makers and infrastructure planning. The need for accurate extreme event information on such extremes became further evident after the July 2021 floods (Ibebuchi, 2022) and summer 2022 record-breaking heatwaves/drought across Western Europe.

The ongoing H2020 Next Generation Earth Modelling Systems (NextGEMS) project aims to address these issues with the development of fully-coupled storm-resolving Earth-System Models. Using some of the first runs of the Integrated Forecast System (IFS) from ECMWF and ICON from MPI-M at 4 km and 5 km horizontal resolution respectively, we examine individual extreme precipitation events across Europe and evaluate their representation against similar analogues in the Copernicus European Regional Reanalysis (CERRA) and observational datasets. The unprecedented high resolution of the fully-coupled Storm-Resolving Models and CERRA allows for an evaluation of precipitation characteristics in complex terrain like the Alps (Hughes et al., 2009) or complex coastlines. We first evaluate the spatial and temporal structure of the events, compare their representation to coarse-resolution GCMs and then examine the potential drivers such as atmospheric river using integrated moisture transport and vertical structure of the low-level jet (Swain et al., 2015).

Hughes, M., Hall, A., & Fovell, R. G. (2009). Blocking in Areas of Complex Topography, and Its Influence on Rainfall Distribution. Journal of the Atmospheric Sciences, 66(2), 508–518. https://doi.org/10.1175/2008JAS2689.1

Ibebuchi, C. C. (2022). Patterns of atmospheric circulation in Western Europe linked to heavy rainfall in Germany: preliminary analysis into the 2021 heavy rainfall episode. Theoretical and Applied Climatology, 148(1), 269–283. https://doi.org/10.1007/s00704-022-03945-5

Seneviratne, S.I., X. Zhang, M. Adnan, W. Badi, C. Dereczynski, A. Di Luca, S. Ghosh, I.

Iskandar, J. Kossin, S. Lewis, F. Otto, I. Pinto, M. Satoh, S.M. Vicente-Serrano, M. Wehner, and B. Zhou, 2021: Weather and Climate Extreme Events in a Changing Climate. In Climate Change 2021: The Physical Science Basis. Contribution of Working Group I to the Sixth Assessment Report of the Intergovernmental Panel on Climate Change [Masson-Delmotte, V., P. Zhai, A. Pirani, S.L. Connors, C. Péan, S. Berger, N. Caud, Y. Chen, L. Goldfarb, M.I. Gomis, M. Huang, K. Leitzell, E. Lonnoy, J.B.R. Matthews, T.K. Maycock, T. Waterfield, O. Yelekçi, R. Yu, and B. Zhou (eds.)]. Cambridge University Press, Cambridge, United Kingdom and New York, NY, USA, pp. 1513–1766, doi:10.1017/9781009157896.013.

Swain, D. L., Lebassi-Habtezion, B., & Diffenbaugh, N. S. (2015). Evaluation of Nonhydrostatic Simulations of Northeast Pacific Atmospheric Rivers and Comparison to in Situ Observations. Monthly Weather Review, 143(9), 3556–3569. https://doi.org/10.1175/MWR-D-15-0079.1

How to cite: Wille, J. and Fischer, E.: Dynamical representation of extreme precipitation events in storm resolving global climate models within the NextGEMS project, EGU General Assembly 2023, Vienna, Austria, 23–28 Apr 2023, EGU23-8455, https://doi.org/10.5194/egusphere-egu23-8455, 2023.

An abnormal episode of high rain or snow is classified as heavy precipitation; its extreme intensity and driver mechanisms can vary a lot depending on location and season. The most extreme events can turn into a severe impact at ground (in terms of flood or flash-flood, human casualties and injuries, ecosystem and economy damages and losses).

We have implemented a method to detect the most extreme precipitation events trough 10-year long dataset of high-resolution observations and built on a list of the most disastrous ones occurred between 2000 and 2009 within the so called great alpine region (1°–17° East, 40°–50° North).

The method is then applied to the models belonging to the coordinated experiment CORDEX-FPS dedicated to convection and the ensemble at the convection permitting  scale is able to represent the 70% of such kind of extreme events. The main drivers of the extreme precipitation are analysed and the factors affecting the model ability in correctly reproducing the unsuccessful cases are also investigated.

The same framework has been applied also to the model projections under the RCP8.5 scenario to study the sensitivity of such episodes and of their driving mechanisms to the climate change. The extreme events are projected to increase in frequency especially in the fall season over sub-regions with prevailing orographic forcing, whereas the events related to complex mesoscale interactions are projected to affect larger areas at the end of the century, posing the conditions of increased flood risk.

How to cite: Pichelli, E. and the CORDEX-FPSCONV Team: Detection of disastrous convective events in the great alpine region and analysis of their sensitivity to the climate change, EGU General Assembly 2023, Vienna, Austria, 23–28 Apr 2023, EGU23-11196, https://doi.org/10.5194/egusphere-egu23-11196, 2023.

EGU23-12221 | ECS | Posters on site | CL2.4

Applying a scaling approach for extreme precipitation to disentangle thermodynamic and dynamic contributions to CORDEX-FPS simulations​ 

Nicole Ritzhaupt, Stefan P. Sobolowski, and Douglas Maraun and the the CORDEX Flagship Pilot Study on Convection over Europe and the Mediterranean – ensemble

The response of the hydrological cycle to global warming is one of the greatest concerns of climate change. Especially, extreme precipitation can lead to severe physical and economic impacts on human and natural systems. Though extreme precipitation is expected to increase over many land areas an important question remains: which factors drive the uncertainty in extreme precipitation? Answering this will help better understand, prepare for, and ultimately, predict future extreme precipitation. 

In this study, we use a scaling approach for extreme precipitation events developed by O’Gorman and Schneider (2009) to disentangle the thermodynamic and dynamic contributions to these events. Extreme precipitation is scaled by the vertical integral over the product of the vertical velocity (ω; dynamic contribution) and the derivation of the saturation specific humidity (; thermodynamic contribution):

We apply this scaling approach to a subset of the CORDEX-FPS ensemble and focus on change signals of seasonal extremes of daily precipitation for two 10-year periods (2090-2099 vs 1996-2005). By keeping either the first term or the second term in the formula constant over the entire time period we obtain the thermodynamic and dynamic signal, respectively. The thermodynamic signal is quite homogeneous over the domain, approximately in the order of Clausius-Clapeyron scaling (~ 7%/K), while the dynamic signal modifies the thermodynamic signal. Thus, the dynamic contribution, which is represented by vertical wind, is key in understanding differences between models and uncertainty in precipitation changes. The vertical wind profiles show, especially for summer, that the vertical winds during extreme events weaken in the future period compared to the historical period. This seemingly counterintuitive result could be due to more downdrafts leading to extreme precipitation in the future period instead of updrafts. However, a comprehensive interpretation is the subject of ongoing research.

How to cite: Ritzhaupt, N., Sobolowski, S. P., and Maraun, D. and the the CORDEX Flagship Pilot Study on Convection over Europe and the Mediterranean – ensemble: Applying a scaling approach for extreme precipitation to disentangle thermodynamic and dynamic contributions to CORDEX-FPS simulations​, EGU General Assembly 2023, Vienna, Austria, 23–28 Apr 2023, EGU23-12221, https://doi.org/10.5194/egusphere-egu23-12221, 2023.

EGU23-13414 | ECS | Posters on site | CL2.4

Spatial and temporal patterns of tropical forest microclimate in Mount Kenya 

Jinlin Jia, Alice C. Hughes, Erone Ghizoni Santos, Petri K.E. Pellikka, and Eduardo Eiji Maeda

Tropical-mountane forests are global biodiversity hotspots, and also play important roles in regional hydrological systems. Yet, climate and especially microclimate in these areas, and how they vary spatially and temporally have been largely neglected. Due to the buffering effect of vegetation, microclimate (i.e. environmental conditions experienced by organisms inside the forest) can be substantially different from the conditions outside the forests. Additionally, sparse meteorological stations and satellite data cannot provide accurate climate estimates over tropical mountains, especially on microclimate under the canopy. Consequently, further research is needed to clarify the spatial and temporal patterns of environmental conditions in these regions.

In this study, we set 16 microclimate sensors on the southern and southeastern slopes of Mount Kenya, with an elevation range of 720 m (from 1730 m a.s.l. to 2450 m a.s.l) across the Lower Montane Wet Forest. The sensors measured understory air temperature and soil moisture every 15-minutes across a 2-year period.

We found that average soil moisture in the study area varied with monthly precipitation, synchronously increasing with the start of the rainy seasons, but decreasing with a approximate one month lag towards the dry seasons. Soil moisture did not have a linear relationship with altitude, presenting a local minimum at about 2050 m a.s.l.. The understory air temperature changed linearly with altitude, whereas the lapse rate varied across seasons. The seasonal variation of diurnal lapse rate was about three times larger than that during the night. For the intra-daily temperature, minimums occured simultaneouly (at 4:30 am) independently of altitude. Conversely, at higher altitudes, the maximum temperature occurred earlier. The lowest average daily temperature and smallest daily temperature range occurred between June and August, whilst the opposite phenomena occurred from January to March. Furthermore, Jan-Feb-Mar also presented the smallest lapse rate and low soil moisture, representing the main period of vegetation growth. Our results will contribute for clarifying the conditions sustaining the disproportionally high biodiversity and biomass observed in tropical mountain forests. Further research will investigate the drivers and biophysical feedbacks of microclimate, as well as their sensitivity to climate change.

How to cite: Jia, J., Hughes, A. C., Santos, E. G., Pellikka, P. K. E., and Maeda, E. E.: Spatial and temporal patterns of tropical forest microclimate in Mount Kenya, EGU General Assembly 2023, Vienna, Austria, 23–28 Apr 2023, EGU23-13414, https://doi.org/10.5194/egusphere-egu23-13414, 2023.

EGU23-13843 | ECS | Posters on site | CL2.4

How does the assessment of extreme precipitation profit from convection permitting climate ensembles? 

Marie Hundhausen, Hendrik Feldmann, Regina Kohlhepp, and Joaquim G. Pinto

In response to global warming, an intensification of extreme precipitation has been observed, and models project this trend to continue. Since the return values of extreme precipitation events are regularly used in practice in the form of heavy rainfall hazard products, a reliable update of these products is required. Moreover, for resilient planning a projection of future conditions is urged by practice stakeholders.

A promising tool for projection are convection permitting climate simulations, which have been shown to better represent extreme precipitation events compared to coarser simulations and thus provide higher confidence in future extreme estimates. However, due to the large computation time of convection permitting simulations, evaluations are mostly based on single time slice experiments. Therefore, we explore the potential of an unique transient convection permitting (2.8 km) ensemble with COSMO-CLM regional simulations (1971-2100) over Germany, with four ensemble members driven by MPI-ESM-LR, EC-EARTH, CNRM-CM5, and HadGEM2-ES with the emission scenario RCP8.5. Extreme precipitation is derived over 30-year running time slices and the scales investigated span from hourly to 3-day event duration and return periods from 1 year to 100 years, representing the wide range of events considered for application.

Within the historical period (1971-2005) we found adequate agreement between the simulations and the observation data set KOSTRA with increasing bias with longer event duration. Furthermore, the climate change signal, derived as a relative value with regard to the historical period of the simulation, was found to increase with return period and for shorter durations. Strongest relative changes lie within the range of Clausius-Clapeyron-scaling with global warming. Analysis of the uncertainty revealed a substantial residual standard deviation of the linear approximation of the change signal over global warming, highlighting the benefit of a transient ensemble that enables a more robust estimation of the change signal of extreme events. Moreover, the results indicate an increased variance of future extreme precipitation.

How to cite: Hundhausen, M., Feldmann, H., Kohlhepp, R., and Pinto, J. G.: How does the assessment of extreme precipitation profit from convection permitting climate ensembles?, EGU General Assembly 2023, Vienna, Austria, 23–28 Apr 2023, EGU23-13843, https://doi.org/10.5194/egusphere-egu23-13843, 2023.

EGU23-13995 | Posters virtual | CL2.4

Climate change scenarios for IDF curves for mainland Portugal 

Cristina Andrade, Sandra Mourato, Rita Guimarães, and Claúdia Brandão

Rainwater drainage systems and other hydraulic infrastructure are scaled considering the intensity of precipitation and its probability of occurrence. The estimation of precipitation intensity through the analysis of the frequency of occurrence of extreme precipitation events is a key instrument for the dimensioning of hydraulic infrastructures and the associated risk of collapse. Sub- or over-estimated rainfall intensities can cause significant problems in various types of hydraulic infrastructures, including flood mitigation and support works due to flooding.

The aim of this study is to determine how climate change will influence extreme rainfall and, consequently, the future sizing of hydraulic systems, including rainwater drainage and hydraulic passages. Towards this aim, the Intensity-Duration-Frequency (IDF) curves were computed (durations between 24 and 72 hours), considering the historical period between 1950 and 2001, and for future precipitation projections (ensemble of biased-corrected Regional Climate Models, RCMs). The period 2041‒2070 under the RCP8.5 (Representative Concentration Pathways) and 2071‒2100 under the RCP4.5 and RCP8.5 emission scenarios were analyzed for 25 udometric stations studied in Brandão et al. (2001 and 2004) located in mainland Portugal.

Results show an increase in precipitation intensity, however, the differences between the projected IDF and those obtained with observed data (ERA5 dataset) for the 2, 5, 10, 20, 50, and 100 years return periods are not spatially uniform. The outcomes reveal North/South contrasts between the station’s IDFs, being also quite apparent in the influence of the orography.

Overall, this study is the first approach to the problem of extreme rainfall in a changing climate, due to the severe consequences of sudden floods and the resilience of territories and their hydraulic infrastructures to these extreme events. Therefore, planning of new policies and the dimensioning of new and existing infrastructures in the medium and long term is thus highly relevant.

Acknowledgment: This work was supported by National Funds by FCT - Portuguese Foundation for Science and Technology, under the project UIDB/04033/2020.

Keywords: Climate change, IDF curves, Hydraulic passages, Extreme precipitation, Drainage systems, Portugal.

How to cite: Andrade, C., Mourato, S., Guimarães, R., and Brandão, C.: Climate change scenarios for IDF curves for mainland Portugal, EGU General Assembly 2023, Vienna, Austria, 23–28 Apr 2023, EGU23-13995, https://doi.org/10.5194/egusphere-egu23-13995, 2023.

EGU23-14134 | ECS | Posters on site | CL2.4

Impact of orography on sub-daily precipitation upper tail from convection-permitting climate model simulations: a multi-model ensemble perspective 

Nathalia Correa Sánchez, Eleonora Dallan, Francesco Marra, Giorgia Fosser, and Marco Borga

Understanding the impact of orography on the probability distribution of extreme precipitation at short (i.e., sub-daily) temporal scales, as well as on extreme-rainfall causative processes, is critical for managing risk from rainfall-triggered natural hazards in mountainous regions. High-resolution convection-permitting models (CPMs) are crucial for this type of analysis since they better represent convective processes key to short-duration extremes.

Here, we assess the ability of multi-model CPM ensemble CORDEX-FPS to represent the upper tail of sub-daily precipitation in a complex-orography region in the Eastern Italian Alps. In this area, different orographic impacts on sub-daily precipitation upper tail were reported at different event durations, and significant temporal trends in precipitation intensity were reported during the last few decades, making it a challenging and interesting test case for CPM simulations. An ensemble of six CPMs with a horizontal grid spacing of 2.2 km, driven by ERA-Interim reanalysis, are analysed and evaluated against 180 rain gauges. Since CPM simulations are too short (10 years) for analysing extremes using conventional methods, we use a non-asymptotic statistical approach (Simplified Metastatistical Extreme Value, SMEV), which was proven to provide reliable results even using short time records. We explore how the model spread vary with elevation and the ability of the multi-model mean to reproduce the distribution parameters and the extreme quantiles up to 100-year return period at different elevations.

How to cite: Correa Sánchez, N., Dallan, E., Marra, F., Fosser, G., and Borga, M.: Impact of orography on sub-daily precipitation upper tail from convection-permitting climate model simulations: a multi-model ensemble perspective, EGU General Assembly 2023, Vienna, Austria, 23–28 Apr 2023, EGU23-14134, https://doi.org/10.5194/egusphere-egu23-14134, 2023.

Tropical-extratropical cloud bands are typical of the subtropical South American climate, occurring mainly during the rainy season and producing more than 60% of the seasonal precipitation. Thus, their correct representation in climate models is fundamental for the accuracy of simulated subtropical precipitation. Here, we investigate the occurrence of extreme precipitation during tropical-extratropical cloud band events, considering both observed and simulated events. We use outgoing longwave radiation (OLR) data from the National Oceanic and Atmospheric (NOAA) Climate Data Record (CDR) and precipitation from ERA5 reanalysis to identify the observed events. For simulated events, we use the UK Met Office Unified Model convective-permitting simulations considering two different configurations: a control run forced by a high-resolution global climate model (HadGEM3-GC3.1-n512) and a hindcast run forced by a reanalysis product (ERA-Interim) downscaled by an RCM. Both configurations have ten years of data at 4.5 km spatial resolution. The cloud bands are identified using an objective detection algorithm applied to OLR, as described by Zilli and Hart (2021). The convective-permitting simulations reproduce the location and seasonal cycle of observed cloud bands well. To select the extreme cloud band events, we choose the top 20% of events with (a) the most extensive land area with precipitation above a threshold; and (b) the largest average precipitation over the land areas with precipitation above a threshold. Cloud band events that fulfil both these extent and intensity criteria are considered extreme cloud band events. The precipitation threshold is defined as the precipitation rate with the largest fractional contribution to the cloud band's total precipitation over the land area. Extreme cloud band events are responsible for a significant fraction of the seasonal precipitation, with the largest precipitation rates occurring over subtropical latitudes. They occur throughout the cloud band season (NDJFM) but are more frequent during its onset (ND), particularly when considering only the transient ones (i.e., those events persisting less than three days). During persistent extreme cloud band events (i.e., those lasting for four or more days), the moisture anomalies are located mainly over Eastern Brazil and the adjacent tropical South Atlantic Ocean, with a similar but more intense than during all persistent events. On the other hand, transient extreme cloud band events are more dependent on the moisture from the western subtropical South Atlantic Ocean when compared to all transient events. The convective-permitting simulations adequately reproduce the ERA5 precipitation during the extreme cloud band events, despite biases in the intensity of the rain increasing the precipitation threshold values. Despite that, the convective-permitting simulations better represent the precipitation and extremes over subtropical latitudes, providing a valuable tool for improving the understanding and forecasting of cloud band-related extreme precipitation events. 

How to cite: Zilli, M. and Hart, N.: Extreme Precipitation during Tropical-Extratropical Cloud Bands over South America: comparing observations and Convective-Permitting Model simulations, EGU General Assembly 2023, Vienna, Austria, 23–28 Apr 2023, EGU23-15042, https://doi.org/10.5194/egusphere-egu23-15042, 2023.

EGU23-15059 | Orals | CL2.4

Evaluation of precipitation variability over the Sierra de Guadarrama 

Jesús Fidel González-Rouco, Emilio Greciano-Zamorano, Félix García-Pereira, Cristina Vegas-Cañas, Jorge Navarro-Montesinos, Elena García-Bustamante, Ernesto Rodríguez-Camino, and Esteban Rodríguez-Guisado

Heterogeneity in the occurrence, amount, and distribution of precipitation in mountainous areas is relevant for water resources and stresses the need for high-altitude observations and high-resolution modeling over complex terrain. However, the harsh weather conditions and the complex terrain associated with these environments hinder a continuous monitorization and pose challenges for regional climate models.

In this work, data from 37 stations located in the Sierra de Guadarrama and nearly lowlands, in Central Spain, and with altitudes ranging from 600 to 2200 m.a.s.l. have been studied. A few of the highest altitude sites belong to GuMNet facility (https://www.ucm.es/gumnet) and the rest to the Spanish Meteorological Agency (AEMET; https://www.aemet.es). These data have been compared to ERA5 reanalysis (https://confluence.ecmwf.int/display/CKB/ERA5) and to three different resolution (9, 3, and 1 km) outputs of a simulation of the regional climate model WRF (https://www.mmm.ucar.edu/WRF) during the period from 1990-2019. The comparison of the different data sources aims at characterizing the precipitation distribution over the area, assessing the goodness of ERA5, and the potential added value of the increasing resolution of WRF simulation in reproducing the observations.

Results show that the increase in WRF resolution from 9 to 3 km always produces a better representation of precipitation, whereas the step from 3 to 1 km shows a significant improvement at the highest altitudes, but an overestimation of precipitation at low plain areas. The lack of added value in the simulation at the highest resolution is discussed in relation to the parameterization of cumulus precipitation. Also, an altitudinal gradient of precipitation is observed and can be traced to large-scale precipitation.

How to cite: González-Rouco, J. F., Greciano-Zamorano, E., García-Pereira, F., Vegas-Cañas, C., Navarro-Montesinos, J., García-Bustamante, E., Rodríguez-Camino, E., and Rodríguez-Guisado, E.: Evaluation of precipitation variability over the Sierra de Guadarrama, EGU General Assembly 2023, Vienna, Austria, 23–28 Apr 2023, EGU23-15059, https://doi.org/10.5194/egusphere-egu23-15059, 2023.

EGU23-16649 | ECS | Posters on site | CL2.4

Mountain climate: one of the multipronged challenges in Ethiopia’s Agriculture 

Emnet Negash, Bert Van Schaeybroeck, Piet Termonia, Michiel Van Ginderachter, Kwinten Van Weverberg, Maarten Podevyn, and Jan Nyssen

The Ethiopian highlands are home to more than 90% of the Ethiopian population and constitute for 90% of total area suitable for agriculture (Hurni et al., 2010). The livelihood of 66% of Ethiopia’s population depends on subsistence agriculture, mostly rainfed. Little rainfall variability can therefore cause massive economic loss for farmers reliant on rain-fed agriculture, making differences in wealth among farmers on different sides of the mountain. This study aims at understanding the sub daily distribution of summer rain over the Ethiopian highlands using the ALARO-0 regional climate model at convection-permitting resolution of 4 km. The dependence on factors such as leeward or windward conditions, and elevation are explored to categorize and relate the diurnal cycles of surface variables including precipitation, wind speed, humidity, and temperature. Rainfall occurrence in these mountains is mainly influenced by circulation patterns, orography, surface heating and convection, making its distribution very heterogeneous. Elevation is the most important determinant factor leading to increased average rainfall and rainfall per rainfall event towards higher elevations. Ethiopia’s summer rain exhibits a pronounced diurnal cycle with the highest rainfall occurring during the early afternoon hours (12:00–16:00) and the minimum occurring in the late night (04:00–11:00). Windward average rainfall and rainfall per rainfall event are on average 0.05mm h-1 and 0.08 mm hr-1 (respectively) larger than leeward events, except during peak hours when leeward events have 0.05 mm higher average rainfall and rainfall per rainfall event. In contrast to average rainfall events, extreme events in the afternoon are often followed by another peak rainfall event at night. Leeward wind speed features a weak diurnal variation as compared to the strong contrast between day and night for windward wind speed. The diurnal cycles of temperature and humidity start earlier in the morning and recede later than the cycles of wind speed and rainfall. Moreover, rainfall peaks occur earlier in the day at higher elevations, and at night in valleys and in Afar Triangle. The prevalence of windward over leeward event probability, the stark contrast in wind speed diurnal cycle between windward and leeward events, and the early peak hour of dewpoint and air temperature all point towards temperature-induced rather than wind-induced convection. Rainfall-temperature dependence, in other words Clausius-Clapeyron relationship, in the lowlands such as the Afar triangle is however at its lowest due to moisture deficit. These differences are very likely to determine hydrology and vegetation distribution, and farmers economy at large.

How to cite: Negash, E., Van Schaeybroeck, B., Termonia, P., Van Ginderachter, M., Van Weverberg, K., Podevyn, M., and Nyssen, J.: Mountain climate: one of the multipronged challenges in Ethiopia’s Agriculture, EGU General Assembly 2023, Vienna, Austria, 23–28 Apr 2023, EGU23-16649, https://doi.org/10.5194/egusphere-egu23-16649, 2023.

EGU23-16986 | ECS | Posters virtual | CL2.4

The impact of climate change on fire danger over the contiguous United States 

Maria Klariza Madrazo, Huikyo Lee, Arezoo Khodayari, Weile Wang, Taejin Park, and Colin Raymond

Recent extreme heat events, especially those that have occurred in the Western United States (WUS), are fueling wildfires and funneling smoke at an unprecedented level, impacting air/water quality and leading to an increase in respiratory hospitalizations. Under greenhouse warming, extreme weather conditions that favor wildfire ignition are expected to occur more frequently over the contiguous United States (CONUS). Therefore, predicting wildfire danger under a changing climate is essential in managing future wildfires and protecting the welfare of people and the environment. In response to mitigating wildfire risks, the Canadian Fire Weather Index (FWI) was developed to provide a numeric rating representing the intensity of a spreading fire. In this work, we utilized fine-scale (0.25° x 0.25°) daily meteorological inputs from thirty-five general circulation models in NASA Earth Exchange Global Daily Downscaled Projections Coupled Model Intercomparison Project Phase 6 (NEX-GDDP-CMIP6) data to calculate the FWI. Using the daily maximum temperature, relative humidity, wind speed, and precipitation from NEX-GDDP-CMIP6, we calculated the FWI of historical and future simulations from the periods of 1950 to 2100 under different emission scenarios (Shared Socioeconomic Pathways 2-4.5 and 5-8.5). We have analyzed the FWI for the GISS-E2-1-G model, which indicates a 2-3% increase per decade in future fire danger under both emission-pathway-driven climate scenarios during the dry season in the Southwestern US. We have found that the FWI climatology in the Southwestern US during the Summer presents high to extreme fire danger (> 50) and higher FWI values in the future compared to historical observations. Moreover, we have explored the uncertainties across multiple models using NEX-GDDP-CMIP6 statistically downscaled data and found a significant spread of the FWI across the models for historical observations and future simulations. To correlate the link between the FWI and actual fire occurrence, we will calculate the FWI using reanalysis data (MERRA-2) and validate the FWI with actual fire occurrence data from Global Fire Emissions Database (GFED) with a special emphasis on the WUS. While supporting the US NCA and NASA’s Climate Adaptation Service Investigator (CASI), we will also try to contribute FWI to NASA’s FireSense, an initiative to bring an Earth systems approach to improving wildfire and wildland fire management.

How to cite: Madrazo, M. K., Lee, H., Khodayari, A., Wang, W., Park, T., and Raymond, C.: The impact of climate change on fire danger over the contiguous United States, EGU General Assembly 2023, Vienna, Austria, 23–28 Apr 2023, EGU23-16986, https://doi.org/10.5194/egusphere-egu23-16986, 2023.

Humid heat extremes, taking account of both temperature and humidity, have adverse impacts on society, particularly on human health. It has been suggested that quasi-stationary waves (QSWs) with anomalously high amplitudes contribute to the occurrence of near-surface precipitation extremes and temperature extremes in the mid-latitudes of Northern Hemisphere. While little attention is paid to the linkages between amplified QSWs and humid heat extremes. Using the ERA5 dataset, we identify amplified QSWs of zonal wavenumbers 5-7 (Wave 5-7) in summer months from 1979 to 2020. These amplified QSWs show clear circumglobal wave patterns horizontally and nearly barotropic structure vertically. Linking amplified Wave 5-7 to wet-bulb temperature (WBT) extremes, we find that amplified QSWs preferentially induce prominently prolonged WBT extremes in specific regions: north-central North America for amplified Wave 5; western United States, south-central Asia, as well as eastern Asia for amplified Wave 6; western Europe and the Caspian Sea region for amplified Wave 7. Analyses of physical processes indicate that accompanied by the amplification of Wave 5-7, the changes in horizontal temperature advection, adiabatic heating, downward solar radiation, moisture transport and moisture flux convergence, and surface latent heat fluxes largely account for the increase in persistence of WBT extremes.

How to cite: Lin, Q. and Yuan, J.: Linkages between Amplified Quasi-stationary Waves and Humid Heat Extremes in Northern Hemisphere Midlatitudes, EGU General Assembly 2023, Vienna, Austria, 23–28 Apr 2023, EGU23-78, https://doi.org/10.5194/egusphere-egu23-78, 2023.

EGU23-505 | ECS | Posters virtual | CL2.5

Investigating the Changing Heavy Rainfall Climatology of North East India 

Aniket Chakravorty, Shyam Sundar Kundu, and Shiv Prasad Aggarwal

The increase in the variability of rainfall as the climate of the world warms up is a concern for many regions. Studies in the past have associated this change in variability to rise in heavy rainfall events. Thus a regional analysis of heavy rainfall characteristics to evaluate its response to a changing climate becomes important. In this study, we are putting this focus on the North East Region (NER) of India, which boasts of being one of the wettest regions of the world. This study examines the heavy rainfall characteristics from 1901 till 2020 over NER using the IMD gridded daily rainfall product. The examination showed that although the annual and monsoonal rainfall over the NER has been decreasing, the intensity of heavy rainfall has increased by ~5mm over the decades. Singular Spectrum Analysis is used to identify the long-term trend, which showed a change in heavy rainfall characteristics around 1970 and hence further investigation is carried out over two time blocks (Pre-1970: 1901-1970 and Post-1970: 1971-2020). The investigation of the frequency of heavy rainfall events showed that its increasing trend, prior to 1970, transitions to a decreasing trend, post 1970. It also showed that the area under a negative trend of frequency has increased significantly after 1970. Furthermore, a non-parametric probability distribution approach has also been implemented to interpret the frequency and intensity relationship of heavy rainfall together. This showed that post 1970, the probability of occurrence of a very heavy or extreme rainfall events has increased. The increase in probability did show a spatial variability. The increase in probability is more for the pre-monsoon season compared to the monsoon. This finding corresponds to the fact that the contribution of pre-monsoon rainfall to annual rainfall has increased while that of the monsoon rainfall has decreased over the decades. To investigate the local causes of the observed changes, the 2m temperature (T2), 2m Dew-point temperature (TD2) are investigated using a cross-sample entropy analysis. Interestingly, both T2 and TD2 showed a significant increasing trend over NER. Coincidentally, locations with increasing heavy rainfall intensity and frequency are also the locations with increasing TD2. Also, the pre-monsoon show a stronger increase in TD2, i.e., more moisture is available for convection, compared to T2, which could explain the higher probability of heavy rainfall events. Thus, increasing intensity and decreasing frequency can be explained by the inter-relationship between T2, TD2 and the convective processes.

How to cite: Chakravorty, A., Kundu, S. S., and Aggarwal, S. P.: Investigating the Changing Heavy Rainfall Climatology of North East India, EGU General Assembly 2023, Vienna, Austria, 23–28 Apr 2023, EGU23-505, https://doi.org/10.5194/egusphere-egu23-505, 2023.

Rainfall is an essential climatic parameter for any region, and it can have a significant socioeconomic impact on society. In this study, the trend analysis of rainfall data of the Ajay River Basin was performed for daily rainfall data from the APHRODITE dataset. It is a gridded dataset with a resolution of 0.25*0.25 degree latitude and longitude with 1951 to 2007 long time series for Asia. The non-parametric Mann-Kendall test was used to detect the monotonic trend in the rainfall time series and the Theil-Sen estimator to look at the magnitude of the change. The quantile perturbation method is used for extreme rainfall analysis. The study reveals that total annual rainfall and the monsoon period (June, July, August, September) have increased over the basin's southern part at a 5% significance level. In the pre-monsoon period (March, April, May) rainfall has increased all over the basin area at the 5% significance level. Extreme rainfall anomalies were found in most of the basin region, but some periods had very high perturbation. In the 1950-1960s, the northern area of the basin showed statistically significant negative anomalies, while the southern region showed significant positive anomalies. The 1970-1980s was the period of the highest significant positive anomalies, with up to 110% change. Significant negative anomalies dominated most of the southern basin from 1980 to 2000. The study concluded that although total rainfall has increased, extremes have decreased in the region.

How to cite: Mandraha, S. and Ray, S.: Trend analysis of total, seasonal and extreme rainfall data for Ajay River Basin, West Bengal., EGU General Assembly 2023, Vienna, Austria, 23–28 Apr 2023, EGU23-628, https://doi.org/10.5194/egusphere-egu23-628, 2023.

Three extreme cold events successively occurred across East Asia and North America in the 2020/21 winter. This study investigates the underlying mechanisms of these record-breaking persistent cold events from the isentropic mass circulation (IMC) perspective. Results show that the midlatitude cold surface temperature anomalies always co-occurred with the high-latitude warm anomalies, and this was closely related to the strengthening of the low-level equatorward cold air branch of the IMC, particularly along the climatological cold air routes over East Asia and North America. Specifically, the two cold surges over East Asia in early winter were results of intensification of cold air transport there, influenced by the Arctic sea ice loss in autumn. The weakened cold air transport over North America associated with warmer northeastern Pacific sea surface temperatures (SSTs) explained the concurrent anomalous warmth there. This enhanced a wavenumber-1 pattern and upward wave propagation, inducing a simultaneous and long-lasting stronger poleward warm air branch (WB) of the IMC in the stratosphere and hence a displacement-type Stratospheric Sudden Warming (SSW) event on 4 January. The WB-induced increase in the air mass transported into the polar stratosphere was followed by intensification of the equatorward cold branch, hence promoting the occurrence of two extreme cold events respectively over East Asia in the beginning of January and over North America in February. Results do not yield a robust direct linkage from La Niña to the SSW event, IMC changes, and cold events, though the extratropical warm SSTs are found to contribute to the February cold surge in North America.

How to cite: Yu, Y.: An Isentropic Mass Circulation View on the Extreme Cold Events in the 2020/21 Winter, EGU General Assembly 2023, Vienna, Austria, 23–28 Apr 2023, EGU23-1192, https://doi.org/10.5194/egusphere-egu23-1192, 2023.

EGU23-1579 | ECS | Orals | CL2.5

Anthropogenic impact on the severity of compound extreme high temperature and drought/rainy events in China 

Wanling Li, Huijun Wang, Rufan Xue, Huixin Li, Mingkeng Duan, Xiaochun Luo, and Wenwen Ai

Extreme events seriously affect human health and natural environment. In the present study, several indexes that can describe the severity of compound extreme high temperature and drought/rainy events (CHTDE/CHTRE) are constructed based on copulas. According to observations, CHTDE and CHTRE have intensified in most areas of China during 1961–2014. The significant increase trend in the severity of CHTDE and CHTRE is basically consistent with simulations under historical anthropogenic forcing. This result proves that changes in CHTDE can be largely attributed to anthropogenic climate change. The historical greenhouse gas forcing is identified to be the dominant factor that affects the severity of CHTDE in China, particularly in the Tibetan Plateau and Northwest China. Moreover, the contribution of anthropogenic forcing to the linear change of the CHTRE severity in China is more than 90%. In addition, the ozone and land use signals also can be detected on change of CHTDE and CHTRE.

How to cite: Li, W., Wang, H., Xue, R., Li, H., Duan, M., Luo, X., and Ai, W.: Anthropogenic impact on the severity of compound extreme high temperature and drought/rainy events in China, EGU General Assembly 2023, Vienna, Austria, 23–28 Apr 2023, EGU23-1579, https://doi.org/10.5194/egusphere-egu23-1579, 2023.

EGU23-1580 | ECS | Orals | CL2.5 | Highlight

Future projections of meteorological, agricultural and hydrological droughts in China using the emergent constraint 

Rufan Xue, Wanling Li, Huixin Li, Xiaochun Luo, and Wenwen Ai

In the context of global warming, droughts occur more frequently and have caused great losses to human society. Therefore, understanding the potential changes in future droughts under climate change is of great scientific importance. In this paper, combining with climate models from CMIP6, the emergent constraint and the Model Goodness Index (MGI) are used to analyze the characteristics of meteorological, agricultural and hydrological droughts in China under four socioeconomic scenarios in the mid- and late 21st century. The results show that in the mid-21st century, there will be more frequent meteorological, agricultural and hydrological droughts in northern China. In the late 21st century, longer and more intense droughts are more likely to occur in China than in the mid-21st century. This indicates that drought events in China will gradually become more continuous and serious from the middle to the late 21st century. Additionally, northwestern and central China will be the main areas where the three types of drought areas and extreme droughts will increase in the future. In the mid-21st century, a higher socioeconomic scenario will suppress drought, which will enhance drought conversely in the late 21st century. These findings are of great significance for drought monitoring under climate change and can provide a basis for making a drought response plan.

How to cite: Xue, R., Li, W., Li, H., Luo, X., and Ai, W.: Future projections of meteorological, agricultural and hydrological droughts in China using the emergent constraint, EGU General Assembly 2023, Vienna, Austria, 23–28 Apr 2023, EGU23-1580, https://doi.org/10.5194/egusphere-egu23-1580, 2023.

Southeastern South America (SESA), delimited between 38°S–25°S and 64°W–51°W, is characterized as one of the regions in the world with the highest frequency of occurrence of intense storms associated with deep convection, mainly during the spring and summer months (Zipser et al., 2006). These convective storm systems induce extreme precipitation events and produce most of the rain in the warm season (Rasmussen and Houze, 2016), generating significant damage (floods, intense winds, hail) and have a high impact on economic and social activities. Considering that the occurrence of extreme precipitation events in SESA is associated with the occurrence of certain synoptic patterns, the objective of this work was to detect the occurrence of extreme precipitation events from the synoptic patterns that induce these events, in spring (October to December, OND) and summer (January to March, JFM).

Daily data from the ERA5 reanalysis was used to detect recurring synoptic patterns associated with extreme precipitation events in the 1979-2013 calibration period. In order to identify a variety of precursor synoptic patterns of extreme precipitation events, the classification obtained from the principal component methodology (PCA) in orthogonally rotated T mode was used (Huth, 2000). To carry out the classification, the geopotential height was used at the 850 hPa level of the day prior to the occurrence of the extreme events (detected from the 95th percentile of the distribution of daily precipitation of the CPC Global Unified Gauge-Based Analysis of Daily Precipitation from the NOAA Climate Prediction Center). This classification resulted in two dominant synoptic situations for spring and summer. With the days obtained for each main component, compositions of the anomalies were made: the meridional component of the wind at the 850 hPa level, geopotential height at 850 and 500 hPa, and 200 hPa wind.

Based on the compositions made, an analog method was developed that was used to detect the occurrence of intense precipitation events in the verification period 2014-2021. In this methodology, two detection criteria were used, on the one hand, that the correlation coefficient between the fields of daily anomalies and the compositions are greater than a threshold and also that there is consistency between the sign of the daily meteorological variables with that of the compositions on certain grid points called hotspots regions.

For the evaluation of the analogue method, the F1 index developed by Gao et.al 2017 was used, which takes into account the number of true positives (TP), false positives (FP; type I error), and false negatives (FN; type II error).

How to cite: Martinez, D. and Solman, S.: Identification of extreme precipitation events in southeastern South America from their associated synoptic environment, EGU General Assembly 2023, Vienna, Austria, 23–28 Apr 2023, EGU23-1911, https://doi.org/10.5194/egusphere-egu23-1911, 2023.

EGU23-1945 | ECS | Orals | CL2.5

Explosive increase in convective Extreme El Niño events in the CO2 removal scenario 

Gayan Pathirana, Ji-Hoon Oh, Wenju Cai, Soon-Il An, Seung-Ki Min, Seo-Young Jo, Jongsoo Shin, and Jong-Seong Kug

Convective extreme El Niño (CEE) events, characterized by strong convective events in the eastern Pacific, are known to have a direct link to anomalous climate conditions worldwide, and it has been reported that CEE will occur more frequently under greenhouse warming. Here, using a set of CO2 ramp-up and –down ensemble experiments, we show that frequency and maximum intensity of CEE events increase further in the ramp-down period from the ramp-up period. Such changes in CEE are associated with the southward shift of the Intertropical Convergence Zone and intensified nonlinear rainfall response to SST change in the ramp-down period. The increasing frequency of CEE has substantial impacts on regional abnormal events and contributed considerably to regional mean climate changes to the CO2 forcings.

How to cite: Pathirana, G., Oh, J.-H., Cai, W., An, S.-I., Min, S.-K., Jo, S.-Y., Shin, J., and Kug, J.-S.: Explosive increase in convective Extreme El Niño events in the CO2 removal scenario, EGU General Assembly 2023, Vienna, Austria, 23–28 Apr 2023, EGU23-1945, https://doi.org/10.5194/egusphere-egu23-1945, 2023.

Summer hot and dry extremes (defined as high air temperature and low atmospheric humidity) in monsoon (climatologically high-humidity) region, may cause severe disasters, such as flash droughts. However, it remains unclear whether hot (dry) extremes are amplified on dry (hot) days to warming temperature. Here, taking eastern monsoon China (EMC) as a typical monsoon region, we find a fastest positive (negative) response of air temperature (atmospheric humidity) on driest (hottest) days to per unit warming, indicating amplified warming (drying) of hot (dry) extremes on dry (hot) days (i.e. coupling hotter and drier extremes) especially in southern EMC.  The southern EMC is also a hotspot where the coupling of hot and dry extremes has become significantly stronger during the past six decades. The increasing hot-dry extremes in southern EMC is associated with anomalies in large-scale environmental conditions, such as reduced total cloud cover, abnormal anticyclone in upper atmosphere, intense descending motion, and strong moisture divergence over this region. Land-atmosphere feedbacks play another important role in enhancing the hot-dry coupling via increasing land surface dryness (described as decreasing evaporation fraction). The decreasing evaporation fraction is associated with drying surface soil moisture which is controlled by decreases in pre-summer 1-m soil moisture and summer-mean precipitation. Given hot extremes (atmospheric humidity) are (is) projected to increase (decrease) in the future, it is very likely to witness more hot-dry days in monsoon regions and associated disasters, which should be mitigated by adopting adaptive measures. 

How to cite: zhang, X. and Gu, X.: Coupling hotter and drier extremes under elevating air temperature over eastern monsoon China, EGU General Assembly 2023, Vienna, Austria, 23–28 Apr 2023, EGU23-1982, https://doi.org/10.5194/egusphere-egu23-1982, 2023.

The influence of moisture recycling and transport on major drought events is poorly understood, but essential to enhance our knowledge of the atmospheric water cycle. Here, we investigate this for two record-breaking droughts over the Mid-to-Lower Reaches of the Yangtze River (MLRYR), the winter-spring (WS) drought of 2011 and summer-autumn (SA) drought of 2019. Using a land–atmosphere water balance framework, we find the precipitation recycling ratio (the percentage of precipitation in a region derived from the same region’s evaporation) increased during both droughts, especially for the SA drought (from 14.5% to 22.9%). The WS drought was characterized by a 27.8% reduction in external advected moisture, originating principally from the northeast China and Bohai Sea (reduced by 22.3%) and from the northwest Pacific and South China Sea (25.7%). The SA drought was driven by a 43.8% reduction in external advected moisture, originating mainly from a southwesterly path, i.e. the Bay of Bengal and the South China Sea (reduced by 26.8%). From a regional viewpoint, moisture transportation from the Pacific Ocean (and South China Sea) decreased during the WS (SA) droughts, mainly resulting in moisture deficit over the MLRYR. Analyses reveal that this reduction was driven by strong negative convergence, which was unfavorable for precipitation formation and enhanced air flow out of the MLRYR. The weakened moisture transport was principally driven by seasonal mean flow rather than transient eddies. Changes in wind (i.e. dynamic processes), rather than specific humidity (i.e. thermodynamic processes) were dominant in regulating the seasonal mean moisture transport. Our study helps understand the atmospheric water cycle anomalies driving extreme drought events, and advances knowledge on moisture transportation and its controlling processes.

How to cite: Guan, Y. and Gu, X.: Tracing anomalies in moisture recycling and transport to two record-breaking droughts over the Mid-to-Lower Reaches of the Yangtze River, EGU General Assembly 2023, Vienna, Austria, 23–28 Apr 2023, EGU23-2050, https://doi.org/10.5194/egusphere-egu23-2050, 2023.

Drylands play an essential role in Earth’s environment and human systems. Although dryland expansion has been widely investigated in previous studies, there is a lack of quantitative evidence supporting human-induced changes in dryland extent. Here, using multiple observational datasets and model simulations from phase 6 of the Coupled Model Intercomparison Project, we employ both correlation-based and optimal fingerprinting approaches to conduct quantitative detection and attribution of dryland expansion. Our results show that spatial changes in atmospheric aridity (i.e., the aridity index defined by the ratio of precipitation to potential evapotranspiration) between the recent period 1990–2014 and the past period 1950–74 are unlikely to have been caused by greenhouse gas (GHG) emissions. However, it is very likely (at least 95% confidence level) that dryland expansion at the global scale was driven principally by GHG emissions. Over the period 1950–2014, global drylands expanded by 3.67% according to observations, and the dryland expansion attributed to GHG emissions is estimated as ∼4.5%. Drylands are projected to continue expanding, and their populations to increase until global warming reaches ∼3.5℃ above preindustrial temperature under the middle- and high emission scenarios. If warming exceeds ∼3.5℃, a reduction in population density would drive a decrease in dryland population. Our results for the first time provide quantitative evidence for the dominant effects of GHG emissions on global dryland expansion, which is helpful for anthropogenic climate change adaptation in drylands.

How to cite: Shuyun, F. and Xihui, G.: Greenhouse gas emissions drive global dryland expansion but not spatial patterns of change in aridification, EGU General Assembly 2023, Vienna, Austria, 23–28 Apr 2023, EGU23-2063, https://doi.org/10.5194/egusphere-egu23-2063, 2023.

Based on the precipitation and minimum temperature data observed at the stations from 1981 to 2020, two types of winter cold air activity events in the middle-lower reaches of the Yangtze River are identified, which are strong cooling events with precipitation and only strong cooling events without precipitation (referred to as “cold-wet” and “cold-dry” events), respectively. The atmospheric circulation differences and the characteristics of cold and warm air activities in the two type events, and their connection with the jet stream are also examined. The results show that the frequency of cold air activity events in the middle-lower reaches of the Yangtze River decreases year by year, among which the frequency of cold-dry events decreases and the frequency of cold-wet events increases significantly. In addition, the cooling amplitude of cold-wet events is greater than that with no precipitation. When cold-wet events occur, the upper-level subtropical jet moves northward and the polar front jet is weaker. There is a tilting ridge in the middle level and the subtropical high is located westward. In the lower-level, the Siberian high is strengthened and the warm and humid air flowing from the southwest converges and ascends in the middle-lower reaches of the Yangtze River. However, when cold-dry events occur, the subtropical jet in the upper level is weaker and the polar front jet is stronger. The trough and ridge in the middle level are weaker and the subtropical high is located eastward. In the lower level, the Siberian high is located southward and the dry air flowing from the north diverges and sinks in the middle-lower reaches of the Yangtze River. In addition, compared with cold-wet events, the jet stream intensity index and the meridional wind position index fluctuate more frequently during cold-dry events, and the cold air activity duration is shorter.

How to cite: Zhang, Y. and Zhu, X.: Circulation differences between two types of winter extreme cold air activity events in the middle-lower reaches of the Yangtze River and their relationship with the jet stream, EGU General Assembly 2023, Vienna, Austria, 23–28 Apr 2023, EGU23-2192, https://doi.org/10.5194/egusphere-egu23-2192, 2023.

High temperatures and droughts pose a great threat to the human health, social economy and ecosystems. A large number of previous studies have focused on meteorological hot-dry events (based on temperature and precipitation), but there is a lack of comprehensive studies about hydrological hot-dry events (based on temperature and runoff). Here, using the ensemble empirical mode decomposition method and Copula function, we assess spatio-temporal evolution of global compound hot-dry events from temperature and runoff, and quantify their drivers based on monthly temperature and runoff data during 1902-2019. We find there is a significant warming at an unprecedented pace over the past 118 years, especially in the mid-latitudes of the Northern Hemisphere. However, changes in accumulated trends in precipitation and runoff show complex patterns globally. Probabilities of meteorological and hydrological hot-dry events both have been increasing significantly, but hydrological events are more likely to occur with higher spatial homogeneity, wider coverage and more severe damage. To analyze its underlying driving mechanism, we estimate quantitatively the contribution of high temperature, low runoff and the dependence between high temperature and low runoff to the compound event. High temperature plays a dominant role in the driving mechanism. In several regions, such as Australia, Europe and South America, hot-dry events could be considered as a potential hazard caused by increasing temperatures. Runoff deficit and dependence between the two, together with high temperature, exacerbate the occurrence of compound hot-dry events. Our findings provide a promising direction to predict joint probability of hot-dry events. Hydrological hot-dry events have seldom been considered, so far, in strategic policy formulation and risk assessment. Our results offer a powerful tool to improve planning and strategies to adapt to climate change.

How to cite: Min, R. and Gu, X.: Increasing likelihood of global compound hot-dry extremes from temperature and runoff during the past 120 years, EGU General Assembly 2023, Vienna, Austria, 23–28 Apr 2023, EGU23-2299, https://doi.org/10.5194/egusphere-egu23-2299, 2023.

Abstract EGU General Meeting – April 2023


Abstract for session CL2.9: Atmospheric circulation in different spatial scales as one of the main climate variability factor


Precipitation extremes in the Ukraine: dynamical aspects, large-scale circulation and moisture sources


Ellina Agayar1,2, Franziska Aemisegger1, Moshe Armon1, Alexander Scherrmann1, and Heini Wernli1


1Institute for Atmospheric and Climate Science, ETH Zürich, Zürich, Switzerland

2Odessa State Environmental University, Odessa, Ukraine


Changes in the occurrence of large-scale circulation regimes link with changes in the global and regional climate and affect the frequency of occurrence and intensity of weather extremes, including extreme precipitation events (EPE). Understanding such natural hazards and their drivers is essential to mitigate related risks. In specific regions of the Ukraine, especially the Ukrainian Carpathians and the Crimean Mountains, precipitation can last for several days leading to floods. In this study, we investigate the dynamics of EPEs (≥ 100 mm day-1) over the territory of Ukraine in the recent decades (1979-2019). The EPEs are identified based on precipitation observations from 215 meteorological stations and posts in Ukraine. The atmospheric parameters for the categorization of the weather types (WTs) associated with the EPEs, as well as for composite studies and trajectory calculations were taken from ERA5 reanalyses. The identification of moisture sources contributing to extreme precipitation in Ukraine is based on the computation of kinematic backward trajectories and the subsequent application of a moisture source identification scheme based in the humidity mass budget along these trajectories.

By analysing the large-scale atmospheric circulation from reanalysis products, a four-class weather type (WT) classification of days with extreme precipitations in Ukraine is performed. The largest values of precipitation and greatest likelihood of EPEs occur in the WTs “Southerly cyclones and troughs” (45.1%) and “Easterly and South-Easterly cyclones and troughs” (23.2 %). The resulting WTs are assessed in terms of frequency of occurrence, seasonality, thermodynamic structure, and the spatial pattern of the large-scale flow, which allow identifying the main mechanisms for the formation of EPEs over Ukraine. Results show a clear spatial division in EPE occurrence, with summer and autumn being the seasons of highest EPE frequency in the western, south-western and eastern Ukraine. The last part of this study is dedicated to defining the origin, uptake characteristics, and transport pathways of moisture that precipitates during EPEs in Ukraine.


How to cite: Agayar, E.: Precipitation extremes in the Ukraine: dynamical aspects, large-scale circulation and moisture sources, EGU General Assembly 2023, Vienna, Austria, 23–28 Apr 2023, EGU23-2647, https://doi.org/10.5194/egusphere-egu23-2647, 2023.

EGU23-2866 | ECS | Orals | CL2.5 | Highlight

Unravelling the origin of the atmospheric moisture deficit that leads to droughts 

Luis Gimeno-Sotelo, Rogert Sorí, Marta Vázquez, Raquel Nieto, Sergio M. Vicente-Serrano, and Luis Gimeno

Drought is the main natural hazard at the planetary scale and although this is a very complex phenomenon that involves many aspects of the hydrological cycle, there is always a deficit of precipitation compared to usual, understanding usual as climatological. This deficit can occur essentially for three reasons, either because there is less moisture available in the air column or because there is less atmospheric instability that forces air to rise, or for both reasons simultaneously. As the existing local humidity in the air column is mostly insufficient to justify precipitation, less humidity available for precipitation implies a deficit in the moisture which reaches the site in question. Therefore, on a global scale, moisture transport deficits lead to the occurrence of droughts.

In a first approximation, this humidity can have two origins, or comes directly from the ocean, or is subsequently recycled from the continents themselves. The processes that control the evaporation over oceans or the continents as well as the moisture transport are very different, and there is a variable relationship between the oceanic and terrestrial origin of precipitation both globally and regionally. In a second approximation, the main sources of humidity at a global level are those regions where evaporation greatly exceeds precipitation over them, which mainly occurs in the subtropical oceans, some inland seas, and the two continental areas known as green oceans, the Amazon and the Congo basins.

It is known where the humidity coming from the whole ocean or the whole continent precipitates, as well as the sinks of the humidity that comes from these large individual sources. It has also been studied how anomalous moisture transport affects droughts in specific regions, but the probability of occurrence of droughts at a planetary scale on continental areas given a deficit of the moisture transported from the global oceanic area, the global continental area, and each of these major sources has not been fully evaluated. Here we make use of a Lagrangian approach widely used and checked, which consists of estimating how much precipitation comes from the humidity arriving from a specific moisture source and enables to reveal the origin of the atmospheric moisture deficit underlying the occurrence of droughts. 

How to cite: Gimeno-Sotelo, L., Sorí, R., Vázquez, M., Nieto, R., Vicente-Serrano, S. M., and Gimeno, L.: Unravelling the origin of the atmospheric moisture deficit that leads to droughts, EGU General Assembly 2023, Vienna, Austria, 23–28 Apr 2023, EGU23-2866, https://doi.org/10.5194/egusphere-egu23-2866, 2023.

This study finds a significant negative correlation between the December–February mean surface temperature (Ts_DJF) and the following June–August mean surface temperature (Ts_JJA) in South Korea for the period 1991–2017. This indicates that colder winters tend to precede hotter summers with extreme seasonality, while mild winters generally precede mild summers. This winter-to-summer association can be attributed to persistent atmospheric circulation anomalies on the Eurasian continent during the preceding winter and spring characterized by cyclonic circulations in Europe and East Asia and anti-cyclonic circulation in the Arctic regions. Resembling a negative Arctic Oscillation (AO) pattern combined with a negative Polar/Eurasia (PE) pattern, these atmospheric patterns tend to cause colder winters in South Korea and to increase the springtime sea surface temperatures in the western tropical Pacific (WTP) and in the North Atlantic (tripole pattern, NATRI). High WTP and NATRI values induce summertime anti-cyclonic circulations and then hotter summers in Korea with different pathways, the former via northward Rossby wave propagation in response to strong convection over a warm Philippine Sea and the latter via both extratropical Rossby wave propagation from the North Atlantic to East Asia and tropical connections from the tropical Atlantic to the Indian Ocean and then increased summer precipitation in South Asia. Under the opposite conditions (e.g., positive AO and PE phases in winter and negative WTP and NATRI), mild summers are preceded by mild winters. Since the early 1990s, the aforementioned atmospheric circulation anomalies during winter have shown greater persistence, creating the negative correlation between Ts_DJF and Ts_JJA. These findings provide useful information for the long-lead prediction of summer temperatures and heat waves in South Korea.

How to cite: Myoung, B.: Recent Trend of Cold Winters Followed by Hot Summers in South Korea due to the Combined Effects of the Warm Western Tropical Pacific and North Atlantic in Spring, EGU General Assembly 2023, Vienna, Austria, 23–28 Apr 2023, EGU23-2985, https://doi.org/10.5194/egusphere-egu23-2985, 2023.

Climate change can be reflected in terms of  shift in mean climatology as well as shift in the distribution of rainfall and temperature extremes over time. Southern Africa has distinct climate regimes that includes arid and semi-arid climates as well as relatively humid climate. This results in distinct spatio-temporal response of the region to climate change. In this study, major extreme climate indices for the region are derived from daily CHIRPS rainfall, ERA-Interim minimum, maximum and average temperatures to understand the spatio-temporal variability. The long term mean of the coldest annual day-time maximum temperature (90thpercentile) is observed over Lesotho highlands and adjoining areas in South Africa (21.0oC) whereas the warmest day-time temperature (37.4oC) is observed over areas bordering South Africa, southern Botswana and Namibia during the recent four decades. The trend in this indices shows warming (up to 1oC/decade) over southwestern South Africa, along coastal strips of South Africa, much of Mozambique, northwestern Zimbabwe, northern and western Zambia, eastern Angola and cooling over central Botswana. The annual night-time minimum temperature (10th percentile) is increasing northward in contrast to day-time maximum temperature which, in addition, exhibits zonal gradient. In terms of frequency, 10 to 12% of  the days in a year experienced maximum temperature above 90th percentile whereas 9 to 11 % of the days in a year observe night-time minimum temperature below 10th percentile. The annual heat wave duration indices show longest duration (8 days) over Southern Angola, northern Namibia, southern  Zambia, northern Zimbabwe and Botswana and decrease from here northward and southward. Annual number of days with rainfall  above 10 mm is about 10 days over western South Africa, Botswana, southern Zimbabwe, Namibia and southern Angola. In contrast,  it is in the range of 32 to 74 days over northern Angola, Zambia and Mozambique with increasing trend over Botswana, eastern parts of Zambia and Angola.  Similar trend in maximum 5 to 10 day total rainfall is observed over the same areas. Central part of the Southern Africa region exhibits the highest annual continuous dry days (147 to 254 days) whereas the southern and northern parts of the region has the lowest annual continuous dry days ( about 76 days). The long term mean of maximum annual continuous wet days increases northward from 3 days over western parts of South Africa and Namibia to 21 days over  Angola and northern Malawi. Besides secular trend, the rainfall extreme indices have coherent cyclic modes of variability with a period of 3.6 to 3.8 years accounting for 9 to 12 % of the total variance whereas the temperature extreme indices show periodicity of about 2.5 years accounting for 18 to 19% of the total variance. The periodicities are possibly associated with ENSO events that modulate interannual variability.

How to cite: Mengistu Tsidu, G.: Spatio-temporal variability of rainfall and temperature extremes over Southern Africa, EGU General Assembly 2023, Vienna, Austria, 23–28 Apr 2023, EGU23-3037, https://doi.org/10.5194/egusphere-egu23-3037, 2023.

Observations have shown sub-seasonal reversal of temperature anomalies between early and late winter over Eurasia, which is distinct from the seasonal mean condition. Based on the reanalysis data, the 1800-year control simulation and the 40-member ensemble simulations in 1920–2100 from the Community Earth System Model (CESM) Large Ensemble (CESM-LE), this study reveals that the reversal of surface air temperature (SAT) anomalies between early and late winter is one of the dominant and intrinsic features of the Arctic-Eurasian winter climate. Such a reversal is characterized by “colder Arctic, warmer Eurasia” in December (January–February) and ‘warmer Arctic, colder Eurasia’ in January–February (December). Robust climate dynamic processes associated with the reversal of SAT anomalies, including sub-seasonal reversals of anomalies in the Ural blocking, mid-latitude westerlies and stratospheric polar vortex, are found in both reanalysis data and CESM simulations, indicating the important role of internal atmospheric variability. Further analysis reveals that the reversal of Ural blocking anomalies in late December can be a potential precursor for the reversal of SAT anomalies in late winter. The reversal of mid-latitude westerly wind anomalies associated with the Ural blocking can affect upward propagation of planetary-scale waves especially with wavenumber 1, subsequently promoting the contribution of stratospheric polar vortex to the reversal of SAT anomalies in late winter over the Arctic-Eurasian regions. Such a troposphere-stratosphere pathway triggered by the perturbation of tropospheric circulations is confirmed by the CESM-LE simulations, and it may be useful for the prediction of sub-seasonal reversal of SAT anomalies.

How to cite: Xu, X.: Atmospheric contributions to the reversal of surface temperature anomalies between early and late winter over Eurasia, EGU General Assembly 2023, Vienna, Austria, 23–28 Apr 2023, EGU23-4395, https://doi.org/10.5194/egusphere-egu23-4395, 2023.

EGU23-4726 | Posters on site | CL2.5

Record-breaking High Temperature in July 2021 over East Sea and Possible Mechanism 

MinHo Kwon, Kang-Jin Lee, and Hyun-Woo Kang

As climate change due to global warming continues to be accelerated, various extreme events become more intense, more likely to occur and longer-lasting on a much larger scale. Recent studies show that global warming acts as the primary driver of extreme events and that heat-related extreme events should be attributed to anthropogenic global warming. Among them, both terrestrial and marine heat waves are great concerns for human beings as well as ecosystems. Taking place around the world, one of those events appeared over East Sea in July 2021 with record-breaking high temperature. Meanwhile, climate condition around East Sea was favorable for anomalous warming with less total cloud cover, more incoming solar radiation, and shorter period of Changma rainfall. According to the results of wave activity flux analysis, highly activated meridional mode of teleconnection that links western North Pacific to East Asia caused localized warming over East Sea to become stronger.


How to cite: Kwon, M., Lee, K.-J., and Kang, H.-W.: Record-breaking High Temperature in July 2021 over East Sea and Possible Mechanism, EGU General Assembly 2023, Vienna, Austria, 23–28 Apr 2023, EGU23-4726, https://doi.org/10.5194/egusphere-egu23-4726, 2023.

EGU23-5494 | ECS | Posters on site | CL2.5 | Highlight

Understanding the Potential Changes in Causal-Physical Drivers of Extreme Mei-yu Precipitation and Potential Applications 

Kelvin S. Ng, Gregor C. Leckebusch, and Kevin I. Hodges

Accurate predictions of extreme Mei-yu precipitation (MYR) over China for near-term and long-term climate is crucial.  This is because such information is essential for decision and policy makers to develop optimal strategies to mitigate any negative socioeconomic impact which could be caused by changes in MYR. While the performance of climate models has improved substantially over the past few decades, accurate prediction of MYR remains an open challenge. On the other hand, climate models often have a better representation of the large-scale climate modes (LSCMs) and many studies have suggested some LSCMs and MYR are related. A recent study has demonstrated the representation of MYR in climate models can be improved by using causality-guided statistical models (CGSMs) based on LSCMs causally related to MYR as predictors. However, the potential changes in these causal-physical drivers on (multi-)decadal timescale has not previously been considered. In this presentation, we present the preliminary results on the potential changes in causal-physical drivers, which govern MYR, on (multi-)decadal timescales. A potential application of such information for decadal prediction systems is also discussed.

How to cite: Ng, K. S., Leckebusch, G. C., and Hodges, K. I.: Understanding the Potential Changes in Causal-Physical Drivers of Extreme Mei-yu Precipitation and Potential Applications, EGU General Assembly 2023, Vienna, Austria, 23–28 Apr 2023, EGU23-5494, https://doi.org/10.5194/egusphere-egu23-5494, 2023.

EGU23-5554 | Posters on site | CL2.5 | Highlight

Changes in snow accumulation and snow depth in Slovakia in the 1921 – 2021 period 

Pavel Fasko, Ladislav Markovič, and Oliver Bochníček

Warming surface temperatures have driven a substantial reduction in the extent and duration of Northern Hemisphere snow cover. Analysis of the long-term snow cover data can provide an exact picture on the climate change induces changes. Slovak Hydrometeorological Institute maintains a network of 113 precipitation measuring stations with daily observations of the snow cover depth since 1921. This paper presents analysis of the cumulative snow cover depth in the territory of Slovakia in the period 1921 - 2021. Such an approach to processing can effectively point to changes in the seasonal development of the snow cover. The results show that, in general, we observe a decrease in the snow cover, which began to become more pronounced especially in the course of the 21st century. The magnitude and speed of the detected change is significantly influenced not only by the altitude of the precipitation gauge, but also by its geographical location.

How to cite: Fasko, P., Markovič, L., and Bochníček, O.: Changes in snow accumulation and snow depth in Slovakia in the 1921 – 2021 period, EGU General Assembly 2023, Vienna, Austria, 23–28 Apr 2023, EGU23-5554, https://doi.org/10.5194/egusphere-egu23-5554, 2023.

EGU23-5767 | Posters on site | CL2.5

Dynamic and thermodynamic effects driving anomalous precipitation over Amazon 

Fernanda Cerqueira Vasconcellos and Laurent Li

Anomalous rainfall produces droughts and floods over the Amazon region, enhancing risks of forest fires, heatwaves and inundations, which affects the regional fauna, flora, and socioeconomic activities. In this study, the driest and wettest years of the Northern and Southern Amazon are investigated by analyzing the regional moisture and moist static energy budget. For the Northern and Southern Amazon, the dynamic effect, related to vertical movement changes, was the primary cause for the precipitation anomalies. The thermodynamic effect connected with moisture changes also contributed to the Northern Amazon precipitation anomalies. The anomalous vertical motion in the Northern Amazon was mainly caused by the horizontal advection of anomalous moist enthalpy through climatological wind, which alters the moist static energy in the region. Thus, a vertical movement is produced to compensate the energy changes, leading to changes in precipitation. Nonlinear terms and the horizontal advection of climatological moist enthalpy by the anomalous wind constrained the vertical motion in the driest years over Southern Amazon. For the wettest years over Southern Amazon, the anomalous ascending movement had contributions from all moist static equation terms, except the vertical advection of anomalous moist static energy by climatological wind, which had an opposite effect. The latent heat was the main contributor to anomalous moist enthalpy influencing the vertical movement. Further investigations indicated that the tropical Atlantic and Pacific SST anomalies could influence the vertical anomalies. In conclusion, although the dynamic effect (changes in the vertical motion) was the main driver for precipitation anomalies, the thermodynamic contribution related to latent heat anomalies is significant, mainly for Northern Amazon.

How to cite: Vasconcellos, F. C. and Li, L.: Dynamic and thermodynamic effects driving anomalous precipitation over Amazon, EGU General Assembly 2023, Vienna, Austria, 23–28 Apr 2023, EGU23-5767, https://doi.org/10.5194/egusphere-egu23-5767, 2023.

Southeast Asia lies at the heart of heavy precipitation on Earth, and a large amount of latent heat released
here provides substantial energy for the global atmospheric circulation. Utilizing gauge-based daily precipitation and the
self-organizing map technique, the summertime extreme and total precipitation over Southeast Asia during 1979–2019 are
classified into three and five distinct patterns, respectively. The three extreme precipitation clusters are characterized by
southern dry and northern wet (C1_extreme), overall wet (C2_extreme), and northern dry and southern wet (C3_extreme)
structures. The frequencies of these patterns exhibit increasing trends during the analysis, although they are not statistically
significant for C1_extreme. The C1_extreme pattern is accompanied by an anomalous cyclone over the South China Sea in
response to negative Indian Ocean sea surface temperature anomalies (SSTAs). The C2_extreme and C3_extreme clusters
are characterized by a westward extension of the western Pacific subtropical high, regulated by cool SSTAs over the tropical
central-eastern Pacific that are induced by the tropical North Atlantic warming and the tropical Pacific and Atlantic
SSTAs, respectively. For total precipitation, the first and second clusters show overall dry distributions, which are mainly
composed of nonextreme precipitation. The spatial patterns and atmospheric and oceanic features associated with the
other three clusters of total precipitation bear large resemblances to those of C1_extreme, C2_extreme, and C3_extreme,
respectively, but their trends exhibit smaller similarities. Comparing the differences between extreme and total precipitation
over Southeast Asia could improve our understanding of their regional variabilities and relationships, and potentially
their global impacts.

How to cite: Xu, L.: Variations of Summer Extreme and Total Precipitation over Southeast Asia andAssociated Atmospheric and Oceanic Features, EGU General Assembly 2023, Vienna, Austria, 23–28 Apr 2023, EGU23-5908, https://doi.org/10.5194/egusphere-egu23-5908, 2023.

EGU23-6124 | ECS | Posters on site | CL2.5 | Highlight

Trends in drought across Europe and their links to atmospheric circulation 

Zuzana Bešťáková, Jan Kyselý, Ondřej Lhotka, and Josef Eitzinger

We study trends in drought across the central latitude strip of Europe (defined as the region 47.5–52.5 °N and 2.5°W–32.5°E) during 1950–2019, and their links to atmospheric circulation. Drought characteristics are based on difference between potential evapotranspiration and precipitation in E–OBS data, and atmospheric circulation is characterized in terms of circulation types classified using daily sea level pressure patterns from the NCEP–NCAR reanalysis. Circulation types supporting drought in vegetation season (April–September) are identified, and we analyse changes in their occurrence since 1950, seasonal changes, and the connection with drought trends in individual European regions. We find that while in the early vegetation season, drought develops mainly in Central Europe, in the late vegetation season the most pronounced trends are shifted towards west. The circulation types supporting drought depend on regions and seasons, especially for directional types. The largest increase of the dry circulation types is observed in both seasons in Central Europe, and contributes to the pronounced drying.

How to cite: Bešťáková, Z., Kyselý, J., Lhotka, O., and Eitzinger, J.: Trends in drought across Europe and their links to atmospheric circulation, EGU General Assembly 2023, Vienna, Austria, 23–28 Apr 2023, EGU23-6124, https://doi.org/10.5194/egusphere-egu23-6124, 2023.

EGU23-6127 | ECS | Orals | CL2.5

Comparison Analysis of the Climate Extreme in 2022 

Chaonan Ji, David Montero, Veronika Grupp, Karin Mora, and Miguel D. Mahecha

Extreme events are on the rise. The 2022 compound heatwave and drought event caused significant vegetation mortality and serious ecosystem destruction in Europe that urgently need to be investigated. In this study, we used climate data (ERA5-Land air temperature at 2 m and precipitation) and remote sensing products (kNDVI derived from MODIS and ESA CCI Land Cover product) to investigate the dynamics of the 2022 extreme events and vegetation responses. Furthermore, we compared the effects of this year to other normal as well as abnormal years in Europe. We propose a ranking-based approach that compares cumulative sums of climate variables and kNDVI over the growing season to determine extreme areas and compound intensity over the last 23 years.

The results show that the 2022 event is a widespread compound heatwave and drought event, with a similar spatial pattern to the 2018 extreme event, but less severe. Vegetational response differed among land cover classes, grassland was more affected while deciduous trees were barely affected in the 2022 event. In general, vegetation recovered relatively quickly after the 2022 event.

Our ranking-based approach enables an effective comparison and characterization of climate extremes and their effects on vegetation over different years. A more in-depth analysis of spatial and temporal patterns can contribute to the development of targeted measures and support decision-makers in responding to climate extremes.

How to cite: Ji, C., Montero, D., Grupp, V., Mora, K., and D. Mahecha, M.: Comparison Analysis of the Climate Extreme in 2022, EGU General Assembly 2023, Vienna, Austria, 23–28 Apr 2023, EGU23-6127, https://doi.org/10.5194/egusphere-egu23-6127, 2023.

Analyses of the standardized precipitation evaporation index (SPEI), using the season-reliant empirical orthogonal function (S-EOF) method, indicate that the second leading mode of drought over Northeast China features an in-phase variation from spring to summer. Such an in-phase change is closely connected to the persistence of geopotential height anomalies around Lake Baikal. The positive height anomalies around Lake Baikal, with an equivalent barotropic structure in the troposphere, can decrease water vapor transport into Northeast China and induce anomalous descending over Northeast China during both seasons, favoring precipitation deficit and high temperature in situ and hence resulting in the synchronous variations of spring and summer droughts. Further investigation reveals that the spring North Atlantic Oscillation (NAO) plays a notable role in the in-phase change of spring-summer droughts over Northeast China. The positive phase of spring NAO could induce spring drought over Northeast China directly through its influence on the above atmospheric circulations via a zonal wave train emanating from the North Atlantic. Meanwhile, it can also increase the soil moisture in Central Siberia by enhancing the local snow depth. The wetter soil moisture in the following summer, in turn, increases the meridional temperature gradient between the middle and high latitudes and then forces westerly anomalies around 60°N, consequently yielding positive height anomalies around Lake Baikal which favor the occurrence of summer drought over Northeast China. Therefore, the spring NAO is hypothesized to contribute to the in-phase variations of spring-summer droughts over Northeast China through the combined roles of zonal wave train and Central Siberian soil moisture.

How to cite: Hu, Y.: In-phase Variations of Spring and Summer Droughts over Northeast China and Their Relationship with the North Atlantic Oscillation, EGU General Assembly 2023, Vienna, Austria, 23–28 Apr 2023, EGU23-6270, https://doi.org/10.5194/egusphere-egu23-6270, 2023.

The South Asian High (SAH) experienced a decadal weakening in the late 1970s under global warming. Based on an evaluation of the historical runs from CMIP6 models, we quantitatively assessed the contributions of different external forcing using “good” models that reasonably simulated the decadal decline of the SAH. All-forcing runs yielded the weakened SAH after the late 1970s, albeit the decadal decline was underestimated by most models. Compared to the insignificant contributions of greenhouse gas and natural forcing, anthropogenic aerosol played a dominant role in the decadal decline of the SAH. The increased aerosol likely drove a cooling surface over the Tibetan Plateau and East China via its effect on radiation. Consequently, the weakened heat source over the Tibetan Plateau and associated thermodynamic effects over East China would have driven a cooling of eddy temperature and cyclonic anomalies in the upper troposphere, respectively, thereby causing the decline of the SAH.

How to cite: Zhang, D.: Contributions of External Forcing to the Decadal Decline of the South Asian High, EGU General Assembly 2023, Vienna, Austria, 23–28 Apr 2023, EGU23-6331, https://doi.org/10.5194/egusphere-egu23-6331, 2023.

EGU23-6335 | ECS | Orals | CL2.5 | Highlight

The Arctic-Siberian Plain warming drives the heat waves in East Asia. 

Jeong-Hun Kim, Seong-Joong Kim, Joo-Hong Kim, Michiya Hayashi, and Maeng-Ki Kim

Generally, it is well known that the East Asian heatwaves are strongly affected by the Pacific-Japan pattern and circum-global teleconnection pattern. However, recent studies suggest that various teleconnection patterns also can contribute to the East Asian heat waves (e.g., Scandinavian pattern, Arctic Oscillation, El Nino-Southern Oscillation, etc.). However, the teleconnection between the Arctic-Siberian Plain (ASP) warming and East Asian heat waves has been unexplored. This study investigates the teleconnection mechanism between East Asian heatwaves and the warming over the ASP for the last 42 years (1979-2020). The results show that the enhanced surface radiative heating by the anticyclonic anomalies over the ASP region increases the air temperature and surface evaporation, amplifying the thermal high pressure via positive water vapor feedback. The Rossby wave, amplified by land-atmosphere interaction in the ASP, propagates to East Asia through the upper troposphere, causing favorable atmospheric patterns for the occurrence of the East Asian heatwaves.

How to cite: Kim, J.-H., Kim, S.-J., Kim, J.-H., Hayashi, M., and Kim, M.-K.: The Arctic-Siberian Plain warming drives the heat waves in East Asia., EGU General Assembly 2023, Vienna, Austria, 23–28 Apr 2023, EGU23-6335, https://doi.org/10.5194/egusphere-egu23-6335, 2023.

Southwest China (SWC) is vulnerable to disasters caused by extreme precipitation. This study investigates the mechanisms of low-latitude intraseasonal oscillations affecting regional persistent extreme precipitation events (RPEPEs) over SWC during rainy seasons. Most of the RPEPEs over SWC are dominated by 7–20-day variability. The RPEPEs over SWC are preconditioned by two different types of 7–20-day Rossby waves with almost opposite phases over the western North Pacific (WNP). The two types of 7–20-day Rossby waves have direct (indirect) effects on Type 1 (2) RPEPEs, respectively. For Type 1, a coupled 7–20-day low-level anticyclone and suppressed convection originating from the tropical WNP propagate northwestward and cover the region from the South China Sea (SCS) to the Bay of Bengal before the RPEPEs. The anticyclone triggers ascending motion over SWC and transports more moisture to SWC, favoring the SWC RPEPEs. Before the Type 2 RPEPEs, a coupled 7–20-day low-level cyclone and enhanced convection propagates from the tropical WNP to the SCS. The enhanced convection over the SCS leads to the westward extension of the western Pacific subtropical high (WPSH) and the eastward shift of the South Asian high (SAH). The variations in the WPSH and the SAH directly cause SWC RPEPEs by inducing ascending motion and transporting moisture. The mechanisms for Type 2 RPEPEs tend to work under the background with a strong WPSH. Using a Lagrangian model, we found that both the 7–20-day oscillations and their background atmospheric circulations result in significant differences in moisture sources for the two types of RPEPEs. These findings benefit a better understanding of SWC extreme precipitation events.

How to cite: Nie, Y.: Regional Persistent Extreme Precipitation Events over Southwest China under Different Low-Latitude Intraseasonal Oscillations during Rainy Season, EGU General Assembly 2023, Vienna, Austria, 23–28 Apr 2023, EGU23-6377, https://doi.org/10.5194/egusphere-egu23-6377, 2023.

EGU23-7451 | ECS | Orals | CL2.5

Evaluation of the main heatwave patterns in the northeast of the Iberian Peninsula using ERA5 and CORDEX models 

Sergi Ventura, Gara Villalba, Josep Ramon Miro, and Juan Carlos Peña

Heatwaves are expected to increase not only in intensity but also in frequency and duration in the next decades. Most of the studies are focused on the temperature variable, but little is known about their synoptic structure, which is especially important in mid-latitude regions.

In this study, we propose a Principal Sequence Pattern Analysis (PSPA) to classify the main synoptic patterns that define heatwaves in the northeast of the Iberian Peninsula. This is done by finding the most correlated input variables that represent the highest number of variance possible. The database used for this analysis comes from ERA5 reanalysis data covering the 1951-2020 period, in which we have selected three variables: mean sea level pressure (MSLP), geopotential height at 500 hPa (Z500) and maximum daily temperature at 2 meters (TMAX). Once the historical analysis is prepared, the same steps are repeated for CORDEX models (1951-2000) to discuss the performance of these models simulating heatwave periods.

The multivariate analysis has resulted in four synoptic patterns that explain more than 50% of the total variance. The four patterns are divided into two groups, stationary and dynamical. The HWs with highest temperatures in the Metropolitan Area of Barcelona are the prefrontal patters, which are dynamical and undulated at Z500 and undetermined at MSLP, with mean maximum temperatures around 35°C. However, the warmest pattern in inland areas is stationary and stable, generated at Z500 by intense anticyclonic ridges covering the Iberian Peninsula and at MSLP by deep thermal lows. The CORDEX models simulate similar patterns but less defined due to the lack of resolution. Z500 results in an overestimation of the anticyclonic ridges and MSLP shows an underestimation of pressure gradients, simulating more undetermined patterns. However, there are discrepancies between the models, which will result in different future projections in the climate change scenarios.

How to cite: Ventura, S., Villalba, G., Miro, J. R., and Peña, J. C.: Evaluation of the main heatwave patterns in the northeast of the Iberian Peninsula using ERA5 and CORDEX models, EGU General Assembly 2023, Vienna, Austria, 23–28 Apr 2023, EGU23-7451, https://doi.org/10.5194/egusphere-egu23-7451, 2023.

Concurrent heatwaves and droughts that occur over northeastern China (NEC) bring severe threats to human lives and crop productions. In the present study, a probability-based index that simultaneously considers precipitation deficiency and high temperature is calculated to represent concurrent heatwaves and droughts over NEC. Based on this index, the characteristics of concurrent heatwaves and droughts over NEC in summer are investigated using the year-to-year increment approach. The results indicate that the occurrence of concurrent heatwave and drought over NEC is closely related to the Polar-Eurasian teleconnection pattern and the Pacific-Japan teleconnection pattern. Further analyses indicate that the sea ice content in the Barents Sea in March (SICBS), the La Niña-like sea surface temperature (SST) in February (SST-PC1), and the northwestern Siberia soil moisture in April (SM) are coincidently linked to the two teleconnection patterns mentioned above. Based on their corresponding physical mechanisms, these three independent predictors are chosen to construct a physical-empirical prediction model for the prediction of concurrent heatwaves and droughts over NEC. Results suggest that this physical-empirical prediction model performs well with a high correlation coefficient and a low root mean squared error between the observed and predicted concurrent heatwaves and droughts over NEC for the period 1979–2018. Moreover, the cross-validation test and independent hindcasts both suggest that the physical-empirical model proposed in the present study with the three independent predictors has good prediction skills.

How to cite: Li, H.: Mechanisms and prediction of concurrent heatwaves and droughts in July–August over northeastern China, EGU General Assembly 2023, Vienna, Austria, 23–28 Apr 2023, EGU23-7631, https://doi.org/10.5194/egusphere-egu23-7631, 2023.

EGU23-7643 | ECS | Orals | CL2.5 | Highlight

The Role of Moisture and Heat Transport for Extreme Droughts in the Amazon Basin - a Lagrangian Perspective 

Katharina Baier and Andreas Stohl

In the last decade, tropical rainforests, e.g. the Amazon basin, have experienced events of extreme droughts. Such events have huge impacts on the forest, as trees are damaged. Therefore, it is relevant to gain deeper understanding on the main mechanisms causing such events, and further clarify the role of moisture recycling over the continent vs. moisture transport from oceanic regions.

We study the role of moisture- and heat transport for the Amazon basin, with special focus on drought events. We show how these extreme events differ from normal conditions, with special focus on the changes in atmospheric transport. We analyse the atmospheric transport with the particle dispersion model FLEXPART using meteorological input data from the ERA5 reanalysis. In this Lagrangian model, the atmosphere was filled homogeneously with particles, which were traced forward in time and represent the global atmospheric mass transport. From this Lagrangian reanalysis dataset, covering the years 1979-2021, air masses over the Amazon basin are selected and traced backward in time.

Based on that, we investigate the role of continental and oceanic moisture source areas, incorporating also information on soil moisture and burned areas. Thereby, we highlight the relevance of moisture recycling over continental - vs.  moisture transport from oceanic areas. For example, we found that for the northern parts of the Amazon basin the most important moisture source is the Atlantic Ocean, thus this area is less affected by deforestation in the southern areas.

How to cite: Baier, K. and Stohl, A.: The Role of Moisture and Heat Transport for Extreme Droughts in the Amazon Basin - a Lagrangian Perspective, EGU General Assembly 2023, Vienna, Austria, 23–28 Apr 2023, EGU23-7643, https://doi.org/10.5194/egusphere-egu23-7643, 2023.

EGU23-8274 | ECS | Orals | CL2.5 | Highlight

Sources, propagation and sinks of Europe’s major heat waves; a complex network analysis of heat extremes 

Irene Garcia-Marti, Gerard van der Schrier, and Florian Polak

In the last few decades, Europe has seen many devastating heat waves; each one producing new all-time heat records and pushing the limits of climatic extremes. The quantification of the dynamical linkage, the evolution and propagation of such heatwaves is a start to understand these processes. This network structure and propagation characteristics for European heatwaves is analyzed using a complex network approach based on E-OBS, the gridded dataset based on in situ data from the European meteorological services.

Complex networks (CN) are data-driven methods suited to model natural non-linear dynamic systems (Dijkstra et al., 2019). CN are based on graph theory; hence a network is composed by two sets (nodes and vertices) conforming a network topology that can be subsequently explored. In this work, we process European-wide daily maximum temperature gridded layers to build up a CN capable of shedding light on interesting mechanisms underlying the heatwave propagation. We identify the source and sink regions primarily responsible for heatwave propagations and the strength of association between these regions. The network coefficients are derived to evaluate the extremal dependence, evolution, and spatial propagation of specific large scale heatwave events.

Enabling the tracking of climate extremes such as heatwaves might be a relevant resource to help evaluating climate attribution methodologies and expanding them further having this visual support. In addition, having a more realistic representation of a heatwave might help reduce uncertainties, hence better guiding the decision-making process. Both types of contributions might be of service at issuing weather warnings tailored to regions, therefore improving the social preparedness and response capacity when heatwaves hit a region (e.g. excess human mortality associated with heat stress).

References
Dijkstra, H. A., Hernandez-Garcia, E., Masoller, C., & Barreiro, M. (2019).
Networks in Climate. Cambridge: Cambridge University Press, Cambridge, UK and New York, NY, USA. 

How to cite: Garcia-Marti, I., van der Schrier, G., and Polak, F.: Sources, propagation and sinks of Europe’s major heat waves; a complex network analysis of heat extremes, EGU General Assembly 2023, Vienna, Austria, 23–28 Apr 2023, EGU23-8274, https://doi.org/10.5194/egusphere-egu23-8274, 2023.

EGU23-8502 | ECS | Orals | CL2.5 | Highlight

Trends and Variability in Extreme Precipitation over India 

Chaithra Sajeevan Thankamani and Krishna AchutaRao

The frequency, intensity and duration of weather and climate extremes have increased globally over the past several decades, and the trend is projected to continue. It is important to understand the changing nature of these extremes as it contributes to better monitoring and prediction, thereby reducing the risk to society. Changes in climate and associated weather extremes may be caused both by natural factors such as internal variability, volcanic eruptions, and solar variability as well as anthropogenic factors such as GHGs, aerosols and land use changes. It is essential to differentiate between the contributions of these drivers in order to take suitable measures to mitigate and adapt. Though the changes in temperature extremes are well-documented, rainfall extremes are significantly heterogeneous around the world.

This study analyses extreme precipitation indices over India (developed by the Expert Team on Climate Change Detection and Indices; ETCCDI) and their relationship with different modes of climate variability. The study examines the mean climatology, long-term trends and variability in extreme precipitation indices over India using the daily gridded rainfall data from the India Meteorological Department (IMD). The analysis is carried out over different homogeneous zones as well as custom-defined areas over India in different seasons. The study finds significant variability of extreme indices in the 2 to 4 year time scales and highlights the role of Indian Ocean Dipole (IOD) and El Niño-Southern Oscillation (ENSO) in modulating extreme precipitation. 

How to cite: Sajeevan Thankamani, C. and AchutaRao, K.: Trends and Variability in Extreme Precipitation over India, EGU General Assembly 2023, Vienna, Austria, 23–28 Apr 2023, EGU23-8502, https://doi.org/10.5194/egusphere-egu23-8502, 2023.

Marine Heat Waves (MHWs), persistent and anomalously sea water temperature warm events, are known to have significant impacts on marine ecosystems as well as on air-sea exchanges. As global ocean temperatures continue to rise, MHWs have become more widespread, threatening marine ecosystems and their services for food-provision, livelihoods and recreation. Detecting and predicting the occurrence, intensity and duration of these extreme events, and understanding their impacts on marine ecosystems is a key step towards developing science-based solutions for sustainable development.

The project “deteCtion and threAts of maRinE Heat waves – CAREHeat”, funded by ESA in the framework of the Ocean Health initiative, aims at improving the current MHW detection and characterization methodology, as well as advancing the understanding of the physical processes involved, and the corresponding ecological and biogeochemical changes.

This is being to be achieved following a multidisciplinary approach capitalizing on the large potential offered by satellite Earth observations, complemented with in situ field measurements, physical and biogeochemical ocean reanalyses, biogeochemical modelling and emerging machine learning technologies. In this presentation an overview of the CAREHeat Project activities and its preliminary results will be provided. In particular the assessment of the major gaps in scientific knowledge, existing products and tools in MHW detection will be discussed. A first version of the CAREHeat MHW Global Atlas covering the entire satellite era (1981-today) will be presented and analysed to investigate the year-to year MWH variability in spatial extension, intensity, duration and rate of evolution.

Specific work has also been done to investigate the impact of sea temperature trends and prominent climate modes, as El Nino Southern Oscillation (ENSO), in order to disentangle the slow-varying SST component and quasi-periodic oscillations from the abrupt changes that are characteristics of these extreme events.

A first preliminary analysis of the impact of MWHs on marine ecosystem will be presented.  

Up to date about the project research and results can be found visiting the  CAREHeat website (www.careheat.org) or on Twitter (@ careheat_)

How to cite: Santoleri, R. and the CAREheat team: Detection, characterization and trends of Marine Heat waves in the global worming scenario: the CAREHeat Project, EGU General Assembly 2023, Vienna, Austria, 23–28 Apr 2023, EGU23-8961, https://doi.org/10.5194/egusphere-egu23-8961, 2023.

The effects of extreme temperature events depend critically on both the length and amplitude of the events. Here I review numerical evidence from a range of climate models - including complex Earth System Models and highly simplified aquaplanet models - that indicates robust changes in both temperature persistence and variance under climate change. The most robust changes are found over ocean areas and appear to arise from fundamental thermodynamic constraints on atmospheric water vapor concentrations, the moist atmospheric lapse rate, and longwave radiative cooling. It is argued that such constraints will drive robust changes in the persistence and amplitude of temperature variability over the next century that will be superposed on any other changes due to, say, land-surface processes or variations in the ENSO phenomenom.

How to cite: Thompson, D.: Thermodynamic constraints on changes in temperature persistence and variance under climate change, EGU General Assembly 2023, Vienna, Austria, 23–28 Apr 2023, EGU23-10154, https://doi.org/10.5194/egusphere-egu23-10154, 2023.

Hourly gauge rainfall measurements and ERA5 reanalysis for the period 1980-2020 are used to identify typical synoptic weather patterns responsible for summer regional hourly extreme precipitation events over the lower Yangtze River basin. It turns out that the Meiyu front or cyclonic shear imbedded in the East Asian summer monsoon (EASM) and landfalling typhoons are the leading contributors. As the dominant synoptic pattern, the EASM accounts for ~93% occurrence of regional hourly rainfall extremes. The double peak diurnal occurrence (morning and late afternoon) of rainfall extremes corresponds to the Meiyu front and cyclonic shear driven by a strengthened and westward extended western North Pacific subtropical high and accelerated low-level southwesterly flow. During 1980-2020, there was a clear increasing trend in the occurrence of regional hourly rainfall extremes over the region. These findings are beneficial to the prediction and risk assessment of extreme rainfall events over the specific region. 

How to cite: Huang, A.: Typical Synoptic Weather Patterns Responsible for Summer regional Hourly Extreme Precipitation Events over the Lower Yangtze River Basin, China, EGU General Assembly 2023, Vienna, Austria, 23–28 Apr 2023, EGU23-10374, https://doi.org/10.5194/egusphere-egu23-10374, 2023.

This research evaluated the performance of 19 Coupled Model Intercomparison Project phase 6 (CMIP6) models in simulating the Arctic sea ice from the perspective of annual cycle, spatial pattern and temporal variation. Based on the evaluation, five models with better comprehensive performance capacity were optimized as the ensemble to project the response of the East Asian winter climate to the sea ice-free Arctic occurring under the SSP2-4.5 and SSP5-8.5 scenarios, respectively. The ensemble projections indicate that the sea ice-free Arctic is followed by a weakening of the East Asian winter monsoon, which is characterized with the shallower East Asian trough and weaker East Asian jet stream. Concurrently, the winter surface net radiation flux is projected to increase in the East Asian-western North Pacific region. These changes favour large-scale warming in the East Asian-western North Pacific region. Moreover, the warming is more pronounced under the sea ice-free Arctic of SSP2-4.5 than under that of SSP5-8.5. The winter precipitation tends to increase along the East Asian coast from South China to the Sea of Okhotsk. Such an increase is closely associated with the enhancement of low-level moisture. Due to larger enhancement of moisture, there appears greater increase of precipitation in the monsoon region from South China to Japan under the sea ice-free Arctic of SSP5-8.5 compare to that under SSP2-4.5. Substantial changes are also projected for the temperature and precipitation extremes, such as a general increase in warm days and warm nights and an overall intensification of extreme precipitation in the East Asian-western North Pacific region.

How to cite: Song, Z.: CMIP6 projected response of the East Asian winter climate to the sea ice-free Arctic, EGU General Assembly 2023, Vienna, Austria, 23–28 Apr 2023, EGU23-10470, https://doi.org/10.5194/egusphere-egu23-10470, 2023.

Devastating floods in July-August 2022 led to one-third of Pakistan being under water. The rainfall over Pakistan in these months was extreme—four to six times the 30-year average. We investigate the cause of this historically unprecedented flooding and extreme rainfall using station measurements and reanalysis datasets. In July-August 2022 there was an abnormal distribution of south Asian summer monsoon (SASM) precipitation characterized by more precipitation in Southern Pakistan and Central India but less precipitation in the south of the western Tibetan Plateau. The abnormal distribution of monsoon rainfall was dominated by the weakening of the 200-hPa northern westerly winds and SASM, and associated with anomalous westward moisture transport in the south of the Tibetan Plateau. Moreover, the temperature of the western Tibetan Plateau reaches its peak in 2022. The “heat pump effect” of the Tibetan Plateau led to positive geopotential height anomalies over Pakistan and the western Tibetan Plateau in the mid-to-upper troposphere. This blocked the 200-hPa northern westerly winds and shifted them northward. At the lower troposphere, the easterly winds are enhanced, and the SASM is suppressed. Furthermore, the Tibetan Plateau warming caused increased glaciers melt and large amounts of meltwater that feed the upper Indus River and worsened the floods. In the context of global warming, summers temperatures and melting will increase in the Tibetan Plateau. Our results indicate that this will cause massive flooding over Pakistan, such as in 2022, to become a common occurrence.

How to cite: Li, H.: Tibetan Plateau warming-induced abnormal distribution of south Asian monsoon precipitation contributes to Pakistan's fatal flood in 2022, EGU General Assembly 2023, Vienna, Austria, 23–28 Apr 2023, EGU23-10722, https://doi.org/10.5194/egusphere-egu23-10722, 2023.

EGU23-10759 | ECS | Orals | CL2.5

How Do Extreme Summer Precipitation Events Over Eastern China Subregions Change? 

Xin Hao, Linqiang He, Hua Li, and Tingting Han

Spatiotemporal features of summertime extreme precipitation occurrences (EPEs) over eastern China subregions were captured by using observations from the CN05.1 daily data set and K-means clustering from 1961 to 2018. Five subregions including South China (SC), the Yangtze River Basin (YRB), the HeTao Area (HTA), North China (NC), and Northeast China (NEC) are identified, which is distinct from previous studies. The accompanying evolution of synoptic development are discussed, including the high rates of EPEs transfer from the YRB-type to the SC-type (18%), the HTA-type to the YRB-type (16%), the HTA-type to the NC-type (22%), and the NC-type to the NEC-type (25%). Intrinsic relationships that exist within these types of regional EPEs have not been recorded by previous studies. The intraseasonal evolution of summer EPEs shows a northward migration of the rainbelt influenced by the East Asian summer monsoon system. Moreover, temporal variations of regional EPEs from interannual timescales to long-term trends are examined.


How to cite: Hao, X., He, L., Li, H., and Han, T.: How Do Extreme Summer Precipitation Events Over Eastern China Subregions Change?, EGU General Assembly 2023, Vienna, Austria, 23–28 Apr 2023, EGU23-10759, https://doi.org/10.5194/egusphere-egu23-10759, 2023.

EGU23-10834 | ECS | Orals | CL2.5

Cause of the cold condition over northeast Asia in April 2020 

Go-Un Kim, Hyoeun Oh, Yong Sun Kim, Jun-Hyeok Son, Jongmin Jeong, and Jin-Yong Jeong

Although northern Asia's temperature was the fourth highest on record, Northeast Asia was severely damaged agricultural and marine products due to the cold condition in April 2020. Previous studies have shown that the dipole atmospheric circulation over Siberia and the East Sea (also referred to as the Japan Sea) rendered this cold environment. Here we show that the atmospheric structure affecting the cold condition over northeast Asia was a mixed result of the East Atlantic/Western Russia (EAWR) pattern and blocking. The wave train was originated from the vorticity forcing of northwest/central Russia and propagated toward the southeast via the climatologically westerly and northerly flows. Furthermore, the blocking days over Siberia increased approximately ten times in April 2020 than climatology along with the easterly anomaly over Mongolia–northeast China. The blocking occurrence might be connected to wavy westerly at the high latitudes. The strong blocking and EAWR pattern led to the robust dipole atmospheric structure with the prevailing northerly wind in April 2020, thereby causing the cold over northeast Asia. Our results help to understand the cause of the cold condition in April over northeast Asia and its impact on the land and ocean ecosystems.

How to cite: Kim, G.-U., Oh, H., Kim, Y. S., Son, J.-H., Jeong, J., and Jeong, J.-Y.: Cause of the cold condition over northeast Asia in April 2020, EGU General Assembly 2023, Vienna, Austria, 23–28 Apr 2023, EGU23-10834, https://doi.org/10.5194/egusphere-egu23-10834, 2023.

The summer extreme high temperature days (EHTDs) in the Northern Hemisphere have been frequently detected, posing a serious threat to the safety of human life, agricultural production, and the ecological environment of many countries. This study investigates the decadal variation of summer EHTDs in northern Eurasia (30°–70°N, 10°–130°E) during 1960–2018, using the EHTD index provided by Hadley Center and the atmospheric circulation and sea surface temperature (SST) data provided by NOAA. Statistical analysis shows that the first principal component of the EHTD index fluctuates slightly over a relatively low level during 1960–1994, while it increases significantly during 1995–2018. Moreover, Z-test and sliding t-test confirm that the decadal variations of the EHTD index in terms of trends and the climatological mean values change significantly around 1994/1995. Therefore, the total period is divided into two phases, i.e., fewer EHTDs and an insignificant trend during the period from 1960 to 1994, and more EHTDs with a significant increasing trend during the late period from 1995 to 2018. During 1960–1994 (1995–2018), low pressure and cyclonic (high pressure and anticyclonic) anomalies controlled Lake Baikal and the Caspian Sea, favoring more (less) cloud cover and precipitation, absent (sufficient) solar radiation and increased (decreased) EHTDs over there. Global warming and internal variability of the North Atlantic are both responsible for the decadal variations of EHTDs. On one hand, regression analysis shows that the global warming trend shows a significant influence on the positive pressure anomalies over the areas to the south of Lake Baikal. On the other hand, during 1995–2018, the anomalous Rossby wave activities induced by warmer than normal North Atlantic leads to high-pressure anomalies over the Caspian Sea, resulting in the significant anticyclonic anomaly over the area, which favors the more frequent occurrence of EHTDs than those during 1960–1994. Meanwhile, the Atlantic jet is located northward. The area around the Caspian Sea is to the right side of the jet stream exit. Under such a background, the negative vorticity advection at the upper-level troposphere would lead to the divergence anomaly and strengthen the sinking motion between lower- and higher- levels. Thus, the summer EHTD tends to be maintained over the Caspian Sea.

How to cite: Fan, Y.: Variations of summer extreme high temperatures in northern Eurasia during the recent decades, EGU General Assembly 2023, Vienna, Austria, 23–28 Apr 2023, EGU23-10945, https://doi.org/10.5194/egusphere-egu23-10945, 2023.

Compared with daytime (occurring only in daytime) and nighttime (occurring only in nighttime) heat waves (HWs), daytime-nighttime compound HWs (occurring simultaneously in daytime and nighttime) are highlighted to exert much severer impacts especially on human health. However, the physical mechanisms underlying compound HWs are poorly understood. Based on the observed maximum and minimum temperatures and NCEP/ NCAR reanalysis data, this article addressed the physical processes for the occurrence of compound HWs in East China, where compound HWs occur most frequently across China. Comparisons with those related to daytime or nighttime HWs were also performed. The results indicate that the occurrences of three HW types are all associated with anticyclonic circulation anomalies from the upper troposphere to the lower troposphere, whereas their locations and intensities determine the configuration of atmospheric conditions for different categories of HWs. The resultant less (more) cloud cover and humidity as well as increased downward shortwave (longwave) radiation at the surface favor the warming of daytime (nighttime), conducive to the occurrence of daytime (nighttime) HWs. The combination of above conditions associated with daytime and nighttime HWs, which helps the persistence of high temperatures from daytime to nighttime, benefits the occurrence of compound HWs. In addition, nighttime and compound HWs occur with the northwestward extension of the western Pacific subtropical high (WPSH), while it stays in the climatological location for the occurrence of daytime HWs. Further investigation suggests that daytime (nighttime) HWs are accompanied with an upper-tropospheric meridional (zonal) wave train propagating downstream from western Siberia (the east to the Caspian Sea). In comparison, the wave train related to compound HWs shares the mixed features of daytime and nighttime HWs, characterized by a meridional wave propagation from the Scandinavian Peninsula to East China and then a zonal propagation toward the western Pacific.

How to cite: Xie, W.: On the atmospheric background for the occurrence of three heat wave types in East China, EGU General Assembly 2023, Vienna, Austria, 23–28 Apr 2023, EGU23-11002, https://doi.org/10.5194/egusphere-egu23-11002, 2023.

EGU23-11077 | ECS | Posters on site | CL2.5

Characteristics of Large-Scale and Localized Droughts in the Gangetic Plains 

Chamarthi Sarat Chandra, Veungopal Vuruputur, and Sekhar Muddu

The groundwater depletion over the past two decades in the Indo-Gangetic Plains has been extensively documented. On a smaller scale, the Bundelkhand sub-region (rectangular box in the Figure) has been experiencing an extended period of meteorological drought. In this region, as with a majority of the Gangetic Plains, the contribution of local evaporation is comparable to the moisture brought in from afar.  It is unclear whether the below-normal rainfall in this region is due to low-frequency climate variability or a result of a "negative" feedback loop in the regional hydrologic cycle where less rain leads to less soil wetness, which in turn leads to lower evaporation and less moisture available for rain. An analysis of this region's daily rainfall records from the past century shows that while most droughts in and around Bundelkhand coincide with larger-scale Indian monsoon droughts (Type-1 in the Figure), some appear to be localized (Type-2 in the Figure). In addition, our analysis shows that while north central India typically experiences a rainfall deficit in early July, western India often sees more than normal rainfall. We present our assessment of the causes of these droughts, including the role of local hydrology and potential large-scale drivers. 

How to cite: Chandra, C. S., Vuruputur, V., and Muddu, S.: Characteristics of Large-Scale and Localized Droughts in the Gangetic Plains, EGU General Assembly 2023, Vienna, Austria, 23–28 Apr 2023, EGU23-11077, https://doi.org/10.5194/egusphere-egu23-11077, 2023.

The Yangtze River Valley (YRV) is the main rice-growing region in China and agriculture production in YRV plays a vital role in ensuring food security. Spring is the key season of plowing preparation and sowing, and drought during this period could cause serious threats to agricultural activity in YRV. As a basic feature of drought, consecutive dry days (CDDs), especially the extreme-CDDs with long duration, could directly reflect the drying degree and serve as a good indicator of drought. Therefore, knowledge of variations and mechanisms of spring extreme-CDDs has significant implications for a comprehensive view of spring drought in YRV. Based on daily station precipitation data, the variability of spring extreme-CDDs in YRV is investigated. It is found that the extreme-CDDs in YRV experienced a significant decadal increase around the early 2000s. Associated with this decadal change, the Mongolian high (MH) and western North Pacific anticyclone (WNPA) are significantly intensified and weakened, respectively. The intensified MH and weakened WNPA lead to anomalous northerlies and water vapor divergence over YRV, providing favorable atmospheric conditions for more extreme-CDDs over the region. Further mechanism analyses suggest that the transition of mega-El Niño/Southern Oscillation (mega-ENSO) from the negative-phase to positive-phase contributes to the decadal weakening of WNPA. And the phase transition of Atlantic Multidecadal Oscillation (AMO) and decadal decrease of sea ice over the Barents Sea lead to intensified MH through exciting atmospheric wave train. Multiple linear regression shows that there could be a synergistic role of mega-ENSO, AMO, and sea ice over the Barents Sea in the decadal change in YRV extreme-CDDs around the early 2000s. Analysis on the simulation of 14 models in the Atmospheric Model Intercomparison Project (AMIP) experiment from phase 6 of the Coupled Model Intercomparison Project (CMIP6) shows that the models can reproduce the observed decadal intensification of MH and weakening of WNPA around the early 2000s, indicating the contribution of mega-ENSO, AMO, and sea ice over the Barents Sea to the decadal changes in MH, WNPA and extreme-CDDs in YRV.

How to cite: Zeng, Z.: Decadal change of spring extreme consecutive dry days in the Yangtze River Valley around the early 2000s: Synergistic effect of mega-El Niño/Southern Oscillation, Atlantic Multidecadal Oscillation, and Arctic sea ice, EGU General Assembly 2023, Vienna, Austria, 23–28 Apr 2023, EGU23-11219, https://doi.org/10.5194/egusphere-egu23-11219, 2023.

In this study, the variations in the extreme high-temperature event (EHE) over Northern Asia (NA) and the associated possible mechanisms are explored. On an interdecadal timescale, NA EHE frequency experienced a significant interdecadal increase around the mid-1990s, which could be associated with the phase shift of the Atlantic Multidecadal Oscillation. On an interannual timescale, the first two empirical orthogonal function modes of the NA EHE frequency exhibit meridional dipole pattern (EOF1) and diagonal tripolar pattern (EOF2), respectively. Further analysis reveals that the EOF1 mode is related to the Polar-Eurasian teleconnection pattern (POL), while the EOF2 mode is associated with North Atlantic Oscillation (NAO) and Pacific-Japan/East Asia-Pacific pattern (PJ/EAP). The fitted EHE frequency based on the atmospheric factors (POL, NAO and PJ/EAP) can explain the interannual variation in the regionally averaged EHE frequency by 33.8%. Furthermore, three anomalous sea surface temperature (SST) patterns over the North Atlantic-Mediterranean Sea region and around the Maritime Continent are associated with the two EHE modes by intensifying the pronounced atmospheric teleconnections. Analysis on the simulation of five models in the Atmospheric Model Intercomparison Project experiment further confirms the impact of the pronounced SST patterns on the POL, NAO and PJ/EAP. From a synoptic perspective, the atmospheric patterns responsible for the NA EHE are investigated. By applying a hybrid regionalization approach to the daily maximum temperature, three subregions of NA can be identified: western NA, central NA, and southeastern NA. To better understand the mechanism for the formation of EHE in each subregion of NA, the EHE-related synoptic circulation patterns over each subregion are further categorized into two types. These six synoptic circulation patterns influence the NA EHE occurrence through different radiation and advection processes. From the forecasting perspective, six wave train patterns are explored as the precursors of the six synoptic circulation patterns, separately. These wave train patterns appear over the upstream regions of NA subregions with at least three-day lead, and provide potential forecasting information for the NA EHEs. The results may deepen our understanding of the NA EHE formation and provide information for the prediction and forecast of NA EHE.


How to cite: Hong, H.: Variations in Summer Extreme High-temperature Events over Northern Asia and the Possible Mechanisms, EGU General Assembly 2023, Vienna, Austria, 23–28 Apr 2023, EGU23-11276, https://doi.org/10.5194/egusphere-egu23-11276, 2023.

EGU23-11356 | ECS | Posters virtual | CL2.5 | Highlight

The Role of the Ocean for the Development of Heat Waves over Europe 

Sabine Bischof, Robin Pilch-Kedzierski, Martje Hänsch, and Katja Matthes

European heat waves are becoming more and more severe under global warming. The frequency and duration of heat waves are very likely to further increase under future climate conditions over most land areas. To improve the predictability of such extreme events, it is important to understand their driving mechanisms better.

Although earlier work hints at a connection between North Atlantic sea surface temperatures (SSTs) and the occurrence of European heat waves, the role of the ocean in shaping heat waves is still not fully understood. Here, we investigate the effect of the 2018 SST pattern, which was characterized by negative anomalies in the North Atlantic, on European heat wave characteristics.

Using the Flexible Ocean and Climate Infrastructure (FOCI) model we conducted two 100-year long AMIP-like model experiments: one that employs the observed global 2018 SST and sea ice patterns as a boundary forcing and another one that differs only in the North Atlantic SST field, for which we removed the cold SST anomaly. Comparing these two experimental settings, we find that cold North Atlantic SST anomalies can favor heat wave conditions especially over the most eastern part of the European continent.

How to cite: Bischof, S., Pilch-Kedzierski, R., Hänsch, M., and Matthes, K.: The Role of the Ocean for the Development of Heat Waves over Europe, EGU General Assembly 2023, Vienna, Austria, 23–28 Apr 2023, EGU23-11356, https://doi.org/10.5194/egusphere-egu23-11356, 2023.

EGU23-11753 | ECS | Orals | CL2.5

Assessing the role of thermodynamic drivers underlying extreme heat in a warming climate 

Dominik L. Schumacher, Mathias Hauser, and Sonia I. Seneviratne

In recent years, heatwaves around the globe have eclipsed long–term maximum temperature records. While a stronger warming over land than sea is both expected and observed, regional hot extremes are warming at an even faster pace. Modeling studies have suggested that soil moisture–temperature feedbacks drive this amplification in climate projections of the ongoing century, and there is solid observational evidence of a link between high temperatures and desiccating soils for individual events: dry soils invoke a shift in the surface energy partitioning toward sensible heating, thereby promoting higher air temperatures. A particularly notable heatwave unfolded in late June 2021 in the Pacific Northwest, baffling the scientific community with its high intensity. Using a combination of reanalysis data and factorial Earth System Model simulations, we show that heat released from condensation over the North Pacific and local soil moisture deficits strongly contributed to the extreme heat where the temperatures were most anomalous. Mediated by desiccating soils, our analysis also points to complex land–atmosphere interactions beyond intensified surface sensible heating. Since it remains unclear to what extent an enhanced thermodynamic potential — such as epitomized by this remarkable “black swan event” — is responsible for the observed exacerbation of heatwaves in recent decades, we we also investigate the link between summertime soil drought and hot extremes in our changing climate.

How to cite: Schumacher, D. L., Hauser, M., and Seneviratne, S. I.: Assessing the role of thermodynamic drivers underlying extreme heat in a warming climate, EGU General Assembly 2023, Vienna, Austria, 23–28 Apr 2023, EGU23-11753, https://doi.org/10.5194/egusphere-egu23-11753, 2023.

EGU23-13740 | ECS | Orals | CL2.5

Detecting Extreme Temperature Events Using Gaussian Mixture Models 

Aytaç Paçal, Birgit Hassler, Katja Weigel, M. Levent Kurnaz, and Veronika Eyring

Extreme events are rare atmospheric phenomena that cause significant damage to humans and natural systems, but detecting extreme events in the future in a changing climate can be challenging. Traditionally, temperature distributions were assumed to follow a normal distribution and certain thresholds were used to define extreme events. However, the mean and the variance of temperatures are expected to change in a future climate, which might limit the application of traditional methods for detecting extreme events.

We found that daily maximum surface temperature data can be described accurately using a multimodal distribution. In this study, we therefore used a statistical method called Gaussian Mixture Models (GMM) to fit a multimodal distribution to daily near-surface maximum air temperature data from simulations participating in the Coupled Model Intercomparison Project Phase 6 (CMIP6) for 46 Intergovernmental Panel on Climate Change (IPCC) land regions. GMM allowed us to use the parameters from the Gaussian distribution fitted to the higher temperatures to define the thresholds for the return period of extreme events. We analysed the change in the return periods of extreme temperature events in study regions compared to the historical period (1980-2010) under future Global Warming Levels (GWL) of 1.5°C, 2°C, 3°C and 4°C for each Shared Socioeconomic Pathways (SSP) scenarios. 

How to cite: Paçal, A., Hassler, B., Weigel, K., Kurnaz, M. L., and Eyring, V.: Detecting Extreme Temperature Events Using Gaussian Mixture Models, EGU General Assembly 2023, Vienna, Austria, 23–28 Apr 2023, EGU23-13740, https://doi.org/10.5194/egusphere-egu23-13740, 2023.

EGU23-14462 | ECS | Posters on site | CL2.5

Analysis of rainfall generation process in east Asia by Summer Cold Wave 

Kwang-Hee Han, Ho-Young Ku, Jee-Hoon Jeong, and Baek-Min Kim

In August 2022, extremely heavy rainfall occurred in the central region of the Korean Peninsula. On August 8, Seoul received 381.5 mm of rain, the most in 115 years. Heavy rain is a phenomenon that accounts for the most significant portion of dangerous weather occurring in Korea, and many studies, including the mechanism of occurrence, have been done on this phenomenon. However, the synoptic pressure pattern that caused heavy rain in August 2022 differed from the rainfall pattern studied in general. The pressure system around the Korean Peninsula also showed a different pattern from the typical summer pressure characteristics. As a result, by reviewing the pressure system specificity of the Korean Peninsula and the Eurasian continent, this study investigated the mechanism and climatological factors of heavy rain in August 2022. In August 2022, strong high pressure developed over the Eurasian continent, the Kamchatka Peninsula, and the Ural Mountains. On August 8, a stationary front crossing the Korean Peninsula from east to west was located. To determine the specificity of the barometric pressure system, the air temperature and barometer of the ground and upper layers were analyzed using ECMWF's ERA-5 reanalysis data. At the surface level, high pressure intensified near the Ural Mountains and Lake Baikal in Siberia in early August. In the case of temperature, the advection of cold air below a -5°C anomaly from high latitudes to the northwest of the Korean Peninsula through Siberia following the flow of lower high pressure is analyzed. At 500 hPa, upper-level blocking was observed in the Ural Mountains and the Kamchatka Peninsula. The blocking over the Eurasian continent reduced zonal flow while increasing meridional flow. Cold air from the high latitudes was transported to East Asia by the increased meridional flow. The cold air that moved toward East Asia met the edge of the North Pacific high pressure and formed a stationary front, causing heavy rain. In this study, the development of a cold continental high pressure in summer affecting the mid-latitude region was defined as the "Summer Cold Wave" (SCW), and the development of the front by the SCW was defined as the "Summer Cold Front" (SCF). In addition, by analyzing cases where SCW occurred in the past, it was determined that the development of Ural blocking in summer influenced the occurrence of SCW, and it was determined that precipitation due to SCF increased in the Korean Peninsula when the North Pacific high pressure occurred strongly.

How to cite: Han, K.-H., Ku, H.-Y., Jeong, J.-H., and Kim, B.-M.: Analysis of rainfall generation process in east Asia by Summer Cold Wave, EGU General Assembly 2023, Vienna, Austria, 23–28 Apr 2023, EGU23-14462, https://doi.org/10.5194/egusphere-egu23-14462, 2023.

EGU23-15195 | Orals | CL2.5

Extremely hot East Asia and flooding western South Asia in the summer of 2022 tied to reversed flow over Tibetan Plateau 

Chao He, Tianjun Zhou, Lixia Zhang, Xiaolong Chen, and Wenxia Zhang

In the summer (July and August) of 2022, unprecedented heat wave occurred along the Yangtze River Valley (YRV) over East Asia while unprecedented flood occurred over western South Asia (WSA), which are located on the eastern and western sides of Tibetan Plateau (TP). By analyzing the interannual variability based on observational and reanalysis data, we show evidences that these two extreme events are mutually connected, and the anomalous zonal flow over subtropical Tibetan Plateau (TP) explains a major fraction the extreme events occurred in 2022. In summer, there is a warm center in the atmosphere over TP, and the isentropic surfaces incline eastward (westward) with altitude on the eastern (western) side of the warm center over TP. As adiabatic flow move along isentropic surfaces, anomalous easterly (westerly) flow generates anomalous descent (ascent) on the eastern side of TP and anomalous ascent (descent) on the western side of TP via isentropic gliding. The anomalous easterly flow is extremely strong to reverse the climatological westerly flow over subtropical TP in 1994, 2006, 2013 and 2022. The easterly flow in 2022 is the strongest since 1979, and it generates unprecedented descent (ascent) anomaly on the eastern (western) side of TP, leading to extreme heat wave over YRV and extreme flood over WSA in 2022. The anomalously strong easterly flow over subtropical TP in 2022 is dominated by atmospheric internal variability related to mid-latitude wave train, while the cold sea surface temperature anomaly over the tropical Indian Ocean increases the probability of a reversed zonal flow over TP by reducing the meridional gradient of tropospheric temperature.

How to cite: He, C., Zhou, T., Zhang, L., Chen, X., and Zhang, W.: Extremely hot East Asia and flooding western South Asia in the summer of 2022 tied to reversed flow over Tibetan Plateau, EGU General Assembly 2023, Vienna, Austria, 23–28 Apr 2023, EGU23-15195, https://doi.org/10.5194/egusphere-egu23-15195, 2023.

Atmospheric blockings have widespread, long-lasting, and severe consequences in a variety of regions, causing climate extremes such as drought, heavy rainfall, cold spells, and heatwaves. Depending on where the blocking occurs, climate anomalies caused by high-latitude Euro-Atlantic winter blockings, in particular, have a significant impact on Arctic sea ice export in the North Atlantic, and thus on the freshwater budget in deepwater formation regions, and also impact Greenland ice cap and Arctic sea ice recovery during the cold polar season. Understanding the evolution of future winter Euro-Atlantic blockings in the context of climate change is thus critical for accurately predicting future changes in cryosphere systems and ocean circulation. The future evolution of these blockings, however, remains highly uncertain because coupled climate models generally fail to reproduce their frequencies of occurrence and spatial locations in historical runs. Meanwhile, recent research has shown that historical atmospheric blockings are much better simulated in climate models with eddy-permitting ocean resolutions due to more accurately represented mean climate states and air-sea interactions. Here, we show that eddy-permitting climate models provide blocking projections with much lower uncertainties in terms of frequency and spatial extent by using an ensemble of more than a hundred of CMIP6 climate model simulations, both ran with and without eddying ocean models. Finally, we show from the set of model simulations with eddying ocean models that the frequency of blocking types leading to dryer and warmer winter conditions in North Atlantic-Arctic regions for the next three decades is likely to increase under strong warming scenarios. Such an evolution in blocking activity would trigger large sea ice export events in the North Atlantic and a low rate of recovery of Artic sea ice and the Greenland ice cap during winter, leading to quicker ice loss in general than for climate models with standard ocean grids resolutions.

How to cite: Michel, S. L. L., von der Heydt, A. S., and Dijkstra, H. A.: New projections of winter Euro-Atlantic atmospheric blocking activity under strong warming scenario and consequences for Arctic land and sea ice, EGU General Assembly 2023, Vienna, Austria, 23–28 Apr 2023, EGU23-15205, https://doi.org/10.5194/egusphere-egu23-15205, 2023.

EGU23-16399 | Posters virtual | CL2.5

Spatial and temporal variability of compound drought heatwave events in the Northern Hemisphere 

Chan Diao, Liang Zhao, Xiuchen Wu, and Yang Li

Recent decades have witnessed a notable increase in the compound drought and heatwave events (CDHW) in many regions across the globe, which may have more complex and intense implications on terrestrial ecosystem stability than individual extreme events.  It is necessary to clarify the response of terrestrial ecosystems to compound drought-heatwave events. However, the research is remain poorly understood about this. Therefore, we used the Standardized Precipitation Index (SPI) and temperature data to extract the regions where occur compound drought and heatwave events in global. The results obtained in this study are as follows: Firstly, the majority of the regions that have experienced compound drought heatwaves have experienced only one such event, while only a small percentage have experienced two such events. Secondly, we found that the number of compound drought heatwave events in all years is generally more in drylands than in wetlands.

How to cite: Diao, C., Zhao, L., Wu, X., and Li, Y.: Spatial and temporal variability of compound drought heatwave events in the Northern Hemisphere, EGU General Assembly 2023, Vienna, Austria, 23–28 Apr 2023, EGU23-16399, https://doi.org/10.5194/egusphere-egu23-16399, 2023.

Abstract

The empirical probability distribution of extreme precipitation in the eastern United States comprises heavy rainfall events stemming from the moisture held by the Atmospheric Rivers (ARs). In many sites, ARs trajectories can have varying impacts on the extreme precipitation seasonality based on the moisture source and tracks. Consequently, a characterization of location specific and regional patterns of timing of extreme precipitation caused by ARs and their non-stationarity has salience for both scientific and engineering concerns. To this end, analysis of annual maximum daily precipitation (AMP) at 581 long-term stations across the eastern United States was pursued in this study to evaluate the role of moisture sources and tracks in the seasonality of extreme rainfall-AR related events (AMP-AR) and their temporal changes over the 1950–2015 period. The key results from this study include: (a) spatio-temporal variation in the fraction of annual maximum precipitation events linked to ARs, and (b) a marked influence of moisture sources on the seasonality of AMP-AR related events. Results from this study have important bearing on the flood risk management and preparedness.

How to cite: Dhakal, N. and Aljoda, A.: Role of atmospheric moisture sources and pathways in the seasonality of extreme precipitation over the eastern United States, EGU General Assembly 2023, Vienna, Austria, 23–28 Apr 2023, EGU23-16634, https://doi.org/10.5194/egusphere-egu23-16634, 2023.

EGU23-16862 | ECS | Posters on site | CL2.5

High Asia Refined analysis-based Monsoon precipitation characteristics over Indian Himalayas 

Rohtash Saini, Raju Attada, Nischal Sharma, and Sreehari Kizhuveettil

The Himalayas, known as the world's third pole, are extremely vulnerable to the ramifications of extreme precipitation events (EPEs), such as flash floods, landslides, and agricultural and infrastructural damages during the Indian summer monsoon (ISM). Complex terrain, high meteorological diversity and uncertainty in observations over this region, make it challenging to comprehend the precipitation disparities and predict the EPEs across the Western Himalayas (WH). Therefore, a better representation of ISM precipitation characteristics over the WH using high-resolution data is crucial for precisely understanding the precipitation variability and mechanisms of climate-triggered localised natural disasters. This study investigates the spatiotemporal variability of precipitation and EPEs using High Asia Refined analysis version 2 (HAR v2), during ISM. It is generated by dynamically downscaling global ERA5 reanalysis data, using Weather Research and Forecasting model (WRF). Before investigating the EPEs, we evaluated HAR v2's ability to represent general characteristics of ISM over the WH against reanalysis, satellite and observational datasets. Preliminary results indicate that, HAR v2 reanalysis better represented the spatiotemporal patterns of precipitation and EPEs across WH. The present study will also investigate the dynamic and thermodynamic processes, associated with EPEs over the study region. Overall, this study aims to provide scientific insights to investigate the potential impacts of climate change on extreme events, which in turn could help mitigate disasters in the Himalayan region. Detailed results of precipitation variability over the Himalayas, and mechanisms altering the atmospheric conditions attributed to the EREs will be discussed.

Keywords: Indian Summer Monsoon, Himalayas, HAR-V2 reanalysis, Extreme Precipitation Events

How to cite: Saini, R., Attada, R., Sharma, N., and Kizhuveettil, S.: High Asia Refined analysis-based Monsoon precipitation characteristics over Indian Himalayas, EGU General Assembly 2023, Vienna, Austria, 23–28 Apr 2023, EGU23-16862, https://doi.org/10.5194/egusphere-egu23-16862, 2023.

EGU23-17028 | ECS | Posters on site | CL2.5

Diagnosis of Extreme Precipitation Events in the Yucatan Peninsula. 

Marta Paola Rodríguez González and Ruth Cerezo Mota

Given the impacts of human-induced global warming on the water cycle, it is relevant to pay attention to those impacts on water security as it is one of the UN's SDGs (sustainable development goals).

Many studies on future climate projections agree on a positive trend of extreme precipitation in various regions of the world. However, the process and causes of those events are not always clear and can change depending on local scales.

On the one hand, there is a dynamic mechanism due to atmospheric circulation, and on the other, there are local and thermodynamic effects from surface variables. In addition, the characteristics of the vegetation cover can influence the distribution and conservation of water in the system.

The Yucatan Peninsula - located in the southeastern part of Mexico- has a particular climate due to its morphological and hydrological characteristics (scarce orography and absence of rivers). Therefore, in this region, the recharge of the aquifer depends entirely on rainfall.

In this study, we first characterised the trend of precipitation in the last 30 years. Then we analysed the region's contribution to total annual precipitation by different hydrometeorological phenomena (e.g. tropical cyclones and cold fronts). Finally, simulations with RegCM4 were analysed to understand local mechanisms that favour the occurrence of extreme rainfall related to changes in vegetation and land use due to urbanization.

In general, the results show that the accumulated total annual precipitation has a negative trend, while the contribution of extreme events to total precipitation has increased. Moreover, under urban land use, precipitation would increase, especially in the spring months, and it would decrease during the summer.

Keywords: precipitation, extreme events, land use change, Yucatan, RegCM, urbanization.

How to cite: Rodríguez González, M. P. and Cerezo Mota, R.: Diagnosis of Extreme Precipitation Events in the Yucatan Peninsula., EGU General Assembly 2023, Vienna, Austria, 23–28 Apr 2023, EGU23-17028, https://doi.org/10.5194/egusphere-egu23-17028, 2023.

EGU23-197 | ECS | Orals | CL2.8

Urban Heat Island and thermo-physiological stress by Local Weather Types in Lisbon 

Cláudia Reis, André Nouri, and António Lopes

Today’s urban areas are excessive heat sources. The urbanization process has led to the development of positive temperature anomalies, called Urban Heat Islands (UHI). The future climate projections add an increasingly concern to the already heated and polluted urban environments, especially the increase in air temperature and in the frequency, intensity and duration of heat wave events. Hence, the degradation of the thermal conditions is already affecting human thermo-physiological comfort (TC) and health. In this investigation the UHI effect in Lisbon was detailed analyzed according to different thermal seasons (created based on the annual cycle of maximum and minimum air temperatures) and meteorological conditions, these later grouped into Local Weather Types (LWT). Over 60 000 hourly air temperature grids between 2008 and 2014 with a spatial resolution of 100m were extracted from the Copernicus Earth Observation Program. The UHI was calculated based on the widely used land use/land cover scheme, Local Climate Zones (LCZ). Furthermore, the UHI daily cycle by LWT and LCZ was also analyzed. Results show that on rainy conditions with higher cloud coverage the UHI effect is less pronounced (median intensity close to 0ºC), while on sunny conditions with weak to moderate winds and almost no clouds, especially very cold winter days and very hot summer days, median UHI reach 1.5ºC. The analysis of the UHI daily cycle proves that the UHI effect is mainly a nighttime phenomenon, while during the morning a slight Urban Cool Island (UCI) appears on most LWT. However, the analysis of UHI’s patterns and intensities only shows and compares the distribution of air temperature across different land uses, but the human body’s thermal sensation depends not only on air temperature, but also on wind, humidity, and radiation fluxes Therefore, the TC on 163 days between 2008 and 2014 from a particular LWT (the hottest summer days) was modeled in Lisbon. Thirteen microscale samples were selected according to the LCZ scheme, and 2 different TC indices based on the heat balance of the human body (Physiologically Equivalent Temperature (PET) and Universal Thermal Climate Index (UTCI)) and Mean Radiant Temperature (MRT) were modeled during the day (12:00 to 15:00h) and night (00:00 to 03:00h) on a freely available and user-friendly software (SkyHelios v. 1.5). Results depict a moderate heat stress on LCZ A during the day (average PET/UTCI/MRT of 34ºC, 32ºC and 45ºC respectively) while the  sun-exposed and poorly ventilated areas on the remaining samples registered higher PET, UTCI (strong to extreme heat stress) and MRT values. During the night, PET results present a slight cold stress in all samples, while UTCI simulations show no thermal stress. This investigation will ultimately help to identify critical areas in the city that need interventions on surface materials, urban morphology, urban greenery and anthropogenic heat emissions in order to mitigate extreme heat conditions and its health risks associated.

How to cite: Reis, C., Nouri, A., and Lopes, A.: Urban Heat Island and thermo-physiological stress by Local Weather Types in Lisbon, EGU General Assembly 2023, Vienna, Austria, 23–28 Apr 2023, EGU23-197, https://doi.org/10.5194/egusphere-egu23-197, 2023.

There is often a lack of meteorological stations in cities, which makes it difficult to examine their microclimate. Alternatively, it is possible to get around this by fixing measuring instruments on bicycles and traversing through the city to observe spatial patterns in the urban canopy layer. The "traverse" approach enables insight into the spatial variation of air temperature in relation to urban form.

In this research, air temperature measurements were carried out using bicycles and an IoT MF-300 instrument with a synchronized GPS receiver and a temperature probe under different weather conditions throughout 2021 and 2022 in Zagreb, Croatia. The GPS receiver's high sensitivity and position accuracy allowed measurements in places like urban canyons and dense foliage environments. The routes were carefully designed to pass through morphologically diverse parts of Zagreb to emphasize the heat characteristics of the city's microclimate. We specifically analysed the spatial distribution of air temperature and land surface temperature (LST) during a heat wave event on the 24th of June 2021. On that day mobile measurements were conducted between 10:30 and 11:15 AM local time to match the LST measurements of the Landsat-8 satellite that overpassed Zagreb at approximately 10:45 AM. Additional measurements were carried out in other seasons and at different times of the day.

Results show thermal differences between surface types and urban forms. During a heat wave event, air temperatures reached up to 35 °C, and LST was above 40 °C, which are high temperatures considering the time of measurement. However, mobile measurements showed that city parks can be even 3 °C cooler compared to densely built-up city areas. Due to the high response time of the instrument, the effect of microscale city properties, such as tree lines, was also observed. These results indicate the cooling effect of green areas in Zagreb and the importance of their preservation for heat load reduction and mitigation of the negative effects of the urban heat island.

How to cite: Žgela, M. and Herceg Bulić, I.: Urban heat load assessment in Zagreb, Croatia: a multi-scale analysis using mobile measurements and satellite imagery, EGU General Assembly 2023, Vienna, Austria, 23–28 Apr 2023, EGU23-290, https://doi.org/10.5194/egusphere-egu23-290, 2023.

EGU23-848 | ECS | Orals | CL2.8

Rainwater harvesting potential: the Turin case for an analysis at the urban scale 

Matteo Carollo, Ilaria Butera, and Roberto Revelli

The population growth and its concentration within cities, on the one hand lead to an increment of water demand and on the other hand affect the urban water cycle with frequent urban flood events associated to rain extreme events. New approaches to the water management are currently being developed where a role is assigned to rain water harvesting (RWH). RWH provides water for non-potable uses (private and public, indoor and outdoor), reducing water consumption. Moreover, RWH allows to partially retain water on site, reducing the probability of failures of the sewerage system during heavy rain events.

These positive effects are easily evaluable at a building scale when well-known behavioral models are used, while the evaluation becomes often more complex at an urban scale, due to the lack of characteristics and demographic data about all the buildings in the city. In our work, we consider RWH impact at the urban scale, by means of the representative building concept.

We focus on several hypothetical retrofitting scenarios for the residential buildings of Turin (Italy): 1) domestic use of rainwater (e.g., toilet flushing and the washing machine), where buildings are independent of each other, and 2) two public uses of rainwater (the irrigation of public green areas and street washing), for which we have hypothesized that the rainwater collection takes place at a district scale. We estimate a reduction of 42% in the non-potable water consumption for domestic use (values vary across the municipal districts from 29% to 62%, according to the characteristics of the buildings), while for irrigation and street washing, that require a lower amount of water, about 80% of the water can be provided by RWH. The highest reduction of the flow peak conveyed to the sewerage system during extreme storms is reached in the domestic use scenario (about 60%, quite constant across the city), while for public uses the retention capacity is very low.

Finally, our estimations based on historical rainfall series are examined against different climate change scenarios.


How to cite: Carollo, M., Butera, I., and Revelli, R.: Rainwater harvesting potential: the Turin case for an analysis at the urban scale, EGU General Assembly 2023, Vienna, Austria, 23–28 Apr 2023, EGU23-848, https://doi.org/10.5194/egusphere-egu23-848, 2023.

EGU23-1326 | Orals | CL2.8

Sensitivity of micro-scale atmospheric processes in a city quarter of Berlin, Germany on elevated meso-scale temperature forcing 

Dieter Scherer, Katharina Scherber, Ute Fehrenbach, Fred Meier, Marco Otto, Benjamin Schmidt, Ralf Steikert, and Achim Holtmann

During heat waves, urban dwellers are exposed to elevated temperatures, especially during night-time when urban heat island (UHI) effects are most intense. Climate change is expected to further increase heat-stress hazards. There are only few studies that have investigated how UHI effects interfere with heat waves. Here, we present results from a sensitivity study in which we analyse non-linear effects of elevated meso-scale temperature forcing on micro-scale atmospheric processes. The study employs the large eddy simulation model PALM-4U. The ‘Tempelhofer Feld’ in Berlin, Germany, the largest park within the city, was used as study area. Starting point was a 24 h (plus 6 h spin-up) control simulation followed by a scenario simulation in which all temperature variables, not only air temperature, were increased by 1 K. The control simulation was configured to represent a real weather situation in an idealized form. Grid spacing was set to 10 m horizontally and 2 m vertically to resolve buildings and trees. A residential area to the east of the airport was simulated with a higher horizontal grid resolution of 2 m to investigate micro-scale atmospheric processes in more detail. The results show that the micro-scale response of near-surface air temperature to elevated meso-scale temperature forcing is not constant throughout the day with lower values during day-time and higher values during night-time, particularly in the early evening. In both simulations, the night-time inversion over the park continues into the settlement above the roof level. The study shows that there are weak non-linear effects leading to an amplification of the UHI during night-time. However, as linear effects dominate, adaptation measures with regard to heat stress may be planned on the basis of current weather and climate conditions, additionally documented by observational data, and subsequently evaluated by urban climate monitoring.

How to cite: Scherer, D., Scherber, K., Fehrenbach, U., Meier, F., Otto, M., Schmidt, B., Steikert, R., and Holtmann, A.: Sensitivity of micro-scale atmospheric processes in a city quarter of Berlin, Germany on elevated meso-scale temperature forcing, EGU General Assembly 2023, Vienna, Austria, 23–28 Apr 2023, EGU23-1326, https://doi.org/10.5194/egusphere-egu23-1326, 2023.

EGU23-1367 | ECS | Orals | CL2.8

Evaluating the impact of urban parks on the thermal comfort during a heat wave episode in a Mediterranean city 

Ricard Segura, Carme Estruch, Alba Badia, Sergi Ventura, E. Scott Krayenhoff, and Gara Villalba

The Mediterranean basin is expected to experience an increase in intensity and frequency of heat wave events. Additionally, heat peaks are exacerbated by the low albedo of urban materials and the heat island effect of urban areas. To reduce heat-related discomfort and health risks, urban planners aim to implement green infrastructures to regulate temperatures thanks to their transpiration cooling effect. For example, the Metropolitan Area of Barcelona (AMB) has created a metropolitan network of “climate shelters”, which are public spaces (both indoor and outdoor) where urban dwellers can find better climatic conditions. Urban parks can be considered “climate shelters” if two requirements are met: the NDVI of the vegetation is higher than 0.4 and the extension of the park is bigger than 0.5 ha. However, given the dense urban edification and space limitation, we wanted to explore the thermal regulation capacity of smaller urban parks which are easier to implement. In this study, we present the results of a micrometeorological measurement campaign to assess the temporal and spatial variations of thermal comfort in parks of different sizes in the AMB during a heatwave episode in July 2022. The goals of this study are to determine the impact on human biometeorology of urban design in the construction of urban parks for facing heatwave episodes and to check the classification requirements for the “climate shelters”.

Using a mobile human-biometeorological weather station (MaRTy cart), we registered the microclimatic factors affecting thermal exposure at different points inside and outside the parks. From the microclimatic measurements we derived the Universal Thermal Climate Index (UTCI). Additional characterization of the measurement points consisted in sky-view-factor estimations and 360o vegetation and impervious view factors. Throughout the campaign period and measurement hours (14:00, 15:00 and 20:00 LT), the UTCI varied between 29.5 oC (moderate heat stress) and 41.9 oC (very strong heat stress). During the early afternoon, when air temperatures and heat stress are higher, the UTCI is lower inside of the parks, by a difference that ranges from 1.0 oC to 3.2 oC. The sky-view-factor is responsible for 43 to 58% of the observed variability in the UTCI, pointing out the importance of tree shadowing inside the parks. Air temperature has also a clear influence on thermal comfort, explaining between 17 and 50% of the UTCI variability. Although air temperature reductions in smaller parks are not as significant as in the “climate shelter” park, there are vegetation zones inside the smaller parks with comparable reductions in the UTCI. The results show that small parks can provide thermal comfort in similar capacity as bigger parks classified as “climate shelters”.

How to cite: Segura, R., Estruch, C., Badia, A., Ventura, S., Krayenhoff, E. S., and Villalba, G.: Evaluating the impact of urban parks on the thermal comfort during a heat wave episode in a Mediterranean city, EGU General Assembly 2023, Vienna, Austria, 23–28 Apr 2023, EGU23-1367, https://doi.org/10.5194/egusphere-egu23-1367, 2023.

EGU23-1476 | Orals | CL2.8

Modeling daily urban temperature fields using land use regression approaches 

Moritz Burger, Moritz Gubler, and Stefan Brönnimann

Detailed knowledge about the intra-urban air temperature variability within a city is crucial for the implementation of adaptation strategies to counteract the negative effects of urban heat stress. Various methods to model urban-rural temperature differences exist, but they often only cover certain periods (heatwave, hot day) or meteorological conditions (sunny and calm) due to computational limitations or limited data availability. Land use regressions, which are usually based on fine scaled measurements and high resolution spatiotemporal data, are one promising method to overcome those limitations and to conduct daily urban temperature fields.

In the city of Bern, Switzerland, a very dense urban temperature network (about 1 station per 1.5 km2) is operated since summer 2018. With that detailed information on temperature and publicly available land use and meteorological data, different land use regression types with a differing degree of complexity were tested in the recent past. One main outcome of the application of the method in Bern is an urban temperature dataset that covers the temperature distribution of all nights of the metropolitan area of the summers 2007 to 2022 with a resolution of 50 meters. In this talk, we would like to present the different models applied in Bern, analyze the potential of land use regression approaches in urban climate studies, and discuss possible applications of the dataset regarding urban planning and heat stress studies.

How to cite: Burger, M., Gubler, M., and Brönnimann, S.: Modeling daily urban temperature fields using land use regression approaches, EGU General Assembly 2023, Vienna, Austria, 23–28 Apr 2023, EGU23-1476, https://doi.org/10.5194/egusphere-egu23-1476, 2023.

EGU23-1546 | Orals | CL2.8 | Highlight

Urban climate modelling, anywhere, at any time 

Matthias Demuzere, Jonas Kittner, Mathew Lipson, and Ting Sun

In recent years it has become increasingly evident that the solutions to climate changes, both mitigation
and adaptation, must pay greater attention to the places where most people on the planet live. Moreover,
the demand for weather services at urban scales is increasing in line with the ability to model
atmospheric processes at these finer scales; these advances could herald more resilient cities with the
evidence to support planning and design at appropriate time scales. In this context, the lack of
information on urban landscapes and the dearth of urban observations represent a major obstacle to
progress.
This work explores the possibility to create the scientific infrastructure needed to incorporate climate
knowledge into urban decision-making quickly. By combining globally available but locally appropriate
datasets (global map of LCZs, ERA5, Copernicus global land cover layers) and cloud computing (Google
Earth Engine), we created a seamless, holistic and user-friendly SUPY-based urban modelling framework
that can be applied anywhere at any time. Results are evaluated using the Urban Plumber flux tower
observations and a large unique database crowdsourced weather-station observations. The wider
purpose of the project is to develop a pathway to the creation of a universal ‘toolbox’ for baselining
climate-related data for use in any city.

How to cite: Demuzere, M., Kittner, J., Lipson, M., and Sun, T.: Urban climate modelling, anywhere, at any time, EGU General Assembly 2023, Vienna, Austria, 23–28 Apr 2023, EGU23-1546, https://doi.org/10.5194/egusphere-egu23-1546, 2023.

EGU23-1872 | Posters on site | CL2.8 | Highlight

Greening the cities – Improving micro-scale thermal conditions and enhancing sustainable urban environments 

Stevan Savić, Dragan Milošević, Jelena Dunjić, Hrvoje Krstić, and Ivan Šećerov

To improve the urban environment in general and contribute to the greening of urban areas in the cities of Central and Southeastern Europe, an international project was implemented in the period 2019-2022. The GReENERGY project is an international/cross-border project that is implemented in Europe, with the aim to improve the environmental conditions in cities, i.e., in this case, the urban areas of Novi Sad (Serbia) and Osijek (Croatia). Therefore, the activities of the GReENERGY project aim to: a) encourage the production and consumption of green energy through the installation of new solar power plants in public buildings, and reduce the energy consumption from conventional sources that are the major emitters of CO2; b) highlight the installation of vertical and horizontal greenery (green roofs and walls) on public facilities as one of the nature-based solutions (NBS) that ensure increased energy efficiency of buildings; and c) help preserve the urban ecosystem and improve outdoor thermal comfort conditions on a microscale.

The microclimate monitoring during the summer period and on hot days around a public building in Novi Sad (School for primary and secondary education “Milan Petrović”) showed that the thermal conditions are mainly driven by a combination of direct sunlight exposure or the presence of tree/building shadows. In our case, the differences in globe temperature (Tg) range from 6 °C to 10 °C during daytime at the micro-scale. A noticeable cooling effect caused by horizontal/vertical green areas is present during the night and based on datasets from our network this cooling effect is about 2 °C in Tg values.

Finally, thanks to the GReENERGY project the AWS network was installed around the public building in Novi Sad, and further monitoring, analysis and research of datasets from the network and current microclimate conditions in Novi Sad is supported by a new regional project financed by Autonomous Province of Vojvodina (regional government).

Finally, thanks to the GReENERGY project, an AWS network was installed around a public building in Novi Sad, and further monitoring, analysis and research of datasets from the network and current microclimate conditions in Novi Sad is supported by a new regional project financed by the Autonomous Province of Vojvodina (regional government).

Acknowledgement: The research was supported by the project entitled: "Improving the environment in Vojvodina in order to adapt to climate change and reduce the risk of natural disasters" (no. 142-451-3161/2022-01) financed by the Autonomous Province of Vojvodina.

How to cite: Savić, S., Milošević, D., Dunjić, J., Krstić, H., and Šećerov, I.: Greening the cities – Improving micro-scale thermal conditions and enhancing sustainable urban environments, EGU General Assembly 2023, Vienna, Austria, 23–28 Apr 2023, EGU23-1872, https://doi.org/10.5194/egusphere-egu23-1872, 2023.

EGU23-1976 | Orals | CL2.8 | Highlight

Copernicus for Urban Resilience in Europe: Final results from the CURE project 

Nektarios Chrysoulakis, David Ludlow, Zina Mitraka, Giorgos Somarakis, Zaheer Khan, Dirk Lauwaet, Hans Hooyberghs, Efrén Feliu, Daniel Navarro, Christian Feigenwinter, Anne Holsten, Tomas Soukup, Mario Dohr, Mattia Marconcini, and Birgitte Holt Andersen

A major challenge for the urban community is the exploitation of Earth Observation intelligence in managing in the multidimensional nature of urban sustainability towards enhancing urban resilience, particularly in relation to the challenges of climate change. This study presents the ways in which the H2020 funded project CURE (Copernicus for Urban Resilience in Europe) synergistically exploited Copernicus Core Services to develop cross-cutting applications supporting urban resilience. CURE provided the urban planning community with spatially disaggregated environmental intelligence at a local scale, as well as a proof-of-concept that urban planning and management strategies development enhancing the resilience of cities can be supported by Copernicus Core Services. Here, we demonstrate the technical operational feasibility of an umbrella cross-cutting system on urban resilience, consisting of 11 specific applications. These use Copernicus core products from at least two services each as main input information, reflect the main urban sustainability dimensions and are relevant to user needs, which were identified based on a strong stakeholders’ engagement. As a result, CURE is built on Data and Information Access Services (DIAS), as a system integrating these cross-cutting applications, capable of supporting downstream services across Europe, enabling its incorporation into operational Copernicus products portfolio in the future and also addressing its economic feasibility. For more information on CURE: http://cure-copernicus.eu

How to cite: Chrysoulakis, N., Ludlow, D., Mitraka, Z., Somarakis, G., Khan, Z., Lauwaet, D., Hooyberghs, H., Feliu, E., Navarro, D., Feigenwinter, C., Holsten, A., Soukup, T., Dohr, M., Marconcini, M., and Holt Andersen, B.: Copernicus for Urban Resilience in Europe: Final results from the CURE project, EGU General Assembly 2023, Vienna, Austria, 23–28 Apr 2023, EGU23-1976, https://doi.org/10.5194/egusphere-egu23-1976, 2023.

EGU23-2135 | Posters on site | CL2.8 | Highlight

Greenspace, bluespace, and their interactive influence on urban  thermal environments 

Leiqiu Hu and Qi Li

Urbanization has continued growing dramatically in the past few decades, as more than half of the global population live in urban areas. The alternation of surface materials and morphologic characteristics in urban areas and anthropogenic emissions from daily activities have been evident with a considerable influence on a wide spectrum of local climate, hydrologic cycles, and ecologic patterns. Decades of research efforts have enlightened our physical understanding of the impacts of LULC on urban climates. In addition, such knowledge has provided a scientific basis for adaptation and mitigation strategies in cities to counteract the risks associated with adverse climate effects. Examples include the adoption of high albedo roofs and pavements to alleviate heat stress and harnessing the evapotranspirative cooling power of urban greenspace and blue space (water bodies, including lakes, rivers, etc.) to provide a more comfortable thermal environment. Building on multiple-year dense observations from the ground networks and high-resolution spaceborne thermal measurements, this presentation will discuss the heat mitigation capacity of nature-based cooling infrastructures, such as green space and blue space.   Specifically, we will compare the thermal benefits of different cooling infrastructures, and how their spatial organization, and coverage yield different diurnal effects at both the microclimate scale and the city scale. The study shed light on their individual and interactive effects under different meteorological conditions, which offers new insights into the cooling benefit of excising urban amenities under various synoptical conditions, including extreme heat events. The findings provide critical information support to invest in future natural-based cooling amenities in cities as the heat threats grow dramatically on a global scale. 

How to cite: Hu, L. and Li, Q.: Greenspace, bluespace, and their interactive influence on urban  thermal environments, EGU General Assembly 2023, Vienna, Austria, 23–28 Apr 2023, EGU23-2135, https://doi.org/10.5194/egusphere-egu23-2135, 2023.

EGU23-2185 | ECS | Orals | CL2.8

Deep Learning-Based Vegetation Extraction and Vegetation Change Monitoring by using Very High-Resolution Satellite Imagery 

Aisha Javed, Yerin Yun, Jaewon Hur, Junho Yeom, and Youkyung Han

Vegetations play an important role in the management of physical activities and the public health of urban residents. However, with the rapid urbanization in the world, vegetation regions are changing constantly. In order to prevent the decrease in vegetation areas, constant vegetation monitoring is required. In this study, we performed vegetation extraction and vegetation change monitoring in very high-resolution (VHR) satellite imagery through deep learning-based techniques. To this end, two deep learning networks (i.e., DeepLabV3-plus, and deeply supervised image fusion network (DSIFN)) were used for vegetation extraction and change detection, respectively. Firstly, the two networks were trained on the two datasets each for their respective purpose. Then, a DSIFN was tested to detect all the changes occurring in VHR bitemporal satellite images. Moreover, the binary vegetation maps from bitemporal images were independently generated by using DeepLabv3-plus. Later, the vegetation maps and the change detection result were combined to figure out the change tendency related to vegetation. To show the effectiveness of the proposed method, an accuracy assessment was carried out. The proposed method can be used to determine the amount of change occurring within a period in the vegetation of urban areas.

How to cite: Javed, A., Yun, Y., Hur, J., Yeom, J., and Han, Y.: Deep Learning-Based Vegetation Extraction and Vegetation Change Monitoring by using Very High-Resolution Satellite Imagery, EGU General Assembly 2023, Vienna, Austria, 23–28 Apr 2023, EGU23-2185, https://doi.org/10.5194/egusphere-egu23-2185, 2023.

EGU23-2638 | ECS | Posters virtual | CL2.8

Bioclimatic characteristics of the county seat cities in the Moldova - Romania region, outlined by ITU 

Nistor Alina, Nistor Bogdan, Mihăilă Dumitru, Bistricean Petruț-Ionel, Sfica Lucian, and Emandi Elena Maria

Argument. The bioclimate is one of the most important life factors for humans, influencing a multitude of states, reactions, attitudes, actions and human activities. In the context of the regional warming of the atmosphere, in the conditions where the warming of the atmosphere of the cities of the region is faster and considering that in the cities of Suceava, Botoșani, Piatra Neamț, Iași, Bacău, Vaslui, Focșani and Galaţi there are 1,469,929 inhabitants, this study is necessary and fills a gap in scientific research with the information it brings.

Objectives. Having temperature and humidity data series from 10 stations in the 8 cities for the interval January 1, 2009 - December 31, 2022, we bring to the knowledge plan the temporal and spatial coordinates of the ITU for the Moldova region, with the attention focused on the days of the warm season in which ITU was above the thresholds of 66 (the lower limit of the alert threshold) and 80 units (the lower limit of the bio-meteorological discomfort threshold). The objectives of the study are:

  • i) outlining the differences and similarities of the multiannual, annual and daily regime of the ITU, with the identification and determination of the frequency of occurrence of temporal entities in which the value increase exceeded the threshold of 66, respectively 80 units,
  • ii) the identification of critical intervals from year and day in which the thermo-hygrometric complex can put man in difficulty, iii) finding some explanations related to the spatiality and temporality of the ITU, focusing on the positional, dimensional-urbanistic and synoptic factors, for the cases where the ITU has passed the threshold of 66/80 units.

Results. From all the processed time series, it emerged that the ITU can exceed the daily threshold of 66 units in the April - October interval. The highest frequency of days with ITU above 66 units is reached at all stations during summer days. ITU went up to over 80 units almost exclusively on summer days, most frequently in big cities (Iași - 9.8%, Galați - 2.9%).In the other cities, the ITU passing over 80 units is almost statistically insignificant at the daily level (in Suceava, Botoșani, Piatra Neamț and Focșani, the share of days with ITU ≥ 80 was equal to 0). Between 11-13 and 19-21 and only in the months of June-August ITU exceeded 80 units. In Iași, the share of hours with ITU over 80% was 14.6%, in Galati 9.8%, and in Piatra Neamț only 0.23%. Daily cases with ITU values above 66% held 57.5% of the time and were due to anticyclonic billow baric fields.

Conclusions. Through the ITU we demonstrated that in Moldova, on summer days, between 11:00 and 21:00, in a predominantly anticyclonic synoptic context, there is a moderate bio-meteorological risk for the population that goes outside the home during this time.

How to cite: Alina, N., Bogdan, N., Dumitru, M., Petruț-Ionel, B., Lucian, S., and Elena Maria, E.: Bioclimatic characteristics of the county seat cities in the Moldova - Romania region, outlined by ITU, EGU General Assembly 2023, Vienna, Austria, 23–28 Apr 2023, EGU23-2638, https://doi.org/10.5194/egusphere-egu23-2638, 2023.

EGU23-2898 | ECS | Posters on site | CL2.8

How will the Surface Urban Heat Island respond to changes in climate? 

Sarah Berk, Manoj Joshi, Peer Nowack, and Clare Goodess

The Surface Urban Heat Island (SUHI), known as the difference in land surface temperature (LST) created by the presence of a city, is impacted by both the climate and morphology of the city in question. Subsequently, a changing climate would be expected to result in consequences for characteristics of the SUHI. Modelling the future climate of cities remains a challenge as resolution of global climate models is too coarse to capture the scale of a city, and regional climate models are computationally expensive. In order to address these issues, statistical models can be used. Using a dataset of cities selected based on similar characteristics such as population, variation of elevation within the city and surrounding area, and proximity to water bodies, satellite data is used to quantify the SUHI magnitude. A statistical model is fitted to current observations using predictive variables based on climate. The model shows promising performance for the majority of cities in the dataset and results are discussed.  

How to cite: Berk, S., Joshi, M., Nowack, P., and Goodess, C.: How will the Surface Urban Heat Island respond to changes in climate?, EGU General Assembly 2023, Vienna, Austria, 23–28 Apr 2023, EGU23-2898, https://doi.org/10.5194/egusphere-egu23-2898, 2023.

EGU23-3249 | ECS | Orals | CL2.8

Study of the urban effect of Paris on several thunderstorm cases in 2022, using hectometric ensemble simulations 

Arnaud Forster, Valéry Masson, and Clotilde Augros

Climate change and a rapidly increasing urban population make cities more vulnerable to hazardous weather events. The need for a better understanding of meteorological processes and an improvement of the weather prediction system in an urban environment is crucial to mitigate these impacts and protect the population. 

The “Paris Olympics” international Research and Demonstration Project, endorsed by WMO, aims at improving meteorological research in urban meteorological processes and weather forecasting systems at 100m resolution. It mainly focuses on extreme weather events in urban areas such as urban heat islands and thunderstorms. Several study cases have been proposed. They are golden cases observed during the PANAME2022 field campaign in Paris and they represent interesting weather situations to test numerical weather prediction capacities.

The objective of this study is to investigate through the selected cases, the influence of Paris’s urban environment on thunderstorms. An ensemble of hectometric simulations is built using the Meso-NH research atmospheric model initialized and forced by the members of the AROME-EPS ensemble prediction system which has a 1.3 km horizontal resolution. For each case, two sets of ensemble simulations are performed; to identify the main processes driving the interactions between urban environment and thunderstorms: one with a fine-scale surface description of the city (using a multi-layer urban scheme) and another one where the urban surface is replaced with vegetation.

The first results show that it remains challenging to correctly simulate the location of thunderstorms. Nevertheless, the ensemble technique combined with urban and non-urban city description is effective to discriminate random effects from real trends on  the urban environment impacts on thunderstorms.

How to cite: Forster, A., Masson, V., and Augros, C.: Study of the urban effect of Paris on several thunderstorm cases in 2022, using hectometric ensemble simulations, EGU General Assembly 2023, Vienna, Austria, 23–28 Apr 2023, EGU23-3249, https://doi.org/10.5194/egusphere-egu23-3249, 2023.

EGU23-3458 | ECS | Orals | CL2.8

Comprehensive analysis of high-resolution dispersion simulations in urban area using the GRAMM/GRAL model 

Maximilian May, Simone Wald, and Sanam N. Vardag

During the last decade, atmospheric measurement networks in urban areas have become important drivers for global pollution and greenhouse gas (GHG) mitigation. For city stakeholders to effectively plan GHG emissions mitigation measures and to monitor changes in emissions, GHG concentration data both, from measurements and simulations on high resolution, are required, but still lacking in most cities. The accurate simulation of high-resolution dispersion in urban areas enables the interpretation of concentration measurements as well as quantitative estimates of local emissions in an inverse modelling framework.

High-resolution dispersion simulations on neighborhood scale are generally computationally costly, preventing the analysis of long time periods. To overcome this limitation, we use the coupled GRAMM/GRAL model which is computationally efficient due to a ‘catalogue approach’. GRAMM/GRAL is composed of the mesoscale model GRAMM, solving the Reynolds Averaged Navier Stokes equations for an outer domain (resolution 100 m), and the computational fluid dynamics model GRAL for an inner domain (resolution 10 m). We run GRAMM for 1008 different wind situations differing in synoptic wind forcing and stability class. GRAL is initialized by the GRAMM fields and calculates wind fields taking the flow around buildings into account.  A time series of hourly, 10 m resolved wind fields and concentrations can be obtained by matching catalogued, simulated wind fields with measurement of a local wind measurement network (‘catalogue approach’).

Here, we evaluate the GRAMM/GRAL model in the urban area of Heidelberg for 12 months. 14 wind measurement stations within the inner GRAL domain enable a thorough evaluation of GRAL for yearly time periods and for a 12x12 km2 area under challenging topography. Our evaluation also includes wind profile measurements (up to 200 m) from a LIDAR. We find good agreement between modelled and simulated wind directions. Wind speeds can be simulated with an overall root-mean square difference of about 1 ms-1 and a mean bias of about -0.3 ms-1. Measurement sites with poorer model representation are located in the forest or the outer domain with coarser resolution. We conclude that GRAMM/GRAL is capable of simulating high-resolution wind fields in urban areas of complex topography. We showcase first dispersion simulations for carbon dioxide in Heidelberg.

How to cite: May, M., Wald, S., and Vardag, S. N.: Comprehensive analysis of high-resolution dispersion simulations in urban area using the GRAMM/GRAL model, EGU General Assembly 2023, Vienna, Austria, 23–28 Apr 2023, EGU23-3458, https://doi.org/10.5194/egusphere-egu23-3458, 2023.

The increasing frequency of heatwave events poses new threats to the health of urban residents. This effect can be exacerbated by the urban heat island (UHI) phenomenon. Air temperature is widely utilised in public health to quantify and analyse nonaccidental mortality attributable to heatwaves in urban areas throughout the world. Therefore, monitoring air temperature at the city level is important for identifying high-risk areas during heatwaves. However, measuring the spatial distribution patterns of air temperature in urban areas is challenging due to the lack of weather stations. The coarse spatial resolution of existing global and regional climate models is insufficient to detect the changes in microclimates, especially in complex-topography areas. In this study, a downscaling method for acquiring the 1-km hourly daytime air temperature data is proposed. It aims to produce a regression model by adopting Genetic Programming (GP) algorithm to estimate air temperature. Using multi-source datasets is considered to combine the advantages of spatial and temporal resolution from different datasets. This research used six weather stations from UK Met Office to assess the regression model obtained from seven satellite- and model-based products. The products consist of six satellite-based datasets retrieved from Aqua Moderate Resolution Imaging Spectroradiometer (MODIS), Terra MODIS, Shuttle Radar Topography Mission (SRTM) and Landsat 8, and one model-based dataset from the newly released ERA5-Land produced by the European Centre for Medium Range Weather Forecasts (ECMWF). The study demonstrates the potential of the proposed model in retrieving high-resolution urban air temperature. The regression model validation showed good results with an R-squared value of 0.992, an RMSE of 0.001 °C, an MAE of 0.322 °C and an NSE of 0.989. The novelty of the study is threefold: (a) unlike previous studies that only estimated the spatial distribution patterns of maximum daily temperatures in urban areas, this study is the first to produce estimations at a one-hour time granularity; (b) it innovatively combines multi-source datasets with GP algorithm to explore possible downscaling models; and (c) it makes the model more reflective of the temperature distribution of extremely hot days than others considering that the regression model is obtained based on data during heatwaves. This study provides a general framework for obtaining hourly air temperature data in urban areas, which could provide theoretical support for heatwave-related decisions. Simultaneously, it can help public health scholars improve the estimation process of mortality caused by heatwave events.

How to cite: Wen, Z., Zhuo, L., Wang, Q., and Han, D.: Estimating air temperature with high spatio-temporal resolution in urban areas during heatwaves using genetic programming algorithm combined with multi-source datasets, EGU General Assembly 2023, Vienna, Austria, 23–28 Apr 2023, EGU23-4451, https://doi.org/10.5194/egusphere-egu23-4451, 2023.

EGU23-5192 | ECS | Orals | CL2.8

Urban influences on rainfall interception of different tree species 

Markus Anys and Markus Weiler

The rapid expansion of impermeable surfaces in cities has a major impact on hydrology and meteorology. The infiltration of rainwater is reduced resulting in more overland flow with higher peak flows, but also reduced evapotranspiration and hence higher sensible heat flux. Urban trees are becoming more important as stormwater management or climate adaptation tools. The rainfall interception of trees already reduces overland flow generation and increases latent heat flux. An in-situ field experiment to measure throughfall on the common urban trees Acer platanoides (Norway maple) and Tilia cordata (small-leaved lime) was conducted to determine the interception of solitary trees on urban sites with different degrees of surface sealing and shading from surrounding buildings in the city of Freiburg, Germany. The influence of rainfall characteristics and tree morphological traits on interception behaviour was investigated with eight trees per species. 76 recorded rainfall events were evaluated from April to September 2021. The recorded interception rates were much higher compared to typical values in forests. Average interception rates were higher for T. cordata (70.29 ± 6.56%) than for A. platanoides (54.76 ± 10.29%). The average interception loss of the recorded events per tree was 2.58 ± 0.60 mm and 3.73 ± 0.29 mm for A. platanoides and T. cordata, respectively. For both tree species, significant linear correlations were found between the relative interception values and other factors like rainfall characteristics, the leaf area index (LAI), and the plant area index (PAI) (adj.R2 > 0.45). Compared to A. platanoides, T. cordata showed significant relationships between several tree morphological parameters (CR, CPA, CC, CV, LAD, PAD) and the relative interception values (adj.R2 > 0.43). The lowest LAI of both tree species were observed at sites with highest degree of surface sealing (tree pits), which also impacts the interception process. Our results provide a better understanding of the interception process of solitary trees for different urban settings. However, further field experiments with various tree species need to be conducted in order to obtain a larger database for simplified applications in modelling approaches and to support urban planners in managing stormwater runoff and adapt to climate change.

How to cite: Anys, M. and Weiler, M.: Urban influences on rainfall interception of different tree species, EGU General Assembly 2023, Vienna, Austria, 23–28 Apr 2023, EGU23-5192, https://doi.org/10.5194/egusphere-egu23-5192, 2023.

EGU23-5207 | ECS | Orals | CL2.8

Impact of land use/land cover changes on the urban heat load - a case study for the city of Dubrovnik 

Marijana Boras, Matej Žgela, and Ivana Herceg Bulić

In this study, land use/land cover changes were examined to investigate their impact on the urban heat load of the City of Dubrovnik in the present and future climate. Dubrovnik is situated in the Mediterranean, which has been referenced as one of the most responsive regions to climate change. Therefore, it is crucial to investigate the effects of different substrates on the heat load and its possible mitigation. Firstly, urban heat load, in the current morphology of the city, is investigated in the present and future climate conditions by using data observed at the local meteorological station and data obtained from regional climate models of the EURO-CORDEX initiative. Also, the urban climate model MUKLIMO_3 is utilized to obtain the spatial distribution of the heat load. Climate indices based on measured data (summer days and tropical nights) show that the heat load has been increasing in the last 50 years. The spatial distribution of the heat load in the City of Dubrovnik in the present climate indicates that the highest heat load is in the public and residential parts of the city. Furthermore, during the nighttime, heat load decreases with a reduction in the density of buildings. Climate indices obtained by simulations of the model MUKLIMO_3 for future climate scenarios (rcp4.5 and rcp8.5) show that the heat load will increase in the entire city domain, with the strongest increase in its urbanized parts. In this study, the impact of modifications in land use/land cover (like changes in the fraction of buildings, impervious surfaces, vegetation and albedo of the roofs) on the heat load are examined. It is demonstrated that these changes will decrease the heat load to some extent. However, the impact is locally limited and significantly smaller than the contribution of global warming. Therefore, land use/land cover changes can mitigate the urban heat load. However, even more comprehensive interventions cannot eliminate the overall increase in the urban heat load due to global warming.   

How to cite: Boras, M., Žgela, M., and Herceg Bulić, I.: Impact of land use/land cover changes on the urban heat load - a case study for the city of Dubrovnik, EGU General Assembly 2023, Vienna, Austria, 23–28 Apr 2023, EGU23-5207, https://doi.org/10.5194/egusphere-egu23-5207, 2023.

EGU23-5473 | ECS | Orals | CL2.8

Comparison of urban canopy models (UCMs) over the area of Nicosia 

Giandomenico Vurro, Katiana Constantinidou, and Panos Hadjinicolaou

Climate change is posing a significant strain on society. The fast urbanization process, in addition to population growth and the constant rise in anthropogenic greenhouse gas emissions, exacerbates climate-induced phenomena. In this background, the EMME region, a climate change hotspot, emerges for its high vulnerability to climate change impacts. Taking advantage of the improvements made in urban parameterization and modeling, and given the lack of works that focus on this region integrating advanced urban parameterization schemes, this work adopts the Weather Research and Forecasting (WRF) model coupled with different urban canopy models (UCMs), to evaluate their performance using Local Climate Zones (LCZs) as land use classification. In particular, we applied three parameterization schemes: 1) Bulk parameterization, 2) Building Effect Parameterization (BEP), and 3) Building Energy Model coupled with BEP (BEP+BEM) over the city of Nicosia (Cyprus) at 1 km2 horizontal resolution for the period 27th of July to 5th of August 2021. This way, we aim to capture a better representation of the finer spatial and temporal distribution of the heatwave that occurred during that period, leading to a peak temperature of 44.3 °C on the 4th of August. These three simulations were compared with observations provided by the Department of Meteorology. The Modified IGBP MODIS-NOAH land use classification is adopted for the whole domain. At the same time, the LCZs classify the land cover into 10 classes based on the urban and thermal features of the Nicosia domain.

How to cite: Vurro, G., Constantinidou, K., and Hadjinicolaou, P.: Comparison of urban canopy models (UCMs) over the area of Nicosia, EGU General Assembly 2023, Vienna, Austria, 23–28 Apr 2023, EGU23-5473, https://doi.org/10.5194/egusphere-egu23-5473, 2023.

EGU23-6042 | Orals | CL2.8 | Highlight

Observations and modelling of urban carbon and water fluxes to aid cities in climate mitigation and adaptation 

Leena Järvi, Joyson Ahongshangbam, Minttu Havu, Hei Shing Lee, Jesse Soininen, Esko Karvinen, Anni Karvonen, and Liisa Kulmala

Urban green areas have multiple benefits extending from heat mitigation and carbon sinks to human well-being. Due to their multi-benefits, they are an attractive natural solution to aid climate change adaptation and mitigation. In cities of Helsinki and Tampere located in Finland, intensive observations and modelling of urban water and carbon dioxide (CO2) fluxes have taken place to improve our understanding of the functioning and carbon sequestration potential of different urban green areas and provide science-based evidence for decision-makers on how urban green areas should be planned and constructed to maximize their climate benefits.

Extensive eco-physiological observations were collected from different vegetation types (urban forest, park, garden, and street vegetation) in Helsinki during summers 2020-2022. The observations were made in the vicinity of the ICOS Associated Ecosystem Station FI-Kmp where eddy covariance (EC) measurements presenting the ecosystem level are conducted. The measurements included photosynthesis, sap flow, soil respiration, phenology, fine root growth, meteorology and soil properties. FI-Kmp represents mixed land use and vegetation, and to get more information of the behavior of lawns, additional EC measurements were conducted over urban lawn in the city of Espoo in 2021-2022. The observations are complemented by ecosystem modelling using SUEWS (Surface Urban Energy and Water balance Scheme). SUEWS is used to examine the impact of different urban green area planning options on carbon sinks and storages with focus on the city of Tampere. 

This work will highlight some of the findings made so far and provide examples on the carbon and water fluxes in different urban green areas. We also demonstrate how science-based knowledge can aid decision-making concerning urban green areas.

How to cite: Järvi, L., Ahongshangbam, J., Havu, M., Lee, H. S., Soininen, J., Karvinen, E., Karvonen, A., and Kulmala, L.: Observations and modelling of urban carbon and water fluxes to aid cities in climate mitigation and adaptation, EGU General Assembly 2023, Vienna, Austria, 23–28 Apr 2023, EGU23-6042, https://doi.org/10.5194/egusphere-egu23-6042, 2023.

EGU23-6744 | Posters on site | CL2.8

The interactions between the summer urban heat islands and heatwaves in Beijing: from past to future 

Fengqi Cui, Rafiq Hamdi, Piet Termonia, and Philippe De Maeyer

The coexistence of urban heat islands (UHIs) and heatwaves (HWs) enhances the stress on human society. However, how UHIs responds to the HWs and the interaction mechanisms between the UHIs and HWs in historical period and under different global warming levels (GWL) 1.5 ºC and 2 ºC scenarios are still elusive. In this study, the regional climate model ALARO-SURFEX (incorporated with LCZs) will be firstly used to estimate the historical interactions between the UHI and HW and the contribution of urbanization to the HWs in Beijing. The intensifying impact of three HWs (daytime HW, nighttime HWs, compound HW) on the UHI will be analyzed, and its energy mechanism will also be revealed. Secondly, the ensembled EAS-CORDEX data calibrated by adding hourly urban signatures will be used to force the offline SURFEX model to project the future urban climate in Beijing. The HW duration, frequency, and intensity will be estimated, and the UHI intensity and pattern will be investigated before, during, and after three kinds of HWs under different warming levels (GWL1.5 and GWL2). Understanding the interaction mechanisms of HWs and UHIs, as well as projecting for HWs and UHIs under the Paris Agreement, would be beneficial for stakeholders and city planners in developing future local adaptation policies.

How to cite: Cui, F., Hamdi, R., Termonia, P., and De Maeyer, P.: The interactions between the summer urban heat islands and heatwaves in Beijing: from past to future, EGU General Assembly 2023, Vienna, Austria, 23–28 Apr 2023, EGU23-6744, https://doi.org/10.5194/egusphere-egu23-6744, 2023.

EGU23-6825 | ECS | Posters on site | CL2.8

Identification of hot/cold spots inside the Surface Urban Heat Island of the main cities in North-Eastern Romania using Landsat imagery 

Stefanel-Claudiu Cretu, Lucian Sfica, Vlad-Alexandru Amihaesei, Iuliana-Gabriela Breaban, and Pavel Ichim

Urban Heat Island (UHI) is caused by inadvertent climate modification due to human spatial concentration, being generally defined as the difference in temperature between urban areas and their rural surroundings. However, seen at fine spatial resolution, the heat island seems rather to look like an archipelago of hot spots delimited by colder areas. This study analyses the Surface Urban Heat Islands (UHISurf) of 16 cities located in Romania’s North-East Development Region for the identification of these hot and cold spots.

For each city, in order to identify UHISurf’s hot and cold-spots, Landsat series of satellites were used due to their potential to provide Land Surface Temperature (LST) product at a high spatial resolution, which is commonly required for micro or local scale studies. For this purpose, LST is derived from the Landsat 4, 5, 7, and 8 (1988-2021), collection 1 (using the Statistical Mono-Window algorithm), implemented in Google Earth Engine platform.

For hot /cold spots identification, Hot Spot Analysis (Getis-Ord Gi*) tool from ArcGIS Pro 3.0 was used. This tool calculates the Getis-Ord Gi* statistic for each feature in a dataset by looking at each feature within the context of neighboring features. To be classified as a statistically significant hot spot, a feature will have a high value and has to be surrounded by other features with high values. The local sum for a feature and its neighbors is compared proportionally to the sum of all features and a statistically significant z-score results. The larger the z-score is (positive), the more intense the clustering of high values defined as hot spots. The smaller the z-score is (negative), the more intense the clustering of cold spots. When the False Discovery Rate (FDR) correction is applied, statistical significance is adjusted to account for multiple testing and spatial dependency.

This procedure was applied for each of 16th cities, summing up 10900 images which cover an area of 2526,8 km2. LST is strongly controlled by surface properties (radiative, thermal, geometric, moisture and aerodynamic), these giving a greater surface temperature variability compared to air temperature, particularly during the day. Inside the identified hot spots, the LST is with 8-10C higher than the mean of UHISurf LST. Generally, light industrial, warehouses and transportation infrastructure (airports) are often relatively hot-spots, while cold-spots, are obviously more heavily vegetated areas, water bodies and areas of well-watered vegetation, but their futures are related to each city characteristics. The obtained results are designated to be used as the main assessment of urban heat island, delivering for stakeholder a clear image of the target regions inside the cities for the policies dedicated to the mitigation of the urban heat island effect.

How to cite: Cretu, S.-C., Sfica, L., Amihaesei, V.-A., Breaban, I.-G., and Ichim, P.: Identification of hot/cold spots inside the Surface Urban Heat Island of the main cities in North-Eastern Romania using Landsat imagery, EGU General Assembly 2023, Vienna, Austria, 23–28 Apr 2023, EGU23-6825, https://doi.org/10.5194/egusphere-egu23-6825, 2023.

EGU23-6927 | ECS | Posters on site | CL2.8

Climate and health effects of different urban forest structures 

Jonathan Simon, Christoph Beck, Joachim Rathmann, Elisabeth André, Linda Becker, Yekta Can, Alexander Heimerl, Bhargavi Mahesh, Nicolas Rohleder, and Andreas Seiderer

Urban forests are a proven human health resource, as they restore the physical and mental health of the human body and mind. They have a positive impact on air quality and thermal conditions by reducing concentrations of gaseous and particulate pollutants and lowering air temperature, respectively. In addition, urban forests provide several important ecosystem services, including those associated with human health. Different human-place concepts, show that a close connection of humans to their natural environment is an important determinant of people's well-being. Urban forests, however, vary based on e.g., tree species composition, structure, age and diameter of trees, canopy cover, number and density of canopy layers, abundance of plant species, dead wood, visibility distance, and light conditions. In any human-centered approach, these physical forest characteristics cannot be considered independently of subjective human perception.

Thus, besides answering the question of whether different urban/peri-urban forest and open land structures are associated with different local and human bioclimatic characteristics, another major objective of the project is to collect, digitize, process, model and assess data on human physiological effects gathered during field experiments and walking studies in selected study regions within the city and the urban forest of Augsburg, Germany. Thus, the overarching research question of our study is whether "climatic" forest types are also "human physiological" and "therapeutic" forest types.

The thermal properties of the study regions will be modelled with the microclimatic model ENVI-met and validated against field measurements of climate variables like air temperature, relative humidity, and wind conditions. If successful, this will allow the calculation of further bioclimatological thermal indices such as physiological equivalent temperature (PET), predicted mean vote (PMV) or universal thermal climate index (UTCI) and the development of silvicultural scenarios. Data on physiological effects on humans will be collected during monitored thermal walks along predefined routes in and near-by the study regions, where participants will be equipped with wearable electronic devices that collect physiological data, such as heart activity. Stress levels of participants along the routes will be assessed by saliva-cortisol probes. Questionnaires will be used to collect sociodemographic data and data on participants perceived thermal and visual sensations during the walks. Subjective thermal sensations will be compared to objectively derived thermal indices based on the model results and mobile measurements taken simultaneously with the thermal walks.

Measurements of bioclimatic parameters, human physiological responses, hormone releases, and the recording of subjective well-being as well as subjective perceptions of environmental variables allow for a comprehensive analysis of positive human-environment relationships in urban forests. Thus, a qualitative and quantitative assessment of recreational effects, differentiated by different forest structures, bioclimatic parameters, and social groups, can be comprehensively presented.

How to cite: Simon, J., Beck, C., Rathmann, J., André, E., Becker, L., Can, Y., Heimerl, A., Mahesh, B., Rohleder, N., and Seiderer, A.: Climate and health effects of different urban forest structures, EGU General Assembly 2023, Vienna, Austria, 23–28 Apr 2023, EGU23-6927, https://doi.org/10.5194/egusphere-egu23-6927, 2023.

EGU23-6962 | Orals | CL2.8

Towards a satellite based long-term monitoring and prediction of urban heat stress 

Dominik Kortschak, Andrea Damm, Heinz Gallaun, Michael Kernitzkyi, Judith Köberl, and Manuel Strohmaier

Climate change is causing temperatures around the globe to rise, leading to an increase in hot days and nights and a rise in the frequency and intensity of heat waves. High temperatures represent one of the key factors causing heat stress, which is affecting human health. Examples include the mega heat wave in August 2003 that took more than 70,000 lives across Europe or the unprecedented heat in 2018 with more than 100,000 heat-related deaths in the EU. Spatial exposure to heat stress varies, with urban areas usually heating up much stronger than their rural surroundings (urban heat island effect). With progressing global warming, the importance of spatially monitoring and predicting urban heat stress over large areas to prevent heat-associated morbidity and mortality is thus rising. For this purpose, thermal data obtained by satellites may represent a valuable alternative or addition to in-situ observations and climate modelling, which both show several advantages, but also shortcomings in terms of spatial coverage (in-situ), data needs (climate modelling) and costs.

One of the main challenges for the use of satellite thermal data for urban heat stress monitoring is to convert the obtained land surface temperature (LST) into air temperature (AT), since satellites only provide information on the former whereas the latter is needed as input for most heat stress indicators. In our presentation, we will address this challenge with emphasis on urban regions. Two main strands of methods are used in the literature for converting LST into AT. First, data driven methods that use the empirical relationship between in-situ observations of AT from weather stations and LST data from satellites. These methods usually work well for individual stations, but the transferability of the relationship to different locations is typically limited. In addition, especially for methods based on machine learning techniques, a significant amount of data is needed for model calibration. The second type of methods comprises physical models. They typically make use of the energy balance to estimate AT from LST. These models show the advantage of better transferability but need additional input data besides LST. Moreover, physical methods are often designed for applications in rural areas, which may differ from the situation in cities. We apply different methods to derive AT from LST in urban regions and discuss their suitability to monitor and predict urban heat stress based on satellite thermal data.

How to cite: Kortschak, D., Damm, A., Gallaun, H., Kernitzkyi, M., Köberl, J., and Strohmaier, M.: Towards a satellite based long-term monitoring and prediction of urban heat stress, EGU General Assembly 2023, Vienna, Austria, 23–28 Apr 2023, EGU23-6962, https://doi.org/10.5194/egusphere-egu23-6962, 2023.

EGU23-7111 | Orals | CL2.8 | Highlight

Modelling spatial variation of thermal comfort indices in urban settings performed within an open source GIS 

Fredrik Lindberg, Jeremy Bernard, Nils Wallenberg, Oskar Bäcklin, Jessika Lönn, Sofia Thorsson, and Karzo Kalori

The Urban Multi-scale Environmental Predictor (UMEP) is a city based climate service tool that facilitate user-friendly open source capabilities to combine models and tools essential for climate simulations. The tool is designed for a broad range of users, both within academia as well as practitioners and non-expert users. UMEP is available as a plugin in QGIS, a free and open source geographic information system (GIS) available on all common platforms. One main purpose with UMEP is to include pre-processing of geo- and weather data, process calculations as well as post-processing and visualisation in the same tool.

Recent developments in UMEP enables creation of all essential input variables required to generate high-resolution raster grid of common human thermal comfort indices such as Physiological Equivalent Temperate (PET), Universal Thermal Comfort Index (UTCI), Comfort Formula (COMFA) etc. This work presents initial results and methodology used to compute these indices within UMEP. Examples of workflow throughout the process, all the way to the final result, will be presented and discussed.

Acknowledgement
This project has received funding from the European Union’s Horizon 2020 research and innovation programme under the Marie Skłodowska-Curie grant agreement No 896069.

How to cite: Lindberg, F., Bernard, J., Wallenberg, N., Bäcklin, O., Lönn, J., Thorsson, S., and Kalori, K.: Modelling spatial variation of thermal comfort indices in urban settings performed within an open source GIS, EGU General Assembly 2023, Vienna, Austria, 23–28 Apr 2023, EGU23-7111, https://doi.org/10.5194/egusphere-egu23-7111, 2023.

EGU23-7133 | Orals | CL2.8

Heat hazard and risk assessment in urban areas. Case study of Bucharest (Romania) 

Sorin Cheval, Alexandru Dumitrescu, Dana Micu, Irina Onțel, Monica-Gabriela Paraschiv, and Gabriel Simion

Climate and climate-related hazards are growing threats to our cities, as a result of the twin challenges derived from the warming climate and urban expansion. Accountable development strategies must take into consideration the safety of the urban population, including its vulnerability and exposure to different hazards. The evaluation of risks related to heat hazards is a priority for urban municipalities, especially in big cities where the urban heat island intensity is significant. For example, the urban perimeter of Bucharest (Romania) is 2 - 3°C warmer than the 5 km buffer of the rural neighborhood, as an average of the land surface temperature (LST) over the summer months.

This research explores the risk associated with the heat hazard occurring over Bucharest due to vulnerabilities derived from different urban elements, such as population, land cover-land use, local climate zones, and characteristics of the buildings. The analysis covers the period 2013-2022, and the outputs are delivered at 100-m spatial resolution. The heat hazards were derived from LST retrieved from high-resolution imagery (i.e. Landsat 8) data using emissivity estimation, and the urban risk was calculated based on several variables related to demographics and built environment, considering their influence on the vulnerability to heat hazard. The Heat Hazard-Risk was computed using a risk matrix approach, as a product between the heat hazard and vulnerability, and the results inform the level of Census Administrative Units (CAU).

The results show that the heat hazard is more frequent during the warm season, and especially in June-July-August, when the average daily LST exceeds 40°C over the largest part of the city. The land cover characteristics and the LCZ have a significant influence on the LST values and generate adverse impacts on health, economic activities, and the environment.

As regards the demographic profile, this study examines the consequent risk derived from (a) population size (i.e. number of inhabitants and density), (b) age (i.e. younger and older people), and (c) density of people in the same dwelling.

This study has been partly funded by the project Synergies between Urban Heat Island and Heat Wave Risks in Romania: Climate Change Challenges and Adaptation Options (SynUHI) PN-III-P4-PCE-2021-1695.

How to cite: Cheval, S., Dumitrescu, A., Micu, D., Onțel, I., Paraschiv, M.-G., and Simion, G.: Heat hazard and risk assessment in urban areas. Case study of Bucharest (Romania), EGU General Assembly 2023, Vienna, Austria, 23–28 Apr 2023, EGU23-7133, https://doi.org/10.5194/egusphere-egu23-7133, 2023.

EGU23-7691 | ECS | Orals | CL2.8

Validation of a 2D modelling approach for urban microclimatic conditions 

Albert König, Markus Pichler, and Dirk Muschalla

The mitigation of urban microclimatic deficiencies as a result of the urbanized environment receives increasing attention by cities, municipalities and the planning community. Priority areas for the implementation of multi-beneficial climate change adaptation measures and the development of mitigation plans need to be identified. Therefore modelling methods producing good results while only requiring moderate data input and computational effort are needed for the widespread application in planning processes. In this study, we test the rapid fine-scale methodology for simulating urban bioclimatic conditions in a 2D environment that was previously introduced by Back et al. (Back et al., 2021). The original methodology uses high resolution land cover classification (Hiscock et al., 2021) from multi-spectral aerial imagery, digital elevation data, and a vector layer of buildings to calculate land surface temperature (LST), mean radiant temperature (MRT), and the Universal Thermal Climate Index (UTCI). We apply this methodology to the rural municipality of Feldbach, Austria, using commercially and openly available satellite imagery. The simulated data is validated against the publicly available monitoring data from the WegenerNet climate station networks (Fuchsberger et al., 2022), which provides high spatial and temporal resolution measurements. The results are evaluated regarding the agreement of relative spatial differences of the simulated variables with the observed data. To be suitable for the identification of priority areas for the implementation of climate change adaptation measures, the methodology is expected to accurately reflect the spatial variability of the simulated variables.

Project supported by ESA Network of Resources Initiative.

Back, Y., Bach, P. M., Jasper-Tönnies, A., Rauch, W., & Kleidorfer, M. (2021). A rapid fine-scale approach to modelling urban bioclimatic conditions. Science of The Total Environment, 756, 143732. https://doi.org/10.1016/j.scitotenv.2020.143732

Fuchsberger, J., Kirchengast, G., Bichler, C., Leuprecht, A., & Kabas, T. (2022). WegenerNet climate station network Level 2 data [Text/csv,application/x-netcdf]. Wegener Center for Climate and Global Change, University of Graz. https://doi.org/10.25364/WEGC/WPS7.1:2022.1

Hiscock, O. H., Back, Y., Kleidorfer, M., & Urich, C. (2021). A GIS-based Land Cover Classification Approach Suitable for Fine‐scale Urban Water Management. Water Resources Management, 35(4), 1339–1352. https://doi.org/10.1007/s11269-021-02790-x

How to cite: König, A., Pichler, M., and Muschalla, D.: Validation of a 2D modelling approach for urban microclimatic conditions, EGU General Assembly 2023, Vienna, Austria, 23–28 Apr 2023, EGU23-7691, https://doi.org/10.5194/egusphere-egu23-7691, 2023.

EGU23-7886 | ECS | Orals | CL2.8 | Highlight

Hot weather impacts on urban indoor air temperature assessed through citizen science observations in the Netherlands 

Esther Peerlings and Gert-Jan Steeneveld

Due to climate change and urbanization, the world's population is increasingly exposed to extreme heat, posing a threat to public health. Despite people spending ~90% of their time indoors, heat effects in buildings have been studied far less than outdoor heat island effects. This study aims to observe, understand and model the behaviour of indoor air temperatures (Tin) during summer heat. As a proof of concept, we present and analyse up to 27 years of individual Tin timeseries of seven citizen weather stations (CWS) across the Netherlands. First, we find that typically Tin increases slower, but also cools down slower than Tout with a lag difference of ~130 minutes in the diurnal cycle. We demonstrate that nocturnal indoor human thermal comfort (HTC) can be worse than outdoor HTC even for days after a heatwave.

Second, to model Tin behaviour, we simulate six-hour changes in Tin behaviour with a physics-based statistical model by Vant-Hull et al. (2018) that has an outdoor conduction, indoor conduction and solar transfer component. Preliminary results of this computationally-fast model for each of the seven houses are promising, showing on average a R-squared of 0.74 and a root mean squared error of 0.13 K. Third, in the next research steps, we are also interested in how Tin may evolve due to climate change. We will study this by converting the Tin measurements to 2050 and 2085 values based on the Royal Netherlands Meteorological Institute 2014 climate scenarios (or 2023 if available).

Finally, we will scale up our proof-of-concept analyses to 100 indoor CWS placed in Amsterdam. The participating households receive a CWS for three years to measure their indoor climate – temperature, relative humidity, CO2 concentrations – in the bedroom and living room. Based on our insights, we will make recommendations for climate-sensitive urban design to reduce indoor heat stress.

How to cite: Peerlings, E. and Steeneveld, G.-J.: Hot weather impacts on urban indoor air temperature assessed through citizen science observations in the Netherlands, EGU General Assembly 2023, Vienna, Austria, 23–28 Apr 2023, EGU23-7886, https://doi.org/10.5194/egusphere-egu23-7886, 2023.

EGU23-8044 | ECS | Posters on site | CL2.8

Urban tree water demand: Comparison of modeling results to measured sapflow and soil moisture data 

Laura Tams, Björn Kluge, and Eva Nora Paton

Current shifts in rainfall and temperature regimes towards dryer and hotter periods in central Europe have caused substantial water stress for urban trees.  To be able to adapt water supply to urban trees under a changing climate,  a quantification of evapotranspiration and water availability becomes necessary and is at the same time, very challenging in the heavily modified urban environments. Both processes are influenced by soil sealing and complex shading patterns of the surrounding street canyon.  

For five urban street trees in the city center of Berlin, evapotranspiration rates and water availability was monitored in a field campaign (sapflow measurement and soil moisture in different depth) during the vegetation period of 2022. The monitoring results were then used to test a hydrological urban tree model with an integrated shading model which specifically takes into account the shading and sealing variability of the surrounding built environment.

Both measured and modelled data a  show that potential evapotranspiration rates were significantly larger for trees with full sun exposure compared to shaded trees. At sites with full sun exposure, the increased evapotranspiration also reduced soil moisture content faster; at the same time measured actual evapotranspiration was reduced by up to 2/3 during water stress periods.

In conclusion, the comparison showed that our model is a promising option to obtain information on water availability and to improve water management for urban trees under different shading and sealing environments in heavily modified cities. The tool will be further developed to be used by local authorities and practitioners to identify water shortage periods and hot spots  within the city to optimize irrigation efforts.

Key words: urban trees, evapotranspiration (ET), water availability, water stress, water management,  urban environment, shading

How to cite: Tams, L., Kluge, B., and Paton, E. N.: Urban tree water demand: Comparison of modeling results to measured sapflow and soil moisture data, EGU General Assembly 2023, Vienna, Austria, 23–28 Apr 2023, EGU23-8044, https://doi.org/10.5194/egusphere-egu23-8044, 2023.

Grey infrastructures like buildings, roads and parking lots relate to surface sealing, lack of ventilation and anthropogenic heat – leading to effects like urban heat (UHI) and dry islands (= higher temperatures and lower relative humidity), and impact surface runoff during precipitation events. Hence, urban climate conditions differ significantly from their rural surroundings, demanding more granular data to quantify the effect city space has on weather parameters. However, observations and weather forecasts are usually made for rural areas, representative for a larger area – not for spaces where most people live, work and sleep. While a lot of data indeed exist for urban areas already – e.g., from satellites, radar stations and climate models – they all need calibration from measurements, in the city itself.

Tallinn is the European Green Capital 2023. While it strives making green spaces more accessible for its people, grey infrastructure development is continuing and even expanding, sustaining and increasing the city’s urban heat and dry islands. On the other hand, Tallinn is conserving and investing in green infrastructure, like turning an old railway track into a green corridor and publicly open space (the so-called “Pollinator Highway”). This corridor connects living quarters of Tallinn`s outskirts with central areas and supports social inclusion by passing through diverse socio-economic districts.

We created a concept to show the value of this green corridor for urban climate conditions. In May 2022, SEI Tallinn set up a network of 18 weather sensors measuring temperature, relative humidity and precipitation. The majority of stations are placed in green (5), urban green (5) and urban grey (5) spaces in the vicinity of the “Pollinator Highway”, with two more nearby the sea (to quantify land-sea-wind effects) and one near the official weather station. Data are open access, and live measurements publicly accessible.

In this contribution, we evaluate the results of 10 months of measurements, with a spatiotemporal focus on how and where Tallinn’s UHI enhances the impacts of heat and mitigates cold waves. With the data presented in this contribution, we make urban climate challenges visible and climate communication more relevant to people, show the climatic value of green compared to grey city spaces (especially during heat waves) to municipal decision-makers and Tallinn’s citizens, determine the effect of the sea on Tallinn's climate and how it shapes Tallinn`s UHI, and finally support climate resilience and tailored adaptation solutions.

How to cite: Hoy, A. and Gutbrod, K.: Showing the value of green spaces from a climate perspective: a weather sensor network for city spaces in Tallinn, EGU General Assembly 2023, Vienna, Austria, 23–28 Apr 2023, EGU23-8092, https://doi.org/10.5194/egusphere-egu23-8092, 2023.

This study explores the spatiotemporal variations in Land Surface Temperature (LST) and vegetation indices in relation to Local Climate Zone (LCZ) classification in a coastal, temperate climate city across multiple seasons. The study focuses on Cardiff, the capital and largest city of Wales, located only 2.4 km from the sea. The findings of this study extend our scientific understanding of the interrelations between LST and morphological and surface properties of the built environment and urban vegetation for various LCZ classes in Cardiff. Results showed a significant variation in Surface Urban Heat Island (SUHI) intensity in spring, summer, and winter. LST and Normalised Difference Vegetation Index (NDVI) were found to vary significantly across the LCZ classes demonstrating their association with the local urban form and morphology. For built-up areas, LCZ classes with lower vegetation cover and higher building density showed higher LST. For natural areas, LCZ F (Bare soil or sand) had higher LST than LCZ A (Dense trees). The high-density, built-up LCZ classes have a greater UHI compared to the natural classes. In addition, the results showed that LST and NDVI are significantly affected by the morphological and surface properties for each LCZ classes. Building surface fraction, impervious surface fraction and surface admittance were found to have a positive correlation with LST. Sky View Factor, surface albedo and pervious surface fraction, on the other hand, showed a negative correlation with LST. Opposite associations were found with the NDVI. Urban planners and designers will find the study useful to develop heat mitigation strategies while planning, designing, or improvising the new and existing urban areas in Cardiff. In addition, the LCZ map produced in this study for Cardiff using local expert knowledge will enable international comparison and testing of proven climate change adaptation and mitigation techniques for similar urban areas.

How to cite: Sharmin, T., Lannon, S., and Chappell, A.: Spatio-temporal variability of land surface temperature and vegetation indices within Local Climate Zone classes in Cardiff, Wales, EGU General Assembly 2023, Vienna, Austria, 23–28 Apr 2023, EGU23-8591, https://doi.org/10.5194/egusphere-egu23-8591, 2023.

EGU23-9022 | ECS | Posters on site | CL2.8

On the evaluation of different WRF urban canopy schemes for the study of precipitation related to urban heat island in Kuala Lumpur 

Chiara Ghielmini, Francesco S.R. Pausata, Daniel Argüeso, and Razib Vhuiyan

Cities can have a significant impact on local microclimate. Higher temperatures that often characterise urban fabric can influence other meteorological parameters, such as precipitation. In this study, we investigated how the urban heat island (UHI) of Kuala Lumpur impacts rainfall through a set of sensitivity studies performed with the Weather Research and Forecasting (WRF) model. Many studies have already pointed out that the UHI can increase local rainfall, but they disregarded the city heterogeneity to large extent. Here, we investigated the effect of the city on precipitation incorporating different representations of the urban landscape. We performed three simulations with different urban land cover: 1) without city (control experiment) 2) with the urban terrain represented homogeneously and 3) with the urban land represented heterogeneously with the surface classification in the 11 categories of the Local Climate Zone (LCZ) system. We observed that the consideration of the city of Kuala Lumpur in the simulations results in a localised increase in mean annual precipitation and mean intense precipitation within the boundaries of the urban area. However, in the case of the homogeneous representation of the city, the increase is more pronounced than in the case of the heterogeneously represented city. In the former case, the increases also occur over a larger area and the impacts propagate more strongly into the upper layers of the atmosphere. Thus, a more realistic representation of the city and its heterogeneities limits the urban-induced effects on precipitation.

How to cite: Ghielmini, C., Pausata, F. S. R., Argüeso, D., and Vhuiyan, R.: On the evaluation of different WRF urban canopy schemes for the study of precipitation related to urban heat island in Kuala Lumpur, EGU General Assembly 2023, Vienna, Austria, 23–28 Apr 2023, EGU23-9022, https://doi.org/10.5194/egusphere-egu23-9022, 2023.

EGU23-9178 | Orals | CL2.8 | Highlight

Climate resilience of the City of Vienna: social impact of Nature-based Solutions 

Marianne Bügelmayer-Blaschek, Martin Schneider, Tanja Tötzer, Michael Friesenecker, Thomas Thaler, Antonia Schneider, Michael Getzner, Sebastian Seebauer, Claudia Hahn, and Maja Zuvela-Aloise

Since almost half of the world’s population lives in cities and another third in settlements with similar characteristics, the current and future impacts of climate change in cities is of greatest importance. The characteristics of urban environments (reduced long-wave emissions towards the sky due to the blockage effect of the surrounding buildings, construction materials, anthropogenic heat production, lack of green and blue infrastructure) further increase ambient temperatures and cause urban heat islands. Nature-based solutions (NbS) have widely been investigated as a remedy to this challenge, which is quickly worsening due to the combined effects of climate change and the rapid densification of urban settlements. NbS cover a wide scope of measures such as planting roadside trees, greening facades or roofs, re-naturalizing rivers or unsealing of parking spaces to allow rainwater to penetrate and enable evapotranspiration. Yet, the widespread implementation of NbS often meets political, social, legal, financial or spatial barriers. 

In the presented study we combine interdisciplinary expertise from natural to social and economic sciences and a wide range of methods to evaluate and illustrate, exemplarily for the city of Vienna, how urban areas can implement NbS and overcome the aforementioned barriers. Therefore, (1) a list of possible NbS is compiled; (2), their performance is quantified through numerical micro-climate simulations, (3) their impact and potential trade-offs applying a socio-spatial analysis and survey, (4) individual preferences and willingness to pay are analyzed for a representative sample of 2,181 Viennese residents using a choice experiment, and finally, (5) a consolidated list of NbS is validated within policy workshops.

Using this approach we find that substantially transforming an existing quarter by implementing green and blue infrastructure, as well as technical solutions (e.g. sun blinds) may reduce the ambient air temperature by up to 2°C and the mean radiant temperature on some surfaces by up to 45°C, with natural measures being more effective than technical ones. Implementing these measures within the whole city of Vienna may yield a similar temperature effect. The socio-spatial vulnerability assessment identifies few areas where a strong overrepresentation of vulnerable age groups, low-income residents and housing vulnerabilities coincide.  In the city of Vienna, green gentrification owing to rising housing prices for already vulnerable groups thus seems to be very limited, especially as long-standing social housing policies and a rather strict regulation of the private housing markets lead to comparatively stable rent levels. The choice experiment shows a substantial willingness to pay for NbS, suggesting that Viennese citizens would financially support the implementation and maintenance of extensive greening measures. However, the politicians fear the conflicts with the citizens and other political parties as well as stakeholders. Stakeholders from the city authorities map potential physical and legal barriers for local implementation, such as building codes, administrative procedures for permits and inspections, or conflicts over scarce public space.

How to cite: Bügelmayer-Blaschek, M., Schneider, M., Tötzer, T., Friesenecker, M., Thaler, T., Schneider, A., Getzner, M., Seebauer, S., Hahn, C., and Zuvela-Aloise, M.: Climate resilience of the City of Vienna: social impact of Nature-based Solutions, EGU General Assembly 2023, Vienna, Austria, 23–28 Apr 2023, EGU23-9178, https://doi.org/10.5194/egusphere-egu23-9178, 2023.

EGU23-9316 | Posters on site | CL2.8 | Highlight

Rethinking green roofs- natural and recycled materials improve their carbon footprint 

Thomas Nehls, Laura Tams, and Cristina Sousa Coutinho Calheiros

Green roofs are promoted to deliver climate regulation and urban heat island mitigation and many more. Ecosystem services of green roofs are discussed generally positively, but their footprint from production and demolition processes have not been fully addressed. In this study, a life cycle analysis (LCA) was conducted to assess the possibility of creating of a carbon-neutral green roof and to evaluate and compare the global warming potential (GWP) of two green roofs: 1) a conventional green roof (GR-c) with expanded clay, pumice, and compost in the substrate and a polypropylene drainage, and 2) an eco-friendly green roof (GR-a) with recycled bricks and compost in the substrate and a cork drainage. The LCA refers to a functional unit (FU) of a 218 m2 green roof (substrate depth of 9 cm; lifespan of 40 years). The results showed that the use of a brick substrate can reduce the GWP to 3139 kg of CO2 eq/FU (- 50%) and the use of cork drainage to 441 kg of CO2 eq/FU (- 69%). Apart from production, demolition is a key process  to be improved in future, accounting for 32% (GR-c) and 55% (GR-a) of the GWP. Once produced, a green roof can take up 783 gCO2/(m2⋅a) because of plant uptake. To become CO2-neutral, a GR-c and GR-a would have to last 88 and 53 years, respectively. Furthermore, the GWP was influenced by green roof maintenance and plant CO2 uptake. We conclude that recycled bricks and cork are promising green roof materials.

How to cite: Nehls, T., Tams, L., and Calheiros, C. S. C.: Rethinking green roofs- natural and recycled materials improve their carbon footprint, EGU General Assembly 2023, Vienna, Austria, 23–28 Apr 2023, EGU23-9316, https://doi.org/10.5194/egusphere-egu23-9316, 2023.

EGU23-9878 | ECS | Posters on site | CL2.8

Comparison of thermal conditions in different intra- and inter-urban structures of different Balkan cities during the summer period 

Jelena Dunjic, Stevan Savić, and Dragan Milošević

Intensive urbanization and climate change are issues that are affecting majority of the urban areas around the world. Traditional artificial materials that are dominant in most of the cities are enhancing thermal stress that is very pronounced in the summertime especially in urban areas.  Different local and micro locations develop their own specific thermal conditions according to type of the materials that are dominant in the area. Green areas can contribute to improving thermal conditions of the area, but there is few in situ measurements to support those statements.

The main aim of the study is to investigate if there are intra- and inter-urban differences or similarities in thermal conditions in cities of different sizes and climate types. Micro-climate conditions (Ta, RH, v and Tg, 1 min. temporal resolution) were assessed using the in situ measurements with Kestrel 5400 Heat Stress Trackers in urban areas during the summer period. The measurement campaigns were conducted in five cities located in three Balkan countries: Serbia (Belgrade and Novi Sad), Bosnia and Herzegovina (Banja Luka and Trebinje), and Slovenia (Ljubljana). The first results indicate that there are significant differences in micro-climatological conditions of different local climate zones within the cities, which confirms that there are intra- and inter-urban differences within the cities and are related to the level of urbanization and presence of natural areas. For example, in Belgrade measurements show that differences in air temperature between densely built-up areas (LCZs 2 and 8) and green areas (LCZs A and B) are up to 7 ºC. Significant differences among the same LCZ are also recorded, depending on the level of shade provided by the urban configuration. Similar results are recorded in other cities where the measurements were performed. The results also show that shade and short- and long-wave radiation plays the most important role when it comes to reducing the outdoor thermal stress. The results are in good accordance with the previous studies that also reported more comfortable conditions in less built-up local climate zones with higher amount of greenery. This kind of assessments contribute to creating more sustainable urban environments that are resilient to climate change and increased thermal stress and extreme events in urban areas.

How to cite: Dunjic, J., Savić, S., and Milošević, D.: Comparison of thermal conditions in different intra- and inter-urban structures of different Balkan cities during the summer period, EGU General Assembly 2023, Vienna, Austria, 23–28 Apr 2023, EGU23-9878, https://doi.org/10.5194/egusphere-egu23-9878, 2023.

EGU23-9892 | ECS | Posters on site | CL2.8 | Highlight

Assessing the impact of urban heat islands on the risks and costs of temperature-related mortality 

Wan Ting Katty Huang, Pierre Masselot, Elie Bou-Zeid, Simone Fatichi, Athanasios Paschalis, Ting Sun, Antonio Gasparrini, and Gabriele Manoli

Ambient temperatures have an impact on human health, with unfavourably warm and cold conditions both associated with elevated mortality risk. By modulating the temperature in urban environments, urban heat islands (UHIs) can therefore both amplify the impact of heat and offer protection against cold weather. In this study, we quantify the impact of UHI on human mortality at 500m resolution for 85 European cities using air temperature simulations and age-dependent epidemiological temperature-mortality relationships for each city. On an annual basis, UHIs have weak net protective effects for most cities examined. This is due to the prevalence of cold to mild days in these cities when an increase in temperature is associated with slight reductions in mortality risk. On a daily basis, however, UHIs induce the greatest impact during heat extreme days, with a median of 39% increase in risk compared to a 7% reduction during cold extreme days. A valuation of such mortality risk reveals that the annual cost of UHI-related heat mortality is comparable to air pollution-related mortality costs as well as transit costs. Cities with Arid climates and Temperate Dry Summer climates in Southern Europe tend to experience the greatest protective UHI effects during cold extreme weather and the least adverse effect during heat extremes, while cities with Cold climates in Eastern and Northern Europe tend to benefit the least during cold extremes. Annually, the net impact of UHI is most strongly correlated with each city’s vulnerability to heat and cold and the ratio of warm vs. cold days in a year.

How to cite: Huang, W. T. K., Masselot, P., Bou-Zeid, E., Fatichi, S., Paschalis, A., Sun, T., Gasparrini, A., and Manoli, G.: Assessing the impact of urban heat islands on the risks and costs of temperature-related mortality, EGU General Assembly 2023, Vienna, Austria, 23–28 Apr 2023, EGU23-9892, https://doi.org/10.5194/egusphere-egu23-9892, 2023.

EGU23-10461 | ECS | Orals | CL2.8

Understanding within-city interaction between surface and air temperatures 

Marzie Naserikia, Melissa A. Hart, Negin Nazarian, Benjamin Bechtel, and Kerry A. Nice

Urban heat is a local scale warming effect associated with urban areas where most of the world's population live. Due to the scarcity of air temperature (Ta) data, urban heat studies have been mostly focused on Land Surface Temperature (LST) extracted from satellite imagery and a quantitative understanding of how LST interacts with Ta within a city is still lacking. Using crowdsourced weather station data in Sydney, Australia, combined with high resolution satellite images and urban datasets (such as Local Climate Zone (LCZ) and building-level urban data), we explore the interaction between Ta and LST, and their intra-urban variabilities during different seasons. We found that LST and Ta have different characteristics and their dependency varies by season and LCZ. When exploring the relationship between Ta, LST, and variables describing the urban structure, such as building fraction, the correlation between LST and urban structure was stronger and more seasonal dependent than the Ta-urban form relationship. Moreover, stronger correlations between LST and Ta were observed in the less built-up areas within the city. We also found that the determinants of LST variability are different from the contributing factors of Ta. These findings provide new insights for quantitatively investigating surface and canopy urban heat and their relationship with land cover, providing fit-for-purpose information to mitigate the adverse effects of urban overheating at local and global scales. 

How to cite: Naserikia, M., Hart, M. A., Nazarian, N., Bechtel, B., and Nice, K. A.: Understanding within-city interaction between surface and air temperatures, EGU General Assembly 2023, Vienna, Austria, 23–28 Apr 2023, EGU23-10461, https://doi.org/10.5194/egusphere-egu23-10461, 2023.

EGU23-10849 | ECS | Orals | CL2.8

Comparison of 300 m and 100 m uSINGV clear-day simulations for Singapore 

Pratiman Patel, Song Chen, Anurag Dipankar, Matthias Roth, Humphrey Lean, Hugh Zhang, and Aurel Moise

Increasing urbanization and its implication for human health, outdoor thermal comfort, air quality or energy consumption necessitate a need for high-resolution urban modelling. In this study, we evaluate uSINGV, a coupled urban-atmosphere research model used by the Singapore Meteorological Service, for four clear-day over Singapore using two different spatial resolutions of 300 and 100 m, respectively. The model is modified to incorporate urban morphology and land use/land cover datasets which are based on European Space Agency climate change initiative data (ESA CCI) at 300 and local datasets at 100 m spatial resolution. The evaluation is carried out for near-surface variables such as temperature, specific humidity, wind speed, and turbulent surface fluxes using Kling-Gupta efficiency (KGE'), root mean square error (RMSE) and mean absolute error (MAE) as model evaluation metrics. Results suggest that temperature and specific humidity are similar for 300 m and 100 m spatial resolution. On the other hand, for 100 m (300 m), the 10 m wind speed has a KGE’ of 0.45 (0.15), RMSE of 0.69 (1.42) m/s, and MAE of 0.55 (1.26) m/s, hence showing improvements from 300 to 100 m spatial resolution. In addition, sensible heat flux for 100 m resolution simulations is closer to observations, while latent heat flux is overestimated. Overall, uSINGV is able to produce reliable simulations at 100 m spatial resolution, thereby showing promise for improved understanding of detailed urban climate processes.

How to cite: Patel, P., Chen, S., Dipankar, A., Roth, M., Lean, H., Zhang, H., and Moise, A.: Comparison of 300 m and 100 m uSINGV clear-day simulations for Singapore, EGU General Assembly 2023, Vienna, Austria, 23–28 Apr 2023, EGU23-10849, https://doi.org/10.5194/egusphere-egu23-10849, 2023.

EGU23-10965 | ECS | Posters on site | CL2.8

Nighttime Urban Heat Island with rainfall impact during monsoon season in South Korea 

Jeongseop Lee, Dongwon Ko, and Sanghyun Kim

Climate change frequently generated extreme meteorologic event. The temperature difference between urban and its adjacent rural area had been defined as Urban Heat Island(UHI). The UHI during nighttime associated with high humidity condition introduces inconvenient living condition during Monsoon season. The generation of rainfall event and intensity of UHI had been known to counter reciprocal due to the apparent rainfall disturbance to vertical temperature profile. The hydro-meteorological data collected during summer season between 2013 and 2022 was used to evaluate the UHI intensity in Busan, South Korea. The impact of rainfall generation pattern was analyzed to configure the relationship rainfall and nighttime UHI. The results were derived that the temperature difference showed the characteristics of each year rather than the regular form.

How to cite: Lee, J., Ko, D., and Kim, S.: Nighttime Urban Heat Island with rainfall impact during monsoon season in South Korea, EGU General Assembly 2023, Vienna, Austria, 23–28 Apr 2023, EGU23-10965, https://doi.org/10.5194/egusphere-egu23-10965, 2023.

Extreme heat events are becoming more frequent in urban areas, and the magnitude of the urban heat island effect is increasing. Thus, adaptation of cities to climate change is a major challenge in urban planning. The summer of 2022 was the hottest summer in Germany on record. It was characterized by prolonged drought periods and low water levels in many rivers like the Rhine. For our urban study area in the city of Cologne (Germany), temperatures of more than 40°C were measured on several days, which is associated with excessive heat stress and health risks for the affected population. Significant small-scale temperature differences can be determined within cities for such heat events showing local effects and potentials for local adaptation and participation in climate change mitigation. As heat waves predominantly occur during radiation intensive and low-exchange weather conditions with limited or no advective air flow, microscale temperature differences can be traced back to the following most relevant processes: (1) differences in radiation absorption due to the albedo of urban surfaces, (2) shading effects by vegetation or buildings, (3 ) heat storage capacity and emissivity of materials, and (4) cooling effects through evapotranspiration of green infrastructures, urban water bodies, green facades or roofs. The aim of this study is to identify and explain small-scale microclimatic differences within a 16-hectare research area in the city of Cologne. Air temperature differences in a pedestrian level for two parallel streets with the same orientation and significant differences in terms of street width and greenery are analysed. We used the 3D ENVI-met model to simulate the urban microclimate of our study area with a spatial resolution of 1m² for the three hottest consecutive days which show the maximum 72-hour mean temperature in 2022 (July 18th-20th). The simulation results are validated using a densely distributed microclimate measurement network of 36 NETATMO low-cost sensors. The accuracy of these citizen science measurements is checked by three recalibration runs under laboratory conditions and direct comparisons with research-grade meteorological sensors in the field. The sensors show a high long-term stability and consistency with a measurement error less than one tenth of a Kelvin. ENVI-met model outputs and measurements are in very good agreement and show a high correlation. Thus, cause and effect relationships explaining the microclimatic conditions and its local deviations between the two selected streets can be made with high confidence during this heat wave in July 2022. Significant temperature differences of several Kelvin were identified when comparing the narrow, vegetation-free street canyon with the parallel broader street characterized by green front gardens, a double avenue of street trees and several facade greenings. Measured and modelled results show that local climate change adaptation measures can be highly effective in mitigating urban heat stress. In further steps, model scenarios will be developed to simulate and assess the potentials of various heat mitigation strategies in our study area in order to improve thermal outdoor comfort in cities with an increasing frequency of heat waves with over 40°C due to global warming.

How to cite: Eingrüber, N., Schneider, K., and Korres, W.: Evaluation of microclimatic variations and adaptation effects in a central European city during the most excessive heat wave in summer 2022 by ENVI-met modelling, EGU General Assembly 2023, Vienna, Austria, 23–28 Apr 2023, EGU23-11806, https://doi.org/10.5194/egusphere-egu23-11806, 2023.

Urbanization causes modifications in the urban climate of a city due to increase in impervious fraction and lack of evapotranspiration. The rise of extreme heatwave events due to climate change is causing concern for the cities effected by the urban heat island. Europe Union has recommended using Nature based solutions as a solution for multiple urban issues including the mitigation of urban heat. The UPSURGE project aims to use nature-based solutions for regenerative development in five demonstration cities. The five cities are based in different climate zones, consists of single to multiple demonstration sites, and are deploying various Nature based solutions based on the key city challenges.  The cities include Belfast, Breda, Budapest, Maribor, and Katowice. The demonstration sites are being Co-designed with multiple stakeholders to address the local concerns, diversity of voices to encompass perspectives and include citizens to address the longevity of Nature based solutions. The static and mobile sensors are being deployed to build a baseline and measure the effect of Nature based solutions. The cities have selected Nature based solutions varying from green roof, green wall, raingardens, Miyawaki forest, agroecology community gardens, rewilded zones, climate arboretum, meadows, water gardens. The work aims to model the effect of different Nature based solutions on the canopy urban heat island. The urban parameterization of the cities is done using local climate zone classification scheme. The advanced research Weather Research Forecast model is used to model the canopy urban heat island during the heatwave of July 2022. The WRF model is run for 7 days on three domains, 10 km, 5 km and 1 km horizontal resolution using six hourly data from ECMWF. The performance of the model has been assessed by analysing temperature, wind speed, relative humidity and surface level pressure considering their effect on local urban heat stress. The results showcase the importance of using actual urban morphology values in Weather Research Forecast to accurately simulate near-surface variables. The Weather Research Forecast simulations shows the presence of urban heat island and depicts the effect of deploying the various Nature based solutions across cities.

How to cite: Budhiraja, B. and McKinley, J.: Modelling the effect of Nature based solutions on urban heat island using the Local Climate Zone scheme in Weather Research Forecast model, EGU General Assembly 2023, Vienna, Austria, 23–28 Apr 2023, EGU23-11913, https://doi.org/10.5194/egusphere-egu23-11913, 2023.

The aim of the project CityCLIM is the development of a suite of services for the urban environment interesting for citizens and city administrations. The core of the CityCLIM services consists of a model chain to provide an operational weather forecast with an outstanding cell size of 100m for an area covering a whole city for a time span of up to three days. Therefore, the already operational SuperHD model by Meteologix is used to drive the new UltraHD model, which is a fully compressible large eddy simulation model including a two-moment microphysics parameterization. The UltraHD model was designed to use GPUs as the computational platform and is implemented using OpenCL. Surface orography and mountains were implemented using an immersed boundary layer approach and the model uses three-dimensional boundary conditions from the 1km SuperHD model. During the CityCLIM project further extensions for the UltraHD will be the implementation of a soil model for heat and moisture fluxes, a canopy layer to better represent vegetation fluxes and urban surface characteristics and a three-dimensional radiative transport code using raytracing for the short and a longwave band.

The developed CityCLIM services target at two different groups, the citizens within a city and the city administrations.

Services focused on the citizens are the Heat Wave Information and Warning Service, the Climate Information Service, the Pollution Information Service and the Citizen Weather Sensation Service. Except the Climate Information Service, the services will be based on operational everyday forecasts using the SuperHD and the GPU based UltraHD LES model chain. The Climate Information Service will be an extensive collection of climate and weather related parameters from available reanalysis models and measurement data on the Meteologix web portal. The Pollution Information Service will include aerosol compounds (PM10, PM2.5) and atmospheric trace gases (NOx, O3). With the added equations the computational effort for the UltraHD is significantly higher.

The administrative services consist of identification services for heat islands, city air flow and pollution areas within the city and simulation and mitigation strategies services. For the identification services a collection of many operational UltraHD model runs are analyzed for hot spots within a city and areas which are more sensitive to extreme weather conditions can be identified. The simulation and mitigation strategies services use manipulated input fields like orography and land use for recalculations for selected days. Those will be performed on demand and can be compared to previous simulations. This will provide insight in the effects of certain climate mitigation strategies and can be used as a testbed for large scale city planning.

To verify the results and to improve the initial model fields, high resolution measurement data is necessary. Therefore, the CityCLIM consortium installs additional weather stations within the pilot city regions and additional citizen science data will be collected. Earth observation data is extensively used, to characterize the surface of the city area with respect to land use and vegetation state and to compare model results like land surface temperature and soil moisture.

How to cite: Horn, S. and Zimmer, J.: CityCLIM – From an operational city weather forecast to a suite of services addressing the urban environment, EGU General Assembly 2023, Vienna, Austria, 23–28 Apr 2023, EGU23-12118, https://doi.org/10.5194/egusphere-egu23-12118, 2023.

EGU23-12497 | ECS | Orals | CL2.8

The expected effect of climate change on snowfall amounts and snow depth in the major urban areas of Romania 

Robert Hrițac, Lucian Sfîcă, Iuliana-Gabriela Breabăn, and Vlad-Alexandru Amihăesei

Snowfall and snow depth are important elements of the climate system which can have a significant impact on the transport sector, local economy, water resources and local thermal regime.

This study aims to identify the future trends of snowfall and snow depth in the most important urban areas in Romania, based on high-resolution regional climate models (RCM) data, made available through the EURO-CORDEX, and bias-corrected RCM simulations available în the RoCliB dataset. Ten different regional climate models with a target resolution of 10 km and two emission scenarios were considered, namely the moderate (RCP4.5) and business-as-usual (RCP8.5) scenarios. The study covers the interval from 2021 to 2100.

In order to predict the future snow depth, snow cover duration and snowfall amounts based on the available parameters from the RCM simulations, it was necessary to identify the complex relationship between snowfall, snow melting, temperature and precipitation. In order to do this, we first extracted the ERA5 reanalysis data from 1981 to 2020 for each urban area, and then employed a Bayesian Regularized Neural Network (BRNN). The resulting model was used to predict the future variables for all major urban areas in Romania.

A general trend of decreasing snowfall amounts, mean snow depth and snow cover duration was observed for all analyzed areas and for both emission scenarios. Important regional variations were also observed, with some areas no significant change for the 2021 – 2050 interval compared to the observation period, which could be explained mostly by the increasing winter precipitation predicted by the RCM simulation. The results also showed an increased possibility of some years virtually lacking any snow cover and snowfall precipitation, especially after 2050 in the business-as-usual scenario (RCP8.5). However, an increased variability was also observed, with extreme snowfall events remaining possible even in the latter half of the study interval.

How to cite: Hrițac, R., Sfîcă, L., Breabăn, I.-G., and Amihăesei, V.-A.: The expected effect of climate change on snowfall amounts and snow depth in the major urban areas of Romania, EGU General Assembly 2023, Vienna, Austria, 23–28 Apr 2023, EGU23-12497, https://doi.org/10.5194/egusphere-egu23-12497, 2023.

EGU23-12500 | Orals | CL2.8 | Highlight

Investigating global warming and future urbanization impacts on heat stress inmegacities- a multi-scalemodeling approach 

Chi-Yung Francis Tam, Tobi Eniolu Morakinyo, Gerald Mills, Ziqian Wang, Chenxi Hu, Ga Ming Cheng, and Renguang Wu

The dual forcing of climate change and rapidly urban development on heat waves over the Greater Bay Area (GBA), China and Lagos, Nigeria are investigated by multi-scale numerical simulation with the Weather Research and Forecasting (WRF) model coupled with single-layer urban canopy model. Heat stress cases are dynamical downscaled for the GBA and Lagos, under different scenarios. Three experiments are designed: For the first one, historical climate background derived from ERA5 reanalysis data will be utilized as boundary conditions for WRF, and present urban information is used. For the second experiment, future projected climate forcing using CMIP6 is incorporated into ERA5, with present urban information used. For the third experiment, both future climate and future urban landuse data (2050) will be utilized. Model outputs will then serve as boundary conditions for the ENVI-met model, which simulates microclimate conditions and provides details about heat stress at the street scale in two megacities. Based on our previous work, both urbanization and climate change lead to near-future temperature rise over the GBA, with the intensity of extreme heat events greatly enhanced due to their joint effects. This study is envisaged to provide invaluable urban climate information for climate change risk identification, prediction, mitigation and adaptation, by assessing how global warming, future urbanization, and their dual forcing affect heat stress at the city scale with model. Results related to future heat waves will provide useful information to policy maker about climate-sensitive urban planning, nature-based mitigation strategies and public policies making in the future.

How to cite: Tam, C.-Y. F., Morakinyo, T. E., Mills, G., Wang, Z., Hu, C., Cheng, G. M., and Wu, R.: Investigating global warming and future urbanization impacts on heat stress inmegacities- a multi-scalemodeling approach, EGU General Assembly 2023, Vienna, Austria, 23–28 Apr 2023, EGU23-12500, https://doi.org/10.5194/egusphere-egu23-12500, 2023.

EGU23-12896 | ECS | Orals | CL2.8

Urban heat island under climate change. The case study of Milano, Italy. 

Francesca Casale, Wenchuang Zhang, and Daniele Bocchiola

Poli-HE, a coupled hydrological-energy budget model was developed to simulate the surface water, and energy fluxes between soil and shallow atmospheric boundary for the city of Milano, Northern Italy. So doing, we describe the urban heat island effect, i.e. differences in land surface temperature (LST) between paved/urban, and green/natural areas, i.e. parks, and suburban agricultural patches.

Energy and water balance equations are linked through soil water content (W), and latent heat flux (LE), calculated as a function of the LST. W in turn drives (actual) evapotranspiration, thus driving (water) mass balance. Input variables were used from i) meteorological stations, air temperature (Ta), net radiation (Rn), rainfall (R), and ii) satellite images, giving leaf area index (LAI) and land surface temperature were used for model tuning.

The results show large differences in LST between urban/green areas, high during summer, viz 3-4 °C, lower in winter, viz 0.3°C. During 2010-2021 max surface temperature in Milano was +37.3°C in urban areas, and to +33.6°C in the green areas.

The model was then used for future projections of LST, using outputs of the Global Circulation Model EC-Earth3.0, constrained to shared socio-economic pathways SSP1-2.6 and SSP5-8.5 of the CMIP6. We analysed near (2030-2041), medium (2050-2061) and long-term (2080-2091). On average in the city of Milano, LST is projected between +0.14°C (SSP 2.6 in the medium-term), and +6.35°C (SSP 8.5 in the long-term). The jump of LST between urban/green areas would reduce against average increase of air temperature, and LST, i.e. large increase of air temperature will be less and less dampened by the present green area cover.

How to cite: Casale, F., Zhang, W., and Bocchiola, D.: Urban heat island under climate change. The case study of Milano, Italy., EGU General Assembly 2023, Vienna, Austria, 23–28 Apr 2023, EGU23-12896, https://doi.org/10.5194/egusphere-egu23-12896, 2023.

EGU23-13342 | Posters on site | CL2.8

Estimating the effect of roadside barriers in reducing PMs concentration with  PALM - 4U 

Daiane Brondani, Umberto Giostra, and Luca Mortarini

Air pollution from traffic is one of the leading causes of disease and premature death, potentially affecting all human body organs, depending on exposure to polluting sources. Among the main harmful agents to human health are fine particulate materials (PMs), such as PM 10 μm, PM 2.5 μmand PM 1 μm. The finest particulates, like PM 2.5 μm and PM 1 μm, are easily inhaled, causing respiratory problems such as irritation in the airways, coughing or difficulty breathing, worsening asthma, developing chronic bronchitis, irregular heartbeat, non-fatal heart attacks, premature death in people with heart disease, decreased lung function, contributing to the developing lung cancer. 

In addition, transported by the wind and then deposited in soil or water, the fine particulate contributes to the alteration of their acidity and nutrients, causing damage to forests and agricultural plantations. 

The present study investigates the ability of non-porous (concrete, glass) and porous (vegetation) barriers to attenuate the dispersion of fine particulate from roadway traffic. Large Eddy Simulations combined with observational data are used to evaluate the effectiveness of the different barriers in reducing the particulate concentration downwind from the roadway. Different types of barriers, different distances between the road and the barrier, and different barrier heights are simulated with PALM - 4U. The simulated concentration fields are compared to the Marche Region (Italy) measurements.

How to cite: Brondani, D., Giostra, U., and Mortarini, L.: Estimating the effect of roadside barriers in reducing PMs concentration with  PALM - 4U, EGU General Assembly 2023, Vienna, Austria, 23–28 Apr 2023, EGU23-13342, https://doi.org/10.5194/egusphere-egu23-13342, 2023.

EGU23-13594 | ECS | Posters on site | CL2.8

An innovative method to investigate the altering urban thermal environment by dynamic land cover change: A case study of Suwon, Republic of Korea 

Siwoo Lee, Cheolhee Yoo, Jungho Im, Dongjin Cho, Yeonsu Lee, and Dukwon Bae

The transformation of natural land cover into impermeable materials is a common definition of urbanization. However, it should be noted that vertical growth caused by urban renewal has been disregarded, while the horizontal expansion of urban areas has been widely studied. Understanding dynamic land cover change and its impact focusing on the thermal environment is essential for the sustainable management of urban areas. Therefore, the objective of this study is to propose a simple yet effective urban thermal environment investigation strategy that responds to dynamic land cover transformation. The study area is Suwon, Republic of Korea, where the city has recently been experiencing the most extreme urbanization along with explosive population growth. We designed a three-step approach: 1) extraction of temporal local climate zone (LCZ) to monitor the change in land cover due to urban growth over the period 2004 and 2021, 2) retrieval of high spatial-resolution land surface temperature (LST) using artificial intelligence to observe surface energy flux in heterogeneous urban area in detail, and 3) apply the filtering analysis method, which only uses the pixels classified with a higher confidence level, based on deep learning probabilistic approach to reduce the uncertainty of LCZ classification. To construct the temporal LCZ maps with a 30 m spatial resolution and retrieve the downscaled LSTs (DLSTs) with a corresponding spatial resolution, Landsat series satellites, Shuttle Radar Topography Mission (SRTM), and land cover map produced by Ministry of Environment were used. We obtained the following results: First, the overall accuracy (OA) of the LCZ classification was higher than 90% in both 2004 and 2021. Second, the average coefficient of determination (R2) and root mean square error (RMSE) of the DLSTs were greater than 0.9 and less than 1 °C, respectively. Third, through our suggested urban thermal environment investigation strategy, this study could find that the results of LST changes were clearly varied by building height and compactness changes. Especially, change of low-rise building to mid-rise building increased LST significantly. With these findings, we solidly believe the suggested strategy facilitates advanced urban climate studies.

How to cite: Lee, S., Yoo, C., Im, J., Cho, D., Lee, Y., and Bae, D.: An innovative method to investigate the altering urban thermal environment by dynamic land cover change: A case study of Suwon, Republic of Korea, EGU General Assembly 2023, Vienna, Austria, 23–28 Apr 2023, EGU23-13594, https://doi.org/10.5194/egusphere-egu23-13594, 2023.

EGU23-13652 | ECS | Orals | CL2.8

From observations to modeling: Investigating the heat mitigation potential of public spray mist cooling in Zurich 

Ivo Suter, Saskia Drossaart van Dusseldorp, and Julien G. Anet

Residents of urban areas are disproportionately affected by heat stress due to the combination of global warming and increasing urbanisation[1]. This not only affects the quality of life, but also poses a significant health risk and has been shown to lead to increased mortality rates[2]. However, due to the complex nature of urban climate, the impact of such interventions can vary depending on the local conditions and are thus hard to predict.

Figure 1) Left: Image of the misting system. Right: Locations of the misting system (blue circle) and the nearby measuring stations. Station 110 serves as a reference. Left photo from Tabea Vogel, https://www.stadt-zuerich.ch/ted/de/index/gsz/aktuell/aktuelle-projekte/Nebelwolke-Turbinenplatz.html, accessed: 04.01.2023. Right aerial image from www.geo.admin.ch, Swiss federal authorities.

In this study a real-world implementation of a spray mist cooling system in the city of Zurich is investigated. A ring carrying 180 high pressure nozzles was installed on a public square, as shown in figure 1a. Studies on spray mist cooling are scarce and inconclusive, as it depends on various operational, environmental and experimental factors[3]. State-of-the-art measuring stations[4] have been deployed for continuous measurements of temperature, humidity and other parameters during summer 2022, as shown in figure 1b. The measurements showed a weak cooling effect that was most pronounced south of the cloud, as shown in figure 2. A mean effect of -0.7°C was measured, with the strongest cooling of up to -2.5°C. The impact of the cloud was most pronounced at 25°C. A dependency on relative humidity and wind direction was measured, with the largest effect measured at low relative humidity downwind of the misting system. Outside of the operational hours no temperature difference was observed.

Figure 2) Mean difference between the mean temperatures of the measurement sites and the reference station from 12 July to 26 September during operating hours

The field experiment supports model development as an ideal case for model validation. The effect of the misting systems on heat and moisture fluxes have been implemented into the urban LES model PALM[1]. The parameterised cooling system in PALM was then used to investigate variations in placement, weather conditions and amount of sprayed water.

[1] Keith Oleson u. a., „Interactions between urbanization, heat stress, and climate change“, Climatic Change 129 (1. April 2013), https://doi.org/10.1007/s10584-013-0936-8.

[2] Sally Howard und Geetanjali Krishna, „How Hot Weather Kills: The Rising Public Health Dangers of Extreme Heat“, BMJ 378 (14. Juli 2022): o1741, https://doi.org/10.1136/bmj.o1741.

[3] Giulia Ulpiani, „Water Mist Spray for Outdoor Cooling: A Systematic Review of Technologies, Methods and Impacts“, Applied Energy 254 (November 2019): 113647, https://doi.org/10.1016/j.apenergy.2019.113647.

[4] BARANI DESIGN Technologies, „MeteoHelix IoT Pro Datasheet“, 18. August 2022, https://www.baranidesign.com/meteohelix-pro-weather-station.

[5] Maronga et al., Geosci. Model Dev., 13, 1335–1372, https://doi.org/10.5194/gmd-13-1335-2020, 2020

How to cite: Suter, I., Drossaart van Dusseldorp, S., and Anet, J. G.: From observations to modeling: Investigating the heat mitigation potential of public spray mist cooling in Zurich, EGU General Assembly 2023, Vienna, Austria, 23–28 Apr 2023, EGU23-13652, https://doi.org/10.5194/egusphere-egu23-13652, 2023.

EGU23-13816 | ECS | Posters on site | CL2.8

A sensor network for real-time monitoring and modelling of street-level heat exposure in Freiburg, Germany 

Marvin Plein, Gregor Feigel, Matthias Zeeman, Ferdinand Briegel, Carsten Dormann, and Andreas Christen

Exposure and vulnerabilities to heat stress are concentrated in cities, yet exhibit large intra-urban variability. However, existing Weather Sensor Networks (WSNs) that monitor relevant meteorological conditions are typically installed at a much coarser resolution and generally do not cover canopy-layer conditions in cities. There are few examples of fine urban-scale massive sensor networks at street-level, however, they rarely provide any data beyond air temperature and humidity needed to assess, map and calculate thermal comfort, and many street-level networks often lack the real-time data transmission and quality control procedures necessary for real-time communication.

Here, we present a customizable two-tiered WSN setup, coupled with a quality and data processing chain, to quantify, map and communicate heat exposure data and resolve intra-urban variabilities in real-time. The hierarchical urban canopy-layer network developed for long-term monitoring of thermal comfort conditions (and also heavy precipitation and wind storm impacts) in the city of Freiburg, Germany, consists of two different station systems that are integrated into public street lights at a uniform height of 3 m a.g.l. Thirteen “tier I stations“ are strategically placed in representative built-up and rural areas. They are equipped with a ClimaVUE 50 all-in-one weather sensor (precipitation, wind, radiation, temperature, humidity, pressure) and a Black Globe Sensor (both from Campbell Scientific, Inc.) which enables real-time thermal comfort calculations such as the Physiologically Equivalent Temperature (PET) or the Universal Thermal Climate Index (UTCI). Tier I stations feature a custom-built multi-purpose logger which is controlled by a Raspberry Pi Zero running a custom remote control software and GSM data transmission. This allows for a highly flexible setup that can easily be expanded to include additional sensors (e.g. air quality) in the future. In addition, 35 commercial “tier II stations“ (LoRAIN, Pessl Instruments GmbH) measure air temperature, humidity and precipitation and transmit data over NB-IoT.  These tier II stations significantly increase the spatial density of the WSN at a lower cost per site. In addition to urban street-light mounted locations, an additional eight sites in non-built-up locations capture areas with predominantly rural and natural land cover, with selected stations specifically measuring cold-air drainage channels into the city.

With measuring and transmission intervals of one and five minutes, respectively, one major purpose of this WSN is to develop machine learning routines for data quality control and quality assessment in real-time and downscaling thermal comfort data from tier II to tier I stations and areas not covered by stations. Moreover, the WSN will provide input and validation data for numerical high-resolution modelling of urban heat exposure. Real-time visualizations inform researchers, city officials and the general public with instantaneous and historical data at neighborhood-scale. 

How to cite: Plein, M., Feigel, G., Zeeman, M., Briegel, F., Dormann, C., and Christen, A.: A sensor network for real-time monitoring and modelling of street-level heat exposure in Freiburg, Germany, EGU General Assembly 2023, Vienna, Austria, 23–28 Apr 2023, EGU23-13816, https://doi.org/10.5194/egusphere-egu23-13816, 2023.

EGU23-14056 | ECS | Orals | CL2.8

Territorial climate change: understanding, mitigating and adapting 

Florentin Breton

Territories are complex environments with many issues at stake. The issues of human health and energy consumption for instance are linked to local weather and climate change. Despite the scientific and societal developments of the last decades, some of the physical and social processes of territorial climate change are still not well understood, and the implementation of mitigation and adaptation is slow. The following studies address these aspects of processes, mitigation, and adaptation, based on different methods in climate and social sciences.

The first study investigates the seasonality of weather conditions in Europe by using classification approaches (weather types, local analogues) on climate observations, simulations and projections. Simulations are close on average to the observed variability, winter conditions decrease while summer conditions increase, and Mediterranean seasonality expands Northwest while Scandinavian seasonality declines. 

The second study investigates the social perception of climate change and the acceptability of territorial options (mitigation, adaptation) by inhabitants and decision-makers, based on field interviews and foresight activities in the Gulf of Morbihan (France). A strong territorial seasonality (climate, socio-economy) and a complex role of climate change are found, as well as general agreement between local experiences and scientific knowledge. Despite divergent visions among inhabitants, two long-term scenarios and about twenty short-term actions emerged from foresight activities.

A third study investigates the effect of urban parameters on city temperature, and how urban planning options can optimize thermal comfort and reduce energy consumption and GHG emissions, based on urban climate observations and simulations. The city size drives urban warming, followed by urban fraction but building heights can cool the city depending on the season. Model adjustment and sensitivity simulations are presented for the urban planning approach.

How to cite: Breton, F.: Territorial climate change: understanding, mitigating and adapting, EGU General Assembly 2023, Vienna, Austria, 23–28 Apr 2023, EGU23-14056, https://doi.org/10.5194/egusphere-egu23-14056, 2023.

EGU23-14110 | Orals | CL2.8

The use of crowdsourced observations to build climate grids and assess urban heat hazard. 

Timothy D. Mitchell and Matthew J. Fry
Crowdsourced observations have the potential to bring a step-change in urban climatology. This rapid prototyping project explores their potential for improving the standard observed grids, and the likely consequences for urban climate services. Basic quality control procedures are applied to WOW, Davis, Netatmo and Met Office sites around Manchester (UK), and site records of daily minimum and maximum temperatures are built. These are interpolated onto a set of daily observed grids of temperature for Manchester at 1km resolution for summer (JJA) 2020, thus obtaining a crowdsourced alternative to HadUK-Grid. The number of tropical nights (minimum > 20 degrees) is counted in these two gridded products. This provides the baseline for a current climate service for partners in local government that projects possible future changes in heat hazards. Thus the comparison of the standard and crowdsourced products gives some insight into the potential for observations from citizen science to improve gridded observations, an observed hazard metric, future projections of that metric, and so influence public policy decisions related to extreme heat.

How to cite: Mitchell, T. D. and Fry, M. J.: The use of crowdsourced observations to build climate grids and assess urban heat hazard., EGU General Assembly 2023, Vienna, Austria, 23–28 Apr 2023, EGU23-14110, https://doi.org/10.5194/egusphere-egu23-14110, 2023.

EGU23-14169 | Orals | CL2.8 | Highlight

A modeling approach to address building energy consumption and thermal comfort under urban climate change 

Nadège Blond, Florentin Breton, Alice Micolier, and Maxence Mendez

The urban environment and climate change are essential factors to consider for applications involving urban planning and human health. Although these factors influence estimations of energy consumption and thermal comfort, buildings in France are still generally designed and renovated without accounting for these specific conditions but by considering present rural weather conditions. The first objective of this study is to develop an approach to explore building design and renovation choices while accounting for the urban environment and climate change. The second objective is to find which design and renovation choices are relevant to improve thermal comfort and reduce energy consumption (and therefore GHG emissions).

First, we use observations and simulations of weather conditions in several cities of France (representing different climatic zones), for the present and future climate (2050), to analyze urban conditions and estimate energy consumption. Second, we run building simulations for rural and urban situations, and for present and future climate conditions, to investigate the effect of the urban environment and climate change on the operation of buildings, and the effect of building scenarios on the urban climate.

How to cite: Blond, N., Breton, F., Micolier, A., and Mendez, M.: A modeling approach to address building energy consumption and thermal comfort under urban climate change, EGU General Assembly 2023, Vienna, Austria, 23–28 Apr 2023, EGU23-14169, https://doi.org/10.5194/egusphere-egu23-14169, 2023.

EGU23-14239 | ECS | Orals | CL2.8

Influence of urban trees on the climate change adaptation in Boadilla del Monte (Spain) 

Francesco Busca, María Teresa Gómez-Villarino, and Roberto Revelli

Urban green infrastructures are considered useful tools to mitigate air pollution, increase the resistance of cities to climate change, optimize energy consumption expenses and promote the integral management of economic, social and cultural development, according to a "sustainable cooperation". However, there are few studies that quantitatively support this contribution and there is also a lack of knowledge about which species are the most suitable for an urban area in order to improve air quality.  

Therefore, the research project proposes to analyze the improvement of air quality and the contribution to reducing the effects of climate change by trees of an entire urban area. i-Tree Eco software and the inventory of the urban trees of the Madrid Municipality of Boadilla del Monte, with which the project has been developed, have been used. Results about air pollutants reduction have been compared with the Municipality's emissions in order to see how urban greenery helps to the improvement of air quality. Finally, an annual monetary estimation of the Ecosystem Services (ES) offered by the urban trees of the city has been made through the software, then compared with the annual costs (planting, maintenance, removal) agreed with the Municipality of Boadilla, reaching a Cost-Benefit Analysis representative of the contribution given by urban green areas to the surroundings. 

How to cite: Busca, F., Gómez-Villarino, M. T., and Revelli, R.: Influence of urban trees on the climate change adaptation in Boadilla del Monte (Spain), EGU General Assembly 2023, Vienna, Austria, 23–28 Apr 2023, EGU23-14239, https://doi.org/10.5194/egusphere-egu23-14239, 2023.

EGU23-14781 | Orals | CL2.8 | Highlight

PANAME – Project synergy of atmospheric research in the Paris region 

Martial Haeffelin, Simone Kotthaus, Sophie Bastin, Sophie Bouffies-Cloché, Chris Cantrell, Andreas Christen, Jean-Charles Dupont, Gilles Foret, Valérie Gros, Aude Lemonsu, Juliette Leymarie, Fabienne Lohou, Malika Madelin, Valéry Masson, Vincent Michoud, Jeremy Price, Michel Ramonet, Jean-Francois Ribaud, Karine Sartelet, and Jean Wurtz and the PANAME team

The Paris region (France) is increasingly the focus of urban atmospheric research. Numerous national and international research projects have chosen Europe’s largest metropolitan region as their study area to better understand and predict critical hazards (incl. heat, air pollution, thunderstorms) in the context of a changing climate. Located on rather flat terrain in continental, mid-latitude climates, the densely populated Paris region is very suitable for the evaluation of urban processes in numerical simulations at different scales. The European research infrastructures ACTRIS and ICOS are developing strategies for the improved operational monitoring of air pollution and greenhouse gas budgets, respectively. Various research projects are conducting fundamental process studies and model developments to investigate the dynamics and chemistry of the urban atmosphere and its interactions with the rural surroundings and regional-scale flow to better quantify associated health risks and inform sustainable planning.

In addition to numerous modelling activities (chemistry-transport, numerical weather prediction, climate projections), diverse atmospheric observations are collected. These include dense surface station networks, turbulent flux towers, and ground-based atmospheric remote sensing to monitor the atmospheric boundary layer. This multi-project context motivates the pooling of resources.

To facilitate efficient project synergy and to optimise the coordination of the individual experimental campaigns, the PANAME initiative (https://paname.aeris-data.fr/) was established. PANAME provides a framework to optimise the design of the Paris region measurement network and helps to standardise the operations. A professional, multi-disciplinary data portal is developed at the French AERIS atmospheric data centre to host the PANAME observations and model results. Here, data are collected and formatted, standardised advanced products are derived from the diverse sensor networks and high-quality visualisations are generated in near real-time. The presentation will provide an overview on the scientific objectives of the on-going projects, the deployment of measurements and simulation tools, and the data portal design.


How to cite: Haeffelin, M., Kotthaus, S., Bastin, S., Bouffies-Cloché, S., Cantrell, C., Christen, A., Dupont, J.-C., Foret, G., Gros, V., Lemonsu, A., Leymarie, J., Lohou, F., Madelin, M., Masson, V., Michoud, V., Price, J., Ramonet, M., Ribaud, J.-F., Sartelet, K., and Wurtz, J. and the PANAME team: PANAME – Project synergy of atmospheric research in the Paris region, EGU General Assembly 2023, Vienna, Austria, 23–28 Apr 2023, EGU23-14781, https://doi.org/10.5194/egusphere-egu23-14781, 2023.

EGU23-14793 | Posters virtual | CL2.8

Impact of drought on urban trees – a modelling study 

Leif Backman, Esko Karvinen, Olli Nevalainen, Leena Järvi, and Liisa Kulmala

Urban green areas can be used as means for sequestering carbon, but also to manage run-off water and to reduce the urban heat island effect. Urban green spaces are often managed, including irrigation, removal of litter and modification of soil. In addition, urban green areas are often subjected to stress factors such as heat, pollution and drought. Here we study various carbon cycle components of urban trees using the JSBACH ecosystem model, focusing on the impact of drought. The study area is Kumpula, a semi-urban area situated in Helsinki, Southern Finland. In 2020 and 2021, an intensive measurement campaign took place involving a park area with tilia trees (Tilia cordata) and an urban forest dominated by Silver birch (Betula pendula). The observations included soil texture, soil temperature and moisture, and soil respiration. We used remote sensing data (Sentinel-2) for the leaf area index. Photosynthesis was measured using leaf cuvettes, and sap flow was measured for birch and lime trees. In addition, we used net ecosystem exchange from eddy covariance measurements at the Kumpula SMEAR III urban measurement station, operated by the University of Helsinki. The meteorological forcing data, to drive the model, was derived from observations at the Kumpula weather observation station, operated by the Finnish Meteorological Institute, and the SMEAR III station.

How to cite: Backman, L., Karvinen, E., Nevalainen, O., Järvi, L., and Kulmala, L.: Impact of drought on urban trees – a modelling study, EGU General Assembly 2023, Vienna, Austria, 23–28 Apr 2023, EGU23-14793, https://doi.org/10.5194/egusphere-egu23-14793, 2023.

Urban areas are known to be exposed to higher temperatures than rural areas making urban citizens particularly vulnerable to extreme heat events. Large eddy simulation (LES) models can simulate micrometeorological heat transport and mixing processes by directly resolving large-scale turbulence. These models can be used to simulate urban development strategies aiming at mitigating the adverse effects of heat waves in cities by analyzing their influence on urban microclimate. Despite their use in formulating recommendations for city planning, these models are often not validated with observed meteorological data. We here present results from conducting a model-observation comparison for a mid-size city in Germany. Model simulations were computed with the LES model PALM4U run at two different resolutions (Δx,y,z = 5 and 20 m) and evaluated against observations from a network of microweather stations for a heat wave in 2019 reaching maximum near-surface air temperatures of 37 °C.

During daytime, differences between observed and modeled near-surface air temperatures were small (-3.8 to 1.1 K, mean = 0.9 K), but much larger during night-time and the early morning transition. The latter findings can be explained by an overestimated modeled ground heat flux resupplying too much energy offsetting the radiative cooling leading to overestimated modeled air temperatures by up to +9 K (mean = 5.3 K). Further, results showed that in areas where the actual urban structure is reproduced well by the model resolution, differences between observed and modeled wind speeds were lower. Our findings indicate that a spatial resolution smaller than the mean building height produce more accurate model results for wind speeds. Many differences in model-observation intercomparison are explained by an overestimated modeled turbulent kinetic energy (TKE) causing inflated turbulent mixing in the air, which leads to distorted model output particularly for the urban nocturnal boundary layer.

How to cite: Späte, E., Sungur, L., Schneider, J., Babel, W., and Thomas, C. K.: Simulating an extreme heat event in a mid-sized city in Europe: validating and analyzing the relevance of spatial resolution in the urban LES model PALM4U with an observation network, EGU General Assembly 2023, Vienna, Austria, 23–28 Apr 2023, EGU23-15015, https://doi.org/10.5194/egusphere-egu23-15015, 2023.

The inverse S function can not only fit the spatial attenuation of construction land density, but also fit the spatial attenuation characteristics of various urban characteristics. Therefore, we assume that the inverse S-function curve is also applicable to the spatial variation law of urban LST. We hope to conduct an inverse S function model fitting analysis of the surface temperature of the three major cities in Beijing, Tianjin, Hebei, China's capital economic circle in 2001 and 2020 in winter, summer, day and night in eight periods to verify that they all conform to the characteristics of the function curve, and use the fitting parameters to analyze the urban development process and its impact on the thermal environment.

First, we draw concentric circles at intervals of 1KM from the center points of the three cities, and then extract the land surface temperature (LST) of each circle and process it dimensionlessly. Finally, the inverse S function model is fitted to all LST data, and the expression of the inverse S function is as follows. And combined with the characteristics of LST, the fitting parameters in the function are given corresponding meanings.

Analyzing the results of fitting parameters, LST conforms to the law of the reverse S-curve model in most cases.

Since the LST in the most periods can be simulated by the inverse S model, it is proved that their change law is that they first decrease slowly with the increase of the radius of the concentric circle, then decrease rapidly, and finally decelerate to zero.

The fit parameter "a" controls the slope of the curve. The larger "a" is, the faster the curve decays, indicating that the urban thermal environment is more compact.

The "a" of each city of winter is greater than that of summer.

Except for the smallest "a" in winter night in Beijing in 2020, the "a" in summer in 2001 was the smallest in other cities. The distribution of urban thermal environment in this period is the most scattered.

The "a" results for Beijing and Tianjin are similar every time, but Beijing has a wider range of values. Tianjin's is generally larger than them.

The fitting parameter "c" is the mean value of surface temperature at the city fringes.

The most cities are distributed between 0 and 0.2.

Only Tianjin Xiaye in 2020 reached 0.53. It shows that the temperature around Tianjin is on the high side during this period.

The fitting parameter "D" reflects the radius of the urban thermal environment.

The "D" of each city sample has increased to varying degrees, indicating that the urban high-temperature thermal environment has also expanded.

The thermal environment radii of Beijing and Shijiazhuang are the smallest at night in winter, while Tianjin is the smallest at night in summer.

The fastest growth rate was during summer nights, with each city adding more than 10 kilometers.

The slowest growth in Beijing is during the daytime in summer, while that in Tianjin and Shijiazhuang is during the night in winter.

How to cite: Zhang, X., Roca Cladera, J., and Arellano Ramos, B.: Research on the effect of urban territorial expansion on thermal environment using the inverse S-function curve- Taking Beijing-Tianjin-Hebei China Capital Economic Circle as an Example, EGU General Assembly 2023, Vienna, Austria, 23–28 Apr 2023, EGU23-15292, https://doi.org/10.5194/egusphere-egu23-15292, 2023.

This study summarizes the inter-comparison of three urban canopy models that are able to derive local-scale urban air temperature from rural atmospheric data and urban land use and built form characteristics at an hourly resolution. The focus of this presentation are the findings of the sensitivity analysis and the lessons learned in the process. The evaluated models are the Urban Weather Generator (UWG), the Vertical City Weather Generator (VCWG), the Surface Urban Energy and Water Balance Scheme (SUEWS). The evaluation is done against a two-week-long air temperature and relative humidity measurement conducted in the neighborhood of Újlipótváros in Budapest, Hungary. 
 
The study found a good agreement between modeled and observed air temperature values with a root mean square error (RMSE) remaining between 1–2ºC when calculated for the entire period. However, when separated per day- and nighttime, as well as per cyclonic and anticyclonic periods, the RMSE of the models increased up to 2–3ºC—particularly when calculated for nighttime and/or for anticyclonic periods. The sensitivity analyses shed light on additional shortcomings in the models. It revealed UWG’s low sensitivity to trees and vegetation. In this regard, especially the presence of trees in the urban canopy were not captured by the model. The analysis also found discrepancies regarding VCWG’s model physics, as the model responded to the increase in shortwave radiative forcing with decreasing air temperatures. The study will conclude with a set of recommendations for model developers and users.

How to cite: Gal, C.: A model inter-comparison and sensitivity analysis of three urban canopy models, EGU General Assembly 2023, Vienna, Austria, 23–28 Apr 2023, EGU23-15513, https://doi.org/10.5194/egusphere-egu23-15513, 2023.

EGU23-15799 | ECS | Posters on site | CL2.8 | Highlight

Extreme Climate Change Impacts on Urban Infrastructure and Support Systems 

Tom Wood, Hadi Arbabi, and Martin Mayfield

The global human population is projected to grow to between 8.9 billion and 12.4 billion by the end of the 21st century, with the proportion of the population living in cities projected to increase to 85% (OECD, 2015; UN, 2022). More than 80% of current global gross domestic product (GDP) is generated in cities (World Bank, 2020), demonstrating the importance of urban environments to the global economy and human flourishing. Urban infrastructure systems, such as energy networks, water supply and wastewater treatment, transport, communications, waste disposal and other utilities, are vulnerable to climate change impacts. It is therefore vital that the full range of potential climate change impacts on urban areas are understood.

Low-risk, high-consequence (LRHC) extreme climate change (ECC) events represent a severe threat to many aspects of human society. Existing literature tends to focus on average climate responses projected by climate models and emphasises the most likely scenarios based on a probabilistic approach. The impact of LRHC extreme and worst case scenarios has not received as much attention (Kemp et al., 2022). This includes impacts on urban and peri-urban infrastructure systems, regional and global supply chains, population displacement and migration, food, water and energy security and associated consequences such as increased conflict. While the likelihood of worst-case ECC effects by current assessment is low (IPCC, 2021), there remains significant uncertainty regarding potential climate tipping points that may cascade, trigger feedbacks and lead to runaway climate change (Lenton et al., 2019), even if global temperature increase is restricted to 1.5°C - 2°C (Armstrong McKay et al., 2022) which is growing more unlikely (Liu and Raftery, 2021). The potentially existential impacts of such scenarios necessitates that we exercise the precautionary principle (Sutton, 2019) and “explore the boundaries of plausibility” (Shepherd et al, 2018).

In this study we present synthesised evidence from the most extreme estimates of climate change effects such as extreme temperatures, precipitation, flooding, drought, wildfire, storms and sea-level rise from ECC scenarios, assessing the potential worst-case impacts on urban systems with a focus on heterogeneous regional impacts and the potential need for significant pre-emptive adaptation efforts. Global cities are ranked according to their potential vulnerability to ECC impacts with the aim of identifying cities where critical infrastructure is at risk of failure and what ECC effects they are likely to experience. We highlight gaps in current understanding and the need to focus research in this area while outlining a research agenda to explore ECC effects on urban infrastructure, including case studies of infrastructure systems in cities identified as vulnerable, with the aim of generating evidence for use in policy development.


References:

Armstrong McKay et al.. (2022). https://doi.org/10.1126/science.abn7950

IPCC, (2021) doi:10.1017/9781009157896

Kemp, et al (2022). https://doi.org/10.1073/pnas.2108146119

Lenton, T. M., et al., (2019). https://doi.org/10.1038/d41586-019-03595-0

Liu, P. R., & Raftery, A. E. (2021). https://doi.org/10.1038/s43247-021-00097-8

Shepherd, T. G. (2019). https://doi.org/10.1098/rspa.2019.0013

Sutton, R. T. (2019). https://doi.org/10.1175/BAMS-D-18-0280.1

How to cite: Wood, T., Arbabi, H., and Mayfield, M.: Extreme Climate Change Impacts on Urban Infrastructure and Support Systems, EGU General Assembly 2023, Vienna, Austria, 23–28 Apr 2023, EGU23-15799, https://doi.org/10.5194/egusphere-egu23-15799, 2023.

EGU23-16349 | Orals | CL2.8 | Highlight

Global Warming in Spanish Cities (1971-2022) 

Josep Roca, Blanca Arellano, and Xu Zhang

According to NASA's temperature record, Earth in 2021 was about 1.1 degrees Celsius warmer than the late 19th century average, the start of the industrial revolution. The rate of Global Warming (GW), however, differs across different regions of the planet. The Mediterranean is one of the "hotspots" of climate change, with more prominent temperature increases throughout the 20th and 21st centuries (Giorgi 2006). Since the mid-20th century, the average temperature over the Mediterranean has been increasing above the global average. The recent temperature record reveals an annual mean temperature for the entire basin that is approximately 0.4°C above the global mean (Lange 2021). This increase is even higher on the Spanish coast, which has experienced increases of more than 2°C (Arellano 2022).

The aim of this paper is to analyze the warming process in the main Spanish urban areas since unified records were kept in the early 1970s. For this purpose, the evolution experienced by temperatures between 1971 and 2022 in 21 meteorological stations representative of all the Spanish Autonomous Communities is analyzed. Barcelona, Madrid, Valencia, Zaragoza, Seville, Malaga, Bilbao, Valladolid, Ciudad Real, Badajoz, Asturias, Corunya, Ourense, Murcia, Logroño, Palma de Mallorca, Las Palmas de Gran Canaria and Santa Cruz de Tenerife, are studied.

The results show that, if on a global scale temperatures have risen 0.94°C since 1971, the increase in the main cities of peninsular Spain has been 2.17°C. And 2022 will be the warmest year on record. The research carried out differentiates the evolution experienced by maximum and minimum temperatures, showing that the continental influence is mainly manifested in the increase of maximum temperatures, while in the area of Mediterranean influence, the increase of minimum temperatures is more pronounced. On the other hand, the Cantabrian and Atlantic coasts, as well as, above all, the Canary Islands, show less pronounced increases, below 2°C.

The study also presents the heat and cold waves (Serra 2022) experienced by the cities studied. Diurnal heat waves (DHW) have increased from 0.6 per year per weather station in the decade 1971-1980, to 1.71 in 1981-1990, 1.81 in 1991-2000, 2.72 in 2001-2010, and 3.84 in 2011-2020. 2022, with 7.11 DHW per station, is the year with the highest number of diurnal heat waves in the entire series. Regarding nocturnal heat waves (NHW) they have increased from 0.47 per station per year in the decade 1971-1980, to 1.53 (1981-1990), 1.57 (1991-2000), 3.55 (2001-2010), and 4.63 (2011-2020). Again 2022 is the year with the highest number of NHW, with 7.61 per weather station.

2022 appears, therefore, as the warmest year since records have been kept, and the one in which a greater number of NHW has been experienced.

How to cite: Roca, J., Arellano, B., and Zhang, X.: Global Warming in Spanish Cities (1971-2022), EGU General Assembly 2023, Vienna, Austria, 23–28 Apr 2023, EGU23-16349, https://doi.org/10.5194/egusphere-egu23-16349, 2023.

EGU23-16480 | ECS | Orals | CL2.8

Quick calculation of wind field in urban area within a free and open source GIS: evaluation of the URock model 

Jérémy Bernard, Fredrik Lindberg, and Sandro Oswald

The wind speed varies significantly within a neighborhood due to building and vegetation size and position. A good estimation of these spatial variations is useful for several applications (outdoor thermal comfort, air pollution, building energy consumption and thermal comfort, etc.) but might be time-consuming using Computational Fluid Dynamic tools and difficult to produce for non experts.

URock is a Python library that has been developped within UMEP, a city-based climate service tool integrated as plug-in in the free and open source QGIS software. It is based on the Röckle approach already used in non open source softwares such as QUIC-URB and SkyHelios: first an initial wind field is set according to empirical laws derived from wind tunnel observations; second the mass air flow is balanced minimizing the modifications of the initial wind field. This method is less accurate than traditional CFD method but quicker and simple to implement for non specialists. This work presents the evaluation of URock against wind tunnel observations.

Acknowledgement

This project has received funding from the European Union’s Horizon 2020 research and innovation programme under the Marie Skłodowska-Curie grant agreement No 896069.


How to cite: Bernard, J., Lindberg, F., and Oswald, S.: Quick calculation of wind field in urban area within a free and open source GIS: evaluation of the URock model, EGU General Assembly 2023, Vienna, Austria, 23–28 Apr 2023, EGU23-16480, https://doi.org/10.5194/egusphere-egu23-16480, 2023.

Urban anthropogenic heat has a direct impact on urban climate. However, due to a warm feedback loop, the attributions of urban anthropogenic heat in urban area are unclear. This research carried out an attribution analysis of anthropogenic heat index (AHI) derived from remote sensing over global 1386 cities to investigate the contribution of 13 environmental variables to global urban anthropogenic heat based on GEE environment. 13 independent variables are categorized the groups of human activities, land morphology, vegetation, climate and atmospheric environment on anthropogenic heat. The results show that although human activities are considered as the main source of the anthropogenic heat, other factors have more impacts on the anthropogenic heat pattern in the urban area due to the feedback loop of urban thermal environment. Climate played a leading role in the impacts on anthropogenic heat with a contribution rate of 30-50% in most background contexts. The impact rate of human activities and landforms on anthropogenic heat accounts for 20% in most background scenarios. The findings of this research can contribute to the solution of mitigating urban anthropogenic heat and expanded the research scope of urban anthropogenic heat in the urban area.

How to cite: Wu, H. and Huang, B.: Attributes analysis of global urban anthropogenic heat index with multi-sources remote sensing data, EGU General Assembly 2023, Vienna, Austria, 23–28 Apr 2023, EGU23-16489, https://doi.org/10.5194/egusphere-egu23-16489, 2023.

EGU23-16915 | Posters virtual | CL2.8

Impact of urban canyons on atmospheric processes in Minsk, Belarus: observational and modelling study 

Siarhei Barodka, Tsimafei Schlender, Piotr Silkov, Aliaksei Borisovets, Aliaksei Sycheuski, Ilya Bruchkouski, and Tatiana Tabalchuk

This study is devoted to analysis of the impact of urban canyons and other features of urban morphology on formation of wind patterns and micrometeorological weather regimes in the urban area of Minsk, Belarus. For that purpose we combine urban morphology analysis with high-resolution mesoscale simulations with the WRF-BEP+BEM modelling system and observational data.

Urban morphology parameters for Minsk are first obtained on basis of OpenStreetMap (OSM) vector data processed with machine learning techniques. We then apply several algorithms of urban street canyon identification to this data to get an overall picture of main urban morphology features of Minsk and their possible role in wind patterns formation. Furthermore, OSM data is processed to form a representation of buildings data and other urban parameters for use in the WRF-BEP+BEM modelling system along with other sources of data for land use/land cover description. Modelling results are then analyzed along with observational data, which includes available satellite data, regular ground-based measurements, crowdsourced data from citizen weather stations and compact sensors, and our own street observations conducted with mobile instruments during several field campaigns in different parts of Minsk (including previously identified urban canyon zones.

How to cite: Barodka, S., Schlender, T., Silkov, P., Borisovets, A., Sycheuski, A., Bruchkouski, I., and Tabalchuk, T.: Impact of urban canyons on atmospheric processes in Minsk, Belarus: observational and modelling study, EGU General Assembly 2023, Vienna, Austria, 23–28 Apr 2023, EGU23-16915, https://doi.org/10.5194/egusphere-egu23-16915, 2023.

EGU23-17349 | Posters on site | CL2.8 | Highlight

Machine learning-based emulation of land cover effects at sub-hectometric scale using crowd-sourced weather observations 

Andrei Covaci, Thomas Vergauwen, Sara Top, Steven Caluwaerts, and Lesley De Cruz

Traditional weather stations monitor the weather above short grass, which is a standardized environment. Such an environment is far from representative of where most people live. Moreover, despite advances in urban climate modelling, even state-of-the-art weather forecasts and climate scenarios do not account for the hyperlocal influence of land cover on meteorological variables.

To bridge this gap, we have constructed several machine learning models to translate 2-meter temperature measurements from standardized to different rural and urban environments. The input features of these models are the land cover fractions: impervious, green and water around a target station, and the interpolated open-field 2-meter temperature and wind values at the target location. The target feature for these models is the temperature data from the Flemish crowd-sourced VLINDER-network, which consists of calibrated stations positioned in unconventional locations. These models were trained on data from a limited set of VLINDER-stations and evaluated on unseen data of previously used and unused VLINDER-stations. We found that a random forest model yields the best results and had the highest interpretability of how the features interacted with the model. The results of the simple artificial neural networks are not robust, making these models less reliable.

We explore the addition of more features related to the urban environment such as building height, sky view factor and variables related to radiation. Finally, we investigate how to prevent possible overfitting due to insufficient variation in the land cover in the training data by including other data sources.

How to cite: Covaci, A., Vergauwen, T., Top, S., Caluwaerts, S., and De Cruz, L.: Machine learning-based emulation of land cover effects at sub-hectometric scale using crowd-sourced weather observations, EGU General Assembly 2023, Vienna, Austria, 23–28 Apr 2023, EGU23-17349, https://doi.org/10.5194/egusphere-egu23-17349, 2023.

EGU23-2377 | ECS | Orals | CR7.4

Quantifying surface cloud warming increase as Fall Arctic sea ice cover decreases 

Assia Arouf, Hélène Chepfer, Jennifer E. Kay, Tristan S. L’Ecuyer, and Jean Lac

During the Arctic night, clouds regulate surface energy budgets through longwave warming alone. During fall, any increase in low-level opaque clouds will increase surface cloud warming and could potentially delay sea ice formation. While more clouds due to fall sea ice loss have been observed, quantifying the surface warming caused by these cloud increases is observationally challenging. Here, we quantify surface cloud warming using spaceborne lidar observations. By instantaneously co-locating surface cloud warming and sea ice observations in regions where sea ice varies, we find October large surface cloud warming values (> 80 W m −2) are much more frequent (~+50%) over open water than over sea ice. Notably, in November large surface cloud warming values (> 80 W m −2) occur more frequently (∼+200%) over open water than over sea ice. These results suggest more surface warming caused by low-level opaque clouds in the future as open water persists later into the fall.

How to cite: Arouf, A., Chepfer, H., Kay, J. E., L’Ecuyer, T. S., and Lac, J.: Quantifying surface cloud warming increase as Fall Arctic sea ice cover decreases, EGU General Assembly 2023, Vienna, Austria, 23–28 Apr 2023, EGU23-2377, https://doi.org/10.5194/egusphere-egu23-2377, 2023.

The Weddell Sea Polynya is a seasonal opening within the sea ice cover of the Weddell Sea sector, typically found over the Maud Rise and inside the Weddell Gyre. It has been a rare occurrence in the satellite period, appearing in austral spring between 1973 and 1976 and again in 2016/17. The polynya formation has been shown to be complex, requiring a combination of ocean and atmospheric mechanisms to develop. The region is often poorly resolved in global climate models, with little agreement in ocean or sea ice dynamics. When Weddell Sea polynyas have occurred in models without forcing, it is not understood how they occur within the model, or why some models produce frequent polynyas and others produce none. Some studies have shown that increasing horizontal resolution improves the dynamics of the Southern Ocean, allowing for better parameterisation of small-scale features. Here, we use multi-model data of different resolutions, from the PRIMAVERA HighResMIP experiments, to determine how models of different atmospheric and ocean resolution resolve Weddell Sea polynyas. We assess the frequency, size, and location of polynyas in different resolutions, in addition to studying the ocean and atmospheric processes associated with the polynya in these models. Initial results of models that resolve frequent polynya show preconditioning in both the ocean and atmosphere, in addition to a small response to the polynya in the months following.

How to cite: Ayres, H. and Ferreira, D.: Atmosphere and ocean climate model resolution in resolving Weddell Sea polynyas and their ocean-atmosphere interactions., EGU General Assembly 2023, Vienna, Austria, 23–28 Apr 2023, EGU23-2674, https://doi.org/10.5194/egusphere-egu23-2674, 2023.

EGU23-3640 | Posters on site | CR7.4

Lagrangian pathways under the Filchner-Ronne ice shelf and in the Weddell Sea 

Vladimir Maderich, Roman Bezhenar, Igor Brovchenko, Antonina Bezhenar, Fabio Boeira Dias, and Petteri Uotila

The objective of the study is to construct Lagrangian pathways under the Filchner-Ronne ice shelf (FRIS) and in the Weddell Sea using the data of numerical simulation of currents and Lagrangian numerical methods. The yearly cycled results of modeling for the circulation, temperature, and salinity in the Weddell Sea and the FRIS cavity from the Whole Antarctica Ocean Model (WAOM) were used to run the particle-tracking model (Parcels) for computing Lagrangian particle trajectories. The original version of the Parcels model does not have an option for particle reflection from the solid boundaries including the ice shelf. Therefore, the corresponding kernel was developed in the current study. The Parcels model gives an error in interpolation when it cannot find enough grid nodes around the particle. To avoid these errors, the function of particle recovery was developed. To analyze the variations of movement of the water masses under the FRIS, a set of particles was released in the Ronne Depression near the ice shelf front. Particles were released at two depths: 350 m and 500 m under the sea surface. Particles were released each 4 hr within 365 days. Simulation continued for 20 years of particle movement. The results of Lagrangian analysis generally agreed with schemes based on water mass analysis. The released particles first move southward along the Ronne Trough. The flow then turns to the east reaching the passage between Berkner Island and Henry Rise after 3 years. After 10 years, the flow of transformed water reaches the Filchner Trough through which water flows out to the shelf of the southern part of the Weddell Sea. Over time, the particles penetrate into all parts of the cavity. Some of the particles cross the Ronne Shelf front, and then they are carried away by currents on the Weddell Sea shelf. In 20 years, almost the same number of particles left the cavity through the Ronne ice front (43%) and the Filchner ice front (37%) whereas the rest of the particles (20%) remained under FRIS.

How to cite: Maderich, V., Bezhenar, R., Brovchenko, I., Bezhenar, A., Dias, F. B., and Uotila, P.: Lagrangian pathways under the Filchner-Ronne ice shelf and in the Weddell Sea, EGU General Assembly 2023, Vienna, Austria, 23–28 Apr 2023, EGU23-3640, https://doi.org/10.5194/egusphere-egu23-3640, 2023.

Polar lows are intense subsynoptic cyclones on the meso-α to meso-β scale that develop over polar maritime environments. So far, only regional atmospheric models have been able to resolve polar lows due to their small spatiotemporal scales. Investigations with coupled regional atmosphere-ocean models are limited to a single study. We demonstrate the simulation of polar lows and their effects on the ocean and sea ice with the recently developed storm- and eddy-resolving configuration of the ICOsahedral Nonhydrostatic (ICON) model, called ICON-Sapphire. ICON-Sapphire globally couples the atmosphere, land, sea ice and ocean with a horizontal resolution of 2.5 km.
Although we focus on the Nordic Seas, ICON-Sapphire simulates polar lows in the northern and southern hemispheres covering the entire mesoscale. They form in different environments, for instance during marine cold air outbreaks or in low-level baroclinic areas at the marginal sea ice zone. Albeit short-lived phenomena, polar lows considerably affect the underlying ocean in ICON-Sapphire, leading to large heat losses, in particular close to the marginal sea ice zone, where they themselves induce cold air outbreaks. This ICON-Sapphire simulation is the first to show how polar lows interact with sea ice to create leads and polynyas due to strong wind stress. Leads and polynyas induce additional heat loss from the ocean that initiates the formation of new ice. Representing polar lows in global climate models increases the heat loss and ice formation from polar oceans, which are otherwise underestimated.

How to cite: Gutjahr, O. and Mehlmann, C.: Polar lows in a globally coupled storm- and eddy-resolving (2.5 km) climate model (ICON-Sapphire), EGU General Assembly 2023, Vienna, Austria, 23–28 Apr 2023, EGU23-3956, https://doi.org/10.5194/egusphere-egu23-3956, 2023.

EGU23-4860 | ECS | Posters virtual | CR7.4

Sub-daily Antarctic sea-ice variability estimates using swath-based retrieval methods 

Wayne de Jager and Marcello Vichi

Satellite-derived sea-ice concentration measurements have traditionally been used to evaluate the impact of climate change on polar regions. However, concentration-based measurements of sea-ice variability do not allow the discrimination of the relative contributions made by thermodynamic and dynamic processes. This prompts the need to use sea-ice drift and type products and develop new methods to quantify changes in sea-ice properties that would indicate trends in the ice characteristics. A component of the sea-ice variability is driven by local weather events, and in some cases is the dominant driver of variability over larger-scale atmospheric features. Previous work by de Jager & Vichi (2022) has suggested that sea-ice vorticity (derived from low resolution sea-ice displacement vectors) may be a useful metric for quantifying dynamical features in Antarctic sea ice; specifically shorter term changes in the ice-interior driven by atmospheric storms. However, this study hypothesised that much of the rotational drift in the underlying sea-ice field was blurred as a result of the relatively large 48-hr temporal resolution of the drift product, therefore highlighting the necessity of measuring sea-ice properties at higher temporal frequencies. This study will therefore assess the usefulness of an overlapping swath-based method of sea-ice displacement retrieval recently made available by the EUMETSAT OSI-SAF. This swath-based method of retrieval allows for analysis of sea-ice variability at sub-daily timescales, which may be more suitable for measuring the effect of weather events on the sea-ice landscape than using daily averages of merged swaths. In situ data of sea-ice conditions were collected on board the SA Agulhas II research vessel in the Atlantic Sector in July, 2022, which will be compared to swath-based satellite estimates. Furthermore, the newly released 24-hr OSI-SAF drift product will also be compared. To complement these drift estimates, a modified swath-based ice-type retrieval method will be presented to add further context to any potential thermodynamic changes affecting the optical properties of the sea-ice surface.

How to cite: de Jager, W. and Vichi, M.: Sub-daily Antarctic sea-ice variability estimates using swath-based retrieval methods, EGU General Assembly 2023, Vienna, Austria, 23–28 Apr 2023, EGU23-4860, https://doi.org/10.5194/egusphere-egu23-4860, 2023.

EGU23-5458 | ECS | Posters virtual | CR7.4

Enhanced winter biogeochemical activity in Antarctic first-year sea ice 

Riesna R. Audh, Sarah E. Fawcett, Siobhan Johnson, Tokoloho Rampai, and Marcello Vichi

The study of Antarctic first-year ice as a biogeochemical habitat has been limited by samples mostly collected in pack ice during summer. Fewer winter data are available, and due to the harsh conditions, data from the marginal ice zone (MIZ) are even more difficult to obtain. The MIZ is broad and circumpolar in the Southern Ocean; it is found at different latitudes during the year with sufficient light and nutrients to sustain primary production and affect ecosystem functioning. We present the first dataset of biogeochemical properties of first-year ice collected in the Atlantic sector of the Southern Ocean during winter 2019, obtained from young pancake ice and consolidated first-year ice. Temperature, salinity, crystal structure, δ18O, chl-a and bulk macronutrient data were used to investigate the winter habitat and explain the transition from young ice to first year ice through exchanges with the ocean biogeochemistry. Data suggests that the sea ice sampled at the consolidated station was a result of thermodynamic processes combined with possibly multiple cycles of breaking and rafting induced by waves and dynamics, which ultimately enhanced the biogeochemical activity beyond what expected for first-year ice. A numerical model was used to support the hypothesis that winter first-year ice buffers biogeochemical components differently from the upper ocean winter concentrations, and this may determine the conditions for the biogeochemical development later in spring.

How to cite: Audh, R. R., Fawcett, S. E., Johnson, S., Rampai, T., and Vichi, M.: Enhanced winter biogeochemical activity in Antarctic first-year sea ice, EGU General Assembly 2023, Vienna, Austria, 23–28 Apr 2023, EGU23-5458, https://doi.org/10.5194/egusphere-egu23-5458, 2023.

EGU23-6309 | Orals | CR7.4

Changes in Arctic sea ice thickness distribution in Fram Strait over the last three decades, 1990 – 2019 

Hiroshi Sumata, Laura de Steur, Dmitry Divine, Mats Granskog, and Sebastian Gerland

Fram Strait is an ideal location to monitor long-term changes of sea ice properties in the central Arctic since the major fraction of ice export from the Arctic occurs here. The Fram Strait Arctic Outflow observatory has been monitoring sea ice and ocean outflows at ~79°N for the last three decades. We examined changes of monthly mean sea ice thickness distributions obtained from upward looking sonars deployed in the observatory. We found that the thickness distributions can be reasonably approximated by lognormal functions except for fractions of very thin ice classes. We fitted the observed distributions with lognormal functions and used three parameters of the functions (modal thickness, modal peak height and variance) to describe the long-term changes of the thickness distribution. We found that these parameters exhibit a concurrent change and indicate a shift of the Arctic sea ice regime. The first regime is represented by a thick and deformed ice pack, described by thicker modal thickness with a smaller and more broad modal peak with larger variance of the distribution. The second regime has a thinner and more uniform ice cover, represented by thinner modal thickness with more compact distribution around the mode and smaller fraction of deformed ice. We examine factors causing this shift and introduce a stochastic sea ice thickening model which can explain the change of the ice thickness distribution.

How to cite: Sumata, H., de Steur, L., Divine, D., Granskog, M., and Gerland, S.: Changes in Arctic sea ice thickness distribution in Fram Strait over the last three decades, 1990 – 2019, EGU General Assembly 2023, Vienna, Austria, 23–28 Apr 2023, EGU23-6309, https://doi.org/10.5194/egusphere-egu23-6309, 2023.

EGU23-6392 | ECS | Orals | CR7.4

Seeking the origins of Arctic ice nucleating particles with FLEXPART-WRF 

Anderson Da Silva, Louis Marelle, and Jean-Christophe Raut

The Arctic region is subject to polar amplification, causing it to warm approximately four times faster than the global average. The predominance of ice and mixed-phase clouds in high latitude regions causes strong uncertainties in the determination of the cloud radiative effect and the cloud feedback. The representation of these clouds in models is therefore a crucial point for climate prediction. Solid and liquid water phases partitioning in mixed-phase clouds is mostly driven by their formation and growth processes, in which aerosol particles play a major role, especially in the Arctic where those particles are scarce. Although ice nucleating particles (INPs) may have relevant impact on weather and climate, their physical and chemical properties stay poorly understood. One of the main reasons is the lack of knowledge about their nature; the latter being mainly determined by their sources and thereby their geographical origins.

In this study, in situ measurements from several recent data-sets are used to determine the likely origins of warm Arctic INPs (activated between -10°C and -20°C). A statistical method is applied on the backtrajectories derived from the lagrangian dispersion model FLEXPART-WRF, allows to characterize the seasonal variability of the identified INPs’ sources encountered over the arctic basin.

The seasonal analysis shows that contributions of continental and marine sources to INPs concentrations are highly time- and space-dependent. Arctic INPs do not come exclusively from local sources and can originate from long-range transport. However, the general strong contribution of sea ice and open ocean regions to high concentrations of INPs, and its seasonal variability, is a clue about the importance of local sources. It emphasizes the hypothesis that marine biologic sources are among the main contributors to INPs emissions in the Arctic, when air masses coming from continental regions are often weak contributors. Also, the discrete strong contribution of sea ice regions, particularly in Autumn, suggests that mechanisms like blowing snow or emission of sea sprays from leads and marginal sea ice could have a relevant impact on Arctic INPs production.

These results show the potential of this approach to characterize the origins of in situ measured species, and call for the method to be used in future studies on aerosols emissions.

How to cite: Da Silva, A., Marelle, L., and Raut, J.-C.: Seeking the origins of Arctic ice nucleating particles with FLEXPART-WRF, EGU General Assembly 2023, Vienna, Austria, 23–28 Apr 2023, EGU23-6392, https://doi.org/10.5194/egusphere-egu23-6392, 2023.

Coastal (latent heat) polynyas are regions of extremely strong ocean–atmosphere heat, moisture and momentum exchange, often with wind speed and surface turbulent heat flux exceeding 30 m·s1 and 1000 W·m2, respectively, and air temperature below –20°C. Consequently, polynyas play a very important role in shaping the local and regional weather, are crucial for sea ice production and the associated formation of dense water masses. The ocean mixed layer (OML) during polynya events is highly turbulent, with turbulent dissipation due to wind shear, waves and convective mixing. Crystals of frazil ice forming in those very dynamic conditions are transported throughout the OML along irregular, three-dimensional trajectories. The manifestation of those processes at the surface are characteristic elongated strips with high frazil concentration – so called frazil streaks – forming in convergence zones of the Langmuir circulation (https://egusphere.copernicus.org/preprints/2022/egusphere-2022-1435/). The presence of frazil streaks and open water areas between them leads to high spatial variability of OML and, crucially, sea surface properties. In particular, the bulk water viscosity within streaks is much higher and the sea surface roughness much lower than in open water. This in turn affects the momentum flux from the atmosphere and the evolution of wind waves. Wave breaking is suppressed, and short waves are dissipated by frazil/grease ice. Therefore, the whole spectral energy balance is modified. In this paper, satellite data and spectral wave modelling are used to analyse fetch-limited, deep-water wave growth during selected polynya events in the Terra Nova Bay, Antarctica. It is shown that wave growth in the presence of frazil streaks is slower than in analogous ice-free situations, and that wave–ice interactions are the only plausible explanation for observations. Simulations with a spectral wave model SWAN (Simulating Waves Nearshore) are used to examine different scenarios of how the source terms related to wind input, quadruplet wave–wave interactions, whitecapping, and dissipation in grease ice contribute to the net wave energy growth with distance from shore. Additionally, the role of across-wind variations of wind speed and wave properties is examined in detail, illustrating the inherently two-dimensional character of the polynyas’ wave field. Overall, the study shows that polynya events provide a unique, very valuable setting for studying wave–ice interactions, in many respects fundamentally different from the ‘standard’ case of swell entering the marginal ice zone from the open ocean.

How to cite: Herman, A. and Bradtke, K.: Interactions between wind waves and frazil ice in the turbulent surface boundary layer of an Antarctic coastal polynya, EGU General Assembly 2023, Vienna, Austria, 23–28 Apr 2023, EGU23-7086, https://doi.org/10.5194/egusphere-egu23-7086, 2023.

EGU23-9205 | Orals | CR7.4

The impact of large scale atmospheric and cyclone variability on the sea-ice edge in the Labrador Sea 

Joy Romanski, James Williams, Anastasia Romanou, Bruno Tremblay, and Sandrine Trotechaud

We study the temporal variability of the wintertime Labrador Sea ice area.  The driving factors of these intraseasonal and interannual variations are related to large scale atmospheric variability and cyclone variability both of which can be characterized by the Arctic Oscillation (AO) index.  We observe negative trends in the maximum sea-ice area over the past 40 years, and a positive correlation between the AO index and Labrador Sea ice area.  Using satellite-derived daily ice area along with reanalysis-derived cyclones, turbulent flux, wind, humidity, air and sea temperature fields, we delve into the physical coupling mechanisms by which cyclones influence the position of the ice edge in the Labrador Sea throughout the winter.

How to cite: Romanski, J., Williams, J., Romanou, A., Tremblay, B., and Trotechaud, S.: The impact of large scale atmospheric and cyclone variability on the sea-ice edge in the Labrador Sea, EGU General Assembly 2023, Vienna, Austria, 23–28 Apr 2023, EGU23-9205, https://doi.org/10.5194/egusphere-egu23-9205, 2023.

Global Earth System Models (ESMs) seek to simulate physical, chemical and biological processes that are relevant for the evolution of global climate. One key feature of an ESM is the ability to simulate fluxes of greenhouse gases and aerosols between the atmosphere and ocean, keep track of the inventories in the respective model components and allow for feedback on the climate system. These fluxes are usually calculated based on bulk formulations derived from open water measurements, and are restricted by the sea ice fraction in regions covered by sea ice.

The air-sea gas exchange is determined by the difference in concentration across the air-sea interface, and a gas transfer velocity that is specific for the gas in question. Using CO2 as example, the air-sea gas exchange is
          FCO2 = (1 - βCsea-ice ) ⋅ kw(CO2) ⋅ ( [CO2]sea - α[CO2]air)   (1)
where Csea-ice is the sea ice concentration, kw(CO2) is the gas transfer velocity, and α is the Ostwald solubility coefficient. Traditional formulas use β = 1 (complete barrier), but in order to account for cracks and leads in the sea ice, Steiner et al. (2013) proposed a modified formula with β ∈ [0, 1], allowing the sea ice to act as a partial barrier (0 < β < 1) or allowing free exchange in sea ice covered regions (β = 0).

We implement the modified gas exchange formula (eq. 1) in the Norwegian Earth System Model NorESM2, for all model tracers exchanged over the air-sea interface (CO2, O2, N2, N2O, DMS). Experimenting with different β values, we find that small increases (β ∈ [0.01, 0.02]) may result in either increased or decreased gas fluxes in high latitude regions. This can be attributed to the internal variability of the sea ice area, in particular for the summer minimum, which responds to changes in greenhouse gases and aerosols in the atmosphere. For β ∈ [0.1, 0.2] we find an increase in CO2 flux of 16% — 22% north of 68°N, and 5% — 8% south of 60°S. Observational datasets based on eddy covariance data for CO2 in the atmospheric boundary layer will be used in
future work in order to determine a realistic range for β.

REFERENCES:

N. S. Steiner, W. G. Lee, and J. R. Christian. Enhanced gas fluxes in small sea ice leads and cracks: Effects on CO2 exchange and ocean acidification. Journal of Geophysical Research: Oceans, 118(3):1195–1205, 2013. doi: 10.1002/jgrc.20100.

How to cite: Torsvik, T.: Modeling influence of sea ice on gas exchanges between atmosphere and  ocean in a global Earth System Model, EGU General Assembly 2023, Vienna, Austria, 23–28 Apr 2023, EGU23-9684, https://doi.org/10.5194/egusphere-egu23-9684, 2023.

EGU23-12357 | Posters on site | CR7.4

Quantifying the effect of snow and sea ice interactions on SnowModel-LG snow depth and density product 

Ioanna Merkouriadi, Glen Liston, and Heidi Salilla

Snow is a crucial component of the Arctic sea ice system. It dominates the exchanges of heat and light between the atmosphere and the ocean, with important physical and biological implications. To address the imperative need for more realistic representation of snow on sea ice, recent efforts have focused on reanalysis-based snow depth and density reconstructions. However, none of the recent snow products account for snow losses due to snow and sea ice interactions.

This study quantifies the snow loss in snow-ice formation, and its effect in SnowModel-LG snow depth and density product. We coupled SnowModel-LG, a snow modeling system adapted for snow depth and density reconstruction over sea ice, with HIGHTSI, a 1-D sea ice thermodynamic model, to simulate snow-ice and thermal ice growth: SnowModel-LG_HS. We assumed that all negative freeboard would result in snow-ice formation. Pan-Arctic model simulations were performed over the period 1 August 1980 through 31 July 2021, and they were guided by observations where available. In SnowModel-LG_HS, snow depth was lower (domain average: 18%), and snow density was higher (2.3%) compared to SnowModel-LG. The differences were much larger in the Atlantic sector. Our simulations suggest that when snow models do not account for snow and ice interactions, snow depth can be significantly overestimated. In this talk we will discuss the magnitude of this overestimation in relation to the sub-grid parameterization of sea ice dynamics and their effect in snow redistribution over the ice floes. Sea ice dynamics (e.g. deformed ice formation), are likely an additional important snow sink that is not yet accounted for in snow models.

Finally, we use our snow depth and density results from SnowModel-LG_HS to obtain sea ice thickness retrievals from CryoSat-2. A validation of these retrievals against Airborne Electromagnetic Measurements shows that SnowModel-LG_HS performed better when compared to SnowModel-LG and snow climatologies.


How to cite: Merkouriadi, I., Liston, G., and Salilla, H.: Quantifying the effect of snow and sea ice interactions on SnowModel-LG snow depth and density product, EGU General Assembly 2023, Vienna, Austria, 23–28 Apr 2023, EGU23-12357, https://doi.org/10.5194/egusphere-egu23-12357, 2023.

EGU23-12728 | ECS | Orals | CR7.4

Polar sea-salt aerosols in CMIP6 models 

Rémy Lapere, Jennie L. Thomas, Louis Marelle, Annica M. L. Ekman, Markus M. Frey, Marianne T. Lund, Risto Makkonen, Ananth Ranjithkumar, Matthew E. Salter, Bjørn H. Samset, Michael Schulz, Larisa Sogacheva, Xin Yang, and Paul Zieger

We present an inter-comparison of simulated sea-salt aerosols (SSA) in CMIP6 models, including an evaluation against station observations in the Artic and Antarctic regions and satellite data. Drivers of model diversity are investigated. Historical and future trends are also explored and connected to their driving mechanisms. Additionally, the sensitivity of the polar radiative budget to SSA in CMIP6 models is quantified and put in relation to present-day uncertainties and future trends. 

Comparisons suggest (i) a large inter-model spread in SSA surface concentrations mostly driven by the diversity in source functions, (ii) an important overestimation of SSA surface concentrations compared to measurement stations but reasonable agreement with optical depth from satellite data, (iii) difficulties in properly capturing the annual cycle of SSA at both poles, particularly at higher latitude. A generally increasing trend in SSA concentrations is found in CMIP6 over the last decades and in future scenarios. CMIP6 models show that SSA contribute to cooling the poles significantly, implying possible uncertainties of several W/m2 in the present-day polar radiative budget.

How to cite: Lapere, R., Thomas, J. L., Marelle, L., Ekman, A. M. L., Frey, M. M., Lund, M. T., Makkonen, R., Ranjithkumar, A., Salter, M. E., Samset, B. H., Schulz, M., Sogacheva, L., Yang, X., and Zieger, P.: Polar sea-salt aerosols in CMIP6 models, EGU General Assembly 2023, Vienna, Austria, 23–28 Apr 2023, EGU23-12728, https://doi.org/10.5194/egusphere-egu23-12728, 2023.

EGU23-13035 | Posters on site | CR7.4

Impact of sea-ice melt on DMS(P) inventories associated with algal community dynamics in Antarctic surface waters. 

Maria van Leeuwe, Jacqueline Stefels, Michael Meredith, and Alison Webb

The Southern Ocean is a hotspot of the climate-relevant organic sulphur compound dimethyl sulphide (DMS). Spatial and temporal variability in DMS concentration is higher than in any other oceanic region, especially in the marginal ice zone (MIZ). The MIZ is also an area of rich microalgal communities, including algal species that are renown for the production of dimethyl sulphoniopropionate (DMSP), the precursor of DMS. The link between DMS and microalgae has been studied closely over a five-year period (2012 to 2017) near Rothera Station in Ryder Bay (Western Antarctic Peninsula). Algal community structure and spatial heterogeneity of DMS and DMSP was studied and linked with environmental conditions, including sea ice melt. Concentrations of sulphur compounds, particulate organic carbon (POC) and chlorophyll a in the surface waters varied by orders of magnitude in time and space. Highest concentrations of DMS(P) were recorded in spring, associated with the dominance of autotrophic flagellates, including haptophytes and chlorophytes. These microalgae most likely originated from sea-ice communities, stressing the role of sea ice as a seeding vector for the spring bloom and as a potential source of DMS. The strong sea-ice signal in the distribution of haptophyte algal species and DMS(P) implies that DMS(P) production is likely to decrease with ongoing reductions in sea ice cover along the Western Antarctic Peninsula. This has implications for feedback processes on the region’s climate system.

How to cite: van Leeuwe, M., Stefels, J., Meredith, M., and Webb, A.: Impact of sea-ice melt on DMS(P) inventories associated with algal community dynamics in Antarctic surface waters., EGU General Assembly 2023, Vienna, Austria, 23–28 Apr 2023, EGU23-13035, https://doi.org/10.5194/egusphere-egu23-13035, 2023.

EGU23-13126 | Orals | CR7.4

A Climate Data Record of Global Sea-Ice Drift from the EUMETSAT OSI SAF 

Emily Down and Thomas Lavergne

Sea-ice drift is a key variable for understanding sea ice in a changing climate, and an Essential Climate Variable (ECV) product for the Global Climate Observing System (GCOS). In the Arctic, sea ice has been reported to drift faster in recent years (e.g. Rampal et al., 2009), associated with its reduction in area, thinning, and loss of multiyear ice. In the Antarctic, trends in sea-ice drift have been linked to trends in wind patterns (e.g. Hollands and Kwok, 2012). 

In this contribution, we present a new 30-year Climate Data Record (CDR) of global, year-round sea-ice drift vectors covering 1991 to 2020. This uses the continuous maximum cross-correlation technique (CMCC) for measuring sea-ice drift from pairs of brightness temperature images of passive microwave satellite missions (Lavergne et al., 2010). During summer, this technique becomes less accurate due to surface melting and higher atmospheric humidity. We therefore employ a parametric free-drift model to fill the data gaps in the summer. This model calculates the ice drift based on wind vectors from the ERA5 wind reanalysis, under the assumption that the internal stresses of the ice can be neglected. We describe the algorithm baseline for the new CDR as well as results of validation against the sparse network of on-ice buoy trajectories. We finally describe the merits and known limitations of the new data record. This CDR was created in the context of the EUMETSAT Ocean and Sea Ice Satellite Application Facility (OSI SAF) and is readily available at https://doi.org/10.15770/EUM_SAF_OSI_0012.

References:

Holland, P., Kwok, R. Wind-driven trends in Antarctic sea-ice drift. Nature Geosci 5, 872–875 (2012). https://doi.org/10.1038/ngeo1627

Lavergne, T., Eastwood, S., Teffah, Z., Schyberg, H., and Breivik, L.-A. (2010), Sea ice motion from low-resolution satellite sensors: An alternative method and its validation in the Arctic, J. Geophys. Res., 115, C10032, doi:10.1029/2009JC005958.

Rampal, P., Weiss, J., and Marsan, D. (2009), Positive trend in the mean speed and deformation rate of Arctic sea ice, 1979–2007, J. Geophys. Res., 114, C05013, doi:10.1029/2008JC005066.


How to cite: Down, E. and Lavergne, T.: A Climate Data Record of Global Sea-Ice Drift from the EUMETSAT OSI SAF, EGU General Assembly 2023, Vienna, Austria, 23–28 Apr 2023, EGU23-13126, https://doi.org/10.5194/egusphere-egu23-13126, 2023.

EGU23-13518 | ECS | Posters virtual | CR7.4

Association between extreme atmospheric anomalies over Antarctic sea ice, Southern Ocean polar cyclones and atmospheric rivers 

Ehlke Hepworth, Marcello Vichi, and Gabriele Messori

This study analyses the association of Southern Ocean extratropical cyclones and atmospheric rivers (ARs) with extreme temperature and/or moisture atmospheric anomalies over Antarctic sea ice. The hypothesis we test is whether the circulations associated with cyclones and ARs may routinely lead to the presence of unusually warm, moist airmasses over ice-covered regions. The analysis is conducted over the extended Austral winter seasons (May – September) between May 1979 and September 2012, based on the European Centre for Medium-Range Weather Forecasts Interim reanalysis data. Approximately 27% of intense Southern Ocean cyclones and 20% of ARs occur in the vicinity of extreme temperature anomalies, while 12% of intense cyclones and 46% of ARs occur in the vicinity of extreme moisture anomalies. We summarize our results as follows: (1) extreme atmospheric anomalies over sea ice often occur in the absence of cyclones or ARs; (2) intense cyclones have a stronger association with extreme temperature  anomalies than ARs; (3) approximately half of the ARs are in the vicinity of extreme moisture anomalies, while the latter’s link with cyclones is weak; (4) if an AR is in the vicinity of an extreme temperature anomaly, there will likely be a concurrent extreme moisture anomaly. This points to a strong association between ARs and moisture extremes, and a nuanced link between Southern Ocean polar cyclones and atmospheric anomalies over Antarctic sea ice.

How to cite: Hepworth, E., Vichi, M., and Messori, G.: Association between extreme atmospheric anomalies over Antarctic sea ice, Southern Ocean polar cyclones and atmospheric rivers, EGU General Assembly 2023, Vienna, Austria, 23–28 Apr 2023, EGU23-13518, https://doi.org/10.5194/egusphere-egu23-13518, 2023.

EGU23-14048 | ECS | Orals | CR7.4

Fram Strait Marine Cold Air Outbreaks and associated surface heat fluxes in the ERA5 & CARRA reanalyses 

Nils Slättberg, Marion Maturilli, and Sandro Dahlke

The rapidly transforming Svalbard and Fram Strait region is characterised by strong air-sea exchanges and represents a major gateway of oceanic and atmospheric transport between the Arctic and lower latitudes. In winter, Marine Cold Air Outbreaks (MCAOs) extract large amounts of energy from the ocean in the form of surface sensible and latent heat fluxes. We investigate how the spatiotemporal variability in Fram Strait MCAOs affects the heat fluxes in ERA5 and the novel Arctic reanalysis CARRA over ocean, sea-ice and land during November-March 1991-2020.

We find that the daily mean heat fluxes are strongly correlated with the MCAO index and that wind speed only plays a large role for the heat fluxes when the MCAO index is positive. The sensible heat flux from the surface to the atmosphere reaches greater values in CARRA than in ERA5 while the opposite is true for the latent heat flux. The difference between the reanalyses scale with the magnitude of the heat fluxes, leading to large disagreement over ice-free ocean, where the fluxes have their highest values. When accounting for the differences in magnitude, we find the largest disagreement between the reanalyses over sea ice. 

In addition, we find that although sea ice loss drives positive ocean-to-atmosphere heat flux trends around much of Svalbard, negative trends in the monthly mean heat fluxes are seen in Fram Strait during the winter, especially in January. These negative trends reflect the decline in the surface-atmosphere potential temperature difference which forms the basis for the MCAO index. 

Finally, we examine the vertical structure of the atmosphere during MCAOs and find anomalously northerly winds, low temperature and low specific humidity throughout the troposphere. The specific humidity anomalies are strongest at low altitudes over the ice-free ocean in southern Fram Strait, while the temperature anomalies reach their maximum in the vicinity of the ice edge. Over the ice-free ocean, where the heat fluxes warm the air from below, the strongest temperature anomalies are found around the altitude of the 800 hPa level.

How to cite: Slättberg, N., Maturilli, M., and Dahlke, S.: Fram Strait Marine Cold Air Outbreaks and associated surface heat fluxes in the ERA5 & CARRA reanalyses, EGU General Assembly 2023, Vienna, Austria, 23–28 Apr 2023, EGU23-14048, https://doi.org/10.5194/egusphere-egu23-14048, 2023.

EGU23-14090 | ECS | Orals | CR7.4

Assessing Performance of a new High Resolution polar regional climate model with remote sensing and in-situ observations: HCLIM in the Arctic and Antarctica 

Abraham Torres-Alavez, Oskar Landgren, Fredrik Boberg, Ole Bøssing Christensen, Ruth Mottram, Martin Olesen, Bert Van Ulft, Kristiina Verro, and Yurii Batrak

We present results from a new high resolution regional climate model, configured for both the Arctic and the Antarctic, assessed with a range of in-situ and remote sensing datasets. Under the Horizon 2020 PolarRES project, a set of simulations are performed at a spatial resolution of ~12 km over the Arctic and Antarctic regions using the latest version (cy43) of the HCLIM-ALADIN regional climate model. The model includes a thermodynamic sea ice scheme and has been updated with the latest ice sheet masks and improved topography and other physiographic fields. 

The model will be used to provide climate projections over the 100-year period 2001-2100 for two emission scenarios, and driven on the boundaries by General Circulation Models (GCMs) from the Coupled Model Inter-comparison Project (CMIP6). We also present and evaluate hindcast simulations for the period of 2001 to 2020 over both domains, forced by ERA5 on the boundaries. Model precipitation, temperature, sea ice, and other variables are evaluated with observations from automatic weather stations and satellite data in the polar regions, and additionally compared against the new high resolution (2.5km) Copernicus Arctic Regional ReAnalysis (CARRA) dataset. We also examine the effect of spectral nudging on simulation output. Preliminary results show that HCLIM improves on ERA5, capturing the precipitation, temperature, sea ice cover and ice sheet surface mass balance in both polar regions.

In addition, we show that the wealth of earth observation data now available via the ESA climate change initiative and the EUMETSAT climate data programmes are extremely useful tools to the regional climate modelling community. We use example scripts for model evaluation using EO data via an open repository and present user cases that can be replicated by other modelling groups. 

How to cite: Torres-Alavez, A., Landgren, O., Boberg, F., Christensen, O. B., Mottram, R., Olesen, M., Van Ulft, B., Verro, K., and Batrak, Y.: Assessing Performance of a new High Resolution polar regional climate model with remote sensing and in-situ observations: HCLIM in the Arctic and Antarctica, EGU General Assembly 2023, Vienna, Austria, 23–28 Apr 2023, EGU23-14090, https://doi.org/10.5194/egusphere-egu23-14090, 2023.

EGU23-14769 | Orals | CR7.4

DMS(P) distribution in Arctic sea ice related to algal community structure and ice dynamics – results from the MOSAiC expedition 

Jacqueline Stefels, Maria van Leeuwe, Deborah Bozzato, Alison Webb, and Ellen Damm

This presentation is a contribution to the Multidisciplinary drifting Observatory for the Study of Arctic Climate(MOSAiC) expedition. The MOSAiC field campaign took place on board of RV Polarstern, drifting with the Arctic sea ice, from October 2019 to October 2020. As partner of the MOSAiC team, our project contributed to the production of a time series of sulphur compounds in Arctic sea ice and underlying seawater. The aim of our project was to address how seasonality, sea ice dynamics and water characteristics in the Arctic Ocean affect the cycling of organic sulfur compounds. The sampling of sea ice and surface water was part of the concerted actions of the BGC, ICE and ECO teams during MOSAiC.

A crucial compound for organisms to survive the cold and saline environment of sea ice is the organic sulfur compound dimethylsulfoniopropionate (DMSP) that is mainly synthesized by algae. Between 1 and 10% of total primary production is invested in DMSP, thereby making it a key compound in the lower - and potentially also higher - trophic levels. DMSP is also the precursor of the climate active semi-volatile compound dimethylsulfide (DMS).

Our work combines measurements of concentrations of DMSP, DMS and the (photo-)oxidation product of DMS, dimethyl sulfoxide (DMSO), transformation rates of these compounds using stable isotope additions and identification of the microorganisms driving these processes.

In this presentation, we will show persistent features of DMS(P) distribution in vertical profiles of the MOSAiC floe; link these profiles to algal community structure and discuss the connection between ice and surface water DMS(P) concentrations. We will present a conceptual model of how the growth of sea ice in the Central Arctic Ocean results in specific DMS(P) distribution patterns.

How to cite: Stefels, J., van Leeuwe, M., Bozzato, D., Webb, A., and Damm, E.: DMS(P) distribution in Arctic sea ice related to algal community structure and ice dynamics – results from the MOSAiC expedition, EGU General Assembly 2023, Vienna, Austria, 23–28 Apr 2023, EGU23-14769, https://doi.org/10.5194/egusphere-egu23-14769, 2023.

EGU23-15723 | Posters on site | CR7.4

Towards a high-resolution MAR-NEMO coupling to explore atmosphere-ocean-ice interactions in the Arctic 

Clara Lambin, Christoph Kittel, and Xavier Fettweis

Arctic changes are at the centre of climate concerns. Notably, recent Arctic warming drives rapid sea ice decline making the Arctic increasingly vulnerable. To better anticipate the consequences of this strong Arctic warming, it is crucial to better understand the driving processes responsible for large uncertainties in future climate projections. Interactions at the atmosphere-ocean-sea ice interface require particular attention. In this context, the PolarRES project aims at developing the coupled system MAR (atmosphere) - NEMO (ocean-sea ice) over the Arctic region at high spatial resolution (25 km). Such coupling will enable the climate community to access precise data at large scale. Since this coupling has never been applied to the Arctic, a proper model evaluation is required. Here standalone model simulations are compared against a newly compiled dataset including land station and buoys data. We find high correlations between the modelled and observed data. Our evaluation marks an important step in in the ongoing development of coupled models.

How to cite: Lambin, C., Kittel, C., and Fettweis, X.: Towards a high-resolution MAR-NEMO coupling to explore atmosphere-ocean-ice interactions in the Arctic, EGU General Assembly 2023, Vienna, Austria, 23–28 Apr 2023, EGU23-15723, https://doi.org/10.5194/egusphere-egu23-15723, 2023.

EGU23-16224 | ECS | Posters on site | CR7.4

Stability of the winter-time Arctic Ocean boundary layer in CMIP6 climate models evaluated against Soviet drifting stations, SHEBA and MOSAiC observations 

Alistair Duffey, Robbie Mallet, Julia Steckling, Antoine Hermant, Victoria Dutch, Jonathan Day, and Felix Pithan

The atmospheric boundary layer in the Arctic winter is characterised by strong and long-lived low level stability which arises from long-wave radiative cooling of the surface during the polar night. This atmospheric temperature inversion is a necessary condition for the positive lapse rate feedback, which is a major contributor to Arctic Amplification. In this study, we assess the low-level stability of the winter-time Arctic boundary layer using ground-based and radiosonde observations collected during the MOSAiC (2019-2020) and SHEBA (1997-1998) expeditions, and from Soviet drifting stations (1955-1991). We compare these observations with the representation of Arctic boundary layer stability in models participating in the latest phase of the Coupled Model Intercomparison Project (CMIP6). The observations show a bimodal distribution of clear and cloudy states which has been reported previously. In the clear state, longwave radiative cooling from the surface leads to strong inversions and a stably stratified boundary layer. Whereas, in the cloudy state, inversions are weaker and not confined to the surface. Previous work has shown that many CMIP5-era climate models fail to realistically represent the cloudy state and often overestimate low-level stability. Here, we assess the extent to which the CMIP6 models also show such biases and examine the representation of surface net longwave radiation and turbulent heat fluxes as potential sources of the biases. Finally, we show that across CMIP6 models, low level stability over sea-ice is correlated with inter-model variation in Arctic amplification.

How to cite: Duffey, A., Mallet, R., Steckling, J., Hermant, A., Dutch, V., Day, J., and Pithan, F.: Stability of the winter-time Arctic Ocean boundary layer in CMIP6 climate models evaluated against Soviet drifting stations, SHEBA and MOSAiC observations, EGU General Assembly 2023, Vienna, Austria, 23–28 Apr 2023, EGU23-16224, https://doi.org/10.5194/egusphere-egu23-16224, 2023.

EGU23-16638 | ECS | Posters on site | CR7.4

High resolution atmospheric and oceanic modelling over Antarctica: a coupling interface to study sea-ice processes 

Damien Maure, Christoph Kittel, Clara Lambin, and Xavier Fettweis

Understanding the future evolution of the climate over Antarctica is crucial, as the continent holds the potential for a 3-meter rise in sea levels by 2300. However, the Antarctic climate is impacted by various processes and interactions, particularly at the ocean-atmosphere-sea ice interface, which are not fully implemented in Global Climate Models (GCMs). We are developing a high-resolution two-way coupling between the reginal climate model MARv3.13 and ocean/sea-ice model NEMO4.2/SI3 to study these processes, such as blowing snow over sea-ice, and their potential impact on future polar climate scenarios selected by the PolarRES consortium. We evaluated the standalone models' performance in simulating current climate conditions using various meteorological observations, satellite data, and ship observations. The results of this study are a first step to check the setup before moving to a fully coupled interface, and already show the importance of regional modelling to better resolve specific processes. 

How to cite: Maure, D., Kittel, C., Lambin, C., and Fettweis, X.: High resolution atmospheric and oceanic modelling over Antarctica: a coupling interface to study sea-ice processes, EGU General Assembly 2023, Vienna, Austria, 23–28 Apr 2023, EGU23-16638, https://doi.org/10.5194/egusphere-egu23-16638, 2023.

EGU23-17080 | ECS | Posters on site | CR7.4

Evaluating nudged coupled climate models against MOSAiC observations reveals weaknesses in the representation of clouds, boundary-layer turbulence and snow pack 

Felix Pithan, Marylou Athanase, Sandro Dahlke, Antonio Sánchez-Benítez, Matthew Shupe, Anne Sledd, Jan Streffing, Gunilla Svensson, and Thomas Jung

Comparing the output of general circulation models to observations is essential for assessing and improving the quality of models. While numerical weather prediction models are routinely assessed against a large array of observations, comparing climate models and observations usually requires long time series to build robust statistics.

Here, we show that by nudging the large-scale atmospheric circulation in coupled climate models, model output can be compared to local observations for individual days. We illustrate this for three climate models during a period in April 2020 when a warm air intrusion reached the MOSAiC expedition in the central Arctic. Radiosondes, cloud remote sensing and surface flux observations from the MOSAiC expedition serve as reference observations. The climate models AWI-CM1/ECHAM and AWI-CM3/IFS miss the diurnal cycle of surface temperature in spring, likely because both models assume the snow pack on ice to have a uniform temperature. CAM6, a model that uses three layers to represent snow temperature, represents the diurnal cycle more realistically. During a cold and dry period with pervasive thin mixed-phase clouds, AWI-CM1/ECHAM only produces partial cloud cover and overestimates downwelling shortwave radiation at the surface. AWI-CM3/IFS produces a closed cloud cover but misses cloud liquid water. All models overestimate downward turbulent heat fluxes under stable stratification, a long-standing issue in weather and climate models.

Our results show that nudging the large-scale circulation to the observed state allows a meaningful comparison of climate model output even to short-term observational campaigns. We suggest that nudging can simplify and accelerate the pathway from observations to climate model improvements and substantially extends the range of observations suitable for model evaluation.

How to cite: Pithan, F., Athanase, M., Dahlke, S., Sánchez-Benítez, A., Shupe, M., Sledd, A., Streffing, J., Svensson, G., and Jung, T.: Evaluating nudged coupled climate models against MOSAiC observations reveals weaknesses in the representation of clouds, boundary-layer turbulence and snow pack, EGU General Assembly 2023, Vienna, Austria, 23–28 Apr 2023, EGU23-17080, https://doi.org/10.5194/egusphere-egu23-17080, 2023.

EGU23-987 | ECS | Orals | OS1.5

Tracing Arctic outflow through the Fram Strait and its interaction with North Atlantic waters 

Dipanjan Dey, Robert Marsh, and Sybren Drijfhout

The Arctic region is warming four times quicker than the global average, a phenomenon known as the Arctic amplification. Some studies suggested that this warming may lead to seasonally ice-free Arctic Ocean by 2050 which will have potentially devastating consequences for Arctic oceanography, marine ecosystems and the Atlantic Meridional Overturning Circulation (AMOC). The relation between the slowdown of the AMOC and the Arctic Ocean is believed to be linked with enhanced freshwater outflow primarily through the Fram Strait which increases the stratification over sites of deep convection in the Irminger Sea. Earlier studies have also confirmed a link between deep water formation and freshwater release from the Arctic. In the current study, our objectives are to understand how and where the Arctic outflow is changing temperature, salinity and density, moving into the North Atlantic, during the historical period and in a warmer future climate. We use the Lagrangian parcel tracing algorithm, TRACMASS, to trace both the southward flows from Fram Strait and North Atlantic flows into the Nordic Sea. The results quantify how and where Arctic outflow increases temperature and salinity, and decreases density, in transit. This is primarily associated with mixing between the cold, fresh outflow and the relatively warmer, saltier Atlantic waters at Denmark Strait, despite some surface cooling in transit from Fram to Denmark Straits that is due to net surface heat loss and sea ice melting.

How to cite: Dey, D., Marsh, R., and Drijfhout, S.: Tracing Arctic outflow through the Fram Strait and its interaction with North Atlantic waters, EGU General Assembly 2023, Vienna, Austria, 23–28 Apr 2023, EGU23-987, https://doi.org/10.5194/egusphere-egu23-987, 2023.

EGU23-1169 | ECS | Orals | OS1.5

Improved simulation of extratropical North Atlantic atmosphere-ocean variability in HighResMIP models 

Casey Patrizio, Panos Athanasiadis, Claude Frankignoul, Dorotea Iovino, Simona Masina, Luca Famooss Paolini, and Silvio Gualdi

The simulated North Atlantic atmosphere­–ocean variability is assessed in a subset of models from HighResMIP that have either low-resolution (LR) or high-resolution (HR) in their atmosphere and ocean model components. In general, the LR models overestimate the low-frequency variability of subpolar sea-surface temperature (SST) anomalies and underestimate their correlation with the NAO compared to ERA5 reanalysis. These biases are substantially reduced in the HR models, and it is shown that the improvements are related to a reduction of intrinsic (non-NAO-driven) variability of the subpolar ocean circulation.

To understand the mechanisms behind the overestimated intrinsic subpolar ocean variability in the LR models, a link is demonstrated between the biases in subpolar ocean variability and known biases in the mean state of the Labrador-Irminger seas. Supporting previous studies, the Labrador-Irminger seas are found to be too cold and too fresh in the LR models compared to observations from EN4 and the HR models. This causes upper-ocean density and hence convection anomalies in this region to be more salinity-controlled in the LR models versus more temperature-controlled in the HR models. It is hypothesized that this may cause the excessive subpolar ocean variability in the LR models by 1) promoting a positive feedback between subpolar upper-ocean salinity, convection and Atlantic Meridional Overturning Circulation (AMOC) anomalies, and 2) weakening the negative feedback between subpolar upper-ocean temperature, convection and AMOC anomalies that is apparent in the HR models. The results overall suggest that mean ocean biases play an important role in the simulation of the variability of the extratropical ocean.

How to cite: Patrizio, C., Athanasiadis, P., Frankignoul, C., Iovino, D., Masina, S., Famooss Paolini, L., and Gualdi, S.: Improved simulation of extratropical North Atlantic atmosphere-ocean variability in HighResMIP models, EGU General Assembly 2023, Vienna, Austria, 23–28 Apr 2023, EGU23-1169, https://doi.org/10.5194/egusphere-egu23-1169, 2023.

Climate models are a valuable tool to study the interaction between ocean and atmosphere. Nevertheless, they are known to suffer from various biases and uncertainties. In the subpolar North Atlantic typical biases among models from the Coupled Model Intercomparison Project phase 6 (CMIP6) are found in the mean surface temperature and salinity, and in the mean sea ice concentration. These biases will affect the air-sea interaction.

In this study, we are investigating the diversity of CMIP6 models with respect to their response of the Atlantic Meridional Overturning Circulation (AMOC) to the North Atlantic Oscillation (NAO) in pre-industrial control experiments. This response is sensitive to the mean spiciness of the North Atlantic. Thus, we focus on two categories of models: Models that are spicy (warm-salty) and models that are minty (cold-fresh) within the subpolar gyre of the North Atlantic. Spicy models tend to have a lower sea ice cover in the Labrador Sea (LS) and larger LS heat loss during a positive NAO, compared to minty models. Also, spicy models have a weaker stratification in the LS. Sub-surface density changes 1 to 3 years after the NAO are larger in the spicy models and establish a zonal density gradient that can cause a stronger delayed AMOC response that is also more coherent across latitudes.

Although some metrics seem to be more realistic in the spicy models, other characteristics seem less realistic compared to the minty models, like the mixed layer depth relative importance between the eastern and the western subpolar North Atlantic. This could be a sign for how some mean states or processes might be right for the wrong reasons and stresses the need for model improvement.

How to cite: Reintges, A., Robson, J., Sutton, R., and Yeager, S.: Spiciness of the subpolar North Atlantic affects the response of the Atlantic Meridional Overturning Circulation to the North Atlantic Oscillation in CMIP6 models, EGU General Assembly 2023, Vienna, Austria, 23–28 Apr 2023, EGU23-1249, https://doi.org/10.5194/egusphere-egu23-1249, 2023.

EGU23-1359 | ECS | Orals | OS1.5

A Lagrangian study on the structure and pathways of the Irminger Current 

Nora Fried, Caroline A. Katsman, and M. Femke de Jong

The Irminger Current (IC), located over the western flank of the Reykjanes Ridge, is a contributor to the northward volume transport related to the Atlantic Meridional Overturning Circulation.

Previous studies showed that the IC is associated with a region of enhanced eddy kinetic energy. Using high-resolution mooring data from 2014 – 2020 combined with satellite altimetry, a strong intensification in volume transport of the IC in August 2019 could be attributed to the presence of mesoscale eddies in the vicinity of the moorings. At this time, altimetry showed an anticyclone lingering next to a cyclone in the mooring array, which intensified northward velocities within the IC. This example shows that mesoscale variability can directly impact the transport variability of the IC.

Further research presented here uses the high-resolution model POP (Parallel Ocean Program, 1/10°) to investigate the pathways of the IC up- and downstream of the mooring array. Here, the focus lies on determining the origin of waters feeding the IC and the role of mesoscale eddies in shaping the current and its pathways using Lagrangian particle tracking with the Ocean Parcels software. First results from a backtracking experiment reveal different origins for the water masses feeding the respective cores of the IC. Waters of the eastern core mostly originate from the eastern side of the Reykjanes Ridge. The western core appears to contain a substantial amount of waters from the interior Irminger Sea that partly recirculate from the Labrador Sea.

Additionally, we explore the mesoscale variability within the whole eastern Irminger Sea to investigate the potential impact of mesoscale eddies on restratification in the central Irminger Sea.  We focus on identifying the characteristics of variability along the ridge using the output of the Lagrangian particle tracking in POP. First results from a forward experiment show stronger mesoscale activity in the western core than the eastern core, which is in line with available mooring observations.

How to cite: Fried, N., Katsman, C. A., and de Jong, M. F.: A Lagrangian study on the structure and pathways of the Irminger Current, EGU General Assembly 2023, Vienna, Austria, 23–28 Apr 2023, EGU23-1359, https://doi.org/10.5194/egusphere-egu23-1359, 2023.

EGU23-1639 | ECS | Posters on site | OS1.5

Impacts of AMOC slowdown on European circulation patterns 

Andrea Vito Vacca, Katinka Bellomo, and Jost von Hardenberg

The Atlantic meridional overturning circulation (AMOC) is a vital component of the global climate system regulating heat, carbon, and freshwater distribution. Most models predict a weakening of the AMOC throughout the 21st century, although there is significant uncertainty about its magnitude and the related regional climate impacts. In particular, the response of large-scale atmospheric circulation to the AMOC slowdown is still largely unknown, with implications for weather extremes and associated societal risks. The purpose of this study is to enhance our understanding of the impacts of an AMOC slowdown on atmospheric patterns with a focus on the Euro-Atlantic region, where the influence of AMOC is particularly relevant.

We analyse changes in an ensemble of idealised abrupt-4xCO2 climate model simulations from the CMIP archives with respect to the preindustrial climate. We split the models into groups according to their AMOC response to the 4xCO2. Through rigorous statistical testing, we attribute the differences in the simulated climate impacts to the difference in the AMOC response. Specifically, we find that models that simulate a larger AMOC decline feature minimum warming in the subpolar North Atlantic (North Atlantic Warming Hole or NAWH), a southward shift of the ITCZ, and a poleward strengthening of the mid-latitude jet stream. Instead, models that simulate a smaller AMOC decline feature enhanced North Atlantic warming, an intensification of the hydrological cycle but no southward shift in the ITCZ, and smaller displacements of the mid-latitude jet.  

To better characterize the large-scale atmospheric response at daily timescales, we use k-means clustering and self-organising maps to assess the changes in weather regimes over the Euro-Atlanic sector, including the NAO.  We further compare weather regimes’ frequency of occurrence and persistence between the two groups, attributing the differences to the AMOC decline. 

Our results indicate that the AMOC is a key source of large inter-model uncertainty in the simulation of future climate change impacts. Further observational campaigns may thus help us alleviate model biases and provide constraints on a number of societally relevant climate change impacts.

How to cite: Vacca, A. V., Bellomo, K., and von Hardenberg, J.: Impacts of AMOC slowdown on European circulation patterns, EGU General Assembly 2023, Vienna, Austria, 23–28 Apr 2023, EGU23-1639, https://doi.org/10.5194/egusphere-egu23-1639, 2023.

EGU23-1796 | Orals | OS1.5

Intermittent Behavior in the AMOC-AMV Relationship  

Alessio Bellucci, Denis Mattei, Paolo Ruggieri, and Luca Famooss Paolini

The connection between the Atlantic meridional overturning circulation (AMOC) and the Atlantic multidecadal variability (AMV) is inspected in a suite of pre-industrial integrations from the 6th phase of the Coupled Model Inter-comparison Project (CMIP6), using a change-point detection method to identify different AMOC-AMV co-variability regimes. A key finding of this study is that models robustly simulate multi-decadal windows where the AMV and the AMOC are essentially uncorrelated. These regimes coexist with longer periods with relatively high correlation. Drops and recoveries of correlation are found to be often abrupt and confined in a temporal window of the order of 10 years. Phenomenological evidence suggests that the no-correlation regimes may be explained by drops in the variance of the AMOC: a less variable meridional heat transport leads to a suppressed co-variability of the AMV, leaving a larger role for non-AMOC drivers, consistent with a non-stationary AMOC-stationary noise interpretative framework.

How to cite: Bellucci, A., Mattei, D., Ruggieri, P., and Famooss Paolini, L.: Intermittent Behavior in the AMOC-AMV Relationship , EGU General Assembly 2023, Vienna, Austria, 23–28 Apr 2023, EGU23-1796, https://doi.org/10.5194/egusphere-egu23-1796, 2023.

EGU23-1821 | Orals | OS1.5

Deep Ocean Circulation in the Subpolar North Atlantic Observed by Acoustically-tracked Floats 

Sijia Zou, Amy Bower, M. Susan Lozier, and Heather Furey

As part of the Overturning in the Subpolar North Atlantic Program, 122 acoustically-tracked subsurface floats were deployed at 1800-2800 dbar to understand the deep ocean circulation in the subpolar North Atlantic. Gridded mean velocity and eddy kinetic energy (EKE) maps have been constructed using velocity vectors derived from the floats. The mean velocity field reveals a relatively strong deep boundary current around Greenland and in the Labrador Sea, with a weaker deep boundary current over the eastern flank of the Reykjanes Ridge, and near-zero mean flow over the western flank, implying a discontinuous deep boundary current across the subpolar basin. Over most of the subpolar basin, deep EKE resembles that at surface, albeit with smaller magnitudes. A surprising finding about deep EKE is an elevated EKE band east of Greenland. This high EKE band is possibly attributed to the combined influence from propagating Denmark Strait Overflow Cyclones, variability of the wind-driven recirculation offshore of southeast Greenland, and/or topographic waves. The float-based flow fields constructed in this study provide an unprecedented view on the kinematic properties of the large-scale deep circulation in the subpolar North Atlantic.

How to cite: Zou, S., Bower, A., Lozier, M. S., and Furey, H.: Deep Ocean Circulation in the Subpolar North Atlantic Observed by Acoustically-tracked Floats, EGU General Assembly 2023, Vienna, Austria, 23–28 Apr 2023, EGU23-1821, https://doi.org/10.5194/egusphere-egu23-1821, 2023.

EGU23-2035 | ECS | Orals | OS1.5

A Lagrangian view of seasonal overturning variability in the eastern North Atlantic subpolar gyre. 

Oliver J. Tooth, Helen L. Johnson, Chris Wilson, and Dafydd G. Evans

The Atlantic Meridional Overturning Circulation (AMOC) plays a critical role in the global climate system through the uptake and redistribution of heat, freshwater and carbon. At subpolar latitudes, recent observations show that the strength of the AMOC is dominated by water mass transformation in the eastern North Atlantic Subpolar Gyre (SPG). Both observations and ocean reanalyses show a pronounced seasonality of the AMOC within this region. However, the distribution of the strength and seasonality of overturning across the individual circulation pathways of the eastern SPG remains poorly understood. To investigate the nature of this seasonal overturning variability, we use Lagrangian water parcel trajectories evaluated within an eddy-permitting ocean sea-ice hindcast simulation.

By introducing a novel Lagrangian measure of the density-space overturning, we show that water mass transformation along the circulation pathways of the eastern SPG accounts for 8.9 ± 2.2 Sv (55%) of the mean strength of AMOC in the eastern subpolar North Atlantic. Our analysis highlights the crucial role of water parcel recirculation times in determining the magnitude of the strength and seasonality of overturning. We find that upper limb water parcels flowing northwards into the eastern SPG participate in a recirculation race against time to avoid wintertime diapycnal transformation into the lower limb of the AMOC. Upper limb water parcels sourced from the central and southern branches of the North Atlantic Current typically recirculate on interannual timescales (1-5 years) and thus determine the mean strength of overturning within this region. The seasonality of Lagrangian overturning is explained by a small collection of water parcels, recirculating rapidly (≤ 8.5 months) in the upper Central Iceland and Irminger Basins, whose along-stream transformation is dependent on their month of arrival into the eastern SPG.

How to cite: Tooth, O. J., Johnson, H. L., Wilson, C., and Evans, D. G.: A Lagrangian view of seasonal overturning variability in the eastern North Atlantic subpolar gyre., EGU General Assembly 2023, Vienna, Austria, 23–28 Apr 2023, EGU23-2035, https://doi.org/10.5194/egusphere-egu23-2035, 2023.

EGU23-2777 | ECS | Orals | OS1.5

Impacts of Atlantic Multi-decadal Variability on the mid-latitude atmosphere 

Matthew Patterson and Tim Woollings

The large amplitude of low-frequency sea surface temperature (SST) variability in the North Atlantic, often known as Atlantic Multi-decadal Variability (AMV), raises the question of what impact this phenomenon has on atmospheric circulation. However, the coupled nature of AMV, makes disentangling the influence of the ocean on the atmosphere and that of the atmosphere on the ocean, challenging. This problem is further confounded by the relatively short observational record, when considering decadal to multi-decadal timescales.

To address this, we utilize information from both SSTs and ocean-atmosphere turbulent heat fluxes,  in a single index, to separate the influences that the ocean and atmosphere have on one another. This technique is then applied to both free-running coupled simulations and observations. This methodology will help further our understanding of North Atlantic variability on long timescales.

How to cite: Patterson, M. and Woollings, T.: Impacts of Atlantic Multi-decadal Variability on the mid-latitude atmosphere, EGU General Assembly 2023, Vienna, Austria, 23–28 Apr 2023, EGU23-2777, https://doi.org/10.5194/egusphere-egu23-2777, 2023.

EGU23-2883 | ECS | Orals | OS1.5

The Atlantic meridional overturning circulation at 35N from deep moorings, floats, and satellite altimeter 

Isabela Le Bras, Joshua Willis, and Ian Fenty

From 2004 to 2014, the Line W moorings measured a 0.7 Sv/yr slowing of the Deep Western Boundary Current (DWBC) offshore of Cape Cod, Massachusetts. Here, we combine these deep mooring observations with float and satellite altimeter data and find that this DWBC change corresponded to a slowing of the cross-basin Atlantic Meridional Overturning Circulation (AMOC) of about 0.3 Sv/yr. Our AMOC transport time series corresponds well with the ECCO state estimate, particularly when the Line W mooring data influences our reconstruction of upper ocean volume fluxes. We compare our 35N time series with a similar time series at 41N as well as with the 26N RAPID AMOC, and find AMOC declines across datasets during this time period. The relative magnitudes of these declines are consistent with interdecadal variability originating in the Labrador Sea. We find that though our integrated overturning estimate agrees well with ECCO, the structure of the deep flow differs substantially. While we cannot rule out a decreasing AMOC trend during the 20th century, we find that natural variability is too large to detect a net AMOC decrease in direct observations or the ECCO ocean model since 2004.

How to cite: Le Bras, I., Willis, J., and Fenty, I.: The Atlantic meridional overturning circulation at 35N from deep moorings, floats, and satellite altimeter, EGU General Assembly 2023, Vienna, Austria, 23–28 Apr 2023, EGU23-2883, https://doi.org/10.5194/egusphere-egu23-2883, 2023.

EGU23-3118 | ECS | Posters on site | OS1.5

Climate response to Atlantic meridional energy transport variations 

Weimin Jiang, Guillaume Gastineau, and Francis Codron

The climate impacts of fluctuations in the Atlantic meridional overturning circulation (AMOC) are studied using an atmosphere-ocean general circulation model (AOGCM). In two experiments, the baroclinic component of the North Atlantic Ocean currents is modified online to reproduce typical strong and weak AMOC conditions found in a preindustrial control simulation using the same model. These experiments are compared with slab ocean model (SOM) experiments that use heat flux corrections from the coupled model in the Atlantic Ocean. The main impacts of a strong AMOC include widespread warming in the Northern Hemisphere and a northward shift of the intertropical convergence zone (ITCZ). SOM experiments show similar atmospheric responses to AMOC-related heat flux anomalies, but with much larger impacts in the tropics. 
The atmospheric changes are driven by an anomalous cross-equatorial Hadley circulation transporting energy southward and moisture and heat northward. In the AOGCM, changes in the Indo-Pacific Ocean circulation and heat transport, driven by the wind stress associated with the abnormal Hadley cell, damp the atmospheric response. In the SOM simulations, the lack of Indo-Pacific transport and of ocean heat storage leads to larger atmospheric changes, that are further amplified by a positive tropical low cloud feedback. 

How to cite: Jiang, W., Gastineau, G., and Codron, F.: Climate response to Atlantic meridional energy transport variations, EGU General Assembly 2023, Vienna, Austria, 23–28 Apr 2023, EGU23-3118, https://doi.org/10.5194/egusphere-egu23-3118, 2023.

We investigated wintertime convection evolution in the past two decades over the Greenland Sea. This area is a major location regarding dense water production and supply of the lower limb of the Atlantic Meridional Overturning Circulation, a key component of the global climate.
Previous studies mentioned an increase in Greenland Sea wintertime convection intensity during the 2000s in comparison with the previous decade till the mid 2010s. Here, we further document the ongoing oceanic changes within the Greenland Sea using the Mercator Ocean Physical System, an operational ocean model with data-assimilation.
The model shows a large interannual variability, a later start and a decline of convection in the Greenland Sea in recent years. In particular, the depth of the annual maximum mixed layer diminished by 52 % between 2008/2014 and 2015/2020, from 1168 m to 559 m, over the convective area. There, hydrographic changes, especially a temperature increase, have led to isopycnal deepening and stratification strengthening at a larger rate in the north and east of the area (namely the Boreas Basin).
Atlantic Water spreading over the Boreas Basin and the eastern part of the Greenland Basin contributes to the changes of the Greenland Sea hydrography. The model also indicates a decrease in the intensity of the gyre in accordance with the isopycnal deepening while local surface winds and fluxes do not exhibit neither significant trends nor significant interannual variations.

How to cite: abot, L.: Recent Convection Decline in the Greenland Sea - insights from the Mercator Ocean System over 2008-2020, EGU General Assembly 2023, Vienna, Austria, 23–28 Apr 2023, EGU23-3170, https://doi.org/10.5194/egusphere-egu23-3170, 2023.

EGU23-3197 | Posters virtual | OS1.5

Restratification Structure and Processes in the Irminger Sea 

Femke de Jong and Miriam Sterl

The Irminger Sea is one of the few regions in the ocean where deep (>1,000 m) convection
occurs. Convection is followed by restratification during summer, when the stratification of the water column
is reestablished and the convectively formed water is exported at depth. There are currently no descriptions
of interannual variability and physical drivers of restratification in the Irminger Sea. We investigate
restratification in the upper 600 m of the central Irminger Sea using reanalysis data for the years 1993–2019.
We find distinctly different restratification processes in the upper 100 m (the upper layer) and the water below
it (the lower layer). In the upper layer, the stratification is dominated by a seasonal cycle that matches the cycle
of the surface heat flux. In 2010 and 2019, there were peaks in upper layer restratification, which could partly
be related to strong atmospheric heat and freshwater fluxes. Greenland runoff likely also contributed to the
high restratification, although this contribution could not be quantified in the present study. In the lower layer
there is strong interannual variability in stratification, caused by variability both in the convection and the
restratification strength. The restratification strength is strongly correlated with the eddy kinetic energy in the
eastern Irminger Sea, suggesting that lower layer restratification is driven by lateral advection of warm, saline
waters through Irminger Current eddies. In the future, surface warming and freshening of the Irminger Sea
due to anthropogenic climate change are expected to increase upper layer stratification, potentially inhibiting
convection.

How to cite: de Jong, F. and Sterl, M.: Restratification Structure and Processes in the Irminger Sea, EGU General Assembly 2023, Vienna, Austria, 23–28 Apr 2023, EGU23-3197, https://doi.org/10.5194/egusphere-egu23-3197, 2023.

Subpolar and high-latitude regions of the North Atlantic are subject to changing buoyancy and mechanical forcing, alongside changing heat and freshwater exchanges with subtropical and polar regions. Associated changes in water mass formation and circulation are accompanied by changes in upper ocean stratification, of consequence for the large-scale ocean circulation, air-sea interaction, and ocean biogeochemistry. Changes in water mass volumes, and the associated overturning circulation, have been extensively evaluated with the water mass transformation (WMT) framework. Changes in stratification may be quantified with the Potential Energy Anomaly (PEA) framework, which has been extensively applied to seasonally stratified shelf sea environments. The WMT and PEA frameworks in combination provide complementary and holistic insights, for understanding hydrographic changes in relation to selected drivers. These frameworks are used with high-resolution model ocean datasets, obtained from hindcast and coupled simulations, the latter in control mode and forced by rising greenhouse gas concentrations through the 20th and 21st centuries. For selected sub-regions of the subpolar North Atlantic, bound by OSNAP and neighbouring hydrographic sections, mapped stratification (PEA) anomalies are related to respective changes in surface heat and freshwater fluxes. Residual differences between buoyancy-forced and full PEA tendencies are attributed to vertical mixing and divergences of heat and freshwater transports. Changes in regional stratification are evaluated alongside corresponding rates of water mass transformation and associated volumetric variability, for selected water masses. Eulerian perspectives provided by the WMT and PEA frameworks further complement Lagrangian perspectives provided by particle tracking. In full combination, these diagnostics elucidate multiple drivers of change in the North Atlantic that have potentially far-reaching consequences for the wider Earth System.

How to cite: Marsh, R., Dey, D., and Drijfhout, S.: Evaluating recent and future changes in North Atlantic stratification with complementary energetics and water mass frameworks, EGU General Assembly 2023, Vienna, Austria, 23–28 Apr 2023, EGU23-3476, https://doi.org/10.5194/egusphere-egu23-3476, 2023.

Winter (December-March) temperatures in most Europe is strongly correlated with the zonal circulation index of the Atlantic sector, North Atlantic Oscillation (NAO), regardless of which from its several available definitions to choose. However, the variability of this index also has a distinct multi-decade component, which makes it difficult to study trends of several decades. In addition, the NAO index itself is also significantly positively correlated with the global anthropogenic forcing and with the global temperature itself. Therefore, using purely statistical methods, it is not easy to distinguish the influence of zonal circulation variability from the trend resulting from the increasing forcing of greenhouse gases when examining the variability of winter temperatures in Europe.

Because of the prevailing western circulation, wintertime temperature in Europe should dpend on the intensity of the western circulation (NAO) as well as the sea surface temperature (SST) of the ocean (indexed by AMO – Atlantic Multidecadal Oscillation). However winter is the only season when there is no statistically significant correlation of AMO and temperatures in Europe. This surprising result had no explanation until the recent discovery of the northern shift of synoptic systems correlated with AMO. This could offer a “Bjerknes compensation” type of effect where the ocean circulation modifies the atmospheric one, making the air masses arriving in winter to Europe sourced in areas of the same SST, regardless of AMO (or general warming of the North Atlantic).

This study uses the data on SST and pressure fields as well as the NAO and AMO, together with an index if temperatures of Poland (as a proxy of Central Europe) in order to throw light on the relationship. The results confirm the existence of a “Bjerknes compensation” mechanism as well as suggest a dependence of wintertime NAO on the greenhouse forcing (visible in their significant correlation), caused most probably by the recently discovered strengthening of wintertime jet stream over the North Atlantic. This relationship can have important impact on future winter temperatures in a large part of Europe and therefore its possible mechanisms should be the point of further research.


This work been performed as a part of the SURETY project , funded by Polish National Science Centre (NCN), contract 2021/41/B/ST10/00946.


How to cite: Piskozub, J.: Is the North Atlantic modulating wintertime influence of NAO on Europe temperatures?, EGU General Assembly 2023, Vienna, Austria, 23–28 Apr 2023, EGU23-3850, https://doi.org/10.5194/egusphere-egu23-3850, 2023.

Variability of the Atlantic Meridional Overturning Circulation (MOC) has drawn extensive attention due to the MOC’s impact on global heat and freshwater redistribution. The Overturning in the Subpolar North Atlantic Program (OSNAP) array, consisting of an OSNAP West section covering the Labrador Sea and an OSNAP East section covering the eastern subpolar basins (Irminger and Iceland Basins), has continuously observed the MOC and meridional heat and freshwater transports since 2014. The OSNAP observations have contributed substantially to the understanding of the mean state and sub-seasonal to seasonal variability of the subpolar MOC. In this study, we present the latest OSNAP observational results and investigate interannual variability of the subpolar MOC with respect to water mass transformation and formation in the Labrador Sea and eastern subpolar basins. We detail the differences between formation and transformation in each of these basins and discuss their relationships to overturning on monthly and interannual time scales. Finally, we explore the mechanism(s) responsible for these differences.

How to cite: Fu, Y. and Lozier, M. S.: Interannual variability of the meridional overturning circulation in the subpolar North Atlantic, EGU General Assembly 2023, Vienna, Austria, 23–28 Apr 2023, EGU23-4077, https://doi.org/10.5194/egusphere-egu23-4077, 2023.

EGU23-4340 | Orals | OS1.5

Model Biases in the AMOC Stability Indicator 

René van Westen and Henk Dijkstra

The Atlantic Meridional Overturning Circulation (AMOC) is considered to be a multi-stable system with a northward overturning and a southward overturning circulation state. It has been proposed that the stability of the AMOC system can be represented through the net freshwater transport at 34°S (the Atlantic's southern boundary), the so-called Fov index. For example when AMOC transports net freshwater out of the Atlantic sector at 34°S (Fov < 0), freshwater (i.e., salinity) perturbations may grow over time through the salt-advection feedback which eventually can induce a state transition. Present-day observations indicate that Fov is negative and  hence the present-day AMOC is in its multi-stable regime.

AMOC state transitions have regional and global impacts and it is therefore important to study the AMOC stability under climate change. However, most climate models have a tendency of simulating a positive Fov index, implying that the AMOC is too stable in these climate model simulations. Here we analyse Fov-related biases using a high-resolution and a low-resolution model version of the Community Earth System Model (CESM). Under constant pre-industrial conditions, the Fov index drifts from negative values to positive values over a 300-year simulation period. The Fov biases are related to biases in the E-P fluxes, freshwater runoff from Greenland, Agulhas leakage, Southern Ocean deep convection and the (meridional) location of the Antarctic Circumpolar Current front. These numerous processes contributing to Fov are responsible the difficulty in simulating realistic AMOC behaviour in climate model simulations. The implication is that climate models with an inconsistent Fov index are not fit for purpose in making AMOC projections.

How to cite: van Westen, R. and Dijkstra, H.: Model Biases in the AMOC Stability Indicator, EGU General Assembly 2023, Vienna, Austria, 23–28 Apr 2023, EGU23-4340, https://doi.org/10.5194/egusphere-egu23-4340, 2023.

EGU23-5053 | ECS | Orals | OS1.5

Meridional Connectivity of a 25-year Observational AMOC Record at 47°N 

Simon Wett, Monika Rhein, Dagmar Kieke, Christian Mertens, and Martin Moritz

The Atlantic Meridional Overturning Circulation (AMOC) plays a key role for the climate system of Europe and the Arctic by redistributing heat and freshwater in the Atlantic. Since climate model studies project a likely decline of the AMOC under climate change in the 21st century, monitoring AMOC changes remains an important task. Several moored arrays in the Atlantic deliver estimates of the AMOC volume transport. The longest of these observational AMOC records is the RAPID array in the subtropical North Atlantic. The depiction of the AMOC as a global ocean conveyor assumes that the AMOC variability is consistent across latitudes. This concept has been questioned by model studies. However, model studies and estimates based on altimetry and Argo data disagree on the regions and timescales of meridional connectivity. From measurements of the North Atlantic Changes (NOAC) array in the subpolar North Atlantic at 47°N we calculate the AMOC volume transport timeseries. Our approach combines data from moored instruments with hydrography (from Argo floats and shipboard measurements) and satellite altimetry. Here, we present this 25-year (1993-2018) purely observational AMOC record in monthly resolution and analyze its meridional connectivity with the subtropical RAPID AMOC.

How to cite: Wett, S., Rhein, M., Kieke, D., Mertens, C., and Moritz, M.: Meridional Connectivity of a 25-year Observational AMOC Record at 47°N, EGU General Assembly 2023, Vienna, Austria, 23–28 Apr 2023, EGU23-5053, https://doi.org/10.5194/egusphere-egu23-5053, 2023.

EGU23-5281 | ECS | Orals | OS1.5

Decadal Variability of Transports through Barents Sea Opening: Changing impact of Large-Scale Wind Forcing 

Finn Ole Heukamp, Lars Aue, and Torsten Kanzow

The Barents Sea Opening (BSO) is one of two Atlantic gateways connecting the North Atlantic Ocean to the Arctic Ocean. The ocean transport through the BSO is composed of warm and saline Atlantic Water inflow in the central and southern parts of the section and cold Polar and modified Atlantic Water outflow in the north. The variability of strengths of both inflow and outflow largely controls the evolution of the net ocean heat transport into the Barents Sea, locally impacting e.g., ocean-atmosphere heat fluxes, sea ice extent, and deep-water formation. Moreover, changes in heat fluxes and sea ice extent have been shown to impact remote properties such as wintertime weather in northern Europe and water properties in the central Arctic Ocean.


In this study, we identified and disentangled the contributions of local and remote atmospheric forcing mechanisms of the wintertime volume transport through BSO from 1970-2020. In order to understand the variability and co-variability of the local and remote forcing mechanisms and the linked transport anomalies, we performed dedicated model experiments with the unstructured ocean and sea ice model FESOM2. In addition to a hindcast control simulation using JRA55 reanalysis forcing, we performed two additional model experiments in which we combined JRA55 forcing with CORE1 normal year forcing in a way that the simulations are forced with JRA55 (CORE1) in the Arctic domain and CORE1 (JRA55) outside the Arctic domain. This setup allows the separation of local and upstream forced transport variability. Our experiments show, that both BSO inflow and outflow exhibit strong variability on interannual to decadal timescales. While inflow variability is forced to a similar degree by local alongshore winds and alongshore winds upstream in the Norwegian Sea, the outflow variability is almost entirely forced by wind stress curl anomalies over the northern Barents Sea shelf. Moreover, the inflow anomalies forced upstream are highly correlated with the North Atlantic Oscillation (NAO) while the transport anomalies forced locally exclusively correlate with the NAO during periods of a negative NAO. Furthermore, we observe a drastic drop in the correlation of inflow anomalies forced upstream and the NAO around the year 2000 - the same period in which winters with strongly enhanced outflow anomalies (97/98, 03/04) are found. By expanding our analysis to cyclone activity in the northern North Atlantic, we link the loss of co-variability of NAO and BSO inflow to an anomalous southward deflection of cyclones in these winters, affecting the alongshore winds in the Norwegian Sea as well as the wind stress curl over the northern Barents Sea shelf.


In general, this study aims to improve our understanding of the drivers of volume and heat transport variability in the BSO as a key factor for (sub-)Arctic, ocean, weather, and climate variability. 

How to cite: Heukamp, F. O., Aue, L., and Kanzow, T.: Decadal Variability of Transports through Barents Sea Opening: Changing impact of Large-Scale Wind Forcing, EGU General Assembly 2023, Vienna, Austria, 23–28 Apr 2023, EGU23-5281, https://doi.org/10.5194/egusphere-egu23-5281, 2023.

EGU23-5422 | ECS | Posters on site | OS1.5

Argo-based anthropogenic carbon concentration and inventory in the Labrador and Irminger Seas over 2011-2021 

Rémy Asselot, Lidia I. Carracedo, Virginie Thierry, Herlé Mercier, Anton Velo, Raphaël Bajon, and Fiz F. Pérez

The ocean is a net sink for a quater of the carbon dioxide emitted to the atmosphere by human industrial activities and land-use change (Cant). The North Atlantic Ocean encompasses the highest ocean storage capacity of Cant per unit area. In particular, the Labrador and Irminger Seas are two basins storing a high amount of Cant due to the deep convection activity taking place there. The temporal evolution of Cant concentration in these two basins and their Cant inventories in the 0-1800 depth layer are estimated over the period 2011-2021. The Cant values are estimated from Argo floats equipped with oxygen sensors, predictive neural networks (ESPER_NN and CONTENT) and a carbon-based back-calculation method (φCOT method). On average, Cant inventories are similar in the two basins and amount to 75.3 and 75.6 mol/m2 in the Irminger and Labrador seas, respectively. Over the study period, Cant inventories increase in the two basins at a storage rate of 1.01±0.14 mol/m2/yr in the Irminger Sea and 0.94±0.2 mol/m2/yr in the Labrador Sea. The processes involved in Cant evolution in the two basins are then investigated.

How to cite: Asselot, R., Carracedo, L. I., Thierry, V., Mercier, H., Velo, A., Bajon, R., and Pérez, F. F.: Argo-based anthropogenic carbon concentration and inventory in the Labrador and Irminger Seas over 2011-2021, EGU General Assembly 2023, Vienna, Austria, 23–28 Apr 2023, EGU23-5422, https://doi.org/10.5194/egusphere-egu23-5422, 2023.

Multicentennial North Atlantic climate variability revealed by paleoclimate reconstruction has been linked to the Atlantic meridional overturning circulation (AMOC) variability. However, mechanisms of multicentennial AMOC variability in coupled models have yet to reach a consensus, reflecting a necessity of more fundamental theoretical studies. To this end, we propose an ocean-only North Atlantic 4-box theoretical model. A self-sustained AMOC oscillation with a typical period of 300-400 years exhibits. The timescale is largely set by rate of AMOC advection but also modulated by thermal processes, while the self-sustained oscillation mechanism can be generalized as a combination of a linear growing oscillation and a nonlinear restraining. The linear growing oscillation is energized by the salinity advection feedback and stabilized by the temperature advection feedback, while the latter is hampered by surface temperature restoring. Nonlinear restraining processes restrict the runaway tendency of the linear growing oscillation and finally turn it into a self-sustained one. We further identify a 300-400-year AMOC oscillation in a CESM1 control simulation, which can be well explained by the self-sustained oscillation mechanism of the theoretical model. Our work demonstrates that internal variability plays a vital role in multicentennial AMOC variability, while the dominating processes primarily lie in the North Atlantic.

How to cite: Yang, K.: A theory for self-sustained multicentennial AMOC oscillation and its evidence in CESM1, EGU General Assembly 2023, Vienna, Austria, 23–28 Apr 2023, EGU23-5739, https://doi.org/10.5194/egusphere-egu23-5739, 2023.

Both Greenland Ice Sheet mass loss and Atlantic Meridional Overturning Circulation weakening are considered tipping elements of the climate system under global warming. Ocean and climate models of varying complexity are widely applied to understand and project the future evolution of the two processes and their connection. The results are prone to model uncertainty however. Especially the role of regional mesoscale processes in the subpolar North Atlantic is still being investigated. We ran a systematic set of eight dedicated 60 to 100-year long model experiments with and without atmospheric coupling, with eddy processes parameterized and explicitly simulated, with regular and significantly enlarged Greenland runoff to reconcile findings of the regional ocean and global climate modeling communities.

The most prominent result is a major impact by an interactive atmosphere for limiting the AMOC weakening through enabling a compensating temperature feedback. Coupled experiments yield an AMOC decline of <2Sv to a freshwater perturbation of 0.05Sv whereas the AMOC weakens by >4Sv in the ocean-only runs. In addition to this large-scale effect, we find that the Labrador Sea and the Northwest Corner (off Flemish Cap) are critical regions for the role of mesoscale eddies in redistributing Greenland meltwater and affecting the timing of its impact. We show that an ocean grid at 1/10˚–1/12˚, which is currently used in global high-resolution climate simulations, can already significantly improve the path of the meltwater along the North American coast and into the wider North Atlantic. But the same resolution still falls short in providing sufficient dynamical exchange between the boundary current and the interior Labrador Sea and especially lacks capability in restratifying the Labrador Sea after deep convection. Our experiments demonstrate where an eddy parameterization works quite successfully and where only high resolution (>1/12˚) yields a realistic ocean response. This underlines the necessity to advance scale-aware eddy parameterizations for next-generation climate models.

How to cite: Martin, T. and Biastoch, A.: Ocean response to Greenland melting in a hierarchy of model configurations: Relevance of eddies and an interactive atmosphere, EGU General Assembly 2023, Vienna, Austria, 23–28 Apr 2023, EGU23-5909, https://doi.org/10.5194/egusphere-egu23-5909, 2023.

EGU23-5941 | Orals | OS1.5

Realistic freshwater forcing around Greenland in climate models 

Marion Devilliers, Shuting Yang, Steffen Olsen, and Annika Drews
This study summarizes the findings of several realistic freshwater forcing experiments around Greenland and surrounding regions, which were conducted using climate and ocean models over the historical period. The results of the experiments are discussed in terms of their impact on the Atlantic Meridional Overturning Circulation (AMOC) as well as on temperature and salinity changes in the North Atlantic and in the Arctic. It was determined that the addition of freshwater led to a decrease of the AMOC and a reduction of the temperature and salinity biases in the North Atlantic. These results will be of particular interest to researchers interested in the effects of current and future Greenland melting on local and global ocean.


How to cite: Devilliers, M., Yang, S., Olsen, S., and Drews, A.: Realistic freshwater forcing around Greenland in climate models, EGU General Assembly 2023, Vienna, Austria, 23–28 Apr 2023, EGU23-5941, https://doi.org/10.5194/egusphere-egu23-5941, 2023.

EGU23-6169 | ECS | Posters on site | OS1.5

Subpolar Atlantic Meridional Overturning in Community Earth System Model (CESM): setting up the further experiment 

Aleksandr M. Fedorov, M. Femke de Jong, Claudia E. Wieners, and Henk A. Dijkstra

The Atlantic Meridional Overturning Circulation (AMOC) is a three-dimensional system of ocean currents contributing to a relatively mild climate in northern Europe. AMOC transports vary on a range of time scales, from centennial to daily. Despite a wide history of research on AMOC variability from both measurements and modeling perspectives, the role of atmospheric noise in subseasonal and intra-annual AMOC variations remains unclear. In the current study, we describe the modeling experiment planned to reveal the importance of mesoscale winds around the southern tip of Greenland, named Tip Jets, in  AMOC variability. Tip Jet wind events have no regularity in frequency and intensity, they mostly depend on the Icelandic Low location and are partly associated with a positive NAO phase in winter. The experiment design is based on implying the perturbations in the momentum, heat, and freshwater forcing associated with Tip Jet events. Therefore, we constructed the composite Tip Jet forcing using daily ERA5 (25 km, December-March, 1969-2019) wind, surface fluxes, and precipitation/evaporation rates. These composite fields of anomalies are planned to be added to the CESM-derived climatology to describe the possible response of the AMOC system to these types of noise forcing. Setting up the experiment included the model verification based on the comparison between the monthly output from the ~0.1 ° CESM Parallel Ocean Product (POP) simulations and the observational OSNAP array that combines measurements along the line between Labrador, Greenland, and the European shelf. The mean state of the atmosphere from CESM (50 km, monthly) was compared to the ERA5 (25 km, monthly). Generally, the CESM model reproduces the AMOC at OSNAP well. In conclusion, this preliminary research shows that AMOC is well simulated by the Community Earth System Model in the Subpolar North Atlantic. Also, the current research proposes patterns of noise forcing over the North Atlantic Subpolar Gyre that will be used in further modeling experiments.

How to cite: Fedorov, A. M., de Jong, M. F., Wieners, C. E., and Dijkstra, H. A.: Subpolar Atlantic Meridional Overturning in Community Earth System Model (CESM): setting up the further experiment, EGU General Assembly 2023, Vienna, Austria, 23–28 Apr 2023, EGU23-6169, https://doi.org/10.5194/egusphere-egu23-6169, 2023.

EGU23-6219 | ECS | Posters on site | OS1.5

Does freshwater content of the East Greenland Current show imprints of increasing meltwater runoff? 

Ilana Schiller-Weiss, Torge Martin, Johannes Karstensen, and Arne Biastoch

Accelerated melting of the Greenland Ice Sheet has been identified as a tipping element in the freshwater balance of the subpolar North Atlantic (SPNA), where the East Greenland Current is a primary pathway for transporting Arctic-sourced freshwater and Greenland glacial meltwater. Understanding the freshwater variability of the East Greenland Current (EGC) and Coastal Current (EGCC) and their interaction is of high importance, as these gather the imprint of ice melt once the meltwater leaves the fjords and enters the open ocean. Using a high-resolution model (VIKING20X, 1/20°) and gridded, observational assimilated reanalysis (GLORYS12, 1/12°), we find the freshest water remains close to the shelf with interannual extremes in freshwater content attributable to the imprint of Greenland melt only in years 2010 and 2012. This signal is only found in the VIKING20X simulation, which in contrast to GLORYS12 uses realistic, interannually varying runoff forcing including estimates of the Greenland Ice Sheet mass balance. We further discuss the role of wind forcing, sea ice melt, and Greenland runoff, which all contribute to variability in freshwater content along the boundary current.

Our results show that slackened alongshore winds reduce onshore Ekman transport allowing for freshwater to spread laterally in the EGC, while stronger alongshore winds constrain freshwater closer to the shelf with saline intrusions from the interior basin into the outer EGC. South of ~65°N sea ice melts year round and retreats northward with melting occurring only in summer. Associated salinity and thus freshwater content anomalies are of similar magnitude as those associated with meltwater runoff and overlap in both seasonal timing and advective time scales. This could explain the challenges to identify freshening events originating from extreme melt events on the Greenland Ice Sheet at currently observed magnitudes. Their detection is critically dependent on synoptic and interannually varying processes. Our findings also suggest that ocean models or model-based reanalysis products aiming to illustrate the processes of meltwater redistribution should feature grid resolutions preferably exceeding 1/12° in order to represent coastal dynamics and fjord-shelf-open ocean exchange. With more observations on the Greenland shelf hopefully becoming available in the future, we anticipate the GLORYS12 assimilation product to show similar variability as higher resolution models.

How to cite: Schiller-Weiss, I., Martin, T., Karstensen, J., and Biastoch, A.: Does freshwater content of the East Greenland Current show imprints of increasing meltwater runoff?, EGU General Assembly 2023, Vienna, Austria, 23–28 Apr 2023, EGU23-6219, https://doi.org/10.5194/egusphere-egu23-6219, 2023.

EGU23-6539 | Orals | OS1.5

Mechanism of observed North Atlantic multidecadal upper ocean heat content changes 1950-2020 

Ben Moat, Bablu Sinha, Neil Fraser, Leon Hermanson, Simon Josey, Claire MacIntosh, David Berry, Simon Williams, Marilena Oltmanns, Dan Jones, and Rachael Sanders

We synthesize observational datasets and a state of the art forced global ocean model to construct a multidecadal upper ocean heat budget for the North Atlantic for the period 1950 to 2020. Using multiple independent estimates of the variables allows us to provide robust uncertainty estimates for each term. Time-varying ocean heat transport convergence dominates the budget on multidecadal timescales in all regions of the North Atlantic. In the subpolar region (north of 45N) we find that the heat transport convergence is dominated by geostrophic currents whereas in the subtropics (26-45N) advection by ageostrophic currents is also significant. The geostrophic advection is dominated (especially in the subpolar regions) by anomalous geostrophic currents acting on the mean temperature gradient. The timescale and spatial distribution of the anomalous geostrophic currents are consistent with basin scale ‘thermal’ Rossby waves propagating westwards/northwestwards in the subpolar gyre. Multidecadal changes in North Atlantic Changes in ocean heat storage directly affect the climate of the surrounding continents, and hence it is important to understanding the mechanism behind these.

How to cite: Moat, B., Sinha, B., Fraser, N., Hermanson, L., Josey, S., MacIntosh, C., Berry, D., Williams, S., Oltmanns, M., Jones, D., and Sanders, R.: Mechanism of observed North Atlantic multidecadal upper ocean heat content changes 1950-2020, EGU General Assembly 2023, Vienna, Austria, 23–28 Apr 2023, EGU23-6539, https://doi.org/10.5194/egusphere-egu23-6539, 2023.

EGU23-7195 | ECS | Posters on site | OS1.5

Quantifying the Contribution of Surface Buoyancy Forcing to Recent Subpolar AMOC Variability 

Charlotte Marris and Robert Marsh

In the Subpolar North Atlantic (SPNA), interannual to multidecadal variability in the Atlantic Meridional Overturning Circulation (AMOC) is primarily attributed to surface buoyancy forcing. Here, warm surface waters arriving via the Gulf Stream and North Atlantic Current undergo an intense loss of heat and freshwater to the atmosphere and are thus transformed to cold and dense waters which subsequently sink and are returned southward at depth. Quantifying the contribution of surface buoyancy forcing to AMOC variability is essential for modelling how the AMOC will respond to predicted warming and freshening at high latitudes. In a water mass transformation framework, fields of surface density and surface density flux from the GODAS ocean reanalysis are used to construct the surface-forced overturning circulation (SFOC) streamfunction for the SPNA (48-65°N) in an operational assimilation over 1980-2020. Computed and plotted in latitude-density space, the SFOC reconstruction compares favourably with the corresponding AMOC, computed from GODAS currents. We thus conclude that subpolar AMOC variability is largely explained by changing air-sea heat and freshwater fluxes controlling water mass transformation across the region. We further highlight the changing relative influences of water mass transformation in the eastern and western subpolar gyre, by partitioning SFOC longitudinally into an East component (5-43 °W) comprising the Irminger and Iceland basins, and a West component (43-60 °W) comprising the Labrador Sea. Our analysis demonstrates that interannual to multidecadal SFOC variability is dominated by changing water mass transformation in the western subpolar gyre. This challenges a shifting consensus that highlights the eastern subpolar gyre as dominant in driving the AMOC across subpolar latitudes.

How to cite: Marris, C. and Marsh, R.: Quantifying the Contribution of Surface Buoyancy Forcing to Recent Subpolar AMOC Variability, EGU General Assembly 2023, Vienna, Austria, 23–28 Apr 2023, EGU23-7195, https://doi.org/10.5194/egusphere-egu23-7195, 2023.

The Atlantic Meridional Overturning Circulation (AMOC) exports cold, fresh, dense waters formed in the subpolar North Atlantic to equatorward latitudes along the western boundary and interior pathways. The properties of the water formed in the North Atlantic vary from year to year, however the strength and time scale for the downstream communication of this variability is still unclear. While several past studies have focused on tracking specific property anomalies, particularly from the Labrador Sea, we approach our study by investigating property variance downstream of the water mass source region. In effect, we aim to understand the downstream memory of water mass property variability in the North Atlantic along western boundary and interior pathways. To do so, we analyze hydrographic properties on neutral density isopycnal surfaces in the subpolar North Atlantic and along the western boundary and interior pathways with two reanalysis products from the Met Office, the hydrographic dataset (EN4) and ensemble prediction system (GloSea5), over their overlapping time period (1993-2019). Our results show different patterns of downstream variance for the interior compared to the western boundary, which we interpret in terms of known circulation features in the deep North Atlantic and what we have learned from past Lagrangian studies.

How to cite: Fortin, A.-S. and Lozier, S.: Variability of North Atlantic Water Mass Properties along Western Boundary and Interior Pathways, EGU General Assembly 2023, Vienna, Austria, 23–28 Apr 2023, EGU23-7535, https://doi.org/10.5194/egusphere-egu23-7535, 2023.

EGU23-7698 | ECS | Orals | OS1.5

Water mass transformation following instability in the mixed layer of the East Greenland Current 

Fraser Goldsworth, Isabela Le Bras, Helen Johnson, and David Marshall

Observations show that strong southerly winds over the Irminger Sea can excite symmetric instability in the East Greenland Current, resulting in the generation of a low potential vorticity layer below the convectively mixed layer (Le Bras et al., 2022). The role of these downfront wind events on the formation of dense waters is not yet well understood.

Using an ensemble of ultra-high resolution models (25 m in the horizontal)  we show that the low potential vorticity layer is virtually indistinguishable from the convectively mixed layer, implying the absence of symmetric instability in coarse models may lead to underestimates in the mixed layer depth and baroclinicity of the East Greenland Current. We explore the hypothesis that symmetric instability acts as the short time-scale response of the current to these southerly wind events and pre-conditions the mixed layer, making it more susceptible to baroclinic instability over longer time-scales. We then investigate whether baroclinic eddy activity is enhanced following these wind events and examine the implications of this on lateral and diapycnal mixing, including by calculating water mass transformation rates.

How to cite: Goldsworth, F., Le Bras, I., Johnson, H., and Marshall, D.: Water mass transformation following instability in the mixed layer of the East Greenland Current, EGU General Assembly 2023, Vienna, Austria, 23–28 Apr 2023, EGU23-7698, https://doi.org/10.5194/egusphere-egu23-7698, 2023.

EGU23-7805 | ECS | Orals | OS1.5

Intra-annual variability of carbon signature and transport in the North Atlantic Ocean 

Raphaël Bajon, Lidia Carracedo, Herlé Mercier, Fiz F. Pérez, Anton Velo, Rémy Asselot, and Virginie Thierry

The ocean is the largest carbon reservoir on Earth, and a major sink for the excess of CO2 (anthropogenic carbon) emitted to the atmosphere by human activities. Having removed about a quater of these emissions since the beginning of the industrial era, ocean’s key role in climate is particularty outstanding in the North Atlantic (NA). A combination of physical and biological processes makes the NA a key-role region for the natural and anthropogenic carbon uptake and storage, and hence for the global carbon cycle. Traditionally, the seasonal carbon cycle has been assumed to respond to natural variability, unnafected by the ongoing anthropogenic increase of atmospheric CO2. Recent model projections, however, point otherwise, yet observational evidence to verify these predictions is still missing. Here we examine seasonal cycle in dissolved inorganic carbon (DIC) and its (surface-2000 dbar) transport, estimated using in-situ data and neural networks, across the OVIDE (GO-SHIP A25) section, from 1993 to 2021 at a monthly resolution. Our results highlight that changes in temperature, dissolved oxygen and ocean circulation are key components driving the seasonal DIC variability. DIC concentrations are higher in years with strong winter mixing regimes (which bring more nutrient-rich waters to the surface, favouring photosynthesis, and more (remineralized) carbon back to the surface). Seasonal DIC transport fluctuations are found significant compared to the mean (e.g. +/- 25% in the upper branch of the meridional overturning circulation), putting into relevance that caution is needed if assuming that single-cruise occupations are representative of the annual state. We also observe a yearly variant seasonal imbalance, with a significant reduction over the past two decades in the upper branch of the meridional overturning circulation. These results underscore the importance of considering intra-annual variability in the North Atlantic's carbon cycle when addressing climate change.


How to cite: Bajon, R., Carracedo, L., Mercier, H., Pérez, F. F., Velo, A., Asselot, R., and Thierry, V.: Intra-annual variability of carbon signature and transport in the North Atlantic Ocean, EGU General Assembly 2023, Vienna, Austria, 23–28 Apr 2023, EGU23-7805, https://doi.org/10.5194/egusphere-egu23-7805, 2023.

EGU23-7844 | ECS | Orals | OS1.5

Linkage between overturning and density anomaly over the subpolar gyre 

Tillys Petit, Jon Robson, David Ferreira, and D. Gwyn Evans

The surface forced water mass transformation (SFWMT) is known to be the main contributor of the Atlantic Meridional Overturning Circulation (AMOC) over the subpolar gyre. Over the eastern part of the subpolar gyre, a recent study revealed the dominant role of surface density changes in driving the SFWMT as opposed to the direct influence of air-sea fluxes. Indeed, the distribution at surface of the isopycnal associated with the maximum overturning streamfunction, Smoc, modulates the area of dense water formation induced by the air-sea fluxes.

The Overturning in the Subpolar North Atlantic Program (OSNAP) showed that the density of Smoc is highly variable in time along each section of the array. However, the drivers of Smoc remain unclear. In our work, we use a combination of atmospheric reanalysis and coupled simulations of HadGEM3-GC3.1 to evaluate the Smoc variability over the subpolar gyre as well as its connection with the overturning strength. At interannual timescale, the variability of Smoc at OSNAP East is strongly related to those at OSNAP West and at 45°N. However, its connection with the overturning strength is more complex. Although Smoc is not well related to the overturning at OSNAP, it is associated with a shift in density of the overturning stream function. The Irminger Sea is identified as being the centre of action driving this variability.

How to cite: Petit, T., Robson, J., Ferreira, D., and Evans, D. G.: Linkage between overturning and density anomaly over the subpolar gyre, EGU General Assembly 2023, Vienna, Austria, 23–28 Apr 2023, EGU23-7844, https://doi.org/10.5194/egusphere-egu23-7844, 2023.

EGU23-9765 | ECS | Orals | OS1.5

Cross-shelf exchanges between the East Greenland shelf and interior seas 

Elodie Duyck and Femke De Jong

The Atlantic Meridional Overturning Circulation (AMOC) is predicted to weaken in the 21st century as a result of climate change. One of the proposed drivers for such a weakening is the dampening of deep convection in the Subpolar North Atlantic following an increase in freshwater fluxes from the Greenland ice sheet. However, the fresh waters that flow from Greenland and the Arctic to the Subpolar North Atlantic are primarily found over the Greenland shelf, and it is unclear where and how much freshwater is exported from the shelf to the interior seas where deep convection occurs. While the main export of freshwater off the Greenland shelf is likely to occur west of Greenland, the importance of water mass transformation and overturning east of Greenland in the total subpolar AMOC makes it essential to better understand freshwater exchanges between the east Greenland shelf and deep convection regions of the Irminger and Nordic Sea.

We investigate these exchanges using drifter data from five deployments carried out at different latitudes along the east Greenland shelf in 2019, 2020 and 2021, as well as satellite data and an atmospheric reanalysis. We compute Ekman transport (from winds) and geostrophic velocity (from satellite altimetry) at the shelfbreak and find that the Blosseville Basin, just upstream of Denmark Strait, and Cape Farewell, are particularly favorable to cross-shelf exchanges. We further investigate exchange processes in these regions using drifter data. In the Blosseville Basin, drifters are brought off-shelf towards the Iceland Sea and into the interior of the Basin, possibly joining the separated EGC. As they flow downstream, they re-enter the shelf and most are driven towards the coast. This exchange appears to be mainly driven by the shape of the bathymetry. At Cape Farewell, the wind appears to be the main driver, although occasionally an eddy seems to turn drifters away from the shelf. The drifters brought off-shelf at Cape Farewell mostly continue around Eirik Ridge, where they re-enter the West Greenland Current. How much of the freshwater signature is lost between leaving the East Greenland Current and entering the West Greenland Current is not clear and will need further study.

How to cite: Duyck, E. and De Jong, F.: Cross-shelf exchanges between the East Greenland shelf and interior seas, EGU General Assembly 2023, Vienna, Austria, 23–28 Apr 2023, EGU23-9765, https://doi.org/10.5194/egusphere-egu23-9765, 2023.

EGU23-9981 | Orals | OS1.5

Cessation of Labrador Sea Convection by Freshening through (Sub)mesoscale Flows 

Louis Clement, Eleanor Frajka-Williams, Nicolai von Oppeln-Bronikowski, Ilona Goszczko, and Brad de Young

By ventilating the deep ocean, deep convection in the Labrador Sea plays a crucial role in the climate system. Unfortunately, the mechanisms leading to the cessation of convection and, hence, the mechanisms by which a changing climate might affect deep convection remain unclear. In winter 2020, three autonomous underwater gliders sampled the convective region and both its spatial and temporal boundaries. Both boundaries are characterised by higher sub-daily mixed-layer depth variability than the convective region. At the convection boundaries, buoyant intrusions--including eddies and filaments--primarily drive restratification by bringing freshwater, instead of warm warmer, and instead of atmospheric warming. At the edges of these intrusions, submesoscale instabilities, such as symmetric instabilities and mixed-layer baroclinic instabilities, seem to contribute to the decay of the intrusions. In winter, strong destabilising surface heat flux and along-front winds can enhance the lateral stratification, sustaining submesoscale instabilities. Consequently, winter atmospheric conditions and freshwater intrusions participate in halting convection by adding buoyant freshwater into the convective region through submesoscale flows. This study reveals freshwater anomalies in a narrow area offshore of the Labrador Current and near the convective region; this area has received less attention than the more eddy-rich West Greenland Current, but is a potential source of freshwater in closer proximity to the region of deep convection. Freshwater fluxes from the Arctic and Greenland are expected to increase under a changing climate, and our findings suggest that they may play an active role in the restratification of deep convection.

How to cite: Clement, L., Frajka-Williams, E., von Oppeln-Bronikowski, N., Goszczko, I., and de Young, B.: Cessation of Labrador Sea Convection by Freshening through (Sub)mesoscale Flows, EGU General Assembly 2023, Vienna, Austria, 23–28 Apr 2023, EGU23-9981, https://doi.org/10.5194/egusphere-egu23-9981, 2023.

EGU23-10227 | ECS | Posters on site | OS1.5

Is the AMOC connected across all latitudes? 

María Jesús Rapanague, Dian Putrasahan, and Jochem Marotzke

The Atlantic Meridional Overturning Circulation (AMOC) is fundamental for the northward transport of heat and the vertical transport of carbon from the surface to the deep ocean in the North Atlantic Ocean, influencing the climate at both local and global scales. However, the mechanisms underlying the AMOC variability are still poorly understood, because of the lack of long-term observations and the challenge of representing key processes in standard climate models. Furthermore, assumptions widely accepted for several decades have re-entered the debate in recent years, such as the AMOC meridional coherence and the role of deep convection in the Labrador Sea in driving the AMOC variability and deepwater formation. New modeling and observational studies suggest that the overturning variability is not coherent between subtropical and subpolar latitudes on interannual to decadal scales and that climate models systematically exaggerate the importance of the Labrador Sea, pointing toward other regions like the Irminger Sea and the Nordic Sea as better candidates for deepwater formation.

In this study, we aim to critically assess the long-held notion of meridional coherence in the AMOC, using output from high- and very-high-resolution model simulations. Specifically, we investigate how the meridional coherence of the AMOC changes when increasing model resolution, via spectral analysis of the MPI-ESM1.2 control simulations with resolutions of 1°, 0.4°, and 0.1°. Preliminary analysis using lead-lag time correlations indicates a high correlation and meridional coherence between the AMOC strength and mixed layer depth variability in the Labrador Sea for the coarsest resolution. However, when increasing the resolution this relationship disappears, and the AMOC is instead better related to overflow changes in the Denmark Strait and in the Nordic Seas. Additionally, the meridional coherence of the AMOC becomes unclear.

How to cite: Rapanague, M. J., Putrasahan, D., and Marotzke, J.: Is the AMOC connected across all latitudes?, EGU General Assembly 2023, Vienna, Austria, 23–28 Apr 2023, EGU23-10227, https://doi.org/10.5194/egusphere-egu23-10227, 2023.

EGU23-10569 | Orals | OS1.5

Global climate teleconnections into and out of the North Atlantic Ocean 

Matthew H. England, Bryam Orihuela-Pinto, and Andréa Taschetto

The Atlantic Meridional Overturning Circulation (AMOC) has a profound impact on both global and regional climate, yet our understanding of the mechanisms controlling remote teleconnections remains limited. In addition, it is unclear how remote processes impact the North Atlantic and alter the strength of the AMOC.  In this presentation I will show how a slowdown in the AMOC can drive an acceleration of the Pacific trade winds and Walker circulation by leaving an excess of heat in the tropical South Atlantic. This tropical Atlantic warming drives anomalous atmospheric convection, resulting in enhanced subsidence over the east Pacific, and a strengthened Walker circulation and trade winds. Further teleconnections include a shift in the ITCZ, enhanced zonal SST gradients across the tropical Pacific, strengthened convection over the West Pacific Warm Pool, and a deepening of the Amundsen Sea Low off Antarctica.  Teleconnections back to the North Atlantic can in turn be triggered by Southern Hemisphere wind anomalies on a relatively rapid time-scale via propagating planetary waves in the ocean.  There is also evidence that tropical Pacific cooling can feedback and influence the strength of the AMOC.  These findings have implications for understanding both intrinsic decadal climate variability as well as longer-term climate change.

How to cite: England, M. H., Orihuela-Pinto, B., and Taschetto, A.: Global climate teleconnections into and out of the North Atlantic Ocean, EGU General Assembly 2023, Vienna, Austria, 23–28 Apr 2023, EGU23-10569, https://doi.org/10.5194/egusphere-egu23-10569, 2023.

EGU23-11459 | ECS | Posters on site | OS1.5

Tracing Ocean circulation at the AR7W and OVIDE lines using artificial radionuclides 

Lisa Gerlinde Thekla Leist, Maxi Castrillejo, John N. Smith, Marcus Christl, and Núria Casacuberta

The Subpolar North Atlantic (SPNA) and Labrador Sea are key regions for deep and intermediate water mass formation and contribute to the southward return flow of the lower limb of the Atlantic Meridional Overturning Circulation (AMOC).

The origin and circulation pathways of these water masses can now be studied using the artificial radionuclides 129I and 236U. These tracers are mainly released to the Nordic seas by the European nuclear reprocessing plants of La Hague and Sellafield since the 1960s. This point like source provides a unique fingerprint for Atlantic waters entering the Arctic Ocean and recirculation to the western SPNA.

Here we will present results of the distribution of 129I and 236U in the Labrador Sea (AR7W Line) and the SPNA (OVIDE Line). The 129I concentrations and its temporal evolution is studied at 11 stations on a time series that started in 2014. In addition, first results of 236U  will also be  presented along the AR7W line.

At the timeseries the 129I concentration shows a general increase with time and from east to west, reaching its highest concentration in the deep overflow waters and along the Eastern and Western Greenland current.

The combination of the well-known tracer 129I with 236U allows to study the origin and mixing of different water masses in the SPNA.

How to cite: Leist, L. G. T., Castrillejo, M., Smith, J. N., Christl, M., and Casacuberta, N.: Tracing Ocean circulation at the AR7W and OVIDE lines using artificial radionuclides, EGU General Assembly 2023, Vienna, Austria, 23–28 Apr 2023, EGU23-11459, https://doi.org/10.5194/egusphere-egu23-11459, 2023.

EGU23-11576 | ECS | Orals | OS1.5

Assessing the variability of Irminger Water at AR7W between 1993 and 2022 using time-dependent property thresholds 

Kevin Niklas Wiegand, Dagmar Kieke, Paul G. Myers, and Igor Yashayaev

Irminger Water (IW) is a prominent water mass in the subpolar North Atlantic (SPNA). It is warm and saline and originates from the North Atlantic Current and the Irminger Current. The water mass delivers anomalously large amounts of heat and salt to the Labrador Sea. Like any other water mass, IW is subject to temporal and spatial variability, which needs to be adequately identified and tracked.

To separate IW from ambient waters, previous studies identified IW at different times using static thresholds of salinity, temperature, and density (i.e., constant over time within the individual studies). However, given the tremendous variability in the region, such static definitions often do not detect IW sufficiently since these definitions do not account for shifts in the large-scale hydrographic state of the SPNA. To address this issue, this study aims to identify non-static thresholds (i.e., incorporating temporal variability) to analyze IW variability. We refer to the method of identifying IW based on non-static thresholds as the phenomenological approach. To do so, we utilize the observation-based data set ARMOR3D between 1993 and 2022. This new approach allows us to compare estimates of IW properties and volume transports to respective estimates obtained from the static approach.

In the case of the static approach being applied to the AR7W section in the eastern part of the Labrador Sea as a test region, the water column was anomalously saline in years of high IW volume transport. Hence, the static approach identified more IW and thus overestimated its volume transport. In contrast, the water column was anomalously fresh in years when the static approach reveals a low IW volume transport. Hence, applying the static approach, less IW is identified, and thus its volume transport is underestimated. In contrast, the phenomenological approach reveals less pronounced decadal variability of the IW volume transport.

Applying a static IW definition will likely create stronger gradients between IW and ambient water masses when both are fresher. In turn, these gradients may impose or modulate unrealistic changes in the IW volume transport simply because the actual boundary of IW does not coincide with a certain isohaline or isotherm. Any correlated change or shift in IW properties and, for example, Labrador Sea Water will relocate the IW boundary causing the transport to change. The phenomenological approach introduced in our study resolves this issue.

How to cite: Wiegand, K. N., Kieke, D., Myers, P. G., and Yashayaev, I.: Assessing the variability of Irminger Water at AR7W between 1993 and 2022 using time-dependent property thresholds, EGU General Assembly 2023, Vienna, Austria, 23–28 Apr 2023, EGU23-11576, https://doi.org/10.5194/egusphere-egu23-11576, 2023.

Over the observed period, North Atlantic Sea surface temperatures have gone through cycles of anomalous warming and cooling relative the global mean. This variability has become known as the Atlantic Multidecadal Variability (AMV), and it has been associated with important regional climate impacts. However, in recent years there has been considerable controversy over the origins of AMV. In particular, there is debate over whether AMV is a natural phenomenon (e.g., an expression of internal variability or natural external forcings), or whether it was caused by human activity through the impact of anthropogenic aerosol forcing.

Here, an analysis of CMIP6 multi-model historical simulations is presented which isolates the internal and externally forced AMV. The analysis shows that, although there is substantial externally forced AMV in the CMIP6 historical simulations, the forced variability is part of a wider hemispheric signal and is not specific to the North Atlantic like in observations. Therefore, the magnitude of the externally forced variability is highly dependent on the definition of the AMV index used. Ocean circulation changes consistently lead the internal AMV across models, but there is no-clear relationship for the external AMV. AMV is also associated with broader changes than just sea surface temperatures, but this multivariate fingerprint of AMV is significantly different between the internal and external components. For example, internal AMV is associated with salinity anomalies and increased turbulent heat loss across the subpolar North Atlantic that agree broadly with observations. However, in contrast, the externally forced AMV is associated with freshening and reduced heat loss across the subpolar North Atlantic and especially in models with the strongest aerosol forcing. Overall, the analysis suggests that internal variability remains a likely hypothesis to explain AMV, but questions remain on whether models adequately simulate the forced response.

How to cite: Robson, J.: Contrasting the internal and external components of Atlantic Multidecadal Variability in CMIP6 historical simulations, EGU General Assembly 2023, Vienna, Austria, 23–28 Apr 2023, EGU23-11588, https://doi.org/10.5194/egusphere-egu23-11588, 2023.

EGU23-12040 | ECS | Posters on site | OS1.5

Common mechanisms of centennial-scale AMOC variability in CMIP6 models 

Oliver Mehling, Katinka Bellomo, and Jost von Hardenberg

It has been hypothesized that climate variability on centennial timescales – in the North Atlantic region and beyond – is linked to unforced variability of the Atlantic Meridional Overturning Circulation (AMOC). Because of the presence of external forcings, uncertainties in proxy reconstructions of the AMOC and the short observational record, coupled climate models represent a key tool in assessing low-frequency AMOC variability. However, sufficiently long pre-industrial control (piControl) simulations with state-of-the-art climate models have only become widely available during the past decade. While significant centennial-scale AMOC variability has been identified in several single-model studies, proposed physical mechanisms differ considerably.

Here, we assess mechanisms of AMOC variability on centennial timescales in the CMIP6 multi-model piControl ensemble. We find that a relatively large number of models – 11 out of the 15 analyzed – exhibit a statistically significant mode of centennial-scale MOC variability in the Atlantic. We review previously proposed mechanisms for centennial-scale AMOC variability and test whether their key elements are present in the CMIP6 ensemble.

We find that salinity exchanges between the Arctic and North Atlantic basins, which have previously been proposed as drivers of multi-centennial AMOC variability in two CMIP6 models (IPSL-CM6A-LR and EC-Earth3), can also be identified in other CMIP6 models using the same ocean component (NEMO). However, we find only a weak or no signature of this mechanism in models that do not include NEMO. Even among NEMO models, the amplitude and timescale of centennial-scale AMOC variability is model-dependent, and we assess the relative role of deep-water formation sites in shaping these differences. Because AMOC fluctuations are linked to surface temperature anomalies and related impacts over land, our results motivate the need for more paleoclimate evidence at sub-centennial resolution, which would help constrain the CMIP6 inter-model spread in centennial-scale AMOC variability.

How to cite: Mehling, O., Bellomo, K., and von Hardenberg, J.: Common mechanisms of centennial-scale AMOC variability in CMIP6 models, EGU General Assembly 2023, Vienna, Austria, 23–28 Apr 2023, EGU23-12040, https://doi.org/10.5194/egusphere-egu23-12040, 2023.

EGU23-12097 | ECS | Posters on site | OS1.5

Treasure from trash: Using nuclear waste to trace ocean circulation around Iceland 

Duncan Dale, Marcus Christl, Andreas Macrander, Sólveig Ólafsdóttir, Rob Middag, and Núria Casacuberta

Iceland stands at an important gateway where Arctic and Atlantic waters interact. Atlantic waters pass northward and circulate in the Arctic before returning southward in the East Greenland Current (EGC). Zones of deep water formation in the Nordic Seas contribute to overflows of the Iceland-Scotland Ridge such as Denmark Strait Overflow Water (DSOW). These are key processes in Arctic warming and deep ocean ventilation.

This system has been tagged with anthropogenic radionuclides 129I and 236U by bomb tests in the 1950-60s and point-source nuclear reprocessing plants (NRPs) at Sellafield (UK) and La Hague (FR) since the 1960s providing an opportunity to trace the origins of water masses in the region and their transit timescales. Here we present the results of measurements on samples taken during two cruises around Iceland in 2021 by the Marine and Freshwater Research Institute (MFRI) of Iceland (winter) and the NIOZ MetalGate Cruise of the GEOTRACES program (summer). Models for the origin of waters transiting Denmark Strait and of the evolution of Iceland Scotland Overflow Water (ISOW) are presented that provide a tracer-based perspective for comparison with models based on physical oceanographic tools. This forms a baseline for tracking changes to circulation in the Subpolar North Atlantic using the transient nature of the tracer signals.

How to cite: Dale, D., Christl, M., Macrander, A., Ólafsdóttir, S., Middag, R., and Casacuberta, N.: Treasure from trash: Using nuclear waste to trace ocean circulation around Iceland, EGU General Assembly 2023, Vienna, Austria, 23–28 Apr 2023, EGU23-12097, https://doi.org/10.5194/egusphere-egu23-12097, 2023.

Given the major role of the Atlantic Ocean meridional heat transport in the climate system, it is essential to characterize its temporal variations at different locations. The 4DATLANTIC-OHC Project (https://eo4society.esa.int/projects/4datlantic-ohc/) aims at developing and testing space geodetic methods based on satellite altimetry and space gravimetry to estimate the local ocean heat content (OHC) changes over the Atlantic Ocean. Combined with independent estimates of the surface heat fluxes this approach holds promise to estimate the Atlantic Meridional Heat Transport (MHT) at any section across the Atlantic basin. 

The official version 1.0 of the 4DAtlantic-OHC product has been released, it provides estimates of local changes in OHC with their uncertainties. This product is accessible with DOI https://doi.org/10.24400/527896/A01-2022.012  and can be downloaded on AVISO portal. At two test sites, OHC changes derived from in situ data (RAPID and OVIDE) are used to evaluate the accuracy and reliability of the new space geodetic based OHC change estimate. Combined with ERA5 estimate of the surface heat fluxes, the Atlantic OHC product will be used to derive an energy budget of the North Atlantic basin and estimate the associated divergence in ocean heat transport. From the divergence field we will derive at the end of the project new estimates of the Atlantic meridional heat transport at different sections in the North Atlantic basin (RAPID and OSNAP sections) and compare it with in situ estimates. 

The V1.0 of 4DAtlantic-OHC products over the Atlantic Ocean, the evaluation results of the OHC against in situ data and preliminary results of MHT estimation will be presented.

How to cite: Fraudeau, R. and the 4DAtlantic-OHC Team: Monitoring local Ocean Heat Content changes with satellite altimetry and space gravimetry to assess the variability of the Meridional Heat Transport in the North Atlantic: the 4DATLANTIC-OHC Project, EGU General Assembly 2023, Vienna, Austria, 23–28 Apr 2023, EGU23-12244, https://doi.org/10.5194/egusphere-egu23-12244, 2023.

It has been suggested previously that the long-term warming hole in the subpolar North Atlantic, that is the relative cooling in this region compared to the rest of the globe, is an indicator of a slowdown of the Atlantic Meridional Overturning Circulation (Caesar et al., 2018; Drijfhout et al., 2012; Rahmstorf et al., 2015), yet other drivers like aerosols or a change in the local atmospheric forcing (e.g., the wind stress curl) have been proposed (Li et al., 2021; Piecuch et al., 2017). The still not fully answered question of the driver(s) of the warming hole also raises the question of whether or not ocean temperatures in the subpolar North Atlantic can be used as an indicator for AMOC strength. While several studies suggest that AMOC strength and temperatures in the subpolar North Atlantic are dynamically linked through the AMOC’s northward heart transport (Dima et al., 2022; Latif et al., 2022; Zhang, 2008), a recent model-based study suggests that the correlation between temperature-based AMOC index (Caesar et al., 2018) and AMOC strength depends largely on the subtraction of the global warming signal (Little et al., 2020).

Based on the knowledge that the AMOC transports both heat into and freshwater out of the North Atlantic, we apply a lead-lag correlation analysis to both the North Atlantic’s heat and freshwater content to identify the region and the time lag that give the strongest correlation with the strength of the AMOC (to make use of the available observational data we consider the AMOC strength at 26˚N). We find that an AMOC weakening (strengthening) leads to cooling (warming) and simultaneous freshening (salinification) in the eastern subpolar North Atlantic with the upper ocean (200-1000m) contents showing a higher correlation with AMOC strength than the surface (0-200m) contents. The temporal evolution of heat and freshwater content in the eastern subpolar gyre region are furthermore strongly anticorrelated, with a correlation value of -0.82 (for the annual values) as expected for an AMOC (or otherwise advective) driven signal. On longer time scales this anticorrelation decreases unless the heat content is corrected for a large scale warming signal. This could suggest that it is indeed necessary to look at the relative not the absolute temperature evolution in the subpolar North Atlantic to extract the AMOC signal.

Both the absolute freshening in the eastern subpolar North Atlantic as well as the relative (compared to the rest of the North Atlantic) cooling in this region suggest a linear AMOC trend of about -2 Sv from 1957-2013.

References

Caesar, L., et al. (2018).  https://doi.org/10.1038/s41586-018-0006-5

Dima, M., et al. (2022).  https://doi.org/10.1007/s00382-022-06156-w

Drijfhout, S., et al.  (2012). https://doi.org/10.1175/jcli-d-12-00490.1

Latif, M., et al.  (2022). https://doi.org/10.1038/s41558-022-01342-4

Li, L., et al.  (2021). https://doi.org/10.1007/s00382-021-06003-4

Little, et al.  (2020).  https://doi.org/10.1029/2020gl090888

Piecuch, C. G., et al.  (2017).  https://doi.org/https://doi.org/10.1002/2017JC012845

Rahmstorf, S., et al.  (2015). https://doi.org/10.1038/nclimate2554

Zhang, R. (2008). https://doi.org/10.1029/2008GL035463

How to cite: Caesar, L. and McCarthy, G.: AMOC changed derived from simultaneous (absolute) freshening and (relative) cooling in the subpolar North Atlantic, EGU General Assembly 2023, Vienna, Austria, 23–28 Apr 2023, EGU23-13393, https://doi.org/10.5194/egusphere-egu23-13393, 2023.

EGU23-14080 | ECS | Orals | OS1.5

Changes in air-sea fluxes over the North Atlantic during 1950-2019 as derived from ERA5 data 

Johannes Mayer, Leopold Haimberger, and Michael Mayer

Air-sea heat fluxes play a key role for many processes in the North Atlantic Ocean, such as the lateral transport of energy or the formation of storm tracks. Thus, an accurate estimation of air-sea heat flux trends is pivotal and helps to understand implications of climate change. To do so, reanalysis products are attractive candidates due to their excellent spatial coverage over multiple decades. However, trend estimations based on reanalysis data are challenging as changes in the observing system can introduce temporal discontinuities.

In this study, we explore the reliability and temporal stability of net air-sea heat flux trends from ERA5 forecasts in the North Atlantic basin over the period 1950-2019.  The assessment is complemented with an indirect estimate of the net surface flux derived from the atmospheric energy budget. Causes of trends in latent and sensible heat fluxes are identified based on monthly analyzed state quantities from ERA5, such as wind speed, moisture, and temperature. Additionally, the impact of the North Atlantic Oscillation (NAO) and Atlantic Multi-decadal Oscillation (AMO) as well as analysis increments, as introduced by the ERA5 data assimilation, is investigated.  

Our results show a robust increase of latent heat fluxes in the tropical North Atlantic over the past seven decades, which is likely caused by the intensification of the Hadley cell favouring subsidence and advection of drier air masses. In the Norwegian Sea, positive net air-sea heat flux trends (increased ocean heat uptake) are largely dominated by changes in sensible heat fluxes, which are driven by a trend towards more southerly winds and the advection of warmer air. In the Gulf Stream region, the AMO likely drives the multi-decadal variability of net air-sea heat fluxes, while long-term trends over the 1950-2019 period remain insignificantly small. Furthermore, we find significant changes over the North Atlantic Warming Hole and western North Atlantic associated with more frequent positive NAO phases during the past 30 years. From our analysis, we conclude that analysis increments most likely influence the magnitude of these trends, especially at low latitudes where the impact can be as large as ~2 W m-2 dec-1, while the basin-wide trend pattern remains unaffected. The net effect of the found regional changes in fluxes is assessed by the spatial average trend over the whole North Atlantic north of 26°N, which yields a positive but statistically insignificant trend of 0.5 W m-2 dec-1 over the past 70 years. Potential implications for trends in the AMOC are discussed. 

How to cite: Mayer, J., Haimberger, L., and Mayer, M.: Changes in air-sea fluxes over the North Atlantic during 1950-2019 as derived from ERA5 data, EGU General Assembly 2023, Vienna, Austria, 23–28 Apr 2023, EGU23-14080, https://doi.org/10.5194/egusphere-egu23-14080, 2023.

EGU23-14285 | ECS | Orals | OS1.5

On the inaccuracy of CMIP6 models in capturing the observed long-term variability of the NAO 

Amar Halifa-Marín, Miguel A. Torres-Vázquez, Enrique Pravia-Sarabia, Ricardo Trigo, Sergio M. Vicente-Serrano, Marco Turco, Sonia Jerez, Pedro Jiménez-Guerrero, and Juan Pedro Montavez

This study assesses how the CMIP6 simulations capture the non-stationarity of the main source of winter climate variability in the Euro-Atlantic region, the North Atlantic Oscillation (NAO), observed in the recent past.

For that purpose, we characterise the NAO long-term variability in climate reanalysis, analysing their features in several 30-year periods since 1851; and we evaluate whether CMIP6 historical simulations capture all the observed NAO “types”. Although the literature sometimes assumes that the NAO pattern is stationary, three groups of NAO pattern have been proved in the reanalyses depend on the location of their Action Centres (ACs): 1) the north AC locates over Iceland and the south AC in Azores, 2) the north AC locates over Southern Greenland and the south AC in the Western Mediterranean, and 3) the north AC locates over Northern Scandinavia and the south AC in the Azores.

Our main finding is that the NAO long-term variability is not accurately captured by all CMIP6 models. In particular, the overestimation of the NAO group 3 is remarkable in most simulations. This NAO group mainly represents the last decades, which the literature has addressed with much interest for its exceptional features (e.g. NAO+ strengthening and northeastward shift of its north AC), and which has been generally associated with the anthropogenic warmer climate. We also found underestimation of NAO group 2.

We have also found that each NAO group could be associated with precipitation anomalies in Europe. For example, the NAO group 3 implies drier(wet) conditions in the south(north). While group 2 implies the opposite pattern of anomalies. Therefore, we have reason to suggest that the lack of accuracy of models reproducing the non-stationarity of NAO may explain some of the bias in the expected changes of winter precipitation in Europe for future scenarios.

How to cite: Halifa-Marín, A., Torres-Vázquez, M. A., Pravia-Sarabia, E., Trigo, R., Vicente-Serrano, S. M., Turco, M., Jerez, S., Jiménez-Guerrero, P., and Montavez, J. P.: On the inaccuracy of CMIP6 models in capturing the observed long-term variability of the NAO, EGU General Assembly 2023, Vienna, Austria, 23–28 Apr 2023, EGU23-14285, https://doi.org/10.5194/egusphere-egu23-14285, 2023.

EGU23-14337 | ECS | Orals | OS1.5

Impact of interannual chaotic variability on the total interannual variability of the North Atlantic Eighteen Degree Water 

Olivier Narinc, Thierry Penduff, Guillaume Maze, Stéphanie Leroux, and Jean-Marc Molines

Using ensemble ocean simulations, recent studies have shown that non-linear intrinsic oceanic processes are a source of chaotic intrinsic oceanic variability (CIOV). It was found that in eddy-active regions and at interannual timescales, this CIOV can be a significant fraction of total variability, and that as model resolution increases small-scale non-linearities can generate variability at large scales. The Eighteen Degree Water (EDW) is a mode water formed in the winter mixed layer within and south of the Gulf Stream. It is the most abundant T,S class of water in the surface North Atlantic and has been shown to be an important contributor to air-sea exchanges over the entire North Atlantic basin. Observational studies have shown that a significant part of the interannual variability of EDW cannot be explained by atmospheric variability. This motivates the present investigation of the importance of interannual CIOV in the total interannual EDW variability. The present study uses a NEMO-core, 1/4°, 50-member ensemble hindcast of the North Atlantic ocean with a realistic atmospheric forcing. This ensemble simulation is assessed using ARMOR3D, a 3-dimensional gridded observational product obtained using satellite altimetry and ARGO floats. In both datasets, the 3-dimensional structure of EDW is identified using physical criteria. This spatial structure is used to compute timeseries of the EDW’s total volume and average temperature, in each ensemble member and in the observational product. It is found that the ensemble simulation produces a realistic EDW, with a comparable total variability. In the ensemble simulation, the CIOV of integrated EDW properties is estimated from their time-averaged ensemble standard deviation, and is compared to the total variability estimated from the ensemble mean of the temporal standard deviations of all members. In the ensemble, CIOV accounts for 13% of the total interannual variability of EDW volume, and 44% of the total interannual variability of EDW temperature. Notably, this means that CIOV is a source of unquantifiable uncertainty in single-member ocean simulations. This suggests that a significant part of observed interannual variability may also be chaotic intrinsic in nature. This calls for a better parametrisation of chaotic variability in ocean simulations.

How to cite: Narinc, O., Penduff, T., Maze, G., Leroux, S., and Molines, J.-M.: Impact of interannual chaotic variability on the total interannual variability of the North Atlantic Eighteen Degree Water, EGU General Assembly 2023, Vienna, Austria, 23–28 Apr 2023, EGU23-14337, https://doi.org/10.5194/egusphere-egu23-14337, 2023.

EGU23-14637 | ECS | Orals | OS1.5

Eight years of continuous Rockall Trough transport observations from moorings and gliders 

Kristin Burmeister, Neil Fraser, Lewis Drysdale, Sam Jones, Stuart Cunningham, Mark Inall, and Alan Fox

The Rockall Trough (RT) is a key pathway for warm and salty water flowing northward, a process which plays a key role in dictating the western European climate. The picture of the mean circulation and variability in the RT is still emerging, as the record of continuous transport observations has only recently been extended to eight years. Here, for the first time, we present the temporally extended record of RT volume, heat and freshwater transports. An important feature of the RT circulation is the European Slope Current (ESC) which is poorly constrained by ship-based, mooring, and satellite observations. To tackle this, we gathered around 150 glider transects over 2.5 years which capture the ESC velocity field in unprecedented detail. The data are sufficient to characterise both the mean state and the emergent seasonal variability of the ESC, and reveal the year-round presence of a southward countercurrent at depth. Variability in the strength and structure of this previously unstudied feature modulates net northward transport in the eastern boundary current system.

We also utilise these observations for monitoring the basin-wide overturning circulation as part of the newly developed OSNAP_I transect. We will present the first results from that programme.

How to cite: Burmeister, K., Fraser, N., Drysdale, L., Jones, S., Cunningham, S., Inall, M., and Fox, A.: Eight years of continuous Rockall Trough transport observations from moorings and gliders, EGU General Assembly 2023, Vienna, Austria, 23–28 Apr 2023, EGU23-14637, https://doi.org/10.5194/egusphere-egu23-14637, 2023.

We explore the amplitude and frequency of Atlantic Multi-decadal Variability (AMV) in a 2,000-year pre-industrial control simulation with the FOCI-OpenIFS coupled climate model. We find a statistically significant AMV-like mode on the 20-year and 80-year time scales. We also find a mode of multi-centennial variability where the North Atlantic Ocean shifts a regime of a warm period to/from a cold period of ~400 years. The warm period is characterised by mean states of a stronger and deeper Atlantic Meridional Overturning Circulation (AMOC), less Arctic sea ice, and more deep convection in the Labrador Sea than the cold period. 


We find that the AMV has a much higher amplitude in the cold period compared to the warm period, and also that the lead-lag relationship between the AMOC and the AMV is different between the two periods. In the warm period, AMOC leads the AMV; a strong AMOC enhances the oceanic poleward heat transport which warms the North Atlantic Ocean both at the surface and deeper down, producing a positive AMV. In the cold period, however, AMV leads AMOC; a warm surface anomaly reduces the sea ice in the Labrador Sea which enhances local air-sea interactions and deep convection, and later a stronger AMOC. In the cold period, the warm anomaly associated with the AMV does not extend below the mixed layer, suggesting that it is driven by the atmosphere and not ocean dynamics.

How to cite: Kjellsson, J. and Park, W.: Multi-centennial modulation of Atlantic multi-decadal variability in a 2000-year climate integration, EGU General Assembly 2023, Vienna, Austria, 23–28 Apr 2023, EGU23-14759, https://doi.org/10.5194/egusphere-egu23-14759, 2023.

EGU23-15366 | ECS | Posters on site | OS1.5

Optimizing simulated oxygen variability, circulation, and export in the subpolar North Atlantic Ocean using BGC-Argo & ship-based observations 

Lauren Moseley, Galen McKinley, Dustin Carroll, Raphael Dussin, Dimitris Menemenlis, and An Nguyen

The subpolar North Atlantic (SPNA) transports surface-ocean properties deep into the interior via deep convection and is one of the most intense regions of air-sea gas exchange globally. Deep convection in the SPNA exports highly-oxygenated water masses to depth, which subsequently ventilate intermediate and deep waters throughout the North Atlantic. The SPNA thus plays a critical role in setting the oxygen inventory of the global ocean. Due to intensifying ocean warming, many climate models predict substantial global-ocean oxygen loss — albeit at magnitudes which vary widely by model. Therefore, there is a need to better understand the impacts of SPNA convective variability on oxygen saturation in intermediate and deep water masses. Here we use a physical-biogeochemical model, ASTE-BGC, which couples the Arctic Subpolar gyre sTate Estimate (ASTE) with the Biogeochemistry with Light, Iron, Nutrients, and Gas (BLING) model to quantify oxygen cycling and deep ventilation in the SPNA. ASTE utilizes the MIT General Circulation Model (MITgcm) and assimilates physical in-situ and satellite data using tools developed by the Estimating the Circulation and Climate of the Ocean (ECCO) consortium. We use a Green’s Functions approach to optimize ASTE-BGC biogeochemistry using BGC-Argo and GLODAPv2 ship-based profiles of O2 and NO3. The Green’s Functions approach allows us to adjust the biogeochemical parameters of the BLING ecosystem towards O(106) in-situ data constraints over the 2002–2017 model period. We then evaluate the optimized simulation against independent data and construct an oxygen budget for the central Labrador Sea to assess the interannual variability of SPNA oxygen.

How to cite: Moseley, L., McKinley, G., Carroll, D., Dussin, R., Menemenlis, D., and Nguyen, A.: Optimizing simulated oxygen variability, circulation, and export in the subpolar North Atlantic Ocean using BGC-Argo & ship-based observations, EGU General Assembly 2023, Vienna, Austria, 23–28 Apr 2023, EGU23-15366, https://doi.org/10.5194/egusphere-egu23-15366, 2023.

EGU23-15631 | ECS | Orals | OS1.5

Continuity Constraints on the Atlantic Meridional Overturning Circulation 

Neil Fraser, Alan Fox, and Stuart Cunningham

In the subtropics, the Atlantic meridional overturning circulation (MOC) has the same strength and variability whether measured in depth- or density-space. Two different continuity budgets must therefore be satisfied north of the subtropics, one via diapycnal volume transport and the other via downward volume transport. However, as water can get denser without getting deeper (and vice versa), it is unclear why the integrated effect of these processes, the MOC, should have the same strength and variability in both depth- and density-space, provided one integrates these terms sufficiently far south (e.g. to 26 °N). Previous work has investigated the surface buoyancy forcing and mixing processes which drive diapycnal volume transport. Here, we use a suite of observational products and new analyses in a vorticity framework to study the magnitude and distribution of the various terms responsible for vertical volume transport, and gain further insight by also evaluating these terms using VIKING20X model output. We conclude that bottom Ekman transport and advection curl around the boundaries of the subpolar gyre, particularly around Greenland, are dominant drivers of downward vertical transport and hence crucial for closing MOC streamlines in depth-space, with much of the variability also projecting onto the MOC in density-space. As these processes are “spun-up” by the sub-polar gyre yet project onto the overturning, our results offer new insights into the coupling between the overturning and gyre circulations.

How to cite: Fraser, N., Fox, A., and Cunningham, S.: Continuity Constraints on the Atlantic Meridional Overturning Circulation, EGU General Assembly 2023, Vienna, Austria, 23–28 Apr 2023, EGU23-15631, https://doi.org/10.5194/egusphere-egu23-15631, 2023.

EGU23-15913 | ECS | Orals | OS1.5

The role of surface forcing in driving pathways and time scales of ocean ventilation in the subpolar North Atlantic 

Alice Marzocchi, George Nurser, Louis Clement, and McDonagh Elaine

The ocean takes up 93 % of the excess heat in the climate system and approximately a quarter of the anthropogenic carbon via air–sea fluxes. Ocean ventilation and subduction are key processes that regulate the transport of water from the surface mixed layer to the ocean's interior, which is isolated from the atmosphere for a timescale set by the large-scale circulation. Using numerical simulations (NEMO framework), we assess where the ocean subducts water and takes up properties from the atmosphere, and how ocean currents transport and redistribute these properties. This is achieved by adding a set of simulated seawater vintage dyes (passive tracers) that are released annually from different ocean surface “patches”, representing water masses’ source regions. The dyes’ distribution captures years of strong and weak convection at deep and mode water formation sites in both hemispheres, showing good agreement with observations in the subpolar North Atlantic. We show that interannual variability in subduction rates, driven by changes in surface forcing, is key in setting the different sizes of the long-term inventory of the dyes. The Northern and Southern Hemispheres are characterised by different ventilation pathways and timescales, but our analysis highlights a strong correlation between the strength of ventilation in recently subducted waters and the longer-term dye inventory in each hemisphere. This means that the conditions close to the time of dye injection are driving the amount of seawater being subducted, but also that this signal persists over time and the longer-term tracer inventory is strongly related to the initial surface conditions. The correlation still holds for the different source regions, where it is even stronger, but the slope of the correlation does vary. Export and isolation of subducted waters is shown to be faster in the Northern Hemisphere, defining a stronger ventilation “persistence” – represented by the slope of the correlation between subduction and the longer-term inventory. The highest ventilation persistence is found in the subpolar North Atlantic and specifically in the Labrador and Irminger Seas, which are the dominant regions in retaining tracer on multi-decadal time scales.

How to cite: Marzocchi, A., Nurser, G., Clement, L., and Elaine, M.: The role of surface forcing in driving pathways and time scales of ocean ventilation in the subpolar North Atlantic, EGU General Assembly 2023, Vienna, Austria, 23–28 Apr 2023, EGU23-15913, https://doi.org/10.5194/egusphere-egu23-15913, 2023.

EGU23-17084 | Orals | OS1.5

The role of propagating signals in the gyre-scale interannual to decadal sea level variability in the subpolar North Atlantic 

Denis Volkov, Claudia Schmid, Leah Chomiak, Cyril Germineaud, Shenfu Dong, and Marlos Goes

The gyre-scale, dynamic sea surface height (SSH) variability signifies the spatial redistribution of heat and freshwater in the ocean, influencing the ocean circulation, weather, climate, sea level, and ecosystems. It is known that the first empirical orthogonal function (EOF) mode of the interannual SSH variability in the North Atlantic exhibits a tripole gyre pattern, with the subtropical gyre varying out of phase with both the subpolar gyre and the tropics, influenced by the low-frequency North Atlantic Oscillation. We show that the first EOF mode explains the majority (60 %–90 %) of the interannual SSH variance in the Labrador and Irminger Sea, whereas the second EOF mode is more influential in the northeastern part of the subpolar North Atlantic (SPNA), explaining up to 60 %–80% of the regional interannual SSH variability. We find that the two leading modes do not represent physically independent phenomena. On the contrary, they evolve as a quadrature pair associated with a propagation of SSH anomalies from the eastern to the western SPNA. This is confirmed by the complex EOF analysis, which can detect propagating (as opposed to stationary) signals. The analysis shows that it takes about 2 years for sea level signals to propagate from the Iceland Basin to the Labrador Sea, and it takes 7–10 years for the entire cycle of the North Atlantic SSH tripole to complete. We demonstrate that the observed interannual-to-decadal variability of SSH, including the westward propagation of SSH anomalies, is the result of a complex interplay between the local wind and surface buoyancy forcing, and the advection of properties by mean ocean currents. The relative contribution of each forcing term to the variability is space and time dependent. We show that the most recent cooling and freshening observed in the SPNA since about 2010 were mostly driven by advection associated with the North Atlantic Current. The results of this study indicate that signal propagation is an important component of the North Atlantic SSH tripole, as it applies to the SPNA.


How to cite: Volkov, D., Schmid, C., Chomiak, L., Germineaud, C., Dong, S., and Goes, M.: The role of propagating signals in the gyre-scale interannual to decadal sea level variability in the subpolar North Atlantic, EGU General Assembly 2023, Vienna, Austria, 23–28 Apr 2023, EGU23-17084, https://doi.org/10.5194/egusphere-egu23-17084, 2023.

CL3 – Future Climate

EGU23-4118 | ECS | Posters on site | CL3.5

Varying contributions of fast and slow responses cause asymmetric tropical rainfall change between CO2 ramp-up and ramp-down 

Shijie Zhou, Ping Huang, Shang-Ping Xie, Huang Gang, and Lin Wang

Tropical rainfall is important for regional climate around the globe. In a warming climate forced by rising CO2, the tropical rainfall will increase over the equatorial Pacific where sea surface warming is locally enhanced. Here, we analyze an idealized CO2 removal experiment from the Carbon Dioxide Removal Model Intercomparison Project and show that the tropical rainfall change features a stronger pattern during CO2 ramp-down than ramp-up, even under the same global mean temperature increase, such as the 2 °C goal of the Paris Agreement. The tropical rainfall during CO2 ramp-down increases over the equatorial Pacific with a southward extension, and decreases over the Pacific intertropical convergence zone and South Pacific convergence zone. The asymmetric rainfall changes between CO2 ramp-down and ramp-up result from time-varying contributions of the fast and slow oceanic responses to CO2 forcing, defined as the responses to abrupt CO2 forcing in the first 10 years and thereafter, respectively, in the abrupt-4xCO2 experiment. The fast response follows the CO2 evolution, but the slow response does not peak until 60 years after the CO2 peak. The slow response features a stronger El Niño-like pattern, as the ocean dynamical thermostat effect is suppressed under stronger subsurface warming. The delayed and stronger slow response leads to stronger tropical rainfall changes during CO2 ramp-down. Our results indicate that returning the global mean temperature increase to below a certain goal, such as 2 °C, by removing CO2, may fail to restore tropical convection distribution, with potentially devastating effects on climate worldwide.

How to cite: Zhou, S., Huang, P., Xie, S.-P., Gang, H., and Wang, L.: Varying contributions of fast and slow responses cause asymmetric tropical rainfall change between CO2 ramp-up and ramp-down, EGU General Assembly 2023, Vienna, Austria, 23–28 Apr 2023, EGU23-4118, https://doi.org/10.5194/egusphere-egu23-4118, 2023.

EGU23-6636 | ECS | Posters on site | CL3.5 | Highlight

Divergent Response of Ocean Regions to Temporarily Overshooting Paris Agreement Warming Levels 

Fabrice Lacroix, Friedrich Burger, Yona Silvy, and Thomas Froelicher

Under current mitigation implementations, it is of increasing likelihood that global warming will exceed the target set by the Paris Agreement (PA) of “well below 2°C”. Correcting for this overshoot through intense carbon dioxide removal could reverse global warming back to safe levels, but the biophysical impacts associated with pathways exposing the planet to dangerous warming levels is essentially unknown. This is particularly the case for the ocean ecosystem, where peak warming could lead to ecosystem threshold exceedance and non-reversible changes. Here, we investigate spatial asymmetries in the response of surface ocean ecosystem stressors to temporarily overshooting the PA target using a novel model framework.

To advance the knowledge on temporary overshoots, we utilized the Adaptive Emission Reduction Approach to design first-order emission pathways to reach given stabilization and overshoot peak temperature targets. With the help of this framework, we performed simulations with the Earth System Model GFDL-ESM2M that overshoot by 0.5°C and 1.5°C, and thereafter returns to the quasi-stabilized warming level of a simulation that respects the PA target.  

Our preliminary analysis shows important differences in regional ocean characteristics between simulations that overshoot the PA target and a simulation that stabilizes at the PA target, despite ultimately reaching the same global surface temperature. For instance, regional sea surface temperatures can differ by over 0.5°C in the extreme overshoot of 1.5°C in comparison to the PA stabilization simulation, even following the overshoot. This spatial heterogeneity is illustrated through the divergent oceanic response of the polar oceans; In northern latitudes, cooler temperatures are simulated through the expansion of the North Atlantic cold spot during the overshoot, which arises through decrease of heat transport of the Gulf Stream owing to the weakening of the Atlantic Meridional Overturning Circulation (AMOC) of around 6 Sv or 30 %. In turn, the Southern Ocean is substantially warmed regionally in the overshoot simulations versus the stabilization, likely originating from increasing cross-ocean transport of heat during the overshoots, an implication that is ongoing even after the temporary overshoots return to the PA warming level. Similar spatial heterogeneities are also found for other ecosystem stressors such as O2 and pH, hinting at potential disruption of regional ecosystems. Our analysis indicates that increased assessment of regional ocean responses to temporary warming exceedance levels and their impacts for regional ecosystems are urgently needed in the scope of fully evaluating trade-offs associated with delaying climate action and overshooting the PA.      

How to cite: Lacroix, F., Burger, F., Silvy, Y., and Froelicher, T.: Divergent Response of Ocean Regions to Temporarily Overshooting Paris Agreement Warming Levels, EGU General Assembly 2023, Vienna, Austria, 23–28 Apr 2023, EGU23-6636, https://doi.org/10.5194/egusphere-egu23-6636, 2023.

EGU23-7511 | ECS | Posters on site | CL3.5

Future northern peatland responses and its climate feedback under overshoot scenarios 

Biqing Zhu, Chunjing Qiu, Thomas Gasser, Katsumasa Tanaka, and Philippe Ciais

Northern peatlands store 300~600 Pg carbon, with approximately half underlain by permafrost. Climate change is progressively threatening this large carbon stock. Future temperature rise is likely to trigger changes in this already vulnerable system and can cause irreversibility or strong hysteresis, increasing natural CO2 and CH4 emissions. However, the role of northern peatlands in carbon cycle under various future emission scenarios is still unclear. Elevated temperature and atmospheric CO2 level may enhance the carbon sink in northern peatlands, while increased decomposition may lead to higher CO2 emissions. At the same time, massive amount of CH4 may be released due to permafrost thaw and other processes induced by future climate change.

The large carbon pool, as well as the often-delayed responses of northern peatlands, is an essential component in evaluating future climate responses, especially under overshoot scenarios. Ignoring the climate impact on this carbon pool may lead to misestimations of the carbon fluxes of terrestrial systems under future emission scenarios. Furthermore, it is critical to fully understand its feedback, which may make a significant contribution to the future carbon budget. Therefore, the role of peat carbon feedback in meeting the Paris Agreement goals must be investigated and quantified.

Significant progresses have been made in representing the northern peatlands with process-based complex land surface models. These results have laid a solid foundation to allow the development of our new peat carbon emulator. Compared to the extended run time required for complex land surface models, our emulator allows for running a large number of scenarios within a short time frame. The parameterizations of the peat carbon cycle, such as vegetation growth, soil carbon accumulation, organic matter decomposition, and CO2 and CH4 emissions are calibrated on five state-of-the-art complex land surface models that specifically represent high-latitude peatlands. By coupling the peat carbon emulator into the compact Earth System Model OSCAR, we incorporated the peatland feedback into global carbon-climate system and explored interactions between multiple feedbacks. Under a series of overshoot scenarios, we show that effective climate change mitigations are needed to prevent peat C loss and consequently positive climate feedback in the future.

How to cite: Zhu, B., Qiu, C., Gasser, T., Tanaka, K., and Ciais, P.: Future northern peatland responses and its climate feedback under overshoot scenarios, EGU General Assembly 2023, Vienna, Austria, 23–28 Apr 2023, EGU23-7511, https://doi.org/10.5194/egusphere-egu23-7511, 2023.

EGU23-8310 | ECS | Posters on site | CL3.5

Does the perspective of Global Mean Temperature decreasing after peak warming in an overshoot pathway matter for adaptation? 

Quentin Lejeune, Chahan M Kropf, and Carl Schleussner

Limited global gas emissions reductions would lead to exceeding 1.5˚C and even 2˚C of global warming compared to pre-industrial levels. Yet many emission scenarios included in the last IPCC report feature a decrease in Global Mean Temperature (GMT) after peak warming, even suggesting that levels compatible with the Long-Term Temperature Goal of the Paris Agreement could be reached again within the 21st century. In contrast with the prominence of overshoot pathways in the literature, their implications for adaptation planning have not been discussed. Many factors are taken into account when it comes to decision-making about adaptation, however it could be argued that the perspective of seeing in the future Global Mean Temperature decrease after peak warming constitutes a disincentive to deploy adaptation measures dimensioned against impacts to be expected at peak warming.


In this study, we take the viewpoint of a decisionmaker who is trying to determine the extent to which they should adapt their assets to optimize costs. We assume that this decision is made in 2040, when global warming has just reached 1.5˚C and that the decisionmaker has full knowledge of the future evolution of GMT and resulting potential impacts from 1-in-100-year tropical cyclones on their assets. We consider three idealized pathways: two overshoot pathways in which GMT peaks in 2060 (at 1.65 or 1.8˚C) before coming back to 1.5 in 2080, and a third one in which it stabilizes at 1.65˚C as of 2060. We then compare the sum of the one-off costs of implementing adaptation measures and of the expected damages from tropical cyclones on the assets for two options: the decisionmaker decides to adapt against the level of damages expected at 1.5˚C, or at Peak Warming (1.65 or 1.8˚C). We also assess the sensitivity of the results to the evolving perceived value of the assets via a discount or growth (inflation) rate.


We find that adapting to impacts at peak warming is more cost-efficient for adaptation measures characterized by high efficiency (effectiveness divided by costs), while adapting to impacts at 1.5˚C is more cost-efficient for measures with low efficiency. In contrast, which option is more cost-efficient does not depend on the GMT pathway, although the differences in total costs between the two options become stronger in pathways that reach higher levels of global warming. Higher discount rates constitute incentives to adapt to lower levels of global warming, whereas this is the opposite for higher growth rates. Overall, these results suggest that the perspective of decreasing GMT in the future plays a limited role in adaptation decisionmaking, and that it should not be perceived as an incentive not to deploy adaptation measures.

How to cite: Lejeune, Q., Kropf, C. M., and Schleussner, C.: Does the perspective of Global Mean Temperature decreasing after peak warming in an overshoot pathway matter for adaptation?, EGU General Assembly 2023, Vienna, Austria, 23–28 Apr 2023, EGU23-8310, https://doi.org/10.5194/egusphere-egu23-8310, 2023.

EGU23-8383 | ECS | Posters on site | CL3.5

Regional surface climate irreversibility under temperature overshoot scenarios 

Norman Julius Steinert, Jörg Schwinger, and Hanna Lee

With the current rate of climate change, exceeding the remaining global carbon budget for a warming target of 1.5 °C becomes increasingly likely. Hence, attention has been put towards carbon dioxide removal (CDR) strategies that, given the required socio-economic feasibility and sustainability, allow temporary emission overshoots. The balance between the potential viability of overshoot scenarios and the associated risks depends on their characteristics and how the global ecosystems respond during and after the overshoot. Here we investigate the global climate and regional ecosystem responses to emission-driven overshoot scenarios of different magnitude, duration and timing, imposing the potential for irreversible changes. Our analysis focuses on the behavior and reversibility of thermodynamic, hydrological, and biogeochemical processes and their impacts on a regional scale. Based on results from state-of-the-art Earth system models, physically driven mechanisms appear to be mostly reversible for moderate overshoot scenarios considering a response lag in the range of decades. However, feedbacks in high overshoot scenarios and biogeochemical processes show signs of irreversibility on a larger spatial scale – some of which have been brought into connection with the crossing of tipping points for certain elements of the Earth system. Our analysis informs about the reversibility of climate system processes, which allows refining thresholds for global climate change mitigation policies. Furthermore, the aspect of partial reversibility of temperature overshoot scenarios might not be the main concern, but rather the impacts and risks occurring during the periods of elevated temperatures during the overshoot.

How to cite: Steinert, N. J., Schwinger, J., and Lee, H.: Regional surface climate irreversibility under temperature overshoot scenarios, EGU General Assembly 2023, Vienna, Austria, 23–28 Apr 2023, EGU23-8383, https://doi.org/10.5194/egusphere-egu23-8383, 2023.

EGU23-11505 | Posters on site | CL3.5

Potential changes of finfish thermal habitat under negative emissions 

Nadine Goris, Jörg Schwinger, Filippa Fransner, Friederike Fröb, and Siv Lauvset

The Paris Agreement has set out the aim to limit global warming to 1.5°C to reduce the risks of climate change. Yet, global carbon emissions continuously increase, such that the option of “negative emissions” – removing CO2 from the atmosphere and storing it on land, underground or in the oceans - is discussed to delay the transition to a zero-carbon society. Among the options discussed are pathways where the 1.5°C temperature goal is temporarily overshot, while negative emissions are subsequently applied to return to a “safe” climate state.  

However, such overshoot strategies might have adverse effects. A previous study showed that a delayed removal of CO2 does not simply lead to a warming while CO2 is increasing, a cooling while CO2 is decreasing and a subsequent steady atmospheric temperature but to a trajectory of warming-cooling-warming. As this response is related to the model´s sensitivity of the Atlantic large-scale ocean circulation, the amplitude of the warming-cooling-warming is most pronounced in the North Atlantic. Here, we extend this study to analyse the impact of the warming-cooling-warming trajectory on Finfish species that are commonly used for Aquaculture, that is Atlantic salmon, gilthead seabream and cobia. Via thermal windows of potential growth ranging from optimal to lethal conditions, we identify temporal fluctuations in the extent of optimal habitats. We anticipate that a more pronounced warming-cooling-warming amplitude exacerbates challenges for the considered species, such that northern habitats are threatened more than southern habitats. We analyse this potential north-south divide in terms of economic and ecological consequences. 

How to cite: Goris, N., Schwinger, J., Fransner, F., Fröb, F., and Lauvset, S.: Potential changes of finfish thermal habitat under negative emissions, EGU General Assembly 2023, Vienna, Austria, 23–28 Apr 2023, EGU23-11505, https://doi.org/10.5194/egusphere-egu23-11505, 2023.

EGU23-14436 | ECS | Posters on site | CL3.5

A precautionary approach to carbon dioxide removal needs 

Gaurav Ganti, Quentin Lejeune, Matthew Gidden, Christopher Smith, Alexander Nauels, and Carl-Friedrich Schleussner

A central finding of the most recent reports of the Intergovernmental Panel on Climate Change (IPCC) is that net zero CO2 emissions are required for stabilizing CO2-induced global average surface temperature increase. However, given substantial uncertainties of the earth system response after reaching net zero CO2, outcomes of long-term declining, or continuously increasing global temperatures after achieving and maintaining net zero CO2 emissions cannot be excluded. At the same time, nearly all emission reduction pathways  assessed by the IPCC, which are consistent with global climate goals, require large-scale deployment of carbon dioxide removal (CDR) to balance remaining positive emissions and to draw down temperatures after a peak. Using evidence from Earth System Models and Simple Climate Models we show that peaking global mean temperature may potentially require net CO2 removals of the order of several hundred gigatonnes (Gt) sustained over multiple decades in case of strong positive earth system feedbacks. We also estimate the contribution of scenario uncertainty (e.g., reduction in emissions of different greenhouse gases) to such net CO2 removal figures. A precautionary approach to ensure a very high chance of peaking of global mean temperature may therefore require the availability of substantial amounts of CDR. Our findings have direct implications for CDR needs in order to achieve the long-term temperature goal of the Paris Agreement. The potential risk of strong earth system feedback outcomes have to be carefully considered when discussing temperature reversal in case of a (temporary) overshoot above the 1.5°C threshold, in particular as there are well-documented biophysical, technological and sustainability limits to CDR deployment.

How to cite: Ganti, G., Lejeune, Q., Gidden, M., Smith, C., Nauels, A., and Schleussner, C.-F.: A precautionary approach to carbon dioxide removal needs, EGU General Assembly 2023, Vienna, Austria, 23–28 Apr 2023, EGU23-14436, https://doi.org/10.5194/egusphere-egu23-14436, 2023.

EGU23-15179 | Posters on site | CL3.5

Physical climate impacts in overshoot scenarios 

Jana Sillmann, Peter Pfleiderer, and Carl-Friedrich Schleussner

With ongoing greenhouse gas emissions it becomes increasingly unlikely that the global mean temperature (GMT) can be stabilized at 1.5°C without considerable negative emissions. As a result, most emission scenarios that would allow to reach 1.5°C GMT at the end of the century are overshoot scenarios: In these scenarios GMT warms until net-zero emissions are reached and slowly starts to cool afterwards. Here we want to have a closer look at the local climate responses after peak warming to get a first idea of potential consequences of overshoots.

The analysis is mainly based on the overshoot scenarios SSP119 and the SSP534-over from the “Coupled Model Intercomparison Project (Phase 6)”. We identify regions in which precipitation or temperature has an asymmetric response to GMT changes around peak warming. In some regions, and especially for temperature related variables, the asymmetries could result from lagged responses in the climate system. However, there are also a number of dynamic mechanisms that could influence local climate signals after peak warming and there are only few regions where analyzed earth system models (ESM) agree on the sign of change.

In many regions, the projected trends in precipitation or temperature after peak warming are in the range of trends that can be found in control runs without anthropogenic forcings. Here, single model initial-condition large ensembles (SMILEs) are necessary to estimate the forced response in overshoot scenarios. For a comprehensive understanding of the mechanisms explaining these non-linear responses to GMT changes around peak warming, more large ensemble simulations of idealized overshoot scenarios for different ESMs would be required.

How to cite: Sillmann, J., Pfleiderer, P., and Schleussner, C.-F.: Physical climate impacts in overshoot scenarios, EGU General Assembly 2023, Vienna, Austria, 23–28 Apr 2023, EGU23-15179, https://doi.org/10.5194/egusphere-egu23-15179, 2023.

EGU23-15477 | Posters on site | CL3.5 | Highlight

Global glacier response to temperature goals overshoot 

Fabien Maussion, Patrick Schmitt, and Lilian Schuster

Glaciers have a delayed response to climate change. As a result, glacier mass loss is expected to continue long after greenhouse gas emissions have stopped as they seek to reach a new equilibrium, with consequences for sea level rise, infrastructure and freshwater resources. However, most glacier projections stop in 2100 and use a small number of greenhouse gas emission scenarios that do not allow linking global temperature targets to glacier change beyond 2100. Here, we compute mountain glacier volume and runoff changes until 2300 under a large suite of synthetic greenhouse gas emission scenarios leading to various levels of overshoots and temperature decline after peak. We show that early temperature stabilization leads to less glacier loss than the overshoot “peak-and-decline” scenarios. We also discuss the potential relevance of global temperature overshoots on water availability from glaciers, before and after peak global temperature.

How to cite: Maussion, F., Schmitt, P., and Schuster, L.: Global glacier response to temperature goals overshoot, EGU General Assembly 2023, Vienna, Austria, 23–28 Apr 2023, EGU23-15477, https://doi.org/10.5194/egusphere-egu23-15477, 2023.

EGU23-15724 | ECS | Posters on site | CL3.5 | Highlight

Overshoot proofing adaptation policies and plans 

Burcu Yesil, Emily Theokritoff, Patrick Pringle, Inga Menke, and Carl-Friedrich Schleussner

With 1.2°C current global warming, it becomes increasingly important to think about overshoot and what this would imply for adaptation. In the face of increasing impacts, more and more thresholds and limits to adaptation will be reached – but if global warming levels are brought down again through the deployment of negative emission technologies, what does this imply for adaptation?

Here, we present a methodology which aims to provide concrete entry points for integrating overshoot risks into adaptation planning, with the objective of strengthening resilience, reducing vulnerability and avoiding maladaptation. We explore concepts such as impact (un)avoidability and (ir)reversibility, key elements of long-term adaptation planning. Ultimately, we aim to develop a step-based approach allowing adaptation planners to formulate and review adaptation policies adequately integrating the concept of overshoot and its implications.

How to cite: Yesil, B., Theokritoff, E., Pringle, P., Menke, I., and Schleussner, C.-F.: Overshoot proofing adaptation policies and plans, EGU General Assembly 2023, Vienna, Austria, 23–28 Apr 2023, EGU23-15724, https://doi.org/10.5194/egusphere-egu23-15724, 2023.

EGU23-2593 | Posters on site | ITS3.5/CL3.6

Coarse and fine root development of street-tree species in different planting soil substrate 

Joscha N. Becker, Stephan Musal, Susann Ocker, Alexander Schütt, and Annette Eschenbach

Climate change increases the pressure on urban street trees by limited soil-water availability during extended heat and dry summer periods. Young and freshly planted trees are particularly affected by soil drought since their root system is not well developed and spatially limited to the volume of the initial root ball. The vitality and survival of these trees is strongly dependent on their ability to quickly exploit a larger rooting zone.

To investigate early tree development and root growth, we established a field trial in a tree nursery within the metropolitan region of Hamburg, Germany. Three tree species (Amelanchier lamarckii, Quercus cerris and Tilia cordata ‚Greenspire‘) were grown in two soil substrates (loam, sand) in five replicates. After three years, we excavated a defined soil volume radially from each tree trunk, and determined root biomass (coarse > 2 mm, and fine < 2 mm diameter) in three distances and three depths. Results were compared to species-specific allometric equations, derived from stem diameter measurements.

While no overall substrate effect appeared for total root biomass, the average fine-root biomass between all species was 59% higher in loam compared to sand. Species wise, A. lamarckii showed 68% lower total root biomass and a lower root spread in sand substrate, compared to loam. This was mainly related to the near complete absence of A. lamarckii‘s coarse roots in sand. In contrast Q. cerris developed larger root biomass in sand substrate, particularly in form of deep fine roots, with a maximum in 60-90 cm depth. This was not reflected in the allometric equation (r = -0.8), indicating a shift in belowground carbon allocation under water stress. Compared to the restricted root system of A. lamarckii and the deep roots of Q. cerris, T. cordata formed an extensive fine root system, with a reduced fine root abundance in sand substrate.

We conclude that the rooting-zone exploitation in planting pits is strongly affected by soil substrate and differs between tree species. Particularly Q. cerris invests in a large deep rooting system under enhanced water stress (i.e. in sand substrate), which is not reflected by common allometric equation methods. Ensuring a healthy urban tree population under climate change, therefore requires the combined consideration of adaptive tree species and present urban soil substrates for new tree plantings.

How to cite: Becker, J. N., Musal, S., Ocker, S., Schütt, A., and Eschenbach, A.: Coarse and fine root development of street-tree species in different planting soil substrate, EGU General Assembly 2023, Vienna, Austria, 23–28 Apr 2023, EGU23-2593, https://doi.org/10.5194/egusphere-egu23-2593, 2023.

EGU23-2682 | ECS | Posters virtual | ITS3.5/CL3.6

Assessing the state of the adoption of Nature-based Solutions for coastal risk management in the Mediterranean basin 

Giulia Motta Zanin, Simon Peter Muwafu, and María Máñez Costa

The ineffectiveness of traditional grey engineering infrastructures to counteract coastal risks such as erosion and flooding, combined with the exacerbation of climate change impacts, is leading scientists, experts and decision makers to devise and implement more adaptive, cost-effective, resilient, sustainable and environment-friendly risk management measures. Nature-based Solutions (NbSs), as an alternative or complement to traditional grey infrastructures for coastal risk management, are gaining importance in the international and EU debate. The Mediterranean Basin is considered one of the most vulnerable regions worldwide mainly due to its population density and concentration of economic activities along the coasts and its borderline climatic balance. It is defined as one of the most critical erosion hotspots in Europe, due to the degradation of coastal areas and the overexploitation and unsustainable practices along the coasts and in the sea, heavily affecting beach tourism, agriculture and fishing activities. Moreover, the Mediterranean coasts are affected by impacts of other phenomena (e.g. storms, floods), exacerbated by climate change. To mitigate and adapt to such environmental and climatic changes, NbSs are considered a promising step-forward, as it is based on the principle that the enhancement and protection of natural processes provide multiple benefits to society, thus ensuring a sustainable provision of benefits and co-benefits and counteracting the negative climate change impacts.

This paper seeks to bring a comprehensive understanding of the state of the adoption of NbSs for coastal risk management in the Mediterranean. To assess the goal, an in-depth analysis based on a literature review of past and current implemented NbSs for coastal risk management in the Mediterranean has been performed. Starting from 162 scientific papers and documents, only 23 fit the goal of the work. Through the support of an innovative four-dimensional matrix, the operationalized classification of the NbSs has been performed. The main result reveals a lack of consideration of NbSs for coastal risk management in the Mediterranean leading to difficulties in helping to facilitate NbS mainstreaming and uptake.

The current study raises the necessity to examine the reasons behind the difficulties in implementing  NbSs for coastal risk management in a complex system such as the Mediterranean, by identifying strengths and gaps.

How to cite: Motta Zanin, G., Muwafu, S. P., and Máñez Costa, M.: Assessing the state of the adoption of Nature-based Solutions for coastal risk management in the Mediterranean basin, EGU General Assembly 2023, Vienna, Austria, 23–28 Apr 2023, EGU23-2682, https://doi.org/10.5194/egusphere-egu23-2682, 2023.

EGU23-3139 | ECS | Orals | ITS3.5/CL3.6

Future climatic suitability of cocoa agroforestry systems with common fruit trees in Cameroon 

Nele Gloy, Paula Romanovska, Abel Chemura, and Christoph Gornott

Climate change is projected to become limiting for cocoa production which can increase drastically the pressure on forest land as cocoa is already now a major driver for deforestation in Cameroon. Therefore, a comprehensive understanding of climate risks that are associated to cocoa production and change in suitability is key for future resilient land use planning.  The nature based solution agroforestry is a common and promising strategy in the face of climate change impacts on cocoa production due to the reduction of heat stress by providing shade and its various co-benefits, as for instance the diversification of income. Crop suitability models are used in assessing the impact of climate change on season-long crop production potential and provide important information for projections of production rates. In this study, we developed an approach to assess the vulnerability of cocoa production in agroforestry systems under climate change considering common fruit tree species (Dacryodes edulis and Mangifera indica) in cocoa plantations in Cameroon. We simulated first the general suitability for cocoa under current and projected climate change and then compared the suitability under an emulated agroforestry system. We considered various climatic parameters such as monthly temperature, mean monthly precipitation, number of hot nights and days, (consecutive) dry months as well as further soil parameters such as pH. Farmers and expert’s opinion were considered through interviews and focus groups to complete and improve data availability on further socio-economic factors that might affect future suitability and productivity within agroforestry systems. We modelled future climate projections with Global Climate Models covering the time period 2015-2100 under the two climate change scenarios SSP1-RCP2.6 and SSP3-RCP7.0. Our results show an important shift of suitable areas and considerable decrease of suitability especially for the fruit trees which should be considered in adaptation planning to ensure future viable production.

How to cite: Gloy, N., Romanovska, P., Chemura, A., and Gornott, C.: Future climatic suitability of cocoa agroforestry systems with common fruit trees in Cameroon, EGU General Assembly 2023, Vienna, Austria, 23–28 Apr 2023, EGU23-3139, https://doi.org/10.5194/egusphere-egu23-3139, 2023.

In order to adapt to sea level rise, sand nourishments are one of the measures to protect the coast from erosion and stabilize shorelines. Marine sands are being dredged from the ocean floor and nourished onto the beach or in the shallow water. To understand the ecological effects of these measurements, the following case study was performed. Both short and long-term effects on aquatic and terrestrial coastal ecosystems were monitored during a 24 months survey which started in June 2021 in Ahrenshoop at the Baltic Sea (Germany). Sediment structure and vegetation along the nourished beach as well as the turbidity plume caused by the nourishment were monitored.
It was shown that it takes around 6 months until the sediment and water conditions prior to the nourishment are met again. This is due to the mechanism of the nourishment itself and depending on the nourished sediment. The algae vegetation was only influenced by seasons and not affected by the nourishment. In contrast, there were major changes in vegetation of the dune since part of the dune was burrowed under the nourished sand. The vegetation coverage decreased as well as the biodiversity in the primary and secondary dune which both were buried under a new layer of sediment that was significantly different and only Ammophila arenaria was restored there. The tertiary dune was not directly affected by the nourishment. Nevertheless, comparisons of the dune with unnourished dunes showed overall lower biodiversity including the tertiary dune.
Sand nourishments can change the ecology of a coastal ecosystem. Even after reinstating similar sediment parameters, the results of the case study suggest that long-term effects occur regarding vegetation of the dune. 

How to cite: Glueck, D.: Can sand nourishments counteract the consequences of climate change while preserving ecosystems: A case study, EGU General Assembly 2023, Vienna, Austria, 23–28 Apr 2023, EGU23-4894, https://doi.org/10.5194/egusphere-egu23-4894, 2023.

EGU23-6288 | Orals | ITS3.5/CL3.6

Systemic design approach for climate change adaptation and enhancement of public health and wellbeing 

Stanislava Boskovic, Pepe Puchol-Salort, Ana Mijic, and Cedo Maksimovic

Climate change-related phenomena are putting an enormous strain on cities’ infrastructure, human livelihoods, public health and citizens well-being. This, together with the increase in urban growth and urbanization, results in an expansion of urban hazards - including water scarcity, disease transmission and consequent social issues.

To address this complexity in an urban design context we introduce a Systemic Design (SyD) framework for Multifunctional Nature-based Solutions (NBS) to rethink and contribute to the planet’s health and people’s quality of life. The SyD approach focuses on context knowledge creation (environmental, climatic, social…) that includes perspectives from the point of view of multiple stakeholders, maps its key features, and analyses alternatives for exploiting different design options. Exploratory or suitability modelling supports all these steps.

The examples here presented are part of the multidisciplinary project euPOLIS focused on climate change adaptation and on enhancement of public health and citizen’s well-being through the implementation of nature-based solutions (NBS). Although diversity of the size and the scale of presented case studies, the systematic baseline analysis have revealed that there are several shared conditions, such as an immediate need for improvement of existing green spaces, mitigation of direct and indirect UHI effect and refinement of maintenance systems.

A mapping of the local features, and variety of specific spatial and social conditions in public spaces studied in euPOLIS’s Cities (Belgrade, Gladsaxe, Lodz and Pireas) gives synthetic prospects to better understand the potential effectiveness of Blue-Green Infrastructure (BGI) solutions (design options) in relation to their wider ecosystem and citizens’ concerns.  This leads to a systematic assessment of possible future scenarios of different scales (local, urban, regional…) and allows an examination of possible steps to better define locally specific variables, evaluation and validation of benefits to reduce existing vulnerability, and to improve community’s liveability.  The systemic design approach allows to explore the main drivers of urban development, climate change mitigation and urban resilience. In this way, it also supports decisions for further planning stages and anticipates actions for the management of the multifaceted hazards of the entire urban system.

How to cite: Boskovic, S., Puchol-Salort, P., Mijic, A., and Maksimovic, C.: Systemic design approach for climate change adaptation and enhancement of public health and wellbeing, EGU General Assembly 2023, Vienna, Austria, 23–28 Apr 2023, EGU23-6288, https://doi.org/10.5194/egusphere-egu23-6288, 2023.

EGU23-6674 | ECS | Posters virtual | ITS3.5/CL3.6

Estimation of crop fractional cover (FCover) in smallholder farming systems using UAV and Sentinel-2 images : Case study of a Senegalese agroforestry parkland 

Ibrahima Diack, Louise Leroux, Benjamin Heuclin, Philippe Letourmy, Serigne Mansour Diene, Alain Audebert, Olivier Roupsard, Abdoul Aziz Diouf, Idrissa Sarr, and Moussa Diallo

Scattered trees in farmer fields, also known as agroforestry parkland, are integrated part of West African smallholder agricultural landscapes. While they are used for centuries by farmers, they are now recognised by the scientific and politic communities as a mean to face climate changes (Skole et al., 2021). Fractional cover (FCover) is an important biophysical parameter allowing to monitor the crop growth. Satellite images has been proven very efficient for crop FCover estimation in various ecosystems (Gräzing et al 2021). However, in agroforestry parklands, the presence of trees inside the fields induced a huge variability that can be hardly captured by traditional approach relying on satellite images and ground information.

We propose an original empirical framework relying on the combining use of UAV-based FCover and Sentinel-2 data to estimate the pearl millet FCover at landscape scale in an agroforestry parkland of Senegal. 6 UAV images were acquired during the 2021 cropping season and the millet FCover has been derived from a threshold of UAV images for 95 subplots on a 3-m grid and used as targeted variable. 4 vegetation indices and 8 texture featured calculated from S2 data were used as models’ predictors. 3 machine learning regression algorithms (RF, GBM and SVM) and a multiple linear regression (MLR) model were calibrated over the 3-m grid using a cross-validation approach and different scenarii of modelling were tested: (1) fit the four models date by date dataset, (2) fit the four models on all dates dataset with and without date information as predictor, (3) single models vs a meta-model resulting from the stacking of the different models.

Our results evidenced that for each model tested the accuracy is dependent to the millet growth stage, the vegetative period being overall the one allowing to reach the higher accuracy. MLR is not adapted to estimate millet FCover (R² between 0.07 and 0.13) while the machine learning models gave overall good results, RF being the better one (R² between 0.45 and 0.69).

We have shown that the use of date information as predictor allowed to improve the FCover estimation (R² increases up to 24%) however, the use of a meta-model didn’t significantly improve the accuracy suggesting that RF, GBM and SVM are robust enough for millet FCover estimation in such kind of landscape.

While the original workflow we proposed in this study need to be confirmed by adding data from the 2022 cropping season, the results obtained show promising opportunities for improving the crop monitoring in heterogeneous landscapes. The next step will be to better understand the influence of trees on the millet FCover, at the field scale and at the landscape scale.

How to cite: Diack, I., Leroux, L., Heuclin, B., Letourmy, P., Diene, S. M., Audebert, A., Roupsard, O., Diouf, A. A., Sarr, I., and Diallo, M.: Estimation of crop fractional cover (FCover) in smallholder farming systems using UAV and Sentinel-2 images : Case study of a Senegalese agroforestry parkland, EGU General Assembly 2023, Vienna, Austria, 23–28 Apr 2023, EGU23-6674, https://doi.org/10.5194/egusphere-egu23-6674, 2023.

EGU23-7009 | ECS | Posters on site | ITS3.5/CL3.6

Estimation of Mangrove Leaf Area Index using Unmanned Aerial Vehicle multispectral imagery 

Mariana Elías-Lara, Jorge Rodríguez, Yu-Hsuan Tu, Javier Blanco-Sacristán, Marcel M. El Hajj, Kasper Johansen, and Matthew F. McCabe

Mangroves are essential ecosystems composed of salt-tolerant plants that grow in tropical and subtropical intertidal zones, acting as a vital link between aquatic and terrestrial ecosystems. Interest in mangrove preservation and restoration has been increasing in recent years due to their important role in climate regulation by capturing and preserving carbon. Despite their importance, these ecosystems are under huge pressure due to human activities. It is estimated that these environments have lost up to half of the area occupied under pristine conditions. Leaf area index (LAI) is a well-known biophysical parameter related to plant health, as it provides information on the water, energy, and CO2 exchange between plants and the atmosphere. Unmanned aerial vehicles (UAVs) have emerged in recent years as a viable solution for ecosystem monitoring, as they allow for rapid and frequent data acquisition of a wide range of wavelengths. In this work, we evaluated the potential of multispectral images acquired by a UAV to estimate the LAI of a mangrove (Avicennia marina) forest located in the coastal area of the Red Sea in the Kingdom of Saudi Arabia. Multicollinearity assessment was performed to select significant variables suited for estimating LAI, including five multispectral bands, a canopy height model, and eight vegetation indices. Multicollinearity assessment was performed with three approaches: the Least Absolute Shrinkage and Selection Operator (LASSO), Random Forest (RF) for variable selection, and Hierarchical Cluster Analysis (HCA). The capability of significant variables to estimate LAI was assessed using the Generalized Linear Model (GLM), RF and Support Vector Machine (SVM). Results showed high estimation accuracy of LAI (R² = 0.91 for GLM, R² = 0.89 for RF and R² = 0.90 for SVM). However, further analysis showed that it is possible to estimate LAI of the mangrove forest with reasonable accuracy (R² = 0.87 for GLM, R² = 0.78 for RF and R² = 0.87 for SVM) using only two variables, the canopy height model and the GreenNDVI. The same variables were used to estimate LAI at another mangrove site and similar results were obtained (R² = 0.74 for GLM, R² = 0.73 for RF and R² = 0.68 for SVM). 

How to cite: Elías-Lara, M., Rodríguez, J., Tu, Y.-H., Blanco-Sacristán, J., El Hajj, M. M., Johansen, K., and McCabe, M. F.: Estimation of Mangrove Leaf Area Index using Unmanned Aerial Vehicle multispectral imagery, EGU General Assembly 2023, Vienna, Austria, 23–28 Apr 2023, EGU23-7009, https://doi.org/10.5194/egusphere-egu23-7009, 2023.

Nature-based solutions are increasingly promoted in regional and national policies as actions to address societal challenges and promote climate change mitigation and adaptation while leading to co-benefits to human well-being and biodiversity. However, several challenges limit the mainstreaming of nature-based solutions in decision-making. Through the presentation of case studies from the island state of Malta, we analyse the (a) use of urban ecosystem service assessment to prioritise nature-based solutions based on existing distributional patterns, (b) recent case-studies of nature-based solutions implementation, and (c) barriers and enablers to mainstreaming nature-based solutions in decision-making. We show how urban ecosystem service assessments can support greening strategies by identifying the most effective nature-based solutions that can play a redistributive role by addressing existing inequalities in ecosystem services supply within cities. Our results also indicate that while nature-based solutions were used to address multiple societal challenges, including tackling drought and heat risk, low place aesthetic value, low green infrastructure availability, and biodiversity and knowledge loss, several gaps in practice remain. We show how nature-based solutions uptake has been more strongly associated with the environmental sector, and social and economic benefits, such as green job creation, social cohesion and ownership by communities, were less often identified in the analysed case-studies. We also show how current bottlenecks, including knowledge gaps regarding the scope, cost-effectiveness and benefits arising from nature-based solutions, and limited practical experience, act as barriers to implementation while the arising public relations, adoption of interdisciplinary approaches involving multiple stakeholders, and the availability of regional guidelines were considered as key enablers. Drawing on these case-studies, we present recent collaborative work aiming at addressing some of the gaps in knowledge and practice, while engaging with communities to co-create nature-based solutions and evaluating the impacts of implementation.

How to cite: Balzan, M.: Planning effective and multifunctional nature-based solutions: insights from the case-study of Malta, EGU General Assembly 2023, Vienna, Austria, 23–28 Apr 2023, EGU23-7092, https://doi.org/10.5194/egusphere-egu23-7092, 2023.

EGU23-7179 | Orals | ITS3.5/CL3.6

Effectiveness of climate change adaptation measures in a drought-prone area 

Beate Zimmermann, Sarah Kruber, and Christian Hildmann

In the state of Brandenburg in eastern Germany, land use is increasingly affected by long-lasting soil moisture deficits in the vegetation period. Therefore, it is important to take measures to improve water retention at the landscape level to delay and mitigate the effects of droughts.

As a first step, we developed a catalog of possible measures that can be implemented on agricultural land, in forests, settlements, and nature reserves in our study area, a 1900 km² county in Brandenburg. Our objective was then to quantify their bio-physical efficacy. The distribution of land surface temperature (LST), which we derived from Landsat thermal images from the vegetation seasons of 2013 to 2020, served as a proxy for environmental conditions that favor water retention. We modeled LST as a function of several parameters of the physical environment such as land cover, forest and crop type. In addition, we incorporated an antecedent moisture index and potential evapotranspiration at time of satellite overpass into the model. With the help of meteorological time series from climate projections, we can thus check to what extent the model results could change in the future.

In this contribution, we will present the modeling framework and results. The model predictions provide a ranking of measures in terms of their effectiveness both within and between land use classes. In agricultural landscapes, for example, the conversion of cropland to forest and, albeit to a lesser extent, to permanent grassland is much more efficient than organic fertilization, agroforestry, or the cultivation of permanent crops. Finally, we discuss possible approaches to using the results for practical recommendations despite the various uncertainties (data and model uncertainty, uncertainty of climate projection data).

How to cite: Zimmermann, B., Kruber, S., and Hildmann, C.: Effectiveness of climate change adaptation measures in a drought-prone area, EGU General Assembly 2023, Vienna, Austria, 23–28 Apr 2023, EGU23-7179, https://doi.org/10.5194/egusphere-egu23-7179, 2023.

Nature-based adaptation Solutions (NbaS) have become central elements for action on climate. With a wide range of forms across different ecosystems, NBaS are now recognized to mitigate the intensity and frequency of climate-related events, to buffer heat stress and to regulate altered hydrological cycles for instance.

The LIFE ARTISAN project (Achieving Resiliency by Triggering Implementation of nature-based Solutions for climate Adaptation at a National scale) aims to promote the implementation of NbaS throughout the French territory (www.life-artisan.fr) in the framework of the National Plan for Climate Change Adaptation. For this purpose, many actions are carried out to facilitate the design, use, assessment and maintenance of NbaS: development of tools, trainings, grid of indicators, taking benefit from 10 pilot sites.

This communication is particularly focused on the way in which the naturation of the urban environment can attenuate heat islands. It presents the thermo-hydric coupling carried out between the Multi-Hydro and Solène-Microclimate models. This new platform is able to simulate both water balance and energy budget to assess the performance of NbaS in stormwater management and microclimate mitigation at the urban project scale. This coupling, based on the evapotranspiration process, was validated by using observed data collected during the ANR EVNATURB project (https://hmco.enpc.fr/portfolio-archive/evnaturb/).

Perspectives are proposed concerning schoolyards. These locations, often highly impervious, appear very relevant for setting up NbaS in order to create cooling islands, while having an educational aim.

How to cite: Versini, P.-A.: Thermo-hydric assessment of Nature-based adaptation Solutions in urban environments, EGU General Assembly 2023, Vienna, Austria, 23–28 Apr 2023, EGU23-9250, https://doi.org/10.5194/egusphere-egu23-9250, 2023.

Photovoltaic electricity, heat, or biomass are potential products of transformed solar radiation on building envelopes. In the urban landscape all of these energy forms can be used. Walls can be heated when left blank (in winter) and plants can generate biomass, which stores CO2. Roof- and facade greening are both discussed climate change mitigation and adaptation strategies, whereas its cooling performance is of highest interest in order to prevent indoor heat stress in urban areas, e.g. in the mid latitudes. Shading is the most effective cooling process before transpiration and insulation, its impact depends on the solar radiation. Therefore, solar radiation must be quantified for a set of typical urban conditions in order to prioritize roof or façade greening as the most effective cooling strategy.

The latitude and the regional climatic conditions have an impact on the radiation absorbed by the roofs and the facades of a city. Additionally, the urban design (street canyon height-to-width ratio, roof-to-facade area ratio, altitude of the facade and roof, albedo) and the building orientation play an important role.

We simulated idealized (clear sky conditions, constant albedo and elevation) and realistic scenarios (accounting realistic mean annual weather conditions) with three simplified urban designs (street canyon height-to-width ratio =1, 0.5, 0), using the meteonorm database for seven latitudinal evenly distributed cities between the equator and Svalbard. We present results for buildings with a roof to facade ratio of 1, 2 and 3 and discuss the corresponding effectiveness of roof and facade greening.

How to cite: Dahm, Y. and Nehls, T.: Seasonal solar radiation input of building surfaces depending on latitude, orientation and urban design- implications for urban greening, EGU General Assembly 2023, Vienna, Austria, 23–28 Apr 2023, EGU23-9635, https://doi.org/10.5194/egusphere-egu23-9635, 2023.

EGU23-10916 | ECS | Posters on site | ITS3.5/CL3.6

Leveraging Climate and Governance Variability to Support Future Protected Area Risk Assessments  

Amina Ly and Noah Diffenbaugh

Protected areas are a critical tool for managing and ensuring the persistence of species biodiversity and land conservation. Their spatial extents are used to measure progress towards land protections by several international targets. However, governance type, management, and enforcement of these protected areas vary sub-nationally, and can influence the efficacy of the designation. Simultaneously, climatic conditions are coupled with species resilience, and changes in climate can be associated with shifts, expansions, and contractions of viable areas for habitat maintenance. Climate change is expected to change baseline climatic conditions globally and is likely to limit the benefits of terrestrial protected areas. Improved understanding of the relationship between governance, regional climate change, and protected areas can further enhance tracking of land cover change and inform protection strategies implemented across spatial scales. To aid in informed decision making at sub-national scales, we combine information on terrestrial sites in the World Database on Protected Areas, historic and future climate projections from CMIP6, and remotely sensed data on vegetation cover (NDVI). We leverage categorical differences in protected area management, as well as climate anomalies through time to explore their relationship to land cover change, and create additional tools for risk assessment that may be used in conjunction with local governance processes

How to cite: Ly, A. and Diffenbaugh, N.: Leveraging Climate and Governance Variability to Support Future Protected Area Risk Assessments , EGU General Assembly 2023, Vienna, Austria, 23–28 Apr 2023, EGU23-10916, https://doi.org/10.5194/egusphere-egu23-10916, 2023.

The intensified accumulation of greenhouse gasses has led to rapid changes in global temperature trends and climate. In urban areas, this issue may also be exacerbated by the Urban Heat Island (UHI) effect. There is an extensive body of studies investigating the effectiveness of nature-based solutions in addressing these concerns. The majority of investigations have been conducted in evaluating the performance of urban greenspaces on cooling the environment since greenspaces can provide significant urban cooling via shade provision, evapotranspiration, and increased albedo. However, there remain some technical constraints for currently widely used methods for quantifying the cooling effect of greenspace. For example, although remote sensing techniques can provide spatially representative temperature observations over large areas from regional to global scales, satellite thermal sensors possess relatively low-spatial resolution. Therefore, this study proposes an effective temperature downscaling method to assess the cooling effect of urban greenspaces based on the high-resolution temperature data. A total of five sites among typical urban communities in a highly-density city/country - Singapore were selected as study areas. The temperature downscaling algorithm proposed in this research combines predictions of both the geographically weighted regression (GWR) and the neural network. Results show that the hybrid temperature downscaling method outperforms the conventional downscaling method on whole territories of study regions. The cooling effect of greenspace improves with both increments in the area and the intensity of greenspace (indicated by the green plot ratio; GnPR) with R2 of 0.12 and 0.24, respectively. The characteristics of the urban built environment can also affect the cooling effect of greenspace with the R2 between the cooling effect and the sky view factor (SVF) ranging from 0.10 to 0.22 among the sites. Based on the high-resolution cooling performance of greenspace, our research offered some interesting findings: (1) small greenspace with low canopy density (e.g., small patches of grassland) may deliver higher temperature than the temperature of surroundings, thus becoming local heat islands. (2) In sites characterized by relatively high SVF, greenspace is less effective in urban cooling with an increase of openness. This suggests the effect of wind in dense high-rise urban built environments. These findings may assist in better planning of urban greenspaces to increase their cooling effects among different urban communities. The model developed in this study can also be used in other studies to study the influences of potential driving factors on the cooling performance of urban greenspace or other types of nature-based solutions at the regional level.

How to cite: Jia, S. and Weng, Q.: Planning of Urban Greenspace for Cooling Singapore: Modeling the Cooling Effects of Greenspace and Urban Morphology, EGU General Assembly 2023, Vienna, Austria, 23–28 Apr 2023, EGU23-11790, https://doi.org/10.5194/egusphere-egu23-11790, 2023.

EGU23-11799 | ECS | Posters on site | ITS3.5/CL3.6

A systemic framework based on the One Health approach to assess the performance of Nature-based Solutions in urban areas 

Aurore Toulou, Lucie Merlier, Bernard Kaufmann, Claire Harpet, and Frédéric Lefèvre

Nature-based Solutions (NbS) in urban areas can be solutions that simultaneously enable adaptation to climate change, preserve biodiversity, and ensure human health and well-being. Since NbS are open systems, their behavior is highly dependent on their interactions with the environment, which are particularly complex and diverse in the urban ecosystem. The dynamics of the urban socio-ecosystem are driven by humans who create new flows, new interactions and further redefine natural ecological processes.  

Urban NbS have the potential to deliver multiple benefits, such as cooling air, regulating the water cycle, capturing pollutants, producing biomass, contributing to the creation of ecological corridors, providing spaces for socialization and recreational activities, and improving quality of life. However, in the literature, their effectiveness is mainly assessed through siloed approaches, making it fragmented and unnuanced, with the outcomes rarely studied together. Following this, we develop a systemic framework, based on the “One Health” approach, to assess NbS as complex systems having interactions with biodiversity, microclimate, and humans. A well-performing NbS is assumed to be a solution in which biodiversity and humans are healthy in a mitigated microclimate. Through this systemic analysis, several outcomes of a NbS are studied together and links can be identified between the underlying processes, as synergies or antagonisms.

This work presents the One Health assessment framework. It is based on semantic work to define the system and conceptualize the One Health approach. It was supplemented by a literature review of studies developing other systemic frameworks and studies on the impacts of NbS. In addition, the framework was first developed for a particular type of urban NbS, green spaces, in order to focus on solutions based on the same objects – lawn, shrub, and tree –, and therefore, with mostly identical ecological functions.

This work was supported by the LabEx IMU (ANR-10-LABX-0088) of Université de Lyon, within the «Plan France 2030» operated by the French National Research Agency (ANR), and the French Agency for Ecological Transition (ADEME).

How to cite: Toulou, A., Merlier, L., Kaufmann, B., Harpet, C., and Lefèvre, F.: A systemic framework based on the One Health approach to assess the performance of Nature-based Solutions in urban areas, EGU General Assembly 2023, Vienna, Austria, 23–28 Apr 2023, EGU23-11799, https://doi.org/10.5194/egusphere-egu23-11799, 2023.

EGU23-13824 | ECS | Posters on site | ITS3.5/CL3.6

Model-based assessment of the effectiveness of Nature-Based Solutions in flood risk reduction: The case of Tamnava River Basin in Serbia 

Laddaporn Ruangpan, Jasna Plavšić, Nikola Rosic, Alex Curran, Ranko Pudar, and Zoran Vojinovic

Urbanization and climate change are making societies around the world more vulnerable to flooding. Effective and sustainable adaptation measures are needed to counteract the impacts of these changes and Nature-Based solutions have gained considerable attention for both mitigation and adaptation methods of flood risk reduction. However, methodologies to evaluate their performance and upscale their implementation are lacking. Performance evaluation in particular is an important process for decision-makers to be able to decide on the most desirable measures to be implemented. The present research aims to develop a methodology for evaluating the effectiveness of NBS in reducing flood risk. The hydrological model (HEC-HMS) and 1D-2D hydrodynamic model (HEC-RAS) were coupled to create probabilistic inundation depth maps. A detailed flood damage model is then built and applied to estimate damage with and without the measures. The flood damage model was developed within the model builder in ArcGIS so that it can be easily replicated with many scenarios. Four measures were selected for the analyses, namely; reforestation, retention ponds, riparian buffer stripes, and bridge removal. This methodology has been applied to the case study of the Tamnava River Basin in Serbia within the EU-funded RECONECT project.

How to cite: Ruangpan, L., Plavšić, J., Rosic, N., Curran, A., Pudar, R., and Vojinovic, Z.: Model-based assessment of the effectiveness of Nature-Based Solutions in flood risk reduction: The case of Tamnava River Basin in Serbia, EGU General Assembly 2023, Vienna, Austria, 23–28 Apr 2023, EGU23-13824, https://doi.org/10.5194/egusphere-egu23-13824, 2023.

EGU23-13851 | ECS | Orals | ITS3.5/CL3.6

Discerning relationships between urban ecosystem connectivity and social vulnerability in a major US city 

Zane Havens, Stephen Macko, and Laura Mogensen

As the body of research surrounding the benefits of Urban Green Infrastructure (UGI) grows, questions regarding how and where UGI is implemented in regards to vulnerable populations require more investigation. Although US cities and municipalities have begun to examine the environmental justice implications of UGI placement, the spatial aggregation and connectivity characteristics of urban ecosystems in vulnerable areas aren’t always considered when making these decisions.  Evidence suggests that connectivity of UGI can influence the ecosystem services UGI provides, but currently research into the differences in UGI connectivity between vulnerable and non-vulnerable populations is sparse. Understanding this relationship can help to better inform decisionmakers on how to effectively address discrepancies in UGI implementation while minimizing the expenditure of municipal resources.

In this case study of Washington, DC, we explore relationships between metrics of ecosystem connectivity derived from high spatial resolution (1m) land cover maps and components of the US Center for Disease Control’s Social Vulnerability Index.  These relationships are analyzed using PCA to uncover correlations between commonly used indicators of social vulnerability and the spatial patterns of land cover in a major US city.

How to cite: Havens, Z., Macko, S., and Mogensen, L.: Discerning relationships between urban ecosystem connectivity and social vulnerability in a major US city, EGU General Assembly 2023, Vienna, Austria, 23–28 Apr 2023, EGU23-13851, https://doi.org/10.5194/egusphere-egu23-13851, 2023.

EGU23-14044 | Posters on site | ITS3.5/CL3.6

Towards the intentional, multifunctional design of green infrastructure 

Lauren M. Cook, Kelly D. Good, Marco Moretti, Peleg Kremer, Bridget Wadzuk, Robert Traver, and Virginia Smith

Nature-Based Solutions (NbS), which are mitigation measures seeking to protect, manage, and restore ecosystems, have been lauded as a solution to multiple environmental challenges in urban areas, including adaptation to climate change and protection of biodiversity. NbS are particularly compelling due to their perceived multifunctionality, or the ability to simultaneously perform multiple ecosystem functions or deliver multiple ecosystem services. However, after several decades discussing the ideas surrounding this broad vision, the implementation of multifunctional NbS in urban areas remains elusive. As several authors have pointed out, this can be due to poor coordination between planning and implementation efforts of NbS elements at the site-level, referred to here as “green infrastructure” (GI).  GI are typically designed for one, maybe two purposes, such as water absorption and/or shade, while other ecosystem services and benefits of GI are a passive consideration, assumed to occur based on principles of ecology. With this approach, the lessons learned, management and best practices of these elements are siloed, and synergies within green infrastructure implementation efforts are often overlooked, limiting comprehensive design and consideration of multi-functionality.

In this literature analysis, we offer a new perspective for the holistic design of multifunctional green infrastructure. First, we identify 15 types of GI elements that encompass a larger system. Second, we establish the “design objective” as a way to intentionally consider various ecosystem functions or benefits before GI implementation. Based on a literature review, we identify 13 design objectives, such as stormwater management, heat mitigation, biodiversity, human health & well-being, and social justice. By cross analyzing the GI elements and design objectives using literature queries, we find that most objectives are indeed siloed among particular elements. For instance, literature on stormwater management-focused elements, such as vegetated and non-vegetated infiltration systems (e.g., rain gardens), is dominated by stormwater management papers. Biodiversity is repeatedly considered in papers related to GI elements that are seldom associated to stormwater management (e.g., trees, parks). Design objectives related to social justice are largely lacking from the GI literature, with the exception of parks, trees, and urban gardens. These findings highlight that efforts for multifunctional GI planning will need to be coordinated across design objectives and elements. Yet, with a vast number of objectives to consider, evaluating all options before implementation may eventually impede the decision-making process and lead to a paradox of choice. A solution could be to follow principles of flexible and adaptable design, allowing for changes in the system along the way to account for new information. Ultimately, inter and transdisciplinary collaboration, research, and coordination are needed to address this multifaceted and critical issue. 

How to cite: Cook, L. M., Good, K. D., Moretti, M., Kremer, P., Wadzuk, B., Traver, R., and Smith, V.: Towards the intentional, multifunctional design of green infrastructure, EGU General Assembly 2023, Vienna, Austria, 23–28 Apr 2023, EGU23-14044, https://doi.org/10.5194/egusphere-egu23-14044, 2023.

EGU23-14076 | ECS | Orals | ITS3.5/CL3.6

A multi-stage analytical framework for the integration of Nature-based Solutions into climate risk management and adaptation 

Elisa Furlan, Elena Allegri, Christian Simeoni, Remy Simide, Geraldine Perez, Bethan O'Leary, Catarina Fonseca, Andrea Critto, and Antonio Marcomini

Climate change and environmental degradation are severely affecting marine and coastal systems and the innumerable ecosystem goods and services on which people rely. As result, biodiversity loss and reductions in ecosystem functioning have been recorded across marine and terrestrial systems. A transformative change in the way we adapt to climate change is needed, centered around preserving and restoring nature. Nature-based Solutions (NbS), an umbrella term for conservation, restoration and other management measures (e.g., regulation law implementation), offer an opportunity to transform climate adaptation pathways while providing environmental and societal benefits. They can act as risk reduction measures and address ecological, political, societal, economic issues at multi-level from individual targeted local interventions to collective regional upscaling.

To facilitate the adoption of evidence-informed NbS responding to environmental targets as posed by relevant EU acquis (e.g., Marine Strategy Framework Directive) and specific contexts, in the frame of the MaCoBioS project, a harmonized modeling framework has been developed. It brings together risk assessment approaches, NbS suitability mapping and a decision-support system guiding the selection of most appropriate NbS in marine and coastal ecosystems. In particular, following a progressive analytical process, Machine Learning techniques and GIS are exploited to recognize risk-prone areas against the combined effect of human and climate-related pressures, while identifying suitable areas for marine-coastal NbS implementation today and into the future. Drawing on this, the designed decision-support system offers a portfolio of potential actionable interventions based on a variety of factors (e.g., from ecological to socio-economic) that will need to be considered during NbS planning and implementation. It allows practitioners an overview of NbS approaches that are best suited to addressing societal challenges, also linked to climate-related risks, thereby potentially helping to achieve value for money from the often-limited resources available for environmental conservation and management.

Overall, the proposed multi-stage analytical framework aims to provide evidence-based guidance on the inter-relations between climate change, biodiversity and ecosystem services, offering a basis for strategic discussions and better alignment of marine-coastal NbS with respect to societal challenges. Its adoption by marine-coastal managers can facilitate an effective pathway towards NbS adoption that enhances the adaptation and resilience capacity of marine-coastal ecosystems.

How to cite: Furlan, E., Allegri, E., Simeoni, C., Simide, R., Perez, G., O'Leary, B., Fonseca, C., Critto, A., and Marcomini, A.: A multi-stage analytical framework for the integration of Nature-based Solutions into climate risk management and adaptation, EGU General Assembly 2023, Vienna, Austria, 23–28 Apr 2023, EGU23-14076, https://doi.org/10.5194/egusphere-egu23-14076, 2023.

Recently, most cities have opted for urban greening as a way to mitigate climate change. However, the urban characteristics, such as the fragmented land cover and harsh environment hard to maintain vegetation healthy, reduce the efficiency of greenery. Therefore, a continuous and scientific management tool is required to mitigate climate change through urban greenery. In this study, we developed the decision-making tool, CMRI (Carbon Management Requiring Index), which can identify the area with low carbon sequestering performance and propose the priority for the carbon management requirement. The index was determined by integrating five parameters; 1) terrestrial carbon storage, 2) terrestrial carbon uptake, 3) soil texture, which implies the capacity for soil carbon sequestration, 4) green area ratio, which means that the chance of carbon management, and 5) landscape context, which represents the edge effect by the adjacent urban landscape. The three parameters of terrestrial carbon storage, green area ratio, and landscape context were estimated based on the 0.25 m land cover map using satellite data through machine learning. The terrestrial carbon uptake was determined by the data-driven model through satellite measurement data. Lastly, we acquired the soil texture data from ISRIC – World Soil Information dataset. We normalized each parameter with the z score method. We applied the index in our test site (Suwon, Republic of Korea), and we mapped CMRI with its spatial resolution of 30 m x 30 m considering the resolution of each parameter. The CMRI values had a gradient which showed the high management demand in the city center and the relatively low in the forest interior. The range of CMRI values was from 0.2 to 0.8. To suggest the priority of carbon management requirements, we divided the CMRI grids into four quarters, low, medium, high, and extremely high. To verify that CMRI represents the carbon management requirement level properly, we plan to validate it by field observation. Three grids in each priority level will be selected to measure the vegetation condition, including DBH and chlorophyll-a content, and soil characteristics, including soil texture, soil carbon stock, and soil respiration. Through principal component analysis (PCA) using field measurement results of the grids, we can weigh each parameter and make the index more accurate.

How to cite: Seo, I. and Yoo, G.: Carbon Management Requiring Index: The Scientific Decision-making Tool for Urban Green Management, EGU General Assembly 2023, Vienna, Austria, 23–28 Apr 2023, EGU23-15045, https://doi.org/10.5194/egusphere-egu23-15045, 2023.

EGU23-15121 | ECS | Posters on site | ITS3.5/CL3.6

A cropland application of Enhanced Weathering in the Mediterranean area to face climate change and preserve natural resources 

Giuseppe Cipolla, Davide Danilo Chiarelli, Salvatore Calabrese, Matteo Bertagni, Maria Cristina Rulli, Amilcare Porporato, and Leonardo Valerio Noto

The goal of limiting the use of natural resources and combatting climate change has led to the improvement of agricultural techniques and the development of some Carbon Dioxide Removal (CDR) techniques, given their proficiency to sequester carbon from the atmospheric CO2 and to store it in more stable forms within oceans, plants, soil, or other terrestrial environments. Among them, Enhanced Weathering (EW) is regarded as one of the most promising. This consists of amending soils with silicate minerals, such as olivine, so as to speed up the weathering process that naturally occurs in soils. This work aims to couple a model for the resolution of the agro-hydrological balance in the active soil layer of croplands (i.e., WATNEEDS model) and a dynamic mass balance model that explores ecohydrological, biogeochemical, and olivine dissolution dynamics, also estimating carbon sequestration rates (i.e., EW model). This latter is composed of different interacting components and takes into account important processes, such as the cation exchange.

From the operational point of view, the EW model is fed by rainfall data, and the outputs of the soil water balance (i.e., infiltration, evapotranspiration, leaching, and runoff rates) estimated by the WATNEEDS at the global scale at a 5 arcminute resolution. In this study, a regional application of both models is proposed to explore EW efficiency in various cropland areas in Sicily (Italy), the largest island of the Mediterranean basin, which is considered a hot spot of climate change. The methodological approach will be developed and tested for four different crops (i.e., olive and citrus groves, vineyards, and fruit trees) that are particularly widespread and profitable in the selected region. Apart from facing climate change, the goal of this study is also to preserve water, thus selecting the most suitable irrigation strategies in the context of a changing climate and olivine amendment prescription. This study may also provide a tool to decision-makers for an actual future application of EW, which can be valid for Sicily and for other parts of the world with similar climatic conditions, soil, and vegetation.

How to cite: Cipolla, G., Chiarelli, D. D., Calabrese, S., Bertagni, M., Rulli, M. C., Porporato, A., and Noto, L. V.: A cropland application of Enhanced Weathering in the Mediterranean area to face climate change and preserve natural resources, EGU General Assembly 2023, Vienna, Austria, 23–28 Apr 2023, EGU23-15121, https://doi.org/10.5194/egusphere-egu23-15121, 2023.

One of the ways to increase green areas that are shrinking due to urbanization is to create urban roadside greenery. Among the various ecosystem services of roadside greenery, carbon uptake plays a significant role in reducing CO2, the main factor of climate change. Multi-layered planting can enhance carbon uptake, which is focused on as an effective method. Hence, the roadside ecosystem consists of trees, understory shrubs, and soil. Although shrubs are as crucial as trees because of the large number of populations per unit area, only a few studies were focused on shrubs. Therefore, considering shrub carbon uptake is necessary for estimating the accurate carbon exchange on the roadside ecosystem.

This study focused on the roadside greenery composed of a tree, shrubs, and soil in the unit 1m x 8m area. The experiment was conducted in Suwon city, the Republic of Korea. The selected tree and shrub are Zelkova serrata and Euonymus japonicus, the most common species in Suwon. Net Ecosystem Exchange(NEE) was calculated by the equation [NEE = NPPtree + NPPshrub + Rheterotroph]. NPPtree was estimated through the allometric equation. NPPshrub and Rheterotroph were calculated through measurements. To calculate NPPshrub, two experiments were conducted. One was field measurement using the closed chamber with LI-820, and another was greenhouse incubation and harvesting. In the field measurement, the closed chamber measured the real-time change of CO2 concentration including leaf photosynthesis and stem respiration, and the results showed the aboveground NPPshrub. Also, environmental factors such as air temperature, PAR (photosynthetically active radiation), and leaf area were collected. In the greenhouse experiment, the results showed the accurate NPPshrub without considering field conditions. With those two results, the equation for calculating field shrub NPP was developed considering field conditions and root respiration. However, the closed chamber has a problem with installation, management, and stability, so the leaf chamber would be more adaptable for field measurement than the closed chamber. For accurate measurement of field shrub NPP, this study also did an experiment using Vaseline to block the stomata to calculate the proportion of stem respiration in the aboveground NPPshrub. The stem respiration can be measured by comparing the CO2 concentration change before and after pasting Vaseline on the shrub leaves in the closed chamber. Soil respiration(Rs) was measured by EGM-5 in the field and used the equation [Rs = Rroot + Rheterotroph].

The results of these experiments accurately estimated NPPshrub and Rheterotroph, and the NEE of the 1m x 8m roadside greenery section could be quantified as 5.23 kg C/yr. This amount could mitigate 1.09% of annual vehicle carbon emissions in Suwon city if roadside greenery is applied on all roadsides in Suwon.

How to cite: Jeong, M. and Yoo, G.: Quantification of Carbon Uptake in Urban Roadside Ecosystem by Measuring Carbon Exchange from the Leaf, Stem, and Root of the Shrub, EGU General Assembly 2023, Vienna, Austria, 23–28 Apr 2023, EGU23-15204, https://doi.org/10.5194/egusphere-egu23-15204, 2023.

EGU23-15256 | ECS | Posters on site | ITS3.5/CL3.6

Stress tests on a modular green wall for greywater treatment 

Elisa Costamagna, Silvia Fiore, Anacleto Rizzo, Fabio Masi, and Fulvio Boano

Water scarcity and sanitation are two challenges deeply related to urbanization and climate change. Thus, the future development of urban areas requires innovative design solutions to increase cities’ resilience (SDG11), looking for new resources. One answer is the use of nature-based solutions (NBS) for wastewater treatment, to provide multiple benefits while transforming a waste into a new resource. Green walls for greywater (GW) treatment are the NBS that converts the unused vertical facades into important ecosystem services, treating the amount of domestic wastewater that excludes the toilet flush. To better understand the removal processes and improve green walls design, pilot studies have been performed in recent years, usually in controlled conditions. However, it is important to evaluate also the influence of more real operating conditions that can stress the biological component or damage the whole system, affecting the effectiveness of the GW treatment.

This study aims to test stressing conditions due to chemical loads caused by variations in GW composition. Fifteen identical vegetated pots have been filled with a mix of coconut fibre and perlite (1:1 in volume) and one Hedera helix per pot. Every pot received 24 L day-1 of standard GW (Diaper et al., 2008), provided in 15-minute batches every hour (HLR=740 L m-2 day-1). The pots were organised in 5 configurations (3 pots each as replicates) and four of them received periodic spikes of modified GW: (i) – always standard GW as control (ii) bleach, (iii) floor cleaner, (iv) drain opener, (v) sodium hydroxide added to the standard recipe at increasing concentrations. The concentration was selected simulating the common use of these cleaning products in buildings, provided with wastewater collecting tanks of different sizes, resulting in (a) 500 ppm for (ii-iv) and 100 ppm for (v); (b) 1000 ppm for (ii-iv) and 200 ppm for (v); (c) 2500 ppm for (ii-iv) and 500 ppm for (v). The input and output water were weekly sampled from May 2022 and different parameters (pH, Temperature, Electric Conductivity, Dissolved Oxygen, Biochemical Oxygen Demand - BOD5, Chemical Oxygen Demand - COD, Sulphate, anionic surfactants - MBAS) have been measured to evaluate the effects on biological systems (plants and biofilm) through their removal performance.

Results showed that all configurations were not damaged by load events (a) and (b). Experiments on high chemical load (c) are still ongoing. The plants’ health was generally similar for all configurations and removal performances for BOD5, COD and MBAS were good for all configurations.

How to cite: Costamagna, E., Fiore, S., Rizzo, A., Masi, F., and Boano, F.: Stress tests on a modular green wall for greywater treatment, EGU General Assembly 2023, Vienna, Austria, 23–28 Apr 2023, EGU23-15256, https://doi.org/10.5194/egusphere-egu23-15256, 2023.

EGU23-15449 | ECS | Orals | ITS3.5/CL3.6

Preliminary results of salt marsh transplants in rewilded coastal wetlands 

Inês Carneiro, A. Rita Carrasco, Karin Didderen, and Ana I. Sousa

The loss of coastal wetlands in the last decades has been dominated by human-induced pressures and sea-level rise. Still, wetlands restoration has gained political momentum (e.g., the UN Decade on Ecosystem Restoration 2021-2030) as means of coastal protection, while supporting nature values and its biodiversity, addressing causes and consequences of climate change and securing ecosystem services for human well-being. Assessing the success of ecological restoration projects is thus critical to support the use of restoration actions as a natural enhancement of ecosystem health and to improve current restoration practices. Though there is plenty of information about seagrass transplant and restoration, less is known about salt marsh restoration.

We conducted a salt marsh vegetation transplant experiment in a rewilded wetland in the Ria Formosa coastal lagoon (South Portugal). This study aimed to (1) advance knowledge on the facilitation of pioneer salt marsh species colonization and development in rewilded wetlands, and (2) monitor the evolution of flora biodiversity and phytosociology over time. Two pioneer and perennial halophyte species, the Spartina maritima and the Sarcocornia perennis, were transplanted from a natural donor place into a rewilded marsh. Biodegradable 3D BESE-elements® were implemented to facilitate the salt marsh plant establishment, sedimentation process, and natural recovery process. Data collected include ecological datasets, sediment characteristics, and hydrodynamics.

Early results from the transplant experiment show that, four months later, S. maritima has successfully adapted to the restored area, while several transplants of S. perennis did not survive after this period. S. maritima leaves length increased on average >30% since the transplant was implemented. The elevation gradient, sediment geochemistry in the transplanted area, and probably the timing of the transplants were found to be determinants for S. perennis survival.  The preliminary results of this study highlight the importance of considering the bio-physical interactions in salt marsh restoration projects, and the use of environmental indicators to evaluate wetland-based solutions performances.

How to cite: Carneiro, I., Carrasco, A. R., Didderen, K., and Sousa, A. I.: Preliminary results of salt marsh transplants in rewilded coastal wetlands, EGU General Assembly 2023, Vienna, Austria, 23–28 Apr 2023, EGU23-15449, https://doi.org/10.5194/egusphere-egu23-15449, 2023.

EGU23-15939 | Orals | ITS3.5/CL3.6

Future forest growth in the UK – a case study of supporting land use decisions for net zero 

Anna B. Harper, Arthur Argles, Peter Cox, Richard Betts, Eddy Robertson, and Ian Bateman

The UK has committed to reaching net zero emissions by 2050, and the government plans to triple current tree planting rates over the next 25 years. This commitment brings up many questions – Where should the trees be planted? If they displace agriculture, where should the displaced food come from, and how should farmers be compensated? And how will future UK woodlands fare in a changing climate?

We are developing a suite of models to address the multifaceted implications of land use change in the UK. The aim is to empower decision makers to understand policy options that would lead to a desired outcome – for example tree planting incentives to maximize greenhouse gas removal. A core component of this modelling framework is forest carbon storage and its sensitivity to climate, CO2, and management. Using km-scale climate forcing from an ensemble of projections, we model forest carbon with JULES, which typically represents the land surface in the UK/Hadley Centre climate models. We include developments to represent forest demography, multiple species, and management. Future climate in the UK is projected to be warmer with drier summers and wetter winters. Therefore, both drought and flooding are concerns for planning future land use.

This study highlights both the mitigation and adaptation potential of UK woodlands, focusing on a case study of locations illustrative of the climate change patterns seen in UKCP18 projections produced by the UK Met Office. We evaluate the potential for carbon removal, as well as impacts of the new woodlands on water resources (runoff and soil water retention) and local surface temperatures. Although higher CO2 levels are expected to enhance growth, the potential for warmer and drier summers pose regional threats to future UK woodlands, even in high mitigation scenarios.

How to cite: Harper, A. B., Argles, A., Cox, P., Betts, R., Robertson, E., and Bateman, I.: Future forest growth in the UK – a case study of supporting land use decisions for net zero, EGU General Assembly 2023, Vienna, Austria, 23–28 Apr 2023, EGU23-15939, https://doi.org/10.5194/egusphere-egu23-15939, 2023.

EGU23-16076 | Orals | ITS3.5/CL3.6

Transformative Adaptation through Nature-Based Solutions: A Comparative Case Study Analysis in China, Italy and Germany 

Anna Scolobig, JoAnne Linnerooth-Bayer, Mark Pelling, Juliette Martin, Teresa Deubelli, Wei Liu, and Amy Oen

This presentation explores how claims for transformative adaptation toward more equitable and sustainable societies can be assessed. We build on a theoretical framework describing transformative adaptation as it manifests across four core elements of the public-sector adaptation lifecycle: vision, planning, institutional frameworks, and interventions. For each element, we identify characteristics that can help track adaptation as transformative. Our purpose is to identify how governance systems can constrain or support transformative choices and thus enable targeted interventions. We demonstrate and test the usefulness of the framework with reference to three case studies of nature-based solutions (NBS): river restoration (Germany), forest conservation (China), and landslide risk reduction (Italy). Building on a desktop study and open-ended interviews, our analysis adds evidence to the view that transformation is not an abrupt system change, but a dynamic complex process that evolves over time. While each of the NBS cases fails to fulfill all the transformation characteristics, there are important transformative elements in their visions, planning, and interventions. There is a deficit, however, in the transformation of institutional frameworks. The cases show institutional commonalities in multi-scale and cross- sectoral (polycentric) collaboration as well as innovative processes for inclusive stakeholder engagement; yet, these arrangements are ad hoc, short-term, dependent on local champions, and lacking the permanency needed for upscaling. For the public sector, this result highlights the potential for establishing cross-competing priorities among agencies, cross-sectoral formal mechanisms, new dedicated institutions, as well as programmatic and regulatory mainstreaming.

How to cite: Scolobig, A., Linnerooth-Bayer, J., Pelling, M., Martin, J., Deubelli, T., Liu, W., and Oen, A.: Transformative Adaptation through Nature-Based Solutions: A Comparative Case Study Analysis in China, Italy and Germany, EGU General Assembly 2023, Vienna, Austria, 23–28 Apr 2023, EGU23-16076, https://doi.org/10.5194/egusphere-egu23-16076, 2023.

EGU23-16310 | ECS | Posters on site | ITS3.5/CL3.6

Accretion capacity in Mediterranean coastal ecosystems. Study case: Ebro Delta 

Lucía Rodríguez Arias, Jordi Pagès Fauria, Candela Marco-Méndez, and Teresa Alcoverro Pedrola

Coastal ecosystems exist at the interface between land and sea and are characterized by their high dynamism, related to the interaction between marine agents (winds, waves, currents, sea level changes) and continental forms and processes. These environments are well known for their great diversity of habitats and communities, a high capacity for sequestering carbon and a range of ecosystem services, but they are also highly sensitive to a variety of natural and anthropogenic factors. The ability to repeatedly observe and quantify the accretion capacity of the environments located in the shoreline is key to present-day coastal management and future coastal planning. This study focused on the Ebro Delta, where we evaluated how the ability to retain sediment in coastal ecosystems, both emerged and submerged (dunes, salt marshes and seagrass meadows), is influenced by the presence or absence of vegetation and other ecological variables such as the patch area, biodiversity orspecies dominance. We carried out transects with a differential GPS to measure ground elevation inside and outside vegetation patches in contrasting habitats to understand the mechanism of sediment retention. In addition, we complemented this data with UAVs orthomosaic data to gather data on a bigger spatial scale. Our results show that the presence of vegetation facilitates sediment retention in all ecosystems. Greater species diversity and larger patch areas increased sediment retention capacity. In dune ecosystems, Ammophila arenaria was significantly better at retaining sediment than any of the other species surveyed, while in salt marshes and seagrass meadows we did not find significant differences between species. We believe that while understanding the abiotic environment and physical drivers of sediment retention in coastal habitats is key, we also need to focus on the ecology of coastal vegetated ecosystems if we are to use them as nature-based solutions. Our study sheds light to how vegetation presence, patch size, patch plant diversity and plant traits influence sediment retention capacity across habitat types and scales, which is useful to face event-scale shoreline changes (e.i. individual storms) and others related to the climate change.  

How to cite: Rodríguez Arias, L., Pagès Fauria, J., Marco-Méndez, C., and Alcoverro Pedrola, T.: Accretion capacity in Mediterranean coastal ecosystems. Study case: Ebro Delta, EGU General Assembly 2023, Vienna, Austria, 23–28 Apr 2023, EGU23-16310, https://doi.org/10.5194/egusphere-egu23-16310, 2023.

EGU23-16330 | Posters virtual | ITS3.5/CL3.6

Spatio-temporal analysis of two decadal (2000 – 2020) landcover changes and spectral indices assessment for major Southeast Asian urban clusters 

Shankar Acharya Kamarajugedda, Fairul Edros Shaikh Bin Shaikh Ahmad, Perrine Hamel, and Raffaele Lafortezza

The world is urbanizing at an unprecedented rate, with the United Nations projecting that 68% of the world’s population will be living in urban areas by 2050. In Southeast Asia (SEA) region, it is expected that 47% of the population will live in urban areas by 2025.  Urbanization patterns in this region are generally associated with rapid population growth, economic development and competing demands for land. SEA is also a hotspot of tropical deforestation due to rapid urbanization, resulting in detrimental impacts to the environment and associated ecosystem services. For example, changes in vegetation due to land use/ land cover (LULC) change impact the thermal environment. The objectives of this study are to i) calculate the land cover changes between 2000 and 2020 for 20 major SEA urban clusters; ii) characterise the change in urban form within SEA urban clusters via landscape metrics used at the neighbourhood-scale; iii) determine the relationship between landscape metrics and urban heat measured by LST; and iv) determine the relationship between landscape metrics and vegetation indices such as NDVI and EVI. Documenting the LULC transitions (2000 – 2020) and the associated impacts on urban heat and vegetation changes can help inform policy, sustainable land management and ecosystem services management using Nature based Solutions. We discuss the results per country, contrasting results for major cities and secondary cities, which show different changes in landscape. 

How to cite: Kamarajugedda, S. A., Shaikh Bin Shaikh Ahmad, F. E., Hamel, P., and Lafortezza, R.: Spatio-temporal analysis of two decadal (2000 – 2020) landcover changes and spectral indices assessment for major Southeast Asian urban clusters, EGU General Assembly 2023, Vienna, Austria, 23–28 Apr 2023, EGU23-16330, https://doi.org/10.5194/egusphere-egu23-16330, 2023.

EGU23-16784 | Orals | ITS3.5/CL3.6

Criteria for assessing the impact of nature-based solutions on groundwater systems 

Adrien Selles, Cécile Herivaux, Philippe Le Coent, and Jean-Christophe Marechal

Nature-based solutions (NBS) involve using natural systems such as wetlands, forests, and rivers restoration, to address challenges related to water, such as flooding, water scarcity, and water quality. Groundwater circulations and processes play a critical role in these natural systems. The solutions applied at the surface will have qualitative and quantitative impacts on groundwater, in this case, we propose the term NBS-GW (nature based solutions on groundwater). Therefore, the impact of the NBS on the groundwater systems should be assessed.

The evaluation of NBS implemented with the objective of sustainable management of groundwater poses particular challenges related to the specificities of aquifers, invisible due to their underground location, whose functioning is complex and highly dependent on the geological context. Many factors influence the hydrogeological effects of a NBS-GW, including the climate, the topography of the watershed, the geology, but also the characteristics of the ecosystems concerned.

The recharge of the aquifers allows to store water during times of plenty, and then it can be released gradually during times of drought providing sustainable base flow in the rivers, helping to mitigate the effects of water scarcity. Moreover, groundwater systems can act as a buffer against flooding by absorbing excess water during heavy rainfall events. NBS can have negative impact if not designed and implemented based on hydrogeological considerations. The benefits of NBS-GW can be maximized by combining different solutions and tailoring them to the specific conditions of a given area.

This work aims to define the criteria to assess the effectiveness of different NBS in terms of their ability to recharge aquifers and improve water quality. NBS-GW can be distinguished according to the type of environment/ecosystem on which the solution acts, by preserving it, by improving its functioning, or by creating a new ecosystem. At the scale of a hydrogeological watershed, we will then distinguish between the solutions implemented (1) in agro-forestry environments, (2) in urban and peri-urban environments, or (3) aimed at aquatic environments.

A review of the scientific literature was carried out in order to characterize the hydrogeological effects of NBS-GW by major type of environment (agro-forestry, urban, aquatic), and to identify the main factors of variation of these effects.

These indicators of hydrogeological effects and efficiency could contribute to the list of NBS impact indicators recommended by the European Commission, which currently do not take groundwater into account.

How to cite: Selles, A., Herivaux, C., Le Coent, P., and Marechal, J.-C.: Criteria for assessing the impact of nature-based solutions on groundwater systems, EGU General Assembly 2023, Vienna, Austria, 23–28 Apr 2023, EGU23-16784, https://doi.org/10.5194/egusphere-egu23-16784, 2023.

In this talk, we will present an innovative French program on Biodiversity and Nature Based Solutions, SOLU-BIOD, driven by the CNRS and INRAe. This is an ambitious (>44 Mio€), long term (9 years) transformative (systemic) program, part of an investment plan of the French Government, which will address the challenges of implementing innovative NbS by tackling three main issues:

(i) an organizational challenge: SOLU-BIOD will structure in France the community of research and practice on NbS in an unprecedented way by making possible highly inter- and transdisciplinary research;  (ii) scientific challenges: SOLU-BIOD will enable highly innovative research, in particular on the roles of biodiversity facets (in particular genetic diversity and evolutionary potential) for NbS; the importance of social processes (legislation frameworks, social norms, financing and governance systems) underlying NbS; the approaches and criteria to assess the effectiveness of NbS with the necessity to go beyond a case-by-case approach; and the creation of models and development of scenarios to design and assess NbS for the forthcoming decades. These scientific challenges will be addressed for four priority cases of NbS, namely NbS based on protected area networks, NbS in agricultural/natural mosaics, urban NbS and coastal NbS; (iii) a knowledge transfer, education and training challenge: SOLU-BIOD will profoundly change access to data and scientific knowledge and capacity building on NbS, through rethinking higher education and academic and continuing training and creating unprecedented access to expertise on these types of solutions in French territories. We will present more particularly the national network of living labs on NbS established by SOLU-BIOD and the research conducted therein.

How to cite: Hossaert, M. and Le Roux, X.: Revising our way to program and support research to tackle the scientific issues of nature-based solutions: the case of France institutions, EGU General Assembly 2023, Vienna, Austria, 23–28 Apr 2023, EGU23-16964, https://doi.org/10.5194/egusphere-egu23-16964, 2023.

EGU23-17063 | ECS | Orals | ITS3.5/CL3.6

Nature-based Solutions (NBS) at work and monitoring their performance – the innovative research case of the EU-funded project euPOLIS 

Anja Randelović, Alfred Figueras, Frida Seidelin, Lars Briggs, and Filip Stanić

Climate change impacts are affecting and will continue to widely affect particularly urban areas and their dwellers. These impacts not only come with economic losses, but also directly threaten the health of urban dwellers, as well as the functionality of urban ecosystems in terms of providing ecosystem services (EES) and ensuring habitats for threatened biodiversity. Nature-based Solutions (NBS) are approaches that can tackle many of these impacts by mimicking natural processes.

In this case, the euPOLIS project, aims at creating cities-for-healthy-people by introducing NBS as a common practice in the urban planning methodologies, to locally improve thermal comfort, enhance biodiversity, mitigate pollution, improve climate resilience, provide open areas that stimulate social exchange and inclusivity, and much more, all contributing to enhancing public health and wellbeing (PH&WB) of citizens. By selecting 4 front-runner cities acting as demo-cases in different biogeographical and climatic regions, NBS are designed and tailored to each urban environment characteristics and problems. An innovative urban planning methodology that actively engage citizens is firstly developed, then tested and finally put into practice in all FR cities and resulting into a set of NBS interventions which aim to enhance the outdoor environmental conditions of the sites, supporting and promoting increased physical activity of citizens (as a precursor for health and well-being enhancements) and providing ground for socio-cultural and business improvements. These NBSs are then, implemented and constructed on each site, and carefully monitored before, under and after construction in order to measure their expected impacts.

The monitoring phase is based on an exhaustive data collection approach of different variables (environmental, social, public health and well-being, urban), which together with the posterior data analysis are expected to be important research tools and methodologies allowing to withdraw evidence-based conclusions of the NBS impacts. Different approaches to monitor NBS will be used, such as biodiversity surveys and environmental modelling, that in combination with in-situ sensors and satellite imagery and will provide insights about the environmental status of the site. In addition, the use of wearables together with health apps will help to determine the effects on PH & WB of citizens. Finally, questionaries on-site along with other qualitative methods will help to shed light on the enhanced social and economic conditions. NBS implemented in the project sites will therefore cover a multi-disciplinary consortium, actively engage citizens for consultation in all phases of the project and have a strong focus on PH & WB with the assessment of multiple co-benefits the solutions can provide. The enhanced EES by the newly introduced NBS, are expected to revitalize the urban ecosystems, protect local biodiversity and by doing so, regenerate the economic, social, cultural aspects of the site. Finally, this process is expected to directly/indirectly improve PH & WB in the demonstration sites.

The euPOLIS Project is on-going and expected to finish by August 2024, when the results and conclusions of the developed urban planning methodologies and NBS impacts on PH&WB will be shared, discussed and potentially scaled-up in other urban environments impacted by climate change. 

How to cite: Randelović, A., Figueras, A., Seidelin, F., Briggs, L., and Stanić, F.: Nature-based Solutions (NBS) at work and monitoring their performance – the innovative research case of the EU-funded project euPOLIS, EGU General Assembly 2023, Vienna, Austria, 23–28 Apr 2023, EGU23-17063, https://doi.org/10.5194/egusphere-egu23-17063, 2023.

Implementing Nature-based Solutions (NBS) will be crucial in the context of the urban environment, as the global share of greenhouse gas emissions attributed to urban areas is - according to the latest IPCC report - increasing. In 2020, urban emissions were estimated at 29 GtCO2-eq. These emissions represent 67-72% of the global share. In that sense, NBS can play an important role. On the one hand, by reducing emissions, and on the other hand, by adapting the environment to the consequences of climate change, such as making the urban environment more resilient to the heat island effect and the increased risk of flooding.

Although investments in NBS infrastructures are considered a cost-effective way to achieve future societal and environmental benefits, the current public spending in Flanders (Belgium) still needs to be increased. As a result, the gap between investments and the societal need for NBS is growing. In contrast to the limited public spending, the private capital seeking for investments is abundant. Yet, the potential to invest private capital in NBS is not fully exploited. NBS projects typically have sizeable upfront costs and diffuse and long-term societal benefits that are not easily captured in steady cash flows. In order to attract private investments to NBS, new business models and alternative financing mechanisms are needed.

This research focuses on land value capture instruments as an alternative financing mechanism for NBS. The interest in this topic, and especially in developer obligations as an alternative financing instrument, has recently grown exponentially among scholars. The developer obligations are related to permits for additional buildings/constructions. In Flanders, however, the legal preconditions imply that the developer’s obligation must have a direct link with the project. This leaves little room for using (incomes from) developer obligations in a non-site-specific way. Although, those additional buildings and the associated sealing of soil, have a clear link with its heat island effect in the cities. Mitigating measures such as cooling nature, forestry, and water surfaces in and near the cities are therefore of vital importance in this era of climate change. 

In this research, the legal context in Flanders will be assessed through in-depth doctrinal legal research. By illustration, the legal framework will be applied to the Stiemervalley NBS case in Genk.

How to cite: Van Esbroeck, C.: Developer obligations as an alternative financing instrument for Nature-based Solutions in Flemish cities: an urban planning law perspective, EGU General Assembly 2023, Vienna, Austria, 23–28 Apr 2023, EGU23-17085, https://doi.org/10.5194/egusphere-egu23-17085, 2023.

EGU23-17125 | Orals | ITS3.5/CL3.6

NBS efficiency-informed urban upscaling methodology: the euPOLIS approach 

Sotiria Baki, Athanasia Kazantzi, and Christos Makropoulos

Nature-Based Solutions (NBS) offer multiple and diverse benefits for both nature and society as they could simultaneously address a spectrum of environmental, social, and economic aspects. The need to upscale urban environments via NBS has resulted in an ever-increasing demand for structured methodologies and easy-to-implement urban design tools to facilitate their adaptation in standard urban policies and modern practices. Within this context, an innovative multi-dimensional, indicator-based NBS assessment framework for enabling a first-order site-specific selection of NBS has been developed herein. The proposed two-step simple, yet systematic, methodological framework enables urban planners to rank a set of candidate NBS, considered for a site of interest, on the basis of multi-dimensional measurable criteria, instead of founding their decision on a purely subjective interpretation of the potential NBS benefits in view of past good practices.

The first step of the proposed methodology exploits readily available data and expert knowledge to eventually deliver an initial site screening through estimating appropriate indicators that monitor site performance in a set of concerns associated with the following categories: (a) Public Health and Well Being, (b) Urban, (c) Environment, (d) Social, and (e) Economic. In particular, urban planners initially perform a qualitative site assessment to evaluate site performance across a list of concerns, representing critical issues identified within each of the aforementioned categories, that could potentially be mitigated via NBS interventions. Although the severity assessment of a particular concern (e.g. air quality, overweight population) is offered in a descriptive form (i.e. High/Moderate/Low/Not a problem/Not a concern), specific thresholds are recommended for each concern to guide stakeholders’ decisions with regards to the transition from one severity state to the other. The second step involves assessing the capacity for each of the NBS identified for the site of interest to mitigate the most pressing site-specific concerns. This NBS impact assessment, likewise the site screening, is performed in a qualitative manner. Hence, based on available literature, past experience and expert opinion, urban planners specify whether a specific NBS could have a Direct/Indirect/No mitigating impact on a particular site concern.

Following the input phase, the information related to the severity of the concerns (step 1) is convolved with the ability of an NBS to impact them (step 2) to produce a ranked list of the site-specific candidate NBS on the basis of their efficiency to address the most pressing site concerns. To facilitate this, a score is assigned to each of the qualitative descriptions in both steps. Through multiplying the two step scores per concern and then summing them, a total score per NBS is computed reflecting the overall NBS site-specific score. Supplementary factors could be accommodated by the proposed framework, to account for other aspects that are likely to affect NBS selection, e.g. budget or other constraints.

The proposed innovative methodology is also offered in the form of an online application, to serve as a decision-assisting tool for undertaking a first-order NBS selection and consequently prioritising further investigation and detailed modelling to appropriate interventions prior to their implementation.

How to cite: Baki, S., Kazantzi, A., and Makropoulos, C.: NBS efficiency-informed urban upscaling methodology: the euPOLIS approach, EGU General Assembly 2023, Vienna, Austria, 23–28 Apr 2023, EGU23-17125, https://doi.org/10.5194/egusphere-egu23-17125, 2023.

Recently, Nature-based Solutions (NbS) have received increasing attention for their potential to contribute to climate change mitigation, as well as disaster risk reduction and adaptation to climate change. Previous research has used a variety of methods to assess NbS and ecosystem- based risk reduction. The overarching question we aim to answer is: How many people do coastal ecosystems protect from the impacts of tropical cyclones and resulting storm surges?

The combination of event-based risk modelling and ecosystem modelling data is a novel approach. This research uses the probabilistic model CLIMADA and ecosystem service data to quantify the coastal protection provided by coastal ecosystems. First, a baseline of the number of people impacted by tropical cyclones in the low-elevation coastal zone globally and the number of people simultaneously within the protection distance of coastal habitats is established. Next, the baseline is compared with historical habitat and population data from 1992. Looking to the future, we investigate changes in coastal protection under climate change (SSP585 in 2050). Finally, scenarios of different options for human action in protecting, managing, and restoring nature in the near future (2050) are appraised: continued forest conversion, agroforestry, mangrove restoration, and reforestation.

Currently, the annual average number of people in the global low-elevation coastal zone protected from tropical cyclones by coastal habitats is 13.84 million, which corresponds to approximately a quarter of all people impacted annually by tropical cyclones in this zone. Historically, the share of protected people has decreased by approximately 4%, both due to population developments and habitat loss. With climate change, the average annual number of people impacted will increase by up to 40%, however, there is a slight decrease in the share of people protected by coastal ecosystems. Protecting, managing, and restoring nature is important to prevent a further decrease in the protection provided by coastal ecosystems globally, but especially on a local scale. While the number of people protected globally only increases slightly across the nature management and protection scenarios, protection in individual countries can increase by around 30% under reforestation or mangrove restoration, and around 5% under agroforestry. These findings form an important basis for NbS policy and use for disaster risk reduction and adaptation to climate change, e.g. by highlighting areas which have both a need for protection and a potential for NbS.

How to cite: Hülsen, S., Kropf, C. M., and McDonald, R.: Nature-based Solutions for disaster risk reduction - How many people do coastal ecosystems protect from tropical cyclones globally?, EGU General Assembly 2023, Vienna, Austria, 23–28 Apr 2023, EGU23-17166, https://doi.org/10.5194/egusphere-egu23-17166, 2023.

EGU23-351 | ECS | Orals | BG3.17

Assessing the Cooling Potential of Land Restoration in Africa with Google Earth Engine 

Jessica Ruijsch, Adriaan J. Teuling, and Ronald W.A. Hutjes

The African continent, although having one of the lowest per-capita contribution to greenhouse gas emissions, is already experiencing the effects of global climate change, resulting in biodiversity loss, droughts, reduced food production, reduced economic productivity and loss of lives. Land restoration and greening practices, such as active reforestation, natural regeneration, and water harvesting are seen as one of the major solutions to mitigate climate change through the carbon sequestration potential of trees. However, land restoration practices can also directly affect the local climate through changes in the biophysical properties of the earth surface (e.g. albedo, evapotranspiration and surface roughness) and can therefore be used as adaptation strategy to reduce the impact of climate change in Africa. Yet, it is currently unknown to what extend land restoration can be used to reduce local temperatures in Africa through biophysical processes, because the net cooling or warming effect of vegetation changes depends on latitude, scale and atmospheric conditions.

In this study, we aim to bridge this gap by determining the biophysical cooling and warming effects of land restoration in Africa. To this end, we use MODIS satellite imagery in Google Earth Engine to analyse the effects of vegetation changes (NDVI) in the twenty-first century on albedo and land surface temperature, after which we apply the found relations to predict the cooling effect of potential large-scale land restoration in Africa. Preliminary results show that increases in vegetation cause biophysical cooling in large parts of Africa and especially in dryland areas. Using these relations, we predict that large scale land restoration can decrease the land surface temperature in some areas up to 5 degrees Celsius. With these results we hope to provide more insight in the climate change adaptation potentials of land restoration projects in Africa, as well as other parts of the world.

How to cite: Ruijsch, J., Teuling, A. J., and Hutjes, R. W. A.: Assessing the Cooling Potential of Land Restoration in Africa with Google Earth Engine, EGU General Assembly 2023, Vienna, Austria, 23–28 Apr 2023, EGU23-351, https://doi.org/10.5194/egusphere-egu23-351, 2023.

EGU23-1934 | ECS | Posters on site | BG3.17

Deforestation intensifies daily temperature variability in the northern extratropics 

Jun Ge, Qi Liu, Beilei Zan, Zhiqiang Lin, Sha Lu, Bo Qiu, and Weidong Guo

While the biogeophysical effects of deforestation on average and extreme temperatures are broadly documented, how deforestation influences temperature variability remains largely unknown. To fill this knowledge gap, we investigate the biogeophysical effects of idealized deforestation on daily temperature variability at the global scale based on multiple earth system models and in situ observations. Here, we show that deforestation can intensify daily temperature variability (by up to 20%) in the northern extratropics, particularly in winter, leading to more frequent rapid extreme warming and cooling events. The higher temperature variability can be attributed to the enhanced near-surface horizontal temperature advection and simultaneously is partly offset by the lower variability in surface sensible heat flux. We also show responses of daily temperature variability to historical deforestation and future potential afforestation. This study reveals the overlooked effects of deforestation or afforestation on temperature variability and has implications for large-scale afforestation in northern extratropic countries.

How to cite: Ge, J., Liu, Q., Zan, B., Lin, Z., Lu, S., Qiu, B., and Guo, W.: Deforestation intensifies daily temperature variability in the northern extratropics, EGU General Assembly 2023, Vienna, Austria, 23–28 Apr 2023, EGU23-1934, https://doi.org/10.5194/egusphere-egu23-1934, 2023.

EGU23-2749 | ECS | Posters on site | BG3.17

Understanding the Effects of Revegetated Shrubs on Energy, Water and Carbon Fluxes in a Semiarid Steppe Ecosystem Using STEMMUS-SCOPE Model 

Enting Tang, Yijian Zeng, Yunfei Wang, Zengjing Song, Danyang Yu, Hongyue Wu, Chenglong Qiao, Christiaan van der Tol, Lingtong Du, and Zhongbo Su

The revegetation practice is one of the most efficient ways to alleviate soil erosion and desertification. However, the land cover change can considerably disturb ecohydrological processes, particularly in arid and semiarid regions where ecosystems are fragile and suffer intense water stress. This study evaluated the effects of revegetation on the energy, water and carbon fluxes in a desert steppe in Yanchi County, Ningxia Province, Northwest China, by simulating two scenarios of shrubs-grassland and grassland ecosystem with the STEMMUS-SCOPE model. The STEMMUS-SCOPE model integrates canopy photosynthesis, fluorescence, energy balance model and soil water and heat transfer model in the soil-plant-atmosphere continuum system. The model was validated by field observations from May to September of 2016-2019, and showed good performances in simulating the energy, water and carbon fluxes. It indicated that the revegetation facilitated carbon fixation (+69.34%). Latent heat flux was the primary consumer of the available energy and was stronger in the shrubs-grassland ecosystem (+16.76%). With the remarkably increased transpiration of the shrubs-grassland ecosystem (+86.72%), revegetation intensified the soil water losses, especially the soil water content within the 0-200 cm depth (−18.97%). Moreover, the water consumption of the shrubs-grassland ecosystem tended to exceed the received precipitation over the growing seasons. These results emphasized the necessity of considering the adverse impacts of revegetation in future ecological restoration, especially the irreversible soil water depletion and imbalance of energy, water and carbon cycles.

How to cite: Tang, E., Zeng, Y., Wang, Y., Song, Z., Yu, D., Wu, H., Qiao, C., van der Tol, C., Du, L., and Su, Z.: Understanding the Effects of Revegetated Shrubs on Energy, Water and Carbon Fluxes in a Semiarid Steppe Ecosystem Using STEMMUS-SCOPE Model, EGU General Assembly 2023, Vienna, Austria, 23–28 Apr 2023, EGU23-2749, https://doi.org/10.5194/egusphere-egu23-2749, 2023.

EGU23-3159 | ECS | Posters on site | BG3.17

Integrating cover crops with no-tillage benefits crop yields, increases soil carbon storage while reducing nitrogen leaching in global croplands 

Jianyong Ma, Peter Anthoni, Stefan Olin, Sam Rabin, Anita Bayer, and Almut Arneth

Increasing crop productivity while keeping detrimental side-effects on the environment low is a major challenge for global agriculture. Cover crops (CCs), mostly grown during the fallow period and incorporated in soils, are expected to improve soil fertility and crop yields while reducing chemical fertilizer use, with climate change mitigation co-benefits. However, quantifying these ecosystem services across global agricultural lands remains uncertain. In this study we investigate how the use of herbaceous CCs with and without biological nitrogen (N) fixation affects yields and cropland carbon and nitrogen balances using the dynamic global vegetation model LPJ-GUESS. Model performance is evaluated against observations from field trials worldwide as well as other published model-based estimates. LPJ-GUESS generally captures the observed enhanced soil carbon, reduced N leaching, and yield changes caused by CCs. We found that the combination of N-fixing CCs with no-tillage management could potentially increase soil carbon storage by 7% (+0.32 Pg C yr-1 in global croplands) while reducing N leaching by 41% (-7.3 Tg N yr-1) compared with bare fallows after 36 years of simulation. This integrated practice is accompanied by a 2% increase in total crop production (+37 million tonnes yr-1 including wheat, maize, rice, and soybean) in the last decade of the simulation. Legume cover cropping is found to contribute more to increasing the subsequent crop yields than non-legumes. The effects of CCs on crop productivity are highly dependent on the main food crop types, chemical fertilizer use, and management duration, with smallest yield changes found in soybean systems and highly fertilized agricultural soils. Our results demonstrate the possibility of conservation agriculture when targeting long-term environmental sustainability without compromising crop production in global croplands.

How to cite: Ma, J., Anthoni, P., Olin, S., Rabin, S., Bayer, A., and Arneth, A.: Integrating cover crops with no-tillage benefits crop yields, increases soil carbon storage while reducing nitrogen leaching in global croplands, EGU General Assembly 2023, Vienna, Austria, 23–28 Apr 2023, EGU23-3159, https://doi.org/10.5194/egusphere-egu23-3159, 2023.

EGU23-3539 | ECS | Posters on site | BG3.17

Land-use following a middle-road socio-economic pathway (SSP2) is not enough to recover mammal populations in Southern-Asia 

André Pinto da Silva, Filip Thörn, Anne-Kathleen Malchow, Damaris Zurell, and Juliano Cabral

Land use is the main direct driver of biodiversity loss and Southern-Asia is, globally, one of the regions under the highest land-use change. Here we estimate how mammals that play a key role in the ecosystem functioning will cope with landscape transformations. We used the a state-of-the-art spatially-explicit agent-based model (RangeShifter) combining local density-dependence on fecundity, stage-structured demographics and dispersal to predict the occupancy and abundance for large-body size carnivorous species (Panthera tigris, Panthera pardus) mid-sized and small carnivorous (Cuon alpinus, Felis chaus, Vulpes vulpes and Prionailurus bengalensis) and two Cetartiodactyla species (Sus scrofa and Gazella benetti) in Southern Asia. In addition, we estimated how species-richness changed through time. The model was projected to the period 1850 to 2100 under two socio-economic pathways, representing an intermediate scenario (SSP2-4.5) and a fossil-fueled development scenario (SSP5-8.5). We found mixed-response to land-use across species. We estimate the mean total proportion of remaining individuals to be 0.60 (SD = 0.24) under SSP2 and 0.64 (SD = 0.37) under SSP5 compared to baseline land use in 1850. The drop in the total number of occupied cells is of lower magnitude (SSP2: mean = 0.82, SD = 0.27; SSP5: mean = 0.84, SD = 0.32). Mean species richness per cell followed a decline throughout the 20th century (mean = 0.90, SD = 0.15) followed by increase from current time up to 2100 under both scenarios (SSP2: mean = 0.95, SD = 0.18; SSP5: mean = 0.97, SD = 0.22). Our results support biotic homogenization with spread of widespread species and restriction of forest-specialists. We confirm a disproportionate and negative influence of loss of non-disturbed patches, and lower landscape permeability in large mammals, potentially leading to considerable change in mammalian biomass in the ecosystem. These findings suggest that a middle-road socio-economic pathway (SSP2) is not enough to maintain or recover populations compared to pre-disturbance levels.

How to cite: Pinto da Silva, A., Thörn, F., Malchow, A.-K., Zurell, D., and Cabral, J.: Land-use following a middle-road socio-economic pathway (SSP2) is not enough to recover mammal populations in Southern-Asia, EGU General Assembly 2023, Vienna, Austria, 23–28 Apr 2023, EGU23-3539, https://doi.org/10.5194/egusphere-egu23-3539, 2023.

EGU23-3754 | ECS | Posters on site | BG3.17

The Biophysical Impacts of Idealized Afforestation on Surface Temperature in China: Local and Nonlocal Effects 

Chaorong Chen, Jun Ge, Weidong Guo, Yipeng Cao, Yu Liu, Xing Luo, and Limei Yang

Afforestation can impact surface temperature through local and nonlocal biophysical effects. However, the local and nonlocal effects of afforestation in China have rarely been explicitly investigated. In this study, we separate the local and nonlocal effects of idealized afforestation in China based on a checkerboard method and the regional Weather Research and Forecasting (WRF) Model. Two checkerboard pattern–like afforestation simulations (AFF1/4 and AFF3/4) with regularly spaced afforested and unaltered grid cells are performed; afforestation is implemented in one out of every four grid cells in AFF1/4 and in three out of every four grid cells in AFF3/4. The mechanisms for the local and nonlocal effects are examined through the decomposition of the surface energy balance. The results show that the local effects dominate surface temperature responses to afforestation in China, with a cooling effect of approximately −1.00°C for AFF1/4 and AFF3/4. In contrast, the nonlocal effects warm the land surface by 0.14°C for AFF1/4 and 0.41°C for AFF3/4. The local cooling effects mainly result from 1) enhanced sensible and latent heat fluxes and 2) decreases in downward shortwave radiation due to increased low cloud cover fractions. The nonlocal warming effects mainly result from atmospheric feedbacks, including 1) increases in downward shortwave radiation due to decreased low cloud cover fractions and 2) increases in downward longwave radiation due to increased middle and high cloud cover fractions. This study highlights that, despite the unexpected nonlocal warming effect, afforestation in China still has great potential in mitigating climate warming through biophysical processes.

How to cite: Chen, C., Ge, J., Guo, W., Cao, Y., Liu, Y., Luo, X., and Yang, L.: The Biophysical Impacts of Idealized Afforestation on Surface Temperature in China: Local and Nonlocal Effects, EGU General Assembly 2023, Vienna, Austria, 23–28 Apr 2023, EGU23-3754, https://doi.org/10.5194/egusphere-egu23-3754, 2023.

In comparison to naturally developed cities, a new town is strategically built in a short period of time according to development plans. It is considered as an appropriate study area for analyzing the urban climate issues such as Local Climate Zone (LCZ) and Urban Heat Islands (UHIs) phenomenon that are differently generated according to urban planning and development. However, there are few research on comparative investigation of new towns based on urban planning due to several external variables such as environmental considerations and economic situations. In this study, we suggest comprehensive method for determining and comparing changes in LCZ distribution and UHI phenomenon in two new towns in South Korea  with different urban planning. The LCZ distribution for each new town was analyzed using Sentinel 1&2 imagery as the main material, and Convolutional Neural Networks (CNN) method, a one of the deep learning algorithms. In addition, the UHI phenomenon was analyzed using Landsat imagery and the constructed LCZ map. These results have the potential to improve knowledge of the thermal environmental implications of urbanization and give guidance for sustainable urban development and maintenance when combined with architectural evaluation models.

How to cite: Lee, K. and Park, S.: Analysis of changes in Local Climate Zone and Urban Heat Island phenomenon of new towns in South Korea according to urban planning, EGU General Assembly 2023, Vienna, Austria, 23–28 Apr 2023, EGU23-4131, https://doi.org/10.5194/egusphere-egu23-4131, 2023.

EGU23-5354 | Posters on site | BG3.17

The influence of canopy structural traits on the understorey air temperature of tropical forests in Borneo 

Erone Ghiznoni Santos, Martin Svátek, Matheus Henrique Nunes, and Eduardo Eiji Maeda

Changes in vegetation structure caused by selective logging have direct impacts on energy exchange and ecosystem functioning, which may result in altered microclimate. In this study, we investigated how selective logging affected microclimate temperatures in tropical forests of Malaysian Borneo. We used structural metrics derived from Terrestrial Laser Scanner (TLS) obtained in 16 permanent forest plots distributed over a logging intensity gradient. The plots were located within the Stability of Altered Forest Ecosystems (SAFE) Project, the world’s largest forest fragmentation experiment. TLS point clouds were used to calculate the following forest structural traits: Canopy Ratio (CR), Effective Number of Layer (ENL), Foliage Height Diversity (FHD), total Plant Area Index (PAI) and PAI layered for each 5 m height, Relative Height (RH) at 25, 50, 75, 95 and 98 percentiles. TOMST-TMS-4 microclimate dataloggers were installed in the centre of each plot to monitor air temperature at 15 cm above ground every 15 minutes during the year 2019. We then tested whether canopy traits derived from TLS point clouds could explain the variability of minimum, mean and maximum air temperature. We found that not recently logged forest plots had consistently lower understory temperatures and lower daily variability in comparison with heavily logged forest plots. Mean daily temperatures decreased by 0.9 °C for each PAI unit. PAI alone, however, could capture only 21% of the microclimate variability between plots, suggesting that structural metrics accounting for the vertical distribution of vegetation are key for a comprehensive understanding of how disturbances arising from logging affect energy dissipation in tropical forests.

How to cite: Ghiznoni Santos, E., Svátek, M., Henrique Nunes, M., and Eiji Maeda, E.: The influence of canopy structural traits on the understorey air temperature of tropical forests in Borneo, EGU General Assembly 2023, Vienna, Austria, 23–28 Apr 2023, EGU23-5354, https://doi.org/10.5194/egusphere-egu23-5354, 2023.

EGU23-5938 | ECS | Orals | BG3.17

Observed and simulated local climate responses to tropical deforestation 

Callum Smith, Jessica Baker, Eddy Robertson, Robin Chadwick, Douglas Kelley, Arthur Argles, Caio Coelho, Dayana Castilho, Paulo Kubota, Isabella Talamoni, and Dominick Spracklen

Tropical deforestation causes local and regional changes in climate through complex biophysical and biogeochemical processes. These processes must be accurately represented in Earth System models for reliable predictions of how future land-use change will impact climate. The impacts of tropical deforestation in the sixth Coupled Model Intercomparison Project (CMIP6) group of models have yet to be fully assessed and evaluated. Here, we use satellite observations to evaluate the local land-surface temperature and precipitation responses to tropical forest loss within CMIP6 simulations analysed at consistent spatial scales. Remote sensed observations show consistent local warming and drying responses to tropical forest loss across all analysed scales from 25 to 200 km. The multi-model mean broadly agrees with observations, although some models simulate increased rainfall and local cooling due to tropical deforestation, opposite to the observed response. We explore potential reasons for this discrepancy within the models. This work provides key insights for specific model improvement in relation to real-world observations. 

How to cite: Smith, C., Baker, J., Robertson, E., Chadwick, R., Kelley, D., Argles, A., Coelho, C., Castilho, D., Kubota, P., Talamoni, I., and Spracklen, D.: Observed and simulated local climate responses to tropical deforestation, EGU General Assembly 2023, Vienna, Austria, 23–28 Apr 2023, EGU23-5938, https://doi.org/10.5194/egusphere-egu23-5938, 2023.

EGU23-6294 | ECS | Orals | BG3.17

Expansion of soybean plantations into new agricultural frontiers may worsen the climatic impacts of deforestation in the Amazon Basin 

Jie Zhang, Jin Wu, Alice Catherine Hughes, Jed Kaplan, and Eduardo Maeda

Over the past 20 years, soybean cultivation has expanded rapidly across the Amazon Basin. There has been growing evidence that the conversion from forest to croplands can worsen the climatic impacts of deforestation, in comparison to other land use conversions, such as forest to rural settlements, or pastures. This research applied process model simulations to clarify the biophysical mechanisms of regional climatic changes associated with the most common land use transitions in the Amazon Basin.  Our results suggest that soybean plantations, due to their minimal vegetation cover and/or seasonal bare land at harvest or planting periods, transmit more longwave radiation to the atmosphere than pastures or forests, leading to an increase in atmospheric temperature. Although the vegetation properties of the soybean plantations tend to increase the surface heat flux, resulting in a stronger surface heat lifting effect, due to the reduction of the water vapor content in the boundary layer, the regional precipitation will also be affected and reduced. Changes in atmospheric boundary layer elements are more pronounced over soybean plantations than in pastures, thereby confirming previous research that large-scale commodity crops will exacerbate regional climatic change in the Amazon Basin. Furthermore, we provide evidence that large-scale soybean plantations have more pronounced climatic impacts in the northern and western Amazon Basin, suggesting that as large-scale soybean plantations continue to expand into new agricultural frontiers, climatic changes associated with it are likely to be magnified. 

How to cite: Zhang, J., Wu, J., Hughes, A. C., Kaplan, J., and Maeda, E.: Expansion of soybean plantations into new agricultural frontiers may worsen the climatic impacts of deforestation in the Amazon Basin, EGU General Assembly 2023, Vienna, Austria, 23–28 Apr 2023, EGU23-6294, https://doi.org/10.5194/egusphere-egu23-6294, 2023.

EGU23-6863 | Posters on site | BG3.17

Adaptation strategies in Europe: the biophysical impact of forest cover change on climate simulated at high spatial resolution 

Luca Caporaso, Matteo Piccardo, Emanuele Massaro, Gregory Duveiller, and Alessandro Cescatti

Forests can significantly influence local climate both by altering the carbon cycle (biogeochemical effects) and changing the surface energy budget (biophysical effects). Recent debates on the impacts of forestry and deforestation on the climate have focussed on trees' capacity to store carbon, but usually, the biogeophysical implications are not taken into account. In this study, we explore how regional-scale forestation and deforestation affect the Earth's energy balance, which in turn affect temperature and precipitation. We perform simulations where the vegetation cover is either increased or decreased while the carbon dioxide mixing ratio is kept constant, at a convection-permitting grid spacing of 5 km over the larger European domain using the regional climate model (RegCM4) coupled with CLM4.5. Over a time window of 11 years from 2004 to 2014, we study how the change in the forest cover affects the main atmospheric variables both at local level (local effects) and in the neighborhood (non-local effects). The need for a comprehensive understanding of how forests and climate impact each other is nowadays particularly relevant for Europe, and our analysis is one step forward in the direction of supporting the design of new policies and adaptation plans by pointing out the areas where afforestation efforts could mitigate the effects of climate change. This would improve the design of ambitious environmental policies like the European Green Deal project.

How to cite: Caporaso, L., Piccardo, M., Massaro, E., Duveiller, G., and Cescatti, A.: Adaptation strategies in Europe: the biophysical impact of forest cover change on climate simulated at high spatial resolution, EGU General Assembly 2023, Vienna, Austria, 23–28 Apr 2023, EGU23-6863, https://doi.org/10.5194/egusphere-egu23-6863, 2023.

Afforestation is an important mitigation strategy to climate change due to its carbon sequestration potential. Besides this positive biogeochemical effect on global CO2 concentrations, afforestation also affects the regional climate by changing the biogeophysical land surface characteristics. In this study, we investigate the effects of an idealized global CO2 reduction to pre-industrial conditions by a Europe-wide afforestation experiment on the regional longwave radiation balance, starting in the year 1986 from a continent entirely covered with grassland. Results show that the impact of biogeophysical processes on the surface temperatures is much stronger than of biogechemical processes. Furthermore, biogeophysically induced changes of the surface temperatures, atmospheric temperatures and moisture concentrations are as important for the regional greenhouse effect as the global CO2 reduction. While the greenhouse effect is strengthened in winter, it is weakened in summer. On annual total, a Europe-wide afforestation has a regional warming effect, despite reduced CO2 concentrations. Thus, even for an idealized reduction of the global CO2 concentrations to pre-industrial levels, the European climate response to afforestation would still be dominated by its biogeophysical effects.

How to cite: Breil, M., Krawczyk, F., and Pinto, J.: The response of the regional longwave radiation balance and climate system in Europe to an idealized afforestation experiment, EGU General Assembly 2023, Vienna, Austria, 23–28 Apr 2023, EGU23-7539, https://doi.org/10.5194/egusphere-egu23-7539, 2023.

EGU23-7863 | ECS | Posters on site | BG3.17

Measures of effectiveness to compare the climate mitigation potential of afforestation and BECCS 

Sabine Egerer, Stefanie Frank, and Julia Pongratz

The climate mitigation potential of terrestrial carbon dioxide removal (CDR) methods remains highly uncertain depending on the timing and magnitude of climate mitigation but also due to model uncertainty in the underlying Earth System models. In addition to these uncertainties, there are different approaches to measuring the effectiveness of CDR methods for climate change mitigation. In our study, we introduce various measures of effectiveness and evaluate the climate mitigation potential of afforestation and bioenergy plants under the low-emission scenario ssp126. To do this, we use the land component JSBACH3 of the Earth System Model MPI-ESM; afforestation is represented as the spatial increase of four forest plant functional types. Bioenergy plants are represented as highly efficient C4 plants (miscanthus and panicum). There are various assumptions concerning fossil fuel substitution and carbon capture and storage. Measuring effectiveness over time, we show how bioenergy plants become more effective over the long term compared to afforestation. In addition to this temporal measure, the climate mitigation potential of bioenergy plants depends significantly on the rate of fossil fuel substitution. Lastly, the spatial extent that is needed to match a given CDR amount in time by afforestation and BECCS can be quantified. Our study thus asses and compares the potentials of the two CDR methods highlighting the various perspectives of assessment.

How to cite: Egerer, S., Frank, S., and Pongratz, J.: Measures of effectiveness to compare the climate mitigation potential of afforestation and BECCS, EGU General Assembly 2023, Vienna, Austria, 23–28 Apr 2023, EGU23-7863, https://doi.org/10.5194/egusphere-egu23-7863, 2023.

EGU23-8607 | ECS | Orals | BG3.17

Importance of land cover scenarios in a low warming world 

Steven De Hertog, Felix Havermann, Suqi Guo, Julia Pongratz, Iris Manola, Fei Luo, Dim Coumou, Edouard Léopold Davin, Sonia Isabelle Seneviratne, Quentin Lejeune, Inga Menke, Carl-Friedrich Schleussner, Florian Humpenöder, Peter Lawrence, Louise Chini, George Hurtt, Wim Thiery, and Alexander Popp

Land cover and land management changes (LCLMC) have often been highlighted as crucial regarding climate change, both for mitigation (e.g. afforestation) and adaptation (e.g. irrigation). In order to understand this role we present fully coupled Earth System Model (ESM) simulations using external forcing conditions from the SSP1-1.9 scenario, except for land cover and land management scenarios that follow differing trajectories. First we conduct a short 30-year historical simulation (histCTL) and a future (years 2015-2100) simulation under SSP1-1.9 conditions but with present day land cover kept at constant end of 2014 conditions (futCTL). These allow us to isolate climate changes in response to the SSP1-19 forcing, but in the absence of land cover changes. Secondly we conduct two simulations under SSP1-1.9 forcing, but with land cover and land management following two different trajectories. These trajectories are derived from the scenarios presented in Humpenöder et al. (2022) and represent two strongly diverging worlds with regard to socio-economic development, environmental protection, and land-based mitigation: (i) the future sustainability scenario (futSust) in which the land sector experiences sustainable development and application of mitigation strategies (such as greenhouse gas emission pricing) in all countries, (ii) the future inequality scenario (futIneq) in which these developments mostly happen in OECD countries, with the rest of the world continuing on current trends (including massive tropical deforestation). Each of these simulations have been run with three different ESMs (CESM, MPI-ESM and EC-EARTH) in order to identify how robust these results are over different ESMs.

The results of these simulations can be used to increase our understanding of the role of land cover scenarios within a low-warming future as prescribed by the Paris agreement. We can compare the effects of all other forcings (futCTL- histCTL; CO2, aerosols etc.) to the effects of land cover changes in the different scenarios (futSust – futCTL or futIneq-futCTL) as well as to the difference between the future sustainability and the inequality narratives (futSust-futIneq). These results will be analysed for temperature and moisture fluxes, mainly focusing on warm and dry extremes and how land cover scenarios affect these.


References

Humpenöder, F., Popp, A., Schleussner, C. F., Orlov, A., Windisch, M. G., Menke, I., Pongratz, J., Havermann, F., Thiery, W., Luo, F., Jeetze, P. V., Philipp Dietrich, J., Lotze-Campen, H., Weindl, I. & Lejeune, Q. (2022). Overcoming global inequality is critical for land-based mitigation in line with the Paris Agreement. Nature Communications, 13(1), 1-15.

How to cite: De Hertog, S., Havermann, F., Guo, S., Pongratz, J., Manola, I., Luo, F., Coumou, D., Davin, E. L., Seneviratne, S. I., Lejeune, Q., Menke, I., Schleussner, C.-F., Humpenöder, F., Lawrence, P., Chini, L., Hurtt, G., Thiery, W., and Popp, A.: Importance of land cover scenarios in a low warming world, EGU General Assembly 2023, Vienna, Austria, 23–28 Apr 2023, EGU23-8607, https://doi.org/10.5194/egusphere-egu23-8607, 2023.

EGU23-9625 | ECS | Orals | BG3.17

The effect of agricultural intensification and population growth in the local climate. A case study of the Ecuadorian Amazon. 

Doris Álvarez-Lozano, David Rivas-Tabares, and Andrea Urgilez-Clavijo

Among the most important transitions in land use change detected in the Ecuadorian Amazon, two stand out: i) agricultural intensification/rotation and ii) the expansion of populated areas. Both are the result of rural development in recent decades on the slope hills of Ecuador towards the Amazon. The changes registered in the landscape are the consequence of an intensification of forestry, agricultural, livestock and mining activities, which has negatively impacted ecosystems, causing loss/mobilization of fauna and biodiversity. Consequently, ecosystems have also been affected by changes in local climatic characteristics with different degrees of affectation. Local changes in temperature, soil moisture, relative humidity, and wind speed are studied in detail in order to improve decision-making regarding conservation and remediation actions for the Amazon biome. In this study, based on land use and cover maps, spatiotemporal analysis of the evolution of the two transitions was carried out, coupled with an analysis of time series of climatic variables. Contrast analysis with long persistence was carried out in the surroundings of changed patches to confirm the climatic variation because of the transition according to LULCC. A landscape ecology approach was used to support and characterise the analysis of transitions and their relationship with the dynamic characteristics and trends of climatic variables. As a preliminary result, a detected set of points with the greatest territorial dynamics associated with local climate change. This set of patches is valuable to prioritize actions in the short term.

Acknowledgements

The authors acknowledge the support of the Master in Climate Change, Agriculture and Sustainable Rural Development (MACCARD), co-funded by the Erasmus + Programme of the European Union. The authors also acknowledge support from European Union NextGenerationEU and RD 289/2021 and the support of Project No. PGC2018-093854-B-I00 of the Ministerio de Ciencia, Innovación y Universidades de España.
 

References

  • Urgilez-Clavijo, A., de la Riva, J., Rivas-Tabares, D. A., & Tarquis, A. M. (2021). Linking deforestation patterns to soil types: A multifractal approach. European Journal of Soil Science, 72(2), 635-655.
  • David Rivas-Tabares, Ana M. Tarquis, Ángel de Miguel, Anne Gobin, Bárbara Willaarts. Enhancing LULC scenarios impact assessment in hydrological dynamics using participatory mapping protocols in semiarid regions. Sci. Total Environ., 803, 149906, 2022. https://doi.org/10.1016/j.scitotenv.2021.149906
  • Urgilez-Clavijo, A., Rivas-Tabares, D. A., Martín-Sotoca, J. J., & Tarquis Alfonso, A. M. (2021). Local Fractal Connections to Characterize the Spatial Processes of Deforestation in the Ecuadorian Amazon. Entropy, 23(6), 748.

How to cite: Álvarez-Lozano, D., Rivas-Tabares, D., and Urgilez-Clavijo, A.: The effect of agricultural intensification and population growth in the local climate. A case study of the Ecuadorian Amazon., EGU General Assembly 2023, Vienna, Austria, 23–28 Apr 2023, EGU23-9625, https://doi.org/10.5194/egusphere-egu23-9625, 2023.

EGU23-9741 | Orals | BG3.17

Carbon losses and gains from agricultural ecosystems – what happened, where are we, and where do we go from here? 

Carl Bernacchi, Bethany Blakely, Taylor Pederson, Caitlin Moore, Nuria Gomez-Casanovas, Christy Gibson, Anya Knecht, Tilden Meyers, Kaiyu Guan, Evan DeLucia, Emily Heaton, and Andy VanLoocke

A generally accepted understanding of carbon in agricultural fields is that (1) a significant amount of carbon was lost from soils when land was converted from natural vegetation to agricultural ecosystems, (2) over time a steady-state soil carbon concentration is reached with standard agronomic practices, and (3) that improved management practices or optimal crop species selection can result in increased carbon storage over time.  The extent of the carbon lost from conversion from native to agricultural ecosystems is variable, but multiple studies show that carbon losses were large and consistent (supporting point 1).  While an assumption of steady state is generally accepted (point 2), there are significant challenges in measuring whether mature agroecosystems are gaining or losing carbon.  Multiple strategies are continually proposed to increase soil carbon storage (point 3), yet data is sparce given the plentitude of potential opportunities being considered.  Furthermore, direct analysis of soil carbon is prone to substantial heterogeneity, leading to challenge in detecting signals relative to noise in heterogeneous soil environments.  Eddy covariance measurements, while unable to measure pools of carbon in the soil directly, can infer changes in ecosystem carbon storage when measurements are integrated over time.  Here, long-term eddy covariance datasets were used to measure carbon and water fluxes over agricultural ecosystems in the Central Midwestern United States over multiple years for different crop and management practices.  The measurements show that conventionally tilled Midwestern row crops, maize and soybean, integrated on a rotational basis typical for this region represents a large carbon source to the atmosphere, counter to point 2 above.  However, similar measurements over the same agroecosystem but with conservation tillage practices indicate long-term carbon storage, even after 20+ years of conservation tillage with significant climate variability.  These results suggest that large-scale adoption of no-till practices can significantly reduce the large-scale losses of carbon associated with conventional tillage and, potentially, lead to small but meaningful increases in soil carbon storage, supporting point 3.  Similar measurements were also collected over perennial grass ecosystems with potential for bioenergy production, including Miscanthus giganteus, Panicum virgatum, and high species diversity prairie.  While these agricultural ecosystems show promise for offsetting fossil carbon emissions, they are also predicted to be better at storing carbon than annual row crops.  Multiple years of analysis from these ecosystems show that perennial bioenergy crops are much more likely to lead to ecosystem carbon storage than minimally-tilled annual row crops as early as the first year of transition, but the amount of storage varies based on which species is planted.  While this research is focused on one location, the results suggest that the assumptions of steady-state and increases in storage over time may not hold for all agricultural ecosystems and in all locations.

How to cite: Bernacchi, C., Blakely, B., Pederson, T., Moore, C., Gomez-Casanovas, N., Gibson, C., Knecht, A., Meyers, T., Guan, K., DeLucia, E., Heaton, E., and VanLoocke, A.: Carbon losses and gains from agricultural ecosystems – what happened, where are we, and where do we go from here?, EGU General Assembly 2023, Vienna, Austria, 23–28 Apr 2023, EGU23-9741, https://doi.org/10.5194/egusphere-egu23-9741, 2023.

Vegetation change is one of the essential indices of global change. In the past 30 years, based on the remote sensing records, the whole world has shown an overall greening phenomenon, accompanied by regional browning. How to identify the drivers of regional-scale vegetation change, especially to distinguish between climate change and human activities remains a great challenge. Modeling studies show that the CO2 fertilization effect plays a dominant role, but the significant greening contribution of farmland areas at the global scale seems to indicate that human land management (LMC) activities have a huge impact. Methods can be divided into two categories: model and observation statistics. Models are easy to quantify contributions but lack descriptions of LMC processes, and regional-scale statistical methods are difficult to identify driving factors. This study proposes the theory of Paired Land Use Experiment (PLUE), which selects areas with large differences in land management and consistent climate change to achieve "control" of climate change and attribute the difference in vegetation change to on the LMC. The PLUE theory was applied in two selected regions around the world. First, the Khabur River plain on the border between Syria and Turkey was selected. The two countries occupy roughly the same area of the plain. The climate conditions on both sides are consistent with the changes, and the interannual time series correlation coefficient of the Enhanced Vegetation Index (EVI) after detrending exceeds 0.8 (p <0.01). For multi-year trends, this difference can be attributed to LMC. Combined with relevant reports on Syrian social development, social unrest has caused serious degradation of land management capabilities. Therefore, social unrest and occasional severe natural disasters have led to a continuous decline in land management capabilities in the region, further contributing to the "browning" of Syrian vegetation. Secondly, the Sanjiang Plain was selected. China and Russia roughly divided the plain into two, with farmland and temperate savannah as the main vegetation types on both sides. The temperature and precipitation changes in the two places were basically the same, and the leaf area index (LAI) showed a significant growth trend with the same magnitude. However, the seasonal characteristics of the LAI trend in the two regions are significantly different. Using the PLUE method, it can be seen that this difference is caused by land management, including the expansion of paddy fields and the increase in farmland management intensity (mechanization, pesticide and fertilizer application). At the same time, it is found that the climate residual method will give false conclusions in the attribution of interannual changes. In summary, the PLUE method can directly identify land management activities other than climate elements from observations at the regional scale, which is helpful for further research on the driving forces of long-term vegetation change trends.

How to cite: Chen, T.: the Paired Land Use Experiments (PLUE) theory in driver identification of regional vegetation change, EGU General Assembly 2023, Vienna, Austria, 23–28 Apr 2023, EGU23-10578, https://doi.org/10.5194/egusphere-egu23-10578, 2023.

EGU23-10587 | Posters virtual | BG3.17

Future Land Use Change projection under SSP-RCP scenarios over Ethiopia 

Ermias Sisay Brhane and Koji Dairaku

Land use land cover (LULC) data are crucial for modeling a wide range of environmental conditions. So far, access to high-resolution LULC products at a global and regional scale for public use has been difficult, especially in developing countries/regions (Doelman et al., 2018). Land Use Land Cover (LULC) change simulation models are a powerful tool for analyzing the causes and effects of LULC dynamics under different scenarios. Scenario-based simulations of future land-use change can provide important information for evaluating the impacts of land strategies under different conditions. In this study, we project the future land use data at a 1-km resolution that comprises six land use types, adopting the newest integrated scenarios of the shared socioeconomic pathways and the representative concentration pathways (SSPs-RCPs) over Ethiopia. To generate this high-resolution land-use product, we use the FLUS model to simulate future land-use dynamics. The process of developing a future land dataset for Ethiopia can be divided into two parts. The first part is the estimation of the future area demands of different land use types under different SSP-RCP scenarios extracted from the LUH2 (Land-Use Harmonization 2) datasets which is available for free at http://luh.umd.edu/index.shtml. This dataset comprises a global projection of multiple land types for successive years from 2015 to 2100 under different SSP-RCP scenarios with a 0.25° resolution (approximately 25 km at the equator). The second part is conducting a 1-km spatial land simulation using the future land use simulation (FLUS) model under the macro constraints of the demands. In this sense, we select a series of relevant spatial driving factors, such as socioeconomic (GDP, population), distance factors (urban center, roads, and rivers), and natural factors (climate, topography, and soil quality). On this basis, a new set of land use projections, with a temporal resolution of 10 years and a spatial resolution of 1km, in eight SSP-RCP scenarios, comprising six land use types in Ethiopia is produced. This dataset shows good performance compared to remotely sensed ESA CCI-LC data. The results show that our land use simulation yields a satisfactory accuracy (Kappa = 0.8, OA = 0.9, and FoM = 0.1). Because of the advantages of the fine resolution, current scenarios, and multiple land types, our dataset provides powerful data support for environmental impact assessment and climate research, including but not limited to climate models.

How to cite: Brhane, E. S. and Dairaku, K.: Future Land Use Change projection under SSP-RCP scenarios over Ethiopia, EGU General Assembly 2023, Vienna, Austria, 23–28 Apr 2023, EGU23-10587, https://doi.org/10.5194/egusphere-egu23-10587, 2023.

EGU23-11572 | ECS | Posters on site | BG3.17

Effects of forest management on stand structural variability and microclimate in boreal forests 

Iris Aalto, Juha Aalto, Steven Hancock, Sauli Valkonen, and Eduardo Maeda

In boreal forests, uneven-aged management has recently become an attractive alternative to even-aged rotation forestry. These different management types, based on selection felling and clear-cutting, respectively, can result in substantial differences in the structural characteristics of  forest stands. Therefore, management modifies net surface radiation and heat fluxes and further regulates microclimatic variability important for forest organisms and ecosystem processes. Yet, the magnitude and structural drivers of microclimate variability in managed boreal forests have remained poorly understood. Here, we studied the stand structure and microclimate of 20 study plots including even-aged and uneven-aged forest stands in the Vesijako Research Forest in southern Finland. We used terrestrial laser scanning (TLS) to quantify the structural characteristics of the sites and measured soil and air temperature with 80 microclimate loggers in 2021–2022. The TLS data showed that the total amount of plant material did not differ between the management types. However, there were significant structural differences in vertical layering and horizontal heterogeneity of vegetation. Our preliminary results show significant differences in microclimate temperatures depending on stand age category. These differences were clearest at the hottest and coldest times of the year. Air and soil temperature variability in uneven-aged stands resembled at stand level the variability that is encountered in even-aged management only across larger areas including young, immature and mature stands. Uneven-aged stands may therefore support more diverse habitats than even-aged forests. We show that the total amount of plant material was a stronger structural modifier of air temperatures than the vertical arrangement of vegetation. We expect our results to clarify how forest management contributes to shaping microclimates experienced by organisms, which has potential consequences on biodiversity and ecosystem resiliency.  

How to cite: Aalto, I., Aalto, J., Hancock, S., Valkonen, S., and Maeda, E.: Effects of forest management on stand structural variability and microclimate in boreal forests, EGU General Assembly 2023, Vienna, Austria, 23–28 Apr 2023, EGU23-11572, https://doi.org/10.5194/egusphere-egu23-11572, 2023.

Changes in land cover deeply affect the surface properties and therefore the direction and magnitude of the energy, water and carbon fluxes between the atmosphere and the land, ultimately impacting the local and global climate. The processes underlying biophysical and biogeochemical vegetation properties are themselves strongly influenced by the background climate and therefore affected by climate change in a complex and circular manner. For these reasons, deepening our understanding and prediction capacity of the ongoing changes in the land-climate nexus is of paramount importance to developing land-based climate mitigation strategies and policies that are robust and achievable.

The high complexity of the land-based climate interaction is driven by its bi-directional nature that involves multiple positive and negative feedbacks, and by the co-occurrence of processes with opposite climate impacts (i.e. climate cooling and warming) both for biophysical and biogeochemical processes (e.g. radiative vs. non-radiative effects, respiration versus photosynthesis). These specific features of the land system lead to an extremely high sensitivity of the net climate impact of land cover change to management practices and environmental drivers.

Because of the inherent complexities of the land-climate systems, simulations performed with land-atmosphere coupled models proved to be rather uncertain and strongly affected by knowledge gaps, weak assumptions and oversimplistic parameterization. On the other hand, disentangling the signals of the different processes from Earth observations is particularly complex and leads to uncertain attribution of causality. Even more challenging is using experimental signals derived under present climate conditions to project the future direction and magnitude of biophysical and biogeochemical impacts of land cover change on climate. To this scope, among the key limitations of the widely used “space for time” substitution we can list the role played by unaccounted factors (e.g CO2 fertilization), the speed and span of ecosystem adaptation, the assumption of steady state and the temporal and spatial dependence of the processes. Given the importance of this research topic in the current fight to mitigate climate warming, new approaches and methodological advances are required to benefit from the increasing computational capacity and by the expanding observation of the Earth system. To address the issue, in this presentation I will review the most recent progress of data-driven and hybrid analyses, and report on a recent attempt to investigate the impact of land transformation on the climate trajectory under future climatic conditions. Additional discussion points will deal with the emerging research needs related to non-linearity in the system and tipping points (e.g. related to plant mortality rates), and the possible way forward on the ingestion of knowledge derived from Earth observation in process-oriented modelling frameworks.

How to cite: Cescatti, A.: Assessing the climate impacts of land cover change under present and future environmental conditions, EGU General Assembly 2023, Vienna, Austria, 23–28 Apr 2023, EGU23-13017, https://doi.org/10.5194/egusphere-egu23-13017, 2023.

EGU23-14584 | ECS | Posters on site | BG3.17

Irrigation-expansion-induced impacts model-intercomparison project (IRRMIP) 

Yi Yao, Kjetil Schanke Aas, Pedro Arboleda Obando, Mats Bentsen, Liang Chen, Benjamin Cook, Narayanappa Devaraju, Agnès Ducharne, Simon Gosling, Andrew Hartley, Jonas Jägermeyr, Colin Jones, Hyungjun Kim, David Lawrence, Peter Lawrence, Ruby Leung, Min-Hui Lo, and Sonali McDermid and the IRRMIP members

As the most dominant freshwater-use practice, irrigation plays an important role in global and regional environmental changes. Its extent experienced a substantial increase during the 20th century, from less than 100 mha before 1950 to about 300 mha around the year 2000. To advance the scientific understanding of the irrigation-expansion-induced impacts during the last century, we launched a model-intercomparison project (MIP), through which we intend to discover its effects on different sectors, i.e. water, climate, and agriculture, with Earth system models. In the protocol, two experiments are designed, i) simulation with transient irrigation extent and ii) simulation with the irrigation extent fixed at the level of the year 1901. For every experiment, three ensemble members are required to reduce the uncertainty. Currently, the analysis of outputs will be focused on climate extremes, the water cycle, vegetation-carbon interactions and some social implications. In the next phase of IRRMIP, we plan to combine the Earth system model community with both the hydrological model and crop model communities.

How to cite: Yao, Y., Aas, K. S., Arboleda Obando, P., Bentsen, M., Chen, L., Cook, B., Devaraju, N., Ducharne, A., Gosling, S., Hartley, A., Jägermeyr, J., Jones, C., Kim, H., Lawrence, D., Lawrence, P., Leung, R., Lo, M.-H., and McDermid, S. and the IRRMIP members: Irrigation-expansion-induced impacts model-intercomparison project (IRRMIP), EGU General Assembly 2023, Vienna, Austria, 23–28 Apr 2023, EGU23-14584, https://doi.org/10.5194/egusphere-egu23-14584, 2023.

EGU23-15474 | Posters on site | BG3.17

Modeling the effect of land-based mitigation technologies on the carbon cycle and climate 

Florian Wimmer, Etienne Tourigny, Isabel Martinez Cano, Benjamin Stuch, and Rüdiger Schaldach

The H2020 research project LANDMARC1 (Land Use Based Mitigation for Resilient Climate Pathways) will enhance understanding of the realistic potential of land-based negative emission solutions in agriculture, forestry, and other land use sectors. An important component of LANDMARC is modeling the effects of land-based mitigation technologies (LMT) on carbon fluxes and climate on the global scale.

We will present the development of a coupled modeling system consisting of the EC-Earth3-CC Earth System Model (ESM) and the LandSHIFT-G land use model. In this model system, LandSHIFT-G models sequences of land-use maps on a spatial resolution of 5 arc-minutes by integrating assumptions on the future development of the agricultural sector (e.g. crop/livestock production, changes in average crop yields) and assumptions on the implementation of a selection of LMTs as specified in global or regional scaling scenarios. Based on these land-use/land-cover changes (LULCC), EC-Earth3-CC simulates potential effects on vegetation (both natural and managed) and atmospheric CO2 concentrations and climate variables on a spatial resolution of approximately 70 km. Changes in potential crop yields due to climate change are fed back to the land-use model, potentially affecting subsequent land-use patterns. Carbon fluxes between the atmosphere, vegetation, and soils as well as crop yields are modeled by the dynamic vegetation model LPJ-GUESS, which is a component of EC-Earth3-CC. Hence, the system addresses three feedback loops between land-use, vegetation and climate. Land-use change is impacted by crop yields and pasture productivity. Carbon fluxes as well as crop yields and pasture productivity are impacted by land-use change and climate while climate is influenced by changes in atmospheric CO2 and land surface properties.

In the first version of the model system, it is foreseen to cover six different LMTs building on the capabilities of the models that are coupled. The set consists of (i) enhancement of carbon in vegetation and soils by afforestation, increasing soil carbon by (ii) no/reduced tillage agriculture and (iii) organic farming, combination of fossil fuel substitution and medium to long-term storage of carbon by (iv) BECCS (bio-energy and carbon capture and storage) and (v) application of biochar on cropland, as well as (vi) avoiding deforestation by  enhanced cropland irrigation.

In the current implementation, a simulation is done with a simplified modeling system, in which LandSHIFT-G is only coupled to LPJ-GUESS which is driven by atmospheric forcings from a previous EC-Earth3-CC model run, thus neglecting the dynamic effects under which the carbon cycle and land cover change impact the climate. As a proof of concept, we will present results of preliminary experiments simulating the effect of selected LMTs, e.g. afforestation, on the total carbon storage on land.


1 The LANDMARC project has received funding from the European Union’s Horizon 2020 Research and Innovation Programme under grant agreement No 869367.

How to cite: Wimmer, F., Tourigny, E., Martinez Cano, I., Stuch, B., and Schaldach, R.: Modeling the effect of land-based mitigation technologies on the carbon cycle and climate, EGU General Assembly 2023, Vienna, Austria, 23–28 Apr 2023, EGU23-15474, https://doi.org/10.5194/egusphere-egu23-15474, 2023.

EGU23-16740 | Orals | BG3.17

A 29-year time series of annual 300-metre resolution plant functional type maps for climate models 

Celine Lamarche, Kandice Harper, Andrew Hartley, Philippe Peylin, Catherine Ottlé, Vladislav Bastrikov, Rodrigo San Martín, Sylvia Bohnenstengel, Grit Kirches, Martin Boettcher, Roman Shevchuk, Carsten Brockmann, Olivier Arino, and Pierre Defourny

The existing CCI Medium Resolution land cover (MRLC) product delineates 22 primary and 15 secondary land cover classes at 300-meter resolution with global coverage and an annual time step extending from 1992 to the present. Previously, translation of the land cover classes into the plant functional types (PFTs) used by the Earth system and land surface models required the use of the CCI global cross-walking table that defines, for each land cover class, an invariant PFT fractional composition for every pixel of the class regardless of geographic location. Here, we present a new time series data product that circumvents the need for a cross-walking table. We use a quantitative, globally consistent method that fuses the 300-meter MRLC product with a suite of existing high-resolution datasets to develop spatially explicit annual maps of PFT fractional composition at 300 meters. The new PFT product exhibits intraclass spatial variability in PFT fractional cover at the 300-meter pixel level and is complementary to the MRLC maps since the derived PFT fractions maintain consistency with the original land cover class legend. This was only possible by ingesting several key 30m resolution global binary maps like the urban, the open water, the tree cover, and the tree height while controlling their compatibility thanks to the MRLC maps. This dataset is a significant step forward towards ready-to-use PFT descriptions for climate modelling at the pixel level. For each of the 29 years, 14 new maps are produced (one for each of 14 PFTs: bare soil, surface water, permanent snow and ice, built, managed grasses, natural grasses, and trees and shrubs each split into broadleaved evergreen, broadleaved deciduous, needleleaved evergreen, and needleleaved deciduous), with data values at 300-meter resolution indicating the percentage cover (0–100%) of the PFT in the given year. Based on land surface model simulations (ORCHIDEE and JULES models), we find significant differences in simulated carbon, water, and energy fluxes in some regions using the new PFT data product relative to the global cross-walking table applied to the MRLC maps. We additionally provide an updated user tool to assist in creating model-ready products to meet individual user needs (e.g., re-mapping, re-projection, PFT conversion, and spatial sub-setting).

How to cite: Lamarche, C., Harper, K., Hartley, A., Peylin, P., Ottlé, C., Bastrikov, V., San Martín, R., Bohnenstengel, S., Kirches, G., Boettcher, M., Shevchuk, R., Brockmann, C., Arino, O., and Defourny, P.: A 29-year time series of annual 300-metre resolution plant functional type maps for climate models, EGU General Assembly 2023, Vienna, Austria, 23–28 Apr 2023, EGU23-16740, https://doi.org/10.5194/egusphere-egu23-16740, 2023.

EGU23-17287 | Orals | BG3.17

Offsetting climate and land use effects on wetland methane emissions over 1901-2020 

Etienne Fluet-Chouinard, Zhen Zhang, Robert Jackson, Benjamin Poulter, Lukas Gudmundsson, and Sonia Seneviratne

Atmospheric methane (CH4) concentration has more than doubled since per-industrial time. The contribution of natural wetland ecosystems, currently the largest natural emitters of CH4, to this increase is not well known. While temperature may have contributed to an growth in emissions, the extent wetlands has declined over this period due to drainage and land use conversion. In this study, we combine a new reconstruction of global wetland extent with simulated CH4 flux from nine land surface model to estimate wetland CH4 emissions over 1901-2020. Our analysis evaluates: 1) the uncertainty of modelled emissions over the century timescale, 2) the separate and combined effects of climate and land use change on emissions, and 3) the global and regional trends of wetland CH4 emissions. We show that prognostic outputs from model of wetland extent are highly uncertain over the century timescale although most prognostic models suggest an emission increase. We find that inclusion of wetland drainage reducing wetland area primarily in temperate latitudes is sufficient to offset the increase in modeled emission in the absence of land use, with an ensemble mean displaying no significant trend between 1901-1920 and 2001-2020. We evaluate the contribution of individual land uses to the decline in global emissions, in particular the conversion to irrigated rice and wet cultivation which are also methane emitting areas. These results diverge from previous source attributions at the century timescale and may require upward revisions to other biogenic sources to balance the budget and remain within δ13C isotope constraints.  In the future, we will investigate the effect of wetland drainage on CO2, CH4 and aquatic carbon export for a more complete accounting of this land use change on global carbon fluxes.

How to cite: Fluet-Chouinard, E., Zhang, Z., Jackson, R., Poulter, B., Gudmundsson, L., and Seneviratne, S.: Offsetting climate and land use effects on wetland methane emissions over 1901-2020, EGU General Assembly 2023, Vienna, Austria, 23–28 Apr 2023, EGU23-17287, https://doi.org/10.5194/egusphere-egu23-17287, 2023.

EGU23-17586 | Posters on site | BG3.17

Detection of land cover changes based on the Sentinel-2 multitemporal data on the GEE platform 

Alicja Rynkiewicz, Agata Hoscilo, Milena Chmielewska, Aneta Lewandowska, Linda Aune-Lundberg, and Anne Nilsen

The world around us is constantly changing, and humans contribute to many of these changes. Land cover and land use (LCLU) changes over time have a significant impact on the functioning of the Earth, particularly climate change and global warming. Spatial data of LCLU changes find important applications in land management, monitoring the sustainable development of agriculture, forestry, rural areas, assessing the state of biodiversity and urban planning.

In the frame of the InCoNaDa project "Enhancing the user uptake of Land Cover / Land Use information derived from the integration of Copernicus services and national databases”, the maps of land cover (LC) changes were developed for two study areas - the Łódź Voivodeship in Poland and the Viken County in Norway. The detection of LC changes was performed on the annual bases for the period 2018-2021 based on the analysis of multitemporal optical data from the Sentinel-2 mission. The Google Earth Engine (GEE) platform was used, which allows to analyze satellite data and to perform spatial analyses anywhere in the World while providing computing power. The LC change detection method was divided into two phases. The first phase is based on the analysis of spectral signatures, and the second phase applies the machine learning Random Forest algorithm. The classification was performed separately for each time interval: 2018-2019, 2019-2020, 2020-2021. In this way, three independent classification models were developed for each study area. The following three LC change classes were distinguished:  a) no-change, b) forest loss, and c) construction sites and newly built-up areas. The minimum mapping unit (MMU) was 0.2 ha. The LC change detection models reached high accuracy - in both study areas for all time intervals, the overall accuracy was equal to or greater than 0.97 and the Kappa coefficient than 0.95. The independent verification carried out based on the aerial orthophotos proved that the overall accuracy of the LC changes is pretty good for both study areas (around 0.9). The changes occurring in the construction sites and newly built-up area class reached slightly lower accuracy and has the lowest precision. The presented method showed its universality and adaptability, giving the possibility for further development. We will present the method, algorithm, results and their verification for Poland and Norway.

How to cite: Rynkiewicz, A., Hoscilo, A., Chmielewska, M., Lewandowska, A., Aune-Lundberg, L., and Nilsen, A.: Detection of land cover changes based on the Sentinel-2 multitemporal data on the GEE platform, EGU General Assembly 2023, Vienna, Austria, 23–28 Apr 2023, EGU23-17586, https://doi.org/10.5194/egusphere-egu23-17586, 2023.

EGU23-215 | ECS | Posters on site | EOS2.3

Variety and diversity in climate and ocean literacy activities 

Pariphat Promduangsri, Pimnutcha Promduangsri, Stacey Alvarez de la Campa, Farhad Bolouri, and Hüseyin Gökçekuş

Climate change (CC) and ocean degradation (OD) affect every living species on the planet.  CC and OD negatively impact marine life, plant life, soils and agriculture, animals and humans.  One way to fight against CC and OD is by learning from climate and ocean programmes and activities, both formal and informal.

Climate and ocean education is crucial as it helps people to better understand how climate is changing and how the ocean is degrading.  Such education will thus provide know-how and ways to act for individuals and for communities to adapt to and mitigate CC and OD.

In this poster, we survey some of the variety and diversity of climate and ocean literacy activities at personal and institutional levels.  At the personal level, we will show experiences that help people to learn about CC and OD, such as work with indigenous communities, attending conferences and studying in MOOCs.  Examples at the institutional level include working in an environmental association, attending workshops (eg, EN-ROADS) and participating in a participatory simulation (eg, IOCS).

We invite you to visit our poster and share your climate and ocean literacy activities.

----------------------------------------------------------------------

References

UNESCO. (n.d.).  Climate change education.  Paris, UNESCO. https://www.unesco.org/en/education/sustainable-development/climate-change

United Nations. (n.d.).  Education is key to addressing climate change.  United Nations. https://www.un.org/en/climatechange/climate-solutions/education-key-addressing-climate-change

How to cite: Promduangsri, P., Promduangsri, P., Alvarez de la Campa, S., Bolouri, F., and Gökçekuş, H.: Variety and diversity in climate and ocean literacy activities, EGU General Assembly 2023, Vienna, Austria, 23–28 Apr 2023, EGU23-215, https://doi.org/10.5194/egusphere-egu23-215, 2023.

EGU23-217 | ECS | Posters on site | EOS2.3

Climate and ocean literacy: Cultural dimensions 

Pimnutcha Promduangsri, Pariphat Promduangsri, Stacey Alvarez de la Campa, Farhad Bolouri, and Hüseyin Gökçekuş

Climate and culture influence each other.  On the one hand, climate change (CC) and ocean degradation (OD) have an impact on culture (with a small c).  According to UNESCO (2021), the negative impacts of CC on culture include loss of cultural heritage, local knowledge and language.  CC also reduces access by communities to their culture.

On the other hand, culture plays an essential role in helping communities to fight against, adapt to and mitigate CC and OD (UNESCO, 2021).  Culture includes knowledge, know-how and local practices in combating climate and OD.  Culture is informally and formally transmitted through society and education.  UNESCO (2021) illustrates the role of culture in fighting against CC:

Culture is a powerful resource for addressing climate change impacts.  …  Intangible cultural heritage practices have proven to be highly effective tools for helping communities prepare for, respond to and recover from climate change-related impacts and emergencies.

CC and ocean literacy methods encourage and embody cultural diversity.  This presentation will provide examples of the cultural dimensions of climate and ocean literacy.  These includes:

  • The views of indigenous communities about climate and ocean literacy (Barbados);
  • EN-ROADS (international and Iran), an online participatory simulation, often includes people from several cultures, especially in online workshops;
  • IOCS (intercultural and France), an online participatory simulation, specifically includes an intercultural dimension and encourages people from different cultures to participate. 

----------------------------------------------------------------------

Reference

UNESCO. (2021).  Culture & climate change, Question & answers.  Paris, UNESCO.  https://en.unesco.org/sites/default/files/info_sheet_climate_change.pdf

How to cite: Promduangsri, P., Promduangsri, P., Alvarez de la Campa, S., Bolouri, F., and Gökçekuş, H.: Climate and ocean literacy: Cultural dimensions, EGU General Assembly 2023, Vienna, Austria, 23–28 Apr 2023, EGU23-217, https://doi.org/10.5194/egusphere-egu23-217, 2023.

Since the beginning of the military aggression of the Russian Federation in Ukraine on 24 February, 2022, military actions and rocket attacks caused a powerful devastating impact on the objects of the residential sector and industry, infrastructure of life support and energy sector as well as on the natural environment, ecosystems, life, and health of people. This factor had a significant impact on the educational process in the Kyiv-Mohyla Academy. On the one hand, aspects of the methodology and practice of assessing the environmental impact of military operations are reflected in the subjects taught to students of the master's program in Ecology. On the other hand, students of master's and PhD programs are involved in real surveys and environmental assessments of the state of deteriorated and polluted territories. The purpose of this study with students’ participation was to analyze the consequences of rocket and artillery shelling of oil depots in the villages of Kalynivka and Kryachky, Kyiv region, and the oil depot of the Aistra Enterprise in the city of Chernihiv. The article presents the results of the analysis of the impact of fires caused by shelling on atmospheric air, terrestrial ecosystems, and climatic characteristics of the Polissia region. The research and learning experience of the students are discussed additionally in terms of the capacity building of young researchers in extraordinary conditions.

How to cite: Karamushka, V., Boychenko, S., and Nazarova, O.: Fossil war impact on atmosphere air, terrestrial ecosystems, and climate: involvement of master’s degree and post-graduate students in Ukrainian Polissia case study, EGU General Assembly 2023, Vienna, Austria, 23–28 Apr 2023, EGU23-600, https://doi.org/10.5194/egusphere-egu23-600, 2023.

For a certain time since the beginning of the aggression of the Russian Federation in Ukraine, education in many Ukrainian universities has been suspended due to security reasons. Ffurther adaptation of the educational process within the Ecology program to the conditions of war included, inter alia, the integration in educational courses the research methodology, and environmental impact assessment of hostilities. The impact of the military actions on the environment in general and the atmosphere, in particular, was in the focus of the discussions during the course Climatology and Meteorology. Researchers and students analyzed powerful direct and indirect effects, namely due to changes in the optical characteristics of the atmosphere, atmospheric pollution as a result of the emission of products of detonation of missiles and shells and increasing emission of greenhouse gases and gas-aerosol impurities. Satellite data were used for this purpose.

Satellite observation of atmospheric concentrations of formaldehyde, aerosol, carbon monoxide, nitrogen oxide, and sulphur dioxide from the Sentinel-5P satellite was an important research method integrated into the educational process. Daily satellite observation data were analyzed using the Google Earth Engine platform for the period 2019-2022. Data were monthly and yearly averaged within the boundaries of rayons (second-level administrative units of Ukraine). In addition, shelling incidents data from the Armed Conflict Location & Event Data Project (ACLED) were analyzed. It helped to register dynamic of the air pollution in the conditions of war.

A full-scale war in Ukraine caused the suspension of many enterprises that were the main sources of gas emissions into the atmosphere, especially in the eastern and southern parts of Ukraine. Therefore, in recent months, the content of pollutants in the atmosphere over these regions is mainly tent to background values and as a result of hostilities. However, massive shelling, the use of military heavy equipment, and fires caused additional emissions of a number of pollutants into the atmosphere. It should be noted that in certain regions and certain months during the active phase of hostilities, these emissions were exceeded by several times compared to the average for the period 2019-2021.


How to cite: Boychenko, S. G., Kuchma, T., and Karamushka, V.: Integrating research in educational process: assessment of gas-aerosol atmospheric pollution over the southern and south-eastern regions of Ukraine due to military actions, EGU General Assembly 2023, Vienna, Austria, 23–28 Apr 2023, EGU23-659, https://doi.org/10.5194/egusphere-egu23-659, 2023.

 In communicating the science behind climate change, there is no single magic bullet. This is because different people process received information in different ways. Some communication-methods have been used far less than others, one in particular being narrative. Opportunities for narrative present themselves worldwide because of the large eustatic rise in sea levels following the Last Glacial Maximum, a well-understood phenomenon in terms of timing and rate. That rise flooded over fertile lowland plains, such as the mostly <30 metres deep modern-day Cardigan Bay, off the western coast of Wales. The advance of the shoreline towards modern-day land created many well-known coastal features. One such is the shingle-spit, dune hinterland and intertidal submerged forest at Ynyslas, Ceredigion, Wales (UK). Ynyslas is a National Nature Reserve with a Visitor Centre and ca. 250,000 visitors a year. A book describing how its landscape came into being has proved popular with almost 2000 copies having been bought since publication in August 2019 (despite closure during the COVID-19 pandemic of 2020-21). Interviews with some of those who read the book indicate that weaving climate science into an interesting narrative, explaining what actually happened, gives people important new insights into the processes involved and the threats now facing modern coastal communities.

How to cite: Mason, J.: The Making of Ynyslas: weaving hard scientific evidence into an understandable narrative, EGU General Assembly 2023, Vienna, Austria, 23–28 Apr 2023, EGU23-2367, https://doi.org/10.5194/egusphere-egu23-2367, 2023.

 Ynyslas National Nature Reserve is a shingle-spit and sand dune complex on the western coast of Wales. In its hinterland are extensive estuarine flats, shifting sandbanks and deep channels. The shingle-spit fronts a wide sandy beach that uncovers at low tide, featuring extensive peat deposits of mid-Holocene and younger ages (6-4.7 KYA). Set in the peat are the stumps of the famous Submerged Forest, consisting of alder, birch, oak and pine that once flourished here before rising water-levels drowned them. Offshore in Cardigan Bay, although extensively reworked Quaternary glaciogenic sediments predominate, similar but either older or undated peatlands have been encountered sporadically in boreholes, one undated example being twenty meters beneath the sea bed in a water depth of 20 m. Clearly these and the Submerged Forest record parts of the post-glacial marine transgression that created the shallow (typically <<50 meters) Cardigan Bay over several thousand years following the onset of the Holocene. The fact that the results of the transgression can be so starkly seen at low tide, coupled with the offshore borehole records, provides a stark reminder of the effects of climate change, of which sea level rise is probably the greatest threat to communities along the Welsh coast. Such straightforward evidence for the effects of climate change provides an excellent opportunity to further explore topics around both its causes and its effects, using a narrative of what actually happened, based on the scientific literature. The Making of Ynyslas (2019) is that narrative and has proved to be an effective method of outreach based around this highly popular (250 K visitors per year) destination. Given that the post-glacial transgression was global in nature, other such science-communication opportunities are likely to present themselves elsewhere.

How to cite: Mason, J.: The Making of Ynyslas: communicating change through the visual impact of a drowned landscape, EGU General Assembly 2023, Vienna, Austria, 23–28 Apr 2023, EGU23-3261, https://doi.org/10.5194/egusphere-egu23-3261, 2023.

EGU23-3485 | ECS | Orals | EOS2.3 | Highlight

Fostering the next generation of Arctic scientists, from five to 35 

Jenny Turton, Naima El bani Altuna, Charlotte Weber, Salve Dahle, Nina Boine Olsen, Elise Fosshaug, Katrine Opheim, and Julia Morales-Aguirre

Inspiring the next generation of scientists and science-policy makers is crucial for continued scientific development and to tackle the largest issues currently facing the Arctic and the globe. Outreach in the Arctic has an added importance by promoting future development of northern and Indigenous communities and inspiring educated individuals to remain living and working in the north, thereby providing value creation in the local areas. But at what age should we focus our outreach efforts? And how can we ensure that the children we inspire go onto careers in science and decision making?

Arctic Frontiers is a non-profit organisation based in Tromsø with the purpose of bringing together scientists, business leaders, policy makers and local communities for knowledge-based discussions. Each year, they organise a series of education and outreach activities for a range of audiences, from 'Science for Kids' and 'Science for Schools' for young children to 'Student Forum' and 'Emerging Leaders' for those up to 35 years old. As well as those in formal education (high school and university), outreach is also vital for those outside of academia and education, including in business, cultural fields and the public sector.

The main focus of the outreach and education is the Arctic: a broad and multidisciplinary topic spanning climate change, biodiversity, cultural preservation, sustainable development, energy transition and science-policy interactions. The science and activities that are planned are tailored to each age group. The youngest children focus on experiments and gaging an interest in science. For those in high school, the program lasts three months, from inspiration days to holding a science conference with findings of their research project. Collaborations and funding are necessary for these events to run, and this can alter the amount of scientific outreach as well as numbers and diversity of students they can reach.

The education and outreach components of Arctic Frontiers have been running now for over 10 years. Testimonials and feedback from attendees are largely positive, but efforts should now be made to increase the circle of impact. In this presentation we will focus on how we tailor the outreach to different groups and discuss how we use science at the heart of bringing together different audiences for holistic Arctic discussions. We also welcome feedback on new methods or activities for outreach, to ensure that we see scientific interest from childhood to career.

How to cite: Turton, J., El bani Altuna, N., Weber, C., Dahle, S., Boine Olsen, N., Fosshaug, E., Opheim, K., and Morales-Aguirre, J.: Fostering the next generation of Arctic scientists, from five to 35, EGU General Assembly 2023, Vienna, Austria, 23–28 Apr 2023, EGU23-3485, https://doi.org/10.5194/egusphere-egu23-3485, 2023.

EGU23-4157 | Orals | EOS2.3 | Highlight

A journey to a cold seep: a paired teaching video lesson on how scientists study methane in the Arctic Ocean 

Vibeke Aune, Giuliana Panieri, and Solmaz Mohadjer

The knowledge generated through scientific research in the Arctic Ocean is often done with little input or communication with the public. In particular, school communities have few opportunities to engage in and contribute to knowledge generation and sharing related to the Arctic Ocean.

To address this issue, the 2022 AKMA OceanSenses expedition (11-23 May) brought together scientists and teachers to co-create educational materials that are scientifically accurate and pedagogically engaging. Here, we present an educational video about methane activity in the Arctic Ocean. The video follows a pedagogical model known as paired teaching. This approach enables scientists and teachers to create and instruct virtual lessons and activities that are carried out under the guidance of in-class teachers in school classrooms. The video is designed to be viewed in short segments. In each segment, the video scientist asks questions that will be explored through hands-on activities and group discussions under the guidance of the classroom teacher in between segments.

The video introduces students to methane and gas hydrates, their geographical distribution, and global significance. These topics are taught through lively discussions and observation-based exercises where students work together to relate scientific datasets to discover processes that produce methane and gas hydrates. The video and supporting materials are freely available on the YouTube channel of the European Geoscience Union (https://youtu.be/k0awmdQQlTA).   

How to cite: Aune, V., Panieri, G., and Mohadjer, S.: A journey to a cold seep: a paired teaching video lesson on how scientists study methane in the Arctic Ocean, EGU General Assembly 2023, Vienna, Austria, 23–28 Apr 2023, EGU23-4157, https://doi.org/10.5194/egusphere-egu23-4157, 2023.

Marine insurers: cargo, shipping (hull and P&I) while insuring their insureds, aid and abet ocean biodiversity damage and climate change. In the process they are also a threat to the related planetary boundaries.

While marine insurance is a direct threat to the well-being of our oceans, insurers of land-based assets - with multiple forms of discharges - also critically and adversely impact the oceans need to be taken into account.

The author will highlight an overview on what these damages are, the possible corrective actions required, seek the insights from the participants and ideally agree upon a plan of action to mitigate this threat.

How to cite: Gupta, P.: How marine insurance causes damage with insurers aiding and abetting it!, EGU General Assembly 2023, Vienna, Austria, 23–28 Apr 2023, EGU23-4214, https://doi.org/10.5194/egusphere-egu23-4214, 2023.

EGU23-7892 | Posters on site | EOS2.3

Activism as a tool for education and societal outreach: making action attractive and accessible for scientists and effective for a greater audience. 

Riccardo Riva, Elodie Duyck, Sylvain Kuppel, Odin Marc, and Marthe Wens

The current state of the climate and environmental crisis calls for science to be able to have a deep impact on society, and to have it quickly. Here we propose to discuss how scientists engaging in climate activism can contribute to educating the general public and press for urgent action, as well as under which conditions such scientific activism can be most effective. The classical way science has been interacting with society has mostly consisted in making scientific results public, without interfering in how politicians, business and the general public would make use of them. Similarly, the role of science educators has been often limited to spreading knowledge to students and broader audiences, independently from how this knowledge affects society. However, such a dynamic is clearly not enough for nowadays climate and environmental science education. Despite an overwhelming scientific consensus about the trajectory of the Earth’s climate and about what is going to happen in the coming decades unless humanity drastically changes its use of natural resources and cuts greenhouse gases emission, too little is still happening. As a result, many scientists, both within and outside academia, have been looking for other ways to communicate the urgency of the climate crisis, including outreach to policy makers and the general public. Notably, communication efforts have been increasingly extending to the public support of environmental action movements and the joining of protests and civil disobedience actions. Since it is good practice to adapt educational methods to both the audience and the message, we argue that activism can be seen as the result of a search for methods that produce viable results and the desired impact on society. 
Using recent examples of civil disobedience by scientists, including actions we joined and/or supported in national or international groups, we discuss how such activism can be complementary to classical approaches to public education about the urgency of the climate and environmental crisis. We also present the reception and reaction from other actors (politicians, companies) and how such actions are received, supported or criticized by the scientific community. We specifically discuss the relation between activism and the broader scientific community, since we believe that scientific activism can only become an efficient way to communicate science and enhance policy-makingif (i) it finds a way to be accepted and respected within the scientific community, and (ii) it follows some rules allowing such communication to maintain (or ideally increase) scientific reputation and position in the broader society. We also stress the important role of universities and research institutes in making possible, especially for early career scientists, to engage in such activism. Scientific institutions need to make clear that climate activism and advocacy is welcome among both researchers and teachers, that their freedom of speech is protected, and that such activities are recognized as valuable.
Finally, we will show some examples of how scientists engaging in climate action can build networks of support, contribute to normalizing such activism in the scientific community, and valorise this form of engagement.

How to cite: Riva, R., Duyck, E., Kuppel, S., Marc, O., and Wens, M.: Activism as a tool for education and societal outreach: making action attractive and accessible for scientists and effective for a greater audience., EGU General Assembly 2023, Vienna, Austria, 23–28 Apr 2023, EGU23-7892, https://doi.org/10.5194/egusphere-egu23-7892, 2023.

EGU23-8324 | Orals | EOS2.3 | Highlight

Activism as a tool for education and societal outreach: legitimacy, efficiency and complementarity with classic science communication 

Sylvain Kuppel, Odin Marc, Riccardo Riva, and Marthe Wens

A classic conception held by many scientists is that their role is to produce and provide new and reliable information for use by the rest of society (public, decision-makers, media, etc). In the case of the ongoing climate and ecological crisis, this has been the dominant stance of many scientific actors, including the IPCC and IPBES. It has resulted in producing and making available syntheses of scientific results both on the “natural” processes and “societal” impacts. The relevance of this conception has been seriously challenged through decades of mismatch between expected and observed translation of scientific communication regarding the ongoing crisis into policy-relevant mitigation measures. At the same time, the urgency of current climate and ecological crisis calls more than ever for actionable science with a deep and immediate impact on society.
Effective communication requires that the recipients of knowledge (i) are able to understand, (ii) want to understand, and (iii) are not distracted by contradictory information (Oreskes, 2022). Most of the effort on science communication has focused on (i), ignoring that conditions (ii) and (iii) are often not met. Other cognitive or psychological issues with important political implications must also be carefully pondered, most notably the fact that popularity or acceptability of a discourse is judged by the public in relation to other discourses, and not in absolute terms, (e.g., Overton window, Simpson et al., 2022) and in relation to the position of the communicator (such as emotional state and personal actions in relation the message, e.g., Attari et al., 2019).
Here we contend that scientists joining environmental activist groups, including engaging in direct actions of civil disobedience, have the potential to enhance effective scientific communication on several levels. Indeed, scientists taking their share of discomfort and even breaking the law, is a strong signal of the emotional involvement of the scientists, of the magnitude of the crisis (e.g., the latter largely dwarfs the risk of receiving judiciary sanctions) and of the need to revise the interactions between science, media and politics. In addition to making more acceptable or even legitimizing more moderate ways of communication, such radical propositions of engagement may also raise media attention and therefore audience and support in the general public (Capstick et al., 2022).
We review recent non-violent actions involving scientists, and then discuss the complementary/synergistic aspects that such disobedience and related direct actions bring to the spectrum of scientific outreach, as a renewed way of communication and dissemination, especially about urgent challenges. Besides, the question of its complementarity with common ways (process of peer review, consolidation of scientific knowledge before dissemination at the University) is also evaluated. The targeted strategy may not replace the "ancient system" with a new one but rather lead to the development of a new system aimed at reinforcing the efficiency of the existing ones.

References

  • Attari, S. Z., et al., Climatic Change, 154, 529–545, https://doi.org/10.1007/s10584-019-02463-0, 2019.
  • Capstick, S., et al., Nat. Clim. Chang., 12, 773–774, https://doi.org/10.1038/s41558-022-01461-y, 2022.
  • Oreskes, N., Proc.Indian Natl. Sci. Acad., 88, 824–828, https://doi.org/10.1007/s43538-022-00121-1, 2022.

How to cite: Kuppel, S., Marc, O., Riva, R., and Wens, M.: Activism as a tool for education and societal outreach: legitimacy, efficiency and complementarity with classic science communication, EGU General Assembly 2023, Vienna, Austria, 23–28 Apr 2023, EGU23-8324, https://doi.org/10.5194/egusphere-egu23-8324, 2023.

Armed conflict and military activity can be highly destructive for the environment. Russia’s invasion of Ukraine has unexpectedly elevated global media attention on the humanitarian, environmental and societal impact of the war, with media reporting on the environmental consequences beyond the scale of other contemporary conflicts.a However, while this attention on the carbon costs of conflict and military actives is welcome, significant data and knowledge gaps remain on the overall contribution that day-to-day military activities make to climate change.b Communicating the issues around military emissions is difficult, given both their complexity and because it is politically sensitive. This is particularly the case around military decarbonisation plans, which some regard as a low priority and a risk to military operational effectiveness or preparedness. This makes geoethics important and communication of the problem especially challenging during a time when military spending is increasing due to Russia’s aggression in Ukraine. 

This perceived political sensitivity has contributed to the exclusion of military emissions from mainstream climate discourse, despite their potential scale. A study - led by Scientists for Global Responsibility - suggests that the world’s militaries are responsible for 5.5% of global emissions.c This is considerable yet many governments do not yet publish or fully understand the contribution that their militaries make to climate change. The significant data gaps mean it is inherently difficult to estimate the emissions of the world’s militaries as a whole. In turn, this makes it challenging to communicate the importance of the topic. 

This presentation will set out some of the initiatives – such as https://militaryemissions.org - which have been developed by civil society to communicate the problem to the broad range of stakeholders, including the public, the military, civil society organisations and policy makers. Given the diverse audience, a spectrum of communication narratives has been used, including a podcast series with the military think-tank Royal United Services Institute,d policy briefs,e webinars,f blogs, papers, and media articles. Effective, ongoing communication and education is vital to increase awareness around the military’s contribution to climate change and seek to ensure that any emerging climate and decarbonisation plans for the military are properly implemented and their effectiveness scrutinised.

a CEOBS, 2022a. Sustainable recovery? First sustain interest in Ukraine’s environment.  https://ceobs.org/sustainable-recovery-first-sustain-interest-in-ukraines-environment/
b Rajaeifar, M. et al, 2022.  Decarbonize the military — mandate emissions reporting. https://doi.org/10.1038/d41586-022-03444-7
c SGR/CEOBS, 2022b. Estimating the Military’s Global Greenhouse Gas Emissions. https://ceobs.org/wp-content/uploads/2022/11/SGRCEOBS-Estimating_Global_MIlitary_GHG_Emissions_Nov22_rev.pdf
d Greening Defence podcast series, available at https://rusi.org/podcast-series/greening-defence-podcasts
e CEOBS, 2022c. Policy brief: Military greenhouse gas emissions – transparency, reporting and action. https://ceobs.org/wp-content/uploads/2022/11/CEOBS_briefing_note_military_GHG_reporting.pdf
f COP27 virtual panel: Military Emissions Gap annual update 2022, available at https://www.youtube.com/watch?v=wRi5Apxht5M&t=3621s


How to cite: Cottrell, L., Parkinson, S., and Kinney, E.: Communicating the need for better understanding of the military’s contribution to climate change and action to be taken, EGU General Assembly 2023, Vienna, Austria, 23–28 Apr 2023, EGU23-8483, https://doi.org/10.5194/egusphere-egu23-8483, 2023.

EGU23-15590 | ECS | Posters virtual | EOS2.3 | Highlight

Time to recognize the geoscience disclosure as the tool to face climate change impacts: can we care about something that we do not know? 

Alan Maria Mancini, Alessandra Negri, Marco Tonon, and Francesca Lozar

Human-induced climate alteration is impacting ecosystem functioning and services. Ocean acidification and deoxygenation, mass extinction, rising sea level and extreme meteorological events are related to the rise of atmospheric CO2 and the consequent increase in temperature. The rate of environmental change is extremely fast, hampering the biota to adapt to the ongoing new conditions, therefore increasing the potential impact on the ecosystem. The geological record is a powerful tool to investigate past trends in order to better understand the current climate change. The ability of geosciences to reconstruct the whole “evolutionary history” of past extreme events, from their onset to their conclusion and the consequent recovery of the ecosystem is something that must be exploited to increase awareness. As an example, the environmental reconstruction of the main events related to abrupt (natural) emissions of CO2 during Earth history underlines that the current climate change is outstanding in terms of rate of environmental change and impact on ecosystems. Understanding and disclosing these findings is crucial in order to increase the population’s awareness of the current ecosystem threat and therefore, contributing to mitigate the impact. This because, trivially, “people cannot care about something that they do not know”. Anthropogenic pressure mostly derives from governance regime; this can be changed if population consciousness boosts governance actions for climate change mitigation. In this perspective, the geoscience, with its potential to explore and constrain past environmental changes, necessitate to be more considered in the educational career both at school and in the mass media worldwide. Clear examples of how, and how much, the awareness of the population regarding the current climate change plays a fundamental role in stimulating sustainable governance actions derive from the “Youth for climate” movement. Here we propose easily performable, inclusive and proactive educational tools for mitigation strategies to face possible future impacts deriving from the climate evolution, as pointed out in the United Nations 2030 Agenda (Sustainable Development Goal 13: Climate Action). We mainly focus our activities on marine sediments, in order to draw the attention to this widely unknown environment and to show how climate change affects the oceans; this also supports the UN Ocean Decade. In order to assess the knowledge and perception on climate change and ocean life evolution, we will present some data collected among the secondary school students reached by a public engagement project devoted to the dissemination of these subjects.

How to cite: Mancini, A. M., Negri, A., Tonon, M., and Lozar, F.: Time to recognize the geoscience disclosure as the tool to face climate change impacts: can we care about something that we do not know?, EGU General Assembly 2023, Vienna, Austria, 23–28 Apr 2023, EGU23-15590, https://doi.org/10.5194/egusphere-egu23-15590, 2023.

EGU23-15886 | Orals | EOS2.3

Innovative tools to narrate the importance of climate literacy 

Selvaggia Santin, Mauro Buonocore, Ottavia Carlon, and Agnese Glauda

Climate literacy means making individuals aware of the daily interactions we all have with the world around us and, consequently, supporting them in making responsible and informed decisions on how to make such interactions sustainable and not harmful to the environment. The idea behind climate literacy is not only to educate people on such principles but also to provide learners with practical applications and equip them with tools they can use to become active change agents in their communities. CMCC is actively taking part in this ambitious challenge through an innovative, interactive platform in which climate change information, tools and data are narrated in a new, multidisciplinary way to help people understand what climate literacy is and what is the meaning of successful adaptation to climate change - and how to practically do it.

Focused on the Adriatic area, the multimedia platform collects a series of nine success stories taking place in the context of the Italy-Croatia Interreg AdriaClim project, which involves local authorities, experts, scientists and citizens in a common effort to adapt to climate change impacts in coastal areas.

The nine stories are presented through the use of new - or different - words, images,  unheard voices and multimedia contents to provide a new narration for innovative solutions. We simplify scientific jargon, giving new life to the words of climate science and sharing information that appeals to facts, and data but also emotions. We dived into the heart of the climate change discourse to extract the most useful keywords to talk about adaptation: we collected and organised them in a simpler, non-canonical dictionary, with practical examples, general context scenarios, differentiated sources and more. Images represent reality but can also be used as access points to knowledge, and impactful visual narratives to explain and illustrate complex concepts and phenomena. Getting in touch with experts and institutional representatives who are at the forefront of the adaptation activities carried out in their areas gives life to a peer-to-peer process that can be an inspiration for different stakeholders. 

Our Climate Literacy platform narrates stories that are born within science but are able to reach non-experts and citizens and help them understand and act about the challenges and solutions of coastal adaptation. Through a multimedia and interdisciplinary dialogue, the platform provides a unique hub for the contamination of knowledge and ideas to act in the face of future impacts.


How to cite: Santin, S., Buonocore, M., Carlon, O., and Glauda, A.: Innovative tools to narrate the importance of climate literacy, EGU General Assembly 2023, Vienna, Austria, 23–28 Apr 2023, EGU23-15886, https://doi.org/10.5194/egusphere-egu23-15886, 2023.

What questions can clarify our thinking so that we understand our technosphere more fully and can actually reduce our ecocidal impacts? Starting by naming our assumptions, say that our biosphere is the world of flora and fauna that can reproduce and biodegrade. Say that our technosphere is anything fabricated—including the Internet, motorized vehicles of all kinds, solar PVs, industrial wind turbines and battery energy storage systems. What are the technosphere’s main energy guzzlers? What kind of water use, extractions, greenhouse gases, electromagnetic radiation, abusive labor practices and toxic waste are involved in manufacturing, operating and discarding the technosphere? What regulations could promote safety and limit ecocidal growth? Katie Singer will sketch what we take from the biosphere to manufacture, operate and discard our technosphere. She’ll propose questions and activities for reducing our digital footprint. For example, could every smartphone user trace the supply chain of one substance in their smartphone or laptop—and share their research?


How to cite: Singer, K.: Mapping Our Technosphere: what questions make it (and our biosphere) more sustainable?, EGU General Assembly 2023, Vienna, Austria, 23–28 Apr 2023, EGU23-15965, https://doi.org/10.5194/egusphere-egu23-15965, 2023.

EGU23-16102 | Orals | EOS2.3

Getting to impact at scale: A dynamic analysis to guide propagation of educational innovations in climate change 

Florian Kapmeier, Juliette N. Rooney-Varga, Charles Henderson, and David N. Ford

In order to successfully address climate change, society needs education that scales rapidly, transmits scientific information about its causes and effects, and motivates sustained commitment to the problem and science-based action to address it. For decades, government agencies in the US and elsewhere have funded the development of innovative, evidence-based pedagogies and curricula to teach STEM fields, including climate change and sustainability. Research shows that many of these innovations deliver strong gains in learners’ knowledge, sense of urgency, and desire to learn more about climate change and sustainability. To build capacity needed to meet the climate and related grand challenges, rapid scaling of educational innovations is needed in higher education. However, current practices of outreach and word-of-mouth propagation mostly fall short. We develop and analyze a simple computational model to understand why and, using the model and conducting sensitivity analyses, test other, more promising strategies. Our dynamic analysis reveals that outreach has limited impact and does little to accelerate word-of-mouth adoption under conditions typical in higher education. Instead, we find that community-based propagation can rapidly accelerate adoption, as is also shown by successful real-world scaling efforts.

How to cite: Kapmeier, F., Rooney-Varga, J. N., Henderson, C., and Ford, D. N.: Getting to impact at scale: A dynamic analysis to guide propagation of educational innovations in climate change, EGU General Assembly 2023, Vienna, Austria, 23–28 Apr 2023, EGU23-16102, https://doi.org/10.5194/egusphere-egu23-16102, 2023.

EGU23-16618 | Posters virtual | EOS2.3

Perfect storm for green economy and fossil fuels alike 

Will Dubitsky

Fuel prices, inflation and war have created the perfect storm for the green economy and fossil fuels alike.  

The presentation is special in its global focus on the perfect storm interconnections of components, much like a huge jigsaw puzzle for which all the pieces fit together, but in a complicated way.

Renewables are expected to represent 90% of newly installed electrical generation capacity between 2022 and 2027, overtaking coal in the process. 

Electric vehicle (EV) sales are growing hastily in China and Europe.  By contrast, North American targets are weak, leaving much room for automakers to continue to favour the more profitable gas-powered vehicles.  Another constraint is the lack of availability of many EV models, with delivery wait times as long as 2 years or more.

The U.S. Inflation Reduction Act (IRA) and the Bipartisan Infrastructure Law (BIL) combined, will catapult U.S. clean energy production plus close American EV and clean tech gaps with China and Europe.  There was a mind-boggling momentum for green economy projects, existing, under construction and planned, prior to the IRA and BIL.  The new legislative initiatives promise to stimulate massive investments green economy research, applications and R & D unparalleled elsewhere, with the possible exception of China.

The IRA and BIL are complex and likely to give the U.S. a North American green advantage at the expense of Canada.

Concurrently, with trillions in profits, the oil and gas sector is headed for gargantuan fossil fuel agenda.  Though the sector was writing off tens of billions of dollars in 2020 and all signs point to peak oil and gas nearby, the short-term sector view has taken precedence. 

This oil and gas industry tunnel vision perspective is propelled by executive bonuses linked to production increases, 41% in the case of ExxonMobil and 20% for Shell.  While the bonus criteria include transition positive elements, many of these elements may actually increase production and/or are greenwashing.  Such is the case with characterizations of natural gas as a bridge fuel, howbeit shale gas methane emissions could render this fuel as bad as coal.  Notwithstanding, greater production trumps all other considerations.

This is what it is like in a transition, the path is bumpy with much tugging in opposite directions.  Not unlike the long history of the struggle for women’s rights.  The green transition shakedown is tramping ahead, but gamechangers are only noticed when tide is omnipresent.

There are reasons that give hope for a green metamorphosis, but the foundation is shaky.

How to cite: Dubitsky, W.: Perfect storm for green economy and fossil fuels alike, EGU General Assembly 2023, Vienna, Austria, 23–28 Apr 2023, EGU23-16618, https://doi.org/10.5194/egusphere-egu23-16618, 2023.

EGU23-16704 | Posters on site | EOS2.3 | Highlight

Education for climate change - Utilizing atmospheric research facilities 

Nikos Kalivitis, Dimitris Stavrou, Mihalis Vrekoussis, Olivia Levrini, Giulia Tasquier, Laura Riuttanen, Athina Ginoudi, Giorgia Bellentani, Georgios Mavromanolakis, and Maria Kanakidou

In order to face the challenges of climate change, coordinated actions and efforts are required on global, regional and local scales. To succeed, they must be conveyed to informed, conscious and active citizens who understand the challenges and are ready to alter their way of living and thinking toward protecting our planet. Therefore, educating young people is one of the most effective tools for combating climate change. However, the increasing interest in climate change education by stakeholders, policymakers and the research community is not yet broadly incorporated into science education activities.

Atmospheric research stations provide valuable information about evolving climate change. Long-term observations of atmospheric parameters provide scientific evidence for the connections between the anthropogenic effect on atmospheric composition and the resulting changes in the planet’s climate.

Here we present educational activities at well-established atmospheric observatories part of international observational networks like ACTRIS, LTER, GAW and ICOS. The stations in those networks provide the necessary data and the links between atmospheric composition changes and climate perturbations. At the same time, these stations host at their premises local hubs where teachers and students have the chance to receive hands-on training on using environmental data in education and, ultimately, in school classrooms. The atmospheric research stations support networking, training and community building by stimulating personal engagement and out-of-school education of trainees.

How to cite: Kalivitis, N., Stavrou, D., Vrekoussis, M., Levrini, O., Tasquier, G., Riuttanen, L., Ginoudi, A., Bellentani, G., Mavromanolakis, G., and Kanakidou, M.: Education for climate change - Utilizing atmospheric research facilities, EGU General Assembly 2023, Vienna, Austria, 23–28 Apr 2023, EGU23-16704, https://doi.org/10.5194/egusphere-egu23-16704, 2023.

EGU23-17036 | ECS | Posters virtual | EOS2.3

The European Teach-In On Climate And Justice, March 2023 

Rossen Petkov and Evelina Van Mensel

Achieving the Sustainable Development Goals is essential to resolving the climate crisis. Higher education is critical in preparing climate-resilient societies and preparing students for careers in sustainable development. But how can universities reach more students in a larger variety of disciplines, outside of the dedicated climate or sustainability studies? The key is to show how their chosen field contributes to just and fair solutions. Since 2019, the Center for Environmental Policy at Bard College in New York has led a global initiative in collaborative climate education, The Worldwide Teach-In on Climate and Justice www.WorldwideTeachIn.org. In March 2022, more than 350 universities, high schools and other organizations held climate education events in 60 countries, directly engaging over 50,000 participants. The theory of change behind the initiative is that, at every school in the world, there are dozens of deeply climate-concerned faculty and staff. How do we empower these faculty to reach students across campus-- beyond the few dozen students who are directly studying climate-- in discussion about climate solutions and justice? The key is creating opportunities for faculty who are not climate experts to teach about climate from their disciplinary perspective—to focus on how artists, economists, chemists, philosophers, or business experts and others, are all working to resolve the climate crisis. For the March 2023 Teach-In, Bard is working with universities worldwide to help their climate-concerned faculty to #MakeClimateAClass. In this presentation, the local coordination team for Europe will provide insights into promoting campus-wide conversation about climate solutions in all disciplines.

How to cite: Petkov, R. and Van Mensel, E.: The European Teach-In On Climate And Justice, March 2023, EGU General Assembly 2023, Vienna, Austria, 23–28 Apr 2023, EGU23-17036, https://doi.org/10.5194/egusphere-egu23-17036, 2023.

Science-inspired art has recently gained momentum as an effective communication tool for educating the public about scientific topics, benefiting from the intrinsic abilities of art to reach a broad audience, convey ideas in novel ways, and inspire on a deep, emotional level.  An upcoming science-art exhibition furthers this concept by offering an immersive, interactive experience to the public. Titled Seas & Oceans, the two-month event seeks to educate and inspire the public about the environment, climate change, sustainability, biodiversity, and related topics through a variety of activities:

  • 1) an art exhibition containing artwork produced by collaborations between scientist and artist pairings,
  • 2) scientific talks given to the public by scientists from a range of disciplines,
  • 3) workshops for local schools and children’s organizations,
  • 4) informal chats between scientists and the public through a “Science Café”, and
  • 5) other interactive performances and activities.

Serving as the scientific coordinator of the event, I will present the strategies used to prepare the event, challenges faced in its organization, feedback from scientists and artists about their collaborations, and methods / performance indicators used to gauge its success in educating the public and energizing interest in the associated scientific topics.

How to cite: Baker, N.: “Seas & Oceans”:  An interactive, immersive science-art exhibition for communicating science and educating the public, EGU General Assembly 2023, Vienna, Austria, 23–28 Apr 2023, EGU23-17490, https://doi.org/10.5194/egusphere-egu23-17490, 2023.

EGU23-1422 | Orals | BG3.14 | Highlight

Increasing water limitation of global ecosystems in a changing climate 

Rene Orth, Jasper M.C. Denissen, Wantong Li, and Sungmin Oh

The ongoing and projected climate change involves changes in temperatures and precipitation in many regions. These changes in turn affect terrestrial ecosystems that require sufficient water and energy to provide essential services such as food security and the uptake of human-caused CO2 emissions.

This presentation will introduce the concept of ecosystem water and energy limitation, and identify areas where each limitation prevails. These areas are characterised by different sensitivities of evapotranspiration and vegetation productivity to long-term changes in temperature and precipitation. A special focus will be on the global trends of ecosystem water limitation through time, where our results show increased water sensitivity across recent and future decades in many regions. This implies an increasing ecosystem vulnerability to water availability which can lead to reductions in vegetation carbon uptake in the future, consequently amplifying climate change. In this context, near-surface soil moisture is found to be the most relevant water reservoir for vegetation functioning, while deeper soil moisture is less relevant for the investigated multi-decadal time periods.

The presentation will also illustrate that the increasing water limitation can affect the consequences of droughts in related regions. These ecosystems become more vulnerable to droughts such that disruptions in vegetation functioning are more pronounced. Also evaporative cooling will decrease more strongly which promotes hotter temperatures during drought. At the same time, decreased vegetation productivity could lead to reduced availability of fuel for wildfires.

These analyses are based on (i) observation-based data including reanalyses, satellite-based datasets and gridded data derived from upscaling in-situ observations, and (ii) simulations from land surface and Earth system models. Building upon this, the presentation will discuss the related model performance as well as opportunities for model development to more accurately capture and predict ecosystem water limitation. 

How to cite: Orth, R., Denissen, J. M. C., Li, W., and Oh, S.: Increasing water limitation of global ecosystems in a changing climate, EGU General Assembly 2023, Vienna, Austria, 23–28 Apr 2023, EGU23-1422, https://doi.org/10.5194/egusphere-egu23-1422, 2023.

Recent decades have been characterized by increasing temperatures worldwide, resulting in an exponential climb in vapor pressure deficit (VPD). Heat and VPD have been identified as increasingly important drivers of plant functioning in terrestrial biomes and are significant contributors to recent drought-induced tree mortality. Despite this, few studies have isolated the physiological response of plants to high VPD, heat, and soil drought, thus limiting our understanding and ability to predict future impacts on terrestrial ecosystems. I will present diverse experimental approaches to disentangle atmospheric and soil drivers of plant functions across scales. I will further discuss recent findings suggesting that high temperature and VPD can lead to a cascade of impacts, including reduced photosynthesis, foliar overheating, and higher risks of hydraulic failure, independently of soil moisture changes.

How to cite: Grossiord, C.: Disentangling the impact of co-varying changes in soil moisture, vapor pressure deficit, and temperature on plant carbon and water relations, EGU General Assembly 2023, Vienna, Austria, 23–28 Apr 2023, EGU23-1952, https://doi.org/10.5194/egusphere-egu23-1952, 2023.

EGU23-2596 | ECS | Orals | BG3.14

Improving stomatal optimization models for accurate prediction of photosynthesis under drought conditions. 

Victor Flo, Jaideep Joshi, Manon Sabot, David Sandoval, and Iain Colin Prentice

Accurate estimation of stomatal regulation is crucial for understanding how plants respond to changing environmental conditions, particularly under climate change. While stomatal optimization models have made significant progress in predicting instantaneous plants' carbon and water exchange, they often do not account for biochemical acclimation to drought over long time scales. In this study, we investigated the impact of incorporating photosynthetic acclimation on the accuracy of six stomatal optimization models in predicting carbon and water exchange in terrestrial C3 plants. By introducing the cost of maintaining a certain level of photosynthetic capacity into the stomatal optimization process, we incorporated photosynthetic acclimation to the previous seven days of environmental conditions. Using experimental data from 37 plant species, we found that accounting for photosynthetic acclimation improved the prediction of carbon assimilation in most of the tested models. Additionally, we found that non-stomatal mechanisms significantly contributed to photosynthesis limitation under drought conditions compared to well-watered conditions in all tested models. The hydraulic impairment functions of the stomatal models were unable to accurately account for drought effects on photosynthesis, indicating the need to consider photosynthetic acclimation to improve estimates of carbon assimilation under drought conditions.

How to cite: Flo, V., Joshi, J., Sabot, M., Sandoval, D., and Prentice, I. C.: Improving stomatal optimization models for accurate prediction of photosynthesis under drought conditions., EGU General Assembly 2023, Vienna, Austria, 23–28 Apr 2023, EGU23-2596, https://doi.org/10.5194/egusphere-egu23-2596, 2023.

EGU23-3491 | Posters on site | BG3.14 | Highlight

Discrepant decadal trends in global land-surface and air temperatures controlled by vegetation biophysical feedbacks 

Fei Kan, Xu Lian, Jiangpeng Cui, Anping Chen, Jiafu Mao, Mingzhu He, Hao Xu, and Shilong Piao

Satellite-based land surface temperature (Ts) with continuous global coverage is increasingly used as a complementary measure for air temperature (Ta), yet whether they observe similar decadal trends remains unknown. Here, we systematically analyzed the trend of the difference between satellite-based Ts and station-based Ta (Ts–Ta) over 2003–2018. We found the global land warming rate based on Ts was on average 56.7% slower than that on Ta (Ts–Ta trend: -0.0166℃ yr-1, p<0.01) during daytime of boreal summer. This slower Ts-based warming was attributed to recent Earth greening, which effectively cooled canopy surface through higher evapotranspiration and turbulent heat transfer. However, Ts showed faster warming than Ta during boreal summer nighttime (0.0159℃ yr-1, p<0.01) and boreal winter daytime (0.011℃ yr-1, p=0.14), when vegetation activity is limited by temperature and radiation. Our results indicate potential biases when using Ts in assessments of atmospheric warming and the vegetation-air temperature feedbacks.

How to cite: Kan, F., Lian, X., Cui, J., Chen, A., Mao, J., He, M., Xu, H., and Piao, S.: Discrepant decadal trends in global land-surface and air temperatures controlled by vegetation biophysical feedbacks, EGU General Assembly 2023, Vienna, Austria, 23–28 Apr 2023, EGU23-3491, https://doi.org/10.5194/egusphere-egu23-3491, 2023.

EGU23-3554 | ECS | Orals | BG3.14

Land-cover and management modulation of ecosystem resistance to drought stress 

Chenwei Xiao, Sönke Zaehle, Jean-Pierre Wigneron, Hui Yang, Christiane Schmullius, and Ana Bastos

Drought events are projected to become more severe and frequent across many regions in the future, but their impacts will likely differ among ecosystems depending on the capability of ecosystem to maintain functioning during droughts, i.e., the ecosystem resistance. Different plant species have diverse strategies to cope with drought. As a result, responses of different vegetation types have been found to be divergent for similar levels of drought severity. However, it remains unclear whether such divergence is also caused by different drought duration, climatological settings, or co-occurring compound events, etc.

Here, we evaluate vegetation resistance using different proxies for vegetation condition, namely the Vegetation Optical Depth (SMOS L-VOD) data from ESA’s Soil Moisture and Ocean Salinity (SMOS) passive L-band mission and EVI and kNDVI from NASA MODIS. L-VOD has the advantage over more commonly used vegetation indices (such as kNDVI, EVI) in that it provides more information on vegetation structure and biomass and suffers from less saturation over dense forests compared (Wigneron et al., 2020). We apply a linear autoregressive model accounting for drought, temperature and memory effects to characterize ecosystem resistance by their sensitivity to drought duration and temperature anomalies. We analyze how ecosystem resistance varies with land cover across the globe and investigate the modulation effect of forest management and irrigation. Furthermore, estimates of ecosystem resistance obtained from a similar methodology are compared between L-VOD, kNDVI and EVI.

We find that regions with higher forest fraction show stronger ecosystem resistance to extreme droughts than cropland for all three vegetation proxies. L-VOD indicates that primary forests tend to be more resistant to drought events than secondary forests, but this phenomenon cannot be detected in EVI and kNDVI. This is possibly related to their saturation in dense forests. In tropical evergreen deciduous forests, old-growth trees tend to be more resistant to drought than young trees from L-VOD and kNDVI. Irrigation increases the drought resistance of cropland substantially.

These results suggest that ecosystem resistance can be better monitored using L-VOD in dense forests and highlight the role of forest cover, forest management and irrigation in determining ecosystem resistance to droughts.


Wigneron, J.-P., Fan, L., Ciais, P., Bastos, A., Brandt, M., Chave, J., Saatchi, S., Baccini, A., and Fensholt, R.: Tropical forests did not recover from the strong 2015–2016 El Niño event, Science Advances, 6, eaay4603, https://doi.org/10.1126/sciadv.aay4603, 2020.

How to cite: Xiao, C., Zaehle, S., Wigneron, J.-P., Yang, H., Schmullius, C., and Bastos, A.: Land-cover and management modulation of ecosystem resistance to drought stress, EGU General Assembly 2023, Vienna, Austria, 23–28 Apr 2023, EGU23-3554, https://doi.org/10.5194/egusphere-egu23-3554, 2023.

EGU23-3651 | ECS | Orals | BG3.14

Observed Global Photosynthesis Response to Changing Storm Frequency and Magnitude 

Andrew Feldman, Benjamin Poulter, Joanna Joiner, Mitra Asadollahi, Joel Biederman, Abhishek Chatterjee, Pierre Gentine, Alexandra Konings, William Smith, and Lixin Wang

Rain events are becoming less frequent, but stronger in many global locations under a changing climate. These intra-seasonal rainfall features have received less attention than changes in mean temperature and total annual rainfall in their influence on the global carbon cycle. Field rainfall manipulation experiments consistently show non-negligible changes to annual photosynthesis in response to rainfall frequency alterations while holding total annual rainfall constant. However, field and modeling experiments show little consensus on the sign and magnitude of change of annual photosynthesis due to changing storm frequency and magnitude. In this study, we ask: based on satellite observations, how is global photosynthesis changing due to shifts in storm frequency and magnitude? What are the soil-plant-atmosphere drivers of the response?

Using several global satellite-based photosynthesis proxies, we find that the annual photosynthesis response to storm frequency is as high in magnitude and global spatial extent as its response to total annual rainfall. The satellite-based photosynthesis proxies and field tower sites indicate that years with fewer, stronger storms tend to show decreased photosynthesis in humid ecosystems and increased photosynthesis in drylands. The absolute magnitudes of annual photosynthesis trends show 10-20% per century changes due to rainfall frequency trends over nearly half of vegetated surfaces, which is consistent with the magnitude and extent of total annual rainfall trend effects. The contrasting responses observed in humid locations and drylands are shown to be driven by patterns of plant pulse response, soil texture, and mean atmospheric aridity response to rain frequency. Ultimately, our results indicate that intra-seasonal rainfall variability drives global photosynthesis interannual variability similarly to interannual rainfall variability.

How to cite: Feldman, A., Poulter, B., Joiner, J., Asadollahi, M., Biederman, J., Chatterjee, A., Gentine, P., Konings, A., Smith, W., and Wang, L.: Observed Global Photosynthesis Response to Changing Storm Frequency and Magnitude, EGU General Assembly 2023, Vienna, Austria, 23–28 Apr 2023, EGU23-3651, https://doi.org/10.5194/egusphere-egu23-3651, 2023.

EGU23-4319 | Posters on site | BG3.14 | Highlight

Compound drought slow down the greening of the Earth 

Xianfeng Liu, Gaopeng Sun, Zheng Fu, Philippe Ciais, Xiaoming Feng, Jing Li, and Bojie Fu

Vegetation response to soil and atmospheric drought has raised extensively controversy, however, the relative contributions of soil drought, atmospheric drought and their compound drought on global vegetation growth remain unclear. Combining the changes in soil moisture (SM), vapor pressure deficit (VPD) and vegetation growth (NDVI) during 1982-2015, here we evaluated the trends of these three drought types and quantified their impacts on global NDVI. We found that global VPD has increased 0.22±0.05 kPa·decade-1 during 1982-2015, and this trend was doubled after 1996 (0.32±0.16 kPa·decade-1) than before 1996 (0.16±0.15 kPa·decade-1). Regions with large increase in VPD trend generally accompanied with decreasing trend in SM, leading to a widespread increasing trend in compound drought across 37.62% land areas. We further found compound drought dominated the vegetation browning since late 1990s. Earth system models agree with the dominant role of compound drought on vegetation growth, but their negative magnitudes are considerably underestimated, with half of the observed results (34.48%). Our results provided the evidence of compound drought induced global vegetation browning, highlighting the importance of correctly simulating the ecosystem-scale response to the under-appreciated exposure to compound drought as it will increase with climate change.

How to cite: Liu, X., Sun, G., Fu, Z., Ciais, P., Feng, X., Li, J., and Fu, B.: Compound drought slow down the greening of the Earth, EGU General Assembly 2023, Vienna, Austria, 23–28 Apr 2023, EGU23-4319, https://doi.org/10.5194/egusphere-egu23-4319, 2023.

EGU23-4622 | ECS | Posters on site | BG3.14

Significant drought legacy effects on gross primary productivity detected in terrestrial ecosystems across the globe 

Xin Yu, René Orth, Markus Reichstein, Michael Bahn, Ulisse Gomarasca, Mirco Migliavacca, Dario Papale, Christian Reimers, and Ana Bastos

The frequency, intensity, and duration of drought are expected to increase in many regions under climate change. A large number of studies have shown that droughts influence terrestrial ecosystems. Yet, assessments of drought impacts on ecosystem carbon cycling usually focus on instantaneous effects during drought, while legacy effects following drought can be important as well. 

Here, we provide the first synthesis about drought legacy effects on gross primary productivity (GPP) based on 90 long-term (>=7 years) eddy covariance sites across the globe. We predict the ‘potential’ GPP in the 2 years following drought (considered legacy years) based on a random forest model trained by data in non-legacy time periods. Legacy effects are inferred based on the difference between actual and ‘potential’ GPP in legacy periods. Results show widespread drought legacy effects on GPP across the globe. The change in GPP due to legacy effects is of the same order of magnitude as instantaneous effects. Furthermore, using the unconditional dependence test on many different potential factors, we find legacy effects unconditionally depend on aridity, instantaneous impact intensity, and species richness in forests. The conditional dependence test further reveals aridity primarily modulates legacy effects in forests.  These findings highlight the significance of drought legacy effects on ecosystem carbon cycling across the globe. We find a dominant role of climatic controls on drought legacy effects, while species diversity effects did not explain variability in drought legacy effects. 

How to cite: Yu, X., Orth, R., Reichstein, M., Bahn, M., Gomarasca, U., Migliavacca, M., Papale, D., Reimers, C., and Bastos, A.: Significant drought legacy effects on gross primary productivity detected in terrestrial ecosystems across the globe, EGU General Assembly 2023, Vienna, Austria, 23–28 Apr 2023, EGU23-4622, https://doi.org/10.5194/egusphere-egu23-4622, 2023.

EGU23-6416 | ECS | Posters on site | BG3.14

Accelerating the understanding of plant response to drought stress 

Fakhereh Alidoost, Yang Liu, Bart Schilperoort, Zhongbo Su, and Yijian Zeng

Climate extremes like droughts and heatwaves impact how water, energy, and carbon move through ecosystems. Soil-water-plant-energy interactions can be represented by SCOPE (vegetation photosynthesis model) and STEMMUS (soil water and heat model). SCOPE simulates the radiative transfer of incident light and thermal and fluorescence radiation emitted by soil and plants, temperatures of leaves and soil in the sun and shade, photosynthesis and turbulent heat exchange whereas STEMMUS traces soil moisture and soil heat dynamics and root water uptake.  

The integrated model, “STEMMUS-SCOPE”, thus links vegetation dynamics to soil moisture and soil temperature variability. This helps to simulate evaporation, transpiration and carbon fluxes better, especially under water stress conditions. With STEMMUS-SCOPE, we can model variables like moisture levels in deeper soil (root-zone-soil moisture) and the amount of carbon that is stored underground (carbon sequestration) at a global scale.  

However, applying STEMMUS-SCOPE across ecosystems at a global scale faces numerical problems and computational challenges, such as numerical convergency of the model, optimization issues in calibration, and expensive computational cost. To overcome the challenges, we are developing tools for efficient computing and data handling within the context of EcoExtreML project. The project aims to improve the coupling of STEMMUS and SCOPE models, approximate the integrated model by a machine learning approach, and estimate uncertain model states and parameters using data assimilation techniques. The results of STEMMUS-SCOPE are currently prepared for 170 flux tower sites representing 1040 site-years of data with a half-hour time step across most of the world’s climate zones and representative biomes. 

In this talk, we will give you an overview of STEMMUS-SCOPE, show how the model can be used, and introduce EcoExtreML project. 

References:  

SCOPE: https://doi.org/10.5194/bg-6-3109-2009,  https://github.com/Christiaanvandertol/SCOPE 

STEMMUS: https://doi.org/10.1007/978-3-642-34073-4, https://github.com/yijianzeng/STEMMUS 

STEMMUS–SCOPE : Integrated modeling of canopy photosynthesis, fluorescence, and the transfer of energy, mass, and momentum in the soil–plant–atmosphere continuum (STEMMUS–SCOPE v1.0.0), https://doi.org/10.5194/gmd-14-1379-2021  

EcoExtreML project: Accelerating process understanding for ecosystem functioning under extreme climates with Physics-aware machine learning, https://research-software-directory.org/projects/ecoextreml, https://github.com/EcoExtreML  

How to cite: Alidoost, F., Liu, Y., Schilperoort, B., Su, Z., and Zeng, Y.: Accelerating the understanding of plant response to drought stress, EGU General Assembly 2023, Vienna, Austria, 23–28 Apr 2023, EGU23-6416, https://doi.org/10.5194/egusphere-egu23-6416, 2023.

EGU23-6909 | ECS | Posters on site | BG3.14

The role of stream heterogeneity in gas emissions from headwater streams 

Nicola Durighetto, Anna Carozzani, Paolo Peruzzo, and Gianluca Botter

Headwater streams as hotspots of carbon dioxide evasion from surface water, and therefore represent a key component of the global carbon cycle. The gas transfer velocity at the water-air interface, k, modulates gas emissions from rivers and streams and is physically related to the energy dissipated by the flow field, ε. Here, we developed mathematical tools for quantifying the fraction of carbon emissions that can be related to localized height drops in the riverbed (e.g. in steps or step-pool formations, which constitute localized energy losses). Direct measures of stream CO2 outgassing in an Italian headwater catchment and numerical simulations are also part of the study. Our results show that high energy heterogeneous streams are characterized by significantly higher gas transfer velocities than that of an homogeneous stream. The empirical data also suggests the presence of a pronounced heterogeneity of outgassing along a river network. In particular, in many settings the total gas evasion may be dominated by localized gas emissions in correspondence of hydraulic discontinuities. These results offer a clue for the interpretation of empirical data about stream outgassing in heterogeneous reaches, and provides insight into the development of more advanced models for the large-scale estimation of CO2 outgassing from mountain rivers.

How to cite: Durighetto, N., Carozzani, A., Peruzzo, P., and Botter, G.: The role of stream heterogeneity in gas emissions from headwater streams, EGU General Assembly 2023, Vienna, Austria, 23–28 Apr 2023, EGU23-6909, https://doi.org/10.5194/egusphere-egu23-6909, 2023.

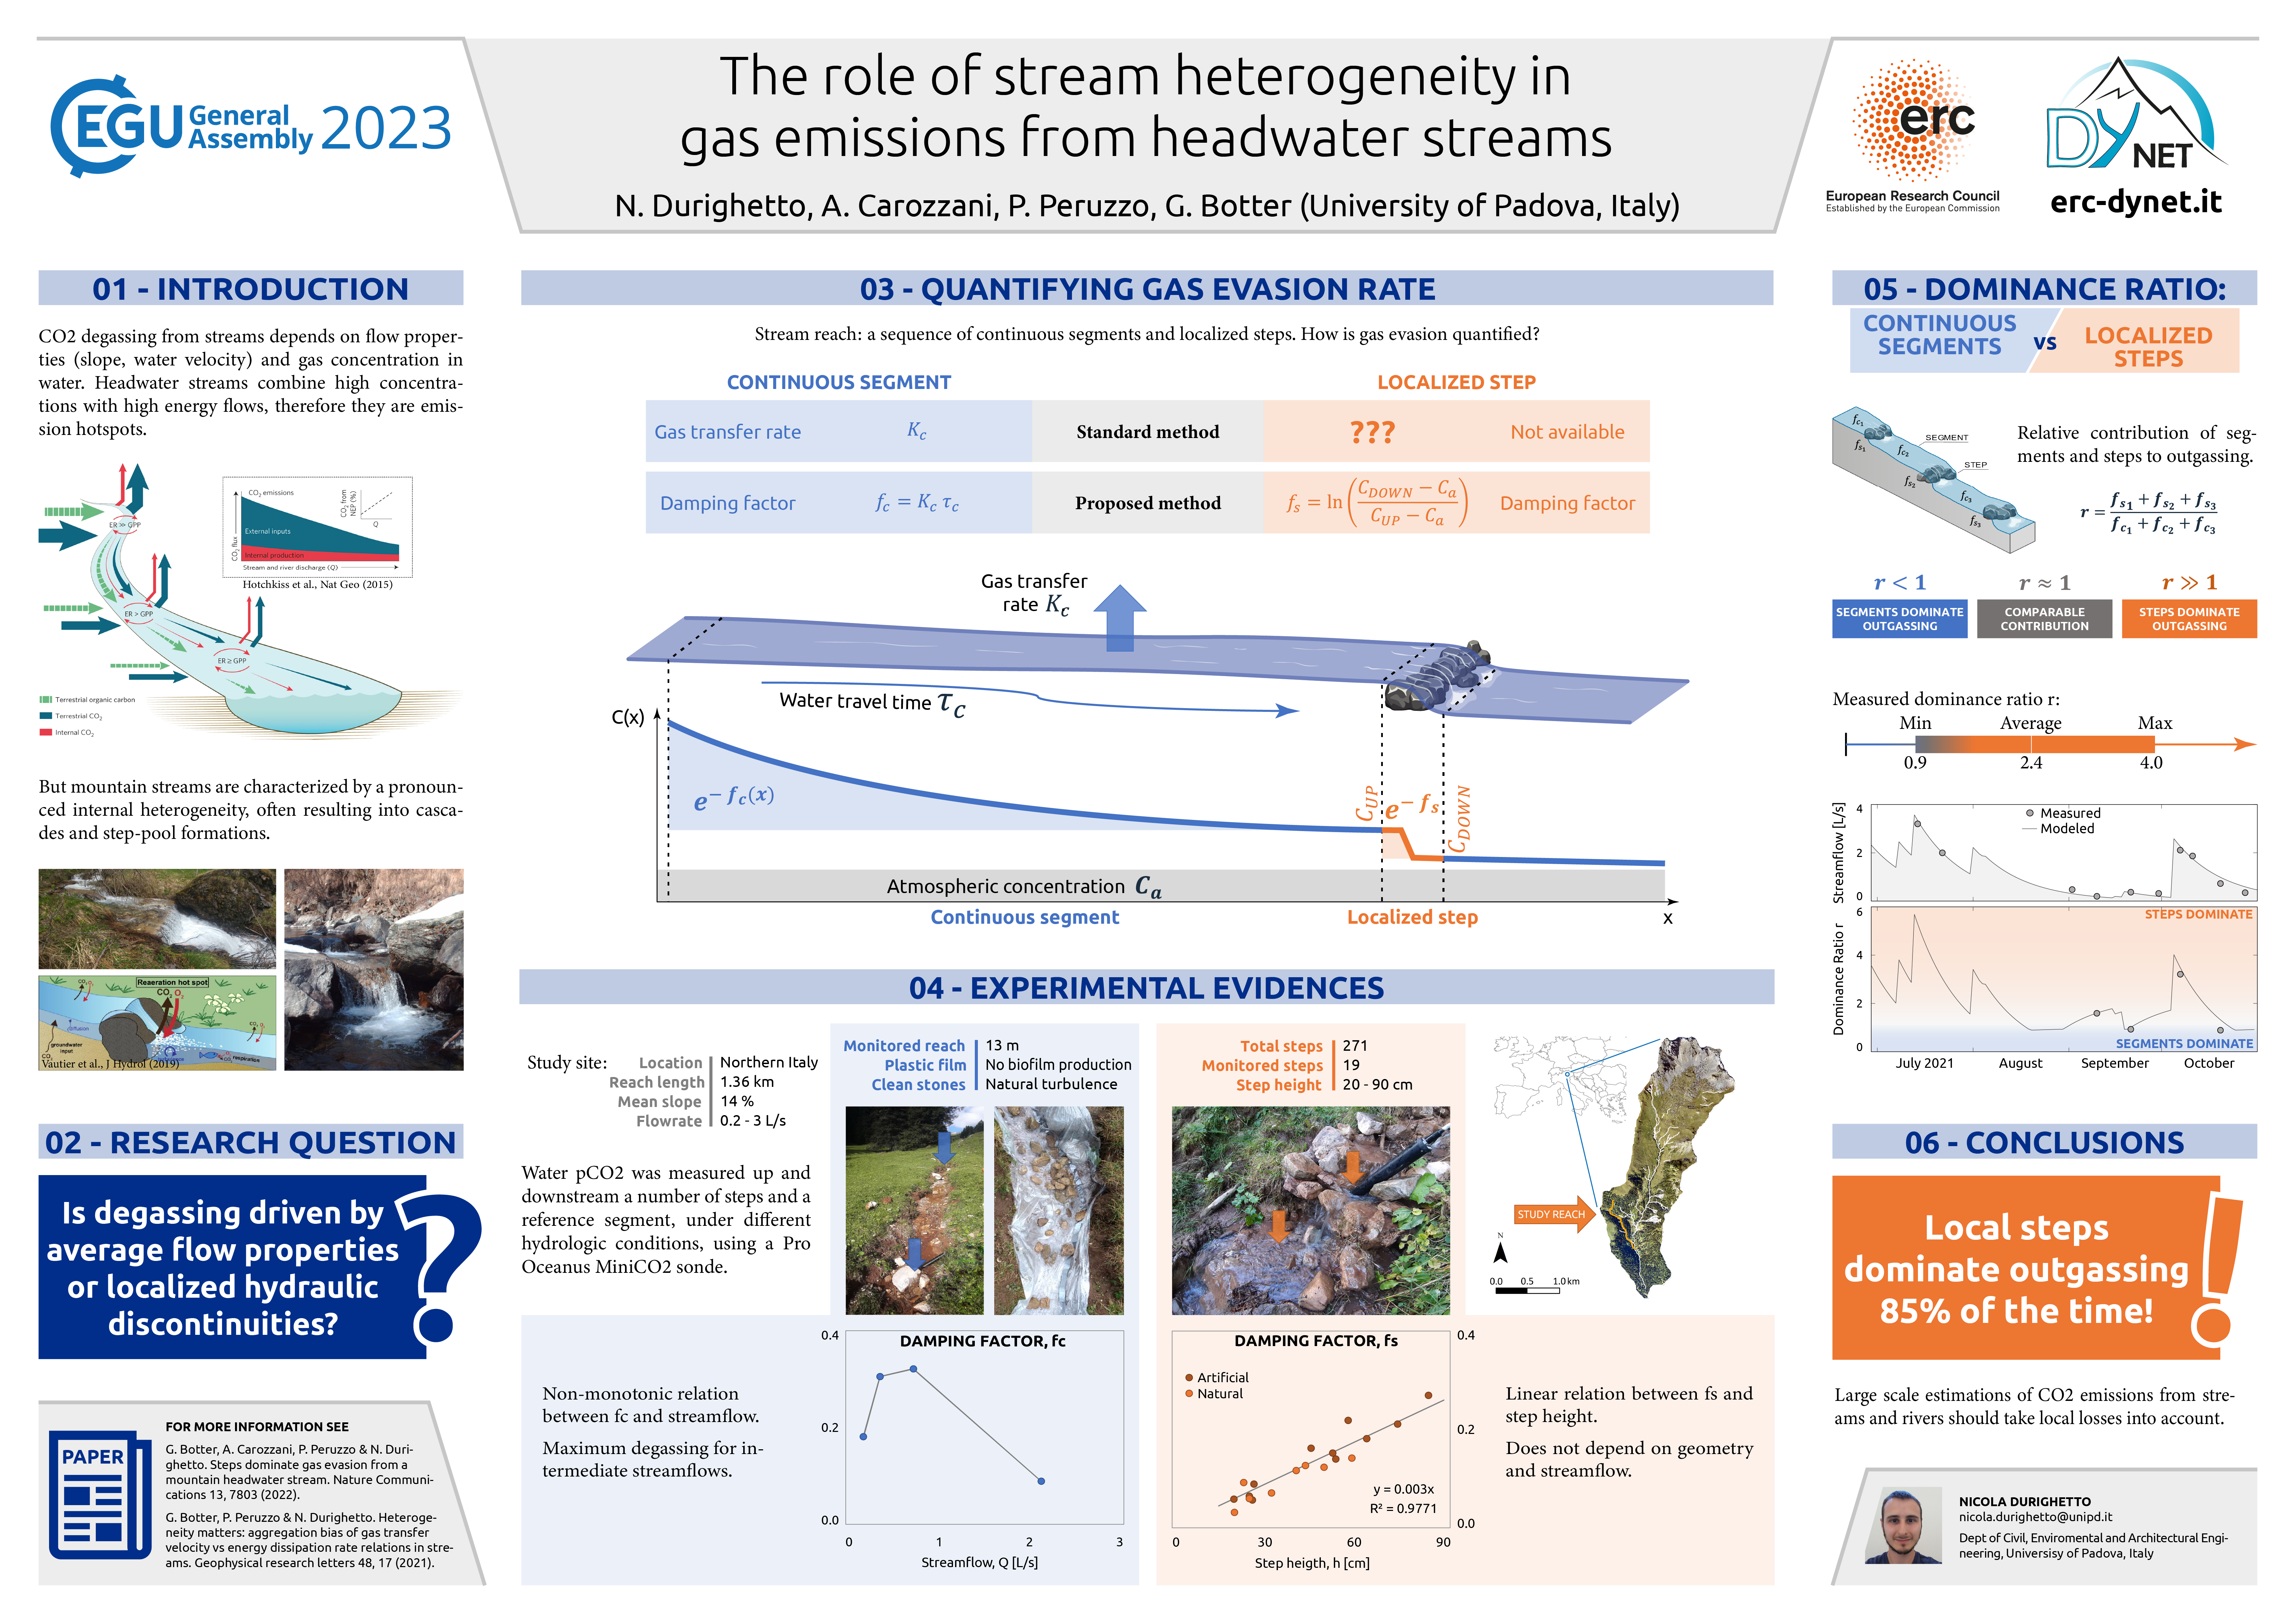
EGU23-7670 | Posters on site | BG3.14

Near-surface vs. sub-surface soil moisture impacts on vegetation functioning 

Prajwal Khanal, Anne Hoek van Dijke, Yijan Zeng, and René Orth

Soil water availability is a critical requirement for vegetation functioning in a water-limited regime. Vegetation takes up water from varying soil depths depending on their rooting location and soil moisture availability. The uptake depth varies spatially across climate regimes and vegetation types and temporally between seasons. Yet, a scientific consensus on the global relevance of near-surface and sub-surface soil moisture for vegetation functioning is still lacking and is the focus of this study. 

In particular, we calculate the correlation between the Near-Infrared Reflectance of Vegetation (NIRv) with both satellite-derived near-surface soil moisture from ESA-CCI and terrestrial water storage from GRACE. This is done globally and with monthly data during the growing season at each grid cell and accounting for the confounding effects of temperature and radiation. We analyze how these correlations vary spatially across varying vegetation types and climatic regimes, and temporally between all growing season months and particularly dry months. Finally, we repeat the analyses using Sun-induced fluorescence (SIF) data instead of NIRv. 

We find that NIRv and SIF correlate more strongly with near-surface soil moisture compared to terrestrial water storage in semi-arid regions with low tree cover. This suggests that the vegetation preferentially takes up water from near-surface soil moisture whenever available to meet its transpiration demand.   In contrast, in regions with more tree cover and in drier regions, the correlation with terrestrial water storage is comparable to or even higher than with near-surface soil moisture. This indicates that trees can make use of their deep rooting systems to access deeper soil moisture resources, similar to vegetation in arid regions. In particularly dry months, correlations with near-surface soil moisture increase while this is even more the case with terrestrial water storage, highlighting the relevance of deeper water resources during rain-scarce periods.

Overall, while direct observations of sub-surface soil moisture are scarce, this study employs different satellite-based data streams in order to estimate the relevance of near-surface versus sub-surface soil moisture for vegetation functioning. This can inform the representation of vegetation-water interactions in land surface models to support more accurate climate change projections.


How to cite: Khanal, P., van Dijke, A. H., Zeng, Y., and Orth, R.: Near-surface vs. sub-surface soil moisture impacts on vegetation functioning, EGU General Assembly 2023, Vienna, Austria, 23–28 Apr 2023, EGU23-7670, https://doi.org/10.5194/egusphere-egu23-7670, 2023.

EGU23-7820 | Orals | BG3.14

When do plant hydraulics matter in ecosystem modelling? 

Athanasios Paschalis, Simone Fatichi, Manon Sabot, and Martin de Kauwe

 The dynamics of the ascent of water from the soil to the leaves of vascular plants determine ecosystem responses to environmental forcing and their recovery from periods of water stress. Recently several models that describe the dynamics of plant hydraulics have been proposed. In this study we introduce four different configurations of a plant hydraulics model in an existing terrestrial biosphere model T&C. The model configurations in increasing order of complexity introduce the basics of the cohesion-tension theory, plant water storage dynamics and long-term damage and repair of the plant's water conducting system. Using the model configurations at six case studies spanning semi-arid to tropical ecosystems we quantify how plant hydraulics can modulate overall ecosystem responses to environmental forcing. As droughts develop, models with plant hydraulics predict a slower onset of plant water stress and can reproduce diurnal patterns of water and carbon fluxes that models that incorporate empirical stomatal conductance only cannot capture. However, when the complex variability of the environmental forcing (i.e., observed hourly meteorological forcing driving the models) is considered, plant hydraulics alone cannot significantly improve model performance. Models that only have simple empirical stomatal conductance models can adequately capture most of the variability of the observed ecosystem responses without explicitly simulating plant hydraulics. Most of the time, the gain from introducing plant hydraulics in ecosystem modelling is limited compared to the possible model improvements from correct representation of other processes such as plant phenology. Nevertheless, during periods of water stress, only models that explicitly simulate plant hydraulics can reproduce observed ecosystem responses to stress and the dynamics of ecosystem recovery. Finally, sensitivity analyses highlight that accurately modelling plant hydraulics relies on good knowledge of plant hydraulics traits, particularly at the leaf level, as stomata are usually the hydraulic bottleneck in the water flow from the soil to the atmosphere.

How to cite: Paschalis, A., Fatichi, S., Sabot, M., and de Kauwe, M.: When do plant hydraulics matter in ecosystem modelling?, EGU General Assembly 2023, Vienna, Austria, 23–28 Apr 2023, EGU23-7820, https://doi.org/10.5194/egusphere-egu23-7820, 2023.

EGU23-8013 | ECS | Orals | BG3.14

Contrasting responses of vegetation to intraseasonal rainfall in Earth System Models 

Bethan L. Harris, Christopher M. Taylor, Tristan Quaife, and Phil P. Harris

The response of vegetation productivity to water availability provides a key link between the carbon and water cycles. Correctly representing this response in Earth System Models (ESMs) is essential for accurate modelling of the terrestrial carbon cycle and the evolution of the climate system. To investigate how well models capture this relationship at intraseasonal timescales, we use global datasets based on satellite observations to assess the land surface response to intraseasonal precipitation events, and evaluate the performance of CMIP6 ESMs in representing this response in the recent historical period. Whereas models are able to capture the observed surface soil moisture (SSM) response with reasonable agreement, there are large inter-model discrepancies in the response of Gross Primary Productivity (GPP), both in magnitude and timing, even in regions where land cover is similar between models. In particular, ACCESS-ESM and NorESM produce much lower-amplitude GPP responses to rainfall than UKESM and CNRM-ESM. All the models studied are able to represent that the regional amplitude of the GPP response is positively correlated with the amplitude of the SSM response, and negatively correlated with the amplitude of the vapour pressure deficit (VPD) response. All models except NorESM also capture that stronger SSM responses are associated with faster GPP responses. However, the models differ in their sensitivity to these drivers, and can produce very different GPP responses from similar variations in SSM and VPD, particularly in climatologically dry regions. This highlights the need for a better understanding of the uncertainties in the representation of water-vegetation relationships in ESMs, such as the effect of atmospheric vapour pressure deficit on stomatal conductance and the control of soil moisture stress on GPP.

How to cite: L. Harris, B., M. Taylor, C., Quaife, T., and P. Harris, P.: Contrasting responses of vegetation to intraseasonal rainfall in Earth System Models, EGU General Assembly 2023, Vienna, Austria, 23–28 Apr 2023, EGU23-8013, https://doi.org/10.5194/egusphere-egu23-8013, 2023.

EGU23-8747 | ECS | Orals | BG3.14

Modeling global vegetation processes and hyperspectral canopy radiative transfer using CliMA Land 

Yujie Wang, Renato Braghiere, Anthony Bloom, and Christian Frankenberg

Recent progress in satellite observations has provided unprecedented opportunities to monitor vegetation activity at global scale. However, a major challenge in fully utilizing remotely sensed data to constrain land surface models (LSMs) lies in inconsistencies between simulated and observed quantities. For example, gross primary productivity (GPP) and transpiration (T) that traditional LSMs simulate are not directly measurable from space, although they can be inferred from spaceborne observations using assumptions that are inconsistent with those LSMs. In comparison, canopy reflectance and fluorescence spectra that satellites can detect are not modeled by traditional LSMs. To bridge these quantities, we presented an overview of the next generation land model developed within the Climate Modeling Alliance (CliMA), and simulated global GPP, T, and hyperspectral canopy radiative transfer (RT; 400--2500 nm for reflectance, 640--850 nm for fluorescence) at hourly time step and 1 degree spatially resolution using CliMA Land. CliMA Land predicts vegetation indices and outgoing radiances, including solar-induced chlorophyll fluorescence (SIF), normalized difference vegetation index (NDVI), enhanced vegetation index (EVI), and near infrared reflectance of vegetation (NIRv) for any given sun-sensor geometry. The modeled spatial patterns of CliMA Land GPP, T, SIF, NDVI, EVI, and NIRv correlate significantly with existing data-driven products (mean R2 = 0.777 for 9 products). CliMA Land would be also useful in high temporal resolution simulations, e.g., providing insights into when GPP, SIF, and NIRv diverge.

How to cite: Wang, Y., Braghiere, R., Bloom, A., and Frankenberg, C.: Modeling global vegetation processes and hyperspectral canopy radiative transfer using CliMA Land, EGU General Assembly 2023, Vienna, Austria, 23–28 Apr 2023, EGU23-8747, https://doi.org/10.5194/egusphere-egu23-8747, 2023.

Expanding access to remotely sensed Earth observations provides us with an opportunity to examine the underlying spatiotemporal coupling between vegetation, both natural and managed, and the hydroclimate. Applying approximately 20 years of satellite records, we demonstrate a method to quantify the sensitivity and stability of land-atmosphere interactions. Here we evaluate the predictability of vegetation via the Normalized Difference Vegetation Index (NDVI) across croplands, shrublands, grasslands, and woodlands of East Africa as it relates to fluctuations in precipitation, soil moisture, evapotranspiration, and land surfaced temperature. In this study, we detect the strength of state dependency among these variables at the dekadal (10-day) to monthly scale using a data-driven approach known as Empirical Dynamic Modeling (EDM). There is notable spatial variability in NDVI predictability, with equatorial areas generally expressing the poorest skill, which can be attributed to the inconsistent rainfall seasonality and high aridity. Woodlands exhibit strong predictability throughout the region while vegetation response to environmental drivers in grasslands is less reliable. Our results suggest water availability, uptake and storage are important factors influencing the NDVI cycle. For a one-month lead time, high predictive skill can be retrieved from the time series, though skill weakens by a four- to sixth-month lead, at which point the overall seasonality appears to play a dominant role. One contribution to highlight is the advancement in our understanding of the relationship between vegetation and land surface temperature, which is particularly valuable in drought-prone East Africa. In this presentation, we introduce an application of EDM for biogeosciences, assess how historical seasonal information of the hydroclimate and vegetation across various land use and land covers can inform future environmental patterns, and identify critical areas of inquiry with a changing climate and extending agricultural production.

How to cite: Green, R. and Caylor, K.: Measuring the Sensitivity and Stability of Vegetation in Response to the Hydroclimate Across East Africa with an Empirical Dynamic Modeling Approach, EGU General Assembly 2023, Vienna, Austria, 23–28 Apr 2023, EGU23-9480, https://doi.org/10.5194/egusphere-egu23-9480, 2023.

EGU23-10417 | ECS | Orals | BG3.14

Disentangling the influence of vegetation structure and physiology on land-atmosphere coupling 

Wantong Li, Mirco Migliavacca, Alexandra G. Konings, Gregory Duveiller, Markus Reichstein, and René Orth

Terrestrial vegetation is a key component of the Earth system as it mediates the exchange of carbon, water and energy between the land and the atmosphere. Thereby, the vegetation affects the climate through changes in its structure (such as leaf area index, LAI) and its physiology (such as stomatal conductance); However, their relative contributions and respective processes on the land-atmosphere coupling are not yet understood. For instance, increased LAI, referred to as structural changes, promotes transpiration and vegetation productivity, and increases the surface albedo in most cases. In contrast, decreased surface conductance, referred to as physiological changes, could reduce transpiration and productivity. Therefore, the overall feedback of vegetation to climate change via water, carbon and energy exchange will depend on the relative importance of structural and physiological responses. Here we study to what extent dynamic changes in global vegetation structure and physiology modulate land-atmosphere coupling using satellite remote-sensing, data-driven, and earth system modelled vegetation data, as well ashydro-meteorological reanalysis. The land-atmosphere coupling is quantified through the correlation between soil moisture and lagged vapor pressure deficit determined with a moving time window. We employ random forests to quantify vegetation physiology by accounting for functional variability (e.g. GPP and ET) explained by hydro-meteorological data but not by the vegetation structure. Then using an explainable machine learning approach (SHAP), we determine the contributions of vegetation structure and physiology where we find overall larger contributions of structure on regulating land-atmosphere coupling during the growing season. The relative importance of vegetation structure differs across ecosystems, with stronger contributions in dry ecosystems. Furthermore, we analyze the variations of the relevance of vegetation structure over time and in particular during warm and dry periods. The results are partially backed up by using in-situ measurements of physiological traits to interpret the large-scale observed physiological patterns.

How to cite: Li, W., Migliavacca, M., Konings, A. G., Duveiller, G., Reichstein, M., and Orth, R.: Disentangling the influence of vegetation structure and physiology on land-atmosphere coupling, EGU General Assembly 2023, Vienna, Austria, 23–28 Apr 2023, EGU23-10417, https://doi.org/10.5194/egusphere-egu23-10417, 2023.

EGU23-10949 | ECS | Orals | BG3.14

Understanding vegetation drought legacy effects on carbon cycling using observations from multiple platforms 

Yitong Yao, Yujie Wang, Yi Yin, and Christian Frankenberg

Drought legacy effects refer to the lasting impacts on the carbon cycle from droughts, being a prime uncertainty in predicting future land carbon sink in a changing climate. While previous studies have been focusing on the drought legacy effects on tree growth using tree ring chronologies, the rapid developments of site and satellite observations over the past decades provide us new opportunities to investigate the effects with improved temporal and spatial coverage. For example, retrievals of canopy structure, photosynthesis, evapotranspiration, and vegetation water content would allow for evaluating the differences in recovery processes in magnitude, timing and duration of the legacy effects. Potential asynchrony and divergence among these multiple legacy indicators result in large uncertainties in understanding the full range of vegetation responses to drought. To address this issue, this study aims to leverage the development of a new generation Earth system model (CliMA) in combination with site and satellite observations to understand the various legacy effects on carbon sink responses from site to regional scales. Through investigating the temporal and spatial patterns of legacy effects, our work will gain a comprehensive understanding of drought related carbon cycle feedback and benefit science-based decision making facing changing climate, especially extreme events. 

How to cite: Yao, Y., Wang, Y., Yin, Y., and Frankenberg, C.: Understanding vegetation drought legacy effects on carbon cycling using observations from multiple platforms, EGU General Assembly 2023, Vienna, Austria, 23–28 Apr 2023, EGU23-10949, https://doi.org/10.5194/egusphere-egu23-10949, 2023.

EGU23-11271 | ECS | Posters on site | BG3.14

Water use efficiency differs for mixed and monospecific boreal forests in Sweden 

Alisa Krasnova, Peng Zhao, Anne Klosterhalfen, Jinshu Chi, Tim Schacherl, Mats B. Nilsson, and Matthias Peichl

Ecosystem water use efficiency (WUE) is a key characteristic that describes the coupling of carbon and water exchange and can be used as an indicator of a forest's adaptability to varying climatic conditions. Mixed forests, characterized by the coexistence of two or more dominant tree species, may potentially exhibit higher productivity and greater resistance to extreme weather events due to possible niche differentiation among dominant species, leading to more efficient nutrient utilization. However, the increased productivity may also result in higher evapotranspiration demand, resulting in lower WUE compared to monospecific forests. 
In this study, we aim to assess the variation in WUE of mixed and monospecific boreal forests in response to different environmental factors using eddy-covariance measurements. The two study sites are represented by forest stands of similar age, growing under the same climatic conditions and located in close proximity (~10km distance) in Northern Sweden. The Rosinedalsheden site is a ~100-year-old monospecific pine (Pinus sylvestris) forest stand with sandy soils. The Svartberget site is a mixed ~110-year-old forest featuring pine (Pinus sylvestris, 61%), spruce (Picea abies, 34%), and birch (Betula sp., 5%) species, with soils dominated by till and sorted sediments. Our study spans a period of seven years (2014-2020) and covers a wide range of weather conditions, including the 2018 heatwave.

How to cite: Krasnova, A., Zhao, P., Klosterhalfen, A., Chi, J., Schacherl, T., B. Nilsson, M., and Peichl, M.: Water use efficiency differs for mixed and monospecific boreal forests in Sweden, EGU General Assembly 2023, Vienna, Austria, 23–28 Apr 2023, EGU23-11271, https://doi.org/10.5194/egusphere-egu23-11271, 2023.

EGU23-11564 | ECS | Orals | BG3.14

Vegetation optical depth reveals changes in ecosystem-level water stress for global forests 

Samuli Junttila, Adrià Descals, Iolanda Filella, Josep Peñuelas, Martin Brandt, Jean-Pierre Wigneron, and Mikko Vastaranta

Plant water stress due to climate change is posing a threat to various ecosystem services such as carbon sequestration, food and wood production, and climate regulation. To address this issue, methods are needed to assess and monitor plant water stress at various spatial and temporal scales. Passive microwave emission observations from satellites have proven useful in monitoring changes in vegetation water content and assessing plant water stress at a low spatial resolution (> 9 km). In this study, we used vegetation optical depth (VOD) and measurements of hydraulic vulnerability to create a novel model for assessing ecosystem-level water stress. We used L-band VOD and global measurements of xylem water potential at 88% loss of stem hydraulic conductivity (P88) from the TRY database (including 1103 measurements of P88 from 463 species and nine different vegetation biomes) to create a linear regression model between L-band VOD and biome-level P88. We used monthly mean values of L-band VOD and calculated ratios of yearly minimum and maximum VOD (L-VODmin/max) for each pixel to describe average variability in ecosystem-level water content. The developed L-VODmin/max metric explained 75% of the variation in P88 at the biome level (R2=0.75) indicating that the novel L-VODmin/max metric is capable of capturing changes in plant water status. We then used the L-VODmin/max metric and daily climate data from the ERA5 to see if water stress has increased over time in the world's forests that are more water limited (aridity index below 1.5). For these areas, we found a positive trend in maximum daily vapour pressure deficit, which correlated negatively (p<0.05) with L-VODmin/max trend for the same time period further confirming that L-VODmin/max is capable of explaining differences in plant water status. Additionally, we examined the trend in L-VODmin/max for global forests for the same 2011-2020 period and found a significant negative trend (increasing water stress, p<0.05) for forests in central Africa, southeast Asia, and eastern Australia, and a positive trend (decreasing water stress) for boreal forests in North America and rainforests in Indonesia. Further studies are required to confirm our results suggesting that some of the world's largest carbon sinks are experiencing rapid changes in water stress as a result of climate change.

How to cite: Junttila, S., Descals, A., Filella, I., Peñuelas, J., Brandt, M., Wigneron, J.-P., and Vastaranta, M.: Vegetation optical depth reveals changes in ecosystem-level water stress for global forests, EGU General Assembly 2023, Vienna, Austria, 23–28 Apr 2023, EGU23-11564, https://doi.org/10.5194/egusphere-egu23-11564, 2023.

EGU23-11630 | Posters on site | BG3.14

Optimal stomatal control in the presence of leaf-atmosphere coupling 

Stan Schymanski, Milan Milenovic, and Gitanjali Thakur

Plant leaves absorb solar radiation and carbon dioxide (CO2) from the atmosphere while releasing water vapour, oxygen and heat to the atmosphere. The leaf-atmosphere interface is hence the primary determinant of water-carbon interactions, where stomata control transpiration according to soil water availability, but at the cost of reducing carbon uptake by photosynthesis. It has been proposed that stomata not only respond to water stress, but function in a way to maximise a plant's long-term carbon gain by dynamically economising plant available water according to varying environmental conditions (Cowan and Farquhar, 1977). While the search for the relevant costs of stomatal opening focuses more and more on the costs of the infrastructure needed to supply water to the leaves, the consequences of opening stomata in the presence of leaf-atmosphere feedbacks, potentially resulting in a cooling and humidification of the air at the diurnal scale, hence reducing evaporative demand (Cowan, 1978), and/or depletion of atmospheric CO2, hence reducing CO2 uptake, have so far not been considered in stomatal optimality modelling. It has been shown that optimal response of vegetation to even small long-term variations in atmospheric CO2 can lead to substantial changes in land-atmosphere exchange (Schymanski et al., 2015), while the effect of trends in atmospheric vapour pressure concentration and temperature has also been documented widely. However, little research has been conducted on the optimal behaviour of plants in the presence of land-atmosphere feedbacks.

Here we present a theoretical analysis and preliminary experimental results of (optimal) stomatal control in the presence of leaf-atmosphere coupling. The coupling strength is represented theoretically by adding an additional control volume representing the leaf boundary layer or canopy air space, and experimentally by varying the flow rate of dry and CO2-rich air into a leaf cuvette. We discuss the positive and negative effects of a de-coupled canopy air space for leaf gas and energy exchange, and present experimental and mathematical methods to put them into relation to each other.

Literature:

Cowan, I. R.: Water use in higher plants, in: Water: planets, plants and people, edited by: McIntyre, A. K., Australian Academy of Science, Canberra, 71–107, 1978.

Cowan, I. R. and Farquhar, G. D.: Stomatal Function in Relation to Leaf Metabolism and Environment, in: Integration of activity in the higher plant, edited by: Jennings, D. H., Cambridge University Press, Cambridge, 471–505, 1977.

Schymanski, S. J., Roderick, M. L., and Sivapalan, M.: Using an optimality model to understand medium and long-term responses of vegetation water use to elevated atmospheric CO2 concentrations, AoB Plants, 7, plv060, https://doi.org/10.1093/aobpla/plv060, 2015.

How to cite: Schymanski, S., Milenovic, M., and Thakur, G.: Optimal stomatal control in the presence of leaf-atmosphere coupling, EGU General Assembly 2023, Vienna, Austria, 23–28 Apr 2023, EGU23-11630, https://doi.org/10.5194/egusphere-egu23-11630, 2023.

EGU23-12444 | Orals | BG3.14

Using machine learning to quantify multi-scale soil moisture controls on water and carbon fluxes at the land surface 

Rafael Rosolem, Daniel Power, Miguel Rico-Ramirez, Pierre Gentine, David McJannet, Humberto da Rocha, Martin Schrön, and Corinna Rebmann

Knowledge of fluxes of water vapor and carbon at the land surface are paramount to our understanding of the Earth system. Large-scale network initiatives such as the Fluxnet allow us to better understand the environmental controls on the evapotranspiration and gross primary productivity. An important aspect of such initiatives is that its large number of sites allow for localized knowledge to be upscaled to a region or even globally. This can be either done by employing physics-based global land models or empirically, via data-driven approaches. Particularly, we have seen a significant increase of data-driven approaches with the use of machine learning techniques more recently. Here, we use a similar structure employed in the FLUXCOM initiative to focus particularly on the role of soil moisture information in predicting evapotranspiration and gross primary productivity at several flux sites encompassing a wide range of hydroclimates and biomes around the globe. Our analyses employ a machine learning method to a predictive model of evapotranspiration and gross primary productivity, while focusing primarily on how changes in the way soil moisture is incorporated into the methodology affects such predictions. First, we evaluate the predictive power of this model when soil moisture is directly estimated via observations against more indirect estimates via bucket-type models. Secondly, we evaluate the role of the spatial resolution of different soil moisture estimates in predicting both fluxes. We do this by using three sets of direct estimates covering distinct spatial footprints co-located at all flux sites: (1) point-scale time-domain reflectometers, (2) field-scale cosmic-ray neutron sensors, and (3) regional-scale satellite remote sensing products. In this talk, we summarize which hydroclimatic regions benefit from having direct estimate of soil moisture for evapotranspiration and gross primary productivity, while also providing some insights on the possible role of spatial scale mismatches between the fluxes and soil moisture.

How to cite: Rosolem, R., Power, D., Rico-Ramirez, M., Gentine, P., McJannet, D., da Rocha, H., Schrön, M., and Rebmann, C.: Using machine learning to quantify multi-scale soil moisture controls on water and carbon fluxes at the land surface, EGU General Assembly 2023, Vienna, Austria, 23–28 Apr 2023, EGU23-12444, https://doi.org/10.5194/egusphere-egu23-12444, 2023.

EGU23-12507 | Orals | BG3.14

A review of Water Use Efficiency across space and time 

Simone Fatichi, Athanasios Paschalis, Sara Bonetti, Gabriele Manoli, and Christoforos Pappas

Water Use Efficiency (WUE) is the variable linking assimilation and storage of carbon in plants with the release of water through transpiration. In this study, we combine multiple datasets including global scale leaf-level gas exchange measurements, tree-ring isotopes, flux-tower observations, and remote sensing products with mechanistic terrestrial biosphere modeling to evaluate whether WUE depends on precipitation or aridity levels and how changes in vapor pressure deficit affect ecosystem scale WUE and intrinsic water use efficiency (IWUE). A constrained range of WUE values across ecosystems and climates are observed with few noticeable exceptions. Observations and model simulations converge towards a weak WUE dependency on precipitation or aridity conditions.

Numerical simulations with a mechanistic model reveal two distinct signatures of VPD on site level WUE and IWUE, with high VPD resulting in increased IWUE, but decreased WUE. Relations with soil moisture are instead more complex and non-monotonic. Multiple data sources in combination with mechanistic modeling offer new insights on WUE variability across spatial and temporal scales and provide reference WUE values for future comparisons.

How to cite: Fatichi, S., Paschalis, A., Bonetti, S., Manoli, G., and Pappas, C.: A review of Water Use Efficiency across space and time, EGU General Assembly 2023, Vienna, Austria, 23–28 Apr 2023, EGU23-12507, https://doi.org/10.5194/egusphere-egu23-12507, 2023.

EGU23-12846 | ECS | Posters on site | BG3.14

The role of water table depth and plant functional type in energy partitioning 

Francesco Giardina, Sonia I. Seneviratne, Benjamin D. Stocker, Jiangong Liu, and Pierre Gentine

Energy partitioning between surface latent (LE) and sensible (H) heat fluxes is a key factor in the development of the boundary layer and the regulation of the hydrological cycle. Climate factors and surface cover are commonly considered the major controlling effects on energy partitioning. However, the influence of other drivers such as water table depth and groundwater convergence has rarely been considered.

Here, we use an extensive dataset of eddy covariance and global remote-sensing data to show that not only climate, but also water table depth and plant functional type (PFT) play an important role in energy partitioning across different biomes. Our findings illuminate the understanding of plant water stress in terrestrial ecosystems.

How to cite: Giardina, F., Seneviratne, S. I., Stocker, B. D., Liu, J., and Gentine, P.: The role of water table depth and plant functional type in energy partitioning, EGU General Assembly 2023, Vienna, Austria, 23–28 Apr 2023, EGU23-12846, https://doi.org/10.5194/egusphere-egu23-12846, 2023.

EGU23-13093 | ECS | Orals | BG3.14

Peatlands methane origin and fluxes to the atmosphere: towards an integrative conceptual model of a temperate French peatland 

Alexandre Lhosmot, Adrien Jacotot, Marc Steinmann, Laure Gandois, Philippe Binet, Marie-Laure Toussaint, Sébastien Gogo, Daniel Gilbert, Jean-Sébastien Moquet, Sarah Coffinet, Anne Boetsch, Christophe Loup, Fatima Laggoun-Défarge, and Guillaume Bertrand

Peatlands cover only 3 % of emerged lands, but their carbon stock represents about 30 % of the global soil organic carbon. Climate change and local anthropogenic disturbances deeply affect the hydrological functioning of peatlands. This may trigger carbon fluxes to surface waters and the atmosphere, thus leading to a positive feedback for global warming. It is therefore crucial to better estimate carbon fluxes between peatlands and the atmosphere and to delineate their major controlling constraints. To achieve this goal, we studied the functioning of a temperate mid-mountain peatland located in the French Jura Mountains, named the Frasne peatland.

The methane (CH4) dynamics of the Frasne peatland appear to be constrained by a range of hydrological, physical, biogeochemical, and biotic factors. From a hydrological point of view, the system is fed by local rainwater and injection of carbonated groundwater at the bottom of the peatland, which provides a major input of dissolved inorganic carbon (DIC) to the system. Values of the δ13CDIC were high (even reaching positive values up to 8.1 ‰) compared to the expected values in a limestone and C3 plant-dominated area such as the Jura Mountains, supporting biotic CH4 production within the peatland. Consistently, high-frequency eddy-covariance monitoring during 2.5 years allowed us to show that the site acted as a source of CH4 to the atmosphere (23.9 ± 0.6 g C m-2 year-1) with interannual, seasonal, and diurnal time scale dynamics. In particular, we found an outstanding diurnal cycle for CH4 with the highest fluxes at night and lower ones at mid-day. In addition, the mid-day fluxes were negative in spring, highlighting larger oxidative processes than CH4 production attributed to photosynthesis activity (i.e., soil oxygen penetration and endosymbiotic methanotrophs of Sphagnum). The range of CH4 emissions was also controlled by the interannual variation in precipitation amounts and by the seasonal temperature variation.

This conceptual production-emission model highlights that water-carbon interactions in the peatland depend on local biotic and abiotic factors but also on hydrological processes at the watershed scale. This also highlights the need to further constrain carbon transfers between the production and the emission zones (i.e., peatland-atmosphere interface and surface water exports). For this purpose, we will soon carry out a field campaign to measure the concentrations and isotopic values of dissolved gases in peat pore water along with an upstream downstream and a vertical gradient.

How to cite: Lhosmot, A., Jacotot, A., Steinmann, M., Gandois, L., Binet, P., Toussaint, M.-L., Gogo, S., Gilbert, D., Moquet, J.-S., Coffinet, S., Boetsch, A., Loup, C., Laggoun-Défarge, F., and Bertrand, G.: Peatlands methane origin and fluxes to the atmosphere: towards an integrative conceptual model of a temperate French peatland, EGU General Assembly 2023, Vienna, Austria, 23–28 Apr 2023, EGU23-13093, https://doi.org/10.5194/egusphere-egu23-13093, 2023.

EGU23-13401 | Posters on site | BG3.14

Drought effect on urban plane tree ecophysiology and its isoprene emissions 

Ruben Puga Freitas, Alice Claude, Alice Maison, Luis Leitao, Anne Repellin, Paul Nadam, Carmen Kalalian, Christophe Boissard, Valérie Gros, Karine Sartelet, Andrée Tuzet, and Juliette Leymarie

Urban trees emit a wide range of biogenic Volatile Organic Compounds (bVOC). Some of these bVOC, like isoprene can react with atmospheric oxidants to form secondary compounds, such as ozone (O3) and secondary organic aerosols (SOA), which have impacts on air quality and climate. In addition, isoprene emissions are strongly influenced by environmental factors and urban sites are known as stressful environment, characterized for example by water scarcity. However, little is known on the contribution of urban trees to air quality, notably during drought periods. In a semi-controlled experiment, fourteen young plane trees (Platanus x hispanica, known as a strong isoprene emitter) were grown in containers, in an urban site (at Vitry-sur-Seine, near Paris), since 2020. In June 2022, half the trees were subjected to drought by total rainfall exclusion and by withholding watering. A comprehensive characterization of tree response to drought, including plant morphology (leaf density and area), water status (i.e., leaf water potential, δ13C isotopic composition) and physiology (stomatal conductance, net photosynthesis, leaf pigment contents, stress molecular markers, chlorophyll fluorescence) analyses, was undertaken along with the characterization of bVOC emissions by an original leaf scale method (portable GC-MS coupled to a leaf chamber). All together, these parameters provided relevant information on the relation between bVOC emissions and plant morphology, its water use efficiency and photosynthetic energy conversion.

Shortly after the onset of drought, the isoprene emissions of the plane trees remained unchanged even though typical responses to drought stress were observed, such as partial stomatal closure leading to a decrease in carbon assimilation. With the progression of drought stress, progressive leaf shedding occurred. When almost completely defoliated, the trees emitted lower amounts of isoprene emissions likely due to disruption of the photosynthetic energy conversion process. Despite the moderate decrease in absolute isoprene emissions rates (as expressed per dry leaf mass) induced by the drought treatment on plane trees with nearly zero gas exchange, total emissions were strongly affected because defoliation significantly reduced the total leaf area. We emphasize that this phenomenon should be taken into account in atmospheric models especially in species highly subjected to drought induced defoliation. Here, a simple parameterisation of this effect on plane tree-bVOC emissions is proposed.

How to cite: Puga Freitas, R., Claude, A., Maison, A., Leitao, L., Repellin, A., Nadam, P., Kalalian, C., Boissard, C., Gros, V., Sartelet, K., Tuzet, A., and Leymarie, J.: Drought effect on urban plane tree ecophysiology and its isoprene emissions, EGU General Assembly 2023, Vienna, Austria, 23–28 Apr 2023, EGU23-13401, https://doi.org/10.5194/egusphere-egu23-13401, 2023.

EGU23-13448 | ECS | Posters on site | BG3.14

Shifting consensus in moisture modifier of decomposition towards the optimum in well-drained mineral soils instead of mid- or high- moisture levels of organic soils in boreal forest 

Boris Tupek, Aleksi Lehtonen, Alla Yurova, Rose Abramoff, Stefano Manzoni, Bertrand Guenet, Samuli Launiainen, Mikko Peltoniemi, Kari Minkkinen, and Raisa Mäkipää

The lack of consensus of functional dependency of soil respiration on moisture among the Earth system models (ESMs) contributes significantly to uncertainties in their projections.

Based on data of soil organic C stocks and CO2 emissions from the boreal ecotone between mineral soil forests and adjacent peatlands with organic soils in Finland, we derived the field-based moisture response of respiration in a maximum range of moisture conditions (extending from xeric and mesic forests to water saturated mires). Using Bayesian data assimilation technique, we coupled Yasso07 soil carbon model with the heuristic bell shape moisture function, approximating the enzyme and oxygen limitations. As expected, the Yasso07 model fitted with the revised moisture modifier on data from catena of organic-mineral soils outperformed the previous model version in peatlands.

Unlike the most found optimum of decomposition in ESM in mid- or high- moisture levels, our optimum or the highest rate of decomposition correspond to well-drained conditions of mineral soils.

We speculated that the reason for the shift in the moisture optimum of the functional form was its accounting for long-term processes leading to a larger C mineralization in mineral soils related to extreme events, such as prolonged elevated moisture or rewetting after droughts, which enhance microbial access to previously protected or labile C pools and may not be detected in short-term incubation studies.

Although, the moisture modifier derived here improved the match between the modelled and measured SOCs of peatlands, a shift in consensus from current decomposition rate modifiers used in ESMs requires further evaluation before it can be largely applied for the landscape level semiempirical processed-based modelling of the mineral and organic soil C stocks and CO2 emissions.

How to cite: Tupek, B., Lehtonen, A., Yurova, A., Abramoff, R., Manzoni, S., Guenet, B., Launiainen, S., Peltoniemi, M., Minkkinen, K., and Mäkipää, R.: Shifting consensus in moisture modifier of decomposition towards the optimum in well-drained mineral soils instead of mid- or high- moisture levels of organic soils in boreal forest, EGU General Assembly 2023, Vienna, Austria, 23–28 Apr 2023, EGU23-13448, https://doi.org/10.5194/egusphere-egu23-13448, 2023.

EGU23-14027 | Orals | BG3.14

Variability of the photosynthetic and fluorescence response of high mountain plants to climate change. 

Salvador Aljazairi, M.-Teresa Sebastià, Daniel Agea, Enrique P. Sánchez-Cañete, Andrew Kowalski, Regino Zamora, and Penelope Serrano-Ortiz

Alpine ecosystems have a high ecological value, high biodiversity, and provide important ecosystem services. However, alpine communities are highly vulnerable to climate changes. Changes in biodiversity and its distribution will affect the goods and services that these ecosystems provide. Also, it can affect climate regulation by altering the exchanges of greenhouse gases (GHG) and the cycles of carbon (C) and nitrogen (N), in feedback processes. Due to their ecological importance and vulnerability, alpine meadows deserve special attention. In this regard, the main objective of the IBERALP project is the analysis of the interactions between components of biodiversity, mainly plant and soil microbial diversity, and their relationship with GHG fluxes; and how these interactions are affected by climate change.


IBERALP is focused on the alpine communities of five Iberian mountain National Parks: Picos de Europa, Ordesa and Monte Perdido, Aigüestortes i Estany de Sant Maurici, Sierra Nevada, and Sierra de Guadarrama. In each National Park, we selected two different altitudes and two different alpine community types based on soil conditions (mesic and xeric). Here we study leaf physiological and fluorescence parameters assimilation, respiration, the quantum yield of photosystem II (PhiPSII), maximum quantum efficiency (Fv`/Fm`) and photochemical quenching (qP) in two representative plant species (a legume (Trifolium repens) and a grass (Nardus strita)) present in each National Park. In addition, we recorded altitude and humidity soil condition using a portable photosyntheic system (Li-cor 6800; Li-Cor Inc.) with an integrated fluorescence chamber head.


Multiple factors affect the ability of plants to assimilate CO2 and photoprotect themselves from solar radiation excess, so there was no common pattern for all Parks. However, in general, plants at higher altitudes showed a greater photosynthetic and photoprotection capacity against high irradiances compare to those at lower altitudes. Similar behaviour was found in mesic versus xeric communities. Exceptions were found, such as, for example, in Picos de Europa National Park, where the intense fog and grazing (with continuous contribution of N to the soil) modified these patterns of photosynthesis and photoprotection. 

This work was supported by the OAPN through the project PN2021-2820s (IBERALP).

How to cite: Aljazairi, S., Sebastià, M.-T., Agea, D., Sánchez-Cañete, E. P., Kowalski, A., Zamora, R., and Serrano-Ortiz, P.: Variability of the photosynthetic and fluorescence response of high mountain plants to climate change., EGU General Assembly 2023, Vienna, Austria, 23–28 Apr 2023, EGU23-14027, https://doi.org/10.5194/egusphere-egu23-14027, 2023.

EGU23-15472 | Orals | BG3.14

Soil hydraulic conductivity defines minimum Root:Shoot surface ratio in moisture-limited environments 

Mathieu Javaux, Andrea Cecere, Louis Delval, Fabian Wankmüller, and Andrea Carminati

In drying soils, root water uptake is limited by the low soil hydraulic conductance. The magnitude of this conductance drop and its temporal dynamics are function of soil texture, soil water status, root hydraulic architecture, atmospheric demand and canopy conductance.  Under dry climates, in order to survive, plants can adapt their carbon allocation by maximizing their root:shoot surface ratio, thereby decreasing their transpiration surface while increasing their root surface.

Thanks to a simple soil-plant hydraulic model, we show that soil hydraulic conductivity controls the minimum root:shoot surface ratio. A meta-analysis of shoot:root surface ratio is combined with a database of soil hydraulic properties to demonstrate how the minimum root:shoot surface value changes with soil conductivity across soil textural classes for dry biomes. We discuss the mechanisms by which plants can control their carbon allocation in such conditions and investigate the sensitivity of this minimum root:shoot surface ratio to future shifts in evaporative demand.

How to cite: Javaux, M., Cecere, A., Delval, L., Wankmüller, F., and Carminati, A.: Soil hydraulic conductivity defines minimum Root:Shoot surface ratio in moisture-limited environments, EGU General Assembly 2023, Vienna, Austria, 23–28 Apr 2023, EGU23-15472, https://doi.org/10.5194/egusphere-egu23-15472, 2023.

EGU23-15565 | ECS | Orals | BG3.14

Reducing uncertainty in extreme weather vegetation stress modeling using satellite-model approach at high resolution 

Arpita Verma, Louis Francois, Ingrid Jacquemin, Benjamin Lanssens, Alain Hambuckers, Alessandro Ugolotti, Merja Tölle, and Eric Hallot

Vegetation is a key driver for carbon uptake from the atmosphere to the land. Yet episodes of plant stress and mortality associated with drought and heat waves due to persistent lack of precipitation have been reported over the last decades and are expected to increase under ongoing climate change. It is presumed that climate-related vegetation stress results in progressively worsening plant health and rising mortality. However, the mechanisms driving such mortality are still up for debate because of the complex interconnections between the processes and the factors. Monitoring plant stress and mortality at the ecosystem level remains challenging to quantify since long-term, tree-individual, reliable observations are uncertain. For this reason, here we adapted a satellite-model approach to work on regional forests, before up scaling the results to the global forest.

In Belgium, the Wallonia region is covered by 30% forests which are the highest among all the three regions. While with the consecutive recent extreme events especially the droughts and heat waves of 2018, 2019, 2020, and 2022 caused water stress and bark beetle attack. According to the 35 years (1985-2022), land use land cover change extracted by LANDSAT 5,7, and 8 satellites, there is no significant change in forest land in Wallonia, Belgium. Meanwhile, in the current years 2021-2022, there is a decrease in the tree canopy with intensive forest management due to tree plant stress. On the other hand, in Wallonia, the forest is distributed in a significant patch of broadleaves, coniferous leaves, and mixed forest. However, we found that consecutive drought events cause water stress on specific plant species like Norway spruce which are in vulnerable states. For example: in a mixed forest when bark beetle or Scolytinae attacked the spruce tree it is more attracted to the other trees and in this consequence tree species –like  birch and oak –are now also in premature death or deteriorating tree health. In this study, we are using a high spatial resolution (25cm) remote sensing images using Artificial Intelligence and machine learning techniques to find out pixel-based individual plant stress or mortality. In addition, the high-resolution tree mortality extracted data will be used to calibrate CARAIB dynamic vegetation model and analyze the impact of extreme events on trees during the recent past and the future (until 2070). In conclusion, from this study, we plan to improve our model regarding the implementation of plant traits and species mortality aspects towards a better prediction of forest tree species' vulnerability to future extreme weather events.

How to cite: Verma, A., Francois, L., Jacquemin, I., Lanssens, B., Hambuckers, A., Ugolotti, A., Tölle, M., and Hallot, E.: Reducing uncertainty in extreme weather vegetation stress modeling using satellite-model approach at high resolution, EGU General Assembly 2023, Vienna, Austria, 23–28 Apr 2023, EGU23-15565, https://doi.org/10.5194/egusphere-egu23-15565, 2023.

EGU23-16495 | ECS | Posters on site | BG3.14

Development of a portable, distance-based paper analytical sensor for carbonate detection. 

Zakia Tebetyo, Samantha Richardson, Leigh Madden, Mark Lorch, and Nicole Pamme

Development of a portable, distance-based paper analytical sensor
for carbonate detection.


Zakia Tebetyo1, Samantha Richardson1, Leigh Madden2, Mark Lorch1, Nicole Pamme1,3

1Schoolof Natural Sciences, University of Hull.

2 Centre for Biomedicine, Hull York Medical School, University of Hull, UK

3Department of Materials and Environmental Chemistry, Stockholm University, Sweden

In this study we transferred a laboratory-based titration reaction for carbonate determination onto a portable paper-based analytical device (PAD). The carbonate quantity can be read out by measuring the distance of a colour change along a paper-based reaction channel. Device dimensions and detection reagent constituents were optimized to enable detection of carbonate ions in the range of 0 – 1000 mg L-1. The PAD featured a reaction channel in hydrophilic filter paper defined by a hydrophobic wax barrier. The detection reagent consisted of citric acid/citrate buffer (0.5 M, pH 2.5), bromocresol green (BCG) indicator (0.10% w/v) and PDADMAC (5.0 % v/v) dissolved in 20% ethanol. The base of the device was sealed with tape to prevent reagents leaking. Sixty microlitres of carbonate sample were added to the base of the channel and the liquid was allowed to wick up the channel. Colour development occurred as the carbonate ions reacted with the hydronium ions in the detection reagent resulting in a colour change of the BCG indicator from yellow to blue.

To optimise the reaction channel, two dimensions were compared, 1 mm x 30 mm and 2 mm x 30 mm. The device with the wider channel gave a higher colour intensity between carbonate concentrations 0 – 200 mg L-1. In this range the sensor gave a linear response. The effect of filter paper pore size was investigated to study wicking time. Whatman 4 paper (pore size 23 µm) had a six times faster wicking rate of 7 min compared to Whatman 1 (11 µm) with 42 min. Reproducibility studies (100, 200, 400, 500, 600, 800 and 1000 ppm carbonate, n = 6) gave a maximum RSD of 2.4% showing consistency across the range of samples tested. Interference tests were conducted with 500 ppm  with additional environmentally occurring ions, i.e. 250 ppm , 250 ppm  or 50 ppm of  (F=1.924<Fcrit=3.411, no significant difference). There was no significant interference found from these ions.

Future work will focus on packaging and sealing the devices for on-site use, benchmarking with real environmental samples and in-the-field use with by minimally trained personnel.

How to cite: Tebetyo, Z., Richardson, S., Madden, L., Lorch, M., and Pamme, N.: Development of a portable, distance-based paper analytical sensor for carbonate detection., EGU General Assembly 2023, Vienna, Austria, 23–28 Apr 2023, EGU23-16495, https://doi.org/10.5194/egusphere-egu23-16495, 2023.

EGU23-16633 | Orals | BG3.14

STEMMUS-SCOPE for PLUMBER2: Understanding Water-Energy-Carbon Fluxes with a Physically Consistent Dataset Across the Soil-Plant-Atmosphere (SPAC) Continuum 

Yunfei Wang, Yijian Zeng, Fakhereh (Sarah) Alidoost, Zengjing Song, Danyang Yu, Enting Tang, Qianqian Han, Retsios Bas, Girgi Serkan, Christiaan van der Tol, and Zhongbo (Bob) Su

High-quality and long-term measurements of water, energy, and carbon fluxes between the land and atmosphere are critical for eco-hydrological monitoring and land surface model (LSM) benchmarking. Eddy Covariance has become the most widely used method for theory development and LSM evaluation. On the other hand, flux tower data as measured (even after site post-processing and gap-filling based on empirical formulation) cannot be used directly for validating LSMs, and most of time, lacking physically-consistent measurement across the soil-plant-atmosphere continuum (SPAC) (e.g., other than surface fluxes, lacking the measurement of soil moisture, soil water potential, leaf water potential, fluorescence, and reflectance). Here we present high-quality and long-term fluxes and corresponding above/below-ground hydrological, physiological, photosynthetic data derived from the STEMMUS-SCOPE model simulations for PLUMBER2 project with 170 FLUXNET sites. Fluxes data from PLUMBER2 and SM data from FLUXNET2015 are used to further validate the effectiveness of the STEMMUS-SCOPE dataset. Results show that the simulated fluxes and SM dataset have reasonable agreements with the in-situ measurements, using the available global input/forcing datasets without any model tunning. This dataset adds to the existing ecosystem flux and SM network to help increase our understanding of ecosystem responses to extreme events.

How to cite: Wang, Y., Zeng, Y., Alidoost, F. (., Song, Z., Yu, D., Tang, E., Han, Q., Bas, R., Serkan, G., van der Tol, C., and Su, Z. (.: STEMMUS-SCOPE for PLUMBER2: Understanding Water-Energy-Carbon Fluxes with a Physically Consistent Dataset Across the Soil-Plant-Atmosphere (SPAC) Continuum, EGU General Assembly 2023, Vienna, Austria, 23–28 Apr 2023, EGU23-16633, https://doi.org/10.5194/egusphere-egu23-16633, 2023.

EGU23-1168 | ECS | Orals | BG8.4 | Highlight

Counting (on) Blue Carbon - Challenges and Ways forward for carbon accounting of ecosystem-based carbon removal in marine environments 

Nadine Mengis, Allanah Paul, and Mar Fernández-Méndez

The latest IPCC assessment report highlights once more the need for negative emissions via carbon dioxide removal (CDR) measures to reach ambitious mitigation goals. In particular ecosystem-based CDR measures are currently the focus of national net-zero strategies and novel carbon crediting efforts. Using ecosystem-based carbon removal measures in marine environments as an example, we here highlight key challenges concerning the monitoring and evaluation of blue carbon fluxes for carbon crediting. Challenges specific to ecosystem-based CDR measures are i) the definition of baseline natural carbon fluxes, which is necessary for ii) clear anthropogenic CDR signal attribution, as well as iii) accounting for possible natural or anthropogenic disturbances of the carbon stock and hence an assessment for the durability of the carbon storage. In addition, the marine environment poses further monitoring and evaluation challenges due to i) temporal and spatial decoupling of the carbon capturing and sequestration processes, combined with ii) signal dilution due to high ecosystem connectivity, and iii) large pre-existing carbon stocks which makes any human-made increase in carbon stocks even harder to quantify. To increase the scientific rigor behind issued carbon credits, we propose a concentration of monitoring efforts on carbon sequestration rather than capturing processes, and baseline establishment for natural carbon sequestration in diverse ecosystems. Finally, we believe that making carbon credits subject to dynamic adjustments over time, will increase their credibility.

How to cite: Mengis, N., Paul, A., and Fernández-Méndez, M.: Counting (on) Blue Carbon - Challenges and Ways forward for carbon accounting of ecosystem-based carbon removal in marine environments, EGU General Assembly 2023, Vienna, Austria, 23–28 Apr 2023, EGU23-1168, https://doi.org/10.5194/egusphere-egu23-1168, 2023.

The blue carbon system generally refers to the carbon sink environment that can be stored in the ocean system, and these environments are mainly mangroves, seagrass beds and salt marshes. This study investigates the second-largest seagrass bed in Kenting in Southern Taiwan. In addition to the advantages of high ecological diversity, seagrass beds are also considered to be a high carbon storage environment, which is more capable of sequestering carbon in the atmosphere than green carbon systems. In risk assessment, green carbon system may have fire risks, causing the sequestered carbon in plants to be released back into the atmosphere. Therefore, we believe that research on coastal blue carbon systems and carbon sequestration issues are better development goal and direction. To understand how much total organic carbon can be sequestered in seagrass bed sediments under natural growth, and to estimate how many tons of carbon equivalent (CO2e) in the atmosphere the carbon sequestered in this area are our ultimate goal. In the choice of sampling sites, we collected two seagrass bed sediment cores about 40 cm long, namely core A (BH2-SG)(coring in the seagrass area), and core B (BH1-NSG)(coring in the bare area on the seagrass bed). The analysis results showed that the organic carbon content of sediment core A was 0.184-0.298 wt%, with an average content of 0.237 wt%, and that of sediment core B was 0.188-0.401 wt%, with an average content of 0.318 wt%. After plugging in the organic carbon accumulation content formula (MgC *ha-1= (TOC(%)*depth(cm)*BD(g/cm3)), we can get the organic carbon accumulation values of sediment core A (13.539 MgC*ha-1) and sediment core B (18.405 MgC*ha-1). For now, we can only evaluate the carbon accumulation of the upper 40 cm seagrass bed sediments in this area. The average accumulated carbon content of the two cores is multiplied by the total area of the Kenting seagrass bed (about 4.38 ha), and then multiplied by the carbon dioxide equivalent coefficient 3.67 represents its carbon dioxide equivalent (CO2e) (the content value is 256.49 CO2e). At last, we consider that the area is a major factor affecting the amount of carbon storage. If we can increase seagrass area, more carbon can be stored in the sediment.


Keywords: Kenting, Taiwan, blue carbon system, seagrass bed, organic carbon content (TOC%), carbon dioxide equivalent (CO2e)

How to cite: Tang, Z.-W. and Chen, H.-F.: Estimating sediment carbon stocks in the environment of Taiwan's coastal blue carbon system, EGU General Assembly 2023, Vienna, Austria, 23–28 Apr 2023, EGU23-2547, https://doi.org/10.5194/egusphere-egu23-2547, 2023.

EGU23-4623 | ECS | Orals | BG8.4 | Highlight

Carbon stocks and fluxes of Mangrove Associates(Hibiscus hamabo and Paliurus ramosissimus) in Jeju Island, South Korea 

Yoojin Choi, Gwang-Jung Kim, Jeongmin Lee, Hyung-Sub Kim, Minji Park, and Yowhan Son

Mangrove associates, generally distributed in the landward fringe of mangrove forests, are one of the major carbon sinks. Mangrove associates are expected to increase in South Korea as their spatial distribution is shifting to poleward with global warming. However, understanding of carbon stocks and fluxes of mangrove associates is still limited. In this study, we estimated carbon stocks in soils and forest floors and measured carbon fluxes of soil CO2 efflux and net photosynthesis of Hibiscus hamabo and Paliurus ramosissimus, mangrove associates which inhabit naturally in Jeju Island, South Korea from April to October, 2022. Four sites of H. hamabo (Gimnyeong – coast, Hado, Seongsan and Wimi) and P. ramosissimus (Gimnyeong – wetland and Daejeong 1 ~ 3) were selected. Soil carbon stocks at 0 – 10 cm depth from Gimnyeong – wetland, Seongsan, and Hado where soil horizons developed, and forest floor carbon stocks were quantified. In addition, soil CO2 efflux and net photosynthesis were measured once a month. Mean soil carbon stocks (t C ha-1) ranged from 29.0 to 30.1 while mean forest floor carbon stocks (t C ha-1) ranged from 2.8 to 5.8. Soil CO2 efflux rate (µmol CO2 m⁻² s⁻¹) in August was significantly higher than that in April and October. There was a positive correlation between soil CO2 efflux and soil (p < 0.001, r = 0.41) and air (p < 0.001, r = 0.52) temperatures compared to other factors such as soil water content (p > 0.05), and electrical conductivity (p > 0.05). Net photosynthesis (µmol m⁻² s⁻¹) was significantly high in July, and there were no significant differences among sites. Soil carbon stocks of the two species were higher than those of Quercus mongolica forests (27.8) in South Korea. Moreover, forest floor carbon stocks were higher compared to those of Q. glauca forests (1.32) in Jeju Island. Mean net photosynthesis (mean ± standard error, µmol m⁻² s⁻¹) of H. hamabo (8.9 ± 0.9) and P. ramosissimus (8.8 ± 1.3) in July were higher than that of Eleutherococcus gracilistylus (6.74 ± 0.26), a deciduous shrub inhabiting in Jeju Island. This study provides the first data base to estimate carbon stocks and fluxes of mangrove associates in South Korea and the results showed that H. hamabo and P. ramosissimus seem to be promising species for carbon sinks.

Acknowledgement

This study was carried out with the support of the National Research Foundation, Republic of Korea (Project No. 2022R1A2C1011309), and the Warm-temperate and Subtropical Forest Research Center (Project No. FE100-2022-04-2022).

How to cite: Choi, Y., Kim, G.-J., Lee, J., Kim, H.-S., Park, M., and Son, Y.: Carbon stocks and fluxes of Mangrove Associates(Hibiscus hamabo and Paliurus ramosissimus) in Jeju Island, South Korea, EGU General Assembly 2023, Vienna, Austria, 23–28 Apr 2023, EGU23-4623, https://doi.org/10.5194/egusphere-egu23-4623, 2023.

EGU23-5295 | Orals | BG8.4

Carbon Burial in Shelf Sea Sediments – Anthropogenic Effects and Implications for Management 

Lucas Porz, Rumeysa Yilmaz, Wenyan Zhang, and Corinna Schrum

Many continental shelves host sediment depocenters which act as natural, long-term (>100 yr) carbon sinks. Human activities can strongly affect the efficiency with which carbon is sequestered in these depocenters, either through direct disturbances of the seafloor, or indirectly through climatic, light- or nutrient-induced changes, thereby affecting habitat and ecosystem functioning. In this study, we address the short- and long-term impacts of sea-use on carbon burial in the North Sea. Specifically, we focus on the role of bottom trawling as a crucial disturbance of seafloor sediments and benthic biota. In order to quantify the large-scale impact on carbon sequestration, we employ a numerical coastal ocean model to simulate the effects of demersal fishing gear on sediment transport, bioturbation efficiency and their interactions. Based on the results, the effects of potential management scenarios are discussed.

How to cite: Porz, L., Yilmaz, R., Zhang, W., and Schrum, C.: Carbon Burial in Shelf Sea Sediments – Anthropogenic Effects and Implications for Management, EGU General Assembly 2023, Vienna, Austria, 23–28 Apr 2023, EGU23-5295, https://doi.org/10.5194/egusphere-egu23-5295, 2023.

EGU23-5542 | ECS | Orals | BG8.4

Climate Change Mitigation in The Bahamas - The Power of Earth Observation for Blue Carbon Accounting 

Alina Blume, Dimosthenis Traganos, Avi Putri Pertiwi, Chengfa Benjamin Lee, and Marie-Helene Rio

The seagrass ecosystem can sequester and store vast amounts of carbon in their soils and biomass, which renders them a strong natural climate solution for climate change mitigation. The carbon uptake capabilities of this coastal marine ecosystem have important implications for Multilateral Environmental Agreements like the National Determined Contributions of the Paris Agreement and the Sustainable Development Goals. However, the  value of seagrasses for these agendas is often overlooked due to a lack of spatially-explicit extent and carbon data. Modern Earth Observation advances can provide time- and cost-efficient solutions to minimise these data gaps.

We utilised multi-temporal Sentinel-2 data within the cloud computing platform Google Earth Engine to quantify the current Bahamian seagrass extent, associated carbon stocks, and sequestration rates. Our approach combines big satellite data, pixel and object-based feature analysis, and scalable machine learning algorithms. We are envisaging to assess ecosystem extent changes using historic image archives (e.g. Landsat), and the integration of biophysical variables into our models (e.g. bathymetry, meadow patchiness).

We estimate the current seagrass ecosystem extent to cover an area of up to 46,792 km2, storing 723 Mg carbon and sequestering about 68 times the amount of carbon dioxide that was emitted by The Bahamas in 2018.

Our generated data highlights the importance of the seagrass ecosystem for climate change mitigation in The Bahamas and beyond, and showcases the necessity of including seagrass blue carbon in national climate agendas. This data and our developed earth observation approach can support policy makers and scientists from a national to a global climate action context.

How to cite: Blume, A., Traganos, D., Pertiwi, A. P., Lee, C. B., and Rio, M.-H.: Climate Change Mitigation in The Bahamas - The Power of Earth Observation for Blue Carbon Accounting, EGU General Assembly 2023, Vienna, Austria, 23–28 Apr 2023, EGU23-5542, https://doi.org/10.5194/egusphere-egu23-5542, 2023.

EGU23-6103 | ECS | Orals | BG8.4 | Highlight

Accumulation rates of salt-marsh blue carbon at Lindisfarne, northern England, and their relationship with sea-level change 

Catrina Gore, Roland Gehrels, Craig Smeaton, Luke Andrews, Lucy McMahon, Fiona Hibbert, and Ed Garrett

Salt marshes sequester carbon at rates significantly exceeding those found in terrestrial environments. This ability arises from the in-situ production of plant biomass and the effective trapping and storage of both autochthonous and allochthonous organic carbon. The importance of this blue carbon store for mitigating increasing atmospheric carbon dioxide depends on both the rate at which carbon is buried within sediments and the rapidity with which that carbon is remineralised. It has been hypothesized that carbon burial rates, in turn, depend on the local rate of sea-level rise, with faster sea-level rise providing more accommodation space for carbon storage. This study addresses these three key aspects in a salt-marsh sediment study from Lindisfarne, northern England. We quantify rates of carbon accumulation by combining a Bayesian age-depth model based on 210Pb and 137Cs activities with centimetre-resolution organic carbon density measurements. A Bayesian isotope mixing model pinpoints terrestrial sources as providing the majority of stored carbon. We compare two approaches for assessing the relative proportions of labile and recalcitrant carbon based on a two-pool modelling approach and thermogravimetric analysis. Preliminary results indicate that during the 20th century more carbon was stored at Lindisfarne salt marsh during decades with relatively high rates of sea-level rise.

How to cite: Gore, C., Gehrels, R., Smeaton, C., Andrews, L., McMahon, L., Hibbert, F., and Garrett, E.: Accumulation rates of salt-marsh blue carbon at Lindisfarne, northern England, and their relationship with sea-level change, EGU General Assembly 2023, Vienna, Austria, 23–28 Apr 2023, EGU23-6103, https://doi.org/10.5194/egusphere-egu23-6103, 2023.

EGU23-9877 | ECS | Orals | BG8.4

Marine Biomass Regeneration: Simple Modelling of Large-Scale Ocean Carbon Dioxide Removal 

Elisavet Baltas, Anna Katavouta, and Hugh Hunt

Effective and large-scale atmospheric carbon capture is essential in limiting global warming to within 1.5 degrees Celsius as outlined by the Paris Agreement. The oceans make up two thirds of the Earth’s surface and already absorb approximately a quarter of anthropogenic emissions annually, therefore it is imperative to maximise their carbon sequestration ability through large-scale Carbon Dioxide Removal (CDR). One technique that aims to improve the efficiency of oceanic carbon uptake is Marine Biomass Regeneration (MBR), otherwise known as Ocean Iron Fertilisation (OIF). MBR is grounded on evidence that the introduction of certain key nutrients to nutrient depleted areas of the ocean can enhance primary productivity and regenerate ocean biomass, which then acts as a carbon sink. The ocean’s ability to circulate nutrients has been hindered by the over-exploitation of whales, which naturally regulate oceanic nutrient levels by feeding at a depth of 150-200m and defecating at the ocean surface through the whale cycle. Their faeces are rich in nutrients such as nitrates, phosphates and iron, and act as a natural fertiliser. It will take decades to restore the whale population to pre-whaling numbers, therefore, to catalyse the biomass regeneration of oceans, it is proposed that artificial whale faeces are deployed to mimic the whale cycle.


A two-dimensional carbon and heat cycling box model with meridional overturning circulation is extended, to include biological processes and nutrient cycling. This model has previously been used to carry out climate projections, by investigating the ocean’s carbon and thermal response to annual anthropogenic emissions, but there has been no investigation on how the changing meridional overturning circulation impacts the biological carbon pump. A simple nutrient-phytoplankton-zooplankton (NPZ) biological model is introduced to model the impact of macronutrient concentrations on phytoplankton and zooplankton growth. Further to this, some basic parameterisations for iron cycling will be added, based off the iron box models of Parekh et al. (2004) and Lefèvre and Watson (1999).  Using the extended model, it will be possible to undertake MBR experiments with different nutrient ratios and concentrations, mimicking the whale cycle, and investigate the impact these parameters have on the oceanic carbon and heat uptake and distribution from anthropogenic carbon emissions. The model also accounts for slower meridional overturning with increased ocean warming, which allows for the investigation of the effect of slower circulation on the biological carbon pump, primary productivity and nutrient distribution.

How to cite: Baltas, E., Katavouta, A., and Hunt, H.: Marine Biomass Regeneration: Simple Modelling of Large-Scale Ocean Carbon Dioxide Removal, EGU General Assembly 2023, Vienna, Austria, 23–28 Apr 2023, EGU23-9877, https://doi.org/10.5194/egusphere-egu23-9877, 2023.

EGU23-10160 | ECS | Posters on site | BG8.4

A Study of Ephemeral Wetland Types According to Water Level Changes in Lava Forests 

Minji Park, Sangeun Kwak, Ju-eun Yang, Eun-ha Park, Bora Lee, and Ara Seol

Jeju Island is a basalt volcanic island located in Korea, and lava forests are distributed in the east and west of the island. Wetlands play a more significant role in lava forest than other forests, due to high volume of underground water as a result of high rainfall permeability rates averaging 67%. In particular, the lava forests of eastern Jeju Island is designated as a protected Ramsar wetland, featuring both a few permanent wetlands and several ephemeral wetlands. Notably, ephemeral wetlands show higher species diversity than permanent wetlands. A study was conducted to understand the types of ephemeral wetlands and investigate the characteristics. Water level sensors were installed in five wetlands for three years beginning in 2020. A three-type classification system was created: rugged topography with many large stones (Wetland ‘Type A’), concave topographies (Wetland ‘Type B’), and sedimentary topographies (Wetland ‘Type C’). The highest water levels were recorded in 2020 at all study sites. ‘Type A’ had the highest water levels (1.5m; 2.7m) before quickly draining (2.9mm/h; 5mm/h), and was the first to zero out. ‘Type B’ achieved the mid-range of recorded water levels (0.7m; 0.8m), and drain rate (1.3mm/h; 1.4mm/h). ‘Type C’ had the lowest highest water level (0.4 m), and the slowest drain rate (0.8 mm/h). In the same 2020 observation period, water levels were maintained at 0.1m for both Type A wetlands were maintained for 72 days and 40 days, ‘Type B’ for 111 days and 92 days, and ‘Type C’ for 221 days. The submersion period during which wetlands were submerged decreased by 7% in 0.1m water level and 19% in 0.25m water level in 2021 compared to 2020, and 37% in 0.1m water level and 42% in 0.25m water level in 2022 compared to 2020. Additionally, there was no observed difference in total annual precipitation in 2020 and 2021, but there was variation in maximum daily rainfall. In 2022, the total annual precipitation was 35% lower than in 2020. Therefore, ephemeral wetland environment change every year, as the amount of level of ephemeral wetlands seems to be affected not only by both total annual precipitation and but also by how concentrated rainfall is within shorter time periods. These factors have a significant impact on the distribution of rare and special plants and the diversity of herbaceous species distributed by the wetland types.

How to cite: Park, M., Kwak, S., Yang, J., Park, E., Lee, B., and Seol, A.: A Study of Ephemeral Wetland Types According to Water Level Changes in Lava Forests, EGU General Assembly 2023, Vienna, Austria, 23–28 Apr 2023, EGU23-10160, https://doi.org/10.5194/egusphere-egu23-10160, 2023.

EGU23-11136 | ECS | Posters virtual | BG8.4

The vegetation characteristics of semi-mangrove Hibiscus hamabo Siebold & Zucc. and Paliurus ramosissimus (Lour.) Poir. in Jeju Island, Korea 

Yang Ju-eun, Park Eun-Ha, Kwak Sang-eun, Park Min-Ji, and Lee Bora

Hibiscus hamabo and Paliurus ramosissimus are Korea’s endangered flora species, are predominantly native to Jeju Island, with more limited native appearances on few of Korea’s southern islands. The differences between the northernmost area (Jeju) and Japan’s southwestern native habitat characteristics of H. hamabo and P. ramosissimus were investigated utilizing a B-B method. In the case of semi-mangrove plants on Jeju island, its native habitats are divided into the inlet and gulf areas. Over time as silt soil deposits took shape, Cnidium japonicum and Limonium tetragonum appeared along with H. hamabo in bay areas, while Vitex rotundifolia and Eurya emarginata appeared at bedrock sites that had poor soil conditions in gulf areas. 
P. ramosissimus appeared in three habitats: wetland type, seashore rock type, and costal roadside type. In wetland type, Cyclosorus interruptus and Persicaria japonica appeared with high contributions. In the seashore rock type, the woody and vines native to the coast, the Euonymus japonicus and the Lonicera japonica, are found. In the ruderal site beside the coastal road, Humulus scandens, Rosa multiiflora, and other annual plants appeared. Jeju’s habitat appeared to have a more limited natural propagation radius than found in Japan, and are vulnerable to damage by coastal development. Therefore, more preservations efforts are essential of H. hamabo and P. ramosissimus, which support the integrity of coastal ecosystems and contributes to carbon capture.

How to cite: Ju-eun, Y., Eun-Ha, P., Sang-eun, K., Min-Ji, P., and Bora, L.: The vegetation characteristics of semi-mangrove Hibiscus hamabo Siebold & Zucc. and Paliurus ramosissimus (Lour.) Poir. in Jeju Island, Korea, EGU General Assembly 2023, Vienna, Austria, 23–28 Apr 2023, EGU23-11136, https://doi.org/10.5194/egusphere-egu23-11136, 2023.

EGU23-11142 | ECS | Posters on site | BG8.4

Characteristics of vegetation according to the micro-climatic conditions of a lava pit on Jeju Island 

Eun-Ha Park, Ju-Eun Yang, Minji Park, SangEun Kwak, Bora Lee, and Ara Seol

Jeju Island is a volcanic island created by the eruption of a lot of basaltic lava through plume activity. Lava pits come in many shapes and sizes and have unique environmental conditions. This study aimed to examine the vegetation characteristics of various lava pit microclimates of Geomunoreum lava tube system formed 100-300 thousand years ago, and is one of the largest on Jeju Island. Seven plots on Geomunoreum surveyed using the belt transect method, and air temperature and relative humidity were also collected for each plot. The similarity index of the lower area (plot 3) and outside flattening-out areas (plots 6 and 7) were 14.6% and 17.5%. The lower area has the highest mortality and lowest growth rates, and therefore having a simple structure compared to other areas, with no observed changes in dominant species. At the midpoint areas (plots 2 and 4) the dominant species transitioned from Quercus glauca to Acer palmatum and Camellia japonica. The species composition of the shrub and subtree layers remained almostly unchanged. At the higher areas (plots 1 and 5), changes in species composition were frequently observed in all layers. At the outer flattening-out areas (plots 6 and 7), the lowest mortality and highest growth rates were observed, the variety of competing species were high diverse in the tree layer. The daily average temperature of plot 3 (low) and plots 6 and 7 (flattening-out areas) ranged from 4.1℃ to 13.2℃, and the daily average humidity ranged from 1.2% to 39.3%. The simple vegetation structure of the lower area can be attributed to this low temperature and high humidity. The concluding observation is that on the Geomunoreum lava pit, areas where microclimate conditions remain fairly constant, there is no dramatic change in vegetation compared to the perimeter. These characteristics are not always observed on other lava pits on the island.

How to cite: Park, E.-H., Yang, J.-E., Park, M., Kwak, S., Lee, B., and Seol, A.: Characteristics of vegetation according to the micro-climatic conditions of a lava pit on Jeju Island, EGU General Assembly 2023, Vienna, Austria, 23–28 Apr 2023, EGU23-11142, https://doi.org/10.5194/egusphere-egu23-11142, 2023.

The research team was first tasked with finding a solution to the need for more creative ways to contribute to natural carbon capture and storage solutions to meet South Korea’s national climate-change objective of reaching net zero by 2050. It was through this, and the unique properties of Korea’s southern islands, that true mangroves and mangrove associates (semi-mangroves) were suggested as possible candidates that could promise high carbon absorption rates and adaptability to continue to provide ecosystem services under climate change. Some pre-existing native habitats of semi-mangrove species (e.g. Hibiscus hamabo, Paliurus ramosissimus) on Jeju Island had already demonstrated comparatively higher carbon absorption abilities than other broadleaf species as measured by photosynthesis rates and soil carbon storage performance. This study’s sole objective is to evaluate candidate mangrove species for their suitability for responsibly planned propagation in South Korea. This includes also evaluating their carbon uptake capabilities in order to forecast projections on the carbon storage and absorption performance of selected species. This study is an opportunity to contribute knowledge towards global emission reduction and climate-change mitigation objectives, especially, given the high concentration of highly vulnerable or at-risk populations in the Asia-Pacific.

How to cite: Lee, B. and Baral, H.: Prospects of Adaptability and Establishment of Mangroves to Achieve Carbon Capture Expansion in Korean Coastal Areas, EGU General Assembly 2023, Vienna, Austria, 23–28 Apr 2023, EGU23-11394, https://doi.org/10.5194/egusphere-egu23-11394, 2023.

EGU23-11967 | ECS | Posters on site | BG8.4

Study on Forest Management System Considering Ecosystem Services in Islands in South Korea 

Chanwoo Park, Bora Lee, Jang-Hwan Jo, and Kwang Soo Lee

Forest ecosystem in islands should be managed based on site-specific management plan since it has different biological and cultural characteristics compared to inland forest ecosystem related to isolation, uniqueness, and vulnerability. There are more than 3,800 islands in South Korea and half of them have forest ecosystem. The area of forest ecosystem in island is 2,267 km2, 3.5% of total forest area in South Korea. The need for island forest management is widely recognized, but it is not cost- and time-effective to manage island forest ecosystem intensively same as inland forest ecosystem. we are conducting research to develop suitable management system for island forest ecosystem through the following process. (1) constructing island database, (2) identifying effective factors to categorize island forest type, (3) determining and quantifying key ecosystem services and funtions, (4) developing technical and silvicutural method to enhance ecosystem functions, (5) seeking to legislate for continuity and legitimacy to island forest ecosystem maintenance. Database on the island forest ecosystem with 49 fields containing socio-economical, biological and ecological information was constructed. Then islands were categorized into 6 types using 16 effective factors to categorize derived from expert delphi survey. Also, 10 key ecosystem services importantly in domestic island forests were determined as follows: natural resources, medicinal plants, watershed and freshwater, erosion control, biological control, aesthetic appreciation and inspiration, forest recreation, cultural heritage, species habitants, and maintenance of genetic diversity. The key ecosystem services in each type of island forest are expected to provide priorities and directions for forest management.

How to cite: Park, C., Lee, B., Jo, J.-H., and Lee, K. S.: Study on Forest Management System Considering Ecosystem Services in Islands in South Korea, EGU General Assembly 2023, Vienna, Austria, 23–28 Apr 2023, EGU23-11967, https://doi.org/10.5194/egusphere-egu23-11967, 2023.

EGU23-12012 | Orals | BG8.4

Predictable patterns within the kelp forest can indirectly create temporary spatial refugia for ocean acidification 

Nina Bednarsek, Greg Pelletier, Marcus Beck, Richard Feely, Zach Siegrist, Dale Kiefer, Joth Davis, and Betsy Peabody

Seaweeds are gaining recognition as a significant CO2 sink with a role in active mitigation and

climate change adaptation, and specifically so in the application of an innovative coastal CO2 removal belt, effectively utilizing seaweed habitats to mitigate the adverse effects of ocean acidification (OA). However, assessing OA modification strength requires an understanding of the multiple parameters’ potential buffering effects, especially in highly dynamic systems. Exactly how kelp might generate more favorable conditions for marine calcifiers, has not been taken into account in previous studies to date. We studied the effects of sugar kelp (Saccharina latissima) on an experimental farm at the north end of Hood Canal, Washington—a low retentive coastal system. This study can serve as a natural analogue for many coastal bay habitats where prevailing physical forcing drives chemical changes. In this field mesocosm study, pelagic and benthic calcifiers were exposed with or without the kelp’s putatively protective proximity at locations in the middle, on the edge, and outside the kelp array. Model outputs were used to identify dominating factors in spatial and temporal kelp dynamics, while wavelet spectrum analyses helped in understanding predictability patterns. We linked these results to biological assessments, including biomineralization, growth and subcellular energetics responses of the examined species. We found our studied kelp array system did not modify carbonate chemistry parameters, but changed pH autocorrelation patterns towards higher predictability that was more favorable for marine calcifiers. Kelp also improved habitat provisioning through kelp-derived particulate organic resource utilization. Because of this, the co-culture of bivalves and seaweed can protect the calcifiers from negative effects of projected near-future OA. However, our study shows that a complex combination of physical, chemical and biological processes determines the efficiency of the kelp farms for creating more favorable habitats with respect to OA. Future macrophyte studies should focus significantly on the importance of predictability patterns, which can additionally improve the conditions for marine calcifiers as well as ecosystem services, with important implications for the aquaculture industry.


How to cite: Bednarsek, N., Pelletier, G., Beck, M., Feely, R., Siegrist, Z., Kiefer, D., Davis, J., and Peabody, B.: Predictable patterns within the kelp forest can indirectly create temporary spatial refugia for ocean acidification, EGU General Assembly 2023, Vienna, Austria, 23–28 Apr 2023, EGU23-12012, https://doi.org/10.5194/egusphere-egu23-12012, 2023.

EGU23-12084 | ECS | Posters on site | BG8.4

Review of a systematic protocol for carbon dynamics and ecosystem services of species associated with land-use and land-cover change in mangrove ecosystems 

Citra Gilang Qurani, Sigit D Sasmito, Agus Muhammad Maulana, Mihyun Seol, Bora Lee, Himlal Baral, and Putu Angga Wardana

Mangrove ecosystems are among the most efficient natural carbon sinks on Earth. Overall global mangrove loss between 2000 and 2016 was 3363 km2 (2.1%) owing to land-use and land-cover change. It is predicted that global greenhouse-gas emissions will reach 2391 Tg CO2 eq by 2100. The conversion of mangrove forests for various activities has reduced vegetation abundance, which has an impact on the global carbon cycle because of changes to the carbon dynamics in each climate zone. We will create a revised systematic protocol built on the systematic protocol of Sasmito et al. (2016) by adding information on species’ ability to absorb carbon to contribute to the global climate cycle, particularly, in relation to land-use and land-cover change of mangrove forests. Our primary question will be how do local climate characteristics (micro-meteorological) associated with land-use and land-cover change affect the carbon dynamics of mangrove species? Our protocol will focus on carbon dynamics, including absorption ability, stocks, fluxes and sequestration, in particular climate zones, to assess species’ distribution and diversity, using spatial mapping to identify suitable species for restoration programmes across Asia and the Pacific. The review will include peer-reviewed and grey literature (including unpublished studies) since 2019 onwards combined with references from Sasmito et al. 2016 from 1970 onwards specific to carbon dynamics of mangrove species. The output of our review will be geographical mapping of species’ distribution and diversity together with estimation of carbon absorption capacity, stocks, fluxes and sequestration in different climate zones, noting latitude, longitude and characteristics of the habitats. Rhizophora sp. — one of the most dominant species — has higher carbon absorption ability than Bruguiera sp. of the same age undergoing tropical monsoon mangrove-cover changing to fishponds and housing in Indonesia. Rhizophora sp. also store high amounts of carbon owing to strong carbon uptake ability compared to Octornia octodonta, Sonneratia alba, Ceriops tagal and Avicennia marina in tropical northwest monsoon areas. In contrast, Kandelia obovata has the highest carbon density (148.03 t ha-1) followed by Avicennia marina (104.79 t ha-1) and Aegiceras corniculatum (99.24 t ha-1) in another tropical monsoon climate in China. The carbon stocks of vegetation in subtropical mangroves show lower rates compared to tropical mangroves. The ability of species to absorb carbon is affected by the climate zone and its characteristics — which has a strong impact on carbon dynamics and affects global climate regulation — particularly, in disturbed mangrove forests. Mangrove ecosystems are home to coastal flora and fauna with high quantities of carbon stored and sequestered as part of major global carbon cycles. Consequently, it is essential to assess the carbon dynamics of mangrove species and the association with ecosystem services as part of land-use and land-cover change in various mangrove ecosystems.

How to cite: Qurani, C. G., Sasmito, S. D., Maulana, A. M., Seol, M., Lee, B., Baral, H., and Wardana, P. A.: Review of a systematic protocol for carbon dynamics and ecosystem services of species associated with land-use and land-cover change in mangrove ecosystems, EGU General Assembly 2023, Vienna, Austria, 23–28 Apr 2023, EGU23-12084, https://doi.org/10.5194/egusphere-egu23-12084, 2023.

EGU23-13673 | ECS | Posters on site | BG8.4

Classification of islands forest types and ecosystem services management in South Korea 

Jang-Hwan Jo, Deog-Kyu Kweon, Bora Lee, and Chanwoo Park

To implement sustainable management of island forests efficiently, it is important to categorize island forests into groups by similar characteristics based on specific criteria and establish a consistent management system for each type. This study aims to improve and provide directions for the efficiency of sustainably managing island forests by considering various socioeconomic and ecologically effective factors (connectivity to land and natural vegetation composition ratio) in classifying the forests according to the forest types. Moreover, To classify the types of island forests and present the management direction, an AHP analysis was conducted with forest experts.  A total of six island forests were extracted: Excellent natural vegetation/connected islands [n=156], General natural vegetation/connected islands [n=16], Poor natural vegetation/connected islands [n=60], Excellent natural vegetation/disconnected islands [n=1,810], General natural vegetation/disconnected islands [n=108], and Poor natural vegetation - disconnected islands [n=302]. In areas where islands are connected, provisioning services (natural resources, medicinal plants, etc.) was considered more important to be managed. In areas where islands are disconnected, people tend to consider the management of regulating services (erosion control) and supporting services (species diversity) to be more important. In addition, even in areas where islands are disconnected, especially in places where natural vegetation is poorregulating services (erosion control) for the conservation of the ecosystem were considered the more important target to be managed. The results of this study can be used as evidence to determine the direction and degree of policy budget input for sustainable island forest management.

How to cite: Jo, J.-H., Kweon, D.-K., Lee, B., and Park, C.: Classification of islands forest types and ecosystem services management in South Korea, EGU General Assembly 2023, Vienna, Austria, 23–28 Apr 2023, EGU23-13673, https://doi.org/10.5194/egusphere-egu23-13673, 2023.

EGU23-13684 | ECS | Posters virtual | BG8.4

Assessing impact of land-use changes on carbon stock dynamics in coastal mangrove ecosystem in Bali Island, Indonesia  

Agus Muhammad Maulana, Putu Angga Wiradana, I Kadek Wisma Yudha, Nandar Sutiadipraja, Citra Gilang Qur’ani, and Himlal Baral

Indonesia has more than 3 million ha of mangrove forests along its coastal islands, play a significant role as one of the largest global blue carbon storages for an estimated 3.14 billion tons in 2020. However, this mangrove ecosystem is under serious threat with 6% of annual forest loss recorded due to the conversion of various land-use changes. Bali has 2207 ha of intact mangrove forest and has the potential to store a large amount of carbon pool, at the same time Bali serves as the center of tourism activity in Indonesia which raises a challenge to maintain its sustainability. This study aims to estimate the dynamics of carbon storage in Bali island using spatial and temporal data generated from satellite imagery (Landsat-8 and Sentinel-2) and GIS modeling. We analyzed the distribution of mangroves forest from the past and present to understand the threat from land-use change and modeling the future scenario using InVEST. The model will predict the dynamics of carbon stock from present, past, and future values to be assessed and evaluated under development scenarios. Assessing and quantifying the amount of carbon stored in mangrove ecosystem is fundamental in the context of climate change and development of sustainable mitigation programs. 

How to cite: Maulana, A. M., Wiradana, P. A., Yudha, I. K. W., Sutiadipraja, N., Qur’ani, C. G., and Baral, H.: Assessing impact of land-use changes on carbon stock dynamics in coastal mangrove ecosystem in Bali Island, Indonesia , EGU General Assembly 2023, Vienna, Austria, 23–28 Apr 2023, EGU23-13684, https://doi.org/10.5194/egusphere-egu23-13684, 2023.

The PARADeS project uses participatory approaches to contribute towards enhancing Ghana’s national flood disaster risk reduction and management strategy. The project was initiated by practitioners from Ghana and the problem setting was developed during a definition phase of the project. When the project started, commitment and strong partnership and involvement of partners were already established - a prerequisite for collaborative and non-extractive research.

Multiple workshops and focus group discussions were ‘successfully’ conducted in collaboration with our local partners. Despite the sound basis of the project (e.g. shared goal(s), strong and committed partnership), we experienced challenges before, during and post fieldwork. In this contribution, we particularly reflect and focus on including and managing different types of participants. On the one hand, we engaged with representatives from different governmental institutions and non-governmental organizations with mostly academic background during the workshops. On the other hand, flood-affected urban and rural citizens with strongly differing educational backgrounds and socio-economic assets elaborated on their flood experiences during the focus group discussions. Here, three main themes and challenges arose:

  • Selection of participants: Identifying blind spots of researchers and local partners, e.g. the risk of missing out marginalized voices,
  • Expectations management: Coping with expectations of participants and communicating own room of action, and
  • Feedback processes: Preventing extractive research by feedbacking information relevant to the participants

During the session, these themes are discussed using the guiding principles for fieldwork with participants (see Rangecroft et al. 2020) by highlighting ethics, communication, power dynamics and positionality. For this, we share our experiences and lessons learned e.g. how we deal with the problem of getting a gender balanced participant list or how we manage unexpected structures of focus groups. Furthermore, we would like to share our uneasiness when, for example, a focus group discussion turned into a community talk or unrealistic though understandable expectations were raised. By sharing our successes and pitfalls, we would like to contribute to a broader discussion on how to improve fieldwork, prepare for surprise and, especially, to meet expectations of participants, partners and researchers without compromising each other’s needs and integrity. 


Rangecroft, S., M. Rohse, E. W. Banks, R. Day, G. Di Baldassarre, T. Frommen, Y. Hayashi, B. Höllermann, K. Lebek, E. Mondino, M. Rusca, M. Wens and A. F. Van Loon (2020). "Guiding principles for hydrologists conducting interdisciplinary research and fieldwork with participants." Hydrological Sciences Journal: 1-12.

How to cite: Höllermann, B. and Ntajal, J.: Managing participants, expectations and surprises during fieldwork – Experiences from collaborative flood risk management in Ghana, EGU General Assembly 2023, Vienna, Austria, 23–28 Apr 2023, EGU23-207, https://doi.org/10.5194/egusphere-egu23-207, 2023.

EGU23-851 | ECS | Orals | EOS4.1

Organisational preparedness for the physical risks of climate change in the UK 

Denyse S. Dookie, Declan Conway, and Suraje Dessai

Understanding local perceptions of preparedness, risk and response to climate change is important for effective adaptation-focused actions and policy design. While there have been national surveys of the public’s concern, organisational perspectives are less studied. This research presents findings of a national survey of UK-based organisations’ perceptions about adapting to a changing climate. The survey covers awareness among organisations of climate change, its physical risks and how organisations are taking action to prepare for perceived risks. Administered in spring 2021, our survey summarises the insights of 2,400 respondents in roles related to organisational planning. The majority of respondents (69%) were from the private sector, while others came from public health authorities, local authorities, public educational establishments, and third sector or charitable organisations. 58% of respondents identified the effects of climate change as a concern. While the survey results support a picture of UK organisations taking steps to prepare for similar extreme weather events in the future, action is strongly informed by dealing with the effects of extremes already experienced. There is a much lower proportion of organisations taking measures to deal with the physical risks of future climate change. In terms of future action, organisations perceived a strong role for leadership from government and collective responsibilities for adaptation, signalling a need to recognise this in efforts to promote adaptation. These findings, though UK-centric, provide insight to societal responses, options and pathways, especially at the organisational level for the less widely studied private sector, as noted in IPCC AR6 WGII Chapter 13: Europe. 

How to cite: Dookie, D. S., Conway, D., and Dessai, S.: Organisational preparedness for the physical risks of climate change in the UK, EGU General Assembly 2023, Vienna, Austria, 23–28 Apr 2023, EGU23-851, https://doi.org/10.5194/egusphere-egu23-851, 2023.

Professional experiences led geoscientists initially to put together epistemic-moral hybrids [1], e.g. The Cape Town Statement on Geoethics  [2]. Then, combining geosciences and political philosophies more comprehensively, geo-philosophical assessments of human practices as part of the Earth System emerged [3] [4]. These assessments describe the Human-Earth Nexus amalgamating insights into (i) the dynamics of the Earth System; (ii) socio-historical features of human societies; (iii) philosophical appraisals of socio-political choices.

Scholars of the history of science recently developed a theory of the evolution of knowledge [5] [6] [7]. Applied to societies experiencing anthropogenic global change, they discern the concept of an ergosphere to depict the essence of the Human-Earth Nexus. “With their rapidly evolving culture, humans have introduced an “ergosphere” (a sphere of work, as well as of technological and energetic transformations) as a new global component of the Earth system, in addition to the lithosphere, the hydrosphere, the atmosphere, and the biosphere, thus changing the overall dynamics of the system.“ [6, p. 7].

The historians’ theory of evolution of knowledge offers geoscientists notions (e.g. borderline problem, economy of knowledge, and external representation) for assessing human practices, e.g. (i) a ‘borderline problem’ defined as: “problems that belong to multiple distinct systems of knowledge. Borderline problems put these systems into contact… (and sometimes into direct conflict) with each other, potentially triggering their integration and reorganisation” [7, p427]; (ii) an ‘economy of knowledge’ defined as: “societal processes pertaining to the production, preservation, accumulation, circulation, and appropriation of knowledge mediated by its external representation” [7, p.429]; (iii) an ‘external representation’ defined as: “any aspect of the material culture or environment of a society that may serve as an encoding of knowledge” [7, p. 224].

Concluding: (i) taking a geo-philosophical perspective means, per se, specifying a borderline problem, an economy of knowledge, and an external representation; (ii) the theoretical findings of the history of science offer a standardised methodology for geo-philosophical studies, namely asking: What borderline problem? What economy of knowledge? What external representation? Responses will discern sharper the socio-historical features of geo-philosophical topics, be it geoheritage or the Human-Earth-Nexus.

[1] Potthast T (2015) Toward an Inclusive Geoethics—Commonalities of Ethics in Technology, Science, Business, and Environment. In: Peppoloni MW (ed) Geoethics. Elsevier, pp 49–56

[2] Di Capua G, Peppoloni S, Bobrowsky P (2017) The Cape Town Statement on Geoethics. Ann Geophys 60:1–6. https://doi.org/10.4401/ag-7553

[3] Di Capua G, Bobrowsky PT, Kieffer SW, Palinkas C (2021) Introduction: geoethics goes beyond the geoscience profession. Geol Soc London, Spec Publ SP508-2020–191. https://doi.org/10.1144/SP508-2020-191

[4] Bohle M, Marone E (2022) Phronesis at the Human-Earth Nexus: Managed Retreat. Front Polit Sci 4:1–13. https://doi.org/10.3389/fpos.2022.819930

[5] Rosol C, Nelson S, Renn J (2017) Introduction: In the machine room of the Anthropocene. Anthr Rev 4:2–8. https://doi.org/10.1177/2053019617701165

[6] Renn J (2018) The Evolution of Knowledge: Rethinking Science in the Anthropocene. HoST - J Hist Sci Technol 12:1–22. https://doi.org/10.2478/host-2018-0001

[7] Renn J (2020) The Evolution of Knowledge - Rethinking Science for the Anthropocene. Princeton University Press, Oxford, UK

How to cite: Bohle, M.: Takings from the History of Science for Geo-philosophical Studies, EGU General Assembly 2023, Vienna, Austria, 23–28 Apr 2023, EGU23-1204, https://doi.org/10.5194/egusphere-egu23-1204, 2023.

EGU23-1385 | Posters on site | EOS4.1 | Highlight

An expanded definition of geoethics 

Giuseppe Di Capua and Silvia Peppoloni

Geoethics incorporates instances, categories, concepts, principles, and values already present in the cultural debate, and develops an original theoretical and interdisciplinary framework that merges reflections and considerations that animate philosophical, political, sociological, economic, and (geo)scientific discussions. Geoethics analyses critically and rationally theoretical and practical issues of local and global importance (from climate change, to defense against geohazards and the use of geo-resources), in order to guide social stakeholders towards more inclusive, sustainable, and ecologically-oriented choices.

Geoethics can be qualified as:

  • universal and pluralist (it defines an ethical framework for humanity, in the awareness that the respect of the plurality of visions, approaches, tools is essential to assure dignity to all agents and to guarantee a wide range of opportunities for developing more effective actions to face common threats).
  • wide (its issues and reflections cover an extensive variety of themes);
  • multidisciplinary (its approach favors cooperation and overcoming the sectoral languages of the individual disciplines, to reach the intersection and integration of knowledge);
  • synthetic (it expresses a position of synthesis, definable as ecological humanism, between various existential concepts and different conceptions regarding the nexus between human being and Earth system);
  • local and global (its topics of interest concern both local and regional dimensions, as well as the global one related to the entire Earth system);
  • pedagogical (it proposes a reference model to cultivate one's ethical dimension, to reach a greater awareness of the value of human identity, not in terms of exercisable power over the other by oneself, but of respect of the dignity of what exists);
  • political (it criticizes the materialism, egoism, and consumerism of capitalism, prefiguring a profound cultural change of economic paradigms, and supports the right to knowledge as the foundation of society).

By contributing to change the perception of the nexus between the human being and the Earth system and consequently the social and legal structures of the organization of human communities, geoethics defines educational and political horizons for reaching a global reform of society (Peppoloni and Di Capua 2021: https://doi.org/10.3390/su131810024).

Based on these considerations, the definition of geoethics, as included in the Cape Town Statement on Geoethics (Di Capua et al. 2017: https://doi.org/10.4401/ag-7553) and internationally adopted, can find a new, broader formulation, which also describes better its theoretical structure and operational logic:

Geoethics is a field of theoretical and applied ethics focused on studies related to human-Earth system nexus. Geoethics is the research and reflection on principles and values which underpin appropriate behaviors and practices, wherever human activities interact with the Earth system. Geoethics deals with ways of creating a global ethics framework for guiding individual and social human behaviors, while considering human relational domains, plurality of human needs and visions, planetary boundaries, and geo-ecological tipping points. Geoethics deals with the ethical, social, and cultural implications of geoscience knowledge, education, research, practice, and communication and with the social role and responsibilities of geoscientists.

How to cite: Di Capua, G. and Peppoloni, S.: An expanded definition of geoethics, EGU General Assembly 2023, Vienna, Austria, 23–28 Apr 2023, EGU23-1385, https://doi.org/10.5194/egusphere-egu23-1385, 2023.

EGU23-1391 | Posters on site | EOS4.1

Proposal of ethical guidelines for the European Research Infrastructure EPOS 

Silvia Peppoloni and Giuseppe Di Capua

In the science and technology domain, common methods, procedures, and protocols (rules allowing to make science) guarantee the quality and reliability of scientists’ and technicians’ work. When those rules are adequately followed, there should not arise any problems in deciding what is the best action to take while carrying out research and technological activities. But this is not enough to ensure that activities are conducted ethically.

Ethics influences personal and collective conduct and thereby shapes relationships and resulting outcomes. Research institutions/networks/organizations and their operators have societal responsibilities since their activities may have an impact on stakeholders, partners, and general end users with consequential effects on the economy, society, culture, public policy or services, health, the environment, or quality of life that goes way beyond a purely academic impact. Science, technology, and ethics are closely interconnected and they mutually influence the subject of their analyses and reflections. Thus, research and technological activities have to consider ethics to develop their full potential.

The mission of EPOS is “To establish and underpin a sustainable and long-term access to solid Earth science data and services integrating diverse European Research Infrastructures under a common federated framework.” This mission encapsulates ethical aspects that must be considered by the EPOS community (scientists, technicians, and data providers, who have different roles and therewith responsibilities within the EPOS community) and that are reflected in EPOS’ goals (https://www.epos-eu.org/about-epos).

In the EU H2020 EPOS-SP project, we developed first draft of the ethical guidelines for the EPOS community, that considers the following EPOS key-concepts:

  • multidisciplinary research;
  • integrated use of data, models, and facilities;
  • appropriate legal solutions;
  • common and shared data policy;
  • open access policy;
  • transparent use of data;
  • mutual respect of intellectual property rights.

The ethical guidelines are essential for establishing an informal “contract” between all members of the EPOS community for managing the relationships within the research infrastructure and with partners by defining principles and values to be shared for building a community of purposes, that is a set of individual and institutional subjects who share an organization, a language, a mission, goals to be achieved, a working method and operational tools.

These guidelines shall ensure that the research conducted within EPOS and services operated in this context are done in an ethical way.

The ethical guidelines are an orienting document for the implementation of the EPOS ERIC’s (European Research Infrastructure Consortium) tasks towards its reference community and stakeholders and are preparatory to the drafting of the final version of the EPOS ERIC ethical guidelines on which to develop subsequent ethical codes for managing specific activities or issues concerning EPOS activities.

How to cite: Peppoloni, S. and Di Capua, G.: Proposal of ethical guidelines for the European Research Infrastructure EPOS, EGU General Assembly 2023, Vienna, Austria, 23–28 Apr 2023, EGU23-1391, https://doi.org/10.5194/egusphere-egu23-1391, 2023.

EGU23-2805 | Posters on site | EOS4.1

Study on the effective disaster risk management and communication for resilient community 

Mo-Hsiung Chuang, Kuo-Chen Ma, and Yih-Chi Tan

This 27th United Nations Climate Change Conference clearly pointed out that global warming is progressing. The threat of climate change and extreme disasters will increase rapidly, and the risk of community disasters will increase significantly. Therefore, effective disaster risk management and risk communication can enable community residents in disaster potential areas to understand disaster risks and build disaster prevention organizations, which has become a Practitioner in Disaster Risk Management. This study aims to explore training methods for resilient Communities. These include community environment diagnosis map making, including natural disaster risk and vulnerability discussion and disaster prevention map drawing, and secondly, how to train resilient community to conduct disaster risk control and disaster management measures before or during disaster events and recovery periods. Finally, combine the geographic information of the public sector and volunteers to conduct public-private cooperation to build disaster risk management and practice with resilient communities as the key players.

How to cite: Chuang, M.-H., Ma, K.-C., and Tan, Y.-C.: Study on the effective disaster risk management and communication for resilient community, EGU General Assembly 2023, Vienna, Austria, 23–28 Apr 2023, EGU23-2805, https://doi.org/10.5194/egusphere-egu23-2805, 2023.

EGU23-3462 | Posters on site | EOS4.1 | Highlight

How to collectively engage in reducing the carbon footprint of a research lab? 

Jean-Philippe Vidal, Céline Berni, Marina Coquery, Alexandre Devers, Leslie Gauthier, Claire Lauvernet, Matthieu Masson, Louise Mimeau, and Martin Turlan and the RiverLy Downstream team

This communication aims at testifying how individual commitments of researchers can be combined to engage a whole research lab – in this case INRAE RiverLy – in a carbon transition path. INRAE RiverLy is an interdsciplinary research unit for the management and restoration of river systems and their catchments. In 2020, a group of RiverLy people started questioning the downstream impacts of their research practices. An official internal action called RiverLy Downstream was thus launched to address these issues. A first lab-scale carbon accounting for the year 2019 was performed thanks to the GES 1point5 tool (https://apps.labos1point5.org/ges-1point5). It showed a large contribution of air travel to the total carbon footprint. Further carbon accounting for 2020 and 2021 however highlighted the even larger impact of purchases (equipment, consumables, etc.) thanks to newly implemented features in GES 1point5. An open “climate day” was organized in the lab in September 2022 for (1) raising awareness through a general-public-oriented tool, (2) provide live feedback from other research labs engaged in a carbon transition, and (3) collectively identify propositions of local actions on different themes: purchases, travels, premises, computing, food, and research activities. These propositions fed a lab-wide survey that will help defining a few carbon footprint reduction scenarios based on their social acceptability. These scenarios will then be submitted to the lab board for implementation. The whole process benefited from rich interactions with INRAE national to regional strategy for reducing its environmental footprint (https://www.inrae.fr/en/corporate-social-responsibility-inrae), and with the French national initiative Labos1point5 (https://labos1point5.org/).

How to cite: Vidal, J.-P., Berni, C., Coquery, M., Devers, A., Gauthier, L., Lauvernet, C., Masson, M., Mimeau, L., and Turlan, M. and the RiverLy Downstream team: How to collectively engage in reducing the carbon footprint of a research lab?, EGU General Assembly 2023, Vienna, Austria, 23–28 Apr 2023, EGU23-3462, https://doi.org/10.5194/egusphere-egu23-3462, 2023.

EGU23-4066 | Posters on site | EOS4.1

Supradisciplinary approach: a (geo)ethical way of producing knowledge and guiding human actions in the XXI Century. 

Eduardo Marone, Martin Bohle, and Rika Prieser

Once upon a time, super-specialization and intra-disciplinary approaches were highly rated, although implying divisions of knowledge1. How to challenge such epistemic boundaries? The disciplinary methodology for creating knowledge is important, particularly when subject to solid quality control. However, it is often faulty when handling broad complex systems, such as Natural or Social ones, despite scholars building elaborated methodologies, such as multi-, inter, trans-, and cross-disciplinary practices2. They provided insights and knowledge generation, although showing limitations3,4,5 (epistemic, field domination, egos, etc.).

Geoethics, looking into appropriate behaviours and practices wherever human activities interact with the Earth system6, is an example of the above, which requires overcoming limitations of disciplinary approaches by aiming at supradisciplinary7: engaging with a subject matter across a range of discourses/fields without giving rise to an interdisciplinary hybrid or sui generis discipline.

Exploring what a supradisciplinary practice means, a networkn of scholars proposes a tactic to assemble fellows from the People Sciences and the Natural Sciences: (i) A respectful epistemic trespassing8 allows crossing traditional disciplinary boundaries, and applying proper supradisciplinary collaboration seems more ethical than other methodologies. (ii) Organizing the team under a rhizomatic structure9 does not allow any scientific field hierarchy, avoiding the dilemma of preferring transdisciplinary approaches versus interdisciplinary or multidisciplinary ones and vice versa. Epistemic trespassing is a powerful tool for creating new supradisciplinary knowledge, avoiding the usual hyper-protection (and egos) related to any disciplinary epistemic backyards. It must be considered that supradisciplinary collaboration depends strongly on the quality of the given scientific problem and the proper promotion of the needed epistemic metamorphosis, which seems a more ethical and efficient way of producing knowledge.


1 Klein, J. T., & Miller, R. C. (1983). The Dialectic and Rhetoric of Disciplinary and Interdisciplinary. Issues in Interdisciplinary Studies.

2 Van den Besselaar, P., & Heimeriks, G. (2001). Disciplinary, multidisciplinary, interdisciplinary: Concepts and indicators. In ISSI (pp. 705-716).

3 Okamura, K. Interdisciplinarity revisited: evidence for research impact and dynamism. Palgrave Commun 5, 141 (2019). https://doi.org/10.1057/s41599-019-0352-4

4 Editorial. How to avoid glib interdisciplinarity. Nature 552, 148 (2017). DOI: https://doi.org/10.1038/d41586-017-08465-1

5 Kotter, R., Balsiger, P. W., Bailis, S., & Wentworth, J. (1999). Interdisciplinarity and transdisciplinarity: a constant challenge to the sciences. Issues in Interdisciplinary Studies.

6 Peppoloni, S., Bilham, N., & Di Capua, G. (2019) Contemporary Geoethics Within the Geosciences. In: Exploring Geoethics. Springer International Publishing, Cham, pp 25–70

7 Balsiger, P. W. (2004). Supradisciplinary research practices: history, objectives and rationale. Futures, 36(4), 407-421.

8 Ballantyne, N. (2019). Epistemic trespassing. Mind, 128(510).

9 Deleuze, G., & Guattari, F. (1987) [1980]. A Thousand Plateaus. Translated by Massumi, Brian. University of Minnesota Press. p. 21. ISBN 0-8166-1402-4.

n The Network: Alexandra Aragão, Alessia Rochira, Anamaria Richardson, Antony Milligan, Bruno Costelini, Carlos A.S. Batista, Carlos Murillo, Carsten Herrmann-Pillath, Claire A. Nelson, Cornelia E. Nauen, Eduardo Marone, Francesc Bellaubi, Jas Chambers, Javier Valladares, Luis Marone, Martin Bohle, Nic Bilham, Paul Hubley, Rika Preiser, Sharon Stein, Silvia Peppoloni, Vincent Blok, Will Steffen.

How to cite: Marone, E., Bohle, M., and Prieser, R.: Supradisciplinary approach: a (geo)ethical way of producing knowledge and guiding human actions in the XXI Century., EGU General Assembly 2023, Vienna, Austria, 23–28 Apr 2023, EGU23-4066, https://doi.org/10.5194/egusphere-egu23-4066, 2023.

EGU23-4384 | ECS | Posters on site | EOS4.1

Social safety in the field – preparing the students, our future colleagues 

Kalijn Peters, Steye Verhoeve, and Wiebe Nijland

Watching the documentary ‘The Leadership’ led to a consentient discussion amongst colleagues. In this documentary a group of female scientists set off on a cruise to learn about and experience leadership. Personal experiences, what happens on board and statistics about social safety, show that feeling socially safe and included is still an issue amongst (female) scientists, especially when working in the field. The significantly high numbers of female field scientists in STEM research having experienced discrimination, gender inequality and (sexual) harassment cannot be ignored, so we decided this subject has to be embedded in our bachelor curriculum.

In order to enhance social safety in our earth sciences program, we set up a workshop on this subject for our bachelor students as part of a 15ECTS fieldwork course. In the field, students are physically and mentally challenged, while operating in an often unfamiliar environment, working in bigger and smaller groups, for longer periods of time and integrating all they have learned over the past year(s). With the many challenges this encompasses, they will likely face the boundaries of their comfort zone. This makes them more vulnerable and increases the risk of creating an unsafe working, studying/living environment. However, when treated with care, these experiences can have a significant positive impact on the students personal growth and become beneficial to their professional skills and learning.

The workshop we designed starts with discussing daily practicalities and individual responsibilities, including sanitary hygiene and proper field-equipment, and continues with professional attitude, an exercise on group dynamics, how to function in a team that is not your own choice, and getting to know your teammates in a playful manner. We finish with the discussion of (sexual) harassment, providing tools to become an active bystander, and giving the students case studies of socially (un)safe settings in the field. They present these case studies to each other on how they would react, reflecting on their own capabilities and responsibilities.

After this first year, student evaluations and discussions with field staff point out that this is a valuable part of the fieldwork. For example the staff could more easily refer to some manners discussed in the workshop, and the students could recognize the case studies and use this to tackle unsafe situations at an earlier stage. We now continue with optimizing the existing workshop, and would like to exchange experiences about this subject with colleagues to enhance improvement of social safety and personal growth in the field for both students and teaching staff.

How to cite: Peters, K., Verhoeve, S., and Nijland, W.: Social safety in the field – preparing the students, our future colleagues, EGU General Assembly 2023, Vienna, Austria, 23–28 Apr 2023, EGU23-4384, https://doi.org/10.5194/egusphere-egu23-4384, 2023.

The unprecedented acceleration of human extractions of living and mineral resources particularly after WWII and their wasteful transformation in an expanding technosphere is now estimated to exceed living matter[1]. This fossil fuel driven acceleration has led to exceeding planetary boundaries in several dimensions [2], including the on-going mass extinction of species particularly in the warming and overfished ocean. Catch reconstructions since the beginnings of global statistics in 1950 are revealing the extent of unsustainable extractions from the ocean[3]. Two decisions at global negotiations in 2022, one on harmful fishing subsidies and the landmark target 3 on the protection of 30% of ocean and land by 2030, have potential to slow down the excesses and gradually rebuild fully functional ecosystems. How can scientists enhance their contribution towards shifting the emphasis to implementation? We know from cognitive science, e.g. that excessive car speed and other forms of sensory overload stress humans and reduce quality of life while also harming the environment[4]. Yet even in the face of evidence, it has often been impossible to act decisively on this evidence. Similarly, it has so far been been difficult to overcome widespread cognitive dissonance about climate change and species extinctions in the ocean. Contrary to widely held beliefs, here it is postulated that different attitudes are not impervious to scientific information and learning. Historically these judgemental processes are not fixed, even when reinforced by social norms[5]. However, the accumulation of facts and their presentation in the scientific literature is not enough to bring about what may be considered desirable behavioural change. This is reflected in considerable effort put into policy briefs and other dissemination formats in recent years, including video and social media e.g. by the IPCC. Art of hosting and collective leadership are other proven approaches for building understanding and trust necessary to develop robust solutions through enabling collective action. In their various context-adapted formats they have been successfully deployed for joint learning and action in settings as diverse as largely illiterate small-scale fishing communities and government organisations. They could benefit research and academic institutions in their search for promoting more stakeholder engagement and fostering greater inter- and transdisciplinarity.

[1] Elhacham, E., Ben-Uri, L., Grozovski, J. et al. Global human-made mass exceeds all living biomass. Nature 588, 442–444 (2020). https://doi.org/10.1038/s41586-020-3010-5

[2] Steffen, E., Richardson, K., Rockstroem, J. et al. Planetary boundaries: Guiding human development on a changing planet. Science 347(6223) (2015). DOI: 10.1126/science.1259855

[3] Pauly, D. & Zeller, D. Catch reconstructions reveal that global marine fisheries catches are higher than reported and declining. Nature Commun. 7, 10244 (2016). doi: 10.1038/ncomms10244

[4] Knoflacher, H. Zurück zur Mobilität! Anstöße zum Umdenken. Ueberreuter, Wien (2013)

[5] Sparkman, G., Howe, L., Walton, G. How social norms are often a barrier to addressing climate change but can be part of the solution. Behavioural Public Policy 5(4), 528-555 (2021). DOI: https://doi.org/10.1017/bpp.2020.42

How to cite: Nauen, C. E.: Art of hosting approaches with greater participation of scientists can support robust solutions for increased societal resilience, EGU General Assembly 2023, Vienna, Austria, 23–28 Apr 2023, EGU23-4421, https://doi.org/10.5194/egusphere-egu23-4421, 2023.

EGU23-4443 | Posters on site | EOS4.1

Minerals as lenses to illustrate the relationships between Geology and colonialism 

Selby Hearth and Carrie Robbins

When the core ideas of Geology were being developed in the 19th century, geologists used colonial expeditions for transport, access, data, and -- critically -- specimens. Mineral specimens were sent from colonized and mined localities around the world to centralized collections in Europe and European settler states, forming diverse repositories of minerals, rocks, and fossils that geologists could then draw on without having to leave their home country. The accumulation of these specimens contemporaneously spurred the growth of museums and formed the collections at the heart of object-based pedagogy. As curators of these collections today, how can we use these specimens and their histories to illustrate these connections? This presentation will examine how the Bryn Mawr Mineral Collection is using mineral specimens in cataloging, display, and teaching to provoke reflection on this critical social dimension of our science. One of these strategies has been to recruit student research into mine sites and the provenance and provenience of individual specimens. Activating historical collections in this way helps make them relevant to today’s students. It also helps students recognize that geo-colonialism is not restricted to the past. Lithium, cobalt, and other rare minerals will be central to the production of batteries and anti-carbon technologies for the new “green economy” in the coming decades. It is important that mineral collections begin to use specimens to teach broader social histories of mining, extraction, and Western colonial relationships so that differential distributions of power are taken into account.

How to cite: Hearth, S. and Robbins, C.: Minerals as lenses to illustrate the relationships between Geology and colonialism, EGU General Assembly 2023, Vienna, Austria, 23–28 Apr 2023, EGU23-4443, https://doi.org/10.5194/egusphere-egu23-4443, 2023.

Scientists remain citizens and human beings. As so, they keep their critical mind and have visions for society and opinions on related crucial issues. The climate and ecological crisis makes no exception and has become the subject of more and more discussions among scientific communities. The bond between scientific research and societal issues can be seen in the common practice of national funding agencies asking scientists to explicitly define the societal values of their research activities (the so-called “knowledge utilization”). On such occasions, scientists need to prove that their findings will bring parts of technical, scientific, social, or even political solutions to a range of stakeholders, including decision-makers. Such a peculiar position raises many issues. In democracies, scientists and other experts are usually asked to remain neutral and only provide scientific and technical knowledge to support decision-makers (i.e., governments) who will make the decision.

The question of neutrality has particularly animated scientific communities for decades. May we, as scientists, activate only the rational part of our brains when doing science and activate the emotional one when we return to our daily personal and civic life? Should we remain neutral at all costs? When "business as usual" means making the ecological and social crisis more profound, does the concept of neutrality even exist? Is that ethical if doing nothing means supporting "business as usual"? Or should we admit that this is neither doable nor desirable?

In this paper, we suggest that being neutral and inactive is neither doable nor desirable for the sake of science and society. First of all, scientists are people, and their actions cannot remain completely value-free or independent from societal influences. Instead, the notions of objectivity, scientific rigor, and transparency, which all make part of scientific integrity, may be much more relevant to define good research practices. As long as these practices are followed, many ways of communicating with peers, stakeholders, and the public sphere may be considered, from appeased recommendations to stakeholders all the way down to (illegal) civil disobedience, as those may only differ by their degree of engagement in reporting the same facts. To which the ethics of responsibility should be added: we must say what we know (Resnik and Elliot, 2016).

We collected several testimonies from scientists from the earth and climate sciences engaged in activism and civil disobedience. The description of the several types of intellectual trajectories will help us understand how scientists connect their values to science and how, at their scale, their vision helps them disseminate science to improve societies and reduce their impacts on global changes.

Resnik, D. B. and Elliott, K. C.: The Ethical Challenges of Socially Responsible Science, Accountability in Research, 23, 31–46, https://doi.org/10.1080/08989621.2014.1002608, 2016.

How to cite: Lassabatere, L., Kuppel, S., and Vitón, Í.: Engaged scientists and the question of neutrality and integrity: illustrative intellectual trajectories of geoscientists, EGU General Assembly 2023, Vienna, Austria, 23–28 Apr 2023, EGU23-5456, https://doi.org/10.5194/egusphere-egu23-5456, 2023.

EGU23-5570 | ECS | Orals | EOS4.1

Decarbonising conference travel: testing a multi-hub approach 

Sabrina Zechlau, Stefanie Kremser, Andrew Charlton-Perez, Jadwiga Richter, Jose Santos, Julia Danzer, and Stefanie Hölbling

As the global research enterprise grapples with the challenge of a low carbon future, a key challenge is the future of international conferences. An emerging initiative which combines elements of the traditional in-person and virtual conference is a multi-hub approach. Here we report on one of the first real-world trials of a multi-hub approach, the World Climate Research Programme/Stratosphere-troposphere Processes And their Role in Climate (WCRP/SPARC) General Assembly held in Qingdao-Reading-Boulder during the last week of October 2022. Based on travel surveys of participants, we estimate that the multi-hub approach reduced the carbon footprint from travel of between a factor of 2.3 and 4.1 times the footprint when hosting the conference in a single location. This resulted in a saving of at least 288 tCO2eq and perhaps as much as 683 tCO2eq, compared to having the conference in one location only. Feedback from participants, collected immediately after the conference, showed that the majority (85%) would again attend another conference in a similar format. There are many ways that the format of the SPARC General Assembly could have been improved, but this proof-of-concept provides an inspiration to other groups to give the multi-hub format a try.

How to cite: Zechlau, S., Kremser, S., Charlton-Perez, A., Richter, J., Santos, J., Danzer, J., and Hölbling, S.: Decarbonising conference travel: testing a multi-hub approach, EGU General Assembly 2023, Vienna, Austria, 23–28 Apr 2023, EGU23-5570, https://doi.org/10.5194/egusphere-egu23-5570, 2023.

Paul Crutzen’s concept of the Anthropocene in Nature in 2002 stressed that “a daunting task [lay] ahead for scientists and engineers to guide society towards environmentally sustainable management” and that “this will require appropriate human behaviour at all scales”. The proposal by the Anthropocene Working Group of the International Commission on Stratigraphy’s Subcommission on Quaternary Stratigraphy for an ‘Anthropocene Epoch’ with an isochronous mid-20th century start has been recently challenged by another group of researchers. Mindful of the diachronous impacts of human evolution, they favor a much longer and still ongoing ‘Anthropocene Event’.

In sync with IUGS goals to promote public understanding of the Earth and contribute to international policy decisions, the Anthropocene debate offers an unprecedented opportunity for the geoscience profession to become proactively relevant to the UN’s next-step vision for Planet Earth. Arguably, its 2015-2030 agenda of 17 Sustainable Development Goals each focused on a facet of society and the environment needs a more holistic successor with realistic thinking about sustainability, “one of the most overused and ill-defined words in conversations about the environment” in the view of Andrew Revkin at Columbia University’s Earth Institute. Ideally, the UN’s successor plan would be aligned with the interdependent subsystems of the Earth-Human System and propelled by transdisciplinary involvement of the sciences and humanities.

Echoing an observation by Stanley Finney and Lucy Edwards in GSA Today in 2016 that the terms Anthropocene and Renaissance have similar characteristics as “richly documented, revolutionary human activities”, an ‘Anthropocene Renaissance’ would highlight the need for greater harmony among and between environmental and societal movements. In this vision, the past-framed ‘Anthropocene Event’ underpins the future-framed ‘Anthropocene Renaissance’ as a boldly integrated effort to ‘protect our planet’, one of twelve commitments made by world leaders in 2020 at the UN’s 75th Anniversary Meeting. In a profile of the Anthropocene debate in The New York Times on 18 December 2022, the conclusion featured my interview: “I always saw it not as an internal geological undertaking but rather one that could be greatly beneficial to the world at large”. The UN’s ‘Summit of the Future: Multilateral Solutions for a Better Tomorrow’ will take place in New York City on 22-23 September 2024.


How to cite: Koster, E.: Defining the Anthropocene for the greatest good as an Event-based Renaissance, EGU General Assembly 2023, Vienna, Austria, 23–28 Apr 2023, EGU23-6182, https://doi.org/10.5194/egusphere-egu23-6182, 2023.

EGU23-6356 | Posters on site | EOS4.1

Ma Terre en 180 Minutes: a transition support system to build decarbonization scenarios in the academic community. 

Nicolas Champollion and the Ma Terre en 180 Minutes team

A growing portion of scientists realized the need to not only alert about climate change, but also change their professional practices. A range of tools have emerged to promote more sustainable activities, yet many scientists struggle to go beyond simple awareness-raising to create concrete transition actions. This study proposed the use of a new game-based transition support system called " Ma Terre en 180 Minutes ", which is, to our knowledge, the first tool developed by and for the academic community. It has been designed to build scenarios of greenhouse gases (GHG) emissions reduction in the academic community, and present its deployment during the year 2021, including six hundred participants from 9 countries and 50 cities.


After the phase 1, called awareness, that aims to build a common scientific background about the context (global warming, its causes and consequences, planetary boundaries) and challenge (50% reduction of our carbon budget by 2030), the participants, with the phase 2 called role-playing, immerse themselves into fictional characters, to simulate the behavior of real research groups. Phase 1 and 2 are separated by a few days interphase helping participants to embody their fictional characters and be comfortable with the virtual research group they will simulate, as well as having time to perform their personal carbon footprint. Finally, an important final phase after the game-playing phase 2 take place to discuss, analyze and assess the results of phase 2.


Results show clear pathways for GHG reductions between 25 and 60%, and a median reduction of 46%. The alternatives allowing the greatest reduction are video communication tools (36%), followed by mutualization of professional activities and voluntary cancellation or reduction, thatrepresents 22 and 14% of reduction, respectively. The remaining 28% of reduction is composed by the use of trains as a transport alternative, the relocation of professional activities, the duration extension of some missions, etc… In addition, the analyses pointed out the importance of guided negotiations to bring out some alternatives such as relocation, local partners and computing optimization. An added value of this transition support system is that the information it collects (anonymously) will be used to answer pressing research questions in climate change science and environmental psychology regarding the use of serious games for promoting changes in attitudes and behaviors towards sustainability, and including broader questions on how network structures influence “climate behavior”, knowledge, and the governance of the commons.

How to cite: Champollion, N. and the Ma Terre en 180 Minutes team: Ma Terre en 180 Minutes: a transition support system to build decarbonization scenarios in the academic community., EGU General Assembly 2023, Vienna, Austria, 23–28 Apr 2023, EGU23-6356, https://doi.org/10.5194/egusphere-egu23-6356, 2023.

EGU23-7063 | Posters virtual | EOS4.1

The evolving Code of Conduct at the National Institute of Geophysics and Volcanology of Italy: a participatory process to combine law compliance and geoethics principles 

Giuliana Rubbia, Daniele Bravi, Valeria De Paola, Sergio Gurrieri, Maria Valeria Intini, and Silvia Peppoloni

According to the current legislation of Italy (e.g., Law No. 165/2001) public organizations must have a code of conduct in place, which specifies and complements the General Code of Conduct for public employees, embedding issues that are typical for the specific context. 

The Authority aimed at disseminating a culture of integrity and legality, the Italian National Anti-Corruption Authority (ANAC), provided a set of directives over time that specifies key actors and procedures, drafting methods, and fundamental principles that the Code must contain.

In this framework, public research institutes are no exception. At the National Institute of Geophysics and Volcanology of Italy (INGV) an interdisciplinary working group with diverse experiences and profiles has been created and committed to reviewing the current code of conduct and proposing a new one.

The drafting process progressed through a thorough examination of fundamental principles and compliance with laws, on the one hand, and with an in-depth analysis of areas of application in the context of the institute and its activities. 

Once drafted, the first version has been proposed for provisional approval by the Board of Administrators (CdA), and submitted for stakeholder consultation.  INGV personnel commented on the first version, expressed their concerns, and proposed various amendments. These comments have all been addressed, partially or completely accepted, or refused; an updated version has been created and submitted for a further round of approval by the Independent Evaluation Body (OIV), a body assessing the performance, clearness, and integrity of the administrative action.

The values on which the Code is structured refer to four geoethical domains: 1) the individual dimension, which concerns the ethical action of each individual recipient of the Code in the context of his/her specific work activity; 2) the interpersonal/professional dimension, which refers to relationships with colleagues; 3) the societal dimension, which includes relations with all the various components of society; and d) the relationship with the natural environment, which includes actions aimed at minimizing negative impacts on ecosystems and promoting eco-sustainable behaviors. Moreover, the code benefits from the principles expressed in the European Code of Conduct for Research Integrity and the European Charter for Researchers.

At present, the Code contains both ethical and legal norms, i.e. both principles underpinning appropriate behaviors and rules, which if violated give rise to sanctions.  Code recipients are called to observe them in order to ensure workplace well-being, quality of research and services, prevention of corruption phenomena, compliance with the constitutional duties of diligence, loyalty, impartiality, care of the public interest, and achievement of INGV institutional goals. The Code will be updated according to the structure of a new General Code of Conduct to be issued by the Italian Government.

How to cite: Rubbia, G., Bravi, D., De Paola, V., Gurrieri, S., Intini, M. V., and Peppoloni, S.: The evolving Code of Conduct at the National Institute of Geophysics and Volcanology of Italy: a participatory process to combine law compliance and geoethics principles, EGU General Assembly 2023, Vienna, Austria, 23–28 Apr 2023, EGU23-7063, https://doi.org/10.5194/egusphere-egu23-7063, 2023.

EGU23-7377 | Posters on site | EOS4.1

For a sustainable future: a survey about geoethics and 2030 Agenda among the Italian geosciences community 

Elena Egidio, Andrea Gerbaudo, Manuela Lasagna, Francesca Lozar, and Marco Davide Tonon

The annual Congress of the Società Geologica Italiana (SGI) and Società Italiana di MIneralogia e Petrologia (SIMP), held in Turin in September 2022 and dedicated to Geosciences for a sustainable future, has been the occasion to critically think on the role of the Geosciences for our society and planet, on the position geoscientists deserve and the role they must take in the formation of citizens, protection from natural hazards and preservation of cultural and natural heritage. In continuation of our previously published work Are we ready for a sustainable development? A survey among young geoscientists in Italy , the present study broadens the sample analyzed to include the entire Italian community of geoscientists and aims to highlight: 1) The relevance of the ethical aspects connected to the work of professionals and scholars, in accordance with the values of geoethics; 2) the most widely held views about the connections between the Earth Sciences and the 17 Sustainable Development Goals of the UN 2030 Agenda; 3) which initiatives have been put in place by Italian Earth Sciences departments on education for sustainability and which can be the best strategies for developing sustainability education related to geoscience issues. Based on 230 answers to a questionnaire with open and closed questions sent to the participants at the Congress, the results show that the Italian geocommunity has great awareness of the ethical implications of its work and research, in particular of the responsibility towards the environment; despite this consciousness, the average level of knowledge about the 2030 Agenda and its goals is still scarce. To fill this gap, the need for sustainability education initiatives in departments is recognized as urgent, as well as the use of inter- and transdisciplinary educational approaches that can train scholars and professionals capable of addressing the complex challenges of our time.

How to cite: Egidio, E., Gerbaudo, A., Lasagna, M., Lozar, F., and Tonon, M. D.: For a sustainable future: a survey about geoethics and 2030 Agenda among the Italian geosciences community, EGU General Assembly 2023, Vienna, Austria, 23–28 Apr 2023, EGU23-7377, https://doi.org/10.5194/egusphere-egu23-7377, 2023.

This communication aims at presenting how transitions are being made at different organizational scales at INRAE (French National Research Institute for Agriculture, Food and Environment): (1) at the scale of a research lab through the perspective of a sustainable development contact person, (2) at the scale of a regional research centre through the perspective of the sustainable development regional manager, and (3) at the national and institutional level with the view of the sustainable development director of INRAE. The overall institutional context is first introduced to further develop viewpoints of the three persons involved on the on-going transitions, the strengths of the implemented approach, but also the points of attention. This communication aims at triggering exchanges on how to make sustainable development reach all organizational levels while ensuring a global coherence, and notably across all professions including administration staff, scientists, engineers, etc.

How to cite: Gauthier, L., Vidal, J.-P., and Carnet, A.: How to make a sustainable development approach successful across all scales of a research institute? Crossed views at INRAE, EGU General Assembly 2023, Vienna, Austria, 23–28 Apr 2023, EGU23-7600, https://doi.org/10.5194/egusphere-egu23-7600, 2023.

EGU23-7601 | Orals | EOS4.1

Reducing environmental impact at NERSC (Bergen, Norway). 

Julien Brajard and Christine Due Sivertsen

NERSC is a non-profit research foundation established in Bergen (Norway) in 1986. Besides cutting-edge research in climate science, the NERSC has for a long time been very attentive to the working conditions, diversity, inclusion, and environmental impact of its activities.

In this poster, we will present the different efforts taken at the NERSC initiative to take the path of reducing its environmental impact, especially the GHG footprint, of its activities. We have divided the analysis into big compartments including the travels, the numerical computations, the field campaigns, and the premises. For each compartment, we are in the process to assess the GHG emissions, and some actions have already been taken to already minimize the impacts, for example, a travel policy, and opportunity campaigns.

In addition to the details of the work done by NERSC for reducing GHG emissions, we will reflect on challenges and problems encountered while taking those actions, some being general to the scientific or geoscience field (e.g., travel injunction), others being specific to NERSC (fundings, geographic location, low-carbon electricity).

Finally, we will draw perspective to the experience, and try to bring recommendations into the debate, such as a better inclusion of climate impact in the European research calls.

How to cite: Brajard, J. and Sivertsen, C. D.: Reducing environmental impact at NERSC (Bergen, Norway)., EGU General Assembly 2023, Vienna, Austria, 23–28 Apr 2023, EGU23-7601, https://doi.org/10.5194/egusphere-egu23-7601, 2023.

EGU23-7612 | ECS | Orals | EOS4.1

My earth in 180 minutes: A transition support system for reducing the carbon footprint in Academia. Experimental design for evaluating its impact on academic practices 

Claudia Teran-Escobar, Nicolas Becu, Nicolas Champollion, Nicolas Gratiot, Benoit Hingray, Géremy Panthou, and Isabelle Ruin

Some practices embedded in academic culture (international conferences, scientific instruments...) are  important sources of greenhouse gases (e.g., van Ewijk & Hoekman, 2021). Although the scientific community have started to propose ways to reduce the impact of international conferences (e.g., Warner et al., 2022), collective efforts should be pursued to reduce the carbon footprint of the entire academic world. Serious games have been used in the encourage climate change attenuation practices (Fernández Galeote et al., 2021). Nevertheless, to our knowledge, the deployed evaluations have only measured the changes on knowledge and not on actual practices.

My Earth in 180 Minutes (ME180, https://materre.osug.fr/) is a collaborative role-playing game aiming at raising awareness, stimulating interactions in groups and constructing scenarios of professional carbon footprint reductions with multiple stakeholders. The game sessions place staff (researchers, technical and administrative staff, etc.) in a situation of social interaction in which each person plays two characters (inspired from real life observations) of a research team needing to reduce its carbon footprint by 50%. The game allows to build scenarios to reproduce as much as possible the complexity of interactions and the level of inequality existing within academic world. With 85 games played between November 2020 and June 2021, My Earth in 180 Minutes collaborative workshop has shown robust results, in particular Academia’s capacity to reduce its own carbon footprint and propose concrete alternatives: video communication, mutualization and reduction of professional activities (Gratiot et al., 2022).

This communication will describe the methods designed to a) evaluate the effectiveness of the serious game “My Earth in 180 Minutes” in academic practices and b) investigate the factors (e.g., career status, family engagements) that enable or constrain changes in academic practices.

The protocol for a future study is described. Participants working in French research centres (N = 970) will be recruited and randomly split in two groups: a) a group who will participate to the ME180 workshop, or b) control group using another approach for discussing about Academic carbon footprint. Participants will complete online surveys about their professional practices (air travelling, commuting ...) and about the psychological, institutional and, sociodemographic factors related to these practices (intention towards reducing professional air travelling, number of children). The surveys will be repeated six times over the 2 years of the study: before the experiment, one, 6, 12, 18 and 24 months after the beginning of the study. Data will be analysed by using mixed linear methods.

We expect that carbon footprint reduction and related practices would be more important in the ME180 group. Mediation and moderation analysis will be used to identify psychological, institutional and, sociodemographic factors (career status, intention to change practices) that may facilitate or block the transition of professional practices.

The previous deployments of “My earth in 180 minutes” help in identifying Academic transition paths (Gratiot et al., in revision). The present study will allow to assess the effects of ME180 in Academic carbon footprint reduction to provide insights about the obstacles and levers of carbon footprint reduction in academia.

How to cite: Teran-Escobar, C., Becu, N., Champollion, N., Gratiot, N., Hingray, B., Panthou, G., and Ruin, I.: My earth in 180 minutes: A transition support system for reducing the carbon footprint in Academia. Experimental design for evaluating its impact on academic practices, EGU General Assembly 2023, Vienna, Austria, 23–28 Apr 2023, EGU23-7612, https://doi.org/10.5194/egusphere-egu23-7612, 2023.

EGU23-8072 | Orals | EOS4.1 | Highlight

Hydrogeoethical questions related to urban groundwater management: the case of Kabul city, Afghanistan 

Mohammad Salem Hussaini, Asadullah Farahmand, and Manuel Abrunhosa

Groundwater resources are largely invisible and unknown to most people. Hence, unauthorized appropriation of groundwater is not obvious, and its impacts are less evident. It can be said that it is an invisible geo-resource but its impacts and problems are visible to mankind, even if often its source is not recognized. Kabul, the capital of Afghanistan, is the fifth fastest-growing city in the world and rapid population growth and urbanization have created huge pressure on groundwater resources. As a result of a lack of surface water storage and the seasonal variability of river flows, Kabul is among the world's most water-stressed cities as it depends almost entirely on groundwater. The findings of scientific studies reveal that extensive groundwater depletion and degradation of groundwater quality in Kabul city is largely due to anthropogenic factors and it is likely to rapidly continue in the future, particularly in densely populated areas of the city. Here, ethics can play an important role because human behavior is among the main factors creating the problems. So, hydrogeoethical concepts can be assessed and discussed, especially for urban groundwater where human needs (social ethics) and environmental dynamics (environmental ethics) both should be respected. In this study, the most vital questions related to ethical aspects of groundwater management in Kabul city are extracted. To achieve the questions, the water ethics principles and ethical criteria were evaluated concerning the condition of groundwater and the society of Kabul city, as an exercise of applied hydrogeoethics. Finally, six questions are obtained as the result of this study. The response to these critical questions could be a key to solving many dilemmas related to groundwater management in an urban concept. It is recommended to groundwater managers and policymakers explore the answer to these questions and consider the findings in the policies, strategies, and regulations, particularly in urban regions.

The questions are as follows:

1) What is the level of contribution, obligation, responsibility, honesty, trust, and respect among geoscientists, and engineers related to groundwater management?

2) What kind of regulation is adequate for the management of over-abstraction urban groundwater; top-down or self-regulation or a mix of both?

3) How education and communication can shape moral motivation for city residents to better groundwater management?

4) What is the level of participation of public media (TV, radio, newspapers, etc.) in awareness-raising campaigns related to groundwater conditions?

5) Can groundwater abstraction from the deep aquifer (groundwater mining) be an ethical and sustainable policy concerning future generations and environmental ethics?

6) How consideration of gender equity and women's participation can be effective in the management of groundwater?

How to cite: Hussaini, M. S., Farahmand, A., and Abrunhosa, M.: Hydrogeoethical questions related to urban groundwater management: the case of Kabul city, Afghanistan, EGU General Assembly 2023, Vienna, Austria, 23–28 Apr 2023, EGU23-8072, https://doi.org/10.5194/egusphere-egu23-8072, 2023.

EGU23-8173 | ECS | Posters on site | EOS4.1 | Highlight

The specific responsibility of geoscientists in the midst the climate and ecological crises: a need to address personal and institutional dissonances 

Odin Marc, Elodie Duyck, Laurent Lassabatère, Iñigo Viton, and Marthe Wens

The climate and ecological crises question the role and responsibility of scientists and scientific institutions as producers and conveyers of knowledge. Decades of thorough reporting, efforts at communication towards policy makers, and strong-worded scientific warnings, have not yet lead to policy changes significant enough to reduce greenhouse gas emissions and halt environmental degradation. This questions whether geoscientists and scientific institutions should remain distanced from the political and societal implications of their research work, or if on the contrary they have a responsibility to lead by example and to use their position to press for urgent action on the climate and ecological crisis. 

We argue that the failure of governments and international institutions to address these crises at the appropriate scale gives scientists and scientific institutions a responsibility to be more than mere producers of knowledge.  Indeed, doing “science as usual” while warning of the ever growing urgency to act on the climate and ecological crisis risks is widening the already-existing dissonance between, on the one hand, our stated raison d’être and discourses and on the other hand, our everyday practice and institutional mechanisms ; effectively undermining our impact on the broader society.

We first discuss the issue of scientific institutions and the scientific community at large not yet leveling with the urgency to address the climate and ecological crises. A prominent example is that despite repeated campaigns for universities to severe ties with the fossil industry, most  are still accepting sponsoring and research funding from fossil companies, which contributes to the legitimization of companies that have been and are still actively opposing effective climate action. While some universities are taking initiatives to limit carbon intensive behavior such as flying, serve plant-based food as a standard, stop accepting polluting companies on campuses, or include climate education in all curriculums, these are still individual initiatives, dependent on the voluntary mobilization from student and staff.

 We then argue that we, as geoscientists, can not only lead by example with individual changes to our lives, but can also have a strong impact when engaging in collective action, pressing our universities and governments to enact strong climate and environmental policies. Public engagement of universities, of other scientific institutions, and of scientists can amplify and legitimize the voice of the climate and environmental movements in a mutually beneficial science-society approach, notably because the former produce the very scientific knowledge empowering these movements.  We propose to discuss recent examples, including from our own experience, of the impact of scientists engaging in demonstrations and civil disobedience as part of environmental groups, at the ethical level, but also regarding consequences within and outside of academic circles.

How to cite: Marc, O., Duyck, E., Lassabatère, L., Viton, I., and Wens, M.: The specific responsibility of geoscientists in the midst the climate and ecological crises: a need to address personal and institutional dissonances, EGU General Assembly 2023, Vienna, Austria, 23–28 Apr 2023, EGU23-8173, https://doi.org/10.5194/egusphere-egu23-8173, 2023.

EGU23-8259 | Posters on site | EOS4.1

Geoethics values clarification: A playable poster 

David Crookall and Pimnutcha Promduangsri

Values underlie geoethics and geoscience, especially climatology.  Can we understand or build geoethics without reference to values?  Are values and geoethics driven by beliefs, or should values remain unchanged despite changing beliefs?  Those are some of the questions that we may ask when considering ethics in life, in the geosciences and in climate change and action.  Values include honesty, compassion, quality, patience, objectivity, truth, respect, individualism, justice, power, peace and beauty.  How are these related to geoethics?  Often an ethical dilemma stems from two or more underlying value conflicts, such as individual identity and social value.  It is not easy to understand the principles and dynamics of such relations.

One way into this quagmire is by using a values clarification exercise or game (VCE or VCG).  A VCE can be a useful geoethics literacy tool to help people explore the complexities of such relationships, to allow them to express their own ideas, to confront their ideas with those of others and to gain a rich understanding of their own values that underlie geoethics.  Undorf and colleagues (eg, https://doi.org/10.5194/egusphere-egu22-12732, https://doi.org/10.1007/s10584-022-03435-7) have adopted a philosophical approach.  We take an easier approach, that of interactive, participatory gaming.

We have designed and used VCEs and VCGs in a variety of cultural and social settings and with encouraging results.  Our poster will outline our prior experience and allow you to participate, albeit superficially, in a VCE.  Please come to see us during the poster session, and be sure to bring along one or two friends so that you can play; three players is better than two.  Also bring some paper and a pen.

How to cite: Crookall, D. and Promduangsri, P.: Geoethics values clarification: A playable poster, EGU General Assembly 2023, Vienna, Austria, 23–28 Apr 2023, EGU23-8259, https://doi.org/10.5194/egusphere-egu23-8259, 2023.

EGU23-8402 | ECS | Orals | EOS4.1

The share of research infrastructure in comprehensive greenhouse gas budget for five French Earth and Space Science laboratories 

Odin Marc, Sylvain Biancamaria, Solene Derrien, François Gheusi, Jürgen Knödleser, Sylvain Kuppel, Marion Maisonobe, Arnaud Mialon, Pierrick Martin, Florian Pantillon, Luigi Tibaldo, and Florence Toublanc

To maintain global warming below 1.5°C the last IPCC report indicates global greenhouse gas (GHG) emissions should be reduced by 45% and 80% before 2030 and 2050, respectively, reaching an average of 2 tCO2e.pers-1.yr-1 on Earth. Although responsibilities vary, substantial reductions must be implemented across all aspects of society including academia. It can even be argued that, given its role in informing and alerting the public about climate and ecological change, the scientific community should have a leading role and demonstrate exemplarity in terms of reducing its environmental impact.

Here, we present a broad-scope GHG budget of five laboratories of the Observatoire Midi-Pyrénées in France, in 2019. The studied laboratories comprise 90 to 260 staff members each, with study fields encompassing the solid Earth and the environment, the superficial biosphere, oceanography and glaciology, atmospheric physics and chemistry, as well as astronomy and astrophysics.

To assess GHG emissions, we follow standard procedure (see Mariette et al., Environ. Res.: Infrastruct. Sustain., 2022) in which anyactivity data’ quantifying the usage of a given resource (e.g., in kWh of electricity, or km travelled by aircraft) is multiplied with an appropriate emission factor’ quantifying the unitary carbon footprint of the resource (e.g., electricity production or air-travel). The quantified budget thus includes infrastructures usage, professional travel and expenses and an estimation of the GHG footprint of research infrastructures, in particular scientific satellites. For the latter, we adapted the methodology of Knödleser et al. (Nature Astronomy, 2022), in which the GHG footprint is estimated based on the launch mass or cost of the mission and the share attributable to a given lab depends on the fraction of world author affiliated with the lab who have published articles referring to the satellite, as extracted from the Web of Science database.

We find that emissions related to the lab facilities (electricity, heating, air conditioning and waste) and to individual habits (commuting and lunch meals) both reach about 1 tCO2e.pers-1.yr-1. Unsurprisingly, professional trips significantly contribute to the overall budget (2-6 tCO2e.pers-1.yr-1) and are largely dominated by long-haul air travel. However, services and equipment equally contribute with more than 3-5 tCO2e.pers-1.yr-1. These numbers vary between the studied labs but higher (lower) values for services and equipment tends to compensate for lower (higher) values for professional trips. Furthermore, for three out of five laboratories observational data from research infrastructures represents the largest share of the emissions, with about 5-10 tCO2e.pers-1.yr-1. Although this last estimate is subject to large uncertainty and shows discrepancies between research fields, it suggests that current GHG budget should include at least a first order estimate of the footprint of research infrastructures and adapt reduction strategies accordingly.

How to cite: Marc, O., Biancamaria, S., Derrien, S., Gheusi, F., Knödleser, J., Kuppel, S., Maisonobe, M., Mialon, A., Martin, P., Pantillon, F., Tibaldo, L., and Toublanc, F.: The share of research infrastructure in comprehensive greenhouse gas budget for five French Earth and Space Science laboratories, EGU General Assembly 2023, Vienna, Austria, 23–28 Apr 2023, EGU23-8402, https://doi.org/10.5194/egusphere-egu23-8402, 2023.

EGU23-8683 | Orals | EOS4.1 | Highlight

The Knowledge Hub on Sea Level Rise and the science-based European Seas assessment reporting 

Nadia Pinardi, Bart van den Hurk, Jose A. Jimenez, Gundula Winter, Giulia Galluccio, Sandy Bisaro, Angelique Melet, Roderick van de Wal, Kristin Richter, Jan-Bart Calewaert, Bernd Bruegge, Lavinia G. Pomarico, Michael Depuydt, Thorsten Kiefer, and Petra Manderscheid

Nine European countries under the umbrella of the Joint Programming Initiatives on Climate (JPI Climate) and on Oceans (JPI Oceans) have set up a joint Knowledge Hub on Sea Level Rise. The ambition is to provide easy access to usable knowledge on regional-local sea level change in Europe, regularly updated as a series of periodic assessments. It will complement existing global and national assessments by providing additional geographical and contextual detail, tailored to regional, national and European policy development and implementation.

As its key product, it will deliver by the end of 2023 its first European Assessment Report on Sea level rise hazards and impacts, co-designed with European Sea stakeholders. The co-design framework is based on consultation workshops, questionnaires and a final Conference in Venice that enabled to discuss at large the regional and local end-user needs.

Based on the latest available science provided by  the IPCC AR6 WGI and II reports and using the most advanced knowledge on sea level rise from European services and research done at the national level, the Assessment report will allow to downscale to the European Seas the SLR impacts and devise adaptation strategies. We will present the user needs that were revealed by the stakeholder consultations and plan to provide a peek into the content of the first draft of this first Assessment Report.

How to cite: Pinardi, N., van den Hurk, B., Jimenez, J. A., Winter, G., Galluccio, G., Bisaro, S., Melet, A., van de Wal, R., Richter, K., Calewaert, J.-B., Bruegge, B., Pomarico, L. G., Depuydt, M., Kiefer, T., and Manderscheid, P.: The Knowledge Hub on Sea Level Rise and the science-based European Seas assessment reporting, EGU General Assembly 2023, Vienna, Austria, 23–28 Apr 2023, EGU23-8683, https://doi.org/10.5194/egusphere-egu23-8683, 2023.

Local climate change risk assessments and climate resilient adaptation are best supported by a quantitative integration of physical hazards, exposures and vulnerabilities that includes the characterization of uncertainties. However, it is challenging to take into account the complex information of climate change projections and uncertainties in participatory risk assessments with decision-makers. We propose to use Bayesian Networks (BNs) for this task. Bayesian Networks are a cutting-edge integrated modelling approach for combining qualitative and quantitative knowledge in uncertain and complex domains, such as climate change impacts on water. To quantify potential future hazards of climate change on water, it is state-of-the-art to rely on multi-model ensembles to integrate the uncertainties of both climate and impact modelling. At the same time, local expert knowledge needs to be integrated in local climate change risk assessments. We show how to integrate freely-available output of multiple global hydrological models into BNs, in order to probabilistically assess risks for water supply. To this end, a roadmap to set up BNs and apply probability distributions of risk levels under historic and future climate and water use in a participatory manner was co-developed with water experts from Spain and the Maghreb. Multi-model information on hydrological variables was computed by three global hydrological models driven by the output of four global climate models for four greenhouse gas emissions scenarios. The output of projected relative changes of hydrological hazards was pre-processed using MATLAB, taking into account local information on water availability and use, to set up the BN. Results show that the method is useful for probabilistically computing climate change impacts on water stress and to assess potential adaptation measures in a participative process with stakeholders and decision-makers. Local water experts positively evaluated the BN application for local climate change risk assessments. While requiring certain training, the presented approach is suitable for application in the many local risk assessments necessary to deliver efficient and successful climate resilient adaptation.

How to cite: Kneier, F., Woltersdorf, L., and Döll, P.: Participatory Bayesian Network modelling to assess climate change risks and adaptation regarding water supply: integrating multi-model ensemble hazard information and local expert knowledge, EGU General Assembly 2023, Vienna, Austria, 23–28 Apr 2023, EGU23-8861, https://doi.org/10.5194/egusphere-egu23-8861, 2023.

EGU23-8882 | Posters on site | EOS4.1

How to reduce the carbon footprint of Earth and Space Science? Potential strategies based on a comprehensive greenhouse gas budget for five French labs 

Florian Pantillon, Sylvain Kuppel, Sylvain Biancamaria, Solene Derrien, François Gheusi, Jürgen Knödlseder, Marion Maisonobe, Odin Marc, Arnaud Mialon, Pierrick Martin, Luigi Tibaldo, and Florence Toublanc

To maintain global warming below 1.5°C the last IPCC report indicates global greenhouse gas (GHG) emissions should be reduced by 45% and 80% before 2030 and 2050, respectively, reaching an average of 2tCO2e.pers-1.yr-1 on Earth. Recent estimates of the carbon footprint of universities and research centers accounting for indirect emissions often exceed 10tCO2e.pers-1.yr-1.

Here we find similar or higher values (10-30tCO2e.pers-1.yr-1) for the year 2019 for five research labs encompassing the solid Earth and the environment, the superficial biosphere, oceanography and glaciology, atmospheric physics and chemistry, and astronomy and astrophysics. These values are derived through a common procedure (see Mariette et al., 2022) in which any activity data quantifying the usage of a given resource (e.g., in kWh or km) is multiplied by an appropriate emission factor quantifying the unitary carbon footprint of the resource (e.g., electricity production or air travel). Our budget quantifies the share of emissions from local facilities (about 1tCO2e.pers-1.yr-1), lunch meals and commuting (about 1tCO2e.pers-1.yr-1), professional trips (2-6tCO2e.pers-1.yr-1), services and equipment (3-5tCO2e.pers-1.yr-1), and the use of observational data from research infrastructures, in particular scientific satellites (up to 10tCO2e.pers-1.yr-1; derived similarly to Knödlseder et al., 2022).

These numbers imply radical changes to make scientific activity sustainable and have strong implications on potential strategies to reduce GHG emissions. For example, a predominant discussion in the literature in the past years focused on avoiding air travel. However, in our case, shifting all national travels to train or halving the number of plane trips would reduce the total emissions by a fraction only. Similarly, any strategy targeting local building efficiency or individual habits will little influence the budget. In contrast, reducing or changing practice for services and equipment may have stronger impact but requires collective thinking, especially for research infrastructures that are planned and managed at national and international levels.

The sheer magnitude of our GHG emissions questions the degree of reduction that can be achieved without redirection of scientific activity. We present and discuss examples of changes such as shifting to interdisciplinary research including social sciences, focusing on archived data, relocating field work, or engaging more with students and society.

How to cite: Pantillon, F., Kuppel, S., Biancamaria, S., Derrien, S., Gheusi, F., Knödlseder, J., Maisonobe, M., Marc, O., Mialon, A., Martin, P., Tibaldo, L., and Toublanc, F.: How to reduce the carbon footprint of Earth and Space Science? Potential strategies based on a comprehensive greenhouse gas budget for five French labs, EGU General Assembly 2023, Vienna, Austria, 23–28 Apr 2023, EGU23-8882, https://doi.org/10.5194/egusphere-egu23-8882, 2023.

EGU23-9299 | ECS | Orals | EOS4.1

From informal to institutional science-society-policy interactions: Introducing a climate advisory board in Frankfurt, Germany 

Georg Sebastian Voelker, Ralf Becherer, Carmen Junge, and Thomas Seifert

Climate change may be the most severe crisis humanity has faced to date. Both the social and natural sciences have well understood the causes and effects of climate change as well as the possible mitigation and adaptation measures. However, implementations of both mitigation and adaptation measures generally fall behind the goals defined by the Paris agreement.

With increasing political awareness and progressing federal climate protection legislation in Germany communal politics is facing the challenge of charting explicit paths to net carbon neutrality. Due to diverse social and geographic settings as well as different existing infrastructures solutions have to be tailored to the local conditions. Local climate advisory panels are a common and if well constructed an effective way to support the local administration in the necessary transformation.

Here we report on the successful efforts lead by the local group of the Scientists for Future in Frankfurt, Germany, to aid the city hall in establishing a communal climate advisory panel. Early stakeholder communication, broad alliances with local climate protection initiatives and the shared experience of the Scientists for Future network were key to successfully establish an institutionalized science-society-policy interface to permanently support local climate action activities.

How to cite: Voelker, G. S., Becherer, R., Junge, C., and Seifert, T.: From informal to institutional science-society-policy interactions: Introducing a climate advisory board in Frankfurt, Germany, EGU General Assembly 2023, Vienna, Austria, 23–28 Apr 2023, EGU23-9299, https://doi.org/10.5194/egusphere-egu23-9299, 2023.

EGU23-10073 | Posters virtual | EOS4.1

Teaching Geosciences through practical activities to enhance global citizenship education in schools with a high dropout rate 

Ester Piegari, Giovanni Camanni, Daniela Flocco, Maurizio Milano, Nicola Mondillo, and Umberto Riccardi

Most students living in disadvantaged areas do not trust that their school education will have much bearing on their future and become disaffected from school as early as in lower secondary school.

We here report the results of teaching Geosciences through several practical activities carried out in suburban schools characterized by a high dropout rate. The lectures were given in the framework of the STEM project Next Land, which has the overarching goal of instilling interest towards scientific topics into young students and promoting the role of scientific education for sustainable development.

We propose a sequence of four laboratory activities on the subject of natural calamities (e.g. earthquakes and tsunamis), which are based on the use of both manual and IT skills.

The didactical experimentation has been conducted on 21 seventh-grade classes (age ~12) involving about 350 students from the area of Naples (Southern Italy). The final aim of the teaching is to test the potential of the Geosciences in generating attitudes and behaviours of solidarity and responsible global citizenship.

All the proposed activities try to make students aware that they are part of a connected global system, therefore through these lectures we attempt to help these young students to put in perspective their local reality in a larger one.

How to cite: Piegari, E., Camanni, G., Flocco, D., Milano, M., Mondillo, N., and Riccardi, U.: Teaching Geosciences through practical activities to enhance global citizenship education in schools with a high dropout rate, EGU General Assembly 2023, Vienna, Austria, 23–28 Apr 2023, EGU23-10073, https://doi.org/10.5194/egusphere-egu23-10073, 2023.

Existential and Global Catastrophic Risk, defined by Beard et al 2020 as risk that may result in the very worst catastrophes “encompassing human extinction, civilizational collapse and any major catastrophe commonly associated with these things.” As such, it has been the topic of work by many philosophers as we move into a world where humans have more and more power over the world around us.

However, geoscientists have typically neglected the study of these risks, and have in turn been neglected in the field of existential risk studies. I will discuss the ethical importance of reducing existential risk from a variety of different ethical frameworks, and how this links to the concepts in geoethics. I will then discuss some of the opportunities for geoscientists to contribute to the reduction of these risks, including some of the work that has been done by geoscientists to identify and reduce existential risk and increase civilisational resilience, as well as how methodological expertise of different geoscience disciplines can contribute to the growing corpus of theoretical work around existential risk.

How to cite: Futerman, G.: The Ethics and Role of Geoscientists in Existential Risk Studies, EGU General Assembly 2023, Vienna, Austria, 23–28 Apr 2023, EGU23-10097, https://doi.org/10.5194/egusphere-egu23-10097, 2023.

Minerals occupy a unique position as specimens yielding scientific information, objects with aesthetic and monetary value, and substances necessary for modern society. Aside from minerals in industrial use, a broad range of people are interested in minerals such as geologists, gemologists and jewelers, and people involved in minerals as collectors’ items including miners, dealers, private and institutional collectors, curators -- even art collectors and anthropologists. Traditionally, we have taken the extractive nature of these minerals for granted with little discussion of where and how they are obtained.

Adherence to legalities, disclosure of information, and personal and institutions responsibility are among ethical considerations. Legal considerations include how a mineral specimen is obtained in its initial extraction, its movement through opaque supply chains, export and import requirements, and ownership transfer. Disclosure issues range from curators and institutions maintaining and relaying accurate information about a mineral’s authenticity, sourcing, and history. What ethical responsibilities do individuals and institutions possess to ensure acquisition policies that address these issues? And, finally, as mineral extraction becomes a more pressing issue in the world’s move from a fossil-fuel economy, where does ethics lie in educating the public in the role minerals play in the environment and society?

Some of these questions raise issues which, in their complexity, have no apparent or easy solution. This paper presents the results of a literature survey on ethics of mineral specimens and raises questions for geoscientists.

How to cite: Eriksson, S.: Things we just don't talk about:  ethics in mineral collection, EGU General Assembly 2023, Vienna, Austria, 23–28 Apr 2023, EGU23-10191, https://doi.org/10.5194/egusphere-egu23-10191, 2023.

EGU23-10946 | Posters on site | EOS4.1

Research in Volcanology: where, when, and by whom? A global bibliometric analysis 

Susanna F. Jenkins, Geoffrey A. Lerner, George T. Williams, Elinor S. Meredith, and Jenni Barclay

The global and transdisciplinary nature of volcanology means that research takes place across institutions in a wide variety of locations around the world. The concentration of volcanic activity within certain regions means that researchers frequently conduct research outside their own borders. Collaboration between international and local researchers has the potential to produce mutual benefit and improve research. For local scientists, international collaboration can provide niche expertise that may not be currently available in the region where the volcano is located, in addition to resources, analyses, or equipment. For international researchers, in addition to different scientific perspectives, collaboration with local scientists can provide vital knowledge of local and regional information, access to field sites, and greater research relevance to the communities and organizations the research is often intended to benefit.

Despite these noted benefits, there is often a lack of inclusivity of local scientists in international research. In this study we use a bibliometric approach to understand who is doing and leading volcanic research, and in which countries the research is taking place. We assessed the metadata of ~24,000 volcanological works from 1901-2021 with 768 volcanoes identified across 68 countries. Our evaluation of affiliations shows that 40% of articles that name a volcano do not include any authors affiliated with the volcano’s country. We also look at case studies of island territories to explore to what extent local scientists are involved in doing research compared to the mainland or foreign countries. We find that only 23% of studies on volcanoes located on island territories have an author affiliated with the territory. Our assessment of bibliometric data provides insights and support for ongoing conversations on the inclusiveness of international research, both spatially and temporally, and can be used to identify geographical areas for improvement, as well as trends in inclusion and leadership.

How to cite: Jenkins, S. F., Lerner, G. A., Williams, G. T., Meredith, E. S., and Barclay, J.: Research in Volcanology: where, when, and by whom? A global bibliometric analysis, EGU General Assembly 2023, Vienna, Austria, 23–28 Apr 2023, EGU23-10946, https://doi.org/10.5194/egusphere-egu23-10946, 2023.

EGU23-11580 | Orals | EOS4.1

Geoethics: hammering out an interdisciplinary conversation 

Bethany Fox, Kate Dawson, Vicki Trowler, Sophie Briggs, Ruth Massey, Alexandra Fitzsimmons, Tania Marshall, Christina Riesselman, and Anna Davidson

Geoethics is not just a matter of geoscience, but involves complex transdisciplinary concerns with social, economic and cultural implications. Because of this, both geoethicists within geosciences and those working in social sciences and humanities are increasingly calling for dialogue across disciplinary silos. Drawing from our work on the British Academy funded interdisciplinary project, ‘Mining for Meaning: the Geoethics of Extractive Industries,’ we trace out what an interdisciplinary engagement with Geoethics might look like. As an earthly ethics that necessarily stretches beyond geological considerations to consider the socio-natural, cultural-spiritual and political-economic, any engagement with Geoethics demands conversations that bring geoscientific understandings into more explicit dialogue with ideas from the social sciences and the geohumanities (though not exclusively). Acknowledging the very real challenges of doing interdisciplinary work - from distinct understandings about research, knowledge and results, to disciplinary-specific technical terminology - we set out the core ideas underpinning Geoethical approaches in these domains. This lays important groundwork for crafting meaningful and indeed ethical conversations that stretch across these disciplines, but crucially, avoids the mining of other disciplines for useful concepts and metaphors, without due regard for their context, history and technical meaning – a form of disciplinary extractivism in itself. Animated by this anti-extractivism, the paper presents a reading of how the earth, ethics, knowledge and practices are understood from within the geosciences, social sciences and geohumanities respectively, charting out what we hope to be a useful frame of reference for working across these disciplines. We then use this analysis as the bedrock for discussing the potential of cross-disciplinary conversation. By critically responding to the relative strengths, limitations and offerings of each discipline’s conceptualisation of geoethics, we bring to the fore important interdisciplinary frictions, overlaps and potential collaborative directions. Taken together, we suggest that this two-part analysis offers scope for crafting meaningful conversations necessary for an interdisciplinary Geoethics. 

How to cite: Fox, B., Dawson, K., Trowler, V., Briggs, S., Massey, R., Fitzsimmons, A., Marshall, T., Riesselman, C., and Davidson, A.: Geoethics: hammering out an interdisciplinary conversation, EGU General Assembly 2023, Vienna, Austria, 23–28 Apr 2023, EGU23-11580, https://doi.org/10.5194/egusphere-egu23-11580, 2023.

EGU23-11656 | Orals | EOS4.1

Traveling for academic research : patterns, determinants and mitigation options 

Olivier Aumont, Tamara Ben Ari, Jérôme Mariette, Laurent Jeanneau, Aymeric Spiga, Gaelle Lefort, Philippe-e Roche, Alexandre Santerne, and André Estevez-Torres

In the midst of climate change, academic travels - one salient aspect of the carbon footprint of research activities - are at the center of a growing concern. Mitigation options often focus on two dimensions : (i) decreasing the frequency of attendance to conferences and (ii) modal shift in transport. Here, we analyze professional travel in academia from a unique database compiling about 100 000 travels from about 150 research labs across a large array of disciplines and localities in France to detail the structure, patterns and heterogeneity of national and international research travels for research purposes. We estimate the mitigation potential of a series of options encompassing but not limited to institutional options. We show that, if short distance traveling (typically below 1000 km) are largely dominant in number, their relative mitigation potential via modal shift is small (i.e., below 15%). On the other hand, long distance traveling, which is often associated with international collaborations or field work hold a much larger mitigation potential but question the very nature of research activities. We propose ambitious sobriety options to robustly decrease travel-induced GHG emissions in academia and discuss their acceptability in the context of the French public research system.

How to cite: Aumont, O., Ben Ari, T., Mariette, J., Jeanneau, L., Spiga, A., Lefort, G., Roche, P.-E., Santerne, A., and Estevez-Torres, A.: Traveling for academic research : patterns, determinants and mitigation options, EGU General Assembly 2023, Vienna, Austria, 23–28 Apr 2023, EGU23-11656, https://doi.org/10.5194/egusphere-egu23-11656, 2023.

EGU23-12019 | ECS | Posters on site | EOS4.1

Development of a Web Based Decision Support System to Provide Relevant Climate Indicators for Climate Change Adaption 

Lorenz König, Mike Teucher, Katrin Ziegler, Daniel Abel, Torsten Weber, Heiko Paeth, and Christopher Conrad

The African continent faces various challenges and numerous risks due to current and future climate change. To strengthen the resilience of West African societies in the sectors of agriculture, food security, water and risk management, adaption measures need to be implemented in time. In the WASCAL-LANDSURF project, an earth system model for West Africa is developed to enable high-resolution regional climate change information. The obtained data must be accessible to the public so that interested stakeholders and smallholders can incorporate them into their decision-making processes.
To realize this, a web based spatial decision support system (SDSS) is developed with state-of-the-art open-source technologies to give information on climate change as well as relevant cross-sector indicators. For successful co-development, stakeholder workshops were held to identify important key functionalities and indicators that need to be implemented. The SDSS will be multilingual and easy to use to ensure an extensive range of applications. Users will have the possibility to familiarize themselves with the Web Portal by means of different guides in order to ease the entry into the SDSS. The current prototype supports map and diagram visualization and selection of various indicators and climate data, as well as query functionalities for different West African regions. Many other functionalities, such as the possibility to download data and statistical outputs of selected indicators, will be integrated soon. The final web portal will give users the opportunity to include climate indices in a simple and clear way into their decision-making process to strengthen their resilience towards climate change.

How to cite: König, L., Teucher, M., Ziegler, K., Abel, D., Weber, T., Paeth, H., and Conrad, C.: Development of a Web Based Decision Support System to Provide Relevant Climate Indicators for Climate Change Adaption, EGU General Assembly 2023, Vienna, Austria, 23–28 Apr 2023, EGU23-12019, https://doi.org/10.5194/egusphere-egu23-12019, 2023.

EGU23-12106 | Orals | EOS4.1

Taking Stock of Greenhouse Gas Emissions in the Geosciences: an Example from GFZ Potsdam 

Christoph Sens-Schönfelder, Friedhelm von Blanckenburg, and Knut Kaiser

The basis of all serious efforts to reduce greenhouse gas emissions is an inventory of the emissions caused by the various activities of an organisation. The Greenhouse Gas Protocol provides the guideline for establishing such an inventory. The German Research Centre of Geosciences GFZ Potsdam used these guidelines to estimate its greenhouse gas emissions for 2019. Besides the estimation of quantities (e.g. travel distances or hotel nights) which is an administrative challenge, the specific emissions per unit of quantity -- the Global Warming Potential -- play a crucial role. Unequivocal accounting of emissions from construction work is another task of great complexity.  A compilation and standardisation of these values within the research community would greatly simplify the compilation of GHG inventories and help to improve their comparability. Controversy inevitably will arise regarding the design of mitigating measures, like purchase of electricity and heat from renewable sources (which generates extra costs) the compensation of emissions (of which the effectiveness is contested), and even to shifting scientific activities away from those with high greenhouse gas footprints (which may conflict with scientific needs). Building awareness for emissions caused by academic activities and careful communication of mitigation options comprise the first necessary steps en route to low (or net-zero)-emission science.

How to cite: Sens-Schönfelder, C., von Blanckenburg, F., and Kaiser, K.: Taking Stock of Greenhouse Gas Emissions in the Geosciences: an Example from GFZ Potsdam, EGU General Assembly 2023, Vienna, Austria, 23–28 Apr 2023, EGU23-12106, https://doi.org/10.5194/egusphere-egu23-12106, 2023.

EGU23-12452 | ECS | Orals | EOS4.1 | Highlight

The ethics of volcano geoengineering 

Lara Mani, Mike Cassidy, and Anders Sandberg

Volcano engineering is the practice of altering the state of volcanic systems and/or volcanic eruptions to exploit them or mitigate their risk. Past and current examples of volcano engineering are limited but include drilling crater walls to drain volcanic lakes, channeling and bombing lava flows, siphoning off CO2 rich volcanic lakes, and cooling lava flows with seawater. There have also been several incidental examples of drilling into magma reservoirs in search for geothermal resources in Hawaii, Iceland, and Kenya. While not causing anything more damaging than the loss of drill bits or forcing the use of alternative holes, this demonstrates that humans are increasingly able to reach volcanic plumbing systems. As the pursuit of high temperature and enhanced geothermal energy increases as the world strives for renewable energy and critical metal resources, it is also likely that such contacts will become more common. We must accept, therefore, that despite the controversial nature of this topic, geoengineering of volcanic systems is an inevitable consequence of such exploration in the coming century. Since we possess the technological and engineering potential to perturb volcanic systems, the question we ask here is, should we? Do we have the scientific knowledge to do so? What are the potential benefits to future humanity? And, what are the ways it could do more harm than good? We highlight that while volcano geoengineering has significant potential benefits, the risks and uncertainties are too great to justify its use in the short term. Even if we do not decide to conduct volcano geoengineering, we believe there is a strong ethical case to support research into the efficacy and safety of volcano geoengineering going forwards. In this work, we lay out a series of protocols and practices based on the ethical arguments to be followed should humanity decide to conduct volcano geoengineering in the future.

How to cite: Mani, L., Cassidy, M., and Sandberg, A.: The ethics of volcano geoengineering, EGU General Assembly 2023, Vienna, Austria, 23–28 Apr 2023, EGU23-12452, https://doi.org/10.5194/egusphere-egu23-12452, 2023.

EGU23-13681 | ECS | Orals | EOS4.1

Engaging stakeholders for the co-creation of Climate Services. Beyond ERA4CS INDECIS project  

Jon Xavier Olano Pozo, Anna Boqué Ciurana, and Enric Aguilar

INDECIS (Integrated approach for the development across Europe of user-oriented climate indicators for GFCS high-priority sectors: agriculture, disaster risk reduction, energy, health, water, and tourism) was a project part ERA4CS, an ERA-NET initiated by JPI Climate, and funded by FORMAS (SE), DLR (DE), BMWFW (AT), IFD (DK), MINECO (ES), ANR (FR) with co-funding by the European Union Grant 690462). INDECIS main produced different outcomes, such as software packages, improved datasets and a large number of scientific papers (see www.indecis.eu). 


Even though INDECIS formally ended in July 2021, the knowledge gained continues to pay off. This communication will synthetically show how we took advantage of the methodology for the engagement of stakeholders developed in INDECIS (Font et al. 2021). The co-creation methodology developed in the frame of INDECIS has served as a starting point for the development of further research, transfer, and empowerment actions of stakeholders for decision-making related to climate change in four main axes: in research, in leading international research and transfer projects in collaboration with industry, in local projects developed in partnership with industry, users and administration and, knowledge transference to high schools, bachelor degree and technical training to professionals. 


The research has continued through a doctoral dissertation based on co-creating a climate service for surfing (see Boqué Ciurana, 2022). It is also continued by developing more indices for tourism and tourism sites to face climate change effects through mitigation measures in the TURLIT-ODS project (see: http://turlit.eu). This project is a local scale project where with users, private actors, and administration, we try to define the optimal conditions to develop sport water activities in Calafell, Costa Daurada, Spain. 


With the industry, in collaboration with a private organization, we engage stakeholders in the infrastructure sector to co-define climate risk indices to manage risk and investments. In this project, through co-creation workshops developed with local agents from both the company (technical) and the administration and other sectorial actors, indices are being computed to assess the climate risk of mobility infrastructures (railways and highways). 


The co-creation methodology has been adapted to develop high school co-creation processes to empower young people with tools to fight climate change and misinformation (see EMPOCLIM project: http://www.empoclim.cat ). In the same way, the Geography, Sustainability, and Territorial Analysis bachelor at the Rovira i Virgili University, offers a subject (6 ECTS) to develop essential skills and competences for developing climate services based on the engagement of local stakeholders and co-creation. 


Last but not least. Updating the quality control and data homogenization software has allowed the development of training for NMHs in Colombia, Peru, and Chile in the frame of the ENANDES project. In this training, we added lectures and practices to capacity-building staff in co-creating climate services with local users. 


How to cite: Olano Pozo, J. X., Boqué Ciurana, A., and Aguilar, E.: Engaging stakeholders for the co-creation of Climate Services. Beyond ERA4CS INDECIS project , EGU General Assembly 2023, Vienna, Austria, 23–28 Apr 2023, EGU23-13681, https://doi.org/10.5194/egusphere-egu23-13681, 2023.

EGU23-13694 | Orals | EOS4.1

Reducing the carbon footprint of a public research laboratory in Geosciences. Assessing a reduction strategy built with laboratory members after a 3-year experimentation 

Thierry Pellarin, Nicolas Champollion, Nicolas Gratiot, Claudia Teran-Escobar, Isabelle Ruin, Geremy Panthou, Benoit Hingray, Gilles Delaygue, Eliot Jager, Alexis Lamothe, Guillaume Piton, Guillaume Evin, Juliette Blanchet, Nathalie Philippon, Armelle Philip, Patricia Martinerie, and Ghislain Picard

The Institute of Environmental Geosciences (IGE) is a public research laboratory in Earth and Environmental Sciences with a staff of about 300 people, which conducts research on climate, the anthropisation of our planet and environmental risks, combining glaciology, hydrology, oceanography, mechanics, atmospheric sciences and human sciences. An important part of its activity consists of field experiments in remote sites (Antarctica, Asia, South America, Africa), numerical simulations using significant computer resources (several million CPU hours/year), using expensive and sometimes energy intensive scientific equipment (e.g. 170 m² of cold rooms).

In 2019, the laboratory collectively decided to adopt a strategy to reduce its Carbon Footprint (CFP) by 7% per year in order to achieve a 50% reduction by 2030 and thus to comply with the objectives of the Paris Agreement. The first CFP budget (2018 and 2019, using the GES1point5 tool) showed a predominance of emissions from professional travels (~640 tCO2e out of 1850 tCO2e, i.e. 2.6 tCO2e/person). In this context, the strategy consisted in defining CO2 budgets for each of the 8 research teams of the IGE on the basis of the 2018/2019 emissions, imposing a 10% reduction per year from 2020. Given the pandemic in 2020 and 2021, the reduction targets for professional travel were easily achieved (-81% and -64%) and the reduction in 2022 was -39% compared to 2018/2019 instead of the targeted -27%.

For all emission items (commuting, professional travel, heating, electricity, digital computing, purchasing, refrigerants), the reduction was -45% in 2020, -30% in 2021 and -15% in 2022. To consider the evolution of the number of people in the laboratory (and in the teams), the mean individual CFP has been defined as the ratio between the CO2 emissions and the number of people in the laboratory. The IGE's mean individual CFP was 7.22 tCO2e/person in 2018/2019 and 5.45 tCO2e/person in 2022 (for a target of 6.0 tCO2/person). It should be 3.61 tCO2e/person in 2030.

The strategy (the long-term reduction trajectory and the team-based reduction objectives) is well received by the IGE laboratory staff, even if some staff are still reluctant to any form of reduction. To ease its implementation and check whether it is being kept, a bimonthly monitoring of the teams’ emissions and the mean personal CFP was set up. The IGE also proposes participation in awareness-raising tools (La Fresque du Climat, Ma Terre en 180'). Significant changes in travel habits have followed. For instance, out of the 30 members of the IGE who come to the EGU in Vienna each year, 90% came by plane and 10% by train (a 20-hour long journey) in 2018/2019, and this ratio was 25% by plane and 75% by train in 2022.

To achieve our objective, further actions need to be identified to reduce the "purchase" and "digital computing" emission posts. What will help is that the insulation of the buildings was initiated in 2022, and the cold rooms which emitted a very strong greenhouse gas (refrigerant gas R508b) were changed in 2022 for a model operating with CO2.

How to cite: Pellarin, T., Champollion, N., Gratiot, N., Teran-Escobar, C., Ruin, I., Panthou, G., Hingray, B., Delaygue, G., Jager, E., Lamothe, A., Piton, G., Evin, G., Blanchet, J., Philippon, N., Philip, A., Martinerie, P., and Picard, G.: Reducing the carbon footprint of a public research laboratory in Geosciences. Assessing a reduction strategy built with laboratory members after a 3-year experimentation, EGU General Assembly 2023, Vienna, Austria, 23–28 Apr 2023, EGU23-13694, https://doi.org/10.5194/egusphere-egu23-13694, 2023.

EGU23-13910 | Orals | EOS4.1 | Highlight

Social production of ignorance – the role for geoscientists in addressing “undone science” 

Fiona Johnson, Philippa Higgins, Martin Andersen, Kirsty Howey, Matthew Kearnes, Stuart Khan, and Greg Leslie

In this presentation we discuss the role of geoscientists and engineers in advocating for improved civic science that can minimise the impacts of industrial and mining activities on the environment and downstream communities, with a particular focus on water-related impacts. We argue that, if not carefully designed, data collection, analyses and communication by geoscientists does not always contribute to the wider public good because the issues that communities care about are not addressed – so called “undone science”. A case study, focusing on the environmental impacts of the McArthur River mine (MRM) in a remote part of the Northern Territory, Australia, is used to highlight key issues that should inform civic science and lead to better outcomes for communities and the environment.

Despite thousands of pages of “data” about the MRM project and its impacts, we argue that this project is an example of the social production of ignorance – because the knowledge of the communities most impacted by the mine’s activities is not improved by the reporting and impact assessments associated with the project. Based on a temporal synthesis of independent monitoring reports of the McArthur River Mine which covered the period from 2007 to 2018, we identify three main lessons for improving civic science. Firstly, without adequate baseline monitoring prior to development, data collection during a project cannot satisfactorily assess impacts of a development. Baseline data is particularly important when seasonal and interannual variability is high. Baseline and ongoing monitoring programs should be co-designed with the community, so that what matters to the community is monitored (e.g. culturally important sites, contamination in animal species relevant to the community). Secondly, geoscientists and engineers need to partner with social scientists and local community organisations to ensure that communities are effectively informed about the impacts of development, focusing on the impacts that matter to communities, not just the impacts that are conveniently measured. Finally regulatory processes need to be improved to ensure that problems identified by geoscientists and engineers are addressed.

How to cite: Johnson, F., Higgins, P., Andersen, M., Howey, K., Kearnes, M., Khan, S., and Leslie, G.: Social production of ignorance – the role for geoscientists in addressing “undone science”, EGU General Assembly 2023, Vienna, Austria, 23–28 Apr 2023, EGU23-13910, https://doi.org/10.5194/egusphere-egu23-13910, 2023.

EGU23-14085 | Posters virtual | EOS4.1

Carbon footprint and reduction initiatives in a French geosciences laboratory 

Laurent Jeanneau, Emilie Jardé, Anne-Laure Argentin, Annick Battais, Thomas Bernard, Alexandre Coche, Marion Fournereau, Frédérique Moreau, and Laure Guerit

The impact of our productivist societies on our environment is now clearly demonstrated. It is illustrated in particular by the alteration of biogeochemical flows, the erosion of biodiversity, the chemical pollution of environments, the anthropisation of soils, the alteration of the water cycle, the acidification of the oceans and climate change.

As higher education and research staff working at the interface between science and society, we are aware of the need for an environmental transition that can only be achieved by reducing our greenhouse gas emissions and our environmental impact. We do not believe that the content of our research justifies any form of exemption and are aware of the benefits of being exemplary. As a research lab, we are committed to participating in limiting the increase in the Earth's average temperature, ideally targeted at less than 1.5°C compared to the pre-industrial period. This objective requires achieving carbon neutrality by 2050.

From 2021 the Sustainable Development & Social Responsibility working group of the research laboratory “Géosciences Rennes” has been created (i) to determine the C footprint by using GES1.5 (Research Consortium labo1.5), (ii) to communicate and raising staff awareness of the climate emergency, (iii) to propose indicators for reducing the carbon footprint, (iv) to convey a message to the supervisory authorities to work on the various reduction items.

The calculated C footprint includes heating of buildings, electricity, purchase of goods and services, scientific missions and commutes. Between 2019 and 2021, the C footprint was 879, 520 and 708 T CO2eq, which corresponds to 5.8, 3.6 and 5.1 T CO2eq/person. The purchase of goods and services was the main item, representing 48 ± 8 % (mean ± SD) of the C footprint. Scientific missions represented 14 ± 9 % of the C footprint. Sanitary restrictions due to the covid pandemy induced a drastic decrease of the C footprint of scientific missions from 220 T CO2eq in 2019 to 43 T CO2eq in 2020.

Thanks to the GES1.5 toolkit, it is possible to identify the main emission items for a given laboratory and to design and quantify specific actions to collectively reduce the C footprint. These data were the corner stone of collaborative workshops to invent our low-carbon laboratory. This presentation will feature the data and the process of collective decision in “Géosciences Rennes” laboratory. These results highlight that achieving the European Union targets will require a rethinking of the way we do science. 

How to cite: Jeanneau, L., Jardé, E., Argentin, A.-L., Battais, A., Bernard, T., Coche, A., Fournereau, M., Moreau, F., and Guerit, L.: Carbon footprint and reduction initiatives in a French geosciences laboratory, EGU General Assembly 2023, Vienna, Austria, 23–28 Apr 2023, EGU23-14085, https://doi.org/10.5194/egusphere-egu23-14085, 2023.

EGU23-14481 | Orals | EOS4.1

Project VECTOR – researching challenges to mining in Europe through a robust ethics structure. 

Chris Stockey, Sarah Gordon, Rose Clarke, and Emily Lewis and the VECTOR Partnership

VECTOR (Vectors to Accessible Critical Raw Material Resources in Sedimentary Basins) is an EU Horizon and UKRI co-funded research project assessing the social, technical, and environmental challenges to mining critical raw materials in Europe. Our commitment to geoethics is informed by the diverse partnership’s research expertise and our social science research. We will incorporate these learnings into all subsequent research and outreach programmes to promote good practice. Our dedicated ethics structure ensures that we put this commitment into practice. This approach to project ethics is a first for a Horizon Europe project.

Plans for decarbonisation presented in the EU Green Deal include achieving Net Zero by 2050 and reducing net greenhouse gas emissions by at least 55% by 2030 (compared to 1990 levels). Meeting the supply of renewable energy needed to achieve these goals requires a sharp increase in production, and a more responsible use, of critical raw materials. Recycling alone cannot meet the projected demand. Sourcing raw materials from inside the EU, where suitable environmental, social, and political regulations could be implemented, may be instrumental in securing an ethical provision of metals. However, mineral projects face complex social, environmental, and technical challenges in the EU. VECTOR will explore these challenges through social- and geoscience research, integrating the results of both research streams into easy-to-understand resources.

The VECTOR consortium is committed to ensuring the highest level of ethical standards during the project, with respect to both conduct and outputs. To put this commitment into practice, the VECTOR consortium has appointed an Ethics Advisor, responsible for advising the project on ethical matters and Chairing an Independent Ethics Committee, which will bring subject matter expertise to ethical deliberations. The Ethics Advisor and the Independent Ethics Committee sit within an ethics governance framework that interacts with, but is independent of, the Project governance framework. This ensures that ethical matters arising during the course of the Project are considered by expert, neutral third parties who are not otherwise directly invested in the Project, and that their advice is given due weight in Project decision making processes and practically implemented. This approach is a first for a Horizon Europe project, and one we hope will set the bar for strong ethical project management across the Horizon universe.

This will also be informed by our social science research to understand how stakeholders balance the ethical, social, economic, political, and environmental consequences of sourcing critical raw materials. The aim is to understand how levels of social acceptance influence attitudes, decisions and policy acceptance. Insights gained from this will inform good practice standards in our other research and be used to develop outreach tools targeting all stakeholder groups, informing their future decision making. These include policy makers and the much-overlooked public, as well as continued professional development pathways for geoscientists.

Taken together, our ethics structure and social science research provide a robust geoethics framework that will evolve with our new understandings and inform our work to investigate a socio-environmentally sustainable supply of raw materials.

How to cite: Stockey, C., Gordon, S., Clarke, R., and Lewis, E. and the VECTOR Partnership: Project VECTOR – researching challenges to mining in Europe through a robust ethics structure., EGU General Assembly 2023, Vienna, Austria, 23–28 Apr 2023, EGU23-14481, https://doi.org/10.5194/egusphere-egu23-14481, 2023.

EGU23-14915 | ECS | Posters on site | EOS4.1

Is maximizing spatial resolution worth the computational cost? 

Yomna Eid and Edzer Pebesma

Link: https://docs.google.com/document/d/15788dfGPL5ehDaDsO7BsOKoGk3Bk7g2epKQ58HiYZVM/edit

The core of the modern data revolution is data centers: “the central nervous system of the 21st century,” [1] housing networking and storage equipment, and servers that enable services such as cloud computing. They consume increasing quantities of energy not only to run their operations, but also to cool down their servers. With advances in cloud computing and the growth of Internet services use, data centres are estimated to have the fastest growing carbon footprint from across the whole ICT sector.

Although the opportunities and risks of Big Data are often discussed in the geosciences, most of the literature and initiatives surprisingly neglect a crucial risk for sustainable development: the fact that the data revolution hampers sustainable development because of its environmental footprint. Therefore, the ability to quantify and project data centre energy use is a key energy and climate policy priority.

Remote sensing products present one of the highest storage-capacity demands, with imagery archives spanning petabytes. High- and very high-resolution remote sensing imagery has emerged as an important source of data for various geoscientific analysis, most of which are highly computationally taxing. With this trend in increasing spatial and temporal resolution, a crucial question remains - is the accuracy and overall quality of analysis results significantly impacted by substituting the standard high-resolution product with a less computationally-intensive, coarser-resolution one?

Emerging products such as the World Settlement Footprint [2] and Dynamic World [3] land use land cover maps, which are produced at very high temporal resolution (5 day) and spatial resolution (10 m). A generally accepted attitude is that developing products at higher resolutions is a legitimate scientific goal. However, the interest is often not which 10 m pixel changes land use and when exactly this happens, but rather how many pixels change land use over a larger area (a country, or basin) and over a larger time period (e.g. by year over a decade). For a few high resolution products we evaluate and report how such aggregated target quantities computed from lower spatial and temporal resolution data change the quality (accuracy) of the final product, and which resolutions still seem acceptable.

[1] Lucivero, F. Big Data, Big Waste? A Reflection on the Environmental Sustainability of Big Data Initiatives. Sci Eng Ethics 26, 1009–1030 (2020). https://doi.org/10.1007/s11948-019-00171-7

[2] Marconcini, M., Metz-Marconcini, A., Üreyen, S. et al. Outlining where humans live, the World Settlement Footprint 2015. Sci Data 7, 242 (2020). https://doi.org/10.1038/s41597-020-00580-5

[3] Brown, C.F., Brumby, S.P., Guzder-Williams, B. et al. Dynamic World, Near real-time global 10 m land use land cover mapping. Sci Data 9, 251 (2022). https://doi.org/10.1038/s41597-022-01307-4

How to cite: Eid, Y. and Pebesma, E.: Is maximizing spatial resolution worth the computational cost?, EGU General Assembly 2023, Vienna, Austria, 23–28 Apr 2023, EGU23-14915, https://doi.org/10.5194/egusphere-egu23-14915, 2023.

EGU23-15941 | Orals | EOS4.1 | Highlight

The UK Climate Resilience Programme (2019-2023) 

Suraje Dessai, Kate Lonsdale, Jason Lowe, Rachel Harcourt, and Peter Walton

Even with the successful implementation of the Paris agreement, a certain amount of climate change is now unavoidable over the next few decades and high warming levels by the end of the century cannot be ruled out. Therefore, urgent action is needed to build resilience and accelerate adaptation to climate variability and change. Informing the extensive range of actions needed to manage climate risks, reduce damage without exacerbating existing inequalities, and realise emerging opportunities, is a critical scientific and societal challenge. The UK has been at the forefront of climate adaptation policy with the Climate Change Act 2008 requiring the UK Government to conduct a five-yearly Climate Change Risk Assessment (CCRA) and National Adaptation Programme. Another important recent driver amongst UK organisations has been compliance with the Task Force on Climate-Related Financial Disclosures. The UK Climate Resilience (UKCR) Programme emerged as a response to these policy and societal needs. It aims to enhance the UK’s resilience to climate variability and change through frontier interdisciplinary research and innovation on climate risk, adaptation and services, working with stakeholders and end-users to ensure the research is useful and usable.

The UK Climate Resilience Programme, led by UK Research and Innovation and the UK Met Office and running from 2019 to 2023, has funded over 50 projects worth £19 million. It is part of the Strategic Priorities Fund initiative which provides research funding to develop strategically important research for the national government. Topics central to the programme’s research agenda have included improved characterisation and quantification of climate risks, enhanced understanding of the management of climate risks, and the development and delivery of climate services. Amongst its achievements, the programme has: developed a set of future UK socio-economic scenarios to be used alongside climate scenarios, delivered a step change in climate change risk assessment capability, and produced a roadmap for the development and implementation of UK climate services. It has funded arts and community based projects and pioneered an embedded researchers scheme in which the researcher collaborates with a host organisation to address their real world needs. The programme has also developed a more coherent community of climate resilience researchers and practitioners in the UK.

In this talk we will provide an overview of the programme, focusing on the nexus between UKCR–funded research, and UK policy and practice. For example, we will consider how the national CCRA process shaped the programme’s research agenda while at the same time the availability of research sets the parameters of risk assessments. We will also provide examples of co-production undertaken by researchers and practitioners and comment on what can be achieved in terms of societal resilience when there is collaboration on shared objectives. This programme is unique in dedicating significant time, funding and other resources to researching national resilience while working in close partnership with the national government. We anticipate that our learnings from this process will be of interest to other researchers, as well as policy makers and practitioners who work with researchers on climate resilience issues.

How to cite: Dessai, S., Lonsdale, K., Lowe, J., Harcourt, R., and Walton, P.: The UK Climate Resilience Programme (2019-2023), EGU General Assembly 2023, Vienna, Austria, 23–28 Apr 2023, EGU23-15941, https://doi.org/10.5194/egusphere-egu23-15941, 2023.

EGU23-15959 | Posters on site | EOS4.1 | Highlight

Changing the narrative: the hidden histories of British colonial mineral exploitation in Africa 

Dr Munira Raji, Dr Rebecca Williams, Dr Anya Lawrence, Dr Nicholas Evans, Professor Trevor Burnard, Dr M. Satish Kumar, Keely Mills, Steven Rogers, Catharine Souch, George Jameson, Jacqui Houghton, and Natasha Dowey

At the height of colonial Europe, during the late 18th century, many of the principles, theories, laws and practices that shape the (Western) academic discipline of Earth Science were established. However, during this imperial production of knowledge, there was little reference to or acknowledgement of any pre-existing geological knowledge. The legacy of colonialism is perpetuated through many modern Earth Science practices and education activities, and the influence of this legacy adds to the perception of Earth Science as a white, western-dominated subject and the erasure and dismissal of other geological knowledge. This project explores the unacknowledged local geological knowledge and labour upon which the foundational institutions of Earth Science are built and how this legacy creates modern-day exploitation, unethical behaviour and inequity in our discipline. 


We uncover some of the hidden histories of colonial mineral exploitation, including the role of British geologists and geological institutions in expanding colonial rule in Africa and how local geological knowledge and local guides underpinned the activities of the colonial geological surveys. British mineral exploitation in Africa started in the seventeenth century with a series of expeditions by pioneer British geologists and prospectors into South Africa's interior to make preliminary observations and geological surveys for minerals. More expeditions to other parts of Africa followed in the eighteenth century. During the late eighteenth century, many of the principles, theories, laws and practices that shaped the academic discipline of Earth Science were established in parallel to colonial expansion. The British Empire sustained a programme of exploratory geological surveys and activities directly linked with mapping the geological features to locate and discover economic mineral resources to fuel the British economy and industrialise the British Empire. Exploitable deposits of coal, copper, iron and limestone's essential smelting flux were vital for the long-term development of steamship lines, railways, and industry. 


At the end of the First World War, the British government promoted and intensified geological surveys in several British Empire territories – Uganda, Sierra Leone and Nigeria in 1918, Tanzania in 1925 and Kenya in 1933. Some pioneer British geologists were heralded for their pioneering work and credited with the discovery of economically significant minerals in Africa. Our archival investigation reveals many of these mineral resources were already used and mined locally and that local knowledge underpinned these resource 'discoveries' and local people were used as field assistants, guides, carriers, labourers, and camp guides. These pioneer geologists relied on the colonial structure to obtain information from natives central to fieldwork, mineral investigation, and discoveries. Still, history has omitted the contributions of the natives involved in these mineral discoveries and the acknowledgement of any local geological knowledge. Perhaps it is time to change the narrative from one of discovery to one of exploitation. As a discipline, by reckoning with the colonial legacy of our past, we can seek to normalise working with local knowledge and knowledge outside the boundaries of (western) Earth Science, leading to ethical,  equitable, interdisciplinary work, better preparing the discipline for current global challenges.

How to cite: Raji, D. M., Williams, D. R., Lawrence, D. A., Evans, D. N., Burnard, P. T., Kumar, D. M. S., Mills, K., Rogers, S., Souch, C., Jameson, G., Houghton, J., and Dowey, N.: Changing the narrative: the hidden histories of British colonial mineral exploitation in Africa, EGU General Assembly 2023, Vienna, Austria, 23–28 Apr 2023, EGU23-15959, https://doi.org/10.5194/egusphere-egu23-15959, 2023.

EGU23-16302 | Orals | EOS4.1 | Highlight

An Ethical Framework for Climate Intervention Research and Potential Scaling 

Billy Williams, Brooks Hanson, Raj Pandya, Janice LaChance, and Mark Shimamoto

Climate change is a global threat. As such, scientific and technology organizations and funders are increasingly devoting attention and resources to climate intervention research and, in some cases, already pursuing large-scale testing. Climate intervention measures include carbon dioxide removal and solar radiation management. The U.S. National Academy of Sciences and many other authoritative bodies have called for "a code of conduct" and governance structure to guide the research, potential scaling and possible deployment of these intervention measures.  This presentation will discuss a global initiative facilitated by AGU to help establish and gain support for an ethical framework to help guide such efforts, and to include various practical, ethical and governance considerations of potential climate intervention technologies to be considered before deciding potential scaled deployment of such measures – including climate justice considerations and representation.  Preliminary ethical framework modules and global engagement processes currently underway will be discussed.

How to cite: Williams, B., Hanson, B., Pandya, R., LaChance, J., and Shimamoto, M.: An Ethical Framework for Climate Intervention Research and Potential Scaling, EGU General Assembly 2023, Vienna, Austria, 23–28 Apr 2023, EGU23-16302, https://doi.org/10.5194/egusphere-egu23-16302, 2023.

EGU23-16734 | Orals | EOS4.1

Impact of the COVID19 crisis on changes in business travel and the associated carbon footprint. Case study of a French scientific research institute. 

Christophe Peugeot, Grolleau Dany, Play Caroline, Sultan Benjamin, Hernandez Valeria, Janicot Serge, and Tramblay Yves

The French National Research Institute for Sustainable Development (IRD) is a multidisciplinary academic organisation working in partnership with countries in the Mediterranean and intertropical zone. Through sustainability science, IRD is committed to achieving the Sustainable Development Goals. Because of its missions, the IRD has a particular footprint linked to the activities of its agents (2100 employees in 2020) and partners, who travel between France and the rest of the world.

The COVID19 health crisis has forced changes in work habits. This study aims to analyze the impact of these changes on carbon emissions. All business trips of IRD employees and partners in the period 2017-2022 were collected in an anonymized database (aboout 67,000 entries), which describes trips, mode of transportation, reasons for travel, and traveler status.

The annual number of trips dropped sharply during the health crisis, from an average of 14,000/year in 2017-2019 to less than 6,000 in 2022 (-60%). Associated carbon emissions dropped by 70%. Starting in 2021, the number of trips increased to about 90% of pre-covid levels in 2022. However, while the share of air travel in total travel has decreased slightly in 2022 compared to 2017-2019, the share of car travel has increased sharply over the past three years, at the expense of train travel, which remains less used than before COVID. On a finer scale, the share of each mode of transport (and therefore the associated footprint) differs markedly according to the regions in which the research teams work, depending on the type of activity and the modes of transport available (e.g. rail travel mainly in Europe, field campaigns mainly by car).

The analysis highlights that the few trips authorized in 2020 and 2021 were primarily for overseas field activities or mobilities, to and from France. These activities, which cannot be replaced by videoconferencing and which constitute the core of IRD's activity, have been prioritized. The widespread use of videoconferencing has reduced the need for travel, especially for meetings and conferences. This is likely accompanied by an increase in virtual meetings, the associated footprint of which is not assessed here.

Traveling less, using videoconferencing when possible, or pooling several objectives for a single trip are trends that seem to emerge from our analysis. It is interesting to note that they are consistent with the actions proposed by research teams engaged in footprint reduction strategies, as highlighted for example by the serious game "Ma Terre en 180'" or the national survey of the Labo1point5 group.

Our analysis, with only one year without travel restrictions (2022), must be consolidated over a longer period (at least 3 years) to assess the sustainability of practice changes and their impact on IRD's carbon footprint. These results will serve as guidelines to define the necessary actions to reduce the environmental footprint of IRD research activities.

How to cite: Peugeot, C., Dany, G., Caroline, P., Benjamin, S., Valeria, H., Serge, J., and Yves, T.: Impact of the COVID19 crisis on changes in business travel and the associated carbon footprint. Case study of a French scientific research institute., EGU General Assembly 2023, Vienna, Austria, 23–28 Apr 2023, EGU23-16734, https://doi.org/10.5194/egusphere-egu23-16734, 2023.

We desire to know out of different motivations. According to Aristotle, scientists can feel happy or eudaimon when they fulfill the final cause of humans, reasoning, by providing knowledge. Freud argued that infants start to learn in order to distinguish between conditions that cause them pain or pleasure. We want to increase chances of achieving desired outcomes and avoiding undesired outcomes of our decisions by understanding causalities between events and predicting future events. In Geoscientific contexts, we may want to understand nature in order to satisfy different desires such as physical and psychological comforts, ethical dignity and continuation of existence, which are inseparable from but also conflict often against each other. We seek optimal decisions by means of the Geoscientific knowledge amidst the conflicting desires and natural conditions that hamper the desires.

All formations in the universe and all our perceptions are impermanent. Buddhism views that the course of life in which one is born, ages, gets ill and dies is suffering, if one clings to satisfactions, existence or non-existence as they are impermanent. A human being is seen in Buddhism as an ever-changing flux comprised of body (rupa in Pali language), senses (vedana), perceptions (sanna), volitions (sankhara) and consciousness (vinnana), or the five aggregates (khandha). Lasting peacefulness can be experienced when one understands the impermanence of its five aggregates, or selflessness (sunnata), which is a goal of Buddhist practices.

From this Buddhist perspective, satisfactions of material needs provided by Geoscience do not last permanently. Geoscience may help humans satisfy their basic needs, but the standards of basic needs seem to be ever-growing, influenced often by materialism which overlooks spiritual sources of happiness and technocentric hopes for sustainability in the future. According to Buddhism, our experiences and actions (kamma) condition our perceptions, volitions and habits, and reifying them as constant or substantial leads us to assume that certain desires ‘ought’ to be met as basic living standards. However, such standards are subjective judgements that cannot be justified by factual propositions in ‘is’ forms.

It can be satisfying for scientists to perform their professional tasks of providing knowledge required for fulfilling the human needs. However, epistemic and aleatory uncertainties in Geoscience can frustrate their desire to know. Geoscientists may suffer from the frustration, if they cling to their tasks and desires, failing to see satisfactions as impermanent and uncertainties as natural processes.

It is important to note that Buddhism does not compel dogmatically ascetic life styles or nihilistic worldviews but suggests ways to cease suffering. The Threefold Training (ethics, mindfulness and wisdom), the practice methods of Buddhism, can be applied in pursuing Geoscience as opportunities to experience lasting peacefulness. Scientists can create peaceful conditions by helping others with their knowledge, and let go of their reification and desires through mindfulness and the Buddhist ontology. Studying human desires and providing honest information about uncertainties and physical boundaries of satisfying the desires would be also parts of the practice.

How to cite: Jung, H.: Buddhist thoughts on frustration of the desire the know in Geoscience, EGU General Assembly 2023, Vienna, Austria, 23–28 Apr 2023, EGU23-17116, https://doi.org/10.5194/egusphere-egu23-17116, 2023.

EGU23-17583 | Orals | EOS4.1

Inform international institutions for interdisciplinary development strategies linking nutrition enhancement and climate change adaptation 

Giulia Galluccio, Chiara Trozzo, Monia Santini, Marta Antonelli, and Océane Espin

Climate change and malnutrition, that includes undernutrition as well as micronutrient deficiency and overweight, are among the greatest issues in the 21st century. Acting in synergy, each of these dynamics aggravates the effects of the other, creating complex and compounding impacts that increase particularly the vulnerability of the poorest people. This so-called climate and nutrition nexus can be broadly described as the fact that climate change poses a serious threat to global nutrition security, while current food systems are contributing significantly to this warming dynamic and malnutrition is reducing people’s ability to cope with the induced changes. Therefore, climate information and science are crucial to inform both international funding institutions (especially their investment portfolios) and local decision-makers in the design and selection of comprehensive, effective and innovative strategies and actions to adapt and cope with climate change and therefore advance sustainable development at all scales.

Regarding this topic, we carried out a consultancy project funded by the ASAP II programme of the International Fund for Agricultural Development (IFAD) to inform its investment portfolio on the design and implementation of interdisciplinary development strategies linking nutrition enhancement and climate change adaptation. We reviewed and analysed 7 selected IFAD ‘climate related and nutrition-sensitive projects’ in Latin America and the Caribbean. The identification of best practices and lessons learned to be cultivated, scaled-up and even mainstreamed in future projects will encourage the sustainable transformation of the food systems, increase the climate resilience of the population and fight inequalities in the region.

Our work was articulated in three stages. Firstly, a wide literature review of scientific articles and other relevant documents published to date on the climate and nutrition nexus has been carried out, as well as a review of all related project documentation. This primary data collection and analysis has been complemented by conducting semi-structured interviews with key stakeholders from the projects. As part of this study, a two-day peer-to-peer sharing event was organised to assess the know-how accumulated by the participants and aimed to create an environment conducive to the exchange of knowledge and experiences, as well as to present and validate preliminary research results.

Our results are compiled in a practical guidebook that focuses on 9 main themes. The analysis allowed us to identify adaptation knowledge and solutions coming directly from the field and tested during the projects. The added value of considering the climate and nutrition nexus is to point out the numerous co-benefits of actions and practices which can both contribute to climate change mitigation and adaptation, and to the promotion of sustainable agricultural systems and healthy diets. The majority of the solutions identified concern: the consideration of the most vulnerable communities and populations, and in particular the empowerment of women, youth and indigenous people; governance and organisation from the global scale with South-South cooperation to the household level; and finally, the use of information from both traditional knowledge and more technical studies, as well as the implementation of climate-smart and nutrition-sensitive agriculture practices.

How to cite: Galluccio, G., Trozzo, C., Santini, M., Antonelli, M., and Espin, O.: Inform international institutions for interdisciplinary development strategies linking nutrition enhancement and climate change adaptation, EGU General Assembly 2023, Vienna, Austria, 23–28 Apr 2023, EGU23-17583, https://doi.org/10.5194/egusphere-egu23-17583, 2023.

EGU23-277 | ECS | Orals | SSS2.3

Local assessment of technical forestry awareness on soil erosion after wildfire – the case study of Central Portugal region 

Ana R. Lopes, Sandra Valente, Jacob Keizer, and Diana Vieira

Wildfires consist in an environmental problem with a global dimension, but also with future demands as fire prone regions will likely increase, driven by new climate constrains but also socioeconomic drivers. Similarly to other land degradation pressures, despite the large scale of its occurrence, wildfires impacts require assessment and mitigation actions at local scale. Therefore, there is an urgent need to identify local agent’s perspectives regarding wildfires impacts in the ecosystems, and incorporate their local knowledge into post-fire land management decision making. Can a local analysis contribute to political decision-making, streamlining and simplifying processes established at national level?

In an attempt to assess the local perception that technical forest managers have on soil erosion after wildfire, an investigation was conducted, having the central region of Portugal as case study. In this project, we assessed the relevance that technical forest managers give to post-fire soil erosion, by identifying the priority of their activities, established procedures, and their perception of present and future risk following wildfires. Thus, a survey was structured and provided to 108 entities (100 municipalities and 8 inter-municipal communities), being active for reply between 14 September and 14 October 2022. The survey was structured in three main sections: i) general characterization of the entity, ii) description of its global relationship with forest land management and actions after wildfire, and iii) identification of procedures and technical tools used for post-fire land management.

From the 108 requests, 78 answers were obtained, and 52 were considered valid for analysis. The results identified a general concern with soil erosion after wildfire. However, the focus of individual local concerns with wildfires impacts is mostly targeted to loss of biodiversity, the abandonment and degradation of affected areas, followed only then by the soil losses by erosion. Respondents also identified that they have implemented, or are aware of the implementation, of erosion mitigation measures in their actuation area, being these measures mainly represented by the construction of organic barriers and interventions in water bodies, for soil stabilization and overflow redirection. Technical tools are generally used for forest management planning, but not with the main intention to control soil erosion neither to promote its rehabilitation. Respondents also refer that an open source, and updated, technical tools on this scope would allow them to design an emergency strategy on time. This would also enable the support of the local decision-making process, and contribute to a standardized and streamlined response from diverse municipalities affected by the same wildfire.

According to the results obtained, two main strategies can be inferred in order to promote the local conservation of forest soils after an wildfire: i) local empowerment to act and contribute with technical support to private local forest owners and managers, and ii) the reinforce of the awareness-raising process, by adapting campaigns (information/language) to the different, affected and interested, stakeholders.

How to cite: R. Lopes, A., Valente, S., Keizer, J., and Vieira, D.: Local assessment of technical forestry awareness on soil erosion after wildfire – the case study of Central Portugal region, EGU General Assembly 2023, Vienna, Austria, 23–28 Apr 2023, EGU23-277, https://doi.org/10.5194/egusphere-egu23-277, 2023.

EGU23-1570 | ECS | Orals | SSS2.3

How acidic or alkaline soils affect SOC stock in a post-abandonment secondary succession process: a case study in th Mediterranean mid-mountains. 

Melani Cortijos-López, Pedro Sánchez-Navarrete, Teodoro Lasanta, and Estela Nadal-Romero

Mediterranean mountains have been affected by an intense process of cropland abandonment since the middle of the last century, as a result of the rural exodus. This has led to the activation of natural revegetation processes in marginal areas that have not been managed. Literature has recorded different soil responses to secondary succession depending on factors such as climate, altitude, soil depth and type, but still very little is known about the influence of soil pH. Thus, the main objective of this work is to identify how soil quality and carbon sequestration are affected by secondary succession after abandonment for two types of soil lithologies (acidic and alkaline). For this purpose, the Leza Valley (La Rioja, Spain) was selected as the representative study area. Soil samples were collected for each lithology, at different depths (0-40 cm), for 5 stages of succession (cropland (CRL); shrubland (SH); bushland (BS); young forest (YF); and old forest (OF)), and their physicochemical properties were analysed in the laboratory. Data analysis was carried out and these are the most relevant results: i) there are significant differences between acidic and alkaline organic carbon stocks; ii) the alkaline soils increase their SOC stock with the advance of succession, and significant differences were observed between the first stages of abandonment and BS, YF and OF; iii) while in the acidic soils no significant differences were observed, and the highest values were recorded in YF; iv) these results may be the combination of interactions between pH, soil properties and plant and microbiological communities that establish in these areas. Our work has shown the relevance of considering the lithology of our soils in order to determine which post-abandonment management practices may be the most appropriate for our study area. Therefore, it is necessary that policies and management strategies include this type of analysis to achieve the best results of soil carbon sequestration.

Acknowledgement: This research project was supported by the MANMOUNT (PID2019-105983RB-100/AEI/ 10.13039/501100011033) project funded by the MICINN-FEDER. Melani Cortijos-López is working with an FPI contract (PRE2020-094509) from the Spanish Ministry of Economy and Competitiveness associated to the MANMOUNT project

Keywords: abandoned croplands, natural revegetation, carbon sequestration, soil pH, Iberian System (Spain)

How to cite: Cortijos-López, M., Sánchez-Navarrete, P., Lasanta, T., and Nadal-Romero, E.: How acidic or alkaline soils affect SOC stock in a post-abandonment secondary succession process: a case study in th Mediterranean mid-mountains., EGU General Assembly 2023, Vienna, Austria, 23–28 Apr 2023, EGU23-1570, https://doi.org/10.5194/egusphere-egu23-1570, 2023.

EGU23-3504 | Orals | SSS2.3

New approach to evaluate the intensity of ancient human activities, based on organic matter characteristics using Rock-Eval® thermal analysis. 

Marie-Liesse Aubertin, Oscar Pascal Malou, Manuel Arroyo-Kalin, Umberto Lombardo, Tiphaine Chevallier, Priscia Oliva, Frédéric Delarue, Julien Thiesson, Katell Quenea, David Sebag, and Geoffroy de Saulieu

Archaeological anthrosols constitute a heritage of long-term carbon storage and soil fertility. Their anthropogenic features are affected by the type and intensity of ancient human activities. Human activities can follow a gradation of disturbance intensity, with lower intensity related to a weak human pollution of natural soil, and stronger intensity related to anthropogenic materials inputs (e.g. refuse pits). Soil properties are indeed deeply modified by the addition of objects (e.g. bones, ceramic) and of organic matter with distinct chemical composition and biological stability (e.g. charcoal). The aim of the study was to establish a new analytical approach to distinguish intensities of human activities, based on organic matter characteristics. To this end, we studied intertropical soil profiles (0-120 cm) from Cameroon, Brazil and Bolivia, with spatial or temporal intensity variations of human activities. We used standard compositional parameters (hydrogen index, HI, and oxygen index, OI) and advanced thermal parameters (I-index and R-index) from Rock-Eval® pyrolysis, as well as magnetic susceptibility, to characterize anthrosols.

Results demonstrated the potential of Rock-Eval® pyrolysis parameters to identify human activities changes. First, the deviation of I-index (delta-I) between our samples and a reference value from natural sites informed about the intensity of human impacts, allowing for the distinction between artificial infilling of refuse pits and soil profiles with no or few human impacts. Second, positive HI:OI correlation established the importance of charcoal as main organic C source. The magnetic susceptibility informed about the presence of burnt soils in a Brazilian and one of the Bolivian sites. The combination of all these parameters, when represented with soil depth, allowed for the estimation of temporal changes in Brazilian and Bolivian sites. The topsoils were similar for all sites, relative to a low intensity of human activities or to the resumption of natural pedogenesis, thereby alleviating the effects of ancient human activities on organic matter characteristics. In contrast, the subsoils exhibited higher intensities of ancient human activities, with even higher values of intensities in Bolivian sites, thereby evidencing the long-term conservation of their effects on organic matter characteristics.

To conclude, anthropogenic activities may durably affect organic matter characteristics in tropical sites, even after several centuries. Beyond being of interest for archaeological research, this new approach raises questions about the long-term consequences of our current human activities.

How to cite: Aubertin, M.-L., Malou, O. P., Arroyo-Kalin, M., Lombardo, U., Chevallier, T., Oliva, P., Delarue, F., Thiesson, J., Quenea, K., Sebag, D., and de Saulieu, G.: New approach to evaluate the intensity of ancient human activities, based on organic matter characteristics using Rock-Eval® thermal analysis., EGU General Assembly 2023, Vienna, Austria, 23–28 Apr 2023, EGU23-3504, https://doi.org/10.5194/egusphere-egu23-3504, 2023.

EGU23-5949 | ECS | Posters on site | SSS2.3 | Highlight

Sustainable increase of SOC stocks and nutrients in sandy subsoils by ameliorative fractional deep tillage (aFDT) 

Marisa Gerriets, Martin Leue, Sylvia Koszinski, and Michael Sommer

The sandy soils of Eastern Germany show a high gradient in soil organic carbon (SOC) between topsoil and subsoil. This is reflected in the low nutrient supply, water storage capacity and increased compaction susceptibility of the subsoil. In view of these productivity limitations, ameliorative fractional deep tillage (aFDT) was developed in the late 1950s.

The aim of this subsoil melioration measure is to create shafts enriched with organic-rich topsoil material in the subsoil to remediate root restricting layers and promote accessibility of subsoil resources. At the same time, organic C sequestration is induced by mixing of subsoil material low in organic matter into the topsoil. The 50 cm deep and 7-15 cm wide shafts are created at 35-80 cm intervals by a special plough or modified loosener. Thereby, solid zones remain between the shafts to ensure stability and reduce the risk of re-compaction of the strip wise deep tillage.

We studied three 37- to 43-year-old historical field trials representing a soil quality gradient near Müncheberg to investigate the long-term effects of aFDT on SOC accumulation as well as nutrient stocks in the subsoil and organic carbon sequestration in the topsoil. Besides the shaft, the topsoil, the area next to the shaft, the subsoil material below the shaft and reference topsoil without aFDT outside the trial plot were sampled. In total, 43 shafts were sampled.

We found that the 50-75% of the original SOC was still preserved in the shafts. The shafts had significantly higher SOC contents (+286%) and nutrient contents (P+75%, K +33%, Mg +50%) compared to surrounding subsoils (E/Bw horizons). These results indicate that aFDT is an effective melioration method to increase the SOC and nutrient stocks.

How to cite: Gerriets, M., Leue, M., Koszinski, S., and Sommer, M.: Sustainable increase of SOC stocks and nutrients in sandy subsoils by ameliorative fractional deep tillage (aFDT), EGU General Assembly 2023, Vienna, Austria, 23–28 Apr 2023, EGU23-5949, https://doi.org/10.5194/egusphere-egu23-5949, 2023.

The development of the balance of carbon stocks is at the EU level as well as nationally a key issue related to climate change and the state of the environment, and nowadays it is also strongly linked to the economic perspective through common agreements related to taxonomy. This places the need to produce new researched information as a basis for decision-making.

In Finland, the lack of soil information is becoming a limitation of climate-resilient agriculture and forestry policy measures. Because of this, Geological Survey of Finland (GTK) and its partners have launched several projects to improve the situation. In the new projects, remote sensing methods, digital tools and the use of artificial intelligence have been developed in particular to expand the regional coverage of soil data and to enable the assessment of the national carbon stock. By developing the production of information and making the use of databases more efficient, land use measures can be directed and targeted in such a way that they maintain and strengthen carbon sinks and stores.

GTK's partners in the projects have been the Natural Resources Institute Finland, the Universities of Helsinki and Turku, the Finnish Food Authority, the National Land Survey of Finland and RADAI, and the work would not be possible without interdisciplinary cooperation.

How to cite: Pihlaja, J.: Development of soil research supporting climate resilience and decision-making in Finland, EGU General Assembly 2023, Vienna, Austria, 23–28 Apr 2023, EGU23-6129, https://doi.org/10.5194/egusphere-egu23-6129, 2023.

EGU23-6290 | Posters virtual | SSS2.3

Adapting irrigated maize cropping to a changing climate 

Carla S.S. Ferreira, Matthew T. Harrison, Nicolas F. Martin, Guillermo S. Marcillo, Pan Zhao, Ran Tao, Naira Hovakimyan, and Zahra Kalantari

The European Mediterranean region is heralded globally for both its high vulnerability to soil degradation and realization of the climate crisis, with ambient temperatures increasing at rates 20% faster than the global average. Maize crops in this region experience moderate to severe water stress during late spring and summer, although such trends are being exacerbated by lack of agricultural irrigation, which has exhausted ~70% of freshwater reserves to date. Future water scarcity is expected to increase as evaporative demand ramps in line with global warming, with rainfall intensity and distribution becoming more variable, and with intensification of weather extremes including drought. Agricultural droughts occur when soil moisture for a prolonged period is below the wilting point threshold, leading not only to yield reduction or failure, but also impaired soil biogeochemical processes, enhanced losses of terrestrial carbon and soil biodiversity. Thus, agricultural water management is key not only in terms of global food security but also in terms of natural capital and environmental stewardship, namely planning for net-zero greenhouse gas emissions. Here, our aim was to identify adaptations for maize crops that improve water-use efficiency, resulting in greater production for lower water requirement. Using the Agricultural Production Systems sIMulator (APSIM) crop model, we simulated maize growth in 14 regions across the European Mediterranean region under historical (1984-2021) and future (2064-2100) climate horizons, assuming a 22% decrease in precipitation and a 5.6ºC increase in temperature following the Six Assessment Report of the IPCC (IPCC, 2022). Treatments included a range of irrigation quanta per season (0 mm, 200 mm, 400 mm, 560 mm, 920 mm, 1400 mm, 1600 mm and 2000 mm) and several representative irrigation infrastructures. Irrigated water was applied with furrow, sprinkler and drip-irrigation systems. Under future climates, we reveal that penalties in rainfed maize yields range from between 30% to complete catastrophic collapse. Increasing irrigation applied helped alleviate negative impacts of the climate emergency. However, even under optimal irrigation, maize yields decreased by 6-44% (except for modest increases in Villamanan [north Spain] and Montelier [south France]). For the same amount of water applied over the season, drip and sprinkler systems were conducive to greater yields than furrow irrigation (1-63% and 1-52%, respectively), with the rotating sprinkler (pivot) irrigation providing the highest average water use efficiency (10-17 kg grain/mm water). Drip irrigation – characterised by smaller amounts of water applied more frequently for a longer duration - was conducive to higher evaporation losses than pivot and furrow. Understanding the impacts of climate variability under future climates will be critically important for developing productive, profitable, efficient irrigation strategies that improve security of carbon, water and food.

Keywords: Climate change, irrigation management, crop yield, water use efficiency, Mediterranean region


How to cite: S.S. Ferreira, C., T. Harrison, M., F. Martin, N., S. Marcillo, G., Zhao, P., Tao, R., Hovakimyan, N., and Kalantari, Z.: Adapting irrigated maize cropping to a changing climate, EGU General Assembly 2023, Vienna, Austria, 23–28 Apr 2023, EGU23-6290, https://doi.org/10.5194/egusphere-egu23-6290, 2023.

Soils are often underestimated and overlooked in reviewing national economic structures. Soils and groundwater are the essential basics for food production. Beyond securing nourishment, quantity and quality of soils are pivotal factors in farming, forestry and further land use. The potential of soils governs the availability and variety of its products for national food security and trading. In most industrial European countries, farming has only a share of about 1% of the national gross domestic product but secures vital needs. In the Sub-Saharan region, the same share varies between 16% and 20%, largely depending on regional weather, water availabilty and soil quality. The largest threats are climate change and depletion of soils. Whereas European countries aim for steadily increasing sustainability, countries in Southern Africa are often struggling between short term profits, preservation of soils and necessary climate adaptions. The study sheds some light on the different roles of soils in European and Southern African economies, their inter-dependencies, the necessity to map quantities and qualities of soils for managemant measures and growing needs with a still fastly rising population in Southern-Africa. 

How to cite: Meyer, U.: Soils and Economy - Snapshots on Europe and Southern Africa, EGU General Assembly 2023, Vienna, Austria, 23–28 Apr 2023, EGU23-6715, https://doi.org/10.5194/egusphere-egu23-6715, 2023.

EGU23-7463 | Posters on site | SSS2.3

Options for reducing agricultural ammonia emissions on different soil types 

Kitti Balog, Sándor Koós, Béla Pirkó, Nóra Szűcs-Vásárhelyi, Marianna Magyar, János Mészáros, Mátyás Árvai, Anita Szabó, Zsófia Adrienn Kovács, Tünde Takáts, and Péter László

A governance perspective of the European Union, that increasing efforts are dedicated towards reducing emissions of air pollutants, including ammonia. To reach this goal, Directive 2016/2284 (NEC) has been adopted, which sets a total annual emission limit value for all EU countries to be achieved by 2030. To contribute to the ambitions of sustainable agriculture, Hungary needs to reduce ammonia emissions by 32% compared to 2005 levels. Since 90% of ammonia emissions are related to agriculture, change in agrotechnical practices is needed to reach the target.

Our goal is to find optimal land use management practices in order to minimize ammonia emission, thus creating interactions between land degradation reduction and climate neutrality. A small-scale plot field trial was set up to demonstrate the possibilities of reducing ammonia emissions from urea fertilizer (46.6% active N ingredient), due to agrotechnical treatment combinations [split dose (60-40%) fertilizer application and incorporation] taking into account different test crops (wheat, triticale, grain sorghum, maize, sunflower), soil properties, climatic factors and vintage effect. In the experiment, urease inhibitor (Limus  Yellow) was tested, which was designed to inhibit the urease enzymes catalyzing the hydrolysis of urea, thus reducing and slowing the formation of ammonium, and reducing the loss of ammonia. Treatment combinations were set up in 4 replicates in a randomized design, with a total of 32 plots and 4 controls on four different soil types (Arenosol in Őrbottyán, Chernozem in Nagyhörcsök, Luvisol in Keszthely and Gleyic Chernozem in Karcag – according to WRB) with sand, loam, clayey loam and clayey loam texture, respectively. The volatilized ammonia was investigated using a passive  chamber method (phosphoric - acid  and glycerol mixture as trap to NH3) for 6 weeks in the case of hoe culture and for 12 weeks in the case of cereals, during which the ammonia release was determined at 2-week intervals.

The inhibitor delayed the rate of ammonification in all soil types, thus reducing ammonia emissions in the weeks following application, but at a decreasing rate. The order of the soils from high to low ammonia reduction due to the inhibitor (2-year averages) was Arenosol (52%) > Chernozem (50%) > Luvisol (46%) > Gleyic Chernozem (20%), which shows a correlation with soil texture (from low to high clay content).

Split fertilizer application reduced ammonia emissions by 48% (3-year average) compared to treatments where 100% of the N dose was applied at the start (2020, 85%; 2021, 24%; 2022, 35%).

Incorporation has an ammonia emission reduction effect of 57% (3-year average) (2019, 53%; 2021, 70%; 2022, 49%). On Gleyic Chernozem, ammonia emission reduction was 68%, while on Luvisol it was 71% (2021) and 49% (2022) compared to leaving it on the surface.

Considering the test crops, incorporation was the most effective in reducing ammonia emissions in maize (62%), sunflower (67%) and grain sorghum (68%), against inhibitor effect (49, 54 and 3 %, respectively). In contrast, the inhibitor effect was the strongest in winter wheat (46 %) and triticale (52 %), against split dose application (28 and 31%, respectively).

How to cite: Balog, K., Koós, S., Pirkó, B., Szűcs-Vásárhelyi, N., Magyar, M., Mészáros, J., Árvai, M., Szabó, A., Kovács, Z. A., Takáts, T., and László, P.: Options for reducing agricultural ammonia emissions on different soil types, EGU General Assembly 2023, Vienna, Austria, 23–28 Apr 2023, EGU23-7463, https://doi.org/10.5194/egusphere-egu23-7463, 2023.

EGU23-8708 | Orals | SSS2.3

Trading water for carbon in agricultural systems 

Erik Schwarz, Anna Johansson, Cristina Lerda, John Livsey, Anna Scaini, Daniel Said-Pullicino, and Stefano Manzoni

Climate change and agricultural intensification are placing enormous pressure on soil to provide essential services, from water storage and nutrient provision to carbon sequestration. Indeed, storing carbon in agricultural systems is proposed as an effective climate mitigation approach. Yet, storing carbon comes often at a cost in terms of water consumed—water used either to increase productivity and carbon inputs to soil, or to create conditions in the soil that promote carbon storage. These linkages are perhaps most evident in rice paddy systems.

Rice – a staple food for 3 billion people – consumes more water than any other crop, leading to unsustainable water withdrawals. However, this large water consumption allows paddy soils to store more carbon than under other land uses, because flooding of the fields keeps soils saturated and inhibits organic matter decomposition. Therefore, changing water saving approaches such as alternate wetting and drying has the potential to reduce carbon storage and alter the provision of other ecosystem services. But how much can soil organic carbon change across land uses and when water management is altered?

In this contribution, we discuss the mechanisms of carbon storage in paddy fields, using data from a meta-analysis of soil carbon budgets in tropical rice paddies and from a detailed investigation of carbon storage along a gradient of a land use and soil age in a temperate rice system. The meta-analysis shows that, as expected, reducing the time of flooding decreases soil organic carbon, but also results in a net decrease of greenhouse gas emissions. The more detailed study shows that in temperate conditions with relative short flooding time, rice paddies can store as much organic carbon as forest sites, despite the higher carbon inputs of forests compared to rice systems. This higher carbon storage is achieved thanks to decreased soil respiration in anaerobic conditions and increased mineral associations of organic carbon. These results show that water management strongly affects soil carbon storage, and that trade-offs emerge between sustainable water use and long-term provision of soil-related ecosystem services.

How to cite: Schwarz, E., Johansson, A., Lerda, C., Livsey, J., Scaini, A., Said-Pullicino, D., and Manzoni, S.: Trading water for carbon in agricultural systems, EGU General Assembly 2023, Vienna, Austria, 23–28 Apr 2023, EGU23-8708, https://doi.org/10.5194/egusphere-egu23-8708, 2023.

EGU23-11518 | Orals | SSS2.3

Mapping spatial and vertical repartitions of soil carbon stocks, additional storage potential and storage dynamics at the regional scale 

Delphine Derrien, Clémentine Chirol, Laurent Saint-André, and Geoffroy Séré

Soils constitute a carbon reservoir that can help to mitigate climate change, or conversely accelerate greenhouse gas emissions if not managed properly. Soils are heterogenous and dynamic systems, which physico-chemical properties impact their current soil organic carbon (SOC) stocks and their capacity to store more carbon. Land-use planning aiming to preserve and increase SOC stocks should therefore be aware of the spatial repartition of various soil types and of the SOC dynamics therein.

This project aims to map the effect of soil typology on the spatial and vertical repartition of soil carbon stocks, additional storage potential and storage dynamics at a regional scale to improve guidance of SOC storage strategies. The study site is a 320 km2 temperate rural region in NE France. Eight dominant soil types are defined, notably Calcaric cambisols in the agricultural valleys, deep silty and acidic soils in the forested plateaus, shallow rocky calcaric soils on the hillslopes, and deep clay-rich hydromorphic soils in the alluvial valleys.  

Based on logarithmic fits of soil carbon data extracted from 197 full-depth soil profiles, mean soil organic carbon stocks are obtained as a function of depth for each represented soil type and land cover. The additional storage potential corresponds to the difference between the current stock and the maximum stock, as estimated by the fit of the upper 25% of the soil carbon content data.  Finally, a depth-dependent SOC dynamic model using multilayer soil modules is used to simulate SOC stock evolution. Results are mapped by combining the spatial information given by a pedological map and a map of land covers.

Median soil carbon stocks over the full soil profile range from 78 to 333 tC ha-1, of which 59 to 148 tC ha-1 are in the topsoil (0-30 cm). The lower stocks are found in the shallow, rocky cultivated soils, and the highest stocks in the gleysols under grasslands. The additional storage potential varies from 19 tC ha-1 for shallow, rocky forest soils to 197 tC ha-1 for cultivated gleysols. SOC build-up is heterogenous and depends on the mean residence time of carbon in the represented soil types.

Maps of carbon stocks show the areas to preserve to avoid C losses, and maps of additional storage capacity for different time horizons show areas in which to implement carbon storage practices. Going forward, the association of carbon stock mapping and modelling should allow us to estimate at which depths and over which timescales.

How to cite: Derrien, D., Chirol, C., Saint-André, L., and Séré, G.: Mapping spatial and vertical repartitions of soil carbon stocks, additional storage potential and storage dynamics at the regional scale, EGU General Assembly 2023, Vienna, Austria, 23–28 Apr 2023, EGU23-11518, https://doi.org/10.5194/egusphere-egu23-11518, 2023.

EGU23-12830 | Posters virtual | SSS2.3

Quantifying the potential of agricultural soils to store carbon. A data-driven approach illustrated for the Netherlands.  

Yuki Fuijta, Sven Verweij, Tessa van der Voort, and Gerard Ros

Improved soil and cropland management changes the soil carbon stocks and thereby mitigate climate change. However, spatially explicit insights on management impacts as well as critical thresholds for optimum SOC levels are lacking, which is crucial for actionable changes in farming practices. In this study we unravelled the contribution of soil texture, geohydrology and soil quality to changes in SOC in the Netherlands using a data-driven approach (using XGBoost) using 21.123 soil analyses done by agricultural laboratories. The current C stock of the 0-30cm soil layer is 119 ton C ha-1 and could be increased by 21 to 59 ton C ha-1 depending on soil type, land use and the agronomic measures taken. The SOC saturation capacity, expressed as the ratio between the actual and potential SOC stock varied from 85 to 93% in grassland soils, from 55 to 83% in arable soils and from 69 to 91% in other land uses. On average, the actual C saturation degree was 75%. The key factors controlling the potential of soils to sequester additional carbon within environmental limits for N and P included the crop sequence in the last decade, soil texture (i.e. oxide extractable aluminium, iron and phosphorus), the acidity, and groundwater depth. The data driven approach shows that spatially explicit recommendations for carbon farming are possible up to the farm and field scale, facilitating the implementation of carbon farming and the mitigation of climate change. When all agricultural fields are saturated with C, an equivalent of 257 Mton of CO2 can be stored.  

How to cite: Fuijta, Y., Verweij, S., van der Voort, T., and Ros, G.: Quantifying the potential of agricultural soils to store carbon. A data-driven approach illustrated for the Netherlands. , EGU General Assembly 2023, Vienna, Austria, 23–28 Apr 2023, EGU23-12830, https://doi.org/10.5194/egusphere-egu23-12830, 2023.

EGU23-13552 | Orals | SSS2.3

Enabling carbon farming: a robust, affordable and scalable approach leveraging remote and proximal sensing 

Sven Verweij, Maarten van Doort, Yuki Fuijta, Tessa van der Voort, and Gerard Ros

The main hurdle in instrumentalizing agricultural soils to sequester atmospheric carbon is a development of methods to measure soil carbon stocks on farm level which are robust, scalable and widely applicable. Specifically, it is necessary that socio-economic barriers related to cost, usability and accessibility are overcome. We present the Wageningen Soil Carbon Stock pRotocol (SoilCASTOR), a method for soil carbon stock assessment using satellite data, direct soil measurements via mobile soil sensors and machine learning which can help overcome these socio-economic hurdles. The method has a low cost per hectare and uses plug-and play tools (soil scanner), which lower the threshold users need to overcome. The method has been tested and applied for multiple farms in Europe and the United states on agricultural fields with variable crop rotations, soil types and management history. Results show that the estimates are precise, repeatable and that the approach is rapidly scalable. Carbon stocks in the top 30 cm range between 1.8-6.1 kg C/hectare and resolution is up to 10x 10 meters. The precision of farm C stocks is below 5% enabling detection of SOC changes desired for the 4 per 1000 initiative. The assessment can be done robustly with as few as 0.5 samples (or 2-3 minutes) per hectare over a range of scales, for farms varying from 20 to 200 hectares.These findings can enable the structural and widespread implementation of carbon farming. This approach has recently been awareded the Bayer Grants4Tech innovation prize.

How to cite: Verweij, S., van Doort, M., Fuijta, Y., van der Voort, T., and Ros, G.: Enabling carbon farming: a robust, affordable and scalable approach leveraging remote and proximal sensing, EGU General Assembly 2023, Vienna, Austria, 23–28 Apr 2023, EGU23-13552, https://doi.org/10.5194/egusphere-egu23-13552, 2023.

EGU23-14111 | ECS | Orals | SSS2.3

Investigation of soil carbon sequestration and storage in Hungarian forest sites under different climatic conditions 

Péter Végh, Pál Balázs, András Bidló, and Adrienn Horváth

A szén-elnyelő erdők és talajok előtérbe kerülnek a szénsemlegesség mielőbbi elérése érdekében. A folyamatosan növekvő kibocsátás felborítja a légkör egyensúlyát, és a folyamatok eltolódásával klímaváltozásban vagy időjárási szélsőségekben nyilvánul meg. Kutatásunk célja az erdei ökoszisztémákban különböző éghajlati és erdészeti viszonyok között tárolt szerves széntartalom felmérése volt. A talajelemzésre helyeztük a hangsúlyt, mert a talaj szén mennyisége közel azonos a föld feletti biomasszában tárolt szén mennyiségével. Mintegy 40 kijelölt erdőállományból vettünk mintát, hogy meghatározzuk az egyes erdőállományok talajában tárolt szerves szén mennyiségét. A talajmintákat 40 cm mélységű fúrással gyűjtöttük. A talajmintavétellel egyidejűleg a mintavételi pont közelében lévő egyes állományok élőfaállományát is felmértük. A 40 kijelölt erdőállományban eddig végzett vizsgálatok alapján a területek Cambisols, Luvisols és Arenosols talajosztályokba sorolhatók (WRB 2020). A talajminták pH-értéke többnyire savas (átlag = 5,9), az állaga vályogként határozható meg. A 0-40 cm-es termőtalajok talaj szervesanyag-tartalma (SOM) 1,45%, ami ~14 t széntartalmat jelent hektáronként. A környéken még mindig van elegendő csapadék a növényzethez zavartalanul; így a szénmérleg a térségben jelenleg stabil annak ellenére, hogy az alommennyiség csökkenése miatt a készletek már most is csökkennek. 9) és a textúra vályogként határozható meg. A 0-40 cm-es termőtalajok talaj szervesanyag-tartalma (SOM) 1,45%, ami ~14 t széntartalmat jelent hektáronként. A környéken még mindig van elegendő csapadék a növényzethez zavartalanul; így a szénmérleg a térségben jelenleg stabil annak ellenére, hogy az alommennyiség csökkenése miatt a készletek már most is csökkennek. 9) és a textúra vályogként határozható meg. A 0-40 cm-es termőtalajok talaj szervesanyag-tartalma (SOM) 1,45%, ami ~14 t széntartalmat jelent hektáronként. A környéken még mindig van elegendő csapadék a növényzethez zavartalanul; így a szénmérleg a térségben jelenleg stabil annak ellenére, hogy az alommennyiség csökkenése miatt a készletek már most is csökkennek.

Ez a cikk a TKP2021-NKTA-43 projekt keretében készült, amely a Magyar Innovációs és Technológiai Minisztérium (jogutód: Kulturális és Innovációs Minisztérium) a Nemzeti Kutatási, Fejlesztési és Innovációs Minisztérium támogatásával valósult meg. Alap, a TKP2021-NKTA támogatási konstrukció keretében finanszírozott. A Kulturális és Innovációs Minisztérium ÚNKP-22-3-I-SOE-99 Új Nemzeti Kiválósági Programja pedig a Nemzeti Kutatási, Fejlesztési és Innovációs Alapból támogatott.

How to cite: Végh, P., Balázs, P., Bidló, A., and Horváth, A.: Investigation of soil carbon sequestration and storage in Hungarian forest sites under different climatic conditions, EGU General Assembly 2023, Vienna, Austria, 23–28 Apr 2023, EGU23-14111, https://doi.org/10.5194/egusphere-egu23-14111, 2023.

EGU23-14616 | Posters virtual | SSS2.3

Effect of afforestation on the organic carbon stock of soils 

András Bidló, Mátyás Csorba, Pál Balázs, Péter Végh, and Adrienn Horváth

Since 1922, the territorial proportion of forests has increased from 12% to 22% due to large-scale afforestation in Hungary. These planted forests bind huge amounts of carbon dioxide from the atmosphere. The sequestered carbon is partly stored in the above-ground biomass of forests in the form of organic matter. At the same time, a similar amount of carbon can be found underground. The research aims to assess the effect of afforestation on the amount of organic carbon stored in the soil (SOC).

During our investigations, we collected samples from 3 study areas from the Hungarian Great Plain. We compared the soil of the poplar and acacia forests in the sample areas with the grassland soils located directly next to these plantations. By the natural conditions, the pH of forest (7.75 and 8.29 pH(H2O)) and grassland (8.01 and 8.45 pH(H2O)) samples was weakly alkaline/alkaline. We measured a lower pH value in case of forests, which clearly shows the leaching effect in the forest soils. The average humus content of the tested soil samples was 0.94%. The lowest measured value was 0.09%, while the highest was 4.21% which clearly showed that dry sandy soils have a low organic matter content.

The soil and the litter cover contain 7 to 37 tons SOC/ha. The differences between the studied areas were very large. The carbon stock of the soils was higher in forest stands in every case. This shows that in long term the afforestation increases the amount of carbon stored in soils compared to grasslands.

This article was made in frame of the project TKP2021-NKTA-43 which has been implemented with the support provided by the Ministry of Innovation and Technology of Hungary (successor: Ministry of Culture and Innovation of Hungary) from the National Research, Development and Innovation Fund, financed under the TKP2021-NKTA funding scheme.


How to cite: Bidló, A., Csorba, M., Balázs, P., Végh, P., and Horváth, A.: Effect of afforestation on the organic carbon stock of soils, EGU General Assembly 2023, Vienna, Austria, 23–28 Apr 2023, EGU23-14616, https://doi.org/10.5194/egusphere-egu23-14616, 2023.

Cropland soils show large potential to sequester carbon to achieve climate neutrality. Changes in management can affect an increase of carbon sequestration or reducing carbon losses in form of emissions or leaching. However, the impact of management changes on the sequestration and other processes needs to be quantified to provide advice to farmers. Experiments to analyse impacts of management changes are costly and labour intensive. Additionally, these experiments take time and cover only a small range of environmental conditions. Therefore, modelling is widely used to over-come these limitations. Model results allow the estimation of all relevant fluxes for the overall greenhouse gas emission balance or, depending on the model, for some parts. This is a fast and efficient method to quantify soil organic carbon (SOC) changes due to modifications in agricultural management. Even though, models proved their quality of simulating SOC changes, there are some restrictions in the use of models for actual advice based on model results. In the here presented study, three key points will be analysed: First, the additional impacts beside the SOC changes. Carbon sequestration can be offset by emission of other greenhouse gases or management changes affect yield, which needs to be included in the analysis. While these two variables are well covered by usual model approaches, other aspects like food quality are more difficult to include. Second, how does the complexity of the model affect the result. The simple assumption that more complex models are potentially more accurate, but also require more input data is in most cases realistic (this is a generic assumption which is not always true). More input data and more complexity are also associated with potentially increased uncertainty. Third, who is running the model. While research-based advice using more complex models might be potentially more accurate, models used by farmers might be more specific and direct in providing key information. Additionally, the impact of the increased data demand and required data can affect an increased error. These points are analysed on examples and case studies. This includes an analysis beyond the carbon sequestration and how to include these aspects in the analysis. Further, results of a tool developed for stakeholders/farmers is compared with results of a biogeochemical model for selected sites. Finally, an analysis of the limitations of the models due to data demand and data availability. The analysis of wheat yields shows mainly positive impacts on the SOC change, but mainly reduced yield. The comparison of the two models indicates the impracticability of the more complex option, as the data demand is not orientated on the data availability. The decision based on model results requires a careful use of models and a good understanding of the results.

How to cite: Kuhnert, M.: Using modelling and tools for advice on improved agricultural management to achieve climate neutrality in croplands, EGU General Assembly 2023, Vienna, Austria, 23–28 Apr 2023, EGU23-14833, https://doi.org/10.5194/egusphere-egu23-14833, 2023.

EGU23-15333 | ECS | Orals | SSS2.3

The effects of olivine fertilization on growth and elemental composition of barley and wheat differ with olivine grain size and rain regimes. 

Jet Rijnders, Sara Vicca, Eric Struyf, Thorben Amann, Jens Hartmann, Patrick Meire, Ivan Janssens, and Jonas Schoelynck

With rising population growth, there is a need for increased food production. With rising temperatures and more frequent droughts due to climate change, it becomes more challenging to keep up with this increased demand for food. Therefore, a change in land use and management is needed in which enhanced silicate weathering (ESW) can play an important role. Weathering of silicate rocks has been regulating the atmospheric CO2 concentrations for over decades, but with the rise in atmospheric CO2, the natural weathering is too slow. Grinding the silicate rocks into a fine powder and spread it over for example agricultural fields will increase the reactive surface area and hence, the amount of CO2 that is stored in soils. The application of silicate minerals to soils can enhance plant growth by multiple processes, for example by counteracting soil acidification and by the release of plant nutrients. In this way, ESW can be used on agricultural fields without competing for land like other carbon capture techniques (e.g. Bio-Energy with carbon capture and storage). This study investigates the use of olivine (a fast-weathering Mg-rich silicate mineral) as a fertilizer in agriculture using a full-factorial mesocosm experiment. Barley and wheat were grown under two different rain regimes (daily rain vs weekly rain) and with application of two different grain sizes of olivine (p80 = 1020 µm and p80 = 43.5 µm). Our results showed increased plant growth and biomass with olivine addition, albeit only for fine olivine. However, this was not translated in an increase in yield of wheat and barley. Besides changes in biomass, we found significant differences in plant nutrient concentrations. As expected, Mg concentration increased significantly. However, BSi and Ca concentrations decreased with fine olivine application. Nitrogen in grains was also increased in the fine olivine treatment. In contrast to fine olivine, coarse olivine addition had almost no influence on nutrients. Ca, Mg and Si concentrations in plant samples followed the same trend as in the soil pore water, in contrast to metal concentrations. Olivine addition increased Ni and Cr availability in the soil pore water, but the concentrations of these elements in plant tissue did not increase and were even below detection limit for the majority of samples. While the influence of olivine on metal concentrations in plant samples was not affected by rain treatment, the influence of olivine on nutrients in the plants and plant growth was. Fine olivine addition enhanced the plants resistance to drought as it reduced the decrease in biomass with weekly rain treatment compared to daily rain treatment. This positive effect of olivine addition can be due to the increased weathering rate in combination with enhancement of soil properties like increased soil water retention. In this way, the use of olivine as a fertilizer on agricultural fields can mitigate climate change while it can also contribute to the solution for increased food demand.

How to cite: Rijnders, J., Vicca, S., Struyf, E., Amann, T., Hartmann, J., Meire, P., Janssens, I., and Schoelynck, J.: The effects of olivine fertilization on growth and elemental composition of barley and wheat differ with olivine grain size and rain regimes., EGU General Assembly 2023, Vienna, Austria, 23–28 Apr 2023, EGU23-15333, https://doi.org/10.5194/egusphere-egu23-15333, 2023.

EGU23-15465 | Posters on site | SSS2.3

Climate change impacts on crop production and soil carbon stock in a continuous wheat cropping system in southeast England 

Shuo Liang, Nan Sun, Jeroen Meersmans, Bernard Longdoz, Gilles Colinet, Minggang Xu, and Lianhai Wu

Understanding dynamics of soil organic carbon (SOC) stock in agroecosystems under climate change is imperative for maintaining soil productivity and offsetting greenhouse gas emissions. Simulations with the SPACSYS model were conducted to assess the effects of future climate scenarios (Representative Concentration Pathway (RCP) 2.6, 4.5 and 8.5) and fertilization practices on crop yield and SOC stock by 2100 for a continuous winter wheat cropping system in southeast England. Weather data between 1921 and 2000 was considered as a baseline. SPACSYS was first calibrated and validated with the data of the Broadbalk continuous winter wheat experiment for over a century. Six treatments were used: no fertiliser (control), a combination of chemical nitrogen, phosphorus and potassium with three N application rates (N1PK, N3PK and N5PK), manure only (FYM) and a combination of manure and chemical nitrogen application (FYMN). SPACSYS simulated grain yields and the dynamics of SOC and TN stocks well compared with the observations. Future climatescould significantly increase wheat yield by an average of 8.3% as compared to the baseline. FYMN was characterized by the highest grain yield. Moreover, when considering NPK practices, the relative increase in SOC stock under the RCP8.5 (+3.3%) was higher than those under the RCP4.5 (+1.4%), whereas the RCP2.6 indicated a negative effect (-0.6%) on SOC stocks. When considering manure amendments, the SOC stock decreased (-1.2%) under all RCP scenarios. However, continuous manure amendments can still be considered as a sustainable strategy for SOC sequestration with C stock increases between 34-106 kg C ha-1 yr-1. Future climates generally had positive effects on C sequestration in continuous wheat system with an annual C sink of 43-425 kg C ha-1 yr-1. Mineral fertiliser plus manure could be recommended as a good practice for simultaneously increasing crop productivity and having a rather high C sink under future climate change.


How to cite: Liang, S., Sun, N., Meersmans, J., Longdoz, B., Colinet, G., Xu, M., and Wu, L.: Climate change impacts on crop production and soil carbon stock in a continuous wheat cropping system in southeast England, EGU General Assembly 2023, Vienna, Austria, 23–28 Apr 2023, EGU23-15465, https://doi.org/10.5194/egusphere-egu23-15465, 2023.

EGU23-1525 | ECS | Orals | SSS5.3 | Highlight

Carbon preservation in soils: The role of carbon chemistry in soil aggregate formation 

Alba Otero-Fariña, Helena Brown, Ke-Qing Xiao, Juan Antelo, Sarah Fiol, Pippa Chapman, Joseph Holden, Steven Banwart, and Caroline Peacock

To mitigate climate change, it is of vital importance to increase the stocks of global soil organic carbon (SOC), which also improves soil resilience, soil fertility and thus food security. 

The preservation of SOC heavily depends on its vulnerability to microbial degradation. Two processes and their interplay strongly influence carbon protection: the formation of primary organo-mineral (O-M) complexes via the sorption of dissolved organic carbon (DOC) to fine-grained soil minerals, and the aggregation of these to form micro and macroaggregates. To date, research suggests that the chemistry of the SOC and the mineralogy of the soil matrix play a key role in the formation of O-M complexes and their stability against microbial degradation, but whether and to what extent these factors help control micro and macroaggregation are unknown. 

We focus our investigation on how the chemistry of the SOC source affects the stability and aggregation of iron (oxyhydr)oxide O-M complexes. Thus, we determine the sorption behaviour of different SOC sources chosen to represent different functional group chemistries, using sorption isotherm experiments and electrophoretic techniques. We also conduct long-term aggregation experiments to track aggregate particle size using a novel Particle Size and Shape Analyzer technique.  

Our findings suggest that the stability and aggregation modes of O-M complexes are a function of SOC chemistry, and that aggregation patterns are strongly influenced by the presence of microbial exudates and communities. 

How to cite: Otero-Fariña, A., Brown, H., Xiao, K.-Q., Antelo, J., Fiol, S., Chapman, P., Holden, J., Banwart, S., and Peacock, C.: Carbon preservation in soils: The role of carbon chemistry in soil aggregate formation, EGU General Assembly 2023, Vienna, Austria, 23–28 Apr 2023, EGU23-1525, https://doi.org/10.5194/egusphere-egu23-1525, 2023.

EGU23-2051 | ECS | Orals | SSS5.3

Long-term fertilization and PFM changed the accumulation of stalk-derived POM in soil aggregates under field conditions 

Xinxin Jin, Roland Bol, Tingting An, Lihong Zheng, Shuangyi Li, Jiubo Pei, and Jingkuan Wang

Plastic film mulching (PFM) is critical for agricultural planting and production in semi-arid and arid areas. Particulate organic matter (POM) is assumed to be a sensitive indicator of evaluating the effects of different agricultural practices on soil fertility and soil organic carbon (SOC) pool. Soil aggregates are the main storage sites for POM. However, there is limited information regarding how PFM and fertilization influences the dynamic changes of newly added stalk-derived POM in Brown earth. Consequently, a depth-study of the fate of carbon (C) and nitrogen (N) derived from maize stalk residues as the POC and PON fractions in soil aggregates will help in predicting the active organic matter component sequestration in the soil. The dynamics and contribution of the newly added maize stalk C and N as POC and PON in different soil aggregates (using dry sieving method divided to > 2, 1-2, 0.25-1and < 0.25 mm) was analyzed by an in-situ 13C15N-tracing technique under 27-year long term PFM and different fertilization treatments. Over the 360 d cultivation, the POC and PON contents were significantly (P < 0.05) higher in the nitrogen (N) and organic manure (M) treatments than other fertilizer addition treatments. Compared with no PFM, PFM accelerated the decomposition of maize stalk C in the N fertilizer treatment, exhibiting an increase of 64% in stalk-derived POC in the initial cultivation time. In addition, stalk-derived POC tended to accumulate in 1-2 mm aggregates in the summer and fall as a result of long-term PFM coupled with fertilization. However, the stalk-derived PON was decreased with the cultivation time in different four aggregates. Stalk-derived POM was tended to accumulate in the macroaggregate size fraction (> 0.25 mm) over 360 days of cultivation in the field conditions. Accordingly, PFM application and fertilization practices had important effects on accumulation of newly added stalk-derived POM in soil aggregates.

How to cite: Jin, X., Bol, R., An, T., Zheng, L., Li, S., Pei, J., and Wang, J.: Long-term fertilization and PFM changed the accumulation of stalk-derived POM in soil aggregates under field conditions, EGU General Assembly 2023, Vienna, Austria, 23–28 Apr 2023, EGU23-2051, https://doi.org/10.5194/egusphere-egu23-2051, 2023.

EGU23-2255 | ECS | Posters on site | SSS5.3

Molecular characterisation of fire-affected soil organic matter by a 5th generation wildfire in SW-Portugal 

Nicasio T. Jiménez-Morillo, Nuno Guiomar, Ana Z. Miller, José M. De la Rosa, and José A. González-Pérez

Forest fires are a recurrent ecological phenomenon in the Mediterranean basin. They induce molecular changes in soil organic matter (SOM) leading to immediate and long-term environmental consequences [1]. The SOM is of paramount importance as indicator of soil health [2]. Fire-induced changes in SOM include the alteration of biogenic chemical structures and the accumulation of newly formed ones, enhancing dynamics in the complex balance between the different C-types [2,3]. Therefore, understanding SOM molecular composition, before and after fire, is fundamental to monitor changes in soil health, as well as its natural or man-mediated recovery [3,4]. Our aim was to assess the molecular composition of organic matter in fire-affected leptosols, at two depths (0–2 and 2–5 cm) under different vegetation types located in the southwestern of Portugal (Aljezur, Algarve). The SOM characterization was conducted by analytical pyrolysis (Py-GC/MS), a technique based on the thermochemical breakdown of organic compounds in the absence of oxygen at elevated temperatures [5]. The Py-GC/MS has been found suitable for the structural characterization of complex organic matrices [4], providing detailed structural information of individual compounds considered fingerprinting of SOM. However, due to the relative high number of molecular compounds released by analytical pyrolysis, the use of graphical-statistical methods, such as van Krevelen diagrams, are usually applied to help monitoring SOM molecular changes produced by fire [3,4]. This work represents the first attempt to evaluate the fire effects in SOM using a detailed molecular characterisation of SOM under different vegetation canopies, recently affected by wildfire, in southern Portugal.


References:

[1] Naveh, Z., 1990. Fire in the Mediterranean – a landscape ecological perspective. In: Goldammer, J.G., Jenkins, M.J. (Eds.), Fire in Ecosystems Dynamics: Mediterranean and Northern Perspective. SPB Academic Publishing, The Hague.

[2] González-Pérez, J.A., González-Vila, F.J., Almendros, G., Knicker, H., 2004. The effect of fire on soil organic matter—a review. Environ. Int. 30, 855–870.

[3] Jiménez-Morillo, N.T., De la Rosa, J.M., Waggoner, D., et al., 2016. Fire effects in the molecular structure of soil organic matter fractions under Quercus suber cover. Catena 145, 266–273.

[4] Jiménez-Morillo, N.T.; Almendros, G.; De la Rosa, J.M.; et al., 2020. Effect of a wildfire and of post-fire restoration actions in the organic matter structure in soil fractions. Sci. Total Environ. 728, 138715.

[5] Irwin, W.J., 1982. Analytical pyrolysis—a comprehensive guide. In: Cazes, J. (Ed.), Chromatographic Science Series, 22: Chapter 6. Marcel Dekker, New York.


Acknowledgments: This work was funded by national funds through FCT–Fundação para a Ciência e a Tecnologia (EROFIRE project, ref. PCIF-RPG-0079-2018) and by the EU-FEDER co-funded project MARKFIRE (ref. P20_01073) from Junta de Andalucía. This research was also funded by the European Union through the European Regional Development Funds in the framework of the Interreg V A Spain-Portugal program (POCTEP) through the CILIFO (Ref.: 0753_CILIFO_5_E) and FIREPOCTEP (Ref.: 0756_FIREPOCTEP_6_E) projects. A.Z.M. and N.T.J.M. thank the FCT for contracts CEECIND/01147/2017 and 2021/00711/CEECIND, respectively. N.T.J.M. and A.Z.M. were also supported by MCIN “Ramón y Cajal” contracts (RYC2021-031253-I and RYC2019-026885-I, respectively).

How to cite: Jiménez-Morillo, N. T., Guiomar, N., Miller, A. Z., De la Rosa, J. M., and González-Pérez, J. A.: Molecular characterisation of fire-affected soil organic matter by a 5th generation wildfire in SW-Portugal, EGU General Assembly 2023, Vienna, Austria, 23–28 Apr 2023, EGU23-2255, https://doi.org/10.5194/egusphere-egu23-2255, 2023.

EGU23-2423 | Orals | SSS5.3

The subsoil horizons are the preferential location for organic carbon stabilization in chestnut forests 

Mauro De Feudis, Gloria Falsone, William Trenti, Gilmo Vianello, and Livia Vittori Antisari

Forest soils are recognized to be important organic carbon storage, but the role of surface and subsurface soil horizons on such function and its drivers are still field of debate. In this context, we examined the dynamics of soil organic carbon (SOC) for a chestnut forestry system in a temperate area of northern part of Apennine mountain range in Italy. Specifically, we questioned: what are the main i) SOC forms both in mineral surface and subsurface soil horizons? ii) factors affecting SOC stabilization?. Soil samples were collected by horizon and SOC was separated into organic C of the particulate organic matter (POM_C), sand–size aggregates (sand_C) and the mineral–associated organic C (MAOM_C). The easily oxidizable C (EOC), water–soluble organic C (WSOC), the microbial biomass–C and its respiration, and the total and easily extractable glomalin–related soil protein (T–GRSP and E–GRSP, respectively) were also estimated. Then, the E–GRSP–to–T–GRSP and E-GRSP–to–SOC ratios, the metabolic (qCO2) and microbial (qMIC) quotients were calculated. The POM_C, sand_C and MAOM_C showed the highest concentrations in A horizon (26.5, 14.6 and 13.9 g kg–1, respectively) highlighting the importance of the litter floor on the organic matter pools quantity in the topsoil. Further, the A horizon was enriched of the most labile organic C forms (i.e., EOC and WSOC) indicating the key role of A horizon for the development and growth of chestnut forest ecosystems. In fact, the labile organic C forms provide several ecosystem services, such as plant growth and yield. Unlike A horizon, the subsurface horizons preserved SOC mostly in the most stable form (63.8 %, on average). Because of the role of fungal biomass and its exudates to increase SOC capture and stabilization, the great potential of the subsurface horizons to store MAOM_C can be attributed both to the higher release of exogenous GRSP (higher E–GRSP–to–T–GRSP ratio) by mycorrhizal fungi and fungal mycelium expansion (higher E-GRSP–to–SOC ratio) within such horizons (0.504  and 0.061, respectively) compared to the A horizon (0.244 and 0.034, respectively). Therefore, the subsurface soil horizons seemed to have more favourable conditions for microorganisms compared to surface one as shown by the lower qCO2 and the higher qMIC values found in the former than in the latter. Overall, the present investigation highlighted the importance of subsurface soil horizons of chestnut forests on C stabilization processes compared to the A horizon likely due to the better edaphic conditions for the microbial communities. Thus, our results pointed out the key role that the subsurface soil horizons of chestnut forests could have for mitigating the current climate change.

How to cite: De Feudis, M., Falsone, G., Trenti, W., Vianello, G., and Vittori Antisari, L.: The subsoil horizons are the preferential location for organic carbon stabilization in chestnut forests, EGU General Assembly 2023, Vienna, Austria, 23–28 Apr 2023, EGU23-2423, https://doi.org/10.5194/egusphere-egu23-2423, 2023.

Lipids from the wax layers of plant leaves and plant roots as preserved in soils and sediments have been used for decades as proxies for environmental reconstructions. In particular the n-alkanes of higher chain-lengths (ca. C25-C37) are used to this end. The past decade has seen an increased research attention for the use of plant lipids as molecular proxies. This includes an emerging interest in applications aimed at unravelling the dynamics of soil organic matter (SOM) rather than answering purely palaeo-ecological questions[1] as well as in reconstructing multiple environmental factors at once. Here I highlight these developments via two examples of recent work by our group. In the first example we applied analysis of n-alkanes and n-alcohols preserved in plaggic Anthrosols to reconstruct the origin of the plant material that was used as the stable fillings that were applied to fertilize the soils in this unique agricultural system. In the second example we examined plant derived n-alkanes preserved in soils along an altitudinal transect in the Ecuadorian Andes as part of a coupled reconstruction of palaeo-vegetation and palaeo-climate. I discuss both the exciting new insights gained as well as the challenges that still remain.

References

[1] J.M. van Mourik, T.V., Wagner, J.G. de Boer, B. Jansen, (2016). The added value of biomarker analysis to the genesis of plaggic Anthrosols; the identification of stable fillings used for the production of plaggic manure. SOIL, 2, 299-310

[2] B. Jansen, H. Hooghiemstra, S.P.C. de Goede, J.M. van Mourik, (2019). Chapter 5 - Biomarker analysis of soil archives, Eds. J.M. van Mourik, J.J.M. Van der Meer, Developments in Quaternary Sciences, 18: 163-222

[3] M.L. Teunissen van Manen, B. Jansen, F. Cuesta, S. León-Yánez, S., W.D. Gosling, (2020). From leaf to soil: n-alkane signal preservation, despite degradation along an environmental gradient in the tropical Andes. Biogeosciences, 17, 5465-5487

How to cite: Jansen, B.: Plant lipids as proxies to trace the origin and dynamics of soil organic carbon, EGU General Assembly 2023, Vienna, Austria, 23–28 Apr 2023, EGU23-2772, https://doi.org/10.5194/egusphere-egu23-2772, 2023.

ABSTRACT: Global nitrogen (N) deposition has impacted the structure and functioning of soil microbial communities, translating into important changes to the cycling of soil organic matter (SOM). Recent frameworks have proposed that portioning the particulate and mineral-associated organic matter (POM and MAOM) fractions can help us better understand SOM cycling. However, how N deposition affect the fractionation of SOM into MAOM and POM forms, and how soil microbes process these across soil profile all remain unclear. Here we examined the microbial phospholipid fatty acids and determined N and soil organic carbon (SOC) content in POM and MAOM at depths of 0–10, 30–40 and 70–100 cm after 10-year N addition at rates of 0, 2, 10 and 50 g m-2 yr-1 in a temperate steppe. We found that N addition remarkably shifted microbial communities by increasing the relative abundances of bacteria and gram-positive (GP) bacteria, and decreasing gram-negative bacterial across the three soil layers. These effects of N addition tended to increase with the N addition rate but diminished with soil depth probably as pH decreased with the N addition rate but increased with soil depth. Both N addition and soil depth may cause similar microbial community shifts, through which fungi and GP bacteria become dominant, but may through different mechanisms. More than 60% of total SOC and N are stored as MAOM in this grassland. The share of SOC and total N in the MAOM was slightly decreased by N addition in 0-10 cm but significantly increased in deeper soils. The ratios of POM-C/MAOM-C and POM-N/MAOM-N significantly decreased with soil depth regardless of N addition treatments. Moreover, N addition increased the two ratios in 0-10 cm soil, but decreased them in deeper soil layers. N addition increased the stocks of SOC (MAOM: +11 %; POM: +23 %) and total N (MAOM: +10 %; POM: +27 %) in 0–10 cm soil, but increased only in MAOM in 30–40 cm (SOC: +24 %; total N: +24 %) and 70–100 cm (SOC: +15 %; total N: +13 %) soils. Soil physicochemical features exerted stronger controls than microbial properties in the distribution of SOC and total N in the two fractions regardless of soil depth because of eight soil features explaining more of the total variation than eight microbial properties. Our findings imply that increase in N deposition may make more SOC stabilized as MAOM fraction in grassland soils.

Keywords: Nitrogen deposition, Soil microbiome, Mineral-associated organic matter, Subsoil

How to cite: Niu, G., Huang, J., Lu, X., and Rousk, J.: Decadal nitrogen addition enhanced soil C and N storage in mineral-associated organic matter by altering soil abiotic and microbial properties in a temperate grassland, EGU General Assembly 2023, Vienna, Austria, 23–28 Apr 2023, EGU23-3272, https://doi.org/10.5194/egusphere-egu23-3272, 2023.

Subsoils have gained increasing attention due its slower soil organic carbon (SOC) turnover than in topsoil. Thus, subsoil with low content of mineral associated organic matter but a large number of exchange sites on mineral surfaces represents the potential to accumulate and sequester carbon (C). Generally, it has been assumed that the carbon turnover mechanism in topsoil and subsoil is influenced by similar environmental factors, with the difference of a lower C content in subsoil. In contrast, diverse abiotic variables prevalent in subsoils, like low temperature, high moisture, nutrient availability, etc., have been shown to imply different processes influencing C turnover in subsoils. Therefore, differences in processes and factors affecting SOC turnover in topsoil and subsoil are incompletely identified and understood.

Our objective is to investigate whether C decomposition and stabilisation mechanisms in topsoil and subsoil differ given the same added substrate content, as well as how it responds to increasing substrate C content. To assess these questions, a long-term (total duration 20-year) field incubation experiment was conducted at three different locations with varied soil textures in which soil was mixed and labelled with isotopically (13C) enriched beech litter substrate with different C contents of 8, 16, 32, and 64 g substrate kg-1 in topsoil (10 cm) and 2, 4, 8, and 16 g substrate kg-1 in subsoil (60 cm), filled in mesocosms, and buried. Soil samples were collected after one, two, and four years. Soil was fractionated into particulate organic matter (>20µm) and mineral-associated organic matter (<20µm) to find out how carbon is stabilised in these fractions, and stable C isotopes were measured. Our results indicate that the decomposition of the identical litter substrate strongly depends on the soil depth. The results of four years of buried field-microcosms will be presented, which will shed more light on differences in mechanisms responsible for SOC dynamics and the fate of litter substrate into different SOC pools of topsoil and subsoil.


How to cite: Begill, N., Don, A., and Poeplau, C.: Investigating soil organic matter dynamics in topsoil and subsoil by burying isotopically labelled litter substrate for four years, EGU General Assembly 2023, Vienna, Austria, 23–28 Apr 2023, EGU23-3538, https://doi.org/10.5194/egusphere-egu23-3538, 2023.

EGU23-3581 | ECS | Posters on site | SSS5.3

Plastic film mulching combined with manure fertilizer application promotes microbial necromass carbon accumulation within soil macroaggregates 

Xu Liu, Roland Bol, Tingting An, Yaocen Liu, Hongbo Wang, Chang Peng, Shuangyi Li, and Jingkuan Wang

Plastic film mulching is a common agricultural management to increase crop yield in the dry and cold regions. The improved soil hydrothermal environment under mulching conditions could change soil microbial activities and soil aggregation, thereby affecting soil organic carbon (C) sequestration. However, it remains not clear that how mulching regulates microbial necromass C accumulation and distribution within soil aggregates, especially under different fertilizer applications. We analyzed the contents of fungal and bacterial necromass C (taking amino sugar as biomarkers) and their contributions to organic C within soil aggregates under mulching combined with different fertilization treatments (no fertilization, CK; inorganic fertilizer application, IF; and manure fertilizer application, MF) in a 900-day in-situ field experiment. On day 360, the contents of fungal and bacterial necromass C within macroaggregates were 25% and 12% higher in the mulching combined with IF treatment, and were 20% and 32% higher in the mulching combined with MF treatment relative to the corresponding no-mulching treatments, respectively. On day 900, the mulching combined with CK and IF treatments decreased microbial necromass C content within soil aggregates, while the mulching combined with MF treatment promoted microbial and fungal necromass C accumulation within macroaggregates (>0.25 mm), compared with the corresponding no-mulching treatments. Mulching increased the fungal/bacterial necromass C ratio within macroaggregates on day 900, but decreased this ratio within microaggregates during the whole incubation period compared with the corresponding no-mulching treatments. Moreover, microbial necromass C occupied 28%–43% and 40%–56% of organic C within macroaggregates and microaggregates on day 900, respectively. Overall, mulching combined with the application of manure fertilizer greatly promoted microbial necromass C accumulation, and thus increased organic C sequestration within macroaggregates.

How to cite: Liu, X., Bol, R., An, T., Liu, Y., Wang, H., Peng, C., Li, S., and Wang, J.: Plastic film mulching combined with manure fertilizer application promotes microbial necromass carbon accumulation within soil macroaggregates, EGU General Assembly 2023, Vienna, Austria, 23–28 Apr 2023, EGU23-3581, https://doi.org/10.5194/egusphere-egu23-3581, 2023.

EGU23-3868 | ECS | Posters on site | SSS5.3

Alterations of soil organic matter following 130 years of afforestation assessed by molecular markers 

Tatjana Carina Speckert and Guido Lars Bruno Wiesenberg

In alpine areas of the European Alps, many of the pastures are no longer economically profitable and are converted into forests (Bolli et al., 2007). Afforestation on former pastures affects soil organic matter (SOM) dynamics through alteration of quality and quantity of root and aboveground biomass litter input. Compared with pasture OM, forest OM is less decomposable and characterized by increased C:N ratio as well as increased lignin concentration (Hiltbrunner et al., 2013). Therefore, it could be expected that long-term afforestation on a centennial scale may have a severe impact on SOM dynamics, an aspect that remains so far unknown as most of the earlier studies focused on successions between 30 and 50 years (Vesterdal et al., 2002).

In the current study, we aimed to identify the major sources of SOM in a subalpine afforestation sequence (40-130 years) with Norway spruce (Picea abies L.) on a former pasture in Jaun, Switzerland. Therefore, we combined plant- and microorganism-derived molecular proxies from several compound classes such as free-extractable fatty acids and phospholipid fatty acids.

We observed a decline in soil organic carbon (SOC) stock (9.6 ± 1.1 kg m-2) after 55 years and a recovering of the SOC stock 130 years (12.7 ± 0.9 kg m-2) after afforestation. Overall, there is no alteration of the SOC stock in the mineral soil following afforestation of former pasture (13.3 ± 0.9kg m-2) after 130 years. But if we consider the additional SOC stock accumulated in the organic horizons (between 0.8 and 2 kg m-2), the total SOC stock slightly increased, although OM in organic horizons is less stabilized than mineral-bound OM. An increase of the C:N ratio in the Oi-horizon with increasing forest age (40yr: 36.9 ± 2.6; 55yr: 40.9 ± 4.1; 130yr: 42.4 ± 6.6) reflects the alteration in litter quality towards poorly decomposable compounds in older forests. In addition, preliminary results show an increase in the abundance of Gram+ (+3%) and Gram- bacteria (+6%), especially in the young (40yr) forest. Thus, the bacterial community seems to proliferate in the early succession before the fungal-dominated community takes over. Thus, the change in SOM source and quality following afforestation may not result in considerable stock changes, but results in better stability of SOM in the mineral soil.

References

Bolli, J. C., Rigling, A., Bugmann, H. (2007). The influence of changes in climate and land-use on regeneration dynamics of Norway spruce at the treeline in the Swiss Alps. Silva Fennica, 41, 55.

Hiltbrunner, D., Zimmermann, S., Hagedorn, F. (2013). Afforestation with Norway spruce on a subalpine pasture alters carbon dynamics but only moderately affects soil carbon storage. Biogeochemistry, 115, 251-266.

Vesterdal, L., Ritter, E., Gundersen, P. (2002). Change in soil organic carbon following afforestation of former arable land. Forest Ecology and Management, 169, 137-147.

How to cite: Speckert, T. C. and Wiesenberg, G. L. B.: Alterations of soil organic matter following 130 years of afforestation assessed by molecular markers, EGU General Assembly 2023, Vienna, Austria, 23–28 Apr 2023, EGU23-3868, https://doi.org/10.5194/egusphere-egu23-3868, 2023.

Soil organic matter (SOM) is a key player in soil functioning and services in forest lands, which had been subject to accelerated land degradation particularly in karst terrain in Southwest China. So far, there had been poor knowledge of pool and molecular composition of SOM associated with soil aggregates across lithologic origins of karst soil. In this study, undisturbed topsoil (0-10 cm) samples were collected in forest lands on sandstone (SS), dolomite (DS) and limestone (LS) sedimentary rocks in a karst terrain from Guizhou, Southwest China. Changes in SOM pool distribution and molecular composition of water-stable aggregates were explored using size and density fractionation and GC/MS detection of extracted biomarkers. The OC content ranged from 41.05 g kg-1 on SS to 50.94 g kg-1 while the mean weight diameter of sand-free soil water-stable aggregates ranged from 420.9 μm on SS to 544.4 μm on DS, across the lithologic sequence. With biomarker molecular assay, the higher SOC storage was relevant to the higher abundance of plant-derived organics (lignin, cutin, suberin, wax and phytosterols) in macro- and micro- aggregates. Whereas, the higher OC in silt & clay fraction of topsoil on DS and LS could be explained by the higher abundance of microbial lipids plus cutin and suberin. Also, the higher ratio of (Ad/Al)v to (Ad/Al)s of silt-clay fraction pointed to a stronger degradation of lignin thereby. Thus, the forest soil of dolomite and limestone origin preserved a relatively high level of SOC storage in topsoil, mainly with accumulation of POC physically protected in macro- and micro- aggregates. Moreover, the high SOC of topsoil on dolomite could also be attributed to enrichment of SOC in the clay silt fraction, mainly with mineral association of microbially degraded OCs.

How to cite: Lin, Q., Chen, S., Feng, X., and Pan, G.: Pool distribution and molecular composition of organic matter among water-stable aggregate size fractions of karst topsoil across a lithologic sequence from Guizhou, Southwest China, EGU General Assembly 2023, Vienna, Austria, 23–28 Apr 2023, EGU23-3957, https://doi.org/10.5194/egusphere-egu23-3957, 2023.

EGU23-5557 | Orals | SSS5.3

Tracing sources and turnover of soil organic matter in a long-term irrigated dry forest - a non-exchangeable hydrogen isotope approach 

Claudia Guidi, Marco Lehmann, Katrin Meusburger, Matthias Saurer, Valentina Vitali, Martina Peter, Ivano Brunner, and Frank Hagedorn

Soil organic matter (SOM) originates from various sources such as foliar litter, roots and microbial (e.g. fungal) components. The relative sources contribution represents one of the key unknowns in SOM dynamics. Our study aimed to explore whether stable isotope ratios of non-exchangeable hydrogen (Hn) bound to organic matter can be used to differentiate SOM sources, since natural 2Hn abundance can strongly differ between root and foliar tissues. We also investigated if long-term irrigation with 2H-depleted water in a pine forest can be used to track Hn incorporation into organic matter inputs and eventually in the soil pools.

In a 17-year-long irrigation experiment in a dry pine forest, we assessed variations in natural abundance of 2Hn, 13C, and 15N in SOM sources (foliar litter, fine roots, fungal mycelia), decomposing litter, soil (organic layers and uppermost 5 cm-mineral soil) and particle-size fractions. We then applied a Bayesian mixing model (including δ2Hn,δ13C, and δ15N) to estimate the relative sources contribution to SOM.

Natural 2Hn abundance was significantly higher in roots vs. foliar litter (up to +39‰), and in fungal mycelia vs. roots (up to +41‰). Results from Bayesian mixing model suggest that foliar litter contributed to approximately 68 ± 10% of SOM in organic layers and in coarse particulate organic matter (POM). Foliar litter and roots contributed similarly to upper 2 cm of mineral soil (46 ± 11%), while 2-5 cm of mineral soil were largely derived from roots (61 ± 13%). Fungal mycelia contributed to 18 ± 8% of mineral-associated organic matter (MOM), while only to 1-2% of coarse and fine POM. Bayesian mixing models provided only a general indication of the sources contribution to SOM, also considering that isotopic signatures shifted during decomposition. Measurements of isotope signatures in microbial necromass might allow a more accurate assessment of the different SOM sources contribution.

The δ2Hn depletion of soil water under irrigation was paralleled by a comparable decrease in δ2Hn of roots (~12‰). In comparison, the natural 2Hn abundance in fresh needles and foliar litter decreased less strongly (~ 7‰ and 4‰, respectively), likely due to photosynthetic adjustments that may have counterbalanced the irrigation water 2H-depletion. Similar to soil water 2H-depletion, δ2Hn values in coarse POM were 11‰ lower in irrigated vs. dry plots, suggesting that nearly all organic Hn turned over or exchanged with soil water in less than two decades. In contrast, δ2Hn values in fine POM and MOM decreased only by 3‰ under irrigation, which indicate that these fractions comprise slower cycling Hn pools.

Our study showed that the natural 2Hn abundance represents a promising tool to differentiate among SOM sources. While 13C and 15N did not clearly separate between roots and foliar litter, Hn isotopic signatures allowed a good discrimination between SOM sources. In addition, long-term irrigation can provide a potential in situ 2H-labelling of SOM, which may help to examine organic Hn turnover rates across SOM pools.

How to cite: Guidi, C., Lehmann, M., Meusburger, K., Saurer, M., Vitali, V., Peter, M., Brunner, I., and Hagedorn, F.: Tracing sources and turnover of soil organic matter in a long-term irrigated dry forest - a non-exchangeable hydrogen isotope approach, EGU General Assembly 2023, Vienna, Austria, 23–28 Apr 2023, EGU23-5557, https://doi.org/10.5194/egusphere-egu23-5557, 2023.

The sequestration of carbon in the form of organic compounds in the soil is considered one of the main strategies for mitigating climate change. Mountain ecosystems have a great potential to store soil organic carbon (SOC) due to relatively lower temperatures and higher precipitation, which slow down the rate of organic matter decomposition. However, mountains are also regions particularly vulnerable to changes caused by direct and indirect human activity, in particular climate change and land cover change. All these changes have an impact on soil properties and thus on SOC stocks and their stability. One of the changes that has been particularly evident in mountainous regions in recent decades is the rapid succession of forests over grasslands, due to the land abandonment and the effects of global warming. In addition, the soil cover of mountainous regions is characterized by a large natural diversity of soil-forming processes, which is reflected in differences in the SOC sequestration potential. Thus, the aim of this research was to determine the effect of different soil-forming processes compared to different land cover on SOC stock and SOC stability. 
The SOC stock was measured in soils subjected to various soil-forming processes (podzolization, brunification, peat accumulation) and with different land cover (ancient forests, succession forests, meadows) in three similar study areas in the Carpathians (S Poland). The highest SOC stocks in the first 30 cm of soil were found in ancient forests (between 4.2 kg m-1 and 8.8 kg m-1) and the lowest in meadows dominated by tall-grass communities (1.3–2.0 kg m-1). The SOC stock was significantly higher in Podzols than in Cambisols and Histosols; however, most of the soils subjected to podzolization were found in forests. In addition, in mineral soils with contrasting pedogenic pathways (Podzols and Cambisols) soil organic matter fractionation was carried out. The preliminary results indicate that Podzols are characterized by much higher SOC content outside water-stable aggregates and in light fractions (particulate organic matter), which suggests relatively a weaker stability of organic matter in this type of soils than in Cambisols.
This project has received funding from the European Union’s Horizon 2020 research and innovation programme under grant agreement No 952327 (HES-GEO) and has been supported by a grant from the Priority Research Area Antropocene (Young Labs) under the Strategic Programme Excellence Initiative at Jagiellonian University.

How to cite: Musielok, Ł., Stolarczyk, M., Rudnik, A., and Buczek, K.: The role of soil-forming processes and changes in land cover in the storage and stabilization of soil organic carbon - preliminary results from the Carpathians (Southern Poland), EGU General Assembly 2023, Vienna, Austria, 23–28 Apr 2023, EGU23-6229, https://doi.org/10.5194/egusphere-egu23-6229, 2023.

EGU23-6849 | ECS | Posters on site | SSS5.3

Complementarity and drivers of thermal and physical soil organic carbon fractions at the scale of mainland France 

Amicie Delahaie, Lauric Cécillon, Claire Chenu, Dominique Arrouays, Line Boulonne, Claudy Jolivet, Céline Ratié, Nicolas Saby, Marija Stojanova, Antonio Bispo, Manuel Martin, Pierre Arbelet, Jussi Heinonsalo, Christopher Poeplau, Kristiina Karhu, Pierre Roudier, Samuel Abiven, Lorenza Pacini, and Pierre Barré

Assessing soil organic carbon biogeochemical stability is critical for estimating future changes in soil carbon stocks. Several methods for the assessment of soil organic carbon (SOC) biogeochemical stability have been proposed but very few can be implemented on large sample sets. Indeed, to date, only simple physical fractionation protocols (e.g. Lavallee et al., 2020) and Rock-Eval® thermal analysis techniques (Delahaie et al., 2022, SOIL discussion) have been implemented on data sets larger than a few hundred samples. Simple fractionation techniques allow separating a particulate organic carbon fraction (POC; considered labile) and an organic fraction associated with minerals (MaOC; considered more stable). Regarding thermal analyses, Rock-Eval® results associated to the PARTYsoc machine-learning model (Cécillon et al., 2021) provide a measure of the active (mean residence time of ca. 30 years) and centennially stable SOC fractions.

In this study, we present the results of physical fractionations performed on ca. 1000 samples and thermal analyses performed on ca. 2000 samples from French mainland topsoils (RMQS program). We compare the amount and the drivers of each fraction. Our results show that most of the MaOC fraction is not stable at a centennial timescale. However, we show using a Random Forest model that the MaOC content and the centennially stable SOC content are similarly influenced by a common set of drivers: clay, pH and climatic conditions (mean annual temperature and mean annual precipitation). Finally, we discuss the complementarity of these two types of relatively high-throughput fractionation protocols.


References

  • Cécillon, L., Baudin, F., Chenu, C., Christensen, B. T., Franko, U., Houot, S., Kanari, E., Kätterer, T., Merbach, I., van Oort, F., Poeplau, C., Quezada, J. C., Savignac, F., Soucémarianadin, L. N., & Barré, P. (2021). Partitioning soil organic carbon into its centennially stable and active fractions with machine-learning models based on Rock-Eval® thermal analysis (PARTY SOC v2. 0 and PARTY SOC v2. 0 EU). Geoscientific Model Development14(6), 3879-3898.
  • Delahaie, A. A., Barré, P., Baudin, F., Arrouays, D., Bispo, A., Boulonne, L., Chenu, C., Jolivet, C., Martin, M. P., Ratié, C., Saby, N. P. A., Savignac, F., & Cécillon, L. (2022). Elemental stoichiometry and Rock-Eval® thermal stability of organic matter in French topsoils. EGUsphere, 1-31.
  • Lavallee, J. M., Soong, J. L., & Cotrufo, M. F. (2020). Conceptualizing soil organic matter into particulate and mineral‐associated forms to address global change in the 21st century. Global Change Biology26(1), 261-273.

How to cite: Delahaie, A., Cécillon, L., Chenu, C., Arrouays, D., Boulonne, L., Jolivet, C., Ratié, C., Saby, N., Stojanova, M., Bispo, A., Martin, M., Arbelet, P., Heinonsalo, J., Poeplau, C., Karhu, K., Roudier, P., Abiven, S., Pacini, L., and Barré, P.: Complementarity and drivers of thermal and physical soil organic carbon fractions at the scale of mainland France, EGU General Assembly 2023, Vienna, Austria, 23–28 Apr 2023, EGU23-6849, https://doi.org/10.5194/egusphere-egu23-6849, 2023.

EGU23-7186 | ECS | Posters on site | SSS5.3

Soil organic matter as a mediator of energy fluxes - a new perspective 

Anna Gunina and Yakov Kuzyakov

The transformation of “energy to (soil organic) matter’’ has long been the focus of scientific attention, but a definitive conceptual framework does not yet exist. Following the classical definition of energy given by Odum and Odum (1977) and the principles and laws of energy, we have developed an experiment-based review of the complex process of microbial conversion of energy and carbon (C) from litter to soil organic matter (SOM). Based on the transformation rate of plant residues, the amount of plant-derived energy persisting in soil (after one year) ranges from 7 to 20 % of total energy input depending on the plant community (for example, spruce and broadleaf forests and grasslands were taken). This represents 0.8-10 % of the energy already stored in SOM but only adds 0.4-5 % C to the existing SOM pool. We have introduced two new parameters - energy quality representing primarily substance, and energy availability representing the ability of microorganisms to utilize that substance (or pool of substances) under actual soil conditions. According to these parameters, we have assigned the main classes of organic substances to one of the three groups that show the availability of energy stored in microorganisms. When the energy availability is >1, microorganisms gain more energy than invest by the decomposition of organic substances; when energy availability is <1, then energy investment is required for the co-mining of nutrients, and some compounds are unsuitable for energy mining due to low efficiency, and in this case, they will be partially decomposed by co-metabolism (no energy gain). We have estimated the energy investment of soil microorganisms for exoenzyme production and concluded that the disadvantage of enzymatic degradation could explain the ‘stability’ of the SOM because the energy input (investment) required for degradation exceeds the energy gain. Following the linear decrease in energy density (by 106 kJ mol-1 C) of a broad range of organic substances per nominal oxidation state of C (NOSC) unit upon oxidation and experimental data on litter decomposition, we have developed the concept showing changes in the NOSC and the energy content of plant residues during decomposition and formation of SOM. Mineralization, recycling, and accumulation processes control energy and NOSC changes in organic pools. Mineralization processes lead to energy losses and an increase in NOSC, while SOM accumulation increases energy content and decreases NOSC. Recycling can shift both the energy content and NOSC values depending on the environmental conditions of the soil and the quality/quantity of litter input. As a result, the SOM pool is different from the initial litter in the energy content and NOSC. The SOM has a more diverse molecular composition but a narrower range of NOSC values than plant residues, consists of microbial necromass and substances recycled by microorganisms, and contains, on average, substances with a higher energy content than the initial plant residues. Based on the developed concept, we have concluded that plant-derived C and energy that persist in the form of SOM ensure energy fluxes in the soil system.

How to cite: Gunina, A. and Kuzyakov, Y.: Soil organic matter as a mediator of energy fluxes - a new perspective, EGU General Assembly 2023, Vienna, Austria, 23–28 Apr 2023, EGU23-7186, https://doi.org/10.5194/egusphere-egu23-7186, 2023.

EGU23-7318 | ECS | Orals | SSS5.3

Soil organic matter stability decreases with increasing urbanization in highly weathered rainfed tropical arable soils 

Stephen Boahen Asabere, Axel Don, Tino Peplau, and Daniela Sauer

Urbanization is a major land use change factor affecting soils. There is little understanding of how expansions of tropical West African cities have affected soil organic matter (SOM) composition and dynamics. In such cities, urban agriculture is common, playing an essential role in food security and urban sustainability. However, tropical soils tend to have low nutrient contents and cation exchange capacity. Thus, management strategies that enhance soil fertility and carbon (C) sequestration are needed. Developing such strategies requires a thorough understanding of how SOM dynamics alter in response to urban growth. Here, our objective was to assess how urbanization has affected the relatively stable mineral-associated-SOM (MAOM) and the labile particulate-SOM (POM) fractions in rainfed urban arable maize fields of Kumasi, a typical expanding city in Ghana (West Africa).

Using a grid-based satellite approach, and keeping other factors constant (including climate, topography, parent material and soil type), we took topsoil samples (0–10 cm) along an urban-intensity (UI) gradient, distinguishing: (i) low UI, located >400 m away from any primary road and having been under urbanization for <30 years, (ii) mid-low UI, located ≤400 m from a primary road and having been under urbanization for <30 years, (iii) mid-high UI, located >400 m from primary road and having been under urbanization for ≥30 years, (iv) high UI, located within ≤400 m from a primary road and having been under urbanization for ≥30 years. SOM fractions were isolated from the soils using a size separation approach, whereby the sand-sized fraction (0.063 - 2 mm) was regarded as POM and the clay- and silt-sized fraction (<0.063 mm) as MAOM. Prepared samples were ultimately analyzed for SOC using a Leco temperature ramp C analyzer, where a temperature threshold of 600 ºC was used to separate organic from inorganic C.

We found that mean SOC contents of the POM fraction increased markedly from 7.7 g kg-1 in the low UI topsoils to 13 g kg-1 in their high UI counterparts, suggesting an increase in POM with increasing urbanization. This trend was not observed for the MAOM that showed SOC contents of 4.5, 4.1, 4.9, and 4.1 g kg-1 for the low, mid-low, mid-high, and high UI topsoils, respectively. Moreover, the share of SOC contents of POM in the bulk SOC increased from 51% in the low UI topsoils to 64% in the high UI topsoils, whereas that of MOAM decreased by 6% from 31% to 25%, respectively. These findings suggest that while there is evidence of strong anthropogenic contributions of SOM to urban arable soils, urbanization does not seem to promote SOC storage in the relatively stable MAOM fraction. Consequently, rainfed urban arable soils in Kumasi will need management interventions for keeping appropriate long-term SOM levels to maintain soil functions.       

How to cite: Asabere, S. B., Don, A., Peplau, T., and Sauer, D.: Soil organic matter stability decreases with increasing urbanization in highly weathered rainfed tropical arable soils, EGU General Assembly 2023, Vienna, Austria, 23–28 Apr 2023, EGU23-7318, https://doi.org/10.5194/egusphere-egu23-7318, 2023.

EGU23-7982 | ECS | Posters on site | SSS5.3

Formation of organo-Fe (oxyhydr)oxide interactions during the first stages of Martian regolith simulant terraforming 

Beatrice Giannetta, Antonio G. Caporale, Danilo Oliveira De Souza, Paola Adamo, and Claudio Zaccone

Future long-term space missions beyond Low Earth Orbit (e.g., to Mars) depend on the development of bioregenerative life support systems able to produce food crops based on in situ resource utilization. Mars regolith potentially contains most of the essential nutrients for plant growth, except for organic matter (OM). Several strategies and treatments can be applied to improve nutrient deficiency of simulants and enhance their performance as plant growth substrates. Although Mars regolith simulants have been characterized by mineralogical, physico-chemical and hydraulic properties, no data are available to date in the scientific literature about the stabilization of exogeneous OM by minerals, including iron (Fe) oxides, over time.

This study aims at understanding the mineral transformation and OM turnover in the early stages of terraforming. The Mojave Mars Simulant MMS-1, alone (R100) and with a commercial compost 70:30 v:v (R70C30), was compared to a fluvial sand, alone and with compost (S100 and S70C30). Potato was grown on these substrates for 99 days in greenhouse. Samples were fractionated, obtaining particulate OM (POM) and mineral associated OM (MAOM), andcharacterized for total nitrogen and organic carbon (OC), total element concentration (ICP-OES) and by Fe K-edge X-ray absorption near edge structure (XANES) and extended X-ray absorption fine structure (EXAFS).

In the whole medium, OC increased in S70C30 (10×) and R70C30 (25×). As expected, most of the OC accumulated in the POM fraction of both growing media (10× in S70C30 and 20× in R70C30), while OC in the MAOM was 3-times higher in R70C30 than in S70C30. Chlorite, smectite and goethite were the main Fe species in S100, according to XANES, while Fe(III)-OM was found in both fractions of S70C30. Moreover, according to EXAFS, hematite occurred in POM, whereas goethite in MAOM. XANES revealed the occurrence of smectite, maghemite and ferrihydrite in R100, and of nontronite and hematite in the MAOM and POM, respectively.

Revealing Fe species involved in the formation of organo-mineral interactions will help to identify the main critical aspects and future challenges related to sustainable space farming improving the in-situ use of Martian resources.

How to cite: Giannetta, B., Caporale, A. G., Oliveira De Souza, D., Adamo, P., and Zaccone, C.: Formation of organo-Fe (oxyhydr)oxide interactions during the first stages of Martian regolith simulant terraforming, EGU General Assembly 2023, Vienna, Austria, 23–28 Apr 2023, EGU23-7982, https://doi.org/10.5194/egusphere-egu23-7982, 2023.

EGU23-8025 | ECS | Orals | SSS5.3

Is the additional organic carbon stored thanks to alternative cropping systems and organic waste products application predominantly stable at a decadal timescale? 

Tchodjowiè Israel Kpemoua, Pierre Barré, Sabine Houot, François Baudin, Cédric Plessis, and Claire Chenu

The implementation of agroecological practices can lead to an additional soil organic carbon (SOC) storage. The carbon sink effect will be more effective, even in the short and medium term, if the additional storage is realized in the form of persistent organic carbon (OC) and not in labile OC. The objective of this study was to evaluate the biogeochemical stability of additionally C stored by agroecological practices. Biogeochemical stability was assessed using particles size and density fractionation and Rock-Eval (RE) thermal analyses with PARTYsoc machine learning model. Samples were collected from the QualiAgro experiment, where organic wastes products (OWPs) including biowaste compost (BIOW), residual municipal solid waste compost (MSW) and farmyard manure (FYM) were applied, and from the La Cage experiment, where conservation (CA) and organic (ORG) agriculture had been established for 20 years. The plots that received the OWPs showed that 60-66% of the additional C was stored in mineral-associated organic matter (MAOM-C) and 29 - 39% in particulate organic matter (POM-C), whereas in CA and ORG, 77 - 84% of the additional C was stored in MAOM-C versus 15 - 23% in POM-C. While leading to additional C stocks of similar sizes, MSW and FYM exhibited higher proportions of the additionally stored C as POM-C (39 and 29% respectively) compared to CA (15%). This suggests a recalcitrance of POM under OWPs management compared to CA. The PARTYSOC model using RE thermal analysis parameters allows to predict the active (30 - 40 years) and stable (>100 years) carbon pools as defined in the AMG model. The results revealed that most, if not all, of the additional C belonged to the active C pool. These findings suggest that although additional SOC is mainly associated with MAOM-C, it is probably not stored in a form with a mean residence time exceeding ~30 years. The agroecological practices implemented in both long-term field experiments have resulted in substantial short-term additional C storage, but this storage will only be maintained at a high level if these storing practices are continued.

How to cite: Kpemoua, T. I., Barré, P., Houot, S., Baudin, F., Plessis, C., and Chenu, C.: Is the additional organic carbon stored thanks to alternative cropping systems and organic waste products application predominantly stable at a decadal timescale?, EGU General Assembly 2023, Vienna, Austria, 23–28 Apr 2023, EGU23-8025, https://doi.org/10.5194/egusphere-egu23-8025, 2023.

EGU23-8035 | ECS | Posters on site | SSS5.3

13C natural abundance for analysis of steps of organic carbon transformation in soil: application for various ecosystems 

Ying Wang, Anna Gunina, and Yakov Kuzyakov

Following the developed concept of carbon (C) flows during soil organic matter (SOM) formation, from which the probable C pathways between the aggregates and SOM fractions can be suggested based on the natural changes of the 13C/12C ratios, we have prepared the review based on 42 publications. The data were collected from the existing databases using the following keywords: “soil organic matter fractions and 13C”, “density fractionation and 13C”, and “soil aggregates and 13C”; publications contained the data from forest, shrubland, grassland, and cropland ecosystems that were located in the Temperate, Mediterranean, subtropical and tropical climatic zones were chosen; only the top 20 cm were considered. Besides the δ13C data, the main soil properties, including pH, total C and nitrogen contents, texture, and the dominant type of soil minerals, were collected. All data for the isotopic composition of aggregates (>2000, 250-2000, 52-250, and <53 µm) and density fractions (<1.4, 1.4-1.6, 1.8-2.0, and >2.2 g cm-3) were normalized to the δ13C values of bulk soils. The preliminary analyses have shown that the isotopic composition of density fractions separated from the soils allocated in temperate and Mediterranean climates followed the previously established order, namely was getting heavier with the increase of particle densities. In contrast, density fractions separated from the soils of subtropical and tropical zones did not show prominent trends, or isotopic composition showed the enrichment in 12C with increased particle density. The isotopic composition of fractions separated from forest soils was also found with more minor variations compared to cropland and grassland. The data related to the probability of C flow between the density fractions and aggregates during SOM formation were also calculated and will be presented, as well as the concept explaining the effect of land use and climatic variables on the changes of the isotopic composition of density fractions and aggregates.

How to cite: Wang, Y., Gunina, A., and Kuzyakov, Y.: 13C natural abundance for analysis of steps of organic carbon transformation in soil: application for various ecosystems, EGU General Assembly 2023, Vienna, Austria, 23–28 Apr 2023, EGU23-8035, https://doi.org/10.5194/egusphere-egu23-8035, 2023.

EGU23-8543 | ECS | Orals | SSS5.3

Organic carbon stabilisation mechanisms in estuarine marsh soils: Effect of salinity and flooding frequency 

Friederike Neiske, Joscha N. Becker, Maria Seedtke, Daniel Schwarze, and Annette Eschenbach

The capability of coastal wetland soils to store large amounts of organic carbon (OC) has been increasingly recognised. Stabilisation mechanisms (e.g. aggregation or mineral association) and stability of organic matter (OM) (recalcitrant vs. labile) are important features for the long-term storage of soil organic carbon (SOC). In estuarine marshes, SOC storage is dominated by a complex and dynamic interaction of abiotic conditions such as tidal inundation or changes in salinity. However, little is known on OC stabilisation and stability in these transitional ecosystems and how they are affected by system-specific characteristics. Therefore, our aim was to assess the effect of flooding and salinity on (i) OC stabilisation by aggregation and mineral association and (ii) the stability of the OC pool in estuarine marsh soils.

We analysed topsoil (0 – 10 cm) and subsoil (10 – 30 cm) samples from 9 marsh zones along the salinity gradient (salt, brackish and freshwater) and flooding gradient (pioneer zone, low and high marsh) of the Elbe Estuary for their SOC contents, OC stabilisation mechanisms (density fractionation), OC stability (incubation with one- and two-compartment model fits) and dissolved organic carbon (DOC) concentrations.

Total SOC contents were highest in the freshwater marsh and decreased towards topsoils with higher salinity. Flooding frequency had no uniform effect on SOC contents: While there was a positive tendency with decreasing flooding frequency, subsoils of the freshwater marsh showed the opposite trend. Total SOC contents were positively correlated with mineral-associated OC (CMAOM) and pedogenically unprotected particulate OM (CfPOM). The highest proportion of CMAOM was found in topsoils of freshwater marshes and it decreased towards higher salinities in topsoils of high marshes and pioneer zones. The OM protection by aggregation (CoPOM) increased in topsoils of high marshes. The proportion of CfPOM was less directly affected by salinity and flooding than by the CN ratio of the aboveground biomass (CNlitter). Furthermore, CfPOM correlated positively with the potential mineralisable C (Cpot) and labile C (Clabile) and negatively with the recalcitrant C pool (Crecalcitrant) that were derived from the one- and two-compartment models. Labile C, Cpot and Crecalcitrant were also strongly influenced by CNlitter. Moreover, Crecalcitrant was linked to the proportion of CMAOM. Concentrations of DOC increased with total SOC and Cpot but decreased with CoPOM.

We conclude that SOC stabilisation in the Elbe Estuary is mainly related to mineral association of OM. With increasing terrestrial influence, physical protection in aggregates becomes more important. Besides these pedogenic stabilisation mechanisms, recalcitrance is strongly determined by vegetation characteristics.

How to cite: Neiske, F., Becker, J. N., Seedtke, M., Schwarze, D., and Eschenbach, A.: Organic carbon stabilisation mechanisms in estuarine marsh soils: Effect of salinity and flooding frequency, EGU General Assembly 2023, Vienna, Austria, 23–28 Apr 2023, EGU23-8543, https://doi.org/10.5194/egusphere-egu23-8543, 2023.

EGU23-10208 | ECS | Orals | SSS5.3

Assessing soil carbon cycling as a function of intercropped maize-forage systems and nitrogen rates using 13C natural abundance 

Laudelino Vieira da Mota Neto, Marcelo Valadares Galdos, Vladimir Eliodoro Costa, and Ciro Antonio Rosolem

Intercropping maize along with forages fertilized with N can potentially increase soil carbon sequestration, contributing to climate change mitigation. However, there is a lack of knowledge if the input of new C sources in this production system impacts the cycling of the original soil C and SOM fractions, especially in tropical soils. To investigate this, soil samples were taken up to 80 cm depth from a 7-year experiment where ruzigrass (Urochloa ruziziensis), palisadegrass (Urochloa brizantha) and Guinea grass (Megathyrsus maximus) were intercropped with maize fertilized with (270 kg N ha-1) or without N. In these samples, SOM was fractionated by size into particulate (POM) and mineral-associated (MAOM) organic matter and submitted to 13C natural abundance measurements. Intercropping with Guinea grass reduced the δ13C values in comparison to ruzigrass and palisadegrass, especially under N fertilization. Forage grasses reduced the δ13C values up to 40cm, indicating the contribution of the grasses for the cycling of the original carbon of the soil. Nitrogen supply increased the contribution of C from the grasses to the POM fraction if compared to the no N application. Further, 13C  in POM at 0-10 and 10-20 cm differed from deeper layers, probably due the above- and belowground C inputs on the uppermost soil layers. Under N supply, Guinea grass lowered the δ13C value, which did not occur in the palisade and ruzigrass treatments. In contrast to POM, the δ13C values of MAOM decreased in all depths, with the highest change at the uppermost soil layer. Our findings showed that intercropping influenced the cycling of total C and SOM fractions , with differences in the soil profile. However, only Guinea grass changed δ13C values under N supply.

How to cite: Vieira da Mota Neto, L., Valadares Galdos, M., Eliodoro Costa, V., and Antonio Rosolem, C.: Assessing soil carbon cycling as a function of intercropped maize-forage systems and nitrogen rates using 13C natural abundance, EGU General Assembly 2023, Vienna, Austria, 23–28 Apr 2023, EGU23-10208, https://doi.org/10.5194/egusphere-egu23-10208, 2023.

EGU23-10362 | ECS | Orals | SSS5.3

Divergent controls on particulate and mineral-associated organic carbon formation and persistence 

Paige Hansen, Alison King, Jocelyn Lavallee, Meagan Schipanski, and M. Francesca Cotrufo

Identifying global controls on soil carbon (C) storage, as well as where soil C is most vulnerable to loss, are essential to realizing the potential of soils to mitigate climate change via C sequestration. However, we currently lack a comprehensive understanding of the global drivers of soil C storage, especially with regards to particulate (POC) and mineral-associated organic carbon (MAOC). To better understand global controls on these two C fractions, we synthesized climate, and net primary production (NPP), and soils data from 73 published studies and databases. This large dataset is representative of multiple land cover types, including broadleaved and coniferous forests, grasslands, shrublands, wetlands, tundra, and wetlands. We then applied structural equation modeling (SEM) to assess hierarchical, interactive controls on global POC and MAOC pools (i.e., g POC or MAOC per kg soil) in topsoils. Our SEM tested relationships between NPP and climate (i.e., mean annual temperature (MAT) and effective moisture, assessed as mean annual precipitation minus potential evapotranspiration), as well as the extent to which climate and NPP, along with soil texture and pH, govern POC and MAOC storage. We found that NPP is positively related to MAT and effective moisture. Additionally, POC storage is negatively related to both MAT and pH, while MAOC storage is positively related to NPP and effective moisture, but negatively related to soil % sand. Given that temperature and pH impose constraints on microbial decomposition, these results indicate that POC storage is primarily controlled by C output limitations. In contrast, strong relationships with variables related to plant productivity constraints and to mineral surfaces available for sorption indicate that MAOC storage is primarily controlled by climate-driven C input limitations and C stabilization mechanisms. Together, we demonstrate that divergent controls govern C storage in POC and MAOC, and that these controls are consistent across multiple ecosystem types.

How to cite: Hansen, P., King, A., Lavallee, J., Schipanski, M., and Cotrufo, M. F.: Divergent controls on particulate and mineral-associated organic carbon formation and persistence, EGU General Assembly 2023, Vienna, Austria, 23–28 Apr 2023, EGU23-10362, https://doi.org/10.5194/egusphere-egu23-10362, 2023.

A wide range of image-based techniques revealed mounting evidence of a heterogeneous arrangement of mineral-associated organic matter (OM) in soils at the microscale and nanoscale. Spectromicroscopic approaches using such as NanoSIMS, STXM-NEXAFS, AFM, STEM-EELS, and others have provided insights about a patchy and piled-up arrangement of OM. This arrangement is determined by different local OM properties and mineral composition as well as OM-OM interactions. The emerging conceptual framework of the microscale arrangement of OM affects our understanding of soil functions: By compartmentalizing and decoupling local carbon sequestration in the mineral soil matrix, by localizing the mechanical stabilization of soil structure, by altering surface properties and re-distributing ion exchange sites, and by shaping distinct biotic microenvironments. After an overview on the spectromicroscopic evidence, this contribution will illustrate the emerging conceptual framework of localized soil functions, and highlight opportunities for research approaches based on the patchy and piled-up arrangement of OM at the microscale and nanoscale.

How to cite: Schweizer, S.: Taking a closer look: How spectromicroscopic imaging of organo-mineral associations leads to a novel perspective on interrelated soil functions, EGU General Assembly 2023, Vienna, Austria, 23–28 Apr 2023, EGU23-11969, https://doi.org/10.5194/egusphere-egu23-11969, 2023.

EGU23-12085 | ECS | Orals | SSS5.3

Mineral type, land use, and management intensity drive the formation of mineral-associated organic matter in temperate soils 

Susanne Ulrich, De Shorn Bramble, Ingo Schöning, Robert Mikutta, Klaus Kaiser, and Marion Schrumpf

Formation of mineral-associated organic matter (MAOM) supports accumulation and stabilization of carbon in soil, and thus, is a key factor in the global carbon cycle. Little is known about the interplay of mineral type, land use, and management intensity on the extent of MAOM formation. We addressed this research question by exposing mineral containers with pristine minerals (goethite, as a representative of oxide-type mineral phases, and illite, representing layered aluminosilicate minerals) for five years to ambient soil conditions at 5 cm depth in 150 grassland and 150 forest plots in three regions across Germany. After recovery, the content of organic carbon (OC) of the minerals was determined by dry combustion. Results show that irrespective of land use and management intensity, more OC accumulated on goethite than illite (on average 0.23 and 0.06 mg m-2 mineral surface, respectively), demonstrating that mineral type was the most crucial factor for MAOM formation. Carbon accumulation was consistently greater in coniferous forests than in deciduous forests and grasslands. Structural equation models revealed that in grasslands, fertilization had contradictory effects on carbon accumulation, with the positive effect being mediated by enhanced plant productivity and the negative effect by reduced plant species richness. Overall, our results suggest that OC stabilization in soil is primarily driven by mineral type, in particular iron and other metal oxides. The mineral-driven MAOM formation is further modified by land use and management intensity.

How to cite: Ulrich, S., Bramble, D. S., Schöning, I., Mikutta, R., Kaiser, K., and Schrumpf, M.: Mineral type, land use, and management intensity drive the formation of mineral-associated organic matter in temperate soils, EGU General Assembly 2023, Vienna, Austria, 23–28 Apr 2023, EGU23-12085, https://doi.org/10.5194/egusphere-egu23-12085, 2023.

EGU23-12386 | Posters on site | SSS5.3

Hair-ice, fungal guttation droplets, ice ribbons and needle ice from a chemical perspective 

Diana Hofmann, Gisela Preuss, Pietro Fontana, and Christian Mätzler

As a result of global warming, now evident also in temperate latitudes, longer periods of snow-free winters, instead with plenty of precipitation are becoming increasingly common. If the temperatures then fall below freezing point, one can, with a little luck, discover hair ice - hair-like, flexible structures reaching up to 10 cm in length without any ramifications.

This natural phenomenon, already described in 1918 by Alfred Wegener, was a mystery for a long time. Only in the 21st century a fungus (Exidiopsis effusa) was discovered as the causative agent [1].

Hair ice develops exclusively on rotten hardwoods on/in which this fungus is present, at high humidity, preferably windless, and temperatures slightly below freezing. Once infected, corresponding branches can be repeatedly elicited hair-rise growth under optimal conditions (field & climate chamber). Hair ice, unlike frost needles, arises from the base. At the onset of hair-ice melt a very thin fibre becomes apparent, which carries brownish water drops. Melting water samples show complex mass spectra similar to dissolved organic carbon e.g. from terrestrial/ marine waters, soil extracts or aerosols.

Hair ice samples of various tree species were desalted, concentrated by solid phase extraction and subsequently analyzed by flow injection analysis in a Fourier Transform Ion Cyclotron Resonance Mass Spectrometer, equipped with an ESI source and a 7 T supra-conducting magnet (LTQ-FT Ultra, ThermoFisher Scientific) - the key technique for the analysis of complex samples, simultaneously providing molecular level details of thousands of compounds. As main result, complex, but almost identical spectra were found. For their chemical characterization van Krevelen diagrams, typical to classify samples regarding polarity and aromaticity were plotted. By comparison with references biopolymer substance classes were derived. As result, lignin and tannin could be detected as the main hair-ice substance classes, supposed to act as freezing catalyst as well as recrystallization inhibitor.

For the question, if and what happens in summer, we sampled in several years guttation droplets, too – of this fungus and for comparison from a fungus of another family. Both samples were carbon riche, but only the samples from Exidiopsis effusa show such a complex DOC-spectrum, but in contrast to hair ice peak depleted with mainly tannin assignment.

Popular scientific publications have led to an increasing interest in hair ice and related phenomena in recent years. We have received spectacular photos of various ice structures, followed by first samples of needle ice and ice ribbons. After initial measurements for their C content, HPLC-MS investigations still with a triple quadrupole mass spectrometer have been performed. For final analyses a cooperation with a FTICRMS working group is now sought.

[1] D. Hofmann, G. Preuss and C. Mätzler (2015) Biogeosciences 12: 4261–4273

How to cite: Hofmann, D., Preuss, G., Fontana, P., and Mätzler, C.: Hair-ice, fungal guttation droplets, ice ribbons and needle ice from a chemical perspective, EGU General Assembly 2023, Vienna, Austria, 23–28 Apr 2023, EGU23-12386, https://doi.org/10.5194/egusphere-egu23-12386, 2023.

EGU23-12839 | ECS | Orals | SSS5.3

Dynamics and stability of soil organic matter: climate vs. time 

Giorgio Galluzzi, César Plaza, Simone Priori, Beatrice Giannetta, and Claudio Zaccone

This study aims to investigate the mechanisms of soil organic carbon (SOC) sequestration with depth as a function of time and climate. Two chronosequences located along a climate gradient were investigated. The first chronosequence (ADI) consisted of fluvial terraces, whereas the second (LED) of fluvio-glacial terraces. Four sites (Q2, Q3, Q4 and Q5) located in 3 terraces (T1, T2, and T3), with age ranging from about 125,000 to 2,000 yr, were investigated for ADI, while 3 sites (Q1, Q2, and Q3) in 3 terraces (T1, T2, and T3, respectively), with age range from about 16,000 to 10,000 yr, were selected for LED. All sites were grasslands. Soil samples were collected (1 profile and 2 cores per site) by horizon, and each horizon sub-sampled by depth (each 5 cm). The sub-samples were characterized for pH, EC, total organic C, total N, texture, mineralogy, total and extractable elements, and for soil respiration. Particulate organic matter (POM) and mineral-associated organic matter (MAOM) were isolated and characterized by elemental and thermal analyses.

In ADI, the oldest site (ADIQ2) stocks 2 times more C in the topsoil (15 cm) than the youngest site (ADIQ5) (60 and 27 MgC/ha, respectively). Furthermore, in ADIQ3, 38% of the total SOC accumulated between 30 and 80 cm (48 MgC/ha). In LED, the youngest site (LEDQ3) shows the highest SOC stock to both 15 and 30 cm (86 and 138 MgC/ha, respectively). In LEDQ1, 46% of the total SOC accumulated between 30 and 90 cm (94 MgC/ha). Among sites having same age but different climate, LEDQ3 (the wettest and coldest site) stocks ~2 times more carbon than ADIQ3 (the driest and warmest site) to the first 30 cm of depth.

In LED, the ratio between the organic C in MAOM/POM in the topsoil ranges between 0.6 and 1.8, while in ADI between 1.1 and 3.9. Thermal indices (e.g., WL400-550/200-300, TG-T50) show that the stability of bulk SOM and pools generally increased with depth in ADI sites, whereas remained constant in LED. ADI soils had similar cumulative respiration (RHCUM), whereas LEDQ3 exhibited the highest RHCUM along the first 30 cm. Indeed, LEDQ3 had a 3× higher RHCUM than ADIQ3 in topsoil.

Our data show that significant amounts of organic C were accumulated in deeper soils (>30cm). Moreover, soil organic matter (SOM) stability, and especially that of MAOM, in ADI increased with depth. The relative contribution of POM to C storage was more important in LED than in ADI, especially in the topsoil. Overall, our data suggest that climate has a greater influence on the size of SOC stocks than age, which in turn exerts a major influence on the stability of SOM.

How to cite: Galluzzi, G., Plaza, C., Priori, S., Giannetta, B., and Zaccone, C.: Dynamics and stability of soil organic matter: climate vs. time, EGU General Assembly 2023, Vienna, Austria, 23–28 Apr 2023, EGU23-12839, https://doi.org/10.5194/egusphere-egu23-12839, 2023.

EGU23-13410 | ECS | Posters on site | SSS5.3

Turnover of soil organic matter and microbial biomass under C3-C4 vegetation change: implications for carbon sequestration in Mediterranean agricultural soils. 

Layla M. San-Emeterio, José Antonio González-Pérez, Rafael López-Núñez, Lorena M. Zavala, Yakov Kuzyakov, and Anna Gunina

 Carbon isotopic composition of soils subjected to C3–C4 vegetation change can be used to estimate C turnover in bulk soil, but more specifically in soil organic matter (SOM) pools with fast and intermediate turnover rates. Analysis of phospholipid fatty acids (PLFA) has been widely used to evaluate rapid changes in soil microbial populations. In this study we investigated the effect a C3–C4 vegetation change experiment, along with a sustainable practice versus tillage soil microbial community composition as well as their isotopic C composition by compound-specific PLFA 13C analysis.

Soils (Calcaric Cambisol) from an agricultural trial located in Southern Spain were sampled, which are characterized by high carbonate content (~27%) low fertility and low organic matter contents. The experimental trial consisted in replacing former C3 vegetation by maize crop (C4 plant) since February 2017, comprising two different treatments: A) after harvesting, maize surpluses were chopped and applied to surface soil, hereafter known as aboveground biomass “A” treatment; B) the total part of maize plant was left out after harvesting, including the roots, known as belowground biomass “B” treatment. Moreover, untreated soil was taken as control plots, “C”, where soil was tillaged and kept the same isotopic signature as the former land use. Composite soil samples (0-5 cm) were taken.

PLFA profiles revealed a great abundance of bacterial activity, comprising gram-positive and gram-negative, along with branched (i-14:0, i-&a- 15:0, i:16:0, i-&a- 17:0) and mono- and polyunsaturated groups (16:1n7, 18:2n6, 18:1w9c and 18:1w7c). Significant increase of fungal abundance in “B” treatment may indicate decrease of litter decomposability, which facilitates fungal development. The “A” treatment also indicated a greater microbial activity, though intermediate in most of the groups compared to control. Lastly, in control plots, it is observed a significant decrease of G- bacteria, which correlates well with lower C content. indicates the low amount of easily available root exudates (Gütlein et al., 2017), which are the preferred C source for this microbial group. On the other hand, significant 13C enrichment of PLFAs varied across microbial groups. “B” plots showed greater 13C contribution for fungi, whereas the application of aboveground biomass contributes greatly to the gram-positive and gram-negative bacteria. PLFA 13C mean residence times were much longer for bacteria compared to the rest of microbial groups.

Our results indicate that the addition of biomass in SOM-depleted agricultural soils resulted an increase of microbial biomass, denoting a predominant bacterial activity. Over 5 years of C3-C4 vegetation change, fungi and actinobacteria showed the fastest turnover rates compared to bacteria, which appeared to play a major role in the rapid acquisition of C into the soil microbial community. Fungi and actinobacteria appeared to have a delayed utilization of C or to prefer other C sources upon application of grounded biomass. Further discussion will be made on the implications of sustainable practices for enhancing C sequestration under Mediterranean climate.

How to cite: M. San-Emeterio, L., González-Pérez, J. A., López-Núñez, R., M. Zavala, L., Kuzyakov, Y., and Gunina, A.: Turnover of soil organic matter and microbial biomass under C3-C4 vegetation change: implications for carbon sequestration in Mediterranean agricultural soils., EGU General Assembly 2023, Vienna, Austria, 23–28 Apr 2023, EGU23-13410, https://doi.org/10.5194/egusphere-egu23-13410, 2023.

EGU23-13825 | Posters on site | SSS5.3 | Highlight

How does edaphic context affect soil organic matter persistence? 

Karen Vancampenhout, Judith Schellekens, Sascha Nijdam, Keunbae Kim, Maria I.J. Briones, Bart Muys, Ellen Desie, and Boris Jansen

European and Flemish climate-change policies aim to enhance carbon (C) storage in soils of conservation areas, including natural areas such as forests, grasslands and wetlands. Soil capability and condition however may impact C persistence and material cycles in soils, and therefore the sustainability of this policy effort, by making soil C stocks more vulnerable to climatic anomalies, shocks and disturbances. Edaphic limitations in terms of nutrients, acidity, temperature or moisture availability have been shown to affect soil C persistence, but processes behind this effect remain elusive and poorly quantified.

In this contribution, we therefore present several case studies in western European forests and wetlands, where we assess how the molecular composition of several soil organic matter fractions varies along gradients of soil cover, edaphic conditions and perturbation intensity. Furthermore, by comparing different fractions and markers, we evaluate the suitability of different methods to evaluate changes in soil carbon dynamics, as a tool to predict the potential impact of anthropogenic stresses and management interventions on soil carbon persistence.

How to cite: Vancampenhout, K., Schellekens, J., Nijdam, S., Kim, K., Briones, M. I. J., Muys, B., Desie, E., and Jansen, B.: How does edaphic context affect soil organic matter persistence?, EGU General Assembly 2023, Vienna, Austria, 23–28 Apr 2023, EGU23-13825, https://doi.org/10.5194/egusphere-egu23-13825, 2023.

EGU23-13926 | ECS | Orals | SSS5.3

The role of lignin in the saprotrophic degradation of plant biomass in boreal forest soil. 

Aswin Thirunavukkarasu, Mats Öquist, Jurgen Schleucher, Tobias Sparrman, Mattias Hedenstrom, Mats Nilsson, and Stefan Bertilsson

The amount of carbon stored in boreal forests soil as Soil organic matter (SOM) is significant. Carbohydrate polymers such as cellulose and hemicellulose constitute 40-50% of the SOM mass in the surface mor layer, even in SOM that has been decomposed for decades to centuries. This is in contrast to conceptual decomposition models assuming aromatic and aliphatic polymers to constitute the fraction of recalcitrant SOM. One prevailing view for support is that lignin manifest itself as a factor in the stabilization of carbohydrate polymers as SOM. However, detailed elucidation of how the complex array of molecular moieties making up SOM decompose over time is lacking. Here we investigated the effect of lignin content and composition during the progressive degradation of polymeric carbohydrates, lignin, and lipids in the lab during a year-long soil decomposition study using Aspen (Populus tremula) wood as a model substrate. To specifically address lignin decomposition we used a range of Aspen clones that varied naturally in their lignin content (high lignin 30% - low lignin 25%) with boreal coniferous forest soil obtained from the surface moor layer (O-horizon). The decomposition of the different molecular moieties of the model substrate was evaluated by Two-dimensional (2D) liquid state 1H–13C nuclear magnetic resonance (NMR) spectroscopy. In addition, the CO2 production during decomposition was monitored continuously and assays for exo-enzymatic activity was carried out at selected time points.

The NMR spectroscopy revealed that for different periods of decomposition, saprotrophic microorganisms preferred different monomers of polymeric lignin, carbohydrates, and lipids. The relative degradation of resinol, spirodienone, and cinnamyl alcohol were higher among lignin interlinkages and the relative degradation of p-hydroxybenzoate and syringyl were higher among lignin subunits. For carbohydrates, the relative degradation of mannose and glucose were higher than that of e.g. xylose. The relative degradation of unsaturated fatty acids was higher among lipids. The lignin: carbohydrates ratio decreased linearly over the period of decomposition. This showed that the initial degradation of lignin compounds was greater compared to the decomposition of carbohydrate compounds. The significant difference in the relative degradation of mannose among model substrate with different lignin content showed that lignin had no effect on cellulose degradation but may have had an effect on the preferential degradation of hemicelluloses. The high-resolution decomposition patterns we observe are crucial for obtaining a detailed mechanistic understanding of plant polymer decomposition by soil microorganisms during the initial stages of SOM genesis.


Keywords: Soil organic matter (SOM), Lignin, Carbohydrates, 2D NMR, Decomposition

How to cite: Thirunavukkarasu, A., Öquist, M., Schleucher, J., Sparrman, T., Hedenstrom, M., Nilsson, M., and Bertilsson, S.: The role of lignin in the saprotrophic degradation of plant biomass in boreal forest soil., EGU General Assembly 2023, Vienna, Austria, 23–28 Apr 2023, EGU23-13926, https://doi.org/10.5194/egusphere-egu23-13926, 2023.

EGU23-15659 | ECS | Posters on site | SSS5.3

SOC sequestration affected by fertilization in rice-based cropping systems over the last four decades 

Shuhui Wang, Nan Sun, Shuo Liang, Shuxiang Zhang, Jeroen Meersmans, Gilles Colinet, Minggang Xu, and Lianhai Wu

Enhancing soil organic carbon (SOC) stocks through fertilization and crop rotation will contribute to sustaining crop productivity and mitigating global warming. Although it is known that cropping systems may affect SOC stocks by influencing the balance between C input and C decomposition, only few studies focused on the impact of different rice cropping systems on SOC stock changes in paddy soils. In this study, we analyzed the differences in SOC stocks and their driving factors in the topsoil (0–20 cm) with various fertilization measures in two rice-based cropping systems (i.e. rice-wheat rotation and double rice rotation systems) over the last four decades from seven long-term experiments in the Yangtze River catchment. The treatments include no fertilizer application (CK), application of chemical nitrogen, phosphorus and potassium fertilizers (NPK) and a combination of NPK and manure (NPKM). Results showed that during the last four decades, the topsoil SOC stock significantly increased by 8.6 t ha-1 on average under NPKM treatment in rice-wheat system and by 2.5–6.4 t ha-1 on average under NPK and NPKM treatments in double rice system as compared with CK. A higher SOC sequestration rate and a longer SOC sequestration duration were found in NPKM treatment than that in NPK treatment in both cropping systems. The highest relative SOC stock percentage (SOC stock in fertilized treatments to CK) was observed under the NPKM treatment in both cropping systems, though no significant difference was found between these two cropping systems. However, the fertilization-induced relative increase of the SOC stock was 109.5% and 45.8% under the NPK and NPKM treatments, respectively in the rice-wheat system than that in the double rice system. This indicates that the rice-wheat system is more conducive for SOC sequestration. RF and SEM analyses revealed that the magnitude and influencing factors driving SOC sequestration varied between two systems. In the double rice system, continuous flooding weakens the influence of precipitation on SOC sequestration and highlights the importance of soil properties and C input. In contrast, soil properties, C input and climate factors all have important impacts on SOC sequestration in rice-wheat system. This study reveals that the rice-wheat system is more favorable for SOC sequestration despite its lower C input compared to the double rice system in China’s paddies.

How to cite: Wang, S., Sun, N., Liang, S., Zhang, S., Meersmans, J., Colinet, G., Xu, M., and Wu, L.: SOC sequestration affected by fertilization in rice-based cropping systems over the last four decades, EGU General Assembly 2023, Vienna, Austria, 23–28 Apr 2023, EGU23-15659, https://doi.org/10.5194/egusphere-egu23-15659, 2023.

EGU23-15729 | ECS | Orals | SSS5.3

Managed pastures enhance soil carbon stocks from degraded pasture in Ferralsol of Brazilian Cerrado 

Lucas Raimundo Bento, Steffen A. Schweizer, Patrícia P. A. Oliveira, José R. M. Pezzopane, Alberto C. de C. Bernardi, Ingrid Kögel-Knabner, and Ladislau Martin-Neto

The conversion of native vegetation into agricultural lands is often associated with a decrease in soil C. The soils from the Brazilian savannah (named Cerrado), with 200 million hectares, are rich in Fe and Al (hydr)oxides, which could result in more organo-mineral associations and lead to particularly high C storage. The changes in the C stocks from the conversion of native forest into degraded pasture (DP), and the adoption of proper management to recover DP and increase C stocks in such Ferralsols are not well understood. To provide insights into the drivers of C storage, this study compared the C stocks across depth in the top 1m and the distribution of C in the soil fractions 24 years after the adoption of different management systems in degraded pastures in the Brazilian Cerrado.

A DP area located in São Carlos, São Paulo, Brazil was converted into different management systems: (i) RMS: rainfed pasture with moderate animal stocking rate, (ii) RHS: rainfed pasture with higher animal stocking rate, and (iii) IHS:  irrigated pasture with higher stocking rate. As a control, the adjacent native vegetation (FO) was also evaluated. The adoption of management started in 1996 with RMS and in 2002 for RHS and IHS. Except for the DP, all areas were limed and N-fertilized. RMS with 200 kg N ha, RHS 400 kg N ha, and IHS with 600 kg N ha. Soil sampling was carried out in 2020 and the C stocks were evaluated up to 1 m deep. To state vegetation change from C3 (native forest) to C4 (introduced pasture) the isotopic natural abundance of 13C was analyzed. To evaluate the contribution of mineral-associated and particulate organic matter forms to C storage, we performed a physical fractionation by size and density with SPT 1.8 g cm-3, respectively.

Our results showed that the conversion of FO into DP decreased soil C stocks.  Otherwise, the adoption of management in DP with RMS and RHS increased C stocks achieving levels similar to FO. RMS showed the highest C stocks with the lower dosage of N-fertilizer and animal stocking rate. IHS area did not increase their C stocks compared to DP, which may be related to limited root growth after irrigation decreasing the C input. Around 50% of the C stocks in RHS and RMS systems are pasture-derived (C4 plants) according to the 13C abundance. This shows that half of C stocks from rainfed pastures is of preserved organic matter from previous FO. While in the IHS and DP systems, the organic matter composition is mainly pasture-derived. Our preliminary data showed that the RMS topsoil contained more free particulate organic matter than the FO, suggesting that the C stocks were enhanced mainly by pasture-derived biomass input. The contribution of mineral-associated organic matter still will be evaluated.

Our study shows that the recovery of degraded pasture soils by management leads to increased OC stocks derived from fertilized pasture but also higher maintenance of OC from FO.

How to cite: Bento, L. R., Schweizer, S. A., Oliveira, P. P. A., Pezzopane, J. R. M., Bernardi, A. C. D. C., Kögel-Knabner, I., and Martin-Neto, L.: Managed pastures enhance soil carbon stocks from degraded pasture in Ferralsol of Brazilian Cerrado, EGU General Assembly 2023, Vienna, Austria, 23–28 Apr 2023, EGU23-15729, https://doi.org/10.5194/egusphere-egu23-15729, 2023.

Under conservation agriculture (CA), soil aggregates physically protect soil organic C, creating microhabitats with heterogeneities in nutrient availability. These may become rich in microbial taxa with structured interconnections, and thus maintain the equilibrium between C sources and sinks. A long-term experiment on tillage and N fertilization located in the Mediterranean was used to investigate the microbiota within small macroaggregates (sM), and occluded microaggregates (mM). At surface layer N fertilization was the main driver of diversity of prokaryotes and fungi in soil aggregates, whereas at subsurface layer tillage intensity was the primary driver. Moreover, although along the soil profile a conserved core microbial community was found across managements in soil aggregates, some taxa were unique to certain managements. At surface layer, N fertilization significantly modified the prokaryotic community structure in sM and mM under conventional tillage, whereas in the subsurface layer, tillage modified the community structure of prokaryotes in both soil aggregates, and of fungi in mM. The fungal community structure in sM was strongly modified by the interaction between tillage and N fertilization at both soil layers and in mM only at surface layer. Overall sM had a higher diversity of prokaryotes and a lower diversity of fungi than mM. Small macroaggregates and mM had distinctive microbial community structures. Prokaryotic taxa, such as Actinobacteria, Chloroflexi and Thermomicrobia, and fungi, such as Agaricomycetes, Dydimellaceae, and Mortierellaceae, characterized sM, whereas others prokaryotes (Betaproteobacteria, Sphingobacteriia, Blastocatellia) and fungi (Sordariales, Lasiosphaeriaceae and Glomeraceae) characterized mM. Within- and cross-domain network were more complex in mM than sM at surface layer, and the opposite occurred at subsurface. Some prokaryotic and fungal taxa (Chloroflexi and Sordariomycetes), found abundant in hubs within soil aggregate networks, were consistently positively related to C cycling and soil structuring. We can therefore conclude that soil aggregation should be included in a more complete ‘multifunctional’ perspective of soil ecology, and that a full understanding of soil processes requires analyses emphasizing feedbacks between soil structure and soil microbiota, rather than a unidirectional approach simply addressing single members in bulk soil. As CA systems and soil structure were strongly connected to soil microbiome and function, the application of CA practices should be supported for the restoration of disturbed soils, the prevention of soil erosion and the enhancement of SOC storage. Overall, the higher diversity and differentiated soil microbial structures observed in minimum and fertilized tillage systems may offer biological buffering capacity and maintain agriculturally relevant soil functions. This study allows to improve the knowledge on taxa resistant and sensitive to modifications induced by tillage and N fertilization, according to soil aggregation size. We also demonstrate that linking taxonomy to function is a priority for explaining the ecological interactions that promote SOC accumulation in soil aggregates.

How to cite: Ercoli, L., Piazza, G., Helgason, T., and Pellegrino, E.: Microbiome structure and interconnection in soil aggregates across conservation and conventional agricultural practices allow to identify taxa related to soil functioning, EGU General Assembly 2023, Vienna, Austria, 23–28 Apr 2023, EGU23-16928, https://doi.org/10.5194/egusphere-egu23-16928, 2023.

EGU23-17105 | ECS | Orals | SSS5.3

Evidence for the diagenetic formation of fused aromatic ring structures in an organic soil 

Jeewan Gamage, James Longstaffe, Adam Gillespie, Andy Lo, Sameer Al-Abdul-Wahid, and Paul Voroney

Understanding the molecular make-up of recalcitrant organic matter (rSOM) is important to postulate the capability of soil organic matter (SOM) to sequester carbon and mitigate climate change. Humic acid (HA) extracted from the river bed sediment (RS) from the West Holland river was analyzed, aiming to characterize and quantify the fused ring aromatic structures (FRA) portion. FARs can be formed through condensation and polymerization reactions and act as an important skeletal structure of the rSOM which has a mean residence time >1000 years. We conducted a series of nuclear magnetic resonance (NMR) experiments, 13C Direct Polarization Magic Angle Spinning (DP-MAS) NMR spectroscopy, and Dipolar dephased (dd) DPMAS NMR, chemical shift anisotropy (CSA) cross-polarization (CP) total sideband suppression (TOSS) NMR experiment and a dd-CSA filtered CPTOSS to accurately quantify the proportion of FRAs in the sediment HA sample. We compared the proportions of the functional groups of the RS with the surface (0-20 cm, TS) and deep (>90 cm, CS) soil HAs of the nearby Holland Marsh, Muck Crops Research Station to understand the linkages and the transformations of SOM happened while transportation (wind erosion and horizontal seepage) to the muck river sediment. We found that 90% of the aromatic C in the RS is non-protonated, and 32% of the aliphatic region was non-protonated. The DPMAS spectral comparison between RS, TS and CS clearly showed that RS contains characteristic peaks of both TS and CS. Moreover, the proportion of non-protonated aliphatics in RS (32%) is high compared to TS (18%) and CS (29%). Our results indicate that in muck river sediment soil HA, non-protonated aliphatics (CRAM-like structures) contribute to the rSOM more than FRAs, while in TS and CS, FRAs' contribution is higher than the non-protonated aliphatics. Collectively our results show the link between terrestrial organic matter transportation to the river sediment and the transformation that occur in the rSOM fraction in the river sediment SOM. This new knowledge allows us to understand the structural changes that happen in the sequestered carbon in different soil environments.

How to cite: Gamage, J., Longstaffe, J., Gillespie, A., Lo, A., Al-Abdul-Wahid, S., and Voroney, P.: Evidence for the diagenetic formation of fused aromatic ring structures in an organic soil, EGU General Assembly 2023, Vienna, Austria, 23–28 Apr 2023, EGU23-17105, https://doi.org/10.5194/egusphere-egu23-17105, 2023.

CL3.1 – Climate change: from regional to global

EGU23-233 | ECS | Orals | CL3.1.2 | Highlight

Simulating extreme cold winters in France with empirical importance sampling 

Camille Cadiou and Pascal Yiou

Extreme winter cold temperatures in Europe have huge societal impacts. Being able to simulate worst-case scenarios of such events for present and future climates is hence crucial for adaptation. Rare event algorithms have been applied to simulate extreme heat waves. They have emphasized the role of atmospheric circulation in such extremes. The goal of this study is to test such algorithms for extreme cold spells.

We focus first on winter cold temperatures that have occurred in France from 1950 to 2021 and then on winter cold spells that could occur in the future according to different emissions pathways. We investigate winter mean temperatures in France (December, January, and February) and identify a record-shattering event in 1963. We find that, although the frequency of extreme cold spells decreases with time, their intensity is stationary.

We applied a stochastic weather generator approach with importance sampling, to simulate the coldest winters that could occur every year since 1950. We hence simulated ensembles of worst winter cold spells that are consistent with observations. Only some of the simulations reach colder temperatures than the record-shattering event of 1963, and the ensembles do not yield the trend that is observed in the mean temperature. The atmospheric circulation that prevails during those events is analyzed and compared to the observed circulation during the record-breaking events.

How to cite: Cadiou, C. and Yiou, P.: Simulating extreme cold winters in France with empirical importance sampling, EGU General Assembly 2023, Vienna, Austria, 23–28 Apr 2023, EGU23-233, https://doi.org/10.5194/egusphere-egu23-233, 2023.

EGU23-911 | ECS | Orals | CL3.1.2

Increasing 2020-Like Boreal Summer Rainfall Extremes Over Northeast Indian Subcontinent Under Greenhouse Warming 

Haosu Tang, Gang Huang, Kaiming Hu, and Jun Wang

Due to windward slope topography and monsoon activities, the populated Northeast Indian subcontinent (NEI) suffers from heavy rainfall and floods almost every year. Extreme persistent downpours lashed NEI in summer 2020, ranked the second heaviest on record since 1901. This event caused about 550 fatalities and economic loss up to hundreds of millions of dollars. It is highly compelling but challenging to understand the weather drivers and future risks of this high-impact event. Here, we suggested this event was likely caused by the anomalous anticyclone (AAC) over the Indo-Northwest Pacific region and La Niña-induced Walker circulation intensification. The overall effect of current human-induced climate change contributed little to the occurrence probability of this event, as most of the warming and wetting effects of greenhouse gases were canceled out by anthropogenic aerosols. Climate models project an increasing risk of 1.77 (1.97), 2.08 (2.59), 2.58 (3.88), and 3.10 (5.52) times of such extreme event in the median-term (long-term) future under SSP1-2.6, SSP2-4.5, SSP3-7.0, and SSP5-8.5, respectively. It is mainly caused by the increases in atmospheric water vapor and 2020-like AAC frequency. Our findings indicate that future flooding risk over NEI will increase robustly if greenhouse warming continues.

How to cite: Tang, H., Huang, G., Hu, K., and Wang, J.: Increasing 2020-Like Boreal Summer Rainfall Extremes Over Northeast Indian Subcontinent Under Greenhouse Warming, EGU General Assembly 2023, Vienna, Austria, 23–28 Apr 2023, EGU23-911, https://doi.org/10.5194/egusphere-egu23-911, 2023.

EGU23-1279 | Orals | CL3.1.2

New Compound Extreme Event Indicators for Detecting and Tracking Weather and Climate Extremes under Climate Change 

Gottfried Kirchengast, Stephanie Haas, and Jürgen Fuchsberger

Weather and climate extreme indicators are useful tools in the assessment and quantification of climate change induced alterations of key climate variables and extreme events. However, capturing both the main change aspects and the total extremity of such extreme events remains a challenging task.

Climate change can affect multiple characteristics of weather and climate extremes. Most indices, such as annual maximum temperature or number of hot days, focus on only one aspect of extreme events. While annual maximum temperature aims at describing the magnitude, the number of hot days is used for assessing the frequency of an extreme. The consideration of only one characteristic is a common limitation of such metrics. Since the total severity of extremes is the result of a combination of frequency, duration, magnitude and areal extent changes, however, the extremity is more than the sum of these parts and compound indices are hence required to fully capture the overall change.

Here we introduce Threshold-Exceedance-Amount (TEA) indicators as a new class of metrics that capture changes in event frequency, duration, magnitude, and spatial extent both in isolation and in total. Using a high-percentile-based threshold in a key climate variable that describes extreme magnitudes, the TEA metrics work in a cascaded manner up to expressing the total extremity of events, optionally also as an amplification vs. a suitable reference period.

Besides a detailed definition, we also show example applications for heat and heavy precipitation extremes (using daily maximum temperature and precipitation amount as key variables), from local- to country-scale regions in Austria to resolving and covering the entire European land region. We discuss amplifications and climate change detection vs. the 1961-1990 reference period and natural variability.

The TEA indicators are applicable for different types of extremes also beyond temperature and precipitation, making them a useful and versatile tool for the climate change-related investigation of extreme events and their impacts on natural and socio-economic systems, while also helping to fulfill the need for compound indices.

How to cite: Kirchengast, G., Haas, S., and Fuchsberger, J.: New Compound Extreme Event Indicators for Detecting and Tracking Weather and Climate Extremes under Climate Change, EGU General Assembly 2023, Vienna, Austria, 23–28 Apr 2023, EGU23-1279, https://doi.org/10.5194/egusphere-egu23-1279, 2023.

EGU23-1722 | ECS | Orals | CL3.1.2

Evaluation of compound dry-hot extremes in summer monsoon in India: Past and Future 

Nikhil Kumar and Manish Kumar Goyal

The intensification of the global hydrological cycle has significantly altered the behaviour of climate extremes. Lately, compound extremes i.e. simultaneous occurrence of two or more extremes, have received substantial emphasis because of their larger impact than individual extremes. Therefore, this study evaluates compound dry-hot extremes in summer monsoon season in India for the past and future using advanced statistical (variance transform method and REA- reliability ensemble averaging) and probabilistic methods (copulas). Monthly projections of precipitation/temperature are obtained from multi-modal ensembles of 21 CMIP5 GCMs, constructed using the REA technique. Furthermore, the frequency and spatial extent of monsoonal compound dry-hot events are assessed using a Standardized Compound Event Indicator (SCEI), based on monthly precipitation/temperature, for past (1975-2015)  and future (2025-2095 under RCP8.5). Moreover, vegetation loss estimates (using NDVI-Normalized Difference Vegetation Index) are evaluated under multiple dry-hot conditions (using SCEI) during 1982-2013 using bivariate copulas. Further, the teleconnections (Nino3.4, PDO, AMO and DMI) with SCEI are assessed using the variance transformation method. The results indicate a rise in dry-hot extremes in the monsoon season during 1975-2015. Due to the adverse impact of such extremes on vegetation, vegetation vulnerability assessment indicate that around 65.70% of the country’s area is prone to vegetation loss under extreme dry-hot conditions. And, it is also found that Nino3.4 (ENSO) is the dominant climate indice influencing SCEI (4 monthly scale), in > 50% of the country. Furthermore, the results show that the frequency and spatial extent of dry-hot extremes are projected to increase in the future (2055-2095), relative to past (1975-2015) across the country. Our study gives an enhanced understanding of dry-hot extremes in monsoon season and can further facilitate an effective adaptation strategy.

How to cite: Kumar, N. and Kumar Goyal, M.: Evaluation of compound dry-hot extremes in summer monsoon in India: Past and Future, EGU General Assembly 2023, Vienna, Austria, 23–28 Apr 2023, EGU23-1722, https://doi.org/10.5194/egusphere-egu23-1722, 2023.

EGU23-2684 | ECS | Posters on site | CL3.1.2

On detecting signals of anthropogenic climate change in basin-scale hydrologic variables 

Anju K. Vijayan and Pradeep P. Mujumdar

Anthropogenic climate change is one of the most pressing global environmental challenges faced by society in recent times. Large-scale shifts are observed in precipitation and runoff patterns due to the impact of anthropogenic climate change on the regional water cycle. Understanding these impacts is critical for effectively managing and protecting water resources and for mitigating the impacts of climate change. However, the detection of the impact of anthropogenic climate change on the regional water cycle is challenging. A pattern correlation analysis using fingerprints can be carried out to evaluate the impacts of human-induced climate change. Fingerprints give the expected direction of the anthropogenic signal and help to reduce the detection problem to a univariate or low-dimensional problem. This study adopts a formal fingerprint-based detection method to analyze the trends in monsoon precipitation and streamflow in the Krishna River basin, India. In-situ observations and several climate model outputs are utilized for the analyses. Principal component analysis, statistical downscaling techniques, and an Artificial Neural Network (ANN) based rainfall-runoff model are employed. The fingerprint detection method is illustrated using three scenarios by altering the anthropogenic forcings: aerosols alone, land use alone, and a combination of greenhouse gases with aerosols. The hydrologic variables considered are the gridded monthly monsoon precipitation data for 1951-2005 at 1° latitude by 1° longitude and monthly monsoon streamflow at a downstream gauging station. Leading Empirical Orthogonal Functions (EOFs) and signal strength are used to compare the response pattern of observed hydrologic variables with the response pattern simulated by climate models, including various forcings. The hypothesis that the observed trend in hydrologic variables lies within the range expected from natural internal variability alone is validated at a 95% statistical confidence level for most of the climate models considered. This excludes the possibility of other causal factors, including solar irradiance, volcanic eruption, and other anthropogenic impacts. It is found that the signal of human influence is less distinct from that of natural variability. Hence, it is concluded that applying a formal fingerprint-based method is not fully successful in detecting anthropogenic trends in hydrologic variables at the basin scale. The results emphasize the need for robust observational data and advanced analytical techniques considering a detailed process understanding.

How to cite: K. Vijayan, A. and P. Mujumdar, P.: On detecting signals of anthropogenic climate change in basin-scale hydrologic variables, EGU General Assembly 2023, Vienna, Austria, 23–28 Apr 2023, EGU23-2684, https://doi.org/10.5194/egusphere-egu23-2684, 2023.

EGU23-2776 | Orals | CL3.1.2

Human impacts and their interactions in the Baltic Sea region 

Marcus Reckermann and the BEAR Human Impacts Author team

Coastal environments, in particular heavily populated semi-enclosed marginal seas and coasts like the Baltic Sea region, are strongly affected by human activities. A multitude of human impacts, including climate change, affects the different compartments of the environment, and these effects interact with each other.

As part of the Baltic Earth Assessment Reports (BEAR), we present an inventory and discussion of different human-induced factors and processes affecting the environment of the Baltic Sea region, and their interrelations. Some are naturally occurring and modified by human activities (i.e. climate change, coastal processes, hypoxia, acidification, submarine groundwater discharges, marine ecosystems, non-indigenous species, land use and land cover), some are completely human-induced (i.e. agriculture, aquaculture, fisheries, river regulations, offshore wind farms, shipping, chemical contamination, dumped warfare agents, marine litter and microplastics, tourism, coastal management), and they are all interrelated to different degrees.

We present a general description and analysis of the state of knowledge on these interrelations. Our main insight is that climate change has an overarching, integrating impact on all of the other factors and can be interpreted as a background effect, which has different implications for the other factors. Impacts on the environment and the human sphere can be roughly allocated to anthropogenic drivers such as food production, energy production, transport, industry and economy.

We conclude that a sound management and regulation of human activities must be implemented in order to use and keep the environments and ecosystems of the Baltic Sea region sustainably in a good shape. This must balance the human needs, which exert tremendous pressures on the systems, as humans are the overwhelming driving force for almost all changes we see. The findings from this inventory of available information and analysis of the different factors and their interactions in the Baltic Sea region can largely be transferred to other comparable marginal and coastal seas in the world.

This work is published as Open Access article in Earth System Dynamics (Earth Syst. Dynam., 13, 1–80, 2022; https://doi.org/10.5194/esd-13-1-2022)

How to cite: Reckermann, M. and the BEAR Human Impacts Author team: Human impacts and their interactions in the Baltic Sea region, EGU General Assembly 2023, Vienna, Austria, 23–28 Apr 2023, EGU23-2776, https://doi.org/10.5194/egusphere-egu23-2776, 2023.

Primer: The record-shattering Pacific Northwest heatwave in late June 2021 challenged a key element of extreme event attribution, namely, the statistical evaluation of the event likelihood given historical records up to the event. The respective model, a non-stationary generalised extreme value (GEV) distribution depending on a global mean temperature covariate, suggested an infinite return period, or zero probability of reaching the event intensity in the year in which it was observed, based on the historical record. The apparent shortcoming of the method triggered a widespread debate about the general suitability of this statistical approach and its ability to provide informative insight in the context of extreme event attribution.

Research objective: The aim of this study is to first evaluate the quality of return period estimates for very rare heatwave events to determine whether or not the method can reliably characterise the event likelihood of rare extremes. We then assess the contributions of different factors to systematic deviations in tail estimates (such as high quantiles or return periods) relevant for rare event attribution statements. We consider both aspects associated with the statistical method, as well as such related to the attribution procedure.

Data & Methods: A robust evaluation of tail estimates requires vast amounts of homogeneous data. Our analysis is based on two transient historical and future (RCP8.5 and SSP3.7) initial condition large ensembles (84 and 100 members) and an extensive bootstrap dataset of extreme values simulated from parametric GEV distributions.

Results: We demonstrate that also in climate model experiments, events analogous to the 2021 heatwave are simulated, which, assessed with data up to the event, would have deemed to have zero occurrence probability. Thus, also within the climate model context, we find that the non-stationary GEV approach yields substantially biased exceedance probability estimates for low-likelihood events, thereby overestimating the respective return period or underestimating the likelihood of occurrence if the GEV distribution is based on a relatively short “historical” record. This systematic has become particularly pronounced in recent extreme events due to the emergence of a distinct climate change signal and high rate of warming.

Especially maximum likelihood estimates of the non-stationary GEV distribution are prone to systematically underestimate the shape parameter, and in consequence overestimate the return periods. We demonstrate that the bias arises because the GEV fit is restricted to rather short time series, and it is partially alleviated if a Bayesian estimation approach is used. Furthermore, widely used symmetric, so-called Wald-type maximum likelihood confidence intervals are found to be a rather inadequate and misleading measure of the estimation uncertainty in GEV-parameters and tail quantities like return levels. For these reasons, Wald-type confidence intervals should thus not be used for model evaluation purposes in extreme event attribution studies.

How to cite: Zeder, J., Sippel, S., and Fischer, E.: Are return period estimates from observational records reliable for low-likelihood heatwave events? A systematic evaluation, EGU General Assembly 2023, Vienna, Austria, 23–28 Apr 2023, EGU23-3235, https://doi.org/10.5194/egusphere-egu23-3235, 2023.

EGU23-3412 | Orals | CL3.1.2

Challenges and ways forward in ecological impact attribution 

Ana Bastos, Sebastian Sippel, Dorothea Frank, Miguel Mahecha, Sönke Zaehle, Jakob Zscheischler, and Markus Reichstein

Weather extremes have multiple impacts on ecosystems, either through direct influence on plant functioning and health, or indirect and lagged impacts through disturbances such as fires, insects or pest outbreaks. Recent decades have seen an increase in high-impact extreme events, such as large-scale drought-induced mortality, crop failure, mega-fires, and widespread tree mortality events.

Understanding to which degree these events are already signs of human-driven climate change requires establishing a reference of natural climatic and ecological variability and formal attribution frameworks. Attribution of single weather extremes is challenging, but feasible through large ensembles of climate model simulations and by advanced statistical techniques. Attribution of high-impact ecological events is, however, complicated by the fact that impacts are not only driven by climate but also by internal ecological dynamics (mortality, gap dynamics, competition, succession) and human influence on the landscape and ecosystem composition (e.g., through land cover change, management, landscape fragmentation, etc.).

Here, we present a systemic framework that brings together climate risk and disturbance ecology perspectives to analyse the causal links between climate extremes, disturbances, and ecosystem dynamics. We propose an extended attribution approach that considers not only anthropogenic effects via climate change but also anthropogenic influences on ecological factors that modulate impacts. Based on this framework and on dedicated simulations by an Earth System Model, we exemplify how eco-climatic storylines can be used for robust attribution of high-impact events.


How to cite: Bastos, A., Sippel, S., Frank, D., Mahecha, M., Zaehle, S., Zscheischler, J., and Reichstein, M.: Challenges and ways forward in ecological impact attribution, EGU General Assembly 2023, Vienna, Austria, 23–28 Apr 2023, EGU23-3412, https://doi.org/10.5194/egusphere-egu23-3412, 2023.

EGU23-3662 | ECS | Orals | CL3.1.2

Global emergence of compound climatic impact-drivers 

Zhetao Tan, Karina von Schuckmann, Lijing Cheng, and Sabrina Speich

Changes in health and sustainability of the ocean that provide goods and services for human well-being are closely linked to climate change. However, the ocean is exposed to a range of climatic impact-drivers (CIDs, e.g., temperature increase, sea level rise, oxygen depletion, acidification etc.) from global to local scale concurrently. These multiple CIDs make the ocean environment shifting from the normal condition, posing either positive or detrimental effects to ocean ecosystems. Therefore, detecting and understanding the combined effect of different CIDs (named compound CIDs in this study) is critical to further unravel diverse and adverse impacts on the ocean ecosystems.

In this study, we analyzed compound CIDs from changes in the upper 2000m of the ocean temperature (T), salinity (S), and dissolved oxygen (DO) from 1960 to 2022, as well as surface pH changes from 1985 to 2021 by using several observation-based gridded products.

We used a time of emergence (ToE) approach to investigate the long-term change of  the compound CIDs. First, to quantify the ToE of each CID, we investigated when and where the long-term change (signal) is significantly larger than the background variability (noise). The long-term change is quantified by the 20 years of low-pass filtering of global time series, and the background variability is quantified by the magnitude of annual-interannual variability of the local time series. Additionally, the uncertainty of ToE is defined by using an ensemble approach. With the ToE of individual CID available, we defined the regions where ToE of the compound CIDs can be detected if the change of more than one CID has already emerged. The results we obtained provide a new insight on the 3D changing ocean properties. They differ from previous studies that were limited to a subset of individual CID (e.g., sea level rise, chlorophyll-a, net primary production) or to the ocean surface only (e.g., SST).

The analysis shows that, before 2021, for the upper 2000m, ~15% (±5%) of areas of global ocean has experienced the concurrent emergence of three CIDs (triple emergence), and ~30% (±8%) of global ocean has experienced concurrent emergence of two CIDs (double emergence) mainly in the Atlantic and northern Indian Ocean. Analyses at different depths reveal that ToE is stronger and starts earlier in deep layers (200-1300m) than in the upper ocean (0-200m) where the signal-to-noise ratio is lower (which may due to the strong interplay of the long-term change with natural variability).

As marine ecosystems rely on an environment determined by multiple drivers (T/S/oxygen etc.), the investigation of the compound CIDs provides a more complete description (and quantification) of their long-term exposure to the CIDs (multiple stressors).

How to cite: Tan, Z., von Schuckmann, K., Cheng, L., and Speich, S.: Global emergence of compound climatic impact-drivers, EGU General Assembly 2023, Vienna, Austria, 23–28 Apr 2023, EGU23-3662, https://doi.org/10.5194/egusphere-egu23-3662, 2023.

EGU23-3679 | Orals | CL3.1.2 | Highlight

From hot air to environmental injustice: end to end event attribution 

Michael Wehner, Kevin Smiley, and Christopher Sampson

The human influence on many classes of extreme weather events has been made very clear by extreme weather event attribution studies. However, this is only the first step to quantify the human influence on the actual impacts from these events. Using Hurricane Harvey as a storyline example, we illustrate the causal chain from increased temperatures to increased precipitation to increased flooding to increased structural damages. Detailed geographical information about the effect of climate change on the flood leads to an attribution statement about damages and is combined with census data revealing profound disparities across socioeconomic groups. We leave the listener with rhetorical questions: Can one quantify environmental injustice? If so, can an end to end attribution statement about climate change induced loss and damages provide a defensible claim for reparations?

How to cite: Wehner, M., Smiley, K., and Sampson, C.: From hot air to environmental injustice: end to end event attribution, EGU General Assembly 2023, Vienna, Austria, 23–28 Apr 2023, EGU23-3679, https://doi.org/10.5194/egusphere-egu23-3679, 2023.

EGU23-3768 | ECS | Posters on site | CL3.1.2

Constrained Emergence of Air Temperature Change Signal in Northern-Central India From Background Variations 

Kaiwen Zhang, Zhiyan Zuo, Renhe Zhang, Dong Xiao, and Liang Qiao

The signal of temperature change has emerged from background variations in most tropical regions in boreal summer over decadal-centennial timescales but not in northern-central India (NCI). In this study, we investigated the reason for the limited temperature change in NCI. We found that internal variability, largely caused by the Interdecadal Pacific Oscillation (IPO) on a ∼20-year timescale, has the potential to mask the temperature change signal. Besides, local response to external forcing, linked to non-greenhouse gas (GHG) forcings, strongly overrides GHG warming in NCI, which results in little trend in the temporal evolution of external variability. The internal variability related to IPO and the limited warming arising from the competition between multiple forcings result in the smallest signal-to-noise ratio and thus, the temperature change signal fails to emerge from the background variations.

How to cite: Zhang, K., Zuo, Z., Zhang, R., Xiao, D., and Qiao, L.: Constrained Emergence of Air Temperature Change Signal in Northern-Central India From Background Variations, EGU General Assembly 2023, Vienna, Austria, 23–28 Apr 2023, EGU23-3768, https://doi.org/10.5194/egusphere-egu23-3768, 2023.

EGU23-5385 | Orals | CL3.1.2

Gaps in Attribution for the Next UK Climate Change Risk Assessment 

Richard Betts, Regan Mudhar, Dann Mitchell, and Peter Stott

We will present findings from a comprehensive review of the detection and attribution of climate change in the UK, including both recent and past events within the observation record. We will highlight where there are notable gaps, including those that can and cannot be closed with existing data and/or attribution techniques.

This systematic review of detection and attribution literature will feed into a report, with a database of supporting evidence, to inform the Climate Change Committee’s upcoming UK Climate Change Risk Assessment. The first part of the review will cover the detection and attribution of weather and climate changes in the UK, relevant to specific Climate Impact Drivers, while the second will cover societal, infrastructural, economic, and biodiversity impacts associated with these. As part of this, we will identify variables which are key drivers of multiple impacts, and, importantly, where further attribution analysis is needed, especially when the impacts are critical for UK risk.

How to cite: Betts, R., Mudhar, R., Mitchell, D., and Stott, P.: Gaps in Attribution for the Next UK Climate Change Risk Assessment, EGU General Assembly 2023, Vienna, Austria, 23–28 Apr 2023, EGU23-5385, https://doi.org/10.5194/egusphere-egu23-5385, 2023.

The impact of climate change on typhoon is of great concern in the East Asia. In particular, typhoon heavy rainfall has a destructive impact on our society and economy since they are many megacities along the coastal regions. Although observations suggest significant changes in typhoon heavy rainfall, the contribution of anthropogenic forcing has not been determined.

In this study, we show that anthropogenic global warming has a substantial impact on the observed changes in typhoon heavy rainfall in the western North Pacific region. Observational data show that, in general, typhoon heavy rainfall has increased (decreased) in coastal East Asia (tropical western North Pacific) during latter half of 20th Century and onward. A similar spatial distribution is found in the “Anthropogenic fingerprint”, difference between Earth systems with and without human-induced greenhouse gas emission, from a set of large ensemble climate simulations. This provides evidence to support that the significant increase in the frequency of typhoon heavy rainfall along coastal East Asia is not explained solely by natural variability. Further, the results show that since mid-1970s, the signal of “Anthropogenic fingerprint” has been increasing rapidly and departs from natural variability in early-2000s.

Reference:
Utsumi, N., & Kim, H. (2022). Observed influence of anthropogenic climate change on tropical cyclone heavy rainfall. Nature Climate Change, 12(5), 436–440. https://doi.org/10.1038/s41558-022-01344-2

How to cite: Kim, H. and Utsumi, N.: Anthropogenic Fingerprint on Recent Changes in Typhoon Heavy Rainfall beyond Tipping-Point, EGU General Assembly 2023, Vienna, Austria, 23–28 Apr 2023, EGU23-5392, https://doi.org/10.5194/egusphere-egu23-5392, 2023.

EGU23-5612 | ECS | Orals | CL3.1.2 | Highlight

Attributing human health impacts to climate change 

Eunice Lo, Dann Mitchell, Ana M. Vicedo-Cabrera, and Sarah Perkins-Kirkpatrick

Attributing extreme weather events to human-induced climate change has been a topic of interest for decades. In recent years where unprecedented and high-impact events have occurred all over the world, it is all the more important to not just understand how human influence on the climate system has changed the probability or magnitude of the weather events, but also how it has changed the impacts of these events on human life. In this talk, I will review the climate-epidemiology literature on attributing adverse human health impacts to climate change, with a focus on heat-related mortality, as it is well-established that high temperatures are associated with increased mortality risks. I will include notable heat-mortality events in history such as the 1995 Chicago heatwave, 2006 UK summer, and the 2003 European heatwave. I will also discuss the use of large ensembles of future climate projections to ‘attribute’ heat-related mortality that could occur if global mean warming reached certain levels, keeping other factors unchanged. Finally, I will discuss the use of climate-health attribution information in engaging with the media and communicating with policymakers.

How to cite: Lo, E., Mitchell, D., Vicedo-Cabrera, A. M., and Perkins-Kirkpatrick, S.: Attributing human health impacts to climate change, EGU General Assembly 2023, Vienna, Austria, 23–28 Apr 2023, EGU23-5612, https://doi.org/10.5194/egusphere-egu23-5612, 2023.

EGU23-6020 | ECS | Posters on site | CL3.1.2

The attribution of flash flooding impacts over cities in the United Kingdom 

Daniel Cotterill, Dann Mitchell, Peter Stott, and Paul Bates

The risk of flash flooding is likely to increase with the intensification of short-duration rainfall extremes due to Climate Change. Using the latest convective-permitting resolution climate model data for the UK and the LISFLOOD-FP flood inundation model, we adopt a trend detection approach to attribute flash flooding impacts over the UK city, Leeds. Our study is based on an extreme rainfall event in August 2014, where over 400 properties were flooded after 80mm of rainfall fell in five hours in parts of the city. This research will be the first attribution study for UK pluvial flood impacts, using pure convective-permitting resolution climate model data.  The flood inundation model simulates flood maps for over 12 000 events using soil moisture and rainfall data as inputs.

How to cite: Cotterill, D., Mitchell, D., Stott, P., and Bates, P.: The attribution of flash flooding impacts over cities in the United Kingdom, EGU General Assembly 2023, Vienna, Austria, 23–28 Apr 2023, EGU23-6020, https://doi.org/10.5194/egusphere-egu23-6020, 2023.

EGU23-6412 | Orals | CL3.1.2

Attribution of excess heat-related death toll during 2009 heat wave in Victoria, Australia 

Philipp Aglas-Leitner, Sarah Perkins-Kirkpatrick, Nina Lansbury, Linda Selvey, Nicholas Osborne, and Daithi Stone

In recent decades, anthropogenic climate change has led to significant increases in heat wave length and intensity. Many of these heat waves have resulted in substantial impacts on human health. In 2009, the state of Victoria, Australia, experienced several days with maximum temperatures rising 12-15°C above the climatological mean and a marked rise in the human death toll. This study attempts to directly quantify the heat-related human fatalities of the 2009 heatwave attributable to anthropogenic climate change.

We focus on changes in return values of heat wave-related mortality. Furthermore, we combine two types of modeling tools. The first is a set of large initial-condition ensembles of simulations from atmosphere-only models from the weather@home/ANZ and C202C+ D&A projects, and large initial-condition ensembles of simulations from atmosphere-ocean models from CMIP6.  We compare factual outcomes from year-2009 era periods from historical simulations against counterfactual outcomes from either naturalised (non-anthropogenic) simulations or pre-industrial times. The second tool is an empirical model linking heat-related mortality to exceedance of temperature percentile thresholds from daily climate simulation output. This mortality model categorizes heat waves based on three consecutive percentile windows starting at the 95th, 97.5th, and the 99th percentile.

Our analysis shows considerable agreement among the climate-mortality model combinations indicating significant increases in human fatalities during conditions comparable to the 2009 Victoria heat wave under anthropogenic climate change. Most models attribute approximately one third to one half of excess heat-related deaths to anthropogenic greenhouse gas emissions. These findings demonstrate that unless significant climate change mitigation and adaptation efforts are undertaken, further increases in heat-related mortality risk can be expected.

How to cite: Aglas-Leitner, P., Perkins-Kirkpatrick, S., Lansbury, N., Selvey, L., Osborne, N., and Stone, D.: Attribution of excess heat-related death toll during 2009 heat wave in Victoria, Australia, EGU General Assembly 2023, Vienna, Austria, 23–28 Apr 2023, EGU23-6412, https://doi.org/10.5194/egusphere-egu23-6412, 2023.

Heatwaves are increasing in frequency, intensity, and duration, and represent the category of extreme event that is most easily attributable to anthropogenic warming. Yet how the spatiotemporal patterns of attribution outcomes link to population dynamics is still poorly understood.  Here we show that children and young people are already being affected by a disproportionately greater number of attributable heatwaves, especially in the Global South. Using observations, reanalysis, and simulations of temperature changes available through the ISIMIP3b and CMIP6 projects in combination with demographic data, we show that temperature extremes emerge more clearly and consistently from the noise across low-income countries in lower latitudes, which have some of the youngest populations. Our findings have important implications for children and young people seeking redress from climate harms, for example through climate lawsuits.

How to cite: Pietroiusti, R. and Thiery, W.: Children disproportionally exposed to attributable heatwaves at low-latitude low-income countries, EGU General Assembly 2023, Vienna, Austria, 23–28 Apr 2023, EGU23-7528, https://doi.org/10.5194/egusphere-egu23-7528, 2023.

EGU23-7716 | ECS | Orals | CL3.1.2

The evolution of the global population experiencing unprecedented exposure and its age of emergence. 

Luke Grant, Wim Thiery, Inne Vanderkelen, Lukas Gudmundsson, Erich Fischer, and Sonia Seneviratne

In climate change attribution, unprecedented magnitudes of extreme events can be defined on the basis of thresholds in the pre-industrial distributions of event magnitudes. This notion of unprecedented levels of climate change impacts has been extended toward the lifetime exposure to extreme events by evaluating exposure frequency. Unprecedented exposure to extreme events is assessed by comparing average lifetime exposure under different climate scenarios to an upper percentile of exposure in a pre-industrial climate. Here we combine simulations of climate change impacts under different climate forcing scenarios with country-level demography datasets to estimate the fraction of the global population experiencing unprecedented exposure to extreme events. This is done for 29 global mean temperature trajectories taken from the AR6 scenario explorer and multiple extreme event categories such as heatwaves, floods and droughts. Further, we assess the age of emergence at which birth cohorts reach unprecedented levels of exposure.

How to cite: Grant, L., Thiery, W., Vanderkelen, I., Gudmundsson, L., Fischer, E., and Seneviratne, S.: The evolution of the global population experiencing unprecedented exposure and its age of emergence., EGU General Assembly 2023, Vienna, Austria, 23–28 Apr 2023, EGU23-7716, https://doi.org/10.5194/egusphere-egu23-7716, 2023.

EGU23-7932 | Posters on site | CL3.1.2

Evident decrease in future European soil moisture in the Kiel Climate Model 

Médéric St-Pierre, Mojib Latif, Joakim Kjellsson, Wonsun Park, and Leonard Borchert

During the last few decades, the European climate has changed significantly. Extreme temperatures are now more frequent than ever since the start of industrialization and changes in the water cycle evident. The soil water content could be affected by these changes disturbing the daily life of many people. More often than we would like, anthropogenic factors and more specifically the CO2 emissions are found to be the causes of these perturbations. In this study, we look into the European soil moisture trends in a changing climate. To achieve this, we use a single grand ensemble of 100 members performed with the Kiel Climate Model (KCM). Each simulation starts with different initial conditions taken from a pre-industrial control run and is forced by a 1%-CO2 increase per year. This means that the atmospheric CO2-concentration doubles after 70 years and quadruples after 140 years. Strong drying over most of Europe is simulated with more than 95% of the ensemble members agreeing on the sign of the change. Central Europe experiences a particularly large drying during spring and summer, while the Mediterranean region is affected all year long by drying. The northern European soil moisture also decreases, but to a lesser extent. The changes over all of Europe are mainly due to a reduction in precipitation and, to a certain degree, an increase in evaporation. Precipitation trends in the KCM ensemble are in good agreement with that in the CMIP6 models forced by the shared socioeconomic pathway 5-8.5 (SSP585).

How to cite: St-Pierre, M., Latif, M., Kjellsson, J., Park, W., and Borchert, L.: Evident decrease in future European soil moisture in the Kiel Climate Model, EGU General Assembly 2023, Vienna, Austria, 23–28 Apr 2023, EGU23-7932, https://doi.org/10.5194/egusphere-egu23-7932, 2023.

EGU23-8136 | ECS | Orals | CL3.1.2

Anthropogenic influence on precipitation quantile trends over China 

Chen Lu, Gordon Huang, Xiuquan Wang, and Erika Coppola

It has been established that the variations/trends in large-scale precipitation over land since the mid-twentieth century can be attributed to forcing changes due to anthropogenic greenhouse gas emissions (Eyring et al.). The detection and attribution (D&A) of changes in regional precipitation regimes, however, remains challenging due to issues such as larger influences from internal variability, as well as larger uncertainty in observed and simulated data (Doblas-Reyes et al.). This study is aimed at exploring the feasibility of attributing the quantile trends in daily precipitation over China to natural and anthropogenic influences, aided by the latest CMIP6 GCM data. The quantile trends in observed and modeled daily precipitation are derived through quantile regression (Koenker and Bassett). The scenarios considered are the historical, natural, anthropogenic greenhouse gas, and anthropogenic aerosol forcings, and the control simulations are employed to reflect natural variability. The D&A is undertaken through the regularized optimal fingerprinting (Ribes et al.). The results show that the increasing trends in winter precipitation at high and extremely high quantile levels, as well as the increasing trends in spring precipitation at all quantile levels, can be attributed to the effects of historical forcing. The effect of anthropogenic greenhouse gas forcing is evident over the domain, to which the increasing precipitation trends at all quantile levels in all seasons can be attributed; this effect can be separated from that of anthropogenic aerosol forcing for winter precipitation trends at high and extremely high quantile levels, and for spring, summer, and autumn trends at low quantile levels. Findings of this research can help improve our knowledge of anthropogenic processes on the climate system, which can further support climate modeling and projections.


Reference

Doblas-Reyes, F. J., et al. “Linking Global to Regional Climate Change.” Climate Change 2021: The Physical Science Basis. Contribution of Working Group I to the Sixth Assessment Report of the Intergovernmental Panel on Climate Change, edited by V. Masson-Delmotte et al., Cambridge University Press, 2021.

Eyring, V., et al. “Human Influence on the Climate System.” Climate Change 2021: The Physical Science Basis. Contribution of Working Group I to the Sixth Assessment Report of the Intergovernmental Panel on Climate Change, edited by V. Masson-Delmotte et al., Cambridge University Press, 2021, pp. 423–552, https://doi.org/10.1017/9781009157896.005.

Koenker, Roger, and Gilbert Bassett. “Regression Quantiles.” Econometrica, vol. 46, no. 1, Jan. 1978, p. 33, https://doi.org/10.2307/1913643.

Ribes, Aurélien, et al. “Application of Regularised Optimal Fingerprinting to Attribution. Part I: Method, Properties and Idealised Analysis.” Climate Dynamics, vol. 41, no. 11–12, Dec. 2013, pp. 2817–36, https://doi.org/10.1007/s00382-013-1735-7.

How to cite: Lu, C., Huang, G., Wang, X., and Coppola, E.: Anthropogenic influence on precipitation quantile trends over China, EGU General Assembly 2023, Vienna, Austria, 23–28 Apr 2023, EGU23-8136, https://doi.org/10.5194/egusphere-egu23-8136, 2023.

EGU23-8900 | Posters virtual | CL3.1.2

Observed and projected changes in the diurnal temperature range at European cities with different base climate 

George Katavoutas, Dimitra Founda, Konstantinos V. Varotsos, and Christos Giannakopoulos

Many regions across the globe have been witnessing changes in both mean climate and climatic extremes during the last decades. Cities in particular, where the concentration of urban population is high, have been in the spotlight of scientific research seeking to address climate-related issues. At the same time, climate change is expected to largely impacts cities until the end of 21st century. However, changes in air temperature levels, as an essential element of the climate, are probably not uniform nor of the same rate across different areas of the globe. An important indicator of the global climate change is the diurnal temperature range (DTR), defined as the difference between the daily maximum and daily minimum air temperature, thus reflecting the temperature variation within a day.

This study analyses the distribution and long-term trends in DTR in seventeen European cities of different base climate. The response of DTR under exceptionally hot weather has also been investigated. The study uses observed and projected data of daily maximum and minimum air temperature over the periods 1961-2019 and 1971-2100, respectively. The projected data, over the studied cities for the closest land grid point to the stations’ location, were derived from the Regional Climate Model (RCM) RCA4 of the Swedish Meteorological and Hydrological Institute driven by the Max Planck Institute for Meteorology model MPI-ESM-LR, with the simulations carried out in the framework of the EURO-CORDEX modeling experiment. The projected data were bias adjusted applying the empirical quantile mapping technique. Future simulations were based on two climate scenarios, the Representative Concentration Pathways (RCPs) 4.5 and 8.5.

The distribution of the DTR frequency based on observations shows a similar pattern in cities that share the same background climate, while is clearly differentiated at diverse climate types. The mean DTR for normal summer days (maximum air temperature lower than 95 percentile) ranges between 8.0 and 10.5 oC for all cities, with the exception of Nice that shows lower mean DTR and Nicosia, Madrid and Bucharest that present higher. The change of the mean DTR between summer normal days and hot days (maximum air temperature higher than 95 percentile) is greater for cities in higher latitudes, while it is smaller for cities in lower latitudes. According to the projected data for the period from 1971 to 2100 under the RCP4.5 scenario, a statistically significant decreasing trend in mean DTR/yr is projected for the cities in the highest latitudes (Oslo, Stockholm and Helsinki), suggesting higher increasing rates in the minimum air temperature compared to the maximum air temperature. At the same time, the opposite result is expected in Madrid (statistically significant increasing trend), while no statistically significant trends in mean DTR are projected for the rest of the cities.

How to cite: Katavoutas, G., Founda, D., Varotsos, K. V., and Giannakopoulos, C.: Observed and projected changes in the diurnal temperature range at European cities with different base climate, EGU General Assembly 2023, Vienna, Austria, 23–28 Apr 2023, EGU23-8900, https://doi.org/10.5194/egusphere-egu23-8900, 2023.

Rainfall across the state of Victoria in Australia exhibits a strong climatological gradient from north to south and from east to west. In general, the highland areas in eastern Victoria receive the highest rainfall, followed by the southern coastal regions and substantially less rainfall occurs over the north-west of Victoria. The latter two regions show a pronounced annual cycle with winter maxima while rainfall over eastern Victoria is more uniform throughout the year. These distinct variations in rainfall arise from the fact that the different regions of Victoria are influenced by different weather systems and large-scale climate drivers and they also respond differently to external forcing. Many of the previous studies on rainfall changes were derived using all-Victoria area-averaged rainfall. However, there is a strong interest of stakeholders, both within and beyond the climate science community in Australia, about the role of climate change on the decline in local rainfall since the beginning of the Millennium Drought in 1997.

In this study, we used both observations and climate models to provide comprehensive and robust information on past and future rainfall changes on three sub-regions of Victoria (Murray Basin Victoria: MBVic, southeast Victoria: SEVic, and southwest Victoria: SWVic) during the cool season (April – October) due to climate change. Our results show that the percentage decline of rainfall for the 1997-2018 period, relative to the 1900-1959 period average, is more pronounced over the MBVic and SEVic regions of Victoria and least pronounced over the SWVic region. However, the fractional contribution of external forcing is estimated to be about 30% to the observed drying over SWVic which is about 1.5 times higher than the other two regions. Equivalently, the external forcing contribution to the observed trend for the 1900-2018 period are 56%, 17% and 24% for SWVic, MBVic and SEVic, respectively. These numbers suggest that the recent drying across Victoria, while primarily driven by internal rainfall variability, was reinforced by external forcing.  We are currently investigating the time of emergence of the external forcing signal beyond its pre-industrial and historical range and the expected combined impact of both external forcing and internal variability on rainfall over different sub-regions of Victoria for coming decades.

How to cite: Rauniyar, S., Hope, P., and Power, S.: The role of external forcing and natural processes on past and future changes in rainfall over sub-regions of Victoria, Australia, EGU General Assembly 2023, Vienna, Austria, 23–28 Apr 2023, EGU23-10927, https://doi.org/10.5194/egusphere-egu23-10927, 2023.

EGU23-11209 | ECS | Posters on site | CL3.1.2 | Highlight

Significant Role of Internal Climate Variability for the Global Warming Hot-spots in the Northern Hemisphere 

Hye-Yeon Kim, Eun-Ji Song, Min-Ho Kwon, and Baek-Min Kim

The origin of characteristic increase of continental-scale summer surface temperature in decades over Northern hemisphere was investigated. July-temperature in Europe, East Asia, the North Pacific, and western North America have been undergoing more increase than the global average of about 1ºC increase, especially in recent years. On the contrary, MME of 37 CMIP5 models do not show the focused regional warming hot-spots but exhibits hemispheric surface temperature increase. From the comparison between GISTEMP observation record and CMIP5 MME historical data, we show an evidence that the observed characteristic increase of regional temperature for the recent 43 years is dominated by the Internal Climate Variability (ICV) of decadal time-scale. Performing EOF analysis on the ICV, the four dominant modes are identified as Pacific Decadal Oscillation (PDO), North Pacific Oscillation (NPO), Pacific Meridional Mode (PMM), and Atlantic Multi-decadal Oscillation (AMO). It is also shown that, with only two dominant modes among those modes, large portion of continental-scale temperature increase can be explained: We show that PDO and PMM are dominant modes in Europe and East Asia, NPO and AMO in the North Pacific, and PDO and NP in western North America. The observed sub-trend is nicely reproduced with only these two modes. Quantitatively, the observed sub-trend from ICV explains 73%, 60%, 55%, and 18% of the total variability in North Pacific, East Asia, western North America and Europe, respectively. Note that, despite 82% of temperature fluctuation in Europe is attributed by the external forcing, 18% of the internal variability is still important to explain the increasing number of extreme heat events in Europe in recent several decades.

How to cite: Kim, H.-Y., Song, E.-J., Kwon, M.-H., and Kim, B.-M.: Significant Role of Internal Climate Variability for the Global Warming Hot-spots in the Northern Hemisphere, EGU General Assembly 2023, Vienna, Austria, 23–28 Apr 2023, EGU23-11209, https://doi.org/10.5194/egusphere-egu23-11209, 2023.

EGU23-11234 | ECS | Orals | CL3.1.2

Attributing heatwaves to climate change in mountainous areas. An analysis of the summer 2022 heatwaves in the Pyrenees 

Marc Lemus-Canovas, Sergi Gonzalez-Herrero, Laura Trapero, Anna Albalat, Damian Insua-Costa, Martin Senande-Rivera, and Gonzalo Miguez-Macho

The field of extreme event attribution (EEA) seeks to quantify how recent extreme events are directly exacerbated by ongoing climate change. As this is a relatively new field in climate science, there is a noticeable knowledge gap in EEA analysis in mountain areas. Precisely, this work performs an attribution to climate change of the two greatest heatwaves (HWs) occurred during June and July 2022, both hitting the Iberian Peninsula and southern France, and therefore, the Pyrenees Mountain range. We used the analogues technique on 500 hPa geopotential height composites to identify the 30 days closer to the dynamical structure of both heatwaves for the counterfactual (1950-1985) and factual (1986-2021) period, using ERA5 daily data. Results showed that factual HWs analogues in the factual period have a spatial structure closer to the 2022 HWs events than those analogues extracted from the counterfactual period. At the Pyrenean scale, we observed that 2-meter air temperature differences consisted of a positive non-uniform pattern in a factual world, with a significant increase in the southern slope of the mountain range and in the nearby depressed areas. However, most of the mountain range exhibited a small increase of the HW air temperature in a factual world. We also provided an explanation of the physical process involving the abovementioned 2-meter air temperature differences. In this study, we revealed the complexity of conducting the attribution of extreme heatwaves to climate change in mountain areas, both because of the scarcity of in-situ data, as well as due to the physical processes involved during these extreme events in an area of complex terrain.

How to cite: Lemus-Canovas, M., Gonzalez-Herrero, S., Trapero, L., Albalat, A., Insua-Costa, D., Senande-Rivera, M., and Miguez-Macho, G.: Attributing heatwaves to climate change in mountainous areas. An analysis of the summer 2022 heatwaves in the Pyrenees, EGU General Assembly 2023, Vienna, Austria, 23–28 Apr 2023, EGU23-11234, https://doi.org/10.5194/egusphere-egu23-11234, 2023.

EGU23-11482 | Posters on site | CL3.1.2

Climatic water balance in Poland – intraannual variability and longterm trends 

Joanna Wibig and Joanna Jędruszkiewicz

On the basis of data from the period 1966-2020 from about 50 stations in Poland the precipitation and potential evaporation indices will be estimated and their variability analyzed. Different formulas of potential evapotranspiration, based on air temperature, relative humidity, saturation deficit, wind speed and/or sunshine duration, will be compared. Climatic water balance defined as a difference of precipitation and potential evapotranspiration will be calculated and its intraannual variability analyzed. Long-term changes of all three parameters (precipitation, evapotranspiration and climatic water balance) in the context of contemporary warming will be examined. On this basis, the problem of water availability in various regions of the country will be discussed, especially in the context of changes in the spatial distribution and duration of the snow cover. 

How to cite: Wibig, J. and Jędruszkiewicz, J.: Climatic water balance in Poland – intraannual variability and longterm trends, EGU General Assembly 2023, Vienna, Austria, 23–28 Apr 2023, EGU23-11482, https://doi.org/10.5194/egusphere-egu23-11482, 2023.

Parts of western North America experienced a heatwave in late June 2021that many would have conceived impossible based on observations so far. In Lytton, Canada, temperatures peaked at 49.6°C, and the area-average daily maximum temperature record across the Pacific Northwest was broken by nearly 5°C. Given the exceptional intensity of the eventsome media outlets and scientists raised the questions whether heat extremes intensify faster than previously projected based on climate models, or whether current generations of climate models miss crucial processes and are thus unable to even reproduce such an event.. Here I address these questions and highlight some of the challenges for widely methods in model evaluation and attribution.

First, I review some of the recent literature detailing the key physical mechanisms driving the Pacific Northwest heatwave. I address some of the key scientific challenges regarding the quantification of return periods, event attribution, model evaluation and near-term projections. Widely used methods estimating stationary return periods based on the observational record up to the year before imply that such an event had an infinite return period, i.e., that it would never happen. Even when taking into account the non-stationarity of a warming climate, the exceedance probability would be zeroor nearly zero depending on the estimation of the confidence intervals, the duration of the event and whether the event itself is included in the fit.

I discuss some potential ways forward in addressing the above challenges and in quantifying the potential intensity of record-shattering events in the near future.  

How to cite: Fischer, E.: The record-shattering 2021 Pacific Northwest heatwave – challenges and opportunities for attribution and event storylines, EGU General Assembly 2023, Vienna, Austria, 23–28 Apr 2023, EGU23-11732, https://doi.org/10.5194/egusphere-egu23-11732, 2023.

EGU23-12474 | ECS | Orals | CL3.1.2 | Arne Richter Award for Outstanding Early Career Scientists Lecture

The kids aren’t alright 

Wim Thiery

Under continued global warming, extreme events such as heatwaves will continue to rise in frequency, intensity, duration, and spatial extent over the next decades. Younger generations are therefore expected to face more such events across their lifetimes compared to older generations. This raises important questions about solidarity and fairness across generations that have fuelled a surge of climate protests led by young people in recent years, and that underpin questions of intergenerational equity raised in recent climate litigation. However, scientific analyses that explicitly consider the intergenerational equity dimension of the climate crisis are remarkably absent. Our standard scientific paradigm is to assess climate change in discrete time windows or at discrete levels of warming, a “period” approach that inhibits quantification of how much more extreme events a particular generation will experience over its lifetime compared to another. By developing a “cohort” perspective to quantify changes in lifetime exposure to climate extremes and compare across generations, we estimate that children born in 2020 will experience a two to sevenfold increase in extreme events, relative to the 1960 birth cohort, under current climate pledges. Building on this framework, we quantify where and when people start living an unprecedented life, as well as intergenerational differences in exposure to attributable extreme events. Furthermore, using a new water deficit indicator, we uncover spatiotemporal differences in lifetime water scarcity. Our results overall highlight a severe threat to the safety of young generations and call for drastic emission reductions to safeguard their future. Finally, this research is already being used in ongoing litigation (e.g. Duarte Agostinho and Others v. Portugal and 32 Other States), calling for more research in this direction to bolster the upcoming wave of climate lawsuits.

How to cite: Thiery, W.: The kids aren’t alright, EGU General Assembly 2023, Vienna, Austria, 23–28 Apr 2023, EGU23-12474, https://doi.org/10.5194/egusphere-egu23-12474, 2023.

Heat extremes show the fastest warming trend over western Europe (WEU) and a weak cooling trend over the Midwest United States (MUS). We use observations and Earth System Model (ESM) large ensemble simulations to understand why the observed trends over these two regions are opposite. Based on the dynamical adjustment method we provide observational and model evidence that circulation changes greatly amplify the warming trends over WEU and weaken the trends over MUS in the last four decades. We find that circulation-driven changes in heat extremes cause ~0.2°C/decade cooling over MUS that reverses the weaker warming effects of all other forcings combined and thus leads to very small overall trends. In contrast, it causes an additional ~0.2°C/decade warming over WEU, which accounts for ~35% of the warming rate that is caused by forced thermodynamic changes. Although ESMs represent the forced thermodynamic warming well over WEU, they underestimate the circulation-induced warming that further reveals why ESMs underestimate the observed warming rate over WEU.

Overall, these findings imply that if the circulation changes represent a forced response WEU continues to experience a severe intensification of heat extremes conditions in future as circulation-induced amplification of heat extremes may further intensify in the warmer world. Conversely, if the circulation-induced trend were due to internal variability, and thus would reverse in the coming decades, this would imply a somewhat slower rate of warming of heat extremes. Moreover, heat extremes over MUS continue to warm more slowly if circulation keeps dampening the warming effects in the coming decades, but potentially increase rapidly if the circulation trend reverses.

How to cite: Singh, J., Sippel, S., and Fischer, E.: Observed intensification of heat extremes amplified by circulation over western Europe and dampened over the US Midwest, EGU General Assembly 2023, Vienna, Austria, 23–28 Apr 2023, EGU23-12990, https://doi.org/10.5194/egusphere-egu23-12990, 2023.

EGU23-13745 | Orals | CL3.1.2 | Highlight

Searching for the most extreme temperature events in recent history 

Julien Cattiaux and Aurélien Ribes

Because they are rare, extreme weather events inevitably attract public and scientific attention. The most unusual events are regularly documented as part of routine climate monitoring by meteorological services, and put into the perspective of climate change by attribution studies through quantities such as a probability ratio. However, it is often recognized that (i) the selection of studied events is geographically uneven, and (ii) the definition of a given event, in particular its spatio-temporal scale, is subjective, which may impact the results.

In previous work, we proposed an objective method of event definition, consisting in the automatic selection of the spatio-temporal window maximizing the event rarity. Importantly, we showed that maximizing the event rarity does not bias attribution statements, in the sense that it does not systematically maximize (or minimize) the probability ratio. Here we present how this method can be used to compare several events occurring on different years, seasons, regions, etc. Our objective research procedure works both over time, which can be useful for routine climate monitoring, and over space, which can resolve the geographical selection bias of attribution studies. Ultimately, we provide a selection of the most extreme hot and cold events that have occurred worldwide in the recent past, among which are iconic heat waves such as that seen in 2021 in Canada or 2003 in Europe.

How to cite: Cattiaux, J. and Ribes, A.: Searching for the most extreme temperature events in recent history, EGU General Assembly 2023, Vienna, Austria, 23–28 Apr 2023, EGU23-13745, https://doi.org/10.5194/egusphere-egu23-13745, 2023.

EGU23-13786 | ECS | Orals | CL3.1.2

Analysis of precipitation records from climate models in a non-stationary context 

Paula Gonzalez, Philippe Naveau, Soulivanh Thao, and Julien Worms

In the context of climate change, assessing how likely a particular change or event has been caused by human influence is important for mitigation and adaptation policies. Disturbances, such as increases in the frequency and intensity of extreme precipitation have been observed at continental to global scales. In this work we present an Extreme Event Attribution methodology for yearly maxima records that takes into consideration the temporal non-stationarity of climate variables and allow us to quantify record probability at a global scale in a transient setup. We apply our methodology to study records of yearly maxima of daily precipitation issued from the numerical climate model IPSL-CM6A-LR and the scenario rcp8.5 at a global scale. Focusing on decadal records, we detect a clear anthropogenic signal from the 2020's, even thought decadal record probability increases in most parts of the world, we observe a decrease of records probability in the subtropics.

How to cite: Gonzalez, P., Naveau, P., Thao, S., and Worms, J.: Analysis of precipitation records from climate models in a non-stationary context, EGU General Assembly 2023, Vienna, Austria, 23–28 Apr 2023, EGU23-13786, https://doi.org/10.5194/egusphere-egu23-13786, 2023.

EGU23-14095 | ECS | Posters on site | CL3.1.2

Recent changes of tropical night in the South Korea metropolitan area 

TaeHun Kang, Donghyuck Yoon, Dong-hyun Cha, and Myong-In Lee

To investigate the recent change of tropical night in South Korea, the duration and intensity of tropical nights (daily minimum temperature , Korea Meteorological Administration; KMA) were quantitatively analyzed for 40 years (1979-2018). As a result of spatiotemporal analysis, There were stronger and longer-lasting tropical nights in the Seoul metropolitan area compared to other regions of South Korea. In particular, the tropical nights over the region tended to increase more prominently in terms of intensity, frequency, and duration.

The tropical night event in the metropolitan area was classified into pure-TN (no heatwave prior to tropical night) and HWTN (tropical night following heatwave). In the analysis of climatological synoptic conditions based on 40-year ERA5 data, two types of tropical night events (pure-TN and HWTN) occurred. Pure-TN occurred when a mid-level anticyclone circulation existed over the Korean Peninsula with the southwesterly which induced a positive temperature advection anomaly over the metropolitan area. Moreover, a positive low cloud cover anomaly with enhanced downward longwave radiation also prevailed. On the other hand, HWTN mainly occurred when a mid-level cyclone circulation was located over the Korean Peninsula with a positive downward shortwave radiation anomaly and a descending motion anomaly that induced adiabatic heating over the metropolitan area.

Significant increasing trends in tropical night events (pure-TN: 0.143 day/year, HWTN: 0.077 day/year) appeared at 95% confidence level. The regression analysis was also conducted for three sub-analysis periods with 10 days (21-31 July;P1, 1-10 August;P2, 11-20 August;P3). Consequently, the favorable atmospheric conditions for HWTN (pure-TN) have been frequently constructed during P2 (P1, and P3).

How to cite: Kang, T., Yoon, D., Cha, D., and Lee, M.-I.: Recent changes of tropical night in the South Korea metropolitan area, EGU General Assembly 2023, Vienna, Austria, 23–28 Apr 2023, EGU23-14095, https://doi.org/10.5194/egusphere-egu23-14095, 2023.

EGU23-14441 | ECS | Posters on site | CL3.1.2

Collective attribution and future risk assessment of recent high-impact wildfire events 

Zhongwei Liu, Jonathan Eden, Bastien Dieppois, Igor Drobyshev, Stefaan Conradie, Carolina Gallo, and Matthew Blackett

In recent years, the occurrence of a series devastating wildfire events around the world has raised considerable public concern about how climate change is altering meteorological conditions conducive to such events. The relative scarcity of wildfire attribution studies, coupled with the limited observational record, has added to the difficulty of developing reliable collective conclusions for future forest management strategies. Recent work has discussed the uncertainties and sensitivities associated with the choice of meteorological indicator to represent fire weather and the validation of climate model ensemble in the context of extreme event attribution, but the value of linking the attribution of recent record-breaking wildfire events with future risk assessment has not yet been fully explored.

Here, using an established probabilistic framework based on extreme value theory, we present the findings of attribution analysis applied to a series of recent high-impact wildfire. In each case, fire weather extremes, represented by annual maxima of the Canadian Fire Weather Index (FWI), are fitted to an extreme value distribution and scaled to the global mean surface temperature. Probability ratios are used to quantify the influence of rising global temperatures on the changing frequency of FWI extremes for past, present and future climates. We demonstrate the value of the application of a common methodological framework in combining results from different case studies as part of a collective attribution approach for multiple extreme across several world’s fire-prone regions. Further analysis of future risks will provide robust recommendations to reduce and address the hazards posed by wildfires and to improve post-disaster resilience.

How to cite: Liu, Z., Eden, J., Dieppois, B., Drobyshev, I., Conradie, S., Gallo, C., and Blackett, M.: Collective attribution and future risk assessment of recent high-impact wildfire events, EGU General Assembly 2023, Vienna, Austria, 23–28 Apr 2023, EGU23-14441, https://doi.org/10.5194/egusphere-egu23-14441, 2023.

EGU23-14521 | ECS | Orals | CL3.1.2

Quantifying the contribution of climate change to heat-attributable mortality in Europe: Interfacing epidemiology and Extreme Event Attribution 

Thessa Beck, Lukas Gudmundsson, Sonia I. Seneviratne, Hicham Achebak, Dominik Schumacher, and Joan Ballester

Extreme Event Attribution (EEA) aims to answer the question of whether and to what extent the intensity and likelihood of an observed extreme weather event have changed due to climate change. This approach has been applied to different types of weather extremes such as heatwaves, droughts, or extreme rainfall, but has only rarely been used to assess the role of climate change on health impacts caused by extreme weather events.

In this study, we focus on the short-term effects of extreme heat events on human mortality in Europe. We first apply an epidemiological model to estimate the lagged association between temperatures and mortality counts. We use ERA5-Land temperature data and a mortality database including 92.612.620 counts of death from 823 contiguous regions in 35 European countries, representing a population of over 534 million people. We estimate the number of deaths attributable to heat and then compute the death count caused by climate change by applying EEA methods. Here, we apply a conditional extreme value distribution to estimate how the likelihood of selected heat-attributable mortality events has changed from a pre-industrial climate to present-day conditions (1.2ºC global warming).

We show that in all regions of Europe, a climate change signal in heat-attributable mortality can be detected. This climate change contribution to mortality differs between geographical locations in Europe and is also influenced by demographic, and socioeconomic factors, e.g., we identify differences in climate impacts in gender-specific mortality.

This study shows that epidemiological models can be combined with EEA methodologies and it opens the door to conducting further EEA studies, including rapid attribution, on other health impacts and beyond.

How to cite: Beck, T., Gudmundsson, L., Seneviratne, S. I., Achebak, H., Schumacher, D., and Ballester, J.: Quantifying the contribution of climate change to heat-attributable mortality in Europe: Interfacing epidemiology and Extreme Event Attribution, EGU General Assembly 2023, Vienna, Austria, 23–28 Apr 2023, EGU23-14521, https://doi.org/10.5194/egusphere-egu23-14521, 2023.

EGU23-14756 | ECS | Orals | CL3.1.2 | Highlight

The Effect of Climate Change on Global Wildfire Activity 

Seppe Lampe, Chantelle Burton, Eleanor Burke, Jinfeng Chang, Nikos Christidis, Matthew Forrest, Lukas Gudmundsson, Huilin Huang, Stijn Hantson, Akihiko Ito, Douglas Kelley, Sian Kou-Giesbrecht, Gitta Lasslop, Fang Li, Wei Li, Lars Nieradzik, and Wim Thiery

Recent long and intensive wildfire seasons in many regions have highlighted the urgency to understand the shift in worldwide fire regimes, raising the question if human induced climate change has played a role therein. However, attributing changes in fire to anthropogenic climate change is difficult, since possible signals are confounded by multiple drivers including fire weather, fuel availability and sources of ignition. Therefore, fire indices or individual input variables are often used as proxies. There have been some attempts to model drivers of recent trends in fire, though assessment of overall anthropogenic climate change is still lacking. Recent integration of fire models into ISIMIP now allow us to perform a fire impact attribution analysis using multiple coupled fire-vegetation models. Here, we combine both ISIMIP factual and counterfactual simulations with remote sensed observations to understand how burnt area has changed over the historical period due to a changing climate.

How to cite: Lampe, S., Burton, C., Burke, E., Chang, J., Christidis, N., Forrest, M., Gudmundsson, L., Huang, H., Hantson, S., Ito, A., Kelley, D., Kou-Giesbrecht, S., Lasslop, G., Li, F., Li, W., Nieradzik, L., and Thiery, W.: The Effect of Climate Change on Global Wildfire Activity, EGU General Assembly 2023, Vienna, Austria, 23–28 Apr 2023, EGU23-14756, https://doi.org/10.5194/egusphere-egu23-14756, 2023.

EGU23-15031 | Posters on site | CL3.1.2

Attributing observed trends in heat-related excess mortality to climate change 

Veronika Huber, Susanne Breitner-Busch, Alexandra Schneider, and Matthias Mengel

Past studies quantifying the burden of heat-related mortality attributable to climate change have mostly focused on specific extreme events or considered multi-decadal averages. Here, we contribute to the scarce literature on the attribution of observed temporal trends in heat-related mortality to climate change. Our study is based on daily all-cause mortality time-series from 15 major German cities over 1993-2020. Counterfactual climate data is derived from century-long measurement series of daily mean temperatures by removing trends related to the observed rise in global mean temperature according to the ATTRICI method. We use quasi-Poisson regression models including distributed lag non-linear models and multivariate meta-regression models to estimate temperature mortality associations. Our results corroborate previous model-based estimates, suggesting that, averaged over the entire study period, 28% (95%CI: 17%, 42%) of warm-season (May-Sep) heat-related excess mortality across all German cities were attributable to climate change. Considering linear temporal trends suggests that this proportion has increased by 4.0±1.0% per decade. Under observed climate change, we find a linear increase of 174 (SE: ±151) heat-associated deaths per decade across cities. By contrast, our results suggest that without climate change there would not have been a significant increase in heat associated deaths. Overall, our study provides evidence of increasing impacts of climate change on heat-related mortality in Germany since the 1990s. As temperatures keep rising in the future, climate change is expected to drive further increases in heat-related excess mortality unless additional adaptive measures are taken.

How to cite: Huber, V., Breitner-Busch, S., Schneider, A., and Mengel, M.: Attributing observed trends in heat-related excess mortality to climate change, EGU General Assembly 2023, Vienna, Austria, 23–28 Apr 2023, EGU23-15031, https://doi.org/10.5194/egusphere-egu23-15031, 2023.

EGU23-15331 | ECS | Orals | CL3.1.2

Recent trends in vegetation phenology across the southern Mediterranean region, and potential climatic drivers 

Behnam Mirgol, Bastien Dieppois, Jessica Northey, Jonathan Eden, Lionel Jarlan, Yves Tramblay, Gil Mahé, Ikram El Hazdour, Saïd Khabba, Lahoucine Hanich, and Michel Le Page

The agriculture sector is sensitive to changes in weather and climate, notably extreme events. Extreme variations in weather conditions throughout a growing season led to changes in phenological features of vegetation and crops and cause variations in harvest, and, generally, the impact could be large in terms of production amounts and then food security in the region. The last version of the Intergovernmental Panel on Climate Change report (IPCC) highlighted the southern Mediterranean region as a hot spot and one of the most vulnerable regions in the world. While numerous studies have addressed changes in climate extremes throughout the world, very little research has been conducted in the southern Mediterranean region concerning the seasonal concurrence of climate extremes, and their evolutions in recent decades.  Moreover, understanding the impacts of these changes on vegetation phenology is crucial in the region, but this is yet to be studied.

This study evaluates the impact of climate extremes on vegetation phenology in the southern Mediterranean region over the last 40 years. Firstly, the trends of 15 phenological vegetation indicators (e.g., length of the growing season, maximum Normalized Difference Vegetation Index [NDVI] value/time, onset/offset times, green upslope, brown downslope, etc.) are examined using National Oceanic and Atmospheric Administration [NOAA] satellite images and the modified Mann-Kendall trend test. Secondly, we examine how recent trends in vegetation phenology compare with those observed in various heat-related indices (heat wave characteristics), water-related indices (Standard Precipitation Index [SPI], Standard Precipitation Evapotranspiration Index [SPEI], Extreme Precipitation, Wet/Dry spells), and compound indices (Dry-Cold, Dry-Hot, Wet-Cold, Wet-Hot events) calculated using the ERA5-land dataset. Finally, we examine the relative importance of each climate indicator in explaining multi-year changes in vegetation phenology. As such, this study not only identifies the areas with higher risk and vulnerability for vegetation and crops in the last years but also identifies potential predictors for seamless seasonal-to-decadal forecasts of agrometeorological risks across the region.

How to cite: Mirgol, B., Dieppois, B., Northey, J., Eden, J., Jarlan, L., Tramblay, Y., Mahé, G., El Hazdour, I., Khabba, S., Hanich, L., and Le Page, M.: Recent trends in vegetation phenology across the southern Mediterranean region, and potential climatic drivers, EGU General Assembly 2023, Vienna, Austria, 23–28 Apr 2023, EGU23-15331, https://doi.org/10.5194/egusphere-egu23-15331, 2023.

EGU23-15387 | Posters on site | CL3.1.2

Climate attribution for extreme events. A statistically based approach. 

Daniele Bocchiola and Lucia Ferrarin

Weather data observed all over the world show an increase in the frequency of extreme events, leading to higher economical losses and numbers of victims. It is thus crucial to investigate causes of such trends, and future evolutions thereby. A method for climate attribution is to assess as to whether anthropogenic climate change affected either the probability of occurrence/or the magnitude of extreme events. Results thereby are fundamental to link extreme event impacts and global warming, and could potentially be used to assess responsible subjects, under the perspective e.g. of setup of compensation policies. Attribution studies so far have shown large uncertainty, especially concerning weather events affected by other drivers than temperature (e.g. precipitation, drought, snow-fall events). As a first step to perform an attribution study one has to identify/quantify a trend of one or more variable(s)/indexes affecting the event under analysis.

Here, we applied statistical methods to identify potential trends, and to back-attribute them to global warming. Using synthetically generated a-priori known, trend-affected series of meteorological variables (P,T, etc..), we (try and) back-trace the presence/magnitude of trends, and try and verify measurable changes of the statistical (extreme values) distribution thereby, for the purpose of robust  climate attribution.  

The goal is to quantify how much results of an attribution study depend upon data type (ground based, climate models, etc..), and accuracy thereby, and upon (robustness of) the trend detection method applied in the analysis.

For an application to a real world case study, we selected variables of interest (precipitation/snowfall extremes) in the Alps of Italy, and we tested the results of the methodology, by assessing trend presence/magnitude of extreme events distributions’ parameters, and robustness thereby.  

How to cite: Bocchiola, D. and Ferrarin, L.: Climate attribution for extreme events. A statistically based approach., EGU General Assembly 2023, Vienna, Austria, 23–28 Apr 2023, EGU23-15387, https://doi.org/10.5194/egusphere-egu23-15387, 2023.

EGU23-15502 | ECS | Orals | CL3.1.2

Climate change has increased the intensity of documented Derecho storms in France 

Lucas Fery, Bérengère Dubrulle, and Davide Faranda

A thunderstorm system formed during the night of August 17 to 18 over the northern Balearic Islands and moved rapidly to the northeast, causing widespread damage over Corsica, Northern Italy and Austria due to the production of strong surface wind gusts (>200 km/h over Corsica) and severe hail. The intensity of this phenomenon can be classified in the category of derechos: this is a classification of very violent storms that takes into account the wind gusts (more than 94km/h with maxima of more than 120km/h) and the extent of the affected territory (major axis longer than 400 kilometers). Here we analyse recent derechos event in France in the satellite era and assess the role of climate change in modifying their characteristics. We identify eleven events in the past and provide their tracks retrieved using the ERA5 reanalysis dataset. To detect climate change signal, we compare  analog cyclonic atmospheric circulations that can lead to derechos in the distant past (1950-1979) and in the recent past (1992-2022). Two of the events, the derechos which affect the Northern regions are unprecedented, that is no good analogues can be found and attribution statements cannot be made on the basis of the present analysis. For the other events, instead, we find a significant signal of increased precipitation in the recent period which, without change in circulation, is explained by the higher temperatures of the Bay of Biscay and the Mediterranean Sea. For these events there is also not a clear change in depth of the pressure minimum which triggered the convective system. Finally, we can exclude the role of the climate variability of El Nino (ENSO) in most of the events, while we cannot rule out the influence of the Atlantic Multidecadal Oscillation (AMO) in favoring low pressure systems possibly leading to derechos.

How to cite: Fery, L., Dubrulle, B., and Faranda, D.: Climate change has increased the intensity of documented Derecho storms in France, EGU General Assembly 2023, Vienna, Austria, 23–28 Apr 2023, EGU23-15502, https://doi.org/10.5194/egusphere-egu23-15502, 2023.

EGU23-15912 | ECS | Posters on site | CL3.1.2

Attribution of seasonally-relevant climate indicators in Hungary 

Péter Szabó, Judit Bartholy, and Rita Pongrácz

Although anthropogenic global warming is well-described in the climate community, some socioeconomic groups are still skeptical about it due to various reasons, and they do not know how to associate local weather or climate events with global warming. It is our duty to raise awareness by conveying easily understandable yet scientifically sound and straightforward information and to explain how human activity contributes to climate impacts in front of our eyes, in our region. Although it is widely assessed now in Western Europe, in Hungary from September 2021 we began our comprehensive analyses and raised awareness in several social strata through our local attribution project.

Within the project, we selected seasonally relevant and publicly well-known climate indicators (e.g., vegetation start in spring, heatwaves and forest aridity in summer, second summer in autumn, snow in winter), since they either have a fairly large public interest or have big impacts in our region. Dissemination is done mainly via a well-known online Hungarian platform with broad media coverage, while their social media network is also used with short messages. Results are published in each season at around an event occurrence or absence (e.g., when there is no snow in winter, when vegetation starts too early in spring).

For the analysis, we used several state-of-the-art data sets consisting of global climate model simulations with both natural-only and historical forcings, an ensemble of regional climate model simulations with strong mitigation and non-mitigation future scenarios, and high-quality, gridded observations.

How to cite: Szabó, P., Bartholy, J., and Pongrácz, R.: Attribution of seasonally-relevant climate indicators in Hungary, EGU General Assembly 2023, Vienna, Austria, 23–28 Apr 2023, EGU23-15912, https://doi.org/10.5194/egusphere-egu23-15912, 2023.

EGU23-16087 | Orals | CL3.1.2 | Highlight

On the nature and attribution of the 2022 annual record temperature in the UK and Ireland 

Neven Fuckar, Myles Allen, and Michael Obersteiner

As climate changes to likely a warmer mean state by the end of this century than any time during the existence of humans, the world population has rapidly increased from about 1.3 billion in 1850 to 8 billion in November 2022. The latest IPCC AR6 reports attests that extreme events (e.g., heatwaves, floods, droughts, etc.) are occurring in many parts of the world at an increasing frequency and/or intensity due to global climate change, and are threatening human health, Earth’s biosphere, and the socio‐economic fabric of our rapidly expanding and resource‐hungry civilisation. On 19 July 2022 England, Wales and Scotland all experienced the hottest days on the record reaching 40.3 deg.C, 37.1 deg.C and 34.8 deg.C, respectively, and London Fire Brigade received the highest number of emergency calls since World War II. While in Dublin near-surface air temperature reached 33.0 deg.C on 18 July – the highest in the Ireland’s record. Furthermore, the annual mean temperature in 2022 was highest on the record in the UK and Ireland. This study uses a set of observations and reanalysis products combined with large ensembles of CMIP5/6 simulations to examine the structure of atmospheric circulation and the role of anthropogenic drivers leading to these extreme events on annual timescale. We also use large ensembles of specifically designed historical/factual and natural/counterfactual simulations of EC-Earth3 coupled climate model at the standard resolution and weather@home2 climate simulations performed by citizen scientists around the world to assesses to what extent anthropogenic forcing modified the probability and magnitude of this event. Moreover, we involve conditional perspective of the atmospheric circulation in our attribution estimates. The preliminary results points to a pronounced role of the global climate change in modifying likelihood and intensity of these annual extreme events.

How to cite: Fuckar, N., Allen, M., and Obersteiner, M.: On the nature and attribution of the 2022 annual record temperature in the UK and Ireland, EGU General Assembly 2023, Vienna, Austria, 23–28 Apr 2023, EGU23-16087, https://doi.org/10.5194/egusphere-egu23-16087, 2023.

EGU23-16818 | ECS | Orals | CL3.1.2

Shifting Velocity of Precipitation Extremes over India under Climate Change 

Disha Sachan, Amita Kumari, and Pankaj Kumar

Climate change is leading to alterations in the dynamic climate systems worldwide. The Indian Summer Monsoon (ISM) is one such climate system that supports more than a billion population and drives the Indian economy. The ISM is governed by intra-annual to inter-decadal variabilities. However, anthropogenic climate change is inducing unprecedented transformations in this natural system, such as the increased probability of precipitation extremes (dry and wet), changes in their frequency and duration, spatial variabilities, etc. These changes, in turn, impact the human and ecological systems due to droughts, floods, and prolonged dry spells. In such scenarios, it is essential to gain insights into the projected precipitation extremes (PEs) changes. The velocity of climate change (VoCC) or climate velocity can help us project the temporal and spatial shift of PEs especially in terms of their intensities. VoCC is a regional metric of climate change, defined as the ratio of the temporal gradient of a particular climate variable (temperature, precipitation, humidity, etc.) with its spatial gradient, and the resultant units are in km/year. In the current study, the climate velocities of 50th, 75th, 95th, 99.5th, and 99.9th percentiles of precipitation for the JJAS season are projected over India and its different biogeographic zones for the four time periods: historical (1976-2000), near-future (2025-2049), mid-future (2050-2074) and far-future (2075-2099). ROM, a regional earth system model over the CORDEX-South Asia domain was used in the study. It was found that ROM showed a better resemblance with observation in simulating the PEs over other regional climate models (RCMs). The intense rainfall (95th percentile: R95) is expected to be enhanced over most of the study region in mid future and far future. Interestingly, very intense rainfall (99.9th percentile: R99) showed robust increases in the near and mid-future as compared to the far future. The PEs also exhibited higher velocities as compared to the median values. The detailed results will be discussed further in the presentation.

How to cite: Sachan, D., Kumari, A., and Kumar, P.: Shifting Velocity of Precipitation Extremes over India under Climate Change, EGU General Assembly 2023, Vienna, Austria, 23–28 Apr 2023, EGU23-16818, https://doi.org/10.5194/egusphere-egu23-16818, 2023.

EGU23-17253 | ECS | Orals | CL3.1.2

The burden of temperature-related stillbirths and neonatal deaths attributable to climate change – a global analysis across 29 Low- and Middle-income countries 

Asya Dimitrova, Anna Dimitrova, Matthias Mengel, Antonio Gasparrini, Sabine Gabrysch, and Hermann Lotze-Campen

Climate change is increasingly affecting the health of vulnerable populations, including pregnant women, the developing foetus and newborns. Despite growing epidemiological evidence on the effects of ambient temperatures on adverse birth outcomes and child survival, the role of climate change in the burden of temperature-related adverse birth outcomes has been insufficiently investigated. We combine data from the Demographic Health Survey (DHS) for 29 low- and middle-income countries with factual temperature data from the ISIMIP3a simulation round to quantify the non-linear association between daily mean temperature and stillbirths and neonatal deaths. We estimate the associations using a time-stratified case-crossover design. Based on the derived exposure-response functions and counterfactual temperature data we estimate the burden of stillbirths and neonatal deaths between 2001-2019 that can be attributed to climate change. The results both for stillbirths and neonatal deaths indicate a U-shaped curve, with risk of mortality increasing below and above an optimum temperature. We find that climate change has increased the burden of heat-related stillbirths across 28 of the countries (from 0.6% in Albania and Tajikistan to 4.1% in Philippines) and the burden of heat-related neonatal deaths – across 20 of the countries (from 0.2% in India to 1% in Philippines and Haiti). For 21 of the included countries climate change has also led to a reduction in the burden of cold-related stillbirths (from 0.2% in Tajikistan to 4.4% in Uganda) and neonatal deaths (from 0.5% in Tajikistan to 3.5% in the Philippines).

How to cite: Dimitrova, A., Dimitrova, A., Mengel, M., Gasparrini, A., Gabrysch, S., and Lotze-Campen, H.: The burden of temperature-related stillbirths and neonatal deaths attributable to climate change – a global analysis across 29 Low- and Middle-income countries, EGU General Assembly 2023, Vienna, Austria, 23–28 Apr 2023, EGU23-17253, https://doi.org/10.5194/egusphere-egu23-17253, 2023.

EGU23-17514 | Orals | CL3.1.2

Challenges and opportunities for detection and attribution of climate change impacts on health 

Felipe J Colón-González, Isabel Fletcher, Grace Annan-Callcott, and Bilal Mateen

There are valid concerns as to whether climate change has influenced the observed shifts in the spatial range, frequency, intensity, and duration of some health hazards. In a few cases, it has been possible to quantify the extent of this influence. However, current research is limited to a small number of health hazards and a handful of geographical areas, primarily in high income countries. This situation negatively affects the credibility of the mitigation policy arguments and constrains our ability to communicate with relevant stakeholders who might see climate impacts on health as distant in time, geography, or social cohort.  

Attribution science could be used to strengthen the evidence on how some types of health events have changed and how they are expected to change due to climate change. This evidence could be used as a case for limiting warming before irreversible changes occur. It will also be useful to inform adaptation strategies and increase the likelihood that policymakers will implement their announced climate change pledges and policies in a timely manner. 

Given its relatively new application to health, there are no clear best methods, sets of assumptions, or comprehensive data sets that could be used to attribute climate impacts on health. Also, the tools and methods for attributing climate impacts on health that exist in the literature tend to be created locally by a handful of institutions for a narrow use case and are often not easily reproducible.  Here, we present a funding organisation perspective on how we can start addressing some of the challenges on the D&A space.

How to cite: Colón-González, F. J., Fletcher, I., Annan-Callcott, G., and Mateen, B.: Challenges and opportunities for detection and attribution of climate change impacts on health, EGU General Assembly 2023, Vienna, Austria, 23–28 Apr 2023, EGU23-17514, https://doi.org/10.5194/egusphere-egu23-17514, 2023.

EGU23-268 | ECS | Orals | CL3.1.3

Future Projections of Heat Waves over India under CMIP6 Scenarios 

Neethu Chathu and Kalidahasan Vasanthakumari Ramesh

Anomalous episodes of extremely high surface temperature are heat waves, observational studies have shown that heat wave characteristics like intensity, frequency, and duration are increasing regionally and globally. As heat waves inflict disastrous impacts on the livelihood of millions of people, it is critical in developing suitable mitigation strategies to curtail the socio-economic vulnerability. Future projections at the regional level will be crucial for climate risk management to policymakers. The present study addresses the changes in the heat wave characteristics over the seven temperature homogeneous zones of India, viz. North West, North Central, West Coast, East Coast, Interior Peninsula, Western Himalaya, and North East. We use the historical (1951-2014) and projections (2015-2100) of the Coupled Model Intercomparison Project phase-6 (CMIP6) under different climate change scenarios based on Shared Socioeconomic pathways, SSP126, SSP245, SSP370, and SSP585. The reliability assessment has been carried out and the selected model composite showed good skill than all model composite, in the multiple aspects of observed heat wave features over each zone. The findings show that the projected area of occurrence of extreme daily maximum temperature and long-lasting heat waves (>11 days) are considerably increasing over all zones, where the exacerbating increase is over West Coast under all climate change scenarios.  The heat wave days are likely to increase two times over Western Himalaya and North West,  while the warm days are increasing four-fold over West Coast and double over other zones under SSP370 and SSP585.  The projected changes in heat wave characteristics over North East is below the all-India average. High-intensity heat waves are probably over the coastal zones under the scenario SSP370 and SSP585. Currently, the least heat wave impacted West Coast,  likely to be more vulnerable in the future. The projections show the heat wave characteristics are increasing over all the zones and have a spatio-temporal variation.

How to cite: Chathu, N. and Ramesh, K. V.: Future Projections of Heat Waves over India under CMIP6 Scenarios, EGU General Assembly 2023, Vienna, Austria, 23–28 Apr 2023, EGU23-268, https://doi.org/10.5194/egusphere-egu23-268, 2023.

EGU23-918 | Orals | CL3.1.3 | Highlight

Causes of the extremely low solar radiation in the 2021 growing season over southeastern Tibetan Plateau and its impact on vegetation growth 

Yanyi He, Kun Yang, Yanghang Ren, Mijun Zou, Xu Yuan, and Wenjun Tang

The Tibetan Plateau (TP), known as the ‘Third Pole’ region, is one of the most sensitive places to global climate change, which possesses the highest surface incident solar radiation (SSR) in China. In the 2021 growing season, i.e., May to September, southeastern Tibetan Plateau (SETP) registered a widespread and extremely low SSR since 1950 with approximately -18.65 W/m2 of regional mean anomaly relative to 1950-1979 mean. Through the analyses using observations, reanalysis and CMIP6 model simulations, the extremely low SSR event in 2021 is mainly attributed to more clouds and abundant atmospheric moisture caused by anomalous southerlies from the Bay of Bengal. The existence of abnormal south winds could increase the probability ratio of such low SSR events like 2021 to be 9.25 (95% CI: 6.56-19.02). Anthropogenic aerosols and GHGs-induced warming might increase the probability of such SSR events to be a factor of 4.70 (95% CI: 1.66-15.49) and 1.66 (95% CI: 1.01-6.59), respectively. As a result, the extremely low SSR event could significantly reduce local gross primary productivity in the 2021 growing season over SETP, especially in the humid eastern SETP where SSR has a stronger impact on vegetation photosynthesis.

How to cite: He, Y., Yang, K., Ren, Y., Zou, M., Yuan, X., and Tang, W.: Causes of the extremely low solar radiation in the 2021 growing season over southeastern Tibetan Plateau and its impact on vegetation growth, EGU General Assembly 2023, Vienna, Austria, 23–28 Apr 2023, EGU23-918, https://doi.org/10.5194/egusphere-egu23-918, 2023.

EGU23-2176 | ECS | Orals | CL3.1.3 | Highlight

The 1820s Marks a Shift to Hotter‐Drier Summers in Western Europe Since 1360 

Lu Wang, Hongyan Liu, Deliang Chen, Peng Zhang, Steven Leavitt, Yu Liu, Congxi Fang, Changfeng Sun, Qiufang Cai, Zhengyang Gui, Boyi Liang, Liang Shi, Feng Liu, Yukun Zheng, and Jussi Grießinger

    Soil moisture is the primary indicator for assessing agricultural and ecological drought, and its relationship with temperature has a great impact on regional climates, such as triggering heat waves. So far, studies on the coupling relationship between soil moisture and temperature have mainly focused on arid or semi-arid regions with strong land-atmosphere coupling. However, less attention has been paid to humid regions with relatively weak coupling between soil moisture and temperature there. In recent years, a number of studies have found that heat waves in humid regions are directly related to the coupling of soil moisture and temperature. Nevertheless, historical changes of soil moisture and its relationship with temperature in humid areas are still unclear.
    In this study, three sampling sites with published long-term tree ring δ18O records in England and France were selected to reconstruct the surface (0–10 cm) soil moisture changes in Western Europe (40°N–55°N, 10°W–10°E) from 1360 to 2000 AD. Various abrupt-change detecting tests (Mann-Kendall test, Yamamoto method, and Bernaola-Galvan segmentation algorithm) showed that soil moisture began to decline suddenly around 1820, with increasing dry years and decreasing wet years, and no wet years after 1950 . After 1820, the coupling of soil moisture and temperature was growing stronger than before. Compared with the historical period, the summer sea level pressure anomaly is stronger in the dry years after 1820, which may be related to the weakened westerly circulation and water vapor transport. These findings suggest that, in the context of global warming, hotter and drier conditions are occurring not only in arid regions, but also in humid western Europe. Under future warming scenarios, humid regions may also be threatened by hot droughts.

How to cite: Wang, L., Liu, H., Chen, D., Zhang, P., Leavitt, S., Liu, Y., Fang, C., Sun, C., Cai, Q., Gui, Z., Liang, B., Shi, L., Liu, F., Zheng, Y., and Grießinger, J.: The 1820s Marks a Shift to Hotter‐Drier Summers in Western Europe Since 1360, EGU General Assembly 2023, Vienna, Austria, 23–28 Apr 2023, EGU23-2176, https://doi.org/10.5194/egusphere-egu23-2176, 2023.

Understanding extreme precipitation is essential for mitigating the associated risk. This study analysed eight Coupled Model Inter-comparison Project phase 6 (CMIP6) models by capturing daily, seasonal, yearly, and extreme precipitation over Bangladesh during the period 1961-2014, treating ECMWF Reanalysis v5 (ERA5) rainfall reanalysis data as an observational reference. Sixteen extreme precipitation definitions were found in the literature, implemented, and used in a comparative analysis in Bangladesh, one of the most vulnerable countries to climate change. Definitions used in the literature, duration definitions, such as the Consecutive Dry Days (CDD) and the Consecutive Wet Days (CWD), frequency definitions, such as the days when precipitation is at least 10 mm, 20 mm, 30 mm, at least 65 mm but less than 100 mm, at least 100 mm but less than 115 mm, at least 115 mm but less than 205 mm, and at least 205 mm, and intensity definitions, such as SDII, RX1day, RX3day, RX5day, PRCPTOT, R95pTOT, and R99pTOT. Temporal trends in extreme events identified by 16 different methods were assessed using both the modified Mann-Kendall (MK) method and Sen's Slope Estimator (SSE).

Analysis of the ERA5 reanalysis product indicated a 0.33-day-per-year increase in consecutive dry days (CDD) during 1961-2014 over Bangladesh, revealing that Bangladesh may be drying out at a faster rate than previously anticipated. For average daily wet-day precipitation intensity (SDII), ERA5 and MIROC6 showed a decrease at annual rates of -0.07 and -0.06 mm per day, respectively. If these trends continue over the next few years, Bangladesh may encounter water scarcity. In addition, a decrease at a rate of -0.09 days per year in R65mm was found in ERA5, while other frequency definitions do not have statistically significant trends. MIROC-ES2L has the closest agreement to ERA5 in terms of Percentage BIAS (PBIAS), R-Squared (R2), Root Mean Squared Error (RMSE), and Mean Squared Error (MSE) metrics, followed by EC-Earth3-Veg-LR, IPSL-CM6A-LR, and MIROC6. Several recommendations for future studies and improvements are also included in this study. Results presented in this study, specifically a faster drying rate, fewer days with 65-100 mm of daily precipitation, and possibly less monsoon seasonal precipitation are important for the development of adaptation strategies in Bangladesh.

How to cite: Huang, Y.: Analysis of extreme precipitation in Bangladesh based on reanalysis data and climate models, EGU General Assembly 2023, Vienna, Austria, 23–28 Apr 2023, EGU23-2403, https://doi.org/10.5194/egusphere-egu23-2403, 2023.

The attribution study of extreme weather events has attracted the interests of climate change science communities in recent years. From July–August 2022, an extraordinary heatwave with record-breaking high temperatures occurred in Central and Eastern China, especially over the Yangtze River Basin, for what period the China Meteorological Administration gave the first “red heat warning” in history. Meanwhile, the western Pacific subtropical high leaped over the Tibetan Plateau, which was rarely seen in the past. Understanding the causes of such extreme events and distinguishing the role of human played are both helpful for mitigation and adaptation of climate change, although it is full of challenges. This study used a risk ratio approach (PR) to investigate whether and to what extent atmospheric circulation and other factors (such as anthropogenic climate change, greenhouse gases, and aerosols) contributed to this event, 42 members out of 12 CMIP6 models. According to the CMIP6 simulations, the contribution results show that the existence of anomalous anticyclones would have increased the probability of this extreme heatwave by 4.5 times, making it the main driver for this extreme event in the past 60 years, while the anthropogenic climate change contributed the most (PR = 3.9) for the past 30 years. Additionally, we found that anthropogenic aerosols had no significant impact on the likelihood of this event (PR = 0.82 (0.74) in the past 30 (60) years). This study provides a strong warning that global warming caused by anthropogenic activities in recent decades may result in more frequent extreme heatwaves of summers similar to the summer of 2022. Therefore, measures for mitigating and adapting to global warming are urgently needed.

How to cite: Liang, W. and Dong, W.: How did anthropogenic forcing influence the exceptional heatwave in the summer of 2022 over the Yangtze River Basin through subtropical high?, EGU General Assembly 2023, Vienna, Austria, 23–28 Apr 2023, EGU23-2695, https://doi.org/10.5194/egusphere-egu23-2695, 2023.

EGU23-2892 | ECS | Posters on site | CL3.1.3

Impact of evaporation in Yangtze River Valley on heat stress in North China 

Lulei Bu and Zhiyan Zuo

In North China (NC), heat stress, which can be quantitatively characterized by wet-bulb globe temperature (WBGT), is closely related to specific humidity. This study focuses on the total days for NC averaged daily maximum WBGT exceeding 26°C (WGBT26) per summer (June to August) from 1979 to 2017. Rather than local precipitation or evaporation in NC, the NC WBGT26 is significantly related to the nonlocal evaporation around the Yangtze River Valley (YR). The abnormal positive evaporated water vapor in YR, associated with abnormal water vapor flux from south to north at 925 hPa, is continuously transported to NC in the above-normal WBGT26 years. Such an abnormal “evaporation and transportation” process can significantly increase the water vapor in NC and therefore enhance WBGT26. The evaporation in YR peaks in mid to late July and is closely associated with the occurrence days for daily maximum WBGT exceeding 26°C and maximum daily mean specific humidity at 925 hPa in summer. The main driver for the strongest YR evaporation anomaly from July 15th to August 15th is the simultaneous surface air temperature rather than the simultaneous or earlier soil moisture, precipitation, and vapor pressure deficit (VPD) anomaly. This condition is due to the continuously abundant soil moisture in the YR from April to September. The results of this study provide new ideas for studying heat stress in NC, indicating that nonlocal land-atmosphere interactions are crucial.

How to cite: Bu, L. and Zuo, Z.: Impact of evaporation in Yangtze River Valley on heat stress in North China, EGU General Assembly 2023, Vienna, Austria, 23–28 Apr 2023, EGU23-2892, https://doi.org/10.5194/egusphere-egu23-2892, 2023.

EGU23-3791 | ECS | Posters on site | CL3.1.3

Storylines for future changes in regional extreme precipitation 

Donghe Zhu, Patrick Pieper, Stephan Pfahl, and Erich Fischer

Despite the high confidence in the overall intensification of extreme precipitation at global scale in response to warming, uncertainties in regional intensity and spatial distribution remain large. Changes due to thermodynamical processes are largely consistent across global climate models and account for the globally homogeneous increase in extreme precipitation, whereas changes in dynamical processes modify the regional responses of extreme precipitation and are also mainly responsible for the projected uncertainties. We here aim at developing and characterizing different storylines for regional changes in extreme precipitation.

The latest CMIP6 multi-model ensembles allow for disentangling the three potential sources of uncertainty across climate models. Specifically, we find that scenario uncertainty in annual maximum precipitation (Rx1day) per K global warming is relatively small except over tropical Pacific and subtropical Africa regions. In order to isolate the inter-model uncertainty, which primarily relates to different responses in atmospheric dynamics, we here average multiple members from initial condition ensembles within CMIP6. To further characterize the dynamical processes and their effects on extreme precipitation, clusters of different model responses to climate change are identified for Mediterranean and Asian monsoon regions. The clusters are defined based on metrics that characterize regional dynamics. Different atmospheric fields are evaluated to develop physical storylines of future changes in extreme precipitation with model clusters representing similar dynamical responses. Specifically, an overall anticyclonic change is found to be characteristic for projections indicating highest reduction in Rx1day over Mediterranean. Future extreme precipitation changes over South Asia are linked to the models' representation of western coastal precipitation and orographic rainfall over the Himalaya. Other potential factors characterizing dynamical responses will be further examined to help understand changes in regional projections of extreme precipitation.

How to cite: Zhu, D., Pieper, P., Pfahl, S., and Fischer, E.: Storylines for future changes in regional extreme precipitation, EGU General Assembly 2023, Vienna, Austria, 23–28 Apr 2023, EGU23-3791, https://doi.org/10.5194/egusphere-egu23-3791, 2023.

EGU23-4223 | ECS | Orals | CL3.1.3

Atmospheric Drivers of Rainfall Events in the Republic of Djibouti 

Moussa Mohamed Waberi, Pierre Camberlin, Benjamin Pohl, and Omar Assowe

The Republic of Djibouti is a small country (23 200 km²) in East Africa, characterised by an arid context coupled with a high variability of rainfall that generates flash floods causing severe damage to the population and infrastructure. The mechanisms controlling climate dynamics in Djibouti and the Eastern Africa region remain poorly understood. In this study, we document the atmospheric mechanisms associated with extreme rainfall events in the Republic of Djibouti. To that end, we use at the daily timescale rain-gauge data (a network of 36 stations on the period 2013-2020), satellite-based rainfall estimates (CHIRPS, IMERG, MSWEP and RFE) and atmospheric reanalyses (ERA5), selected over their common period 2001-2020.

A multivariate Hierarchical Ascendant Classification of rainy days in Djibouti (≥ 10% of grid-points exceeding 1 mm.day-1, according to all four satellite products) reveal 4 clusters (intense rainfall, moderate rainfall, rainy in the southwest, rainy in the east) which differentiate from each other by the intensity and spatial extent of rainfall. These clusters show a non-homogeneous seasonal distribution, occurring mainly in the March-April-May (MAM) and July-August-September (JAS) seasons, and more rarely in October-November-December (OND). The atmospheric circulation anomaly patterns associated with the clusters are quite similar and highly season-dependent. In MAM most clusters display an anomalous trough over the Red Sea from 700 hPa to 200 hPa. In JAS, an anomalous low over the southern Red Sea drives a thicker than normal monsoon flow at 700 hPa (especially for the southwest cluster), while upper northerlies prevail at 200 hPa. In OND, most rainy events result from moisture advection from the Western Indian Ocean favoured by positive phases of the Indian Ocean Dipole. Some highly unusual atmospheric circulation patterns, which are not depicted by the above classification (e.g., associated with tropical cyclones), also result in intense rainfall events in the Republic of Djibouti.

How to cite: Mohamed Waberi, M., Camberlin, P., Pohl, B., and Assowe, O.: Atmospheric Drivers of Rainfall Events in the Republic of Djibouti, EGU General Assembly 2023, Vienna, Austria, 23–28 Apr 2023, EGU23-4223, https://doi.org/10.5194/egusphere-egu23-4223, 2023.

EGU23-4268 | Posters on site | CL3.1.3

Variation of global compound heatwaves and their associations with climate variability 

Kun Zhang, Jinbao Li, Michael K. Ng, Amos P. K. Tai, and Jin Wu

Recent widespread heatwaves have broken local temperature records over the world. Large and intense heatwaves not only change the land surface biophysical environment in terms of temperature rise and water shortage, but also endanger our natural and human ecosystems by increasing health risks. Compared to the independent daytime or nighttime heatwave, the compound heatwave often yield higher hot extremes and even pose greater hazard to human and ecosystem health, as it prevents humans or ecosystems recovering from previous hot temperatures if the extreme hot occur in both day and night. However, factors shaping their spatiotemporal patterns on a global scale remain poorly understood, as do their links with large-scale interannual climatic variability. Here, with the air temperatures from multiple global datasets (e.g., ERA5L, CPC, MERRA2, and JRA55), we quantified the frequency and intensity patterns of compound heatwaves over 1980–2019 and analyzed their associations with modes of climate variability. Our results show a significant increasing trend of compound heatwave occurrences on a global scale, with the global average frequency and intensity increased by 90% and 32%, respectively, in 2010–2019 relative to 1980–1989. Specifically, Arctic and mid-latitudes of the Northern Hemisphere have seen the greatest increases in heatwave frequency and intensity over the last four decades, which may be connected to the amplifying influence of Arctic warming as well as human activity. The interannual variability of tropical compound heatwaves is dominated by ENSO occurrences from the previous year to the present year. And, the PDO and AMO modes dominate the interannual variability of extremely high temperatures in the majority of the mid-latitudes. In contrast, the interannual variability of compound heatwaves in the Arctic is most strongly tied to the AO and NAO in the winter of the present year, but it is most directly associated with the AAO and SAM in the Antarctic, which has an 8–9-month lag impact. This work will increase our knowledge of the global patterns and mechanisms of compound heatwaves in a multi-decadal context, hence enhancing our ability to predict hot extremes.


How to cite: Zhang, K., Li, J., Ng, M. K., Tai, A. P. K., and Wu, J.: Variation of global compound heatwaves and their associations with climate variability, EGU General Assembly 2023, Vienna, Austria, 23–28 Apr 2023, EGU23-4268, https://doi.org/10.5194/egusphere-egu23-4268, 2023.

Rainfall estimation in ungauged areas is becoming one of the research hotspots recently. From a case study in the UK, this study builds a sub-daily rainfall estimation model based on more widely available daily series data from 151 gauges. In this study, we stratify the scaling properties of UK rainfall into homogenous rainfall zones, geophysical factors, seasons, and air masses to investigate how these scaling properties change temporally and spatially. We use temporal scaling techniques to extract the scaling relationship between sub-daily rainfall intensity and annual maximum series along with all possible factors introduced above. The estimated rainfall is validated with observed rainfall data and shows a higher degree of agreement. Finally, we compare the IDF (Intensity-Duration-Frequency) curves for both estimated and observed data. Such scaling relationships can support scientists and governments to estimate extreme rainfall at a specific duration and return period in ungauged regions. This method can also generate design rainfall time series for flood simulation models to evaluate present and future pluvial flood risks in urban areas.

How to cite: Wang, Z., Wilby, R., and Yu, D.: Temporal scaling properties of extreme rainfall and intensity-duration-frequency curves in the UK, EGU General Assembly 2023, Vienna, Austria, 23–28 Apr 2023, EGU23-4473, https://doi.org/10.5194/egusphere-egu23-4473, 2023.

As still-water bodies, the change of lakes reflects the effect of climate change and human activities and play as sentinels of the earth. It has been witnessed that the detailed area change of lakes on Tibetan Plateau (TP) are more sensitive to global warming than the many other places of the world. Among them, small lakes are especially abundant in number, having disproportionately high hydrology and nutrient processing rates, and playing an irreplaceable role in regional and global carbon and nitrogen cycle meanwhile. It has been proved that the change small lakes and ponds, like emerging and disappearing, show strong correlation with that of precipitation, permafrost, and ecological systems in Arctic. However, as the third pole on earth with extremely complex terrain and physical surface properties, the small lakes are also a unique part while has not been investigated thoroughly. Based on the cloud computing platform Google Earth Engine (GEE), this study focused on the 11,400 small lakes on TP (lakes with max area between 0.1 and 1 km2) to answer the question that how the emergence and vanishing of small lakes responses to the climate change from 1972 to 2019. The lakes with area shrinking below 0.01 km are regarded as vanished, while area increasing above the value are regarded as emerged. Comparing with Ocean Nino Index (ONI) and and in-situ precipitation data, preliminary results show that: 1. the severe El-Nino events have been well captured by the emergence and vanishing of small lakes; 2. the emergence and vanishing of small lakes have a negative relationship in each year and the emergence peaks have about one-year time lag after those vanishing peaks; 3. the net emergence rate of small lakes has strong positive relationship with precipitation. This work could support further studies on the relationship among climate change, carbon cycle, and water cycles on Tibetan Plateau.

How to cite: Li, H.: Small lakes on Tibetan Plateau act as a climate change indicator, EGU General Assembly 2023, Vienna, Austria, 23–28 Apr 2023, EGU23-4496, https://doi.org/10.5194/egusphere-egu23-4496, 2023.

Snow albedo is an essential factor in the land surface energy balance and the water cycle. It is usually parameterized as functions of snow-related variables in land surface models (LSMs). However, comparing with albedo schemes in the CLM and Noah-MP LSMs, the default snow albedo scheme in the widely used Noah LSM shows evident drawbacks in land-atmosphere interactions simulations during an extreme snow process on the complex topographic Tibetan Plateau (TP). We firstly demonstrate that the improved Noah snow albedo scheme includes MODIS albedo products and explicit considers snow depth as an additional factor. It performs well in relation to near-surface meteorological elements estimates during an extreme snow process. Then, we comprehensively evaluate the performance of the improved snow albedo scheme in WRF coupled with Noah LSM in simulating the additional eight heavy snow events on the TP. It reveals that the improved snow albedo scheme significantly outperforms the default Noah scheme in relation to air temperature, albedo and sensible heat flux estimates, by alleviating cold bias estimates, albedo overestimates and sensible heat flux underestimates, respectively. This in turn contributes to more accurate reproductions of snow event evolution. The averaged RMSE relative reductions (and relative increase in correlation coefficients) for air temperature, albedo, sensible heat flux and snow depth reach 27% (5%), 32% (69%), 13% (17%) and 21% (108%) respectively. These results demonstrate the strong potential of the improved snow albedo parameterization scheme for heavy snow events simulations on the TP.

How to cite: Liu, L. and Ma, Y.: Application of an improved snow albedo scheme in the simulation of heavy snow processes over the Tibetan Plateau, EGU General Assembly 2023, Vienna, Austria, 23–28 Apr 2023, EGU23-4651, https://doi.org/10.5194/egusphere-egu23-4651, 2023.

EGU23-4762 | Orals | CL3.1.3 | Highlight

Detection and attribution of extreme precipitation events over the Asian monsoon region 

Tianyun Dong, Wenjie Dong, and Xian Zhu

Extreme precipitation events have enormous impacts on the natural and human aspects of most regions. This study presents a detection and attribution analysis of extreme precipitation in the Asian monsoon region (AM) from 1950 to 2014 using the Coupled Model Intercomparison Project Phase 6 (CMIP6) models. The observed positive PI (probability-based index) trends for annual maxima of 5-day (Rx5day) and 1-day (Rx1day) precipitation accumulations are 6.04%/100yr and 10.96%/100yr. The simulated PI trends for Rx5day and Rx1day under greenhouse-gas (GHG) forcing are 9.70% /100yr and 10.86% /100yr, respectively, while the trends are −8.99% /100yr and −7.01%/100yr under the aerosol (AER) forcing. Greenhouse-gas concentrations alone cause extreme precipitation increases, while the offsetting effects of anthropogenic aerosols may result in weaker increasing trends in ALL forcing simulations. The anthropogenic (ANT) signals are detectable, while the natural (NAT) signals could not be distinguished from the noise (internal climate variability) based on the optimal fingerprinting method. GHG forcing is detected for AM’s extreme precipitation when GHG, AER, and NAT forcing are all considered. A three-signal analysis confirms that CO2 forcing had a detectable influence on observations, whereas the influence of volcanic and solar-irradiance forcings could not be distinguished. Our results provide evidence that anthropogenic greenhouse gases (mainly CO2) are the prime external factors influencing the increase of AM’s extreme precipitation.

How to cite: Dong, T., Dong, W., and Zhu, X.: Detection and attribution of extreme precipitation events over the Asian monsoon region, EGU General Assembly 2023, Vienna, Austria, 23–28 Apr 2023, EGU23-4762, https://doi.org/10.5194/egusphere-egu23-4762, 2023.

Cold surge (CS) events are the most serious extreme cold events in winter in China, causing large economic losses and casualties. The occurrence of CS events has slightly increased since the 1990s. However, the possible future changes in these events remain unclear, and quantifying robust projected changes in CS events is important for developing adaptation and policy planning. Here, we project the occurrence of CS events and strong CS (SCS) events using the weighted multi-model ensemble (MME) of the Coupled Model Intercomparison Project 6 (CMIP6) through the application of the rank-based weighting (RBW) approach under three shared socioeconomic pathway (SSP126, SSP245, and SSP585) scenarios. The corresponding weights of each model were obtained depending on the comprehensive historical performance from three aspects: climatology, spatial variation, and interannual variability. The results show that the RBW approach can reduce the relative bias by approximately 50% compared to the unweighted MME. The occurrence of CS and SCS events shows a decreasing trend during 2015–2099 over northern China under the three SSP scenarios. There are also robust change projections during the long-term (2080–2099) and 2015–2099 periods under SSP245 and SSP585, especially in the NEC region, which exhibits a signal-to-noise ratio (SNR) that is >1. However, the occurrence of SCS events shows slight increases of 1.18% and 3.55% over northern China (notably western and eastern Northwest China) during the near-term (2020–2039) under SSP126 and SSP245, respectively. Obvious reductions in projected uncertainty are widespread throughout northern China after applying the RBW approach compared to the unweighted MME, which mainly depends on the scenario, region, and term variation. Then, a robust decreased frequency may contribute to projected changes in large-scale atmospheric circulation (a more positive AO and weaker SH and EAT) under SSP585. Our results emphasize that the weighted MME can be taken into account when projecting future extreme climate change in some areas to enhance reliability.

How to cite: Song, S. and Yan, X.: Projected changes and uncertainty in cold surges over northern China using the CMIP6 weighted multi-model ensemble, EGU General Assembly 2023, Vienna, Austria, 23–28 Apr 2023, EGU23-6630, https://doi.org/10.5194/egusphere-egu23-6630, 2023.

EGU23-7058 | ECS | Posters on site | CL3.1.3

Effects of Cumulus and Radiation Parameterization on Summer Surface Air Temperature over Eastern China 

Zhibo Gao, Xiaodong Yan, Chuanfeng Zhao, and Yan Guo

Cloud-radiation process has strong impacts on surface air temperature (SAT). Using the Weather Research and Forecasting (WRF) model, this study investigates the effects of cumulus and radiation parameterization on SAT simulation over Eastern China (EC) during the summer season from 2001 to 2020. Four experiments are performed at a 30 km resolution using the combination of two cumulus schemes (KF and KF-CUP) and two radiation schemes (CAM and RRTMG). The results indicate that the KF and RRTMG scheme can produce warmer SAT than KF-CUP and CAM, respectively. By decomposing the differences in SAT simulation, it is found that KF and RRTMG have greater surface downward shortwave radiation (DSR), and the DSR shows a significant positive correlation with SAT in most parts of EC. Further analysis reveals that low-level cloud (LC) can strongly reflect the DSR, and the LC fraction (LCF) of KF and RRTMG is less than that of KF-CUP and CAM, respectively. The reason for this phenomenon is that the sub-grid cumulus heating rate is higher in KF and RRTMG, resulting in their higher air temperature (T) and greater differences between T and dew point (Td), which is not conducive to the formation of large-scale stratiform cloud and the increase of LCF. As a result, KF and RRTMG have more DSR and higher SAT than KF-CUP and CAM, respectively. The same mechanism can also explain the differences in the sub-seasonal cycle simulations between the four experiments. By comparing the SAT error in each subregion, this study can also provide a reference for future dynamic downscaling over the EC region.

How to cite: Gao, Z., Yan, X., Zhao, C., and Guo, Y.: Effects of Cumulus and Radiation Parameterization on Summer Surface Air Temperature over Eastern China, EGU General Assembly 2023, Vienna, Austria, 23–28 Apr 2023, EGU23-7058, https://doi.org/10.5194/egusphere-egu23-7058, 2023.

Simulations for China’s annual average maximum and minimum surface air temperature by CMIP6 models were evaluated, referring to observations from CN05.1. Results show that the annual average maximum and minimum surface air temperature in China from 1961 to 2014 had increasing trends. The maximum surface air temperature increased at a rate of 2.15 ℃/100 a. The growth rate of the minimum air temperature was 3.92 °C/100 a, which was about twice the growth rate of the maximum air temperature. CMIP6 models can simulate trends over long time scales, but there were large differences in the simulation ability of different models. The dispersion between models reached 0.38 °C/100 a (maximum air temperature) and 0.41 °C/100 a (minimum air temperature). BCC-ESM1 and EC-Earth3 had the best performance in simulating the trends of the maximum and minimum air temperature, respectively. CMIP6 models can well simulate the spatial distribution of the climatological maximum and minimum air temperature in China. Proportions of grid points where most of the model simulations correlated positively with observations were 82% (maximum air temperature) and 97% (minimum air temperature) in China. Simulation results of the maximum and minimum air temperature in the whole of eastern China had obvious geographical characteristics with a standard deviation within 3 ℃, showing a high consistency. The variation was significant in the western region and reached more than 6 °C in the Tibetan Plateau. GISS-E2-1-G and MRI-ESM2-0 can well simulate the main EOF (empirical orthogonal function) modes and principal components of the maximum and minimum air temperature in China in 1961–2014. In summary, CMIP6 models can well simulate the spatial distribution of the climatological maximum and minimum air temperature and interannual trends of the maximum and minimum air temperature in China.

How to cite: Xie, W. and Yan, X.: Evaluation on CMIP6 Global Climate Model Simulation of the AnnualMean Daily Maximum and Minimum Air Temperature in China, EGU General Assembly 2023, Vienna, Austria, 23–28 Apr 2023, EGU23-7201, https://doi.org/10.5194/egusphere-egu23-7201, 2023.

El Niño–Southern Oscillation is the most important source of interannual variability in the tropics; it also exerts great influences on weather and climate systems in local and remote regions through teleconnections. Observed influences of canonical (or eastern Pacific) El Niño on springtime extreme rainfall in East Asia (EA) are studied, and compared with the Coupled Model Intercomparison Project phase 6 (CMIP6) historical runs. Both model and observational data indicate that the anomalous low-level western north Pacific (WNP) anticyclone is the primary contributor to EA springtime extremes during El Niño. On a day-to-day basis, intense daily precipitation is related to enhanced upper-level synoptic-scale waves. Here we use a temperature advection index (TAI) to represent the amount of synoptic-scale activities. It was found that, when EP El Nino occurs, 85% of Yangtze River Basin (YRB)-South Korea (SK)-south of Japan (SP) extreme events are accompanied by instances of positive TAI (as compared to 72% in the climatological sense). However, such a change of association with TAI is not found in CMIP6. Observations further show a stationary wave pattern trapped along the intensified EA westerly jet during EP El Niño, which favors the development of synoptic-scale activity. There is also enhanced moisture transported from WNP to SK-SP, leading to more extreme precipitation in the region. In contrast, the interannual-scale westerly waveguide effect during EP El Niño is poorly simulated in CMIP6 models, resulting in models’ failure in capturing the contemporaneous YRB-SK-SP extreme precipitation changes.

How to cite: Cao, D., Tam, C.-Y., and Xu, K.: Simulating Springtime Extreme Rainfall in East Asia during Eastern-Pacific El Niño - Importance of Synoptic-Scale Activities and the Westerly Waveguide, EGU General Assembly 2023, Vienna, Austria, 23–28 Apr 2023, EGU23-7202, https://doi.org/10.5194/egusphere-egu23-7202, 2023.

EGU23-8417 | ECS | Orals | CL3.1.3

Analysis of extreme temperature events based on estimated 1-km daily near-surface air temperature 

Bin Wang, Meiling Gao, and Zhenhong Li

Nowadays, the intensification of global warming leads to the increased frequency of extreme temperature events. Many studies reported that different regions are facing the threat of extreme hot and cold temperature in some degree. The Qinghai-Tibet Plateau Transportation Project is a major project in China, and it is beneficial for public to study the extreme temperature events along the railway and avoid the risk induced by the extreme temperature. This study estimated the daily maximum, minimum and average near-surface air temperature along the railway. Sixteen extreme temperature indices defined by ETCCDI (the Expert Team on Climate Change Detection and Indicators) were used to represent the extreme temperature events, and Mann-Kendall trend test and Sen's slope estimation method were employed to explore the spatial-temporal variation trends of the extreme temperature along the Qinghai-Tibet Plateau Transportation Corridor from 1981 to 2019. In addition, the response of extreme temperature events to altitude was discussed.

The results show that the climate becomes warming along the Qinghai-Tibet Plateau Transportation Corridor from 1981 to 2019, and the extreme hot events are detected in most areas, while the extreme cold events mainly occurs in the east and southwest part. The significant increasing trend is found according to the indices representing the hot events (SU25, TR20, TX90p, TN90p, TXx, TXn, TNx, TNn and WSDI), while the indices representing the cold events (FD0, ID15, TX10p, TN10p and CSDI) show a significant decreasing trend in most areas over the past nearly 40 years. Besides, the extreme temperature events is highly related to altitude variations. Compared with the middle altitude zones, extreme high temperature events tend to occur in the lower altitude zones and the higher altitude zones. It is of great significant to schedule the train in advance and reduce the disasters by investigating the long-term variation trends of extreme temperature events along the Qinghai-Tibet Plateau Transportation Corridor.

How to cite: Wang, B., Gao, M., and Li, Z.: Analysis of extreme temperature events based on estimated 1-km daily near-surface air temperature, EGU General Assembly 2023, Vienna, Austria, 23–28 Apr 2023, EGU23-8417, https://doi.org/10.5194/egusphere-egu23-8417, 2023.

EGU23-9547 | Orals | CL3.1.3

WRF Dynamical Downscaling of CCSM over the Arabian Peninsula 

Hussain Alsarraf and Panos Kokkalis

This study proposes dynamical downscaling simulations-high resolution of 12 km- by Weather Research and Forecasting (WRF) model, over the Arabian Peninsula. The downscaling of the Community Climate System Model (CCSM), to simulate (2000–2010), and future (2050–2060) time periods. The Arabian Peninsula is experiencing extreme weather events characterized by large precipitation and above average summer maximum temperatures, which are strong indicators of the climate change impact in the region.  The CCSM-WRF model values were evaluated against values obtained by the Center for Climate Integrity (CCI) on a monthly basis, and during extreme weather events 10 years’ period (2000-2010). The CCSM-WRF results at 12 km are comparable with published outcomes of high-resolution regional climate models, and shows better performance especially during the extreme events over the region (flash floods and heat waves). The future projection of the model shows that the maximum summer average values of temperature, soil temperature, and soil moisture, will increase in the next 30 to 40 years.


How to cite: Alsarraf, H. and Kokkalis, P.: WRF Dynamical Downscaling of CCSM over the Arabian Peninsula, EGU General Assembly 2023, Vienna, Austria, 23–28 Apr 2023, EGU23-9547, https://doi.org/10.5194/egusphere-egu23-9547, 2023.

EGU23-10176 | ECS | Orals | CL3.1.3

Attribution of the 2022 extratropical storm Fiona 

Elizaveta Malinina and Nathan Gillett

In late September 2022, the Atlantic Hurricane Fiona transitioned to an extratropical cyclone making a landfall in the Canadian Atlantic provinces and setting a new national lowest pressure record. The insured damage from the resulting windstorm and flooding is estimated to be 800 million CAD (600 million USD).

In this study, we analyze the maximum daily near-surface wind speeds in Atlantic Canada using reanalysis and CMIP6 HighResMIP data. According to our preliminary results from ERA5 reanalysis, the 2022 Fiona wind speeds were the highest in Atlantic Canada since 1950, with an estimated return period of 500 years. Additionally, using HighResMIP data from the models with a spatial resolution exceeding 56x56 km, we compare the wind speeds in the current climate with those from 1950-1969 and in 2031-2050 under the highres-future scenario, similar to RCP8.5. While currently in Atlantic Canada, there is no statistically significant increase in the maximum daily wind speeds in comparison to 1950-1969 climate, the increase in the mid-21st century wind speeds in comparison to the 1950-1969 period is statistically significant with the 2022 event being 3.8 times more likely. We apply similar analysis to the data from CAM5 model as well as to the CMIP6 precipitation data in the region.

How to cite: Malinina, E. and Gillett, N.: Attribution of the 2022 extratropical storm Fiona, EGU General Assembly 2023, Vienna, Austria, 23–28 Apr 2023, EGU23-10176, https://doi.org/10.5194/egusphere-egu23-10176, 2023.

EGU23-10198 | ECS | Posters on site | CL3.1.3

An Idealized Study of Cold Air Outbreaks 

Karen Papazian and Ben Kirtman

Cold air outbreaks (CAOs) have large societal and environmental impacts, such as agricultural losses, infrastructure damage, changes in atmospheric circulation, etc. As the Earth experiences a climate crisis, the focus on CAOs has been diminishing, but extreme CAOs continue to occur which society is gravely underprepared for. This study looks to explore how CAOs evolve in a changing climate through idealized modeling. In addition to climate modeling, observational data is used to compare the current dynamics of CAOs to that expected in a climate change scenario. Observational data from the NCEP-NCAR Reanalysis project is used in addition to model simulations from the Community Atmospheric Model - version 5 (CAM5), of the NCAR Community Earth System Model v1 (CESM1). In the model simulations, this study prescribes sea surface temperature to a fully ocean-covered planet, an aquaplanet simulation. These differing surface temperature gradients were chosen to resemble potential global climate change scenarios and extreme climate change scenarios. The use of aquaplanet simulations creates an idealized environment conducive of understanding the mechanisms of CAOs. As the pole to equator surface temperature gradient is eliminated, echoing an extreme climate change scenario where the poles warm more than the TR, CAOs continue to be present. With these differing aquaplanet simulations this study aims to further understand the physical mechanisms of CAOs, and the role dynamics plays in their frequency and intensity.

How to cite: Papazian, K. and Kirtman, B.: An Idealized Study of Cold Air Outbreaks, EGU General Assembly 2023, Vienna, Austria, 23–28 Apr 2023, EGU23-10198, https://doi.org/10.5194/egusphere-egu23-10198, 2023.

EGU23-10332 | ECS | Orals | CL3.1.3

The impact of climate change on the extreme ocean warming events observed in Japan’s marginal seas for 1982-2022 

Michiya Hayashi, Hideo Shiogama, and Tomoo Ogura

Anthropogenic global warming has potentially caused regional record-high sea surface temperatures (SSTs) observed around the world, but it is not yet clarified to what extent climate change has increased the frequency of discrete extreme ocean warming (EOW) around Japan. In this study, the impact of climate change on EOW events in Japan’s marginal seas is examined by focusing on each calendar month from January 1982 to December 2022 and on multiple areas including the Japan Sea, East China Sea, Okinawa, Taiwan, and South Korea. We analyzed 24 CMIP6 climate models that have the equilibrium climate sensitivity between 2 K and 5 K to estimate the probability of occurrences of monthly SSTs in the present and preindustrial conditions. The EOW event is defined as high SSTs less frequent than once per 20 years at the preindustrial level. The fraction of attributable risks (FAR) is used to quantify the impact of climate change on SSTs.

In contrast to the gradually increasing occurrences of EOW events for the past 41 years, the most frequent EOW events occurred around 1998 and in the mid-2010s, especially in the southern side of Japan. The impact of climate change on EOW events is not yet dominant around 1998 but has multiplied the occurrence probability of most EOW events by at least twice since 2000. Based on our method, all the EOW events identified in 2022 are attributable to climate change. The regional and seasonal differences of the climate change impact on EOW events around Japan are discussed. In addition, this study suggests that the possibility of the future typical climate exceeding record high SSTs can be sharply reduced by limiting global warming levels from 2°C to 1.5°C, indicating rapid acceleration of mitigation efforts is critical.

How to cite: Hayashi, M., Shiogama, H., and Ogura, T.: The impact of climate change on the extreme ocean warming events observed in Japan’s marginal seas for 1982-2022, EGU General Assembly 2023, Vienna, Austria, 23–28 Apr 2023, EGU23-10332, https://doi.org/10.5194/egusphere-egu23-10332, 2023.

Wetland is one of the ecosystem types with the largest density of organic carbon pool. The threat of declining wetland water level to carbon pools and the resulting greenhouse gas (GHG) emissions have attracted much attention. However, an assessment of emissions from degraded wetlands containing the three major greenhouse gases is still lacking. We compiled a global GHG exchange dataset that shows the non-linear water-heat pattern of GHG emissions. Combined with the Wetland Extended Trends Index, we estimated that the total GHG emissions from global degraded wetlands are 276.4 Gt CO2eq during 1950-2020. The emissions of carbon dioxide, methane, and nitrous oxide are equivalent to 10.8%, - 0.5%, and 30.5% of anthropogenic sources, respectively. Under the historical trend of wetland degradation, the emissions may increase by 1.5 times from 2021 to 2100, reaching 408 Gt CO2eq. Accordingly, wetland restoration can reduce anthropogenic carbon dioxide emissions by 10%.

How to cite: Zou, J. and Zeng, Z.: Assessment of greenhouse gas emissions and mitigation potential in global degraded wetlands, EGU General Assembly 2023, Vienna, Austria, 23–28 Apr 2023, EGU23-10440, https://doi.org/10.5194/egusphere-egu23-10440, 2023.

EGU23-10686 | ECS | Orals | CL3.1.3

Anthropogenic Intensification of East Asia Summer Monsoon Frontal Precipitation System 

Suyeon Moon, Nobuyuki Utsumi, Jee-Hoon Jeong, Jin-Ho Yoon, S.-Y. Simon Wang, Hideo Shiogama, and Hyungjun Kim

Summer monsoon precipitation provides crucial water resources for agriculture, industry, and life in East Asia (EA). Meanwhile, it causes disasters when occurring over highly populated regions. Recently, we have witnessed a series of extreme precipitation events in South Korea, China, and Japan during the summer monsoon season. It remains uncertain whether these events and the EA summer monsoon precipitation system are affected by the ongoing climate changes. The summer precipitation in EA is contributed by various extra-tropical cyclones, fronts, and other weather systems. Here, we focus on the stationary front-induced precipitation, which accounts for more than 30% of EA summer precipitation. Based on objectively detected frontal systems, we found that the intensity of observed frontal rainfall increased by 19.8% during 1991–2015. It was further shown that the intensity increase of frontal rainfall is mainly attributed to anthropogenic greenhouse gas forcing on the basis of the Community Earth System Model Large Ensemble simulations. We found that the reinforced western North Pacific subtropical high makes enhanced water vapor convergence in the lower troposphere along its rim. This study confirms that the frontal summer monsoon precipitation system over EA has been intensified significantly by human-induced global warming, which will likely enhance further in the future.

How to cite: Moon, S., Utsumi, N., Jeong, J.-H., Yoon, J.-H., Wang, S.-Y. S., Shiogama, H., and Kim, H.: Anthropogenic Intensification of East Asia Summer Monsoon Frontal Precipitation System, EGU General Assembly 2023, Vienna, Austria, 23–28 Apr 2023, EGU23-10686, https://doi.org/10.5194/egusphere-egu23-10686, 2023.

EGU23-10723 | ECS | Posters on site | CL3.1.3

South China coastline will face more furious storm surges at the end of the 21st century 

Zhenning Li, Jimmy C.H. Fung, Mau Fung Wong, and Alexis K.H. Lau

South China, with a long and meandering shoreline and well-developed economy, is highly vulnerable to tropical cyclone (TC)-caused storm surges and extreme sea states. The current global warming is expected to continue or even worsen in the rest of the 21st century. Therefore, the warmer sea surface temperature (SST) and lifted mean sea level tend to fuel much more ferocious storm surges. In this study, three severe landfalling TCs have been reproduced by a sophisticated air-wave-ocean coupled model of ultra-high spatial resolution (1-km atmosphere and 500-m wave and ocean). The present-day and pseudo-global warming context mimicking the 2090s have been simulated to investigate the climate change effect. Results indicate that the coupled model can accurately reproduce the air-wave-ocean status during the TC episodes. The 2090s thermodynamic status will effectively increase the intensity of the severe TCs. Typhoon Vicente (2012) even attained a 30% increase in 10-meter wind speed due to its 24-hour stagnant track over the northern South China Sea. On average, the maximum storm surges are lifted by 0.3-0.8 meters over the open sea while aggravating much higher along the coastline, especially for narrowing estuaries where the maximum surge level can be elevated up to 2 meters. Changes in maximum significant wave height show more complicated patterns due to their sensitivity to TC tracks. For Typhoon Vicente (2012), a more than 2-meter wave height increase is observed both in open sea and along the coastline. In the 2090s context, a combination of mean sea level rise, storm surge, and wave height can reach more than 4 meters increase in total water level at certain coastal hot spots.  This will cause much more severe damage and losses at the end of the 21st century.

How to cite: Li, Z., Fung, J. C. H., Wong, M. F., and Lau, A. K. H.: South China coastline will face more furious storm surges at the end of the 21st century, EGU General Assembly 2023, Vienna, Austria, 23–28 Apr 2023, EGU23-10723, https://doi.org/10.5194/egusphere-egu23-10723, 2023.

EGU23-12175 | ECS | Orals | CL3.1.3

Climate variability, trends and extreme events in Ukraine 

Anna Bohushenko, Inna Khomenko, and Sergiy Stepanenko,

During the XX and the beginning of the XXI century, significant warming caused by the emission of greenhouse gases, mainly CO2 and CH4 into the atmosphere, is observed. The fifth assessment report of the Intergovernmental Panel on Climate Change estimated a warming of 0.85˚C ± 0.20˚C during 1880-2012. This global warming has been changing atmospheric circulation patterns, which can result in accelerating and intensifying extreme weather events such as more violent storms, floods, droughts, heat and cold waves. The weather extremes can cause economic loss, as well as loss of human lives.

In this study, the variations in 25 extreme temperature and precipitation indices defined by ETCCDI, are examined using probability distribution analysis and spatial statistics for periods of 71 to 137 years for 16 stations such as Ai-Petri, Askaniia-Nova, Chernivtsi, Feodosiya, Kerch, Kyiv, Lubny, Luhansk, Lviv, Mykolaiv, Odesa, Poltava, Shepetivka, Uzhhorod, Uman, Vinnytsia. The indices data were obtained from www.ecad.eu.

For Ukraine average, in the last 30 years, the number of summer days, warm days and nights, and warm spell duration index have reached historical highest values, while the number of cold days and nights, frost and icing days, and cold spell duration index reached the recorded lowest values.

The distribution characteristics of extreme temperature indices showed the increased frequency of warm events is higher in the west of Ukraine than in its others regions while, on the contrary, the decreased frequency of cold events is higher in the rest of the country than in its western part.

For all territory of Ukraine, an increase in maximum daily and maximum 5 days precipitation amount, the maximum number of consecutive wet days, heavy and very heavy precipitation days, and a decrease in the maximum number of consecutive dry days are observed for the last three decades.

A combination of harmonic regression and spectral analysis was applied to the time series for which the Mann-Kendal method revealed statistically significant trends, to predict the annual and seasonal temperature and precipitation, maxima of daily maximum temperature, minima of daily minimum temperature, maximum 1-day precipitation amount and consecutive dry days up to 2050.

The annual temperature was predicted to increase in the study area, with an increasing rate of 0.3-0.5°C decade−1 up to 2050. The increasing rate of the maxima value of the daily maximum temperature is the same. Minima value of daily minimum temperature was predicted to increase the most from 0.44 to 0.62°C decade−1. Seasonal values of all indices were predicted to grow, especially in summer and winter for maxima of daily maximum temperature and in spring for minima of daily minimum temperature.

Precipitation is predicted to increase in the range of 4 to 22 mm in decade−1, the most increasing rate will be observed in stations located in the western and central parts of Ukraine. For the period up to 2050 for most of the territory of Ukraine time series of annual and seasonal maximum 1-day precipitation showed slightly increasing trends while the annual and seasonal consecutive dry days are anticipated to decrease insignificantly.

How to cite: Bohushenko, A., Khomenko, I., and Stepanenko,, S.: Climate variability, trends and extreme events in Ukraine, EGU General Assembly 2023, Vienna, Austria, 23–28 Apr 2023, EGU23-12175, https://doi.org/10.5194/egusphere-egu23-12175, 2023.

EGU23-13678 | ECS | Posters on site | CL3.1.3

Climate projections of frost risk for apple (Malus Domestica) in Slovenia 

Zala Žnidaršič, Andreja Sušnik, Gregor Gregorič, and Tjaša Pogačar

Due to climate change and increasing temperatures, the phenological development of fruit trees is expected to advance, which already results in higher susceptibility of fruit trees to crop-destroying spring frosts due to phenological stages of bud break or flowering occurring too early in the year. An assessment of the risk of tardive frosts for apple (Malus domestica) in Slovenia was made throughout the 21st century from temperature data of 6 climate model projections, specifically from regionally downscaled projections data of the EURO-CORDEX. The first part of the analysis was based on two phenological models - a classic GDD model and a two-phased BRIN model. In the second part of the analysis the conditional probability of frost occurrence was calculated from the statistical probability of the last day with frost conditions and the budburst event probability, as simulated by the chosen phenological models. The results showed that the probability of frost events occurring after flowering in Slovenian apple varieties increases throughout the 21th century in the case of the RCP4.5, as well as the RCP8.5. We identified the period of 2071–2100 as the period when the majority of Slovenian apple-growing regions will be most prone to frosts, whereas during 2011–2040 and 2041–2070 the probability of frost occurrence might vary.


This work was supported by the Slovenian Research Agency, Research Program P4−0085.

How to cite: Žnidaršič, Z., Sušnik, A., Gregorič, G., and Pogačar, T.: Climate projections of frost risk for apple (Malus Domestica) in Slovenia, EGU General Assembly 2023, Vienna, Austria, 23–28 Apr 2023, EGU23-13678, https://doi.org/10.5194/egusphere-egu23-13678, 2023.

EGU23-14937 | ECS | Posters on site | CL3.1.3

Compound hot and dry extremes might be underestimated in CMIP6 projections 

Srinidhi Jha, Lukas Gudmundsson, and Sonia I. Seneviratne

Future projections of compound hot and dry extremes vary significantly across different ESMs in CMIP6. This affects our understanding of possible future risks of such events specially under high warming-high emission scenarios. We analyze the compound hot and dry extreme events in the SSP5-8.5 projections in 35 different ESMs contributing to CMIP6 for present-day climate (+1°C) and additional global warming levels (+1.5°C, +2°C, +3°C). It is found that the inter-model differences in the projections is quite significant. Investigating this spread, we establish a statistical emergent relationship between future changes in compound hot and dry extremes and the correlation between hot and dry events in the recent past. This robust association indicates that future changes in the global average likelihood of compound hot and dry extremes could be significantly underestimated. The emergent relationship also shows strong regional constraints, and areas which exhibit substantial underestimation of  future changes in compound hot and dry extreme projections are the North America, Amazonian, Mediterranean, West Africa and Mediterranean regions. The results contribute to understanding and reducing uncertainties in future projections of compound hot and dry extremes and therefore aid the formulation of effecting risk management and climate mitigation strategies.  

How to cite: Jha, S., Gudmundsson, L., and I. Seneviratne, S.: Compound hot and dry extremes might be underestimated in CMIP6 projections, EGU General Assembly 2023, Vienna, Austria, 23–28 Apr 2023, EGU23-14937, https://doi.org/10.5194/egusphere-egu23-14937, 2023.

EGU23-15316 | Posters on site | CL3.1.3

Heat waves and climate change: an application to Sicily (Italy) 

Antonio Francipane, Giuseppe Cipolla, Indra Tomasino, and Leonardo Valerio Noto

Nowadays, the effects of global warming are becoming increasingly evident and dangerous at every latitude of the planet. In such a context, the Mediterranean basin turns out to be a "hotspot". Reductions in precipitation, especially in the summer season, and increases in the intensity and frequency of extreme events, such as droughts and heat waves, have been observed in regions bordering the Mediterranean Sea in recent decades. In particular, heat waves may have numerous negative impacts on human health, environment, agriculture, and the energy sectors. Indeed, consecutive days with extremely high temperatures, combined with high humidity, poses a high health risk to the population. Moreover, in combination with other extreme events such as drought, they can also promote the occurrence of forest fires causing further damage to ecosystems.

The goal of this work is to analyze the characteristics of heat waves that have occurred in Sicily over the last two decades, from 2002 to 2021, to assess the existence of any trend over the period under consideration. For the identification and characterization of the heat waves, hourly data of air temperature and relative humidity have been collected from 101 stations of the Sicilian Agrometeorological Information Service (Servizio Informativo Agrometeorologico Siciliano - SIAS) network. Heat waves have been defined on the base of three variables at the daily scale: maximum air temperature, minimum air temperature, and daily maximum values of the Heat Index, which puts together temperature and relative humidity. A heat wave is detected when the daily maximum/minimum air temperature and the maximum daily Heat Index value exceed for at least two consecutive days the value of a threshold usually calculated as a function of the 90th percentile of the distribution of daily maximum/minimum temperatures and daily Heat Index. For each year, the number of events, number of days of heat waves, duration of the longest event, magnitude of the season (i.e., the number of days between the first day of the first heat wave and the last day of the last heat wave), and intensity (i.e., the average of the differences for each event between the mean temperature value and the threshold to define the occurrence of the heat waves) have been assessed. A trend analysis has been carried out by means of a simple linear regression on all the above-mentioned variables. Results reveal increasing trends for most of the Sicilian gauges, although not for all the above-mentioned variables, showing that in the last 20 years the frequencies of occurrence and magnitude of heat waves have increased, most likely as a climate change effect, and confirming what other studies have found out for other Mediterranean regions in the last years.

How to cite: Francipane, A., Cipolla, G., Tomasino, I., and Noto, L. V.: Heat waves and climate change: an application to Sicily (Italy), EGU General Assembly 2023, Vienna, Austria, 23–28 Apr 2023, EGU23-15316, https://doi.org/10.5194/egusphere-egu23-15316, 2023.

EGU23-16663 | ECS | Posters on site | CL3.1.3

Characteristics of the Potential Vorticity and its Budget in the Surface Layer over the Tibetan Plateau 

Chen Sheng, Guoxiong Wu, Bian He, and Yimin Liu

The variability of interior atmospheric potential vorticity (PV) is linked with PV generation at the Earth’s surface. The present paper reveals the features of the surface PV and provides a stepping stone to investigate the surface PV budget. In this study, the formats of the PV and PV budget adopting a generalized vertical coordinate were theoretically examined to facilitate the calculation of the surface PV and its budget. Results show that the formats of the PV and PV budget equations are independent of the vertical coordinate. While the vertical component of the surface PV dominates over the platform of the Tibetan Plateau, the horizontal component plays an important role over the slopes of the Tibetan Plateau, especially the southern slope owing to the strong in-situ meridional gradient of the potential temperature. These results indicate that the employment of complete surface PV not only provides a finer PV structure but also more appropriately reveals its effect on atmospheric circulation. Diagnosis based on reanalysis and model output demonstrates that the surface PV budget equation is well balanced both in terms of the climate mean and synoptic process, and the surface PV budget in June has a prominent diurnal cycle. The diabatic heating with a minimum in the early morning and a maximum from evening to midnight contributes dominantly to this diurnal cycle. It is further indicated that positive PV generation due to diabatic heating is essential for the formation, development, and movement of the Tibetan Plateau vortex.

How to cite: Sheng, C., Wu, G., He, B., and Liu, Y.: Characteristics of the Potential Vorticity and its Budget in the Surface Layer over the Tibetan Plateau, EGU General Assembly 2023, Vienna, Austria, 23–28 Apr 2023, EGU23-16663, https://doi.org/10.5194/egusphere-egu23-16663, 2023.

EGU23-16796 | Orals | CL3.1.3

Projection of Extreme Precipitation in East Asian Spring and Mei-yu Seasons in the Warmer Climate 

ChaoAn Chen, Huang-Hsiung Hsu, Hsin-Chien Liang, Ping-Gin Chiu, and Chia-Ying Tu

Changes in extreme precipitation in East Asia during the spring and Mei-yu seasons under global warming are evaluated based on two sets of high-resolution simulations with various warming pattern of sea surface temperature changes (SST' spa). In the spring season, extreme precipitation exhibits larger enhancements over the northern flank of the prevailing rainy region in conjunction with a shifting tendency of more frequent extreme precipitation events and northward enhancement in the probability distribution, indicating a northward extension of future spring rainband. Enhanced precipitation intensity in conjunction with less rainfall occurrence and prolonged consecutive dry days lead to a minor change in mean precipitation, implying a more difficult water resource management in the warmer climate. The projected enhancement in precipitation intensity is robust compared with the internal variability related to initial conditions and the uncertainty caused by SST'spa. In the Mei-yu season, extreme precipitation is intensified with a distribution of more frequent and more intense extreme events over the prevailing rainband region. The thermodynamic component of moisture flux predominantly contributes to changes in the spring season while both the thermodynamic and dynamic components of moisture flux contribute to the enhanced moisture transport furnishing the intensification of Mei-yu extreme precipitation from southern China to northeast Asia. Projecting future Mei-yu precipitation change is more difficult because of its higher uncertainty associated with 1) the larger variability embedded in the projection of extreme precipitation and 2) the model mean state that determines the spatial distribution of precipitation enhancement. 

How to cite: Chen, C., Hsu, H.-H., Liang, H.-C., Chiu, P.-G., and Tu, C.-Y.: Projection of Extreme Precipitation in East Asian Spring and Mei-yu Seasons in the Warmer Climate, EGU General Assembly 2023, Vienna, Austria, 23–28 Apr 2023, EGU23-16796, https://doi.org/10.5194/egusphere-egu23-16796, 2023.

EGU23-16839 | ECS | Orals | CL3.1.3

How Well do High-resolution Global Climate Models (GCMs) Simulate Tropical Cyclones in the Bay of Bengal? 

Shammi Akhter, Christopher Holloway, Kevin Hodges, and Benoit Vanniere

Using six HighResMIP multi-ensemble GCMs (both the atmosphere-only and coupled versions) at 25km resolution, the Tropical Cyclone (TC) activity over the Bay of Bengal (BoB) is examined in the present (1950-2014) climate. We use the Genesis Potential Index (GPI) to study the large-scale environmental conditions associated with the TC frequency in the models. Although the models struggle to reproduce the observed frequency and intensity of TCs, most models can capture the bimodal characteristics of the seasonal cycle of cyclones over the BoB (with fewer TCs during the pre-monsoon [April-May] than the post-monsoon [October-November] season). We find that GPI can capture the seasonal variation of the TC frequency over the BoB in both the observations and models. After calibrating the maximum sustained windspeeds in the models with IBTrACS, we find that like the observations the proportion of strong cyclones is also higher in the pre-monsoon than the post-monsoon. The windshear term in GPI contributes the most to the model biases in all models during the post-monsoon season. This bias is caused by weakening of upper-level (200 hPa) easterlies in analysed models. During the pre-monsoon season, the environmental term in GPI dominating the model biases varies from model to model, however, the cause of a particular environmental term bias is consistent across the models. When comparing the atmosphere-only and coupled versions of the models, a reduction of 0.5°C in the sea surface temperature (SST) and a lowering of TC frequency occur in almost all the coupled models compared to their atmosphere-only counterparts.

How to cite: Akhter, S., Holloway, C., Hodges, K., and Vanniere, B.: How Well do High-resolution Global Climate Models (GCMs) Simulate Tropical Cyclones in the Bay of Bengal?, EGU General Assembly 2023, Vienna, Austria, 23–28 Apr 2023, EGU23-16839, https://doi.org/10.5194/egusphere-egu23-16839, 2023.

EGU23-17091 | ECS | Orals | CL3.1.3

Spatiotemporal Characteristics of Tropical Cyclone Induced Remote Moisture Transport affecting East Asia using Digraphs 

Shiqi Xiao, Aoqi Zhang, Yilun Chen, and Weibiao Li

Attention of tropical cyclone (TC) induced remote moisture transport has increased over the past several decades. There is significant progress of objective identification to resolve spatiotemporal merging and spitting of the moisture transport patterns using digraphs to represent clusters inside the patterns. This identification method also reflects discontinuous and uneven moisture transport. However, finding the mainstreams of these patterns still remains a challenge, which is necessary to retrieve statistical and geometric features of these patterns. To solve this issue, we assign the weight that is positive and decreases with increasing cross-border moisture transport between two clusters corresponding to two nodes to their edges to process the strongest connected component and dijkstra shortest path algorithms to find the main stream of moisture transport pathways. The frequency of TC remote transport is the highest in July over North China and Korean Peninsula and in September over South China and northern Vietnam. The statistical and geometric features of TC remote moisture transport are analyzed in the key periods and regions above. Moreover, discontinuity of moisture transport over the key periods and regions is quantified by the temporal variability of weights over the lifecycles of moisture transport patterns. Unevenness of moisture transport is quantified by the spatial variability of length of the mainstream. Vertical cross section of physical decomposition of moisture transport along the mainstream is further analyzed in this study.

How to cite: Xiao, S., Zhang, A., Chen, Y., and Li, W.: Spatiotemporal Characteristics of Tropical Cyclone Induced Remote Moisture Transport affecting East Asia using Digraphs, EGU General Assembly 2023, Vienna, Austria, 23–28 Apr 2023, EGU23-17091, https://doi.org/10.5194/egusphere-egu23-17091, 2023.

EGU23-181 | ECS | Posters on site | CL3.1.6

Monitoring of agricultural drought using Crop Moisture Stress index and the estimation of resulting maize yield reduction 

Bransilav Živaljević, Gordan Mimić, Dragana Blagojević, Oskar Marko, and Sanja Brdar

The drought in south-eastern Europe in the summer of 2017 heavily affected agricultural production, subsequently decreasing yields of maize. The European Drought Observatory provides Combined Drought Indicator for a 10-day period with coarse spatial resolution of 5 km, which is not localized on field level. It is derived from the combination of Standardized Precipitation Index (SPI), the Soil Moisture Index Anomaly (SMA), and the anomaly of the fraction of absorbed photosynthetically active radiation (FAPAR). Monitoring moisture levels in crops can provide timely information about the presence of abiotic stress in plants and improper development within a growing season. Heat stress and low levels of moisture in maize during summer can thereafter have detrimental consequences on yield. For that reason, in this study, the crop moisture level was estimated at specific parcels by calculating the normalized difference moisture index (NDMI) from Sentinel-2 multispectral imagery during summer months (June–July–August) and the time-series of NDMI were analyzed. Based on the average NDMI value in July, the crop moisture stress (CMS) index was calculated and divided into six classes. Maize yield data on parcel level were provided by an agricultural company for the period 2017 – 2021 in the Backa region of Vojvodina province, Serbia. Yield data for the period 2017-2020 were used to calculate average yield for each class of CMS, whereas yield data from 2021 were used for validation. Mean absolute error (MAE) and root-mean-square error (RMSE) were calculated and were around 1 t/ha. The results showed that the CMS values at a specific parcel could be used for within-season estimation of maize yield and the assessment of drought effects. Also, the CMS index was tested for the 2022 growing season which had drought hazard conditions in south-eastern Europe according to the European Drought Observatory. Expected maize yield reduction estimated for specific scouted fields showed substantial and below average yield values.

How to cite: Živaljević, B., Mimić, G., Blagojević, D., Marko, O., and Brdar, S.: Monitoring of agricultural drought using Crop Moisture Stress index and the estimation of resulting maize yield reduction, EGU General Assembly 2023, Vienna, Austria, 23–28 Apr 2023, EGU23-181, https://doi.org/10.5194/egusphere-egu23-181, 2023.

EGU23-450 | Posters on site | CL3.1.6

Spatial patterns of droughts in the Northeastern Carpathians 

Dariia Kholiavchuk

Hydroclimatic extremes like droughts are among the main indicators of climate change in the mountains. They are often associated with elevation-dependent warming. However, terrain features and regional circulation patterns shape local spatial patterns of droughts in the midlatitude mountains. The northeastern area in the Carpathians is suggested to have a less prominent elevation-dependent warming signal in the recent investigations of climate change. Thus, the research aims at identifying the drought distribution response to the features mentioned in the Northeastern Carpathians based on Standardized Precipitation-Evapotranspiration Index (SPEI) and Standardized Precipitation Index (SPI). For the calculation of SPEI and SPI, a newly available homogenized dataset of long gridded time series of essential climate variables for Ukraine, covering the period of 1946–2020 at 0.1°×0.1° spatial resolution is tested. The comparison of both indicators at 3-, 6- at 12-month time scales within the defined period is provided. The interplay effect of the North Atlantic, Mediterranean, and Polar atmospheric circulations is found in different spatial drought patterns throughout the year on southeastern and northwestern macroslopes. Preliminary results confirm that the low-mountain areas with broad-leaf and mixed forests are most exposed to drought intensification especially in the closed inner valleys and on the border of the Western and Eastern Carpathians. The continentality is revealed in the insignificant drying of the low-mountain areas of the Northeastern Carpathians towards the east over time. 

How to cite: Kholiavchuk, D.: Spatial patterns of droughts in the Northeastern Carpathians, EGU General Assembly 2023, Vienna, Austria, 23–28 Apr 2023, EGU23-450, https://doi.org/10.5194/egusphere-egu23-450, 2023.

EGU23-762 | ECS | Posters on site | CL3.1.6

The surface runoff response to land use changes in border watersheds of the Central Serbia 

Ana Petrović and Stanimir Kostadinov

The anthropogenic impact on natural processes changing their intensity and even trends is evident and confirmed in many researches. The continuous population urban-to-rural and rural-to-urban movements bring a series of the other changes in the environment. This research estimates the impact of the changes of land use and land cover in a time interval of the last almost three decades (1990–2018) on the extreme runoff in more than 40 watersheds with a torrential water regime. Extreme rainfall episodes and watershed characteristics (steep slopes combined with the geology and soil cover of lower water infiltration as well as sparse vegetation cover and artificial and agricultural land use) are the triggers of occurrence of the torrential floods as the most frequent natural hazards in the Central Serbia. The focus is on the border regions of the Central Serbia, so the observed watersheds belong to the Drina river basin in the Western Serbia, the Timok and the Danube river basin in the Eastern Serbia and the Južna Morava river basin and the Egej basin in the Southern Serbia. The observed watersheds are selected according to the physical-geographical characteristics as well as their mentioning in the Inventory of the torrential floods in Serbia.

The main hydrological indicator whose changes are examined is the curve number that is used for the assessment of the hydrological response of the ungauged watershed in an event of extreme rainfall episode. The usage of curve number together with the watershed morphometric parameters (including rainfall data) enables the assessment of the maximal discharges in the flood event. The curve number is a core parameter of the Soil Conservation Service (SCS, today Natural Resources Conservation Service – NRCS) method whose value is in the defined range (0<CN<100) depending on land use. The lower CN, the lower runoff and the higher CN, the higher runoff.

The results revealed consequences of population movements, especially emigration in the last decades from the border regions in terms of changing the land use patterns, and consequently changing the curve number of watershed – its decline, CNIID or growth, CNIIG. The dominant decline of the curve numbers is recorded in more than 20 watersheds of the border Eastern and Southern Serbia known for its continuous depopulation processes in last several decades. This led to the abandonment of arable lands that turned to the transitional woodland-shrub and forest areas in the course of time which finally results in lowering of the peak discharges in the torrential flood events. The minor changes of the curve numbers of more than 10 watersheds are dominant in the Drina river basin. For the selected watersheds the changes (decrease/increase) of the maximal discharges of 100- and 200-year return period are calculated according to the land use in 1990 and 2018 and rainfall data up to 1990 and 2018. In the torrential flood mitigation, findings related to these spontaneous positive anthropogenic influence on declining the surface runoff should be followed by the implementation of a set of preventive measures in erosion and torrent control.

How to cite: Petrović, A. and Kostadinov, S.: The surface runoff response to land use changes in border watersheds of the Central Serbia, EGU General Assembly 2023, Vienna, Austria, 23–28 Apr 2023, EGU23-762, https://doi.org/10.5194/egusphere-egu23-762, 2023.

EGU23-4482 | Posters on site | CL3.1.6

Application of the Self-calibrated Palmer Drought Severity Index for Estimation of Drought Impact on Maize Grain Yield in Pannonian Part of Croatia 

Krešo Pandžić, Tanja Likso, Ivan Pejić, and Hrvoje Šarčević

Ten-day self-calibrating Palmer Drought Severity Index (scPDSI) has been computed, based on observed 10-day mean air temperature, relative humidity and precipitation totals, as a parameter of drought impact on grain yield of 32 marketleading maize hybrids in 2017 and 2018 over 8 experimental locations in Pannonian part of Croatia. In addition, time series of the same climate variables for the closest “official” weather stations of Croatian Meteorological and Hydrological Service (DHMZ) for the period 1981-2018 have been used for scPDSI calibration and calculation. According to 10-day scPDSI, 2018 showed to be a „regular year“ while 2017 had a „moderate drought“ causing a maize grain yield reduction of 13%, compared to 2018. In spite some differences in climate aridity of central and eastern Croatia, a significant correlation between summer months’10-day scPDSI and maize grain yield has been determined. The highest average correlation coefficients across all maize hybrids for three summer months were determined for the last decade (10-day period) of July and consecutive three decades in August. The dependence of grain yield on scPDSI value is not the same for all hybrids indicating various tolerances of different hybrids to drought stress. The grain yield reduction was primarily affected by insufficient grain filling (smaller 1000-kernel weight) and to some extent by reduction of number of grains. For practical use, within the set of given 32 tested hybrids, the level of determined drought tolerance of a hybrid has to be considered along with its relative grain yield performance.

How to cite: Pandžić, K., Likso, T., Pejić, I., and Šarčević, H.: Application of the Self-calibrated Palmer Drought Severity Index for Estimation of Drought Impact on Maize Grain Yield in Pannonian Part of Croatia, EGU General Assembly 2023, Vienna, Austria, 23–28 Apr 2023, EGU23-4482, https://doi.org/10.5194/egusphere-egu23-4482, 2023.

EGU23-5430 | ECS | Posters on site | CL3.1.6

The effects of the temperature increase on the rainfall regimes in north-central Italy 

Marco Luppichini, Monica Bini, Roberto Giannecchini, and Giovanni Zanchetta

In the last few years, several works have studied rainfall regime changes with the increase of temperature as a result of global warming. These changes, documented mainly in northern Europe, still need to be clarified in the Mediterranean area. Many studies have identified sometimes contradictory trends according to the type of data used, the methodology, and the daily or subdaily types of events. Therefore, an in-depth investigation of the Mediterranean area is required for the definition of more certain future scenarios.

In this study, we examined a database with more than 1,000 raingauges and thermometers in northern and central Italy to analyze the rapid extreme precipitation events (EPEs) in relation to temperature. This large database covers a low rainfall accumulation period (RAP) that allowed us to study the relationship between temperature and rainfall and to distinguish rapid from long events related to rainfall intensity. 

The results show different relationships between rainfall and temperature regarding seasons, RAPs, rainfall intensity, and geographical factors. The high spatial density of the database made it possible to identify spatial clusters with homogenous characteristics influenced mainly by geographical factors. With an increase in temperature, the wet season is characterized by a general increase in rainfall with a higher surge for intense and fast events. Instead, the dry season shows a general rainfall decrease for less intense and longer events, but an increase in rapid and more intensive rainfall events. This outcome has further implications involving a future decrease in water availability and an increase of the EPEs, causing an extremization of the climate during the dry season for northern and central Italy.

How to cite: Luppichini, M., Bini, M., Giannecchini, R., and Zanchetta, G.: The effects of the temperature increase on the rainfall regimes in north-central Italy, EGU General Assembly 2023, Vienna, Austria, 23–28 Apr 2023, EGU23-5430, https://doi.org/10.5194/egusphere-egu23-5430, 2023.

EGU23-6031 | Posters on site | CL3.1.6

Is the flood occurrence rate decreasing in Southeast Europe? 

Igor Leščešen, Biljana Basarin, Manfred Mudelsee, and Robert L. Wilby

Floods are natural phenomena, which can turn into disasters and cause widespread damage, health problems and deaths. This is particularly the case where rivers have been denied from their natural floodplains and are limited by embankments, and where housing and industrial buildings have been constructed in areas that are naturally liable to flooding. However, during the last few decades, flood observations from different parts of Europe do not show a clear increase in flood occurrence rate (Blöschl et al., 2019). In the present paper we present longer-term records of winter and summer floods in one of the largest river of Southeast Europe, the Sava River for the 1926-2021 period. We analysed three group of events that were based on three flood protection levels in Republic of Serbia defined for Sremska Mitrovica station. Regular protection level is set at 4120 m3/s and emergency flood defense level which is set at 5120 m3/s, that is, minor events are up to the regular protection level, strong events are up to the emergency level and extreme events are above emergency flood defense level. For the past 95 years, we find a decrease in both summer and winter flood occurrence rates. The reduction in winter flood occurrence can partly be attributed to reduced amount of precipitation during this period of the year. Further, on the basis of these data and methods, we find that for the Sava River can be stated the following: (1) downward but not significant trends in winter flood risk during the observed period, (2) Downward trends of summer floods was also observed, with only strong events being statistically significant. This decrease can be partially due to a projected decrease in cyclone frequency in the Mediterranean region. Presented results clearly demonstrate decreasing flood occurrence rate of the Sava River, as a consequence of decreasing precipitation and increasing evaporation (due to increasing temperature). 

References

Blöschl, G., Hall, J., Parajka, J., Perdigão, A. P. R., Merz, B., Arheimer, B., Aronica, T. G., Bilibashi, A., Bonacci, O., Borga, M., Čanjevac, I., Castellarin, A., Chirico, B. G., Claps, P., Fiala, K., Frolova, N., Gorbachova, L., Gül, A., Hannaford, J., Harrigan, S., Kireeva, M., Kiss, A., Kjeldsen, R. T., Kohnová, S., Koskela, J. J., Ledvinka, O., Macdonald, N., Mavrova-Guirguinova, M., Mediero, L., Merz, R., Molnar, P., Montanari, A., Murphy, C., Osuch, M., Ovcharuk, V., Radevski, I., Rogger, M., Salinas, L. J., Sauquet, E., Šraj, M., Szolgay, J., Viglione, A., Volpi, E., Wilson, D., Zaimi, K. & Živković, N. (2019). Changing climate both increases and decreases European river floods. Nature 573 (7772), 108–111. https://doi.org/10.1038/s41586-019-1495-6.

Acknowledgements

This research was supported by ExtremeClimTwin project, which has received funding from the European Union’s Horizon 2020 research and innovation programme under grant agreement No 952384.

How to cite: Leščešen, I., Basarin, B., Mudelsee, M., and Wilby, R. L.: Is the flood occurrence rate decreasing in Southeast Europe?, EGU General Assembly 2023, Vienna, Austria, 23–28 Apr 2023, EGU23-6031, https://doi.org/10.5194/egusphere-egu23-6031, 2023.

EGU23-6044 | Posters virtual | CL3.1.6

On external and internal drivers of extreme discharges in the Danube Lower Basin 

Constantin Mares, Ileana Mares, Venera Dobrica, and Crisan Demetrescu

The extreme discharges in the Danube Lower Basin, highlighted by the Generalized Extreme Value theory, were analyzed by their internal and external drivers. For the former, some large and regional scales climate indices, such as the North Atlantic Oscillation (NAO), the Greenland-Balkan Oscillation (GBO), and the Palmer type drought indices, respectively, were used. For the latter the sunspot number (SSN) time series was considered.

Wavelet coherence for multiple variables, different types of filters and regression models were applied.

The results obtained in this study depend on the season, and can be beneficial for different decision-makers for a good management of water resources in case of extreme events.

How to cite: Mares, C., Mares, I., Dobrica, V., and Demetrescu, C.: On external and internal drivers of extreme discharges in the Danube Lower Basin, EGU General Assembly 2023, Vienna, Austria, 23–28 Apr 2023, EGU23-6044, https://doi.org/10.5194/egusphere-egu23-6044, 2023.

EGU23-6942 | ECS | Posters on site | CL3.1.6

Trends and characteristics of warm and dry extreme compound event in Southeastern Europe 

Maja Orihan and Branislav Živaljević

Extreme compound events defined as the simultaneous occurrence of multiple natural hazards such as floods, droughts, and heatwaves, have become increasingly frequent in South East Europe in recent years. These events can have significant impacts on the region's social, economic, and environmental systems and can lead to significant human losses. Because South East is identified as a climate hot spot for future climate change and occurrence of extreme compound events, it is very important to identify and study these hot spots. This information could be useful for decision-makers and practitioners in the water management and agriculture sector, especially in the Balkan region. Here we present the first results of the study of the compound warm and dry over the Western Balkan area since compound events have not been studied over the territory of Eastern Europe since 1950 until today. Using daily data on maximum temperature and precipitation, we calculated the frequency and trends of the warm/dry (WD) indices. Trends were calculated using the Mann-Kendall trend test in R and the resolution that was used is ERA5 1950-now. Presented results are annual and also seasonal variations. The index that we used shows cold and dry events per year or season, the results indicate the rising trend over the whole territory of South East Europe, where trends were statistically significant by over 95 percent. We investigated years with recorded heat waves and the most severe droughts in the observed region in the years: 2007, 2012, 2015, and 2017. In 2007 there were more than 140 warm and dry events in the Western Balkans area, in 2012 there were between 160 and 200 warm and dry events, in 2015 more than 140 and in 2017 around 140 warm and dry events. 

Studying extreme compound events is very important because it helps us to better understand the underlying causes of extreme weather and other natural disasters, especially in this area of high agricultural potential. This knowledge can help farmers to make informed decisions about how to identify potential risks and develop strategies to mitigate them to maximize their yields and minimize losses.

Our results highlight the need for targeted and effective risk management strategies to reduce the negative impacts of extreme compound events in South East Europe.


KEY WORDS

Compound events, temperature, precipitation, Eastern Europe, trends


Funding: This research was supported by the EXtremeClimTwin project, which has received funding from the European Union’s Horizon 2020 research and innovation program under grant agreement No952384.

How to cite: Orihan, M. and Živaljević, B.: Trends and characteristics of warm and dry extreme compound event in Southeastern Europe, EGU General Assembly 2023, Vienna, Austria, 23–28 Apr 2023, EGU23-6942, https://doi.org/10.5194/egusphere-egu23-6942, 2023.

EGU23-11863 | Posters on site | CL3.1.6

Attribution of extreme rainfall associated with the Balkans floods of May 2014 

Zorica Podraščanin, Biljana Basarin, Carley Iles, and Anne Sophie Daloz

In May 2014, the Balkan Region experienced exceptionally heavy rainfall. Between May 14 and May 19, 2014, there was a devastating flood in Serbia, Croatia, and Bosnia & Herzegovina. The event shattered a number of historical records and seriously endangered economies across the region. The close proximity of human settlements, infrastructure (houses, buildings, bridges), and agricultural land to flood plains further amplified the destructive effects. Although atmospheric thermodynamic and dynamic processes were used to describe this exceptional rainfall event, there was no mention of how climate change may have contributed to it. We show that the probability of this brief and powerful event occurring without human-caused climate change were incredibly low. Our research aims to demonstrate how climate change may have affected the likelihood that this extreme rainfall event will occur as well as to outline the difficulties in doing so. This was accomplished using the methods recommended by the World Weather Attribution (WWA) group. We examine whether and how much human-caused climate change has affected the likelihood and intensity of the rainfall over the Balkans as well as the peak 5-day precipitation in order to achieve this. We consider both historical weather data and climate models with and without anthropogenic forcing. The findings suggested that one of the key elements in determining event likelihood calculations is domain selection. Given the current situation and the possibility for further excessive rainfall over the Balkans, it is critical to enhance water management and lessen vulnerability to extreme rainfall.


Acknowledgement:
This research was supported by ExtremeClimTwin project, which has received funding from the
European Union’s Horizon 2020 research and innovation programme under grant agreement No 952384.

How to cite: Podraščanin, Z., Basarin, B., Iles, C., and Daloz, A. S.: Attribution of extreme rainfall associated with the Balkans floods of May 2014, EGU General Assembly 2023, Vienna, Austria, 23–28 Apr 2023, EGU23-11863, https://doi.org/10.5194/egusphere-egu23-11863, 2023.

EGU23-14880 | Posters on site | CL3.1.6

Effects of changing atmospheric circulation patterns on waterlogging potential in Southeast Europe 

Minučer Mesaroš, Dragoslav Pavić, and Igor Leščešen

Waterlogging or inland flooding occurs when excess water accumulates in the soil, leading to saturated conditions and reduced oxygen levels. Waterlogging affects lowlands, flat terrain and alluvial plains with limited runoff and increased water accumulation, which is typical for large parts of the Pannonian and Peripannonian regions of Hungary, Serbia and Croatia. These inundations cause substantial problems, primarily in agriculture trough crop loss, soil degradation and pollution, as well as damage to infrastructure and various socio-economic challenges.

Precipitation is the primary climatic factor that affects waterlogging, in combination with air temperature, humidity, evaporation, and other local hydrogeological, pedological, geomorphological and anthropogenic factors.

Changes in atmospheric circulation patterns influence the amount, intensity, and seasonality of precipitation which determine the extent and duration and subsequent negative impact of inland flooding.

Based on climate reanalysis data (ERA5) and regional climate models we examined precipitation trends in the period from 1950 to 2022 and from 2023 to 2070. Having the most significant effect on waterlogging the amount and intensity of precipitation in winter and spring season were assessed in detail. While the models indicate generally less rainfall in the future, the seasonal distribution and the increase in frequency of extreme precipitation events will favor the periodic occurrence of waterlogging in the region in the comming decades. The results of this study can be implemented in planning agricultural and water management activities.

Acknowledgements:

This research was supported by ExtremeClimTwin project, which has received funding from the European Union’s Horizon 2020 research and innovation programme under grant agreement No 952384.

How to cite: Mesaroš, M., Pavić, D., and Leščešen, I.: Effects of changing atmospheric circulation patterns on waterlogging potential in Southeast Europe, EGU General Assembly 2023, Vienna, Austria, 23–28 Apr 2023, EGU23-14880, https://doi.org/10.5194/egusphere-egu23-14880, 2023.

EGU23-15519 | Posters on site | CL3.1.6

Maize and wheat yield forecasting in the Pannonian Basin using extreme gradient boosting and its performance in years of severe drought 

Emanuel Bueechi, Milan Fischer, Laura Crocetti, Miroslav Trnka, Luca Zappa, Ales Grlj, and Wouter Dorigo

The increasing frequency and intensity of severe droughts over recent decades have significantly impacted crop production in the Pannonian Basin in southeastern Europe. Related crop yield losses can be substantial and require logistic compensation on an international level. To plan such compensations, seasonal crop yield forecasts have proven to be a valuable tool to support decision-makers in taking timely action. However, the impact of severe droughts on crop yields is often underestimated by such forecasts. To address this issue, we developed a maize and wheat yield forecasting system based on extreme-gradient-boosting machine learning for 42 regions in the Pannonian Basin. The used predictors describe vegetation state, weather, and soil moisture conditions derived from Earth observation, reanalysis, in-situ data, and seasonal weather forecasts. The wide range of predictors was selected to represent the state of the crops and the conditions they are facing and are expected to face. We expected it to be crucial, especially during severe drought years, to provide the model with sufficient information about the drought and its impacts. Afterwards, the model was validated, with a focus on drought years. 

Our results show that crop yield anomaly estimates in the two months preceding harvest have better performance than earlier in the year (relative root mean square errors below 17%) in all years. The models have their clear strength in forecasting interannual variabilities but struggle to forecast differences between regions within individual years. This is related to spatial autocorrelations and a lower spatial than temporal variability of crop yields. In years of severe droughts, there is a clear improvement in the forecasts with a 2-month lead time over longer forecasts too. The crop yield losses remain underestimated, but the wheat model performs in drought years better than for average years with errors below 12%. The errors of the maize forecasts in drought years are larger than for non-drought years: 30% two months ahead and 20% one month ahead. The feature importance analysis shows that in general wheat yield anomalies are controlled by temperature and maize by water availability during the last two months before harvest. In severe drought years, soil moisture is the most important predictor for the maize model and the seasonal temperature forecast becomes key for wheat forecasts two months before harvest. Going forward, a finer spatial resolution of the predictors will be tested to better distinguish the yields between the different regions. In addition, longer time-series of crop yield data, including more data during severe drought years, will help to test the findings of this study. 

How to cite: Bueechi, E., Fischer, M., Crocetti, L., Trnka, M., Zappa, L., Grlj, A., and Dorigo, W.: Maize and wheat yield forecasting in the Pannonian Basin using extreme gradient boosting and its performance in years of severe drought, EGU General Assembly 2023, Vienna, Austria, 23–28 Apr 2023, EGU23-15519, https://doi.org/10.5194/egusphere-egu23-15519, 2023.

EGU23-382 | ECS | Orals | NP1.2

Latent Dirichlet Allocation: a new machine learning tool to evaluate CMIP6 climate models atmospheric circulation and extremes 

Nemo Malhomme, Bérengère Podvin, Davide Faranda, and Lionel Mathelin

Climate models aim at representing as closely as possible the statistical properties of the climate components, including the extreme events. This is a fundamental requirement to correctly project changes in their dynamics due to anthropogenic forcing. In order to evaluate how closely models match observations, we need algorithms capable of selecting, processing and evaluating relevant dynamical features of the climate components. This has to be reiterated efficiently for large datasets such as those issued from the Coupled Model Intercomparison Project 6 (CMIP6). In this work, we use Latent Dirichlet Allocation (LDA), a statistical learning method initially designed for natural language processing, to extract synoptic patterns from sea-level pressure data and evaluate how close the dynamics of CMIP6 climate models are to the state-of-the-art reanalyses datasets such as ERA5 or NCEPv2, in general as well as in the case of extremes.

LDA allows for learning a basis of decomposition of maps into objects called "motifs". Applying it to sea-level pressure data, reanalysis or simulation, robustly yields motifs that are known relevant synoptic objects, i.e. cyclones or anticyclones. Furthermore, LDA provides their weight in each of the maps of the dataset, their most probable geographical position and their possible changes due to internal variability or external forcings. LDA decomposition is efficient and sparse, most of the information of a given sea-level pressure map is contained in few motifs, making it possible to decompose any map in a limited number of easy-to-interpret synoptic objects. This allows for a variety of new angles for statistical analysis.

We look at the dominant motifs and their distributions either on entire datasets or conditionally to particular extreme events, such as cold or heat waves, and compare results between reanalysis data and historical simulations. This enables us to assess which models can or cannot reproduce statistical properties of the observations, and whether or not there are properties that no model yet demonstrates. We find that models can capture the statistical synoptic composition of sea-level pressure data in general, but that some drawbacks still exist in the modelling of extreme events. LDA can also be applied separately to each dataset, and the two resulting synoptic bases can be compared. We find the sets of motifs from reanalysis and historical simulations are very similar, even if different spatial resolutions are used.

How to cite: Malhomme, N., Podvin, B., Faranda, D., and Mathelin, L.: Latent Dirichlet Allocation: a new machine learning tool to evaluate CMIP6 climate models atmospheric circulation and extremes, EGU General Assembly 2023, Vienna, Austria, 23–28 Apr 2023, EGU23-382, https://doi.org/10.5194/egusphere-egu23-382, 2023.

EGU23-483 | ECS | Posters virtual | NP1.2

Characteristics of Medicanes using ERA-5 reanalysis 

Jesús Gutiérrez-Fernández, Mario Marcello Miglietta, Juan Jesús González-Alemán, and Miguel Ángel Gaertner

Several Medicanes, which have been previously analyzed in the literature, have been studied using ERA-5 reanalyses to identify the environment in which they develop and possibly distinguish tropical-like cyclones from warm seclusions. Initially, the cyclone phase space was analyzed to identify changes in the environmental characteristics. Subsequently, the temporal evolution of several parameters was considered, including sea surface fluxes, CAPE, coupling index, potential intensity, baroclinicity.

Although the results are not consistent for all cyclones, some general characteristics can be identified: cyclones develop in areas of moderate-to-high baroclinicity associated with intense jet streams, while in the mature stage the environment becomes less baroclinic. A general reduction in the horizontal extent of the cyclone can be observed as the cyclones begin to show a shallow warm core. In this phase a progressive reduction of the CAPE can be observed in proximity of the cyclone center. Finally, the wind speed appears strongly underestimated compared to the observations, raising some concerns about the applicability of ERA-5 for the detection of wind features.

How to cite: Gutiérrez-Fernández, J., Miglietta, M. M., González-Alemán, J. J., and Gaertner, M. Á.: Characteristics of Medicanes using ERA-5 reanalysis, EGU General Assembly 2023, Vienna, Austria, 23–28 Apr 2023, EGU23-483, https://doi.org/10.5194/egusphere-egu23-483, 2023.

EGU23-1388 | ECS | Orals | NP1.2

Extreme events in multiscale systems: theory and applications 

Tommaso Alberti

Many geophysical systems show emergent phenomena and extreme events at different scales, with signatures of chaos at large scales and an apparently random behavior at small scales. Despite the intrinsic morphological and/or physical difference between geophysical extremes, they all originate as temporary deviations from the typical trajectories of the large scale geophysical flows, resulting in dynamical patterns and structures. This motivated to bring together statistics (extreme value theory) and dynamics (dynamical system theory) to provide a new definition of extremes as rare recurrences in the phase space of physical systems. This means to explore the instantaneous properties of the geometrical object hosting the frequency and probability of all physical states attainable by the system, namely the so-called attractor, to inform us on the predictability, persistence and synchronization of physical states.


Here we present a recently proposed formalism to explore the active number of degrees of freedom and the predictability horizon of multiscale complex systems showing non-hyperbolic chaos, randomness, state-dependent persistence and predictability. We briefly discuss the newly introduced framework in comparison with classical approaches, based on generalized fractal dimensions, Lyapunov exponents, and Renyi entropies. Finally, we demonstrate the suitability of this novel formalism to trace the instantaneous scale-dependent and state-dependent features of climate and geophysical extremes, pointing out how the predictability horizon, the persistence and synchronization of geophysical systems’ states is a matter of scales.

How to cite: Alberti, T.: Extreme events in multiscale systems: theory and applications, EGU General Assembly 2023, Vienna, Austria, 23–28 Apr 2023, EGU23-1388, https://doi.org/10.5194/egusphere-egu23-1388, 2023.

EGU23-1555 | ECS | Posters on site | NP1.2

Drought impact-based forecasting: Trade-offs between indicators and impacts 

Anastasiya Shyrokaya, Giuliano Di Baldassarre, Hannah Cloke, Gabriele Messori, Florian Pappenberger, and Ilias Pechlivanidis

Despite the progress in seasonal drought forecasting, it remains challenging to identify suitable drought indices for accurately predicting the impacts of a future drought event. In this study, we identified relationships across Europe between the forecasting skill of various drought indices and the estimated drought impacts. We calculated the indices over various accumulation periods, and assessed the forecasting skill of indices computed based on various seasonal prediction systems. An evaluation was performed by computing the same indices from the ERA5 reanalysis data and comparing them across various verification metrics. We further conducted a literature review of the studies assessing the performance of the indices in terms of estimating drought impacts across Europe. We finally performed a trade-off analysis and mapped the drought indices based on their drought forecasting and drought impact estimating skills.

Overall, this analysis is a step forward to detect the most suitable drought indices for predicting drought impacts across Europe. Here, not only we present a new approach for evaluating the relationship between drought indices and impacts, we also resolve the dilemma of choosing the indices to be incorporated in the impact functions. Such scientific advancements are setting significant contributions to the emerging field of operational impact-based forecasting and operational drought early warning services.

How to cite: Shyrokaya, A., Di Baldassarre, G., Cloke, H., Messori, G., Pappenberger, F., and Pechlivanidis, I.: Drought impact-based forecasting: Trade-offs between indicators and impacts, EGU General Assembly 2023, Vienna, Austria, 23–28 Apr 2023, EGU23-1555, https://doi.org/10.5194/egusphere-egu23-1555, 2023.

EGU23-2146 | ECS | Posters on site | NP1.2

Contrasting Deep and Shallow Arctic Warming Events on the Intraseasonal Time Scale in Boreal Winter 

Juncong Li, Xiaodan Chen, Yuanyuan Guo, and Zhiping Wen

The vertical structure of Arctic warming is of great importance and attracts increasing attention. This study defines two types of Arctic warming events (viz., deep versus shallow) according to their temperature profiles averaged over the Barents-Kara Seas (BKS), and thereupon compares their characteristics and examines their difference in generation through thermodynamic diagnoses. The deep Arctic warming event—characterized by significant bottom-heavy warming extending from the surface into the middle-to-upper troposphere—emanates from the east of Greenland and then moves downstream towards the BKS primarily through zonal temperature advection. The peak day of deep warming event lags that of the precipitation and resultant diabatic heating over Southeast Greenland by about four days, suggesting that the middle-to-high tropospheric BKS warming is likely triggered by the enhanced upstream convection at the North Atlantic high latitudes. In contrast, the shallow warming event—manifested by warming confined within the lower troposphere—is preceded by the meridional advection of warm air from inland Eurasia. These anomalous southerlies over Eurasian lands during shallow warming events are related to the eastward extension of deepened Icelandic Low. Whereas during deep warming events, the in-situ reinforcement of Icelandic Low favors abundant moisture transport interplaying with the Southeast Greenland terrain, leading to intense precipitation and latent heat release there. Both deep and shallow warming events are accompanied by Eurasian cooling, but the corresponding cooling of deep warming event is profoundly stronger. Further, intraseasonal deep Arctic warming events could explain nearly half of the winter-mean change in warm Arctic-cold Eurasia anomaly.

How to cite: Li, J., Chen, X., Guo, Y., and Wen, Z.: Contrasting Deep and Shallow Arctic Warming Events on the Intraseasonal Time Scale in Boreal Winter, EGU General Assembly 2023, Vienna, Austria, 23–28 Apr 2023, EGU23-2146, https://doi.org/10.5194/egusphere-egu23-2146, 2023.

EGU23-2242 | ECS | Posters on site | NP1.2

A Quantile Generalised Additive Approach for Compound Climate Extremes: Pan-Atlantic Extremes as a Case Study 

Leonardo Olivetti, Gabriele Messori, and Shaobo Jin

We present an application of quantile generalised additive models (QGAMs) to study the rela-
tionship between spatially compounding climate extremes - namely extremes that occur (near-)
simultaneously in geographically remote regions. We take as example wintertime cold spells
in North America and co-occurring wet or windy surface weather extremes in Western Europe,
which we collectively term Pan-Atlantic compound extremes. QGAMS are largely novel in cli-
mate science applications and present three key advantages over conventional statistical models
of weather extremes:


1. they do not require a direct identification and parametrisation of the extremes themselves,
since they model all quantiles of the distributions of interest;
2. they do not require any a priori knowledge of the functional relationship between the predic-
tors and the dependent variable;
3. they make use of all information available, and not only of a small number of extreme values.


Here, we use QGAMs to both characterise the co-occurrence statistics and investigate possible
dynamical drivers of the Pan-Atlantic compound extremes. We find that recent cold spells in
North America are a useful predictor of upcoming near-surface extremes in Western Europe,
and that QGAMs can predict those extremes more accurately than conventional peak-over-
threshold models.

How to cite: Olivetti, L., Messori, G., and Jin, S.: A Quantile Generalised Additive Approach for Compound Climate Extremes: Pan-Atlantic Extremes as a Case Study, EGU General Assembly 2023, Vienna, Austria, 23–28 Apr 2023, EGU23-2242, https://doi.org/10.5194/egusphere-egu23-2242, 2023.

EGU23-2644 | ECS | Posters on site | NP1.2

Investigating the typicality of the dynamics leading to extreme temperatures in the IPSL-CM6A-LR model 

Robin Noyelle, Pascal Yiou, and Davide Faranda

Understanding the physical mechanisms leading to extremes of quantities of interest in dynamical systems remains a challenge. Under mild hypothesis, the application of the theory of large deviations to dynamical systems predicts the convergence of trajectories leading to extremes towards a typical, i.e. most probable, one called the instanton. In this paper, we use a 2000 years long simulation of the IPSL-CM6A-LR model under a stationary pre-industrial climate to test this prediction. We investigate the convergence properties of trajectories leading to extreme temperatures at four locations in Europe for several variables. We show the convergence of trajectories for most physical variables, with some geographical and temporal discrepancies. Our results are coherent with the most probable path prediction and suggest that the instanton dynamics leading to extremes is a relevant feature of climate models.

How to cite: Noyelle, R., Yiou, P., and Faranda, D.: Investigating the typicality of the dynamics leading to extreme temperatures in the IPSL-CM6A-LR model, EGU General Assembly 2023, Vienna, Austria, 23–28 Apr 2023, EGU23-2644, https://doi.org/10.5194/egusphere-egu23-2644, 2023.

EGU23-3300 | Posters on site | NP1.2

Simulating the West Pacific Heatwave of 2021 with Analog Importance Samping 

Flavio Pons, Pascal Yiou, and Aglae Jezequel

During the summer of 2021, the North American Pacific Northwest was affected by an extreme heatwave that broke previous temperature records by several degrees and lasted almost two months after the initial peak. The event caused severe impacts on human life and ecosystems, and was associated with the superposition of concurrent extreme drivers, whose effects were amplified by climate change. We evaluate whether this record-breaking heatwave could be anticipated prior to 2021, and how climate change affects North American Pacific Northwest worst case heatwave scenarios. We use a stochastic weather generator  with empirical importance sampling. The generator simulates temperature sequences with realistic statistics using circulation analogues, chosen with an importance sampling based on the daily maximum temperature over the region that recorded the most extreme impacts. We show how some of the large-scale drivers of the event can be obtained form the circulation analogues, even if such information is not directly given to the stochastic weather generator.

How to cite: Pons, F., Yiou, P., and Jezequel, A.: Simulating the West Pacific Heatwave of 2021 with Analog Importance Samping, EGU General Assembly 2023, Vienna, Austria, 23–28 Apr 2023, EGU23-3300, https://doi.org/10.5194/egusphere-egu23-3300, 2023.

EGU23-4216 | ECS | Orals | NP1.2

Large-scale perspective on the extreme near-surface winds in the central North Atlantic 

Aleksa Stanković, Rodrigo Caballero, and Gabriele Messori

This study investigates winter cyclones that cause extreme 10 m winds in the central North Atlantic region (30o to 60latitude, -50o to -10o longitude) in the ERA5 dataset. We employ a bottom-up approach consisting of selection of the extreme 10 m wind events and analysis of the cyclones that caused the extremes.

The 10 m wind extremes were ranked using the Klawa and Ulbrich (2003) destructiveness index, which takes into account wind exceedances over the local 98th percentiles. The top 1% of destructive events were chosen for further analysis. Cyclones were associated with the extreme winds by finding the closest sea-level pressure lows at the times of maximum wind speeds.

By analyzing various meteorological fields associated with the temporal evolution of the selected cyclones, we find an important role of interactions with other pre-existing cyclones that create suitable conditions for the development of the subsequent extreme windstorms.  

How to cite: Stanković, A., Caballero, R., and Messori, G.: Large-scale perspective on the extreme near-surface winds in the central North Atlantic, EGU General Assembly 2023, Vienna, Austria, 23–28 Apr 2023, EGU23-4216, https://doi.org/10.5194/egusphere-egu23-4216, 2023.

EGU23-5515 | ECS | Orals | NP1.2

Estimating non-linear persistence for impact assessment in European forests 

Tristan Williams, Miguel D. Mahecha, and Gustau Camps-Valls

Persistence is an important characteristic of many complex systems in nature and of the Earth system in particular. Relating this statistical concept to physical properties of ecosystems is rather elusive, but reflects how long the system remains at a certain state before changing to a different one and is measured via the memory and dependence of values on past states [1]. Characterizing persistence in the terrestrial biosphere is very relevant to understand intrinsic properties of the system such as legacy effects of extreme climate events [2]. Such memory effects are often highly non-linear and therefore challenging to detect in observational records and poorly represented in Earth system models. This study estimates long and short-term non-linear persistence in eddy-covariance flux measurements and remote sensing products in European forests and the corresponding hydro-meteorological data. Characterizing persistence in the data allows us to make inferences on the interaction between Drought-Heat events, forest dynamics, and ecosystem resilience [3]. The comparison of in-situ and Earth Observation (EO) data allows us to infer how meaningful EO data are for monitoring complex dynamics in ecosystems.

For short-term, spatio-temporal persistence, we use echo state networks using the technique suggested in [4] as an explainable AI (XAI) technique. In this context, the persistence of the system can be estimated by the model's response when the input fades abruptly. For the characterization of long-term persistence, we introduce a novel kernel extension of the well-established Detrended Fluctuation Analysis (DFA) [5], a method widely used in atmospheric sciences [1]. The DFA method is a scaling analysis that provides a simple quantitative parameter (the scaling exponent) to represent the correlation properties of a signal and a characteristic time of the event of interest. Unlike DFA, the proposed kernel DFA method can handle non-linear time-scales interactions. 

Estimating the non-linear persistence of forests and climate data allows us to relate characteristic times, crossover points between different scaling exponents, and short-term memory parameters with the duration and intensity of the events, as well as an indicator of change in the vegetation response to hydro-climatic conditions.


[1] Salcedo-Sanz, S., et al. “Persistence in complex systems”. Physics Reports 957, 1-73, (2022).

[2] Bastos, Ana, et al. “Direct and seasonal legacy effects of the 2018 heat wave and drought on European ecosystem productivity." Science advances 6.24 (2020)

[3] Scheffer, M., Carpenter, S. R., Dakos, V. & van Nes, E. H. Generic indicators of ecological resilience: inferring the chance of a critical transition. Annu. Rev. Ecol. Evol. Syst. 46, 145–167 (2015).

[4] Barredo Arrieta, A., Gil-Lopez, S., Laña, I. et al. On the post-hoc explainability of deep echo state networks for time series forecasting, image and video classification. Neural Comput & Applic 34, 10257–10277 (2022).

[5] Peng, C‐K., et al. "Quantification of scaling exponents and crossover phenomena in nonstationary heartbeat time series." Chaos: an interdisciplinary journal of nonlinear science 5.1 (1995): 82-87.

How to cite: Williams, T., Mahecha, M. D., and Camps-Valls, G.: Estimating non-linear persistence for impact assessment in European forests, EGU General Assembly 2023, Vienna, Austria, 23–28 Apr 2023, EGU23-5515, https://doi.org/10.5194/egusphere-egu23-5515, 2023.

Atmospheric blocking can be described as a large-scale stationary or quasi-stationary circulation anomaly that blocks the mean westerlies. Blocking often triggers extreme temperature events like heat waves or cold spells. However, dynamical processes leading to the formation, maintenance, and decay mechanisms of blocking are still not well understood.

Moist processes have recently been proven to play a significant role in the formation and maintenance of blocking. However, it is unclear if moist processes generate special properties in the blocking life cycle that cannot be represented by dry dynamics or if they are just there to inject extra energy into the atmospheric disturbances. The following is the question we address in the present study: Is a dry dynamical model with climatology close to the observations capable of representing blocking characteristics correctly? The methodology relies on numerical experiments made with the new IPSL dynamical core called DYNAMICO, which enables high spatial resolutions. DYNAMICO is used here to analyze a long-term simulation in which the model forcing is designed to obtain a realistic climatology for a given season (perpetual winter in the present case). Blocking statistics like frequency of occurrence and duration are provided using two blocking detection algorithms and compared to the re-analysis dataset (ERA5). A focus is made on blocking onsets in the Euro-Atlantic sector. To highlight the differences in the processes leading to blocking onsets, backward Lagrangian trajectories seeded in the blocking regions are systematically computed and analyzed. Additional long-term simulations of the same dry model with the increased horizontal resolution are also analyzed following the same approach.

How to cite: Deshmukh, V., Rivière, G., and Fromang, S.: How are atmospheric blockings represented in a dry general circulation model with wave energy just as powerful as in the observations?, EGU General Assembly 2023, Vienna, Austria, 23–28 Apr 2023, EGU23-5671, https://doi.org/10.5194/egusphere-egu23-5671, 2023.

EGU23-6131 | ECS | Orals | NP1.2

Stochastic weather generator and deep learning approach for predicting and sampling extreme European heatwaves 

George Miloshevich, Dario Lucente, Freddy Bouchet, and Pascal Yiou

Sampling rare events such as extreme heatwaves whose return period is larger than the length of available observations requires developing and benchmarking new  simulation methods. There is growing interest in applying deep learning alongside already existing statistical approaches to better generate and predict rare events. Our goal is to benchmark Stochastic Weather Generator (SWG) [1] based on analogs of circulation, soil moisture and temperature as a tool for sampling tails of distribution as well as forecasting heatwaves in France and Scandinavia using data from General Circulation Model (GCM). Analog method has been successfully implemented in rare event algorithms for low dimensional climate models [2].

SWG is implemented using a Markov chain with hidden states (.e.g. geopotential height at 500 hPa) with Euclidean metric. When applying such methods to climate data two challenges emerge: a large number of degrees of freedom and the difficulty of including slow drivers such as soil moisture alongside circulation patterns. Consequently, we are going to discuss ways of adjusting the distance metric of the analog Markov chain and dimensionality reduction techniques such as EOFs and variational auto encoder. By choosing the correct combination of weighted variables in the Euclidean metric and using analogs of only 100 years and generating long synthetic sequences we are able to correctly estimate return times of order 7000 years, which is validated based on a 7200 year long control run. The teleconnection patterns generated thus also look reliable compared to the control run.

Next we compare SWG forecasts of heatwaves with a direct supervised approach based on a Convolutional Neural Network (CNN). Both CNN and SWG are trained and validated on exactly the same GCM runs which allows us to conclude that CNN performs better in both regions. One could consider SWG as a baseline approach for CNN for this task.

[1] Yiou, P. and Jézéquel, A., https://doi.org/10.5194/gmd-13-763-2020, 2020

[2] D. Lucente at al. https://10.1088/1742-5468/ac7aa7, 2022

[3] DP Kingma, M Welling - https://doi.org/10.48550/arXiv.1312.6114, 2013

[4] G. Miloshevich, at al - https://doi.org/10.48550/arXiv.2208.00971, 2022

How to cite: Miloshevich, G., Lucente, D., Bouchet, F., and Yiou, P.: Stochastic weather generator and deep learning approach for predicting and sampling extreme European heatwaves, EGU General Assembly 2023, Vienna, Austria, 23–28 Apr 2023, EGU23-6131, https://doi.org/10.5194/egusphere-egu23-6131, 2023.

EGU23-6507 | ECS | Posters on site | NP1.2

Simulation of future extreme rainfall events over Belgium with a focus on the Vesdre valley using the regional climate model MAR. 

Josip Brajkovic, Hans Van De Vyver, Sébastien Doutreloup, Nicolas Ghilain, and Xavier Fettweis

The rainfall in July 2021 that hit West Germany, Netherlands and Belgium was of unprecedented intensity. To assess the probability of such events ocuring in a near and far future (until 2100), the regional climate model MAR has been used to make simulations at a resolution of 7,5 km. To this end, the regional climate model MAR is linked to a set of Earth System models (ESMs) with 4 IPCC SSP scenarios over a domain that includes Belgium and Luxemburg. The analysis focused on the valley of the Vesdre which in Belgium was the most impacted by flooding in terms of damage to human infrastructures.

For some specific climatic conditions, MAR simulates events of similar intensity to those of the 2021-floods over the next 5 decades. To assess the statistic significance of the results, a Peaks Over Threshold analysis (POT) has been applied to MAR outputs for precipitation events of 1,2,3,4 and 5-days. Quantiles associated with high return periods have been calculated for the historical period of simulation (1980-2010) and for the 2011-2040, 2041-2070 an 2071-2100 periods. This shows that the frequency of such events in the periods 2011-2040 and 2041-2070 is likely to increase if climatic conditions are wet enough. For global warming levels above 3 to 4 °C, conditions appear too dry for such events to occur.

How to cite: Brajkovic, J., Van De Vyver, H., Doutreloup, S., Ghilain, N., and Fettweis, X.: Simulation of future extreme rainfall events over Belgium with a focus on the Vesdre valley using the regional climate model MAR., EGU General Assembly 2023, Vienna, Austria, 23–28 Apr 2023, EGU23-6507, https://doi.org/10.5194/egusphere-egu23-6507, 2023.

EGU23-6732 | Posters on site | NP1.2

Deep learning techniques applied to an attribution study for heatwaves in the Iberian Peninsula 

Pablo G. Zaninelli, David Barriopedro-Cepero, Marie Drouard, José Manuel Garrido-Pérez, Jorge Pérez-Aracil, Dušan Fister, Ricardo García-Herrera, Sancho Salcedo-Sanz, and M. Carmen Alvarez-Castro

Extreme event attribution quantifies the influence of climate change on a particular extreme event (EE). Understanding the extent to which climate change is responsible for particular EE is of paramount importance because of the vulnerability of society and ecosystems to these events, especially when it comes to heatwaves that have become more frequent and intense in many parts of the world in recent decades. This led the scientific community to focus its efforts on attribution analysis and the implementation of new techniques for its study. Attribution studies of temperature EE using machine learning (ML) methods are scarce in the specialized literature. Most attribution studies perform statistical comparison between the probability of occurrence of an event today with its probability in the pre-industrial past, making it possible to determine how much more likely that event is due to climate change and how much severe it could be. However, some limitations of these classical methodologies are the difficulty in understanding the links between the physical processes responsible for the occurrence of extreme events and anthropogenic forcing and the impossibility of detecting new trends associated with this forcing. The CLImate INTelligent (CLINT) project aims, among its objectives, to design ML algorithms to improve classical attribution methodologies in some of the aforementioned limitations for three european hot-spots located in Spain, Italy and Netherlands. In this framework, this work presents a preliminary attribution analysis for summer heatwaves focused in Iberian Peninsula and based on deep learning tools such as anomaly detection with autoencoders. The autoencoder is an unsupervised method that comprises two neural networks, one to encode information and the other to decode it. The autoencoder is fed with pre-industrial realizations integrated in the framework of the Coupled Model Intercomparison Project in its sixth version (CMIP6) in such a way that it allows detecting variabilities and trends that are present in the historical run and not in the pre-industrial one. In addition, the influence of climate change for a particular temperature EE could be associated with the AE anomaly for this EE.

How to cite: Zaninelli, P. G., Barriopedro-Cepero, D., Drouard, M., Garrido-Pérez, J. M., Pérez-Aracil, J., Fister, D., García-Herrera, R., Salcedo-Sanz, S., and Alvarez-Castro, M. C.: Deep learning techniques applied to an attribution study for heatwaves in the Iberian Peninsula, EGU General Assembly 2023, Vienna, Austria, 23–28 Apr 2023, EGU23-6732, https://doi.org/10.5194/egusphere-egu23-6732, 2023.

EGU23-7087 | Posters on site | NP1.2

A Temperature-Duration-Curve model for the real-time estimation of extreme river water temperatures at ungauged sites 

Taha Ouarda, Christian Charron, and André St-Hilaire

Water temperature is an important environmental variable that has impacts on the physical, chemical, and biological processes in streamflows. Extreme river water temperatures affect the spawning, development and survival of several fish species, and are considered as important indicators of the health of a river and essential variables in all habitat models. Unfortunately, river water temperature data is characterised by its limited availability: measurement sites are often scarce, and records are regularly very short when available. It is hence crucial to develop regional thermal data estimation models for ungauged and partially gauged locations. Very few studies in the literature focused on the estimation of extreme water temperatures at sites where thermal data are limited or inexistent. A Temperature-Duration-Curve (TDC) model is proposed in this work to provide real-time estimates of river water temperature at ungauged locations during extreme events. The TDCs are estimated at the ungauged locations using a Generalised Additive Model and are then used to provide continuous estimates of river water temperature at these sites based on a spatial interpolation model. The model is developed based on a data base of 126 river thermal stations from Canada. The performance of the method is compared to a simpler approach and results indicate that the developed TDC model is robust and useful in practice.

How to cite: Ouarda, T., Charron, C., and St-Hilaire, A.: A Temperature-Duration-Curve model for the real-time estimation of extreme river water temperatures at ungauged sites, EGU General Assembly 2023, Vienna, Austria, 23–28 Apr 2023, EGU23-7087, https://doi.org/10.5194/egusphere-egu23-7087, 2023.

EGU23-7124 | ECS | Orals | NP1.2

Influence of the Atlantic Multidecadal Variability and of Soil Moisture on Extreme Heatwaves in Europe 

Valeria Mascolo, Clément Le Priol, Fabio d'Andrea, and Freddy Bouchet

Nowadays heat waves are a growing issue, causing detrimental effects on society, people’s health and environment in several parts of the world. Slow drivers such as spring soil moisture and sea surface temperature are known to impact the probability of occurrence of heatwaves in many areas of the globe. However, their influence remains still little understood and studied. Even fewer has been said on the cross effect and relative impact of both factors. 

Our work aims at analysing and comparing the effects of spring soil moisture deficit in Europe and sea surface temperature decadal variability in the North Atlantic (AMV) on the occurrence of typical and more extreme European heat waves. To do that, we use the outputs from three climate models, namely IPSL-CM6A-LR, EC-Earth3 and CNRM-CM6-1, in which North Atlantic sea surface temperatures are nudged to the observed AMV anomalies.

At a methodological level, previous studies mainly focused on typical heat waves. Our work goes beyond that and proposes a new methodology to study events with larger return times. By introducing return time maps we can study rare heatwaves with return time from 10 to 50 years. We find that the temperature and duration of typical and extreme heatwaves are influenced by the AMV and soil moisture. In general, the changes induced by typical AMV or soil moisture anomalies are of comparable amplitude. In many areas of Europe, the influence of AMV and soil moisture over duration or temperature of extreme heatwaves increases when the return time is longer and is statistically significant even for return times of 50 years. In general, the three models give consistent results. 

With positive AMV phase or low soil moisture, the temperature and duration of extreme heatwaves are changed according to regional patterns. As might be expected, positive AMV phase or low soil moisture often induce hotter and longer typical and extreme heatwaves. However, counter-intuitively, they also induce cooler and shorter heatwaves over part of Northern-Eastern Europe. For more extreme events, the impact of the AMV and soil moisture increases, according to rather similar regional patterns. However, the regions with decreased temperature or duration impact extend in size.

In this work, we have improved the study of extreme heat waves and better understood their slow drivers. Studying those drivers is important to enhance heat wave predictability. To move further in this direction, we need to improve the statistics of the events. In this context, developing and using new tools such as rare event simulations might be the right path to follow.

How to cite: Mascolo, V., Le Priol, C., d'Andrea, F., and Bouchet, F.: Influence of the Atlantic Multidecadal Variability and of Soil Moisture on Extreme Heatwaves in Europe, EGU General Assembly 2023, Vienna, Austria, 23–28 Apr 2023, EGU23-7124, https://doi.org/10.5194/egusphere-egu23-7124, 2023.

EGU23-7697 | ECS | Posters on site | NP1.2

Diagnosing atmospheric persistence for heatwaves and in extended range forecasts 

Emma Holmberg, Gabriele Messori, Rodrigo Caballero, Steffen Tietsche, and Davide Faranda

Extreme events can cause severe disruption to society on many levels, and the ability to forecast these events represents a significant step towards the ability to reduce their impacts. Anomalously persistent atmospheric configurations are typically regarded to be strongly linked with temperature extremes in Europe, however, traditional methods of analysing atmospheric persistence lack a mathematically well-grounded definition. Furthermore, we are not aware of a metric which allows for quantification of instantaneous atmospheric persistence for forecasts for either an individual ensemble member or a deterministic forecast. We aim to help refine the definition of atmospheric persistence by presenting a mathematically well-grounded definition of persistence, which can potentially also be applied in a forecasting environment. We examine the link between the extremal index, an indicator for atmospheric persistence based on dynamical systems theory, and warm temperature extremes in several regions of Europe. We then consider the applicability of this technique to forecast data, in particular ECMWF extended range reforecast data, discussing its potential value as an additional forecast evaluation metric.

How to cite: Holmberg, E., Messori, G., Caballero, R., Tietsche, S., and Faranda, D.: Diagnosing atmospheric persistence for heatwaves and in extended range forecasts, EGU General Assembly 2023, Vienna, Austria, 23–28 Apr 2023, EGU23-7697, https://doi.org/10.5194/egusphere-egu23-7697, 2023.

EGU23-7908 | ECS | Orals | NP1.2

Dynamical pathways for pan-Atlantic compound cold and windy extremes 

Jacopo Riboldi, Josh Dorrington, Richard Leeding, Antonio Segalini, and Gabriele Messori

North American cold spells tend to co-occur with extreme wind and precipitation events over Europe, but the physical mechanisms behind such “pan-Atlantic” compound extremes have not been fully clarified yet. Rather than proposing a single mechanism, we discuss how cold spells over a single North American region can be connected with wind extremes over different European regions through separate, physically consistent dynamical pathways. The first one involves the propagation of a Rossby wave train from the Pacific Ocean, and is associated with windstorms over north-western Europe in the 5-10 days after the cold spell peak. The second one is associated with a high-latitude anticyclone over the North Atlantic and an equatorward-shifted jet, leading to windstorms over south-western Europe already in the days preceding the cold spell peak.

The same dynamical pathways can be independently retrieved from a cluster analysis based on the temporal evolution of the North Atlantic circulation in the days preceding North American cold spells. Such an analysis highlights significantly different stratospheric circulation patterns between the two pathways, with cold spells of the second pathway tied to a weaker than usual stratospheric polar vortex, and an enhanced occurrence of sudden stratospheric warmings.

How to cite: Riboldi, J., Dorrington, J., Leeding, R., Segalini, A., and Messori, G.: Dynamical pathways for pan-Atlantic compound cold and windy extremes, EGU General Assembly 2023, Vienna, Austria, 23–28 Apr 2023, EGU23-7908, https://doi.org/10.5194/egusphere-egu23-7908, 2023.

EGU23-7954 | ECS | Orals | NP1.2

On the Response of North Atlantic Extratropical Cyclones to North America Cold Air Outbreaks 

Richard Leeding, Gabriele Messori, and Jacopo Riboldi

We examine the characteristics of North Atlantic extratropical cyclones in ERA5 data during cold air outbreaks over continental North America. Previous research has established a statistical link between occurrences of North American cold air outbreaks and an increased frequency of extreme wet and windy conditions over Europe. The theoretical understanding of cyclogenesis suggests that greater numbers of extratropical cyclones will be generated in the North Atlantic, resulting from an enhanced temperature difference between the North American continent and the Gulf Stream during cold air outbreaks. Our analysis finds that counts of extratropical cyclones in the North  Atlantic storm track are no greater, or even less than climatology during periods with cold air outbreaks. We instead find anomalous jet stream activity associated with the cold air outbreaks. The jet stream acts to focus extratropical cyclones to a specific region of the North  Atlantic, depending on the regional extent of the cold air outbreak, resulting in significantly higher extratropical cyclone counts for that specific region. The regions found to be experiencing higher counts of extratropical cyclones align with previously established geographical dependencies between co-occurrences of North American cold air outbreaks and wet and windy extremes over Europe. We also find that cold air outbreaks associated with an anomalously strengthened jet result in a general increase in the strength of the extratropical cyclones reaching Europe, whilst a more equatorward-displaced jet, with lower maximum speed, results in more persistent extratropical cyclones over southern Europe. 

How to cite: Leeding, R., Messori, G., and Riboldi, J.: On the Response of North Atlantic Extratropical Cyclones to North America Cold Air Outbreaks, EGU General Assembly 2023, Vienna, Austria, 23–28 Apr 2023, EGU23-7954, https://doi.org/10.5194/egusphere-egu23-7954, 2023.

EGU23-8138 | ECS | Orals | NP1.2

Return levels of extreme European windstorms, their dependency on the NAO, and potential future risks 

Matthew Priestley, David Stephenson, and Adam Scaife

European windstorms experience considerable interannual variability, which makes the quantification of extreme return periods challenging. Estimating 200-year return levels is also complicated by having only ~60 years of comprehensive observational data. Such estimations of return periods are often performed using ‘catastrophe models’, which use complex calibration and tuning processes.  We have developed a reliable statistical model to estimate extreme windstorm gust speed return levels from only a multi-year sample of windstorm footprints without the need for the complexities associated with catastrophe models.


We have also been able to include variations of the NAO in our estimates, allowing for the generation of NAO-dependent return levels. Positive phases of the NAO result in larger return levels across the northwest of Europe. Additionally, the NAO is shown to be especially important for modulating low return period gusts, with the most extreme gusts occurring due to further stochastic processes. Using plausible future states of the NAO we also show that return levels have the potential to increase significantly in the next 100 years to rise well above historical uncertainty levels.

How to cite: Priestley, M., Stephenson, D., and Scaife, A.: Return levels of extreme European windstorms, their dependency on the NAO, and potential future risks, EGU General Assembly 2023, Vienna, Austria, 23–28 Apr 2023, EGU23-8138, https://doi.org/10.5194/egusphere-egu23-8138, 2023.

EGU23-8224 | ECS | Orals | NP1.2

Severe windstorm projections for Europe 

Nicholas James Leach, Gabriele Messori, Alex Crawford, Ryota Wada, Sally Woodhouse, and Claire Burke

Extreme windstorms are of considerable interest due to their potential to cause significant socio-economic damages over very large areas of land. As a result, understanding how climate change may affect the characteristics of the most severe storms is an important question for adaptation planing. However, projections of how the hazard associated with windstorms will change in the future are highly uncertain.

Here, we use an efficient statistical approach that characterises individual windstorms in terms of their intensity and exposure to estimate the present-day risk from such storms. We then use a methodology used widely in detection and attribution of climate change to assess how such characteristics may change into the future. Using windstorms simulated by a diverse set of high-resolution regional climate model projections for Europe, the EURO-CORDEX ensemble, we provide projections of risk over a range of future climate scenarios. Finally, we explore how the variety of driving and regional models influence the associated uncertainties, and how considering the performance and independence of the models can improve the robustness of the projections.

How to cite: Leach, N. J., Messori, G., Crawford, A., Wada, R., Woodhouse, S., and Burke, C.: Severe windstorm projections for Europe, EGU General Assembly 2023, Vienna, Austria, 23–28 Apr 2023, EGU23-8224, https://doi.org/10.5194/egusphere-egu23-8224, 2023.

EGU23-8244 | ECS | Posters on site | NP1.2

Predictability of blocking and zonal flow regimes  in a reduced-order land atmosphere coupled model 

Anupama K Xavier, Jonathan Demaeyer, and Stéphane Vannitsem

Low-frequency variability (LFV) encompasses atmospheric and climate processes on time scales from a few weeks to decades.​ This includes atmospheric blockings, heat waves, cold spells, and at longer time scales long-term oscillations like the MJO, the NAO, ENSO….. Better understanding of LFV, could contribute to improved long term forecasts​. Identifying and evaluating LFVs in GCMs is computationally expensive, so in this study an idealised low order coupled model is used. They are climate models ‘stripped to the bone’,  which links theoretical understanding to the complexity of more realistic models, made by key ingredients and approximations​; which hence helps us to study a particular phenomenon by tweaking the parameters affecting them with less computational cost​. 

The Quasi Geostrophic land atmosphere coupled model is a python implementation of mid-latitude atmospheric model​ with two layer quasi geostrophic channel atmosphere on beta -plane​ coupled to a simple land portion.  The system exhibits blocking conditions at different time scales depending on the incoming solar radiation and also experiences transitions from blocking to zonal flow after applying different sets of parameters to the model. The predictability and persistence of these regimes is investigated by calculating the local lyapunov exponents at the specified transition points and around them.  The findings are discussed in the perspective of the current literature on the predictability of blocking.

How to cite: K Xavier, A., Demaeyer, J., and Vannitsem, S.: Predictability of blocking and zonal flow regimes  in a reduced-order land atmosphere coupled model, EGU General Assembly 2023, Vienna, Austria, 23–28 Apr 2023, EGU23-8244, https://doi.org/10.5194/egusphere-egu23-8244, 2023.

EGU23-9105 | Orals | NP1.2

Effect of anthropogenic climate change on explosive cyclogenesis cases in Europe 

Mireia Ginesta, Emmanouil Flaounas, Pascal Yiou, and Davide Faranda

Mid-latitude storms are essential features of atmospheric variability in the cold season. The subsequent damages are caused by high wind speeds and heavy precipitation. Among such events, explosive cyclones can lead to extreme impacts when they make landfall. Climate change is affecting the underlying characteristics of such types of extremes. Being able to understand the way it modifies their dynamics is of great importance. In this work, we assess the influence of anthropogenic climate change on observed explosive cyclones in an Extreme Event Attribution framework using a large ensemble dataset. We evaluate three storms that hit different parts of Europe: Xynthia in February 2010, Alex in October 2020, and Eunice in January 2022. 

We use three ensembles of 35 members of the Community Earth System Model (CESM). We compare two periods of 6-hourly data: present-day climate [1991-2001] and future climate [RCP8.5 scenario, 2091–2101]. We find analogues of the trajectories of the three storms before their highest intensity in both periods. We do that by tracking all cyclones in the dataset and selecting the cyclone tracks that have the minimum Euclidean distance in km from the trajectories of Xynthia, Alex, and Eunice. We explore the characteristics of the analogues of the trajectories in both periods such as frequency of explosive cyclogenesis and intensity to evaluate whether the dynamics of the storms have been affected by climate change. We further compare the analogues in terms of precipitation and low-level wind in the regions of impact.

How to cite: Ginesta, M., Flaounas, E., Yiou, P., and Faranda, D.: Effect of anthropogenic climate change on explosive cyclogenesis cases in Europe, EGU General Assembly 2023, Vienna, Austria, 23–28 Apr 2023, EGU23-9105, https://doi.org/10.5194/egusphere-egu23-9105, 2023.

EGU23-9123 | ECS | Posters on site | NP1.2

Modeling vegetation response to climate in Africa at fine resolution: EarthNet2023, a deep learning dataset and challenge. 

Claire Robin, Christian Requena-Mesa, Vitus Benson, Lazaro Alonso, Jeran Poehls, Nuno Carvalhais, and Markus Reichstein

Droughts are a major disaster in Africa, threatening livelihoods through their influence on crop yields but also by impacting and weakening ecosystems. Modeling the vegetation state can help anticipate and reduce the impact of droughts by predicting the vegetation response over time. Forecasting the state of vegetation is challenging: it depends on complex interactions between the plants and different environmental drivers, which can result in both instantaneous and time-lagged responses, as well as spatial effects. Furthermore, modeling these interactions at the fine resolution of landscape scale can only rely on remote sensing observations, as in-situ measurements are not global and weather models have a coarse grid. With the increasing availability of remote sensing data, deep learning methods are a promising avenue for these spatiotemporal tasks. Here, we introduce both a dataset and a baseline deep neural network, modeling the vegetation response to climate at landscape scale in Africa.

EarthNet2021 [1] introduced leveraging self-supervised learning for satellite imagery forecasting based on coarse-scale weather in Europe. Here, we introduce EarthNet2023 with a more narrow focus on drought impacts in Africa. It contains over 45,000 Spatio-temporal minicubes (each 1.28x1.28km) at representative locations over the whole African continent. Alongside Sentinel-2 reflectance, ERA5 weather, and topography, it also contains Sentinel-1 backscatter, soil properties, and a long-term Normalized Difference Vegetation Index (NDVI) climatology based on Landsat. The latter allows evaluating models on vegetation anomalies, thereby including modeling of drought impacts. EarthNet2023 is intended as an open benchmark challenge, allowing multiple research groups to develop their approaches to drought impact modeling in Africa. 

As a baseline for EarthNet2023, we train a  Convolutional Long Short-Term Memory (ConvLSTM) deep learning model. Previous work has shown it is suitable for spatiotemporal satellite imagery forecasting [2, 3, 4]. The ConvLSTM baseline captures the seasonal evolution of NDVI over a wide range of vegetation types. General spatial patterns are well-captured as well as a first indication of skill during weather extremes is seen, although the accuracy of the predictions is inconsistent, and the confidence in the model is therefore too low. This suggests, with further development, deep learning approaches are promising for modeling vegetation evolution in Africa, potentially even up to the degree to support anticipatory action with drought impact modeling.


[1] Requena-Mesa, C., Benson, V., Reichstein, M., Runge, J., & Denzler, J. (2021). EarthNet2021: A large-scale dataset and challenge for Earth surface forecasting as a guided video prediction task. In CVPR 2021 (pp. 1132-1142).

[2] Diaconu, C. A., Saha, S., Günnemann, S., & Zhu, X. X. (2022). Understanding the Role of Weather Data for Earth Surface Forecasting Using a ConvLSTM-Based Model. In CVPR 2022 (pp. 1362-1371).

[3] Kladny, K. R. W., Milanta, M., Mraz, O., Hufkens, K., & Stocker, B. D. (2022). Deep learning for satellite image forecasting of vegetation greenness. bioRxiv.

[4] Robin, C., Requena-Mesa, C., Benson, V., Alonso, L., Poehls, J., Carvalhais, N., & Reichstein, M. (2022). Learning to forecast vegetation greenness at fine resolution over Africa with ConvLSTMs. In Tackling Climate Change with Machine Learning: workshop at NeurIPS 2022. 

How to cite: Robin, C., Requena-Mesa, C., Benson, V., Alonso, L., Poehls, J., Carvalhais, N., and Reichstein, M.: Modeling vegetation response to climate in Africa at fine resolution: EarthNet2023, a deep learning dataset and challenge., EGU General Assembly 2023, Vienna, Austria, 23–28 Apr 2023, EGU23-9123, https://doi.org/10.5194/egusphere-egu23-9123, 2023.

Loss and damage (L&D) has been on the international agenda for over 20 years, and recently gained significant headway at UNFCCC COP27. L&D has been a controversial aspect of the international climate negotiations. This is largely due to L&D being connected to responsibility and compensation for the impacts of climate change on vulnerable communities. Researchers and practitioners are beginning to ask how they can help with L&D while many remain unsure about what this may mean.

Loss and Damage (L&D) is associated with the adverse effects of climate change, including the effects that are related to extreme weather events, such as intense typhons, but also occur in slow events, such as at sea level rise. The paper sets out to synthesise three specific challenges to L&D: lack of a coherent definition of L&D, gaps in measuring disproportionate effects of loss and damage on people, including the non economic consequences of L&D events, who it affects, how and why, and on what scale, and finally, absence of coherent understanding of climate governance instruments to influence L&D in ways that do not undermine existing adaptation and development efforts.

How to cite: Boyd, E.: Recasting the disproportionate impacts of climate extremes, EGU General Assembly 2023, Vienna, Austria, 23–28 Apr 2023, EGU23-9492, https://doi.org/10.5194/egusphere-egu23-9492, 2023.

EGU23-9945 | Posters on site | NP1.2

Oceanic Maintenance of Atmospheric Blocking 

Jamie Mathews

In recent years the understanding of atmospheric blocking has changed from solely a dry phenomena to one that includes moist processes. The primary source of that moisture, the ocean, has, until recently, been neglected as a driver of this basin scale structure. Here, the connection between atmospheric blocking over the North Atlantic and the diabatic influence of the Gulf Stream was investigated using potential vorticity diagnostics. In line with previous research, the reliance atmospheric blocking has on latent heat fluxes over the Gulf Stream and its extension, for induction and maintenance, was shown to be significant. It was shown that not only is it more likely for a North Atlantic block to occur after significant surface latent heat fluxes over the Gulf Stream and its extension, but the resulting block is likely to be anchored on the western flank of the Atlantic, making it more stationary and hence, more impactful. Additionally, blocks that have a longer duration were highly associated with surface latent heat fluxes over the western boundary current, while shorter blocks were not, indicating a positive feedback from the oceanic mesoscale phenomena onto this basin scale structure. Finally, the frequency of the block was seen to correspond to the amount of surplus heat content in the western boundary currents prior to the blocking event which, in the North Atlantic, had leading order dependence on the heat transport via the Gulf Stream.

How to cite: Mathews, J.: Oceanic Maintenance of Atmospheric Blocking, EGU General Assembly 2023, Vienna, Austria, 23–28 Apr 2023, EGU23-9945, https://doi.org/10.5194/egusphere-egu23-9945, 2023.

EGU23-11943 | Orals | NP1.2 | Highlight

Simulating worst case  heatwaves during the Paris 2024 Olympics 

Pascal Yiou, Camille Cadiou, Davide Faranda, Aglaé Jézéquel, Nemo Malhomme, George Miloshevich, Robin Noyelle, Flavio Pons, Yoann Robin, and Mathieu Vrac

The Summer Olympic Games in 2024 will take place during the apex of the temperature seasonal cycle in the Paris Area. The midlatitudes of the Northern hemisphere have witnessed a few intense heatwaves since the 2003 epitome event. Those heatwaves have had environmental and health impacts, which often came as surprises. In this paper, we search for the most extreme heatwaves in Ile-de-France that are physically plausible, under climate change scenarios, for the decades around 2024. We apply a rare event algorithm on CMIP6 data to evaluate the range of such extremes. We find that the 2003 record can be exceeded by more than 4°C in Ile-de-France before 2050, with a combination of prevailing anticyclonic conditions and cut-off lows. This study intends to build awareness on those unprecedented events, against which our societies are ill-prepared. Those results could be extended to other areas of the world.

How to cite: Yiou, P., Cadiou, C., Faranda, D., Jézéquel, A., Malhomme, N., Miloshevich, G., Noyelle, R., Pons, F., Robin, Y., and Vrac, M.: Simulating worst case  heatwaves during the Paris 2024 Olympics, EGU General Assembly 2023, Vienna, Austria, 23–28 Apr 2023, EGU23-11943, https://doi.org/10.5194/egusphere-egu23-11943, 2023.

EGU23-12059 | ECS | Posters virtual | NP1.2

Present and projected humid heat exposure and precipitation extremes in Turkey 

Berkay Donmez, Kutay Donmez, Cemre Yuruk Sonuc, and Yurdanur Unal

Regional intensification of precipitation extremes and the emergence of humid heat stress conducive to periling vulnerable populations suggest the need for further nation-specific risk assessments. Here, we conduct the first analysis of present and projected population exposure to extreme wet-bulb temperature (Tw) values in Turkey and concurrently use the generalized extreme value (GEV) theory to model extreme precipitation based on multiple intensity, duration, and frequency metrics. Using simulations dynamically downscaled to 0.11-degree resolution via the COSMO-CLM model, we provide a nationwide picture of the trends in these metrics and derive the number of people exposed to Tw extremes based on the population estimates in the Shared Socioeconomic Pathways (SSPs) under the high-emission RCP 8.5 scenario. As part of the GEV analysis, our main goal is to show how precipitation extremes in Turkey evolve and transform due to the changing climate not only in stationary but also in non-stationary climate settings. Our results convey a detailed understanding of the potentially dangerous conditions across climatologically different regions of Turkey and are relevant for decision-makers.

How to cite: Donmez, B., Donmez, K., Yuruk Sonuc, C., and Unal, Y.: Present and projected humid heat exposure and precipitation extremes in Turkey, EGU General Assembly 2023, Vienna, Austria, 23–28 Apr 2023, EGU23-12059, https://doi.org/10.5194/egusphere-egu23-12059, 2023.

EGU23-12095 | ECS | Posters on site | NP1.2

Weakened impact of the Atlantic equatorial mode of variability on the future Guinea Coast extreme rainfall indices 

Koffi Worou, Thierry Fichefet, and Hugues Goosse

The Atlantic equatorial mode (AEM) is an interannual oceanic internal mode of variability which impacts the tropical circulation during its active phases in the boreal summer. A positive phase of the AEM is characterized by above-normal sea surface temperature anomalies in the eastern equatorial Atlantic which lead to positive rainfall anomalies over the Guinea Coast, a region located in the southern part of West Africa. The AEM appears as the leading oceanic driver of the Guinea Coast rainfall (GCR) during the monsoon season, and the AEM-GCR relation during the last century is stationary.  Moreover, extreme rainfall events over the Guinea Coast are also enhanced by the AEM-positive phases.  Therefore, there is a need to study how the relationship between the AEM and extreme rainfall indices would change under future global warming. The present work assesses this relationship between the AEM and the Guinea Coast extreme rainfall indices in the historical simulations performed by 24 General Circulation Models (GCMs) participating in the sixth phase of the Coupled Models Intercomparison Project (CMIP6). Results indicate that the extreme rainfall responses to the AEM under present-day climate conditions are qualitatively well reproduced by the GCMs in the 1995-2014 period, although there are substantial biases in their magnitudes.  For the future changes, we consider the CMIP6 Shared Socio-economic pathway 5-8.5 (SSP5-8.5) simulations and three different periods: the near-term (2021-2040), the mid-term (2041-2060) and the long-term (2080-2099).  Relative to the present-day period, our results indicate an overall gradual increase with time in the mean and variability of the different extreme indices for the Guinea Coast. However, the future influence of the AEM on the extreme rainfall indices decreases with time, which is in line with the projected decrease in the future AEM variability.

How to cite: Worou, K., Fichefet, T., and Goosse, H.: Weakened impact of the Atlantic equatorial mode of variability on the future Guinea Coast extreme rainfall indices, EGU General Assembly 2023, Vienna, Austria, 23–28 Apr 2023, EGU23-12095, https://doi.org/10.5194/egusphere-egu23-12095, 2023.

EGU23-12130 | ECS | Orals | NP1.2 | Highlight

A probabilistic assessment of extreme weather event impacts on crop yield in Germany 

Federico Stainoh, Julia Moemken, and Joaquim Pinto

The impacts of extreme weather on the agricultural sector are a global concern in a changing climate. In recent years, single and compound weather extremes have increased in frequency, intensity and duration and are expected to worsen in the upcoming decades. Therefore, it is necessary to have a better understanding of extreme weather-related crop yield shock to ensure food security in a growing worldwide population. In this study, we employed a logistic regression model to quantify the risk of major crop yield shocks associated with heat stress, extreme precipitation and frosts. We used reported sub-national level data from Germany and a percentile-based threshold to define yield shock. Climate extreme drivers were based on statistical thresholds over daily maximum temperature, minimum temperature and precipitation. In addition to this,  we investigated how the seasonal meteorological pre-conditions of temperature and precipitation can modulate extreme weather-related yield shock.

How to cite: Stainoh, F., Moemken, J., and Pinto, J.: A probabilistic assessment of extreme weather event impacts on crop yield in Germany, EGU General Assembly 2023, Vienna, Austria, 23–28 Apr 2023, EGU23-12130, https://doi.org/10.5194/egusphere-egu23-12130, 2023.

EGU23-13507 | Orals | NP1.2

Using Artificial Intelligence to Reconstruct Missing Climate Data In Extreme Events Datasets 

Étienne Plésiat, Robert Dunn, Markus Donat, Colin Morice, Thomas Ludwig, Hannes Thiemann, and Christopher Kadow

Evaluating the trends of extreme indices (EI) is crucial to detect and attribute extreme events (EE) and establish adaptation and mitigation strategies to the current and future climate conditions. However, the observational climate data used for the calculation of these indices often contains many missing values and leads to incomplete and inaccurate EI. This problem is even greater as we go back in time due to the scarcity of the older measurements.

To tackle this problem, interpolation techniques such as the kriging method are often used to fill in the gaps. However, it has been shown that such techniques are inadequate to reconstruct specific climatic patterns [1]. Deep-learning based technologies give the possibility to surpass standard statistical methods by learning complex patterns and features in climate data.

In this work, we are using an inpainting technique based on a U-Net neural network made of partial convolutional layers and a loss function designed to produce semantically meaningful predictions [1]. Models are trained using vast amounts of climate model data and can be used to reconstruct large and irregular regions of missing data with few computational resources.

The efficiency of the method is well demonstrated through its application to the HadEX3 dataset [2]. This dataset contains gridded land surface EI, among which the TX90p index that measures the monthly (or annual) frequency of warm days (defined as a percentage of days where daily maximum temperature is above the 90th percentile). As for other EI, there is a lack of TX90p values in many regions of the world, even in recent years. It is particularly true when looking at an intermediate product of HadEX3 where the station-based indices have been combined without interpolation. This is illustrated by the left map of the figure where the gray pixels correspond to missing values. By training our model using data from the CMIP6 archive, we have been able to reconstruct the missing TX90p values for all the time steps of HadEX3 (see right map in the figure) and detect EE that were not included in the original dataset. The reconstructed dataset is being prepared for the community in the framework of the H2020 CLINT project [3] for further detection and attribution studies.

[1] Kadow C. et al., Nat. Geosci., 13, 408-413 (2020)
[2] Dunn R.J.H. et al., J. Geophys. Res. Atmos., 125, 1 (2020)
[3] https://climateintelligence.eu/

How to cite: Plésiat, É., Dunn, R., Donat, M., Morice, C., Ludwig, T., Thiemann, H., and Kadow, C.: Using Artificial Intelligence to Reconstruct Missing Climate Data In Extreme Events Datasets, EGU General Assembly 2023, Vienna, Austria, 23–28 Apr 2023, EGU23-13507, https://doi.org/10.5194/egusphere-egu23-13507, 2023.

EGU23-14675 | ECS | Posters on site | NP1.2

Indirect and direct impacts of Typhoon In-Fa (2021) on heavy precipitation in inland and coastal areas of China: Synoptic-scale environments and return period analysis 

Liangyi Wang, Xihui Gu, Louise J. Slaster, Yangchen Lai, Xiang Zhang, Dongdong Kong, Jianyu Liu, and Jianfeng Li

Typhoon In-Fa in 2021 produced an indirect heavy precipitation event (HPE) in central China well over a thousand kilometers away from its center, as well as a direct HPE in eastern China near its eyewall, inner and outer spiral rainbands. Both indirect and direct HPEs of Typhoon In-Fa caused severe impacts on the society. However, the synoptic-scale environments and the impacts of return period estimations of these HPE events remain poorly understood. Here, we first evaluated the spatio-temporal evolution of the two HPEs indirectly and directly induced by Typhoon In-Fa, then examined the synoptic patterns during Typhoon In-Fa for both HPEs in central and eastern China, and finally analyzed how the Typhoon In-Fa-induced HPEs affected local return period estimations of precipitation extremes. Our results show that the remote HPE over central China ~2,200 km ahead of Typhoon In-Fa was a typical predecessor rain event (PRE). A low-level southeasterly jet conveyed abundant moisture from the vicinity of Typhoon In-Fa to central China. Abundant moisture experienced strong convergence and was forced ascent, which caused frontogenesis on the windward slope due to the impacts of orographic forcing, thereby the occurrence of PRE in central China. The PRE occurred beneath the equatorward entrance of the upper-level westerly jet. Meanwhile, Typhoon In-Fa and the PRE favored divergently and adiabatically driving outflow in the upper level, and thus intensified the upper-level westerly jet. In eastern China, the HPE occurred in areas situated less than 200 km from Typhoon In-Fa’s center and left of Typhoon In-Fa’s propagation. The persistent HPE was primarily due to the long duration and slow movement of Typhoon In-Fa. On the one hand, favorable thermodynamic and dynamic conditions, and abundant atmospheric moisture favored the maintenance of Typhoon In-Fa intensity. On the other hand, a saddle-shaped pressure field in the north of eastern China and peripheral weak steering flow impeded Typhoon In-Fa’s movement northward. From the perspective of hydrological impacts, indirect and direct HPEs induced by Typhoon In-Fa led to decreases in return period estimates of HPEs (especially in central China), indicating that such extreme HPEs might increase the failure risk of engineering operations. These results suggest that anomalous HPEs remotely triggered by TCs require improved early warnings, and that more attention should be paid to such HPEs when estimating the design values of hydraulic infrastructure.

How to cite: Wang, L., Gu, X., Slaster, L. J., Lai, Y., Zhang, X., Kong, D., Liu, J., and Li, J.: Indirect and direct impacts of Typhoon In-Fa (2021) on heavy precipitation in inland and coastal areas of China: Synoptic-scale environments and return period analysis, EGU General Assembly 2023, Vienna, Austria, 23–28 Apr 2023, EGU23-14675, https://doi.org/10.5194/egusphere-egu23-14675, 2023.

EGU23-14838 | Orals | NP1.2

Freva for ClimXtreme: an aid to get the bigger picture in analysis of extremes 

Etor E. Lucio-Eceiza, Christopher Kadow, Martin Bergemann, Andrej Fast, Hannes Thiemann, and Thomas Ludwig


The number of damaging events caused by natural disasters is increasing because of climate change. Projects of public interest such as ClimXtreme (Climate Change and Extreme Events [1, 2]), aim to improve our knowledge of extreme events, the influence of environmental changes and their societal impacts.

ClimXtreme focuses on an integral evaluation through a three-pronged approach, namely: the physical processes behind the extremes, the statistical assessment of them, and their impact. The success of such a project depends on a coordinate effort from many interdisciplinary groups down to the management of computational and data storage resources. The ever-growing amount of available data at the researcher’s disposal is a two-sided blade that craves for greater resources to host, access, and evaluate them efficiently through High Performance Computing (HPC) infrastructures. Additionally, these last years the community is demanding an easier reproducibility of evaluation workflows and data FAIRness [3]. Frameworks like Freva (Free Evaluation System Framework [4, 5]) offer an efficient solution to handle customizable evaluation systems of large research projects, institutes or universities in the Earth system community [6-8] over the HPC environment and in a centralized manner. Mainly written on python, Freva offers:

  • A centralized access. Freva can be accessed via command line interface, via web, and via python module (e.g. for jupyter notebooks) offering similar features.
  • A standardized data search. Freva allows for a quick and intuitive incorporation and search of several datasets stored centrally.
  • Flexible analysis. Freva provides a common interface for user defined data evaluation routines to plug them in to the system irrespective of the programming language. These plugins are able to search from and integrate own results back to Freva. This environment enables an ecosystem of plugins that fosters the interchange of results and ideas between researchers, and facilitates the portability to any other research project that uses a Freva instance.
  • Transparent and reproducible results. Every analysis run through Freva (including parameter configuration and plugin version information) is stored in a central database and can be consulted, shared, modified and re-run by anyone within the project. Freva optimizes the usage of computational and storage resources and paves the way of traceability in line with FAIR data principles.

Hosted at the DKRZ, ClimXtreme’s Freva instance (XCES [7]) offers quick access to more than 9 million datafiles of models (e.g. CMIP, CORDEX), observations (stations, gridded) and evaluation outputs. The ClimXtreme community has been actively contributing with plugins to XCES, its biggest asset, with close to 20 plugins of different disciplines at the disposal of everyone within the project, and more than 20,000 analysis run through the system. At present, any researcher can focus on a past, present or future period and a geographical region and run a series of evaluations ranging from coocurrence probabilities of extreme events, their impact on crops to wind tracking algorithms among many others. Freva facilitates comprehensive and exhaustive analysis of extreme events in an easy way.


References:

[1] https://www.fona.de/de/massnahmen/foerdermassnahmen/climxtreme.php

[2] https://www.climxtreme.net/index.php/en/

[3] https://www.go-fair.org/fair-principles/

[4] http://doi.org/10.5334/jors.253

[5] https://github.com/FREVA-CLINT/freva-deployment

[6] freva.met.fu-berlin.de

[7] https://www.xces.dkrz.de/

[8] www-regiklim.dkrz.de


How to cite: Lucio-Eceiza, E. E., Kadow, C., Bergemann, M., Fast, A., Thiemann, H., and Ludwig, T.: Freva for ClimXtreme: an aid to get the bigger picture in analysis of extremes, EGU General Assembly 2023, Vienna, Austria, 23–28 Apr 2023, EGU23-14838, https://doi.org/10.5194/egusphere-egu23-14838, 2023.

EGU23-14879 | ECS | Posters on site | NP1.2 | Highlight

Assessing recent trends in globally co-occurring hot, dry and wet events under climate change 

Bianca Biess, Lukas Gudmundsson, and Sonia I. Seneviratne

The spring-to-summer seasons in recent years were characterized by co-occurring hot, dry, and wet extremes around the globe, leading to questions about the contribution of human-induced global warming to the changing likelihoods of such extreme years.  Here we investigate recent trends in the fraction of global (and regional) land-area that is affected by hot days, wet days and dry months. Observed trends are put into context of Earth System Model (ESM) ensemble simulations accounting for present day and pre-industrial climate conditions in a detection and attribution setting. The analysis is applied to the global land area as well as to the regions defined in the sixth IPCC assessment report. Results show that on a global scale as well as on a regional level, observed trends of co-occurring hot, dry and wet events cannot be explained by internal climate variability, but are only captured by model simulations that account for anthropogenic changes in the composition of the atmosphere. Thus, the results show that recent global trends in spatially co-occuring hot and dry extremes are very likely linked to anthropogenic climate change.

How to cite: Biess, B., Gudmundsson, L., and Seneviratne, S. I.: Assessing recent trends in globally co-occurring hot, dry and wet events under climate change, EGU General Assembly 2023, Vienna, Austria, 23–28 Apr 2023, EGU23-14879, https://doi.org/10.5194/egusphere-egu23-14879, 2023.

EGU23-15813 | ECS | Posters on site | NP1.2

Delayed Effects of ENSO and Indian Ocean Dipole on the ensuing-summer extreme precipitation over Yangtze River Valley 

Yucong Lin, Silvio Gualdi, and Enrico Scoccimarro

Yangtze River Valley (YRV) locates in Southeast China, is home to about a third of the population in China. Summer extreme precipitation in Yangtze River can lead to extensive social problems and loss of lives. Understanding the characteristics of extreme precipitation and identifying the possible driving factors can increase our ability to plan for, manage and respond to related extreme events over the YRV. This study applies ERA5 data during the period of 1950~2021 to examine the possible influence of ENSO and the sea surface temperature (SST) variability over the Indian Ocean domain on the interannual variability of the extreme precipitation over the YRV. The related physical processes that link the summer Yangtze River extreme precipitation, ENSO and Indian Ocean Dipole (IOD) are investigated.

Using composites analysis and Pearson correlation method, we found that both ENSO and IOD have delayed effects on summer extreme precipitation over the YRV, warm ENSO events and positive IOD phases are in favor of increased extreme precipitation in the subsequent summers, and vice versa. The anomalous anticyclone over the western Pacific Ocean (WNPAC) is the key factor in altering the inter-annual variability of extreme precipitation over the YRV. By comparing the extreme precipitation composites with different ENSO-IOD coupling events, we found that the signals of enhanced extreme precipitation are significant when El Niño occurs with a positive phase of IOD in the previous winter. The results based on the large circulation patterns also support that IOD plays an essential role in modulating the WNPAC. Our research highlights the need for a fundamental exploration into air-sea interactions over the tropical Pacific associate to ENSO-IOD coupling modes, our understanding in learning the impacts of these modes of variability on precipitation extremes over the YRV will contribute to improve the predictability of extreme events over this region.

Keywords:

Yangtze River Valley, extreme precipitation, ENSO, IOD, western North Pacific anomalous anticyclone 

How to cite: Lin, Y., Gualdi, S., and Scoccimarro, E.: Delayed Effects of ENSO and Indian Ocean Dipole on the ensuing-summer extreme precipitation over Yangtze River Valley, EGU General Assembly 2023, Vienna, Austria, 23–28 Apr 2023, EGU23-15813, https://doi.org/10.5194/egusphere-egu23-15813, 2023.

The climate and weather over Europe and Asia are strongly influenced by the large-scale atmospheric circulation over the North Atlantic area. During the winter of 2009/10, the usually separate Atlantic and African jets merged into one zonal jet, resulting in unusually cold and wet conditions in Eurasian regions. During this winter the jet was unusually persistent, with characteristics more typical of the Pacific jet stream, which is a mixed thermally-eddy driven jet, suggesting the jet underwent a rare dynamical regime change.  Such a merging was only observed to occur for a whole winter during winters of 1968-69 and 1969-70. In this study, we apply GKTL rare event algorithm to produce an ensemble of PlaSim model runs of similar winter flow conditions, to study such merged jet (mixed thermally-eddy driven jet) transition and its dynamics. We try to understand how the initial conditions during the beginning of the winter could affect the jet to be in a persistent merged state. It is seen that there is a larger probability to continue in a merged jet state if there is a merged jet state at the beginning of winter. Similarly, there is a larger probability to continue in an eddy-driven jet state if there is an eddy-driven jet state at the beginning of winter. On comparing the ensemble of merged jet winter trajectories with the ensemble of eddy-driven jet winter trajectories there is a significant weakening of eddy heat fluxes over the west and central North Atlantic region. Also, the typically poleward-directed eddy momentum fluxes are significantly weaker during the winter merged jet state with small increases in the subtropics over the eastern North Atlantic due to the equatorward shift of the eddies.

How to cite: Suresan, S. and Harnik, N.: Computing and analyzing persistent merged jet state in climate model using rare event algorithm, EGU General Assembly 2023, Vienna, Austria, 23–28 Apr 2023, EGU23-16917, https://doi.org/10.5194/egusphere-egu23-16917, 2023.

CL3.2 – Climate and Society

EGU23-950 | ECS | Orals | CL3.2.1

Definitions and implications of climate-neutral aviation 

Nicoletta Brazzola, Anthony Patt, and Jan Wohland

To meet ambitious climate targets, the aviation sector needs to neutralize CO2 emissions and reduce non-CO2 climatic effects. Despite being responsible for approximately two-thirds of aviation’s impacts on the climate, most aviation non-CO2 species are currently excluded from climate mitigation efforts. Here we identify three plausible definitions of climate-neutral aviation that include non-CO2 forcing and assess their implications considering future demand uncertainty, technological innovation, and CO2 removal. We use empirical relationships to translate aviation emissions to climate forcing and a reduced-complexity climate model to assess the impacts of these climate neutrality frameworks, including the needed CO2 removal, on global temperature in the context of the different demand and technology scenarios. We demonstrate that simply neutralizing aviation’s CO2 emissions, if nothing is done to reduce non-CO2 forcing, causes up to 0.4 °C additional warming, thus compromising the 1.5 °C target. We further show that substantial rates of CO2 removal are needed to achieve climate-neutral aviation in scenarios with little mitigation, yet cleaner-flying technologies can drastically reduce them. Our work provides policymakers with consistent definitions of climate-neutral aviation and highlights the beneficial side effects of moving to aircraft types and fuels with lower indirect climate effects.

How to cite: Brazzola, N., Patt, A., and Wohland, J.: Definitions and implications of climate-neutral aviation, EGU General Assembly 2023, Vienna, Austria, 23–28 Apr 2023, EGU23-950, https://doi.org/10.5194/egusphere-egu23-950, 2023.

EGU23-1240 | ECS | Orals | CL3.2.1 | Highlight

Does net-zero CO2 stabilize the climate? - On the contributions of the remaining climate forcing 

Estela Monteiro and Nadine Mengis

The Paris Agreement long-term temperature goal (Paris Agreement LTTG) aims to limit global warming to well below 2ºC, if possible to a maximum of 1.5ºC. To understand how this goal could be accomplished, idealized scenarios have been explored in the past years, with a special focus on pathways for reaching net-zero CO2 emissions. 

Non-CO2 forcing is, however, known to contribute to a decrease in the remaining carbon budgets related to the Paris Agreement LTTG (e.g., Mengis & Matthews, 2020). A full picture regarding this benchmark can therefore only be painted when including the effects of aerosols, non-CO2 greenhouse gases and land use changes. These forcings along with the zero emissions commitment to CO2 will define whether temperature is able to stabilize once CO2 emissions decrease.  

To explore individual effects from anthropogenic non-CO2 forcing agents, their respective contributions to the Paris Agreement LTTG scenarios (Rogelj, et al., 2019) is estimated and put into relation. We will present results primarily on the impacts of aerosols and land use change representation as well as their effects on the carbon cycle and climate by simulating LTTG scenarios using an Earth system model of intermediate complexity (UVic ESCM, version 2.10, Mengis et al., 2020). The climate response in these all forcing net-zero CO2 emission scenarios will provide us with relevant insights concerning allowable emissions for temperature stabilization.

References: 

Mengis, N., Matthews, H.D. Non-CO2 forcing changes will likely decrease the remaining carbon budget for 1.5 °C. npj Clim Atmos Sci 3, 19 (2020). https://doi.org/10.1038/s41612-020-0123-3

Mengis, N., Keller, D. P., MacDougall, A. H. et al. Evaluation of the University of Victoria Earth System Climate Model version 2.10 (UVic ESCM 2.10). Geosci. Model Dev. 13, 4183–4204 (2020). https://doi.org/10.5194/gmd-13-4183-2020  

Rogelj, J., Huppmann, D., Krey, V. et al. A new scenario logic for the Paris Agreement long-term temperature goal. Nature 573, 357–363 (2019). https://doi.org/10.1038/s41586-019-1541-4

How to cite: Monteiro, E. and Mengis, N.: Does net-zero CO2 stabilize the climate? - On the contributions of the remaining climate forcing, EGU General Assembly 2023, Vienna, Austria, 23–28 Apr 2023, EGU23-1240, https://doi.org/10.5194/egusphere-egu23-1240, 2023.

EGU23-1664 | ECS | Posters on site | CL3.2.1 | Highlight

Irreversible changes in surface temperature and precipitation to CO2 forcing 

Soong-Ki Kim, Jongsoo Shin, Soon-Il An, Hyo-Jeong Kim, Nari Im, Shang-Ping Xie, Jong-Seong Kug, and Sang-Wook Yeh

Anthropogenic global warming by carbon dioxide emissions may cause irreversible changes in a wide range of climate variables. A comprehensive understanding of this hysteresis effect and its regional patterns is, however, lacking. Here, we use the Community Earth System Model version 1.2 with a CO2 removal scenario to show that surface temperature and precipitation exhibit globally widespread irreversible changes. To explore the climate hysteresis and reversibility on a regional scale, we develop a novel method that quantifies their spatial patterns. Our experiments project that 89% and 58% of the global area experiences irreversible changes in surface temperature and precipitation, respectively. Strong irreversible response of surface temperature is found in the Arctic, Southern Ocean, and North Atlantic Ocean and of precipitation in the global monsoon regions, tropical Pacific, and the Himalayas. The identified global land hotspots of irreversible changes can indicate elevated risks of negative impacts on developing countries.

How to cite: Kim, S.-K., Shin, J., An, S.-I., Kim, H.-J., Im, N., Xie, S.-P., Kug, J.-S., and Yeh, S.-W.: Irreversible changes in surface temperature and precipitation to CO2 forcing, EGU General Assembly 2023, Vienna, Austria, 23–28 Apr 2023, EGU23-1664, https://doi.org/10.5194/egusphere-egu23-1664, 2023.

EGU23-1691 | ECS | Orals | CL3.2.1

Emissions pathways change how abnormal climatic conditions de-emerge beyond net-zero 

Hunter Douglas, Dave Frame, and Laura Revell

As more and more countries set net-zero targets and progress is made on decarbonising industries, the prospect of achieving a net-zero (or even net-negative) emissions world is beginning to come into focus. Our current understanding, however, is that the climate will not immediately stabilise everywhere under such conditions. Understanding where and how the climate will change in a net-zero world is important for adaptation planning and goal setting. Climate change emergence techniques are useful for quantifying change relative to what people and ecosystems are accustomed to. However, to date these techniques have been little used to assess climate change at and beyond net-zero emissions. Whether or not aspects of the climate system “de-emerge” and return to within baseline variability remains under-explored. In this work, we use CMIP6 models to quantify climate change emergence in terms of signal-to-noise for annual- and seasonal-average temperature and precipitation, as well as strength and position of the eddy-driven jets.

Applying this framework, we calculate the rate and extent of de-emergence that occurs when carbon dioxide concentrations fall. We first combine results from multiple models participating in the Carbon Dioxide Removal Model Intercomparison Project (CDRMIP) to establish global and regional behaviour for these variables under an idealised rising/falling CO2 scenario. We then apply the same analysis to multiple models’ results for ScenarioMIP emissions pathways with net-negative CO2 emissions (SSP1-1.9, SSP1-2.6, SSP4-3.4, and SSP5-3.4). We find that both temperature and precipitation exhibit partial reversibility on the scale of decades to centuries, albeit with significant hysteresis due to lag effects. These patterns are clearly apparent in the CDRMIP results and less so for the SSPs. There are significant regional differences in the rate and extent of de-emergence, including a strong land-sea contrast. The jet parameters, in contrast, respond quickly to greenhouse gas and other forcings, and so do not exhibit comparable hysteresis. Those models with data extending beyond 2100 allow for better quantification of de-emergence. CO2 peak concentrations and rates of change both influence the stable climate state, though disentangling these factors remains challenging.  

How to cite: Douglas, H., Frame, D., and Revell, L.: Emissions pathways change how abnormal climatic conditions de-emerge beyond net-zero, EGU General Assembly 2023, Vienna, Austria, 23–28 Apr 2023, EGU23-1691, https://doi.org/10.5194/egusphere-egu23-1691, 2023.

EGU23-4447 | Orals | CL3.2.1

Adaptive emission reduction approach to reach any global warming target 

Thomas Frölicher, Jens Terhaar, Mathias Aschwanden, Pierre Friedlingstein, and Fortunat Joos

The parties of the Paris Agreement agreed to keep global warming well below 2°C and pursue efforts to limit it to 1.5°C. A global stocktake is instituted to assess the necessary emissions reductions every 5 years. Here we present an adaptive approach to successively quantify global emissions reductions that allow reaching a temperature target within ±0.2°C, solely based on regularly updated observations of past temperatures, radiative forcing and emissions statistics, and not on climate model projections. Testing this approach using an Earth system model of intermediate complexity demonstrates that defined targets can be reached following a smooth emissions pathway. Its adaptive nature makes the approach robust against inherent uncertainties in observational records, climate sensitivity, effectiveness of emissions reduction implementations and the metric to estimate CO2 equivalent emissions. This approach allows developing emission trajectories for CO2, CH4, N2O and other agents that iteratively adapt to meet a chosen temperature target.

How to cite: Frölicher, T., Terhaar, J., Aschwanden, M., Friedlingstein, P., and Joos, F.: Adaptive emission reduction approach to reach any global warming target, EGU General Assembly 2023, Vienna, Austria, 23–28 Apr 2023, EGU23-4447, https://doi.org/10.5194/egusphere-egu23-4447, 2023.

EGU23-4638 | ECS | Orals | CL3.2.1

A model-based estimate of the climate and carbon cycle response to negative CO2 emissions over multi-centennial timescales 

Koramanghat Unnikrishnan Jayakrishnan and Govindasamy Bala

Anthropogenic emissions of carbon dioxide since the beginning of industrialization have led to an increase in global surface temperature. This rapid increase in global surface temperature is unprecedented over the past 2000 years. The increase in frequency of natural disasters such as extreme rainfall, floods and heatwaves indicate that immediate action is required to prevent further impact of climate change. The Paris agreement targets to keep warming below 2°C above the preindustrial state, while pursuing efforts to limit the increase to 1.5°C . While climate mitigation strategies such as reducing fossil fuel emissions and deforestation are currently implemented, recent studies show that artificially removing atmospheric CO2 (negative emissions) might be necessary to achieve the targets set by the Paris agreement. Therefore, understanding the response of climate system towards artificial removal of atmospheric CO2 or equivalently negative emissions is essential.

In this study, using a coupled climate and carbon cycle model, we simulate the response of the climate system to net negative emissions in 9 idealized simulations each having a positive emission phase and an equal and opposite negative emission phase such that the cumulative emissions since preindustrial period is zero in each simulation. We specifically address the following two questions: 1) For the same total emissions in the positive phase, does the timescale of emissions have any impact on the long-term response of the climate system? 2) If the timescale of emissions is the same, what is the sensitivity to the magnitude of total emissions in the positive phase? The results from our nine climate-carbon model simulations will be discussed at the meeting.

How to cite: Jayakrishnan, K. U. and Bala, G.: A model-based estimate of the climate and carbon cycle response to negative CO2 emissions over multi-centennial timescales, EGU General Assembly 2023, Vienna, Austria, 23–28 Apr 2023, EGU23-4638, https://doi.org/10.5194/egusphere-egu23-4638, 2023.

EGU23-5097 | Orals | CL3.2.1 | Highlight

Investigating the implications of net-zero emissions at different global warming levels 

Tilo Ziehn, Andrew King, Josephine Brown, Liam Cassidy, and Alexander Borowiak

To stop global warming, humanity needs to achieve close to net-zero greenhouse gas emissions. Many countries are committed to reducing greenhouse gas emissions significantly over the next decade and to reaching net-zero emissions by 2050, in line with the Paris Agreement goal of limiting global warming well below 2°C above pre-industrial levels. This can only be achieved through deep decarbonization and removal of carbon dioxide from the atmosphere. However, many questions remain about the long-term implications of stabilising global temperatures at the Paris Agreement goals or missing this target but stabilising the climate at a higher global warming level.

We have run bespoke millennium-length simulations with the Australian Earth System Model, ACCESS-ESM1.5, under net-zero emissions at different global warming levels ranging from about 1.5°C to 3°C. Here, we discuss these simulations and analyse the evolution of temperature, precipitation and carbon budgets. We will present results on the linearity of local climate changes under different stabilised global warming levels and how these compare with local changes in rapidly warming climates. We will also discuss the processes that cause these local non-linearities and raise opportunities for research that these simulations provide.

We must gain a better understanding of potential future climates which evolve under near-zero greenhouse gas emissions. Policymaking is based on achieving net-zero emissions and we hope our work and similar analyses can increase understanding of a changing climate under net-zero scenarios.

How to cite: Ziehn, T., King, A., Brown, J., Cassidy, L., and Borowiak, A.: Investigating the implications of net-zero emissions at different global warming levels, EGU General Assembly 2023, Vienna, Austria, 23–28 Apr 2023, EGU23-5097, https://doi.org/10.5194/egusphere-egu23-5097, 2023.

EGU23-5881 | Orals | CL3.2.1 | Highlight

Betting on CDR under uncertain climate sensitivity is bad climate policy 

Joonas Merikanto, Theresa Schaber, Antti-Ilari Partanen, and Tommi Ekholm

Climate change mitigation strategies consistent with the Paris Agreement’s temperature targets rely heavily on future carbon dioxide removal (CDR). Although such strategies have drawn considerable critique for long, e.g., that they are ‘betting on negative emissions’, the risks from this betting have not been quantified nor addressed properly. We use a lightweight integrated assessment model SCORE to explore possible scenarios using CDR for limiting global warming to 1.5 °C by 2100. Particularly, we quantify the impacts of relying on CDR when accounting for 1) possible under- and overestimation of the cost, potential, and availability (feasibility) of future CDR and 2) the compound effect with uncertainty in climate sensitivity.

All scenario results unquestionably show that aggressive near-term mitigation is required for limiting warming to 1.5 °C by 2100 for all levels of climate sensitivity, but that some amount of CDR is likely required in the future even if climate sensitivity turns out to be extremely low. If uncertainty in climate sensitivity is disregarded, initial assumptions on the CDR feasibility have only minor effects on the total cumulative mitigation cost. However, taking the uncertainty in climate sensitivity into account changes this conclusion. Wrong assumptions on CDR feasibility can, surprisingly, even lead to lower costs under extreme realizations of climate sensitivity, especially in scenarios where CDR feasibility is underestimated. Assuming low feasibility for CDR eliminates the possibility of sky-rocketing costs associated with overestimating CDR feasibility in combination with a high climate sensitivity. Therefore, a prudent climate policy should assume a low feasibility of CDR to reduce the risk of leaving runaway mitigation costs to future generations.

How to cite: Merikanto, J., Schaber, T., Partanen, A.-I., and Ekholm, T.: Betting on CDR under uncertain climate sensitivity is bad climate policy, EGU General Assembly 2023, Vienna, Austria, 23–28 Apr 2023, EGU23-5881, https://doi.org/10.5194/egusphere-egu23-5881, 2023.

EGU23-6073 | ECS | Posters on site | CL3.2.1

Emissions pathways compatible with 1.5ºC and 2ºC stabilized warming in fully-coupled Earth System Models: first results from AERA-MIP 

Yona Silvy, Jens Terhaar, Friedrich Burger, Fortunat Joos, Myles Allen, Victor Brovkin, Jonathan Buzan, Goran Georgievski, Fabrice Lacroix, Donghyun Lee, and Thomas Frölicher

Climate policies such as the Paris Agreement are framed in terms of global warming levels. Based on past warming and past CO2 emissions, the amount of future cumulative CO2 emissions allowed to keep global warming at or below a global warming level can be estimated. Yet, global warming scenarios in the successive Coupled Model Intercomparison Projects are framed in terms of prescribed atmospheric CO2 concentration or emissions, yielding a wide range of warming levels per CO2 pathway in response to the different transient climate responses to cumulative emissions in the coupled climate models. Based on these scenarios and the latest model projections, the IPCC Sixth Assessment Report assessed climatic impacts of different warming levels. These impacts are thus evaluated in simulations where the warming targets are passed transiently, at different points in time, and not stabilized, as opposed to how climate agreements are framed.

Here, we propose a new Model Intercomparison Project AERA-MIP building on an adaptive approach - the Adaptive Emissions Reduction Approach - that successively calculates the compatible emissions to stabilize global warming at the required temperature target. Earth System Models (ESMs) are run forward in emission-driven mode, with prescribed, model-specific emissions successively calculated every five years, so that all models reach the same warming target and thereafter stabilize at this warming level. The warming uncertainty is thus side-stepped, while different emissions pathways emerge out of the variety of participating ESMs. The approach is based on the TCRE framework and successively adapting for any changes in the Earth System that might affect global mean surface temperature, including the zero emissions commitment as emissions approach zero.

Simulations of the first participating modelling centers already reveal a panel of emissions pathways that successfully stabilize global warming at 1.5ºC and 2ºC. This includes the decline rate from peak emissions, the timing of having to reach net-zero emissions, and the magnitude of negative emissions needed to stabilize the climate. These different emissions pathways result in a range of atmospheric CO2 concentration evolution (350 to 450 ppm at year 2100 in the 1.5°C stabilization scenario) and distribution of anthropogenic carbon in the Earth System components. Unlike concentration-driven projections, these AERA simulations provide an uncertainty range for impacts that are directly affected by atmospheric CO2 concentration such as ocean acidification. The project also includes temporary temperature overshoot simulations using the AERA approach.

How to cite: Silvy, Y., Terhaar, J., Burger, F., Joos, F., Allen, M., Brovkin, V., Buzan, J., Georgievski, G., Lacroix, F., Lee, D., and Frölicher, T.: Emissions pathways compatible with 1.5ºC and 2ºC stabilized warming in fully-coupled Earth System Models: first results from AERA-MIP, EGU General Assembly 2023, Vienna, Austria, 23–28 Apr 2023, EGU23-6073, https://doi.org/10.5194/egusphere-egu23-6073, 2023.

EGU23-6566 | Posters on site | CL3.2.1

Levers of climate pledges influencing the Paris Agreement target 

Kushal Tibrewal, Katsumasa Tanaka, Olivier Boucher, and Philippe Ciais

Countries pledge GHG mitigation goals in form of near-term emissions targets for 2030, long-term net-zero emissions in mid-century (some countries) and targets for methane emission reductions, towards limiting global warming as stipulated in the Paris Agreement. These undergo regular revisions to strengthen the ambition, with the latest set of revisions occurring during COP26 and COP27. As of December 2022, 169 countries have near-term targets, 56 have long-term targets to become carbon neutral and 150 nations have pledged to reduce their methane emissions up to 30% by 2030.  The end-of-century temperature rise is highly sensitive to the pledges but also to actual extent of implementation of these pledges. Using historical emissions from the PRIMAP-Hist dataset, future emissions of CO2, N2O and CH4 are modelled for each country by incorporating their respective near-term, long-term and methane pledges. Emissions for other climate forcers are assumed to follow SSP4-60. These emission profiles are used as input to simple climate model – ACC2 (Tanaka et al., 2021) to estimate the temperature impacts. With the current pledges, the global temperature rise in 2100 is expected to be 2.0 and 2.1 °C, corresponding to the fulfillment of conditional and unconditional near-term pledges, respectively.  We further explore a suite of emissions pathways to identify some key ‘levers’ across the pledges that can strongly influence the projected global temperature in 2100.  We found that these levers can further reduce the temperature by 0.50 °C or increase by 0.25 °C.  The most significant reductions in temperature rise can be achieved by ratcheting up of the current conditional targets by 10%, shifting the net-zero target year to 2050 for all countries currently having a longer-term goal and adding a net-zero target in 2070 for countries with currently no long-term goals. Inclusion of all these levers can increase the likelihood of limiting temperature rise well below 2 °C and bringing it closer to 1.5 °C. Additional, relatively smaller, contributions accrue from inclusion of Russia, China and India in the Global Methane Pledge. On the other hand, failing to meet even the unconditional NDC targets and delaying the current net-zero targets by 10 years contribute to increases in temperature rise of 0.08 and 0.17 °C. Contributions are also evaluated on a country-by-country basis.

Reference

Tanaka K, Boucher O, Ciais P, Johansson DJA, Morfeldt J (2021) Cost-effective implementation of the Paris Agreement using flexible greenhouse gas metrics. Science Advances 7 (22):eabf9020. doi:10.1126/sciadv.abf9020

How to cite: Tibrewal, K., Tanaka, K., Boucher, O., and Ciais, P.: Levers of climate pledges influencing the Paris Agreement target, EGU General Assembly 2023, Vienna, Austria, 23–28 Apr 2023, EGU23-6566, https://doi.org/10.5194/egusphere-egu23-6566, 2023.

EGU23-6584 | ECS | Posters on site | CL3.2.1

Consequences of the spatial configuration of Carbon Dioxide Removal for its potential to withdraw atmospheric CO2 

Moritz Adam, Matthias M. May, Thomas Kleinen, Arya Samanta, and Kira Rehfeld

At the current decarbonization rate, we are set on a path towards re-shaping a substantial share of land for carbon dioxide removal (CDR) over the following decades. However, existing Earth system models which could help to quantify the character of resulting CDR side effects and their consequences for the cumulative CO2 removal do not yet resolve dynamic CDR cover in space. Here, we embark on shedding light on this CDR uncertainty space, scrutinizing CDR impacts in spatial simulations with a comprehensive Earth system model. Assuming CDR to be driven by solar irradiation in the style of photovoltaics, our model is the first to simulate an idealized approach to land-based CDR with its physical, biospheric, and land use couplings on a grid box scale. We analyze dynamic CDR simulations for spatial deployment scenarios according to the country-wise burden of past CO2 emissions, to livelihood constraints, and to optimal irradiation conditions. Shared socio-economic pathways drive the overall global CDR use for a range of potential future emission scenarios. Aside from these spatio-temporal scenarios, the simulations also cover different ways of releasing excess energy from the solar-to-carbon conversion, permitting either local cooling through carbon storage, heat dissipation resulting from system losses or co-benefits for energy production. Based on simulation ensembles for the different scenarios, we quantify Earth system impacts of CDR and their consequences for CO2 removal if grid-scale feedbacks are properly resolved. With new spatially resolved CDR representations in Earth system models we will be able to test CDR-induced Earth system dynamics and CDR promises in greater detail than with existing globally forced projections. This spatially explicit modeling strategy could also open a way toward more comprehensive modeling strategies which include consequences for land use decisions on CDR.

How to cite: Adam, M., May, M. M., Kleinen, T., Samanta, A., and Rehfeld, K.: Consequences of the spatial configuration of Carbon Dioxide Removal for its potential to withdraw atmospheric CO2, EGU General Assembly 2023, Vienna, Austria, 23–28 Apr 2023, EGU23-6584, https://doi.org/10.5194/egusphere-egu23-6584, 2023.

EGU23-6823 | Orals | CL3.2.1 | Highlight

Policy implications from aligning IPCC scenarios to national land emissions inventories 

Matthew Gidden, Thomas Gasser, Giacomo Grassi, Nicklas Forsell, Iris Janssens, William Lamb, Jan Minx, Zebedee Nicholls, Jan Steinhauser, and Keywan Riahi

Taking stock of global progress towards achieving the Paris Agreement requires measuring aggregate national action against modelled mitigation pathways. A key gap exists, however, in how scientific studies and national inventories account for the role of anthropogenic land-based carbon fluxes, resulting in a 5.5-6.0 GtCO2yr-1 difference between the respective present-day land-use estimates. Modelled pathways mainly include direct human-induced fluxes, while inventories submitted by countries to the UNFCCC (NGHGIs) generally include a wider definition of managed land area as well as the indirect removals on that land caused by environmental changes (e.g., the CO2 fertilization effect). This difference hinders comparability between targets set by countries and scientific benchmarks. 

Scenarios assessed in AR6 show that a combination of deep near-term gross emissions reductions and medium-term carbon removal from the atmosphere are needed to reach net-zero and eventually net-negative CO2 emissions to limit warming in line with the Paris Agreement temperature goal. However, scenarios lacked key information needed to estimate land-based removals and to align their LULUCF projections with NGHGIs. Here, we estimate the land-based removals consistent with NGHGIs using a reduced complexity climate model with explicit treatment of the land-use sector, OSCAR, one of the models used by the Global Carbon Project. Of the 1202 pathways that passed IPCC vetting, 914 provide sufficient land-use change data to allow us to fill this information gap and enable alignment between pathways and inventories.

Across both 1.5°C and 2°C scenarios, pathways aligned with NGHGIs show a strong increase in the total land sink until around mid-century. However, the ‘NGHGI alignment gap’ decreases over this period, converging in the 2050-2060s for 1.5°C scenarios and 2070s-2080s for 2°C scenarios. These dynamics lead to land-based emissions reversing their downward trend in most NGHGI-aligned scenarios by mid-century, and result in the LULUCF sector becoming a net-source of emissions by 2100 in about 25% of deep mitigation scenarios.

Our results do not change any climate outcome or mitigation benchmark produced by the IPCC, but rather provide a translational lens to view those outcomes. We find that net-zero timings on average advance by around 5 years; however, this does not imply that 5 years have been lost in the race to net-zero, but rather that following the reporting conventions for natural sinks results in net-zero being reached 5 years earlier. Understanding how these different accounting frameworks can be mutually interpreted is a fundamental challenge for evaluating progress towards the Paris Agreement, given the reality that direct and indirect carbon removals cannot be estimated separately with direct observations.

We propose three primary ways to address this science-policy gap. First, targets can be formulated separately for gross emission reductions, land-based removals, and technical carbon removals, allowing for nations to clearly define their expected contributions and to measure progress in each domain separately. Second, nations can clarify the nature of their deforestation pledges. Third, modelling teams can provide their assumptions for the NGHGI correction as part of their standard output which future IPCC assessments can use to vet scenarios.

How to cite: Gidden, M., Gasser, T., Grassi, G., Forsell, N., Janssens, I., Lamb, W., Minx, J., Nicholls, Z., Steinhauser, J., and Riahi, K.: Policy implications from aligning IPCC scenarios to national land emissions inventories, EGU General Assembly 2023, Vienna, Austria, 23–28 Apr 2023, EGU23-6823, https://doi.org/10.5194/egusphere-egu23-6823, 2023.

EGU23-7143 | ECS | Orals | CL3.2.1

Assessing the size and uncertainty of remaining carbon budgets 

Robin Lamboll, Zebedee Nicholls, Chris Smith, Jarmo Kikstra, Edward Byers, and Joeri Rogelj

The remaining carbon budget (RCB), the net amount of carbon dioxide humans can still emit without exceeding a chosen global warming limit, is often used to evaluate political action against the goals of the Paris Agreement. RCB estimates for 1.5C are small, and minor changes in their calculation can therefore result in large relative shifts. Here we evaluate recent RCB assessments by the IPCC and explain differences between them. We present calculation refinements together with robustness checks that increase confidence in RCB estimates. We conclude that the RCB for a 50% chance of keeping warming to 1.5C is around 250 GtCO2 as of January 2023, around 6 years of current CO2 emissions. This estimate changes to 480 and 60 GtCO2 for a 33% and 66% chance, respectively. Key uncertainties affecting RCB estimates are the contribution of non-CO2 emissions, which depends on socioeconomic projections as much as on geophysical uncertainty, and potential warming after net zero is reached. 

How to cite: Lamboll, R., Nicholls, Z., Smith, C., Kikstra, J., Byers, E., and Rogelj, J.: Assessing the size and uncertainty of remaining carbon budgets, EGU General Assembly 2023, Vienna, Austria, 23–28 Apr 2023, EGU23-7143, https://doi.org/10.5194/egusphere-egu23-7143, 2023.

EGU23-7493 | ECS | Orals | CL3.2.1

Possible causes for regional zero emissions commitment signals 

David Hohn, Torge Martin, Nadine Mengis, and Estela Monteiro

In scenarios with abrupt cessation of CO2 emissions (ZECMIP) the committed warming is expected to be 0±0.3K [1]. It is imperative to understand and narrow this uncertainty range because it is similar in size to the remaining allowable warming until 1.5K. We have shown that temperature changes up to 3K are present at regional scales [2]. Furthermore significant differences between models are observed which are important to understand the uncertainties in the zero emissions committed warming.

Analysing the ZECMIP simulations of nine ESMs, we identify common climate patterns and notable differences in an idealised zero CO2 emissions scenario. We distinguish between patterns within and outside of natural model climate variability, and will present first results for likely causes in commonalities linked to ocean circulations and predominant climate modes.


References:

[1] A. H. MacDougall et al., Is There Warming in the Pipeline? A Multi-Model Analysis of the Zero Emissions Commitment from CO2, Biogeosciences 17, 2987 (2020).

[2] A. H. MacDougall, J. Mallett, D. Hohn, and N. Mengis, Substantial Regional Climate Change Expected Following Cessation of CO2 Emissions, Environmental Research Letters 17, 114046 (2022).

How to cite: Hohn, D., Martin, T., Mengis, N., and Monteiro, E.: Possible causes for regional zero emissions commitment signals, EGU General Assembly 2023, Vienna, Austria, 23–28 Apr 2023, EGU23-7493, https://doi.org/10.5194/egusphere-egu23-7493, 2023.

EGU23-9011 | Orals | CL3.2.1

Do the TCRE and ZEC metrics work under net negative CO2 emissions? 

Charles Koven, Benjamin Sanderson, and Abigail Swann

Two key metrics of the coupled carbon-climate system are used to inform the remaining carbon budget for climate stabilization: the transient climate response to cumulative CO2 emissions (TCRE) and the zero emissions commitment (ZEC), which govern the global temperature response to positive and zero emissions, respectively. We ask whether and how these two metrics describe global temperatures under net negative CO2 emissions, using an idealized scenario defined by a gradual and symmetric reversal from positive to negative emissions. Using a full Earth system model and an ensemble of simple climate model simulations, we show that the two metrics do capture the global temperature dynamics even under large amounts of negative emissions, with ZEC predicting the deviation from symmetric TCRE proportionality under negative emissions. Further, we show that because ZEC begins to influence global temperatures even before reaching net zero, it can be better thought of as a measure of the deviation from the path-independence of the TCRE relationship than as a measure of the committed warming after reaching net zero.

How to cite: Koven, C., Sanderson, B., and Swann, A.: Do the TCRE and ZEC metrics work under net negative CO2 emissions?, EGU General Assembly 2023, Vienna, Austria, 23–28 Apr 2023, EGU23-9011, https://doi.org/10.5194/egusphere-egu23-9011, 2023.

EGU23-9715 | ECS | Posters on site | CL3.2.1

Estimated remaining carbon budgets under terrestrial nutrient limitation 

Makcim De Sisto and Andrew H. MacDougall

Nutrient limitation is a core regulation on the amount of carbon fixed by terrestrial vegetation. Hence, the addition of nutrients such as nitrogen and phosphorus in land model structures in Earth system models is essential for an accurate representation of the carbon cycle feedback in future climate projections. Thereby, the estimation of the remaining carbon budget is impacted by the regulation of nutrient limitation in terrestrial ecosystems, and yet it is rarely accounted for. Here, we estimate the carbon budget and remaining carbon budget of a nutrient limited Earth system model, using nitrogen and phosphorus cycles to limit vegetation productivity and biomass. We use eight Shared Socioeconomic Pathways scenarios on three distinct model structures: 1) carbon cycle without nutrient limitation, 2) carbon cycle with terrestrial nitrogen limitation and 3) carbon cycle with terrestrial nitrogen and phosphorus limitation. The three model structures were calibrated to historical temperature data, and to capture the uncertainty of the remaining carbon budget, three different climate sensitives were tuned for each model version. Our results show that overall the nutrient limitation reduced the remaining carbon budget for all simulations in comparison with the carbon cycle without nutrient limitation. Between the nitrogen and nitrogen-phosphorus limitation, the latter had the lowest remaining carbon budget. The mean remaining carbon budget from the Shared Socioeconomic Pathways scenarios simulations for the 1.5 °C target in the no nutrient limitation, nitrogen limited and nitrogen-phosphorus limited models obtained were 303±31, 280±40 and 241±28 Pg C respectively. As for the  2 °C target the mean remaining carbon budget were 517±193, 468±175 and 436±163 Pg C for the no nutrient limitation, nitrogen limited and nitrogen-phosphorus limited models respectively. This represents a reduction of 7.5 and 20.1% for the 1.5 °C target and 9.4 and 15.6% for the 2 °C target in the nitrogen and nitrogen-phosphorus limited simulations compared to the no nutrient limitation model. These results show that terrestrial nutrient limitations constitute an important factor to be considered when estimating or interpreting remaining carbon budgets and are an essential uncertainty of carbon budgets in Earth system models.

How to cite: De Sisto, M. and MacDougall, A. H.: Estimated remaining carbon budgets under terrestrial nutrient limitation, EGU General Assembly 2023, Vienna, Austria, 23–28 Apr 2023, EGU23-9715, https://doi.org/10.5194/egusphere-egu23-9715, 2023.

EGU23-10823 | Posters on site | CL3.2.1 | Highlight

The full climate impacts of nature-based climate solutions must be considered to achieve climate goals 

Kirsten Zickfeld, Alexander J. MacIsaac, Josep G. Canadell, Chris D. Jones, and H. Damon Matthews

Nature-based climate solutions (NBCSs) refer to actions that seek to protect, restore and better manage natural landscapes to reduce greenhouse gas (GHG) emission or remove CO2 from the atmosphere. NBCSs are integral part of many countries’ roadmaps to reach net zero GHG emissions by mid century in compliance with the Paris Agreement climate goals. Implementation of NBCSs not only affects cycling of CO2 and other GHGs in the Earth system, but impacts the energy balance at the Earth’s surface through biophysical effects including changes in reflectivity (albedo), surface roughness and the water cycle, with effects on surface temperature. Furthermore, storage of the sequestered CO2 in above-ground biomass is often vulnerable to natural and anthropogenic disturbances, with the risk of re-release after a few decades. Yet, frameworks that seek to balance residual GHG emissions with nature-based CO2 removal often only consider the CO2 sequestration potential, and do not take the full climate impacts of NBCSs and the vulnerability of carbon stocks into account. By implementing large-scale reforestation as an example of a NBCS in an Earth system model we show that offsetting fossil-fuel CO2 emissions with nature-based CO2 removals to achieve net zero CO2 emissions could result in additional warming compared to the case where the CO2 emissions are avoided, if biophysical effects are not considered and nature-based CO2 storage is temporary. We provide recommendations for taking into account the full climate impacts of NBCSs in net zero accounting frameworks and lay out directions for future research.

How to cite: Zickfeld, K., MacIsaac, A. J., Canadell, J. G., Jones, C. D., and Matthews, H. D.: The full climate impacts of nature-based climate solutions must be considered to achieve climate goals, EGU General Assembly 2023, Vienna, Austria, 23–28 Apr 2023, EGU23-10823, https://doi.org/10.5194/egusphere-egu23-10823, 2023.

The Republic of Korea submitted its updated Nationally Determined Contribution (NDC) to the United Nations Framework Convention on Climate Change (UNFCCC) Secretariat in December 2021. The updated NDC target is to reduce total national greenhouse gas (GHG) emissions by 40% from the 2018 level, which is 727.6 Mt CO2eq, by 2030. According to the updated NDC, local governments are also required to revise their GHG reduction plans. In addition, local governments should self-inspect the progress and major achievements of the GHG reduction plan every year in accordance with the evaluation guideline of the Ministry of Environment. Of 6 metropolitan cities, Gyeonggi Province shows the highest GHG emissions in the country, which accounts for about 17% of the total national GHG emissions in 2021. Ironically, Goyang City, a basic local government of Gyeonggi Province, was selected as one of the seven best local governments for carbon neutrality in 2021. The City has set a reduction target of 32.8% below BAU by 2030 and prepared a plan to implement reduction targets by sector. Over the last decade, building and transportation sectors have been the major sources of GHG emissions in Goyang City, accounting for approx. 70% of the city’s total GHG emissions. The city promotes zero-energy building (ZEB) for newly constructed buildings and encourages green remodeling for existing buildings in order to reduce GHG emissions in the building sector. It is essential to introduce renewable energy such as solar, geothermal, hydrothermal, etc. for ZEB and green remodeling. In this study, therefore, the potential for solar power generation, which is most easily applicable to the building sector, and GHG reduction were calculated for residential buildings in Goyang City. To calculate the available area for solar power on the roof of residential buildings, spatial data was constructed using high-resolution aerial photographs and the outline of the building roof was extracted through AI training data.


Acknowledgements

This research was carried out as a part of KICT Research Program (Data-Centric Checkup Technique of Building Energy Performance) funded by the Ministry of Science and ICT.

How to cite: Kim, Y. and Lee, S.-E.: Estimation of renewable power generation and greenhouse gas reduction potential in the building sector, EGU General Assembly 2023, Vienna, Austria, 23–28 Apr 2023, EGU23-10836, https://doi.org/10.5194/egusphere-egu23-10836, 2023.

EGU23-11083 | ECS | Orals | CL3.2.1

Transdisciplinary Research Framework on Climate Change Dynamic Decision-making. 

Meng-Hui Lin and Ching-Pin Tung

Sustainability transition on climate change, energy systems, and low carbon society is a big issue in 21 century. However, it’s not a linear question in a specific single research community. This study aims to contribute a transdisciplinary research (TDR) framework to support climate change decision-making as wicked problems. To achieve the global goal of 2050 Net Zero, it needs a science-based scenario setting for both adaptation and mitigation while making decisions and climate risk assessment in business and governance. From knowledge to actions, academics and non-academics are encouraged to engage in climate actions at the same time. This study delivers a system-dynamic approach to integrate the environmental, social, and economical components from participants and stakeholders with different backgrounds in TDR to reduce climate risks including resilient adaptation for physical risk and low carbon transition for transition risk. The TDR framework on climate change dynamic decision-making would be demonstrated through a case of the Carbon Neutrality Project of National Taiwan University.

How to cite: Lin, M.-H. and Tung, C.-P.: Transdisciplinary Research Framework on Climate Change Dynamic Decision-making., EGU General Assembly 2023, Vienna, Austria, 23–28 Apr 2023, EGU23-11083, https://doi.org/10.5194/egusphere-egu23-11083, 2023.

EGU23-11607 | Orals | CL3.2.1 | Highlight

Assessing ExxonMobil’s global warming projections 

Stefan Rahmstorf, Geoffrey Supran, and Naomi Oreskes

The performance of mainstream climate models has received extensive scrutiny. By contrast, climate projections by the fossil fuel industry have never been assessed. Based on recent archival discoveries, we quantitatively evaluate all available global warming projections documented by – and in many cases modeled by – Exxon and ExxonMobil Corp scientists between 1977 and 2003. We find that most of their projections accurately forecast warming consistent with subsequent observations. Their projections were also consistent with, and at least as skillful as, those of independent academic and government models. We find that Exxon and ExxonMobil Corp also correctly rejected the prospect of a coming ice age, accurately predicted when human-caused global warming would first be detected, and reasonably estimated the ‘carbon budget’ for holding warming below 2°C. Our results show that ExxonMobil predicted global warming correctly and that by the 1980s, they already knew how much global warming the company’s products were likely to cause.  

How to cite: Rahmstorf, S., Supran, G., and Oreskes, N.: Assessing ExxonMobil’s global warming projections, EGU General Assembly 2023, Vienna, Austria, 23–28 Apr 2023, EGU23-11607, https://doi.org/10.5194/egusphere-egu23-11607, 2023.

EGU23-11791 | ECS | Orals | CL3.2.1

The coupled uncertainty in negative emission technologies and transient climate response to cumulative CO2 emissions. 

Carla Maria Di Natale, Giang Thanh Tran, David P. Keller, Theresa Schaber, Joonas Merikanto, Tommi Ekholm, and Antti-Ilari Partanen

To meet the Paris Agreement targets, in addition to rapid emission reductions, carbon dioxide needs to be removed from the atmosphere with Negative Emission Technologies (NETs). On one hand, these solutions seem promising; on the other hand, they have significant and poorly estimated uncertainties and risks related to their potential to remove atmospheric carbon and wider impacts on the Earth system. One previously largely unexplored aspect of NETs is whether the uncertainty in NETs and e.g. transient climate response to cumulative CO2 emissions (TCRE) are coupled to any degree, e.g. could some NETs have lower carbon removal potential if TCRE is high. 

We estimate how TCRE and selected NETs’ carbon removal potential are dependent on climate system parameters using Perturbed Parameter Ensemble (PPE) with the University of Victoria Earth System Climate Model (UVic ESCM) and Gaussian Process (GP) emulator. Our aim is to explore and quantify any potential correlation between the carbon removal potential of single NETs and TCRE. The NETs considered are afforestation, reforestation, ocean alkalinization, ocean iron fertilization and direct air capture, which all except the last one depend on the perturbed parameters. 

The parameters of interest are chosen according to their expected impact on the climate and carbon uptake, constrained according to observations, and perturbed based on their prior probability distribution functions (PDFs). Then, to explore the parameter’s space, we use GP emulators to estimate model outputs as surrogate of actual ESM runs, which would be computationally too expensive. The emulators are created for the preindustrial spin-up, historical period, future control scenario and one for each NET scenario. They are trained through 300 simulations, considering 20 perturbed parameters. This analysis yields the correlation between the carbon removal potential of each NET and TCRE, and the contribution of each perturbed parameter to these two metrics. 

The preliminary results from the 300-member ensemble give a mean TCRE of 1.63 °C/1000 PgC, which is consistent with the best estimate of 1.65 °C/1000 PgC reported by the IPCC AR6 WGI (2021). The simulations with a high TCRE also tended to have a high ocean iron fertilization’s potential, meaning that some NETs are potentially more effective in removing atmospheric carbon dioxide if the temperature change per cumulative carbon dioxide emissions is high. Identifying such correlations between TCRE and NETs’ potential allows designing more robust mitigation strategies including portfolios of NETs that hedge against high TCRE. 

How to cite: Di Natale, C. M., Tran, G. T., Keller, D. P., Schaber, T., Merikanto, J., Ekholm, T., and Partanen, A.-I.: The coupled uncertainty in negative emission technologies and transient climate response to cumulative CO2 emissions., EGU General Assembly 2023, Vienna, Austria, 23–28 Apr 2023, EGU23-11791, https://doi.org/10.5194/egusphere-egu23-11791, 2023.

EGU23-12247 | Posters on site | CL3.2.1

Net greenhouse gas emission pathway for Finland based on fair share of allowed warming 

Antti-Ilari Partanen, Taru Palosuo, Tommi Ekholm, Markku Ollikainen, and Hannele Korhonen

Finland has set a legally binding goal of achieving “carbon neutrality” by 2035 and net-negative greenhouse gas emissions thereafter. The scientific background for this goal is based on an interpretation of what a nationally fair share of global carbon budget compatible with 1.5 °C warming is. This national carbon budget includes also non-CO2 greenhouse gas (GHG) emissions and is thus stricter than the original, global CO2-only carbon budget. Finland’s pathway to carbon neutrality relies not only on emission reductions but also on carbon sinks in the land use, land-use change and forestry (LULUCF) sector. The net sink in the LULUCF sector, as estimated in the national greenhouse gas inventory, is interpreted as negative emissions. This assumption is problematic, as part of the LULUCF sink is considered natural sink in the conceptual framework behind the global carbon budget estimates and assuming it entirely anthropogenic leads to underestimation of the net CO2 emissions.  

Here we present an analysis and revision of the Finnish net greenhouse gas emission pathway with two major improvements. First, we extend the carbon budget framework to nationally allowed warming to be able to account explicitly also for national non-CO2 GHG emissions. The global allowed warming until 2050 from future GHG emissions is calculated as the sum of the remaining warming to 1.5 °C, the global decreasing warming impact of past non-CO2 GHG emissions by 2050, and future warming due to reduced aerosols by 2050. We use the fair share used previously for allocating national carbon budget to calculate national allowed warming contribution until 2050 and subtract non-CO2 GHG contribution based on a Finnish carbon neutrality scenario and simulations with a simple climate model FaIR 2.1. The remaining allowed warming is then used to calculate the national CO2-only carbon budget. 

 The second improvement is to consider the recent advancements in disentangling natural and anthropogenic carbon fluxes in the LULUCF sector. National results from a recent global study indicate that the Finnish LULUCF sector has been a carbon sink due to the natural sink induced by CO2 fertilization and climate change. The large natural sink is expected to decrease especially in the most stringent global emission reduction scenarios.  

 The preliminary results indicate that Finland’s currently planned pathway is not compatible with its national fair share of allowed warming compatible with the 1.5-degree target, and more stringent emission reductions coupled with strengthening of the land sink and other forms of negative emissions are very likely needed.

How to cite: Partanen, A.-I., Palosuo, T., Ekholm, T., Ollikainen, M., and Korhonen, H.: Net greenhouse gas emission pathway for Finland based on fair share of allowed warming, EGU General Assembly 2023, Vienna, Austria, 23–28 Apr 2023, EGU23-12247, https://doi.org/10.5194/egusphere-egu23-12247, 2023.

EGU23-13480 | Orals | CL3.2.1

Refining the budget: limits of the cumulative emissions framework and implications for policy 

Benjamin Sanderson, Charles Koven, Glen Peters, and Stuart Jenkins

The linear relationship between cumulative emissions and warming has been a consistent feature of climate models, and underpins the concept of a carbon budget and net-zero goal in order to achieve climate stabilisation.  However, research in recent years has identified potential for deviations from this relationship during the net zero transition.  Here, we consider how important such deviations might be for achieving the goals of the Paris Agreement, and whether current metrics of Earth system warming in response to carbon emissions (TCRE, ZEC, RAZE) adequately describe the range of potential warming trajectories which might be experienced in response to different levels of mitigation.  Further, as carbon emissions (hopefully) peak and decline in the coming decades, we examine the prospects for further constraining response parameters as temperatures depart from the linear growth seen over recent decades.  Finally, we consider how the current CMIP experimental protocol could be extended to better define transient response to real world emissions in a net-zero transition.

How to cite: Sanderson, B., Koven, C., Peters, G., and Jenkins, S.: Refining the budget: limits of the cumulative emissions framework and implications for policy, EGU General Assembly 2023, Vienna, Austria, 23–28 Apr 2023, EGU23-13480, https://doi.org/10.5194/egusphere-egu23-13480, 2023.

EGU23-14454 | ECS | Orals | CL3.2.1

Regional impacts of climate stabilisation across multiple global warming levels 

Andrea Dittus and Ed Hawkins

The 2015 Paris Agreement adopted by 192 parties states the goal of limiting global warming to well below 2, preferably 1.5 degrees Celsius above pre-industrial levels. These goals imply an ambition to stay at or below these levels long-term. Evidence is beginning to emerge that regional patterns of change at given global warming levels (GWLs) can be very different between transiently warming through given GWLs and stabilising at those same GWLs.

In this presentation, we explore regional climate change across multiple variables, with a particular focus on regional precipitation change. Using a novel ensemble of six 500-years long fixed concentration simulations across various levels of warming between 1.5 and 5 degrees above pre-industrial with the CMIP6-generation Earth System Model UKESM1.0, we show that precipitation trends opposite in sign to transient climate change projections occur in several regions at the same GWLs. Such differences have important implications for climate change risk assessments and adaptation discussions, which typically only include transient projections. Here, we provide examples where a transient and stabilised climate differ and discuss the possible mechanisms driving these differences. 

How to cite: Dittus, A. and Hawkins, E.: Regional impacts of climate stabilisation across multiple global warming levels, EGU General Assembly 2023, Vienna, Austria, 23–28 Apr 2023, EGU23-14454, https://doi.org/10.5194/egusphere-egu23-14454, 2023.

EGU23-15161 | ECS | Posters on site | CL3.2.1

Defending climate targets under threat of forest carbon impermanence 

Michael Windisch, Florian Humpenoeder, Leon Merfort, Nicolas Bauer, Jan Philipp Dietrich, Hermann Lotze-Campen, Sonia Seneviratne, and Alexander Popp

Carbon dioxide removal (CDR) can support mitigation efforts and help to limit the footprint of the hardest-to-abate sectors. Forests are one of the most cost-effective solutions to provide this CDR service at scale. Therefore, reforestation has become a major pillar supporting climate targets in scenarios and action plans such as the Nationally Determined Contributions. In addition, forests provide an unassisted aid to climate mitigation, removing a quarter of annual emissions as part of the terrestrial carbon cycle. As a result, today’s mitigation pathways have become a bet on the perpetual growth and permanence of the forest’s carbon storage. However, recent studies are raising doubt about the impeccable future productivity of forests we came to depend on. Forest resilience, especially in biomass hotspots like the Amazon, is in decline. An unexpected carbon stock loss becomes more likely as almost a quarter of primary forests reach critical resilience thresholds. Further, forest disturbances by fire, windfall, and pests become more widespread under changing climatic conditions. Moreover, nutrient limitation might regionally negate positive feedbacks we had hoped for, like CO2 fertilization and prolonged growing seasons. We use the integrated assessment model REMIND-MAgPIE to explore 1.5°C and 2°C mitigation scenarios assuming a range of forest disturbance levels and response timings. Here we show that forest disturbances call for more stringent mitigation targets in all sectors to maintain climate goals. Postponing action instead of preparation risks spiraling costs. Reacting only five years after the disturbance is introduced to the scenario doubles the GDP cost of mitigation action under the same disturbance level. In addition, twice the carbon price is required to reach the same climate goal in 2050. We conclude that even disturbed forests can provide carbon removal services. However, the promise of forest CDR may not be misused to delay decarbonization. Over-relying on forest CDR heightens the risk of unplanned future emissions and leaves us with few options to cope with it.

How to cite: Windisch, M., Humpenoeder, F., Merfort, L., Bauer, N., Dietrich, J. P., Lotze-Campen, H., Seneviratne, S., and Popp, A.: Defending climate targets under threat of forest carbon impermanence, EGU General Assembly 2023, Vienna, Austria, 23–28 Apr 2023, EGU23-15161, https://doi.org/10.5194/egusphere-egu23-15161, 2023.

Overshoot of the global 1.5ºC long term temperature goal is likely soon after 2030, so high emitting nations are liable to exceed their fair share of remaining warming to 1.5ºC well before 2030. Net zero globally and for high emitters will occur in overshoot, therefore the meaningful goal is a net negative world until 1.5ºC is reached. In addition to radical near-term reductions in fossil fuel and land CO2 emissions, limiting and returning from overshoot will require substantial warming reduction (negative emissions), via some combination of methane mitigation and carbon dioxide removal (CDR), and limits on excessive agricultural N2O resulting from inefficient reactive nitrogen usage. Therefore, for developed nations and their decision-makers, rapid assessment of the warming impact from primary greenhouse gases for alternative society-wide policy pathway options relative to a fair share of remaining warming to 1.5ºC is required on a clearly defined equity basis. This research applies such a “Paris Test” through: a ‘micro climate model’ GWP* assessment of IPCC 1.5ºC scenarios undertaken to establish a remaining global CO2 warming equivalent (CO2we) budget, aggregated for [CO2+N2O+CH4], to 1.5ºC from 2015; allocation of this budget on a global equal per capita and national population basis to set out 2015 remaining national ‘carbon’ quotas, as of 2015; and, a case study (Ireland) of alternative multi-gas national scenarios to compare aggregate society-wide cumulative CO2we outcomes relative to meeting the 1.5ºC national carbon quota well before 2100. Other equitable budget allocation principles are possible, but this case shows the importance of justifying the reference year choice, and other normative and quantitative assumptions, on a clearly defined “common but differentiated responsibility” basis. The study shows the benefits of such a rapid Paris Test national mitigation policy assessment methodology. Its outputs clarify the considerable difference for developed nations between overshoot net zero, commonly referred to as “no additional warming”, and quota net zero, the Paris Agreement aligned goal, which requires early and substantial CH4 emissions rate reduction as well as CDR. The common use of GWP100 CO2e in mitigation analyses is shown to undervalue the importance of early, deep, and sustained annual CH4 emission rate reduction toward reducing inequitable long-term reliance on uncertain and costly large scale CDR. If the 1.5ºC goal is to be met, by limiting overshoot magnitude and quickly returning to a Paris-consistent net zero quota level, then urgent, substantial and sustained action by developed nations – to radically reduce their fossil fuel use and deforestation responsibility, and to limit nitrogen flows to intensive animal agriculture – will be required at policy ambition levels far greater than those considered ‘technically feasible’ in IPCC mitigation assessments. To meet society-wide, 1.5ºC fair share, national multi-gas quotas, so-called ‘hard-to-abate’ sectors, such as aviation and ruminant agriculture, likely have to be abated substantially and directly within developed nations through policy-directed regulation. This research confirms that the window of options for fair share 1.5ºC climate action in developed nations is closing very rapidly.

How to cite: Price, P. R., McMullin, B., and O'Dochartaigh, A.: Towards a net negative world: applying a rapid “Paris Test” to multi-gas national policy scenarios to assess and enable fair share 1.5ºC achievement, EGU General Assembly 2023, Vienna, Austria, 23–28 Apr 2023, EGU23-16356, https://doi.org/10.5194/egusphere-egu23-16356, 2023.

EGU23-1022 | ECS | Orals | CL3.2.5

Nonlinear El Niño impact on global economy in a warming climate 

Yi Liu, Wenju Cai, Xiaopei Lin, Ziguang Li, and Ying Zhang

El Niño-Southern Oscillation (ENSO) is the most consequential climate phenomenon affecting global extreme weathers often with devastating socioeconomic impact. However, quantifying the impact on global economy has been a challenge and has so far focused on tangible loss such as reduced agriculture outputs and infrastructure damage. Elusive are issues to what extent the impact affects the macroeconomy, how long the impact lasts, and how the impact may change in a warming climate. Using a smooth nonlinear climate-economy model fitted with historical data, here we find a damaging impact from El Niño in which acceleration of impact lasts for three years after an initial shock, with a total effect an order of magnitude greater than previous estimates; impact from La Niña is not symmetric and far weaker. We attribute a loss of US$2.1T and US$4.0T in global economy to the 1997-98 and 2015-16 El Niño events, but a gain of only US$0.08T from the 1998-99 La Niña event. In a warming climate, economic loss grows exponentially with increased ENSO variability. Under a high-emission scenario, changes in ENSO variability cause an additional median loss of US$33T to global economy at a 3% discount rate aggregated over the last 80 years of the 21st century, but possibly as large as US$375T, highlighting an exacerbated economic damage from future ENSO under global warming. Further, the additional loss lessens with lower emissions and achieving the Paris Agreement reduces the additional loss by half, pointing to a strong incentive for mitigation.

How to cite: Liu, Y., Cai, W., Lin, X., Li, Z., and Zhang, Y.: Nonlinear El Niño impact on global economy in a warming climate, EGU General Assembly 2023, Vienna, Austria, 23–28 Apr 2023, EGU23-1022, https://doi.org/10.5194/egusphere-egu23-1022, 2023.

EGU23-1964 | ECS | Orals | CL3.2.5

Managerial perspectives on climate change and stock price crash risk 

Hail Jung and Chang-Keun Song

Unprecedented climate change not only affects our health, but also poses a significant risk to the economic and financial systems. Limiting the global temperature rise at below 1.5 °C, as suggested by the Paris Agreement, has a significant effect on financial economics. Physical climate change, such as global warming and sea level rise, may directly reduce a firm's productivity. Climate change may also indirectly affect a firm's costs due to governmental sanctions and regulations, such as the emission trading scheme. Simultaneously, some firms strategically use climate change issues as opportunities. As climate change risks do not unidirectionally affect firms, it is important to understand how firms and managers perceive climate change effects. In this manner, we examine the effects of manager's perspectives on climate change on stock price crash risk. The analysis confirms that manager's climate change perspective is negatively associated with future stock price crash risk likelihood. Various channel tests show that investor attention and analyst coverage are potential channels through which a firm's climate change perspective improves financial stability and ultimately reduces crash risk. Our results are also robust to alternative climate change perspective measures.

How to cite: Jung, H. and Song, C.-K.: Managerial perspectives on climate change and stock price crash risk, EGU General Assembly 2023, Vienna, Austria, 23–28 Apr 2023, EGU23-1964, https://doi.org/10.5194/egusphere-egu23-1964, 2023.

EGU23-2779 | ECS | Posters on site | CL3.2.5

Implicit cost of carbon emissions: Design the internal carbon price in the decision-making process 

Hsin-hua Wu and Ching-pin Tung

In the debate on carbon reduction, carbon pricing has become the norm to motivate the actors to work on the issue through economic incentives. Given that more and more relevant policies such as emission allowances or taxes are being released recently and might have a direct impact on operating costs, it is far more essential for companies to identify the implicit cost of emissions.

Internal Carbon Pricing is one of the strategies increasingly used by companies to support the decision-making process to deal with the risk associated with the additional cost of emissions, which helps drive environmental efficiency, change internal behavior, and navigate greenhouse gas regulations across departments. However, there remains a lack of an appropriate approach to accurately express the implicit cost of emissions, which makes it difficult for companies to devise the internal pricing level. In addition, the collection of the pricing policy largely depends on the level of energy consumption of each department, which casts doubt on the representativeness of environmental efficiency.

This study proposes an analysis of implicit carbon pricing based on the concept of the marginal cost of emissions, which includes the additional investment needed in emissions-reducing or -removing projects and the incremental cost that come from relevant regulations that might increase with the emission level. The work calculates the marginal cost of emissions by using linear programming; economic performance serves as an objective function and the mitigation target of the company as well as the available resources constitute the constraints. Moreover, to estimate the environmental efficiency, the study introduces Data Envelopment Analysis (DEA) to measure the relative efficiency between departments and derive an efficiency score as a marginal cost adjustment factor in designing the internal pricing level.

By the calculation of the marginal cost of emissions, which is still under discussion at present, this study develops a strategy to assist companies in accurately establishing internal pricing levels, thus ensuring the effectiveness of the internal carbon pricing policy that is in line with the company's mitigation target.

How to cite: Wu, H. and Tung, C.: Implicit cost of carbon emissions: Design the internal carbon price in the decision-making process, EGU General Assembly 2023, Vienna, Austria, 23–28 Apr 2023, EGU23-2779, https://doi.org/10.5194/egusphere-egu23-2779, 2023.

EGU23-3013 | Orals | CL3.2.5

Observational constraints on economic impact assessments of climate change simulated by an impact emulator 

Hideo Shiogama, Jun’ya Takakura, and Kiyoshi Takahashi

Since many new generation earth system models (ESMs) have been suggested to be ‘hot models’ that overestimate future global warming, the IPCC AR6 used the constrained range of global warming instead of that in the raw ensemble. However, it is not clear how this advance in climate science can contribute to reducing climate-related uncertainties in impact assessments. Here, we show that the climate-related uncertainty of the economic impact of climate change in the world can be observationally constrained. By applying an impact emulator of Takakura et al. (2021, https://doi.org/10.5194/gmd-14-3121-2021), we estimate the economic impacts in nine sectors based on 67 ESMs’ future climate change projections. The impacts in eight sectors are closely related to the recent past trend of global mean temperature. Observational constraints lower the upper bound of the aggregate economic impact simulated by the single emulator from 2.9% to 2.5% of the world gross domestic product and reduce 31% of variance under the RCP4.5 or SSP2-4.5 scenarios. Please see Shiogama et al. (2022, https://doi.org/10.1088/1748-9326/aca68d) for more details.

How to cite: Shiogama, H., Takakura, J., and Takahashi, K.: Observational constraints on economic impact assessments of climate change simulated by an impact emulator, EGU General Assembly 2023, Vienna, Austria, 23–28 Apr 2023, EGU23-3013, https://doi.org/10.5194/egusphere-egu23-3013, 2023.

EGU23-3471 | Posters on site | CL3.2.5

Simple climate emulators - fit for net-zero emission scenarios? 

Doris Folini, Pratyuksh Bansal, Aryan Eftekhari, Felix Kübler, Aleksandra Malova, and Simon Scheidegger

Simple climate models or climate emulators (CEs) are indispensable in the context of climate economics, where the lion share of compute resources is bound to the economic part of the problem. Associated applications traditionally focused on scenarios with strongly increasing carbon emissions. Here we ask to what degree CEs developed with such applications in mind are fit for purpose when it comes to strong reduction or negative emission scenarios, as in the context of the Paris agreement.

To this end, we present and discuss an augmented version of the CE used in the seminal DICE model. Augmentation consists of additional carbon reservoirs, notably a land biosphere and / or a middle ocean reservoir, on top of the three standard carbon reservoirs representing atmosphere, upper ocean, and lower ocean. The different CEs are calibrated and tested against output of large-scale Earth System Models from the Coupled Model Intercomparison Project, run on pre-defined emissions scenarios. For the calibration of the CE, we use the same strategy as in our previous work, i.e., two highly idealized test cases to separately calibrate the CE's carbon cycle and temperature response. In contrast to previous work, we strongly augment the set of test cases to which we expose the calibrated CE. Additional test cases address, in particular, strong mitigation as well as negative emission scenarios. As in our previous work, we demand that all test cases are well documented in the climate literature and can be easily implemented based on that literature. Based on these test cases, we discuss what added value the additional carbon reservoirs may offer with regard to the CE and associated econ studies.

How to cite: Folini, D., Bansal, P., Eftekhari, A., Kübler, F., Malova, A., and Scheidegger, S.: Simple climate emulators - fit for net-zero emission scenarios?, EGU General Assembly 2023, Vienna, Austria, 23–28 Apr 2023, EGU23-3471, https://doi.org/10.5194/egusphere-egu23-3471, 2023.

EGU23-3680 | ECS | Posters virtual | CL3.2.5

Quantifying Airborne Fraction Trends and the Ultimate Fate of Anthropogenic CO2 by Tracking Carbon Flows in a Simple Climate Model 

Leeya Pressburger, Kalyn Dorheim, Trevor Keenan, Haewon McJeon, Steve Smith, and Ben Bond-Lamberty

Carbon dioxide (CO2) concentrations have increased in the atmosphere as a direct result of human activity and are at their highest level over the last 2-3 million years, with profound impacts on the Earth system. However, the magnitude and future dynamics of land and ocean carbon sinks are not well understood; therefore, the amount of anthropogenic fossil fuel emissions that remain in the atmosphere (the airborne fraction) is poorly constrained. This work aims to quantify the sources and controls of atmospheric CO2, the fate of anthropogenic CO2 over time, and the trend and robustness of the airborne fraction. We use Hector v3.0, a coupled simple climate and carbon cycle model, with the novel ability to explicitly track carbon as it flows through the Earth system. We use a priori probability distribution functions for key model parameters in a Monte Carlo analysis of 10,000 coupled carbon-climate model runs from 1750 to 2300. Results are filtered for physical realism against historical observations and CMIP6 projection data, and we calculate the relative importance of parameters controlling how much CO2 ends up in the atmosphere. Unsurprisingly, we find that anthropogenic emissions are the dominant source of near- and long-term atmospheric CO2, composing roughly 45% of the atmosphere, which is consistent with observational studies of the airborne fraction. The overwhelming majority of model runs exhibited a negative trend in the airborne fraction from 1960-2020, implying that current-day land and ocean sinks are proportionally taking up more carbon than the atmosphere. Furthermore, when looking at the destination of anthropogenic fossil fuel emissions, only a quarter ends up in the atmosphere while more than half of emissions are taken up by the land sink on centennial timescales. This study evaluates the likelihood of airborne fraction trends and provides insights into the dynamics and destination over time of anthropogenic CO2 in the Earth system.

How to cite: Pressburger, L., Dorheim, K., Keenan, T., McJeon, H., Smith, S., and Bond-Lamberty, B.: Quantifying Airborne Fraction Trends and the Ultimate Fate of Anthropogenic CO2 by Tracking Carbon Flows in a Simple Climate Model, EGU General Assembly 2023, Vienna, Austria, 23–28 Apr 2023, EGU23-3680, https://doi.org/10.5194/egusphere-egu23-3680, 2023.

EGU23-5641 | ECS | Posters on site | CL3.2.5

Model development for climate optimized aircraft design 

Kathrin Deck, Feijia Yin, Volker Grewe, Kaushik Radhakrishnan, Benjamin Lührs, Florian Linke, and Malte Niklaß

Aviation as an important transport sector contributes to anthropogenic climate change via CO2 effects and non-CO2 effects. Non-CO2 effects include e.g., effects from NOx emissions, H2O emissions and the formation of contrails. Mitigation options include optimization of aircraft operations, e.g., re-routing, and optimization of the aircraft design, while this work focuses on the second option via providing a model for aircraft design optimization. Furthermore, we take CO2 and non-CO2 effects into account.
Previous research (e.g. Grewe et al., 2014) investigated the optimization of aircraft operations with the use of climate cost functions. With these functions, the climate impact per unit non-CO2 emission/flown distance is described depending on the type of emission, the emission location and corresponding time. An equivalent model for aircraft design purposes is currently missing. It has to cover a suitable route network with emission locations and altitudes to be able to optimize regarding the climate impact of CO2 and non-CO2 effects. Within the EU Clean Sky 2 project GLOWOPT, this concept is applied for aircraft design features, presented as climate functions for aircraft design (CFAD).
Here, we present the development routine for the CFAD. As input, emission inventories based on a long-range aircraft (A350 as baseline in this study) are used. The emission inventories cover a set of climb angles and final cruise altitudes to combine both the aircraft design parameter and geographical information of emissions. The climate impact is calculated with the climate-chemistry response model AirClim (Grewe and Stenke, 2008; Dahlmann et al., 2016) to create a response surface. The climate metric Average Temperature Response with a time horizon of 100 years is used as a measure for the climate impact. The created response surface, the CFAD, can be integrated in the aircraft design process to optimize the aircraft design. The CFAD are to be verified with additional emission inventories to evaluate the accuracy.


Grewe, V., Frömming, C., Matthes, S., Brinkop, S., Ponater, M., Dietmüller, S., Jöckel, P., Garny, H., Tsati, E., Dahlmann, K., Søvde, O. A., Fuglestvedt, J., Berntsen, T. K., Shine, K. P., Irvine, E. A., Champougny, T., and Hullah, P.: Aircraft routing with minimal climate impact: the REACT4C climate cost function modelling approach (V1.0), Geoscientific Model Development, 7, 175–201, https://doi.org/10.5194/gmd-7-175-2014, 2014.


Grewe, V. and Stenke, A.: AirClim: an efficient tool for climate evaluation of aircraft technology, Atmospheric Chemistry and Physics, 8, 4621–4639, https://doi.org/10.5194/acp-8-4621-2008, 2008.


Dahlmann, K., Grewe, V., Frömming, C., and Burkhardt, U.: Can we reliably assess climate mitigation options for air traffic scenarios despite large uncertainties in atmospheric processes?, Transportation Research Part D, 46, 40-55, https://doi.org/10.1016/j.trd.2016.03.006, 2016.

How to cite: Deck, K., Yin, F., Grewe, V., Radhakrishnan, K., Lührs, B., Linke, F., and Niklaß, M.: Model development for climate optimized aircraft design, EGU General Assembly 2023, Vienna, Austria, 23–28 Apr 2023, EGU23-5641, https://doi.org/10.5194/egusphere-egu23-5641, 2023.

EGU23-6660 | ECS | Orals | CL3.2.5 | Highlight

The carbon dioxide removal gap: current removals and country proposals versus future requirements for limiting warming to 2°C or lower 

William F. Lamb, Thomas Gasser, Giacomo Grassi, Jan Minx, Matthew Gidden, Carter Powis, Oliver Geden, Gregory Nemet, Yoga Pratama, Keywan Riahi, Stephen Smith, and Jan Steinhauser

Steep emissions reductions are needed in the coming decades to limit warming to 2°C or lower, followed by multiple gigatons of annual carbon dioxide removal (CDR) in the second half of the 21st century. In this presentation we make a first assessment of the “CDR gap” and ask whether countries are preparing for the CDR scale-up challenge. We find that most countries pledge only a small expansion of CDR by 2030 in their nationally determined contributions (NDCs), while only a subset have proposed CDR in their long-term mitigation strategies. There is a significant gap between these proposed CDR levels and levels in scenarios that limit warming to 2°C or lower. While some scenarios have low CDR requirements, these require even steeper emissions reductions that we are not on track to achieve. Most countries prioritize conventional CDR on land (i.e. the management of forest sinks) which has low permanence and may raise land use conflicts. Conventional CDR on land will be extremely difficult just to maintain, let alone expand to meet net zero emissions targets. By contrast, countries focus far less in their NDCs and long-term strategies on novel CDR methods such as bioenergy with carbon capture and storage, direct air capture, or blue carbon. For these technologies to make a meaningful contribution to long-term climate mitigation, urgent support is required in the formative phases of their development. Above all, rapid emissions reductions are needed to reduce our dependence on CDR and prevent a widening CDR gap by 2050.

How to cite: Lamb, W. F., Gasser, T., Grassi, G., Minx, J., Gidden, M., Powis, C., Geden, O., Nemet, G., Pratama, Y., Riahi, K., Smith, S., and Steinhauser, J.: The carbon dioxide removal gap: current removals and country proposals versus future requirements for limiting warming to 2°C or lower, EGU General Assembly 2023, Vienna, Austria, 23–28 Apr 2023, EGU23-6660, https://doi.org/10.5194/egusphere-egu23-6660, 2023.

EGU23-7072 | Posters on site | CL3.2.5

Climate Resilience of IoT devices: A user survey perspective 

Dinara Zhunissova

Climate Resilience of IoT devices: A user survey perspective

Climate change is due to have significant impacts across Central Asia. At the same time, IoT is being used to construct many new industries and provide new ways of managing logistics across existing sectors. For example, Climate change will affect Central Asia's agricultural production which will occur alongside increased frequency of drought, water scarcity, and soil salinization, which will cause food insecurity in the region.  How do we move towards secure management of systems that rely on IoT in a changing climate?

In this research I want to quantifying potential risks to IoT systems, and their connected end points, according to Climate resilience. To do this our work examines concepts and theories from a variety of fields to demonstrate how it could help transport companies and organizations prevent risk in extreme weather conditions.

First, in order to understand risk perception and mitigation for stakeholders, an online survey was created and sent across both public and private sector organisations in Kazakhstan. By delving into the outcomes of this survey, we can better understand perceived risks and map processes implemented in these organisations to potential impacts. In this short presentation we will review those outcomes and discuss future strategies to enable secure resilience. 


How to cite: Zhunissova, D.: Climate Resilience of IoT devices: A user survey perspective, EGU General Assembly 2023, Vienna, Austria, 23–28 Apr 2023, EGU23-7072, https://doi.org/10.5194/egusphere-egu23-7072, 2023.

EGU23-8191 | ECS | Posters on site | CL3.2.5

Climate uncertainty as an integral part of integrated assessment models 

Christopher Smith, Alaa Al Khourdajie, Pu Yang, and Doris Folini

Cost-benefit integrated assessment models (IAMs) such as the Dynamic Integrated model of Climate and the Economy (DICE) are often used to assess the social cost of carbon (SCC), the marginal damage arising from each additional ton of emitted CO2. The climate component of such IAMs has recently come under increased scrutiny. Alongside ensuring that economists are getting climate dynamics correct, the uncertainty in the climate system should be embraced, as it greatly influences the appropriate SCC and CO2 emissions mitigation pathway.

We use DICE, replacing its native climate module with the Finite-amplitude Impulse Response (FaIR) model (v2.1). FaIR is assessed to be fit-for-purpose for evaluating emissions projections from IAMs by the IPCC, and has an advantage over the native DICE module in that carbon cycle feedbacks are included. The FaIR emulator has been calibrated to CMIP6 models and constrained such that its projections are consistent with historical global mean temperature change, atmospheric CO2 concentration and ocean heat content, and IPCC Sixth Assessment Report assessed uncertainty ranges for equilibrium climate sensitivity (ECS), transient climate response and non-CO2 effective radiative forcing, constructing a 1000-member posterior ensemble from a 1.5 million member prior. Three ensembles are produced: a Nordhaus “socially optimal” ensemble with median 2100 warming of around 2.8°C, somewhat consistent with current Nationally Determined Contributions; a 2°C-consistent ensemble; and a 1.5°C-consistent ensemble. We update the economic and climate baseline in DICE/FaIR to 2023 and use a 3-year model timestep. The three scenarios are constructed solely by modifying the discount rate.

The influence of climate uncertainty is profound, having a factor of 5 uncertainty (5-95% range) in the social cost of carbon for a 1.5°C consistent ensemble, and a factor of 3 uncertainty in the business as usual case. There is also a very strong positive correlation between the SCC and the ECS, which re-confirms earlier analysis that reducing climate system uncertainty can realise net present economic benefits by guiding appropriate choices for the SCC. 

Alongside calculating a SCC for the year 2023, DICE/FaIR computes probabilistic projections of socially “optimal” CO2 pathways for each scenario that also show substantial variation depending on the climate configuration (for example, -14 to +11 GtCO2/yr in 2050 for the 1.5°C ensemble) but are broadly consistent with findings from the IPCC Sixth Assessment Working Group 3 report in the median case (such as global net zero emissions required in the 2050s to meet 1.5°C). The range of socially optimal emissions pathways consistent with a specific temperature threshold also highlights a climate-socioeconomic feedback: if climate sensitivity is high, mitigation efforts must be strong to limit future warming and climate damages. This feedback, while implicitly included in cost-benefit IAMs such as DICE, are not typically present in process-based IAMs used to construct emissions scenarios for use by the IPCC or climate models such as the Shared Socioeconomic Pathways. We claim that including climate and climate uncertainty in these process-based IAMs will improve emissions scenarios.

How to cite: Smith, C., Al Khourdajie, A., Yang, P., and Folini, D.: Climate uncertainty as an integral part of integrated assessment models, EGU General Assembly 2023, Vienna, Austria, 23–28 Apr 2023, EGU23-8191, https://doi.org/10.5194/egusphere-egu23-8191, 2023.

EGU23-9745 | ECS | Orals | CL3.2.5

Understanding the Sources of Climate Uncertainty in Projections of Climate Impacts 

Kevin Schwarzwald and Nathan Lenssen

Uncertainty in climate projections is driven by three components: scenario uncertainty, inter-model uncertainty, and internal variability. Although econometric climate impact studies increasingly take into account the first two components, little attention has been paid to the contribution of internal variability. Policymakers generally respond to short-term challenges on time horizons of days to decades, when internal variability is largest in projections of climate variables. Underestimating this uncertainty due to internal variability can lead to underestimating the socioeconomic costs of climate change and therefore estimates of the social cost of greenhouse gases. Using large ensembles from seven Coupled General Circulation Models with a total of 414 model runs, we partition the climate uncertainty in classic empirical dose-response models relating county-level corn yield, mortality, and per-capita GDP to temperature in the continental United States. Internal variability represents more than 50\% of the total climate uncertainty in certain projections, including mortality projections for the early 21st century, though its relative influence decreases for projections farther in the future. These findings suggest that uncertainty due to internal variability must be included for accurate uncertainty quantification in projections of temperature-driven impacts including early- and mid- 21st century projections, projections in regions with high internal variability such as the Upper Midwest United States, and for impacts driven by non-linear relationships. We conclude with recommendations on how to account for differing sources of climate uncertainty when constructing projections of the socioeconomic impacts of climate change impact.

How to cite: Schwarzwald, K. and Lenssen, N.: Understanding the Sources of Climate Uncertainty in Projections of Climate Impacts, EGU General Assembly 2023, Vienna, Austria, 23–28 Apr 2023, EGU23-9745, https://doi.org/10.5194/egusphere-egu23-9745, 2023.

Emulators of Earth System Model (ESM) outputs have the potential to become a powerful tool for the impacts research community. If successful in emulating the needed variables at the required spatial and temporal resolution, they can supply impact model(er)s with the inputs necessary to explore how future water, energy, economic, and land systems evolve under a wide range of future scenarios. This complements the availability of ESM output currently limited to a small number of future scenarios - due to the computational costs of running fully coupled climate models - since emulators are by construction computationally efficient. STITCHES is an open-source climate emulator that can produce time series of multiple ESM variables, at the ESM original temporal and spatial resolution, by recombining existing model output into new scenarios on the basis of the scenario global temperature trajectory. In this talk, we will focus on how STITCHES can be used to explore new scenarios by filling in the space between existing scenarios. We will also discuss how insights from emulators such as STITCHES may be used to inform climate modeling centers on where to prioritize resources in future scenario simulations. 

How to cite: Dorheim, K., Snyder, A., and Tebaldi, C.: STITCHES: a comprehensive option for Earth System Model emulation for impacts research, and its implications for designing future ESM scenario experiments, EGU General Assembly 2023, Vienna, Austria, 23–28 Apr 2023, EGU23-10246, https://doi.org/10.5194/egusphere-egu23-10246, 2023.

EGU23-10393 | ECS | Posters on site | CL3.2.5

Identification and Analysis of Critical Water Futures in the Indus River Basin   

Amal Sarfraz, Charles Rougé, Lyudmila Mihaylova, Jonathan Lamontagne, Abigail Birnbaum, and Flannery Dolan

Pakistan is a water-based economy and suffers from severe water scarcity in its primary river system, the Indus River Basin (IRB). The assessment of interactions among rising agricultural demand, socio-economic development and climate change is crucial to assess water scarcity in the IRB. Given the multiplicity of risks and the physical and social mechanisms that interact with them, estimating the future usage of the IRB requires models that represent plausible futures defined by a broad range of factors.

The Global Change Analysis Model (GCAM), an Integrated Assessment Model (IAM), is used to assess the complex connection and interactions between energy, water, land, climate, and the economy. GCAM divides the globe into  235 water basins, including the IRB, and 384 land use regions which are modelled based on combinations of 32 energy regions and overlapping water basins. Dolan et al. (2021) used GCAM to generate a large ensemble of 3,000 plausible future scenarios, varying parameters related to future socioeconomic conditions, climate impacts, and water supply. Each scenario represents a possible future from now until the end of the century, with detailed socio-economic, water supply and demand and land-use results at the basin level. Yet, while these experiments generate large databases, there is a need for specialised methods that extract useful information from that data.

Using the example of the IRB, we develop a methodology to leverage this type of database and (1) discover critical scenarios, i.e., scenarios with an outsized impact on water scarcity and economic costs, and (2) learn more about their characteristics, including what makes them critical. Here, we seek to identify outlier patterns by proposing a methodology that combines a machine learning technique, clustering, with dimensionality reduction. With clustering, we aim to identify hidden structures among scenarios and describe the clusters by a set of factors. Dimensionality reduction then assists us in determining which factors have the greatest impact on the critical scenarios that clustering identified.

Preliminary results suggest that our methodology is able to identify outlier scenarios for the IRB’s irrigated crops mix (dominated by cotton, wheat, rice, and sugarcane), understand the factors that make them outliers, and evaluate whether they could be critical. The analysis is also able to identify when an ensemble of scenarios becomes an outlier, and indicates that according to GCAM, the crop mix is susceptible to bifurcating in several contrasting directions after 2040. Thus, this methodology helps us to characterise the socio-economic uncertainties associated with the IRB’s water resources and their interaction with climate, land, food, and energy sectors under critical scenarios. It is being developed to have broad applicability in extracting valuable insights from a large ensemble of IAM simulations.


Dolan, F., Lamontagne, J., Link, R., Hejazi, M., Reed, P. & Edmonds, J. 2021. Evaluating the economic impact of water scarcity in a changing world. Nat Commun, 12, 1915.

How to cite: Sarfraz, A., Rougé, C., Mihaylova, L., Lamontagne, J., Birnbaum, A., and Dolan, F.: Identification and Analysis of Critical Water Futures in the Indus River Basin  , EGU General Assembly 2023, Vienna, Austria, 23–28 Apr 2023, EGU23-10393, https://doi.org/10.5194/egusphere-egu23-10393, 2023.

EGU23-10813 | Posters on site | CL3.2.5

Development and application of a climate emulator 

Tamas Bodai, Valerio Lembo, Sundaresan Aneesh, Sun-Seon Lee, Miho Ishizu, and Matthias Franz

Linear and nonlinear response functions (RF) are extracted for the climate system and the carbon cycle represented by the MPI-ESM and cGENIE models, respectively. Appropriately designed simulations are run for this purpose. Joining these RFs, we have a climate emulator with carbon emissions as the forcing and any desired observable quantity (provided the data is saved), such as the surface air temperature or precipitation, as the predictand. Like e.g. for atmospheric CO2 concentration, we also have RFs for the solar constant as a forcing — mimicking solar radiation management (SRM) geoengineering. We consider two application cases. 1. One is based on the Paris 2015 agreement, determining the necessary least amount of SRM geoengineering needed to keep the global mean surface air temperature below a certain threshold, e.g. 1.5 or 2 [oC], given a certain amount of carbon emission abatement (ABA) and carbon dioxide removal (CDR) geoengineering. 2. The other application considers the conservation of the Greenland ice sheet (GrIS). Using a zero-dimensional simplification of a complex ice sheet model, we determine (a) if we need SRM given some ABA and CDR, and, if possible, (b) the required least amount of SRM to avoid the collapse of the GrIS. Keeping temperatures below 2 [oC] even is hardly possible without sustained SRM (1.); however, the collapse of the GrIS can be avoided applying SRM even for moderate levels of CDR and ABA, an overshoot being affordable (2.).

How to cite: Bodai, T., Lembo, V., Aneesh, S., Lee, S.-S., Ishizu, M., and Franz, M.: Development and application of a climate emulator, EGU General Assembly 2023, Vienna, Austria, 23–28 Apr 2023, EGU23-10813, https://doi.org/10.5194/egusphere-egu23-10813, 2023.

EGU23-11431 | Orals | CL3.2.5

emIAM v1.0: an emulator for Integrated Assessment Models using marginal abatement cost curves 

Katsumasa Tanaka, Weiwei Xiong, Philippe Ciais, Daniel Johansson, and Mariliis Lehtveer

We developed an emulator for Integrated Assessment Models (emIAM) based on a marginal abatement cost (MAC) curve approach (Xiong et al., 2022a,b). Using the output of IAMs in the ENGAGE Scenario Explorer and the GET model, we derived a large set of MAC curves: ten IAMs; global and eleven regions; three gases CO2, CH4, and N2O; eight portfolios of available mitigation technologies; and two emission sources. We tested the performance of emIAM by coupling it with a simple climate model ACC2 (Tanaka et al., 2021). We found that the optimizing climate-economy model emIAM-ACC2 adequately reproduced a majority of original IAM emission outcomes under similar conditions, allowing systematic explorations of IAMs with small computational resources. emIAM can expand the capability of simple climate models as a tool to calculate cost-effective pathways linked directly to a temperature target.

References
1. Tanaka, K., O. Boucher, P. Ciais, D. J. A. Johansson, J. Morfeldt (2021) Cost-effective implementation of the Paris Agreement using flexible greenhouse gas metrics. Science Advances, 7, eabf9020. doi:10.1126/sciadv.abf9020. 
2. Xiong, W., K. Tanaka, P. Ciais, D. J. A. Johansson, M. Lehtveer (2022a) emIAM v1.0: an emulator for Integrated Assessment Models using marginal abatement cost curves. arXiv: 2212.12060 on 23 December 2022 (version 1). https://arxiv.org/abs/2212.12060
3. Xiong, W., K. Tanaka, P. Ciais, D. Johansson, M. Lehtveer (2022b) Data for "emIAM v1.0: an emulator for Integrated Assessment Models using marginal abatement cost curves" [Data set]. Zenodo. https://doi.org/10.5281/zenodo.7478234

How to cite: Tanaka, K., Xiong, W., Ciais, P., Johansson, D., and Lehtveer, M.: emIAM v1.0: an emulator for Integrated Assessment Models using marginal abatement cost curves, EGU General Assembly 2023, Vienna, Austria, 23–28 Apr 2023, EGU23-11431, https://doi.org/10.5194/egusphere-egu23-11431, 2023.

EGU23-11904 | ECS | Orals | CL3.2.5

Investigating the R&D-CO2 nexus in the international trade 

Lorenzo Costantini, Francesco Laio, Luca Ridolfi, and Carla Sciarra

Innovation and technological progress are the main drivers of sustainable development and economic growth, and they both play a role in addressing climate change and related actions. These drivers rely on Research and Development (R&D), i.e., the systematic creative work aiming to increase the stock of knowledge and devoted to the creation and development of new products and procedures. Against the existing literature that differently addresses the economic implications of the R&D sector, in this work, we introduce a novel quantification of the R&D content embedded in countries’ export baskets. Considering the current need to understand the dynamics of CO2 emissions and their nexus with the economic aspects, the R&D content in nations’ export baskets is related to the country-specific terrestrial carbon emissions. To this aim, we refer the CO2 emissions embedded in nations' export baskets to the dollars the country at hand exports, defining a country-specific CO2 export intensity; in this way, we can compare economies of different sizes (for example, Germany and Paraguay). Our results show that as countries export products with an increasing R&D content, their CO2 export intensity decreases. Germany, Japan, and the United States are examples of countries exporting high R&D products and having low CO2 export intensity. China stands as an example of elevated CO2 intensity despite having a high R&D content embedded in its export basket. Fuel exporting economies (such as the Russian Federation) and the majority of developing countries have low R&D-oriented export baskets, with high CO2 export intensities. Our work provides a novel perspective of the R&D-CO2 emissions nexus, highlighting the R&D centrality in the green transition and decarbonization process.

How to cite: Costantini, L., Laio, F., Ridolfi, L., and Sciarra, C.: Investigating the R&D-CO2 nexus in the international trade, EGU General Assembly 2023, Vienna, Austria, 23–28 Apr 2023, EGU23-11904, https://doi.org/10.5194/egusphere-egu23-11904, 2023.

EGU23-12124 | ECS | Orals | CL3.2.5

Adaptation constraints in scenarios of socio-economic development 

Emily Theokritoff, Nicole van Maanen, Marina Andrijevic, Adelle Thomas, Tabea Lissner, and Carl-Friedrich Schleussner

In a time of ever-intensifying climate change, it is crucial to understand the timescales needed to overcome adaptation constraints, namely what makes adaptation challenging. Currently, evidence on constraints focusses on the local level and present-day dynamics. Here, we combine qualitative and case study data with national macro indicators and use the Shared Socioeconomic Pathways to look at the pace of various scenarios of future socio-economic development. We find that regardless of the scenario, long timescales will be required to overcome constraints, challenging adaptation for decades to come, in particular in countries on the frontline of climate change. The persistence of adaptation constraints calls for stringent mitigation, improved adaptation along with dedicated finance and increasing efforts to address loss and damage. Our novel approach allows to ground truth existing indicators that can be further used in climate modelling efforts (including economic models), improving the representation of adaptation and its risk reduction potential.

How to cite: Theokritoff, E., van Maanen, N., Andrijevic, M., Thomas, A., Lissner, T., and Schleussner, C.-F.: Adaptation constraints in scenarios of socio-economic development, EGU General Assembly 2023, Vienna, Austria, 23–28 Apr 2023, EGU23-12124, https://doi.org/10.5194/egusphere-egu23-12124, 2023.

EGU23-12337 | ECS | Orals | CL3.2.5 | Highlight

Fire Weather Compromises Large Scale Afforestation Scenarios 

Felix Jäger, Yann Quilcaille, Jonas Schwaab, Michael Windisch, Florian Humpenöder, Alexander Popp, Jonathan Doelman, Detlef van Vuuren, Stefan Frank, Andrey Lessa Derci Augustynczik, Petr Havlik, Kanishka Balu Narayan, and Sonia Isabelle Seneviratne

Ambitious climate change mitigation scenarios typically include substantial amounts of carbon dioxide removal. Such negative emissions are projected by integrated assessment models (IAMs) to be partly provided by afforestation and reforestation. At present, only few IAMs incorporate climate information or natural forest disturbances of any kind on forest dynamics. In this study we show how exposed to fire weather the afforestation areas in the IAM projections are. We illustrate that IAM mitigation scenarios lack climate information to arrive at more realistic projections of carbon stocks in forests, more reliable land use distributions and more realistic forestation costs. In this work we combine forest fractional cover from IAM land use projections and fire weather index (FWI) from multi-model climate projections, based on the latest simulations assessed in the 6th assessment report of the IPCC. With this metric we show how forests and afforestation areas are and will be affected by fire weather. We find a strong upward trend of forest mean fire weather under a 2 °C warming scenario (SSP1-2.6 for both land use and climate, roughly compatible with 2.6 W/m² climate forcing) driven by afforestation more than by fire weather intensification, increasing exposure by 27 % by the end of the century. We argue that climate information, especially climate forcing of forest disturbances (fires, hot droughts, etc.) needs to be included in the modelling framework of IAMs. Such developments would enhance the consistency between emission and climate projections. While such efforts are underway, IAM scenarios currently available likely underestimate management cost of large scale afforestation or overestimate the effectiveness and hence the remaining carbon budget for positive emissions.

How to cite: Jäger, F., Quilcaille, Y., Schwaab, J., Windisch, M., Humpenöder, F., Popp, A., Doelman, J., van Vuuren, D., Frank, S., Lessa Derci Augustynczik, A., Havlik, P., Narayan, K. B., and Seneviratne, S. I.: Fire Weather Compromises Large Scale Afforestation Scenarios, EGU General Assembly 2023, Vienna, Austria, 23–28 Apr 2023, EGU23-12337, https://doi.org/10.5194/egusphere-egu23-12337, 2023.

EGU23-12656 | Orals | CL3.2.5

Constraining the carbon cycle in JULES-ES-1.0 

Douglas McNeall, Eddy Robertson, and Andy Wiltshire

Land surface models are widely used to study climate change and its impacts, but uncertainties in input parameter settings and model errors hamper their use. We use Uncertainty Quantification (UQ) techniques to constrain the input parameters of JULES-ES-1.0, the land surface component of the UK Earth system model UKESM1.0. We use an ensemble of historical simulations of the land surface model to rule out ensemble members and corresponding input parameter settings that do not match modern observations of the land surface and carbon cycle. Using a Gaussian Process emulator trained on the ensemble to predict the model output, we can repeat this process for parts of parameter space where the model is not yet tested. We use history matching - an iterated approach to constraining JULES-ES-1.0 - running an initial ensemble and training the emulator, before choosing a second wave of ensemble members consistent with historical land surface and carbon cycle observations. We rule out 88% of the initial input parameter space as being statistically inconsistent with observed land surface behaviour. We use the emulator to perform 3 types of sensitivity analysis to identify the most (and least) important input parameters for controlling the global output of JULES-ES-1.0, and provide information on how parameters might be varied to improve the performance of the model, eliminate model biases, and make better carbon cycle projections.

How to cite: McNeall, D., Robertson, E., and Wiltshire, A.: Constraining the carbon cycle in JULES-ES-1.0, EGU General Assembly 2023, Vienna, Austria, 23–28 Apr 2023, EGU23-12656, https://doi.org/10.5194/egusphere-egu23-12656, 2023.

EGU23-13183 | Orals | CL3.2.5 | Highlight

Inequality and the adoption of climate mitigation policies 

Margherita Bellanca, Marinella Davide, and Enrica De Cian

The objective of this study is to analyze how inequality affects the demand for emission reduction policies. It is generally recognized that a more equal income distribution can improve environmental quality (IPCC, 2022) influencing several mechanisms, such as the value placed on environmental public goods, the influence of social norms or the cost-benefit distribution of environmental protection. However, the focus so far has been on outputs (i.e., pollution concentration), disregarding the fact that a major component in determining the impact on the environment is the demand for – and implementation of – policies, which are the tools to actually define emission caps or incentivize green technologies.

To fill this gap, we explicitly focus on the relationship between inequality and environmental policies. Our leading research question is: how does the distribution of income affect the demand of emission reduction policies?

Our analysis covers national mitigation-related policies implemented in G20 countries between 1997 and 2021. We use the Climate Policy Database (Nascimento et al., 2022) to create indicators of policy adoption. In line with the policy density approach, we use the count of mitigation policies adopted annually by each country as dependent variable, and consider it as an approximation of climate policy demand.

To capture different aspects of income distribution, we adopt different inequality measures (WID, 2022). We consider the national income shares of specific parts of the population (Top 10%, Bottom 10%, Bottom 40%) as well as commonly used inequality indices (Gini index and Palma ratio). We also construct a composite index, which combines the Gini with the ratio of the income shares held by the top and bottom 10% (Sitthiyot & Holasut 2022). We interact our inequality indicators with GDP per capita (PPP), as we assume that the impact of inequality may differ according to the national income level.

Given the count data nature of our dependent variable, our empirical strategy is based on a fixed-effects Poisson regression model. We control for several institutional and policy-relevant variables.

Our results show that the impact of inequality on climate policy implementation depends on the country's average income level. While in wealthy countries a reduction of inequality leads to a lower number of mitigation policies, in poorer countries an increase in inequality may drive the adoption of new policies. At the same time, the effect of economic growth is also not straightforward: an increase in average income has a positive impact on policy adoption in low-inequality societies. Conversely, an average income increase has a negative impact on climate mitigation adoption in highly unequal societies.

Our findings confirm that inequality plays a key role in the adoption of national mitigation policies. These results, which are robust across multiple specifications of inequality indicators, highlight the importance of advancing knowledge on how equity and environmental challenges interact in order to get full support and progress with the climate agenda. Our results aim to inform the current policy debate on potential trade-offs between climate and equity by presenting new evidence on the interconnections between social and environmental goals.

How to cite: Bellanca, M., Davide, M., and De Cian, E.: Inequality and the adoption of climate mitigation policies, EGU General Assembly 2023, Vienna, Austria, 23–28 Apr 2023, EGU23-13183, https://doi.org/10.5194/egusphere-egu23-13183, 2023.

Integrated Assessment Models (IAMs) play an important role in climate policy decision making by combining knowledge from various domains into a single modelling framework. They serve as tools for informing and evaluating policies on the basis of economic, climatic and other interdisciplinary model components. However, IAMs have been criticised for simplifying assumptions, reliance on negative emission technologies, as well as for their power of shaping discourses around climate policy. Given these controversies and the importance of IAMs for international climate policy, model evaluation is essential in order to analyse how well IAMs perform and what to expect of them. While different proposals for evaluating IAMs exist, they typically target a specific subtype of model and are mostly reliant on a combination of abstract criteria and concrete evaluation methods. I enrich these perspectives by reviewing approaches from the philosophy of modelling and analysing their applicability to three canonical models covering the wide range of IAM types: DICE, REMIND, and IMAGE. The heterogeneity of IAMs and the political and ethical dimensions of their applications imply that any single evaluation criterion can not capture the complexities of IAMs. In order to allow for the inclusion of ethical, political and paradigmatic dimensions into the evaluation procedure, I take a closer look at model expectations, which I define as the conjunction of user aims, modelling purposes and evaluation criteria. Through this lens, I find that there is indeed a mismatch between model expectations and model capabilities. While DICE is a useful tool for investigating the effects of different assumptions, it should not be expected to provide quantitative guidance. IMAGE, on the other hand, has proven to be suitable for projecting environmental impacts, but should not be expected to analyse questions that require a description of macroeconomic processes. REMIND can be used for an assessment of different theoretically possible mitigation pathways, but should not be expected to provide accurate forecasts. I argue that this identified mismatch between what models can do and what is expected of them should be tackled by adjusting expectations to what IAMs can actually deliver, not by trying to make the models live up to outsized expectations. The main vehicle for adjusting expectations is a comprehensive and informative model commentary, that is, an account of the model's appropriate domain of application, critical modelling choices and assumptions, as well as the admissible interpretations of model results. However, I find that the analysed IAMs fail to deliver such a comprehensive and informative model commentary. Expectations for IAMs are often not clearly formulated, due to hard-to-assess user aims, vague purpose statements and opaque ethical dimensions. As clear expectations should form the basis of further evaluations of IAMs, I conclude that integrated assessment modellers should place much more emphasis on their model commentaries, with a special focus on the interpretation of IAM results.

How to cite: Schaumann, F.: What to expect of integrated assessment models: insights from philosophy, EGU General Assembly 2023, Vienna, Austria, 23–28 Apr 2023, EGU23-13832, https://doi.org/10.5194/egusphere-egu23-13832, 2023.

EGU23-14067 | ECS | Orals | CL3.2.5

Automatic and Open-Source Model with Forecasts for Climate Policy and Economics 

Moritz Schwarz, Jonas Kurle, Felix Pretis, and Andrew Martinez

Economic forecasts of the effects of climate policy are frequently based on static economic theory and are not regularly updated. Moreover, their source code is often not public, making replication and critical evaluation difficult. The predominant models used for climate policy narratives, so called Integrated Assessment Models, are rarely estimated using empirical data and are hence highly affected by the modeller’s assumptions. To improve the estimation of likely effects of climate policy, we present the “Aggregate Model”, a data-based model for dozens of countries that flexibly estimates and forecasts economic time series and allows for the simulation of different climate policy options. Data-based models need to incorporate long-term trends and account for both structural breaks and outliers that otherwise distort the model estimates and may lead to systematic forecast error. Our model uses various techniques from the time series literature, such as indicator saturation, model selection, and testing for co-integration. These techniques are automated to a high degree, simplifying the model estimation procedure.  The Aggregate Model is distributed as an open-source R package, allowing for simple replication and modification by users through its modular structure.

How to cite: Schwarz, M., Kurle, J., Pretis, F., and Martinez, A.: Automatic and Open-Source Model with Forecasts for Climate Policy and Economics, EGU General Assembly 2023, Vienna, Austria, 23–28 Apr 2023, EGU23-14067, https://doi.org/10.5194/egusphere-egu23-14067, 2023.

EGU23-14279 | ECS | Orals | CL3.2.5 | Highlight

Closing the loop between integrated assessment and climate risk research – rapid climate risk emulation 

Edward Byers, Michaela Werning, Volker Krey, and Keywan Riahi

Climate model emulation has long been and is increasingly applied to the results of integrated assessment modelling (IAM)models (IAMs), to determine the climate outcomes, primarily global mean surface temperature (GMST), of emissions pathways. Originally provided at the global level, more recently approaches have been developed to reproduce a growing number of climate variables, also with spatial, even gridded, resolution. Here we build on these approaches to demonstrate a workflow and post-processing package, that takes the GMST trajectory, e.g. from a simple climate model (SCM) and calculates a range of climate impacts and exposure indicators based on the GMST trajectory. To do this, we built a database of post-processed climate impacts from global climate [WM1] CMIP6 & ISIMIP-3 GCMs and impacts [WM2] models, and also calculated population and land area exposure to the indicators through time and for spatial units, e.g. countries. Indicators include temperature and precipitation extremes, heatwaves, degree days, drought intensity, water stress, and indicators of hydrological variability. Using a high-resolution temperature time timeslice approach, GMST trajectories are then mapped to the impact and exposure indicators to produce gridded maps of climate impacts through time, and trajectories of climate exposure by spatial unit. Using this approach we demonstrate the rapid post-processing of SCM [WM3] results such that ensembles of global IAM [WM4] mitigation pathways, such as those from AR6, can be accompanied by a new suite of climate impacts and risk information – and discuss related uncertainties and avenues for further research to incorporate vulnerabilities.

How to cite: Byers, E., Werning, M., Krey, V., and Riahi, K.: Closing the loop between integrated assessment and climate risk research – rapid climate risk emulation, EGU General Assembly 2023, Vienna, Austria, 23–28 Apr 2023, EGU23-14279, https://doi.org/10.5194/egusphere-egu23-14279, 2023.

Evaluating the impacts of climate change, be that on health, critical infrastructure, biodiversity, agriculture, economic impacts or any other sectors, requires a multi-sector, multi-scenario analysis.  Such analysis is only possible though integrated impact assessment models within a framework architecture that can handle the associated complexities of generating harmonized results from a heterogenous set of models and drivers. Addressing these challenges, the OpenCLIM framework has been developed to collate existing models from across sectors to form an open, extensible framework, which explores the impacts of climate change in a consistent, -scenario and -scale approach, using Great Britain as a case study. 

Domain-based, siloed approaches are no longer suitable for assessing climate change impacts and integrated assessment platforms where compound cross-sector risks can be assessed are now integral and expected. To this end, the OpenCLIM project has developed a novel, open framework, enabling the hosting of models for assessing climate hazard risks and potential impacts. The nature of the framework enables the coupling of disparate models to explore challenges considering trade-offs between possible interventions, such as the change in risk from increased temperatures when flood management infrastructure policy is applied to reduce flood risk, or the density of new buildings is changed. 

Implemented on the DAFNI (Data and Analytics Facility for National Infrastructure) platform, the framework uses the concepts of workflows in which models can be coupled and run with data and parameterisation passed between models while datasets are available within a shared data archive. A set of tools, or adaptors, to support coupling enable the ease of use and integration of new models into existing workflows, new workflows, or coupling of existing workflows. This flexible framework creates a powerful integrated impact assessment model, and when coupled with accessible data resources, such as climate scenarios and socio-economic datasets, offers a platform for assessing the impacts of climate change across domains. 

An example of the OpenCLIM platform is the assessment of the impact of flooding using the City Catchment Analysis Tool (CityCAT). Climate projections suggest a global increase in extreme rainfall events and the subsequent impact of flooding. Considering socio-economic changes to the urban environment, the OpenCLIM workflows couple future narratives for the urban landscape with flooding events of varying durations and intensities. Cost damage curves are then applied to assess the indicative economic cost of damages, facilitating comparisons between population density changes, climate extremes and the effectiveness of mitigation strategies/adaptation options. 

The OpenCLIM framework exemplifies an open, extendable, flexible integrated assessment model for climate impacts enabling cross-sector and compound risks to be assessed from human, nature, and economic aspects.  The concepts and tools explored and resolved within the framework, although initially with a GB focus, are applicable beyond these bounds where models and data exist.  

How to cite: Butters, O., Robson, C., and Smith, B.: OpenCLIM: A national scale framework for evaluating the effects of climate change for socio-economic scenarios and adaptation policies, EGU General Assembly 2023, Vienna, Austria, 23–28 Apr 2023, EGU23-14835, https://doi.org/10.5194/egusphere-egu23-14835, 2023.

EGU23-14884 | ECS | Orals | CL3.2.5

Spatially-resolved emulations of droughts and fire weather using MESMER-X 

Yann Quilcaille, Lukas Gudmundsson, and Sonia Seneviratne

Climate extremes are among the most impactful consequences of climate change. Moreover, droughts and fires may also hinder envisioned solutions to mitigate climate change, by reducing the efficiency of bio-energies with carbon capture storage and afforestation. Though, investigating such issues would benefit from a tool allowing fast computation of spatial climate extremes, for coupling to other models and exploration of scenarios. Here, we present an approach for emulating such extremes that are based on extensions of the spatially-resolved climate model emulator MESMER-X. In particular, we consider four annual indicators of the Canadian Fire Weather Index and the annual mean soil moisture derived from the Climate Model Intercomparison Project phase 6 for training and emulation. To emulate these indicators, we consider extensions to the framework that include the Gaussian and the Poisson distributions, non-linear evolutions of the parameters of the distribution and lagged effects. We show that the emulator reproduces the trajectories and the statistics of these annual indicators for fire weather and droughts accurately. By doing so, we show that the theoretical framework of MESMER-X can be applied for a large number of annual indicators of climate extremes.

How to cite: Quilcaille, Y., Gudmundsson, L., and Seneviratne, S.: Spatially-resolved emulations of droughts and fire weather using MESMER-X, EGU General Assembly 2023, Vienna, Austria, 23–28 Apr 2023, EGU23-14884, https://doi.org/10.5194/egusphere-egu23-14884, 2023.

EGU23-14996 | ECS | Posters on site | CL3.2.5

Quantifying the different forcing contributions to the climate under the adaptive emission scenarios. 

Donghyun Lee, Myles Allen, and Sarah Sparrow

The Intergovernmental Panel on Climate Change (IPCC) issued a special report on global warming of 1.5°, emphasizing the necessity of urgent and strict mitigation policies to achieve the warming levels of the Paris Agreement. To explore the possible worlds at the warming levels of the Paris Agreement, a brand-new experiment, the adaptive emission reduction approach (AERA), is launched, calibrating the future CO2 emission pathways by considering the transient climate response of the model to the cumulative emission amount of CO2 forcing equivalent (CO2-fe).

While waiting for the AERA protocol results with expensive tools, Earth System Models (ESMs), we explore the likely range of adaptive emission scenario runs by utilizing the fastest and most effective tools. Here we suggest the simple emulator, FaIR, composed of three thermal energy boxes and four carbon-cycle pools. We tested thousands of FaIR ensembles to perform the AERA algorithm and confirm the capability of FaIR to estimate the likely ranges of ESMs. Notably, this FaIR can act as the bridge for inter-mediate complexity models (e.g., HadCM3 and CLIMBER-X) to interact with the AERA algorithm by emulating the carbon-cycle characteristics part of GCMs.

Despite different climate sensitivity in ensemble members, 2450 FaIR, nine HadCM3-FaIR, and six CLIMBER-FaIR ensembles well stabilized at the target temperatures of 1.5°C and 2.0°C by 2100. The residual cumulative emission amount of CO2-fe since 2021 is about 0.71 and 1.77 TtCO2-fe for 1.5°C and 2.0°C levels. We further quantified the contributions from each anthropogenic forcings to the climate of mitigated worlds with FaIR emulations. While CO2 is the most dominant driver for 2.0°C warming (about 83% of total warming), anthropogenic aerosol plays a vital role in stabilizing a warming level at 1.5°C. The reduction of aerosols by 2100 additionally provides positive radiative forcings, and this size is equivalent to the increase in CO2-fe emission amount of 1 TtCO2-fe, which leads to the temperature rise by 0.57°C. The non-CO2 GHG (like methane or fluorinated gases) offsets the emission amount of CO2-fe about 0.57 TtCO2-fe and reduces the warming levels by 0.35°C. Despite the considerable uncertainty in climate responses to anthropogenic aerosols, our results illustrate their notable contributions, at least for the 1.5°C world. In addition, we plan to explore the forcing-driven contributions to the changes in precipitation based on the equations reflecting the favorable atmospheric energy conditions to precipitate.


How to cite: Lee, D., Allen, M., and Sparrow, S.: Quantifying the different forcing contributions to the climate under the adaptive emission scenarios., EGU General Assembly 2023, Vienna, Austria, 23–28 Apr 2023, EGU23-14996, https://doi.org/10.5194/egusphere-egu23-14996, 2023.

EGU23-15660 | ECS | Orals | CL3.2.5

Probabilistic climate emulation with physics-constrained Gaussian processes 

Shahine Bouabid, Dino Sejdinovic, and Duncan Watson-Parris

Emulators, or reduced complexity climate models, are surrogate Earth system models that produce projections of key climate quantities with minimal computational resources. Using time-series modeling or more advanced machine learning techniques, statistically-driven emulators have emerged as a promising venue, producing spatially resolved climate responses that are visually indistinguishable from state-of-the-art Earth system models. Yet, their lack of physical interpretability limits their wider adoption. In fact, the exploration of future emission scenarios still relies on one-dimensional energy balance models which can lack the flexibility to capture certain climate responses.

Here, we propose a statistically-driven emulator that hinges on an energy balance model. Using Gaussian processes, we formulate an emulator of temperature response that exactly satisfies the physical thermal response equations of an energy balance model. The result is an emulator that (1) enjoys the flexibility of statistical machine learning models and can be fitted against observations to produce spatially-resolved predictions (2) has physically-interpretable parameters that can be used to make inference about the climate system. This model shows skilfull prediction of annual mean global distribution of temperature, even over scenarios outside the range of observed emissions of greenhouse gases and aerosols during training — improvement in RMSE of 27% against the energy balance model and of 60% against a physics-free machine learning model. In addition, the Bayesian nature of our formulation provides a principled way to perform uncertainty quantification on the predictions.

We outline how the probabilistic nature of this emulator makes it a natural candidate for detection and attribution studies and discuss extension to a precipitation emulator also incorporating physical constraints. We hope that by combining the ability of machine learning techniques to capture complex patterns with the interpretability of energy balance models, our work will produce a reliable tool for efficiently and accurately exploring future climates.

How to cite: Bouabid, S., Sejdinovic, D., and Watson-Parris, D.: Probabilistic climate emulation with physics-constrained Gaussian processes, EGU General Assembly 2023, Vienna, Austria, 23–28 Apr 2023, EGU23-15660, https://doi.org/10.5194/egusphere-egu23-15660, 2023.

EGU23-16600 | Orals | CL3.2.5

Extending MESMER-M to jointly emulate Earth System Model temperature and precipitation realizations 

Sarah Schöngart, Quentin Lejeune, Lukas Gudmundsson, Shruti Nath, Sonia Seneviratne, and Carl-Friedrich Schleußner

Emulators of Earth System Models (ESM) are runtime efficient models that mimic the behavior of an ESM using simple statistical methods. Because of their low complexity, emulators allow to quickly generate thousands of realizations of high-resolution data. Thus, they have proven to be valuable tools for exploring the emission space, quantifying different sources of uncertainty, and investigating extreme events. In this contribution, we introduce an extension to the Modular Earth System Model Emulator (MESMER) for generating monthly precipitation fields. Precipitation is emulated based off monthly temperature such that also the joint precipitation-temperature characteristics match the distribution of the underlying climate model. The emulation consists of two steps. First, the logarithm of precipitation at each location is assumed to depend linearly on temperatures at selected other locations nearby. The selected locations and the linear coefficients are optimized using a Lasso Regression. This step thus yields a deterministic precipitation response that encodes spatiotemporal relationships between precipitation at a given location and temperature at surrounding locations. Second, the residual variability is assumed to be independent from temperature and is modelled as a multi-dimensional noise process containing spatial correlations. The emulator is trained and tested on CMIP6 data. We show that the emulation set-up performs well in simulating the annual cycle, long-term trends in monthly precipitation as well as spatial patterns and natural variability of the underlying climate model. This offers a promising avenue for, as a next step, extending the MESMER emulation framework to other variables.

How to cite: Schöngart, S., Lejeune, Q., Gudmundsson, L., Nath, S., Seneviratne, S., and Schleußner, C.-F.: Extending MESMER-M to jointly emulate Earth System Model temperature and precipitation realizations, EGU General Assembly 2023, Vienna, Austria, 23–28 Apr 2023, EGU23-16600, https://doi.org/10.5194/egusphere-egu23-16600, 2023.

Previous studies with coarse-resolution global climate models (GCMs) have widely shown that extensive deforestation in the Amazon leads to a reduction in precipitation, with a potential irremediable loss of the rainforest past a critical threshold. However, precipitation in the Amazon region is of convective nature and thus has to be parameterized in coarse-resolution GCMs, limiting confidence in the results of such studies. To bypass this limitation, this study aims to investigate the impact of Amazon deforestation on precipitation in global climate simulations that can explicitly represent convection. The simulations are conducted with the ICON-Sapphire atmosphere-only model configuration run with a grid spacing of 5 km for two years. To understand the impacts of Amazon deforestation, we compare the results of a complete deforestation simulation with a control simulation. Results show no significant change in precipitation during the wet season and a slight decrease of precipitation during the dry season in the deforested simulation. Precipitation decreases due to decreased evapotranspiration are compensated by enhanced moisture convergence.

How to cite: Yoon, A.: The impact of Amazon deforestation on rain system using a storm-resolving global climate model, EGU General Assembly 2023, Vienna, Austria, 23–28 Apr 2023, EGU23-1304, https://doi.org/10.5194/egusphere-egu23-1304, 2023.

The current crisis state of the planet, commonly called the Anthropocene, emerged as the result of the Great Acceleration in human consumption and environmental impact which followed the Second World War in the middle of the 20th c. There is growing evidence suggesting that similar acceleration dynamics, characterised by exponential growth in human environmental impact, occurred locally or regionally at earlier stages in human history. It is, however, difficult to identify, quantify, and confirm such cases without high-resolution, well-dated historical or paleoenvironmental data. In this presentation, I review three cases of well-documented Anthropocene-like accelerations, from Roman Anatolia, medieval Poland, and early modern Greece. In all of these cases, it was political consolidation, even if short-lived, as well as economic integration, that created the social tipping point triggering exponential acceleration of human environmental impact. All of these acceleration phases also collapsed once the underlying social dynamics was no longer present.

How to cite: Izdebski, A.: Social tipping points of Anthropocene acceleration dynamics in European history, from Roman times to the Little Ice Age, EGU General Assembly 2023, Vienna, Austria, 23–28 Apr 2023, EGU23-3151, https://doi.org/10.5194/egusphere-egu23-3151, 2023.

Many aspects of anthropogenic global change, such as land cover change, biodiversity loss, and the intensification of agricultural production, threaten the natural biosphere. Implications of these specific aspects of environmental conditions are not immediately obvious, so it is hard to obtain a bigger picture of what these changes imply and distinguish beneficial from detrimental human impacts.  Here I describe a holistic approach that provides a bigger picture and use it to understand how the terrestrial biosphere can be sustained in the presence of increased human activities.  This approach focuses on the free energy generated by photosynthesis, the energy needed to sustain both the dissipative metabolic activity of ecosystems and human activities, with the generation rate being set by the physical constraints of the environment.  One can then distinguish two kinds of human impacts on the biosphere: detrimental effects caused by enhanced human consumption of this free energy, and empowering effects that allow for more photosynthetic activity and, therefore, more dissipative activity of the biosphere.  I use examples from the terrestrial biosphere to illustrate this view and global datasets to show how this can be estimated.  I then discuss how certain aspects of modern technology can enhance the free energy generation of the terrestrial biosphere, which can then safeguard its sustenance even as human activity increasingly shapes the functioning of the Earth system.

Note: Presentation is based on this manuscript (https://arxiv.org/abs/2210.09164), accepted for publication in the INSEE journal.

How to cite: Kleidon, A.: How to sustain the terrestrial biosphere in the Anthropocene? A thermodynamic Earth system perspective, EGU General Assembly 2023, Vienna, Austria, 23–28 Apr 2023, EGU23-3251, https://doi.org/10.5194/egusphere-egu23-3251, 2023.

EGU23-3443 | Orals | CL3.2.6 | Highlight

Regional Climate Expected to Continue to Change Significantly After Net-Zero CO2 Emissions Reached 

Andrew H. MacDougall, Josie Mallett, David Hohn, and Nadine Mengis

The Zero Emissions Commitment (ZEC) is the expected temperature change following the cessation of anthropogenic emissions of climate altering gases and aerosols. Recent model intercomparison work has suggested that global average ZEC for CO2 is close to zero. However there has thus far been no effort to explore how temperature is expected to change at spatial scales smaller than the global average. Here we analyze the output of nine full complexity Earth System Models which carried out standardized ZEC experiments to quantify the ZEC from CO2. The models suggest that substantial temperature change following cessation of emissions of CO2 can be expected at large and regional spatial scales. Large scale patterns of change closely follow long established patterns seen during modern climate change, while at the regional scale patterns of change are far more complex and show little consistency between different models. Analysis of model output suggest that for most models these changes far exceed pre-industrial internal variability, suggesting either higher climate variability, continuing changes to climate dynamics or both. Thus it appears likely that at the regional scale, where climate change is directly experienced, climate disruption will not end even as global temperature stabilizes. Such indefinite continued climate changes will test the resilience of local ecosystem and human societies long after economic decarbonization is complete. Overall substantial regional changes in climate are expected following cessation of CO2 emissions but the pattern, magnitude and sign of these changes remains highly uncertain.

How to cite: MacDougall, A. H., Mallett, J., Hohn, D., and Mengis, N.: Regional Climate Expected to Continue to Change Significantly After Net-Zero CO2 Emissions Reached, EGU General Assembly 2023, Vienna, Austria, 23–28 Apr 2023, EGU23-3443, https://doi.org/10.5194/egusphere-egu23-3443, 2023.

EGU23-5233 | Posters on site | CL3.2.6

Association for Trans-Eurasia Exchange and Silk-Road Civilization Development 

Likun Ai, Juzhi Hou, Haichao Xie, Yanbo Yu, and Fahu Chen

Spanning more than 6,400 kilometers across Eurasia, the Silk Road played a key role in facilitating exchanges in economy, culture, politics, and religions between East and West. The ancient Silk Road was one of the most important passages for trans-Eurasia exchange and human migrations, which could be traced back to 5000-4000 years before present. To deepen understanding of the effects of environmental changes in shaping the long-term trans-Eurasia exchanges and Silk Road civilization, the Trans-Eurasia Exchange and Silk-Road Civilization Development (ATES) was launched by a group of scientists with background of climate, hydrology, environment, archaeology in 2019. There are about 118 scientists from 10 countries that with different background have joined the ATES so far. ATES now has a President, and three coordinators in the secretariat, and all the alliance members are allocated to the 5 Working Groups (WG) based on their background and research interests. The main scientific issues for the ATES are: 1) Routes and driving forces of ancient human migrations across Eurasia in the Paleolithic; 2) Relationship between the food globalization, development of agro-pastoralism in Eurasia and human migration in the Neolithic; 3) Mechanisms of establishment, shift and demise of routes and key towns along the ancient Silk Road; 4) Effects of environmental changes on the rise and fall of the Silk Road civilization as to the trans-Eurasia exchanges in terms of economy, technology and culture. What does it tell us about the future of ongoing climate change? ATES aims to set an international platform to exchange multi-discipline knowledge and the latest research achievement on the ancient Silk Road, including exchanges of culture, science, and technology along the roads, perceptions of climate change, and socio-economic development in different historical periods along the Silk Road, and effects of environmental changes on the rise and fall of the Silk Road civilization.

ATES welcomes institutes and scientists worldwide to initiate and launch relevant research programs and projects with the ATES community. By establishing several joint research and education centers with partners, ATES facilitates and supports field observations, research, and capacity building. Training of Young Scientists is one of the main tasks for ATES capacity building, which includes the training workshops and field learnings organized by ATES and its partners. In order to strengthen the interaction of the ATES community, and to enhance the exchange of new achievements and insights of the interdisciplinary study on the evolution of trans-Eurasia exchanges and Silk Road civilization, the ATES Silk Road Civilization Forum invites a world-renowned scientist to give a special lecture on the focused topic every 3 months. ATES will organize parallel sessions and side meetings in the big events such as AGU, EGU, Conference of the Parties of the UNFCCC, UNCBD, ANSO conference, et al. ATES partners and other institutes are welcome to join in organizing the above meetings.

How to cite: Ai, L., Hou, J., Xie, H., Yu, Y., and Chen, F.: Association for Trans-Eurasia Exchange and Silk-Road Civilization Development, EGU General Assembly 2023, Vienna, Austria, 23–28 Apr 2023, EGU23-5233, https://doi.org/10.5194/egusphere-egu23-5233, 2023.

EGU23-5722 | ECS | Orals | CL3.2.6 | Highlight

Recurrent droughts increase risk of cascading tipping events by outpacing adaptive capacities in the Amazon rainforest 

Nico Wunderling, Arie Staal, Frederik Wolf, Boris Sakschewski, Marina Hirota, Obbe A. Tuinenburg, Jonathan F. Donges, Henrique M.J. Barbosa, and Ricarda Winkelmann

Since the foundational paper by Lenton et al. (2008, PNAS), tipping elements in the climate system have attracted great attention within the scientific community and beyond. One of the most important tipping elements is the Amazon rainforest. Under ongoing global warming, it is suspected that extreme droughts such as those in 2005 and 2010 occur significantly more often, up to nine out of ten years from the mid to late 21st century onwards (e.g. Cox et al., 2008, Nature; Cook et al., 2020, Earth’s Future).

In this work, we quantify how climates ranging from normal rainfall conditions to extreme droughts may generate cascading tipping events through the coupled forest-climate system. For that purpose, we make use of methods from nonlinear dynamical systems theory and complex networks to create a conceptual model of the Amazon rainforest, which is dependent on itself through atmospheric moisture recycling.

We reveal that, even when the rainforest is adapted to past local conditions of rainfall and evaporation, parts of the rainforest may still tip when droughts intensify. We uncover that forest-induced moisture recycling exacerbates tipping events by causing tipping cascades that make up to one-third (mean+-s.d. = 35.9+-4.9%) of all tipping events. Our results imply that if the speed of climate change might exceed the adaptation capacity of the forest, knock-on effects through moisture recycling impede further adaptation to climate change.

Further, we use a network analysis method to compare the four main terrestrial moisture recycling hubs: the Amazon Basin, the Congo Rainforest, South Asia and the Indonesian Archipelago. By evaluating so-called network motifs, i.e. local-scale network structures, we quantify the fundamentally different functioning of these regions. Our results indicate that the moisture recycling streams in the Amazon Basin are more vulnerable to disturbances than in the three other main moisture recycling hubs.

How to cite: Wunderling, N., Staal, A., Wolf, F., Sakschewski, B., Hirota, M., Tuinenburg, O. A., Donges, J. F., Barbosa, H. M. J., and Winkelmann, R.: Recurrent droughts increase risk of cascading tipping events by outpacing adaptive capacities in the Amazon rainforest, EGU General Assembly 2023, Vienna, Austria, 23–28 Apr 2023, EGU23-5722, https://doi.org/10.5194/egusphere-egu23-5722, 2023.

EGU23-7871 | Posters on site | CL3.2.6 | Highlight

Is the current methane growth event comparable to a glacial/interglacial Termination event? 

Euan Nisbet, Martin Manning, David Lowry, Rebecca Fisher, and James France

Atmospheric methane shows very sharp growth since 2006. Growing evidence for methane's main sink, atmospheric OH, being relatively stable implies a major increase in methane emissions is occurring. Methane's synchronous isotopic shift to more negative d13C(CH4) values means the increase is primarily driven by rapid growth in emissions from biogenic sources, such as natural wetlands and agriculture. Recent acceleration in the increase is also strong evidence that it is too large to be caused primarily by anthropogenic sources. Instead, much of the growth may come from large-scale climate-change feedbacks affecting the productivity and balance between methanogenic and methanotrophic processes in tropical and boreal wetlands. Emissions from tropical wetlands in particular may be larger and more influenced by climate shifts than hitherto realised. If so, even despite the Global Methane Pledge, achieving the goals of the UN Paris Agreement may be much harder than previously anticipated.

Modelling indicates that, for scale and speed, the biogenic feedback component of methane's growth and isotopic shift in the 16 years from 2006-2022 is comparable to (or greater than) phases of abrupt growth and isotopic shift during glacial/interglacial terminations, from Termination V (about 430 ka BP) to Termination I that initiated the Holocene. These were rapid global-scale climate shifts when the Earth system reorganised from cold glacial to warmer interglacial conditions.  Methane's recent 2006-2022 growth in biogenic sources may be within Holocene variability, but it is also a possibility that methane may be providing the first indication that a very large-scale end-of-Holocene reorganisation of the climate system is already under way: Termination Zero.

How to cite: Nisbet, E., Manning, M., Lowry, D., Fisher, R., and France, J.: Is the current methane growth event comparable to a glacial/interglacial Termination event?, EGU General Assembly 2023, Vienna, Austria, 23–28 Apr 2023, EGU23-7871, https://doi.org/10.5194/egusphere-egu23-7871, 2023.

EGU23-9387 | ECS | Posters on site | CL3.2.6

Robustness of critical slowing down indicators to power-law extremes in an Amazon rainforest model 

Vitus Benson, Jonathan F. Donges, Jürgen Vollmer, and Nico Wunderling

Critical slowing down has recently been detected as an indicator of reduced resilience in remotely sensed data of the Amazon rainforest [1]. Tropical rainforests are frequently hit by disturbances such as fire, windthrow, deforestation or drought, which are known to follow a heavy-tailed amplitude distribution. Early warning signals based on critical slowing down are theoretically grounded for systems under the influence of weak, Gaussian noise. Hence, it is not imminent that they are applicable also for systems like the Amazon rainforest, which are influenced by heavy-tailed noise. Here, we extended a conceptual model of the Amazon rainforest [2] to study the robustness of critical slowing down indicators to power-law extremes. These indicators are expected to increase before a critical transition. 

We find the way by which such an increase is detected is decisive for the recall of the early warning indicator (i.e. the proportion of critical transitions detected by the indicator). If a linear slope is taken, the recall of the early warning signal is reduced under power-law extremes. Instead, the Kendall-Tau rank correlation coefficient should be used because the recall remains high in this case. Other approaches to increase robustness, like a high-pass filter or the interquartile range, are less effective. In [1], reduced resilience of the Amazon rainforest was determined through an increase in the lag-1 autocorrelation measured by the Kendall-tau rank correlation. Hence, if there was a resilience loss, they can correctly detect it even in the presence of relatively strong power-law disturbances. However, we also quantify the false positive rate, that is, how often a resilience loss is measured if the model represents a stable rainforest. At a significance level of 5% (1%, 10%) for the early warning signal detection, the false positive rate is approximately 10% (5%, 15%). For strong heavy-tailed noise, this false positive rate can deteriorate to as high as 25% (15%, 35%). This indicates, that increasing critical slowing down may not always be caused by an approaching critical transition, a false positive detection is possible.


[1] Boulton, C.,  Lenton, T.  and Boers, N.: “Pronounced Loss of Amazon Rainforest Resilience since the Early 2000s”. Nature Climate Change 12-3 (2022).

[2] Van Nes, E., Hirota, M., Holmgren, M. and Scheffer, M.: “Tipping Points in Tropical Tree Cover”. Global Change Biology 20-3 (2014).

How to cite: Benson, V., Donges, J. F., Vollmer, J., and Wunderling, N.: Robustness of critical slowing down indicators to power-law extremes in an Amazon rainforest model, EGU General Assembly 2023, Vienna, Austria, 23–28 Apr 2023, EGU23-9387, https://doi.org/10.5194/egusphere-egu23-9387, 2023.

EGU23-9954 | ECS | Posters on site | CL3.2.6

Climate tipping risks under policy-relevant overshoot temperature pathways 

Tessa Möller, Ernest Annika Högner, Samuel Bien, Carl-Friedrich Schleussner, Johan Rockström, Jonathan F. Donges, and Nico Wunderling

The risk of triggering multiple climate tipping points if global warming levels were to exceed 1.5°C has been heavily discussed in recent literature. Current climate policies are projected to result in 2.7°C warming above pre-industrial levels by the end of this century and will thereby at least temporarily overshoot the Paris Agreement temperature goal.

Here, we assess the risk of triggering climate tipping points under overshoot pathways derived from emission pathways and their uncertainties from the PROVIDE ensemble using PyCascades, a stylised network model of four interacting tipping elements including the Greenland Ice Sheet, the West Antarctic Ice Sheet, the Atlantic Meridional Overturning Circulation, and the Amazon Rainforest.

We show that up until 2300, when overshoots are limited to 2°C, the upper range of the Paris Agreement goal, the median risk of triggering at least one element would be less than 5%, although some critical thresholds may have been crossed temporarily. However, the risk of triggering at least one tipping element increases significantly for scenarios that peak above the Paris Agreement temperature range. For instance, we find a median tipping risk in 2300 of 46% for an emission scenario following current policies. Even if temperatures would stabilize at 1.5°C after having peaked at temperatures projected under current policies, the long-term median tipping risks would approach three-quarters.

To limit tipping risks beyond centennial scales, we find that it is crucial to constrain any temperature overshoot to 2°C of global warming and to stabilize global temperatures at 1.0°C or below in the long-term.

How to cite: Möller, T., Högner, E. A., Bien, S., Schleussner, C.-F., Rockström, J., Donges, J. F., and Wunderling, N.: Climate tipping risks under policy-relevant overshoot temperature pathways, EGU General Assembly 2023, Vienna, Austria, 23–28 Apr 2023, EGU23-9954, https://doi.org/10.5194/egusphere-egu23-9954, 2023.

EGU23-10044 | ECS | Orals | CL3.2.6 | Highlight

The Impact of Solar Radiation Modification on Earth System Tipping Points and Threshold Free Feedbacks 

Gideon Futerman and Claudia Wieners

The modification of the climate by Solar Radiation Modification (SRM) could be a potentially important human-Earth System interaction in the Anthropocene, having potentially beneficial and adverse impacts across climatic and human indices. SRM would likely interact with Earth system resilience in many ways, with our paper exploring SRM’s interaction with Earth System tipping point which has been extremely underexplored in the literature thus far.

SRM would likely be able to reduce global mean surface temperature quickly, although its broader climate imprint, especially on precipitation and local climatic conditions, is not the same as reversing greenhouse gas emissions. Its cooling effect suggests that SRM can help stop us from hitting those tipping elements that are most temperature-dependent, while the situation is more complex for tipping elements which strongly depend on other factors such as precipitation or regional climate changes. This more complex picture could have important implications for the role (or lack of) that SRM could and ought to play in improving Earth system resilience in the Anthropocene.

We review the available literature about the influence of SRM on the tipping elements and threshold free-feedbacks identified by McKay et al. (2022), as well as reviewing the impact of SRM on relevant climatic conditions that could contribute to tipping of each element, to give an assessment of the potential beneficial or adverse impact of SRM and identify key uncertainties and knowledge gaps. We will also briefly assess how these impacts may differ with different methods of deployment and with the termination of SRM.

How to cite: Futerman, G. and Wieners, C.: The Impact of Solar Radiation Modification on Earth System Tipping Points and Threshold Free Feedbacks, EGU General Assembly 2023, Vienna, Austria, 23–28 Apr 2023, EGU23-10044, https://doi.org/10.5194/egusphere-egu23-10044, 2023.

EGU23-10864 | Posters on site | CL3.2.6

Towards the Anthropocene peatlands and forests – old-growth forest loss in Western Poland initiated peat growth and peatland state shifts 

Mariusz Lamentowicz, Sambor Czerwiński, Monika Karpińska-Kołaczek, Piotr Kołaczek, Mariusz Gałka, Piotr Guzowski, and Katarzyna Marcisz

During European states’ development, various past societies utilized natural resources, but their impact was not uniformly spatially and temporally distributed. Considerable changes resulted in landscape fragmentation, especially during the Middle Ages. Changes in state advances that affected the local economy significantly drove the trajectories of ecosystems’ development. The legacy of significant changes from pristine forests to farming is visible in natural archives as novel ecosystems. Here, we present two high‑resolution, densely dated multi‑proxy studies covering the last 1000 years from peatlands in CE Europe. In that case, the economic activity of medieval societies was related to the emerging Polish state and new rulers, the Piasts (in Greater Poland) and the Joannites (the Order of St. John of Jerusalem, Knights Hospitaller). Our research revealed rapid deforestation and subsequent critical land-use transition in the high and late Middle Ages and its consequences on the peatland ecosystem development. The shift from the old-growth forests correlates well with raising the local economy, deforestation and enhanced peat initiation. Along with the emerging landscape openness, the wetlands switched from wet fen with open water to terrestrial habitats. Both sites possess a different timing of the shift, but they also show that the catchment deforestation caused accelerated terrestrialization. Our data show how closely the ecological state of wetlands relates to forest microclimate. We identified a significant impact of economic development and the onset of intensive agriculture processes near the study sites. Our results revealed a surprisingly fast rate at which the feudal economy eliminated pristine nature from the studied area and led to intensive nature exploitation in the Anthropocene. In consequence, its activities led to the creation of novel peatlands types.

How to cite: Lamentowicz, M., Czerwiński, S., Karpińska-Kołaczek, M., Kołaczek, P., Gałka, M., Guzowski, P., and Marcisz, K.: Towards the Anthropocene peatlands and forests – old-growth forest loss in Western Poland initiated peat growth and peatland state shifts, EGU General Assembly 2023, Vienna, Austria, 23–28 Apr 2023, EGU23-10864, https://doi.org/10.5194/egusphere-egu23-10864, 2023.

EGU23-13587 | ECS | Posters virtual | CL3.2.6

Model hierarchies and bifurcations in QE monsoon models 

Krishna Kumar S and Ashwin K Seshadri

The convective quasi-equilibrium (CQE) framework has been successfully employed in the past to build intermediate complexity models accounting for the interaction of convection and large-scale dynamics (Neelin and Zeng, 1999, JAS). As a consequence, these models find use in the study of monsoon circulations, which also experience abrupt onset among several other intriguing features. While some low-order simplifications of CQE based Quasi-equilibrium tropical circulation model (QTCM) yields insights into the mechanisms of monsoon dynamics, they are restricted in the range of processes accounted for. A hierarchy of models, on the other hand, would serve well to study monsoon dynamics and various influences. While the existence of bifurcations or 'tipping-points' in monsoon dynamics has been studied for certain simple models, a thorough investigation of this possibility across a hierarchy of models is absent. Such a hierarchy of models would provide an understanding of effects of different simplifying assumptions on dominant balances in the momentum and thermodynamic equations and resulting nonlinear dynamics, including the choice of precipitation parameterizations. This study explores a hierarchy of such models of varying complexity, based on the QTCM equations. The potential occurrence of bifurcation phenomena are considered, along with their sensitivity to various parameter changes, in the context of the role of different nonlinearities present in these models. The study builds on recent results interpreting the suppression of bifurcation phenomena in these models, as a result of shifts in equilibrium branches and consequently their physical relevance. The hierarchy of models approach, in this context, reconciles apparent contradictions between bifurcations being observed in the simplest models and the evidence from more complex models as well as observations, while identifying robust phenomena.

How to cite: Kumar S, K. and Seshadri, A. K.: Model hierarchies and bifurcations in QE monsoon models, EGU General Assembly 2023, Vienna, Austria, 23–28 Apr 2023, EGU23-13587, https://doi.org/10.5194/egusphere-egu23-13587, 2023.

EGU23-13620 | Orals | CL3.2.6

The Western Amazon social-ecological system at risk of tipping: A transdisciplinary modelling approach 

Benjamin Stuch, Rüdiger Schaldach, Regine Schönenberg, Katharina Meurer, Merel Jansen, Claudia Pinzon Cuellar, Shabeh Ul Hasson, Christopher Jung, Ellen Kynast, Jürgen Böhner, and Hermann Jungkunst

The Amazon rainforest is a tipping element of the global climate system due to its high carbon storage potential and its flying rivers providing rain for South America. Studies suggest that land use and land cover change (LUCC) in the Amazon, i.e. deforestation, strongly disturb regional convectional rain pattern, which could lead to an increase of drought frequencies and intensities. Under increasing drought stress, the evergreen tropical rainforest may transform into a seasonal forest or even a savannah ecosystem. Such a transformation would likely activate the Amazon tipping element and may affect global climate change by triggering other critical tipping elements of the global climate system.  

Here we present our transdisciplinary research approach in the Western Amazon rainforest developed in context of the PRODIGY research project. We apply a social-ecological system approach to account for the dynamic interactions and feedbacks between people and nature, which could either stabilize or self-enforce regional tipping cascades. For example, regional land users may suffer declining yield and net primary production from decreasing precipitation. Land users may compensate the drop in production/income e.g. by cultivating more land or seeking for other income sources. As a response, deforestation could increase which may drive a self-enforcing feedback loop that further decrease precipitation.

In a participatory process, together with regional stakeholders we develop land use related explorative scenarios. Preliminary results from the scenario exercise show that future agricultural production increases in all scenarios (crops between 20% and 200% and livestock between 0% and 300%). In the first modelling step, these  changes drive the regionally adjusted spatial land system model LandSHIFT. Simulation results indicate that deforestation increases in all scenarios depending on the production technology and the reflexivity of institutions establishing appropriate management options.

In an integrated modelling step, the calculated LUCC maps serve as input to a regional climate model (WRF), which simulates respective changes in regional temperature and precipitation. Then, temperature and precipitation changes are applied to the biogeochemical model CANDY to simulate the impact (of regional deforestation) on crop yields, Net Primary Production (NPP) and changes in soil C and N cycling. In an iterative process, the yield and NPP responses are fed back to the land-use change model to simulate the required land use adaptations, accordingly. By closing the feedback loop between deforestation, climate, yield and NPP as well as respective land use adaptation, we are able to simulate a cascade of endogenous key process in the regions social ecological system. The integrated modelling results will support the stakeholders in identifying key measures/options/policies that could increase resilience of the regional social-ecological system to prevent crossing destructive regional tipping points.

How to cite: Stuch, B., Schaldach, R., Schönenberg, R., Meurer, K., Jansen, M., Pinzon Cuellar, C., Ul Hasson, S., Jung, C., Kynast, E., Böhner, J., and Jungkunst, H.: The Western Amazon social-ecological system at risk of tipping: A transdisciplinary modelling approach, EGU General Assembly 2023, Vienna, Austria, 23–28 Apr 2023, EGU23-13620, https://doi.org/10.5194/egusphere-egu23-13620, 2023.

Microbial communities in freshwater lake sediments play a crucial role in regulating geochemical cycles and controlling greenhouse gas emissions. Many of them exhibit a highly ordered structure along depth profile. Besides redox effect, sediment stratification could also reflect historical transition. Dam construction dramatically increased in the mid-20th century and is considered one of the most far-reaching anthropogenic modifications of aquatic ecosystems. Here we attempted to identify the effect of historical dam construction on sediment microbial zonation in Lake Chaohu, one of the major freshwater lakes in China. The damming event in AD 1962 was coincidentally labeled by the 137Cs peak. Physiochemical and sequencing analyses (16S amplicon and shotgun metagenomics) jointly showed a sharp transition occurred at the damming-labeled horizon which overlapped with the nitrate-methane transition zone (NMTZ) and controlled the depth of methane sequestration. At the transition zone, we observed significant taxonomic differentiation. Random forest algorithm identified Bathyarchaeota, Spirochaetes, and Patescibacteria as the damming-sensitive phyla, and Dehalococcoidia, Bathyarchaeia, Marine Benthic Group A, Spirochaetia, and Holophagae as the damming-sensitive classes. Phylogenetic null model analysis also revealed a pronounced shift in microbial community assembly process, from a selection-oriented deterministic community assembly down to a more stochastic, dispersal-limited one. These findings delineate a picture in which dam-induced changes to the lake trophic level and sedimentation rate generate great changes in sediment microbial community structure, energy metabolism, and assembly process.

How to cite: Zhou, X. and Ruan, A.: Dam construction as an important anthropogenic modification triggers abrupt shifts in microbial community assembly in freshwater lake sediments, EGU General Assembly 2023, Vienna, Austria, 23–28 Apr 2023, EGU23-14360, https://doi.org/10.5194/egusphere-egu23-14360, 2023.

EGU23-14772 | Posters on site | CL3.2.6

Sustainable Pathways under Climate Variability 

Kira Rehfeld and the SPACY research group members

External forcings and feedback processes of the Earth system lead to timescale and state-dependent climate variability, causing substantial surface climate fluctuations in the past. Particularly relevant for future livelihoods, changing variability patterns could also modify the occurrence of extreme events. However, spatiotemporal mechanisms of climate variability are poorly understood. Likewise, the societal implications are weakly constrained, particularly variability’s potential to drive sustainable transformation. The SPACY project investigates climate variability from past cold and warm periods to future scenarios. One research focus is how forcing mediates climate fluctuations. Bridging the gap between Earth system models and palaeoclimate proxies, we study vegetation and water isotope changes. A second focus is exploring sustainable pathways under climate variability, addressing potential interactions between artificial carbon dioxide removal and surface climate, among others.


In particular, we validate the ability of climate models to represent potential climate variability changes. Here, we focus on isotope-enabled simulations with dynamic vegetation. We find that models exhibit less local temperature and water isotope variability than paleoclimate proxies on decadal and longer timescales. Simulations with natural forcing agree much better with proxy records than unforced ones. The mean local temperature variability decreases with warming. Furthermore, we analyze potentials and limitations of terrestrial hydroclimate proxies. This includes water isotopes in speleothems and ice cores and vegetation indicators derived from pollen assemblages.

Transferring our understanding to the future, we contribute to mitigation and sustainable transitions. Weather and climate extremes determine losses and damages, but their impact on socioeconomic development is poorly examined. We scrutinize damage parametrization of economic models regarding the ability to consider variability. While large-scale sequestration of atmospheric carbon dioxide is paramount to mitigation targets, its representation in climate models is insufficient. Accounting for feedbacks of carbon dioxide removal (CDR) requires model experiments with modified land surfaces. We develop CDR representations of “artificial photosynthesis” in Earth system models. Pollen records benchmark the simulated climate–carbon dioxide–vegetation interactions. This supports modeling endogenous societal land use decisions in the future.

Our work continues to improve the understanding of long-term climate predictability. The combined knowledge from past climate studies and comprehensive modeling for future scenarios underlines the relevance of changing boundary conditions for a future within planetary boundaries.


How to cite: Rehfeld, K. and the SPACY research group members: Sustainable Pathways under Climate Variability, EGU General Assembly 2023, Vienna, Austria, 23–28 Apr 2023, EGU23-14772, https://doi.org/10.5194/egusphere-egu23-14772, 2023.

EGU23-16944 | ECS | Orals | CL3.2.6

Socio-Political Feedback on the Path to Net Zero 

Saverio Perri, Simon Levin, Lars Hedin, Nico Wunderling, and Amilcare Porporato

Anthropogenic emissions of CO2 must soon approach net zero to stabilize the global mean temperature. Although several international agreements have advocated for coordinated climate actions, their implementation has remained below expectations. One of the main challenges of international cooperation is the different degrees of socio-political acceptance of decarbonization.

In this contribution, we interrogate a minimalistic model of the coupled human-natural system representing the impact of such socio-political acceptance on investments in clean energy and the path to net-zero emissions. Despite its simplicity, the model can reproduce complex interactions between human and natural systems, and it can disentangle the effects of climate policies from those of socio-political acceptance on the path to net zero. Although perfect coordination remains unlikely, as clean energy investments are limited by myopic economic strategies and a policy system that promotes free-riding, more realistic decentralized cooperation with partial efforts from each actor could still lead to significant emissions cuts.

Since the socio-political feedback on the path to net zero could influence the trajectories of the Earth System for decades to centuries and beyond, climate models need to incorporate better the dynamical bi-directional interactions between socio-political groups and the environment. Our model represents a first step for incorporating this feedback in describing complex coupled human and natural systems.

How to cite: Perri, S., Levin, S., Hedin, L., Wunderling, N., and Porporato, A.: Socio-Political Feedback on the Path to Net Zero, EGU General Assembly 2023, Vienna, Austria, 23–28 Apr 2023, EGU23-16944, https://doi.org/10.5194/egusphere-egu23-16944, 2023.

EGU23-17342 | ECS | Orals | CL3.2.6

Systematic assessment of climate tipping points 

Sina Loriani, Boris Sakschewski, Jonathan Donges, and Ricarda Winkelmann

Tipping elements constitute one high-risk aspect of anthropogenic climate change - after their critical thresholds are passed, self-amplifying feedbacks can drive parts of the Earth system into a different state, potentially abruptly and/or irreversibly. A variety of models of different complexity shows these dynamics in many systems, ranging from vegetation over ocean circulations to ice sheets. This growing body of evidence supports our understanding of  potential climate tipping points, their interactions and impacts.

However, a systematic assessment of Earth system tipping points and their uncertainties in a dedicated model intercomparison project is of yet missing. Here we illustrate the steps towards automatically detecting abrupt shifts and tipping points in model simulations, as well as a standardised evaluation scheme for the Tipping Point Model Intercomparison Project (TIPMIP). To this end, the model outputs of taylored numerical experiments are screened for potential tipping dynamics and spatially clustered in a bottom-up approach. The methodology is guided by the anticipated setup of the intercomparison project, and in turn contributes to the design of the TIPMIP protocol.

How to cite: Loriani, S., Sakschewski, B., Donges, J., and Winkelmann, R.: Systematic assessment of climate tipping points, EGU General Assembly 2023, Vienna, Austria, 23–28 Apr 2023, EGU23-17342, https://doi.org/10.5194/egusphere-egu23-17342, 2023.

EGU23-17397 | ECS | Posters virtual | CL3.2.6

Is Arctic Permafrost a Climate Tipping Element? – Potentials for Rapid Permafrost Loss Across Spatial Scales 

Jan Nitzbon, Thomas Schneider von Deimling, Sarah Chadburn, Guido Grosse, Sebastian Laboor, Hanna Lee, Norman Julius Steinert, Simone Maria Stuenzi, Sebastian Westermann, and Moritz Langer

Arctic permafrost is yet the largest non-seasonal component of Earth's cryosphere and has been proposed as a climate tipping element. Already today, permafrost thaw and ground ice loss have detrimental consequences for Arctic communities and are affecting the global climate via carbon-cycle–feedbacks. However, it is an open question whether climatic changes drive permafrost loss in a way that gives rise to a tipping point, crossing of which would imply abrupt acceleration of thaw and disproportional unfolding of its impacts.

Here, we address this question by geospatial analyses and a comprehensive literature review of the mechanisms and feedbacks driving permafrost thaw across spatial scales. We find that neither observation-constrained nor model-based projections of permafrost loss provide evidence for the existence of a global-scale tipping point, and instead suggest a quasi-linear response to global warming. We identify a range of processes that drive rapid permafrost thaw and irreversible ground ice loss on a local scale, but these do not accumulate to a non-linear response beyond regional scales.

We emphasize that it is precisely because of this overall linear response, that there is no „safe space“ for Arctic permafrost where its loss could be acceptable. Every additional amount of global warming will proportionally subject additional land areas underlain by permafrost to thaw, implying further local impacts and carbon emissions.

How to cite: Nitzbon, J., Schneider von Deimling, T., Chadburn, S., Grosse, G., Laboor, S., Lee, H., Steinert, N. J., Stuenzi, S. M., Westermann, S., and Langer, M.: Is Arctic Permafrost a Climate Tipping Element? – Potentials for Rapid Permafrost Loss Across Spatial Scales, EGU General Assembly 2023, Vienna, Austria, 23–28 Apr 2023, EGU23-17397, https://doi.org/10.5194/egusphere-egu23-17397, 2023.

EGU23-17457 | ECS | Orals | CL3.2.6 | Highlight

Indicators of changing resilience and potential tipping points in the automotive industry 

Joshua E Buxton, Chris A Boulton, Jean-Francois Mercure, Aileen Lam, and Timothy M Lenton

Through innovation and wider socio-economic processes, large sections of the economy have been known to rapidly (and often irreversibly) transition to alternative states. One such sector currently undergoing a transition is the automotive industry, which is moving from a state dominated by internal combustion engines to one characterised by low-emission vehicles. While much research has focused on early warning signals of climate and ecological tipping points, there is much to be done on assessing the applicability of these methods to social systems. Here we focus on the potential for tipping points to occur in the sale of electrical vehicles in various markets, including Norway and the UK. Early indicators that this new state is being approached are considered through the use of novel data sources such as car sales, infrastructure announcements and online advert engagement. We then map out the socio-technical feedback loops which may drive these tipping points. Consideration is also given to the resilience of the wider automotive industry to previous economic shocks. 

How to cite: Buxton, J. E., Boulton, C. A., Mercure, J.-F., Lam, A., and Lenton, T. M.: Indicators of changing resilience and potential tipping points in the automotive industry, EGU General Assembly 2023, Vienna, Austria, 23–28 Apr 2023, EGU23-17457, https://doi.org/10.5194/egusphere-egu23-17457, 2023.

EGU23-428 | ECS | Posters on site | CL3.2.8

Is Argentina hotter? Understanding heatwaves temporal and spatial behavior using the ERA5-LAND dataset (1950-2022)  

Caterina Cimolai, Enric Aguilar, Benito Zaragozí, Jon Olano Pozo, and Anna Boqué Ciurana

Climate strongly impacts socio-ecologic systems. Increasing the intensity and frequency of heatwaves is one of its major consequences. Heatwaves are periods of consecutive days when temperatures are much hotter than normal. Cities are especially affected because their impact is usually aggravated by the Urban Heat Island (UHI), an intrinsic phenomenon that increases urban temperatures compared to surrounding rural areas. Extreme hot temperatures affect urban areas causing health problems, increasing energy requirements, and altering water supplies, among others.  

Heatwaves have been studied in Argentina but this has not been updated for the whole country recently. Due to these impacts on people’s well-being, infrastructure, and ecosystem functioning, this work proposes to study changes in spatial distribution and frequency of heatwaves in Argentina.  

We use the ERA5 LAND dataset and the HeatWaver R package to identify heatwaves over mainland Argentina. For the purpose of this study, we define heatwaves as periods where maximum and/or minimum temperatures are above the 90th percentile of the WMO standard reference period (1961-1990) during five or more consecutive days. We inspect the temporal and spatial extent of the phenome and monitor its changes over time. In agreement with global warming tendencies, heatwaves are more frequent, and a larger portion of the country has been under stress in recent years. We also inspect the heterogeneous impact over the territory and large cities.  

To understand the impact of heatwaves in cities, it is crucial to evaluate the risk, which is the conjunction of hazards, exposure and vulnerability. As a first step, this work studies heatwaves as hazards while those other aspects will be incorporated into future research. Our final objective is to reach an urban heatwave risk index, combining meteorological, environmental, urban, and social aspects. This indicator would liaise climate science with local and regional policies and offer information for adaptation and mitigation policies to face climate variability and change.  

Keywords: heatwaves, cities, climate change, Argentina. 

How to cite: Cimolai, C., Aguilar, E., Zaragozí, B., Olano Pozo, J., and Boqué Ciurana, A.: Is Argentina hotter? Understanding heatwaves temporal and spatial behavior using the ERA5-LAND dataset (1950-2022) , EGU General Assembly 2023, Vienna, Austria, 23–28 Apr 2023, EGU23-428, https://doi.org/10.5194/egusphere-egu23-428, 2023.

EGU23-862 | Posters on site | CL3.2.8

The hunter-gatherers of Abra del Toro rock shelter, northwestern Argentina, suffered the effects of the large 4.2 ka Cerro Blanco eruption 

Jose-Luis Fernandez-Turiel, Juan Pablo Carbonelli, and Carlos Belotti López de Medina

There is a dearth of information regarding prehistoric foraging societies from the intermontane longitudinal valleys of the South-Central Andes. Due to the intense anthropization of the landscape or the scarce research efforts on prehistoric populations of hunter-gatherers in the intermontane valleys of the Andes, occupation sites have been found on very few occasions. However, new perspectives in the Abra del Toro rock shelter in the Yocavil Valley (Catamarca province, Argentina) have opened up from recent and ongoing excavations. This rock shelter is the first archaeological case in which it is possible to analyze the relationship between a large-scale natural catastrophe and the prehistoric populations living in the Andean intermontane valleys of the southern Central Andes. This rock shelter's stratigraphy and archaeological remains contain the record of interactions between human communities and volcanism. The stratigraphic record of the rock shelter shows a 1-m-thick volcanic ash deposit formed by aeolian transport from primary outer ashfall deposits. Geomorphological and sedimentological context, texture, glass and mineral content, whole-rock chemical composition, and radiocarbon dating prove that the tephra was derived from the 4.2 ka BP eruption of the Cerro Blanco Volcanic Complex in southern Puna (NW Argentina). This volcanic eruption is the largest documented in the world in the last five thousand years and covered the surroundings of the archaeological site with an ash layer of approximately 1 meter thick. The stratigraphic sequence of the Abra del Toro rock shelter allows us to hypothesize that there were three main occupational moments: two hunter-gatherer moments, separated by the record of the large volcanic eruption, and a subsequent agro-pottery period (Carbonelli et al. 2022. J. Archaeol. Sci. Rep. 45, 103629). The rock shelter after the eruption remained in the memory of the hunter-gatherer groups. Good visibility, accessibility, and proximity to water were attributes of this space that made it possible for it to be re-occupied after the eruptive event. Our next objective is to reconstruct, using proxy analysis, how the paleoenvironment was in the intermontane valleys before and after the eruption. The evidence of this Mid-Holocene catastrophic volcanic event in the Abra del Toro rock shelter opens the possibility of knowing its impact on the contemporary hunter-gatherer community and drawing conclusions for similar future volcanic crises.

This work was supported by the National Scientific and Technical Research Council (Grant PIP 112-201301-00178), the University of Buenos Aires (Grant UBACyt 20020170100318BA) (University of Buenos Aires), the National Agency for the Promotion of Research, Technological Development and Innovation (Grant 2019-01229) and the QUECA Project (MINECO, Grant CGL2011-23307).

How to cite: Fernandez-Turiel, J.-L., Carbonelli, J. P., and Belotti López de Medina, C.: The hunter-gatherers of Abra del Toro rock shelter, northwestern Argentina, suffered the effects of the large 4.2 ka Cerro Blanco eruption, EGU General Assembly 2023, Vienna, Austria, 23–28 Apr 2023, EGU23-862, https://doi.org/10.5194/egusphere-egu23-862, 2023.

EGU23-1212 | Orals | CL3.2.8 | Highlight

Storylines of the impacts in the Netherlands of alternative realizations of the Western Europe July 2021 floods 

Bart Van Den Hurk, Karin de Bruijn, Kymo Slager, mark Hegnauer, and Guus Rongen

The 2021 summer flooding was an extremely rare event, driven by precipitation extremes that exceed Dutch design levels for flood protection in regions away from the main rivers and coastline. However, similar events in neighboring locations cannot be ruled out even in the near future. The implications of such extreme rainfall amounts will vary by region, subject to local topography, hydraulic flow patterns, water management, and societal exposure. We explore the geographic distribution of potential flood impacts induced by a similar event by constructing impact-oriented event storylines for different subregions in the Netherlands. The plausibility of the storylines is underlined by using physical evidence, proven impact-modelling concepts, and expert judgment successfully assessing the (sometimes unexpected) outcomes. The approach supports impact assessment for extraordinary events.

The presentation will illustrate the development of the storylines, and its uptake and interpretation by governing authorities responsible for water safety, civil protection and water management.

How to cite: Van Den Hurk, B., de Bruijn, K., Slager, K., Hegnauer, M., and Rongen, G.: Storylines of the impacts in the Netherlands of alternative realizations of the Western Europe July 2021 floods, EGU General Assembly 2023, Vienna, Austria, 23–28 Apr 2023, EGU23-1212, https://doi.org/10.5194/egusphere-egu23-1212, 2023.

EGU23-2330 | ECS | Orals | CL3.2.8 | Highlight

Increasing chances of summer wildfires in the UK? 

Vikki Thompson, Dann Mitchell, Hannah Bloomfield, Nick Dunstone, and Gillian Kay

In the summer of 2022 unprecedented weather conditions in the UK lead to wildfires in many regions. Record breaking temperatures – above 40 °C for the first time - and prolonged dry conditions led to exceptional fire weather severity. On July 19th London Fire Brigade declared a major incident as firefighters battled several significant wildfires across the city. We investigate if climate change is enhancing summertime wildfire risk in the UK. 

We use reanalysis data from 1960 to the present day to analysis trends in the climatic indicators that influence the fire weather index. A large ensemble of initialised climate model simulations from the same time period are used to support the findings and identify as-yet-unrealised possible fire weather index situations in the UK. 

In the UK the term ‘wildfire’ is not limited to fires in wildland, but to any uncontrolled vegetation fire which requires action regarding suppression. Wildfires in the UK are considered a semi-natural hazard due to their close link with human activity. Though we investigate only meteorological influences, these are not the sole cause of wildfires – for example fuel availability plays a large role. 

Better understanding of the trends in the fire weather severity and chance of exceptional conditions for the UK will enable improved understanding of the risks. This information can feed into relevant policy and contingency planning, allowing society to become better prepared for the future as the planet continues to warm. 

How to cite: Thompson, V., Mitchell, D., Bloomfield, H., Dunstone, N., and Kay, G.: Increasing chances of summer wildfires in the UK?, EGU General Assembly 2023, Vienna, Austria, 23–28 Apr 2023, EGU23-2330, https://doi.org/10.5194/egusphere-egu23-2330, 2023.

EGU23-2376 | ECS | Orals | CL3.2.8

Advancing research on compound weather and climate events via large ensemble model simulations 

Emanuele Bevacqua, Laura Suarez-Gutierrez, Aglae Jezequel, Flavio Lehner, Mathieu Vrac, Pascal Yiou, Giuseppe Zappa, and Jakob Zscheischler

Societally relevant weather impacts typically result from compound events, which are rare combinations of weather and climate drivers. For example, compound hot-dry events frequently cause damage to human and natural systems, often exceeding separate impacts from heatwaves and droughts. Focussing on four event types arising from different combinations of climate variables across space and time, we illustrate that robust analyses of compound events – such as frequency and uncertainty analysis under present-day and future conditions, event attribution, and exploration of low-probability-high-impact events – require very large sample sizes. In particular, the required sample is much larger than that needed for routinely considered univariate extremes. We demonstrate how large ensemble simulations from multiple climate models are crucial for advancing our assessments of compound events and for constructing robust model projections. For example, among the case studies, we focus on compound hot-dry events and show that large ensemble model simulations allow for identifying plausible extremely dry climates that, if occurring in a warmer world, would be associated with high risk from compound hot-dry events. Overall, combining large ensemble simulations with an improved physical understanding of compound events will ultimately provide practitioners and stakeholders with the best available information on climate risks.

How to cite: Bevacqua, E., Suarez-Gutierrez, L., Jezequel, A., Lehner, F., Vrac, M., Yiou, P., Zappa, G., and Zscheischler, J.: Advancing research on compound weather and climate events via large ensemble model simulations, EGU General Assembly 2023, Vienna, Austria, 23–28 Apr 2023, EGU23-2376, https://doi.org/10.5194/egusphere-egu23-2376, 2023.

Historical extreme flooding events in Central European river catchments caused high socioeconomic impacts. Previous studies investigated single events in detail but did not focus on an analysis of the underlying extreme precipitation events in general as historical events are too rare for a robust assessment of their generic dynamical causes. This study attempts to fill this gap by analyzing a set of realistic daily 100-year large-scale precipitation events over five major European river catchments with the help of operational ensemble prediction data from the ECMWF. The dynamical conditions during such extreme events are investigated and compared to those of more moderate extreme events (20- to 50-year). 100-year precipitation events are generally associated with an upper-level cut-off low over Central Europe in combination with a surface cyclone southeast of the specific river catchment. The 24 hours before the event are decisive for the exact location of this surface cyclone, depending on the location and velocity of the upper-level low over Western Europe. The differences between 100-year and more moderate extreme events vary from catchment to catchment. Dynamical mechanisms such as an intensified upper-level cut-off low and surface cyclone are the main drivers distinguishing 100-year events in the Oder and Danube catchments, whereas thermodynamic mechanisms such as a higher moisture supply in the lower troposphere east of the specific river catchment are more relevant in the Elbe and Rhine catchments. For the Weser/Ems catchment, differences appear in both dynamical and thermodynamic mechanisms.

How to cite: Pfahl, S. and Ruff, F.: What distinguishes 100-year precipitation extremes over Central European river catchments from more moderate extreme events?, EGU General Assembly 2023, Vienna, Austria, 23–28 Apr 2023, EGU23-2390, https://doi.org/10.5194/egusphere-egu23-2390, 2023.

EGU23-3277 | ECS | Posters on site | CL3.2.8

Future socio-ecosystem productivity threatened by compound drought-heatwave events 

Jiabo Yin, Pierre Gentine, Louise Slater, Lei Gu, Yadu Pokhrel, and Shenglian Guo

Compound drought-heatwave (CDHW) events are one of the worst climatic stressors for global sustainable development. However, the physical mechanisms behind CDHW and their impacts on socio-ecosystem productivity remain poorly understood. Here, by combining satellite observations, field measurements and reanalysis, we show that terrestrial water storage and temperature are negatively coupled, likely driven by similar atmospheric conditions (e.g., water vapor deficit and energy demand). Using simulations from a large climate-hydrology model ensemble of 111 members, we demonstrate that the frequency of extreme CDHWs is projected to increase by ten-fold globally under the highest emissions scenario, along with a disproportionate negative impact on vegetation and socioeconomic productivity by the late 21st century. Limits on water availability are likely to play a more important role in constraining the terrestrial carbon sink than temperature extremes, and over 90% of the global population and GDP could be exposed to increasing CDHW risks in the future, with more severe impacts in poorer or rural areas. Our results provide crucial insights towards assessing and mitigating adverse effects of compound hazards on ecosystems and human well-being.

How to cite: Yin, J., Gentine, P., Slater, L., Gu, L., Pokhrel, Y., and Guo, S.: Future socio-ecosystem productivity threatened by compound drought-heatwave events, EGU General Assembly 2023, Vienna, Austria, 23–28 Apr 2023, EGU23-3277, https://doi.org/10.5194/egusphere-egu23-3277, 2023.

EGU23-3832 | ECS | Posters on site | CL3.2.8

Understanding the origins of climate anomalies during low-yield years in Australia’s largest breadbasket 

Hao Li, Jessica Keune, Qiqi Gou, Chiara Holgate, and Diego Miralles

Wheat yield in Australia is highly dependent on year-to-year climate variability. Prolonged droughts and anomalously high temperatures have been considered as causes of agricultural failures in recent years. However, the origins of these climate extremes and their impacts on yield remain under study. Here, we use a Lagrangian trajectory model driven by atmospheric reanalysis data to delineate the source regions of moisture and heat over Australia’s largest rainfed agricultural region. In particular, we focus on extreme crop failure years (1994, 2002, 2006) and analyze the impact of upwind droughts on heat and moisture imports into the region. Our results indicate that low-yield years are often associated with stable high-pressure systems that lead to a decreased import of moisture from the surrounding oceans. Within the breadbasket, however, this caused higher-than-usual surface sensible heating. Moreover, the analyzed low-yield years coincide with widespread droughts over the Australian continent. We find that upwind droughts can further influence moisture and heat imports to the region. During the initial phase of the Millennium Drought in 2002, crop failure over the breadbasket exceeded 50% and only around 9% of the precipitation over the region originated from (upwind) land — this constitutes a decrease of 5.0% compared to the climatological average. Simultaneously, the heat import from remote land regions increased from an average of 22.8% to 24.7% in 2002. While our findings suggest that upwind droughts played only a minor role for Australia's largest breadbasket due to the influence of oceanic contributions in the region, other agricultural areas that show a larger dependency on moisture and heat imports from the land would be more susceptible to upwind climate anomalies. 

How to cite: Li, H., Keune, J., Gou, Q., Holgate, C., and Miralles, D.: Understanding the origins of climate anomalies during low-yield years in Australia’s largest breadbasket, EGU General Assembly 2023, Vienna, Austria, 23–28 Apr 2023, EGU23-3832, https://doi.org/10.5194/egusphere-egu23-3832, 2023.

The intensity and frequency of extreme storms have been increasing over time due to climate change, challenging sustainable stormwater management. This study examines the impacts of climate change on the precipitation patterns and extremes across the Cedar River Watershed in the Pacific Northwest under the Shared Socio-economic Scenario (SSP-585) obtained from CMIP6 models. Two global climate models (GCMs), namely MIROC6 and CMCC-ESM2, are considered in this study. Prior to generating future extreme storms for the selected GCMs and scenarios, the GCM simulated precipitation data was bias corrected relative to in-situ daily precipitation data. Precipitation data was bias corrected using three different statistical methods (please Named three method); among those Equidistant Quantile Mapping performed best. Bias corrected precipitation from the MIROC6 showed better performance compared to the CMCC-ESM2 in reproducing the observed precipitation statistics. Finally, the bias-corrected precipitation data from MIROC6 was used to develop non-stationary Intensity-Duration-Frequency curves (IDF) to identify the extreme storm events and their return periods. The results indicate that the storm intensities increase (ranging from 2.5% to 30%) over the future periods for all selected return periods, with relatively larger increase for higher return periods i.e., 50-year and 100-year storms. Further, we use the bias corrected precipitation projections and generate mean monthly perception maps of the Cedar River Watershed for the periods of 2020–2039 and 2040–2059.


How to cite: Salem, A. and Abduljaleel, Y.: Assessing the impact of climate change scenario for simulating nonstationary rainfall intensity and duration, EGU General Assembly 2023, Vienna, Austria, 23–28 Apr 2023, EGU23-4309, https://doi.org/10.5194/egusphere-egu23-4309, 2023.

EGU23-4544 | Orals | CL3.2.8 | Highlight

Climate change contributes to the record-shattering 2022 Pakistan rainfall 

Yujia You and Mingfang Ting

From mid-June until the end of August 2022, a sequence of torrential rains and deluges pummeled Pakistan, displacing more than 30 million residents with a death toll of near 2000. The accumulated amount exceeds the centennial average of 126 mm by about 7 standard deviations (50 mm), reaching a value of 487 mm and breaking its record over a century. The extraordinary extremity underscores the urgency for understanding the physical drivers of the event and the relations with human-induced climate change.

Here, we find that distinctive from the historical floods which tend to occur over the relatively wet northern mountains, the 2022 rainfall took place over arid southern Pakistan. Unlike the floods over northern mountains which had closer associations with extratropical westerly troughs, the heavy downpours in 2022 were primarily initiated by the synoptic low-pressure systems (LPS). The longevity and intensity of LPS were sustained and enhanced by the cross-equatorial monsoon flow, which has trended upward since the 1970s and is at a historical high. In combination with the zonal inflow of moisture induced by La Niña, a corridor of heavy rainfall extending from the Bay of Bengal toward southern Pakistan formed.

The signal of greenhouse-gas-forced changes in the heavy rainfall over Pakistan and the cross-equatorial monsoon flow is detectable in climate models, confirming that the likelihood of such extreme events would increase under future warming.

How to cite: You, Y. and Ting, M.: Climate change contributes to the record-shattering 2022 Pakistan rainfall, EGU General Assembly 2023, Vienna, Austria, 23–28 Apr 2023, EGU23-4544, https://doi.org/10.5194/egusphere-egu23-4544, 2023.

EGU23-4681 | Orals | CL3.2.8

Reduced moisture sources contributed to the 2017-2019 southeast Australian drought 

Andréa S. Taschetto, Milica Stojanovic, Chiara Holgate, Anita Drumond, Jason Evans, Luis Gimeno, and Raquel Nieto

The Murray Darling Basin, located in southeast Australia, is an agriculturally rich area, providing one-third of the country’ food supply. In 2017-2019 the region experienced one of its worst droughts since 1900. Rainfall in the Murray Darling Basin was consistently below average for three consecutive cool seasons, an unprecedented event on record. The drought set the extreme conditions that led later to the 2019-2020 Black Summer Bushfires. Previous studies suggest that the strong 2019 positive Indian Ocean Dipole intensified the conditions of the drought, however the state of the climate drivers cannot fully explain the onset and development of the Murray Darling Basin drought. In this study, we investigate processes other than remote climate drivers that may have triggered the drought. Using a Lagrangian model to backtrack moisture sources to southeast Australia, we show that local processes were crucial in explaining the onset and development of the drought. We identify the sources of moisture to the cool season precipitation over the Murray Darling Basin and show for the first time that the moisture supply from the Tasman Sea declined in 2017 and 2018. We further show that the expected moisture was instead transported northward by an anomalous anticyclonic circulation. Our results provide an explanation for the moisture and rainfall deficit that caused the 2017-19 drought. Understanding the processes that led to the 2017-2019 Murray Darling Basin drought is important for predicting and planning future multi-year droughts in Australia.

How to cite: Taschetto, A. S., Stojanovic, M., Holgate, C., Drumond, A., Evans, J., Gimeno, L., and Nieto, R.: Reduced moisture sources contributed to the 2017-2019 southeast Australian drought, EGU General Assembly 2023, Vienna, Austria, 23–28 Apr 2023, EGU23-4681, https://doi.org/10.5194/egusphere-egu23-4681, 2023.

Under the context of global warming, climate and weather extremes (e.g., droughts, high temperature extremes) take a heavy toll on natural and human systems. It has been reported that the concurrence of droughts and hot extremes (CDHEs) in summer 2022 in the Northern Hemisphere (NH) have led to reduced water resources/crop yield and increased health risks. While assessments of droughts and heatwaves in summer 2022 have been noted, the assessment of these extremes from a compound event perspective is still limited. In this study, we analyzed the rarity of CDHEs in summer 2022 across the NH, detected anthropogenic influence on CDHEs area, and projected the likelihood under different warming levels based on observations from ERA5 and simulations from the Sixth Phase of the Coupled Model Intercomparison Project (CMIP6). Our results illustrate that severe CDHEs in summer 2022 across the NH mainly occur in central North America, Europe, and south China. Event attribution analysis shows that CDHEs area in summer 2022 in the NH would not have occurred without anthropogenic global warming. The CDHEs area like 2022 is projected to occur more likely, particularly under SSP585 in a 4°C warming world. This study provides useful insights for advancing our understanding of compound extremes during summer 2022 across the NH.

How to cite: Meng, Y. and Hao, Z.: Attribution and projection of the summer 2022 compound dry and hot extreme in the Northern Hemisphere, EGU General Assembly 2023, Vienna, Austria, 23–28 Apr 2023, EGU23-4705, https://doi.org/10.5194/egusphere-egu23-4705, 2023.

EGU23-7134 | ECS | Posters on site | CL3.2.8

Developing storylines for unprecedented extreme events using ensemble boosting 

Luna Bloin-Wibe, Erich Fischer, and Reto Knutti

Recent extreme temperature and precipitation events such as the dry and heat events in summer 2022 in Europe and China, the New Year’s warm spell 2022/23 across Europe, the 2021 heavy rainfall extremes in northwestern Germany, Belgium and the Netherlands and the 2021 Pacific Northwest heatwave broke previous observed record levels by large margins. The probability of such unprecedented record-shattering extremes increases with the rapid rate of warming. Thus, there is a crucial need for analyzing the underlying processes leading to these events and quantifying potential intensities of events possible in the coming decades.

Here, we evaluate how ensemble boosting (Gessner et al. 2021 and Gessner et al. 2022) can help assess the tail of climate distributions and generate climate model-based storylines more resource-efficiently. In ensemble boosting the most extreme simulated events in an intermediate-size initial condition ensembles are re-initialized in targeted experiments in order to efficiently sample very extreme states of the model climatology. Here, we evaluate different ensemble design choices including lead time, ensemble size and potential iteration choices to most efficiently allocate computational resources to simulate events of very extreme intensity.

The resulting boosted events are analyzed through a storyline approach, thus helping to interpret the underlying mechanisms of each physically consistent unfolding extreme event and its consequences. The Pacific Northwest heatwave in June 2021 will be used as a starting point; but ensemble boosting and storylines can be powerful tools for understanding extremes beyond heat. We further discuss how ensemble boosting can also be applied to compound extremes and future climate scenarios.

How to cite: Bloin-Wibe, L., Fischer, E., and Knutti, R.: Developing storylines for unprecedented extreme events using ensemble boosting, EGU General Assembly 2023, Vienna, Austria, 23–28 Apr 2023, EGU23-7134, https://doi.org/10.5194/egusphere-egu23-7134, 2023.

EGU23-7329 | ECS | Posters on site | CL3.2.8

Increases in Extreme Precipitation over the Northeast United States using High-resolution Climate Model Simulations 

Bor-Ting Jong, Thomas Delworth, and Hiroyuki Murakami

The Northeast United States (NEUS) has faced the most rapidly increasing occurrences of extreme precipitation within the US in the past few decades. Understanding the physics leading to long-term trends in regional extreme precipitation is essential to adaptation and mitigation planning. Simulating regional extreme precipitation, however, remains challenging, partially limited by climate models’ horizontal resolution. Our recent work shows that a model with 25 km horizontal resolution facilitates a much more realistic simulation of extreme precipitation than comparable models with 50 or 100 km resolution, including frequency, amplitude, and temporal variability, based on ensembles generated by GFDL (Geophysical Fluid Dynamics Laboratory) SPEAR (Seamless System for Prediction and EArth System Research) models. The 25-km GFDL-SPEAR ensemble also simulates the trend of NEUS extreme precipitation quantitatively consistent with observed trend over recent decades, as the observed trend is within the ensemble spread. We therefore leverage multiple ensembles and various simulations (with historical radiative forcing and projected forcing following the SSP2-4.5 and SSP5-8.5 scenarios) to detect and project the trend of extreme precipitation. The 10-ensemble member GFDL-SPEAR 25-km simulations project unprecedented rainfall events over the NEUS, driven by increasing anthropogenic radiative forcing and distinguishable from natural variability, by the mid-21st century. Furthermore, very extreme events (99.9th percentile events) may be six times more likely by 2100 than in the early 21st century.


We further conduct a process-oriented study, assessing the physical factors that have contributed to the increasing extreme precipitation over the NEUS. We categorize September to November extreme precipitation days based on daily cumulative precipitation over the NEUS into weather types, including atmospheric river (AR), tropical cyclone (TC), and others. In observations, the most precipitation days were AR days or/and TC days. The number of extreme precipitation days related to pure AR events (without any TC-related event in the vicinity) had increased slightly from 1959 to 2020. The greater contribution to the increasing extreme precipitation was caused by TC-related events, especially the influences from extratropical transitions. The extreme precipitation days related to extratropical transitions were 2.5 times more frequent for the 1990 to 2020 period compared to the 1959 to 1989 period. We apply the same analysis to the GFDL-SPEAR 25-km simulations. Similar to observations, the increasing extreme precipitation days were mainly caused by TC-related events, with a smaller influence from pure AR events. However, the increasing number of TC-related days was dominated by hurricane and tropical storm events, while the number of extratropical transitions near the NEUS changed very little from 1959 to 2020. These results are different from the observational results. Ongoing work focuses on the discrepancy between observations and SPEAR simulations. For example, we are assessing whether the prominent increasing extratropical transitions since the 1990s in observations were the results of limited sample size or caused by decadal variability.

How to cite: Jong, B.-T., Delworth, T., and Murakami, H.: Increases in Extreme Precipitation over the Northeast United States using High-resolution Climate Model Simulations, EGU General Assembly 2023, Vienna, Austria, 23–28 Apr 2023, EGU23-7329, https://doi.org/10.5194/egusphere-egu23-7329, 2023.

EGU23-9277 | Posters on site | CL3.2.8

Estimating compounding heat waves and rainfall extremes under projected climate change over the island of Sicily, Italy 

Armelle Remedio, Jeewanthi Sirisena, and Laurens Bouwer

According to the IPCC AR6 report, the frequency and intensity of high temperatures and precipitation extremes, such as heat waves, and extreme rainfall events that can lead to flash floods have increased in recent decades and are projected to keep increasing. These extreme events, which can occur in separate or as compound events can lead to droughts and flooding, causing severe economic and health impacts including loss of lives. Especially when such events occur shortly or directly in sequence, they can cause more severe impacts than in isolation. Understanding their compound behavior and timing in current and future climates can help to better estimate associated risks and require protection and adaptation planning.

In this study, the frequency and intensity of the compound events of heat waves and extreme precipitation over Sicily, Italy were analyzed and characterized for the present (1980-2010) and near future (2030-2050) periods. We used high resolution gridded datasets from observations (E-OBS) and from the EURO-CORDEX ensemble of regional climate change simulations. Heat waves were defined using a daily maximum temperature threshold persistent for at least three consecutive days while the extreme precipitation events were defined using the 95th percentile threshold of daily data. Results showed that the highest frequency of heat waves occured near the coastal regions of Sicily, while the extreme rainfalls were located in the west of Sicily.  We identified the areas where heat waves and extreme rainfall events have occurred in the past and we demonstrate how they are expected to change in the future, separately and as compound events. The results of this study will be used to develop a workflow for estimating climate risks in the region, which is part of the “risk workflow for CAScading and COmpounding hazards in COastal urban areas” (CASCO) project, and can be combined with other workflows on geophysical risks (earthquakes and tsunamis) to characterize overall natural hazard risks for the island of Sicily.

How to cite: Remedio, A., Sirisena, J., and Bouwer, L.: Estimating compounding heat waves and rainfall extremes under projected climate change over the island of Sicily, Italy, EGU General Assembly 2023, Vienna, Austria, 23–28 Apr 2023, EGU23-9277, https://doi.org/10.5194/egusphere-egu23-9277, 2023.

EGU23-9290 | Orals | CL3.2.8 | Highlight

Quantifying windstorm risks by translating historical extreme events into the future 

Ed Hawkins, Philip Brohan, Samantha Burgess, Stephen Burt, Gilbert Compo, Suzanne Gray, Ivan Haigh, Hans Hersbach, Kiki Kuijjer, Oscar Martinez-Alvarado, Chesley McColl, Andrew Schurer, Laura Slivinski, and Joanne Williams

Extreme wind events are among the costliest natural disasters in Europe. Significant effort is dedicated to understanding the risk of such events, usually analysing observed storms in the modern era. However, it is likely that some historical windstorms were more extreme and/or followed different tracks from those in the modern era. Producing plausible reanalyses of such events would improve the quantification of current and future windstorm risks.

Billions of historical climatological observations remain unavailable to science as they exist only on paper, stored in numerous archives around the world. We demonstrate how the rescue of such paper observations has improved our understanding of an extreme windstorm that occurred in February 1903 and its significant impacts. By assimilating newly rescued atmospheric pressure observations into the 20th Century Reanalysis system, the storm is now credibly represented in an improved reanalysis of the event. In some locations this storm produced stronger winds than any event during the modern era. As a result, estimates of risk from severe storms, based on modern period data, may need to be revised. Simulations of the storm surge resulting from this storm show a large coastal surge of around 2.5m, comparing favourably with newly rescued tide gauge observations and increasing our confidence in the quality of the reconstruction.

In addition, we use novel reanalysis experiments to translate this windstorm into a warmer world to quantify how it might be different both in the present and in the future. We find that the same storm produces more intense rainfall and stronger winds in a warmer climate, providing a new approach to quantifying how extreme weather events will change as the world is warming.

How to cite: Hawkins, E., Brohan, P., Burgess, S., Burt, S., Compo, G., Gray, S., Haigh, I., Hersbach, H., Kuijjer, K., Martinez-Alvarado, O., McColl, C., Schurer, A., Slivinski, L., and Williams, J.: Quantifying windstorm risks by translating historical extreme events into the future, EGU General Assembly 2023, Vienna, Austria, 23–28 Apr 2023, EGU23-9290, https://doi.org/10.5194/egusphere-egu23-9290, 2023.

EGU23-10709 | Orals | CL3.2.8

The Unprecedented Pacific Northwest Heatwave of June 2021: Causes and Impacts 

Rachel White, Sam Anderson, James F. Booth, Ginni Braich, Christina Draeger, Cuiyi Fei, Christopher D. G. Harley, Sarah B. Henderson, Matthias Jakob, Carie-Ann Lau, Lualawi Mareshet Admasu, Veeshan Narinesingh, Christopher Rodell, Eliott Roocroft, Kate R. Weinberger, and Greg West

In late June 2021 a heatwave of unprecedented magnitude impacted the Pacific Northwest (PNW) region of Canada and the United States. Many locations broke all-time maximum temperature records by more than 5°C, and the Canadian national temperature record was broken by 4.6°C, with the highest recorded temperature 49.6°C. Local records were broken by large margins, even when compared to local records broken during the infamous heatwaves in Europe 2003, and Russian in 2010. A region of high pressure that became stationary over the region (an atmospheric block) was the dominant cause of this heatwave; however, trajectory analysis finds that upstream diabatic heating played a key role in the magnitude of the temperature anomalies. Weather forecasts provided advanced notice of the event, while sub-seasonal forecasts showed an increased likelihood of a heat extreme with 10-20 day lead times, with an increased likelihood of a blocking event seen in forecasts initialized 3 weeks prior to the heatwave peak. The impacts of this event were catastrophic. We provide a summary of some of these impacts, including estimates of hundreds of attributable deaths across the PNW, mass-mortalities of marine life, reduced crop and fruit yields, river flooding from rapid snow and glacier melt, and a substantial increase in wildfires—the latter contributing to devastating landslides in the months following. These impacts provide examples we can learn from, and a vivid depiction of how climate change can be so devastating.

How to cite: White, R., Anderson, S., Booth, J. F., Braich, G., Draeger, C., Fei, C., Harley, C. D. G., Henderson, S. B., Jakob, M., Lau, C.-A., Mareshet Admasu, L., Narinesingh, V., Rodell, C., Roocroft, E., Weinberger, K. R., and West, G.: The Unprecedented Pacific Northwest Heatwave of June 2021: Causes and Impacts, EGU General Assembly 2023, Vienna, Austria, 23–28 Apr 2023, EGU23-10709, https://doi.org/10.5194/egusphere-egu23-10709, 2023.

EGU23-11435 | Posters on site | CL3.2.8 | Highlight

How to prepare for record-shattering hot events 

Lisette Klok, Timo Kelder, Elske van Vessem, and Laurens Severijn Hondema

The heat dome that Portland experienced in 2021 with temperatures up to 46 °C was unprecedented and unexpectedly severe, leading to the death of dozens of people. What if such an exceptional event were to occur somewhere else?  

The Netherlands seems to be sensitive to such 'record-shattering' hot events, but luckily has not yet experienced them. Here, we show how to qualitatively connect the increasing scientific understanding of plausible record-shattering hot events with potential impacts and necessary responses for the city of Amsterdam. The expected impacts and potential responses of record-shattering hot events are identified through expert judgement with professionals from various disciplines. 

We asked what could possibly happen in Amsterdam if the temperature rises to 45 degrees, in particular what kind of problems and bottlenecks are expected and what possible solutions are. The results of this exercise provided additional insights to heat plans based on lived experiences. As such, this case study may prove a useful example for governments and private sectors wishing to prepare for future exceptional heat waves.

How to cite: Klok, L., Kelder, T., van Vessem, E., and Hondema, L. S.: How to prepare for record-shattering hot events, EGU General Assembly 2023, Vienna, Austria, 23–28 Apr 2023, EGU23-11435, https://doi.org/10.5194/egusphere-egu23-11435, 2023.

EGU23-13309 | Orals | CL3.2.8

Variability in North Sea wind energy and the potential for prolonged winter wind drought 

Gillian Kay, Nick Dunstone, Anna Maidens, Adam Scaife, Doug Smith, Hazel Thornton, Laura Dawkins, and Stephen Belcher

The UK is committed to substantially increasing offshore wind capacity in its drive to decarbonise electricity production and achieve net zero. If low wind episodes – or “wind drought” events – occur during high energy demand periods, energy security may be threatened without alternative supply. To ensure resilience of the power system now and in the coming years as offshore wind generation grows, better understanding of the severity, frequency and duration of low wind episodes would be useful. Variability in winds is likely to dominate over trends in the next few decades, and hence having improved information on present day characteristics of wind drought is valuable.

Here we focus our attention on the North Sea as a centre of current and planned offshore wind resource for the UK and a number of other European countries, and on the winter season, given the occurrence of weather patterns that risk security of supply. We use a large ensemble of initialised climate model simulations to provide a synthetic but realistic event set that greatly increases the sample size of extreme events compared with that available from reanalysis data, and gives more robust information about their likelihood and properties. Using the basic unit of a week of low winds as the timescale of analysis, we report on the frequency and duration of wind drought events. In addition, we examine the wider conditions associated with wind drought events to investigate what remote factors may contribute to prolonged wind drought.

How to cite: Kay, G., Dunstone, N., Maidens, A., Scaife, A., Smith, D., Thornton, H., Dawkins, L., and Belcher, S.: Variability in North Sea wind energy and the potential for prolonged winter wind drought, EGU General Assembly 2023, Vienna, Austria, 23–28 Apr 2023, EGU23-13309, https://doi.org/10.5194/egusphere-egu23-13309, 2023.

EGU23-14539 | ECS | Orals | CL3.2.8

Increasing probability of extreme records in heavy precipitation 

Iris de Vries, Sebastian Sippel, Erich Fischer, Joel Zeder, Vincent Humphrey, and Reto Knutti

It comes as no surprise that the future holds record-breaking weather and climate events. As global warming continues, temperature records will continue to be broken. Also heavy precipitation records are likely to be broken due to the increased water holding capacity of the atmosphere, in combination with changing atmospheric stability and circulation patterns. Improved estimates on the range of possible record-breaking precipitation events – now and in the future – are a first step to inform adequate adaptation policies for heavy precipitation. Of particular interest are events that break records by large margins – record-shattering events –, since these are likely to incur most damage and losses. 

In order to improve estimates of record shattering precipitation events in the present and future climate we use initial condition large ensemble simulation data (CESM2, SSP370) and statistical models. We evaluate record-shattering events in Rx1d (day with most precipitation per chosen time period (year or season)). In a stationary climate, the probability of Rx1d record-breaking is known to decrease with the number of data points since the start of measurements (inversely proportional). We find, however, that in our nonstationary climate, the decay in Rx1d record breaking and shattering probability is slowed down and even reversed in most world regions. Regional changes in record shattering probability are attributable to a changing underlying probability distribution of Rx1d, which also is region specific. We elucidate the contributions of changes in mean (distribution shift), and in variability (distribution widening/narrowing) to increasing record shattering probability by using a statistical model to create counterfactual realities representative of the regions of interest.

We focus on regions of a size relevant for national and cross-border policy that show differently driven changes in record shattering precipitation probabilities. For example, the annual probability of a record shattering precipitation event somewhere in the Benelux-Germany region which was hit by severe floods in summer 2021 increases from ~2% now to ~4.5% at the end of the century in CESM2. This increase results from a non-linear interaction between mean and variability increases, and is primarily driven by increasing variability. At lower latitudes, for example in Central America, the effect of variability is even stronger, where we find increasing record shattering probability despite a negative long-term trend in Rx1d levels.

Very unlikely events are, paradoxically, arguably the most important to know about, since their unimaginability often means that critical infrastructure is not sized to withstand these events. Our results may thus prove invaluable for regional policy. 

How to cite: de Vries, I., Sippel, S., Fischer, E., Zeder, J., Humphrey, V., and Knutti, R.: Increasing probability of extreme records in heavy precipitation, EGU General Assembly 2023, Vienna, Austria, 23–28 Apr 2023, EGU23-14539, https://doi.org/10.5194/egusphere-egu23-14539, 2023.

EGU23-14556 | ECS | Posters on site | CL3.2.8

A new Max Planck Institute-Grand Ensemble with CMIP6 forcing and high-frequency model output 

Dirk Olonscheck, Sebastian Brune, Laura Suarez-Gutierrez, Goratz Beobide-Arsuaga, Johanna Baehr, Friederike Fröb, Lara Hellmich, Tatiana Ilyina, Christopher Kadow, Daniel Krieger, Hongmei Li, Jochem Marotzke, Étienne Plésiat, Martin Schupfner, Fabian Wachsmann, Karl-Hermann Wieners, and Sebastian Milinski

We present the CMIP6 version of the Max Planck Institute-Grand Ensemble (MPI-GE CMIP6) with 30 realisations for the historical period and five emission scenarios. The power of MPI-GE CMIP6 goes beyond its predecessor ensemble MPI-GE by providing high-frequency model output, the full range of emission scenarios including the highly policy relevant scenarios SSP1-1.9 and SSP1-2.6, and the opportunity to compare the ensemble to high resolution simulations of the same model version. We demonstrate with six novel application examples how to use the power of MPI-GE CMIP6 to better quantify and understand present and future extreme events in the Earth system, to inform about uncertainty in approaching Paris Agreement global warming limits, and to combine large ensembles and artificial intelligence. For instance, MPI-GE CMIP6 allows us to show that the recently observed Siberian and Pacific North American heat waves are projected to occur every year in 2071-2100 in high-emission scenarios, that the storm activity in most tropical to mid-latitude oceans is projected to decrease, and that the ensemble is sufficiently large to be used for infilling surface temperature observations with artificial intelligence.

How to cite: Olonscheck, D., Brune, S., Suarez-Gutierrez, L., Beobide-Arsuaga, G., Baehr, J., Fröb, F., Hellmich, L., Ilyina, T., Kadow, C., Krieger, D., Li, H., Marotzke, J., Plésiat, É., Schupfner, M., Wachsmann, F., Wieners, K.-H., and Milinski, S.: A new Max Planck Institute-Grand Ensemble with CMIP6 forcing and high-frequency model output, EGU General Assembly 2023, Vienna, Austria, 23–28 Apr 2023, EGU23-14556, https://doi.org/10.5194/egusphere-egu23-14556, 2023.

Managing extreme weather events of unprecedented magnitude is one of the main challenges facing climate risk management and climate adaptation. Because of the unprecedented nature of these events, some authors have questioned the use of probabilistic approaches in this context. As an alternative, they introduced the so-called climate storylines approach. Climate storylines do not aim at predicting system states; rather, their focus is on revealing plausible chains of events whose impact might undermine the performance of the system.

Conceptually, climate storylines relate to - but are separate from – downward counterfactual histories. Downward counterfactual histories are plausible alternative realizations of historical events that could have turned to the worse. By constructing downward counterfactual histories in a disaster risk reduction context, some authors showed that many disasters that took societies by surprise could have in fact been anticipated.

This talk will introduce a decision-support framework to build climate storylines based on downward counterfactual histories. The framework is event-oriented, it focuses on impact and it is designed to be applied in a participatory fashion. By following the framework, the user first constructs climate storylines based on an iterative analysis of what (combinations of) counterfactuals are deemed critical (i.e., downward). Then, the user analyzes the future impact of the constructed storylines under climatic and socio-economic scenarios. Finally, the user explores the effects on the estimated impacts of the value-laden choices involved in the construction of the storylines.

The framework is applied to study the impact of tropical cyclones hitting the European Union’s outermost regions on the stability of the European Union Solidarity Fund (EUSF), a public fund that provides financial relief to Member States affected by large disasters. Contrary to what historic evidence would suggest, it is found that extreme - yet plausible - tropical cyclones might deplete the EUSF capital if they happen concurrently with large events in mainland Europe, and that a substantial recapitalization of the fund might be required to cope with future climatic and socio-economic changes.

How to cite: Ciullo, A.: A decision-support framework to construct climate impact storylines using downward counterfactuals, EGU General Assembly 2023, Vienna, Austria, 23–28 Apr 2023, EGU23-15450, https://doi.org/10.5194/egusphere-egu23-15450, 2023.

EGU23-16457 | Posters on site | CL3.2.8

Emulator-enhanced extreme event attribution for data scarce developing countries 

Fahad Saeed, Shruti Nath, Pierre Candela, Quentin Lejeune, Lukas Gudmundsson, Mathias Hauser, Dominik Schumacher, Sonia Seneviratne, and Carl Schleussner

Attribution of extreme events in developing countries poses a significant challenge. A primary hindrance is the lack of historical observations, which not only limits the appraisal of the extent of an extreme event, but also restricts benchmarking of climate models for the region. A secondary hindrance is that tropical climates, characteristic of developing countries, contain large uncertainties due to natural climate variability, which many climate models struggle to represent. As it is those countries and world regions where some of the most severe consequences of climate impacts emerge, addressing these challenges to robust climate attribution is critical to improve prospects of climate litigation in developing countries. In this study, we present a novel method for attribution using the Earth System Model (ESM) emulator for spatially resolved monthly temperatures, MESMER-M (Nath et al. 2022). We use a bootstrap method in calibrating MESMER-M, so as to also characterize its intrinsic parametric uncertainty. Attribution using MESMER-M is then demonstrated on the prolonged heat conditions of March/April 2022 over the Indo-Pakistani region. The outcomes of this study are twofold. Firstly, by calibrating MESMER-M on the BEST observational dataset, we are able to inflate observational records with observationally consistent natural climate variability estimates, enabling exploration of “possible pasts” and insofar characterization of the event and its likelihood under rising Global Mean Temperatures (GMTs). Secondly, by exploring the parametric uncertainty space of MESMER-M calibrated on both BEST and ESM data, we systematically disentangle the uncertainty surrounding the mean response of monthly temperatures to GMT from that surrounding the natural climate variability. Such allows robust appraisal of the uncertainty surrounding natural climate variability as present within ESMs/Observations for the region, so as to not over/understate the event’s likelihood under rising GMTs.


Nath, S., Lejeune, Q., Beusch, L., Seneviratne, S. I., & Schleussner, C. F. (2022) MESMER-M: an Earth system model emulator for spatially resolved monthly temperature. Earth System Dynamics, 13 (2), 851–877. doi: 10.5194/esd-13-851-2022

How to cite: Saeed, F., Nath, S., Candela, P., Lejeune, Q., Gudmundsson, L., Hauser, M., Schumacher, D., Seneviratne, S., and Schleussner, C.: Emulator-enhanced extreme event attribution for data scarce developing countries, EGU General Assembly 2023, Vienna, Austria, 23–28 Apr 2023, EGU23-16457, https://doi.org/10.5194/egusphere-egu23-16457, 2023.

EGU23-17463 | ECS | Posters on site | CL3.2.8

Future Extreme Weather: a Data and AI driven approach to Understand Future Coastal Flooding 

Tudor Suciu, Emily Shuckburgh, and Nicholas Lane

Coastal flooding can be regarded as the most damaging extreme weather event. Careful
planning of mitigation and adaptation strategies requires a deep understanding of the event’s
likelihood and intensity.
This project provides a framework for assessing those changing statistics of coastal floods in
the future. We use historical records of coastal floods on the coasts of the UK historical
weather variables data (sea surface temperature, sea-level pressure, zonal and meridional
wind speeds and daily precipitations) from remote sensing sources, reanalysis data and
global climate models and future predictions of those weather variables from global climate
models. The method consists of using machine learning models to classify days as being
either ‘flooded’ (i.e. containing a coastal flood event) or ‘non-flooded’, at tide gauge
locations in the past 2 decades; both ‘out-of-the-box’ and more complex machine learning
models are trained on historical data. The models are then further used to assess the future
statistics of coastal flooding, by classifying days with or without flooding in the future
decades, from global climate models data. Currently, the method is showing promising
results on predicting the future number of ‘flooding days’, while the models used and trained
still show gradual improvement.
Using the same intensity scale as in the dataset of historical records of floods, it can be
assessed whether those events are becoming stronger or not. As well, the frequency, or the
return period, for the upcoming decades can be inferred from this project. This framework
produces an actionable set of information, that can be used by policy-makers, businesses,
governments and people, to plan accordingly for future floods.

How to cite: Suciu, T., Shuckburgh, E., and Lane, N.: Future Extreme Weather: a Data and AI driven approach to Understand Future Coastal Flooding, EGU General Assembly 2023, Vienna, Austria, 23–28 Apr 2023, EGU23-17463, https://doi.org/10.5194/egusphere-egu23-17463, 2023.

EGU23-1054 | ECS | Posters on site | ERE1.14

Assessing the climate change risk to underwater cultural heritage: the EU-funded WATERISKULT project 

Luigi Germinario, Isabella Moro, and Claudio Mazzoli

The impact of climate change on cultural assets represents a topical subject of scientific research, although spotlighting heritage sites on land while often neglecting the vulnerability of the underwater world. The WATERISKULT project (https://wateriskult.geoscienze.unipd.it), funded by the European Union under the Marie Skłodowska-Curie Actions, aims at filling that gap. The project will provide the first quantitative assessment of the risk to underwater cultural heritage, with a focus on archaeological stone, a material part of countless remains of ancient cities and ship cargoes sunken in the oceans. This contribution introduces WATERISKULT by presenting its layout and first research activities, based on an interdisciplinary approach (including petrography, oceanography, analytical chemistry, marine biology, hydraulic engineering, and underwater archaeology) and a mixed field and laboratory experimentation. The key-factors of climate change under investigation involve ocean acidification, sea level rise, ocean warming, and extreme weather events. Moreover, the causes and effects of current deterioration of archaeological stone materials are being explored, considering the Mediterranean Sea as pilot area. The research results are expected to help assessing the observed and predicted decay trends of underwater heritage sites, constrained by the diverse characteristics of the component materials and submarine environments.

How to cite: Germinario, L., Moro, I., and Mazzoli, C.: Assessing the climate change risk to underwater cultural heritage: the EU-funded WATERISKULT project, EGU General Assembly 2023, Vienna, Austria, 23–28 Apr 2023, EGU23-1054, https://doi.org/10.5194/egusphere-egu23-1054, 2023.

EGU23-2440 | ECS | Orals | ERE1.14

Extreme rainfall risk and climate change impact assessment for Edinburgh World Heritage sites 

Shane O'Neill, Simon Tett, and Kate Donovan

Change in climate extremes and the increased risk associated with human-induced global warming is apparent. Less apparent is the impact such changes may have on vulnerable systems in our society. Climate change impact assessments using state-of-the-art climate models coupled with damage information can offer actionable insight for stakeholders to better protect vulnerable systems.

Cultural heritage is an example of a system that is vulnerable to climate change, especially built cultural heritage which is directly exposed to changing climate extremes. In the UK, significant development has been achieved to better understand the potential change in climate extremes following the release of UK Climate Projections 18 (UKCP18), however, understanding of risk posed by these climate extremes to built cultural heritage is poorly constrained. How to assess and quantify this risk is in its infancy.

We have developed a new methodology building on previous work by cultural heritage experts - the Cultural Heritage Climate Risk Assessment (CHCRA) framework. The CHCRA framework focuses on combining stakeholder engagement and high-resolution climate models to develop site-specific projections of potential damage to cultural heritage assets. This integrated framework when applied with adequate information allows estimation of expected damages to cultural heritage assets through the 21st century.

We applied the CHCRCA framework to cultural heritage buildings in the Edinburgh World Heritage Site, Scotland, considering one-day extreme rainfall events. This pilot study used UKCP18 2.2 km resolution climate projections alongside qualitative and quantitative damage data obtained from multiple sources.

Importantly, UKCP18 2.2 km model is a Convection Permitting Climate Model with the ability to better represent extreme rainfall events. Furthermore, expert elicitation through interviews with practitioners from cultural heritage organisations within Edinburgh were carried out to obtain damage information specific to cultural heritage buildings in the Old and New Town Edinburgh (ONTE), part of the Edinburgh World Heritage Site. A damage function was derived based on expert elicitation and other sources.

Key findings include annual expected damage per year increases from 0.6% in the baseline period (1981-2000) to 1.5% in 2021-40 and 2.3% in 2061-80. A three-to-four-fold increase in annual expected damage to cultural heritage buildings in the ONTE is expected towards the end of the 21st century.

This is the first application of the CHCRA framework. This pilot study considered only one climate stressor, extreme one-day rainfall events. Damage at built cultural heritage is likely exacerbated and accelerated by other climate stressors, as well as non-climate related factors such as poor maintenance. Furthermore, damage caused by pluvial and/or fluvial flooding mechanisms were not taken into consideration, as well as no consideration given to reduction in risk due to adaptive measures.

This study provided insight into the changing risk posed by an impactful climate stressor to cultural heritage buildings in the ONTE. The study highlights the importance of stakeholder engagement from the outset when carrying out a climate change impact assessment. Further work may benefit from considering a more wide-ranging array of climate stressors to capture synergistic damage processes.

How to cite: O'Neill, S., Tett, S., and Donovan, K.: Extreme rainfall risk and climate change impact assessment for Edinburgh World Heritage sites, EGU General Assembly 2023, Vienna, Austria, 23–28 Apr 2023, EGU23-2440, https://doi.org/10.5194/egusphere-egu23-2440, 2023.

EGU23-3237 | ECS | Orals | ERE1.14

Impact Assessment of Pollution and Climate-Induced Damage on Historic Centre of Rieti (Italy) 

Alessandro Sardella, Linda Canesi, Nisha Prashanth Setty, Raffaela Gaddi, and Alessandra Bonazza

The conservation and protection of cultural heritage, seen in its broadest definition, face ongoing and new challenges as a result of the impacts of slow and extreme climate changes. Therefore, there is the need of further studies and the development of improved methods in order to support decision makers and public authorities in preparing plans to manage and mitigate the correlated risks.

The present contribution aims at analysing and assessing the impacts of pollution and climate change induced extremes on the built heritage located in the historic centre of Rieti (Italy). This research has been conducted in the framework of the Interreg Central Europe Project STRENCH (STRENgthening resilience of Cultural Heritage at risk in a changing environment through proactive transnational cooperation, 2020–2022) and the National Italian Project "Piano Straordinario di Monitoraggio e Conservazione dei Beni Culturali Immobili'', coordinated by the Ministry of Culture. First, the pollutants data (NO2, SO2, O3, PM2,5 and PM10) extracted from air quality monitoring station at Rieti (IT0867A) were analysed and interpreted in accordance with the limiting values mandated by Italian law (legislative Decree 155 of 2010) for the characterization of air quality. Further, surface recession of carbonate stones for the period of 2011-2021 was calculated using Lipfert (1989) and Kucera et al. (2007) damage functions. Then, the “Risk Mapping tool for Cultural Heritage Protection” (https://www.protecht2save-wgt.eu/) was exploited: time series based on earth observation data (e.g. Copernicus C3S reanalysis and NASA GPM IMERG products), historical changes based on EOBS dataset and future hazard maps at territorial level based on outputs from regional and global climate models (EURO-CORDEX initiative) were investigated.

Obtained results reveal that a constant slight decline trend of pollutants annual average is shown over the years from 2011 to 2019. During 2020, lower values for each pollutant component were observed, partially attributed to the lockdown caused by the Covid19 pandemic. It was also observed that each investigated gaseous pollutant and PM fractions were within the limits regulated by the Italian Law.

Regarding the surface recession analysis, it was observed that it has been decreasing over the past 10 years from 2010 with slight increases occasionally. Also here, a decline in 2020 attributed to the lockdown is clearly observable. Moreover, most of particles contributing to PM can be certainly attributed to vehicular traffic, among anthropogenic sources, and are therefore in the fine fraction.

Finally, climate future projections, with spatial resolution of 12x12km, show a general increase of the changes of the extreme indices taken into consideration (R20mm and Rx5day); the biggest variations are typically foreseen for the far future (2071-20100), under the pessimistic scenario (RCP 8.5), highlighting a high likelihood of heavy rain and flooding risk in the area of Rieti.

How to cite: Sardella, A., Canesi, L., Prashanth Setty, N., Gaddi, R., and Bonazza, A.: Impact Assessment of Pollution and Climate-Induced Damage on Historic Centre of Rieti (Italy), EGU General Assembly 2023, Vienna, Austria, 23–28 Apr 2023, EGU23-3237, https://doi.org/10.5194/egusphere-egu23-3237, 2023.

EGU23-5424 | Posters on site | ERE1.14

Characterization of the carbonate rocks of the Calcari di Cagliari Formation using a combined petrographic, geomatic and geophysical approach. 

Giuseppe Casula, Silvana Fais, Francesco Cuccuru, Maria Giovanna Bianchi, and Paola Ligas

The methods and the tools aimed at characterizing and analysing the carbonate materials used in the historic built heritage often follow different ways according to the different branches of applied research involved in the knowledge process. In this framework, the 3D digital models both of in situ architectural elements and of significative samples of rocks used as building materials can play an important role in relating different data and disciplines aimed at the prevention and conservation of the Cultural Heritage. Although the 3D geomatic and geophysical digital models represent privileged tools of the diagnostic analysis, they must be supported by the knowledge of the textural characteristics of the rocks under investigation with petrographic analyses. In order to study the stone materials heavily used in the historic built heritage and analyse their vulnerability to the conditions in their environment, it can be beneficial to study appropriately prepared samples and make as many measurements as necessary with different techniques. Moreover, some analyses are destructive and there is a limit to the number of samples that can be sacrificed. For this reason, in the analysis of rock samples, non-destructive techniques are constantly being improved. In this study, using a suitably implemented integrated methodology we analysed in detail samples of the carbonate rocks of the Calcari di Cagliari formation represented by Pietra Cantone, Tramezzario and Pietra Forte lithologies, mainly used in the past as construction materials for the buildings of the Historical Centre of Cagliari (Italy). Our methodology is represented by an integration of the geomatic survey carried out by structure-from-motion (SfM) digital close-range photogrammetry and the seismic tomography normally used for the in situ inspection adapted to laboratory tests on samples of the above lithologies using ultrasonic frequency signals. The rigorous metric of the geomatic 3D models was used to implement the ultrasonic survey by which internal characteristics and physical properties of the studied material are detected thanks to the spatial variations of the longitudinal velocity obtained after the tomographic inversion. The geomatic and geophysical data were complemented by an accurate analysis of the above carbonate materials by optical and scanning electron microscopy in order to detect their textural characteristics and especially the nature and distribution of their porosity. The microscopy analyses were integrated by mercury intrusion porosimetry (MIP) to obtain further information on the pore network, particularly on the effective porosity, pores-throat diameters/radii, permeability and tortuosity of the investigated materials. All the above parameters were found to affect the geomatic and geophysical behaviour of the carbonate materials. The integration of the multi-technique data produced in this study contributes to better understand the interaction between the investigated materials and the environment.

Acknowledgements

This work was supported by Regione Autonoma dellaSardegna (RAS) (Sardinian Autonomous Region), Regional Law 7th August 2007, no. 7, Promotion of scientific research and technological innovation in Sardinia (Italy), Resp. Sc. S.Fais.

How to cite: Casula, G., Fais, S., Cuccuru, F., Bianchi, M. G., and Ligas, P.: Characterization of the carbonate rocks of the Calcari di Cagliari Formation using a combined petrographic, geomatic and geophysical approach., EGU General Assembly 2023, Vienna, Austria, 23–28 Apr 2023, EGU23-5424, https://doi.org/10.5194/egusphere-egu23-5424, 2023.

Built heritage, which gives identity to the urban fabric and fosters the collective memory of the community, is at risk of deterioration due to climate stressors. These stressors result from rapid urbanisation, covering surfaces with hard materials, and a disconnection from nature.

Today, nature-based solutions have become a growing trend as a way to reconnect with nature and mitigate the impact of climate change. Green infrastructures (GI), in particular, offer numerous environmental and social benefits, especially in dense urban areas, including improved air quality, reduced heat island effect, increased biodiversity and improved stormwater management, and stress-reducing and restorative effects on individuals.

Although built heritage sites form an important part of the urban fabric, they are often excluded from this green transition due to the risk of invasive species damaging historic buildings' structural and aesthetic integrity. Therefore, there is a lack of research analysing rigorously designed examples of GI in a historical context.

This study aims to narrow the focus to the sociocultural perception and acceptance of GI in a historical context. We will analyse spatial-perceptual patterns and socio-cultural motivations behind the deliberate use of GI in this context, using biophilic design principles and architectural perception theories as frameworks. Using GIS monitoring as a methodology, we will map and collect inventory data on real-life examples of GI applied to historical buildings in Belgium-Antwerp. The goal is to understand the correlations between spatial-perceptual factors and the use of GI in built heritage contexts.

How to cite: Kale, E., De Groeve, M., and De Kock, T.: Exploring the Socio-Cultural Compatibility of Green Infrastructures in Built Heritage Contexts: A Case Study in Antwerp (Belgium), EGU General Assembly 2023, Vienna, Austria, 23–28 Apr 2023, EGU23-5685, https://doi.org/10.5194/egusphere-egu23-5685, 2023.

EGU23-5786 | ECS | Posters on site | ERE1.14

Pore-scale investigation of salt weathering in building heritage materials: combining AFM nano-indentation measurements and multiscale modeling. 

Clément Mathieu, Jérôme Wassermann, Pierre M. Adler, Sébastien Péralta, Jean-Louis Gallias, Ronan L. Hébert, and Philippe Bromblet

Salt weathering is a main cause of damage in building heritage materials. Despite the large amount of research on this topic, the mechanism of damaging processes remains not fully understood in particular at the pore scale where the salt crystallization and dissolution occur. For this reason, we propose an innovative approach combining damage proxy measurements at pore-scale using Atomic Force Microscopy (AFM), Raman spectrometry and multi-scale numerical modelling, performed during weathering cycles. Imbibition-evaporation cycles are performed on carbonate stones (Savonnières and Saint Maximin limestones) with a 0.1 mol/L sodium sulfate solution at controlled room temperature and relative humidity. The stone samples are especially designed for the measurements at the pore-scale. Cylinder of 1.6 cm diameter and 1.5 cm thickness have been coated with very viscous epoxy resin. Then the two sides of the cylinder have been polished to obtained two free surfaces that allow the fluid circulation in the sample and the measurements. After each weathering cycle, nanoindentation experiments are performed on representative areas of several hundreds of square micrometers in order to monitor the mechanical properties evolution. A force of the µN order is applied in order to stay in the elastic deformation regime. Young modulus values can be then deduced from the slope of the force curves that occurs during the cantilever deflection. With this method, the effect of salt weathering on the mechanical properties of stone minerals is investigated at the pore scale and with no impact of the measurement on the phases structure (reversible indentations). The AFM results are then coupled with chemical Raman mapping to identify the present phases and assign them their mechanical properties. The obtained experimental data are then used in numerical modeling, to generate a numerical Young modulus field with the same properties than the experimental field. Finally, a new medium with higher dimensions will be generated to compare the results with the macro-scale observations on building heritage stones. AFM characterization shows that changes occurred on the topography of the samples between the first and the third alteration cycles. They are of the order of several tens of nanometers and correspond either to salt crystals deposits or in some cases to the loss of material that took place between the second and the third cycle. A decrease of the Young modulus is observed after each cycle that is of the order of 2 GPa between the first and the second cycles. More significant changes are observed after the third cycle especially in some areas where a decrease up to 3 to 4 GPa is estimated.

How to cite: Mathieu, C., Wassermann, J., Adler, P. M., Péralta, S., Gallias, J.-L., Hébert, R. L., and Bromblet, P.: Pore-scale investigation of salt weathering in building heritage materials: combining AFM nano-indentation measurements and multiscale modeling., EGU General Assembly 2023, Vienna, Austria, 23–28 Apr 2023, EGU23-5786, https://doi.org/10.5194/egusphere-egu23-5786, 2023.

EGU23-5956 | Posters on site | ERE1.14

Obtaining pore size distribution of porous stone using non-Newtonian fluids 

Martin Slavík and Martin Lanzendörfer

The characteristics of the pore space are considered a key factor in susceptibility of the stone to various weathering processes. The pore size distribution can be determined by a number of methods such as mercury intrusion porosimetry or computed topography. None of them is without disadvantages, namely the mercury intrusion porosimetry – despite being very popular – is the object of some critics due to the harmful effects of the mercury. Within the last decade, there has been a growing interest in the use of non-Newtonian fluids for obtaining the pore size distribution of the porous materials (see, e.g., Abou Najm and Atallah, 2016; Rodríguez de Castro et al., 2016). The principle exploits the behaviour of non-Newtonian fluids whose viscosity changes with shear rate. This is manifested by the fact that saturated flow of different fluids under different hydraulic gradients is distributed differently in the pore space. Therefore, conducting a set of saturated flow experiments with different fluids and/or under different hydraulic gradients allows – using a numerical model – to determine an approximation of the pore size distribution.

Our goal is to test feasibility of determining the pore size distribution using saturated flow experiments with low-concentration water-xanthan solutions (<1 g/l) under relatively small hydraulic gradients (<5). We have now completed a set of laboratory experiments for three types of sandstone and we are performing a sensitivity analyses of the parameters used in the numerical model. The presented approach is low-cost, easy-to-use and can serve as an alternative to mercury intrusion porosimetry in geoscience and various cultural heritage studies.


The research is funded by the Czech Science Foundation [21-27291S].


References:

Abou Najm, M.R., Atallah, N.M., 2016: Non-Newtonian Fluids in Action: Revisiting Hydraulic Conductivity and Pore Size Distribution of Porous Media. Vadose Zone Journal, 15(19), 1–15.

Rodríguez de Castro A., Omari, A., Ahmadi-Sénichault, A., Savin, S., Madariaga, L-S., 2016: Characterizing Porous Media with the Yield Stress Fluids Porosimetry Method. Transport in Porous Media, 114, 213–233.

How to cite: Slavík, M. and Lanzendörfer, M.: Obtaining pore size distribution of porous stone using non-Newtonian fluids, EGU General Assembly 2023, Vienna, Austria, 23–28 Apr 2023, EGU23-5956, https://doi.org/10.5194/egusphere-egu23-5956, 2023.

EGU23-6252 | ECS | Orals | ERE1.14

Investigations of shallow aquifer groundwater systems of a Gallo-roman anthropized site using earth tide analysis 

Elijah Edet Nkitnam, Alexis Maineult, and Jérôme Wassermann

The prospect for the sustainability of the Gallo-Roman archeological site located in Genainville (France), where relics and artifacts dated to the 2rd century CE have been excavated is threaten by groundwater ingression. The in-situ building heritage materials and structures comprising a two cellea temple and an amphitheater made of limestones, are submitted all days to rising and changing groundwater levels; water being the main agent or vector of damage processes (salt weathering or freeze-thaw cycles). As part of a multi-disciplinary effort to support archeological expeditions and conserve the site structures. We report the results of groundwater monitoring and hydrogeological studies as well as tidal subsurface analysis executed to quantitatively evaluate hydraulic and geo-mechanical characteristics of the subsurface sequences toward a nondestructive approach. Continuous groundwater level data recorded in three wells in the archeological site were decomposed into constituent events that impact the observed fluctuations. The groundwater levels and barometric pressure data were acquired at 60 seconds intervals to study the response of the aquifer to strain and stress prevalence at the site. Using the method of regression deconvolution, the response to barometric pressure was disentangled from the measured water levels. Theoretical Earth tides parameters were computed using the PyGtide code, based on the ETERNA PREDICT program, at intervals of 1 minute. Harmonic analysis of the raw and filtered data using the classical Fast Fourier transform (FFT), and Singular Spectral Analysis (SSA) identify M2, S2, K1 and O1 tidal constituents as the dominant amplitudes. The SSA technique has the advantage of resolving the events into individual strands compare to the spectra of the composite data produced by the FFT. Hence, an event decomposed in the data is isolated in terms of it frequency and amplitude, and visualized. The K1 and S2 harmonic constituents were present in the filtered and raw data sets with different amplitudes. The amplitude response method was used to compute the poroelastic properties of the aquifer and characterize the subsurface heterogeneity. The model identified a semi-confined aquifer as the main groundwater storage system in the site.

Keyword: Heritage site, groundwater ingress, harmonic constituents, hydraulic properties

How to cite: Nkitnam, E. E., Maineult, A., and Wassermann, J.: Investigations of shallow aquifer groundwater systems of a Gallo-roman anthropized site using earth tide analysis, EGU General Assembly 2023, Vienna, Austria, 23–28 Apr 2023, EGU23-6252, https://doi.org/10.5194/egusphere-egu23-6252, 2023.

EGU23-8060 | Orals | ERE1.14

Comparison of different kinds of models to simulate the alteration of medieval stained glass as a function of climate and pollution 

Aurélie Verney-Carron, Loryelle Sessegolo, Roger-Alexandre Lefèvre, and Peter Brimblecombe

A large number of stained glass windows were installed from the 13th century. During the Middle-Ages, most of glass pieces have a Si-K-Ca composition with a relatively low SiO2 content, but high content of K2O and CaO.  This chemical composition means that medieval stained glass deteriorates during environmental exposure, from climate and environmental pollution. These alterations are manifested in the form of an alteration layer and secondary phases (mainly gypsum or syngenite). The alteration layer is generally depleted in K and Ca, but rich in Si, Al and Fe. Its thickness varies up to 300 µm after 6 or 7 centuries of alteration. In order to reconstruct the alteration history and predict the deterioration of stained glass windows in the future, it is necessary to determine alteration rates as a function of the climate and environmental parameters.

Several methodologies can be used to achieve this. First, short-term exposures or laboratory experiments can assess the first stages of the alteration and short-term kinetics. From these results, dose-response functions (DRF) were established for sheltered and unsheltered rain conditions. They correlate relevant environmental factors (temperature, rain quantity, rain pH, relative humidity, SO2 concentration) with the response of the materials in terms of alteration layer thickness. The second methodology consists in laboratory experiments that aim at parametrizing kinetic laws as a function of specific parameters (temperature, pH of rain, and relative humidity). These kinetic parameters do not directly consider pollution, but they can be extrapolated over long periods and can be inputs to geochemical models. In this study, we have compared both methodologies to simulate the alteration of a model stained glass at different European sites (using data from the ICP-Materials program). Both models give good results, but the geochemical model tends to underestimate the alteration at polluted sites. This indicates that the pollution via the concentration in SO2 for example should be included to improve the model.

How to cite: Verney-Carron, A., Sessegolo, L., Lefèvre, R.-A., and Brimblecombe, P.: Comparison of different kinds of models to simulate the alteration of medieval stained glass as a function of climate and pollution, EGU General Assembly 2023, Vienna, Austria, 23–28 Apr 2023, EGU23-8060, https://doi.org/10.5194/egusphere-egu23-8060, 2023.

Moisture and salts cause considerable damage to built and rock-hewn heritage. Rock moisture is a key factor for numerous decay processes, but there is limited knowledge of salt and moisture distribution because measurements of spatial and temporal moisture distribution still remain challenging. The medieval cave town of Uplistsikhe (Georgia) is hewn out of very soft Lower Miocene sandstone and is a typical example of a heritage site suffering from progressive decay. We present data on moisture and salt distribution derived from a multi-method approach, including microwave sensor monitoring (MW-mon; continuously over 2 yrs), microwave handheld sensors (MW), 2D-resistivity profiles (ERT), rock sampling by drilling, and salt extraction by paper pulp poultices (PPP).

Microwave monitoring was applied for the first time (to our knowledge) in a long-term monitoring of heritage sites. We used equipment from hf-sensor (Germany) with two types of microwave reflectivity sensors penetrating approx. 7 cm and 13 cm deep, respectively. The sensors were installed inside and outside of two prominent caves (Grand Hall and Long Hall). MW, ERT, PPP and drilling were carried out in four caves (the two mentioned plus Blackberry Hall and Teatron). Careful laboratory calibration using samples from the site was necessary to produce quantitative results for MW-mon, MW and ERT.  

MW-mon showed pronounced annual fluctuation with highest moisture saturation occurring in summer. The moisture maximum in the caves lags 2 months behind the spring precipitation maximum and might be partly caused by air humidity condensation amplified by salts. Heavy rainfall events cause additional moisture pulses by seeping through the rock or by capillary rise. Spatial moisture distribution derived from MW shows relatively dry rock outside the caves and different patterns of moisture ingress into the caves: Capillary rise from the base, ingress through fractured or otherwise water-permeable areas of the roofs or back walls. The spatial patterns are confirmed by ERT; however, calculated moisture saturation differs between MW and ERT due to electrical conductivity effects of salty pore water.

All drill samples from the caves are significantly saltier on the respective surfaces, which points to the rate of evaporation being smaller than the outward migration of salts. Outside the caves, flaking of thicker layers (several cm) point to deeper layers of salt concentration caused by higher evaporation from the surface; flaking at the "lips" above the caves is probably also amplified by stronger temperature and moisture fluctuations. The main ions everywhere are  Ca2+ and SO42- (subordinate K+) while at the strongly flaking surfaces of Grand Hall, Na+, Cl- and NO32- are also present. Summing up, the results show very diverse and complex patterns of moisture and salt distribution at an apparently homogeneous site.

How to cite: Sass, O. and Fruhmann, S.: Spatiotemporal rock moisture distribution at the medieval cave town of Uplistsikhe, Georgia, EGU General Assembly 2023, Vienna, Austria, 23–28 Apr 2023, EGU23-8442, https://doi.org/10.5194/egusphere-egu23-8442, 2023.

EGU23-11011 | Posters on site | ERE1.14

Evaluation of salt weathering equations. – a review 

Chiaki Oguchi

Salt weathering of building stone is a major cause of loss of historic structures. Many geoheritage sites including stone heritage and geomorphosites have been damaged by this process. In nearly two centuries, research and observation relating salt weathering have accumulated. These studies could be organized focusing on theories, mechanisms, experimental methods, and research tools. This presentation introduce by reviewing many, though not enough, studies to summarize the research history of salt weathering, including the results of subsequent studies, especially focused on an important mechanism of salt weathering, crystallization pressure. Since the concept of crystallization was first proposed in the early 20th century, many equations have been proposed. However, in order to apply them correctly, it is important to consider the type of salt weathering and the surrounding environment, as well as the type and properties of salt and rock (rock properties), and to select and apply the proposed model according to the situation. Although salt weathering studies have been done in a wide variety of research fields, appropriate collaboration among disciplines will lead to meaningful conservation and will be used for practical problems in the future.

How to cite: Oguchi, C.: Evaluation of salt weathering equations. – a review, EGU General Assembly 2023, Vienna, Austria, 23–28 Apr 2023, EGU23-11011, https://doi.org/10.5194/egusphere-egu23-11011, 2023.

EGU23-11840 | Posters virtual | ERE1.14

Smart IoT sensors as part of a holistic solution for improving resilience and sustainable reconstruction of historic areas 

Dr. Antonis Kalis, Nikos Mitro, and Dr. Angelos Amditis

Although Climate Change (CC) has already been reported to have a significant impact on historical areas hosting Cultural Heritage (CH) sites, it is still challenging to assess quantitatively and qualitatively the impact of various climatic and other parameters on the CH sites, since the specific climatic conditions at their vicinity, and the emanating effects on their structure, are difficult to grasp due to cost and regulatory barriers. In the framework of the HYPERION EU project, we address this problem by providing a holistic solution for improving resilience and sustainable reconstruction of historic areas, which integrates the use of smart IoT devices, called Smart Tags, designed to provide environmental measurements close to monuments, with a number of state-of-the-art of technologies, services and tools (e.g. advanced ML, IoT, satellite and terrestrial imaging, social networking, event, material decay and business continuity modelling), in order to develop a single decision support system which aspires to become the cornerstone for resilience and reconstruction planning for historic areas in the future.

How to cite: Kalis, Dr. A., Mitro, N., and Amditis, Dr. A.: Smart IoT sensors as part of a holistic solution for improving resilience and sustainable reconstruction of historic areas, EGU General Assembly 2023, Vienna, Austria, 23–28 Apr 2023, EGU23-11840, https://doi.org/10.5194/egusphere-egu23-11840, 2023.

EGU23-11948 | ECS | Orals | ERE1.14

Selection of relevant black crusts samples as ancient air pollution archives 

Mathilde Ropiquet, Aurélie Verney-Carron, and Anne Chabas

Since the Industrial revolution and due to increasing anthropogenic emissions, the composition of the atmosphere has been modified, leading to climate change and pollution. The impacts of pollution were depicted through paintings and writing from the beginning of the 19th century, but pollution measurements are relatively recent. In order to obtain ancient air pollution data, proxies in urban area need to be found.

Black crusts formed on limestone and marble monuments in urban area seem to be a good candidate as local proxy. Mainly composed of gypsum (CaSO4.2H2O), they are a chemical alteration pattern resulting from the reaction of the dissolution of the calcite (CaCO3) of the stone and of sulfation by sulphur dioxide (SO2) from the atmosphere. Particulate matter accumulates in the newly formed gypsum layer in sheltered area from the rain, thus giving the black crust a passive sampler potential.

To use black crusts as past air pollution archives, samples were collected at Père Lachaise cemetery (Paris) on ancient, dated (1820-1887) and unrestored limestone or marble tombs. Different types of analyses were performed to study sample morphology (by Optical Microscope), particulate matter (by Scanning Electron Microscopy) and chemical composition (especially major elements and trace metals by ICP-AES, LA-ICP-MS). Results underline two important features to use black crusts as past air pollution archives. First, the low variability of chemical composition of black crusts from Père Lachaise cemetery highlights that the black crusts are representative of the site and register the background pollution. Then, the morphology (laminar vs. dendritic) of black crusts is a key parameter to sample black crusts as the stratigraphy is much better preserved in laminar black crusts.

How to cite: Ropiquet, M., Verney-Carron, A., and Chabas, A.: Selection of relevant black crusts samples as ancient air pollution archives, EGU General Assembly 2023, Vienna, Austria, 23–28 Apr 2023, EGU23-11948, https://doi.org/10.5194/egusphere-egu23-11948, 2023.

EGU23-12449 | ECS | Orals | ERE1.14

The technical relationship between vertical greening and built heritage 

Marie De Groeve, Eda Kale, Scott Allan Orr, and Tim De Kock

Built heritage is rich in cultural and economic values and is an essential part of urban environments. These buildings are abundant in city centres that have been the site of development for several centuries. This has produced a dense environment, exhibiting strong urban heat island effects. Green initiatives are increasingly being implemented to mitigate current climate stressors and improve the health and well-being of residents. However, built heritage is often excluded from these approaches due to concerns about their impact on materials and structural integrity, which is poorly understood. 

This research scopes the technical compatibility of vertical greening with built heritage in an urban environment regarding the degradation of historic building materials. Vertical greening here is understood to include plants, rooted in the ground, growing along a vertical surface by either attaching themselves to the façade or trellising. Investigating the impact of vertical greening on the local microclimate by monitoring case studies, lab experiments and analysing current literature can help us understand how vertical greening affects common forms of degradation caused by salts, frost, bio-activity and air pollution. Each method has its own approach to understanding the relationship of vertical greening with built heritage and is complementary to the others. The lab experiments explore the three main factors impacted by vertical greening such as temperature and relative humidity, incoming solar irradiation and precipitation exposure. Temperature and relative humidity are inseparably connected with each other and therefore analysed together. The impact of vertical greening on the aforementioned environmental parameters is investigated separately to provide better insights into those microclimatic changes that determine the risk of weathering of historic building materials.

How to cite: De Groeve, M., Kale, E., Orr, S. A., and De Kock, T.: The technical relationship between vertical greening and built heritage, EGU General Assembly 2023, Vienna, Austria, 23–28 Apr 2023, EGU23-12449, https://doi.org/10.5194/egusphere-egu23-12449, 2023.

EGU23-12934 | ECS | Posters on site | ERE1.14

Microclimatic monitoring of the plaster casts of the Trajan’s Column in the Museum of Roman Civilisation (Rome) 

Federica Bubola, Eleonora Balliana, Chiara Coletti, Claudia Cecamore, Claudio Parisi Presicce, and Claudio Mazzoli

In recent years, the control of the micro-climate in museum environments or in historical buildings has assumed a role of great importance for the protection of the artefacts exhibited and for planning cost-effective and strategic preservation policy. The process of degradation indeed, defined as a result of progressive and cumulative material decay, strongly depends by environmental variables and their changes. Rapid changes and/or strong gradients in temperature and/or relative humidity, are the main causes of internal stress and of material surface detachments. Compared to new museums, historical ones often do not dispose of ideal conservation parameters, and they need specific conservation environments, considering the so-called historical climate, i.e. the microclimate to which the Cultural Heritage has adapted over the time. This is the case of the Museum of Roman Civilisation (Rome), which has been closed since 2014 and hosts a huge and valuable collection of plaster casts, such as those of the Trajan’s Column made by Napoleon III in 1861-1862 and gifted from Vatican City to Rome City Hall in 1953. In view of the imminent museum reopening and restoration, it is essential to define the actual level of microclimate quality, compared to the expected one, considering also economic and regulatory aspects and the future welfare of the artefacts. The research is focused on the response of the materials to the micro-climate by evaluating the incidence of temperature and relative humidity, presumably the main chemical and physical degradation factors for the plaster casts. A multidisciplinary diagnostic approach (i.e. Hyperspectral Imaging, Raman Spectroscopy, Infrared Spectroscopy) is also planned to characterise the constituent materials, to suppose the manufacturing techniques of the casts and to identify the degradation forms. The analysis of the complex interaction between the dynamics of the climate and the need for the conservation of the artefacts under conditions of maximum stability represents the starting point for proposing a sustainable restoration of the Trajan’s Column plaster casts of the Museum of Roman Civilisation and a future exhibition project that will allow their valorisation and exposure.

How to cite: Bubola, F., Balliana, E., Coletti, C., Cecamore, C., Parisi Presicce, C., and Mazzoli, C.: Microclimatic monitoring of the plaster casts of the Trajan’s Column in the Museum of Roman Civilisation (Rome), EGU General Assembly 2023, Vienna, Austria, 23–28 Apr 2023, EGU23-12934, https://doi.org/10.5194/egusphere-egu23-12934, 2023.

EGU23-13158 | Posters on site | ERE1.14

The use and vulnerability of medieval masonries in Balaton region, Hungary 

Ákos Török, Bendek Logó, and Annamária Kis

The geology of the region strongly influences the construction materials of Medieval structures and, consequently, the available raw materials. The current study focuses on the use and vulnerability of various lithotypes and renders in a Medieval Ruined Chuch in West Central Hungary, close to Lake Balaton. The church was constructed in the 13th century and was rebuilt in several periods using various lithotypes and renders. The identification of primary lithologies followed the generation of point clouds by Terrestrial Laser Scanner and the drawing of walls. More than ten various stone types were found, including Jurassic cherty limestone, cemented Triassic limestone (Muschelkalk), basalt tuff, basalt, red Permian sandstone, grey Tertiary sandstone, highly porous Miocene limestone, and travertine. The properties of stones and condition assessment were made by using non-destructive on-site strength tests such Schmidt hammer and Duroskop. Micro-drilling technique was also applied to assess the strength parameters of renders: medieval lime-based mortars, 20th-century portland cement based mortars. Small samples were also taken for laboratory analyses. Our studies suggest that the application of portland cement bearing renders in the 20th century caused significant damage to the structure, accelerating weathering processes. Medieval lime mortars are relatively durable and show smaller-scale alterations. The use of various lithotypes leads to differential weathering of the structure. The long-term preservation of this building depends on the use of appropriate renders and the refurbishment of wall sections that are structurally unstable.

How to cite: Török, Á., Logó, B., and Kis, A.: The use and vulnerability of medieval masonries in Balaton region, Hungary, EGU General Assembly 2023, Vienna, Austria, 23–28 Apr 2023, EGU23-13158, https://doi.org/10.5194/egusphere-egu23-13158, 2023.

EGU23-13243 | Orals | ERE1.14

IT support for climate resilient cultural heritage - examples from the KERES project 

Jürgen Moßgraber, Tobias Hellmund, and Lola Kotova

Not only ecosystems are particularly sensitive to extreme weather as a result of climate change. Historical buildings, museum’s collections and historical gardens can also be affected by extreme weather conditions. Assessing the extent to which cultural assets are endangered by such weather and climate events is an interdisciplinary task that requires the collaboration of climate scientists together with cultural heritage managers, monument conservators, restorers and engineers. However, this discussion is currently hardly taking place in Germany, both on a scientific and on policy levels.

Therefore, the BMBF-funded project KERES addresses the following questions:

  • What safety risks of our cultural heritage are caused by extreme weather events?
  • Which practical solutions need to be addressed and managed the current and emerging impacts of climate change on cultural assets in Germany?

In close cooperation with the relevant stakeholders and potential users, such as the Prussian Palaces and Gardens Foundation (SPSG), Fraunhofer IOSB is building a web-based knowledge platform that combines the research results and best practices for adaptation and mitigation measures of the historical buildings and historical parks property. This aims to create the greatest possible degree of user orientation so that the knowledge platform can be used sustainably in the long term. This platform is able to collect and integrate multisource information in order to effectively provide complete and updated situational awareness and decision support for innovative measurements improving cultural heritage resilience, in particular new solutions for maintenance and conservation. It is based on the open source; easily configurable and extendable. It can be accessed by the wide range of users via the web interface.

Several levels of data integration, aggregation and linking are aggregated:

  • integration of expert knowledge,
  • connection of sensors for comprehensive monitoring

and reporting,

  • data analysis of complex processes with an open interface

for easy integration of new algorithms,

  • semantic and geographic linking of analysis data and
  • multiple domain information.

The backbone of this information network is an ontology, which connects the data of the different domains, like cultural heritage, climate change, environmental data, crisis management, regulations, sensor data management, buildings, materials and many more. The platform is flanked by two other applications, such as a planning tool for the evacuation of art objects:

  • This is a tool for creating route maps for the fire brigade to evacuate cultural objects.
  • The decision-maker supports finding individual measures against damage caused by climate change.

The applications for preventive and reactive measures to deal with potential or acute damage situations are examined as well. The designed methods are tested for five case studies including historical buildings and historical gardens in Germany.

How to cite: Moßgraber, J., Hellmund, T., and Kotova, L.: IT support for climate resilient cultural heritage - examples from the KERES project, EGU General Assembly 2023, Vienna, Austria, 23–28 Apr 2023, EGU23-13243, https://doi.org/10.5194/egusphere-egu23-13243, 2023.

EGU23-13666 | Orals | ERE1.14

Global warming evidence in long-term temperature monitoring of heritage karstic caves 

François Bourges, Bruno Lartiges, Frédéric Perrier, Dominique Genty, Rémi Losno, Stéphane Bonnet, Vincent Regard, Stéphanie Touron, Faisl Bousta, Frédéric Girault, and Pascal Foucher

The outstanding preservation of Paleolithic decorated caves is related to the buffering properties of their karstic environment. However, long-term monitoring of air/wall temperatures and gas compositions has recently revealed disruption signs in cave microclimates that had been maintained stable for hundreds of centuries.

High precision and continuous temperature data records are currently monitored in various prehistoric caves in the South of France. Such operations have been promoted since the late 1990s by the French government for risk assessment and conservation.

The most striking feature is the positive drift of underground temperatures (air and wall) which is now obvious in most sites except for Niaux Cave (> 300 m undersurface) and in the deepest parts of Mas-d’Azil and Chauvet Caves (> 50 m undersurface). In tourist caves (Pech-Merle, Mas-d’Azil, Gargas, Villars), the positive thermal trends could not be related to the energy increase brought by visitors which number is now stable, nor to the lighting systems whose energy demand was strongly reduced. In addition, the underground thermal drift nearly starts at the same time in many caves with uncertainties of +/- 1 year: 2012 for Chauvet with +0.4 °C/decade, 2011 for Pech Merle with +0.32 °C/decade, 2011 for Marsoulas Cave with +1.09 to +0.36 °C/decade from the entrance to the deep gallery, 2011 for Gargas with +0.69 °C, +0.54 °C and +0.36 °C for the deeper station. It is worth noting that a 0.3-0.4 °C thermal drift is consistent with that predicted from global warming in these regions.  The thermal drifts were already in progress when monitoring began in Villars Cave in 1996 (+0.17 °C to +0.39 °C/decade), in Mas-d’Azil in 2012 and in Bruniquel in 2015. Marsoulas (+1.09 °C/decade) and Mas-d’Azil (more than +1 °C/decade in 6 of the 16 stations) present a much higher drift rate compared with that of surface, which suggests a thermal amplification process.

As measurements are performed in heterothermal zones, the long-term thermal drifts are modulated by persisting smoothed and out-of-phase yearly variations. A notable exception is the case of Bruniquel main gallery where the temperature records show a quasi-linear increase. In that case, the decadal evolutions of temperature +0.31 °C, +0.175 °C, and +0.24 °C, are not related to the depth of monitoring stations (32 m, 55 m, and 38 m, respectively) nor to their distances from the entrance. In 2018, those drift rates induced a permanent inversion of thermal gradient in the main gallery. In Gargas, the drift rate is more pronounced in the outer parts of the karst body, thus inducing a continuous evolution of the thermal gradients within the galleries.

Such underground microclimate disruption of patrimonial caves is a warning signal of direct threat on the preservation of remains. Karst physical organization and its related underground environment are themselves legacies of past climates; the current functioning of transfer zones of karst aquifers which includes the caves, are directly dependent on the outside climate. A more comprehensive approach and modelling of possible tipping points are urgently needed for conservation issues.

How to cite: Bourges, F., Lartiges, B., Perrier, F., Genty, D., Losno, R., Bonnet, S., Regard, V., Touron, S., Bousta, F., Girault, F., and Foucher, P.: Global warming evidence in long-term temperature monitoring of heritage karstic caves, EGU General Assembly 2023, Vienna, Austria, 23–28 Apr 2023, EGU23-13666, https://doi.org/10.5194/egusphere-egu23-13666, 2023.

EGU23-13699 | ECS | Posters on site | ERE1.14

Assessing weathering damage in Arenitic Rock using Non-Destructive Testing: the case study of the stone coats of arms of Palazzo Ricasoli in Florence 

Eugenio Segabinazzi, Teresa Salvatici, Irene Centauro, Sara Calandra, and Carlo Alberto Garzonio

Assessing weathering damage in Arenitic Rock using Non-Destructive Testing: the case study of the stone coats of arms of Palazzo Ricasoli in Florence 

The conservation of architectural heritage often involves studying the effects of weathering on stone materials exposed to polluted environments with characteristics unfavorable to their preservation. The decay phenomena that occur in urban environments can lead to destructive effects on stone material, resulting in the need for specific analysis to assess the mechanical properties of these artifacts. 

In this study, we analyzed three stone coats of arms that decorate the facade of Palazzo Ricasoli in Florence using non-destructive diagnostic techniques (NDTs) to assess their degree of weathering.  

Palazzo Ricasoli is a historic Renaissance palace, located in the center of Florence, that features three stone coats of arms on its façade that are currently in critical condition, showing signs of very advanced degradation. The stone of which they are composed is a type of local sandstone rock commonly used in Florentine historical architecture. 

To investigate the properties of the material we used in situ techniques, such Sonic test and 3D scanning. The results obtained with these techniques were then compared with those obtained from laboratory analysis of micro-samples using methods such as Fourier transform infrared spectroscopy (FTIR), X-ray Diffraction (XRD), X-ray Fluorescence (XRF), and optical microscopy.  

Using NTDs we were able to gather data and insights on the mechanical properties of weathered rock used in historical buildings, obtaining crucial information that can be used to develop appropriate and detailed conservation strategies to ensure the long-term stability of these materials in their environmental conditions.

How to cite: Segabinazzi, E., Salvatici, T., Centauro, I., Calandra, S., and Garzonio, C. A.: Assessing weathering damage in Arenitic Rock using Non-Destructive Testing: the case study of the stone coats of arms of Palazzo Ricasoli in Florence, EGU General Assembly 2023, Vienna, Austria, 23–28 Apr 2023, EGU23-13699, https://doi.org/10.5194/egusphere-egu23-13699, 2023.

EGU23-14025 | Posters on site | ERE1.14

Climate change impact of salt weathering on vernacular and archaeological cultural heritage building materials in Europe and Latin America 

Beatriz Menendez, Julian Esteban Cantillo, and Benjamin Quesada

Salts are widely present in all porous building materials. Their chemical composition, degree of hydration and crystalline phase as well as their abundance and location in the building are highly variable. In addition, these parameters depend on the type of material, the location and environmental factors such as climate, air pollution or groundwater composition.  The crystallization of salts inside porous materials depends on the nature of the solutions present in the pores and the conditions under which it occurs. Environmental, climatic and pollution conditions have changed in the past and continue to change today.

In this work we will estimate the changes of the potential salt weathering in vernacular cultural heritage in Europe and archaeological sites in Latin America, in particular in the selected regions of the European project SCORE (Sustainable COnservation and REstoration of built cultural heritage 2021-2024). In order to determine how future climatic conditions may affect salt weathering in these sites, climatic conditions in different models, based on scientific literature, will be used. Salt weathering will be estimated for different salts: Na2SO4, NaCl, and mixture of salt.

For temperatures between 0 and 30 ° C, the solubility of sodium chloride is almost constant (around 26% by mass) while that of sodium sulfate is very variable (between 5% and 20% by mass). Changes in temperature will induce precipitation/dissolution more easily for sodium sulphate than for sodium chloride. Similar conclusions can be drawn for changes in relative humidity in the case of crystals. In the case of sodium sulphate, the crystalline phase changes between the anhydrous salt (thenardite) and the decahydrated salt (mirabilite) and the deliquescence will depend on both temperature and relative humidity. In the case of sodium chloride with a single degree of hydration at temperatures above 0°C, the deliquescence is almost independent of temperature, with a relative humidity of almost constant equilibrium around 75%. In general, salts that have only one state of hydration have a lower capacity of degradation than salts with several phases of hydration. Phase diagrams will be employed to quantify the weathering induced by thee salts.

In nature as well as in buildings, it is common to find associations of salts more than pure salts, which complicates the study of the dependence of salt crystallization on environmental conditions. The variety of salts that can be formed by crystallization of solutions containing several different anions and cations is extremely important. The behavior of mixed solutions is much more complicated than that of solutions containing a single species of cation and anion. For complex solutions, the crystallization pathways as a function of composition and environmental conditions cannot be directly deduced from that of the salts taken separately. Thermodynamic models can be very useful for modeling the sequence and conditions of salt crystallization in a solution. We used the ECOS-RUNSALT model to calculate the evolution of salt volume as a function of temperature and relative humidity conditions to estimate the weathering produced by complex solutions.

How to cite: Menendez, B., Esteban Cantillo, J., and Quesada, B.: Climate change impact of salt weathering on vernacular and archaeological cultural heritage building materials in Europe and Latin America, EGU General Assembly 2023, Vienna, Austria, 23–28 Apr 2023, EGU23-14025, https://doi.org/10.5194/egusphere-egu23-14025, 2023.

EGU23-15431 | Posters virtual | ERE1.14

The Loggiato dei Cappuccini in Comacchio (Italy): assessment of degradation and state of conservation. 

Elena Marrocchino, Lorenzo Ferroni, Rino Manfrini, Maria Grazia Paletta, and Chiara Telloli

Cultural heritage is an irreplaceable component of a country's socio-cultural and economic capital, valuable for community cohesion and for the creation and enhancement of social capital, economic impact and environmental sustainability [1-4]. Unfortunately, the vulnerability of cultural heritage has increased over time and its exposure to a series of slow and sudden natural and man-made hazards threatens its existence.

Comacchio is a small municipality in the province of Ferrara (Emilia-Romagna region in north-eastern Italy), in the southern part of the present-day Po River estuary. It is an early medieval settlement, mainly known for the presence of several Etruscan settlements in its territory [5]. Comacchio is the result of continuous variations in sea level and the Po River, the extent of subsidence phenomena, and finally human activity over the last five thousand years.

The Loggiato dei Cappuccini has always been a symbol of the town of Comacchio for its simple and pleasant aesthetic characteristics, for the shelter it can offer from the weather and the summer sun, for its secluded position with respect to the town centre and for its connection with the sanctuary of the Virgin Mary in Aula Regia, which has always been venerated here [6,7].

This study aims to enhance the Capuchin Loggia through an analysis of the monument's state of conservation. The research started with a historical analysis of the maintenance and restoration work that the monument has undergone over time. Subsequently, macroscopic observation and bibliographic research also analyzed the current degradation morphologies and their causes. The proposed analysis campaign may be used by the Municipality of Comacchio to plan future rehabilitation and restoration works aimed at the conservation of the historical-cultural heritage.

References

  • Cultural Heritage Counts for Europe. Full Report of the EU Project “Cultural Heritage Counts for Europe: towards a Eu-ropean Index for Cultural Heritage”, 2015. https://www.europanostra.org/our-work/policy/cultural-heritage-count s-europe/
  • Culture 2030 Indicators: Thematic Indicators for Culture in the 2030 Agenda. United Nations Educational, Scientific and Cultural Organization, 2019. http://uis.unesco.org/sites/default/files/documents/publication_culture_202 0_indicators_en.pdf
  • Transforming our world: the 2030 agenda for sustainable development. Resolution A/RES/70/1, United Nations General Assembly, United Nations, 2015. https://sustainabledevelopment.un.org/post2015/transformingourworld/publication
  • Romão, X.; Bertolin, C. Risk protection for cultural heritage and historic centres: Current knowledge and further research needs. Int J Disaster Risk Reduc, 2022, 67, 102652,
  • Gelichi, S. L’Isola del Vescovo, Firenze, Edizioni all’insegna del Giglio s.a.s., 2009.
  • Alberti, A. Segnali di una ritrovata cultura della manutenzione urbana e architettonica a Comacchio, FE. Quaderni di soprintendenza : Qds, 2001, 5.
  • Zamboni, A. La fabbrica dei pesci dietro il loggiato dei Cappuccini e la sede amministrativa delle Valli Comunali di Comacchio. In: Anecdota, Quaderni della Biblioteca L.A. Muratori Comacchio, Ferrara, Gabriele Corbo Editore, 2001, 1/2, 1.

How to cite: Marrocchino, E., Ferroni, L., Manfrini, R., Paletta, M. G., and Telloli, C.: The Loggiato dei Cappuccini in Comacchio (Italy): assessment of degradation and state of conservation., EGU General Assembly 2023, Vienna, Austria, 23–28 Apr 2023, EGU23-15431, https://doi.org/10.5194/egusphere-egu23-15431, 2023.

EGU23-16553 | ECS | Posters on site | ERE1.14

Porosity evolution of granitic rocks used for the bridge construction 

Vendula Natherová, Richard Přikryl, Daniela Řimnáčová, Martin Racek, and Jiřina Přikrylová

Granitic rocks are generally ranked to very low porosity (open porosity of fresh, non-weathered granite should be below 1 vol. %) and durable rocks. Favourable physical properties dictate their choice for monumental works and important infrastructural projects such as bridges.

Current study focuses on detailed analysis of porosity evolution in granitic rocks used for the construction of two road bridges (making part of cultural heritage of the Czech Republic) over the Vltava River in Prague (Bohemian capital) in the second half of 19th c. After 120-150 service, many of the stone ashlars of load-bearing parts exhibit quite extensive decay phenomena; however, mostly close to the exposed surfaces. In order to understand causes of decay, several tens of samples obtained from decayed surfaces and from original source quarries were studied by various methods, namely mercury intrusion porosimetry (MIP) and optical and scanning electron microscopy.

Based on the results, porosity of granites in the stone masonry significantly increased compared to that of source rocks: two principal types of granites show open porosity 0.53-0.82 vol. %, and 1.03-1.15 vol. % respectively. In the case of granitic samples from studied bridges, their open porosity ranged from 2.13 to 6.42 vol. %. Most of the pores rank to coarse pores and macropores (according to IUPAC terminology), content of mesopores is negligible.

Significant increase of porosity reflects dynamics of decay process in a specific microclimate in Vltava River valley and polluted atmosphere of the city. However, pre-quarrying history of granites is another important factor: the examined rock types belong to the oldest members of the Central Bohemian Plutonic Complex of Variscan age, and numerous discrete hydrothermal alteration phenomena present in the studied rocks can promote their susceptibility to decay as well.

How to cite: Natherová, V., Přikryl, R., Řimnáčová, D., Racek, M., and Přikrylová, J.: Porosity evolution of granitic rocks used for the bridge construction, EGU General Assembly 2023, Vienna, Austria, 23–28 Apr 2023, EGU23-16553, https://doi.org/10.5194/egusphere-egu23-16553, 2023.

EGU23-370 | PICO | NH9.9

A climate based dengue early warning system for Pune, India 

Sophia Yacob and Roxy Mathew Koll

Dengue incidence has grown dramatically in recent decades, with about half of the world’s population now at risk. Climate plays a significant role in the incidence of dengue. However, the climate-dengue association needs to be clearly understood at regional levels due to the high spatial variability in weather conditions and the non-linear relationship between climate and dengue. The current study evaluates the impacts of weather on dengue mortality in the Pune district of India, for a 15-year period, from 2001 to 2015. To effectively resolve the complexity involved in the weather-dengue association, a new dengue metric is defined that includes temperature, relative humidity, and rainfall-dependent variables such as intraseasonal variability of monsoon (wet and dry spells), wet-week counts, flushing events, and weekly cumulative rains. We find that high dengue mortality years in Pune are comparatively dry, with fewer monsoon rains and flush events (rainfall > 150 mm), but they have more wet weeks and optimal humid days (days with relative humidity between 60–78%) than low dengue mortality years. These years also do not have heavy rains during the early monsoon days of June, and the temperatures mostly range between 27–35°C during the summer monsoon season (June–September).  Further, our analysis shows that dengue mortality over Pune occurs with a 2-5 months lag following the occurrence of favourable climatic conditions. Based on these weather-dengue associations, an early warning prediction model is built using the machine learning algorithm random forest regression. It provides a reasonable forecast accuracy with root mean square error (RMSE) = 1.01. To assess the future of dengue mortality over Pune under a global warming scenario, the dengue model is used in conjunction with climate change simulations from the Coupled Model Intercomparison Project phase 6 (CMIP6). Future projections show that dengue mortality over Pune will increase in the future by up to 86 percent (relative to the reference period 1980–2014) by the end of the 21st century under the high emission scenario SSP5-8.5, primarily due to an increase in mean temperature (3°C increase relative to the reference period). The projected increase in dengue mortality due to climate change is a serious concern that necessitates effective prevention strategies and policy-making to control the disease spread.

How to cite: Yacob, S. and Mathew Koll, R.: A climate based dengue early warning system for Pune, India, EGU General Assembly 2023, Vienna, Austria, 23–28 Apr 2023, EGU23-370, https://doi.org/10.5194/egusphere-egu23-370, 2023.

EGU23-570 | ECS | PICO | NH9.9

Human health as an indicator of climate change. 

Moiz Usmani, Kyle Brumfield, Yusuf Jamal, Mayank Gangwar, Rita Colwell, and Antarpreet Jutla

The association of climatic conditions with human health outcomes has been known for ages; however, the impact of climate on infectious agents in disease transmission is still evolving. Climate change alters the regional weather impacting the emergence, distribution, and prevalence of infectious (vector-, water- or air-borne) diseases. Since the last few decades, the world has experienced an apparent increase in the emergence and re-emergence of infectious diseases, such as Middle East respiratory syndrome coronavirus (MERS-CoV); severe acute respiratory syndrome coronavirus (SARS-CoV); Ebola virus; Zika virus; and recently SARS-CoV-2. With many health agencies recommending handwashing, clean water access, and household cleaning as prevention measures, the threat to water security looms over the world population resulting in a significant public health burden under the lens of the emergence of infectious diseases. Under-resourced regions that lack adequate water supplies are on the verge of an enormous additional burden from such outbreaks. Thus, studying anthropogenic and naturogenic factors involved in the emergence of infectious diseases is crucial to managing and mitigating inequalities. This study aims to determine the impacts of climate variability on infectious diseases, namely water-, air-, and vector-borne diseases, and their association with the distribution and transmission of infectious agents. We also discuss the advancement of built infrastructure globally and its role as a mitigation or adaptation tool when coupled with an early warning system. Our study, therefore, will provide a climate-based platform to adapt and mitigate the impact of climatic variability on the transmission of infectious diseases and water insecurity.

How to cite: Usmani, M., Brumfield, K., Jamal, Y., Gangwar, M., Colwell, R., and Jutla, A.: Human health as an indicator of climate change., EGU General Assembly 2023, Vienna, Austria, 23–28 Apr 2023, EGU23-570, https://doi.org/10.5194/egusphere-egu23-570, 2023.

EGU23-593 | ECS | PICO | NH9.9

Variability and the odds of Total and Pathogenic Vibrio abundance in Chesapeake Bay 

Mayank Gangwar, Kyle Brumfield, Moiz Usmani, Yusuf Jamal, Antar Jutla, Anwar Huq, and Rita Colwell

Vibrio spp. is typically found in salty waters and is indigenous to coastal environments.  V. vulnificus and V. parahaemolyticus frequently causes food-borne and non-food-borne infections in the United States. Vibrio spp. is sensitive to changes in environmental conditions and various studies have explored their relationship with the environment and have identified water temperature as the strongest environmental predictor with salinity also affecting the abundance in some cases. It is unclear how additional environmental factors will affect intra-seasonal variance as well as the seasonal cycle. This study investigated the intra-seasonal variations in total and pathogenic V. parahaemolyticus and V. vulnificus organisms in oysters and surrounding waters from 2009 to 2012 at a few locations in the Chesapeake Bay. V. Vulnificus is always pathogenic, but it has been observed that there was greater sample-to-sample variability in pathogenic V. parahaemolyticus than in total V. parahaemolyticus. To determine the increase in the likelihood of vibrio presence when the value of a certain environmental parameter has changed, the odds ratio is examined for various values of environmental factors. The odds ratio that we employed measures the likelihood that the desired outcome would occur in samples with the vibrio in comparison to the likelihood that the desired outcome will occur in samples without the vibrio. This technique will give us the threshold value of the environmental variable above which the likelihood of vibrio spp. presence has increased drastically. With changing climate and environmental conditions, vibrio is posing increasing risks to human health. The findings of this study will demonstrate the effectiveness of the odds ratio technique in estimating the likelihood that vibrio abundance would increase when environmental conditions change, which can then be incorporated into prediction models to reduce the danger to the public's health.

How to cite: Gangwar, M., Brumfield, K., Usmani, M., Jamal, Y., Jutla, A., Huq, A., and Colwell, R.: Variability and the odds of Total and Pathogenic Vibrio abundance in Chesapeake Bay, EGU General Assembly 2023, Vienna, Austria, 23–28 Apr 2023, EGU23-593, https://doi.org/10.5194/egusphere-egu23-593, 2023.

Some studies suggest atmospheric particulate matter with diameters 2.5 micron and smaller (PM2.5) may possibly play a role in the transmission of influenza and influenza-like illness (ILI) symptoms.  Those studies were predominantly conducted under moderately to highly polluted outdoor atmospheres.  We conducted our study to extend the understanding to include a less polluted atmospheric environment.  A relationship between PM2.5 and ILI activity extended to include lightly to moderately polluted atmospheres could imply a comparatively more complicated transmission mechanism.  We obtained concurrent PM2.5 mass concentration data, meteorological data and reported Influenza and influenza-like illness (ILI) activity for the light to moderately polluted atmospheres over the Tucson, AZ region. We found no relation between PM2.5 mass concentration and ILI activity. There was an expected relation between ILI, activity, temperature, and relative humidity.  There was a possible relation between PM2.5 mass concentration anomalies and ILI activity. These results might be due to the small dataset size and to the technological limitations of the PM measurements. Further study is recommended since it would improve the understanding of ILI transmission and thereby improve ILI activity/outbreak forecasts and transmission model accuracies.

How to cite: DeFelice, PhD, T.: On the Understanding of the transmission route tied to Reported Influenza/Influenza-Like Illness Activity, EGU General Assembly 2023, Vienna, Austria, 23–28 Apr 2023, EGU23-2467, https://doi.org/10.5194/egusphere-egu23-2467, 2023.

EGU23-5923 | ECS | PICO | NH9.9

Impact of global warming and Greenland ice sheet melting on malaria and Rift Valley Fever 

Alizée Chemison, Dimitri Defrance, Gilles Ramstein, and Cyril Caminade

Mosquitoes are climate-sensitive disease vectors. They need an aquatic environment for the development of their immature stages (egg-larva-nymph). The presence and maintenance of these egg-laying sites depends on rainfall. The development period of mosquitoes is reduced when temperature increases, up to a lethal threshold. Global warming will impact vector’s distribution and the diseases they transmit. The last deglaciation taught us that the melting of the ice sheet is highly non-linear and can include acceleration phases corresponding to sea level rise of more than 4 m per century. In addition, glacial instabilities such as iceberg break-ups (Heinrich events) had significant impacts on the North Atlantic Ocean circulation, causing major global climate changes. These melting processes and their feedbacks on climate are not considered in current climate models and their detailed impacts on health have not yet been studied.

To simulate an accelerated partial melting of the Greenland ice sheet, a freshwater flux corresponding to a sea level rise of +1 and +3 m over a 50-year period is superimposed on the standard RCP8.5 radiative forcing scenario. These scenarios are then used as inputs for the IPSL-CM5A climate model to simulate global climate change for the 21st century. These simulations allow to explore the consequences of such melting on the distribution of two vector-borne diseases which affect the African continent: malaria and Rift Valley Fever (RVF).  Malaria is a parasitic disease that causes more than 200 million cases and more than 600,000 deaths annually worldwide. RVF causes deaths and high abortion rates in herds and poses health risks to humans through contact with infected blood. Former studies have already characterised the evolution of the global distribution of malaria according to standard RCPs. Using the same malaria mathematical models, we study the impact of an accelerated Greenland melting on simulated malaria transmission risk in Africa. Future malaria transmission risk decreases over the Sahel and increases over East African highlands. The decrease over the Sahel is stronger in our simulations with respect to the standard RCP8.5 scenario, while the increase over east Africa is more moderate. Malaria risk strongly increases over southern Africa due to a southern shift of the rain belt which is induced by Greenland ice sheet melting.,. For RVF, the disease model correctly simulates historical epidemics over Somalia, Kenya, Mauritania, Zambia and Senegal.  However, our results show the difficulty to validate continental scale models with available health data. It is essential to develop climate scenarios that consider climate tipping points. Assessing the impact of these tipping point scenarios and the associated uncertainties on critical sectors, such as public health, should be a future research priority.


How to cite: Chemison, A., Defrance, D., Ramstein, G., and Caminade, C.: Impact of global warming and Greenland ice sheet melting on malaria and Rift Valley Fever, EGU General Assembly 2023, Vienna, Austria, 23–28 Apr 2023, EGU23-5923, https://doi.org/10.5194/egusphere-egu23-5923, 2023.

EGU23-6855 | PICO | NH9.9

An early warning decision support system for disease outbreaks in the livestock sector 

Paola Nassisi, Alessandro D'anca, Marco Mancini, Monia Santini, Marco Milanesi, Cinzia Caroli, Giovanni Aloisio, Giovanni Chillemi, Riccardo Valentini, Riccardo Negrini, and Paolo Ajmone Marsan

New climate regimes, variability and extreme events affect the livestock sector in many aspects, ranging from animal welfare, production, reproduction, diseases and their spread, feed quality and availability. Heat stress, especially when combined with excess or low humidity, exacerbates the perceived temperature or the drought conditions, respectively, increasing hazards for animals. Also, cold extremes, extraordinary windy conditions and altered radiation regimes are detrimental to both animals and fodder.

In this context, the EU-funded SEBASTIEN project aims to provide stakeholders with a Decision Support System (DSS) for more efficient and sustainable management, and consequent valuation, of the livestock sector in Italy. SEBASTIEN DSS will integrate GIS, environmental and biological variables to generate updated risk maps for livestock diseases and zoonoses and their spread, alerting about the expected occurrence of stressing conditions for animals due to abiotic and biotic factors.

The presence of parasites, vectors, and outbreaks will be combined with environmental data, gathered by spatially distributed meteorological and satellite monitoring, to detect conditions that can potentially favor or trigger the spread of related diseases. Sensor-based monitoring data will be integrated with the above information to determine ranges in animal parameters potentially associated with a higher risk of critical pathogen load or density of vectors potential carriers of diseases. Medium to long-term climate forecasts will support predicting possible shifts of favorable conditions that will open up new areas for parasites and pathogens. The vast amounts of data will be integrated and summarized into user-tailored information through a range of techniques, from empirical/statistical indicators to Machine Learning algorithms.

How to cite: Nassisi, P., D'anca, A., Mancini, M., Santini, M., Milanesi, M., Caroli, C., Aloisio, G., Chillemi, G., Valentini, R., Negrini, R., and Ajmone Marsan, P.: An early warning decision support system for disease outbreaks in the livestock sector, EGU General Assembly 2023, Vienna, Austria, 23–28 Apr 2023, EGU23-6855, https://doi.org/10.5194/egusphere-egu23-6855, 2023.

EGU23-7652 | PICO | NH9.9

Forecasting the risk of vector-borne diseases at different time scales: an overview of the CLIMate SEnsitive DISease (CLIMSEDIS) Forecasting Tool project for the Horn of Africa 

Cyril Caminade, Andrew P. Morse, Eric M. Fevre, Siobhan Mor, Mathew Baylis, and Louise Kelly-Hope

Vector-borne diseases are transmitted by a range of arthropod insects that are climate sensitive. Arthropods are ectothermic; hence air temperature has a significant impact on their biting and development rates. In addition, higher temperatures shorten the extrinsic incubation period of pathogens, namely the time required for an insect vector to become infectious once it has been infected. Rainfall also creates suitable conditions for breeding sites. The latest IPCC-AR6 report unequivocally concluded that recent climate change already had an impact on the distribution of important human and animal diseases and their vectors. For example, dengue is now transmitted in temperate regions of Europe, and malaria vectors are now found at higher altitudes and latitudes in the Tropics. Different streams of climate forecasts, ranging from short range numerical weather prediction (NWP) models to seasonal forecasting systems, to future climate change ensembles can be used to forecast the risk posed by key vector-borne diseases at different time scales.  

This work will first introduce vector-borne disease forecasting system prototypes developed for different time scales and applications. Three examples will be presented; first a NWP driven model to forecast the risk of the animal disease Bluetongue in the UK, second the skill of the Liverpool malaria model simulations driven by seasonal forecasts in Botswana, and third the impact of RCP-SSP climate change scenarios on the risk posed by dengue and malaria at global scale. In addition, the use of mathematical disease models in anticipating disease risk will be presented, highlighting the limited uptake by policy makers. To bridge the academic/policy making gap, novel participatory approaches which include all actors need to be developed.

The CLIMate SEnsitive DISease Forecasting Tool (CLIMSEDIS) project aims to bridge that gap. The overall aim of CLIMSEDIS is to develop and build capacity in the use of an innovative user-friendly digital tool. CLIMSEDIS will allow end-user stakeholders to utilise forecasts and delineate sub-national risk of multiple climate sensitive diseases to inform timely and targeted intervention strategies in eight countries across the Horn of Africa. Disease prioritization exercise, scoping reviews and interactive workshops with stakeholders will be carried out. The final deliverable will consist in a web-based portal and a phone application that will be used, maintained, and developed further by key African regional partners. A presentation of the CLIMSEDIS project phases and its overall strategy will be presented. 

How to cite: Caminade, C., Morse, A. P., Fevre, E. M., Mor, S., Baylis, M., and Kelly-Hope, L.: Forecasting the risk of vector-borne diseases at different time scales: an overview of the CLIMate SEnsitive DISease (CLIMSEDIS) Forecasting Tool project for the Horn of Africa, EGU General Assembly 2023, Vienna, Austria, 23–28 Apr 2023, EGU23-7652, https://doi.org/10.5194/egusphere-egu23-7652, 2023.

EGU23-9509 | PICO | NH9.9 | Highlight

The first continental population dynamics model of the Asian tiger mosquito driven by climate and environment 

Kamil Erguler, Cedric Marsboom, George Zittis, Yiannis Proestos, George Christophides, Jos Lelieveld, and William Wint

The Asian tiger mosquito, Aedes albopictus, is an invasive vector species. It is capable of transmitting more than 20 arboviruses, and is responsible for chikungunya, dengue, and zika transmission. Urbanisation, globalisation, and climate change are expected to expand its habitable range and increase the global vector-borne disease burden in the coming decades. To plan effective control strategies, early-warning and decision support systems are urgently needed.

We developed a climate- and environment-driven population dynamics model of Aedes albopictus with extensive geospatial applicability. The foundation of the model is the age- and stage-structured population dynamics model of Erguler et al. (2016)1. We replaced its rainfall- and human population density-dependent breeding site component with a large-scale mechanistic ecological model. The extension effectively created an ecological-dynamic model hybrid capable of representing niche dependence and response to changing environmental and meteorological conditions over time and under various land characteristics. To the best of our knowledge, this is the first spatiotemporal mechanistic model developed with a capacity to learn from both vector presence and longitudinal abundance data.

We calibrated the model with an extensive field surveillance dataset by combining the data collected through the AIMSurv project, the first pan-European harmonized surveillance of Aedes invasive mosquito species of relevance for human vector-borne diseases, and the global surveillance records available from VectorBase MapVEu. By deriving the model structure and environmental dependencies from the literature and allowing a complete re-configuration of the entire parameter set, we asserted the biological relevance and geospatial applicability, which extends over Europe and North America.

We corroborate that temperate northern territories are becoming increasingly suitable for Aedes albopictus establishment, while neighbouring southern territories become less suitable, as climate continues to change. We identify potential hotspots over Europe and North America by employing the combination of vector abundance and activity as a proxy to pathogen transmission risk.  By investigating routes of introduction to new territories, we demonstrate the significant role of dynamic environmental suitability in the highly efficient spread of this invasive mosquito.

The model is scheduled for integration into the "Climate-driven vector-borne disease risk assessment platform", to predict habitat suitability and dynamic abundance of important disease vectors and the risk of diseases transmitted by them at any location and time up to the end of the century. With the continental model of Aedes albopictus, the platform will reliably inform public health professionals and policy makers and contribute to the global strategies of integrated vector management.

1 Erguler K, Smith-Unna SE, Waldock J, Proestos Y, Christophides GK, Lelieveld J, Parham PE. Large-scale modelling of the environmentally-driven population dynamics of temperate Aedes albopictus (Skuse). PloS one. 2016 Feb 12;11(2):e0149282.

How to cite: Erguler, K., Marsboom, C., Zittis, G., Proestos, Y., Christophides, G., Lelieveld, J., and Wint, W.: The first continental population dynamics model of the Asian tiger mosquito driven by climate and environment, EGU General Assembly 2023, Vienna, Austria, 23–28 Apr 2023, EGU23-9509, https://doi.org/10.5194/egusphere-egu23-9509, 2023.

Vesicular stomatitis (VS) is a multi-vector arboviral disease that affects livestock and has a significant impact on agriculture in both the US and Mexico. Biting midges (Culicoides species) are known vectors of VS. Presence-only species distribution models (SDMs) provide a powerful and versatile tool for estimating both the habitat suitability of biting midges and the distribution of VS, the disease they spread. Such models can improve our understanding of Culicoides ecology, provide opportunities for more efficient VS surveillance and mitigation, and help determine geographical areas where VS is endemic or vulnerable to potential future transmission.

Here, we discuss two case studies related to modeling the distribution of VS and its insect vector. The first focused on predicting the habitat suitability of biting midges, including C. sonorensis and its close relatives (C. variipennis, C. albertensis, and C. occidentalis), based on species presence records collected in the past hundred years from various sources. The second study involved directly estimating the distribution of VS in Mexico, where we used occurrence data in the form of confirmed VS cases in livestock from 2005-2020 in historically endemic regions of Mexico.

SDMs are typically generated using temporally static input data. However, we improved the accuracy of our predictions by applying the Maxent algorithm to time-specific input data, creating dynamic species distribution models and habitat suitability maps. For both case studies, a robust dynamic Maxent distribution modeling workflow was implemented using temporally matched occurrence and environmental data that were carefully selected in collaboration with domain experts.

How to cite: Veron, M.: Dynamic distribution modeling of arboviral vesicular stomatitis and its vector, the biting midge (Culicoides spp.): two case studies, EGU General Assembly 2023, Vienna, Austria, 23–28 Apr 2023, EGU23-10475, https://doi.org/10.5194/egusphere-egu23-10475, 2023.

EGU23-12513 | PICO | NH9.9 | Highlight

Links between weather and seasonal influenza epidemics 

Jan Kyselý, Hana Hanzlíková, Aleš Urban, Eva Plavcová, and Jan Kynčl

Links between weather variability, influenza/acute respiratory infections (ARI), and human health are extremely complex in the cold season, and their explanation remains uncertain. It is not clear whether the winter mortality peak is related rather to low ambient temperatures or ARI, and how weather variability may modify transmission patterns of ARI and related mortality. This study investigates links between weather characteristics, influenza/ARI epidemics and all-cause mortality in the population of the Czech Republic (Central Europe), by employing long-term epidemiological and meteorological datasets over the 1982/83 to 2019/20 epidemics seasons. The links are analysed with respect to the predominant type of influenza virus in each season (A/H3N2 and A/H1N1 subtypes, and B lineages). We focus on i) identification of meteorological conditions associated with epidemics, ii) how timing of the epidemics and their magnitude are linked to weather characteristics, and iii) whether there are synergetic effects of cold weather and epidemics on the mortality impacts. Preliminary results suggest that high excess mortality during influenza epidemics was associated with low temperatures while above-average temperatures were linked to lower morbidity and mortality impacts. The role of other meteorological characteristics is less clear. Understanding weather conditions that increase the transmission and survival of influenza and respiratory viruses could help to better inform at-risk populations, implement preventive measures, and mitigate the negative impacts of influenza and ARI.

How to cite: Kyselý, J., Hanzlíková, H., Urban, A., Plavcová, E., and Kynčl, J.: Links between weather and seasonal influenza epidemics, EGU General Assembly 2023, Vienna, Austria, 23–28 Apr 2023, EGU23-12513, https://doi.org/10.5194/egusphere-egu23-12513, 2023.

EGU23-13298 | ECS | PICO | NH9.9

Prognostic epidemiological indices and the fate of ongoing infectious disease outbreaks 

Cristiano Trevisin and Andrea Rinaldo

Prognostic indices, such as the reproduction number or the epidemicity index, help assess the fate of ongoing infectious disease epidemics. While the first is of established importance, the latter focuses on the instantaneous reactivity of the infective compartment to new flare-ups. When subthreshold values of such indices apply (respectively, below the unity for the first and below zero for the latter), they warrant long-term disease-free and unreactive epidemiological conditions. 

These prognostic indicators benefit policymakers during the assessment and implementation of containment measures to reduce the disease burden. They may depend on an array of factors, including environmental forcings and the effect of containment measures on disease transmission.

We showcase a possible implementation of such prognostic indices with reference to the disastrous 2010-2019 Haiti cholera outbreak. To this end, we use a compartmental model that considers rainfalls as an environmental forcing and societal actions tackling the disease's spread. We thus test several scenarios considering a different deployment of intervention measures and we evaluate the outcome of the evolution of the prognostic indices and the epidemiological trajectory in the Haitian regions. We find that subthreshold values of these indices lead to faster waning-disease conditions.
As these indices can recap diverse epidemiological signatures induced by the spatial and temporal deployment of containment measures and potentially by evolving environmental forcings, their implementation could enable policymakers to strategically adopt containment measures in response to both evolving epidemiological and climate forcings.

How to cite: Trevisin, C. and Rinaldo, A.: Prognostic epidemiological indices and the fate of ongoing infectious disease outbreaks, EGU General Assembly 2023, Vienna, Austria, 23–28 Apr 2023, EGU23-13298, https://doi.org/10.5194/egusphere-egu23-13298, 2023.

EGU23-14214 | ECS | PICO | NH9.9

A Deep Early Warning System of Mosquito Borne Diseases using Earth Observational Data 

Argyro Tsantalidou, Konstantinos Tsaprailis, George Arvanitakis, Diletta Fornasiero, Daniel Wohlgemuth, Dusan Petric, and Charalampos Kontoes

Mosquito-borne diseases (MBDs) have been spreading across many countries including Europe over the past two decades, causing thousands of deaths annually. They are transmitted through the bites of infectious mosquitoes. Environmental, meteorological and other spatio-temporally variables affect the mosquito abundance (MA), and thus affect the circulation of the MBDs in the community. So an early warning system of MA based on these parameters could serve as a warning for the upcoming MBDs incidence. 

We propose Deep-MAMOTH, a data driven, generic and accurate early warning system for predicting MA in the upcoming period, based on earth observational (EO) environmental data and optionally in-situ entomological data. Deep-MAMOTH can be easily replicated and applied to multiple areas of interest without any special parametrization.

The Deep-MAMOTH pipeline collects EO information from various data sources (temperature, rainfall, vegetation, distance from coast, elevation, etc.) and in-situ entomological data for each area of interest. Then, there is a feature extraction phase that combines the previous collected information to more complex features, and finally this data is fed into a Deep Neural Network responsible to capture the relationship between the above mentioned features and the MA, delivering a MA risk class ordered from 0 to 9 for the upcoming period (e.g. 15 days). The pipeline provides a standardized way to predict MA without depending on the area of interest or the mosquito genus and can be modified to predict the actual MA instead of a risk class. However, risk classes help to better propagate the severity of the situation.

Two versions of Deep-MAMOTH were implemented, the first one is using recently collected entomological information in order to produce predictions (i.e. mosquitoes collected 1 week ago). The other version works when there is no recently collected entomological information for the area of interest. The latter version is expected to perform worse than the first one, but gives us the capability to produce predictions anywhere on earth without the need of recently collected entomological data. 

We applied Deep-MAMOTH in Veneto (Italy), in Upper Rhine region (Germany), and the Vojvodina region (Serbia) regarding the Culex spp. genus mosquito. The results are promising as Deep-MAMOTH in Italy achieves a mean absolute error (MAE) of 1.27 classes with the percentage of predictions that deviate at most 3 classes (e3) from the actual one reaching up to 95%. In Serbia MAE is 1.77 classes, with e3 equal to 88% and finally for Germany MAE is 0.92 classes and e3 equal to 94%.  

It’s worth mentioning that prediction performance in the version of Deep-MAMOTH without using entomological information remains promising. MAE in Italy was increased only by 0.02 and in Germany by 0.1, with e3 remaining at the same level in both cases, while in Serbia MAE increased by 0.2 with e3 decreasing by 8%. We conclude that the prediction of MA from EO data can be accurate with or without recently collected entomological data.

Acknowledgment:This research has been co-financed by the ERD Fund of the EU and Greek national funds through the Operational Program Competitiveness, Entrepreneurship and Innovation, RESEARCH-CREATE-INNOVATE(project code:T2EDK-02070)

How to cite: Tsantalidou, A., Tsaprailis, K., Arvanitakis, G., Fornasiero, D., Wohlgemuth, D., Petric, D., and Kontoes, C.: A Deep Early Warning System of Mosquito Borne Diseases using Earth Observational Data, EGU General Assembly 2023, Vienna, Austria, 23–28 Apr 2023, EGU23-14214, https://doi.org/10.5194/egusphere-egu23-14214, 2023.

EGU23-15398 | PICO | NH9.9

Understanding the Area of Applicability of Data Driven Mosquito Abundance Prediction Models 

Theoktisti Makridou, George Arvanitakis, Konstantinos Tsaprailis, Diletta Fornasiero, and Charalampos Kontoes

An Early Warning System for mosquito abundance is a valuable tool that can alert authorities for potential outbreaks of mosquito populations in a given area for the upcoming period. This information is used to take mitigation actions in order to avoid spread of vector borne diseases such as West-Nile Virus, Malaria, Zika etc. A promising direction of those systems today aims to predict the upcoming mosquito population by following a data driven approach and taking advantage of machine learning (ML) algorithms. The ML algorithms are trained on a limited set of point level data that include the environmental, geomorphological, climatic information and historical in-situ measurements of mosquito population for specific latitude and longitude coordinates. Goal of the ML algorithms is to learn the patents that connect the characteristics (features) of a given area (temperature, humidity, NDVI, rainfall, latitude, longitude, etc) with the upcoming mosquito population.


Once the in-situ entomological data are expensive to be collected and limited, one of the key challenge of the aforementioned approach is to understand where those models can generalize with an acceptable accuracy in order to be re-used in areas that prior entomological information do not exist or in other words to understand the area of applicability of those models.


In this study we analyze the performance of ML algorithms that have been trained in specific areas and applied to “unseen” areas. Our analysis aims to understand the characteristics of the cases where the algorithms manage to generalize compared with the ones where the performance is poor. Our scope is to establish a systematic approach for determining the area of applicability of the models, thus, to obtain a prior knowledge regarding the areas that we expect models to generalize properly and the areas the predictions of the models are not trustworthy.


Our work relied on historical data of Culex pipiens mosquitoes (West Nile virus) collected in the Veneto region of Italy for the decade 2011-2021 and satellite Earth Observation data. For ML regressor we used a feedforward Neural Network with typical mean square error cost function. Initially we conclude that the typical euclidian distance between the coordinates of the trained area and the unseen data is not an informative metric about the model’s area of applicability. Instead, we propose a metric that calculates the distance between the known and the unknown points in the feature space (environmental, geomorphological etc.) and also takes into account the feature importance of trained Neural Network using the SHAP values.


The results showed that our proposed metric is informative regarding where the model is expected to have more accurate predictions and manage to capture the cases where the generalization will be poor. This information is useful both to judge if the predictions of a model are trustworthy and also to understand for which areas our prior information is not sufficient and to take actions in future network planning.

How to cite: Makridou, T., Arvanitakis, G., Tsaprailis, K., Fornasiero, D., and Kontoes, C.: Understanding the Area of Applicability of Data Driven Mosquito Abundance Prediction Models, EGU General Assembly 2023, Vienna, Austria, 23–28 Apr 2023, EGU23-15398, https://doi.org/10.5194/egusphere-egu23-15398, 2023.

EGU23-17226 | ECS | PICO | NH9.9 | Highlight

Identification of thresholds on Sea surface temperature and coastal chlorophyll for understanding environmental suitability of V. vulnificus incidence 

Yusuf Jamal, Moiz Usmani, Mayank Gangwar, and Antarpreet Jutla

Vibrio spp. are pathogenic bacteria native to warm and brackish water. Vibriosis- the disease caused by these pathogens in humans accounts for around 80000 illnesses and 100 deaths annually in the United States. Of all the species, V. vulnificus has the highest mortality rate of all seafood-borne pathogens in the United States. In this context, understanding the environmental conditions that lead to increased V. vulnificus growth and spread can aid in the development of early warning systems and targeted prevention strategies. Besides sea surface temperature (SST), biotic parameters like coastal chlorophyll are also determined to affect V. vulnificus incidence in humans locally. However, the precise role of coastal chlorophyll as a potential confounding variable is understudied. Moreover, the spatial scale to which the data for environmental variables could be obtained also poses characterization constraints for researchers since the commonly employed in-situ sampling-based methods usually work with discrete locations covering a small area. The present study uses the odds ratio analysis to determine SST and chlorophyll-a threshold values critical to V. vulnificus incidence. The analysis reveals a definite positive relationship between remotely derived environmental variables and the odds of V. vulnificus incidence, where a specific statistical value of SST and chlorophyll-a marks a clear distinction between low and high odds of V. vulnificus incidence. This finding translates into a consistent pattern when checked for counties of coastal Florida. We anticipate our methodology to help distinguish between high and low-risk conditions, enabling public health workers to take proactive measures to protect the health and well-being of the public.

How to cite: Jamal, Y., Usmani, M., Gangwar, M., and Jutla, A.: Identification of thresholds on Sea surface temperature and coastal chlorophyll for understanding environmental suitability of V. vulnificus incidence, EGU General Assembly 2023, Vienna, Austria, 23–28 Apr 2023, EGU23-17226, https://doi.org/10.5194/egusphere-egu23-17226, 2023.

EGU23-1441 | ECS | Orals | NH9.11

Coastal setback zones can lessen Europe's future exposure to sea level rise. 

Claudia Wolff, Hedda Bonatz, and Athanasios T. Vafeidis

Future coastal risk will largely depend on where people build and settle, and not only on increases in extreme events or sea level rise as a result of global warming. In the past, hard engineering has been used to protect settlements in coastal lowlands. However, as this option becomes less viable and more expensive due to rapidly rising sea levels, coastal managers are increasingly turning to landuse planning interventions, such as setback zones or managed retreat. Although various studies show that one of the most effective approaches is to prevent urban expansion inside the coastal floodplain, limited research has been done to assess the potential of setback zones in minimizing future coastal exposure in Europe. This study enhances our understanding of the potential of coastal setback zones of different shapes in the EU by (1) assessing the avoided urban exposure resulting from the implementation of setback zones/retreat under different socioeconomic futures and (2) providing country-specific information on which type of setback zones is most beneficial in reducing urban exposure. For this purpose, we created spatially explicit projections of urban extent that consider different socio-economic futures and different types of setback zones to examine the effectiveness of these planning strategies in decreasing future urban exposure in Europe’s coastal lowlands. Our results show that by the year 2100, the majority of EU coastal countries can reduce the exposure of new urban land by at least 50% if coastal setback zones are established; and highlight that how we plan, build, and develop urban space in the EU coastal lowlands will be the defining factor on how exposed future urban areas are to sea-level rise.


How to cite: Wolff, C., Bonatz, H., and Vafeidis, A. T.: Coastal setback zones can lessen Europe's future exposure to sea level rise., EGU General Assembly 2023, Vienna, Austria, 23–28 Apr 2023, EGU23-1441, https://doi.org/10.5194/egusphere-egu23-1441, 2023.

EGU23-2370 | ECS | Orals | NH9.11 | Highlight

A Probabilistic Flood Loss Model for Adaptation Planning in Ho Chi Minh City 

Kasra Rafiezadeh Shahi, Nivedita Sairam, Lukas Schoppa, Le Thanh Sang, Do Ly Hoai Tan, and Heidi Kreibich

Transforming rural-urban-systems such as Ho Chi Minh City, Vietnam, are facing exacerbating flood risk due to climatic and socio-economic changes, necessitating effective adaptation solutions. Risk-based adaptation planning requires plausible and accurate flood loss estimation. However, state-of-the-art flood loss models for the region that take into account the multi-causality of flood damage and convey information about predictive uncertainty are lacking.

This study presents a Bayesian network for flood loss estimation for the residential sector in Ho Chi Minh City. We developed the graphical probabilistic model based on new object-level survey data with flood-affected households (n=1530), which cover the topics of flood intensity, household characteristics, warning and emergency, private precaution, and damages. An analysis of the survey data concerning the explanatory power for flood damage revealed a subset of relevant variables, which we used for model elicitation. Using a systematic learning procedure, we identified a robust Bayesian network structure that reflects the local circumstances of flood damage processes at the study site. That is, the resulting model takes into account flood intensity variables such as water depth but also vulnerability variables such as households’ flood experience or adaptive behavior. We confirmed the identified damage influencing variables by comparisons to other established statistical and machine learning methods (i.e., random forest and grid search cross-validation with multivariable regression). A prediction exercise with repeated cross-validation demonstrated that the developed Bayesians network model is capable of estimating building loss accurately. However, similar to previous studies in the field, we observed considerable predictive errors for severe loss cases for which data records are scarce. In addition, we show that the predictive skill of the Bayesian network is competitive to non-parametric modeling alternatives such as random forest.

Our validated Bayesian network loss model exhibits high practical value for applications at the city-scale since it enables loss estimation even when information about the predictor variables is only partially available. Moreover, the inclusion of vulnerability variables as predictors in the loss model facilitates the consideration of adaptive behavior in loss and risk assessment. Ultimately, the fully probabilistic model design inherently quantifies predictive uncertainty, which fosters the uncertainty propagation to subsequent elements of flood risk assessment and well-informed decision-making.

How to cite: Rafiezadeh Shahi, K., Sairam, N., Schoppa, L., Sang, L. T., Tan, D. L. H., and Kreibich, H.: A Probabilistic Flood Loss Model for Adaptation Planning in Ho Chi Minh City, EGU General Assembly 2023, Vienna, Austria, 23–28 Apr 2023, EGU23-2370, https://doi.org/10.5194/egusphere-egu23-2370, 2023.

Like many other coastal megacities, Ho Chi Minh City in Southern Vietnam is regularly affected by flooding from torrential rainfalls and storm surges. Global climate heating will exacerbate these natural hazards, but rapid urbanization has a share in the intensification of urban disaster risk as well. Proceeding surface sealing, uncontrolled land subsidence and the urban heat island effect are only a few of the factors increasing exposure to flooding, which often hits the most vulnerable parts of the population. To defend local residents and reduce flood-induced losses, classic protection measures like embankments, flood gates and large-scale pumping stations are implemented across Ho Chi Minh City. But as low-level inundations continue to cause frequent disruptions to the local economy, ecosystem-based solutions or so-called blue-green infrastructure are more and more seen as promising means to complement existing management strategies and ensure sustainable flood resilience.

In our study, we investigate whether the role of coastal ecosystems in mitigating floods in Ho Chi Minh City is already reflected in recent urban developments. Specifically, we use multi-spectral Sentinel-2 imagery to calculate the Normalized Difference Vegetation Index (NDVI), a dimensionless indicator to describe terrestrial vegetation. The obtained annual NDVI maps have a spatial resolution of ca. 1 arc second and cover the years 2016 to 2022; special attention was given to the composition of cloud-free images. On this basis, temporal trends were determined that specify the (qualitative) development of bio-activity across the urban and suburban districts of the province. These local trends are complemented by annual histograms, which describe the relative frequency of specific NDVI ranges and thus allow estimations of ecosystem density. Unsurprisingly, preliminary results suggest constant ecosystem density for the Can Gio biosphere reserve in the South of the HCMC province, except for slight changes along its boundaries. For the urban districts of HCMC, however, ongoing urbanization can be traced by decreasing ecosystem density according to our assessment of NDVI values. The employed method provides promising results, yet currently still lacks a decent validation through ground truth data.

How to cite: Scheiber, L. and Schlurmann, T.: Tracing the development of coastal ecosystems through satellite imagery: a case study from Ho Chi Minh City, Vietnam, EGU General Assembly 2023, Vienna, Austria, 23–28 Apr 2023, EGU23-5546, https://doi.org/10.5194/egusphere-egu23-5546, 2023.

EGU23-5691 | Posters on site | NH9.11

Micro business participation in collective flood adaptation. Lessons from scenario-based analysis in Ho Chi Minh City, Vietnam 

Javier Revilla Diez, Matthias Garschagen, Van Tran, and Roxana Leitold

Although research on the impacts of climate change on small- and medium-sized firms (SMEs) and their adaptive behavior against climate change risks recently have received more attention, the focus on micro and household businesses is still very limited. Micro and household businesses are adversely impacted by compound flooding events – a situation that will become even more acute in the future – but there is little attention in scientific literature on their possibilities of adaptation and actual implementation.
Against this backdrop, the paper will analyse the following research questions: How do micro firms already respond to flooding? Are micro firms willing to invest jointly into future proactive adaptation efforts in their neighborhood? What are key drivers and barriers for adaptation? Specifically, we evaluate a set of adaptation measures at the neighborhood scale, and then examine key driver and barriers at different spheres for collective adaptation of micro businesses. We offer an empirical analysis on micro businesses in Ho Chi Minh City (HCMC), a city increasingly threathened by flooding and where climate change hazards are on the rise. In HCMC formal – and informal – micro businesses make up a large majority of SMEs.

How to cite: Revilla Diez, J., Garschagen, M., Tran, V., and Leitold, R.: Micro business participation in collective flood adaptation. Lessons from scenario-based analysis in Ho Chi Minh City, Vietnam, EGU General Assembly 2023, Vienna, Austria, 23–28 Apr 2023, EGU23-5691, https://doi.org/10.5194/egusphere-egu23-5691, 2023.

EGU23-6022 | Posters on site | NH9.11 | Highlight

Flood Risk in Vietnamese Coastal Cities – Remote Sensing Based Urban Structure Types as a Planning Relevant Tool 

Volker Hochschild, Andreas Braun, Michael Schultz, and Gebhard Warth

Coastal and delta cities in Vietnam like Ho Chi Minh City, Da Nang, or Hué are exposed to multi-hydrometeorological hazards caused by heavy rainfall, typhoons, tsunamis, rising sea levels, land subsidence as well as river flooding, intensified by global climate warming. Being exposed to these regular events, different degrees of spatial vulnerabilities are resulting for the citizens in relation to their distance to water ways or height above sea level, but also their capabilities to recover from possible hazards.

Since development of many Southeast Asian cities is extremely dynamic, city planners are lacking relevant planning information on population numbers and material flows (waste, drinking water demand, wastewater disposal, energy consumption, etc.), which are usually not provided by outdated masterplans. For that reason, so called Urban Structure Types (USTs) can be defined and derived from high-resolution remote sensing data. They are basic urban spatial units with homogeneous functional and morphological structure, delineated by shape, form, height, material, and density parameters. USTs are independent, quantifiable, and generic and thereby providing a surplus information to urban land cover classes. Their final classification is achieved by machine learning approaches applied to high and very high resolution imagery. A discrimination is made between globally applicable parameters like building height, size, or density and locally adjusted parameters like e. g. distance to water way or street width which are additionally required to cover the character of the individual cities.   

Urban Structure Types are a crucial input for hydrological modelling as well as damage modelling approaches, but they are also correlated with socio-economic data collected by questionnaires and interviews in several sampled quarters of the cities. As a conclusion, the USTs might indicate different ways of living within the city and give hints to consumption patterns but also topics of environmental justice.

How to cite: Hochschild, V., Braun, A., Schultz, M., and Warth, G.: Flood Risk in Vietnamese Coastal Cities – Remote Sensing Based Urban Structure Types as a Planning Relevant Tool, EGU General Assembly 2023, Vienna, Austria, 23–28 Apr 2023, EGU23-6022, https://doi.org/10.5194/egusphere-egu23-6022, 2023.

EGU23-8345 | ECS | Orals | NH9.11

Mapping 21st Century global coastal land reclamation 

Dhritiraj Sengupta, Young Rae Choi, Bo Bo Tian, Sally Brown, Michael Meadows, Christopher R Hackney, Abhishek Banerjee, Yingjie Li, Ruishan Chen, and Yunxuan Zhou

Increasing population size and economic dependence on the coastal zone, coupled with the growing need for residential, agricultural, industrial, commercial, and green space infrastructure, are key drivers of land reclamation. Until now, there has been no comprehensive assessment of the global distribution of land use on reclaimed space at the coast. Here, we analyse Landsat satellite imagery from 2000 to 2020 to quantify the spatial extent, scale, and land use of urban coastal reclamation for 135 cities with popultions in excess of one million.  Findings indicate that 78% (106/135) of these major coastal cities have resorted to reclamation as a source of new ground, contributing a total of 253,000 ha of additional land to the Earth’s surface in the 21st century, equivalent to an area the size of Luxembourg. Reclamation is especially prominent in East Asia, the Middle East, and Southeast Asia, followed by Western Europe and West Africa. The most common land uses on reclaimed spaces are port extension (>70 cities), followed by residential/commercial (30 cities) and industrial (19 cities). While increased global trade and rapid urbanization have driven these uses, we argue that a city’s prestigious place-making effort to gain global reputation is emerging as another major driver underlying recent reclamation projects to create tourist and green spaces Meanwhile, the study suggests that 70% of recent reclamation has occurred in areas identified as potentially exposed to extreme sea level rise (SLR) by 2100 and this presents a significant challenge to sustainable development at the coast.  

How to cite: Sengupta, D., Rae Choi, Y., Bo Tian, B., Brown, S., Meadows, M., R Hackney, C., Banerjee, A., Li, Y., Chen, R., and Zhou, Y.: Mapping 21st Century global coastal land reclamation, EGU General Assembly 2023, Vienna, Austria, 23–28 Apr 2023, EGU23-8345, https://doi.org/10.5194/egusphere-egu23-8345, 2023.

Flood events have been generating great risks and intensifying the challenges of water management in coastal megacities. Instead mitigating the impact of climate change, improving the resilience has an expanding scope of application in environmental science, covering climate change, risk and disaster management [1]. In the past decades, metrological and hydrological causes have been the main drivers of disasters [2], which makes vulnerability assessment methods such as Flood vulnerability index (FVI) clear development pathways [3].

This study is built on the household survey data in HCMC (Ho Chi Minh City, Vietnam) in the framework of the DECIDER project (DECisions for Adaptive Pathway Design and the Integrative Development, Evaluation and Governance of Flood Risk Reduction Measures in Transforming Urban-Rural-Systems). It aimed at creating a framework to interpret social-economic attributes of flood vulnerability with physical features of household. As an essential part of the influencing factor for social vulnerability, the data is regionally intrinsic and mostly accessible only by field survey. Proxy variables were obtained to conduct contextual analysis based on remote sensing images, environmental risk estimates, as well as elevation data, in which study concludes that this method can contribute to identifying the key indicators and optimize the social vulnerability assessment to be more efficient [4]. In this study, 17 socioeconomic indicators only accessible from survey data were weighted using the Principal Component Analysis (PCA), and further aggregated into the FVI. Then 11 physical proxy indicators were collected from field inspection, remote sensing data and environmental flood risk estimates, and trained machine learning models to predict FVI. The AdaBoost model identified the most important physical indicators and the model was able to predict the test data with a MAE of 0.089 but small R2. Another decision tree model, however, was overfitted and yielded a moderate accuracy (~0.4) and further machine learning classification models were also applied on both eleven indicators and selected indicators for each case but no obvious difference showed among these models. Therefore, the socioeconomic FVI could be predicted with physical proxy variables with AdaBoost accurately, but more featured data should be acquired and model rendering can be done in the future for a better prediction model, especially for regional prediction with the scale of households and community.


References

[1] O’Brien, K. Global environmental change II. Progress in Human Geography 2012, 36, 667–676, doi:10.1177/0309132511425767.

[2] Birkmann, J.; Teichman, K. von. Integrating disaster risk reduction and climate change adaptation: key challenges—scales, knowledge, and norms. Sustain Sci 2010, 5, 171–184, doi:10.1007/s11625-010-0108-y.

[3] Balica, S.F.; Wright, N.G.; van der Meulen, F. A flood vulnerability index for coastal cities and its use in assessing climate change impacts. Nat Hazards 2012, 64, 73–105, doi:10.1007/s11069-012-0234-1.

[4] Ebert, A.; Kerle, N.; Stein, A. Urban social vulnerability assessment with physical proxies and spatial metrics derived from air- and spaceborne imagery and GIS data. Nat Hazards 2009, 48, 275–294, doi:10.1007/s11069-008-9264-0.

How to cite: Song, Z., Yang, E., and Tuo, Y.: Piloting a physical-metric-based Index bench-marked by a social-economical Index measuring Flood Resilience in Ho Chi Minh City, EGU General Assembly 2023, Vienna, Austria, 23–28 Apr 2023, EGU23-9192, https://doi.org/10.5194/egusphere-egu23-9192, 2023.

EGU23-9259 | ECS | Posters on site | NH9.11

Simulation and assessment of compound flooding in coastal cities under climate change 

Qinke Sun, Jiayi Fang, and Min Liu

Low-lying coastal areas are highly vulnerable to flood hazards, especially under the influence of global warming, and the possibility of compound floods is often much greater than that of individual floods. Understanding the probability of these compound events and the processes that drive them is essential for mitigating the impacts of coastal high-risk areas. Here we use a new simplified physical solver SFINCS model (Super-Fast INundation of CoastS), to computationally efficiently calculate compound floods in coastal areas due to fluvial, pluvial and storm surge driven processes. At the same time, a variety of climate scenarios are considered for the prediction of potential future compound flood patterns. We demonstrated in our application case in Shanghai, China, that the model can simulate a combination of fluvial, pluvial, and storm surge driven floods well. Our results show that the combined effects of future climate change on coastal compound flood hazards will significantly increase the extent of flood hazards, obviously increasing the level of risk at low-risk areas and requiring an integrated response to the consequences of future compound floods. This research has important implications for the assessment of compound flood risk in coastal areas and for climate-resilient flood management.

How to cite: Sun, Q., Fang, J., and Liu, M.: Simulation and assessment of compound flooding in coastal cities under climate change, EGU General Assembly 2023, Vienna, Austria, 23–28 Apr 2023, EGU23-9259, https://doi.org/10.5194/egusphere-egu23-9259, 2023.

EGU23-9909 | Posters on site | NH9.11

Profiling households with their flood response measures in Ho Chi Minh City, Vietnam 

Liang Emlyn Yang and Matthias Garschagen

Diverse flood response measures and adaptation actions have been carried out worldwide by various stakeholders, especially the various kinds of responses at household level. However, there is a lack of substantial understanding on the profiles of different households regarding their flood response measures, the driving factors, particularly with regards to dynamically changing socio-economic groups and the question of individual vs. collective action for flood risk reduction. Ho Chi Minh City (HCMC) with characterizations of rapid urbanization, socio-economic transitions and significant climate/environment influences at a low lying flood prone area, is increasingly suffering from more frequent and intense floods. Based on a large scale household survey conducted in September and October 2020, the study classifies different flood coping/adaptation measures in HCMC.

A cluster analysis of multiple factors is carried out to clarify the major factors and to identify the features of households and their networks in each cluster. Specific data analysis indicates: 1) Majority of local people don’t receive external supports, due to the fact of moderate flood events and that they subjectively don’t concern much to the impacts (have got used to floods). 2) The most vulnerable groups did receive various supports, which indicates the existence of a basic flood-safe system in HCMC. 3) Long-term adaptation measures are not often applied, because vulnerable groups are not able to while rich people don’t need to. Findings of the study help to better understand the local status of flood responses against the backdrop of underlying socio-economic transformations. 

How to cite: Yang, L. E. and Garschagen, M.: Profiling households with their flood response measures in Ho Chi Minh City, Vietnam, EGU General Assembly 2023, Vienna, Austria, 23–28 Apr 2023, EGU23-9909, https://doi.org/10.5194/egusphere-egu23-9909, 2023.

EGU23-10482 | Posters on site | NH9.11

Analysis of Private Sector Interest in Blue Green Infrastructure by the Motivation and Abilities (MOTA) framework: A case study in Ho Chi Minh City 

Hong Quan Nguyen, Kayla Tift, William Veerbeek, Thu Thuy Nguyen, and Bao Thanh Nguyen

Blue-Green Infrastructure is an emerging approach to storm water management in Ho Chi Minh City, helping to mitigate negative effects of excess storm water while providing multiple benefits. While several top-down initiatives for better storm water management practices have been proposed, many initiatives fail to implement or do not perform as expected. There is also a lack of private sector participation in storm water management, where policy and clear regulation are lacking.

This paper identifies the primary factors contributing to private sector participation in Blue-Green Infrastructure projects in Ho Chi Minh City and validates them through a survey of construction specialists, local authority, and residents. A Motivation and Abilities (MOTA) framework analysis reveals primary risk factors being a lack of perceived economic and financial benefits, as well as maintenance concerns. The primary motivational factors are improved public relations, improved selling value, and increased Floor-Area Ratio. Final remarks include incentive recommendations, addressing corruption, and improved education for private developers and local officials.

How to cite: Nguyen, H. Q., Tift, K., Veerbeek, W., Nguyen, T. T., and Nguyen, B. T.: Analysis of Private Sector Interest in Blue Green Infrastructure by the Motivation and Abilities (MOTA) framework: A case study in Ho Chi Minh City, EGU General Assembly 2023, Vienna, Austria, 23–28 Apr 2023, EGU23-10482, https://doi.org/10.5194/egusphere-egu23-10482, 2023.

Coastal communities around the world are facing increasing risks of sea level rise and extreme weather events, including storm surges, coastal flooding, and erosion. These risks have the potential to devastate infrastructure, disrupt economies, and displace vulnerable populations. In order to protect these communities and reduce their vulnerability to these impacts, it is essential to understand the potential impacts of sea level rise and extreme weather events and to develop and implement effective adaptation and risk reduction measures. In this study, we aim to assess and mitigate coastal vulnerability to sea level rise and extreme weather events by exploring the use of tools such as sea level rise projections, storm surge modeling, and coastal erosion analysis to understand the potential impacts of climate change on coastal communities. We will evaluate the effectiveness of various adaptation and risk reduction measures, such as beach nourishment, sea walls, and managed retreats, in different coastal settings. Through this research, we hope to provide valuable insights and recommendations for policymakers, practitioners, and other stakeholders working to reduce the vulnerability of coastal communities to sea level rise and extreme weather events.

How to cite: Okutan, P. and Otay, E.: Protecting Coastal Communities from Sea Level Rise and Extreme Weather Events: An Analysis of Adaptation and Risk Reduction Measures, EGU General Assembly 2023, Vienna, Austria, 23–28 Apr 2023, EGU23-11548, https://doi.org/10.5194/egusphere-egu23-11548, 2023.

EGU23-13148 | ECS | Orals | NH9.11 | Highlight

Assessing flood situations and technical adaptation measures in the context of climate change in Ho Chi Minh City 

Lam Vu Thanh Noi, Nguyen Phu Quynh, and Do Dac Hai

There is typically limited knowledge on the key factors causing critical flood situations in the context of climate change in many regions, including in large cities like Ho Chi Minh City (HCMC), Vietnam. It is important to improve our understanding of the causes of flood and how to incorporate flood adaptation measures, especially the integration of technical measures into local climate change adaptation plans. This presentation describes the results and experiences of applying a hydraulic model (MIKE 11, 21 and Flood) for simulating flood situations under different climate change scenarios and integration into the master plan for flood prevention (2008) in HCMC. It was found that the water level in Sai Gon River will not increase under the current climate following completion of Phase 1 of constructing flood prevention infrastructure according to the master plan of 2008. However, under the same flood infrastructure prevention condition, the water level at Phu An station will increase from 1.74 m to 2.28 m under the most extreme scenario of Dau Tieng discharge and climate change without land subsidence. Flood prevention infrastructure was identified as a key factor reducing flooding in HCMC. Further studies are recommended to simulate alternative flood situations by applying the same hydraulic model under the new master plan for flood prevention (2021) in HCMC to support flood adaptation measures and strategies.

Key words: Flooding, hydraulic model, flood prevention, climate change   

How to cite: Vu Thanh Noi, L., Phu Quynh, N., and Dac Hai, D.: Assessing flood situations and technical adaptation measures in the context of climate change in Ho Chi Minh City, EGU General Assembly 2023, Vienna, Austria, 23–28 Apr 2023, EGU23-13148, https://doi.org/10.5194/egusphere-egu23-13148, 2023.

EGU23-13799 | ECS | Orals | NH9.11

Assessing perceived probability and damage of flood risk across the globe 

Moongyeom Kim, Wouter Botzen, Toon Haer, Jens de Bruijn, and Jeroen Aerts

In this study we aim to improve our understanding of household adaptation and migration responses to coastal hazards induced by sea level rise, such as coastal flooding. We apply a global ABM (agent-based model; DYNAMO-M), which simulates all ~200 million individual people and households in coastal flood zones around the world. The model simulates in yearly timesteps flood events and changing flood risk and whether residents migrate or adapt (e.g. flood proof their house) to lower their risk. Agents’ migration and adaptation decisions are based on the Subjective Expected Utility Theory (SEUT). Here, agents maximize their utility based on subjective risk assessments, such as their subjective perception of flood risk. However, the current risk perception parameter in the SEUT equation in DYNAMO-M is based on a single empirical study in France. Additional data is needed to address the heterogeneity of risk perceptions across different global coastal households. In order to assess the differences in risk perceptions in different areas around the world, we combine different data sets: (1) we conducted unique surveys on perceptions of flood risk and their determinants as well as people’s intention to adapt or migrate under future SLR scenarios in 6 countries with varying socio-economic backgrounds (Argentina, France, Mozambique, the Netherlands, the US, and Vietnam). Using these survey data, we identify the generic decision rule for the determinants of risk perception parameters such as the perceived probability and damage of flooding through regression analysis. (2) Next, we use additional global datasets on individual characteristics such as the World Value Survey (demographic and residential information data) and Cloud2Street (flood experience data) and use these data as explanatory variables for transferring risk perception parameters to countries where no primary survey data is available. This analysis may aid the understanding of global patterns in risk perceptions of people/agents. We believe our study serves as a basis for research on individual behavior under risk, the role of risk perception, and the use of the data in global ABMs.

How to cite: Kim, M., Botzen, W., Haer, T., de Bruijn, J., and Aerts, J.: Assessing perceived probability and damage of flood risk across the globe, EGU General Assembly 2023, Vienna, Austria, 23–28 Apr 2023, EGU23-13799, https://doi.org/10.5194/egusphere-egu23-13799, 2023.

EGU23-14451 | Orals | NH9.11 | Highlight

Improved Terrain Modelling to aid flood mapping in coastal cities 

Anne Vallette, Anne-Laure Beck, Martin Jones, Harry Cook, and Mohamed Amine Taji

Coastal areas are recognized as the most at risk due to climate change. They exhibit low-lying elevation, very high urban density and valuable economical assets. Sea level rise, storm events and coastal floods that are increasingly frequent and more powerful will increase damage to fragile coasts. Human activities (especially the reduction in natural defences), sediment balance and natural phenomenon are disrupted and increase the coast’s vulnerability.

As part of the GDA-DR initiative, we aim to produce some new indicators derived from EO to better understand the coastal system. As part of these new indicators, improved flooding maps are being developed using corrected elevation data and additional layers to better represent water behaviour in coastal cities. 

  • The Copernicus DEM GLO-30m is proving too crude to provide suitable flood modelling. It offers an accuracy of 4m, leading to an accuracy of earth features’ localization of less than 2.6 m. By using LIDAR measurements from the ISS-borne GEDI sensor and additional altimeter missions such as ATLAS on-board the ICESAT-2 satellite, we provide an improved and corrected DSM and DTM
  • Additional layers produced for DEMs correction are used to improve floods modeling such as land cover maps to extract drag coefficients and 3D settlement layers to take into account channelling effects.

This new approach can provide improved flood maps to better support flood mitigation planning. We propose to present DSM and DTM, for Dili in Timor Leste, based on the most recent space-lidar data, GEDI (2019-2021) and of IceSAT-2/ATLAS (2019- on going) and hoe those new DEMs can impact flood risk assessment.

How to cite: Vallette, A., Beck, A.-L., Jones, M., Cook, H., and Taji, M. A.: Improved Terrain Modelling to aid flood mapping in coastal cities, EGU General Assembly 2023, Vienna, Austria, 23–28 Apr 2023, EGU23-14451, https://doi.org/10.5194/egusphere-egu23-14451, 2023.

Socio-hydrological approach is a new science that is aimed at understanding the dynamics and co-evolution of coupled human-water systems. We use this concept to analyze how flood risk related to social resilience in Can Tho city, one of the biggest urban area located in the Vietnamese Mekong delta. The study employed both secondary and primary data collected in two inner districts of Ninh Kieu and Cai Rang. Key informant interview with related stakeholders and focus group discussion with local community were conducted in the reserach sites. The results showed that urban flood tends to rise up year by year because of various drivers such as increase of rainfall in a short time combined with the blockage of sewers due to garbage or/and lack of green areas. In term of hydrological aspect, rainfall, river water level and discharge are key factors. In addition, the social drivers like ineffective urban planning and inappropriate human behaviour also play an important role causing serious inundation. We also found that flood risk contributes to reduce social resilience by different ways including infrastructure damages, transportation disruption, livelihood decline, social network discontinuance, landscape degradation, environmental poluttion, human health and fatality. Therefore, it is necessary to take into account both social and hydrological drivers to mitigate the flood risk on one hand and enhance social resilience on the other. Green urban development which has the greatest potential for improving the quality of ecosystem services and providing opportunities for urban dwellers to reconnect with nature should be a good strategy for disaster risk reduction in this situation.

How to cite: Nguyen, T. B. and Tien, L. V. T.: Studying flood risk and social resilience at city level by socio-hydrological approach in Can Tho City of Vietnam, EGU General Assembly 2023, Vienna, Austria, 23–28 Apr 2023, EGU23-17568, https://doi.org/10.5194/egusphere-egu23-17568, 2023.

EGU23-1161 | ECS | Orals | HS2.3.6

Modelling global surface water quality under uncertain climate and socio-economic change 

Edward R. Jones, Marc F.P. Bierkens, Peter J. T. M. van Puijenbroek, and Michelle T. H. van Vliet

Human activities greatly impact surface water quality due to the emission of various pollutants associated with different water use sectors (e.g. irrigation, livestock, domestic, energy and manufacturing)1,2. In-stream concentrations are also strongly dependent on the dilution capacity of receiving waters, which is related to both the hydrological regime and surface water abstractions. Pollutant emissions, hydrological regimes and surface water abstractions are all projected to change into the future as a result of both (uncertain) climate change and socio-economic developments. Yet, quantitative projections of future surface water quality are sparse, particularly at the global scale.

In this work, we apply a new high-resolution global surface water quality model (DynQual)3 to project water temperature (Tw) and total dissolved solids (TDS), biological oxygen demand (BOD) and fecal coliform (FC) concentrations for the time period 2005-2100, considering multiple scenarios that combine Representative Concentration Pathways (RCPs) with Shared-Socioeconomic Pathways (SSPs). Input from five general circulation models (GCMs) is used to force PCR-GLOBWB2, the hydrological model coupled to DynQual, to account for the large range of uncertainties inherent in the climatological projections.

The mechanisms that drive patterns in future surface water quality are a complex balance between changes in pollutant emissions, the dilution capacity of streams and in-stream decay processes, which are strongly driven by water temperature, under global change. Patterns of both water quality improvement and deterioration exist, which vary greatly across world regions. Reductions in pollutant emissions across most of Western Europe, North America and East Asia drive trends towards surface water quality improvements, irrespective of climate and socio-economic scenario. Conversely, developing countries are more sensitive to (uncertain) climate and socio-economic changes, with surface water quality typically improving under SSP1-RCP2.6, a mixed response under SSP5-RCP8.5 and strong degradation under SSP3-RCP7.0. Changes to the hydrological cycle are particularly important for surface water quality in the Amazon basin, with substantial reductions in discharge projected under SSP3-RCP7.0 and SSP5-RCP8.5. These changes result in reduced dilution capacities of rivers and thus higher in-stream concentrations, for instance of TDS.

Surface water quality deterioration occurs across Sub-Saharan Africa under all scenarios, albeit to different magnitudes, which substantially increases the number of people that are exposed to poor water quality. Under SSP3-RCP7.0, the “worst-case” scenario for all constituents considered in our study, 4.2 billion people will be exposed to surface water with unsafe levels of organic (BOD) pollution by 2100. With 1.5 billion (36%) of these people located in Sub-Saharan Africa, compared to 290 million (11%) in the historical reference period, we conclude that Sub-Saharan Africa will become the new hotspot of water quality issues.  


References

1. Jones, E. R. et al. Current wastewater treatment targets are insufficient to protect surface water quality. Communications Earth & Environment 3, 221, doi:10.1038/s43247-022-00554-y (2022).

2. van Vliet, M. T. H. et al. Global water scarcity including surface water quality and expansions of clean water technologies. Environmental Research Letters 16, 024020, doi:10.1088/1748-9326/abbfc3 (2021).

3. Jones, E. R. et al. DynQual v1.0: A high-resolution global surface water quality model. Geosci. Model Dev. Discuss. 2022, 1-24, doi:10.5194/gmd-2022-222 (2022).

How to cite: Jones, E. R., Bierkens, M. F. P., van Puijenbroek, P. J. T. M., and van Vliet, M. T. H.: Modelling global surface water quality under uncertain climate and socio-economic change, EGU General Assembly 2023, Vienna, Austria, 23–28 Apr 2023, EGU23-1161, https://doi.org/10.5194/egusphere-egu23-1161, 2023.

EGU23-1721 | ECS | Posters on site | HS2.3.6

Potential variations in groundwater quality for household and irrigation applications as affected by climate change 

Abdulaziz G. Alghamdi, Anwar A. Aly, and Hesham M. Ibrahim

Groundwater quality is being deteriorated as a result of climate change, overuse, and decreased precipitation, consequently impacting both agricultural productivity and human health. Thus, to investigate the potential variations in groundwater quality for irrigation and household applications, groundwater samples were collected from 88 different sites in Sarat Al-Baha region, Saudi Arabia. The Al-Baha region is characterized by a fragile agro-ecosystem, which is extremely susceptible to climate change. The collected samples were subjected to hydrochemical analyses to determine whether groundwater was suitable for irrigation and household consumption. Results showed that concentrations of nitrate and heavy metals were within maximum permissible limits for drinking purposes in 91% of the collected samples. However, because of elevated levels of arsenic and nitrate, 8% of the collected groundwater samples were deemed to be of poor or very poor quality for drinking purposes. The estimated saturation index revealed that the majority of the minerals in the samples were under-saturated, suggesting a higher possiblity of salinity owing to the dissolution of under-saturated minerals, conseqently increasing iron, calcium, magnesium, sodium, chloride, and sulfate concentrations. No sodicity risks were anticipated, despite of medium to higher salinity hazard. More than 90% of the collected groundwater samples had unsatisfactory quality for irrigation purposes due to the presence of salts in higher amounts, which could be due to lower precipitation and higher temperature in the study area. Hence, employing suitable management strategies to maximize groundwater utilization is recommended to avoid further groundwater quality deterioration. Groundwater discharge must be ristricted, cropping patterns should be altered to boost water productivity, and grounwater quality must be monitored on regular basis.

How to cite: Alghamdi, A. G., Aly, A. A., and Ibrahim, H. M.: Potential variations in groundwater quality for household and irrigation applications as affected by climate change, EGU General Assembly 2023, Vienna, Austria, 23–28 Apr 2023, EGU23-1721, https://doi.org/10.5194/egusphere-egu23-1721, 2023.

EGU23-1994 | ECS | Orals | HS2.3.6

Drivers and inter-seasonal trends of nutrient losses from contrasting agricultural river catchments in Ireland and UK 

Golnaz Ezzati, Per-Erik Mellander, Simon Pulley, and Adrian Collins

Current multi-stressor pressures on water quality in agricultural catchments will be exacerbated by the more frequent occurrence of extreme weather events resulting in multi-stressor environments. Managing surface water under future climatic conditions will require adaptations and targeted mitigation strategies that consider individual catchment characteristics. Assessing the impacts of recent extreme weather events can allow for the better understanding of, and insight into, the key drivers of elevated pollutant losses and point to the possible future challenges for water quality management.

As a part of the Irish EPA funded WaterFutures project, changes in the impact of climatic drivers on nutrient losses from field to small stream scale catchments of different typologies are being investigated using long-term and high-frequency water quality datasets. The trends of daily nitrate-N, and phosphorus (TP) concentrations and loads over 11 years were interrogated in two agriculturally-dominated catchments in Ireland, and in both a permanent pasture and arable field in the southwest UK (ca. 0.38– 12 km2). The trends in nutrient losses and the significance of discharge, precipitation, potential evapotranspiration (PET), soil moisture deficit, air temperature, and soil temperature, were investigated using Mann-Kendall Trend and Generalised Additive Model, respectively.

Significant inter-seasonal trends were identified in both countries and similar fluctuations of nutrient concentrations and loads in October and November 2018 were observed following an exceptional summer drought. All study sites responded to daily rainfall exceeding 10mm, although in different ways due to the different site characteristics. The soil and air temperature in the two geographically-close Irish catchments revealed a significant upward trend from June to September. During this period, these two drivers, along with discharge and PET, were key drivers of N-losses in the well-drained and arable dominated catchment. The increasing trend of monthly average N-concentrations were significant in April and November (from 5.6 in 2009 to 8.9 nitrate-N mg L-1 in 2018, Kendall-tau= 0.424). On the other hand, a catchment dominated by poorly-drained grassland showed an increasing trend in TP concentrations during January, May, September, and October (from 0.79 in 2009 to 6.72 TP mg L-1 in 2020, Kendall-tau= 0.455). Here, changes in air temperature, precipitation, and discharge were the key drivers for P losses.

Changing weather patterns, consequent changes in nutrient concentrations and load trends, and precipitation-discharge responses can be detected using long-term water quality records and should be considered for future climate smart mitigation strategies.


How to cite: Ezzati, G., Mellander, P.-E., Pulley, S., and Collins, A.: Drivers and inter-seasonal trends of nutrient losses from contrasting agricultural river catchments in Ireland and UK, EGU General Assembly 2023, Vienna, Austria, 23–28 Apr 2023, EGU23-1994, https://doi.org/10.5194/egusphere-egu23-1994, 2023.

EGU23-2336 | ECS | Posters on site | HS2.3.6

Future coastal water pollution under global change: multi-pollutant modeling 

Ilaria Micella, Carolien Kroeze, and Maryna Strokal

Coastal waters receive multiple pollutants, such as nutrients, plastics, and chemicals. Rivers transport these pollutants often from rural and urban areas to seas. Many pollutants have common sources and cause multiple impacts (e.g., eutrophication and toxicity), decreasing the availability of clean water. Meanwhile, the global change adds to coastal water pollution. For example, cities are expected to expand in size and numbers, increasing future urban pollution. In addition, agriculture may intensify to satisfy the food demand for a growing global population. This intensification may, in turn, increase agricultural pollution in river export to coastal waters. In addition, climate change is expected to result in more floods and droughts. Floods may transport more pollutants from urbanised and agricultural areas to the seas. The effects of global change will likely differ among river basins depending on their characteristics.

Existing scenarios, such as the Representative Concentrative Pathways (RCPs) and Shared Socio-economic Pathways (SSPs), address global change challenges. However, these scenarios have yet to be implemented for a global multi-pollutant assessment of coastal waters. In addition, large-scale assessments of coastal water pollution are often for single pollutants, overlooking synergies and trade-offs in pollution control for multiple pollutants. Sustainable Development Goal (SDG) 14 (clean marine waterways) may be supported by considering multiple pollutants and sources, yet additional research in the field is needed.

Our study aims to better understand the influence of global change on the river export of multiple pollutants to coastal waters by source and sub-basins. To this end, we develop the MARINA-Multi (Model to Assess River Inputs of pollutaNts to the seAs) model for more than 10,000 sub-basins and for nutrients, chemicals, and plastics to estimate future pollution trends. For these pollutants, we consider point (such as sewage systems and open defecation) and diffuse (such as agriculture and improperly managed solid waste on land) sources. Finally, we consider the SGD coastal water quality targets and develop optimistic and pessimistic futures under global change.

Our model results show that, in 2010, more than 50% of the population lived in river basins where coastal waters experienced multi-pollution problems. Rivers exported considerable amounts of nutrients, chemicals, and plastics to coastal waters globally, two-thirds reaching the Atlantic and Pacific seas. Diffuse sources contributed by over 70% to nitrogen and macroplastics in global seas. Point sources contributed by 70- 90% to phosphorus and microplastics in global seas. Multi-pollution hotspots are often found in urbanised areas. Global change will alter those pollution hotspots. First, the pollution patterns are expected to shift due to climate change affecting temperature and the water cycle. Second, changes in socioeconomic drivers are expected. Our optimistic scenarios are associated with, for example, the technological progress that enhances waste collection and treatment. The MARINA-Multi model is useful for understanding the sources and spatial variability of the multiple pollutants in rivers and coastal waters under global change. Our model can support decision-makers and water managers in implementing mitigation and adaptation policies to achieve sustainable targets for the marine environment (SDG 14).

How to cite: Micella, I., Kroeze, C., and Strokal, M.: Future coastal water pollution under global change: multi-pollutant modeling, EGU General Assembly 2023, Vienna, Austria, 23–28 Apr 2023, EGU23-2336, https://doi.org/10.5194/egusphere-egu23-2336, 2023.

Long-term climate change and increased frequency and intensity of hydroclimatic extremes (e.g. droughts, heatwaves, floods) pose serious challenges for water management, not only in terms of water quantity, but also for securing suitable water quality for human use and ecosystems. Recent droughts, heatwaves and floods have been illustrative in showing major challenges due to exceeded water quality thresholds for sectoral use (e.g. inlet stops for drinking water production, irrigation). However, compared to water quantity, a limited number of studies have focused on water quality impacts, which are prevalent in many river basins of the world.

This presentation provides a synthesis of the potential impacts of climate change and extremes (droughts, heatwaves and floods) on global river water quality considering various water quality constituents relevant for different sectoral uses and ecosystems. This synthesis is based on: 1) an extensive literature review of local, regional to global river water quality studies; 2) statistical analyses of water quality monitoring data in various river basins over the last 40 years; and 3) global river water quality projections generated by process-based global water quality models forced with bias-corrected climate change scenarios. Comparison of results over various river basins show overall consistent responses for some general water quality constituents (e.g. water temperature, dissolved oxygen, salinity) due to the predominance of generic mechanisms (e.g. lower dissolved oxygen solubility under warming). However, mixed responses are overall found for nutrients, pathogens and pharmaceuticals due to different counterbalancing mechanisms. In addition, water quality responses vary due to differences in constituent forms (e.g. dissolved vs. particulate nutrient forms) and persistence in surface waters (e.g. for pharmaceuticals). Furthermore, geographic, environmental and socio-economic (e.g. pollution management and infrastructure) conditions conspire, showing substantial impacts on the magnitude of water quality responses under climatic change and extreme events.

How to cite: van Vliet, M. T. H.: River water quality under climate change and extremes: a synthesis of impacts for river basins globally (Invited), EGU General Assembly 2023, Vienna, Austria, 23–28 Apr 2023, EGU23-2361, https://doi.org/10.5194/egusphere-egu23-2361, 2023.

EGU23-3312 | ECS | Posters on site | HS2.3.6

Attribution of climate change imprint on riverine nutrient export from diffuse pollution sources to African coastal waters 

Albert Nkwasa, Celray James Chawanda, and Ann van Griensven

Nutrient pollution derived from anthropogenic activities impacts both inland and coastal waters, altering the aquatic ecosystem and resulting in serious environmental issues. As climate change is affecting most of the hydroclimatic variables across the world, a fundamental concern in river ecology is therefore to understand the degree to which the spatial patterns and variations of nutrient concentration and loading in rivers during the last decades can be associated with climate change. This study detects and attributes the impact of historical climate change on long-term changes in the flux of nutrients from diffuse pollution sources into the coastal waters of Africa. An impact attribution approach is employed by forcing a continental process-based water quality model (Soil and Water Assessment Tool – SWAT+) for Africa with a set of observational and counterfactual climate data from the impact attribution setup of the Inter-Sectoral Impact Model Intercomparison Project (ISIMIP3a). The nonparametric Mann–Kendall test is used to identify trends while long-term mean annual river nutrient simulation differences between a model setup with observational and counterfactual climate data are calculated to allow for quantification of the climate change attribution. Results show spatial differences with climate change reasonably contributing to both an increase and decrease of both riverine Total Nitrogen and Total Phosphorus to African coastal waters. However, the climate change imprint on the riverine nutrient export is starting to emerge within the 21st century years for most rivers. These findings show spatial differences in the sensitivity of impacts of climate on riverine TP and TN export to coastal waters while highlighting the most impacted rivers in Africa.

How to cite: Nkwasa, A., Chawanda, C. J., and van Griensven, A.: Attribution of climate change imprint on riverine nutrient export from diffuse pollution sources to African coastal waters, EGU General Assembly 2023, Vienna, Austria, 23–28 Apr 2023, EGU23-3312, https://doi.org/10.5194/egusphere-egu23-3312, 2023.

EGU23-3700 | ECS | Posters on site | HS2.3.6

Coupling artificial intelligence techniques and remote sensing data for water quality simulation of lakes 

Farkhondeh Khorashadi Zadeh, Saeed Khorashadizadeh, Albert Nkwasa, and Ann van Griensven

Freshwater lakes are a major resource for human populations. To support water quality (WQ) management for lakes, both WQ monitoring and WQ modeling are essential. Conventional approaches, such as process-based models, are usually used for WQ modelling, however, these approaches require a large number of data (meteorological, topographical, hydrological, and WQ data) with high computational demands. Recently, artificial intelligence (AI) techniques are increasingly recommended in WQ modelling to tackle these challenges. In this study, the application of AI techniques for simulating/predicting water quality for large lakes using remote sensing (RS) is investigated. Specifically, the study aims to develop a robust AI model for turbidity in Lake Victoria, using the lake basin precipitation data and the sediment concentrations of the inflow rivers. To develop the AI model, the freely available remote sensing turbidity data for the lake is used as a reference data. Two models using a multi-layer perceptron neural network (MLPNN) and least square support vector regression (LSSVR) have been trained based on three different scenarios. Some performance indices such as mean absolute relative error and percent bias have been selected for model evaluation. According to the obtained results, LSSVR is more accurate than MLPNN in both training and testing phases of all scenarios. The results indicate that AI-based models are potential tools that can be adopted for WQ simulations of large lakes. Additionally, this study illustrates the potential of the use of remote sensing data to support model development, as an alternative to in-situ measurements, especially in data-scarce regions.

Keywords: Water quality, artificial intelligence, remote sensing, sediment concentration, turbidity

How to cite: Khorashadi Zadeh, F., Khorashadizadeh, S., Nkwasa, A., and van Griensven, A.: Coupling artificial intelligence techniques and remote sensing data for water quality simulation of lakes, EGU General Assembly 2023, Vienna, Austria, 23–28 Apr 2023, EGU23-3700, https://doi.org/10.5194/egusphere-egu23-3700, 2023.

EGU23-5239 | Orals | HS2.3.6

Reservoir water quality deterioration due to deforestation emphasizes the indirect effects of global change 

Michael Rode, Xiangzhen Kong, Salman Ghaffa, Maria Determann, Kurt Friese, Seifeddine Jomaa, Chenxi Mi, Tom Shatwell, and Karsten Rinke

Deforestation is currently a widespread phenomenon and a growing environmental
concern in the era of rapid climate change. In temperate regions, it is challenging to
quantify the impacts of deforestation on the catchment dynamics and downstream
aquatic ecosystems such as reservoirs and disentangle these from direct climate
change impacts, let alone project future changes to inform management. Here, we
tackled this issue by investigating a unique catchment-reservoir system with two
reservoirs in distinct trophic states (meso- and eutrophic), both of which drain into the
largest drinking water reservoir in Germany. Due to the prolonged droughts in 2015-
2018, the catchment of the mesotrophic reservoir lost an unprecedented area of forest
(exponential increase since 2015 and ca. 17.1% loss in 2020 alone). We coupled
catchment nutrient exports (HYPE) and reservoir ecosystem dynamics (GOTM-WET)
models using a process-based modelling approach. The coupled model was validated
with datasets spanning periods of rapid deforestation, which makes our future
projections highly robust. Results show that in a short-term time scale (by 2035),
increasing nutrient flux from the catchment due to vast deforestation (80% loss) can
turn the mesotrophic reservoir into a eutrophic state as its counterpart. Our results
emphasize the more prominent impacts of deforestation than the direct impact of
climate warming in impairment of water quality and ecological services to downstream
aquatic ecosystems. Therefore, we propose to evaluate the impact of climate change
on temperate reservoirs by incorporating a time scale-dependent context, highlighting
the indirect impact of deforestation in the short-term scale. In the long-term scale (e.g.
to 2100), a guiding hypothesis for future research may be that indirect effects (e.g., as
mediated by catchment dynamics) are as important as the direct effects of climate
warming on aquatic ecosystems.

How to cite: Rode, M., Kong, X., Ghaffa, S., Determann, M., Friese, K., Jomaa, S., Mi, C., Shatwell, T., and Rinke, K.: Reservoir water quality deterioration due to deforestation emphasizes the indirect effects of global change, EGU General Assembly 2023, Vienna, Austria, 23–28 Apr 2023, EGU23-5239, https://doi.org/10.5194/egusphere-egu23-5239, 2023.

EGU23-6793 | Orals | HS2.3.6

Stress testing the impacts of climate change on water quality permitting across England 

Barry Hankin, Tony Heaney, Paul Eccleston, Paul Simmons, Alex Garratt, and Changgui Wang

This presentation reports on the results of simulating 17 regulatory SIMCAT water quality models for England based on using the CEH Future Flows dataset. The de-biased uplifts were generated across 140 flow gauges comparing 2060-2080 with 2000-2020 for 11 ensembles, and kriged across the country to capture the gradients and apply river reach-specific uplifts in headwater and along-reach flows (for mean and 95 percentile exceedance flows). The resulting uplifts were applied using a recently developed UKWIR workbook and the statistical water quality models were simulated for a range of sanitary and chemical determinands (BOD, ammonia, dissolved oxygen, total and soluble phosphorus, nitrate, PFOS, cadmium and cypermethrin) to assess the potential change to Sewage Treatment Work permits.

Failure of target EQS and 10% deterioration of quality are analysed, computing the necessary adjustment to water quality permits to meet the water quality standards in the future. Ensemble uplifts representative of upper, lower and mid flows were used (focussing on the low flows) and their predicted annual average reduction. The sensitivity of the results to travel time, seasonality and temperature are investigated, and outputs are compared with recent process-based modelling using the EA HYPE model of England.

How to cite: Hankin, B., Heaney, T., Eccleston, P., Simmons, P., Garratt, A., and Wang, C.: Stress testing the impacts of climate change on water quality permitting across England, EGU General Assembly 2023, Vienna, Austria, 23–28 Apr 2023, EGU23-6793, https://doi.org/10.5194/egusphere-egu23-6793, 2023.

Lake chlorophyll-a (Chl-a) is one of the important components of the lake ecosystem. The Chl-a concentration of global water has generally increased in recent decades due to climate change and intensified anthropogenic activity. However, few researches have been done on the lake Chl-a variations in remote areas with less disturbance by human activities such as the Tibet Plateau (TP). Here, we combined 95 in situ measured lake Chl-a concentration data and Landsat reflection spectrum to establish an inversion model of Chl-a concentration through the backpropagation (BP) neural network prediction method, by which the mean annual Chl-a concentration in the past 35 years (1986–2021) of 318 lakes with an area of > 10 km2 in the TP have been retrieved. Meteorological and hydrological data, measured water quality parameters and glacier change in the lake basin were used to elucidate the driving factors of the Chl-a concentration changes in the TP lakes, with the help of geographic information system (GIS) technology and by spatial statistical analysis. The results showed that the mean annual Chl-a in the 318 lakes performed overall decrease during 1986-2021, but 63%, 32% and 5% of the total number exhibited no significant change, significant decrease and significant increase, respectively. After a slight increase during 1986–1995 (0.05 μg/L/y), the mean annual lake Chl-a significantly decreased during 1995–2004 (–0.18 μg/L/y). Further, after a slight increase during 2004–2011 (0.07 μg/L/y), it decreased slightly during 2011–2021 (–0.04 μg/L/y). The mean annual lake Chl-a concentration was significantly negatively correlated with precipitation (R2 = 0.48, P < 0.01), air temperature (R2= 0.31, P < 0.01), lake surface water temperature (LSWT) (R2 = 0.51, P < 0.01), lake area (R2= 0.42, P < 0.01) and lake water volume change (R2 = 0.77, P < 0.01). The decrease in mean annual Chl-a was in consistant to the decrease in that of salinity (R2= 0.69, P < 0.01) and increase in that of transparency (R2= 0.55, P < 0.01). The Chl-a concentrations of non-glacial meltwater-fed lakes were higher than those of glacial meltwater-fed lakes, except during higher precipitation period. Our result of lake Chl-a inversion and their variation reason analyses is able to further deeply understand the climate change impacts on Chl-a changes in the TP lakes.

How to cite: Zhu, L., Pang, S., Liu, C., and Ju, J.: The decreasing Chlorophyll-a in Tibet Plateau lakes during 1986–2021 based on Landsat image inversion and their impact causes, EGU General Assembly 2023, Vienna, Austria, 23–28 Apr 2023, EGU23-6888, https://doi.org/10.5194/egusphere-egu23-6888, 2023.

EGU23-7260 | ECS | Posters on site | HS2.3.6

Modelling the efficacy of catchment remediation measures for reducing sediment & nutrient exports under future climate trajectories 

Maarten Wynants, Lukas Hallberg, and Magdalena Bieroza

The European Green Deal has the ambition to reduce nutrient losses from agricultural catchments with 50%. In the context of a changing climate, there is an increasing need to evaluate the efficacy of catchment remediation measures and reduction in fertilisation. In this study, we set-up a daily discharge and nutrient load model for two Swedish agricultural headwater catchments using Hydrological Predictions for the Environment (HYPE). The daily model was calibrated and validated using high-frequency sensor data and flow-proportional samples analysed for nutrient and sediment concentrations. Multiple catchment remediation scenarios were run under three downscaled climate models and three Representative Concentration Pathways (RCP 2.6, RCP 4.5, and RCP 8.5). The model predicted that Inorganic Nitrogen loads will decrease in the latter half of the 21st century under RCP 4.5 and RCP 8.5 driven by increased denitrification under higher temperatures. Moreover, under all RCPs, an increase in Particulate Phosphorous and sediment loads is forecasted due to increased rainfall intensity. Decreasing the amount of mineral fertilisation only resulted in decreased Inorganic Nitrogen loads, but had no effect on Total Phosphorous loads. Catchment remediation measures were most effective for reducing Total Phosphorous loads. However, large portions of agricultural catchments will need to be converted to floodplains or wetlands in order to achieve significant load reductions and offset the predicted increases under future climatic trajectories.

How to cite: Wynants, M., Hallberg, L., and Bieroza, M.: Modelling the efficacy of catchment remediation measures for reducing sediment & nutrient exports under future climate trajectories, EGU General Assembly 2023, Vienna, Austria, 23–28 Apr 2023, EGU23-7260, https://doi.org/10.5194/egusphere-egu23-7260, 2023.

EGU23-7565 | Posters on site | HS2.3.6

Recent advancement in water quality indicators for eutrophication in global freshwater lakes 

Keerthana Suresh, Ting Tang, Michelle T.H. van Vliet, Marc F.P. Bierkens, Maryna Strokal, Florian Sorger-Domenigg, and Yoshihide Wada

Excessive nutrient (nitrogen and phosphorus) loadings to freshwater lakes cause eutrophication, which is a global water quality issue. Anthropogenic activities in lake basins emit nutrients, either as point- (e.g., sewage) or diffuse sources (e.g., agricultural runoff). Their typical impacts on lake water quality include the occurrence of harmful algal blooms, hypoxia and fish kills. These impacts are likely to worsen due to climate change, population growth and economic development. The response of lakes to a change in nutrient inputs depends on their interactions with the climate, land-use, hydrology and socio-economic conditions of a lake basin. These feedback mechanisms, however, are not often included in the eutrophication assessments for lakes. In this study, we present a new causal network of the drivers-pressure-state-impact-response (DPSIR) framework using a total of 58 sub-indicators to characterize all the DPSIR elements and systematically conceptualize the complex interactions of nutrients in freshwater lake basins. The network provides a holistic perspective on nutrient dynamics of multiple indicators and their interactive effects on water quality in lake basins, which is key to improving water quality management. Furthermore, we disentangle the complex eutrophication mechanisms using drivers and pressures, that represent different sources and nutrient pathways. The study highlights coupling of lake systems in water quality modeling frameworks and assessments which is required to understand its impact on water quality from human activities in the basin. The drivers and pressures can be used as proxies to provide meaningful information on nutrient emissions and biogeochemical pathways, that can fill the gap in water quality monitoring data, especially in data scarce regions such as Asia and Africa. These indicators can be used to set realistic water quality targets, and are, therefore, beneficial in long-term policy making and sustainable water quality management.

How to cite: Suresh, K., Tang, T., T.H. van Vliet, M., F.P. Bierkens, M., Strokal, M., Sorger-Domenigg, F., and Wada, Y.: Recent advancement in water quality indicators for eutrophication in global freshwater lakes, EGU General Assembly 2023, Vienna, Austria, 23–28 Apr 2023, EGU23-7565, https://doi.org/10.5194/egusphere-egu23-7565, 2023.

EGU23-7598 | ECS | Posters on site | HS2.3.6

Joint temporal trends in river discharge and temperature over the past 57 years in a large European basin: implications for diadromous fish 

Hanieh Seyedhashemi, Hilaire Drouineau, Anthony Maire, and Florentina Moatar

Stream temperature and discharge are two fundamental triggers of key periods of the life cycle of aquatic organisms such as the migration of diadromous fish. However, the increase in stream temperature, more frequent and severe droughts, and asynchronous evolution of stream temperature and discharge due to climate change can modify the duration and frequency of favorable temperature-flow associations for the realization of species’ ecological processes.

In this study, we investigated the influence of changes in favorable temperature-flow velocity associations for the upstream migration of Atlantic salmon, Alis shad and Sea lamprey at the scale of the Loire River basin ( km²). First, we used a physically-based thermal model (T-NET), coupled with a semi-distributed hydrological model (EROS) to reconstruct continuous daily times series over the 1963-2019 period (Seyedhashemi et al., 2022). Current velocity (V) was estimated using discharge through a hydraulic geometry model (Morel et al., 2020). We identified suitable water temperature-flow velocity associations for the migration of the three studied species based on (1) the literature and (2) observed migration recorded at fish passage stations. Using the “Choc method” (Arevalo et al., 2020), we then quantified the changes in frequency of occurrence of these suitable environmental windows over the past six decades across the hydrographic network of the Loire River basin.

Our results showed that the greatest increases in stream temperature were associated with the greatest decreases in flow velocity over the past six decades. We also found that the frequency of suitable temperature-velocity associations for upstream migration of Atlantic salmon has significantly reduced, mainly in the southern part of the basin. In contrary, the frequency of suitable associations for upstream migration of the two other species has mainly increased.

These results highlighted strong disparities in the consequence of global changes on fish migratory processes among species and in space. This work provides operational results for the management of these threatened diadromous species and the prioritization of management measures in a context of climate change.

Key words: climate change, hydrological change, water temperature, temporal trends, fish migration, long-term, large scale, Loire basin


Seyedhashemi, H., Vidal, J.P., Diamond, J.S., Thiéry, D., Monteil, C., Hendrickx, F., Maire, A. and Moatar, F., 2022. Regional, multi-decadal analysis on the Loire River basin reveals that stream temperature increases faster than air temperature. Hydrology and Earth System Sciences, 26(9), pp.2583-2603.

Morel, M., Booker, D.J., Gob, F. and Lamouroux, N., 2020. Intercontinental predictions of river hydraulic geometry from catchment physical characteristics. Journal of Hydrology, 582, p.124292.

Arevalo, E., Lassalle, G., Tétard, S., Maire, A., Sauquet, E., Lambert, P., Paumier, A., Villeneuve, B. and Drouineau, H., 2020. An innovative bivariate approach to detect joint temporal trends in environmental conditions: Application to large French rivers and diadromous fish. Science of the Total Environment, 748, p.141260.

How to cite: Seyedhashemi, H., Drouineau, H., Maire, A., and Moatar, F.: Joint temporal trends in river discharge and temperature over the past 57 years in a large European basin: implications for diadromous fish, EGU General Assembly 2023, Vienna, Austria, 23–28 Apr 2023, EGU23-7598, https://doi.org/10.5194/egusphere-egu23-7598, 2023.

EGU23-7683 | Orals | HS2.3.6

Evolution of discharge and stream temperature from past to future in a large European River basin 

Florentina Moatar, Hanieh Seyedhashemi, Jean-Philippe Vidal, Jacob Diamond, Dominique Thiery, Frédéric Hendrickx, and Anthony Maire

Both discharge (Q) and stream temperature (Tw) are the key factors affecting water quality and the suitability of instream habitats, which are expected to experience substantial evolutions due to climate change. However, the absence of continuous and long-term data of Tw at a large scale limits our understanding of the spatio-temporal variations of Tw and their control factors, like riparian vegetation, strahler order, hydroclimate.

The present study used a physically-based thermal model (T-NET), coupled with a semi-distributed hydrological model (EROS) using SAFRAN meteorological reanalysis data provided of Météo-France to reconstruct past daily Q and Tw over the 1963-2019 period for 52 000 hydrographic reaches of the Loire basin (100 000 km²), France. Three regionalized climate projections under several future emissions scenarios (available on the DRIAS portal: www.drias-climat.fr) were used to project future daily time series of these variables over the 2005-2100 period.

The results over the 1963-2019 period showed that the increase of the Tw was higher than those air temperature (Ta) in spring, summer and autumn for the majority of the reaches of the basin. Indeed, Tw increased for almost all reaches and all seasons (average = +0.38°C/decade) with the largest increase in the spring (Mar-May) (range=+0.11 to +0.76°C per decade) and in summer (Jun-Aug) (+0.08 to +1.02°C per decade). Highest spring and summer increases were generally found in the south of the basin (Massif Central and Limousin plateau) and in higher Strahler order where a larger increase in Ta (up to 0.67 °C/decade) and a larger decrease in Q (up to -16%/decade) occurred jointly.  

Depending on climate models, scenarios and seasons,future projections showed changes in seasonal flow and water temperature. Seasonal median flow over the basin would be between -40% and +35% for the middle of the 21st century (2040-2079) compared to the 1990-2019 period. For the end of the century (2070-2099), flow change would be between -53% and +73%. A clear increase in future Tw was also found with seasonal  median increases of +0.7 to +2.7°C in the middle (2040-2079) and of +0.8°C to +5.0°C,  at the end of the century (2070-2099).

These climate-induced changes in Q and Tw could help us to explain shifts in the phenology and geographical distribution of cold-water species. Moreover, they highlight that we should take vital actions for both adaptation and mitigation strategies. In this regard, we found that some of these climate change-induced impacts on Tw can be mitigated through the restoration and maintenance of riparian shading specially in small streams.

How to cite: Moatar, F., Seyedhashemi, H., Vidal, J.-P., Diamond, J., Thiery, D., Hendrickx, F., and Maire, A.: Evolution of discharge and stream temperature from past to future in a large European River basin, EGU General Assembly 2023, Vienna, Austria, 23–28 Apr 2023, EGU23-7683, https://doi.org/10.5194/egusphere-egu23-7683, 2023.

EGU23-11247 | ECS | Posters on site | HS2.3.6

Modeling the impacts of climate change on streamflow and nitrate export in a Mediterranean agricultural watershed in Spain 

Brian Omondi Oduor, Miguel Ángel Campo-Bescós, Noemí Lana-Renault, and Javier Casalí

Nitrate pollution adversely affects water quality, making it unsafe for human consumption and contributing to increased eutrophication. Nitrate exportation in agricultural areas is inevitable; however, climate change introduces great uncertainty into an already very complex problem. Thus estimating the effects of climate change on streamflow and nitrate dynamics would significantly contribute to the management of the affected areas. This research aimed to predict the impacts of climate change on streamflow and nitrate exportation in a Mediterranean rainfed agricultural watershed using the Soil Water Assessment Tool (SWAT). The model was first evaluated for its suitability to simulate streamflow and nitrate loads under rainfed agricultural conditions in the 477 km2 Cidacos River Watershed in Navarre, Spain. The model was then used to analyze the climate change impacts on streamflow and nitrate load in the short-term (2011-2040), medium-term (2041-2070), and long-term (2071-2100) climate projections compared to a historical baseline period (1971-2000) using the RCP4.5 and RCP8.5 CO2 emission scenarios. The model evaluation showed a good model performance during calibration (2000-2011) and validation (2011-2020) for streamflow (NSE = 0.82/0.83) and nitrates load (NSE = 0.71/0.68), indicating its suitability for adoption in the watershed. The climate change projection results showed a steady decline in streamflow and nitrate load for RCP4.5 and RCP8.5 in all the projections, with the long-term projection scenario of RCP8.5 significantly affected. Autumn and winter saw the greatest seasonal declines compared to spring and summer. The decline in streamflow was attributed to the projected decrease in precipitation and increase in actual evapotranspiration due to increasing temperatures, while the nitrate load decline was consistent with the projected streamflow decline. Based on these projections, the long-term projection scenarios of RCP8.5 indicate severe situations requiring urgent policy changes and management interventions to minimize and mitigate the negative consequences. Therefore, better agricultural management practices are needed to ensure sustainable water resource utilization and efficient nitrogen fertilizer application rates in the watershed to reduce pollution.

How to cite: Oduor, B. O., Campo-Bescós, M. Á., Lana-Renault, N., and Casalí, J.: Modeling the impacts of climate change on streamflow and nitrate export in a Mediterranean agricultural watershed in Spain, EGU General Assembly 2023, Vienna, Austria, 23–28 Apr 2023, EGU23-11247, https://doi.org/10.5194/egusphere-egu23-11247, 2023.

The increase of human interventions and developments is modifying the land use/land cover (LULC) of the global landscape, thus affecting the water quality of rivers and lakes severely. Lake Titicaca and Lake Nicaragua (also known as Lake Cocibolca) are the largest lakes in Latin America. Despite Bolivia and Nicaragua being countries with a vast richness of natural resources, they face unsustainable practices ranging from over-exploitation of resources to drastic LULC changes that have created environmental problems that consequently affect human well-being and health. Additionally, climate change (CC) is exacerbating these problems and causing new ones. Therefore, it is also necessary to consider the effects that it will have on water quality, either by changes in temperature or by changes in precipitation (floods or droughts) that affect river flows and sediment transport.

Environmental sustainability means securing adequate management of natural resources in all human productive and livelihood activities. Monitoring and assessing the quality of surface waters are fundamental for managing and ensuring the improvement of its state. A good understanding of the LULC change and CC dynamics is crucial to develop efficient strategy assessment, pollution management, and land use planning for the promotion of sustainable development. For these case studies, the integrated use of remote sensing products; especially considering the scarcity of data, enables a comprehensive understanding of the cause-effect relations in the water system, which assists policymakers in developing management plans for a variety of natural resource management applications.

How to cite: Baltodano Martínez, A. and van Griensven, A.: How remote sensing can identify land cover and climate change impacts on lake water quality: Lake Nicaragua and Lake Titicaca case studies., EGU General Assembly 2023, Vienna, Austria, 23–28 Apr 2023, EGU23-11416, https://doi.org/10.5194/egusphere-egu23-11416, 2023.

EGU23-12024 | Orals | HS2.3.6

Towards realizing the EU 2050 Zero Pollution Vision for Nitrogen Export 

Rohini Kumar, Tam V. Nguyen, Fanny J. Sarrazin, Pia Ebeling, Christian Schmidt, Arthur Beusen, Lex Bouwman, Jan H. Fleckenstein, Sabine Attinger, and Andreas Musolff

The European Union has adopted an ambitious long-term, zero pollution vision for 2050  aiming for EU’s  “air, water and soil pollution to be reduced to levels no longer considered harmful to health and natural ecosystems …” [1]. However, the extent to which such a goal can be realistically realized for legacy contaminants like nitrogen (N) is not yet properly understood. Herein, we provide a comprehensive assessment of nitrogen retention and export across the European landscapes to receiving waterbodies using a suite of climate, hydrology, and future socioeconomic scenarios. We establish a chain of hydroclimate and nitrogen export scenarios, comprising climate simulations from global climate models (CMIP) under different emission pathways (RCPs) and shared socioeconomic pathways (SSPs) to force a coupled hydrology and water quality model (mHM-N [2]) that characterizes the N retention and export dynamics over the period 1971-2070. SSPs consider balancing options for agricultural land management and technical innovations, taking into account future food, economic growth, and environmental demands; and provide N input trajectories from both diffuse (agricultural) and point (wastewater) sources. Our analysis shows a higher degree of improvement with substantially lower N levels in all European surface water bodies by the 2050s, compared to current levels (2010s). Eastern European rivers may benefit from technological improvements by reducing point source inputs, while in the Western European region, lower N levels can be noticed due to a reduction in diffuse N inputs. Despite these improvements, there are areas of concern where some European water bodies may still suffer from N levels exceeding critical thresholds (e.g., 2-3 mg N/l) in 2050. This may be related to continued N exports that slowly deplete legacy storages (e.g., soil and groundwater). Overall, this requires more proactive measures, particularly aiming at reducing N inputs while harvesting/utilizing and attenuating the built-up storage, to achieve the zero-pollution goal.

References

[1] https://environment.ec.europa.eu/strategy/zero-pollution-action-plan_en

[2] https://doi.org/10.1029/2008WR007327; https://doi.org/10.1029/2022GL100278

How to cite: Kumar, R., V. Nguyen, T., J. Sarrazin, F., Ebeling, P., Schmidt, C., Beusen, A., Bouwman, L., H. Fleckenstein, J., Attinger, S., and Musolff, A.: Towards realizing the EU 2050 Zero Pollution Vision for Nitrogen Export, EGU General Assembly 2023, Vienna, Austria, 23–28 Apr 2023, EGU23-12024, https://doi.org/10.5194/egusphere-egu23-12024, 2023.

EGU23-14799 | Orals | HS2.3.6

Precipitation driven river catchment changes - how the climate models determine the results (the example from Polish Carpathians) 

Agnieszka Wypych, Paweł Wilk, Ewa Szalińska, and Paulina Orlińska-Woźniak

Precipitation is one of the essential driving factors of natural processes influencing the structure and functioning of river catchment ecosystems. Changes in precipitation conditions have a significant impact on surface runoff and consequently the intensity of sediment transport, and its deposition especially in mountain catchments exposed to frequent rainfalls and prone to erosion. Therefore, insightful information about future precipitation regional projections seems to be crucial for ecosystem services management, including dammed reservoirs and fresh water resources.

In general, precipitation is projected to change its annual structure over Central Europe in relation to enhanced atmospheric moisture, moisture convergence and extratropical cyclone activity. Although new generations of climate models focus on improved simulation of water cycle, precipitation projections still become a challenge as key processes driving precipitation changes at local and hemispheric scale remain significantly sensitive to model resolution.

The aim of the study is to indicate the differences between particular precipitation projections for the exemplary Carpathian mountains catchment (Raba River, Poland) and their further evaluation   towards the impact of the chosen climate model on the environmental modelling results (sediment load variability). The outcomes of High Resolution Model Intercomparison Project (HighResMIP) - CMIP6 and higher-resolution regional data for Europe from the Coordinated Regional Climate Downscaling Experiment (EURO-CORDEX) will be taken into account. Absolute and relative changes in annual precipitation structure will be examined for the whole period of 2026-2100 with short-term (2026-2050) and long-term (2051-2100) perspectives.

The research conducted so far revealed that both sediment yields from the exemplary catchment and the sediment loads from the studied river could be greatly altered due to the predicted changes in precipitation and temperature. Since such changes can have a pronounced impact on vital ecological processes ongoing in the catchment the utmost attention should be paid to assessment of differences between climate change scenarios applied in such studies. 

How to cite: Wypych, A., Wilk, P., Szalińska, E., and Orlińska-Woźniak, P.: Precipitation driven river catchment changes - how the climate models determine the results (the example from Polish Carpathians), EGU General Assembly 2023, Vienna, Austria, 23–28 Apr 2023, EGU23-14799, https://doi.org/10.5194/egusphere-egu23-14799, 2023.

EGU23-16167 | ECS | Posters on site | HS2.3.6

Including water quality in the water-energy-food nexus: An Upper White Nile case study 

Annika Schlemm, Mark Mulligan, and Ann van Griensven

The Upper White Nile basin plays a critical role in supporting essential ecosystem services and the livelihoods of millions of people in East Africa. The basin has been exposed to tremendous environmental pressures following extensive population growth, urbanisation, and land use change, all of which are compounded by the threats posed by climate change. The water-energy-food (WEF) nexus provides an integrated solution to sustainable development by minimising the trade-offs between water, energy, and food resources. We apply quantitative and qualitative methods to understand the most pressing WEF nexus challenges within the Upper White Nile basin, how these can be represented in indicators, and how existing WEF nexus modelling tools could address this. This research combines semi-structured stakeholder interviews with a Co$tingNature analysis in order to map the greatest environmental pressures within the basin and disentangle the likely drivers. The findings from these highlight the importance of declining water quality, aquatic and terrestrial ecosystem health, and fish populations as a result of deforestation, growing human population, intensifying pollution, and increasing agricultural intensity within the basin, with most stakeholders expressing concerns for the uncertain impacts from climate change. Furthermore, a review of current WEF nexus modelling tools reveals how existing tools are insufficient in addressing the most pressing environmental challenges within the basin, with a significant gap regarding the inclusion of nuanced water quality and aquatic ecosystem indicators. Subsequently, these findings are combined in order to guide the development of holistic WEF nexus indicators that have the potential to spatially model the trade-offs within the WEF nexus in the Upper White Nile basin under climate change and land use change scenarios. This work demonstrates the use of a novel decision framework for WEF nexus indicator development, which ensures that outputs are fit-for-purpose and respond to the actual needs of stakeholders and policymakers. The outputs aim to strengthen water management decisions that enhance water quality, energy production, food production, and aquatic biodiversity within the Upper White Nile basin.

How to cite: Schlemm, A., Mulligan, M., and van Griensven, A.: Including water quality in the water-energy-food nexus: An Upper White Nile case study, EGU General Assembly 2023, Vienna, Austria, 23–28 Apr 2023, EGU23-16167, https://doi.org/10.5194/egusphere-egu23-16167, 2023.

Of all the natural resources available to humankind, water holds a prominent place, particularly because of its importance for human livelihood. Savelugu district in northern Ghana is characterized by unpredictable rainfall patterns with periodic and perennial water shortages. The distance people travel to fetch water and the person-hours spent in search for water affect productivity, economic livelihood, and health and education benefits. Provision of potable water supply to these communities is expected to bring not only health, education benefits but also increase in sanitation and hygiene practices. Static water levels (SWLs) of 19 wells in the study area were collected, analyzed and compared to the initial SWLs measured when the wells were immediately drilled and constructed. The SWL data was subjected to paired samples T-test (with α = 0.05). From the results, there was significant difference in the SWL immediately after drilling and construction (µ = 12.15, σ = 7.50) and SWL after at least 10 years (µ = 17.81, σ = 10.29); t (18) = -3.7, P = 0.002. Lowered groundwater levels were recorded in all wells measured. This can lead to drying up of some of the wells whose difference between the current SWL and well depth is close. There must be strong advocacy, development and implementation of IWRM plans to help address the problem of inadequate WASH in the study area.

How to cite: Acheampong, A.: Lowering of groundwater levels and their effect on Water, Sanitation and Hygiene services in the Savelugu District, Northern Region of Ghana, EGU General Assembly 2023, Vienna, Austria, 23–28 Apr 2023, EGU23-139, https://doi.org/10.5194/egusphere-egu23-139, 2023.

Agriculture, in general, has a long production cycle and is affected by many endogenous and exogenous uncertainty factors. Changes in rainfall patterns, maximum or minimum temperature, types and amounts of fertilizer input, timing, availability of irrigation water, and soil quality can drastically change the agricultural yield. In developing countries such as India, where more than half of countries population is engaged in agriculture, and the whims of nature may affect the agricultural output, it is essential to check how the entire agricultural system reacts to the changes in climatic parameters and anthropogenic practices. This study analyses agricultural trends in four primary staple crops, trends in climatic parameters, and anthropogenic inputs in Indian districts. Significant trends were detected and quantified using the non-parametric Mann-Kendall (MK) test, modified MK test, and Theil-Sen estimator at a 5% significance level. Spearman’s correlation test is used to determine the contributing factors to the changes in agricultural yield. Rice, Wheat, Pearl Millet, and Maize yields have shown significant increasing trends in a large number of the districts. Despite decreases in the gross cropped area in the majority of the districts, the trends in production are mostly positive. According to Spearman’s Rho correlation test, the increase in fertilizer consumption in most districts and the increase in crop-wise irrigated land in many districts are the significant reasons for the increase in yields. The rainfall did not change much compared to maximum and minimum temperatures at both the annual and seasonal levels. Although there were significant climatic changes in the last three decades, the correlation with agricultural yield is mostly insignificant.

How to cite: Sarkar, N. and Ray, S.: Analysis of Agricultural and Climatic trends in Indian Districts and finding the contributing factors in recent Indian Agricultural Outputs, EGU General Assembly 2023, Vienna, Austria, 23–28 Apr 2023, EGU23-653, https://doi.org/10.5194/egusphere-egu23-653, 2023.

EGU23-1916 | ECS | PICO | HS7.3

Modeling the potential of management options to reduce irrigation demand in Western Switzerland 

Malve Heinz, Christoph Raible, Bettina Schaefli, and Annelie Holzkämper

European Agriculture is experiencing the consequences of summer droughts and heatwaves in form of quality and quantity losses for numerous crops and feed production. Water availability for irrigation in the vital summer and fall months is decreasing and therefore, irrigation will most likely not be able to sufficiently mitigate the effects of droughts and heat in the future. Thus, approaches that reduce the need for irrigation are required. We investigate potential water-use reduction strategies based on a modelling framework applied to a selected case study in Western Switzerland, the Broye catchment. The region is characterized by intensive agricultural use and drought-related irrigation bans in summer. In the first step of our project, we quantify the total irrigation demand under current and future climate conditions using the soil-water-atmosphere-plant model SWAP. SWAP mainly simulates water and solute flow in soil as well as vegetation growth by solving a set of equations such as the Richards equations. Irrigation demand is quantified by applying this 1D model to the full range of climatic, soil and land use conditions prevailing in the selected catchment. The model calculates both the irrigation requirements and the yield of various irrigation-intensive crops currently grown in the region, such as potatoes, maize, or sugar beet. In a second step, we use the model to assess the efficiency of different management options to reduce the water demand, such as mulching, organic amendments, biochar application, different tillage methods or the cultivation of better-adapted crops. In future work, we will couple the field-scale model to a catchment-scale rainfall-runoff model to assess the impact of a large-scale application of such measures on the water balance of the catchment.

How to cite: Heinz, M., Raible, C., Schaefli, B., and Holzkämper, A.: Modeling the potential of management options to reduce irrigation demand in Western Switzerland, EGU General Assembly 2023, Vienna, Austria, 23–28 Apr 2023, EGU23-1916, https://doi.org/10.5194/egusphere-egu23-1916, 2023.

EGU23-2603 | PICO | HS7.3

Rainwater harvesting as climate change adaptation strategy for durum wheat production in Sardinia 

Francesco Viola, Roberto Deidda, Salvatore Urru, and Elena Cristiano

The Mediterranean region is widely recognized as a climate change hotspot, where, mainly due to the increase of CO2 concentration, both historical records and future climate models’ projections reveal an increase of the daily average temperature and a reduction of the mean annual precipitation, with less frequent but more intense rainfall events. These changes could have strong impacts on the durum wheat production, and consequently to the food chain that derives from it. Water availability is expected to be the main limiting factor in the durum wheat growth, which is usually rainfed in Mediterranean region. On the other hand, CO2 increase may act as a counterbalance factor, by increasing the water use efficiency. In this work, within the framework of the H2020 European Union project ARSINOE (“Climate-resilient regions through systemic solutions and innovations”), we investigated the possibility to adapt durum wheat production to climate changes, compensating the rainfall reduction with emergency irrigation derived from a rainwater harvesting system, with the aim to keep constant the durum wheat production or alleviate the yield reduction. The Aquacrop model, a crop growth model developed by FAO’s Land and Water Division, has been calibrated to reproduce the actual durum wheat production in the Campidano region in Sardinia (Italy), implementing the local climate and soil characteristics. The model has been then used to simulate the crop production in correspondence of different bias corrected future climate scenarios, which foreseen an average rainfall reduction and increase of average temperature and CO2 concentration in the atmosphere. A rainwater harvesting system to collect rainfall from the rooftops or impervious surface within the cultivated area (100m2/ha) has been designed and the volume for potential emergency irrigation has been estimated year by year. Preliminary results show the importance of implementing rainwater harvesting systems to provide emergency irrigation and sustain durum wheat production in a context of climate changes.

Acknowledgments

This project has received funding from the European Union’s Horizon H2020 innovation action programme under grant agreement 101037424.

How to cite: Viola, F., Deidda, R., Urru, S., and Cristiano, E.: Rainwater harvesting as climate change adaptation strategy for durum wheat production in Sardinia, EGU General Assembly 2023, Vienna, Austria, 23–28 Apr 2023, EGU23-2603, https://doi.org/10.5194/egusphere-egu23-2603, 2023.

With the impact of climate change and the main rainfall seasons in Taiwan are concentrated in the plum rain season from May to June and the typhoon season from July to September each year.There are significant differences in rainfall and spatial and temporal distribution between the wet season and the dry season,the droughts will occur and even lead to severe water shortages, such as the worst drought in half a century in 2021.From a macroscopic spatial scale, for example, the El Niño phenomenon and solar activity may have a certain impact on the overall climate and water resources of the earth.Therefore, this study analyzes the correlation between rainfall and large-scale influencing factors such as sunspots, El Niño-Southern Oscillation,and uses machine learning models to predict and classify rainfall under different conditions,the prediction accuracy rate through historical data can reach 89.9% , with sunspots as the most significant factor. It is hoped that relevant units can provide reference for water resources management and planning.

How to cite: Weng, Z.-H. and Lin, Y.-C.: Establishing a macroscopic-scale rainfall climate and water resources estimation model by machine learning method, EGU General Assembly 2023, Vienna, Austria, 23–28 Apr 2023, EGU23-3008, https://doi.org/10.5194/egusphere-egu23-3008, 2023.

EGU23-3528 | ECS | PICO | HS7.3

Effects of heat and drought stress and their co-occurrence on winter wheat yields in Germany under climate change 

Rike Becker, Bernhard Schauberger, Ralf Merz, Stephan Schulz, and Christoph Gornott

In our changing climate, heatwaves and droughts and their spatio-temporal co-occurrences are likely to intensify. This will inevitably challenge future agricultural production and calls for adaptation strategies to protect future yields. To find suitable climate adaptation strategies for Germany’s major staple crop - winter wheat - it is important to know how heat stress, drought stress or their compound effects drive wheat yield failures. The principal aim of this study is, therefore, to quantify the impacts of heat, drought, and their compound effects on winter wheat yields in Germany, in a spatially and temporally discrete manner.

To address our aim, we develop a statistical crop-climate model for the time period 1991-2019 at the county level. We first create agroclimatic proxies for heat stress, drought stress and their compound effects and use these to construct a separate time series model with the addition of time-dependent interaction terms. Our approach constructs separate regression models for each county, based on common elements that allow for comparing and jointly interpreting individual models.

Preliminary results show that more than 50% of Germany’s wheat yield variability can be explained by climate effects. Compound effects of heat and drought stresses are responsible for approx. 42% of the variability in Germany’s winter wheat yields. Drought stress alone explains approx. 7%, with higher impacts in the east of the country, and heat stress alone explains approx. 3% of the year-to-year yield variability, with higher impacts in the north-west of Germany. The results confirm the importance of compound effects and underline their dominating impacts on winter wheat yields, when compared to individual heat and water stress impacts – a finding which should guide future adaptation strategies. Furthermore, our study shows that heat stress is becoming increasingly important for wheat yield failure in Germany – alone and in conjunction with moisture stress.

In conclusion, we suggest that climate change adaptation strategies for winter wheat in Germany should focus on combined measures against drought and heat extremes. While the increase of multi-stress resilience should be the main goal for entire Germany, north-western areas should prioritize strategies to increase heat resilience and eastern areas should prioritize strategies to increase drought resilience.

How to cite: Becker, R., Schauberger, B., Merz, R., Schulz, S., and Gornott, C.: Effects of heat and drought stress and their co-occurrence on winter wheat yields in Germany under climate change, EGU General Assembly 2023, Vienna, Austria, 23–28 Apr 2023, EGU23-3528, https://doi.org/10.5194/egusphere-egu23-3528, 2023.

current legislation requires the inspection and calibration of operational survey radiation monitoring instruments used in nuclear medicine and radiotherapy departments as well as in any field that uses ionizing radiation sources. As a result, Morocco's national secondary standard dosimetry laboratory provides reliable calibration results with high accuracy while adhering to national and international radiation protection standards and covering the various measurement ranges, using the attenuators offered by the automated Gamma G10 irradiator or the validated beam qualities produced by the X-ray irradiator type X80-320kV as required. The measurements’ reliability was demonstrated by participation in a comparison program launched by the International Atomic Energy Agency (IAEA).

This work aims to develop a digital graphical user interface designed for the calibration of measuring instruments in radiation protection through the programming language Python, which serves to facilitate the establishment of all operations and calculations related to the determination of calibration factors and measurement uncertainties according to the ISO 4037 standard in a minimum time that allows to process several instruments during the day with high accuracy, while minimizing the sources of errors, this interface allows the recording of calculations as well as the establishment and electronic archiving of the calibration certificate in pdf format ported from PHP FPDF.

How to cite: Belhaj, O. E., Boukhal, H., and Belhaj, S.: Digital graphical user interface as a facilitator for the calibration of radiation monitoring instruments according to ISO 4037:2019 at the national secondary standard dosimetry laboratory of morocco, EGU General Assembly 2023, Vienna, Austria, 23–28 Apr 2023, EGU23-4503, https://doi.org/10.5194/egusphere-egu23-4503, 2023.

Groundwater is an essential source of water in Taiwan, and its long-term overuse has resulted in water resource problems that have become a potential crisis in the Zhuoshui River Basin. This overuse of groundwater may also lead to subsidence, which can have significant consequences for the area and its infrastructure. The lack of complete observations of groundwater extraction in Taiwan due to historical factors has made it difficult to accurately understand and manage the amount of water being taken, particularly for agricultural purposes.In view of this, this study uses time series data from 87 agricultural groundwater wells in Huwei Town, Yunlin County from January 2016 to July 2017, and time series data on agricultural well electricity usage in the Changshui River Basin, combined with other attribute data, to understand farmers' water pumping behavior using data mining methods and to estimate the amount of water taken in the Huwei area using machine learning.This study obtained the spatial and temporal distribution of groundwater withdrawals in the Huwei area in 2018.

How to cite: Tseng, Y. K. and Yu, H. L.: Using Time Series Data and Machine Learning Estimating Agricultural Groundwater Extraction in Huwei Town, Taiwan, EGU General Assembly 2023, Vienna, Austria, 23–28 Apr 2023, EGU23-5173, https://doi.org/10.5194/egusphere-egu23-5173, 2023.

EGU23-5551 | ECS | PICO | HS7.3

Probabilistic modelling of water distribution networks and resilient reduction of leakages: Large scale application to the city of Patras in western Greece 

Athanasios V. Serafeim, George Kokosalakis, Roberto Deidda, Nikolaos Th. Fourniotis, Irene Karathanasi, and Andreas Langousis

Modeling of leakages in Water Distribution Networks (WDNs) is a vital task for all water related professionals and experts towards the development of management practices and strategies, which aim at the reduction of water losses (leakages) and the associated financial cost and environmental footprint. In the current work we develop an integrated, theoretically founded, and easily applicable probabilistic framework for resilient reduction of leakages in WDNs, which combines: a) a set of conceptually and methodologically different probabilistic approaches for minimum night flow (MNF) estimation in WDNs based on statistical metrics (Serafeim et al., 2021 and 2022a), and b) a combination of statistical clustering and hydraulic modeling techniques for the rigorous and user unbiased partitioning of WDNs into pressure management areas (PMAs) or district metered areas (DMAs), which seeks for minimization of leakages while maintaining an acceptable level of the network’s hydraulic resilience (Serafeim et al., 2022b). The efficiency of the introduced framework is tested via a large-scale real-world application to the water distribution network of the City of Patras, the largest smart water network (SWN) in Greece, which covers an area of approximately 27 km2 and serves more than 213000 consumers (based on data from the Hellenic Statistical Authority and the Municipality of Patras), with more than 700 km of pipeline grid (mainly HDPE and PVC pipes).

Acknowledgements

The research work was supported by the Hellenic Foundation for Research and Innovation (H.F.R.I.) under the “First Call for H.F.R.I. Research Projects to support Faculty members and Researchers and the procurement of high-cost research equipment grant” (Project Number: 1162).

References

Serafeim, A.V., Kokosalakis, G., Deidda, R., Karathanasi I. and Langousis A (2021) Probabilistic estimation of minimum night flow in water distribution networks: large-scale application to the city of Patras in western Greece, Stoch. Environ. Res. Risk. Assess., https://doi.org/10.1007/s00477-021-02042-9.

Serafeim, A.V., G. Kokosalakis, R. Deidda, I. Karathanasi and A. Langousis (2022) Probabilistic Minimum Night Flow Estimation in Water Distribution Networks and Comparison with the Water Balance Approach: Large-Scale Application to the City Center of Patras in Western Greece, Water, 14, 98, https://doi.org/10.3390/w14010098.

Serafeim, A.V., G. Kokosalakis, R. Deidda, N. Th. Fourniotis and A. Langousis (2022) Combining statistical clustering with hydraulic modeling for resilient reduction of water loses in water distribution networks: Large scale application to the city of Patras in Western Greece, Water, 14(21), 3493. https://doi.org/10.3390/w14213493.


How to cite: Serafeim, A. V., Kokosalakis, G., Deidda, R., Fourniotis, N. Th., Karathanasi, I., and Langousis, A.: Probabilistic modelling of water distribution networks and resilient reduction of leakages: Large scale application to the city of Patras in western Greece, EGU General Assembly 2023, Vienna, Austria, 23–28 Apr 2023, EGU23-5551, https://doi.org/10.5194/egusphere-egu23-5551, 2023.

EGU23-5567 | PICO | HS7.3

A probabilistic approach for detection and classification of PRV malfunctions in the water distribution network of the city of Patras in western Greece 

Anastasios Perdios, George Kokosalakis, Nikolaos Th. Fourniotis, Demetris Pantzalis, and Andreas Langousis

Effective management of water losses in water distribution networks (WDNs) still remains a demanding task, as the temporal and spatial variability of water resources under changing climatic conditions and the increasing needs for drinking water may lead to freshwater shortages. In this context, pressure management strategies are widely adopted in an effort to reduce the water losses in the supply and distribution parts of water networks and, consequently, deescalate their environmental footprint. Installation of pressure reducing valves (PRVs) at critical locations of WDNs plays a central role in pressure regulation strategies, as PRVs reduce the upstream pressure to a set outlet pressure (i.e., downstream of the PRV), usually referred to as set point. Perdios et al. (2022) developed a novel statistical framework and applied it to an existing pressure management area (PMA) of the city of Patras in western Greece, aiming at early detection of PRV malfunctions that may significantly influence network’s operation and the corresponding lifetime of related infrastructure. The results showed that the suggested methodology allows reliable detection of critical malfunctions at least 2 days prior to flow disruptions. Ιn this study, we calibrate and implement Perdios et al. (2022) statistical framework, using pressure data for a 4-year period from 01/Jan./2017 to 26/Nov./2020 from several important PMAs of the WDN of the city of Patras, aiming towards better understanding of the causes of the malfunctions, by decomposing the observed pressure deviations from the set point to systematic and random error components.

Acknowledgements

The research work has been conducted within the project PerManeNt, which has been co-financed by the European Regional Development Fund of the European Union and Greek national funds through the Operational Program Competitiveness, Entrepreneurship and Innovation under the call RESEARCH – CREATE – INNOVATE (project code: T2EDK-04177).

Reference

Perdios A., G. Kokosalakis, N. Th. Fourniotis, I. Karathanasi and A. Langousis (2022) Statistical framework for the detection of pressure regulation malfunctions and issuance of alerts in water distribution networks, Stoch. Env. Res. Risk Asses., https://doi.org/10.1007/s00477-022-02256-5

How to cite: Perdios, A., Kokosalakis, G., Fourniotis, N. Th., Pantzalis, D., and Langousis, A.: A probabilistic approach for detection and classification of PRV malfunctions in the water distribution network of the city of Patras in western Greece, EGU General Assembly 2023, Vienna, Austria, 23–28 Apr 2023, EGU23-5567, https://doi.org/10.5194/egusphere-egu23-5567, 2023.

EGU23-10057 | ECS | PICO | HS7.3

Building a smart green system to control water leakage and monitor drinking water quality in the water supply system of Paramythia city, Greece: the case of SMASH project 

Angelos Chasiotis, Stavroula Tsitsifli, Konstantinos Panytsidis, Vegard Nilsen, Nikolaos Mantas, Dimitrios Theodorou, Thomas Kyriakidis, Stefanos Chasiotis, Maria Bousdeki, Elissavet Feloni, Harsha Ratnaweera, Panagiotis Nastos, and Malamati Louta

Water leakage is acknowledged as one of the most important issues that drinking water supply systems are facing worldwide. Non-Revenue Water is estimated to 346 million m3 per day and its cost/value is estimated to 39 billion USD per year. At the same time drinking water quality is jeopardized from the water intake points to the consumer’s tap, even during normal operating conditions.

ICT support water utility operators to improve the operational capacity of their water supply system. A smart green system to control water leakage and monitor drinking water quality in the water supply system of Paramythia city will be built in the context of SMASH project. It consists of: (a) IoT system comprising three local control stations, installed in selected parts of the water supply network, monitoring water quantity&quality parameters in real time; (b) the hydraulic simulation model of the water supply system of Paramythia; (c) a virtual sensors system, which will be used for water quality prediction; (d) a Decision Support System (DSS) for leakage detection and optimal management of water supply system parameters in an automated manner.

The DSS will detect and locate water leakages within the DMA zone and inform the operators for excessive values in drinking water quality parameters. The DSS will use as inputs the data from the IoT system, will interact with the hydraulic simulation model, and obtain the water quality data from the virtual sensors. All these data will be processed by the DSS logic in the backend subsystem. The IoT and the hydraulic simulation data, based on the digital twin of the water supply system, are used for the calculation of specific performance indicators related to water leakage, such as well-known IWA indicators: water losses, ILI, etc. Calculating the divergences between the PI values observed & the ones representing the optimal operation of the water network without leakages and setting appropriate thresholds, the DSS will detect the leakage, while several different scenarios will run in hydraulic simulation. The frontend subsystem of the DSS will be able to visualize the water distribution network, statistical values of water quantitative & qualitative parameters. It will provide alarms in case of leakage or exceedance of water quality parameters’ values and it will show the leakage location in a map. The architecture of the smart green system, currently under development, is depicted in Fig.1.

Figure 1. The DSS for the water parameters management in the water supply system

Keywords: Drinking water; water quality; leakage; virtual sensors; smart system; decision support.

Acknowledgement: This work is co-financed by EEA Grants 2014 – 2021 and Greek Public Investments Program.

  • Liemberger, R., & Wyatt, A. (2019). Quantifying the global non-revenue water problem. Water Supply19(3), 831-837.
  • Antzoulatos G., Mourtzios C., et al (2020), Making urban water smart: the SMART-WATER solution. Water Science & Technology, 82(12), 2691–2710.
  • Alegre, H., Baptista, et al (2016). Performance indicators for water supply services. 3rd IWA publishing.

How to cite: Chasiotis, A., Tsitsifli, S., Panytsidis, K., Nilsen, V., Mantas, N., Theodorou, D., Kyriakidis, T., Chasiotis, S., Bousdeki, M., Feloni, E., Ratnaweera, H., Nastos, P., and Louta, M.: Building a smart green system to control water leakage and monitor drinking water quality in the water supply system of Paramythia city, Greece: the case of SMASH project, EGU General Assembly 2023, Vienna, Austria, 23–28 Apr 2023, EGU23-10057, https://doi.org/10.5194/egusphere-egu23-10057, 2023.

By calculating the water demand and programming a fine irrigation project, the management and cultivating efficiency of traditional agriculture can be greatly improved. Taking rotational irrigation for example, the efficiency of irrigation can be maximized by adjusting water distribution routes, irrigation area allocation, and irrigation schedule planning. However, in actual operation, some problems are often encountered, such as how to persuade farmers and promote the designed irrigation project, and the negotiation of various stakeholders. Generally, due to the complexity of the irrigation design model, it is impossible to have an effective and immediate communication or presentation. Therefore, this study introduces the Bayesian network to presents the key points of the irrigation project after simplifying the relationship. In addition to being simpler for stakeholders to understand, it is also possible to adjust various parameters in time to obtain rough estimation results.

The research area of this study is a 100-hectare farmland, which is located in Kinmen County, Taiwan. For many years, local farmers have only relied on precipitation to cultivate sorghum, wheat and other crops. However, the precipitation in Kinmen is semiarid and unstable. In the past five years, the annual rainfall has been lower than the average in previous years, which directly led to a very bleak crop harvest. Therefore, we hope to establish an irrigation project in Kinmen, using recycled water as the water source to provide local farmers with a reliable water source.

The Bayesian network used in this study is a directed acyclic graphical (DAG) model based on conditional probability and Bayesian theorem to express the possible relationship between variables. In terms of operation, the different influencing factors in the research topic are converted into nodes, and the relationship between nodes is given by different conditional probabilities. This study uses GeNIe to establish a Bayesian network that can be used to estimate water profit and loss and other results. This Bayesian network can be divided into four sub-blocks, which are the relevant data of the irrigation area, the water demand, the water supply, and the final result calculation. Therefore, when the stakeholders are negotiating the irrigation project, they can discuss the different estimation results by adjusting each node of the first three sub-blocks.

How to cite: Su, Y. and Yu, H.-L.: Application of Bayesian Network in Analysis and Management of Agricultural Water - Taking Kinmen for Example, EGU General Assembly 2023, Vienna, Austria, 23–28 Apr 2023, EGU23-10515, https://doi.org/10.5194/egusphere-egu23-10515, 2023.

Assessing the Sustainability in Water Use under
Different Agricultural Management Planning
in Yeongsan-River Basin, South Korea


Yujong Jeong1, Hyun-woo Jo1, YanYan1, Minwoo Noh1, Woo-Kyun Lee1*


1 Department of Environmental Science and Ecological Engineering, Korea University, Seoul 02841, Republic of Korea

*E-mail: leewk@korea.ac.kr

(Address: Korea University, Anamro 145, Seongbukgu, Seoul 02841, Republic of Korea)


Abstract:

From the past, South Korea has been experiencing high level of water stress as reported by WRI, in 2013, and chronically imbalanced spatiotemporal water allocation. Yeongsan-river basin, where the biggest national breadbasket is located, is facing unequal water allocation among different water uses and inefficient water management under episodic water shortage conditions. Therefore, the main objective of this study was to analyse current water management and allocation scheme, and to evaluate 3 different agricultural management plans in terms of efficiency and equity. The Soil and Water Assessment Tool(SWAT) was applied to simulate the hydrological process and crop yield in the basin. The model was calibrated and validated using observed outflows to set adequate system parameters for the entire watershed. Crop water productivity and spatial-temporal-sectoral water distribution are utilized as the indices to evaluate different agricultural strategies. The results suggested that there was potential to improve both crop productivity and water allocation at the same time with the suggested plannings. Crop water productivity increased in all three strategies in order of on-farm management measures (precise agriculture), crop diversification (replacing rice to beans) and agroforestry (mixing trees and crops). The crop water productivity of on-farm measurement ranges from 5t/L to 13t/L and rises about 20% on average. In addition, it is found that applying the combination of different agricultural management measures could achieve better water allocation in terms of space and time, and between agriculture and ecosystem. The outcomes of this study can serve scientific-evidence policy and decision-making systems for sustainable agricultural society and ecosystem.

KeywordsHydrological Modelling, SWAT, Crop water productivity, Water allocation, Agricultural Management Planning, Yeongsan-River Basin

Acknowledgements: This work was supported under the framework of international cooperation program managed by the National Research Foundation of Korea (No. 2021K2A9A1A02101519).


How to cite: Jeong, Y.: Assessing the Sustainability in Water Use under Different Agricultural Management Planning in Yeongsan-River Basin, South Korea, EGU General Assembly 2023, Vienna, Austria, 23–28 Apr 2023, EGU23-10943, https://doi.org/10.5194/egusphere-egu23-10943, 2023.

EGU23-10953 | ECS | PICO | HS7.3

Leveraging Hydroclimate and Earth Observation to Predict Grain Production in Sub-Saharan Africa 

Donghoon Lee, Frank Davenport, Shraddhanand Shukla, Laura Harrison, Greg Husak, Chris Funk, Michael Budde, James Rowland, Amy McNally, and James Verdin

The importance of forecasting agricultural production in Sub-Saharan Africa (SSA) is increasing for the management of agricultural supply chains, market forecasting, and targeting of food aid. In particular, agricultural forecasts enable governments and humanitarian organizations to respond more effectively to shocks in food production and price spikes resulting from extreme droughts. In this study, we use hydroclimate, earth observations (EO) and machine learning to develop an operational, sub-national grain production forecast system for a number of SSA countries, including food-insecure regions where rapid response is critical. Before creating the forecast, we collect and organize crop production data from the Famine Early Warning Systems Network in order to identify trends and variability in agricultural technology, climate, and vegetation. In addition, we demonstrate the capability of hydroclimate and EO data to capture favorable or unfavorable crop development conditions during the growing season. In addition, we demonstrate a unique capability that explains how EO characteristics influence current grain production forecasts, thereby enhancing the forecasts' reliability and efficacy. This research lays the groundwork for the development of a large-scale, operational crop yield forecasting system that will provide actionable predictions of food shocks for famine early warning and guide advanced preparedness and response strategies.

How to cite: Lee, D., Davenport, F., Shukla, S., Harrison, L., Husak, G., Funk, C., Budde, M., Rowland, J., McNally, A., and Verdin, J.: Leveraging Hydroclimate and Earth Observation to Predict Grain Production in Sub-Saharan Africa, EGU General Assembly 2023, Vienna, Austria, 23–28 Apr 2023, EGU23-10953, https://doi.org/10.5194/egusphere-egu23-10953, 2023.

EGU23-11183 | ECS | PICO | HS7.3

Implications of 1.50C global warming for agricultural productivity over a global rice exporting region in Central India 

Shoobhangi Tyagi, Sandeep Sahany, Dharmendra Saraswat, Saroj Kanta Mishra, Amlendu Dubey, and Dev Niyogi

Water, food, and energy security are the major climate risks of global warming. The Paris Agreement proposed an ambitious target of limiting the rise in global mean surface temperature to well below 20C, and preferably to 1.50C, compared to the pre-industrial era. However, the implication of this policy discourse on the agricultural system is imperative for ensuring food security in the face of global warming. This research focuses on understanding the changes in water availability and rice productivity under 1.50C global warming over a global rice-exporting semi-arid watershed in Central India. Towards this goal, the mean climate under 1.50C of global warming was computed for 21 Coupled Model Intercomparison Project Phase 6 (CMIP6) Global Climate models (GCMs). For each GCM, the corresponding changes in blue-green water availability and rice productivity at 1.50C warming period were estimated under two global warming scenarios (SSP2-4.5 and SSP5-8.5) based on the semi-distributed Soil and Water Assessment Tool (SWAT). Results suggest that the green and blue water is projected to change by ~ -20% to 10 and ~ -50 to 20%, respectively. The rice yield is projected to reduce in the range of 5% to 50%, with an increase in local temperature (~10C) and a decrease in local precipitation (~20%) being the limiting factor. This study provides useful information on when the 1.50C global warming could reach and how it can affect the agricultural productivity of semi-arid watersheds across different global warming scenarios. This study will help develop appropriate strategies to reduce/alleviate the impacts of global warming and foster food security at the watershed-scale.   

How to cite: Tyagi, S., Sahany, S., Saraswat, D., Mishra, S. K., Dubey, A., and Niyogi, D.: Implications of 1.50C global warming for agricultural productivity over a global rice exporting region in Central India, EGU General Assembly 2023, Vienna, Austria, 23–28 Apr 2023, EGU23-11183, https://doi.org/10.5194/egusphere-egu23-11183, 2023.

        Due to climate change, Taiwan's rainfall has become unstable in recent years, leading to short rainy seasons and low rainfall. In 2021, a severe drought occurred due to the lowest rainfall on record. Groundwater is essential for agricultural development, but less than 10% of wells are legal. Improper or excessive use of groundwater resources can cause serious disasters, such as sea intrusion and land subsidence. However, if the government and farmers extract groundwater effectively and sustainably, it will bring more flexibility to water management.

        In this study, a land subsidence model was conducted based on geological conditions and groundwater level. This study analyzes multi layer compaction monitoring well profiles, and further finds the correlation among the two main factors and subsidence. The goal of this study is to visualize which areas are more suitable for using groundwater and assist the government in water resource management. This study focuses on the Choshui river alluvial fan in Taiwan. A risk map of land subsidence for this area is made by evaluating two main factors, geological conditions and groundwater level.

How to cite: Su, S.-H. and Yu, H.-L.: Assessment of Land Subsidence based on Geological Conditions, Groundwater Levels in the Choshui River Alluvial Fan, Taiwan, EGU General Assembly 2023, Vienna, Austria, 23–28 Apr 2023, EGU23-11879, https://doi.org/10.5194/egusphere-egu23-11879, 2023.

EGU23-12693 | ECS | PICO | HS7.3

Photo-driven processes for the removal of biotoxins derived from Harmful Microalgal Blooms 

Javier Moreno-Andrés, Sandra Lage, Ana Catarina Braga, Leonardo Romero-Martínez, Asunción Acevedo-Merino, Enrique Nebot, and Pedro R Costa

Harmful Algal Blooms (HABs) are increasing in frequency and magnitude globally. These episodes are associated with the generation of biotoxins, which pose a potential risk to human and animal health. Biotoxins notably affect aquaculture activities and shellfish production, which has a clear impact on food and human health. Consequently, it is sometimes necessary to close the harvesting areas until the organisms are decontaminated. These natural detoxification mechanisms depend largely on the type of toxin and physiology of the organism, resulting in lengthy processes that can cause severe economic losses to aquaculture activities. As the main goal of this communication, we propose a technological alternative for the degradation of marine biotoxins through the implementation of UV technology as a treatment for agricultural, environmental, and health-related purposes. Therefore, advanced photochemical processes should be evaluated for the efficient degradation of marine biotoxins. The toxin selected was okadaic acid (OA), which is a very stable diarrheal toxin (DSP) and has a great impact on shellfish production areas, e.g. on the Portuguese coast. First, irradiation experiments were performed under UV-A, UV-B, and UV-C irradiation. In general, the concentration remained similar after different UV exposures, indicating that there was no observable photodegradation of OA after 3 h of UV irradiation, detecting a maximum degradation of 19.5% (± 0.95) in the UV-C region, suggesting that OA is clearly resistant to UV photodegradation. Second, the combined UV/H2O2, UV/HSO5, and UV/S2O82 − processes were tested. Two different UV sources were evaluated: LED and low-pressure lamps (LP), performing OA exposure in distilled water and seawater, with a maximum UV exposure of 3 h. In general, a clear degradation of OA is observed in photochemical processes in distilled water, with a slight decrease in efficiency in the UV/H2O2 process with an LED irradiation source. In the case of UV/S2O82 − and UV/HSO5, both the LP lamp and LED achieved a total degradation of OA. In the case of the marine matrix, the effect is clearly inhibited for the UV/H2O2 process; however, for UV/ HSO5, salinity does not seem to affect OA degradation, obtaining practically 100% removal. The study of new UV-LEDs would favor aquaculture activities by increasing sustainability and health safety. Likewise, the results obtained might provide the basis for a possible scale-up of technological processes specifically designed for the minimization of marine biotoxins.

How to cite: Moreno-Andrés, J., Lage, S., Braga, A. C., Romero-Martínez, L., Acevedo-Merino, A., Nebot, E., and Costa, P. R.: Photo-driven processes for the removal of biotoxins derived from Harmful Microalgal Blooms, EGU General Assembly 2023, Vienna, Austria, 23–28 Apr 2023, EGU23-12693, https://doi.org/10.5194/egusphere-egu23-12693, 2023.

EGU23-15429 | ECS | PICO | HS7.3

Effect of distance of crop canopy temperature observations on Crop Water Stress Index 

Aditi Yadav, Hitesh Upreti, and Gopal Singhal

The need for water management in the agriculture sector, which is a 70% consumer of global water resources, is imperative. For the same, a plant-based index called crop water stress index (CWSI) is widely being adopted for irrigation scheduling. An empirically derived CWSI is dependent on three parameters of canopy temperature (Tc), air temperature (Ta), and relative humidity (RH).This study was conducted by performing controlled crop experiments in the arid region of Uttar Pradesh state of India, which aims to evaluate the significance of height of Tc observations, taken from March to April 2022, on CWSI calculations for the wheat crop.This has been done by observing theTc by aiming the wheat crop from the top of the crown at two distances of 10 cm and 100 cm, respectively. Handheld remote sensingdevice known as infrared thermometeris used for the observation of canopy temperature. Variation in the height from 10 cm to 100 cm leads to a variation in the field of view from 51.28 sq. cm to 5128 sq. cm. The effect of enhanced area and the involvement of extra soiland vegetation pixels can be understood by this work. Five different irrigation regimes have been provided to study the effect of change in height for Tc observations. The regimes consist of five plots 1,2,3,4, and 5 with soil moisture depletion by the following percentage respectively: 50% in drip irrigation, 25% in drip irrigation, unregulated flood irrigation, 50% in flood irrigation, and no irrigation plot.Plot 2 has been used to formulatea lower baselinefor CWSI calculations. A lower baseline represents a non-water-stressed condition of the crop where the crop is provided with sufficient irrigation treatment leading towards negligible stress conditions. The lower baseline equations used for CWSI assessment for 10 cm and 100 cm height are -1.287(VPD) -2.19 and -1.214(VPD)-1.738, respectively. VPD represents vapor pressure deficit which is a function of Ta and RH. Upon increasing the height from 10 cm to 100 cm, Tc increased by 2.1%, 2.7%, 0.6%, 0.9%, and 1.3% for plots 1,2,3,4, and 5, respectively. This change in temperature led to a decrease in CWSI by 21.8%,36.4 %,9.2%, and 12.2% in plots 1, 2, 3, and 4 respectively. An increase in CWSI by 5.8% for a rise of 1.3% in Tc for plot 5 was also noted. Further coefficient of determination R2 was observed between CWSI at 10 cm height and CWSI at 100 cm height for all plots. It was observed to be 0.65, 0.50, 0.93, 0.93, and 0.87 for plots 1, 2, 3, 4, and 5, respectively. This study shows the effect of observation distance of crop canopy temperature on CWSI that can lead to the development of sampling procedures meant for CWSI studies.

How to cite: Yadav, A., Upreti, H., and Singhal, G.: Effect of distance of crop canopy temperature observations on Crop Water Stress Index, EGU General Assembly 2023, Vienna, Austria, 23–28 Apr 2023, EGU23-15429, https://doi.org/10.5194/egusphere-egu23-15429, 2023.

Agricultural water use comprises the major part of the total water consumption in many countries, and Taiwan is no exception. However, urbanization and industrialization have triggered the competition for water among different sectors. Water is transferred to satisfy the daily need and industrial need, especially the need of high-tech industries, from the agricultural sector. Groundwater hence becomes an alternative water resource for agriculture, but the over-exploitation of groundwater resources also leads to some problems such as environmental degradation and land subsidence, and climate change has worsened the situation in the recent years.

In Taiwan, groundwater is one of the vital water resources for irrigation, especially when the first crop rice begins being cultivated in the late dry season in central Taiwan. Yunlin County located in central Taiwan is chosen as the study area, which is now facing severe issues about groundwater over-exploitation and suffering from land subsidence threatening the safety of Taiwan High Speed Rail. Because of the high water consumption, groundwater extraction from agriculture is deemed to be the major cause of the land subsidence and should be well monitored and reduced. However, farmers’ pumping behaviors are highly related to the national water allocation policy, food policy and the socioeconomic factors in the rural area. The top-down agricultural water management might not be sufficient and sustainable. Hence, in this study, we propose a participatory framework for agricultural water management using a Bayesian network. The framework tries to incorporate the main factors that affect decision making among different stakeholders, including the Water Resources Agency, Irrigation Agency, Agriculture and Food Agency, farmers, etc., and represent the causal relationship among factors through Bayes’ theorem, or the conditional probability tables (CPTs). The CPTs are constructed based on data, literature reviews and interviews with stakeholders. The key issues concerning different stakeholders are considered in the framework as well, such as surface water shortage for agriculture, land subsidence, and sustainability of agriculture in Yunlin. The network can be used to hold discussions with stakeholders and show the interactions of their decisions among others. The aim of this framework is to facilitate the discussions and formulate the strategies for sustainable agricultural water management with the aid of the intuitive and transparent structure of the Bayesian network.

How to cite: Lee, S.-Y. and Yu, H.-L.: Using Bayesian network to build a participatory framework for sustainable agriculture water management in Yunlin, Taiwan, EGU General Assembly 2023, Vienna, Austria, 23–28 Apr 2023, EGU23-15459, https://doi.org/10.5194/egusphere-egu23-15459, 2023.

Irrigation plays a crucial role in alleviating the negative effects of drought on crop production. However, increasing competition for water by other sectors, such as industry and domestic use, increases the pressure on available water supplies. Under these circumstances, agricultural producers must be able to manage their available supplies efficiently to optimize irrigation water use. The objective of this research is to develop a decision support system (DSS) for optimizing irrigation scheduling for cotton production using Deep Reinforcement learning (DRL). Our approach uses multiple DRL algorithms that enable an intelligent agent to learn cotton irrigation needs in an interactive environment by trial and error using feedback from its past actions and experiences. Aquacrop is used as an environment (cotton field) simulator and is coupled with a DRL model to simulate crop yield for different actions taken by the agent. Our proposed software estimates the daily irrigation needs of a 7-acre crop field irrigated by a center pivot system located at Clemson University's Edisto Research and Education Center (REC), near Blackville, South Carolina. This new system enables a closed-loop control scheme to adapt the DSS to local perturbations such as soil moisture and rainfall variabilities.

How to cite: Umutoni, L.: An Intelligent Irrigation Decision Support System for Optimizing Cotton Water Use, EGU General Assembly 2023, Vienna, Austria, 23–28 Apr 2023, EGU23-16787, https://doi.org/10.5194/egusphere-egu23-16787, 2023.

EGU23-469 | ECS | PICO | HS7.9 | Highlight

Revegetation impacts on moisture recycling over Loess Plateau in China 

Mingzhu Cao, Weiguang Wang, Lan Wang-Erlandsson, and Ingo Fetzer

Moisture recycling of local water sources through evaporation allows a region to maintain precipitation in the same region. Many studies have shown that deforestation can reduce evaporation and downwind rainfall, and it has been suggested that reforestation conversely increase evaporation and downwind rainfall. Precipitation has been observed to increase over China’s Loess Plateau over the past two decades, coinciding with the start of the Grain for Green project - the largest active revegetation programme attempted in the world. However, the contribution of revegetation to the increase in precipitation is yet unknown. Here, we aim to quantitatively analyze the relationship between revegetation, evaporation, and locally recycled moisture. Based on the ERA5 reanalysis data, we used the modified Water Accounting model-2 layers (WAM-2layers) to track the recycling moisture over the Loess Plateau. Preliminary results indicate that local recycling moisture (Er) accounted for almost one-tenth of the annual precipitation, and seems to have a decreasing trend, which was more evident after 2000. Meanwhile, the contribution of local evaporation to local precipitation appears to decrease during both 1982-1999 and 2000-2015, while the decreasing trend has been slightly amplified after the revegetation. Spatially, Er over the Loess Plateau showed a decreasing trend from southeast to northwest. Significant increasing trend of Er can be identified in the northern part of the plateau during 1982-1999. However, after the implement of the Green for Grain Project, most area over the Loess Plateau showed a decreasing trend, which is significant in the east. Thus, contrary to popular wisdom, the revegetation appears to have led to a decrease in evaporation and subsequent recycling, and the increase in precipitation seems to have other causes. These results are subject to high data uncertainty, and further research is needed to better understand the hydroclimatic effects of revegetation projects under climate change.

How to cite: Cao, M., Wang, W., Wang-Erlandsson, L., and Fetzer, I.: Revegetation impacts on moisture recycling over Loess Plateau in China, EGU General Assembly 2023, Vienna, Austria, 23–28 Apr 2023, EGU23-469, https://doi.org/10.5194/egusphere-egu23-469, 2023.

EGU23-965 | ECS | PICO | HS7.9

Ecohydrological dynamics in the Central American and Andean Páramo: Insights from a modelling analysis using a Budyko-type model for non-stationary conditions 

Germain Esquivel-Hernández, Ricardo Sánchez-Murillo, Giovanny M. Mosquera, Patricio Crespo, Rolando Célleri, Juan Pesantez, Braulio Lahuatte, and Enzo Vargas-Salazar

The Páramo is a high‐elevation tropical grassland ecosystem that plays an important role in the regional water cycle of Central America and the northern Andes. However, refined information about the ecohydrological partitioning in these mountainous biomes is scarce. This work aimed to assess sub-annual or monthly variations in the ecohydrological conditions along a N-S transect with three Páramo sites: Chirripó (Costa Rica) and El Carmen and Cajas (north and south Ecuador, respectively). A Budyko-type model for conditions under which evapotranspiration surpasses precipitation using monthly meteorological observations and evapotranspiration products (May 2016-April 2019) was applied to evaluate short-term ecohydrological dynamics based on the aridity index and precipitation partitioning in the Páramo sites. Stronger hydroclimatic variations were found in Chirripó than in the Andean Páramos, related with significant increments in the evaporative index (AET/P) during the dry season. We also found a clear separation between Chirripó and the Ecuadorian Páramos owing to a higher ecohydrological resilience (i.e., similar trajectories in the energy excess or 1- AET/PET and the water excess or Q/P) in Chirripó during dry season and a more effective regulation by the additional water available to evapotranspiration besides direct precipitation (y0, range: 37 – 90 %). Our results reveal the complex ecohydrological functional properties of the Páramo and its sensitivity to future moisture changes (e.g., ENSO cycles) that could alter its water yield synchronicity. 

How to cite: Esquivel-Hernández, G., Sánchez-Murillo, R., Mosquera, G. M., Crespo, P., Célleri, R., Pesantez, J., Lahuatte, B., and Vargas-Salazar, E.: Ecohydrological dynamics in the Central American and Andean Páramo: Insights from a modelling analysis using a Budyko-type model for non-stationary conditions, EGU General Assembly 2023, Vienna, Austria, 23–28 Apr 2023, EGU23-965, https://doi.org/10.5194/egusphere-egu23-965, 2023.

EGU23-1031 | ECS | PICO | HS7.9

Spatial and temporal patterns and influencing factors of carbon and water cycles in different permafrost types on the Qinghai-Tibet Plateau 

Xiang Wang, Guo Chen, Qi Wu, Longxi Cao, Joseph Awange, and Mingquan Wu

Understanding changes in water use efficiency (WUE) and its drivers in terrestrial ecosystems on the Qinghai-Tibet Plateau is important to reveal the response of carbon and water cycle to climate change in the area sensitive to the environment. However, the patterns of carbon and water cycles in different frozen soil zones in this area are not well understood to our knowledge. This study explores the spatial and temporal patterns of WUE, gross primary production (GPP), and evapotranspiration (ET) from 2001 to 2020 at six frozen soil zones (short-time frozen ground; thin seasonally frozen ground; middle-thick seasonally frozen ground; mountain permafrost; predominantly continuous and island permafrost; predominantly continuous permafrost) on the Qinghai-Tibet Plateau with different degrees of freezing based on remote sensing data. The climatic, edaphic, and botanic parameters influencing these patterns were then investigated. The results show that: (1) the WUE, GPP, and ET all generally increased from 2001-2020 for each type of frozen soil ecosystem although the significance and the slope of the trends differed, (2) the WUE and GPP gradually decreased as the degree of freezing increased, while ET first increased and then decreased with the freezing gradient, and (3) enhanced vegetation index was the first important variable influencing WUE for all types of frozen soil regions except for the area of short-time frozen ground. Our results highlight that the freezing degree of soil could influence the evaluation of the water-carbon cycle on the Qinghai-Tibet Plateau.

How to cite: Wang, X., Chen, G., Wu, Q., Cao, L., Awange, J., and Wu, M.: Spatial and temporal patterns and influencing factors of carbon and water cycles in different permafrost types on the Qinghai-Tibet Plateau, EGU General Assembly 2023, Vienna, Austria, 23–28 Apr 2023, EGU23-1031, https://doi.org/10.5194/egusphere-egu23-1031, 2023.

Water is crucial for human health, food and industrial production, ecosystem services, and climate and weather systems. As a major contributor of renewable freshwater over land, humans have been studying the origin of continental precipitation for nearly a century. From the moisture budget perspective, local evapotranspiration in a vast part of the Earth’s surface is effectively smaller than local precipitation. This entails the role of moisture advection in sustaining continental precipitation. However, previous trajectory-based quantification appeared to underestimate the global “continental precipitation recycling (CPR)” ratio –– that is, the fraction of continental precipitation originating from evapotranspiration. To this end, the present study completed a 40-year (1971-2010) tracking of moisture from continental precipitation using a three-dimensional Lagrangian tracking model and optimized water accounting diagnostics. Our Lagrangian tracking confirms that 62% of continental precipitation stems from evapotranspiration, aligning well with the water budget-based estimates in the literature. Across the globe, non-local terrestrial sources dominate 1˚-scale precipitation in nearly 70% of the land areas, together with the greatest continental moisture feedback in the interior of South America, Africa and Eurasia. Seasonally, the CPR ratio anomalies are markedly different between the mid-to-high latitudes and monsoon regions worldwide, from which two kinds of moisture source-regulated hydroclimate are generalized. For transboundary water governance, perennial source hotspots for continental precipitation are identified, including the biome-rich Amazon and Congo rainforests and other major watersheds within 30˚ equatorward. Leveraging the backward “WaterSip” and the forward “WaterDrip” algorithms, we propose two ubiquitous processes of cascading moisture recycling (CMR) that formulate a cascade of regional water cycles. The watershed-scale CMR metrics quantify the hidden interdependence between the regional water cycles through moisture recycling. Overall, by closing the gap in the estimate of the CPR ratio, this work updates the understanding of the moisture recycling, feedback and cascading characteristics of the continental atmospheric water cycle. The outcome sheds light on the potential vulnerability of local precipitation in response to the modification of non-local land surface fluxes by human activities.

How to cite: Cheng, T. F. and Lu, M.: Updated Understanding of Continental Precipitation Recycling Using Global 3-D Lagrangian Tracking, EGU General Assembly 2023, Vienna, Austria, 23–28 Apr 2023, EGU23-1887, https://doi.org/10.5194/egusphere-egu23-1887, 2023.

EGU23-2768 | ECS | PICO | HS7.9

Hydrological response to anthropogenic activities and climate change in the southern Caspian Sea, Iran 

Alireza Sharifi Garmdareh, Ali Torabi Haghighi, and Ritesh Patro

Rivers play a vital role in supplying fresh water for various sectors. During the last decades, increasing anthropogenic activities and climate change have altered river flow regimes around the globe. Rivers flow in the southern Caspian Sea in Iran has altered due to water-intensive socio-economic development and climate change. To assess and quantify the impact of anthropogenic activities and climate change on river flow regimes, the elasticity-based methods and the Budyko hypothesis were applied to 40 rivers on the closest gauges to the Caspian Sea were selected. Furthermore, to evaluate spatial/temporal change in hydrometeorological variables, two non-parametric methods, including the modified Mann-Kendall method (MK3) and Innovative Trend Analysis (ITA), were applied. The results showed an alarming trend of increasing temperature and potential evapotranspiration and decreasing rivers’ flow in the southern Caspian sea. Assessing and quantifying the impact of anthropogenic activities and climate change on river flow alteration indicated that anthropogenic activities (accounting for 83.3%) played a dominant role in river flow alteration that led to inflow to the Caspian Sea decline by about 2,412 MCM annually. In addition, the inflow to the Sea has decreased by about 551 MCM every year due to the impact of climate change. Decreasing the inflow to the Caspian Sea can accelerate the declining trend of the Sea level, which leads to boosts eutrophication conditions in the Sea, and negatively affect the ecosystem and economics of the Caspian Sea. Therefore, an appropriate adoption approach must be taken into account to alleviate the environmental and socio-economic issues in the southern Caspian Sea.

How to cite: Sharifi Garmdareh, A., Torabi Haghighi, A., and Patro, R.: Hydrological response to anthropogenic activities and climate change in the southern Caspian Sea, Iran, EGU General Assembly 2023, Vienna, Austria, 23–28 Apr 2023, EGU23-2768, https://doi.org/10.5194/egusphere-egu23-2768, 2023.

Irrigation practice has impacts on the natural environment by changing the water and energy balance at the land surface and thereby interacting with the atmosphere. To quantify such impacts and estimate irrigation water demand, process-based hydrological models with a representation of irrigation practice are often used. However, the applicability of existing irrigation schemes is limited to arid and semi-arid regions. Likewise, it is still lack of more sophisticated irrigation schemes that can be particularly applicable to humid regions. This study presents the newly developed Crop-classified Dynamic Irrigation (CDI) scheme that has been two-way coupled into the land surface-hydrologic model Noah-HMS. Such development allows to distinguish the different irrigation practices for "rice" and "non-rice" crops and to estimate irrigation water demand. We have applied the newly developed model to an important grain and industrial crop production base in southern China, namely, Poyang Lake Basin (PLB), where the sown area of rice accounts for more than 60% of the sown area of all crops. As compared to the widely used, traditional Dynamic Irrigation (DI) scheme, the CDI-incorporated Noah-HMS improves the simulations of water and energy balance over the PLB from 2007 to 2015, especially irrigation water amount simulation. The relative error for irrigation water amount of CDI (DI) is -18.1% (-56.8%). In terms of surface water balance, the inclusion of irrigation practice has larger impacts on the simulated soil moisture (+1.7%) during dry years than that (+0.9%) during wet years, while has larger impacts on the simulated surface runoff (4.6%) in wet years than that (2.4%) in dry years. In terms of surface energy balance, irrigation practice leads to increased latent heat flux by 0.9 W/m2 (1.4%), decreased sensible heat flux by 0.5 W/m2 (1.3%), decreased ground heat flux by 0.02W/m2 (5.0%), and increased net radiation by 0.09 W/m2 (0.1%). Such impacts on the surface water and energy balance become more pronouncing at local scale especially over the intensively irrigated areas, for example the Nanchang city region. We conclude that our Crop-classified Dynamic Irrigation scheme is especially beneficial for applications in multiple cropping humid regions. Furthermore, our modeling development has the potential to be further extended into the fully coupled atmospheric-hydrologic modeling systems with a more holistic representation of human activities.

How to cite: Yang, Q., Wei, J., Yang, C., and Yu, Z.: Impacts of Farmland Irrigation on Land Surface Water and Energy Balance over a Humid Region: Development and Benefits of a Crop-Classified Dynamic Irrigation Scheme in Noah-HMS, EGU General Assembly 2023, Vienna, Austria, 23–28 Apr 2023, EGU23-4290, https://doi.org/10.5194/egusphere-egu23-4290, 2023.

EGU23-5016 | PICO | HS7.9 | Highlight

Moisture Recycling in the Amazon: a study using WRF with water vapor tracers 

Francina Domínguez and Jorge Eiras-Barca

This work analyzes the sources, sinks and stores of moisture that originates as Amazonian evapotranspiration (ET) from daily to annual timescales. To do this, we use the Weather Research and Forecast (WRF) regional meteorological model with the added capability of water vapor tracers to track the local evapotranspired moisture. The tracers reveal a strong diurnal cycle of Amazonian water vapor which had not been previously reported. This signal is related to the diurnal cycle of ET, convective precipitation and advected moisture. ET's contribution to atmospheric moisture increases from early morning into the afternoon. Some of this moisture is rained out through convective storms in the early evening. Later in the night and following morning, strong winds associated with the South American Low Level Jet advect moisture downwind. The beating pattern becomes apparent when visualizing the Amazonian water vapor as an animation.

How to cite: Domínguez, F. and Eiras-Barca, J.: Moisture Recycling in the Amazon: a study using WRF with water vapor tracers, EGU General Assembly 2023, Vienna, Austria, 23–28 Apr 2023, EGU23-5016, https://doi.org/10.5194/egusphere-egu23-5016, 2023.

EGU23-6508 | PICO | HS7.9 | Highlight

Assessing the impact of large-scale afforestation on the atmospheric water cycle of the Loess Plateau in China 

Lei Tian, Shuoyu Chen, Baoqing Zhang, and Baotian Pan

Afforestation has been regarded as an appropriate way to mitigate climate change and enhance ecosystem services. How afforestation affects the availability of water resources is a hot topic in the science community. Most current studies investigate the impact of afforestation on water resources through offline modeling or observation on a small spatial scale. However, the atmospheric water cycle (AWC) is also an important aspect that can alter the availability of water resources, especially on a large spatial scale. With an investment of about US$54.57 billion, the Chinese government implemented the world’s largest afforestation project, the Grain for Green Program (GFGP), to curb the severe soil erosion over the Loess Plateau (LP) since 1999. Here we focused on this ideal platform, the LP, to explore the impact of large-scale afforestation on the processes related to the atmospheric water cycle. We adopted two different approaches to discern the hydroclimatic effect of the GFGP. This first approach used the reanalysis dataset to compare the hydroclimatic states before (1982–1998) and after (1999–2018) the GFGP. Since the reanalysis dataset cannot separate the impact of climate change and afforestation, this study also applied a regional climate model (the Weather Research & Forecasting Model, WRF) to isolate the net hydroclimatic effect of the GFGP by controlled experiments. In particular, the WRF model was driven by two land surface conditions with/without the implementation of the GFGP. We found both approaches reached similar conclusions. Results show the vegetation coverage fraction over the LP increased by 3.15% decade−1 induced by the GFGP. The climatological precipitation and evapotranspiration (ET) increased by 54.62 and 22.56 mm, respectively, after starting the GFGP in 1999. The large-scale afforestation intensifies the atmospheric water cycle over the LP. In addition, based on the dynamic precipitation recycling model, we also found the precipitation recycling ratio approximately increased by 1%. The GFGP alters the regional circulation by influencing diabatic heating, and moisture convergence, resulting in more moisture being advected from the south boundary, thus more atmospheric moisture was retained in the LP. Additionally, the internal branch of the AWC contributes to about 15% of the increased precipitation, while the contribution of the external branch is about 85%. Moreover, the GFGP remotely affects the water vapor budget in the downwind areas. Our work enriched the current understanding of how afforestation affects the water cycle from a precipitation recycling perspective and can help policy-makers to make science-informed afforestation strategies.

How to cite: Tian, L., Chen, S., Zhang, B., and Pan, B.: Assessing the impact of large-scale afforestation on the atmospheric water cycle of the Loess Plateau in China, EGU General Assembly 2023, Vienna, Austria, 23–28 Apr 2023, EGU23-6508, https://doi.org/10.5194/egusphere-egu23-6508, 2023.

EGU23-6883 | ECS | PICO | HS7.9 | Highlight

Local moisture recycling across the globe 

Jolanda Theeuwen, Arie Staal, Obbe Tuinenburg, Bert Hamelers, and Stefan Dekker

Atmospheric moisture recycling describes how moisture evaporated from land precipitates over land. It explains how shifts in terrestrial evaporation due to land cover changes may affect precipitation and freshwater availability across scales. Recycling at regional and continental scales has been studied using different methods, such as offline and online moisture tracking models and bulk recycling models. Although recycling at regional and continental scales is relatively well understood, it has only recently become possible to study local moisture recycling across the globe. Recent developments in offline moisture tracking resulted in a dataset including a 10-year climatology (2008-2017) of atmospheric moisture connections from evaporation source to precipitation sink at a spatial scale of 0.5° (Tuinenburg et al., 2020). We used this data to calculate the local moisture recycling ratio, which we define as the fraction of evaporated moisture that precipitates within a distance of 0.5° (typically 50 km) from its source. Furthermore, we identify variables that correlate with the local moisture recycling ratio to assess its underlying processes. On average, 1.7% (st. dev. = 1.1%) of terrestrial evaporated moisture returns as local precipitation annually. However, there is large spatial and temporal variability with peak values over mountainous and wet regions and in summer. Wetness (i.e., precipitation and precipitation minus evaporation), orography, latitude, convective available potential energy, wind speed and total cloud cover have moderate to strong correlations with the local moisture recycling ratio. Interestingly, we find peaks in the local moisture recycling ratio at latitudes where air ascends due to the Hadley cell circulation (i.e., at 0° and 60°). These results suggest that wet regions characterized by ascending air and low wind speeds are favourable for high local moisture recycling ratios. This knowledge can be used to strategically recycle water using nature-based solutions or irrigation to minimize the usage of freshwater availability. For example, for the tropics and mountainous regions globally, and for the Mediterranean regions on the Northern Hemisphere, an increase in evaporation through for example, regreening has a relatively large contribution to local precipitation due to the relatively large local moisture recycling ratios here. These results suggest the potential to enhance freshwater availability with land cover changes, e.g., regreening.


References

Tuinenburg, Obbe A., Jolanda J.E. Theeuwen, and Arie Staal. "High-resolution global atmospheric moisture connections from evaporation to precipitation." Earth System Science Data 12.4 (2020): 3177-3188.

How to cite: Theeuwen, J., Staal, A., Tuinenburg, O., Hamelers, B., and Dekker, S.: Local moisture recycling across the globe, EGU General Assembly 2023, Vienna, Austria, 23–28 Apr 2023, EGU23-6883, https://doi.org/10.5194/egusphere-egu23-6883, 2023.

EGU23-7687 | ECS | PICO | HS7.9

Towards using multi-dimensional structures in climate variables to detect anthropogenic changes 

Marius Egli, Sebastian Sippel, Vincent Humphrey, and Reto Knutti

Precipitation (P) and evapotranspiration (ET) play a crucial role in the water cycle and have a significant impact on water resources and the energy balance of the Earth's surface. However, it remains a challenge, in particular on regional scales, to detect changes in hydrological variables and attribute them to anthropogenic or natural influences. Traditional studies that aim to detect or attribute changes in atmospheric variables often consider only a single variable at a time. This makes detecting changes in hydrological variables challenging due to large internal variability, the lack of long-term observational coverage and partly poor mechanistic understanding of land-atmosphere coupling processes in a changing climate.


However, because P and ET are related to various other atmospheric variables, such as temperature, humidity, and sea level pressure, the detection of anthropogenic influences may be conducted in principle within a broader multivariate space. Here, we aim at exploiting multivariate relationships to more robustly detect anthropogenic changes to the hydrological cycle at the regional or up to continental scale. We train statistical models from coupled Earth system models to learn the relationships between relatively well observed variables and more poorly observed ones, like P and ET. We demonstrate that such models can predict and extract patterns of forced change in P and ET, albeit somewhat contingent on the realism of the simulation of the Earth system model. The main advantage is that the method does not rely on sparse observations of P and ET, and instead relies on covariates which are more abundantly and reliably observed.


We demonstrate the effectiveness of this approach in a climate-model-as-truth framework, showing that it can capture a wide range of possible hydrological responses produced by the different climate models. We also apply the statistical model to observations to identify forced changes in P and ET that have already occurred. For example, we see an increase in ET in the northern hemisphere likely induced by a reduction in aerosol emissions. Our results show that this method can infer changes in P and ET that may have taken place, in principle even without the need for direct observations of those variables and can provide constrained projections of future water resources and energy balance.

How to cite: Egli, M., Sippel, S., Humphrey, V., and Knutti, R.: Towards using multi-dimensional structures in climate variables to detect anthropogenic changes, EGU General Assembly 2023, Vienna, Austria, 23–28 Apr 2023, EGU23-7687, https://doi.org/10.5194/egusphere-egu23-7687, 2023.

EGU23-7867 | ECS | PICO | HS7.9 | Highlight

The importance of the plant physiological response to rising CO2 in projections of future water availability 

Jessica Stacey, Richard Betts, Andrew Hartley, and Lina Mercado

Reliable and useful future projections of water scarcity are vital for incorporating into climate policy and national adaptation plans for building climate resilience. However, projections of water scarcity are often based on hydrology models which do not include an important climate feedback affecting the water cycle: the response of plant physiology to rising atmospheric CO2, or “physiological forcing”. With higher atmospheric CO2, plant physiology can affect the water cycle in two contradictory ways. Plant stomata do not open as widely in higher CO2, and therefore transpiration rates are lower, leaving relatively more water in the ground increasing runoff and soil moisture. However, faster rates of photosynthesis with higher CO2 also encourages greater leaf area, and thus higher overall canopy transpiration (even though transpiration of an individual stomata still decreases). The influence of physiological forcing on physical quantities within the water cycle such as transpiration and runoff have been well studied; however, there is a requirement to quantify how this translates to human impacts and more policy-relevant metrics on water resources, such as the water scarcity index. I will present findings from experiments using the Joint UK Land Environmental Simulator (JULES) forced with four earth system models which quantify and highlight the importance of including the plant physiological response in water-related impact studies.

How to cite: Stacey, J., Betts, R., Hartley, A., and Mercado, L.: The importance of the plant physiological response to rising CO2 in projections of future water availability, EGU General Assembly 2023, Vienna, Austria, 23–28 Apr 2023, EGU23-7867, https://doi.org/10.5194/egusphere-egu23-7867, 2023.

EGU23-7976 | ECS | PICO | HS7.9 | Highlight

Modeling the Impacts of Deforestation: local drying of the atmosphere and potential effect on downwind precipitation. 

Clément Devenet, Nathalie de Noblet, Catherine Ottlé, Nicolas Viovy, and Frédérique Chéruy

The Amazon rainforest is a vital component of the hydrological cycle of South America. Its evapotranspiration is an essential supply of atmospheric moisture for precipitation in more southern regions of the continent. The potential impacts of deforestation on precipitation in these distant regions are yet not fully understood.

The present research project aims at quantifying the deficit of evapotranspiration occurring at the location of deforestation, focusing on the southern part of Amazonia, which has experienced intense deforestation since the 80s. We first use the ORCHIDEE land surface model forced with the reanalysis dataset CRU-JRA to simulate the impacts of an imposed land cover change: from observed states of vegetation cover to a massive extension of croplands. The ORCHIDEE model computes all the components of evapotranspiration, giving, in turn, the expected deficit of atmospheric moisture at the location of the land cover change.

Then, thanks to existing datasets connecting any place on Earth with the area that supplies its moisture through the atmosphere, we link this deficit with downwind locations highly dependent on this upwind evapotranspiration for its precipitation. From there, we draw hypotheses about the potential changes in precipitation amounts and seasonality.

In the project’s second phase, these hypotheses are tested against land-atmosphere coupled simulations produced with the IPSL global climate model, nudged to winds from the ERA5 reanalysis. The model grid is zoomed on the South American continent to better describe the atmospheric transport in the region. The land-atmosphere coupled simulations provide information on the atmospheric feedback induced by the land cover change, confirming or invalidating the hypotheses. Since land cover affects not only water fluxes but also energy fluxes, the coupled model experiments give us insights into the atmospheric processes at stake, the changes in cloudiness and local convection, and the potential shifts in precipitation location or timing.

How to cite: Devenet, C., de Noblet, N., Ottlé, C., Viovy, N., and Chéruy, F.: Modeling the Impacts of Deforestation: local drying of the atmosphere and potential effect on downwind precipitation., EGU General Assembly 2023, Vienna, Austria, 23–28 Apr 2023, EGU23-7976, https://doi.org/10.5194/egusphere-egu23-7976, 2023.

EGU23-8061 | ECS | PICO | HS7.9

Exploring the human influence on surface water availability in the contiguous United States 

Sara Alonso Vicario, Maurizio Mazzoleni, and Margaret Garcia

Finding which factors control the spatial variability of surface runoff is fundamental for assessing regional surface water availability. These controlling factors drive the water balance and vary from physio-climatic catchment attributes to anthropogenic activities. A few studies evaluated these factors in the Contiguous United States on catchments with non-human influence (Abatzoglou & Ficklin, 2017). Yet, a comprehensive analysis of the human influence on surface water availability is still missing.

Here, we employed a parametric Budyko-based framework to assess the long-term runoff sensitivity in the last 30 years of 502 catchments in the Contiguous United States. We linked the Budyko-based framework's landscape parameter with an extensive set of 50 climatic, topographic, anthropogenic, and soil factors that were previously found influential on partitioning precipitation into evapotranspiration and runoff. The catchments belong to the GAGES-II database (Falcone, 2010) and have been grouped in reference and human-impacted basins (urban and agricultural) using the most updated land cover data of 2019. A stepwise multiple linear regression model is developed to find the most significant factors in the partitioning depending on the most extensive human activity on the basin and assess their interactions. Also, we analyzed how anthropogenic activities (e.g., irrigated agriculture, urban settlements) alter the effect of climate variables.

Preliminary results suggest that cultivated land is the second most important factor in explaining runoff variability in agricultural basins, and urban settlements increase the runoff in catchments with a high interannual variability of precipitation.


References

Abatzoglou, J. T., & Ficklin, D. L. (2017). Climatic and physiographic controls of spatial variability in surface water balance over the contiguous United States using the Budyko relationship. Water Resources Research, 53(9), 7630–7643. https://doi.org/10.1002/2017WR020843

Falcone, J. A., Carlisle, D. M., Wolock, D. M., & Meador, M. R. (2010). GAGES: A stream gage database for evaluating natural and altered flow conditions in the conterminous United States. Ecology, 91(2), 621–621. https://doi.org/10.1890/09-0889.1

How to cite: Alonso Vicario, S., Mazzoleni, M., and Garcia, M.: Exploring the human influence on surface water availability in the contiguous United States, EGU General Assembly 2023, Vienna, Austria, 23–28 Apr 2023, EGU23-8061, https://doi.org/10.5194/egusphere-egu23-8061, 2023.

EGU23-10635 | PICO | HS7.9

Uncertainties in global future projection of potential evapotranspiration using SSP scenarios 

Young Hoon Song, Eun-Sung Chung, Seung Taek Chae, and Jin Hyuck Kim

Evapotranspiration (ET) is the amount of water lost from the global surface, and it represents water and Earth's energy cycle. The intensity and frequency of climate variables have been changed because of the ongoing climate crisis, leading to increased climate disasters, such as heat waves and droughts. The abrupt climate crisis affects the variation of ET because climate variables highly influence ET. However, the future potential ET (PET) estimates include various uncertainty resulted from the variations in the projection of climate variables. In this context, the uncertainty in the projected future PETs should be quantified for the high reliability. Therefore, this study projected future global PET using Penman-Monteith (PM) for the near (2031-2065) and far (2066-2100) futures and quantified the corresponding uncertainty. The six climate variables of 14 CMIP6 GCMs were used for estimating historical PET which were compared to those from the NCEP/NCAR reanalysis data using the five evaluation metrics. The changes in PETs for four Shared Socio-economic Pathways (SSPs) scenarios were calculated for the near and far futures compared to the historical period (1980-2014). Subsequently, the uncertainties of PETs were quantified using the reliability ensemble average method. As a result, the future PET in high latitudes showed the most significant variability compared to the other latitudes. The future PET in the southern hemisphere was higher than the historical PET. Especially the PET in the mid-latitudes of southern hemisphere was the highest among the other latitudes. In addition, the uncertainty of PET was the highest in the high latitudes of the northern hemisphere while the mid-latitude in the northern was the lowest. This study provides insight into evaluating the global water cycle based on PET and helps establish appropriate policies for climate impact assessment.

How to cite: Song, Y. H., Chung, E.-S., Chae, S. T., and Kim, J. H.: Uncertainties in global future projection of potential evapotranspiration using SSP scenarios, EGU General Assembly 2023, Vienna, Austria, 23–28 Apr 2023, EGU23-10635, https://doi.org/10.5194/egusphere-egu23-10635, 2023.

EGU23-10652 | ECS | PICO | HS7.9

Atmospheric moisture exchanges between the Magdalena River basin and its surroundings. 

Paola Andrea Giraldo Ramirez, Ruben Dario Molina Santamaria, and Juan Fernando Salazar Villegas

Atmospheric moisture transport is a fundamental process in the climate system, critical for the hydrological cycle and water security on land. Moisture exchanges between a basin and its surroundings determine water availability and may change over time due to climate change and other human impacts. Understanding how and why these atmospheric fluxes change under global change is critical for river basins supporting water security in different regions. Here we focused on the Magdalena River basin in northwestern South America, a critical basin for water and energy security in Colombia. We quantified moisture exchanges for the entire watershed and different segments (defined by the boundaries between neighboring basins). We used monthly data between 1979 and 2021 from the ERA5 reanalysis to look for possible changes, including trends. Our results provide new insights into the dynamics of moisture exchanges between the basin and its surroundings. In addition, we found evidence of statistically significant trends likely related to anthropic effects, mainly deforestation and climate change. These results have implications for water security analyses in this region, where there are few studies of this type, and simultaneously generate new insights for decision-making related to water management and transboundary water security in the Magdalena river basin.

How to cite: Giraldo Ramirez, P. A., Molina Santamaria, R. D., and Salazar Villegas, J. F.: Atmospheric moisture exchanges between the Magdalena River basin and its surroundings., EGU General Assembly 2023, Vienna, Austria, 23–28 Apr 2023, EGU23-10652, https://doi.org/10.5194/egusphere-egu23-10652, 2023.

EGU23-12671 | ECS | PICO | HS7.9 | Highlight

WRF with age-weighted water tracers: implementation, application, and new insights into the regionally accelerated atmospheric hydrological cycle under global warming 

Jianhui Wei, Joël Arnault, Thomas Rummler, Benjamin Fersch, Zhenyu Zhang, Patrick Olschewski, Patrick Laux, and Harald Kunstmann

Atmospheric water residence time, here defined as time between the original evaporation and the returning of its respective water masses to the land surface as precipitation, is a measure of the speed of the atmospheric hydrological cycle. Traditional analytical methods are generally limited by crude assumptions in the coupling between the land surface and the atmosphere, and hence are not applicable to regions with complex monsoon systems under a changing climate. To this end, we have implemented the age-weighted water tracers into the Weather Research and Forecasting WRF model, namely, WRF-age, to follow the atmospheric water pathways and to derive atmospheric water residence times accordingly. The newly developed, physics-based WRF-age is used to regionally downscale the reanalysis of ERA-Interim and the MPI-ESM Representative Concentration Pathway 8.5 scenario (RCP8.5) simulation for an East Asian monsoon region, i.e., the Poyang Lake basin, for two 10-year slices of historical (1980-1989) and future (2040-2049) times. In comparison to the historical WRF-age simulation, the future 2-meter air temperature rises by 1.3 °C and precipitation decreases by 38% under RCP8.5 on average. In this context, global warming leads to decreased atmospheric residence times of the column-integrated water vapor (from 22 to 13 hours) and column-integrated condensed moisture (from 26 to 14 hours) in the atmosphere over the basin, but slightly increased atmospheric residence times of surface precipitation (from 12 to 15 hours) in agreement with reduced the precipitation amounts. Our findings demonstrate that global warming increases the complexity of regional atmospheric water cycle, especially the associated changes in the residence times of atmospheric water states of matter.

How to cite: Wei, J., Arnault, J., Rummler, T., Fersch, B., Zhang, Z., Olschewski, P., Laux, P., and Kunstmann, H.: WRF with age-weighted water tracers: implementation, application, and new insights into the regionally accelerated atmospheric hydrological cycle under global warming, EGU General Assembly 2023, Vienna, Austria, 23–28 Apr 2023, EGU23-12671, https://doi.org/10.5194/egusphere-egu23-12671, 2023.

EGU23-12775 | PICO | HS7.9

Introducing project ITHACA: Investigation of the Terrestrial HydrologicAl Cycle Acceleration 

Yannis Markonis, Mijael Rodrigo Vargas Godoy, Johanna Blöcher, Riya Dutta, Shailendra Pratap, Rajani Pradhan, Alexander Kazantsev, Petr Bašta, Akbar Rahmati, Arnau Sanz i Gil, Vishal Thakur, Hossein Abbasizadeh, Oldřich Rakovec, Martin Hanel, Petr Máca, Rohini Kumar, and Simon Papalexiou

ITHACA is a 5-year project that aims to benchmark the terrestrial water cycle intensification. Our goal is to estimate the past range of the hydrological cycle variability, determine the present state of its acceleration, and understand its future impacts on the terrestrial water availability. To achieve this, we combine multi-source data products, stochastic analysis, and process-based hydrological modeling from regional to global scale. Here, we present the preliminary results after the completion of its first year, which come with multiple homogenized datasets of water cycle components, R software packages for data pre-processing and data-driven analyses, and methodological suggestions and insights for the cross-scale quantification of water cycle changes. We also discuss the current challenges and the future steps of the project, highlighting the numerous opportunities for active collaboration.  

How to cite: Markonis, Y., Vargas Godoy, M. R., Blöcher, J., Dutta, R., Pratap, S., Pradhan, R., Kazantsev, A., Bašta, P., Rahmati, A., Sanz i Gil, A., Thakur, V., Abbasizadeh, H., Rakovec, O., Hanel, M., Máca, P., Kumar, R., and Papalexiou, S.: Introducing project ITHACA: Investigation of the Terrestrial HydrologicAl Cycle Acceleration, EGU General Assembly 2023, Vienna, Austria, 23–28 Apr 2023, EGU23-12775, https://doi.org/10.5194/egusphere-egu23-12775, 2023.

EGU23-13142 | PICO | HS7.9

An engineering approach to land-surface controlled convective precipitation 

Sarah Warnau and Bert Hamelers

In the summer of 2022, several records of hot and dry conditions were broken in Europe, resulting in problems of water availability that are projected to increase further, especially in the Mediterranean basin. The reason for this drying trend is twofold: There is a reduction in precipitation, and an increase in evaporative demand due to climate warming. For climate mitigation and adaptation, solutions are needed to counteract this drying trend. A technological innovation that can be considered is enhancing surface evaporation by evaporating sea water using solar energy. The aim of this research is to examine whether this technology can potentially be used to address the reduction in precipitation. Therefore, we study under which conditions enhanced surface evaporation leads to more convective precipitation and how much water is required to achieve this.

For convective precipitation to occur, several conditions must be met. These include the atmospheric boundary layer (ABL) crossing the lifting condensation level (LCL), moist air parcels reaching their level of free convection (LFC), and the convective available potential energy (CAPE) surpassing a certain threshold (e.g. 400 J/kg). These conditions can be affected by turbulent fluxes of heat and moisture from the surface. Here we use a zero-dimensional mixed layer "slab" model which describes the evolution of the convective ABL height up to the LCL-crossing and the potential temperature and specific humidity of the mixed layer. From this model we obtain an implicit analytical relationship between the integrals of surface fluxes of heat and moisture that cause the LCL and ABL to cross. The relationship between these integrated surface fluxes varies depending on the initial and free atmospheric conditions.

As a case study, we examine the Ebro basin in northeastern Spain. We use the analytical expression of the LCL-crossing with the observational data from the LIAISE campaign to estimate:

  • how many days during the 2021 summer months could enhanced surface evaporation theoretically have led to an LCL-crossing,

  • the amount of water required in such cases, and

  • the changes to the LFC and CAPE that this evaporation enhancement could cause.

Preliminary results indicate that the LCL-crossing relationship between the integrated surface fluxes strongly depends on the initial and free atmospheric temperatures. This has implications for the areas where the technology could potentially benefit the water availability. Since convective precipitation is only controlled by the surface under specific atmospheric conditions, climate warming can cause areas to go from surface controlled to being too hot for the technology to be able to trigger convective precipitation.

Our research provides a preliminary assessment of the potential of this technology to counteract the drying trend in the Mediterranean basin. Further research is needed to evaluate the amount of precipitation that can be expected from the technology, as well as the effects of the technology on local evaporative demand, evapotranspiration, and heat stress.

How to cite: Warnau, S. and Hamelers, B.: An engineering approach to land-surface controlled convective precipitation, EGU General Assembly 2023, Vienna, Austria, 23–28 Apr 2023, EGU23-13142, https://doi.org/10.5194/egusphere-egu23-13142, 2023.

EGU23-13426 | ECS | PICO | HS7.9

Upwind land-use change impacts on wetland vulnerability 

Simon Felix Fahrländer, Lan Wang-Erlandsson, Agnes Pranindita, Lauren Seaby Andersen, and Fernando Jaramillo

Research on the protection and preservation of wetlands has traditionally focused on direct human drivers and impacts of climate change occurring in their upstream hydrological basin. However, since precipitation falling in the hydrological basin comprises both oceanic and terrestrial evaporation originating mostly outside of the basin boundaries, upwind land use and hydroclimatic changes affecting this supply of precipitation also need to be assessed. This study assesses the vulnerability of 40 wetlands of international importance to land use and hydroclimatic changes occurring upwind (i.e., in their precipitationsheds). We here use a dataset containing atmospheric moisture flows in combination with evaporation from natural and current vegetation to analyse the impact of extra-basin vegetation changes on the precipitation over the wetland basins. The analysis shows that historical land-use conversion has already caused reduced incoming precipitation into most wetland hydrological basins. The strongest effects are seen in (sub)tropical wetlands in South America, Africa and Asia and especially those located downwind of large agricultural areas. Based on our results and current wetland decline rates, we find that wetland sites in China, India, South America and Sub-Saharan Africa are especially threatened by hydroclimatic and vegetation changes outside of their basins. Additionally, larger basins appear to be more reliant on evaporation from within their basin boundaries than smaller hydrological basins. Using wetland ecosystems as an exemplary case, this study stresses the need to incorporate downwind effects to land-use changes in sustainable ecosystem management approaches. Since the transition from potential natural vegetation to agricultural land is often associated with changes in evaporation, land conversion may affect the resilience of wetland water availability. Following this analysis of the upwind moisture sources of wetland basins, future studies should investigate the potential effect of wetland loss on downwind precipitation patterns.

How to cite: Fahrländer, S. F., Wang-Erlandsson, L., Pranindita, A., Andersen, L. S., and Jaramillo, F.: Upwind land-use change impacts on wetland vulnerability, EGU General Assembly 2023, Vienna, Austria, 23–28 Apr 2023, EGU23-13426, https://doi.org/10.5194/egusphere-egu23-13426, 2023.

EGU23-13859 | PICO | HS7.9

Collaborative moisture tracking with WAM2layers v3 

Peter Kalverla, Imme Benedict, Ruud van der Ent, and Chris Weijenborg

Atmospheric moisture tracking is a valuable technique for understanding the physical processes that drive (extreme) precipitation and drought in our changing climate. By following where precipitated moisture originally evaporated (backtracking) or where evaporated moisture eventually precipitates (forward tracking) we can gain valuable insights into the connection of large-scale weather systems and hydrometeorological events, land-atmosphere interactions, or the impact of land-use changes on water availability.

The WAM2layers model is an Eulerian moisture tracking code that solves the water balance equation for tagged moisture in gridded model output data. With the increasing resolution of weather and climate models, however, data handling and performance have become serious constraints. Over the past year, we have worked on a new version of WAM2layers (github.com/WAM2layers/WAM2layers), in which we tackle these computational challenges and make a substantial upgrade to the user- and developer-friendliness of the model. The most important changes are summarized below.

Usability: the new version of WAM2layers separates configuration from code. This makes it possible to run many different model simulations without modifying the source code. The model can now be run with a single command, supplying a configuration file as an input argument. It is even possible to use the model without copying the code. Simply install the wam2layers Python package from PyPI.

Modularity: we have made a stricter separation between preprocessing steps, the actual tracking code, and utilities for analysing the results. This is important, for example, for working with multiple datasets. So far, we've worked with ERA5 data. Adding support for other datasets requires no modifications to the tracking code, only a separate preprocessing script.

Documentation: the new version of the model comes with documentation on ReadTheDocs. The documentation includes theory, installation instructions, a complete user guide, and contributing guidelines.

Collaborative development: previous versions of the model were already available on GitHub, but further development often happened offline and without coordination. From the start of this project, we have opened up the development process such that everyone can ask questions, raise issues, and open pull requests. The brand-new documentation includes instructions for anyone willing to contribute. We believe this shift represents a modern perspective on collaborative research practice.

How to cite: Kalverla, P., Benedict, I., van der Ent, R., and Weijenborg, C.: Collaborative moisture tracking with WAM2layers v3, EGU General Assembly 2023, Vienna, Austria, 23–28 Apr 2023, EGU23-13859, https://doi.org/10.5194/egusphere-egu23-13859, 2023.

EGU23-1089 | Orals | CR6.1

Glacial hot spots for sediment supply during global warming: a case study from the Eastern Italian Alps 

Sara Savi, Francesco Comiti, and Manfred Strecker

Glacial and proglacial zones of high-mountain regions are among the areas most affected by the ongoing climate warming. Rising temperatures accelerate glacial retreat and the degradation of permafrost, with a consequent increase of instability of steep rock walls, moraines, and slopes. This may increase sediment production that could either contribute to the debris cover of the retreating glaciers, or to an increase in the amount of sediment being transported through the proglacial zone and the more distant fluvial system. The contribution of a proglacial area to the total amount of sediment that exits a basin, however, depends on many factors and it is not yet clear, if sediment supply from such areas will continue to increase or decrease in future. Filling this knowledge-gap is crucial to be able to predict the transport capacity of glacial-fed fluvial systems, especially in relation to possible related hydrogeological hazards.

By analyzing aerial photographs and high-resolution digital surface models from a proglacial area in the Eastern Italian Alps, we demonstrate that these sources of sediment are intimately coupled with the position of the glacier through time; this also applies to the newly formed channel reaches that have evolved following glacial retreat. It follows that sediment sources can be “switched on” or “switched off” in relative short time periods, which are primarily influenced by climate-driven environmental change. Such a pulsed sediment production thus generates waves of sediment that may be entrained by the fluvial system depending on water availability and transport capacity. As such, a detailed and robust forecast of sediment yield for future scenarios may be possible if the spatial and environmental changes associated with glacier retreat and newly formed channel network are monitored and assessed.

How to cite: Savi, S., Comiti, F., and Strecker, M.: Glacial hot spots for sediment supply during global warming: a case study from the Eastern Italian Alps, EGU General Assembly 2023, Vienna, Austria, 23–28 Apr 2023, EGU23-1089, https://doi.org/10.5194/egusphere-egu23-1089, 2023.

EGU23-1630 | ECS | Posters on site | CR6.1

Quantification of water flow in permafrost rock walls 

Riccardo Scandroglio, Samuel Weber, Till Rehm, and Michael Krautblatter

Here we present the first multi-annual study in periglacial environments quantifying and characterizing water accumulation in bedrock joints with the help of lysimeters, weather data, snowmelt modeling and gravimetric monitoring.

Continuous measurements allow to detect the timing and to estimate the quantity of water accumulations. These can easily generate significant hydrostatic pressures in sealed clefts and are one of the most important but less understood contributors to slope destabilization. Due to the recent increase of temperatures and the consequent deepening of active layers, it is expected that the influence of water will increase and potentially lead to bigger instabilities, dangerous for people and expensive for infrastructures.

Measurements have been conducted at Mount Zugspitze (Germany/Austria, 2962 m a.s.l.). Hourly cleft water discharge was recorded in a tunnel by two lysimeters-like loggers, high frequency weather data from the summit were provided by the German Meteorological Service and snow measurements from the plateau were obtained from the Bavarian Avalanche Service. Monthly measurements with a relative spring gravimeter Scintrex CG-5 were conducted in the tunnel together with the TUM Institute of Astronomical and Physical Geodesy to monitor water mass changes. Additionally, our temperature loggers and electrical resistivity tomographies recorded permafrost degradation, while a geological mapping provided a detailed cleft structure of the location.

Water flowing in the tunnel comes predominantly from clefts as the Wetterstein limestone exhibits very low porosity and permeability. Over the complete time of investigation, two repeating phases can be clearly distinguished. (i) Snowmelt from April to July provides the highest discharge rates, up to 800 l/d. These measures are well in agreement with the hourly melting rates obtained by the model Snowpack (SLF). Saturation of bedrock and clefts is at its maximum during this period and temperatures are constantly around 0°C, so that water-ice processes are expected to dominate slope stability. (ii) Rainfall events, normally present only from June to September, deliver smaller quantities of water since they mainly have high intensity but short duration. Nevertheless, due to a clear separation between events, it is possible to detect water flow continuing several days after the end of the rainfall, a clear evidence of water accumulation.

Although direct measure of hydrostatic pressures in single clefts remains an open challenge, this benchmark study provides measures on fluid flow and quantitative estimate on water accumulation leading to hydrostatic pressure in bedrock permafrost. Improving the knowledge of slope internal thermal-hydrological dynamics in periglacial environments can help understanding disastrous slope failures.

How to cite: Scandroglio, R., Weber, S., Rehm, T., and Krautblatter, M.: Quantification of water flow in permafrost rock walls, EGU General Assembly 2023, Vienna, Austria, 23–28 Apr 2023, EGU23-1630, https://doi.org/10.5194/egusphere-egu23-1630, 2023.

EGU23-2549 | ECS | Orals | CR6.1

Increasing cryospheric hazards and sediment supply threaten water quality and hydropower systems in high mountain areas 

Dongfeng Li, Xixi Lu, Desmond Walling, Ting Zhang, Jakob Steiner, Robert Wasson, Harrison Stephan, Santosh Nepal, Yong Nie, Walter Immerzeel, Dan Shugar, Michèle Koppes, Stuart Lane, and Tobias Bolch

Global warming-induced melting and thawing of the cryosphere are rapidly changing hydrogeomorphic processes and cryospheric hazards in high mountain areas worldwide. These processes and hazards include glacial retreat and collapses, permafrost thaw and associated landslides, rock-ice avalanches, debris flows, and outburst floods from glacier lakes and landslide-dammed lakes. The changing slope instability and extreme flood have accelerated landscape erosion and increased fluvial sediment loads. For example, the rivers in High Mountain Asia are becoming muddier due to increased suspended particulate matters from melting glaciers and thawing permafrost, likely degrading water quality as fine-grained sediment are easily bonded with organic carbon, phosphorus and most heavy metals (e.g., mercury, chromium, arsenic and lead). Importantly, numerous hydropower dams and reservoirs are under construction or planning in high-mountain areas worldwide such as in the Himalaya and Andes. The increasing amounts of mobilized sediment can fill up reservoirs, cause dam failure, and degrade power turbines, threatening the short-term safety and longer-term sustainability of these hydropower systems.

In the future, we recommend forward-looking design and maintenance solutions that can help transition towards climate change-resilient high-quality water supply and hydropower systems in high-mountain areas. The specific suggestions include: (i) monitor the climate, glaciers and permafrost, glacial lakes, unstable slopes, discharge and sediment yields to better understand the cascading links between climate change, glacier retreat and hazards; (ii) predict future fluvial sediment loads, water quality and reservoir sedimentation in a changing climate and develop sustainable sediment management solutions; (iii) establish real-time early warning systems and enhance social awareness and drills, especially for in-construction dams to minimize human and infrastructure losses; (iv) enhance transboundary cooperation by establishing data-sharing schemes and adopting joint-operation strategies to better cope with hazards and optimise sediment flushing; and (v) promote the inclusion of indigenous and local knowledge in policy, governance, and management for water quality assessment and dam and reservoir construction.

The major results of this study have been published online: Li, D., Lu, X., Walling, D. E., Zhang, T., Steiner, J. F., Wasson, R. J., ... & Bolch, T. (2022). High Mountain Asia hydropower systems threatened by climate-driven landscape instability. Nature Geoscience15(7), 520-530. https://doi.org/10.1038/s41561-022-00953-y

How to cite: Li, D., Lu, X., Walling, D., Zhang, T., Steiner, J., Wasson, R., Stephan, H., Nepal, S., Nie, Y., Immerzeel, W., Shugar, D., Koppes, M., Lane, S., and Bolch, T.: Increasing cryospheric hazards and sediment supply threaten water quality and hydropower systems in high mountain areas, EGU General Assembly 2023, Vienna, Austria, 23–28 Apr 2023, EGU23-2549, https://doi.org/10.5194/egusphere-egu23-2549, 2023.

EGU23-3046 | ECS | Orals | CR6.1

Hydrological implications of pervasive permafrost thaw across the Tibetan Plateau 

Taihua Wang and Dawen Yang

Rivers originating from the Tibetan Plateau (TP) provide water to more than one billion people living downstream. Almost 40% of the TP is currently underlain by permafrost, which serves as both an ice reserve and a flow barrier and is expected to degrade drastically in a warming climate. The hydrological impacts of permafrost thaw across the TP, however, remain poorly understood. Here we quantify the permafrost change on the TP over 1980-2100 and evaluate its hydrological impacts using a physically-based cryospheric-hydrological model. Our results indicate widespread permafrost thaw and prominent ground ice losses under warming. The declining ground ice reserve provides locally important but unsustainable meltwater runoff. In addition, the lowering of the permafrost table and removal of permafrost as a flow barrier would enhance infiltration and raise subsurface storage capacity. The diminished water supply from ground ice melt and enhanced subsurface storage capacity could jointly reduce annual runoff and exacerbate the risk of regional water shortage when facing future droughts. Our findings highlight the important role of permafrost thaw in future water resources management and drought risk assessment across the TP.

How to cite: Wang, T. and Yang, D.: Hydrological implications of pervasive permafrost thaw across the Tibetan Plateau, EGU General Assembly 2023, Vienna, Austria, 23–28 Apr 2023, EGU23-3046, https://doi.org/10.5194/egusphere-egu23-3046, 2023.

EGU23-5464 | Posters on site | CR6.1

Detection and localization of ice cavitiy using ambient seismic noise 

Laurent Baillet, Daniela Teodor, Antoine Guillemot, Sylvain Faller, Eric Larose, and Stephane Garambois

Subglacial cavities may trap a considerable quantity of liquid water, causing devastating outburst floods in densely populated mountain areas. Dedicated studies aimed at identifying such intraglacial cavities at an early stage of their formation (1-2) to prevent and mitigate potential subsequent hazards. Both active and passive geophysical methods are employed for the glacier-bedrock interface and intra-glacial characterization e.g., (3), including Ground Penetrating Radar (GPR), refraction seismic, borehole measurements, and surface nuclear magnetic resonance (SNMR). 

Ambient seismic noise can be collected by light surveys at a relatively moderate cost, and allows to access some mechanical properties of the glacier, including the detection and localization of ice cavities. The horizontal-to-vertical-spectral ratio (HVSR) technique is highly sensitive to impedance contrasts at interfaces, especially the ice/bedrock interface, thus allowing to estimate the glacier thickness (but with limited resolution compared to GPR).

In contrast to the classical Horizontal to Vertical Spectral Ratio (HVSR), Saenger et al. (4) proposed analyzing the (opposite) V/H spectral ratio (VHSR) for spectral anomalies characterization. Specifically, a peak in the VHSR indicates a low impedance volume beneath the surface. As a simple picture, we can refer to the “bridge” vibrating mode, where the vertical displacement in the middle of the bridge largely dominates other components of the movement.  Antunes et al. (5) furthermore noticed that the VHSR gives information about seismic energy anomalies generated by fluids in reservoirs since the wavefield is polarized mainly in the vertical direction.

In this work, we apply the HVSR and VHSR techniques to characterize the Tête Rousse glacier (Mont Blanc area, French Alps) and a subglacial water-filled cavity. We analyze the HVSR and VHSR results from 60 temporary dense seismic array installed on the glacier for 15 days (May 2022). Mapping the VHSR over the free surface evidences areas where the main cavity (or secondary cavities) is (are) expected. We perform an elastic modal analysis based on numerical simulations obtained with Comsol Multiphysics finite element numerical scheme to reproduce the observed field data and confirm some geometrical and physical features of the cavity(ties).

References:

  • (1) Haeberli, W. et al: Prevention of outburst floods from periglacial lakes at Grubengletscher, Valais, Swiss Alps. Glaciol., 47 (156), 111–122 (2001).
  • (2) Vincent, C. et al : Origin of the outburst flood from Glacier de Tête Rousse in 1892 (Mont Blanc area, France), Journal of Glaciology, 56 (198), pp 688–698 (2010).
  • (3) Petrenko, V. F, and R.W. Whitworth: Physics of ice. Oxford University Press, New York, 373 (2002).
  • (4) Saenger, E-H. et al: A passive seismic survey over a gas field: Analysis of low-frequency anomalies, Geophysics, 74 (2), O29–O40 (2009).
  • (5) Antunes V. et al: Insights into the dynamics of the Nirano Mud Volcano through seismic characterization of drumbeat signals and V/H analysis. Journal of Volcanology and Geothermal Research, 431 (2022).

How to cite: Baillet, L., Teodor, D., Guillemot, A., Faller, S., Larose, E., and Garambois, S.: Detection and localization of ice cavitiy using ambient seismic noise, EGU General Assembly 2023, Vienna, Austria, 23–28 Apr 2023, EGU23-5464, https://doi.org/10.5194/egusphere-egu23-5464, 2023.

Following the 130 106 m3 detachment of the Sedongpu Glacier (south-eastern Tibet) in 2018, the Sedongpu valley underwent drastic and rapid large-volume landscape changes. Between 2018 and 2022, and in particular during summer 2021, an enormous volume of in total ~335 106 m3 was eroded from the former glacier bed, forming a new canyon of up to 300 m depth, 1 km width and almost 4 km length. The mass was transported into the Yarlung Tsangpo (Brahmaputra) River and further. Several rock-ice avalanches of in total ~150 106 m3 added to the total rock, sediment and ice volume of over 0.6 km3 that were exported from the basin since around 2017. The recent events at Sedongpu Glacier represent a rapid and irreversible process of landscape transformation from a sediment-filled glacier valley to a glacier-free one with a deeply incised canyon, impressively confirming that glaciers are able to protect their soft beds against massive erosion. Once uncovered, the erosion potential of soft glacier beds is here demonstrated to be possibly enormous for some glaciers in terms of volumes and rates. Such erosion could be particularly extreme for fine-grained subglacial sediments and for elevated glacier beds where large amounts of subglacial sediments are stored. The 2018–2022 landscape development at Sedongpu represents an extreme example of rapid paraglacial slope response highlighting extreme glacier erosion potentials and related hazards from debris flows and impacts on rivers. Such consequences of climate change in glacierized mountains have so far not been considered at this magnitude.

How to cite: Kääb, A. and Girod, L.: Rapid and massive 335 million m3 glacier bed erosion after detachment of the Sedongpu Glacier (Tibet), EGU General Assembly 2023, Vienna, Austria, 23–28 Apr 2023, EGU23-6052, https://doi.org/10.5194/egusphere-egu23-6052, 2023.

EGU23-8183 | ECS | Orals | CR6.1

Mapping release and propagation areas of permafrost-related rock slope failures to identify hot spots for hazard assessment; French Alps 

Maëva Cathala, Florence Magnin, Ludovic Ravanel, Dorren Luuk, Nicolas Zuanon, Frédéric Berger, Franck Bourrier, and Deline Philip

Permafrost-affected rockwalls are increasingly impacted by the effects of climate change and rising air temperature leading to rock slope failures. These events pose a threat for human lives and infrastructure, which underlines the need of better knowledge about their triggering mechanism and propagation.  The aim of this study was to propose a mapping approach of susceptible release areas of rock slope failures and resulting runout distances at a regional scale. This information helps identifying hotspots for subsequent hazard assessment.

To do so, we used an inventory of 1389 rock slope failures (volume > 102 m3)recorded in the Mont-Blanc massif from 2007 to 2019 and determined the topographical and permafrost conditions that are most prone to their triggering using a digital terrain model and a permafrost map. These conditions are used in a multi-criteria GIS approach to identify potential unstable slopes at the French Alps scale. Then, the potential release area map is used as input to map the runout of potential events, using a propagation model based on a normalised area dependant energy line principle. The resulting maps of release and propagation areas will be used to point out human assets (mountaineering routes, high mountain infrastructure, tourism areas) and lakes (that can provoke cascading hazards) which could be impacted by rock slope failure hazards.

This work is a first step to identify hot spots for a regional hazard assessment where more detailed analyses will be required to evaluate potential risks at a local scale.

How to cite: Cathala, M., Magnin, F., Ravanel, L., Luuk, D., Zuanon, N., Berger, F., Bourrier, F., and Philip, D.: Mapping release and propagation areas of permafrost-related rock slope failures to identify hot spots for hazard assessment; French Alps, EGU General Assembly 2023, Vienna, Austria, 23–28 Apr 2023, EGU23-8183, https://doi.org/10.5194/egusphere-egu23-8183, 2023.

EGU23-10799 | ECS | Orals | CR6.1

Regional decrease in hazards from ice-dammed lakes in Alaska since the 1960s 

Brianna Rick, Daniel McGrath, Scott McCoy, and William Armstrong

As ice thins and retreats due to climate change, glacial lakes can form and grow. Rapid lake drainage can produce devastating outburst floods leading many to propose that hazards from glacial lakes are increasing. Outburst flood compilations do show an increase in the number of events documented over time, however, recent studies attribute such trends to observational bias. This leaves large uncertainty about current and future glacial-lake hazards. Here, we focus on ice-dammed lake drainages in Alaska, as a third of documented events globally occurred in this region. Using multitemporal satellite imagery (Landsat and Sentinel-2), we documented 1150 drainages from 106 lakes over 1985–2020. Accounting for the increase in satellite imagery availability over time, we find no temporal trend in drainage frequency. Furthermore, 70% of lakes decreased in estimated volume and peak discharge since the 1960s, and nearly a third of lakes released earlier through time. These results suggest a decrease in overall regional flood hazard from ice-dammed lakes and motivates an unbiased look at other regions.

How to cite: Rick, B., McGrath, D., McCoy, S., and Armstrong, W.: Regional decrease in hazards from ice-dammed lakes in Alaska since the 1960s, EGU General Assembly 2023, Vienna, Austria, 23–28 Apr 2023, EGU23-10799, https://doi.org/10.5194/egusphere-egu23-10799, 2023.

EGU23-11207 | ECS | Posters virtual | CR6.1

Monitoring GLOFs via deep learning-based remote sensing and transfer learning 

Thomas Y. Chen

As glacial melting and permafrost melting increase in intensity, regions with glaciers experience higher rates of flooding, which can cause immense economic loss and hundreds of lives lost in glacial lake outburst floods (GLOFs). By training a convolutional neural network (CNN) for this problem on multitemporal satellite imagery, we propose enabling deployable technologies that predict GLOF events and impacts on surrounding areas. In particular, we collect high-resolution satellite imagery data from previous GLOFs around the world, such as in Iceland, Alaska (United States), Pakistan, and Tibet, utilizing repositories provided by ESA and NASA. We curate a dataset based on paired images (pre- and post-GLOF). In this way, we can train the CNN on the change detected between these two instances, which can further aid in predictions in the form of an output from 0 to 10 indicating the severity of damage caused. However, because machine learning algorithms require a large quantity of data, we must also employ transfer learning. We propose a Markov logic network framework to achieve this, incorporating data from events that were not necessarily GLOFs but included glacial movement and/or flooding. When deployed, models like the one we propose can allow for both the monitoring of GLOFs in action as well as predict GLOFs in the near future by assessing changes using data collected from satellites in real time. 

How to cite: Chen, T. Y.: Monitoring GLOFs via deep learning-based remote sensing and transfer learning, EGU General Assembly 2023, Vienna, Austria, 23–28 Apr 2023, EGU23-11207, https://doi.org/10.5194/egusphere-egu23-11207, 2023.

EGU23-12531 | Orals | CR6.1

Connection between thermal stress and frost quakes 

Jarkko Okkonen, Nikita Afonin, Emma-Riikka Kokko, Elena Kozlovskaya, Kari Moisio, and Roseanna Neupauer

Global warming is affecting the Arctic more significantly as it is warming faster than other places on Earth. The consequences for Arctic as well as sub-Arctic environment are not well understood. Observations in the past decades and climate change impact analysis predicts clear changes in snow cover and snow melt but consequences to frozen soil and related phenomena such as frost quakes are unclear. Frost quakes are non-tectonic seismic events that occur when freezing of water in saturated soils or rocks results in sudden release of seismic energy. Compared to traditional tectonic earthquakes in seismology, frost quakes are much less studied, as they usually occur at random, or less predictable, rarely instrumented locations. Reports and news of frost quakes, resulting in mechanical damage to the pavements, roads and buildings have been received recently from different locations in Finland, Canada and USA and connections between air temperature and frost quakes have been found. The conceptual model of frost quakes is well known but a methodology to predict the occurrence of frost quakes have been missing. In our study, we present a methodology to investigate the connection between thermal stress and frost quakes. Thermal stress is a function of temperature, which can be measured or calculated. We used a hydrological model to calculate snow depth, snow melt rate and soil temperature at different depths in soil. We show that rapid decrease in temperature can cause a thermal stress that is higher than fracture toughness and strength of the soil‐ice mixture. A swarm of frost quakes occurred on 6 January 2016, in in the city of Oulu in Central Finland (sub-Arctic environment). Some of the frost quakes created ruptures in soil, building foundations, and roads. We show that origin of frost quakes was related to rapid decrease in air temperature from -12 °C to –29 °C that created thermal stress in frozen soil and roads which could not withstand the stress.

How to cite: Okkonen, J., Afonin, N., Kokko, E.-R., Kozlovskaya, E., Moisio, K., and Neupauer, R.: Connection between thermal stress and frost quakes, EGU General Assembly 2023, Vienna, Austria, 23–28 Apr 2023, EGU23-12531, https://doi.org/10.5194/egusphere-egu23-12531, 2023.

EGU23-13137 | Orals | CR6.1

Emerging threats: Cryosphere-related hazards in the Trans-Himalaya of Ladakh 

Susanne Schmidt, Mohd Soheb, and Marcus Nüsser

Cryosphere-related hazards are a growing but largely neglected threat for rural settlements, agrarian land use and local livelihoods in the cold-arid Trans-Himalayan region of Ladakh. Despite the growing number of studies on cryosphere-related hazards across High Mountain Asia and other glacierized mountain regions, the occurrence, frequency and magnitude of glacial lake outburst floods (GLOFs) are almost entirely overlooked for the region of Ladakh. Due to the small size and high elevational location of glaciers above 5200 m a.s.l. also the glacial lakes are of small size and some of them are almost permanently ice-covered. In the recent past several GLOF events occurred which destroyed infrastructure and agricultural area. It becomes obvious that even these small glacial lakes might be a permanent threat for local livelihoods and socioeconomic development. This is even more problematic as the number and size of lakes has significantly increased over the past decades. Many of these lakes are dammed by ice-cored moraines which tend to become instable due to climate warming. A comprehensive inventory of glacial lakes for the entire Trans-Himalayan region of Ladakh was carried out. This includes several almost permanently ice-covered high altitude lakes, which have to be detected by visual image interpretation. Changes in the extent and number of glacial lakes have been quantified for the years 1969, 1993, 2000/02 and 2018 in order to assess the potential threat of future GLOFs in the region. A total of 192 glacial lakes cover an area of 5.93 ± 0.70 km2 with an estimated water volume of about 61.11 ± 8.5 million m3, including 127 proglacial (PG) and 56 lakes located on recent moraines (RM) were mapped in 2018. The change detection analyses also indicated the disappearance of 22 glacial lakes (decrease by more than 90%) between 1969 and 2018. The lake development of selected former reported GLOF events were analysed in detail to reconstruct lake level changes which possibly indicate earlier GLOF events. Based on high temporal resolution remote sensing data, a sophisticated monitoring concept needs to be realized to indicate the development of short-lived lakes on glaciers or on debris landforms with buried ice or fast glacial lake growth.

How to cite: Schmidt, S., Soheb, M., and Nüsser, M.: Emerging threats: Cryosphere-related hazards in the Trans-Himalaya of Ladakh, EGU General Assembly 2023, Vienna, Austria, 23–28 Apr 2023, EGU23-13137, https://doi.org/10.5194/egusphere-egu23-13137, 2023.

EGU23-13286 | Posters on site | CR6.1

Hazard assessment of the potential outburst flood of the Ikhnach Lakes, Uzbekistan 

Gulomjon Umirzakov, Eleonora Semakova, Dilmurad Junsaliev, Timur Sabitov, Halimjon Mamirov, and Alessandro Cicoira

Glacier lakes outburst floods (GLOFs) study in the Central Asian region is a very important task in terms of global warming and glacier shrinking. It is expected that ongoing climate changes will lead to an increase in the magnitude and frequency of glacial hazards with profound implications for risks. The appearance and expansion of naturally-dammed lakes in the mountain regions of Uzbekistan poses a threat to downstream communities through the potential for sudden drainage.

In this study, we considered a possible flood from failures of natural dams of the two well-known Ikhnach lakes located in the Pskem River basin at an altitude of 2400 m. We simulated the GLOF using the RAMMS: DebrisFlow software. In our scenario the potential debris flow from the Ikhnach Lakes can reach a constructed dam of the Pskem new reservoir located at the altitude of 1020 m. The total length of the analyzed flow path is 34 km. It is known that accurate and up-to-date digital elevation models (DEMs) are important tools for studying mountain hazards. We used such global DEMs as input as ALOS PALSAR, and TanDEM-X DEMs. According to the simulation results of possible floods from the Ikhnach lakes in the Debris Flow module of the software, the following results were obtained: (i) the time of the flood to reach the hydropower station (HPP) area - 14800±700 sec ~ 4.11 hours; (ii) maximum water discharge of flood water at the HPP area – 410±20 m3 s-1; (iii) height of the flood in the HPP area - 1.2 m.

The obtained results show that there is no potential disastrous effect of the possible flood from the lakes to the residential area as the lowest settlement along the river bed is located considerably higher than flood risk area. However, possible floods in the lakes potentially can reach and have an effect on day to day dam operation of newly constructed Pskem HPP and its engineering infrastructures. Therefore, flood parameters modeled in the RAMMS can be useful information for designing flood damage prevention structures and reservoir operation.

How to cite: Umirzakov, G., Semakova, E., Junsaliev, D., Sabitov, T., Mamirov, H., and Cicoira, A.: Hazard assessment of the potential outburst flood of the Ikhnach Lakes, Uzbekistan, EGU General Assembly 2023, Vienna, Austria, 23–28 Apr 2023, EGU23-13286, https://doi.org/10.5194/egusphere-egu23-13286, 2023.

EGU23-13819 | ECS | Posters on site | CR6.1

Climate change impacts on large scale avalanche risk in mountainous regions 

Gregor Ortner, Adrien Michel, Matthias B.A. Spieler, Chahan M. Kropf, Marc Christen, Yves Bühler, Michael Bründl, and David N. Bresch

The effect of climate change on snow avalanches is widely unknown. 
Various studies indicate that a rise of temperature  and extreme precipitation events will influence the release and the flow regime of snow avalanches. To compare the consequences of these potential changes on snow avalanche hazard and risk with the current situation, we have developed a framework to model avalanche risk at a regional scale. In a first step, we combined an algorithm to delineate potential release areas using a high-resolution terrain model and a forest layer and modeled three hazard scenarios for the current climate situation in a region in central Switzerland. The runout modelling was carried out with the RAMMS::LSHIM Large Scale Hazard Indication Mapping algorithm implemented in the recently released high parameterised version RAMMS::Extended.

For modelling climate change effects on snowfall intensity and snow pack temperature, we used down-scaled data from the Swiss climate change scenarios CH2018 as input for the snow- and surface model "SNOWPACK''. The results of six different model chains within the RCP8.5 emission scenario and a hundred year (from year 2000 to 2100) long data set provided the input to simulate the course of over 600 future winters. For these hypothetical  future winters, we applied extreme value statistics to determine the future changes of the three-day maxima of snowfall. This maxima were used to derive the potential future avalanche fracture depth. We used the output of SNOWPACK for various snow layers to take the effect of changing snow temperatures on the flow regime into account. Furthermore, we considered the rise of the zero degree line to restrict potential future avalanche release zones.

The so-derived changing avalanche hazard disposition maps were used as input for the probabilistic, Python-based risk assessment platform CLIMADA to quantitatively assess the risk to buildings. The resulting maps depict the impacts of climate change on snow avalanche risk by highlighting areas where adaptation measures might be needed and thereby provide a basis for risk appraisal options and risk management strategies considering climate change.


How to cite: Ortner, G., Michel, A., Spieler, M. B. A., Kropf, C. M., Christen, M., Bühler, Y., Bründl, M., and Bresch, D. N.: Climate change impacts on large scale avalanche risk in mountainous regions, EGU General Assembly 2023, Vienna, Austria, 23–28 Apr 2023, EGU23-13819, https://doi.org/10.5194/egusphere-egu23-13819, 2023.

EGU23-14598 | ECS | Orals | CR6.1

Future proglacial lake evolution and outburst flood hazard in south Iceland 

Greta H. Wells, Þorsteinn Sæmundsson, Snævarr Guðmundsson, Finnur Pálsson, Eyjólfur Magnússon, Reginald L. Hermanns, and Guðfinna Aðalgeirsdóttir

Arctic regions are warming at more than double the global average rate with significant impacts on glaciers and hydrologic systems. Iceland is on the front line of this rapid climate change, with a predicted loss of ~20% of its current ice cap volume by 2100. Much of this meltwater is stored in proglacial lakes at outlet glaciers, which are at risk of draining in glacial lake outburst floods (GLOFs). Most contemporary outburst floods in Iceland have been triggered by subglacial eruptions and geothermal activity; however, GLOFs resulting from mass movement events into lakes are an emerging—yet understudied—hazard. Many of Iceland’s proglacial lakes form in overdeepened basins, storing large volumes of meltwater; expanding lake extent creates more surface area for mass movements to enter; and retreating glaciers remove support from valley walls, increasing rockfall and landslide risk. Several large rockfalls have fallen onto glaciers in the past decades; however, these events may enter lakes as glacier retreat progresses and lakes expand.

We investigate this emerging hazard by predicting proglacial lake evolution and assessing GLOF risk under a future warming climate at three sites in south Iceland. This presentation focuses on the proglacial lake at Fjallsjökull, an outlet glacier of the Vatnajökull ice cap. We present lake volume changes since 1980, derived from bathymetric surveys and mapped lake surface areas. We then estimate future lake volume and extent changes from the present until 2100 based on: 1) local topography derived from bathymetric mapping, ArcticDEM, and subglacial topography from radio-echo sounding surveys; and 2) projected glacier retreat under different climate warming scenarios. Next, we identify potential hazards from mass movement events entering the lake at its current and future extents based on field mapping and remote sensing imagery. Finally, we discuss implications of a glacial outburst flood on downstream communities, infrastructure, and tourism, laying the foundation for future work on hazard assessment and flood modeling. This site is an excellent pilot study for this emerging hazard in Iceland and has significant potential for application to other Icelandic and Arctic glacial lakes.

How to cite: Wells, G. H., Sæmundsson, Þ., Guðmundsson, S., Pálsson, F., Magnússon, E., Hermanns, R. L., and Aðalgeirsdóttir, G.: Future proglacial lake evolution and outburst flood hazard in south Iceland, EGU General Assembly 2023, Vienna, Austria, 23–28 Apr 2023, EGU23-14598, https://doi.org/10.5194/egusphere-egu23-14598, 2023.

EGU23-15227 | ECS | Posters on site | CR6.1

Thermokarst processes as triggers of debris flows: A case study at Hüttekar Rock Glacier (Austrian Alps) 

Simon Seelig, Thomas Wagner, Karl Krainer, Michael Avian, Marc Olefs, Klaus Haslinger, and Gerfried Winkler

A cascading process including thermokarst lake outburst, debris flow initiation, and river blockage, hit a high mountain valley in the Austrian Alps during summer 2019. The rapid development of thermokarst features on an active rock glacier, including a lake with a water volume of approximately 166,000 m³ as well as a 350 m long drainage channel, most likely triggered the failure of ice-cemented debris within its front, with subsequent mobilization of roughly 50,000 m³ of sediment. This study explores the drivers of thermokarst evolution by tracking the lake development using satellite imagery and modeling its energy budget. We employ a simple balance model, assuming that the atmospheric energy input was efficiently transferred to the frozen rock glacier core through convection of lake water. This process provided sufficient melting energy to establish the thermokarst channel draining the lake within several hours. Our results highlight the need to account for thermokarst processes in hazard assessment studies involving permafrost-affected terrain.

How to cite: Seelig, S., Wagner, T., Krainer, K., Avian, M., Olefs, M., Haslinger, K., and Winkler, G.: Thermokarst processes as triggers of debris flows: A case study at Hüttekar Rock Glacier (Austrian Alps), EGU General Assembly 2023, Vienna, Austria, 23–28 Apr 2023, EGU23-15227, https://doi.org/10.5194/egusphere-egu23-15227, 2023.

EGU23-15703 * | Orals | CR6.1 | Highlight

Mapping Himalayan glacial lake outburst flood hazard through time and space 

Scott McCoy, Jonathan Jacquet, Daniel McGrath, and Sajid Ghuffar

When glacial dams fail catastrophically, the ensuing glacial lake outburst floods (GLOFs) can cause devastating impacts to downstream environments and infrastructure. Large-impact GLOFs imprint distinct geomorphic features in the landscape that can remain diagnostic for hundreds of years, particularly for GLOFs sourced from moraine-dammed lakes. In this work, we used multi-temporal very-high-resolution-satellite imagery to systematically map the occurrence of impactful GLOFs from moraine-dammed lakes along the Himalayan arc between the Indus and the Salween rivers. Additionally, we binned mapped events by approximate date of occurrence to quantify changes in GLOF frequency through time. This new data set adds over 200 newly mapped GLOFs from ~200 lakes to the 108 events documented in published compilations. We find notable spatial heterogeneity in GLOF hazard along the Himalayan arc. Furthermore, we find that GLOF frequency from moraine-dammed lakes in the last 20 years is markedly lower than earlier time periods from 1970-2000 or from the end of the Little Ice Age to 1970. This decrease in GLOF frequency in recent time is despite continued growth of glacial lakes, likely increases in the frequency of mass movements that commonly trigger GLOFs from moraine-dammed lakes, and mapping bias that likely underestimates GLOF occurrence from earlier time periods.

How to cite: McCoy, S., Jacquet, J., McGrath, D., and Ghuffar, S.: Mapping Himalayan glacial lake outburst flood hazard through time and space, EGU General Assembly 2023, Vienna, Austria, 23–28 Apr 2023, EGU23-15703, https://doi.org/10.5194/egusphere-egu23-15703, 2023.

A workflow is presented to estimate the size of a representative elementary volume and 3-D hydraulic conductivity tensor based on the discrete fracture network (DFN) fluid flow analysis through the case study performed for a granitic rock mass near the low and intermediate level radioactive waste disposal site in southeastern Korea. Intensity and size of joints were calibrated using the first invariant of fracture tensor for the 2-D DFN of the study area. Effective hydraulic apertures were obtained by analyzing the results of field packer tests. The representative elementary volume of the 2-D DFN was determined to be 20m square by investigating the variations in the directional hydraulic conductivity for blocks of different sizes. The directional hydraulic conductivities calculated from the 2-D DFN exhibited strong anisotropy related to hydraulic behaviors of the study area. The 3-D hydraulic conductivity tensor for the fractured rock mass of the study area was estimated from the directional block conductivities of the 2-D DFN blocks generated for various directions in 3-D. The orientations of the principal components of the 3-D hydraulic conductivity tensor were found to be identical to those of the delineated joint sets in the study area.

How to cite: Um, J.-G. and Bae, J.: Estimation of 3-D hydraulic conductivity tensor for a granitic rock mass near the low and intermediate level radioactive waste disposal site in Korea, EGU General Assembly 2023, Vienna, Austria, 23–28 Apr 2023, EGU23-1696, https://doi.org/10.5194/egusphere-egu23-1696, 2023.

EGU23-4952 | ECS | Orals | ERE5.2

Poroelastic modeling of borehole-based periodic hydraulic tests in non-fractured and fractured porous rocks 

Nicolás Barbosa, Tobias Müller, Marco Favino, and Klaus Holliger

Characterizing fluid transport and pore pressure diffusion is key for understanding and monitoring many natural (e.g., seismically active zones and volcanic systems) and engineered environments (e.g., enhanced geothermal reservoirs and CO2 underground storage). Borehole hydraulic testing allows to infer relevant properties of the probed sub-surface volume, such as, for example, its transmissivity and diffusivity, for assessing the governing flow regime as well as for detecting the presence of hydraulic boundaries. Periodic hydraulic tests (PHT) achieve these objectives using a time-harmonic fluid injection procedure while measuring the fluid pressure response in monitoring boreholes. The relevant information on the pressure diffusion process occurring in the probed formation is retrieved from the phase shifts and amplitude ratios between the injected flow rate and the interval pressure. In general, the interpretation of PHT data relies on the assumption that the pressure diffusion process is uncoupled from the solid deformation of the probed rock volume. We present a poroelastic numerical approach to investigate the role played by hydromechanical coupling (HMC) effects during PHT and to assess whether and to what extent additional mechanical information can be extracted from these tests. We focus on (i) the influence of the borehole wall deformation on the wellbore storage coefficient Sw, which quantifies the difference between the injected flow rates and those actually entering the porous formation; and on (ii) the HMC effects associated with the presence of fractures in the formation. Following the commonly taken approach, we also interpret the synthetic data from the numerical poroelastic approach using the uncoupled diffusion solution. For different rock physical properties, we demonstrate that, in homogeneous formations, the uncoupled diffusion solution reproduces the poroelastic results. In this scenario, neglecting the effect of the deformation of the borehole wall on Sw upon injection can lead to an underestimation of both the transmissivity and diffusivity, which becomes worse for shorter oscillation periods. We also show that the effective values of Sw depend on the shear modulus of the formation and do not change with the oscillatory period. Based on this evidence, we present a methodology to obtain the effective Sw along with the hydraulic properties using observations at various oscillatory periods. Next, we consider formations containing hydraulically open and compliant fractures intersecting the borehole perpendicularly. Here, a single uncoupled diffusion model is not able to fully describe the poroelastic response of the medium at different periods. Furthermore, the presence of fractures significantly affects the effective value of Sw: it increases with respect to the one associated with the intact homogeneous rock, and the HMC effects associated with the compressibility contrast in the formation result in a period dependence of Sw. The characteristic period of the latter is primarily related to the diffusivity and size of the fractures. This result is particularly relevant for the planning and interpretation of monitoring experiments, in which the mechanical properties of the formation are expected to evolve, such as, for example, hydraulic stimulation procedures, seismic and/or volcanic regions, and injection of wastewater and CO2 for subsurface storage.

How to cite: Barbosa, N., Müller, T., Favino, M., and Holliger, K.: Poroelastic modeling of borehole-based periodic hydraulic tests in non-fractured and fractured porous rocks, EGU General Assembly 2023, Vienna, Austria, 23–28 Apr 2023, EGU23-4952, https://doi.org/10.5194/egusphere-egu23-4952, 2023.

EGU23-5623 | ECS | Orals | ERE5.2

The evolution of permeability with pressure and temperature in microfractured granite 

Lucille Carbillet, Michael Heap, and Patrick Baud

Measurements of permeability at high-pressure and high-temperature are critical to model and understand the behaviour and evolution of geothermal systems. To perform such measurements and provide constraints on the permeability of crustal rocks, we designed and tested a new apparatus.

Our high-pressure, high-temperature permeameter consists of three independent parts: the permeant gas circuit, the confining fluid circuit, and the heating element. For each measurement, a cylindrical sample is placed between the up- and downstream platens, into an annular Viton jacket which is secured within the pressure vessel. A confining pressure can be applied to the sample by filling the void space between the vessel and jacket through the inlet with kerosene. The confining pressure can be increased up to 50 MPa using a high-pressure hand pump. The temperature of the system can then be increased from room-temperature to up to 150 °C using a heating mantle wrapped around the pressure vessel and connected to a control box. After the confining pressure and temperature have been applied to the system, the permeability measurement is performed by flowing nitrogen (the permeant gas) through the sample while monitoring the pressure differential between the upstream pressure transducer and atmospheric pressure downstream of the sample at different volumetric flow rates (the steady-state method), measured using the downstream flowmeter.

Using this new experimental apparatus, the permeability of Lanhélin granite (from France) samples were measured. Cylindrical samples were prepared and thermally stressed (heated to 700 °C) to ensure that their permeabilities lie in the range that can be measured in our set-up (> 10-18 m2). Permeability measurements were then performed under confining pressures of 2, 5, 10, 15, 20, 30, 40, and 50 MPa at room temperature, 50, and 100 °C. Our results provide the evolution of the permeability of microfractured granite in various pressure and temperature conditions, which will serve to inform numerical modelling designed to explore the influence of in-situ conditions on fluid flow within a fractured geothermal reservoir.

How to cite: Carbillet, L., Heap, M., and Baud, P.: The evolution of permeability with pressure and temperature in microfractured granite, EGU General Assembly 2023, Vienna, Austria, 23–28 Apr 2023, EGU23-5623, https://doi.org/10.5194/egusphere-egu23-5623, 2023.

EGU23-5675 | ECS | Orals | ERE5.2

Along-strike fault geometry controls damage zone parameters: the case of the Kornos-Aghios Ioannis Extensional Fault (Lemnos Island, NE Greece) 

Luigi Riccardo Berio, Fabrizio Balsamo, Mattia Pizzati, Fabrizio Storti, Manuel Curzi, and Giulio Viola

The study of fault damage zones is key to the understanding of fault-related fluid flow in the upper crust with many applications, including groundwater and hydrocarbon exploration, and underground storage of CO2 and H. Many studies reveal that a relationship exists between fault damage zone width and net fault displacement. Despite this positive relationship, several factors such as the tectonic setting, the depth of deformation, the deformation mechanisms, and the evolving mechanical properties of fault rocks affect damage zone characteristics (e.g., width, asymmetry, fracture attitude, deformation intensity). Furthermore, recent studies show that the overall along-strike fault geometry may play a pivotal role in controlling damage zone characteristics. In particular, areas such as tip regions, linkage sectors, relay ramps and step-overs can be characterised by fault damage zone parameters markedly different from sectors away from these structural complexities. In this contribution, we present new structural data of fault damage zone parameters acquired along the 8 km long extensional Kornos-Aghios Ioannis Fault (KAIF) on Lemnos Island, North Aegean Sea, Greece. The KAIF deforms lower Miocene effusive and hypabyssal magmatic rocks and middle Eocene to lower Miocene turbidites. Deformed rock volumes along the KAIF are locally strongly altered by hydrothermal fluids (e.g., hydrothermal silicification). We provide a detailed characterization of the KAIF in terms of 2D fault geometry (mapped at 1:1000 scale) and kinematics and we present a characterization of fault damage zone parameters, including frequency and attitude of subsidiary fault-related fractures, in different fault sectors. The acquired data allowed us to define the boundaries of fault damage zones in the different sectors and to discuss the differences in terms of fracture attributes in linking- and tip-damage zones compared to damage zones away from these structural complexities. Our results show that fault damage zones in linkage and tip sectors are wider and that fault-related fractures are more clustered around several subsidiary faults with centimetre- to metre-offsets. Also, secondary fractures in linkage and tip sectors are less systematically oriented, thus increasing fracture network connectivity and, consequently, facilitating fluid mobility in structurally complex fault sectors.

How to cite: Berio, L. R., Balsamo, F., Pizzati, M., Storti, F., Curzi, M., and Viola, G.: Along-strike fault geometry controls damage zone parameters: the case of the Kornos-Aghios Ioannis Extensional Fault (Lemnos Island, NE Greece), EGU General Assembly 2023, Vienna, Austria, 23–28 Apr 2023, EGU23-5675, https://doi.org/10.5194/egusphere-egu23-5675, 2023.

Fluid flow within low permeable reservoirs such as carbonates is primarily controlled by faults, fractures and other structural networks which can be defined through properties such as intensity, connectivity and aperture. These properties can vary not only among individual fractures but also between scales which can influence uncertainties within permeability calculations and fluid flow simulations. Therefore, understanding the interactions and variations within these networks is fundamental to deriving properties such as permeability and characterising fluid flow through naturally fractured reservoirs.

Determining fracture network properties of reservoirs can be undertaken using several methods across different scales from both surface and subsurface sources. However, where subsurface data is limited (e.g., within the geothermal reservoirs of Northern Bavaria), outcrop analogues become vital for obtaining the important information required for characterising fracture networks. Outcrops such as quarry sections can be imaged and scanned using both 2D and 3D photogrammetry techniques, from which fault and fracture networks can be detected and analysed. Previous work has presented a method to upscale fracture networks to 2D permeability tensors from outcrop sections through independently assigning properties to individual fractures within the networks. However, upscaling the networks to larger scales can lead to uncertainties due to variations within the modelled fracture networks. It its therefore important to understand the how the permeability tensor varies between scales and dimensions to reduce upscaling uncertainties.

Using examples from multiple outcrops within the Franconian Basin, Germany, we present an improved workflow to derive the tensors between dimensions and an investigation of the relationships among fracture networks at different scales. This will show the effect on permeability within geothermal reservoirs in the region and how to reduce the uncertainty in upscaling outcrops to subsurface reservoir scale.

How to cite: Smith, R., Prabhakaran, R., and Koehn, D.: Investigating scale variations in outcrop derived permeability tensors and the effect on geothermal fluid in upscaling naturally fractured reservoirs, EGU General Assembly 2023, Vienna, Austria, 23–28 Apr 2023, EGU23-6756, https://doi.org/10.5194/egusphere-egu23-6756, 2023.

EGU23-6830 | ECS | Posters on site | ERE5.2

Comparative analysis of analytical and numerical solutions for hydraulic properties upscaling in fractured media 

Erica De Paolo, Andrea Bistacchi, Stefano Casiraghi, and Fabio La Valle

The investigation of hydro-mechanical properties in rock formations is of utmost importance for several geological and engineering applications, e.g. for carbon-dioxide or hydrogen underground storage, exploitation of groundwater, geothermal or oil and gas reservoirs, hydrothermal ore deposits, and the mechanics of earthquakes. In particular, modeling fluid flow into networks of discontinuities (i.e. faults and fractures) is a key task in all these studies. Due to the high complexity of such processes, involving a significant number of feedbacks and occurring at different spatial and time scales, the achievement of a satisfying representation of the physical problem remains a challenge.

In the last decades, a variety of modeling approaches have been proposed in literature, accounting for different orders of complexity and using several computational methods. Analytical solutions are commonly based on simplistic assumptions about the process, allowing for simple fracture geometries and/or implying incompressible Newtonian fluids; as well as about the medium, considered elastic and permeable (or impermeable). Nevertheless, these solutions are still widely employed, as they provide significantly quick, first-order solutions compared to more sophisticated approaches.

On the other hand numerical models, typically accounting for a higher number of parameters and concurrent effects, are expected to return more realistic solutions. Those based on Finite Element Methods (FEMs) or similarly discretized domains, for example, permit to model the fractured rock mass with information that can be inferred from geological surveys and geophysical techniques.

As anticipated, important limitations in the use of more advanced modeling approaches could be the computing time and model size or resolution, not always allowing for cost-efficient solutions. In this study, we aim at a comprehensive review and benchmarking of the main classes of existing methods, comparing their results obtained for an identical dataset. In this way, we are able to highlight the advantages and disadvantages of each technique, defining the differences in accuracy and the ranges of applicability of these methods. 

The outcomes of our work are intended as a cross-benchmarking among available models, as well as a starting point for the future development of novel improved techniques in the field of fluid flows dynamics in networks of discontinuities.

How to cite: De Paolo, E., Bistacchi, A., Casiraghi, S., and La Valle, F.: Comparative analysis of analytical and numerical solutions for hydraulic properties upscaling in fractured media, EGU General Assembly 2023, Vienna, Austria, 23–28 Apr 2023, EGU23-6830, https://doi.org/10.5194/egusphere-egu23-6830, 2023.

EGU23-7330 | ECS | Orals | ERE5.2 | Highlight

Structural patterns and states of stress at the Hengill Triple Junction, SW Iceland: implications for fluid-injection induced seismic hazard 

Ashley Stanton-Yonge, Thomas Mitchell, Philip Meredith, Sveinborg Gunnarsdóttir, Sandra Ósk Snæbjörnsdóttir, and Vala Hjorleifsdottir

The Hengill region is one of the largest areas of high geothermal gradient and subsurface heat flow in Iceland, and hosts two of its largest geothermal power plants: Hellisheiði and Nesjavellir, which have a combined capacity of 423 MWe and 560 MWth. The Hengill region is located in a unique tectonic setting, characterized by the convergence of three plate boundary segments: the oblique-spreading Reykjanes Peninsula (RP), the orthogonal-spreading rift of the Western Volcanic Zone (WVZ) and the transform, South Iceland Seismic Zone (SISZ). Unlike most tectonic triple junctions, which occur on the ocean floor, the Hengill Triple Junction (HTJ) is exposed above sea level, thus providing a unique opportunity to study the interplay between three plate boundary segments and the local deformation processes occurring at their convergence site. Additionally, the injection of fluids due to on-going geothermal operations enhances the natural tendency of the region for seismic activity, and results in a significant level of induced seismic hazard. Because slip on pre-existing faults is triggered when the applied shear stress surpasses the frictional strength of the fault, regions that are naturally subjected to higher shear stresses are more prone to fault re-activation due to fluid re-injection. Therefore, a spatial variation in tectonic stresses may result in varying induced seismicity potential within a region.

The local interplay of the three converging tectonic regimes, and their effect on the stress fields within the triple junction region, has been examined through a combination of regional structural mapping and a numerical model of the plate boundary interactions using the Boundary Element Method (BEM). Large scale structural mapping and analytical models of oblique rifting were used to estimate the degree of rift obliquity for individual fissure swarms. Our results reveal that the transition from the highly oblique rift system of the RP towards the spreading-orthogonal rift of the WVZ is smooth, and manifests as a rotation of the trend of fissures and eruptive ridges, and the strike of normal faults formed in response to the local stress field developed in the HTJ. These results were then correlated with those from the BEM model, which allows us to predict the orientation, relative magnitude, and distribution of stresses within the study area. Finally, the shear stress distribution determined from the BEM model was plotted against the location of both natural and induced seismic events detected in the region over a time span of 26 months, by the COSEISMIQ project (Grigoli et al., 2022). Our results show that seismic events cluster in either at the triple junction or SW of it, within the highly stressed regions of the RP. Furthermore, the seismicity transitions from scattered to non-existent towards the north of the region, where shear stresses also diffuse. The good correlation between the high shear stress regions predicted by the model and distribution of seismicity suggests that this approach may provide a valuable and cost-effective tool for seismic hazard prediction within regions with complex tectonic settings.


How to cite: Stanton-Yonge, A., Mitchell, T., Meredith, P., Gunnarsdóttir, S., Ósk Snæbjörnsdóttir, S., and Hjorleifsdottir, V.: Structural patterns and states of stress at the Hengill Triple Junction, SW Iceland: implications for fluid-injection induced seismic hazard, EGU General Assembly 2023, Vienna, Austria, 23–28 Apr 2023, EGU23-7330, https://doi.org/10.5194/egusphere-egu23-7330, 2023.

EGU23-7596 | ECS | Posters on site | ERE5.2

Seismic monitoring of laboratory fault reactivation by pore fluid injection 

Aukje Veltmeijer, Milad Naderloo, and Auke Barnhoorn

Rising demand for energy and green energy has led to increasing subsurface activities, such as geothermal energy sites. These increasing human activities in the subsurface have caused substantial induced earthquakes in more densely populated areas, increasing the risks of operating safely. Well-known examples of induced seismicity, due to geothermal sites, are the M5.4 earthquake in Pohang (South Korea) or the M3.4 earthquake in Basel (Switzerland).  

Monitoring and forecasting earthquakes have been a topic of interest for years. Predictions are often made by production scenarios, probabilistic models, or average earthquake size distribution (b-value). Only a few studies focus on predicting fluid-induced seismicity by using seismic monitoring methods. Pore fluid changes play an important role in the reactivation of the fault strength and stability. Variations in pore pressure can cause a drop in the stresses along the fault plane and cause fault instability and movement resulting in induced seismicity.  Monitoring and predicting the stress changes along the fault planes can therefore be essential in forecasting induced seismicity and mitigation, potentially reducing the risks of operating (in denser populated areas). However, monitoring the degree of these changes remains challenging. Most studies using seismic methods to monitor induced seismicity on a field scale or laboratory scale focus on either passive monitoring or active monitoring. This study combines the two methods and shows how they complement each other in monitoring and mitigation of fault reactivation in the laboratory. We have performed pore fluid injection experiments on faulted sandstones to reactivate the faults while monitoring both actively (active seismic) and passively (acoustic emission).

These results show that both acoustic monitoring techniques can be used to detect the different fault reactivation stages: linear strain build-up, early creep (pre-slip), stress drop (main slip), and continuous sliding phase. However, using active monitoring the early creep phase is detected slightly earlier than using passive monitoring. Combining the methods shows that the stress changes along the fault can be detected with more detail in more accuracy. As a result, the combination of passive and active techniques may be useful for monitoring faulted or critically stressed reservoirs that experience pore pressure changes.

How to cite: Veltmeijer, A., Naderloo, M., and Barnhoorn, A.: Seismic monitoring of laboratory fault reactivation by pore fluid injection, EGU General Assembly 2023, Vienna, Austria, 23–28 Apr 2023, EGU23-7596, https://doi.org/10.5194/egusphere-egu23-7596, 2023.

EGU23-8016 | Posters on site | ERE5.2

Hydrochemical Stimulation in Fractured Carbonate Rocks - Monitoring and Simulation 

Jörn Bartels, Peter Schätzl, and Thomas Baumann

Hydrochemical stimulation by acidification of geothermal wells is a standard procedure to remove drilling mud and to improve hydraulic contact between borehole and reservoir. Several successive stimulations using hydrochloric acid were monitored by both online measurement and conventional analysis. The results show recovery curves with distinct two-step exponential temporal decrease of the chloride concentration. The initial decrease is fast, representing water and acid flow along pathways which are very well connected to the borehole. After the fluid from these flow paths has been recovered, the concentration decreases at a lower rate. This can be attributed to water flowing in less well connected flow paths. With additional stimulations the chloride concentration curve approaches a mono-exponential decrease. This indicates that the flow paths within the reach of the stimulation get more homogeneous.

A numerical model of flow and solute transport in the borehole and the surrounding geothermal reservoir was developed in order to simulate the observed chloride-recovery behaviour in the course of a number of successive hydrochemical stimulations. The finite-element model was adapted to match the observed hydraulic and hydrochemical data range.

Simulation hereby allows to separate time-dependent single contributions from the different flow paths to the total recovery concentration. Based on this information, indications of structural change due to the successive acidification steps can be derived from the chloride-recovery curves of each step. Furthermore, for typical settings the minimum time and volume of solution can be estimated which is required to achieve a significant structural signal

The derived structural information can be useful to predict the long-term behaviour of a geothermal injection well which during operation is exposed to a mild but constant chemical stimulation by the injected cold and, with respect to chloride in the rock matrix, undersaturated water. 

How to cite: Bartels, J., Schätzl, P., and Baumann, T.: Hydrochemical Stimulation in Fractured Carbonate Rocks - Monitoring and Simulation, EGU General Assembly 2023, Vienna, Austria, 23–28 Apr 2023, EGU23-8016, https://doi.org/10.5194/egusphere-egu23-8016, 2023.

EGU23-8221 | ECS | Posters on site | ERE5.2

Slip tendency and reactivation pressure prediction of natural fractures at the Bedretto Underground Laboratory, Switzerland 

Kai Bröker, Xiaodong Ma, Deborah Stadler, Nima Gholizadeh Doonechaly, Marian Hertrich, and Domenico Giardini and the Bedretto Team

Hydraulic shearing of natural fractures or fault zones is a key mechanism for enhancing permeability in engineered geothermal systems (EGS) in order to extract geothermal energy from crystalline basement rocks. Shear reactivation is achieved by hydraulic stimulation in an injection borehole, involving a complex hydro-seismo-mechanical response of fractured crystalline rock. A major challenge is to predict which fractures are reactivated at which reactivation pressures, in order to efficiently design the injection protocols and create a large fracture network for sufficient fluid circulation and heat exchange.

The Bedretto Underground Laboratory for Geosciences and Geoenergies (BedrettoLab) in Switzerland serves as an in situ test-bed where meso-scale hydraulic stimulation experiments are conducted to better bridge the knowledge gap between laboratory scale experiments and complex reservoir scale processes (Ma et al. 2022). The BedrettoLab is located in a 100 m long enlarged section of the Bedretto tunnel (Ticino, Switzerland), with an overburden of more than 1000 m of granite. Several characterization, monitoring, and two stimulation boreholes were drilled. One of the stimulation boreholes (referred to as ST1) is 400 m long, 45°-dipping, and was equipped with a multi-packer system that partitions the borehole into 15 intervals. Before conducting two multi-stage hydraulic stimulation phases in borehole ST1, the rock volume was characterized with various geophysical logging tools, hydraulic tests, and mini-frac tests for stress measurements (Bröker and Ma 2022, Ma et al. 2022).

Along the stimulation borehole, we mapped multiple clusters of sub-parallel pre-existing open fractures and fault zones that are preferentially oriented for reactivation in the estimated stress field. In this work, we compare our preceding probabilistic slip tendency and reactivation pressure estimates with the results from hydraulic stimulation experiments. The interval pressure and flowrate data from the stimulations reveal a reactivation of the natural fractures associated with an increase in injectivity. A comparison of the expected stress field around the stimulation interval with the observed reactivation pressure indicates that the fractures were likely reactivated by hydraulic shearing. The observed reactivation pressures are in the range of the preceding estimates, but a precise estimation is challenging due to the large number of input parameters, i.e. stress magnitudes and orientation, fracture orientation, pore pressure, coefficient of friction, and their uncertainties.

References:

Bröker, K., & Ma, X. (2022). Estimating the Least Principal Stress in a Granitic Rock Mass: Systematic Mini-Frac Tests and Elaborated Pressure Transient Analysis. Rock Mechanics and Rock Engineering. https://doi.org/10.1007/s00603-021-02743-1

Ma, X., Hertrich, M., Amann, F., Bröker, K., Gholizadeh Doonechaly, N., Gischig, V., Hochreutener, R., Kästli, P., Krietsch, H., Marti, M., Nägeli, B., Nejati, M., Obermann, A., Plenkers, K., Rinaldi, A. P., Shakas, A., Villiger, L., Wenning, Q., Zappone, A., … Giardini, D. (2022). Multi-disciplinary characterizations of the BedrettoLab -- a new underground geoscience research facility. Solid Earth, 13(2), 301–322. https://doi.org/10.5194/se-13-301-2022

How to cite: Bröker, K., Ma, X., Stadler, D., Doonechaly, N. G., Hertrich, M., and Giardini, D. and the Bedretto Team: Slip tendency and reactivation pressure prediction of natural fractures at the Bedretto Underground Laboratory, Switzerland, EGU General Assembly 2023, Vienna, Austria, 23–28 Apr 2023, EGU23-8221, https://doi.org/10.5194/egusphere-egu23-8221, 2023.

EGU23-9317 | ECS | Orals | ERE5.2

Effect of stress regime change on fractured carbonate’s permeability: A case of Latemar carbonate buildup (The Dolomites, Northern Italy)  

Onyedika Anthony Igbokwe, Jithender Timothy, Ashwani Kumar, Xiao Yan, Mathias Mueller, Alessandro Verdecchia, Günther Meschke, and Adrian Immenhauser

Changes in stress regimes impact the geometry of fracture networks and affect the porosity and permeability of carbonate reservoirs. This is, predominantly, because of the complexity of the deformation phases, the poor understanding of the mechanical and diagenetic mechanisms that affect apertures, and the difficulty in precisely characterizing aperture distributions in the subsurface. Utilizing outcrop data analysis and displacement-based linear elastic finite element modelling, we study the effect of stress regime change on fracture network permeability. The model is based on fracture networks, specifically fracture sub-structures.

The Latemar, which is primarily affected by subsidence deformation and Alpine compression, is used as an outcrop analogue for isolated (Mesozoic) carbonate formations with fracture-dominated permeability. We apply a novel strategy involving two compressive boundary loading conditions constrained by the study area's NW-SE and N-S stress directions. Stress-dependent heterogeneous apertures and effective permeability were computed by: (i) using the local stress state within the fracture sub-structure and (ii) running a single-phase flow analysis considering the fracture apertures in each fracture sub-structure.

Our results show that the impact of the modelled far-field stresses at: (i) subsidence deformation (first stage loading) from the NW-SE, and (ii) Alpine deformation (second stage loading) from the N-S, increased the overall fracture aperture and permeability. In each case, increasing permeability is associated with open fractures parallel to the orientation of the loading stages and with fracture densities. The anisotropy of permeability is affected by shear dilation and is increased by the density and connectedness of the fracture network. The two far-field stresses simultaneously acting within the selected fracture sub-structure at a different magnitude and orientation do not necessarily cancel out each other in the mechanical deformation modelling. These stresses effect the overall aperture and permeability distributions. These effects, which may be ignored in simpler stress-dependent permeability, can result in significant inaccuracies in permeability estimation, especially in the subsurface carbonate reservoirs.

How to cite: Igbokwe, O. A., Timothy, J., Kumar, A., Yan, X., Mueller, M., Verdecchia, A., Meschke, G., and Immenhauser, A.: Effect of stress regime change on fractured carbonate’s permeability: A case of Latemar carbonate buildup (The Dolomites, Northern Italy) , EGU General Assembly 2023, Vienna, Austria, 23–28 Apr 2023, EGU23-9317, https://doi.org/10.5194/egusphere-egu23-9317, 2023.

EGU23-9661 | Orals | ERE5.2

Quantitative structural analysis of fracture networks in outcrop analogues of fractured reservoirs: a review of measurement methodologies and statistical techniques 

Andrea Bistacchi, Sylvain Mayolle, Stefano Casiraghi, Erica De Paolo, Mattia Martinelli, Federico Agliardi, and Fabio La Valle

The characterization and modelling of fractured reservoirs of geofluids are becoming increasingly important in the ongoing energy transition and climate crisis. Fractured reservoirs are fundamental for critical applications such as CO2 sequestration, H2 and natural gas storage, exploitation of geothermal fluids and hydrothermal ore deposits, and management and safeguard of groundwater resources (deep aquifers are considered more resilient in drought scenarios). In addition, the characterization of fracture networks is relevant in earthquake mechanics, slope stability and engineering geology.

Characterization of natural fracture systems and fracture networks is often based on characterization of outcrop analogues, with measurement of large structural datasets with a combination of field and remote sensing techniques (e.g. Digital Outcrop Models - DOMs), leading to statistical and topological analysis. Numerous studies provide significant amounts of data from a broad variety of methodologies and protocols used in the field. These methodologies aim at characterizing fracture systems by a large number of parameters. Individual “fracture” sets are characterized by genetic features (e.g. joint vs. stylolite), relative chronology, spatial distribution (regular, random, clustered...), density and intensity (e.g. P20 and P21), and by statistical distributions of spacing, orientation, length, height, and aperture (the latter being a dynamical property that varies with fluid pressure and confining stress). Fracture networks composed by several sets are also characterized by topology and connectivity (characterized for instance in terms of fracture terminations or with graphs).

Here we propose a thorough review, supported by rich case studies, of quantitative methods for fracture network characterization and analysis on DOMs. This review aims at determining the most relevant and efficient methods for field and remote-sensing measurement, and best-practice statistical analysis techniques, in order to accurately characterize outcrop analogues that can be used to model fractured reservoirs.

How to cite: Bistacchi, A., Mayolle, S., Casiraghi, S., De Paolo, E., Martinelli, M., Agliardi, F., and La Valle, F.: Quantitative structural analysis of fracture networks in outcrop analogues of fractured reservoirs: a review of measurement methodologies and statistical techniques, EGU General Assembly 2023, Vienna, Austria, 23–28 Apr 2023, EGU23-9661, https://doi.org/10.5194/egusphere-egu23-9661, 2023.

EGU23-9673 | ECS | Posters on site | ERE5.2

Deformation bands characterization in porous carbonates: a case study from the Matera High (Southern Italy) 

Giovanni Freda, Silvia Mittempergher, Fabrizio Balsamo, Raffaele Di Cuia, and Angelo Ricciato

Faults and fractures have a crucial role in controlling the permeability in carbonate reservoirs, as they can act as a conduit or barrier for fluid flow. Reservoir-scale outcrop analogue studies provide a useful tool to investigate their spatial distribution and connectivity and to establish the relationships between small-scale structures with larger structures that can be identified in the subsurface.

In this contribution, we describe the preliminary results of a structural study carried out in the Matera's High, South Italy, as an analogue for porous carbonate structures that could be used as CO2 storage fields. Matera High is located on the western side of the Murge region, at the boundary between the Apulian foreland and the foredeep of the southern Apennines thrust belt. It consists of an asymmetrical horst structure involving the Cretaceous carbonates of the Apulian platform (Calcare di Altamura). The Calcare di Altamura is unconformably overlain by Plio-Pleistocene shallow-marine coarse-grained carbonates (Calcarenite di Gravina). The Calcare di Altamura is moderately tilted and is characterised by NW-SE striking normal faults with a throw variable from centimetres to tens of meters. The Cretaceous sequence is also characterised by widespread joints, whose intensity increases approaching faults. The Plio-Pleistocene carbonate succession has very few faults. It is dominated by deformation bands organized into 3 main sets dipping at high angles and striking N-S, NW-SE, and NE-SW. This geological setting allows us to conduct a detailed structural study on an area of about 80 km2, investigating how deformation structures affect the secondary porosity in tight limestone and porous calcarenites. The study was conducted at multiple scales in the field and laboratory and includes (1) geological mapping and structural measurements of faults, fractures and deformation bands; (2) use of linear scan-lines to characterise the deformation bands density across faults; (3) use of photogrammetric techniques to obtain Virtual Outcrop Models (VOMs); (4) development of 3D model based on statistical and topological analysis obtained from scan lines and scan areas in the field and VOMs, (5) petrophysical logging (uniaxial strength, in situ permeability, gamma ray) to highlight the factors that control the formation of the deformation bands, (6) image analysis of blue-resin impregnated thin section and optical cathodoluminescence images, and (7) He-density and Hg-intrusion porosimetry to quantify host rock and deformation bands porosity and pore size distribution.

The preliminary results suggest that the combination of fieldwork, VOMs and laboratory measurements allow the characterization of the deformation bands with more confidence to obtain conceptual and quantitative models about its effects on the fluid flow which can be used for reservoirs characterization for CO2 sequestration.

How to cite: Freda, G., Mittempergher, S., Balsamo, F., Di Cuia, R., and Ricciato, A.: Deformation bands characterization in porous carbonates: a case study from the Matera High (Southern Italy), EGU General Assembly 2023, Vienna, Austria, 23–28 Apr 2023, EGU23-9673, https://doi.org/10.5194/egusphere-egu23-9673, 2023.

EGU23-9694 | ECS | Posters on site | ERE5.2

Modelling fluid flow and water-rock interaction in fractured crust using a Discrete Fracture Network approach 

Ibrahim Harb, Fidel Grandia, Paolo Trinchero, and Jeffrey Hyman

Groundwater accounts for around 25% of the world’s fresh water supply. Due to the increasing anthropogenic pressure on shallow aquifers as well as climate change that is impacting global groundwater recharge, there is an increasing need to access deeper groundwater resources, which are frequently hosted in fractured-rock formations. The migration of groundwater (and other types of fluids, in general) in fractured rocks allows the contact between fluids in geochemical disequilibrium with the host rocks (i.e., large geochemical gradients) promoting water-rock reactions inside the fractures. These reactions may influence the permeability and porosity, as well as they may lead to fracture sealing. So, a thorough understanding of the coupled hydro-chemical processing that occur in fractured media is important for applications such as the sustainable exploitation of the afore-mentioned reserves, the protection and remediations of aquifers used for drinking water production or the safety analyses of deep geological repositories for spent nuclear fuel, energy storage, nuclear waste disposal sites, etc.. In fractured rocks, groundwater flows in specific pathways and interacts with the host rock which may lead to the change in the hydro-geochemical conditions. The prediction of these interactions become critical for a proper management of the different applications. Therefore, the understanding and modelling of fluid-fracture interaction is of high scientific and commercial interest.

Using the software dfnWorks, it is possible to model the fluid transport using a non-reactive Lagrangian method (particle tracking). In this contribution, we intend to implement geochemical reactions in dfnWorks to quantify the impact of these reactions in the fracture network. In fact, flow of water through Discrete Fracture Networks leads to interaction between water and the minerals occurring in the fracture plane and thus alters the underlying groundwater flow patterns. Thus, using these DFN-based reactive transport simulations, we aim at predicting the effect that chemical reactions have on flow and channeling. Besides presenting a proof-of-concept set of calculations, we will also present preliminary results of a real-case application, where fracture filling is produced as a result of a chemical imbalance.

How to cite: Harb, I., Grandia, F., Trinchero, P., and Hyman, J.: Modelling fluid flow and water-rock interaction in fractured crust using a Discrete Fracture Network approach, EGU General Assembly 2023, Vienna, Austria, 23–28 Apr 2023, EGU23-9694, https://doi.org/10.5194/egusphere-egu23-9694, 2023.

EGU23-10311 | Orals | ERE5.2

Use of Mohr diagrams to predict fracturing in rock 

David Peacock, Bernd Leiss, and David Sanderson

Inferences have to be made about likely structures and their effects on fluid flow in a geothermal reservoir at the pre-drilling stage. This is the case for the potential geothermal reservoir in Variscan metasedimentary rocks that are expected to occur in the subsurface at Göttingen. Simple mechanical modelling, using reasonable ranges of values for rock properties, stresses and fluid pressures, is used here to predict the range of possible structures that are likely to exist in the sub-surface and that may be generated during thermal and hydraulic stimulation. Mohr diagrams are a useful way for predicting and illustrating how rocks can go from a stable stress state (i.e., no fracturing occurs) to an unstable stress state (i.e., fracturing occurs). This transition can occur if there are changes in: (1) the failure envelope; (2) the stresses; and/or (3) fluid pressure. Mohr diagrams are used to show under what fluid pressures and tectonic stresses different types and orientations of fractures are likely to be reactivated or generated. The approach enables the effects of parameters to be modelled individually, and for the types and orientations of fractures to be considered. This modelling is useful for helping geoscientists consider, model and predict the ranges of mechanical properties of rock, stresses, fluid pressures and the resultant fractures that are likely to occur in the sub-surface.

The Mesozoic rocks of the Somerset coast, UK, are used to illustrate how Mohr diagrams can help understand the history of fracturing. Such understanding is useful for predicting which fractures are likely to occur in the subsurface, which is important for predicting reservoir behaviour.

How to cite: Peacock, D., Leiss, B., and Sanderson, D.: Use of Mohr diagrams to predict fracturing in rock, EGU General Assembly 2023, Vienna, Austria, 23–28 Apr 2023, EGU23-10311, https://doi.org/10.5194/egusphere-egu23-10311, 2023.

Pore fluid pressure in the geological formation at depth varies spatially and temporarily. An increase in pore fluid pressure leads to a reduction in effective normal stress and thus affects the rock strength and deformation mode. Extremely high pore fluid pressure induces very low normal stress conditions, where an extension or extension-shear hybrid fractures are formed. To better quantify the stress states and fluid pressure during fracture formation, it is crucial to document mechanical strength and the transition from tensile to shear fracture at low effective stress with elevated pore fluid pressure. However, all previous experimental studies were conducted under dry conditions. Here, we investigate the effects of pore fluid pressure on tensile and hybrid fractures in Berea sandstone by conducting triaxial extension deformation experiments under pore-fluid-pressure controlled conditions at effective maximum principal stress (σ1' = σ1 - Pp, where σ1 is total maximum principal stress and Pp is pore fluid pressure) ranging from 10 to 130 MPa. Fracture strength, inelastic strain, strain at failure, fracture angle to σ1', and the amount of comminution increase with σ1'. The transition of extension to shear fracture occurs at σ1' = ~ 30 MPa, based on the fracture angle and the degree of comminution. All the saturated or pore fluid pressure-controlled test specimens exhibit lower fracture strength than dry samples, and the difference is distinct when the minimum principal stress is tensile (i.e., σ3' < 0). This implies that pore fluid pressure more effectively assists the breakage of the bonds and opening of the microcracks in the extension fracture regime. A series of triaxial extension experiments at σ1' = 20 and 50 MPa with various combinations of σ1 and Pp indicate that the fracture angle to σ1' is independent of σ1 and Pp in the extension fracture regime at σ1' = 20 MPa, and that fracture angle increases with σ1 and Pp in the extension-shear hybrid fracture regime at σ1' = 50 MPa. This implies that the estimation of in-situ stress and pore fluid pressure from natural or human-induced deformation at low effective pressure (such as joints, veins, and drilling-induced tensile fractures) requires careful consideration of the mode of fractures formed.

How to cite: Kitajima, H., Ruplinger, C., and Tilley, C.: Experimental investigations on effects of pore fluid pressure on extension and extension-shear mixed-mode fracture in Berea sandstone, EGU General Assembly 2023, Vienna, Austria, 23–28 Apr 2023, EGU23-10433, https://doi.org/10.5194/egusphere-egu23-10433, 2023.

EGU23-10795 | ECS | Posters on site | ERE5.2

Phase field method to model mixed-mode fracturing in fluid saturated porous reservoir 

Swapnil Kar and Abhijit Chaudhuri

                                        Hydraulic fracturing is a useful stimulation technique to create cracks in unconventional reservoirs and enhance the effective fluid transmissivity to recover gas from natural gas reservoirs or heat from geothermal reservoirs. However, due to fracturing the overall strength and load bearing capacity of the reservoir is compromised. This may be a serious concern if the reservoir is below a dam or any other massive structures. In such case significant settlement can take place as the result of mixed mode fracturing inside the reservoir which might already have natural fractures. Phase field method based on the formulation of mixed-mode fracturing has been adopted in the present work for modeling fracture propagation in a saturated porous medium when subjected to fluid pressure and increasing overburden load. A numerical method has been developed using Finite element method (FEM) for solving the displacement and damage field, and Finite volume method (FVM) for solving flow field due to its flux conservative nature which is automatically satisfied for each FVM cell. Our FEM code alone has been first validated for modelling mixed mode fracturing considering a single fracture as a notch against the published experimental and numerical results for elastic medium subjected to compressive load. In this method, the notch does not have any material and computational mesh is refined around the notch as commonly done by others. We have later developed an alternative method where the pre-existing crack is modelled as a fully damaged zone. In this method, a structured and uniform grid can be used to obtain same fracturing pattern and load-deflection curve. The alternative method has a few advantages such as it can be easily applied for reservoir with many cracks without any grid refinement around the pre-existing cracks, and it can be easily coupled with FVM code for modeling fluid flow. Our numerical modelling code is capable to simulate fracturing along with the branching and merging effects. We have simulated load-bearing capacity of a fractured reservoir subjected to increasing overburden load. The reservoir is considered to consists of many randomly oriented but poorly connected natural fractures. The load-bearing capacity and load-deflection curves are compared for reservoirs with and without hydraulic fracturing. The simulations have been performed for different set of natural fractures to understand the effect of fracture density and other fracture network properties on the load-deflection curves.

How to cite: Kar, S. and Chaudhuri, A.: Phase field method to model mixed-mode fracturing in fluid saturated porous reservoir, EGU General Assembly 2023, Vienna, Austria, 23–28 Apr 2023, EGU23-10795, https://doi.org/10.5194/egusphere-egu23-10795, 2023.

 Deep geothermal reservoirs are often naturally or hydraulically fractured media which consist of a rock matrix and a network of randomly oriented discrete fractures of different sizes. In the present study, a three-dimensional model of coupled flow, heat transfer and deformation of fractured geothermal reservoir is developed. Because of high thermal expansibility and high mobility, supercritical C02 is under consideration as an alternative fluid to water/brine for extracting energy from geothermal reservoir. However, for simulation of CO2 based EGS, two phase flow model should be included and this makes the coupled model far more nonlinear and complex. FEHM which is one of the most robust code developed at LANL is capable to simulate the multi-physics problem of geosciences. We have found that the computational cost for CO2 based EGS a few times higher than that of water based EGS. Due to temperature drawdown and pressure difference between injection and production wells thermo-poro-elastic stresses are induced within the reservoir. This can influence larger shear dislocation, and normal opening /closing of fracture causing changes in the fracture aperture and permeability during the extraction of the geothermal energy from a reservoir. The correlation of the variation of fracture permeability with the variation of the local stress tensor has been taken into account in this study. To study the permeability alteration on geothermal energy extraction for water and CO2  based EGS different fracture networks, different values of injection temperature and injection pressure are considered. Three-dimensional fracture networks of randomly oriented rectangular fractures with different sizes, and dip angles are created using ADFNE Matlab code. A structured computational mesh is created for simulating the multiphase flow, heat transfer and geomechanics. The nodes belonging to the fractures are assigned appropriate permeability, thermal conductivity and mechanical properties depending on the fracture aperture. The values of these properties are subjected to alteration based on local stress values.

How to cite: Adhikary, S. S. and Chaudhuri, A.: Thermo-poro-elastic stress induced aperture alteration of fractured geothermal reservoir and its effect on geothermal energy production, EGU General Assembly 2023, Vienna, Austria, 23–28 Apr 2023, EGU23-10797, https://doi.org/10.5194/egusphere-egu23-10797, 2023.

EGU23-12483 | ECS | Orals | ERE5.2

Mineralogical control on fault friction and stability: a systematic study on quartz, calcite and muscovite ternary mixtures. 

Roberta Ruggieri, Giacomo Pozzi, and Cristiano Collettini

During fault evolution different rock types are fractured and sheared within the fault core, producing fault gouges with heterogeneous mineralogical composition. Mineral composition exerts a primary control on fault frictional properties and hence on fault slip behaviour. Understanding the conditions that lead to seismic or aseismic fault slip is of great interest to earthquake hazard assessment both for natural and induced seismicity. Although the effect of single mineral phases is probably the most documented factor in laboratory tests, no clear link has been established to understand how systematic variation of different mineral phases in gouge mixtures influences the macroscopic frictional behaviour.

Here we present an experimental study designed to probe the control of mineral composition on fault friction and stability responses. We selected three representative mineral phases, commonly found in fault zones, that are known to have severely different frictional properties: muscovite (phyllosilicate), quartz (granular silicate) and calcite (granular carbonate). Thirty double direct shear experiments were performed using a biaxial rock deformation apparatus (BRAVA) on powders (with grain sizes < 125 µm) of pure minerals and their mixtures at normal stress of 50 and 100 MPa, at room temperature and water saturation conditions. After an initial sliding of 10 mm at 10 µm/s to develop a steady state shear fabric, slide‐hold‐slide sequences (30-1000 s) and velocity steps (0.3-300 µm/s) were employed to evaluate static healing and frictional stability, respectively.

Our experimental data indicate that the mineralogical composition of fault gouges significantly affects the frictional strength, healing, and stability with a non-trivial pattern. Increasing phyllosilicate (muscovite) content results in a decrease of the frictional strength, from 0.62 for pure calcite and 0.56 for pure quartz down to 0.33 for pure muscovite powders. This effect is more marked in calcite-rich mixtures rather than quartz-rich ones, possibly due to favourable conditions for fluid-assisted pressure-solution at grain contacts. Calcite-muscovite interaction also favours a reduction of frictional healing and a more marked velocity-strengthening behaviour (promoting stable sliding and fault creep) in comparison to quartz-muscovite mixtures.

How to cite: Ruggieri, R., Pozzi, G., and Collettini, C.: Mineralogical control on fault friction and stability: a systematic study on quartz, calcite and muscovite ternary mixtures., EGU General Assembly 2023, Vienna, Austria, 23–28 Apr 2023, EGU23-12483, https://doi.org/10.5194/egusphere-egu23-12483, 2023.

EGU23-13820 | ECS | Orals | ERE5.2

Electric self-potential monitoring of hydraulic fracturing experiments in the Äspö Hard Rock Laboratory, Sweden. 

Nadine Haaf, Luis Guarracino, Damien Jougnot, and Eva Schill

A number of six in situ hydraulic fracturing experiments were carried out at the Äspö Hard Rock Laboratory (Sweden) in 2017 in a depth of 410 m. Here we present electric self-potential monitoring during the conventional and the step-wise cyclic injection experiments HF2 and HF3. Electric self-potential data were acquired through a two-sensor array, each including nine measuring probes and one base probe, that were installed at the 410 m and 280 m levels. The experimental borehole F1 is drilled in the direction of Shmin, perpendicular to the expected fracture plane. The self-potential sensors are installed sub-parallel to Shmin at level 410 at a distance of 50-75 m to the borehole F1 and sub-perpendicular to Shmin at level 280 m at a distance of 150-200 m to F1. The self-potential data were measured with a sampling rate of 1 Hz. Here, we propose a 1-D modelling of the streaming potential that approximates the measured self-potential data. These streaming potential gradients ∆V are estimated from the simulated pressure signals and the coupling coefficient.

How to cite: Haaf, N., Guarracino, L., Jougnot, D., and Schill, E.: Electric self-potential monitoring of hydraulic fracturing experiments in the Äspö Hard Rock Laboratory, Sweden., EGU General Assembly 2023, Vienna, Austria, 23–28 Apr 2023, EGU23-13820, https://doi.org/10.5194/egusphere-egu23-13820, 2023.

EGU23-13949 | ECS | Posters on site | ERE5.2

Permeability and Compressibility Evolution of Fractured and Intact Reservoir Rocks from the Blue Mountain Geothermal Field, Nevada 

Valerian Schuster, Erik Rybacki, Anja M. Schleicher, Trenton T. Cladohous, Roshan Koirala, and Thomas H.W. Göbel

Many reservoir rocks of productive geothermal energy resources display low porosity and matrix permeability. Therefore, to enhance fluid flow, fault zones and natural fracture networks are increasingly targeted for geothermal energy exploitation that are hydraulically connected to geothermal wells by stimulating the reservoir units. To this end, fluid is injected into the reservoir, which is generally believed to reduce effective stress and induce minor slip along stressed faults. Fluid injection can also lead to induced microseismicity and remotely-triggered earthquakes at great distances from the target reservoirs. The Blue Mountain geothermal field produces the largest seismic activity during maintenance shutdowns of injection and production requiring additional mechanisms such as poroelastic stress effects. In order to improve seismic hazard assessment and the understanding of induced seismicity around injection wells, we explore the coupling between matrix permeability, fault zone hydrology and mechanical behavior.

One main goal of this work is to provide insight into the scale-dependence of permeability by comparing laboratory results with previous permeability measurements using tidal responses in three different idle wells in Blue Mountain. We present a series of laboratory experiments performed on rock samples collected from the DB2 well at the Blue Mountain geothermal site in Humboldt County, Nevada, USA. The geothermal field benefits from the intersection of two W- and NW-directed normal faults resulting in high permeability of the geothermal reservoir production zone controlled by a brittle damage zone. Samples were obtained from two different lithologies, both of Triassic age, that constitute the reservoir. The first set of samples are low-porosity, (0.4 vol%) quartz-dominated (~50 – 60 wt%) phyllites, which exhibit zones with pronounced fracturing and elevated porosity (3.8 vol%). The second set of samples are felsic intrusive rocks with moderate to high porosity (7 – 15 vol%) due to strong hydrothermal alteration and clay mineral formation. Samples from both lithologies were selected from different sections of the damage zone showing varying degrees of faulting, from intact to highly brecciated, containing mineralized veins. We determine flow and poroelastic properties of cylindrical samples with a length of 2 cm and a diameter of 5 cm, subjected to stepwise cyclic variation of pore (<40 MPa) and confining pressure (<45 MPa). At each pressure step, we measure volumetric strain changes to derive the bulk modulus and effective stress coefficient, and use steady-state or pore pressure oscillation to determine permeability.

In addition to the tidal response and laboratory results, we developed a high-resolution seismicity catalog based on more than three years of continuous waveforms records from 2016 to 2019. We performed template-matching and differential travel-time inversions and use the resulting seismic events with magnitudes between 0.7 – 2.7 to search for seismicity migration patterns associated with discrete injection events. Integration of field and laboratory results can improve the characterization of the permeability structure of the fault zone at Blue Mountain and help to understand the mechanisms that trigger seismic events during production shutdown as well as the role of poroelastic stress release.

How to cite: Schuster, V., Rybacki, E., Schleicher, A. M., Cladohous, T. T., Koirala, R., and Göbel, T. H. W.: Permeability and Compressibility Evolution of Fractured and Intact Reservoir Rocks from the Blue Mountain Geothermal Field, Nevada, EGU General Assembly 2023, Vienna, Austria, 23–28 Apr 2023, EGU23-13949, https://doi.org/10.5194/egusphere-egu23-13949, 2023.

EGU23-14955 | Posters on site | ERE5.2

Equivalent Biot and Skempton coefficients for fractured rocks 

Silvia De Simone, Caroline Darcel, Hossein A. Kasani, Diego Mas Ivars, and Philippe Davy

Biot coefficient and Skempton coefficient are key descriptors of the coupled hydro-mechanical (HM) behavior of fluid-saturated porous materials. Biot coefficient defines a relationship between an applied load, fluid pressure and the stress that effectively acts on the solid skeleton. Skempton coefficient defines the temporary pore pressure variation caused by the application of a load in undrained conditions. The product of the two coefficients establishes the impact of an applied load on the solid skeleton, and thus the material deformation, under undrained conditions. The two coefficients are generally estimated through analytical expressions valid for isotropic homogeneous materials, or they are experimentally estimated at the laboratory sample-scale.

In this work, we define a framework for the evaluation of equivalent Biot coefficient and Skempton coefficient at the scale of a fractured rock mass. We derive theoretical expressions that estimate the two equivalent coefficients from the properties of both the porous intact rock and the discrete fracture network (DFN), including fractures with different orientation, size, and mechanical properties. These formal expressions are validated against results from fully coupled hydro-mechanical simulations on systems with explicit representation of deformable fractures and rock blocks. We show that the coefficients largely vary with the fracture orientation and density, which implies that disregarding the presence of fractures may incur an incorrect evaluation of the HM response. We also discuss the variability of the coefficients under different settings of DFN properties, including realistic scaling conditions of size-dependent and stress-dependent fracture properties.

How to cite: De Simone, S., Darcel, C., Kasani, H. A., Mas Ivars, D., and Davy, P.: Equivalent Biot and Skempton coefficients for fractured rocks, EGU General Assembly 2023, Vienna, Austria, 23–28 Apr 2023, EGU23-14955, https://doi.org/10.5194/egusphere-egu23-14955, 2023.

EGU23-14982 | Orals | ERE5.2

Constraining the impact of cyclic hydraulic stimulation on granites 

Jackie E. Kendrick, Julian Mouli-Castillo, Anthony Lamur, Andrew Fraser-Harris, Alexander Lightbody, Mike Chandler, Katriona Edlmann, Christopher McDermott, and Zoe Shipton

Subsurface engineering, such as geothermal energy extraction, requires knowledge of the rupture of geomaterials. Of particular importance is the time- and rate-dependence of material strength, which impacts fracture architecture and thus hydraulic conductivity and system permeability. Cyclic soft stimulation (CSS) techniques have been developed to maximise the efficiency of resource extraction whilst minimising large amplitude, fluid-injection induced seismicity. Here, we explore the benefits of cyclic stimulation experimentally, utilising novel “pulsed pumping” hydraulic fracture tests in which fluid pressure is cycled within the central borehole of a suite of 20x20cm cylinders of dense granite. The response is monitored at high-resolution by fibre-optic circumferential strain measurements, fluid pressure data and acoustic emission recording. Using cyclic high-low pressure square waves, we found that breakdown pressure was reduced by up to 15% compared to the monotonic case in which pressure was increased by applying a constant flow rate. Whilst peak pressure had the primary control on the number of cycles to failure, increasing the minimum pressure in the borehole (thus increasing mean pressure) further reduced breakdown pressure, suggesting that even small pressure fluctuations during hydraulic stimulation may reduce the largest stress drops, and hence the magnitude of induced seismic events. Strain measurements detected accelerating precursory deformation a few cycles prior to failure, hinting at the opportunity for responsive stimulation practices where activity can be monitored in real-time. These novel large-scale, high-resolution experiments were complemented by indirect tensile measurements at a range of strain rates, and by cyclic fatigue Brazilian disc testing at a range of peak loads and cycle amplitudes. These results further highlight the increasing contribution of time-dependent deformation during slower and cyclic loading, resulting in lower peak loads and reducing large magnitude fracturing events. The generated S-N curves demonstrate that weakening by cyclic hydraulic pressurisation mimics relationships defined by conventional fatigue testing of geomaterials. Such experimental constraints will be of great benefit to the development of cyclic stimulation practices for subsurface engineering.

How to cite: Kendrick, J. E., Mouli-Castillo, J., Lamur, A., Fraser-Harris, A., Lightbody, A., Chandler, M., Edlmann, K., McDermott, C., and Shipton, Z.: Constraining the impact of cyclic hydraulic stimulation on granites, EGU General Assembly 2023, Vienna, Austria, 23–28 Apr 2023, EGU23-14982, https://doi.org/10.5194/egusphere-egu23-14982, 2023.

EGU23-15424 | ECS | Posters on site | ERE5.2 | Highlight

Structural evolution in the northern Ruhr basin: A case study of urban geothermal exploration in the Münsterland Region 

Vladimir Shipilin and Manfred Dölling

The geothermal potential in the deep subsurface of North Rhine-Westphalia (NRW) has been scarcely explored. Due to the increasing demand for zero-carbon heating applications, there has been a renewed phase of seismic exploration in the region to investigate potential geothermal aquifers. The prime exploration target is the Lower Carboniferous Ruhr Basin and the Devonian substratum of the Variscan foreland, as they host deep carbonate aquifers. Interpretation of the recently-acquired 70-km-long 2D seismic profiles, together with the 2D legacy seismic data in the northern part of the Ruhr basin, the Münsterland region, reveals two carbonate units; the Dinantian platform facies and the Givetian massive facies. These are located at depths that range from c. 4500 m to 6000 m. Considering their great burial depth, the permeability of the carbonate rocks is considered to be primarily facilitated by fault zones with dense fracture swarms. Therefore, understanding the complex deformation history of this fossil foreland basin is crucial to evaluate its geothermal potential. We here reveal the timing and geometric evolution of the fault zones. Using a multiattribute seismic analysis, we delineate three major types of faults; (1) SW–NE-⁠trending, syn-fold thrusts, (2) WNW–ESE-striking normal faults, and (3) E–W and N–S strike-slip faults. Interestingly, we do not observe in the available data flexure-induced faults that are typical for foreland basins and would be expected to strike parallel to the SW–NE-oriented Variscan Orogen. To constrain the relative timing of fault activity, we mapped seven well-constrained and age-calibrated stratigraphic horizons within the Carboniferous molasse sequence and the Cretaceous cover. The preliminary results confirm the observations of previous researchers that the thrust faults formed after the deposition of the Late Carboniferous strata, as evidenced by their concordant folding. Thrusts are crosscut by the normal faults, suggesting that the latter formed at a subsequent stage. Most of the strike-slip faults cut through the Carboniferous–Cretaceous unconformity, with some culminating in the Cretaceous cover as positive flower structures. Notably, one flower structure is co-linear with a thrust fault in the Carboniferous, suggesting that there is some degree of kinematic linkage between the two structural levels. Possibly, some of the optimally-oriented thrusts were reactivated and grew upward as strike-slip faults during Late Cretaceous transpression. Such multiphase evolution of fault zones may enhance permeability structure, since each reactivation event potentially contributes to the widening of the deformation zones, thereby increasing the density of interconnected fractures. In this study, we demonstrate how the integration of new seismic data provides valuable insights into the structural evolution of the Ruhr Basin and its geothermal potential. A 3D seismic acquisition campaign is planned in the investigated region. Using its results, we intend to conduct a high-resolution fault throw analysis to further constrain the kinematic development of the deformation structures.

How to cite: Shipilin, V. and Dölling, M.: Structural evolution in the northern Ruhr basin: A case study of urban geothermal exploration in the Münsterland Region, EGU General Assembly 2023, Vienna, Austria, 23–28 Apr 2023, EGU23-15424, https://doi.org/10.5194/egusphere-egu23-15424, 2023.

Previous hydrocarbon exploration in the Ordos, Tarim, and Sichuan basins of China has indicated that strike-slip faults play an important role in controlling reservoir distribution. High hydrocarbon production within strike-slip fault zones in these basins indicates that the fault zones not only act as conduits or seals for hydrocarbon migration, but also provide space for hydrocarbon accumulation. The productivity of different wells, however, can vary within one strike-slip fault zone, suggesting that variability in fault zone architecture controls hydrocarbon enrichment. To date, very few studies have explored fault zone architecture in the southern Ordos Basin, inhibiting oil exploration and development. We explored faults in the Jinghe Oilfield in the southern Ordos Basin by integrating outcrops, wellbore cores, well logs, and 3D seismic data. We carried out fault segmentation, qualitative characterization of fault zone architecture, and quantitative characterization of the boundary between the damage zone and wall rock. The results showed that fault zone architecture is complicated by fault segmentation, architectural configuration, and damage zone asymmetry. Strike-slip faults can be divided into transtensional, strike-slip, and transpressional segments along the fault strike, with transtensional and strike-slip segments dominant in the Jinghe Oilfield. Each segment is further complicated by different configurations of gouge, breccia, and fracture zones along the fault dip. Compared with the strike-slip segments, transtensional and transpressional segments showed more complexity, with the fracture density and damage zone width of the hanging wall being greater than that of the footwall. Transtensional segments with braided and horsetail structures showed more complexity owing to the presence of multiple fault cores and damage zones around the main fault and its subsidiary faults. Quantitative analysis showed that the fault zone width was the greatest for transtensional segments, intermediate for transpressional segments, and the lowest for strike-slip segments. We determined a positive linear relationship between the relative widths of the fault core and fault zone. The cavities in breccia zones and fractures in damage zones provide conduits and storage space for hydrocarbon migration and accumulation. We conclude that damage zones in transtensional segments, particularly in the hanging wall, are primary potential targets for petroleum exploration and development.

How to cite: Meng, Y., Chen, H., Luo, Y., Zhao, Y., Tang, D., and He, F.: Architecture of intraplate strike-slip fault zones in theYanchang Formation, Southern Ordos Basin, China: Characterizationand implications for their control on hydrocarbon enrichment, EGU General Assembly 2023, Vienna, Austria, 23–28 Apr 2023, EGU23-17164, https://doi.org/10.5194/egusphere-egu23-17164, 2023.

EGU23-17201 | Orals | ERE5.2

Micro-Continuum Modelling of Coupled Hydro-Bio-Chemical MICP Processes in Fractured Rock 

Guijie Sang, Rebecca Lunn, Grainne El Mountassir, and James Minto

Subsurface storage of CO2 and retrievable green energy (i.e. compressed air and hydrogen) in depleted gas reservoirs, deep saline aquifers and salt caverns, are considered as key transitions within the energy sector to enable many countries to meet their net zero carbon emissions targets. One of the main challenges in underground storage is the presence of potential leakage pathways (such as caprock fractures/faults) which pose a threat to economic feasibility and to the environment. Seeking an efficient technique to remediate leakage pathways is crucial to guarantee sealing efficacy. Microbially induced carbonate precipitation (MICP) is regarded as a promising bio-grouting technique for leakage remediation due to its advantages such as the low water-like viscosity and micron-size microbes, which enables permeation far from the injection point and excellent penetration into fine aperture fractures.

MICP utilizes ureolytic bacteria, commonly Sporosarcina pasteurii (S. pasteurii) to produce highly active urease enzyme, which can catalyze urea hydrolysis and result in the production of carbonate ions. Carbonate precipitation occurs if a calcium source is supplied, which can effectively remediate leakage by filling void space and improve strength by bonding solid grains.

We propose a micro-continuum model which accounts for the coupled hydro-bio-chemical MICP processes in fractured porous rock. In this micro-continuum model, the flow is controlled by the Darcy-Brinkman-Stokes equation over a number of control volumes (i.e. voxels based on X-ray CT scan). The kinetic parameters of urea hydrolysis and calcium carbonate precipitation are calibrated based on batch experiments. The bacteria deposition parameters, which feature the bacteria deposition in fractured rock, are calibrated based on experimentally measured bacteria breakthrough curves in a 1-dimensional column filled with fracture gouge materials. The proposed micro-continuum model can well represent the decreases in porosity and permeability of an artificially-cut anhydrite fracture filled with anhydrite gouges under MICP treatment cycles. Our modelling results also suggest that when the CaCl2 concentration is equal to or higher than the urea concentration in the injected cementing solution, the rate of microbially induced carbonate precipitation is predominantly limited by the kinetics of urea hydrolysis rather than the kinetics of calcium carbonate precipitation. The proposed micro-continuum model serves as a useful tool for evaluating MICP treatment strategies and may be upscaled to predict and optimise field-scale leakage remediation.

How to cite: Sang, G., Lunn, R., El Mountassir, G., and Minto, J.: Micro-Continuum Modelling of Coupled Hydro-Bio-Chemical MICP Processes in Fractured Rock, EGU General Assembly 2023, Vienna, Austria, 23–28 Apr 2023, EGU23-17201, https://doi.org/10.5194/egusphere-egu23-17201, 2023.

EGU23-154 | ECS | Posters virtual | NH10.1

Challenges for assessing the risk of compound extremes 

Ravi Kumar Guntu, Bruno Merz, and Ankit Agarwal

The effects of compound extremes (for example, Compound dry hot extremes (CDHE)) in a region simultaneously are more adverse than those of individual dry or hot events. The likelihood of such events depends on the marginal distribution of drivers and their dependence. An approach to assess CDHE probability is urgent because of their frequent occurrence caused by global warming. This study shows how CDHE probability changes with the selection of reference period. We considered the WMO recommended period 1961-1990 and a recent climate normal 1991-2020 to show the effect of the reference period on the likelihood. We applied the framework to homogenous regions of India during the monsoon season. Insights show that CDHE is more likely to occur in arid regions than in other climatic regions. The results of this study are useful for further exploration and provide new insights into the emerging changes in CDHE.


How to cite: Guntu, R. K., Merz, B., and Agarwal, A.: Challenges for assessing the risk of compound extremes, EGU General Assembly 2023, Vienna, Austria, 23–28 Apr 2023, EGU23-154, https://doi.org/10.5194/egusphere-egu23-154, 2023.

EGU23-717 * | ECS | Posters on site | NH10.1 | Highlight

A continental-scale multi-hazard analysis of economic recovery using nighttime light satellite data 

Sophie L. Buijs, Marleen C. de Ruiter, and Philip J. Ward

Risk assessments and disaster management are generally approached from a single-hazard perspective, ignoring the spatial and temporal connections and feedback loops that are involved when consecutive disasters occur. Not only can the total impact of a multi-hazard event differ from the sum of the impacts of the individual events, but the response and recovery process can also be more challenging for multi-hazard events when compared to a single-hazard disaster. Depletion of financial and human resources after a first hazard may for instance increase people’s vulnerability at the time of a second event. This was demonstrated in northern Mozambique, where tropical cyclones Idai and Kenneth made landfall only six weeks apart, early 2019. Despite continued high needs and dependence on humanitarian aid after the second event, UN agencies and partners struggled to provide additional support, due to exhausted stocks and funds after their initial response efforts to Idai. 

This study (that is part of the MYRIAD-EU project), focuses on post-disaster recovery, which is an often overlooked and misunderstood component of the disaster management cycle. A single-hazard approach to understanding recovery does not sufficiently reflect the complexity that is involved in multi-hazard events due to the potential feedbacks and interactions between hazards and their effects. While several recent studies have made efforts to improve our understanding of the relationships between single natural hazards and the recovery thereafter, recovery dynamics after multi-hazard events are still poorly understood. Additionally, the studies that have looked into recovery after natural disasters are often focussed on a single hazard type or limited set of extreme events in a specific region. To address this knowledge gap, this study sets out to compare economic recovery after multi-hazard events and single-hazard events on a continental scale.

Visible Infrared Imaging Radiometer Suite Nighttime Light (VIIRS NTL) data (2013-2022) are used as a proxy for economic recovery. To characterize recovery after different single- and consecutive events, accounting for geological, meteorological, and hydrological hazards, monthly changes in night light intensity are computed. A comparison of the recovery profiles of single- and multi-hazard events will then result in an improved understanding of the different trends and dynamics that are involved with economic recovery after multi-hazard events. The results of this study can be used by policy-makers and aid organizations to improve their disaster management strategies. Moreover, the resulting characterisation of economic recovery after single- and multi-hazard events will support future research into the identification of socio-economic factors that affect the recovery in a multi-hazard context.

How to cite: Buijs, S. L., de Ruiter, M. C., and Ward, P. J.: A continental-scale multi-hazard analysis of economic recovery using nighttime light satellite data, EGU General Assembly 2023, Vienna, Austria, 23–28 Apr 2023, EGU23-717, https://doi.org/10.5194/egusphere-egu23-717, 2023.

EGU23-800 | ECS | Orals | NH10.1

A Novel Method to Generate Global Multi-Hazard Event Sets 

Judith Claassen, Philip Ward, Elco Koks, James Daniell, Timothy Tiggeloven, and Marleen De Ruiter

While the last decade saw substantial scientific advances in studies aimed at improving our understanding of natural hazard risk, research and policy commonly address risk from a single-hazard, single-sector perspective. Thus, not considering the spatial and temporal interconnections of these events. Single-hazards risk analyses are often inaccurate and incomplete when multi-hazard disasters occur, as the interaction between them may lead to a different impact than summing the impacts of single events.

A key first step to reduce this inaccuracy is to create greater understanding of realistic multi-hazard event sets that better examines statistical dependencies between hazard types. Therefore, it is important to understand the spatial and temporal aspects of each individual hazard in order to evaluate when multiple coinciding hazards are a multi-hazard event. To do so, single hazards datasets for meteorological, geological, hydrological and climatological events are explored with the use of a decision tree. The decision tree accounts for varying intensities and time-lags between hazards to better address the dynamics of vulnerability. This paper provides a decision tree that enables realistic multi-hazard event sets to be created based on varying assumptions (such as, the time-lag, the time between two individual hazards). By generating a, first of its kind, global multi-hazard event set database, spanning from 2004 to 2016, we achieve a greater knowledge of the different types of multi-hazards, such as triggering, amplifying, compound and consecutive events, as well as their interconnections. This global dataset provides practitioners and other stakeholders with insights on the frequency of different multi-hazard events and their hotspots. The methods provided in this paper is opensource and can be used by other researchers to conduct a more comprehensive multi-risk assessment.

How to cite: Claassen, J., Ward, P., Koks, E., Daniell, J., Tiggeloven, T., and De Ruiter, M.: A Novel Method to Generate Global Multi-Hazard Event Sets, EGU General Assembly 2023, Vienna, Austria, 23–28 Apr 2023, EGU23-800, https://doi.org/10.5194/egusphere-egu23-800, 2023.

EGU23-892 | ECS | Posters on site | NH10.1

A spatiotemporal indicator-based method to assess the drought and heat risks for urban green infrastructure 

Raghid Shehayeb, Regine Ortlepp, and Jochen Schanze

Given the significance of urban green infrastructure (UGI) and their ecosystem services (ES) towards urban climate resilience and sustainable development, a practical method to assess the drought and heat risks for UGI is needed for understanding the risks, selecting reduction alternatives and protecting the benefits of UGI. Hence, this study develops a spatiotemporal indicator-based method, based on a conceptual drought and heat risk assessment framework, which supports decision makers in analyzing and evaluating risks under changing conditions, and selecting risk-reduction alternatives. The UGI types of parks, creeks, and lakes are selected as representative UGI for this study for developing the assessment method. Subsequently, endpoints as variables of the biophysical risk system are derived considering the processes of drought and heat hazards, exposed UGI entities, ecosystem functions and ES. The biophysical endpoints such as biota, soil-water dynamics, and UGI’s cultural uses, are then translated into information with descriptors explaining their vulnerability aspects following a multi-layer approach and interpreted over three dimensions of provisioning, regulating, and cultural. The multi-layer approach states that the layers of descriptors are accompanied with layers of indicators as a mean to operationalize these characteristics. A two-stage literature review is applied to identify vulnerability indicators for the defined descriptors, whereas a lane-based approach is followed to interrelate these indicators based on their qualities we refer to as attributes. Using the attributes of the drought and heat hazards, the vulnerability indicators are linked with the hazards to derive risk indicators. By introducing these vulnerability and risk indicators, we pave the road for the analysis and evaluation of compound risks to support the decision makers in planning and managing UGI and protecting their ES under these risks. 

How to cite: Shehayeb, R., Ortlepp, R., and Schanze, J.: A spatiotemporal indicator-based method to assess the drought and heat risks for urban green infrastructure, EGU General Assembly 2023, Vienna, Austria, 23–28 Apr 2023, EGU23-892, https://doi.org/10.5194/egusphere-egu23-892, 2023.

EGU23-1658 | ECS | Orals | NH10.1

Exploring disaster risk management pathways in complex, multi-risk systems using DAPP-MR 

Julius Schlumberger, Marjolijn Haasnoot, Jeroen Aerts, and Marleen de Ruiter

Climate change and socioeconomic developments are driving risks from natural hazards and thus determine the effectiveness and efficiency for disaster risk management strategies. With DAPP-MR, an approach to apply a decision-focused lens, and a longer-term planning perspective in multi-risk systems has been recently developed. DAPP-MR  guides the exploration of disaster risk management pathways under uncertainty while explicitly accounting for trade-offs and synergies of policy measures across (interconnected) sectors, hazards, and time.

This work provides a first insight into the utility of the DAPP-MR framework to support disaster risk management decision making in the complex context of multi-hazard, multi-stakeholder settings. We used an integrated impact assessment modelling environment to assess (multi-)hazard impacts in a synthetic river basin, capturing interests and dynamics of three sectors (agriculture, inland shipping, residential housing) exposed to interacting flood and drought-hazards. We showcase (interactive) methods and metrics for the analysis and evaluation of potential risk management pathways. They were selected to deal with the increasingly multi-objective set-up in multi-risk systems  explicitly capturing and explore effects from integrating measures directed towards different hazards and sectors.

How to cite: Schlumberger, J., Haasnoot, M., Aerts, J., and de Ruiter, M.: Exploring disaster risk management pathways in complex, multi-risk systems using DAPP-MR, EGU General Assembly 2023, Vienna, Austria, 23–28 Apr 2023, EGU23-1658, https://doi.org/10.5194/egusphere-egu23-1658, 2023.

EGU23-2155 | ECS | Posters on site | NH10.1

EroCA: a new tool for simulating constructed landform erosion 

Shahla Yavari, Neil McIntyre, Qi Shao, and Thomas Baumgartl

Extensive disturbances during the mining and rehabilitation process can include removal of vegetation, removal and storage of soils hence their modification, changes in topography, and planting of new vegetation. A main goal of mine rehabilitation is to produce a post-mining landscape that is resistant to geotechnical failure and to surface erosion processes. To achieve this, hydrology and erosion models are required to determine erosion rates under alternative landscape designs, including landscape form and cover options.

By critical review of the relevant literature, it was found that most previous erosion modelling studies have concentrated on surface hydrology in agricultural, forestry, and other natural systems, while disturbed ecosystems like mining regions have received little attention. Landscape evolution models have been developed for mined landform applications but modelling over long time-scales compromises the temporal and spatial resolution.

The main objectives of this research therefore were:

  • Extend an existing plot-scale hydrological model to plot-scale erosion model.
  • To improve knowledge of the errors and uncertainty in applying a high-resolution erosion model to mined landforms and to conclude on the potential applicability and limitations of EroCA.

The experimental data used in the research were from a 30 m × 30 m field plot on a mine waste rock dump in the wet tropical environment of the Ranger mine (north-east Australia) from the period 2009 to 2014. The new EroCA model is an extension to the RunCA model, which was developed to provide high resolution simulation of runoff and infiltration in constructed landforms. The extended model uses mass balance principles and established erosion and sediment transport models, covering both suspended and bedload, and solves the equations using the cellular automata approach. Code verification against analytical solutions of runoff and sediment illustrated small errors, which were partly due to approximations used in the analytical solutions. The EroCA model was then applied to the Ranger experimental plot data to assess the suspended and bedload erosion performance. EroCA was able to reasonably represent the observed flows and turbidity profiles. Although an arbitrary reduction in the erodibility parameter value of 20% per year was needed to simulate the bedload depletion.

How to cite: Yavari, S., McIntyre, N., Shao, Q., and Baumgartl, T.: EroCA: a new tool for simulating constructed landform erosion, EGU General Assembly 2023, Vienna, Austria, 23–28 Apr 2023, EGU23-2155, https://doi.org/10.5194/egusphere-egu23-2155, 2023.

EGU23-2413 | Posters on site | NH10.1

An operational tool for geo-hydrological scenario risk assessment and cascading effects evaluation 

Daniela Biondi, Graziella Emanuela Scarcella, and Pasquale Versace

Building multiple, complex risk scenarios is a priority for the improvement of the effectiveness of early warning systems and technical countermeasure designs to detect phenomena associated with severe weather events, such as floods and landslides.

This study introduces CERCA (Cascading Effects in Risk Consequences Assessment), a methodology for the characterisation of event scenarios that is consistent with the current Italian Civil Protection Guidelines on the national warning system for weather-related geo-hydrological and hydraulic risks.

The aim is to propose a simple, effective, multiscale operational tool that can be adapted to multiple purposes. Specifically, the methodology frames the problem as a typical scenario analysis through the assessment of possible cascading effects and consequences characterised by a cause/effect relationship produced by a triggering event. The proposed conceptual framework for ‘cascade scenario’ assessment consists of four stages, referring to the characterization of:

  • Triggering Events,
  • cascading effects in terms of Representative Elementary Phenomena,
  • cascading effects in terms of Damaged Elements at Risk,
  • Fatalities Circumstances.

The CERCA approach can be effective:

  • in processing post-disaster information at the local level to identify site-specific dependencies based on local hazard proneness and exposure and vulnerability conditions as well as to prioritize countermeasures;
  • in supporting efficient surveillance of the real-time evolution of critical situations, helping operative structures of civil protection to update the picture of occurring phenomena;
  • in providing general dependency matrices to be used in the ‘ex-ante’ definition of scenarios and recurring cascading event trees, through analysis of several past events.

The methodology was assessed using a case study concerning a local event occurred in 2015 in the north-east of Calabria (Italy) and a back-analysis on 152 events in warning zones of the Italian territory that occurred during the period 2004–2021.

The first application aimed at illustrating CERCA functionality in describing cascading effects based on a post-disaster survey at a local level for a heavy rainfall event that caused flooding of various streams and widespread shallow landslides.

The national-scale back-analysis offered an overview of the chains generated by triggering events. The analysis showed that in over 50% of investigated cases, more than one triggering event was observed (most of the time floods accompanied by landslides), confirming the necessity for multi-risk analysis. ‘Pluvial flood’, particularly affecting urban areas, was the most frequent triggering event with 30%, mainly causing damage to basement or ground floor/yards of public and private buildings and to transport infrastructure. A detailed characterisation of the circumstances of death for 52 fatalities, further specified that the majority were flood-related fatalities (82%). Numerous people were affected outdoors along roads (35%) and travelling in vehicles (37%). Dependency matrices based on a frequency analysis, provided an overall picture of relations between different elements of the chain that, although limited to the number and type of investigated events, offers a preliminary assessment for further studies that could explore also the dependency from the severity of the forcing rainfall.

How to cite: Biondi, D., Scarcella, G. E., and Versace, P.: An operational tool for geo-hydrological scenario risk assessment and cascading effects evaluation, EGU General Assembly 2023, Vienna, Austria, 23–28 Apr 2023, EGU23-2413, https://doi.org/10.5194/egusphere-egu23-2413, 2023.

EGU23-2514 | Posters on site | NH10.1

The multi-hazard risk perception of young professionals and students in Geography and Tourism amid the Covid-19 pandemic 

Mihai Ciprian Margarint, Sanja Kovačić, Andra-Cosmina Albulescu, and Đurđa Miljković

Multi-hazard risk perception represents a research subject that has been gaining momentum in the context of the Covid-19 pandemic, based on the interaction between management practices aiming to reduce infection rates and to reduce the impact of other co-occurring natural hazards. The concurrent hazards proved to be the source of many hurtful, high-cost, but still invaluable lessons that should be capitalised on by the new generations to progress towards improved multi-hazard management strategies, and to a more sustainable, resilient and equitable society, as proposed by the 2030 Agenda for Sustainable Development. However, such high-level orders cannot be obtained without an adequate understanding of the new challenges posed by multi-hazard risks.

This paper aims to investigate the multi-hazard risk perception of young professionals or students who follow education programmes that aim to develop knowledge and skills related to the very subject of perception (i.e., natural hazards and risks). Zooming in, the paper focuses on the specialization and study level-dependent differences concerning multi-hazard risk perception and hazard-related education insights of future potential specialists in natural hazard-induced risk management and tourism reconstruction. The most prominent research questions (What is the perception of the students and graduates regarding the extent to which the Covid-19 pandemic has amplified the impact of other risks ?, Are there differences in the perception of Geography/ Tourism students and graduates about the impact of different natural hazards on social and economic activities?), as well as secondary aspects of the inquiry were addressed by applying a multi-level questionnaire on 547 students and graduates of Geography and Tourism specializations from two universities in Iași City (Romania) and Novi Sad (Serbia).

The implementation of the t-test pointed out that the main specialization-dependent differences concerned the perception level of certain natural hazards at different sales, the estimation of the impact of different hazards on socio-economic activities (including tourism), and the estimation of the positive effects of hazard-related education. These differences are complemented by the ones that depend on the level of study, which were analyzed through ANOVA and referred the scale of the impact specific to biophysical hazards, the amplification effect of the pandemic on different hazard and vulnerability types, and the different education cycles that the Curriculum upgrade should be performed at. It should be noted that no statistically significant differences emerged between Geography and Tourism students and graduates regarding the impact of the Covid-19 pandemic on training / career. On the other hand, Bachelor and Master level participants reported to be more affected by the pandemic than respondents from the highest tire of university education.

This study represents the first of its type, as it offers valuable insights on the multi-hazard risk perception of students and graduates that may acquire future decision-making, hazard-related research or teaching jobs. Understanding the opinions formed in their training years or in early-career stages provides important cues about tomorrow’s hazard management, and tourism reconstruction practices.

How to cite: Margarint, M. C., Kovačić, S., Albulescu, A.-C., and Miljković, Đ.: The multi-hazard risk perception of young professionals and students in Geography and Tourism amid the Covid-19 pandemic, EGU General Assembly 2023, Vienna, Austria, 23–28 Apr 2023, EGU23-2514, https://doi.org/10.5194/egusphere-egu23-2514, 2023.

The third decade of the century started with a major epidemiological disturbance that favoured the increase in the co-occurrence of hazards in both developed and developing countries. This translated into a multi-hazard research boost, aiming to explore the interactions between concurrent or cascading hazards, but also to propose improved multi-hazard management strategies.

Since floods represent frequent and impactful natural hazards, their spatial and temporal overlap with the Covid-19 pandemic resulted in compounded negative effects that are difficult to mitigate applying classical flood management plans. In return, the efforts of curbing SARS-CoV-2 infection rates become even more of a tall order during flood events. Therefore, both flood and pandemic management practices need to be amended considering each other’s aims, priorities, limitations, and strengths; which cannot be achieved without a proper understanding of the ways the two hazards interact.

This study questions whether the river flood events that occurred during the Covid-19 pandemic in Romania, and the way that they were managed, had an impact on the infection with the SARS-CoV-2 virus at county scale. The challenge of data scarcity was addressed by identifying the flood events of 2020-August 2022 based on the hydrological warnings issued by the National Institute of Hydrology and Water Management. In addition, hazard management data were extracted from autochthonous online press. Only flood events that were severe enough to impose the evacuation of population were corroborated with the Covid-19 confirmed cases dataset, and also with milestones of the Covid-19 preventive legal framework.

The flood events under analysis were followed by an increase in the total confirmed cases at the end of the Covid-19 incubation time range at county level, with only one exception. Infection rates varied in size, most of the counties registering under 50 new Covid-19 confirmed cases after 2 weeks since flood events. The viral load increased by a maximum of 208 new cases of Covid-19. These increases correspond to the late spring and summer months, defined by climatic conditions that hinder the spread of the virus, simultaneously allowing the relaxation of Covid-19 preventive measures. Consequently, low-level local and national viral loads prevented a post-flood spike in the Covid-19 positive cases, which explains the prevalence of increases under 50 new cases. In counties where the infection rate exceeded 150 additional cases, local-scale particularities should be considered. Thus, it is difficult to establish a definite link between flood events and the dynamics of the Covid-19 infection rates recorded in the selected counties.

This research work contributes to the multi-hazard research field by adding important insights on i) the impact of flood events on the number of Covid-19 confirmed cases in a country with high flood risk, and ii) the interactions between the Covid-19 and flood management practices, also providing an example on how to tackle the data scarcity problem through an adapted data collection procedure. The findings may be used to ground decision-making aiming to address the present-day multi-hazard riddle: natural hazard management requires collaboration, while Covid-19 management practices hold social distancing to the core.

How to cite: Albulescu, C. and Larion, D.: Unfolding multi-hazard interactions: Zooming in on the links between flood events and the Covid-19 infection rate in Romania, EGU General Assembly 2023, Vienna, Austria, 23–28 Apr 2023, EGU23-2797, https://doi.org/10.5194/egusphere-egu23-2797, 2023.

EGU23-2811 | ECS | Posters virtual | NH10.1

Assessment of flooding impact on water supply systems: a comprehensive approach based on DSS 

Bianca Bonaccorsi, Silvia Barbetta, Stavroula Tsitsifli, Ivana Boljat, Papakonstantinou Argiris, Jasmina Lukač Reberski, Christian Massari, and Emanuele Romano

The assessment of flood impact on a Water Supply System (WSS) requires a comprehensive approach including several scales of analysis and models and should be managed in the Water Safety Plans (WSP), as recommended in the EU Water Directive 2020/2184. Flooding can affect the quality of groundwater and surface water resources and can cause supply service interruption due to damaged infrastructures. A complete approach to address flood impact on WSS is required but is not yet available, while only specific aspects were investigated in details.

In this context, the MUHA project, funded by the European INTERREG V-B Adriatic-Ionian ADRION Programme 2014-2020, developed a comprehensive tool named WAter Safety Planning Procedures Decision Support System (WASPP–DSS). The tool is mainly addressed to small water utilities (WU) for supporting WSP development and is based on two main premises: 1) a correct approach for WSS risk analysis requires a multi-hazard perspective encompassing all the system components and different hazards; 2) other institutions in addition to WUs have to be involved in WSS risk analyses to harmonize monitoring and response procedures.

The tool was tested on six pilot areas of the ADRION region considering four hazards: drought, flooding, accidental pollution and damage to infrastructure due to earthquakes. In this work, the tool is demonstrated for flooding impact analysis in three pilot areas: the Ridracoli reservoir in Italy and two municipalities, Larissa in Greece and Zadar in Croatia. The WASPP–DSS, tested by eight WUs, was found a potentially valid support for small WUs that must start drafting the WSP in a comprehensive way and can provide a common shared scheme.

Improvements are desirable, as including a specific section to consider the issue of loss of water resources from reservoirs due to overflow.

How to cite: Bonaccorsi, B., Barbetta, S., Tsitsifli, S., Boljat, I., Argiris, P., Lukač Reberski, J., Massari, C., and Romano, E.: Assessment of flooding impact on water supply systems: a comprehensive approach based on DSS, EGU General Assembly 2023, Vienna, Austria, 23–28 Apr 2023, EGU23-2811, https://doi.org/10.5194/egusphere-egu23-2811, 2023.

EGU23-3461 | Orals | NH10.1

Impact webs: a novel approach for characterising and assessing multi-risk in complex systems 

Edward Sparkes, Davide Cotti, Himanshu Shekhar, Saskia E. Werners, Angel A. Valdiviezo-Ajila, Sumana Banerjee, Gusti Ayu Ketut Surtiari, Anthony J. Masys, and Michael Hagenlocher

Characterising and assessing multi-risk in complex systems is vital to realise the expected outcome of the Sendai Framework for Disaster Risk Reduction. As sectors and systems are increasingly interconnected, the space in which impacts cascade is expanding. This became apparent throughout the COVID-19 pandemic, but can also be seen in the compounding and cross-border effects of climate change and connected extreme events, or from global ripple effects of armed conflicts such as the aggression committed by Russia against Ukraine. Single-hazard and single-risk approaches, while useful in certain contexts, are becoming increasingly insufficient for comprehensively managing risk due to cross-sector and cross-system interactions. There is therefore a need to develop tools that can account for how multiple hazards interact with multiple vulnerabilities of interdependent systems and sectors, which requires a systemic perspective for assessing risks.

To this aim, we developed a novel analytical tool to characterise the interconnections between risks, their underlying hazards, risk drivers, root causes and responses to risks and impacts across different systems. The tool draws on the impact chains approach (i.e. conceptual models for climate risk assessment), expanding its linear and sectoral focus towards a system-oriented view. We follow the recommendation of Zebisch et al (2021) and name this tool ‘Impact Webs'. 

We applied the tool to five case studies in Bangladesh, Ecuador, India, Indonesia and Togo to characterise and assess cascading risks linked to COVID-19, responses to it (e.g. restriction measures) and other hazards that co-occurred during the pandemic (e.g. hydrological, geophysical, climatological). The participatory co-development of the Impact Webs was led by local case study experts and involved desk research, stakeholder workshops and expert/community consultations.

These diverse applications at multiple scales showed that Impact Webs are useful to conceptualise and visualise networks of interconnected elements across sectors. Because of the tools suitability to simultaneously analyse the interactions of multiple hazards with multiple pre-existing vulnerabilities, it provided a representation of the multi-risk space in the case studies. This is promising to identify critical elements for further investigation, such as feedback effects, trade-offs and key agents that can influence risks in systems. To this aim, the tool not only accounts for negative impacts, but also how policy responses and societal reactions to policies can lead to additional positive outcomes, as well as unintended consequences, i.e. risks arising from responses. However, given the complexity of systems and system boundaries, it is not possible to characterise all interconnections using Impact Webs. While this simplification of reality is useful for communication purposes, only the most prominent outcomes of the tool are derivable, and although the participatory approach aims to reduce this, results can be influenced by inherent biases. Despite these challenges, we find that Impact Webs are a promising new approach to characterise and assess multi-risk, thereby supporting comprehensive disaster risk management. 

How to cite: Sparkes, E., Cotti, D., Shekhar, H., Werners, S. E., Valdiviezo-Ajila, A. A., Banerjee, S., Surtiari, G. A. K., Masys, A. J., and Hagenlocher, M.: Impact webs: a novel approach for characterising and assessing multi-risk in complex systems, EGU General Assembly 2023, Vienna, Austria, 23–28 Apr 2023, EGU23-3461, https://doi.org/10.5194/egusphere-egu23-3461, 2023.

EGU23-4277 | ECS | Orals | NH10.1

Systems-level geohazard risk assessment in southwestern British Columbia, Canada 

Jack Park and D. Jean Hutchinson

In Western Canada, geohazards can be related to tectonic events, such as earthquakes and volcanoes, but many are weather-driven events, such as floods, landslides, rockfalls, and snow avalanches. Anthropogenic activities, such as residential development, infrastructure, and climate change also contribute to and increase the overall risk from, geohazards. A recent example is the atmospheric river event that devastated much of the southern British Columbia (BC) province in November 2021. Between November 14 and 15, 2021, a 2,500 km long plume of moisture (atmospheric river) hit the west coast of BC and accumulated significant rainfall breaking 20 rainfall records across the province. This intense rainfall event resulted in regional flooding and triggered numerous landslides across the southern province. The impact included closures of all major transportation corridors, severed rail lines, with no rail connections between Kamloops and Vancouver, and evacuation of close to 15,000 residents.

In Western Canada, many geohazards risk assessments are performed within the risk management framework outlined by the Canadian Standards Association. Though guidelines exist, such as the Canadian Technical Guidelines on Landslides, there is no national or provincial standard for managing risk associated with geohazards. Furthermore, BC’s Municipalities Act, which allows individual municipality jurisdictions to manage their own risk, results in uneven distribution of funding and almost always results in emergency response. The insured losses from the November 2021 atmospheric river event are estimated to be $500 million CAD ($370 million USD) and uninsured losses are $9 billion CAD ($6.7 billion USD) and counting. These losses do not account for economic losses due to the closure of major transportation infrastructure networks.

Immediate efforts following the November 2021 atmospheric river event focused on opening the major highway routes. However, the rebuilding of failed bridge and highway embankments is considered a temporary solution and further upgrades in designs are needed to account for the increasing frequency and magnitude of future atmospheric river events. With limited resources at all levels of government, the risk associated with regional-level geohazard triggers needs to be better understood in order to prioritize road infrastructure capacity. Keeping the critical highway arteries open is important not only for economic benefits but to allow for emergency access for communities.

This research looks to help prioritize road infrastructure capacity based on its vulnerability to atmospheric river-triggered geohazard events. Information related to road closures, geohazard events, and infrastructure damages is compiled and related to preconditions of weather trends and infrastructure capacity leading up to the November 2021 event. Road network analysis is performed by defining consequence assessment parameters, such as average daily traffic, associated economic revenue, availability of safety stopping zones, and infrastructure redundancy. Then the risk is assessed based on the vulnerability assignment of different segments of the road network which is presented in a criticality map.

How to cite: Park, J. and Hutchinson, D. J.: Systems-level geohazard risk assessment in southwestern British Columbia, Canada, EGU General Assembly 2023, Vienna, Austria, 23–28 Apr 2023, EGU23-4277, https://doi.org/10.5194/egusphere-egu23-4277, 2023.

EGU23-4825 | Posters on site | NH10.1

Compound Vulnerabilities in an Urban Setting: Impact of Floods on the Transportation Network in Istanbul 

Irem Daloglu Cetinkaya and Özge Naz Pala

Urban areas, the core of socio-economic activity with high population density, are considered highly vulnerable to flood hazards. Istanbul, Turkey's most populated city with around 16 million inhabitants, and at the same time commercial, cultural, and social capital, was chosen as the study area. Istanbul is a metropolis that has grown under unplanned growth, particularly with rural to urban migration in the 1950s. A significant portion of the city's natural areas, stream basins and valleys have been replaced by concrete surfaces. This transformation not only brought societal challenges, but increased urban vulnerability to extreme events and hazards. As a coastal city that consists of two peninsulas, Istanbul is highly prone to flash floods from heavy rainfalls. Flood events intensely impair the municipal services (e.g., public transportation, water and sanitation, electricity distribution), consequently affect the operation of businesses and public services, and cause high economic losses as well as even deaths and casualties. Many of the highly vulnerable zones for floods already endure inadequate housing and transport access. This study aims to build a flood vulnerability index to identify the districts vulnerable to floods in the metropolitan area and assess the impacts of floods on households and transportation infrastructure. The developed vulnerability index incorporates socioeconomic and physical vulnerability components, while also closely examining key transportation infrastructure in highly vulnerable locations. Using the multi-criteria decision making approach, 9 different indicators of flood vulnerability were evaluated, then weighted by stakeholders and experts using the Analytical Hierarchy Process (AHP) method. This methodology is implemented to 100 year flood zones and 500 year flood zones to represent the potential impact of future climate change. The proposed assessment disclosed that 22% of the basin has low urban flood vulnerability while the extremely vulnerable and vulnerable zones together constituted approximately 40% of the total area.  Approximately 75% of the road length (i.e., highways, main arteries, boulevards) and 20% of the public transportation lines (i.e., stations, railways, bus lines) across the basin are located in the vulnerable areas. The findings of the study have the potential to provide policymakers with up-to-date and detailed flood vulnerability assessments to serve as the foundation for their decision-making processes under flooding hazards.

How to cite: Daloglu Cetinkaya, I. and Pala, Ö. N.: Compound Vulnerabilities in an Urban Setting: Impact of Floods on the Transportation Network in Istanbul, EGU General Assembly 2023, Vienna, Austria, 23–28 Apr 2023, EGU23-4825, https://doi.org/10.5194/egusphere-egu23-4825, 2023.

EGU23-5301 | ECS | Posters on site | NH10.1

Multi-risk assessment due to global warming under the SSP climate scenario in the Republic of Korea 

Insang Yu, Huicheul Jung, Dong-Kun Lee, Sung-Hun Lee, and Sung-Il Hong

Assuming that greenhouse gas emissions continue to increase as the current trend, the global average temperature is expected to rise by about 5.7°C by the end of the 21st century. High temperatures and heat waves will increase across East Asia, including in Republic of Korea, and extreme weather events, such as heavy rains and floods, will intensify and become more frequent. Even if carbon neutrality is achieved, losses may still occur due to the limited ability of humans and natural systems to adapt to higher global average temperatures. According to CMIP6 (Coupled Model Intercomparison Project Phase 6), the global average temperature is projected to rise by 2℃ in 2036 (2022-2051, SSP126), by 3℃ in 2065 (2051-2080, SSP245), and it is forecasted to rise by 5.38℃ from 2070 to 2099 (SSP585). When the global average temperature rises by 1.5℃, Republic of Korea's average temperature rises by 0.34℃~0.75℃, a 2℃ increase by 0.82℃~1.01℃, and a 3℃ increase by 1.08℃~1.42℃. As global warming continues, it is analyzed that the difference between Korea and the global average temperature will become larger. Global warming in Republic of Korea is progressing faster than global warming, this will have serious repercussions in various sectors. It is necessary to comprehensively assess risks in various sectors and use the results to establish adaptation policy in order to prepare for damage caused by climate change in advance. This study provides information for comprehensive decision-making support by assessing and integrating climate change risks under the 2℃, 3℃, and end of the 21st century (Bau) scenario in health, energy, traffic, agriculture, forest, and water sectors. Key findings show the current (1985–2014) average annual number of days with heat wave warnings issued by the Korean Meteorological Administration is 6 days. This number is expected to increase to 29 days (+23 days) under 2℃ global warming and to 47 days (+41 days) under 3℃ global warming; it is expected to increase by a factor of 5-15 to 92 days (+85 days) by the end of the 21st century (BaU). The current average period of severe agricultural drought is 0.38 months per year. It will increase to 1.0 month (+0.64 months) under 2℃ global warming and to 0.8 months (+0.43 months) under 3℃ global warming; it is expected to increase to 1.6 months (+1.24 months) by the end of the 21st century (BaU), for a 1.1-4.3-fold increase. The results of the study is expected to contribute to the revitalization of global warming impact and risk assessment research by presenting the global warming period for each SSP scenario. It contributes to the establishment of scientific countermeasures linked to climate risks by predicting the risks of local governments due to global warming and analyzing the current status and characteristics of local governments' adaptation measures.

 [Acknowledgement] This paper is based on the findings of the environmental technology development project for the new climate regime conducted by the Korea Environment Institute (2022-070(R)) and funded by the Korea Environmental Industry & Technology Institute (2022003570004).

How to cite: Yu, I., Jung, H., Lee, D.-K., Lee, S.-H., and Hong, S.-I.: Multi-risk assessment due to global warming under the SSP climate scenario in the Republic of Korea, EGU General Assembly 2023, Vienna, Austria, 23–28 Apr 2023, EGU23-5301, https://doi.org/10.5194/egusphere-egu23-5301, 2023.

EGU23-5815 | Orals | NH10.1

Promoting disaster preparedness and resilience by co-developing stakeholder support tools for managing the systemic risk of compounding disasters 

Cees van Westen, Funda Atun, Silvia Cocuccioni, Marcel Hurlimann, Bettina Koelle, Philipp Marr, Iuliana Armas, Seda Kundak, Elske de Zeeuw-van Dalfsen, Marc van den Homberg, and Jon Hall

Stakeholders in disaster risk management are faced with the challenge to adapt their risk reduction policies and emergency plans to cascading and compounding events, but often lack the tools to account for the cross-sectoral impacts and dynamic nature of the risks involved. The EU Horizon Europe PARATUS project, which started in October 2022 and will run to October 2026, aims to fill this gap by developing an open-source online platform for dynamic risk assessment that allows to analyze and evaluate multi-hazard impact chains, dynamic risk reduction measures, and disaster response scenarios in the light of systemic vulnerabilities and uncertainties. These services will be co-developed within a transdisciplinary consortium of 19 partners, consisting of research organizations, NGOs, SMEs, first and second responders, and local and regional authorities. To gain a deeper understanding of multi-hazard impact chains, PARATUS conducts forensic analysis of historical disaster events, based on a database of learning case studies, augments historical disaster databases with hazard interactions and sectorial impacts, and exploits remote sensing data with artificial intelligence methods. Building on these insights, PARATUS will then develop new exposure and vulnerability analysis methods that enable systemic risk assessment across sectors (e.g. humanitarian, transportation, communication) and geographic settings (e.g. islands, mountains, megacities). These methods will be used to analyze risk changes across space and time and to develop new scenarios and risk mitigation options together with stakeholders, using innovative serious games and social simulations.
The methods developed in PARATUS have been applied in four application case studies. The first one is related to Small Island Developing States (SIDS) in the Caribbean. This case study considers the cross-border impacts of tropical storms, tsunamis, volcanic eruptions, and space weather, and focuses on the development of impact-based forecasting, directed at humanitarian response planning, the telecommunication sector, and tourism. The second case study deals with the local and regional economic impact of hazardous events such as extreme wind, floods, rockfall, mudflow, landslides, and snow avalanches on cross-border transportation in the Alps. The third case study relates to the multi-hazard impact of large earthquakes in the Bucharest Metropolitan Region and focuses on systemic vulnerabilities of the city and emergency response. The fourth application case study is the Megacity of Istanbul which is prone to earthquake hazard chains, such as liquefaction, landslides, and tsunami, as well as to hydrometeorological hazards (extreme temperatures, fires, and flooding). Population growth rates, urban expansion speed, composition, and integration of new migrants (native, foreign, and refugees from countries like Syria and Afghanistan) contribute to the increasing disaster risk. 
The project results will be hosted on two stakeholder hubs related to crisis management and humanitarian relief, and provide stakeholders with a set of tools for risk reduction planning in dynamic multi-hazard environments. The service-oriented approach with active stakeholder involvement will maximize the uptake and impact of the project, and help to increase Europe’s resilience to compounding disasters.

How to cite: van Westen, C., Atun, F., Cocuccioni, S., Hurlimann, M., Koelle, B., Marr, P., Armas, I., Kundak, S., de Zeeuw-van Dalfsen, E., van den Homberg, M., and Hall, J.: Promoting disaster preparedness and resilience by co-developing stakeholder support tools for managing the systemic risk of compounding disasters, EGU General Assembly 2023, Vienna, Austria, 23–28 Apr 2023, EGU23-5815, https://doi.org/10.5194/egusphere-egu23-5815, 2023.

EGU23-6275 | Posters on site | NH10.1

Multi-hazard system of a high Alpine valley: construction of an event chronology from different sources 

Louise Dallons, Florie Giacona, Nicolas Eckert, and Philippe Frey

Mountain regions are subject to highly damaging hydrological and gravitational hazards. This exposure is due to their biophysical and societal characteristics. It is essential for a sustainable management of these risks to consider the natural risk as the result of complex interactions within the risk system, which is composed of a natural and a societal subsystem. In this way, it is possible to adopt a dynamic approach to the risk system by placing the phenomenon in an evolutionary context. We can therefore consider its trajectory according to the socio-environmental dynamics that influence it.

Studying these risk systems over the long term is necessary to understand their evolution and to anticipate future ones in order to guarantee the sustainability of mountain socio-ecosystems, and requires an interdisciplinary approach between geography and history.

The study of the trajectory of a multi-hazard system is being carried out in the Commune of Vallouise-Pelvoux, a high Alpine valley in the Écrins massif, France. This territory was chosen because it is subject to various risks that occur over a wide range of altitudes, its recent socio-economic development is mainly based on tourism, and it is marked by glacial recession, but also because we were aware of the availability of several sources allowing the production of event and multirisk chronologies.

The first stage of the research consisted in the production of a multi-hazard event chronology over 420 years (1600-2020). This database was built from various resources. On the one hand, from existing databases produced by public services and organizations such as the French Forest Office (ONF) specifically the mountain land restoration service (RTM) or the departmental councils. On the other hand, archival research was carried out in the municipal archives of Vallouise-Pelvoux and the departmental archives of the Hautes-Alpes.

After analysis of all available sources, the data collected was processed in various ways. Indeed, sources of different forms and origins requires standardization of the information to make it comparable and usable. The chronology was also subjected to a critical analysis : are the sources authentic? Reliable? What factors might influence them? 

Once this chronology of events in Vallouise-Pelvoux has been contextualized (changes in the natural and societal systems of the Commune), a first statistical analysis of the risks identified and the damage caused will be presented. In the future the data will be used to analyze the trajectory of the system.

How to cite: Dallons, L., Giacona, F., Eckert, N., and Frey, P.: Multi-hazard system of a high Alpine valley: construction of an event chronology from different sources, EGU General Assembly 2023, Vienna, Austria, 23–28 Apr 2023, EGU23-6275, https://doi.org/10.5194/egusphere-egu23-6275, 2023.

EGU23-7106 | ECS | Posters on site | NH10.1

Training risk managers in the climate change and energy transition narrative to avoid maladaptation to the emerging 21st century paradigm. 

Jonathan Mille, Danielle Charlton, Marleen De Ruiter, Muki Haklay, and Stephen Edwards

As the effects of climate change intensify and energy supply issues become more prominent (ie: tackling the rise of CO2 emissions, conflict in Ukraine), the potential impacts of climate and energy variability on anthropogenic systems and question the ability of organisations to maintain their vital services and supply chains in the future.

However, there are many uncertainties surrounding climate change and the energy transition. As risk management is directly dependent on environmental conditions and energy supplies, it is necessary for risk managers to understand how these intertwined phenomena may alter current risk management strategies.

Although climate change is discussed and highlighted amongst the Disaster Risk Reduction community, the issue around the functioning of the energy system is not yet widely discussed and integrated into risk reduction strategies. This research focuses on assessing the perception of risk managers on environmental and energy risks in order to help them integrate climate change and the energy transition into risk management strategies. Our objective is to paint a picture of the global energy system and to integrate its future developments and limitations in order to prepare risk managers for the systemic changes of the 21st century.

How to cite: Mille, J., Charlton, D., De Ruiter, M., Haklay, M., and Edwards, S.: Training risk managers in the climate change and energy transition narrative to avoid maladaptation to the emerging 21st century paradigm., EGU General Assembly 2023, Vienna, Austria, 23–28 Apr 2023, EGU23-7106, https://doi.org/10.5194/egusphere-egu23-7106, 2023.

EGU23-7499 | Posters on site | NH10.1

SIGALE: An online early warning system for gravitational hazard (Savoie, France) 

Héloïse Cadet, David Rouquet, and Anne Lescurier

The SIGALE (System of Information Geographic for grAvitational hazard vigiLancE assessment) project aims at developing an experimental early-warning system of gravitational hazard (landslides and rockfalls) over the road infrastructure network of Savoie (France). This network is about 3 300 km long.

We propose a new approach based on machine learning to predict a vigilance  degree. The vigilance degree is a combination of susceptibility model and trigger model.

The landslide susceptibility model is based on topographical data, landcover and lithology. The rockfall susceptibility model is based on statistical results of propagation using Flow-R.

The trigger models have been trained on an event database of 863 landslides and 481 rockfalls events from 2008 to 2020. The database covers 13 years, so about 4 745 days, over about 6 000 sectors. The thousand events are spread over 28 millions of spatio-temporal sectors. The dataset is thus highly unbalanced and specific machine learning has been deployed. The trigger models features are based on rainfalls and temperatures.

Our results show that, in spite of the high class imbalance issues of such database, the trigger models provide recall values of about 75%, with about 60% of precision.

Our prototype is a web-service showing vigilance degree model for both landslide and rockfall with different zooming information for decision support.

How to cite: Cadet, H., Rouquet, D., and Lescurier, A.: SIGALE: An online early warning system for gravitational hazard (Savoie, France), EGU General Assembly 2023, Vienna, Austria, 23–28 Apr 2023, EGU23-7499, https://doi.org/10.5194/egusphere-egu23-7499, 2023.

EGU23-7782 | ECS | Posters on site | NH10.1

Multi-hazard risk assessment of extreme weather events in a changing climate 

Zélie Stalhandske, Carmen Steinmann, David N. Bresch, and Chahan Kropf

Extreme weather events are among the most destructive natural hazards, affecting a large number of people and causing significant monetary damage globally each year. The impact of these events is increasing due to climate change and socio-economic development. While traditional approaches to risk assessment have focused on the impacts of single hazards, the combined risk of multiple hazards may be different from their sum. Their spatial and temporal co-occurrence may also be influenced by climate change. In this study, we develop a framework for modelling the combined risk of multiple climatic hazards, where risk is defined as the combination of hazard, exposure and vulnerability. We illustrate this method based on globally consistent river floods and tropical cyclones and their impacts on both population and assets. Both hazards are driven by global climate models to investigate their risk at current and future levels of warming. The combined impacts are evaluated by aggregating single hazard models on an event basis, where events are driven by the same climate model outputs. This allows us to not only consider the average annual impact, but also for example to assess combined extreme events or return periods. Additionally, spatially and temporally compounding events can be analysed. This framework is implemented in the open-source climate risk platform CLIMADA and can be applied to different climate risks, providing a more comprehensive approach to understanding and managing the risks posed by extreme weather events in a changing climate.

How to cite: Stalhandske, Z., Steinmann, C., Bresch, D. N., and Kropf, C.: Multi-hazard risk assessment of extreme weather events in a changing climate, EGU General Assembly 2023, Vienna, Austria, 23–28 Apr 2023, EGU23-7782, https://doi.org/10.5194/egusphere-egu23-7782, 2023.

EGU23-8120 | ECS | Orals | NH10.1

A Machine Learning approach to support multi-risk assessment and climate adaptation planning in the Veneto region 

Maria Katherina Dal Barco, Davide Mauro Ferrario, Margherita Maraschini, Ngoc Diep Nguyen, Remi Harris, Stefania Gottardo, Emma Tosarin, Sebastiano Vascon, Silvia Torresan, and Andrea Critto

The analysis of extreme events that occurred in the last decades shows that these are often generated by multiple hazards, whose interactions are still to be fully understood. Moreover, the observation of their temporal trend suggests that their frequency and entity may be related to climate change. The growing impact that natural disasters and climate change have on people and ecosystems makes the ability to model and predict the relationships between multiple risks and their evolution over time a critical expertise.

The use of Artificial Intelligence for climate change adaptation can leverage advanced understanding of multi-risk dynamics, in order to support forward looking disaster risk management and system resilience thinking. Specifically, Machine Learning (ML) algorithms offer a new path to address the analysis of multiple risks due to their ability to model complex and non-linear interactions between different factors, without the need for an explicit modelling.

Here we present the design and development of a ML approach called INTELLIGENT multi-risk (i.e., InNovaTive machinE Learning methodoLogy to assess multi-rIsk dynamics under climate chanGe futurE coNdiTions), aimed at evaluating the impacts of multi-risk events at the regional (sub-national) scale, and predicting risk scenarios based on future climate change projections.

Taking as input hazard, exposure and vulnerability features from both historical observations and future projections, the INTELLIGENT multi-risk allows to: analyse the multi-hazard footprint at different spatio-temporal scales; identify the most influencing factors triggering multiple risks; estimate the effect of climate change on risks scenarios.

An initial application was developed in the frame of the Interreg ITA-CRO AdriaClim project to assess the risks of extreme weather events along the coastal municipalities of the Veneto region. The ML algorithm was trained, validated and tested with local impact records over the 2009-2020 baseline timeframe, and then used to project future climate risk for the timeframe 2021-2050, under the high-emission RCP8.5 climate change scenario. The results of the analysis for the training dataset show a F1-score value of 74% on balanced data, identifying sea surface height, temperature, precipitation, and wind parameters as the most important factors triggering risks in the Veneto coastal area. Nevertheless, the model has the potential to identify which are the coastal municipalities more exposed to multi-hazard events, both in the baseline and future scenarios, in order to support the definition of coastal adaptation strategies.

Future developments of the INTELLIGENT multi-risk approach are foreseen within the H2020 MYRIAD-EU project, where the analysis will be extended to the whole Veneto region, in order to consider additional hazards (e.g., heat waves, drought, wildfires), and analyze multi-risk dynamics across different landscapes (mountains, plains and coastal area), and sectors (finance, tourism, natural ecosystems). At the same time, the ML-based methodology will be used to better identify spatial and temporal footprints of the multi-hazard events and to model the impact of natural hazards and climate change on environmental quality indicators (i.e., water, air, and soil quality).

How to cite: Dal Barco, M. K., Ferrario, D. M., Maraschini, M., Nguyen, N. D., Harris, R., Gottardo, S., Tosarin, E., Vascon, S., Torresan, S., and Critto, A.: A Machine Learning approach to support multi-risk assessment and climate adaptation planning in the Veneto region, EGU General Assembly 2023, Vienna, Austria, 23–28 Apr 2023, EGU23-8120, https://doi.org/10.5194/egusphere-egu23-8120, 2023.

EGU23-11160 | ECS | Posters on site | NH10.1

Can we be precautionary with respect to all risks? A natural and health hazards perspective 

Elena Raffetti and Giuliano Di Baldassarre

Understanding how individuals perceive risk of natural and health hazards can help policymakers, scientists, and clinicians to communicate risks. We show that individuals (as well as communities and institutions) cannot apply the precautionary principle to all threats, and thus we challenge the binary categorizations of risk takers vs. risk avoidersTo illustrate, we compared how people perceive the risk associated with natural and biological hazards in relation to the main preventable health-related risk factor – i.e. tobacco smoking by analyzing the results of nationwide surveys carried out in Italy and Sweden in August 2021. In particular, we compared smokers and non-smokers considering two domains of risk perception (likelihood and individual impact) for seven threats (epidemic, climate change, floods, droughts, wildfires, earthquakes and air pollution). Preliminary results show that: i) the risk perception of some threats is higher in smokers compared to non-smokers; and ii) this difference is mainly observed in a permissive tobacco environment. These results and their implications show the importance of integrating multi-risk components into risk communication, along with promoting policies that simultaneously address health and natural risks.

How to cite: Raffetti, E. and Di Baldassarre, G.: Can we be precautionary with respect to all risks? A natural and health hazards perspective, EGU General Assembly 2023, Vienna, Austria, 23–28 Apr 2023, EGU23-11160, https://doi.org/10.5194/egusphere-egu23-11160, 2023.

EGU23-11291 | ECS | Posters on site | NH10.1

Evaluating Environmental Impacts of Flood-Induced Tank Failures: A Risk Chain Model for Soil and Groundwater Contamination in NaTech context 

Riccardo Giusti, Marcello Arosio, Roberto Nascimbene, and Mario Martina

The European "Floods Directive" requires European River district authorities to create flood damage and risk maps, but the process of assessing flood damage is complex and lacks established methods. Flood risk assessment also requires an understanding of how industrial equipment is vulnerable to flood events and the potential for toxic releases in such scenarios. In this study a practical case is presented regarding multicomponent flood risks in the Secchia River catchment, a tributary of the Po River, and proposes a new risk chain model for evaluating the environmental impact of soil and groundwater contamination in the event of a flood caused by the failure of storage tanks containing hazardous materials. The model is demonstrated using an illustrative case and shown to be a useful tool for managing the risk of such events. Our methodology presents a multi-component model for assessing environmental risk resulting from technological accidents triggered by natural disasters. In particular, we focus on the failure of storage tanks containing hazardous materials due to flooding. The proposed method first evaluates the probability of tank failure under defined flood conditions, including flood height, velocity, and probability of occurrence. To simplify the analysis, we consider all tanks to be unanchored atmospheric storage tanks. The final output of the method for each tank is a monetary estimation of the hypothetical costs for environmental remediation after tank failure, including the contamination of soil and groundwater by the spilled liquid. Our methodology proposed a conservative approach by assuming that all stored liquids are contaminants and by using a fixed value for the density of the stored liquid.

To evaluate the probability of tank failure, it has been considered four types of failure dynamics: buckling, displacement, floating and overturning. The tank failure assessment is based on our recent study that developed vulnerability different dynamic models for unanchored steel atmospheric tanks. Our methodology not only evaluates the probability of tank failure during flood events, but also analyses the potential consequences of failure, including direct damages to the tank and costs associated with recovering the spilled product and mitigating contamination in the affected area. The results of this study can be used to develop strategies for minimizing the risks of tank collapse during flood events and to increase awareness of potential NaTech risks. The ultimate goal of this study is to create a comprehensive procedure for evaluating and comparing the dynamics of tank collapse during flood events, including the potential environmental consequences, and providing risk managers with a full understanding of the risks associated with tank failure during flooding, including potential NaTech risks.


How to cite: Giusti, R., Arosio, M., Nascimbene, R., and Martina, M.: Evaluating Environmental Impacts of Flood-Induced Tank Failures: A Risk Chain Model for Soil and Groundwater Contamination in NaTech context, EGU General Assembly 2023, Vienna, Austria, 23–28 Apr 2023, EGU23-11291, https://doi.org/10.5194/egusphere-egu23-11291, 2023.

EGU23-12813 | ECS | Posters on site | NH10.1

Compound events of drought and salt intrusion in the Greater Bay Area and adaptation countermeasures 

Xudong Li, Fang Yang, Huazhi Zou, and Sen Wang

Dongjiang River drains into the Pearl River Delta in China and waterworks near the delta serves as the main water supply source for cities in the Guangdong-Hong Kong-Macao Greater Bay Area, including Shenzhen, Guangzhou and Hongkong. The basin experienced a severe drought in 2021, with the average streamflow in the downstream gauge reaching its lowest value since 1956. Meanwhile, the most important upstream reservoir, Xinfengjiang Reservoir, experienced a low water level operation period, with the water level declined below its dead water level in Jan. 2022. Coupling with weak river discharge, astronomical tides led to severe salt intrusion in the delta area. The compound events of drought and salt intrusion threatened the urban domestic water supply. According to scenario analysis, the water supply for about 20 million people would have been affected during Nov. 2021 and Jan. 2022 if no countermeasures had been adopted. Comprehensive countermeasures were carried out to prevent the extreme impacts from the compound events, which include engineering and non-engineering ones. The engineering ones include blocking the salt water with temporary batardeau and soft purdah into the water. And non-engineering ones include chlorinity monitoring and forecasting on the strength of in-situ gauges measurements and a three-dimensional baroclinic saltwater intrusion model. The model provided real-time chlorinity forecasting for the waterworks. The bias of peak chlorinity was less than 20%, and the bias of the peaking time was less than 2 h. The forecasting results supported decision making on timing of water intaking for the waterworks and other local water storage infrastructure. In addition, the water authorities carried out tiered prices and imposed limitations to high water use of some industrial water users. With all these strategies, the domestic water supply was well maintained across the compound events, which ended in Mar. 2022. The river basin authority played an important role in communicating the necessary information and coordinating all the countermeasures among associated stakeholders.

How to cite: Li, X., Yang, F., Zou, H., and Wang, S.: Compound events of drought and salt intrusion in the Greater Bay Area and adaptation countermeasures, EGU General Assembly 2023, Vienna, Austria, 23–28 Apr 2023, EGU23-12813, https://doi.org/10.5194/egusphere-egu23-12813, 2023.

EGU23-13325 | Posters virtual | NH10.1

Multi-hazard analysis of abandoned coal-mines 

AL Heib Marwan

Nowadays, most of the coal mines in Europe are already closed or are in a state of liquidation. However, the problem of abandoned coal mines and their influence on the environment remains central for the mining industry and coal regions in transition. After the end of the exploitation, many disturbances can occur. Mines operators, local authorities and decision makers are confronted with multi-hazard and risks related to mine closure. Land use planning and adequate site rehabilitation requires better tools to deal with the multiple hazards and constraints.

The objective of the study is to improve risk assessment by establishing a new methodology to assess the interaction between hazards related to old mines, and no longer treat them separately.

Mining hazards concern: ground movements, hydrological hazards, self-heating, soil and water pollution. One hazard can trigger another one. Different tools are presented such as a global matrix, a fault tree, etc. for identifying the hazards interaction. The hazard interaction matrix has been constructed, figure 1 shows in particular the interactions that the phenomena in the columns (source phenomenon) can have with the phenomena in the rows (target phenomenon). The matrix also provides information on the levels of interaction: no known case of interaction between phenomena (white colour), Low (yellow), Medium (green) and High (red). These assessments are based on feedback and in-depth discussion between experts. This approach is a first tool to help mining and development actors to understand these interactions and improve mitigation and management measures.


How to cite: Marwan, A. H.: Multi-hazard analysis of abandoned coal-mines, EGU General Assembly 2023, Vienna, Austria, 23–28 Apr 2023, EGU23-13325, https://doi.org/10.5194/egusphere-egu23-13325, 2023.

EGU23-13897 | Orals | NH10.1

Development and use of an integrated modelling approach to simulate dynamic risk profiles and support risk reduction strategies 

Hedwig van Delden, Roel Vanhout, Amelie Jeanneau, Douglas Radford, Holger R. Maier, and Aaron C. Zecchin

Natural hazards pose a significant risk to societies across the world. This risk will likely increase in the future, due to climate change, urban development and changing demographics. Understanding the range of potential future conditions, and the associated key uncertainties, is essential in designing disaster risk management strategies that holistically account for these drivers.

For this purpose, we have developed a spatially explicit, dynamic, multi-hazard decision support system called UNHaRMED, which calculates dynamic risk profiles as a combination of hazard, exposure and vulnerability. The aim of UNHaRMED is to better understand current and future risk, and assess the impact of (a combination) of risk reduction options under various  future conditions. In order to do so, UNHaRMED consists of coupled models integrated into a policy support system. It allows the user to understand the impact of climate change, socio-economic developments and risk reduction options on the future evolution of exposure, hazard and vulnerability and hence the resulting risk.

Use of the system will be illustrated through an application to a region in Australia for wildfire and flood risk, for which we simulated a range of futures using different climate and socio-economic scenarios. We found that in a rapidly growing area, the impact of socio-economic development exceeds the impact of climate change, and well thought out spatial planning strategies can substantially reduce future wildfire and flood risk.

The application of UNHaRMED showcases its potential in better understanding future uncertainties and leveraging this information to assess the impact of risk reduction options under a range of conditions. Lessons learned from this can then be incorporated in the design of robust and/or adaptive risk management strategies.

How to cite: van Delden, H., Vanhout, R., Jeanneau, A., Radford, D., Maier, H. R., and Zecchin, A. C.: Development and use of an integrated modelling approach to simulate dynamic risk profiles and support risk reduction strategies, EGU General Assembly 2023, Vienna, Austria, 23–28 Apr 2023, EGU23-13897, https://doi.org/10.5194/egusphere-egu23-13897, 2023.

EGU23-13915 | Orals | NH10.1

An impact-based extreme event catalogue on southwest Germany: Overview, Clustering and Triggers 

Katharina Küpfer, Susanna Mohr, and Michael Kunz

Multiple hazards of different types, such as heat waves, floods, or storms, occurring either simultaneously or in serial clusters can significantly enhance adverse effects on society, economy, and the environment compared to single events. The disastrous flood in Western Europe in 2021 once again showed that natural hazards can lead to severe building damage and thus pointed to the importance of insurance coverage against such events.

To better understand how multiple hazards translate into impact, we propose an economic approach using a unique residential building insurance dataset for southwest Germany ranging from 1986 to 2020. This dataset includes both the number of damage claims reported to a building insurance company and insured losses on a daily resolution, aggregated over the federal state of Baden-Wuerttemberg. This study area is chosen because of the high insurance coverage and therefore high reliability of the data to capture the most important events compared to other states in Germany. In the first step, an event catalogue regarding serially clustered events was elaborated using different methods and statistics. Only convective storms, winter storms and floods are taken into account as these events cause most of the economic damage compared to other events, such as heat waves. To filter smaller events with limited impact and to remove high-frequency clustering, various methods to aggregate the loss events over several days are applied and compared, such as runs declustering using the Peak-Over-Threshold method and an aggregation method considering a fixed number of days, which is common in the insurance industry. After further separating the events according to the relevant seasons, we apply and compare three different clustering methods to the filtered economic dataset: (a) the Poisson regression method, (b) Ripley’s K, and (c) the counting method.

Results show that a high percentile (e.g., 95th or 99th) is needed to analyse the dataset with regard to the most damaging events. This is because the dataset shows a strongly right-skewed distribution. Furthermore, it is found that a small number of high-impact events dominate the overall damage. We show that different hazard types exhibit different behaviours regarding economic metrics (e.g., average loss or correlation between damage claims and insured loss). It is also found and discussed that the degree of clustering depends on the method chosen. For this reason, we performed sensitivity tests and applied different methods to estimate the reliability of the results. To better differentiate between the meteorological event types (e.g., pluvial vs. fluvial floods and convective gusts vs. windstorms), the dataset is further filtered with precipitation data and a dataset on turbulent wind gusts. Building on the final event set with the different event types, the time frames identified by the analyses above are combined with large-scale weather patterns that were dominant at the times when the loss events occurred. This is done to identify relevant relationships of extreme events and their clusters to large-scale processes and mechanisms (e.g., weather regimes or teleconnection patterns).

How to cite: Küpfer, K., Mohr, S., and Kunz, M.: An impact-based extreme event catalogue on southwest Germany: Overview, Clustering and Triggers, EGU General Assembly 2023, Vienna, Austria, 23–28 Apr 2023, EGU23-13915, https://doi.org/10.5194/egusphere-egu23-13915, 2023.

EGU23-14233 | Posters on site | NH10.1

Mapping and characterisation of compound events in Sweden 

Johanna Mård, Örjan Bodin, and Daniel Nohrstedt

Compound events have significant environmental and societal impacts and bring new challenges to decision-making, planning, and management. Meanwhile, knowledge about compound events and their impacts are limited. Sweden, while being prone to various climate-related natural hazards (e.g., storms, floods, wildfires) have no coherent information on where these events and their impacts have occurred in the past, and less so on compound events. Here we present a new cohesive natural hazards impact database for Sweden, including compound events, to advance our understanding of how these events have unfold during the last 50 years. The impact database consists of available data from multiple sources on past climate-related natural hazard events (e.g., databases and reports from governmental organizations, county boards, and scientific reports). These data have further been geocoded using a Geographic Information System (GIS) to generate an integrated natural hazards map. These two products will help provide knowledge on the spatiotemporal distribution of natural hazard events, including compound events in Sweden, and further advance our understanding of their underlying drivers, and aid ongoing work to effectively plan and prepare for these events.

How to cite: Mård, J., Bodin, Ö., and Nohrstedt, D.: Mapping and characterisation of compound events in Sweden, EGU General Assembly 2023, Vienna, Austria, 23–28 Apr 2023, EGU23-14233, https://doi.org/10.5194/egusphere-egu23-14233, 2023.

EGU23-14325 | Posters on site | NH10.1

Operational assessment of landslide risks in the sprawling city of Bukavu (DR Congo) 

Olivier Dewitte, Caroline Michellier, Toussaint Mugaruka Bibentyo, Sylvain Kulimushi Matabaro, Innocent Kadekere, Charles Nzolang, and François Kervyn

The expansion of informal and uncontrolled urban landscapes commonly overlooks the natural constraints from the environment. This is particularly true for urban environments affected by landslides. Landslide risk assessment relevant for urban planning and disaster risk reduction (DRR) strategy requires highly spatially-resolved datasets and approaches. It also requires that both physical and social local aspects of risk are studied in an interdisciplinary manner. Such assessment of hazard risk remains challenging and under-researched in many regions, especially in low- and lower-middle-income countries in the tropics, as it usually requires large and diverse datasets that are frequently unavailable or unreliable. In addition, specifically in urban contexts, human-induced environmental change impacts slope stability. Under these conditions of data-scarcity and land transformation, reliable and detailed landslide risk assessment encompassing the physical and societal aspects in an operational approach strongly relies on expert knowledge.

In this research, we assess the risks associated with landslides in Bukavu, a city located in the eastern DR Congo where urban sprawling is high and the problem of landsliding is particularly acute. Firstly, we compiled a comprehensive multi-temporal landslide inventory covering several decades using remote sensing, archives, field survey and interviews with key informants. From this inventory, we derived three hazard zonations with multiple scenarios that allow to consider the interactions between various landslide processes and the role of human activities. Secondly, we obtained detailed socio-economic data from a sample population survey in morphological areas determined by remote sensing. Within two months, 10 specifically-trained local interviewers counted and located nearly 44,000 inhabitants living in about 6,580 households, and collected socio-economic baseline data over 10,880 people from 1,614 households. These demographic data were used to determine the variations in population density (exposure) in the city. These data were also key for the vulnerability assessment. For this, we designed a contextualised vulnerability index capturing the various dimensions of vulnerability with a set of selected indicators aimed at facilitating understanding, replicability and updating of the data collection. By combining hazard, exposure and vulnerability, we produced three risk zonation maps at a very high spatial resolution with the potential to be used operationally: one for shallow landslides, another for deformation within landslides and one for reactivation of deep-seated landslides. The development of these maps, as well as the collection of field-based information were carried out in close interaction with the city authorities and various stakeholders (e.g. civil protection, local community leaders) involved in DRR. A specific effort of awareness raising was also made through the organisation of dedicated workshops and radio programmes, and the implementation of a disaster risk information centre in Bukavu.

How to cite: Dewitte, O., Michellier, C., Mugaruka Bibentyo, T., Kulimushi Matabaro, S., Kadekere, I., Nzolang, C., and Kervyn, F.: Operational assessment of landslide risks in the sprawling city of Bukavu (DR Congo), EGU General Assembly 2023, Vienna, Austria, 23–28 Apr 2023, EGU23-14325, https://doi.org/10.5194/egusphere-egu23-14325, 2023.

EGU23-16226 | Posters on site | NH10.1

Multihazard Analysis: Istanbul Microzonation Projects 

Sema Kara, Kemal Duran, Deniz Yılmaz, Evrens Rıza Yapar, Muhammed Emin Karasu, and Betül Ergün Konukcu

Istanbul is located one of the most seismically active regions of the earth. For this reason the city has suffered damage due to earthquakes in its historical process. Three of them, occurring in 1509, 1766, 1894 respectively,    seriously affected Istanbul and caused great loses around the city during the Ottoman period. 1509 Earthquake caused extensive damage to many mosques, buildings and some part of the city walls in Istanbul. 1509 Earthquake caused extensive damage to many mosques, buildings and some part of the city walls in Istanbul. Another destructive earthquake occured in the east part of the Sea of Marmara in 1766. Not only many houses and public buildings collapsed but also The Ayvad Dam located north of the Istanbul were damaged in İstanbul because of the 1766 Earthquake. Third major earthquakes took place in the Gulf of Izmit in 1894 and had adverse impact on Istanbul. On Augsut 17, 1999 The Kocaeli Earthquake with a magnitude 7.6 was the not only devastating but also deadly earthquake for Istanbul in recent years. Despite the approximately 110 km epicenter distance, 3,073 buildings suffered extensive damage, 11,339 buildings had moderate damage and 454 people died and 1880 people injured in Istanbul. Damages in Istanbul especially Avcılar and Büyükçekmece during Kocaeli Earthquake in 1999 raised and improved the awareness on disaster risk management since then several scientific and institutional studies has been conducted for the potential earthquake of Istanbul. Istanbul Metropolitan Municipality (IMM) carried out two major geo-scientific studies called “microzonation studies” covering more than 700 km2 of Istanbul’s urbanized areas between 2006 and 2009.     And then IMM has just started new microzonation project in order to complete remainder urbanization area of Istanbul consists of districts of Büyükçekmece, Beylikdüzü, Çatalca, Esenyurt, Küçükçekmece, Beşiktaş, Şişli, Sarıyer covering approximately 257 km2. Esenyurt is the most populated district of Istanbul and the other districts host many Istanbulites. This project supports substantial hazard knowledges after the evaluation of geological, geotechnical and geophysical measurements in order comprehend these districts risk against the potential Istanbul earthquake,.  In the end “Land Suitability Maps” are derived from the combination of inputs using multi-hazard approach. Microzonation results could be used in land development/use plans, hazard identification in urban transformation, determination of the routes and characteristics of various types of engineering structures for making city resilient.

How to cite: Kara, S., Duran, K., Yılmaz, D., Yapar, E. R., Karasu, M. E., and Ergün Konukcu, B.: Multihazard Analysis: Istanbul Microzonation Projects, EGU General Assembly 2023, Vienna, Austria, 23–28 Apr 2023, EGU23-16226, https://doi.org/10.5194/egusphere-egu23-16226, 2023.

EGU23-16521 | ECS | Posters on site | NH10.1

Resilient Istanbul against the evolving challenges 

Betül Ergün Konukcu, Sema Kara, Deniz Yılmaz, and Kemal Duran

Cities are increasingly faced with the complexities, the uncertainties, local and global challenges. These problems make pressures on the life of cities and cause direct, indirect, tangible and intangible damages on physical structure, natural environment, social fabric, cultural heritage and economic situation of the cities. In order to make cities resilient against these pressures, it is substantial to improve skills to cope with these difficulties and strengthen coping capacity of urban elements. Istanbul is one of the oldest cities in the world. The city, hosted many civilizations with its 8500 year history, has dealt with the earthquakes, epidemics, floods, fires, water shortages, economic crises throughout its historical process. Istanbul with more than 16 million population is still trying to struggle against the challenges based on natural events and climate change, the consequences of irresponsible urbanization, socio-economic and cultural stresses and environmental problems. This study reveals Sustainable Resilence Strategy of Istanbul with Sustainable Development Goals against to current and evolving acute shocks and chronical stresses by taking lessons from the past, forecasting future challenges, risk reduction, supra disciplinary and interdisciplinary studies,  holistic approach, shared decision making with multiple criteria ,  competent planning, manageable systems, resource management, funding capability, alternative strategy formation capability, reserve capacity, ensuring coordination between systems, increasing adaptive, absorbing and transformation capacity, providing continuity, developing national and international cooperation.

How to cite: Ergün Konukcu, B., Kara, S., Yılmaz, D., and Duran, K.: Resilient Istanbul against the evolving challenges, EGU General Assembly 2023, Vienna, Austria, 23–28 Apr 2023, EGU23-16521, https://doi.org/10.5194/egusphere-egu23-16521, 2023.

EGU23-16828 | Posters on site | NH10.1

Modelling compound flooding events for multiple hazards mapping: an example from Sweden. 

Faisal Bin Ashraf, Marlon Vieira Passos, and Karina Barquet

Globally climate change has increased exposure to multiple hazards. In Sweden, 10-year events of precipitation and streamflow have started to cluster around the summer months for most of the country. However, Sweden's south and west coasts are especially vulnerable to river flooding events caused by extreme sea surges during the winter. This national-level analysis needs to be combined with detailed local assessments to quantify the hazard properly, its potential impacts and cascading effects. In response to this need, we explore the impacts of multiple hydrometeorological (i.e., weather and water) events that happen simultaneously or close together in Halmstad. Furthermore, we investigate the effects of climate change on the intensity and frequency of these hazards by focusing on extreme – low likelihood but high impact – events. Due to its geographical location, Halmstad is particularly vulnerable to flooding risks. Wind and waves combine to make the city vulnerable to flooding and storm surges. That confluence triggers extreme local sea level rise, resulting in high sea levels in Halmstad compared to nearby coastal towns. These compound flooding events in Halmstad are expected to increase in future climate scenarios. We will simulate multiple scenarios of compound flooding events with a two-dimensional hydrodynamic model. The model's values used as boundary conditions will be based on computed joint return intervals for fluvial flooding and extreme sea surge. This study can not only be used to support local adaptation strategies but will also contribute to the body of knowledge on the issue of compound flooding events in a changing climate. Local-scale assessments like this one are necessary for a nuanced understanding of the possible impacts of multiple hazards on society. At the same time, societies' dependency on critical infrastructure and vital societal services is increasing due to growing system complexity and interconnectedness. Together, these shifts will likely increase societal vulnerability and impact adaptive capacity.

How to cite: Ashraf, F. B., Passos, M. V., and Barquet, K.: Modelling compound flooding events for multiple hazards mapping: an example from Sweden., EGU General Assembly 2023, Vienna, Austria, 23–28 Apr 2023, EGU23-16828, https://doi.org/10.5194/egusphere-egu23-16828, 2023.

EGU23-16861 | Posters on site | NH10.1

A spatial analysis of the relevance of community organizations as an insurance against the economic and environmental vulnerability of Colombian cacao producers. 

Sonia Quiroga, Cristina Suárez, Virginia Hernanz, and Jose Evelio Aguiño

The future of replacing illicit crops with cocoa in the South-Pacific region of Colombia goes far beyond the economic viability of these plantations. The process of social and ecological restoration (SER) that this process implies is intrinsically linked to the role of local organisations and the support of international non-governmental organisations, which are introducing the main technical improvements conditional on the achievement of social improvements. Here we analyse the situation in the South-Pacific region of Colombia, a territory traditionally dominated by illicit crops, inhabited by vulnerable Afro-American communities, and where post-conflict agreements are having a special relevance due to the high level of violence. This paper analyses the determinants of differences in the selling price of cocoa, assuming that the decision to be able to sell cocoa dry and access international markets is directly related to the support received by farmers. To be able to obtain a sustainable production of quality dry cocoa, the main requirement for accessing international market prices, is conditioned by access to adequate infrastructures. And, without access to this higher quality production, the substitution of illicit crops does not seem viable, and with it the environmental sustainability and social cohesion of the territory. Therefore, we analyse the determinants of farmers' ability to sell dry cocoa: percentage of cocoa damaged by pests, the pressure of violence. To do so, we use spatial econometric models, as these have been found to be more appropriate than other types of models. And we show that increasing the participation of producers in community councils supported by international NGOs is fundamental to achieving a better cocoa price.

How to cite: Quiroga, S., Suárez, C., Hernanz, V., and Aguiño, J. E.: A spatial analysis of the relevance of community organizations as an insurance against the economic and environmental vulnerability of Colombian cacao producers., EGU General Assembly 2023, Vienna, Austria, 23–28 Apr 2023, EGU23-16861, https://doi.org/10.5194/egusphere-egu23-16861, 2023.

EGU23-17552 | Orals | NH10.1

Diagnosing multi-hazard risk research, practice, and policy in a European context - lessons learnt from the first year of research in MYRIAD-EU 

Roxana Liliana Ciurean, Melanie Duncan, Joel Gill, Lara Smale, Julia Crummy, Dana Stuparu, and Julius Schlumberger

The first priority of the Sendai Framework for Disaster Risk Reduction is Understanding Disaster Risk. To achieve this goal, it is essential that research and practice draw upon previous disaster risk work. What can the use of terminology and concepts tell us about the barriers and opportunities to further our understanding of disaster risks? How can we build more effectively upon existing tools, methods, and approaches to inform future multi-hazard risk solutions? And what is the current multi-risk governance landscape in Europe? To answer these questions, we present the results of the first work package (WP1) of MYRIAD-EU – a multi-disciplinary, multi-sector project on systemic risk assessment and management in the E.U., funded by the Horizon 2020 Programme. WP1 aimed at undertaking a common baseline development to ensure that all MYRIAD-EU work packages are underpinned by a common understanding of terminology, concepts, and current academic, policy, and industry perspectives on multi-hazard, multi-risk assessment and management.

In this presentation, we briefly introduce the methods, outputs, and outcomes of the first year of Diagnosis research in MYRIAD-EU. We look closer at two outputs, namely the Handbook of multi-hazard, multi-risk definitions and concepts, and the Disaster Risk Gateway wiki platform, aimed at promoting interdisciplinary research and engagement between different actors involved in disaster risk assessment and management. Finally, we reflect on lessons learnt and highlight upcoming work in this project.

How to cite: Ciurean, R. L., Duncan, M., Gill, J., Smale, L., Crummy, J., Stuparu, D., and Schlumberger, J.: Diagnosing multi-hazard risk research, practice, and policy in a European context - lessons learnt from the first year of research in MYRIAD-EU, EGU General Assembly 2023, Vienna, Austria, 23–28 Apr 2023, EGU23-17552, https://doi.org/10.5194/egusphere-egu23-17552, 2023.

CL4 – Climate studies across timescales

Flux partitions between surface water and energy terms are essentially important to the climate system. They can potentially affect assessments of climate risk projections in the future. However, the characterization of surface flux partitioning in numerical models is rarely evaluated due to the absence of large-scale observational evidence. Here, we use long-term satellite datasets and observational meteorological records to evaluate the flux partitioning regime presented in four widely-used Land surface models (LSMs) over two study regions (i.e., China and Continental U.S.). We show that the regime in LSMs differs significantly from satellite-based estimations, which can be due to unrealistic representations of land surface characteristics. The biases in models’ flux partitioning regime may lead to the underestimated potential for climate risks, especially over regions with typical land surface characteristics. The results highlight that particular attention should be paid to the calibration of surface flux partitioning regimes in LSMs. Large model spreads in surface flux partitioning strength and climate risk maps are also reported.

How to cite: He, Q., Lu, H., and Yang, K.: Observation-based assessments of surface flux partitioning regimes in 4 commonly-used land surface models, EGU General Assembly 2023, Vienna, Austria, 23–28 Apr 2023, EGU23-333, https://doi.org/10.5194/egusphere-egu23-333, 2023.

In recent years, drought has become an increasing problem in agricultural production in many places where these problems did not exist in the past. The frequency and intensity of agricultural droughts are increasing, so it is very important to detect temporal and spatial variability of drought. This study analyzed the properties of agricultural drought (duration and intensity) in Bărăgan region (Romania) and Prekmurje region (Slovenia) between 1991-2020 based on the Standardized Precipitation Index (SPI) and the Standardized Precipitation Evapotranspiration Index (SPEI) at different time scales. The reasons for comparing the two regions are similar climatic conditions, the importance of maize cultivation for food security, and repeated droughts in the recent period in these regions. The meteorological data for Romania were provided from ROCADA database, and for Slovenia from SLOCLIM database. Furthermore, relationships between drought-sensitive phenological stages of maize (germination, formation of the first 2 leaves, and flowering), growing season length, thermal time above threshold 10 °C, standardized yields, and calculated drought indicators were calculated. Based on our analysis, we expect to be able to evaluate whether SPI and SPEI can be used to monitor conditions on a variety of time scales and to provide indicators at regional scales on the likely occurrence of drought during critical phenological phases of maize, as well as the differences and similarities between the two regions will be discussed.

How to cite: Kobulniczky, B., Holobâcă, I.-H., Črepinšek, Z., Pogačar, T., Jiman, A.-M., and Žnidaršič, Z.: Comparison of Standardized Precipitation Index (SPI) and Standardized Potential Evapotranspiration Index (SPEI) applicability for drought assessment during the maize growing period between Bărăgan (Romania) and Prekmurje (Slovenia) regions (1991, EGU General Assembly 2023, Vienna, Austria, 23–28 Apr 2023, EGU23-499, https://doi.org/10.5194/egusphere-egu23-499, 2023.

The surface-air temperature difference (Ts-Ta) is the main contributor to the sensible heat flux, and also an important indicator for land degradation. However, as the main influencing factor, the effect of soil moisture (SM) on Ts-Ta at the global scale has not been well articulated. Here, based on the ERA5-land reanalysis data from 1981 to 2019, the impacts of SM on Ts-Ta were studied. It was found that Ts-Ta over 54% of the global land increased, and SM across 70.7% of the world land decreased. In the increased SM areas, the increased soil evaporation weakened the increasing trend of Ts resulting in smaller Ts-Ta. In the decreased SM areas, the latent heat flux increased with soil evaporation and Ts-Ta decreased when SM was relatively high, and the larger sensible heat flux due to decreased soil evaporation aggravated Ts-Ta when SM was relatively low. The effect of SM on Ts-Ta presented nonlinear relationship due to the different background value of SM and temperature. The variation of SM at low SM or low temperature areas had an amplification effect on Ts-Ta. These findings will provide new insights into the different regional characteristics of global changing climate and the improvement of land degradation assessment indicators.

How to cite: jiang, K.: Influence patterns of soil moisture change on surface-air temperaturedifference under different climatic background, EGU General Assembly 2023, Vienna, Austria, 23–28 Apr 2023, EGU23-557, https://doi.org/10.5194/egusphere-egu23-557, 2023.

EGU23-799 | ECS | Posters on site | CL4.1

The role of atmospheric humidity in controlling land-atmosphere feedbacks over forest: regional and global-scale analyses 

Shulin Zhang, Weiguang Wang, and Adriaan J. Teuling

Abstract:

The interaction of land cover and atmosphere can affect the climate patterns via biogeochemical and biogeophysical process. The afforestation contributes to increase the biogeochemical cycles like carbon sequestration. Meanwhile, the landcover change modify the biogeophysical parameters perturbs the energy and water fluxes. The latter will be the most direct process to affect the atmosphere and its effects from landcover change outweigh radiative forcing triggered off by CO2 emissions.

After the “Grain to Green Program”, the Loess Plateau (LP) has experienced a widespread forest expansion. Up to 2012, the extension of forest area in the central LP (Ningxia, Shanxi, and Shaanxi) accounted for 11.2 % of the area of the three provinces. The greening trend has changed the energy and water cycle, hence to a climate variability. The moist heat stress (a combined climate metric) has been recently investigated because it is directly related to human health. However, the affection of afforestation to moist heat stress is still unclear in LP.

In a recent study, we used the Weather Research and Forecasting (WRF) model to simulate the modulation of moist heat in LP caused by the afforestation. The result demonstrates that the intensive revegetation in LP shows a cooling effect on regional average near surface air temperature, especially in central LP. In addition, an increase of relative humidity caused by afforestation is detected. Driving by the near-surface temperature, sensible heat flux, and the subsidence of the planetary boundary layer the moist heat stress has obvious change after afforestation. The average moist heat stress decreases in central LP. While the decrease rate of moist heat stress is slower than near-surface temperature. It is worth noting that, an increased signal occurs in the maximum moist heat stress which might expose humans to the risk of moist heat stress. Our sensitivity results imply that the moist heat stress should be accounted for in climate change adaptation.

In ongoing work, we study the role of atmospheric VPD on mitigating land-atmosphere feedbacks over forest and non-forest land cover based on a global analysis of FLUXNET data. Preliminary results show a strong climate control on the effect of VPD on land-atmosphere exchange, in particular during heatwaves.

Reference: Zhang, S., Wang, W., Teuling, A. J., Liu, G., Ayantobo, O. O., Fu, J., & Dong, Q. (2022). The effect of afforestation on moist heat stress in Loess Plateau, China. Journal of Hydrology: Regional Studies, 44, 101209

How to cite: Zhang, S., Wang, W., and Teuling, A. J.: The role of atmospheric humidity in controlling land-atmosphere feedbacks over forest: regional and global-scale analyses, EGU General Assembly 2023, Vienna, Austria, 23–28 Apr 2023, EGU23-799, https://doi.org/10.5194/egusphere-egu23-799, 2023.

The EC-Earth earth system model is characterized by biases in various aspects of the simulated climate. Biases in precipitation result in biases in soil moisture, while biases in temperature and precipitation contribute to biases in vegetation. In this study, the extent to which the biases in soil moisture and vegetation contribute to the biases in the surface energy fluxes (which, in turn, lead to near-surface climate biases) in EC-Earth through interactions with the atmosphere is investigated.

The study is based on two simulations for the recent period 19719-2017: an offline simulation with the land-surface component of EC-Earth, combining the HTESSEL land surface model and the LPJ-GUESS dynamical vegetation model forced, by the meteorological conditions from the ERA5 re-analyses, and a simulation with the atmospheric version of EC-Earth, where the land-surface conditions, i.e., soil moisture and vegetation, are prescribed from the offline simulation.

The purpose of the study is twofold: By comparing the offline simulation with the land-surface component of EC-Earth with observational estimates of the surface energy fluxes, it is investigated to which extent the land-surface component, combing HTESSEL and LPJ-GUESS, is capable to simulate the surface energy fluxes under “perfect” climate conditions. And by comparing the simulation with the atmospheric component of EC-Earth with the offline simulation, the effects of the land-surface atmosphere interactions on the biases of the surface energy fluxes in EC-Earth are assessed. These effects are, to a large extent, related to climate biases in the atmospheric component of EC-Earth, e.g., the radiative fluxes, precipitation or the near-surface climate conditions.

How to cite: May, W.: The role of land-surface interactions for the surface energy fluxes in the EC-Earth earth system model, EGU General Assembly 2023, Vienna, Austria, 23–28 Apr 2023, EGU23-1067, https://doi.org/10.5194/egusphere-egu23-1067, 2023.

EGU23-1689 | ECS | Posters on site | CL4.1

Contrasting influences of biogeophysical and biogeochemical impacts of historical land use on global economic inequality 

Shu Liu, Yong Wang, Guang Zhang, Linyi Wei, Bin Wang, and Le Yu

Climate change has significant implications for macro-economic growth. The impacts of greenhouse gases and anthropogenic aerosols on economies via altered annual mean temperature (AMT) have been studied. However, the economic impact of land-use and land-cover change (LULCC) is still unknown because it has both biogeochemical and biogeophysical impacts on temperature and the latter differs in latitudes and disturbed land surface types. In this work, based on multi-model simulations from the Coupled Model Intercomparison Project Phase 6, contrasting influences of biogeochemical and biogeophysical impacts of historical (1850–2014) LULCC on economies are found. Their combined effects on AMT result in warming in most countries, which harms developing economies in warm climates but benefits developed economies in cold climates. Thus, global economic inequality is increased. Besides the increased AMT by the combined effects, day-to-day temperature variability is enhanced in developing economies but reduced in developed economies, which further deteriorates global economic inequality.

How to cite: Liu, S., Wang, Y., Zhang, G., Wei, L., Wang, B., and Yu, L.: Contrasting influences of biogeophysical and biogeochemical impacts of historical land use on global economic inequality, EGU General Assembly 2023, Vienna, Austria, 23–28 Apr 2023, EGU23-1689, https://doi.org/10.5194/egusphere-egu23-1689, 2023.

Heavy precipitation (HP) events can be preceded by moist heatwaves (HWs; i.e., hot and humid weather), and both can be intensified by urbanization. However, the effect of moist HWs on increasing urban HP remains unknown. Based on statistical analyses of daily weather observations and ERA5 reanalysis data, we investigate the effect of moist HWs on urban-intensified HP by dividing summer HP events into NoHW- and HW-preceded events in the Yangtze River delta (YRD) urban agglomeration of China. During the period 1961–2019, the YRD has experienced more frequent, longer-lasting, and stronger intense HP events in the summer season (i.e., June–August), and urbanization has contributed to these increases (by 22.66%–37.50%). In contrast, urban effects on HP are almost absent if we remove HW-preceded HP events from all HP events. Our results show that urbanization-induced increases in HP are associated with, and magnified by, moist HWs in urban areas of the YRD region. Moist HWs are conducive to an unstable atmosphere and stormy weather, and they also enhance urban heat island intensity, driving increases in HP over urban areas.

How to cite: Gu, X., Li, C., and Slater, L.: Urbanization-Induced Increases in Heavy Precipitation are Magnified by Moist Heatwaves in an Urban Agglomeration of East China, EGU General Assembly 2023, Vienna, Austria, 23–28 Apr 2023, EGU23-1814, https://doi.org/10.5194/egusphere-egu23-1814, 2023.

EGU23-2064 | ECS | Posters virtual | CL4.1

Hot weather amplifies the urban dry island effect, especially in wetter climates 

Sijia Luo and Xihui Gu

Atmospheric humidity is usually drier in cities than the surrounding rural areas, a phenomenon known as the urban dry island (UDI) effect. However, the response of atmospheric humidity to hot weather in urban versus rural settings remains unknown. Using long-term summer (June-August) observations at 1658 stations over 1961-2020, we find that China is dominated by drying trends in atmospheric humidity (i.e., increasing vapor pressure deficit [VPD]). These drying trends are aggravated on hot days and amplified by urbanization, i.e., the UDI effect is stronger in hot weather. This amplification of the UDI effect on hot days is more prominent in humid than in arid regions. Attributions show that the stronger VPD-based UDI effect on hot days is explained by increased contribution of air temperature in southeastern China, and specific humidity in North China. We suggest that adaptations are required to mitigate adverse combined effects of urban heatwaves and UDIs.

How to cite: Luo, S. and Gu, X.: Hot weather amplifies the urban dry island effect, especially in wetter climates, EGU General Assembly 2023, Vienna, Austria, 23–28 Apr 2023, EGU23-2064, https://doi.org/10.5194/egusphere-egu23-2064, 2023.

EGU23-2078 | Posters on site | CL4.1

A new satellite-based product for studying land-atmosphere interactions 

Jian Peng and Almudena García-García

Information about the energy and water exchanges between the land surface and the lower atmosphere (i.e. land-atmosphere interactions) is necessary for example to improve our understanding of the effect of land-atmosphere interactions on the exacerbation of temperature and precipitation extremes. Observations of energy and water fluxes at the land surface usually rely on the eddy covariance method. There is a wide network of these measurements providing data over all continents but with large spatial gaps in Africa, Asia, South America and Oceania. Additionally, other problems are associated with these observational methods such as the energy and water balance non-closure. To improve the spatial coverage of land-atmosphere interactions data considering the energy and water balance closure, we explore the combination of remote sensing data and a physical-based model. The High resOlution Land Atmosphere Parameters from Space (HOLAPS) framework is a one dimensional modelling framework that solves the energy and water balance at the land surface using remote sensing data and reanalysis products as forcings. Preliminary results from the evaluation ofHOLAPS outputs over Europe at 5 km resolution show an improvement in the simulation of latent heat flux when using remote sensing data in comparison with results using only reanalysis data as forcing. Additionally, we see a moderate improvement in HOLAPS latent heat flux estimates against energy-balance corrected eddy covariance measurements in comparison with other products that solve the energy and water balance equations, such as the ERA5Land product. The new HOLAPS product is available at hourly resolution for the period 2001 to 2016 and these estimates can be useful for agriculture and forest management activities and to evaluate the representation of land-atmosphere feedbacks in weather and climate models.

How to cite: Peng, J. and García-García, A.: A new satellite-based product for studying land-atmosphere interactions, EGU General Assembly 2023, Vienna, Austria, 23–28 Apr 2023, EGU23-2078, https://doi.org/10.5194/egusphere-egu23-2078, 2023.

EGU23-3211 | ECS | Orals | CL4.1

Characterisation and interpretation of local climate evolution in the South-West of France 

Marine Lanet, Laurent Li, and Hervé Le Treut

Summer 2022 has been the second hottest summer after 2003 in France since 1900, with 33 cumulative days of heatwaves. It has also been one of the 10 driest summers in France since 1959. The average precipitation deficit reached 20% compared to the 1991-2020 period, exceeding 60% in some regions, even though June 2022 broke the monthly record of storm occurrences.

These extreme climate conditions led to water restrictions and fostered the development of many wildfires. In particular, so called “megafires” burnt more than 28,000 hectares of the Landes forest in the Nouvelle-Aquitaine region, in the South-West of France.

Starting from the 18th century, this swampy region has been dried out by planting maritime pines and digging ditches to drain away excess water. Due to recent events, these land management practices are questioned : the record-breaking soil dryness of summer 2022 enabled fire to propagate underground and resurface further away, making firemen’s work extremely difficult.

By controlling ditch drainage, is it possible to reduce soil dryness and thus fire risk in summer, as well as mitigate heavy precipitation impacts in this flood prone area ? To answer this question, this work first aims at characterizing and interpreting local climate evolution during the last decades, in terms of trends, changes in the seasonal cycle and extreme events, using  ERA 5 reanalysis, the E-Obs dataset, and MODIS satellite observations. CORDEX regional climate projections are also analysed. Nouvelle-Aquitaine will experience both more frequent and intense heatwaves and droughts and an increase in heavy precipitations. Landes forest management thus has to be adapted.

The perspective of this work is to develop a conceptual ditch drainage model and quantify the drought and flood risk reduction potential using storylines based on plausible short and long term climate conditions in Nouvelle-Aquitaine.

In a broader perspective, the objective of this work is to develop a methodology replicable in other regions of the world to analyse the impacts of climate change at a local scale and explore how climate science can provide quantitative information to help decision making.

How to cite: Lanet, M., Li, L., and Le Treut, H.: Characterisation and interpretation of local climate evolution in the South-West of France, EGU General Assembly 2023, Vienna, Austria, 23–28 Apr 2023, EGU23-3211, https://doi.org/10.5194/egusphere-egu23-3211, 2023.

EGU23-3549 | ECS | Posters virtual | CL4.1

The incorporation of 250 m soil grid textural layers in the NOAH-MP land surface models and its effects on soil hydrothermal regimes 

Kazeem Ishola, Ankur Sati, Matthias Demuzere, Gerald Mills, and Rowan Fealy

Effective representation of soil heterogeneity in land surface models is crucial for accurate weather and climate simulations. The NOAH-MP land surface model uses dominant soil texture from State Soil Geographic (STATSGO)/Food and Agriculture Organization (FAO) datasets, considerably introducing uncertainty in the simulation of soil hydrothermal changes and terrestrial water and energy fluxes, at a fine scale. This study investigates the likely added value of incorporating an alternative high resolution soil grid data at different depths, for a better representation of soil hydrothermal dynamics in NOAH-MP v4.3. The model is set up at 1 km grid space over all Ireland domain and soil layer thicknesses of 0.07, 0.21, 0.72 and 1.55 m, with a cummulative soil depth of 2.55 m. The thicknesses are selected to match the layers of initial soil input fields. Model experiments are carried out based on two soil data options namely, (1) the STATSGO/FAO dominant soil texture and (2) the 250 m global soil grid textural compositions from the International Soil Reference and Information Centre (ISRIC), in combination with PedoTransfer Functions (PTFs). The current model integration is applied within the high resolution land data assimilation (HRLDAS) framework to simulate soil temperature and soil liquid water, and evaluated for wet and dry periods using observations from the newly established Terrain-AI data platforms (terrainai.com). Ultimately, the study highlights the importance of using realistic dynamic soil information, which could provide insightful scientific contributions to better monitor surface climate and the influences on land use and land management under climate change.

How to cite: Ishola, K., Sati, A., Demuzere, M., Mills, G., and Fealy, R.: The incorporation of 250 m soil grid textural layers in the NOAH-MP land surface models and its effects on soil hydrothermal regimes, EGU General Assembly 2023, Vienna, Austria, 23–28 Apr 2023, EGU23-3549, https://doi.org/10.5194/egusphere-egu23-3549, 2023.

EGU23-3780 | ECS | Orals | CL4.1

Greening vegetation alleviates hot extremes in the semiarid region of China 

Yipeng Cao, Weidong Guo, Jun Ge, Yu Liu, Chaorong Chen, Xing Luo, and Limei Yang

China has shown a world-leading vegetation greening trend since 2000, which may exert biophysical effects on near-surface air temperature (SAT). However, such effects remain largely unknown because prior studies either focus on land surface temperature, which differs from SAT, or rely on simulations, which are limited by model uncertainties. As a widely used metric in climate and extremes research, SAT is more relevant to human health and terrestrial ecosystem functions. Therefore, it is necessary to explore impacts of greening on SAT and extremes based on observations. Here, we investigate the greening effects on SAT and subsequent extremes over 2003–2014 in China based on high-resolution SAT observations combined with satellite datasets. We find that greening can cause cooling effects on the mean SAT and more pronounced cooling effects on SAT extremes over semiarid regions. Such cooling effects are attributed to enhanced evapotranspiration caused by greening and strong coupling between evapotranspiration and SAT in semiarid regions. Semiarid regions in China are the transitional zone of both climate and ecosystem and deeply influenced by human agricultural and pastoral activities. These factors make the ecosystem of these regions fragile and extremely vulnerable to climate change. Our results reveal a considerable climate benefit of greening to natural and human systems in semiarid regions, and have significant implications for on-going revegetation programs implemented in these regions of China.

How to cite: Cao, Y., Guo, W., Ge, J., Liu, Y., Chen, C., Luo, X., and Yang, L.: Greening vegetation alleviates hot extremes in the semiarid region of China, EGU General Assembly 2023, Vienna, Austria, 23–28 Apr 2023, EGU23-3780, https://doi.org/10.5194/egusphere-egu23-3780, 2023.

EGU23-4818 | ECS | Posters on site | CL4.1

Simulating regional inter-annual crop yield variability over multiple decades with the Community Land Model (CLM5) 

Theresa Boas, Heye Bogena, Dongryeol Ryu, Harry Vereecken, Andrew Western, and Harrie-Jan Hendricks-Franssen

Global climate change with a predicted increase in weather extremes entails vulnerability and new challenges to regional agriculture. While the general impacts of climate change on global food security are a much studied topic, the implications for regional inter-annual yield variability remain unclear. In this study, we analysed the effects of weather trends on regional crop productivity within two agriculturally managed regions in different climate zones, simulated with the latest version of the Community Land Model (version 5.0) over two decades (1999-2019). We evaluated the models’ potential to represent the inter-annual variability of crop yield in comparison to recorded yield variability and different weather indicators, e.g., drought index and growing season length and evaluated which variables (i.e., temperature, precipitation, initial soil moisture content) dominantly drive changes in CLM5-predicted yield variability. The simulation results were able to reproduce the sign of crop yield anomalies, and thus provide a basis on which to study the effects of different weather patterns on inter-annual yield variability. However, the simulations showed limitations in correctly capturing inter-annual differences of crop yield in terms of total magnitudes (up to 10 times lower than in official records). Our results indicate that these limitation arise mainly from uncertainties in the representation of the subsurface soil moisture regime and a corresponding lack of sensitivity towards drought stress. Insights from this work were used to summarize implications for future analysis of CLM5-BGC simulation results over agriculturally managed land and allowed us to discuss and investigate possible technical model improvements.

How to cite: Boas, T., Bogena, H., Ryu, D., Vereecken, H., Western, A., and Hendricks-Franssen, H.-J.: Simulating regional inter-annual crop yield variability over multiple decades with the Community Land Model (CLM5), EGU General Assembly 2023, Vienna, Austria, 23–28 Apr 2023, EGU23-4818, https://doi.org/10.5194/egusphere-egu23-4818, 2023.

EGU23-5624 | ECS | Orals | CL4.1

Abrupt late 1980s surface climate warming effects on drought risk over main french crop production basins 

Léa Laurent, Albin Ullmann, and Thierry Castel

Since late 1980s, warming trend intensifies strongly over Western Europe, resulting in an abrupt shift in air surface temperature over France (Sutton & Dong 2012; Reid et al., 2016). This rapid warming has modified the hydrological cycle with especially a significant decrease in runoff between January and July (Brulebois et al., 2015). As cumulative annual liquid precipitation didn’t significantly evolve after 1987/1988, evapotranspiration might be the main driver of the water cycle evolution.

Along with this abrupt warming, stagnation of crop yields is observed since the 1990s over France, especially for bread wheat (Schauberger et al., 2018). In addition to maize and grapevine, the impact of climate hazard and agro-climatic risk linked to water cycle on the evolution of bread wheat yields is a major issue for agricultural insurance companies (Fusco et al., 2018). In this context, two major concerns need to be assessed: what are the patterns of water balance responses to abrupt changes in temperature? How did this abrupt warming impact drought risk over crops of interest main production basins?

SIM (Safran-Isba-Modcou) dataset of reanalyzed surface meteorological observations offers the opportunity to address the complexity of processes leading to changes in local water cycle (Soubeyroux et al., 2008). Daily liquid precipitation and potential evapotranspiration on an 8km spatial resolution from 1959 to 2021 are used to quantify the evolution of climate hazard linked to water cycle on a continuous time-scale and over the entire French territory. A simplified two reservoirs water balance model is also used to compute daily water balance using agronomic parameters of crops of interest, taking into account crop cover stage (Jacquart & Choisnel, 1995). The evolution of frequency and intensity of drought risk is analyzed using Tweedie distributions (Dunn, 2004).

Our results suggest that the abrupt warming in air temperature in 1987/1988 had strong influence on water balance evolution. Potential evapotranspiration significantly increases after 1987/1988 over the whole French territory especially in spring and summer. The evolution of annual and seasonal cumulative liquid precipitation differs in space and time and is less pronounced, leading to an intensification of water cycle. Water balance displays various evolutions depending on the crop and the production basin studied. The exceeding of water stress threshold is more frequent or more pronounced, leading to modifications of intensity and/or duration of drought events that significantly modify the risk. Risk evolution depends on the crop cover and main production basin.

Evolving climate hazard linked to water cycle impacts agro-climatic risks, identified as one of the main factor affecting the evolution of crop yields. Both mean conditions changes and modifications of the spatio-temporal variability of water balance affect the probability to overcome risk threshold. This is of major concern for the agricultural sector, especially insurance companies, and may lead to adaptation process from managers.

How to cite: Laurent, L., Ullmann, A., and Castel, T.: Abrupt late 1980s surface climate warming effects on drought risk over main french crop production basins, EGU General Assembly 2023, Vienna, Austria, 23–28 Apr 2023, EGU23-5624, https://doi.org/10.5194/egusphere-egu23-5624, 2023.

EGU23-5726 | ECS | Posters on site | CL4.1

Ground surface temperature linked to remote sensing land surface temperature in mountain environments 

Raul-David Șerban, Paulina Bartkowiak, Mariapina Castelli, and Giacomo Bertoldi

Ground surface temperature (GST), measured at approximately 5 cm into the ground is a key parameter controlling all the subsurface biophysical processes at the land-atmosphere boundary. Despite the GST significant importance, the current observational network for GST is sparse, particularly in mountain regions. This work exploits the relationship between the GST and satellite-based land surface temperature (LST) derived from MODerate resolution Imaging Spectroradiometer (MODIS). The GST and LST were compared at 14 weather stations in Mazia Valley, North-eastern Italian Alps. The 1-km MODIS LST was downscaled to a spatial resolution of 250-m using the random forest algorithm. The LST dataset covers the years 2014-2017 during the phenological cycle, between April and October. The in-situ GST measurements were recorded using Campbell Scientific CS655 data loggers. LSTs were usually larger than GSTs with temperature differences ranging from 0.1 to 22 °C and an average of 7.9 °C. The lowest and largest average difference was 4.49 °C (1823 m, pasture, south slope) and 10.27 °C (1778 m, forest, north slope), respectively. GST was positively correlated with LST with an R2 ranging from 0.24 to 0.52 and was above 0.45 for 57 % of the stations. The RMSE ranged between 6.05 and 11.05 °C, while for 71 % of the stations was below 9.3 °C. The statistics were influenced by the number of available pairwise for comparison that were ranging from 110 to 377 due to cloud contamination or logger malfunction. Although the RMSE was relatively high, the LST closely followed the pattern of the GST variability suggesting the possibility of linking GST to LST products.

How to cite: Șerban, R.-D., Bartkowiak, P., Castelli, M., and Bertoldi, G.: Ground surface temperature linked to remote sensing land surface temperature in mountain environments, EGU General Assembly 2023, Vienna, Austria, 23–28 Apr 2023, EGU23-5726, https://doi.org/10.5194/egusphere-egu23-5726, 2023.

EGU23-5961 | ECS | Orals | CL4.1 | Highlight

Soil Hot Extremes are Increasing Faster than Air Hot Extremes Regionally 

Almudena García-García, Francisco José Cuesta-Valero, Diego G. Miralles, Miguel D. Mahecha, Johannes Quaas, Markus Reichstein, Jakob Zscheischler, and Jian Peng

Hot temperature extremes are changing in intensity and frequency. Quantifying these changes is key for developing adaptation and mitigation strategies. The conventional approach to study changes in hot extremes is based on air temperatures. However, many biogeochemical processes, i.e. decomposition of organic material and release of CO2, are triggered by soil temperature and it remains unclear whether it changes as does air temperature. Here, we demonstrate that soil hot extremes are intensifying and becoming even more frequent faster than air hot extremes over central eastern and western Europe. Based on existing model simulations, we also show that the increase in hot soil extremes could amplify or spread future heat waves by releasing sensible heat during hot days. We find an increase of 3 (7) % in the number of hot days with a contribution of heat from the soil under a warming level of 2.0 (3.0) °C than under a warming level of 1.5 °C. Furthermore, defining intensity and frequency extreme indices based on soil and air temperatures leads to a difference of more than 1 °C in intensity and 10% in frequency regionally during the last decades of the 21st century under the SPP5 8.5 emission scenario. In light of these results, maximum soil temperatures should be included in ecological risk studies as a complementary perspective to the conventional approach using extreme indices based on air temperatures.


How to cite: García-García, A., Cuesta-Valero, F. J., Miralles, D. G., Mahecha, M. D., Quaas, J., Reichstein, M., Zscheischler, J., and Peng, J.: Soil Hot Extremes are Increasing Faster than Air Hot Extremes Regionally, EGU General Assembly 2023, Vienna, Austria, 23–28 Apr 2023, EGU23-5961, https://doi.org/10.5194/egusphere-egu23-5961, 2023.

EGU23-6528 | ECS | Posters on site | CL4.1

Improving the temporal and spatial vegetation variability in land surface models based on satellite observations  

Fransje van Oorschot, Ruud van der Ent, Markus Hrachowitz, Emanuele di Carlo, Franco Catalano, Souhail Boussetta, Gianpaolo Balsamo, and Andrea Alessandri

Land-atmosphere interactions are largely controlled by vegetation, which is dynamic across spatial and temporal scales. Most state-of-the-art land surface models do not adequately represent the temporal and spatial variability of vegetation, which results in weaknesses in the associated variability of modelled surface water and energy states and fluxes. The objective of this work is to evaluate the effects of integrating spatially and temporally varying vegetation characteristics derived from satellite observations on modelled evaporation and soil moisture in the land surface model HTESSEL. Specifically, model fixed land cover was replaced by annually varying land cover, and model seasonally varying Leaf Area Index (LAI) was replaced by seasonally and inter-annually varying LAI. Additionally, satellite data of Fraction of green vegetation Cover (FCover) was used to formulate and integrate a spatially and temporally varying model effective vegetation cover parameterization. The effects of these three implementations on model evaporation and soil moisture were analysed using historical offline (land-only) model experiments at a global scale, and compared to reference datasets.

The enhanced vegetation variability lead to considerable improvements in correlation of anomaly evaporation and surface soil moisture in semiarid regions during the dry season. These improvements are related to the adequate representation of vegetation-evaporation-soil moisture feedback mechanisms during water-stress periods in the model, when integrating spatially and temporally varying vegetation. These findings emphasize the importance of vegetation variability for modelling land surface-atmosphere interactions, and specifically droughts. This research contributes to the understanding and development of land surface models, and shows that satellite observational products are a powerful tool to represent vegetation variability.

How to cite: van Oorschot, F., van der Ent, R., Hrachowitz, M., di Carlo, E., Catalano, F., Boussetta, S., Balsamo, G., and Alessandri, A.: Improving the temporal and spatial vegetation variability in land surface models based on satellite observations , EGU General Assembly 2023, Vienna, Austria, 23–28 Apr 2023, EGU23-6528, https://doi.org/10.5194/egusphere-egu23-6528, 2023.

The diurnal air temperature range (DTR) is strongly shaped by solar radiation but is modulated by hydrologic cycling through changes in atmospheric (clouds) and land-surface (evaporation) characteristics. Here, we aim to determine the distinct patterns in DTR over dry and wet periods and identify their respective controls. To do this, we develop a simple energy balance model that constrains the land-atmosphere exchange using the thermodynamic limit of maximum power. In this framework, we explicitly account for changes in radiative conditions due to clouds and changes in boundary layer heat storage associated with surface water limitation, both of which affect the maximum power limit. Using observations of radiative forcings and surface evaporation, our model predicts DTR reasonably well across 81 FLUXNET sites in North America, Europe, and Australia. We show that DTR is primarily shaped by the trade-off between the heat gain due to solar absorption and heat lost at the surface due to evaporation. Radiation remains a primary control on DTR over very dry and wet conditions where evaporation is either close to zero or limited by available energy. Over these regions, changes in DTR are strongly modulated by clouds which alters the radiative conditions. DTR becomes coupled to the land surface during the transition regime where changes in surface water availability directly control the evaporation rates. Over these regions, increased soil moisture results in more evaporation and reduced DTR. These responses were consistent in both, observations and maximum power estimates. We then apply our framework to quantify the response of DTR to global warming. Our model projects a decrease in DTR by 0.18K for a 1K rise in global temperature, which is consistent with the current observed response. Our findings imply that the predominant controls on DTR are set by clouds and evaporation as they directly modulate the diurnal heating of the lower atmosphere and can be further altered by increased greenhouse forcing.

How to cite: Ghausi, S. A., McColl, K., and Kleidon, A.: Determining the radiative and hydrologic controls on the diurnal air-temperature range using the thermodynamic limit of maximum power, EGU General Assembly 2023, Vienna, Austria, 23–28 Apr 2023, EGU23-7721, https://doi.org/10.5194/egusphere-egu23-7721, 2023.

EGU23-9421 | ECS | Orals | CL4.1

An emergent constraint exposes widespread underestimation of drought impacts by Earth System Models 

Julia K. Green, Yao Zhang, Xiangzhong Luo, and Trevor Keenan

The response of vegetation canopy conductance (gc) to changes in moisture availability gc) during drought is a major source of uncertainty in climate projections. Representing ϒgc accurately in Earth System Models (ESMs) is particularly problematic because no regional scale gc observations exist with which to evaluate it. Here, we overcome this challenge by deriving an emergent constraint on ϒgc across ESMs from Phase 6 of the Coupled Model Intercomparison Project (CMIP6). We leverage an ensemble of satellite, reanalysis and station-based estimates of surface temperatures, which are physically and statistically linked to ϒgc due to the local cooling effect of gc. We find that models systemically underestimate ϒgc by ~50%, particularly in semi-arid grasslands, croplands, and savannas. Based on the mediating effect of gc on carbon, water and energy fluxes through land-atmosphere interactions, the underestimation of modeled ϒgc in these regions contributes to biases in temperature, transpiration and gross primary production. Our results provide a novel benchmark to improve model representation of vegetation dynamics and land-atmosphere feedbacks in these regions, thus improving forecasting ability of climate extremes under future climate change scenarios.

How to cite: Green, J. K., Zhang, Y., Luo, X., and Keenan, T.: An emergent constraint exposes widespread underestimation of drought impacts by Earth System Models, EGU General Assembly 2023, Vienna, Austria, 23–28 Apr 2023, EGU23-9421, https://doi.org/10.5194/egusphere-egu23-9421, 2023.

EGU23-9767 | ECS | Posters on site | CL4.1

Diagnosing above- and below-canopy temperature impacts of forest in the Netherlands during heatwaves 

Jingwei Zhou, Adriaan J. Teuling, and Michiel K. van der Molen

Heatwaves have significant effects on ecosystems and human populations. Human habitability is impacted severely as human exposure to heatwaves is projected to increase. Future risk of heatwaves has demonstrated the need of effective measures for adaptation to persistent hot temperature extremes and ambitious mitigation to limit further increases in heatwave severity.

At local scales, forest management could be a potential approach of modifying surface energy budget and in this way alleviating heatwave impacts. In this study,  open-site, below-canopy, and above-canopy climatic conditions from 4 different sites during the time period 1997-2020 in the Netherlands were compared to investigate canopy functions of affecting above-canopy macroclimate and as a thermal insulator to regulate understory microclimate and land surface ecology. Using high-resolution sub-daily data sets from Loobos, in which water vapor and heat fluxes were measured every half an hour by a combination of eddy covariance flux measurements and a profile system, we analysed temperatures at three levels of Loobos (23.5m, 7.5m, and soil litter layer) of the same profile and compared them with those measured at open sites in De bilt and Deleen.

Heatwave periods are defined as a sequence of at least five days during which the daily maximum temperature exceeds the climatological mean over the reference period 1997-2010 by at least 5 °C. During heatwave periods, the cooling effects of the canopy on surface temperatures are stronger compared to normal periods while the canopy may aggravate the temperature above it during certain hours. By contrast, temperature differences are higher during normal times than heatwave periods when considering temperature buffer effects of canopy on understory climate (7.5m).

Further study on heat fluxes, Bowen ratio, and canopy effects on heat stress during normal conditions and heatwaves will be conducted as well. Relative humidity will be incorporated in measuring heat stress to reflect real conditions living bodies experience.

How to cite: Zhou, J., Teuling, A. J., and van der Molen, M. K.: Diagnosing above- and below-canopy temperature impacts of forest in the Netherlands during heatwaves, EGU General Assembly 2023, Vienna, Austria, 23–28 Apr 2023, EGU23-9767, https://doi.org/10.5194/egusphere-egu23-9767, 2023.

EGU23-9777 | Orals | CL4.1

Leaves, land-atmosphere interactions and extremes 

Gregory Duveiller

Leaves are the main interface between terrestrial ecosystems and the atmosphere. They govern the exchange of carbon, water and energy between vegetation and the atmospheric boundary layer. They are the surface designed to capture light and transform it to sugars via photosynthesis, but they also regulate how much water they transpire through their stomata. Their colour, density and orientation will affect their albedo, which determines how much energy is reflected back to the atmosphere, while their overall configuration within the canopy structure can affect the roughness length of the surface.

When we manage landscapes, be it by planting crops or cutting down forests, we are typically changing the quantity and type of leaves covering the surface of the land. By doing so, we can modify the land-atmosphere interactions and thereby have an effect on the climate. For instance, a substantial local cooling effect could be attained by using cover crops in winter, especially with highly reflective chlorophyll deficient mutants. Increasing forest cover appears to lead to more cloud cover, which itself could affect albedo at the top of the atmosphere. But the amount of leaves in the landscape can further affect extremes.

Here I will illustrate how leaves affect land-atmosphere interactions in the context of extreme events with two studies. The first study looks at the known biophysical effect of land use change on local surface temperature, but extends it to explore its sensitivity across the globe during the extremes observed in 20 years of satellite remote sensing records. The second study shows how much getting leaves right matters within the reanalysis records of ERA5 and ERA5-Land, where prescribed seasonal cycles of leaf area index (LAI) lead to biases in modelling land surface temperature (LST), thereby underestimating the intensity of heat waves over Europe.

How to cite: Duveiller, G.: Leaves, land-atmosphere interactions and extremes, EGU General Assembly 2023, Vienna, Austria, 23–28 Apr 2023, EGU23-9777, https://doi.org/10.5194/egusphere-egu23-9777, 2023.

EGU23-9838 | ECS | Orals | CL4.1

Vegetation-climate coupling and vegetation sensitivity to climate extremes in growing seasons 

Minchao Wu, Gabriele Messori, Giulia Vico, Stefano Manzoni, Zhanzhang Cai, Jing Tang, Torbern Tagesson, and Zheng Duan

Terrestrial vegetation is largely mediated by vegetation-climate coupling. Growing conditions control vegetation growth, which in turn feeds back to climate through changes in biophysical and biogeochemical properties and processes, such as canopy structure and carbon and water exchanges. The vegetation-climate coupling is thus highly variable in space and time. However, little is known on how the large-scale vegetation-climate coupling varies within growing season, and how vegetation responds to climate extremes. In this contribution, we present some recent findings on seasonal and intra-seasonal vegetation-climate coupling and vegetation sensitivity to droughts using multiple remote sensing products including MODIS EVI, GIMMS3g NDVI and VIP EVI2. We account for the differences in phenological stages of growing seasons affected by both climate and landscape heterogeneity. Based on a novel analytical framework incorporating meteorological and vegetation conditions to locally defined vegetation growing seasons, we analyse vegetation-climate couplings using both local climate conditions and teleconnection indices (e.g., Jet Latitude Index). In addition, vegetation sensitivity to droughts and post-drought vegetation changes are assessed. Our results highlight the importance of considering vegetation phenology in understanding sub-seasonal land-atmosphere interaction and vegetation dynamics. The developed analytical framework is suggested to be an effective approach for evaluating vegetation and climate dynamics simulated by Earth System Models.

How to cite: Wu, M., Messori, G., Vico, G., Manzoni, S., Cai, Z., Tang, J., Tagesson, T., and Duan, Z.: Vegetation-climate coupling and vegetation sensitivity to climate extremes in growing seasons, EGU General Assembly 2023, Vienna, Austria, 23–28 Apr 2023, EGU23-9838, https://doi.org/10.5194/egusphere-egu23-9838, 2023.

EGU23-9920 | ECS | Posters on site | CL4.1

Diurnal to interannual variability in Cabauw simulated by the ECLand land surface model 

Luís Fróis, Pedro M. A. Miranda, and Emanuel Dutra

Land surface plays a fundamental role in the earth system, mediating the water, energy and carbon fluxes between the land and the atmosphere. The land surface physical and biophysical processes act on time scales ranging from sub-daily to decades with relevant impacts from weather forecasts to climate change. However, there are very few available in-situ observations of land surface state and fluxes extending for several years to decades, limiting an integrated validation of the models on the different time scales. The long time series of Cabauw (Netherlands) observations provides a unique opportunity to evaluate land surface processes and their representation in land surface model at time scales ranging from sub-diurnal to interannual. In this study, we take advantage of the uniqueness of Cabauw observational record to investigate the performance of the ECMWF land surface model ECLand for the period 2001-2020 (20 years). Emphasis is given to the summer season and to evaporation and evaporative fraction. An idealized simulation without canopy resistance is performed along with other model configurations with changes to the constraints of canopy resistance (soil moisture availability and atmospheric humidity deficit) and the vertical discretization of the soil layers.

Observational uncertainties impact the surface energy budget closure. For example, the model shows a large overestimation of the ground heat flux diurnal cycle. However, part of this can be attributed to observational uncertainties associated with the sinking of the temperature sensors.  The default configuration of ECLand shows an underestimation of latent heat and evaporative fraction, which can be partially attributed to the model’s representation of canopy resistance. The increased vertical discretization of the soil layers has a neutral impact on the simulated turbulent fluxes, showing an improved representation of near-surface soil temperature. Our results show limitations in the representation of the summer interannual variability of the turbulent fluxes. These are associated with the representation of extreme events (droughts) and are not fully addressed in any of the model configurations tested. These results suggest that other processes relevant to the representation of evaporation in dryness stress conditions need to be further investigated.

This work was developed in the framework of the project NextGEMS funded through the European Union’s Horizon 2020 research and innovation program under the grant agreement number 101003470. Luis Frois was funded by the FCT Grant 2020.08478.BD. The authors also acknowledge the financial support of the Portuguese Fundação para a Ciência e a Tecnologia (FCT) I.P./MCTES through national funds (PIDDAC) – UIDB/50019/2020- IDL.

How to cite: Fróis, L., Miranda, P. M. A., and Dutra, E.: Diurnal to interannual variability in Cabauw simulated by the ECLand land surface model, EGU General Assembly 2023, Vienna, Austria, 23–28 Apr 2023, EGU23-9920, https://doi.org/10.5194/egusphere-egu23-9920, 2023.

EGU23-10118 | ECS | Orals | CL4.1

Mechanistic patterns of land hydroclimate changes in a changing climate 

Suqin Duan, Kirsten Findell, and Stephan Fueglistaler

Climate model predictions of land hydroclimate changes show large geographic heterogeneity, and differences between models are large. We introduce a new process-oriented phase space that reduces the dimensionality of the problem but preserves (and emphasizes) the mechanistic relations between variables. This transform from geographical space to climatological aridity index (AI) and daily soil moisture (SM) percentiles allows for interpretation of local, daily mechanistic relations between the key hydroclimatic variables in the context of time-mean and/or global-mean energetic constraints and the wet-get-wetter/dry-get-drier paradigm. Focusing on the tropics (30S-30N), we show that simulations from 16 different CMIP models exhibit coherent patterns of change in the AI/SM phase space that are aligned with the established soil-moisture/evapotranspiration regimes. Results indicate the need to introduce an active-rain regime as a special case of the energy-limited regime. In response to CO2-induced warming, rainfall only increases in this regime, and this temporal rainfall repartitioning is reflected in an overall decrease in soil moisture. Consequently, the regimes where SM constrains evapotranspiration become more frequently occupied, and hydroclimatic changes align with the position of the critical soil moisture value in the AI/SM phase space. Analysis of land hydroclimate changes in CMIP6 historical simulations in the AI/SM phase space reveal the very different impact of CO2 forcing and aerosol forcing. CESM2 Single Forcing Large Ensemble Experiments are used to understand their roles.

How to cite: Duan, S., Findell, K., and Fueglistaler, S.: Mechanistic patterns of land hydroclimate changes in a changing climate, EGU General Assembly 2023, Vienna, Austria, 23–28 Apr 2023, EGU23-10118, https://doi.org/10.5194/egusphere-egu23-10118, 2023.

EGU23-11343 | ECS | Posters on site | CL4.1

The relevance of coupled climate model WRF-CTSM for land-atmosphere interactions analysis 

Iris Mužić, Øivind Hodnebrog, Terje Koren Berntsen, Yeliz Yilmaz, Jana Sillmann, David Lawrence, Sean Swenson, and Negin Sobhani

A credible assessment of spatial and temporal variability of the water and energy budget is of viable importance for the quantification of the observed changes and prediction of extremes in a changing climate. However, an accurate representation of feedback mechanisms between the land surface and the atmosphere is a key source of uncertainty in climate models.

WRF-CTSM (Weather Research and Forecasting model, WRF, and Community Terrestrial Systems Model, CTSM) is a state-of-the-art modelling tool that represents the forefront in the climate modelling community and unifies the recent model development activities across weather, climate, water and ecosystem research. This study is the first to provide a systematic regional scale assessment of the WRF-CTSM coupled climate model performance in the European context - in the high-latitude region encompassing Norway, Sweden and Finland.

A 10-year-long regional WRF-CTSM simulation (2010-2020) using meteorological boundary conditions from the ERA5 reanalysis is performed on a 10.5 km horizontal resolution to evaluate the representation of hydroclimatic variables through comparison against ERA5 and a range of observational datasets. Changes in boundary layer variables such as soil and near-surface air temperature, soil moisture and snowpack are essential for the assessment of the land-atmosphere feedbacks in this region and are thus selected as central for the analysis of the model skill. Besides the WRF-CTSM simulations using default CTSM settings, this study investigates the added value of including the recently developed Hillslope Hydrology model in WRF-CTSM runs that has the potential to improve the understanding of the role of topography and hydrology on the soil moisture and snowpack variability.

Preliminary results indicate the capacity of WRF-CTSM to identify the high-temperature susceptible areas in Norway, Sweden and Finland and reproduce the interannual variability and spatial patterns of hydroclimatic variables in the respective region.

How to cite: Mužić, I., Hodnebrog, Ø., Berntsen, T. K., Yilmaz, Y., Sillmann, J., Lawrence, D., Swenson, S., and Sobhani, N.: The relevance of coupled climate model WRF-CTSM for land-atmosphere interactions analysis, EGU General Assembly 2023, Vienna, Austria, 23–28 Apr 2023, EGU23-11343, https://doi.org/10.5194/egusphere-egu23-11343, 2023.

EGU23-11538 | Orals | CL4.1

Mesoscale Gradients in Soil Moisture over South America Lead to Enhanced Convection 

Francina Dominguez, Divyansh Chug, Christopher Taylor, Cornelia Klein, and Stephen Nesbitt

This work presents the first observationally-based study over subtropical South America linking the spatial location of convection and drier soil patches of the order of tens of kilometers, as well as observational evidence of the control of background flow on the sign of SM-PPT feedbacks at convective scales. Using satellite data from multiple infrared and microwave radiometers, we track nascent, daytime convective clouds over subtropical South America and quantify the underlying, antecedent (morning), SM heterogeneity. We find that convection initiates preferentially on the dry side of strong dry-wet SM boundaries that are associated with spatially drier and warmer patches of tens of kilometers scale consistent with findings in other parts of the world. This preference maximizes during weak background low-level wind, high convective available potential energy, low convective inhibition and low vegetation density when analyzing surface gradients of 30 km length scale. On the other hand, surface gradients of 100 km length scale are significantly associated with afternoon convection during convectively unfavorable synoptic conditions and strong background flow, unlike previous studies. The location of the precipitation maxima following CI onset is most sensitive to the lower tropospheric background flow at the time of CI. The wind profile during weak background flow does not support propagation of convective features away from the dry regions and rainfall accumulates over the dry patch. Convection during strong background flow leads to greater rainfall hundreds of kilometers away from the CI location. 


How to cite: Dominguez, F., Chug, D., Taylor, C., Klein, C., and Nesbitt, S.: Mesoscale Gradients in Soil Moisture over South America Lead to Enhanced Convection, EGU General Assembly 2023, Vienna, Austria, 23–28 Apr 2023, EGU23-11538, https://doi.org/10.5194/egusphere-egu23-11538, 2023.

EGU23-12925 | ECS | Orals | CL4.1

Interannual Variation of Land-Atmosphere Interactions and their Connection with Extremes over Europe 

Lisa Jach, Thomas Schwitalla, Volker Wulfmeyer, and Kirsten Warrach-Sagi

The land surface supplies heat and moisture to the atmosphere influencing the regional climate during the convective season. Availability of soil moisture for evapotranspiration, vegetation phenology and atmospheric conditions influence the strength of the land surface impact on the atmosphere, and the mechanisms predominating the heat and moisture exchange. As both the synoptic conditions as well as the vegetation state vary on sub-seasonal to interannual time scales, the strength of land-atmosphere (L-A) interaction is expected to fluctuate on these time scales.

Up to now, research typically either focuses on case studies to understand the mechanisms of how land surface and atmosphere interact, or on climatic time scales to quantify co-variances in the climate system based on a sufficient sample size. Timescales in between remain rarely considered in land-atmosphere feedback studies.

In our study, we applied various L-A coupling measures to evaluate land surface impacts on the atmosphere and quantify interactions associated with the triggering of convective precipitation and droughts for all summers between 1991 and 2022 over Europe based on ERA5 data.

Our results highlight that differently strong L-A interactions evolve in dependence of atmospheric wetness, temperature, and the circulation pattern, as well as the root zone soil moisture and vegetation cover. Under warm and dry conditions such as in 2003, 2018 and 2022, soil moisture availability imposed limits for evapotranspiration not only in Southern Europe, but also in Central and Eastern Europe, interfering with vegetation growth and atmospheric moisture supply. Limited moisture and excessive heat supply amplified the already high temperatures and low near-surface moisture, which finally aggravated the unfavorable conditions for local precipitation and caused extreme drought conditions. On the contrary, warm and wet conditions such as in 2021 provided well-suited conditions for vegetation growth, which enhanced the moisture supply to the atmosphere. Together with stronger atmospheric instability, this provided more favorable preconditions for convective precipitation. Generally, most L-A interactions perform as an intensifier of persisting anomalies, particularly under warm and dry atmospheric conditions over Europe.

How to cite: Jach, L., Schwitalla, T., Wulfmeyer, V., and Warrach-Sagi, K.: Interannual Variation of Land-Atmosphere Interactions and their Connection with Extremes over Europe, EGU General Assembly 2023, Vienna, Austria, 23–28 Apr 2023, EGU23-12925, https://doi.org/10.5194/egusphere-egu23-12925, 2023.

EGU23-13277 | ECS | Posters on site | CL4.1

Earth observation time series for the monitoring of droughts in Cyprus: Patterns and drivers of vegetation dynamics 

Soner Uereyen, Christina Eisfelder, Ursula Gessner, Sophie Reinermann, Sarah Asam, Constantinos F. Panagiotou, Marinos Eliades, Ioannis Varvaris, Eleni Loulli, Zampela Pittaki, Diofantos Hadjimitsis, Claudia Kuenzer, and Felix Bachofer

With amplified climate warming, climate extremes over Europe become more frequent. Since the 2000’s, many years have been characterized by extreme events such as droughts and heat waves. For example, in Central Europe, extreme droughts and heat waves took place in the years 2003 and 2018. In comparison, Cyprus experienced strong droughts during 2003 and 2016-2018. Such extreme climate events can have severe impacts on agricultural yields, the productivity of natural vegetation, and on water resources. In this regard, long-term Earth observation (EO) time series are essential to quantitatively assess and analyse changes on the land surface, including vegetation condition. In this study, a joint analysis of geoscientific time series over the last two decades, including EO-based MODIS vegetation indices and meteorological variables is performed to assess drought events and analyse trends as well as potential drivers of vegetation dynamics in Cyprus. The analysis of drought events and vegetation trends is based on the full archive of MODIS imagery at 250 m spatial resolution covering the period 2000-2022. In detail, climate-related effects on vegetation were analysed by means of the deviations of MODIS 16-day vegetation index composites from their long-term mean. Next, trends of the MODIS vegetation index were calculated to evaluate spatial patterns of vegetation change over the investigated period. These analyses were additionally performed for geographically stratified regions, including diverse vegetation classes such as cropland and grassland. Furthermore, the application of a causal discovery algorithm reveals linkages within a multivariate feature space, in particular between vegetation greenness and climatic drivers. Preliminary analyses showed that drought patterns differ with respect to seasons and the investigated vegetation class. For example, the strong drought year 2008 is clearly reflected in the results, whereas forest areas appear to be least affected by the drought during the spring months. Moreover, considering the significant trends over the last two decades, an increase in vegetation greenness could be observed.

How to cite: Uereyen, S., Eisfelder, C., Gessner, U., Reinermann, S., Asam, S., Panagiotou, C. F., Eliades, M., Varvaris, I., Loulli, E., Pittaki, Z., Hadjimitsis, D., Kuenzer, C., and Bachofer, F.: Earth observation time series for the monitoring of droughts in Cyprus: Patterns and drivers of vegetation dynamics, EGU General Assembly 2023, Vienna, Austria, 23–28 Apr 2023, EGU23-13277, https://doi.org/10.5194/egusphere-egu23-13277, 2023.

EGU23-13932 | Posters on site | CL4.1

The Impact of Recent European Droughts and Heatwaves on Trace Gas Surface Fluxes: Insights from Land Surface Data Assimilation 

Paul Hamer, Heidi Trimmel, Jean-Christophe Calvet, Bertrand Bonan, Catherine Meurey, Islen Vallejo, Sabine Eckhardt, Gabriela Sousa-Santos, Virginie Marecal, and Leonor Tarrason

Heatwave and drought extremes can have significant impacts on vegetation, which can in turn lead to important effects on reactive trace gas fluxes at the land-atmosphere interface that can ultimately alter atmospheric composition. We present results from the EU-funded Sentinel EO-based Emission and Deposition Service (SEEDS) project, which aimed at developing upgrades to the existing Copernicus Atmospheric Monitoring Service (CAMS) component on European air quality. In this work, we used land surface modelling (SURFEX – Surface Externalisée) combined with data assimilation (Extended Kalman Filter - EKF) of satellite leaf area index (LAI) to deliver improved estimation of the land surface state. The land surface model is coupled with an online model for dry deposition and an offline model (MEGANv3.1) for biogenic volatile organic compounds (BVOCs) to estimate trace gas losses and emissions, respectively. This approach exploits methods at the forefront of land surface modelling (dynamic vegetation simulation and data assimilation) and combines them with the latest algorithms to estimate trace gas fluxes at the surface. We present findings from two extreme events in Europe: the 2018 drought and the 2019 June/July heat waves. SURFEX was forced using ECMWF meteorology at 0.1° × 0.1° resolution that captured both events. Both extreme events provoked strong responses in the models for dry deposition velocity and BVOC emissions. The 2018 drought began in spring and endured through summer, during which dry deposition velocities declined steadily beyond seasonal norms due to increased stomatal resistance forced by the vegetation response to drought. Over continental Europe, BVOCs initially increased in the early phase of the drought, but then sharply declined into July in the worst-affected regions in Germany, Denmark, and Poland. Meanwhile, BVOCs increased in Scandinavia relative to seasonal norms due to the warmer-than-average conditions. The first episode of severe heat in 2019 arrived in late June, which initially caused a large increase in BVOC emissions compared to seasonal norms. Then drought set in during July and despite a second large heat wave BVOC emissions were lower overall compared to seasonal norms. In fact, the European-wide BVOC emissions were higher in June compared to July due to the drought effects that commenced later in the heat wave cycle. This reverses the normal seasonal cycle in BVOC emissions, and drought impacts on vegetation were the primary driver behind this. Dry deposition velocities are reduced during both heat waves, but we see a larger decline in the second heat wave in July when drought conditions are more severe.

Our findings suggest that these impacts on trace gas surface fluxes would have a strong effect on atmospheric composition, and on photochemical ozone formation. We, therefore, conclude that these effects likely played a contributory role to the ozone pollution episodes that occurred coincidentally in time with the heat wave events in both 2018 and 2019. The project aim within SEEDS is to eventually test the BVOC emissions and dry deposition velocities within a chemical transport model participating within the CAMS regional ensemble (MOCAGE) and to therefore evaluate the impact on ozone.

How to cite: Hamer, P., Trimmel, H., Calvet, J.-C., Bonan, B., Meurey, C., Vallejo, I., Eckhardt, S., Sousa-Santos, G., Marecal, V., and Tarrason, L.: The Impact of Recent European Droughts and Heatwaves on Trace Gas Surface Fluxes: Insights from Land Surface Data Assimilation, EGU General Assembly 2023, Vienna, Austria, 23–28 Apr 2023, EGU23-13932, https://doi.org/10.5194/egusphere-egu23-13932, 2023.

EGU23-14104 | ECS | Orals | CL4.1

Transpiration in forest ecosystems based on deep learning and sap flow observations 

Marco Hannemann, Almudena García-García, and Jian Peng

Transpiration (T), the component of evaporation (E) controlled by vegetation, dominates terrestrial Evaporation, but measurements are highly uncertain. In the light of the importance of evaporation for studying the terrestrial water cycle, hydro-climatic extremes such as droughts and heatwaves and land-atmospheric interactions, there is a strong demand on novel approaches to reliably estimate T. Currently available approaches to estimate T mostly rely on its relationship with photosynthesis, but parameterizing this relationship is difficult and estimates of T strongly disagree among each other in terms of magnitude. Moreover, in-situ measurements are scarce and and evaporation cannot be measured directly from space.

We developed a hybrid Priestley-Taylor (PT) model using Deep Learning to learn the relationship between T and state variables such as soil moisture, vapor pressure deficit and the fraction of photosynthetic active radiation for different plant functional types (PFTs). We use globally available variables from reanalysis and remote sensing data as forcing to train an artificial neural network on the PT-coefficient α obtained by inverting the PT model on sap flow based ecosystem T. In this way, we can predict Transpiration at local scales independently from hard-to-obtain fluxes like E or vegetation parameters such as stomatal conductance. We evaluate our algorithm against T estimates from flux partitioning methods based on water use efficiency at eddy covariance sites for different PFTs and regions. Also, we compare our estimates with other available products of transpiration like GLEAM, PML-V2 and ERA5-Land. Preliminary results of this research showed that the developed model can learn the relationship between T and few influencing variables, without incorporating variables such as net radiation or GPP. Our findings contribute to dissolving the scarcity of T estimates in forest ecosystems based on actual observations. Future work is needed to apply our method to the larger scale for studying spatial patterns of T, e.g. across the European continent.

How to cite: Hannemann, M., García-García, A., and Peng, J.: Transpiration in forest ecosystems based on deep learning and sap flow observations, EGU General Assembly 2023, Vienna, Austria, 23–28 Apr 2023, EGU23-14104, https://doi.org/10.5194/egusphere-egu23-14104, 2023.

EGU23-14158 | Posters on site | CL4.1

Continuous observations of CO2 and CH4 exchange from East-African rangelands 

Lutz Merbold, Vincent Odongo, Thomas Dowling, Francesco Fava, Ilona Glücks, Anton Vrieling, Martin Wooster, and Sonja Leitner

Semi-arid rangelands in Sub-Saharan Africa (SSA) are an important source of food security and nutrition but are under increased anthropogenic pressure by a growing population. These rangelands are characterized by nutrient poor soils and distinct wet and dry season(s). Due to the soil and climate combination, conventional crop agriculture is rarely feasible without irrigation and mineral fertilizer amendments, which in turn are limited by prohibitively high fertilizer prices and lack of water. Instead, pastoral livestock keeping is a valuable option to use these marginal lands and – under the right management – can be a sustainable form of food production and biodiversity protection given that most of these landscapes have co-evolved with megafauna over millennia. Despite the global role of livestock systems on climate change, there is still limited understanding on the role of SSA rangelands. At the same time, livestock systems emit greenhouse gases (GHG) and can promote global warming. But despite the impact of livestock systems on climate change, our understanding of the role of SSA rangelands is limited. To date, a thorough assessment that includes continuous GHG exchange measurement in combined wildlife-livestock systems on the African continent has not been undertaken. Here we provide the first eddy covariance (EC) measurements of CO2/CH4/H2O fluxes from the ILRI Kapiti Wildlife Conservancy - a benchmark rangeland site in East Africa that is grazed by livestock and wildlife. Our results show continuous ecosystem CO2 uptake from the wet to dry seasons with considerable CO2 emission pulses following precipitation events after long dry periods that turn the landscape into short-term net CO2 emitters. In contrast to CO2, CH4 fluxes are highly variable and depend particularly on wildlife and/or livestock being present in the fetch of the EC tower. In addition to EC measurements and given the need for scaling of our results, we relate CO2 and CH4 fluxes to simple remote sensing measurements of vegetation greenness derived from phenological cameras. Our results show good agreement between the two approaches. Yet, more observations across a climatic gradient and along varying management intensities are needed to reduce existing uncertainties in the effect of SSA rangelands on climate change. To build a complete GHG budget, hot spots of greenhouse gas emissions such as from livestock enclosures or water bodies as well as soil carbon sequestration have yet to be accounted for.

How to cite: Merbold, L., Odongo, V., Dowling, T., Fava, F., Glücks, I., Vrieling, A., Wooster, M., and Leitner, S.: Continuous observations of CO2 and CH4 exchange from East-African rangelands, EGU General Assembly 2023, Vienna, Austria, 23–28 Apr 2023, EGU23-14158, https://doi.org/10.5194/egusphere-egu23-14158, 2023.

EGU23-14377 | Posters on site | CL4.1

Sensitivity to soil moisture initialization in the simulation of Indian pre-monsoon season, using a regional climate numerical model 

Arjun Vasukuttan, Lorenzo Sangelantoni, Ka Shateesan, and Gianluca Redaelli

Soil moisture content is crucial for the representation and predictability of hydroclimatic extremes of different spatial/temporal scales such as heavy rainfall, droughts and heatwaves. In order to include these effects and the relevant feedback with the atmosphere in a regional climate model, the soil moisture initialization has to be adequate.

This study explores the soil moisture precipitation (SM-P) feedback, the soil moisture temperature (SM-T) feedback and the heat fluxes over the entire domain and 3 smaller regions of interest. A hydrostatic version of the Regional Climate Model  4.7 (RegCM4.7) with Arakawa B grid is used to run the simulations. The simulations  are performed for the months February to May during the years 2008, 2009 and 2010 with a spatial resolution of 12 km and temporal resolution of 3 hours. The initial and boundary conditions(ICBC)  are derived from the ERA5 data.  We examine results from simulations initiated using three different soil moisture datasets, namely, the control, dry and wet datasets. The soil moisture data from the ERA5-Land reanalysis is used for the control simulation. A dry/wet simulation is run using dry/wet datasets derived from the ERA5-Land data. This is done by halving/doubling the soil moisture values from ERA5-Land data, giving rise to new soil moisture values with lower/higher soil moisture as compared to the control dataset (ERA5-Land). CMORPH (Climate Prediction Center (CPC) Morphing Technique (MORPH)) and CRU (Climate Research Unit) datasets are used as reference to evaluate the precipitation and temperature values resulting from the control simulation.

The results display the mean changes in the dry/wet simulation results with respect to the control simulation. Plots showing the vertical profile changes in relative humidity and air temperature, and changes in lower tropospheric wind and specific humidity, indicates the build-up of the observed precipitation events and temperature patterns induced by the initial soil moisture perturbation. Interestingly the simulation results show negative SM-P feedback.  In other words, the average precipitation seemed to increase/decrease for the dry/wet cases with respect to the control simulation. This is contrary to the general expectation that dry/wet soil moisture decreases/increases precipitation. The possible reasons for the negative SM-P feedback and its distribution over the region include the proximity to the ocean, topography, and the pre-monsoon dryline. The SM-T and the heat fluxes on the other hand display expected behaviour with few exceptions in some regions in the dry simulation case.

How to cite: Vasukuttan, A., Sangelantoni, L., Shateesan, K., and Redaelli, G.: Sensitivity to soil moisture initialization in the simulation of Indian pre-monsoon season, using a regional climate numerical model, EGU General Assembly 2023, Vienna, Austria, 23–28 Apr 2023, EGU23-14377, https://doi.org/10.5194/egusphere-egu23-14377, 2023.

Numerous cyclones develop in the Bay of Bengal during the pre-monsoon and post-monsoon seasons. The heavy rain associated with these cyclones causes devastating damage to life and property during landfall. The modern numerical weather prediction models and high temporal satellite observation data have significantly increased the accuracy of cyclone prediction in recent years. However, accurately predicting rainfall intensity and its dissipation after landfall is still challenging. Previous studies have indicated that land-based evapotranspiration plays an essential role in determining the intensity and decay of cyclones post-landfall. In this study, we quantify the contribution of land-based evapotranspiration to the rainfall associated with cyclones and the impact of land conditions on the speed and track of cyclones originating in the Bay of Bengal. For this purpose, we employed the Weather Research Forecasting (WRF) model upgraded with Eulerian water tagging capabilities to track evapotranspiration from land. The tagging model will tag the evapotranspiration originating on land and track it throughout the atmosphere till it precipitates or moves out of the domain. We simulated six cyclones of varying intensities, with three during the pre and three during the post-monsoon seasons. We conducted sensitivity experiments with dry and wet initial soil moisture conditions to determine the impact of perturbed soil moisture on TC. To account for the model's internal variability, we simulated an ensemble with four members for the control simulation. The ensemble is created by changing each member's model initialization time by six hours. This ensemble helped identify the magnitude of the model's internal variability, which was less than the variability due to soil moisture changes. The study revealed that soil moisture conditions prior to TC formation have an impact on its evolution. By analyzing the latent heat, temperature, and wind pattern, we found that the initial soil moisture during the pre and post-monsoon seasons alters the synoptic features over the Indian subcontinent, resulting in variations in the TC evolution. The relatively low-intensity TC tracks are more sensitive to the initial soil moisture conditions. The rainfall originating from land-based evapotranspiration is more significant as the cyclone approaches land. Therefore, land-based evapotranspiration plays a crucial role in the end phase of the cyclone (from just before landfall till its decay). For post-monsoon cyclones, the rainfall from land-based evapotranspiration is as high as 20% to 30% after landfall, whereas, for pre-monsoon cyclones, the land contribution is around 5% to 10%. In addition to soil moisture, factors such as proximity to land, track length over land, and TC intensity also have a role in determining the quantity of precipitation originating from the land for a TC.

How to cite: Lanka, K. and Navale, A.: Influence of Soil Moisture on the Evolution of Landfalling Tropical Cyclones during pre and post-monsoon seasons, EGU General Assembly 2023, Vienna, Austria, 23–28 Apr 2023, EGU23-15299, https://doi.org/10.5194/egusphere-egu23-15299, 2023.

EGU23-15403 | Orals | CL4.1 | Highlight

Global observations highlight regions where vegetation can enhance S2S predictability 

Christopher Taylor and Bethan Harris

The land surface is a key source of predictability for forecasts at the subseasonal-to-seasonal (S2S; 2 weeks to 2 months) timescale, since variables such as root zone soil moisture and leaf area vary more slowly than the atmospheric state. Previous work has mostly focused on the predictability gained from realistic soil moisture initialisations. Considering observable land surface variables, vegetation shows more persistent changes than surface soil moisture following subseasonal rainfall events, and therefore has the potential to provide predictability at longer lead times. We therefore perform the first investigation of vegetation feedbacks onto near-surface air temperatures using global daily data, to ascertain in which regions and seasons these feedbacks can provide S2S predictability. We use daily datasets of Vegetation Optical Depth (VOD, from the VODCA X-band product) and 2m temperature (from ERA5) at 0.25° horizontal resolution, and compute lagged correlations to identify where spatial structures in VOD anomalies are associated with similar structure in 2m temperature anomalies. Using daily data allows us to investigate how the correlations decay as a function of lead time within the S2S timescale. At zero lag, water-limited regions exhibit negative correlations, indicating that an increase in vegetation water content is associated with increased evapotranspiration and reduced sensible heat, leading to cooler near-surface air temperatures. We find extensive regions in the semi-arid tropics and sub-tropics where at certain times of year VOD anomaly patterns are anti-correlated with temperature patterns 2 weeks ahead. These periods tend to occur outside of the wettest time of year. In some regions, e.g. southern Africa in MAM,  predictability of temperature from VOD anomalies extends to lags of 30 days, suggesting that incorporating vegetation variability can improve S2S forecasting. We develop a model for the strength and persistence of vegetation feedbacks to near-surface temperatures based on seasonal cycles of rainfall and vegetation.

How to cite: Taylor, C. and Harris, B.: Global observations highlight regions where vegetation can enhance S2S predictability, EGU General Assembly 2023, Vienna, Austria, 23–28 Apr 2023, EGU23-15403, https://doi.org/10.5194/egusphere-egu23-15403, 2023.

EGU23-16444 | ECS | Orals | CL4.1

Exploring deep root water uptake, soil moisture, and land surface fluxes in the Amazon 

Carolina Bieri, Francina Dominguez, Gonzalo Miguez-Macho, and Ying Fan

Plant roots act as critical pathways of moisture from subsurface sources to the atmosphere. Moreover, deep plant roots allow vegetation to meet water demand during seasonally dry periods by taking up moisture from accessible groundwater. This is an important resilience mechanism in the Amazon, a hydrologically and ecologically significant region. However, most regional land-atmosphere computational models do not adequately capture the link between deep roots and groundwater. This study details the implementation of a dynamic rooting scheme in the Noah-Multiparameterization (Noah-MP) land surface model, a widely used tool for studying the exchange of energy and moisture between the land and atmosphere. The rooting scheme is a first-order representation of dynamic rooting depth based on the soil water profile and includes quantification of deep root water uptake (RWU). The scheme is easily scalable and ideal for regional or continental-scale climate simulations. It is used in conjunction with a groundwater scheme which captures high-resolution spatial groundwater variations, allowing us to capture the critical link between deep roots and groundwater. We perform 10-year simulations with and without the root scheme for a test region in the Amazon to validate the enhanced model. We analyze time series of soil moisture, RWU, and evapotranspiration for points with differing vegetation cover and elevation. This allows us to demonstrate functionality of the root scheme and ensure it behaves properly for varying conditions. Representation of deep RWU is critical for realistic simulation of the soil-plant-atmosphere system. As the land surface is an important component of atmospheric predictability, inclusion of deep RWU can contribute to improved prediction of atmospheric variables such as precipitation.


How to cite: Bieri, C., Dominguez, F., Miguez-Macho, G., and Fan, Y.: Exploring deep root water uptake, soil moisture, and land surface fluxes in the Amazon, EGU General Assembly 2023, Vienna, Austria, 23–28 Apr 2023, EGU23-16444, https://doi.org/10.5194/egusphere-egu23-16444, 2023.

EGU23-1247 | ECS | Orals | CL4.2

Winter Precipitation Responses to Projected Arctic Sea-Ice Loss and Global Ocean Warming and Their Opposing Influences over Northwest Europe 

Hao Yu, James Screen, Stephanie Hay, Jennifer Catto, and Mian Xu

Using a large ensemble of simulations from the Polar Amplification Model Intercomparison Project (PAMIP) and Coupled Model Intercomparison Project Phase 6 (CMIP6), we compare the response of winter-mean precipitation and daily extremes across the North Hemisphere in response to future Arctic sea-ice loss and global ocean warming. North Atlantic-Northwest Europe is simulated to become drier in response to future Arctic sea-ice loss, with reduced precipitation intensity and more dry days. A wetting response to sea-ice loss is simulated over the midlatitude Atlantic Ocean. These responses are robust across the eight models analysed, albeit with differences in their magnitude and spatial pattern. The precipitation response to global ocean warming is broadly opposite in sign, but larger in magnitude, compared to the response to sea-ice loss, over these regions. The precipitation responses to both sea-ice loss and ocean warming are strongly related to coincident changes in storm density and intensity. More specifically, an equatorward shift of the storm tracks in response to sea-ice loss and poleward shift of the storm tracks in response to ocean warming. The linear combination of the responses of future Arctic sea-ice loss and global ocean warming explain well the spatial pattern of the precipitation change at 2 ºC global warming projected in CMIP6. Our results suggest that projected future precipitation change over North Atlantic-Northwest Europe reflects a ‘tug-of-war’ between Arctic sea-ice loss and global ocean warming, but the latter dominates over the former.

How to cite: Yu, H., Screen, J., Hay, S., Catto, J., and Xu, M.: Winter Precipitation Responses to Projected Arctic Sea-Ice Loss and Global Ocean Warming and Their Opposing Influences over Northwest Europe, EGU General Assembly 2023, Vienna, Austria, 23–28 Apr 2023, EGU23-1247, https://doi.org/10.5194/egusphere-egu23-1247, 2023.

EGU23-2569 | ECS | Orals | CL4.2

Perceived midlatitude jet waviness response to polar warming is sensitive to warming structure and metric choice 

Ruth Geen, Stephen Thomson, James Screen, and Geoff Vallis

Arctic amplification has been proposed to influence midlatitude weather via a range of pathways. One hypothesis that has garnered wide public interest is that the weakening of the midlatitude temperature gradient due to Arctic warming causes larger meanders in the jet stream and so more intense weather extremes. However, previous work with idealized model simulations indicated that polar warming reduces waviness.

A variety of metrics have been developed to describe jet waviness, with some focused on jet geometry and others on the magnitude of the associated geopotential anomalies. Recent studies analyzing sea-ice loss and global warming simulations indicate that the response to polar warming may depend on its depth, with deeper warming having a larger effect on midlatitudes. Here we perform a variety of dry idealized model simulations in which we apply polar warming of different depths and latitudinal extents and assess the behavior of these different metrics.

Eddy heat transport decreases regardless of how polar warming is applied. However, unexpectedly we find that metrics relating to geometry (jet sinuosity, meander area) indicate a robust increase in jet waviness with polar warming. Meanwhile Local Wave Activity suggests increased waviness if warming is confined to the poles, but decreased waviness if warming extends into the midlatitudes. The apparent disagreement between metrics can be reconciled by assessing the changes in midlatitude geopotential gradient in the different simulations. Overall, these idealized simulations indicate that polar amplification could cause an increase in jet meandering, characterized by a shift of geopotential anomalies to smaller spatial scales and lower frequencies. However, the heat transport achieved and magnitude of pressure anomalies generated depend predominantly on the equator-to-pole temperature difference and geopotential gradient. Implications for weather extremes are discussed.

How to cite: Geen, R., Thomson, S., Screen, J., and Vallis, G.: Perceived midlatitude jet waviness response to polar warming is sensitive to warming structure and metric choice, EGU General Assembly 2023, Vienna, Austria, 23–28 Apr 2023, EGU23-2569, https://doi.org/10.5194/egusphere-egu23-2569, 2023.

EGU23-4628 | ECS | Orals | CL4.2

The key atmospheric drivers linking regional Arctic amplification with East Asian cold extremes 

Wenqin Zhuo, Yao Yao, Dehai Luo, Ian Simmonds, and Huang Fei

Across the winters of global warming and Arctic amplification (AA) era,  the frequency of extreme cold events in East Asia (EA) showed an upward trend. Here we constructed regional AA index in the winters of 1979–2019, and examine the atmospheric driver that linked with strong AA scenarios and cold extreme in EA. Results show that the local atmospheric blocking is key drivers for regional AA occurrence on the intraseasonal timescale. Ural-Siberia blocking, which is tightly linked to the warming over Barents-Kara Seas (BK), is the primary atmospheric mode when regional AA corresponds with extreme East Asian cold days. However, when there is no warming over BK during the associated cold days in EA, the warming over western hemisphere become prominent, accompanied by the negative phase of the North Atlantic Oscillation (NAO−) and blocking dipole system located at mid-Siberian and East Asian continent. Under this circulation configuration, not only does EA exhibits extremely cooling, but also northeastern North America experiences significant cold anomalies. Furthermore, precursor signals at 2–10 days are found between NAO− and each regional AA event when the days of BK warming are excluded. Our results highlight the importance of atmospheric circulation on linking the warming of different Arctic sectors and cold extremes in the mid-latitude continent, and point out the independent role of NAO− and BKS warming on regional AA.

How to cite: Zhuo, W., Yao, Y., Luo, D., Simmonds, I., and Fei, H.: The key atmospheric drivers linking regional Arctic amplification with East Asian cold extremes, EGU General Assembly 2023, Vienna, Austria, 23–28 Apr 2023, EGU23-4628, https://doi.org/10.5194/egusphere-egu23-4628, 2023.

Recent studies have widely discussed arctic warming and its effect on the temperature variability over Eurasia. They agreed that Eurasia is cold while the arctic is warm during the boreal winter. Yet, the differences in month-to-month features and their predictability have not been examined. In this research, we categorized Arctic vertical warming into four types – Deep Arctic Warming (DAW), Shallow Arctic Warming (SAW), Arctic Warming Aloft, and Others – based on the vertical temperature distribution in the Barents-Kara Sea. And we discussed two significant events, DAW and SAW, which are closely related to the cold event over East Asia. The result shows that the temperature variability over East Asia associated with the Arctic events is significant in January and February but not in December. The multi-model ensemble of seasonal prediction models can distinguish the four types of Arctic events well than the individual models. In contrast, the individual models show better skill in reproducing the circulation patterns associated with the DAW than MME. Models tend to exhibit higher predictability over Eurasia in January and February compared to December. We suggest that this is partly due to the models' better representation of DAW in those months,  which is helpful for the better simulation of Arctic-midlatitude linkage. 

How to cite: Kim, G., Lee, W.-S., and Kim, B.-M.: The Effect of Arctic Vertical Warming on East Asia temperature variability on a monthly time scale and its predictability., EGU General Assembly 2023, Vienna, Austria, 23–28 Apr 2023, EGU23-4694, https://doi.org/10.5194/egusphere-egu23-4694, 2023.

EGU23-5682 | ECS | Posters on site | CL4.2

Understanding the Stratospheric Response to Arctic Amplification 

Regan Mudhar, Ruth Geen, Neil Lewis, James Screen, William Seviour, and Stephen Thomson

Recent studies propose that Arctic sea ice loss and associated warming influence wave propagation into the stratosphere, affecting the winter polar vortex. Through stratosphere-troposphere coupling, this may perturb the winter jet stream and affect surface weather. But the “stratospheric pathway” linking Arctic variability to midlatitude weather extremes is not well understood. For example, studies such as the Polar Amplification Model Intercomparison Project (PAMIP) have not found a robust stratospheric response to Arctic sea ice loss, in strength nor sign.

Here, we use an idealised atmospheric modelling framework (Isca) to better understand mechanisms and uncertainties in the stratospheric polar vortex response to Arctic amplification. We use Newtonian relaxation of temperature to a specified equilibrium temperature to simulate northern hemisphere winter, and force the model with an adjustable polar heating. Consistent with previous work, the vortex weakens in response to the imposed heating. Notably, we find a dependency on heating depth; vortex variability and sudden warming frequency reduces with increasing depth. This is relevant to PAMIP given previous work suggesting that atmosphere-only GCMs likely underestimate the depth of sea ice loss-induced atmospheric warming compared to fully coupled ones, and that the Arctic amplification link to midlatitude weather is sensitive to the vertical extent of polar warming. As such, our results should help to improve understanding and reduce biases in such comprehensive models.

How to cite: Mudhar, R., Geen, R., Lewis, N., Screen, J., Seviour, W., and Thomson, S.: Understanding the Stratospheric Response to Arctic Amplification, EGU General Assembly 2023, Vienna, Austria, 23–28 Apr 2023, EGU23-5682, https://doi.org/10.5194/egusphere-egu23-5682, 2023.

A rapidly warming Arctic and mild cold mid-latitude continents have been one of the main characteristics of the Northern Hemisphere winter during the last two decades. However, the factors contributing this warm Arctic-cold continent (WACC) pattern remain unclear, although anomalies in blocking highs and the Arctic oscillation (AO) are possible factors. This study revealed that the mode with high-latitude concurrent blockings (HCBs) is more consistent with the WACC pattern than the AO. In the HCB mode, a strong anticyclonic anomalous circulation over the Arctic Circle, excited by the strong HCBs over the Ural Mountains and the North Pacific, changes the polar atmospheric circulation and redistributes both momentum and heat to give a warmer Arctic than in the AO mode. A weak polar night jet and a poleward shift in the subtropical westerly jet result in mild cold mid-latitude continents. However, these features are not seen in the AO mode, which is characterized by cool continents and a warm Greenland. Besides, human activities may also be contributed to the interdecadal WACC because there is an interdecadal increase in the WACC pattern with HCBs in the CMIP6 simulations with human activities. These results suggest that the role of HCBs should be highly paid attention in winter mid-high latitude extreme events in recent decades.

How to cite: Zhao, L. and Qu, J.: Enhanced High-Latitude Concurrent Blockings Cause the Warm Arctic-Cold Continent Pattern, EGU General Assembly 2023, Vienna, Austria, 23–28 Apr 2023, EGU23-6700, https://doi.org/10.5194/egusphere-egu23-6700, 2023.

EGU23-6779 | ECS | Orals | CL4.2

Effects of future Arctic sea-ice loss and ocean warming on winter temperature extremes in the Northern Hemisphere 

Eunice Lo, Dann Mitchell, Peter A. G. Watson, and James A. Screen

Rapid Arctic warming and sea-ice loss have been observed in recent decades, and these trends are likely to continue in the future. Research has shown that Arctic changes affect weather and climate across the Northern Hemisphere. These changes, especially those in the extreme ends, can adversely impact communities and ecosystems. Recent development of the Polar Amplification Model Intercomparison Project (PAMIP) means that large ensembles of standardised climate experiments are now available for examining the effects of future Arctic changes on extreme weather in a coordinated way. Based on present-day and future (2°C global mean warming above pre-industrial levels) PAMIP model simulations, I will show the projected responses of winter hot and cold extremes (at the 20-year return period) to future Arctic sea-ice loss and ocean warming separately. I will focus on land areas in the Northern Hemispheric mid- and high latitudes where responses are expected to be largest. I will discuss the importance of considering the effect of sea-ice concentration loss together with that from ocean warming, which is not routinely done in the literature.

How to cite: Lo, E., Mitchell, D., Watson, P. A. G., and Screen, J. A.: Effects of future Arctic sea-ice loss and ocean warming on winter temperature extremes in the Northern Hemisphere, EGU General Assembly 2023, Vienna, Austria, 23–28 Apr 2023, EGU23-6779, https://doi.org/10.5194/egusphere-egu23-6779, 2023.

EGU23-7373 | ECS | Posters on site | CL4.2

European winter climate response to projected Arctic sea-ice loss strongly shaped by change in the North Atlantic jet 

Kunhui Ye, Tim Woollings, and James Screen

Previous studies have found inconsistent responses of the North Atlantic jet to Arctic sea-ice loss. The response of wintertime atmospheric circulation and surface climate over the North Atlantic-European region to future Arctic sea-ice loss under 2°C global warming is analyzed, using model output from the Polar Amplification Model Intercomparison Project. The models agree that the North Atlantic jet shifts slightly southward in response to sea-ice loss, but they disagree on the sign of the jet speed response. The jet response induces a dipole anomaly of precipitation and storm track activity over the North Atlantic-European region. The changes in jet latitude and speed induce distinct regional surface climate responses, and together they strongly shape the North Atlantic-European response to future Arctic sea-ice loss. Constraining the North Atlantic jet response is a priority for reducing uncertainty in the North Atlantic-European precipitation response to future Arctic sea-ice loss.

How to cite: Ye, K., Woollings, T., and Screen, J.: European winter climate response to projected Arctic sea-ice loss strongly shaped by change in the North Atlantic jet, EGU General Assembly 2023, Vienna, Austria, 23–28 Apr 2023, EGU23-7373, https://doi.org/10.5194/egusphere-egu23-7373, 2023.

EGU23-10037 | ECS | Posters on site | CL4.2

Investigating Uncertainty in the Mid-latitude Response to Sea-Ice Loss with Idealised General Circulation Model Experiments 

Neil Lewis, Ruth Geen, Regan Mudhar, Will Seviour, Stephen Thomson, Geoff Vallis, and James Screen

The Arctic is undergoing rapid climate change, manifested by substantial sea-ice loss and Arctic amplification (AA) of global warming. In turn, sea-ice loss (and associated AA) can drive changes in mid-latitude weather and climate, for example through the effect of a reduced equator-to-pole temperature gradient causing a weakening of the mid-latitude westerlies. This and other mid-latitude responses to Arctic climate change have been extensively investigated using climate model simulations in which sea-ice loss (or a local Arctic heating) is prescribed instead of increasing greenhouse gas concentrations. However, there is uncertainty in the magnitude of the 'true' climate response to Arctic sea-ice loss. This due to uncertainty regarding the methodology used to induce sea-ice loss, as well as inter-model spread in the strength of atmospheric eddy feedbacks, which can amplify the circulation response to sea-ice loss and are often too weak.

In this work, we investigate sources of uncertainty in the mid-latitude response to sea-ice loss using an idealised general circulation model with thermodynamic sea-ice. Simulations where sea-ice loss is imposed using a range of methods, and with the sea-ice module 'switched off', are compared against a control simulation with ice. This process is repeated for a range of control climatologies with different eddy feedback strengths. For each experiment, we quantify the magnitude of AA, the mid-latitude jet strength, location, and waviness, and the persistence of surface weather anomalies. By comparing our experiments, we demonstrate the sensitivity of each diagnostic to eddy feedback strength and the method used to impose sea-ice loss. These results are placed in context through discussion with existing work on this topic.

How to cite: Lewis, N., Geen, R., Mudhar, R., Seviour, W., Thomson, S., Vallis, G., and Screen, J.: Investigating Uncertainty in the Mid-latitude Response to Sea-Ice Loss with Idealised General Circulation Model Experiments, EGU General Assembly 2023, Vienna, Austria, 23–28 Apr 2023, EGU23-10037, https://doi.org/10.5194/egusphere-egu23-10037, 2023.

EGU23-10544 | ECS | Posters virtual | CL4.2

Combined effects of La Niña events and Arctic tropospheric warming on the winter North Pacific storm track 

Xiang Zhang, Bingyi Wu, and Shuoyi Ding

This study investigates the dominant characteristics of winter Arctic tropospheric thickness (1000–200 hPa), the variations of winter atmospheric circulation in the Northern Hemisphere, and the related winter North Pacific storm track (NPST) variabilities during 1979–2018 under the combined effects of the La Niña events with different periods of Arctic tropospheric thermal conditions. Results show that the leading mode (42.7%) exhibits prominent warm anomalies centered on Greenland and Baffin Bay. The winter Arctic tropospheric thickness experienced a phase shift from a cold period of the Arctic tropospheric temperature in 1979–1999 to the warm period after 2000. During the La Niña events with Arctic tropospheric warm anomalies, a wave train is shown in the mid-high latitudes with alternative anticyclonic, cyclonic, and anticyclonic anomalies over the Ural Mountains, Lake Baikal, and North Pacific, respectively. This atmospheric circulation pattern not only intensifies the linkage between the Arctic and mid-low latitudes but also induces the winter NPST shifting poleward. The possible physical mechanism is attributed to the large-scale circulation change and the local baroclinic energy conversion (BCEC). The enhanced anticyclonic anomaly in the North Pacific alters the climatological mean flow, further influencing the local BCEC through the interaction between the mean flow and eddies. The significantly robust BCEC over the North Pacific possibly induces the poleward shift of winter NPST during the La Niña events under the warm period.

How to cite: Zhang, X., Wu, B., and Ding, S.: Combined effects of La Niña events and Arctic tropospheric warming on the winter North Pacific storm track, EGU General Assembly 2023, Vienna, Austria, 23–28 Apr 2023, EGU23-10544, https://doi.org/10.5194/egusphere-egu23-10544, 2023.

EGU23-10688 | Orals | CL4.2

Possible linkage between winter extreme low temperature over central-western China and autumn sea ice loss 

Shuoyi Ding, Bingyi Wu, Wen Chen, Hans-F. Graf, and Xuanwen Zhang

Based on reanalysis datasets and sea-ice sensitivity experiments, this study has pointed out that the autumn sea ice loss in East Siberian-Chukchi-Beaufort (EsCB) Seas significantly increases the frequency of winter extreme low temperature over western-central China. Autumn sea ice loss warms the troposphere and generates anticyclonic anomaly over the Arctic region one month later. Under the effects of synoptic eddy-mean flow interaction and anomalous upward propagated planetary wave 2, the Arctic anticyclonic anomaly strengthens and develops toward Greenland-Northern Europe, accompanied by a weakened stratospheric polar vortex. In winter, following intra-seasonal downward propagation of stratospheric anomalies, the Northern European positive geopotential anomalies enhance and expand downstream within 7 days, favoring Arctic cold air east of Novaya Zemlya southward (the hyperpolar path) accumulating in Siberia around Lake of Baikal. In the subsequent 2~3 days, these cold anomalies rapidly intrude western-central China and induce abrupt sharp cooling, thus more frequent extreme low temperature there.

How to cite: Ding, S., Wu, B., Chen, W., Graf, H.-F., and Zhang, X.: Possible linkage between winter extreme low temperature over central-western China and autumn sea ice loss, EGU General Assembly 2023, Vienna, Austria, 23–28 Apr 2023, EGU23-10688, https://doi.org/10.5194/egusphere-egu23-10688, 2023.

EGU23-10837 | Posters on site | CL4.2

Earth system model sea-ice loss experiments are wrong. Are they useful? 

Paul Kushner, Luke Fraser-Leach, and Alexandre Audette

Our poor understanding of how the Arctic’s atmosphere, sea ice, and ocean are coupled limits what we can say about Arctic change from greenhouse warming, and what Arctic change means for global weather and climate. Earth system models that simulate Arctic and global change, while complicated and imperfect, are useful to understand drivers of Arctic change and its global influence. In the virtual world of models, you can remove Arctic sea ice and analyze its local and remote response, without greenhouse warming. Or, you can keep sea ice unchanged and investigate a virtual world of greenhouse warming without sea ice loss. But this virtual exploration can fool us: recent work by Mark England and colleagues has shown that this kind of sea ice removal, when carried out in the setting of coupled ocean-atmosphere models, artificially amplifies Arctic warming, with global implications. The basic problem is that these simulations use Arctic sea ice loss as a stand-in for Arctic warming, but targeted ice loss does not account well for the effect on the Arctic of greenhouse warming.


We confirm the England et al. result but argue that sea ice loss experiments can nevertheless provide physically reasonable results, if they are linearly combined with greenhouse warming experiments using scaling suggested by simple energy balance models. This post-processing step, along with refined methods for inducing sea ice loss, allows us to gain value from sea ice loss experiments and avoid some of the difficulties arising from interpreting these experiments at face value.


How to cite: Kushner, P., Fraser-Leach, L., and Audette, A.: Earth system model sea-ice loss experiments are wrong. Are they useful?, EGU General Assembly 2023, Vienna, Austria, 23–28 Apr 2023, EGU23-10837, https://doi.org/10.5194/egusphere-egu23-10837, 2023.

EGU23-12191 | ECS | Orals | CL4.2

Consistent atmospheric circulation responses due to Arctic sea ice loss between prescribed sea ice simulations and single long control simulations 

Steve Delhaye, François Massonnet, Thierry Fichefet, Rym Msadek, Laurent Terray, and James Screen

This study investigates the differences in atmospheric responses to Arctic sea ice anomalies between simulations from six (atmospheric-only) models contributing to the Polar Amplification Model Intercomparison Project and one long control simulation (piControl from CMIP6) from the same six (coupled) models. We perform a composite analysis between years of low and high Arctic sea ice extent in the piControl and consider four different types of experiment in the PAMIP where only the sea ice concentration is changed (pdSST-futArcSIC, pdSST-futBKSeasSIC, pdSST-futOkhotskSIC and pdSST-pdArcSIC) to examine the associated atmospheric circulation changes owing to an Arctic sea ice loss. A negative change in the North Atlantic Oscillation (NAO) pattern emerges in winter, linked to the so-called stratospheric pathway, and is mainly due to the sea ice anomaly in the Barents-Kara Seas. The results in the PAMIP experiments support these findings, except that the intensity is lower than in the piControl composite analysis. This work highlights that the atmospheric circulation responses to Arctic sea ice loss in a long control simulation (CMIP6) show similarities with the responses of a coordinated set of numerical model experiments with prescribed sea ice (PAMIP). However, the atmospheric responses in the numerical models with prescribed sea ice display weaker changes than in CMIP6. The role of the atmosphere-ocean coupling and of the initial sea ice condition could be the main reasons for this difference in intensity.

How to cite: Delhaye, S., Massonnet, F., Fichefet, T., Msadek, R., Terray, L., and Screen, J.: Consistent atmospheric circulation responses due to Arctic sea ice loss between prescribed sea ice simulations and single long control simulations, EGU General Assembly 2023, Vienna, Austria, 23–28 Apr 2023, EGU23-12191, https://doi.org/10.5194/egusphere-egu23-12191, 2023.

EGU23-13711 | ECS | Posters virtual | CL4.2

Control by the Circulation Adjustment Outside the Arctic on Transient Response of AMOC to Global Warming 

Jiao Chen, Xidong Wang, and Xuezhu Wang

The Atlantic Meridional Overturning Circulation (AMOC), a key component of the climate system, is projected to weaken in the 21st century. Using the Alfred Wegener Institute Climate Model (AWI-CM 1.1 LR), we conduct a set of numerical experiments to investigate the transient response of AMOC to anthropogenic warming with quadrupled carbon dioxide (4×CO2). The results suggest that circulation adjustment outside the Arctic dominates the AMOC weakening. In warming conditions, northward advection transport from the southern flank of the Atlantic subpolar region will increase, which is expected to enhance the upper ocean stratification over deep convection zones and inhibit deep-water formation, thus weakening the AMOC largely. Stratification enhancement is more pronounced in Nordic Seas than that in the Labrador Sea, implying a more direct role of Labrador Sea in evolution of still-active AMOC. In Nordic Seas, decreased ocean convection is dominated by temperature contributions due to a substantial increase of northward advective heat transport. While in Labrador Sea, both surface heat flux and advective heat transport matter, with comparable thermohaline contributions.

How to cite: Chen, J., Wang, X., and Wang, X.: Control by the Circulation Adjustment Outside the Arctic on Transient Response of AMOC to Global Warming, EGU General Assembly 2023, Vienna, Austria, 23–28 Apr 2023, EGU23-13711, https://doi.org/10.5194/egusphere-egu23-13711, 2023.

EGU23-15812 | Orals | CL4.2

Relative impacts of sea ice loss and atmospheric internal variability on winter Arctic to East Asian surface air temperature based on large-ensemble simulations with NorESM2 

Shengping He, Helge Drange, Tore Furevik, Huijun Wang, Ke Fan, Lise Seland Graff, and Yvan Orsolini

To quantify the relative contributions of Arctic sea ice and unforced atmospheric internal variability to “warm Arctic, cold East Asia” (WACE), this study analyses three sets of large-ensemble simulations carried out by the Norwegian Earth System Model with a coupled atmosphere-land surface model, forced by seasonal sea ice conditions from preindustrial, present-day, and future periods. Each ensemble-member within the same set uses the same forcing but with small perturbations to the atmospheric initial state. Hence, the difference between the present-day (or future) ensemble-mean and the preindustrial ensemble-mean provides the ice-loss-induced response, while the difference of the individual members within the present-day (or future) set is the effect of atmospheric internal variability.

Results indicate that both present-day and future sea ice loss can force a negative phase of the Arctic Oscillation with a WACE pattern in winter. The magnitude of ice-induced Arctic warming is over four times larger than the ice-induced East Asian cooling, the latter with a magnitude that is about 30% of the observed cooling. Sea ice loss contributes about 60% (80%) of Arctic winter warming for the present-day (future) climate. Atmospheric internal variability can also induce a WACE pattern with comparable magnitudes between Arctic and East Asia. Ice-loss-induced East Asian cooling can easily be masked by atmospheric internal variability effects because random atmospheric internal variability may induce warming with larger magnitude. Observed WACE pattern occurs as a result of both Arctic sea ice loss and atmospheric internal variability, with the former  dominating Arctic warming and the latter dominating  East Asian cooling.

How to cite: He, S., Drange, H., Furevik, T., Wang, H., Fan, K., Graff, L. S., and Orsolini, Y.: Relative impacts of sea ice loss and atmospheric internal variability on winter Arctic to East Asian surface air temperature based on large-ensemble simulations with NorESM2, EGU General Assembly 2023, Vienna, Austria, 23–28 Apr 2023, EGU23-15812, https://doi.org/10.5194/egusphere-egu23-15812, 2023.

EGU23-604 | ECS | Posters on site | CL4.3

Boreal Spring Southern Hemisphere Climate Mode and Global Monsoon 

Shikhar Srivastava, Arindam Chakraborty, and Raghu Murtugudde

The global climatic pattern is governed by the dominant mode of variability in the tropics and the extratropic and their interaction. The extratropical atmosphere is much more vigorous than the tropics owing to sharp meridional temperature gradients in the mid-latitude. Especially on the decadal timescales, large signals are seen over the extratropical region than in the tropics. Here, we propose that during boreal spring, the second leading mode of climate variability in the Southern Hemisphere, has a decadal pattern. This mode is independent of the Southern Annular Mode (SAM), which represents the most dominant mode of climate variability in the Southern Hemisphere. The boreal spring climate of the Southern Hemisphere interacts with the tropics and significantly impacts the global climate, which is reflected in the global Monsoon rainfall. During the positive phase of the decadal mode, the global Monsoon rainfall is coherently suppressed. We propose a new finding highlighting that the Southern Hemisphere's extratropical forcing can significantly impact the tropical Pacific through subtropical pathways on the decadal to multidecadal timescale. The impact of such decadal climate variability is enormous and global and can add a new paradigm to the pursuit of improving decadal predictions of the global climate.

How to cite: Srivastava, S., Chakraborty, A., and Murtugudde, R.: Boreal Spring Southern Hemisphere Climate Mode and Global Monsoon, EGU General Assembly 2023, Vienna, Austria, 23–28 Apr 2023, EGU23-604, https://doi.org/10.5194/egusphere-egu23-604, 2023.

As a dominant pattern of the North Pacific sea surface temperature decadal variability, the Pacific Decadal Oscillation (PDO) has remarkable influences on the marine and terrestrial ecosystems. However, the PDO is highly unpredictable. Here, we assess the performance of the Coupled Model Intercomparison Project Phase 6 (CMIP6) models in simulating the PDO, with an emphasis on the evaluation of CMIP6 models in reproducing a recently detected early warning signal based on climate network analysis for the PDO regime shift. Results show that the skill of CMIP6 historical simulations remains at a low level, with a skill limited in reproducing PDO’s spatial pattern and nearly no skill in reproducing the PDO index. However, if the warning signal for the PDO regime shift by climate network analysis is considered as a test-bed, we find that even in historical simulations, a few models can represent the corresponding relationship between the warning signal and the PDO regime shift, regardless of the chronological accuracy. By further conducting initialization, the performance of the model simulations is improved according to the evaluation of the hindcasts from two ensemble members of the Decadal Climate Prediction Project (NorCPM1 and BCC-CSM2-MR). Particularly, we find that the NorCPM1 model can capture the early warning signals for the late-1970s and late-1990s regime shifts 5–7 years in advance, indicating that the early warning sig- nal somewhat can be captured by some CMIP6 models. A further investigation on the underlying mechanisms of the early warning signal would be crucial for the improvement of model simulations in the North Pacific.

How to cite: Ma, Y.: On the Pacific Decadal Oscillation Simulations in CMIP6 Models: A New Test‐Bed from Climate Network Analysis, EGU General Assembly 2023, Vienna, Austria, 23–28 Apr 2023, EGU23-5325, https://doi.org/10.5194/egusphere-egu23-5325, 2023.

Climate extremes can impact societies in various ways: from nuances in daily lives to full humanitarian crises. Droughts  are usually slow onset extremes but can be highly disruptive and affect millions of people every year. Warm temperature extremes (e.g. heat waves) can exacerbate droughts and their impacts and trigger a faster drought evolution. Combined drought and heat waves can lead to devastating consequences. For example, 2022 was a very active year in terms of drought or combined drought and heat waves, affecting particularly hard several regions of the world (e.g. Europe, China, southern South America and East Africa). In a context of risk management and civil protection, the use of operationally available seasonal climate forecasts can provide actionable information to reduce the risks and the impacts of these events on societies with different levels of development and adaptive capacities. 


Within the Copernicus Emergency Management Service (CEMS), the European and Global Drought Observatories (EDO and GDO, respectively) provide real time drought and temperature extreme monitoring products freely available and displayed through two dedicated web services. Recent efforts have been targeting the optimal integration and use of multi-system forecasting products to enhance the early warning component of the service. This contribution provides an overview of first results in terms of  initial multi-model skill assessment of forecasts available through the Copernicus Climate Change Service (C3S). It also discusses future avenues to improve skill in regions with limited predictability, for example by applying physically-based sampling techniques.    

How to cite: Acosta Navarro, J. C. and Toreti, A.: Seasonal forecasting of drought and temperature extremes as part of the Copernicus Emergency Management Service (CEMS), EGU General Assembly 2023, Vienna, Austria, 23–28 Apr 2023, EGU23-5602, https://doi.org/10.5194/egusphere-egu23-5602, 2023.

EGU23-6000 | ECS | Orals | CL4.3

Seasonal forecasting of the European North West Shelf: Quantifying the persistence of the physical marine environment 

Jamie Atkins, Jonathan Tinker, Jennifer Graham, Adam Scaife, and Paul Halloran

The European North West shelf seas (NWS) support economic and environmental interests of several adjacent populous countries. Forecasts of physical marine variables on the NWS for upcoming months – an important decision-making timescale – would be useful for many industries. However, currently there is no operational seasonal forecasting product deemed sufficient for capturing the high variability associated with shallow, dynamic shelf waters. Here, we identify the dominant sources of seasonal predictability on the shelf and quantify the extent to which empirical persistence relationships can produce skilful seasonal forecasts of the NWS at the lowest level complexity. We find that relatively skilful forecasts of the typically well-mixed Winter and Spring seasons are achievable via persistence methods at a one-month lead time. In addition, incorporating observed climate modes of variability, such as the North Atlantic Oscillation (NAO), can significantly boost persistence for some locations and seasons, but this is dependent on the strength of the climate mode index. However, even where high persistence skill is demonstrated, there are sizeable regions exhibiting poor predictability and skilful persistence forecasts are typically limited to ≈ one-month lead times. Summer and Autumn forecasts are generally less skilful owing largely to the effects of seasonal stratification which emphasises the influence of atmospheric variability on sea surface conditions. As such, we also begin incorporating knowledge of future atmospheric conditions to forecasting strategies. We assess the ability of an existing global coupled ocean-atmosphere seasonal forecasting system to exceed persistence skill and highlight areas where additional downscaling efforts may be needed.

How to cite: Atkins, J., Tinker, J., Graham, J., Scaife, A., and Halloran, P.: Seasonal forecasting of the European North West Shelf: Quantifying the persistence of the physical marine environment, EGU General Assembly 2023, Vienna, Austria, 23–28 Apr 2023, EGU23-6000, https://doi.org/10.5194/egusphere-egu23-6000, 2023.

EGU23-7676 | Orals | CL4.3

Decadal Climate Variability and Predictability with a High-resolution Eddy-resolving Model 

Wei Zhang, Ben Kirtman, Leo Siqueira, and Amy Clement

Current global climate models typically fail to fully resolve mesoscale ocean features (with length scales on the order of 10 km), such as the western boundary currents, potentially limiting climate predictability over decadal timescales. This study incorporates high-resolution eddy-resolving ocean (HR: 0.1°) in a suite of CESM model experiments that capture these important mesoscale ocean features with increased fidelity. Compared with eddy-parametrized ocean (LR: 1°) experiments, HR experiments show more realistic climatology and variability of sea surface temperature (SST) over the western boundary currents and eddy-rich regions. In the North Atlantic, the inclusion of mesoscale ocean processes produces a more realistic Gulf Stream and improves both localized rainfall patterns and large-scale teleconnections. We identify enhanced decadal SST predictability in HR over the western North Atlantic, which can be explained by the strong vertical connectivity between SST and sub-surface ocean temperature. SST is better connected with slower processes deep down in HR, making SST more persistent (and predictable). Moreover, we detect a better representation of the air-sea interactions between SST and low-level atmosphere over the Gulf Stream, thus improving low-frequency rainfall variations and extremes over the Southeast US. The results further imply that high-resolution GCMs with increased ocean model resolution may be needed in future climate prediction systems.

How to cite: Zhang, W., Kirtman, B., Siqueira, L., and Clement, A.: Decadal Climate Variability and Predictability with a High-resolution Eddy-resolving Model, EGU General Assembly 2023, Vienna, Austria, 23–28 Apr 2023, EGU23-7676, https://doi.org/10.5194/egusphere-egu23-7676, 2023.

Earth system predictability on decadal timescales can arise from both low frequency internal variability as well as from anthropogenically forced long-term changes. However, on these timescales, the chaotic nature of the climate system makes skillful predictions difficult to achieve even if we include information from climate change projections. Furthermore, it is difficult to separate the contributions from internal variability and external forcing to predictability. One way to improve skill is through identifying and harnessing initial conditions with more predictable evolution, so-called state-dependent predictability. We explore a neural network approach to identify these opportunistic initial states in the CESM2 large ensemble and subsequently explore how predictability may manifest in a future climate, influenced by both forced warming and internal variability. We use an interpretable neural network to demonstrate that internal variability will continue to play an important role in future climate predictions, especially for states of increased predictability.

How to cite: Gordon, E. and Barnes, E.: An interpretable neural network approach to identifying sources of predictability in the future climate, EGU General Assembly 2023, Vienna, Austria, 23–28 Apr 2023, EGU23-8000, https://doi.org/10.5194/egusphere-egu23-8000, 2023.

EGU23-8296 | ECS | Orals | CL4.3 | Highlight

Better late than never: arrival of decadal predictions to the climate services arena 

Balakrishnan Solaraju-Murali, Dragana Bojovic, Nube Gonzalez-Reviriego, Andria Nicodemou, Marta Terrado, Louis-Philippe Caron, and Francisco J. Doblas-Reyes

Decadal prediction represents a source of near-term climate information that has the potential to support climate-related decisions in key socio-economic sectors that are influenced by climate variability and change. While the research to illustrate the ability of decadal predictions in forecasting the varying climate conditions on a multi-annual timescale is rapidly evolving, the development of climate services based on such forecasts is still in its early stages. This study showcases the potential value of decadal predictions in the development of climate services. We summarize the lessons learnt from coproducing a forecast product that provides tailored and user-friendly information about multi-year drought conditions for the coming five years over global wheat harvesting regions. The interaction between the user and climate service provider that was established at an early stage and lasted throughout the forecast product development process proved fundamental to provide useful and ultimately actionable information to the stakeholders concerned with food production and security. This study also provides insights on the potential reasons behind the delayed entry of decadal predictions in the climate services discourse and practice, which were obtained from surveying climate scientists and discussing with decadal prediction experts.

How to cite: Solaraju-Murali, B., Bojovic, D., Gonzalez-Reviriego, N., Nicodemou, A., Terrado, M., Caron, L.-P., and Doblas-Reyes, F. J.: Better late than never: arrival of decadal predictions to the climate services arena, EGU General Assembly 2023, Vienna, Austria, 23–28 Apr 2023, EGU23-8296, https://doi.org/10.5194/egusphere-egu23-8296, 2023.

EGU23-8750 | Orals | CL4.3

A simple coupled assimilation approach for improved initialization of decadal climate predictions 

Tim Kruschke, Mehdi Pasha Karami, David Docquier, Frederik Schenk, Ramon Fuentes Franco, Ulrika Willén, Shiyu Wang, Klaus Wyser, Uwe Fladrich, and Torben Koenigk

We introduce a simple data assimilation approach applied to the coupled global climate model EC-Earth3.3.1, aiming at producing initial conditions for decadal climate hindcasts and forecasts. We rely on a small selection of assimilated variables, which are available in a consistent manner for a long period, providing good spatial coverage for large parts of the globe, that is sea-surface temperatures (SST) and near-surface winds.

Given that these variables play a role directly at or very close to the ocean-atmosphere interface, we assume a comparably strong cross-component impact of the data assimilation. Starting from five different free-running CMIP6-historical simulations in 1900, we first apply surface restoring in the model’s ocean component towards monthly means of HadISST1. After integrating this five-member ensemble with only assimilating SST for the period 1900-1949, we start additionally assimilating (nudging) 6-hourly near-surface winds (vorticity and divergence) taken from the ERA5 reanalysis from 1950 onwards. To mitigate the risk of model drifts after initializing the decadal predictions and to account for known instationary biases of the model, we assimilate anomalies of all variables that are calculated based on a 30-year running mean.

By assimilating near-surface data over several decades before entering the actual period targeted by the decadal hindcasts/forecasts for CMIP6-DCPP, we expect the coupled model to be able to ingest a significant share of observed climate evolution also in deeper ocean layers. This would then potentially serve as a source of predictive skill on interannual-to-decadal timescales.

We show that the presented assimilation approach is able to force the coupled model’s evolution well in phase with observed climate variability, positively affecting not only near-surface levels of the atmosphere and ocean but also deeper layers of the ocean and higher levels of the atmosphere as well as Arctic sea-ice variability. However, we also present certain problematic features of our approach. Two examples are significantly strengthened low-frequency variability of the AMOC and a wind bias resulting into generally reduced evaporation over ocean areas.

How to cite: Kruschke, T., Karami, M. P., Docquier, D., Schenk, F., Fuentes Franco, R., Willén, U., Wang, S., Wyser, K., Fladrich, U., and Koenigk, T.: A simple coupled assimilation approach for improved initialization of decadal climate predictions, EGU General Assembly 2023, Vienna, Austria, 23–28 Apr 2023, EGU23-8750, https://doi.org/10.5194/egusphere-egu23-8750, 2023.

The interdisciplinary research project "BayTreeNet" examines the reactions of forest ecosystems to climate dynamics. To establish a relationship between tree growth and climate, it is important to know that in the mid-latitudes, local climate phenomena often show a strong dependence on the large-scale climate weather types (WT), which significantly determine the climate of a region through frequency and intensity. Different WT show various weather conditions at different locations, especially in the topographically diverse region of Bavaria. The meaning of every WT is the physical basis for the climate-growth relationships established in the dendroecology sub-project to investigate the response of forests to individual WT at different forest sites. Complementary steps allow interpretation of results for the past (20th century) and projection into the future (21st century). One hypothesis is that forest sites in Bavaria are affected by a significant influence of climate change in the 21st century and the associated change in WT.

The automated classification of large-scale weather patterns is presented by Self-Organizing-Maps (SOM) developed by Kohonen, which enables visualization and reduction of high-dimensional data. The poster presents the SOM-setting which was used to classify the WT and the results of past environmental conditions (1990-2019) for different WT in Europe based on ERA5 data. Morover, it shows a future projection until 2100 for European WT and their respective environmental conditions. The projections are based on a novel GCM selection technique for two scenarios (ssp1-2.6 and ssp5-8.5) to obtain a range of the most likely conditions.

How to cite: Wehrmann, S. and Mölg, T.: GCM-based future projections of European weather types obtained by Self‑Organizing-Maps and a novel GCM selection technique, EGU General Assembly 2023, Vienna, Austria, 23–28 Apr 2023, EGU23-8934, https://doi.org/10.5194/egusphere-egu23-8934, 2023.

EGU23-9520 | Orals | CL4.3

Estimating the significance of the added skill from initializations: The case of decadal predictions 

Bo Christiansen, Shuting Yang, and Dominic Matte

A considerable part of the skill in decadal forecasts often come from the forcings which are present in both initialized and un-initialized model experiments. This makes the added value from initialization difficult to assess. We investigate statistical tests to quantify if initialized forecasts provide skill over the un-initialized experiments. We consider three correlation based statistics previous used in the literature. The distributions of these statistics under the null-hypothesis that initialization has no added values are calculated by a surrogate data method. We present some simple examples and study the statistical power of the tests. We find that there can be large differences in both the values and the power for the different statistics. In general the simple statistic defined as the difference between the skill of the initialized and uninitialized experiments behaves best. However, for all statistics the risk of rejecting the true null-hypothesis is too high compared to the nominal value.

We compare the three tests on initialized decadal predictions (hindcasts) of near-surface temperature performed with a climate model and find evidence for a significant effect of initializations for small lead-times. In contrast, we find only little evidence for a significant effect of initializations for lead-times larger than 3 years when the experience from the simple experiments is included in the estimation.

How to cite: Christiansen, B., Yang, S., and Matte, D.: Estimating the significance of the added skill from initializations: The case of decadal predictions, EGU General Assembly 2023, Vienna, Austria, 23–28 Apr 2023, EGU23-9520, https://doi.org/10.5194/egusphere-egu23-9520, 2023.

EGU23-9986 | Posters on site | CL4.3

Probabilistic nonlinear lagged teleconnections of the sea surface temperature field 

Carlos Pires and Abdel Hannachi

The monthly anomaly sea surface temperature field over the global ocean exhibit probabilistic dependencies between remote points and lagged times, which are explained eventually by some oceanic or atmospheric bridge of information transfer. Despite much of the bivariate SST dependencies appear to be linear, others are characterized by robust and statistically significant nonlinear correlations. In order to enhance that, we present a general method of extracting bivariate (X,Y) dependencies, seeking for pairs of polynomials P(X) and Q(Y) which are maximally correlated. The method relies on a Canonical correlation Analysis (CCA) between sets of standardized monomials of X and Y, up to a certain (low) degree (e.g. 4). Polynomial coefficients are obtained from the leading CCA eigenvector. Polynomials are calibrated and validated over independent periods, being afterwards subjected to marginal Gaussian anamorphoses. The bivariate non-Gaussianity in the space of marginally Gaussianized polynomials remains residual because of the correlation concentration and maximization. Consequently, the bivariate Gaussian pdf or in alternative, a copula pdf in the space of maximally correlated polynomials can accurately approximate the bivariate dependency. That probabilistic model is then used to determine conditional pdfs, cdfs and probabilities of extremes.

The method is applied to various (X,Y) pairs. In the first example, X is an optimized polynomial of the El-Niño 3.4 index while Y is that index lagged to the future. For lags between 6 and 18 months, the nonlinear El-Niño forecast clearly surpasses the linear one, contributing to lower the El-Niño seasonal predictability barrier. In the second example, we relate El-Niño (X) with the lagged Atlantic multidecadal oscillation index (Y). Nonlinear, robust correlations appear, both for positive and negative lags up to 5 years putting in evidence Pacific-Atlantic basin oceanic teleconnections.

The above probabilistic (polynomial based) model appears to be a good candidate tool for the statistical (seasonal up to decadal) forecast of regime probabilities (e.g. dry/wet) and extremes, given certain antecedent precursors.

This work was funded by the Portuguese Fundação para a Ciência e a Tecnologia (FCT) I.P./MCTES through national funds (PIDDAC) – UIDB/50019/2020- IDL and the project JPIOCEANS/0001/2019 (ROADMAP: ’The Role of ocean dynamics and Ocean–Atmosphere interactions in Driving cliMAte variations and future Projections of impact–relevant extreme events’). Acknowledgements are also due to the International Meteorological Institute (IMI) at Stockholm University.

How to cite: Pires, C. and Hannachi, A.: Probabilistic nonlinear lagged teleconnections of the sea surface temperature field, EGU General Assembly 2023, Vienna, Austria, 23–28 Apr 2023, EGU23-9986, https://doi.org/10.5194/egusphere-egu23-9986, 2023.

EGU23-13375 | ECS | Orals | CL4.3

Role of the subpolar North Atlantic region in skillful climate predictions for high northern latitudes: A pacemaker experiment 

Annika Drews, Torben Schmith, Shuting Yang, Steffen Olsen, Tian Tian, Marion Devilliers, Yiguo Wang, and Noel Keenlyside
Recent studies have suggested that the Atlantic water pathway connecting the subpolar North Atlantic (SPNA) with the Nordic Seas and Arctic Ocean may lead to skillful predictions of sea surface temperature and salinity anomalies in the eastern Nordic Seas. To investigate the role of the SPNA for such anomalies downstream, we designed a pacemaker experiment, using two decadal climate prediction systems based on EC-Earth3 and NorCPM. We focus on the subpolar extreme cold anomaly in 2015 and its subsequent development, a feature not well captured and predicted. The pacemaker experiment follows the protocol of the CMIP6 DCPP-A retrospective forecasts or hindcasts initialized November 1, 2014, but the models are forced to follow the observed ocean temperature and salinity anomalies in the SPNA from ocean reanalysis from November 2014 through to December 2019. Two sets of 10-year hindcasts are performed with 10 members for EC-Earth3 and 30 members for NorCPM. We here detail and discuss the design of this pacemaker experiment and present results, comparing with the initialized CMIP6 DCPP-A experiment assessing differences in decadal prediction skill outside the SPNA. We conclude that the pacemaker experiments show improved skill compared to the standard decadal predictions for the eastern Norwegian Sea, and therefore the SPNA is key for successful decadal predictions in the region.

How to cite: Drews, A., Schmith, T., Yang, S., Olsen, S., Tian, T., Devilliers, M., Wang, Y., and Keenlyside, N.: Role of the subpolar North Atlantic region in skillful climate predictions for high northern latitudes: A pacemaker experiment, EGU General Assembly 2023, Vienna, Austria, 23–28 Apr 2023, EGU23-13375, https://doi.org/10.5194/egusphere-egu23-13375, 2023.

EGU23-13639 | Orals | CL4.3

Seasonal prediction of UK mean and extreme winds 

Julia Lockwood, Nicky Stringer, Katie Hodge, Philip Bett, Jeff Knight, Doug Smith, Adam Scaife, Matthew Patterson, Nick Dunstone, and Hazel Thornton

For several years the Met Office has produced a seasonal outlook for the UK every month, which is issued to the UK Government and contingency planners.  The outlook gives predictions of the probability of having average, low, or high seasonal mean UK temperature and precipitation for the coming three-months.  In recent years, there has been increasing demand from sectors such as energy and insurance to include similar probabilistic predictions of UK wind speed: both for the seasonal mean and for measures of extreme winds such as storm numbers.  In this presentation we show the skill of the Met Office’s GloSea system in predicting seasonal (three-month average) UK mean wind and a measure of UK storminess throughout the year, and discuss the drivers of predictability.  Skill in predicting the UK mean wind speed and storminess peaks in winter (December–February), owing to predictability of the North Atlantic oscillation.  In summer (June–August), there is evidence that a significant proportion of variability in UK winds is driven by a Rossby wave train which the model has little skill in predicting. Nevertheless there are signs that the wave is potentially predictable and skill may be improved by reducing model errors.

How to cite: Lockwood, J., Stringer, N., Hodge, K., Bett, P., Knight, J., Smith, D., Scaife, A., Patterson, M., Dunstone, N., and Thornton, H.: Seasonal prediction of UK mean and extreme winds, EGU General Assembly 2023, Vienna, Austria, 23–28 Apr 2023, EGU23-13639, https://doi.org/10.5194/egusphere-egu23-13639, 2023.

EGU23-13736 | ECS | Posters on site | CL4.3

Decadal predictability of European temperature extremes. 

Eirini Tsartsali, Panos Athanasiadis, Stefano Tibaldi, and Silvio Gualdi

Accurate predictions of climate variations at the decadal timescale are of great interest for decision-making, planning and adaptation strategies for different socio-economic sectors. Notably, decadal predictions have rapidly evolved during the last 15 years and are now produced operationally worldwide. The majority of the studies assessing the skill of decadal prediction systems focus on time-mean anomalies of standard meteorological variables, such as annual mean near-surface air temperature and precipitation. However, the predictability of extreme events frequency may differ substantially from the predictability of multi-year annual or seasonal means. Predicting the frequency of extreme events at different timescales is of major importance, since they are associated with severe impacts on various natural and human systems. In the current study we evaluate the capability of state-of-the-art decadal prediction systems to predict the frequency of temperature extremes in Europe. More specifically, we assess the skill of a multi-model ensemble from the Decadal Climate Prediction Project (DCPP, 163 ensemble members from 12 models in total) to forecast the number of days belonging to heatwaves episodes during summer (June–August). We find statistically significant predictive skill over Europe, except for the United Kingdom and a large part of the Scandinavian Peninsula, most of which is associated with the long-term warming trend. We are progressing with the evaluation of other statistical aspects of extreme events, including warm and cold episodes during winter, and we are also investigating whether there is predictive skill beyond that stemming from the external forcing.  

How to cite: Tsartsali, E., Athanasiadis, P., Tibaldi, S., and Gualdi, S.: Decadal predictability of European temperature extremes., EGU General Assembly 2023, Vienna, Austria, 23–28 Apr 2023, EGU23-13736, https://doi.org/10.5194/egusphere-egu23-13736, 2023.

EGU23-13789 | Posters on site | CL4.3

Do oceanic observations (still) matter in initializing decadal climate predictions over the North Atlantic ocean? 

Sebastian Brune, Vimal Koul, and Johanna Baehr

Earth system models are now regularly being used in inter-annual to decadal climate prediction. Such prediction systems based on CMIP5-generation Earth system models had demonstrated an overall positive impact of initialization, i.e. deriving initial conditions of retrospective forecasts from a separate data assimilation experiment, on decadal prediction skill. This view is now being increasingly challenged in the context of improvements both in CMIP6-generation Earth system models and CMIP6-evaluation of external forcing as well as in the context of ongoing transient climate change. In this study we re-evaluate the impact of atmospheric and oceanic initialization on decadal prediction skill of North Atlantic upper ocean heat content (0-700m) in a CMIP6-generation decadal prediction system based on the Max Planck Institute Earth system model (MPI-ESM). We compare the impact of initial conditions derived through full-field atmospheric nudging with those derived through an additional assimilation of observed oceanic temperature and salinity profiles using an ensemble Kalman filter. Our experiments suggest that assimilation of observed oceanic temperature and salinity profiles into the model reduces the warm bias in the subpolar North Atlantic heat content, and improves the modelled variability of the Atlantic meridional overturning circulation and ocean heat transport. These improvements enable a proper initialization of model variables which leads to an improved decadal prediction of surface temperatures. Our results reveal an important role of subsurface oceanic observations in decadal prediction of surface temperatures in the subpolar North Atlantic even in CMIP6-generation decadal prediction system.

How to cite: Brune, S., Koul, V., and Baehr, J.: Do oceanic observations (still) matter in initializing decadal climate predictions over the North Atlantic ocean?, EGU General Assembly 2023, Vienna, Austria, 23–28 Apr 2023, EGU23-13789, https://doi.org/10.5194/egusphere-egu23-13789, 2023.

EGU23-14755 | ECS | Posters on site | CL4.3

A low-dimensional dynamical systems approach to climate ensemble design and interpretation 

Francisco de Melo Viríssimo and David Stainforth

Earth System Models (ESMs) are complex, highly nonlinear, multi-component systems described by large number of differential equations. They are used to study the evolution of climate and its dynamics, and to make projection of future climate at both regional and global levels – which underpins climate change impact assessments such as the IPCC report. These projections are subject to several sorts of uncertainty due to high internal variability in the system dynamics, which are usually quantified via ensembles of simulations.

Due to their multi component nature of such ESMs, the emerging dynamics also contain different temporal scales, meaning that climate ensembles come in a variety of shapes and sizes. However, our ability to run such ensembles is usually constrained by the computational resources available, as they are very expensive to run. Hence, choices on the ensemble design must be made, which conciliate the computational capability with the sort of information one is looking for.

One alternative to gain information is to use low-dimensional climate-like systems, which consists of simplified, coupled versions of atmosphere, ocean, and other components, and hence capture some of the different time scales present in ESMs. This approach allows one to run very large ensembles, and hence to explore all sorts of model uncertainty with only modest computational usage.

In this talk, we discuss this approach in detail, and illustrate its applicability with a few results. Particular attention will be given to the issues of micro and macro initial condition uncertainty, and parametric uncertainty – including external, anthropogenic-like forcing. The ability of large ensembles to constrain decadal to centennial projections will be also explored.

How to cite: de Melo Viríssimo, F. and Stainforth, D.: A low-dimensional dynamical systems approach to climate ensemble design and interpretation, EGU General Assembly 2023, Vienna, Austria, 23–28 Apr 2023, EGU23-14755, https://doi.org/10.5194/egusphere-egu23-14755, 2023.

EGU23-15829 | ECS | Posters on site | CL4.3

Near term climate change in Emilia-Romagna (Italy) using CMIP6 decadal climate predictions 

Valeria Todaro, Marco D'Oria, Daniele Secci, Andrea Zanini, and Maria Giovanna Tanda

Ongoing climate change makes both short- and long-term adaptation and mitigation strategies urgently needed. While many long-term climate models have been developed and investigated in recent years, little attention has been paid to short-term simulations. The first attempts to perform multi-model initialized decadal forecasts were presented in the fifth Coupled Model Intercomparison Project 5 (CMIP5). Near-term climate prediction models are new socially relevant tools to support the decision makers delivering climate adaptation solutions on an annual or decadal scale. Recent improvements in decadal models were coordinated in CMIP6 and the World Climate Research Program (WCRP) Grand Challenge on Near Term Climate Prediction, as part of the Sixth Assessment Report of the Intergovernmental Panel on Climate Change (AR6, IPCC). The Decadal Climate Prediction Project (DCPP) provides decadal climate forecasts based on advanced techniques for the reanalysis of climate data, initialization methods, ensemble generation and data analysis. The initialization allows to consider the predictability of the internal climate variability reducing the prediction errors compared to those of the long-term projections, whose simulations do not take into account the phasing between the internal variability of the model and the observations. The aim of this work is to assess the near-future climate change in the Emilia-Romagna region in northern Italy until 2031. The hydrological variables analyzed are the daily precipitation and maximum and minimum temperature. An ensemble of models, with the highest resolution available, is used to handle the uncertainty in the predictions. Initially, to assess the reliability of the selected climate models, the hindcast data of the DCPP are checked against observations. Then, the DCPP predictions are used to investigate the variability of precipitation and temperature in the near future over the investigated area. Some climate features that are referenced to have an important impact on human health and activities are evaluated, such as drought indices and heat waves.

How to cite: Todaro, V., D'Oria, M., Secci, D., Zanini, A., and Tanda, M. G.: Near term climate change in Emilia-Romagna (Italy) using CMIP6 decadal climate predictions, EGU General Assembly 2023, Vienna, Austria, 23–28 Apr 2023, EGU23-15829, https://doi.org/10.5194/egusphere-egu23-15829, 2023.

EGU23-16034 | ECS | Posters on site | CL4.3

Seasonal forecast of the Sudden Stratospheric Warming occurrence 

Mikhail Vokhmyanin, Timo Asikainen, Antti Salminen, and Kalevi Mursula

The polar vortex in the wintertime Northern Hemisphere can sometimes experience a dramatic breakdown after an associated warming of the stratosphere during so-called Sudden Stratospheric Warmings (SSWs). These events are known to influence the ground weather in Northern Eurasia and large parts of North America. SSWs are primarily generated by enhanced planetary waves propagating from the troposphere to the stratosphere where they decelerate the vortex and lead to its breakdown. According to the Holton-Tan mechanism, the easterly direction of equatorial stratospheric QBO (Quasi-Biennial Oscillation) winds weakens the northern polar vortex by guiding more waves poleward. Recently, we found that during easterly QBO the occurrence rate of SSWs is modulated by the geomagnetic activity. We used the aa-index which is a good proxy for the energetic electron precipitations (EEP) responsible for the indirect effect on ozone. Our model shows that the breaking of the polar vortex is very likely to occur if the geomagnetic activity is weak. On the other hand, during westerly QBO, solar irradiance modulates the SSW occurrence: more SSWs happen under high solar activity.

How to cite: Vokhmyanin, M., Asikainen, T., Salminen, A., and Mursula, K.: Seasonal forecast of the Sudden Stratospheric Warming occurrence, EGU General Assembly 2023, Vienna, Austria, 23–28 Apr 2023, EGU23-16034, https://doi.org/10.5194/egusphere-egu23-16034, 2023.

The state-of-the-art climate models suffer from significant sea surface temperature (SST) biases in the tropical Indian Ocean (TIO), greatly damaging the climate prediction and projection. In this study, we investigate the multidecadal atmospheric bias teleconnections caused by the TIO SST biases and their impacts on the simulated atmospheric variability. A set of century long simulations forced with idealized SST perturbations, resembling various persistent TIO SST biases in coupled climate models, are conducted with an intermediate complexity climate model. Bias analysis is performed using the normal-mode function decomposition which can differentiate between balanced and unbalanced flow regimes across spatial scales. The results show that the long-term atmospheric circulation biases caused by the TIO SST biases have the Matsuno-Gill-type pattern in the tropics and Rossby wavetrain distribution in the extratropics, similar to the steady state response to tropical heating. The teleconnection between the tropical and extratropical biases is set up by the Rossby wavetrain emanating from the subtropics. Over 90% of the total bias energy is stored in the zonal modes k≤6, and the Kelvin modes take 50-65% of the total unbalanced bias energy. The spatial and temporal variabilities have different responses to positive SST biases. In the unbalanced regime, variability changes are confined in the tropics, but the spatial variability increases whereas the temporal variability decreases. In the balanced regime, the spatial variability generally increases in the tropics and decreases in the extratropics, whereas the temporal variability decreases globally. Variability responses in the tropics are confined in the Indo-west Pacific region, and those in the extratropics are strong in the Pacific-North America region and the Europe. In the experiment with only negative SST biases, spatial and temporal variabilities increase in both regimes. In addition, the comparison between experiments indicates that the responses of the circulation and its variability are not sensitive to the structure and location of the TIO SST biases.

How to cite: Zhao, Y.-B., Žagar, N., Lunkeit, F., and Blender, R.: Long-term atmospheric bias teleconnection and the associated spatio-temporal variability originating from the tropical Indian Ocean sea surface temperature errors, EGU General Assembly 2023, Vienna, Austria, 23–28 Apr 2023, EGU23-16899, https://doi.org/10.5194/egusphere-egu23-16899, 2023.

EGU23-38 | Orals | CL4.4

6.5 ka BP cold spell in the Nordic Seas: a potential trigger for a global cooling event? 

Maciej M. Telesiński and Marek Zajączkowski

The present interglacial is a relatively warm and stable interval, especially compared to the preceding glacial period. However, several prominent cooling events have been identified within the Holocene epoch. Most of them occurred in its early or late part, while the middle Holocene was generally considered the warmest and most stable phase. Some of the cooling events (e.g., the well-known 8.2 ka BP event) have been proven to be of overregional importance. Here we focus on an event centred around 6.5 ka BP observed in marine records from the Norwegian Sea and the Fram Strait that has not been described previously. Planktic foraminiferal records from cores along the North Atlantic Drift reveal a subsurface water cooling that in the Fram Strait was more prominent than the well-known 8.2 ka BP event. The increase in the abundance of cold water foraminiferal species is preceded by a stepwise expansion of sea ice in the eastern Fram Strait and is accompanied by a decrease in the abundance of planktic foraminiferal species, an increase in shell fragmentation and IRD deposition. At the same time, alkenone-derived surface water temperatures in the north-eastern Norwegian Sea remain high, suggesting that the cooling was related to a drop in Atlantic Water advection rather than an external forcing. We discuss the possible causes of this event and its potential consequences, including the triggering of a global climatic deterioration that occurred shortly thereafter. Understanding the mechanisms behind such cold spells occurring within a generally warm interval is invaluable for future climate predictions. This study was supported by grant no. 2020/39/B/ST10/01698 funded by the National Science Centre, Poland.

How to cite: Telesiński, M. M. and Zajączkowski, M.: 6.5 ka BP cold spell in the Nordic Seas: a potential trigger for a global cooling event?, EGU General Assembly 2023, Vienna, Austria, 23–28 Apr 2023, EGU23-38, https://doi.org/10.5194/egusphere-egu23-38, 2023.

EGU23-974 | ECS | Posters on site | CL4.4

A quantitative analysis of the source of inter-model spread in Arctic surface warming response to increased CO2 concentration 

Xiaoming Hu, Yangchi Liu, Yunqi Kong, and Qinghua Yang

This study exams the main sources of inter-model spread in Arctic amplification of surface warming simulated in the abrupt-4×CO2 experiments of 18 CMIP6 models. It is found that the same seasonal energy transfer mechanism, namely that the part of extra solar energy absorbed by Arctic Ocean in summer due to sea-ice melting is temporally stored in ocean in summer and is released in cold months, is responsible for the Arctic amplification in each of the 18 simulations. The models with more (less) ice melting and heat storing in the ocean in summer have the stronger (weaker) ocean heat release in cold season. Associated with more (less) heat release in cold months are more (less) clouds, stronger (weaker) poleward heat transport, and stronger (weaker) upward surface sensible and latent heat fluxes. This explains why the Arctic surface warming is strongest in the cold months and so is its inter-model spread.

How to cite: Hu, X., Liu, Y., Kong, Y., and Yang, Q.: A quantitative analysis of the source of inter-model spread in Arctic surface warming response to increased CO2 concentration, EGU General Assembly 2023, Vienna, Austria, 23–28 Apr 2023, EGU23-974, https://doi.org/10.5194/egusphere-egu23-974, 2023.

In this study, we derived the environmental lapse rate (ELR) with the new European Centre for Medium-Range Weather Forecasts (ECMWF) reanalysis data ERA5 that could cover the central Arctic area and an extended period from 1980 to this day. We focus on the Greenland region, where the melting of the Greenland ice sheet plays a vital role in global sea level rise. The temporal and spatial variability of ELR distribution over the Greenland Ice sheet is fully explored in our research and the ELR values distribution over the other central Arctic land area including the Canadian archipelago, high latitude area of North America, and Eurasian are also studied. Our results indicate that ELR values differ dramatically in different seasons and areas, and the commonly used constant ELR −6.5 K/km is not suitable for the Arctic region. The monthly averaged ELR in Greenland shows an annual seasonal cycle with the lowest value is −2.5 K/km in winter. Near-zero ELR occurs in the northeastern marginal part of Greenland for the entire year except summer months. We talked about factors that might cause the near-zero ELR values that occurred over the research area in different seasons and hence research the inversion phenomenon in detail. 

The freshwater forcing that is equivalent to ice loss from Greenland in the real world is too small to affect the AMOC in climate model experiments. The freshwater flux (FWF) is comprised of runoff(liquid) and discharge(solid). To get a real and complete FWF as a freshwater forcing to activate the hosing experiment, the first step is to downscale near-surface temperature to get a higher-resolution runoff. ELR displays how the temperature near the surface varies with altitude and has been used for downscaling the near-surface temperature which will be further used for obtaining runoff. 

Our results could not only provide a reference for future near-surface temperature research and studies about inversion phenomena in different regions, but also depict the temperature vertical changes over the Arctic land area with ELR distribution. This research could provide a useful perspective on the changes in the Arctic cryosphere in recent years and should be helpful for a better understanding of mechanisms and feedback that drive the Arctic and subarctic climate changes. 

How to cite: Zhang, Z., Bamber, J., and Igneczi, A.: Temporal and spatial variability of Environmental Lapse Rate distribution over Greenland and the central Arctic from 1980 to 2020, EGU General Assembly 2023, Vienna, Austria, 23–28 Apr 2023, EGU23-1762, https://doi.org/10.5194/egusphere-egu23-1762, 2023.

After the last glaciation numerous temperature sensitive climate proxies from around the Arctic – ice cores, terrestrial and marine archives alike – show a tight connection to northern insolation with highest temperatures noted in the early Holocene. However, until the mid-Holocene (5-6ka; start of neoglaciation) all environmental change and reorganization occurred under circumstances still caused by deglaciation and global sea-level rise. Thus, the situation observed since then is interpreted to be mainly driven by a kind of ocean-atmospheric system that has little in common with the time before. In the Arctic the flooding of the vast shelves ended thereby massively expanding the area of winter sea-ice. And in the Nordic Seas water fronts were established which caused intensification of the gyre systems leading to the modern-like circulation pattern during the past 4kyrs. In several records these past 4 millennia were relatively cool. In the largest Arctic delta (Lena) peat-based island accumulation started at 4ka and another major change in growth occurred after 2.5ka in both, accumulation and species composition.

Neoglacial cooling in the colder Nordic Seas is witnessed by a persistent sedimentation of ice-rafted debris (IRD) after 6 ka, a trend which continued until recent time. Although within the eastern, Atlantic-influenced sector warm conditions persisted until about 1 ka, as seen in both planktic and benthic O-isotopes, variability among foraminiferal species would indicate major surface changes, as the abundance of the polar species increased to 70 % since then (in the Little Ice Age). That drastic increase was associated with highly variable O-isotope values throughout the entire water column. Thus, for the Little Ice Age the particular situation caused a rerouting of polar water masses and sea-ice far into the eastern Nordic seas. The major force behind such centennial-long climatic events must be sought in a complex atmosphere-surface ocean interaction rather than in the often-mentioned meridional ocean overturning circulation. Thus, spatial expansion of sea-ice impacts both the polar vortex and the temperature gradient between the high and low latitudes thereby exerting climate pressure on regions well beyond the Arctic realm.

How to cite: Bauch, H.: Effects of atmosphere-ocean interactions on late Holocene climate in the Arctic-Subarctic region, EGU General Assembly 2023, Vienna, Austria, 23–28 Apr 2023, EGU23-2775, https://doi.org/10.5194/egusphere-egu23-2775, 2023.

EGU23-3186 | ECS | Posters on site | CL4.4

Spatial-temporal variations of maximum surface water temperature in Arctic Fennoscandian lakes 

Mingzhen Zhang, Jan Weckstrom, Maija Heikkila, and Kaarina Weckstrom

The remote Arctic region is covered with numerous small lakes affected my current climate warming. There are little data on their thermal features, however, which hinders our understanding of the possible ecosystem impacts of warming climate and climate feedbacks at large spatial scales. We investigated spatial - temporal variations of summer lake surface temperatures (LSTs’) in 12 Arctic lakes and explored the predominant drivers by continuous year round observations of surface water temperatures. Our results suggest the general annual cycle pattern of summer water temperature: 1) the warming - up season lasted from May to July (or August) until the water temperature reached its maximum, and then the water temperature decreased until freezing in fall; and 2) the large regional heterogeneity existed in changes of summer LSTs. Futhermore, our results illustrate that July air temperature, maximum lake depth and longitude explained most of the variance in summer LSTs (>75%), and the remaining variance was related to geographic location (e.g. altitude and latitude), lake morphometric features, such as lake area and catchment area, and geochemical characteristics, i.e. turbidity and dissolved organic carbon (DOC) content. Our results provide new insights into thermal responses of small Arctic lakes with different environmental settings to climate change.

How to cite: Zhang, M., Weckstrom, J., Heikkila, M., and Weckstrom, K.: Spatial-temporal variations of maximum surface water temperature in Arctic Fennoscandian lakes, EGU General Assembly 2023, Vienna, Austria, 23–28 Apr 2023, EGU23-3186, https://doi.org/10.5194/egusphere-egu23-3186, 2023.

EGU23-3252 | Posters on site | CL4.4

The Batagay megaslump in east Siberia as an archive of climate–permafrost interactions during the Middle and Late Pleistocene 

Thomas Opel, Sebastian Wetterich, Hanno Meyer, and Julian Murton

The Batagay megaslump (67.58 °N, 134.77 °E) is the largest known retrogressive thaw slump on Earth, and located in the Yana River Uplands near the town of Batagay in east Siberia. The slump headwall is about 55 m high and exposes ancient permafrost deposits that provide a discontinuous record of the Middle and Late Pleistocene that dates back to at least 650 ka.

In this contribution, we compile cryostratigraphic observations and dating results for the permafrost exposed in the Batagay megaslump. Both provide evidence for several periods of permafrost formation and degradation. Permafrost formation and stability during Marine Isotope Stage (MIS) 16 or earlier (lower ice complex), MIS 7–6 or earlier (lower sand unit), MIS 4–2 (upper ice complex), and MIS 3–2 (upper sand unit) are reflected by the presence of deposits hosting syngenetic ice wedges and composite (i.e., ice–sand) wedges. In contrast, permafrost thaw and erosion are indicated by sharp, erosional discordances above reddish and organic-rich layers and by the accumulation of woody (forest) remains in erosional downcuts below and above the lower sand unit, and above the upper ice complex. Permafrost thaw and erosion likely took place during one or several periods between MIS 16 and MIS 7–6 as well as during MIS 5 and the late Pleistocene–Holocene transition.

To gain seasonal-scale climate signals, we analyzed the stable isotope composition of ground ice (ice and composite wedges and pore ice) from all four main stratigraphic units reflecting permafrost aggradation exposed in the Batagay megaslump. Ice and composite wedges contain winter climate signals. Their distinctly depleted δ18O values reflect the extreme continentality of the region with large seasonal temperature differences. Pore ice is mostly characterized by less depleted δ18O values and rather reflects summer to annual climate signals subject to post-depositional isotopic fractionation.

To draw large-scale conclusions on climate–permafrost interactions we compare our data to independent climate and permafrost reconstructions from terrestrial (cave deposits, lake sediment cores, and permafrost deposits) and marine sediment cores across the Arctic.

How to cite: Opel, T., Wetterich, S., Meyer, H., and Murton, J.: The Batagay megaslump in east Siberia as an archive of climate–permafrost interactions during the Middle and Late Pleistocene, EGU General Assembly 2023, Vienna, Austria, 23–28 Apr 2023, EGU23-3252, https://doi.org/10.5194/egusphere-egu23-3252, 2023.

EGU23-3330 | Orals | CL4.4

Tides, Internal and Near-Inertial Waves in the Yermak Pass at the Entrance of the Atlantic Water to the Arctic Ocean. 

Christine Provost, Camila Artana, Ramiro Ferrari, Clément Bricaud, Léa Poli, and Young-Hyang Park

In the crucial region of the Yermak Plateau where warm Atlantic water enters the Arctic ocean, we examined high frequency variations in the Yermak Pass Branch over a 34 months-long mooring data set. The mooring was ice covered only half of the time with ice-free periods both in summer and winter. We investigated the contribution of residual tidal currents to the low frequency flow of Atlantic Water (AW) and high frequency variations in velocity shears possibly associated with internal waves. High resolution model
simulations including tides show that diurnal tide forced an anticyclonic circulation around the Yermak Plateau. This residual circulation helps the northward penetration of the AW into the Arctic. Tides should be taken into account when examining low frequency AW inflow. High frequency variations in velocity shears are mainly concentrated in a broad band around 12 hr in the Yermak Pass. Anticyclonic eddies, observed during ice-free conditions, modulate the shear signal. Semi-diurnal internal stationary waves dominate high frequency variations in velocity shears. The stationary waves could result from the interaction of freely propagating semi-diurnal internal waves generated by diurnal barotropic tides on critical slopes around the plateau. The breaking of the stationary waves with short length scales possibly contribute to mixing of AW at the entrance to the Arctic.

How to cite: Provost, C., Artana, C., Ferrari, R., Bricaud, C., Poli, L., and Park, Y.-H.: Tides, Internal and Near-Inertial Waves in the Yermak Pass at the Entrance of the Atlantic Water to the Arctic Ocean., EGU General Assembly 2023, Vienna, Austria, 23–28 Apr 2023, EGU23-3330, https://doi.org/10.5194/egusphere-egu23-3330, 2023.

EGU23-3894 | ECS | Posters on site | CL4.4

A 22,000-Year Sediment Record from Burial Lake, Alaska, Shows a Rapid Twofold Increase in Mercury Concentration in Response to Early Holocene Climate Change 

Melissa Griffore, Eitan Shelef, Matthew Finkenbinder, Joseph Stoner, and Mark Abbott

Arctic permafrost soils have recently been identified as the largest mercury (Hg) reservoir on Earth. Today, rapid warming in the high latitudes may be altering the Arctic Hg cycle by accelerating permafrost thaw, leading to changes including deepening of the active layer, increasing organic matter decay, and increasing seasonal groundwater flow. However, few studies have investigated how the Hg cycle has responded to past changes in climate, and there is a lack of Arctic records that span the late glacial to early Holocene when climate conditions changed abruptly. We propose that the geochemical and physical changes in the sediment record of Burial Lake (68.43ºN, 159.17ºW; 460 m ASL), which document climatic and environmental changes in northwestern Alaska after the Last Glacial Maximum (LGM), can be used as an analog to investigate how today’s rapid warming affects Hg mobilization from permafrost soils to surficial waters. Warming in the Northern Hemisphere between ~15.0 and 8.0 ka resulted in rapid changes in northwest Alaska, including the submergence of the Bering Land Bridge that reconnected the Pacific and Arctic Oceans (~11.0 ka), in addition to changes in the hydroclimate. Our results indicate that the Hg concentration was relatively low and stable in the Burial Lake record during the transition from the LGM to the late glacial (20.0 and 16.0 ka) with a mean concentration of 64±7 μg/kg. Mercury concentrations begin to increase after 16.0 ka. Then, coinciding with a rapid temperature increase at the beginning of the Bølling Allerød (14.7 to 12.9 ka), Hg concentrations increased by ~20% and showed higher variability as temperatures fluctuated until the end of the Younger Dryas (12.9 to 11.7 ka). At 11.0 ka, the Hg concentration increased rapidly. It peaked at 140 µg/kg, with a mean Hg concentration of 119 μg/kg between 11.0 to 8.8 ka, coinciding with evidence of a rapid increase in regional precipitation and flooding of the Bering Land Bridge. From 8.8 to 0.1 ka, the mean Hg concentration decreased to 107 μg/kg and then increased rapidly over the last 100 years to a maximum concentration of 196 μg/kg occurring during the 1990s. Throughout the majority of the Burial Lake sediment record, the Hg concentration is most strongly correlated with total organic carbon content and geochemical proxies sensitive to changes in redox conditions. We interpret this finding as an indication that a large fraction of Hg is mobilized from the lake catchment along with dissolved organic matter (DOM), iron (Fe), and manganese (Mn) that are mobilized as a result of saturation and deepening of the active layer during periods of warmer, but most importantly, wetter climate. The Hg record from Burial Lake suggests that as the climate warmed after the LGM, organic-rich permafrost soils and Hg accumulated in the catchment. The sudden increase in Hg mobilization from permafrost soils was then initiated at the onset of the Holocene due to the rapid increase in precipitation that coincided with the flooding of the Bering Land Bridge.

How to cite: Griffore, M., Shelef, E., Finkenbinder, M., Stoner, J., and Abbott, M.: A 22,000-Year Sediment Record from Burial Lake, Alaska, Shows a Rapid Twofold Increase in Mercury Concentration in Response to Early Holocene Climate Change, EGU General Assembly 2023, Vienna, Austria, 23–28 Apr 2023, EGU23-3894, https://doi.org/10.5194/egusphere-egu23-3894, 2023.

EGU23-4364 | ECS | Posters on site | CL4.4

Interaction between ice sheet instability and sea surface characteristics in the Labrador Sea during the last 50 ka 

Defang You, Ruediger Stein, and Kirsten Fahl

The study on the decay of ice sheets in the past provides important insights into the interaction between ice sheet behaviours and ocean characteristics, especially under a sustained warming climate. On the one hand, the ice sheet may affect the ocean environment; on the other hand, changes in sea surface conditions may affect the instability of the ice sheets. However, interactions between ice sheet dynamics and sea surface characteristics are still not fully understood. Thus, studies of carefully selected sediment cores representing both ice-sheet and ocean characteristics can help to better predict changes in ice sheets in the future. Here, we show sedimentary records from the eastern Labrador Sea, proximal to the Laurentide Ice Sheet (LIS) and the Greenland Ice Sheet (GrIS), representing the last 50 ka, i.e., the last glacial-deglacial-Holocene period. Our XRF and biomarker data document the outstanding collapse of the LIS/iceberg discharge during Heinrich Events (i.e., HE5, HE4, HE2, and HE1) and the occurrence of meltwater plumes from the LIS and GrIS during the deglaciation. Such meltwater discharge has caused surface water freshening in the Labrador Sea and, consequently, decreased sea surface temperatures and decreased primary productivity. Enhanced Irminger Current inflow might have triggered the retreat of ice sheets/meltwater discharge, as shown in our planktic foraminifera records. In contrast to dominantly relatively low primary productivity during the glacial period, both higher sea ice algae and phytoplankton production occurred during the Last Glacial Maximum (LGM), probably caused by a polynya in front of the GrIS reaching its maximum extent at that time. During the deglaciation to Holocene time interval, primary productivity shows an increasing trend probably related to decreased meltwater discharge, decreased sea ice extent, and increased insolation.


How to cite: You, D., Stein, R., and Fahl, K.: Interaction between ice sheet instability and sea surface characteristics in the Labrador Sea during the last 50 ka, EGU General Assembly 2023, Vienna, Austria, 23–28 Apr 2023, EGU23-4364, https://doi.org/10.5194/egusphere-egu23-4364, 2023.

EGU23-5088 | ECS | Orals | CL4.4

Sedimentation rates across Baffin Bay since the last glacial period (based on radiocarbon age control) 

Emmanuel Okuma, Jürgen Titschack, Markus Kienast, and Dierk Hebbeln

Around Baffin Bay, the large continental Laurentide, Innuitian, and Greenland ice sheets retreated from their maximum extent reaching the shelf break during the Last Glacial Maximum (LGM) to their present-day close-to-minimum extent being largely confined to onshore settings. The associated changes in ice extent, erosion patterns, and material transport modes probably greatly affected spatial and temporal patterns of sediment deposition in Baffin Bay. While for many sites in Baffin Bay, local information about temporal changes in sedimentation rates exist, a spatial analysis allowing to compare sedimentation patterns is still lacking. To fill this gap, radiocarbon ages from over 50 sediment cores (with two or more dates) across Baffin Bay were compiled to assess the spatiotemporal variability in sediment input to Baffin Bay since the LGM. Preliminary results evaluating sedimentation rates (calculated from un-calibrated 14C ages) binned to 1 ka time slices reveal that during the LGM and the early deglacial, the slope beyond the shelf break and the deep basin were the only active depocenters, however, marked by very low sedimentation rates (mainly <20 cm ka-1), suggesting a largely ice-covered bay. At ~15 ka, sediment supply to these settings increased, likely reflecting the onset of ice retreat during the deglaciation. With the beginning of deposition on the mid and outer shelves after ~10 ka, deposition on the slopes and in the basin ceased almost completely. Ongoing ice retreat progressively uncovered new depocenters in the over-deepened shelf troughs off Baffin Island and Greenland, where from ~9 ka onwards, especially the inner shelf off Greenland, experienced elevated sedimentation rates (~100-500 cm ka-1), while Baffin Island fjords received less material (mainly <100 cm ka-1). Most shelf records show a continuous decrease in sedimentation rates since the early Holocene but a few records from the Greenland shelf point to rates picking up over the last two millennia, probably reflecting the Neoglaciation. Sedimentation rates peak after ~6 ka in the wider northern Baffin Bay. These data generally reflect the transition from low glacial to enhanced deglacial sedimentation beyond the shelves, followed by a progressive landward displacement of the main depocenters towards the over-deepened inner shelf troughs. There, sediment input decreased when the ice sheets attained their minimum extent in the mid-Holocene. Only in northernmost Baffin Bay is this trend turned around, with the highest sediment input in the Late Holocene.

How to cite: Okuma, E., Titschack, J., Kienast, M., and Hebbeln, D.: Sedimentation rates across Baffin Bay since the last glacial period (based on radiocarbon age control), EGU General Assembly 2023, Vienna, Austria, 23–28 Apr 2023, EGU23-5088, https://doi.org/10.5194/egusphere-egu23-5088, 2023.

EGU23-5643 | Posters on site | CL4.4

Late Quaternary history of glaciations in the northern Kara Sea and Arctic Ocean iceberg drift in marine isotope stage 6 

Robert F. Spielhagen, Blumenberg Martin, Kus Jolanta, Ovsepyan Yaroslav, Taldenkova Ekaterina, Wangner David, and Zehnich Marc

We present new data from two long sediment cores obtained off the St. Anna and Voronin troughs on the northern continental margin of the Kara Sea (eastern Arctic Ocean). According to preliminary age models based on microfossil findings and grain size data, the cores cover the last ca. 150 kyr. Coarse-grained layers with common to abundant iceberg-rafted lithic grains (IRD) were deposited when ice sheets on the Kara Sea shelf had advanced close to the shelf break and ice streams developed in the deep troughs opening towards the eastern Arctic Ocean. Terrestrial data suggest that large ice sheets in the area developed in marine isotope (sub)stages (MIS) 6, 5b, and 4, while glaciation was restricted to the westernmost Kara Sea in the last glacial maximum (MIS 2) (Svendsen et al., 2004, Quat. Sci. Rev.). Our new data reveal details of the ice extent during individual glacial phases. They suggest that only in MIS 6 both troughs were filled with ice streams and that in the younger glacial phases regional differences of ice extent developed along the continental margin.

In several layers, coal clasts up to 4 cm in size were found. We have obtained coal petrological and organic geochemical data of these particles and of coal grains found in other sediment cores from the deep-sea eastern Arctic Ocean and the Fram Strait area. The results reveal a certain variability of data (random vitrinite reflectance (VRr %), Rock-Eval hydrogen and oxygen indices, hydrocarbon biomarkers) even among samples from the same core, suggesting that the coal grains do not stem from one restricted area. Data clusters and comparison with published information on coals from circum-Arctic continents, however, allow a tentative discrimination of our samples. The coals from the northern Kara Sea area and the central Fram Strait show relatively high oxygen indices, in opposite to coals from the NE Greenland margin. The latter resemble coals from the Cretaceous/Tertiary basins on Svalbard and NE Greenland. Available stratigraphic data from the cores suggests that the layers with high coal particle abundances in deep-sea cores from the northern Kara Sea area, the central Fram Strait, and the NE Greenland margin were deposited in MIS 6. We conclude that during MIS 6 coal-bearing layers in the NE Greenland Wandel Sea Basin were eroded by an expanded North Greenland Ice Sheet and transported by icebergs southward along the adjacent continental margin. At the same time, icebergs breaking off from the large northern Eurasian Ice Sheet drifted from northern Siberia across the Eurasian Basin towards the central Fram Strait. Our results generally support the hypothesis of a cross-Arctic iceberg transport in MIS 6 but show that caution must be applied when conclusions are made on the sources of individual coal particles.

How to cite: Spielhagen, R. F., Martin, B., Jolanta, K., Yaroslav, O., Ekaterina, T., David, W., and Marc, Z.: Late Quaternary history of glaciations in the northern Kara Sea and Arctic Ocean iceberg drift in marine isotope stage 6, EGU General Assembly 2023, Vienna, Austria, 23–28 Apr 2023, EGU23-5643, https://doi.org/10.5194/egusphere-egu23-5643, 2023.

EGU23-8351 | ECS | Orals | CL4.4

A high-resolution, operational pan-Arctic meltwater discharge database from 1950 to 2021 

Adam Igneczi and Jonathan Bamber

The Arctic has warmed about four times faster than the global average during the last four decades. One of the consequences of this intensive warming is increasing Arctic land ice loss. In particular, mass loss from the Greenland Ice Sheet has been estimated to have increased sixfold between 1980 and 2020. Glaciers and ice caps outside of Greenland, though receiving less attention, have also been reported to be losing mass at an increasing rate. This is caused by a combination of negative surface mass balance – due to decreasing snowfall and/or increasing melting and runoff – and increasing ice discharge. However, negative surface mass balance due to increasing melting and runoff has become the dominant cause of mass loss in Greenland and the Canadian Arctic during the last 10-15 years. This indicates the increasing role of meltwater discharge into fjords and coastal seas, influencing a wide-range of physical, chemical and biological processes and also the large-scale oceanic circulation. Despite recent advancements, no meltwater discharge data products are available that cover the entire Arctic at a high spatial (< 1 km) and temporal (sub-monthly) resolution. To fill this data gap, we use daily ~6km runoff data from a regional climate model, Modéle Atmosphérique Régional (MAR), for the period of 1950-2021 – covering Greenland, Arctic Canada, Iceland, Svalbard, and Arctic Russia. We employ a statistical downscaling algorithm that utilises a high resolution (250 m) DEM, land mask (Copernicus GLO-90), and ice mask (GIMP, RGI). A hydrological routing scheme is also applied to the downscaled runoff to provide meltwater runoff data at coastal outflow points. Meltwater components coming from non glacierized land, bare glacier ice, and glacierized area above the snowline are separated to aid further analyses. The software pipeline is designed to be fully operational so that it can be used to update the time series as soon as the input data are available, so providing a continuous time series for the entire Arctic within the framework of a project aimed to develop a holistic, integrated observing system for the Arctic (www.arctipassion.eu).

How to cite: Igneczi, A. and Bamber, J.: A high-resolution, operational pan-Arctic meltwater discharge database from 1950 to 2021, EGU General Assembly 2023, Vienna, Austria, 23–28 Apr 2023, EGU23-8351, https://doi.org/10.5194/egusphere-egu23-8351, 2023.

EGU23-8460 | ECS | Orals | CL4.4

An updated view on water masses on the Northeast Greenland shelf and their link to the Laptev Sea and Lena River 

Esty Willcox, Jørgen Bendtsen, John Mortensen, Christian Mohn, Marcos Lemes, Thomas Juul-Pedersen, Marit-Solveig Seidenkrantz, Johnna Holding, Eva Møller, Mikael Sejr, and Søren Rysgaard

The Northeast Greenland shelf is a broad Arctic shelf located between Greenland and Fram Strait. It is the principal gateway for sea ice export and sea ice-associated freshwater from the Arctic Ocean. Sea ice thickness has decreased by 15% per decade since the early 1990s and meteoric freshwater discharge has increased. The consequence of changing sea-ice and freshwater conditions in the region on ocean dynamics and the biological system remains unknown. Determining the source(s) of freshwater is important to be able to understand how the area will react to future upstream change. Here we present a synoptic survey of the Northeast Greenland shelf and slope with observations of hydrography, the nutrients nitrate, phosphate and silicate, and conservative tracers δ18O, δ2H and total alkalinity during late summer 2017. We compare these to previously published values, including those which identify Pacific and Atlantic water, the Siberian shelf seas, and the 6 largest Arctic rivers. We show that a major source of freshwater on the Northeast Greenland shelf during late summer 2017 is the Laptev Sea and find no conclusive evidence of Pacific Water. Our observations provide a direct link between Northeast Greenland hydrology and processes occurring on Eurasian shelves.

How to cite: Willcox, E., Bendtsen, J., Mortensen, J., Mohn, C., Lemes, M., Juul-Pedersen, T., Seidenkrantz, M.-S., Holding, J., Møller, E., Sejr, M., and Rysgaard, S.: An updated view on water masses on the Northeast Greenland shelf and their link to the Laptev Sea and Lena River, EGU General Assembly 2023, Vienna, Austria, 23–28 Apr 2023, EGU23-8460, https://doi.org/10.5194/egusphere-egu23-8460, 2023.

EGU23-9642 | Orals | CL4.4 | Highlight

ABRUPT Arctic Climate Change 

Bjørg Risebrobakken, Yunyi Wang, Chuncheng Guo, Dag Inge Blindheim, Trond Dokken, Kirsten Fahl, Eystein Jansen, Marlene Klockmann, Juliette Tessier, Amandine Tisserand, Rüdiger Stein, Guido Vetteretti, and Andrzej Witkowski

At unprecedented resolution we investigate the nature of Dansgaard-Oeschger events in the Fram Strait, the gateway between the Nordic Seas and the Arctic Ocean. The new reconstructions of biomarkers and sea ice variability, stable isotopes and IRD will be seen in context of sea ice conditions, ocean hydrography and climate of the Nordic Seas as seen in multi-model output from three transient glacial GCM simulations (NorESM, CESM, MPI-ESM) and high-resolution reconstructions from an eastern Nordic Seas transect (from the Faeroe-Shetland Channel, via the Norwegian Sea to the Fram Strait). The combined results show that ocean-atmosphere-sea ice processes and dynamics during the transition from H4 to GI8 are strongly coupled. 


Both model results and reconstructions suggest subsurface ocean warming and polynya events in the southern- and northernmost Nordic Seas during the cold stadial. For a short time during the stadial to interstadial transition, a corridor of open water and hence sea ice-free conditions existed from the southern Nordic Seas all the way to the Fram Strait. The breakup of the sea ice cover is likely caused by the overshoot of AMOC during the transition and the associated enhanced ocean heat transport into the Nordic Seas. After the transition, winter sea ice grows back in the Fram Strait during the interstadial state, but the Southern Nordic Seas remain ice-free.

How to cite: Risebrobakken, B., Wang, Y., Guo, C., Blindheim, D. I., Dokken, T., Fahl, K., Jansen, E., Klockmann, M., Tessier, J., Tisserand, A., Stein, R., Vetteretti, G., and Witkowski, A.: ABRUPT Arctic Climate Change, EGU General Assembly 2023, Vienna, Austria, 23–28 Apr 2023, EGU23-9642, https://doi.org/10.5194/egusphere-egu23-9642, 2023.

EGU23-10585 | ECS | Orals | CL4.4

Performance evaluation of 20CRv3 downscaling using WRF over southern Alaska with focus on temperature and precipitation in glaciated areas 

Sandra Koenigseder, Timothy Barrows, Jenny Fisher, Jason Evans, and Chesley MacColl

Global warming has raised mean surface temperatures by 0.99 ± 0.15 °C from 1850-1900 to 2011-2020. The temperature rise has been greatest in the high latitudes. Alaska has one of the largest temperate and subarctic glaciated areas in the world, which is highly sensitive to climate change. Currently, the mass loss from these glaciers contributes to about a third of the global sea-level rise. For example, the tidewater glacier Columbia Glacier located within Prince William Sound is the largest single contributor to sea level rise through its rapid retreat, which started in the early 1980s. Although internal controls strongly influence the tidewater glacier cycle, the ubiquitous retreat of Alaskan tidewater glaciers indicates climatic forcing is involved. However, it is unlikely climate controls the rate of retreat. There are insufficient meteorological observations from this region to assess the role of climate across a whole tidewater cycle. This project reconstructs the regional climate of southern Alaska from 1836–2015 using dynamical downscaling of the NOAA-CIRES-DOE 20th Century Reanalysis (20CRv3). To do this, the Weather Research and Forecasting model (WRF) has been used to spatially downscale the reanalysis data to produce high-resolution 4 km (convection permitting) output for southcentral/southeastern Alaska. Five different physics parametrisations have been tested for the year 2010. The model output of these five configurations were evaluated using observational records from the Global Surface Summary of the Day (GSOD). The physics scheme that performed most realistically was identified using root mean square error, R squared and normalized mean error for temperature and precipitation. The study shows that 20CRv3 can successfully be downscaled for the study region. As a result, the leading parametrisation was used for a long-term simulation (179 years) to reconstruct local climate and weather over southern Alaska over a significant part of a tidewater glacier cycle. The results will be used to evaluate the influence of climate on these glaciers for the downscaling period from 1836 to 2015.

How to cite: Koenigseder, S., Barrows, T., Fisher, J., Evans, J., and MacColl, C.: Performance evaluation of 20CRv3 downscaling using WRF over southern Alaska with focus on temperature and precipitation in glaciated areas, EGU General Assembly 2023, Vienna, Austria, 23–28 Apr 2023, EGU23-10585, https://doi.org/10.5194/egusphere-egu23-10585, 2023.

EGU23-11323 | Posters on site | CL4.4

Freshwater input and water mass interactions in the Uummannaq fjord system 

Leandro Ponsoni, Anouk Ollevier, Roeland Develter, and Wieter Boone

The climate is rapidly changing in the Arctic, where global warming is reported to be about up to four times the global average in the last two decades. Aligned with this Arctic Amplification, other climate-related phenomena are also changing, or are bound to change, on a regional scale. For instance, the accelerated glaciers’ melting is forcing a transition of some glaciers from marine- to land-terminating systems and, therefore, impacting the balance of freshwater input into the oceans. As consequence, other ocean climate-related processes (e.g., water masses (trans)formation, baroclinicity of geostrophic currents) are expected to be impacted.

Within this context, and as part of the “Innovative study on regional high-resolution imaging of glacier induced plankton dynamics in West-Greenland fjords (IOPD)” project, we visited the fjord system in the Uummannaq area, off Western Greenland, aboard the R/V Sanna, from 28/Jun to 10/Jul/2022. In this region, fjords are marked by both land- and marine-terminating glaciers. During the cruise, we performed 47 hydrographic stations of the entire water column into 5 different fjords - from their mouth to the innermost accessible location. These stations are complemented by an offshore transect from the fjord mouth to the shelf edge.

Based on the in-situ measurements described above, complemented by other historical oceanographic measurements and state-of-the-art datasets for solid and liquid freshwater input provided by the Geological Survey of Denmark and Greenland (GEUS), we aim at characterizing the fjord system in the Uummannaq area in perspective of the ongoing climate changes. More specifically, this work addresses the following questions (i) What is the long-term and recent freshwater input to the region? And, is this input undergoing changes in the latest years? (ii) How are the water masses quantitatively distributed within the fjords and adjacent continental shelf? Are there differences between fjords? And, how do the connections with the adjacent continental shelf take place? (iii) Are there differences between marine- and land-terminating systems in terms of (solid and liquid) freshwater input and water mass distribution in the region? If so, what are these differences?

How to cite: Ponsoni, L., Ollevier, A., Develter, R., and Boone, W.: Freshwater input and water mass interactions in the Uummannaq fjord system, EGU General Assembly 2023, Vienna, Austria, 23–28 Apr 2023, EGU23-11323, https://doi.org/10.5194/egusphere-egu23-11323, 2023.

Radiogenic Sr, Nd, and Pb isotope compositions in marine sediments are widely used as provenance tracers delivering valuable information about past environmental conditions. Over the last ten years, several studies performing radiogenic isotope analysis on marine sediment records from Baffin Bay and Labrador Sea highlighted the strength of this method in shedding light upon past glacier dynamics and related environmental changes in Greenland and the Canadian Arctic. The main outcomes of our studies include precise information on the opening of Arctic gateways and the setting of oceanic connection from the Arctic Ocean to the Atlantic through Baffin Bay. At a more regional scale, these tracers document the late glacial to Holocene dynamics of Baffin Island glaciers, helping to understand how climate and oceanic conditions impacted glacier margin fluctuations. As importantly, our study also highlighted limitations in the sensitivity of radiogenic isotopes from Baffin Bay marine sediments as tracers. Most important for interpreting radiogenic isotope compositions is the availability of a sufficiently dense cover of their properties in bedrock and reference isotope signatures from such remote areas to better resolve potential sediment sources. Another challenge for sediment records obtained from core sites at near-proximity to ice margins is the effect of glacier dynamics on the sediment composition. Intense meltwater discharge can lead to grain size and mineral sorting, which could bias the radiogenic isotope composition of the sediment. Nonetheless, radiogenic isotopes present a significant advantage over lesser availability tracers, such as biological proxies, which can be restricted due to the harsh climate conditions. In several cases, radiogenic isotope analysis also reveals more information about sediment provenance than mineralogical assemblages. All in all, in combination with sedimentological and mineralogical features, the radiogenic Sr, Nd, and Pb isotope compositions of Arctic marine sequences can be used as reliable tracers for changes in sediment provenance.

How to cite: Hingst, J., Lucassen, F., Hillaire-Marcel, C., and Kasemann, S.: Strengths and limitations of using radiogenic isotope signatures of marine sediments from Baffin Bay for the reconstruction of ice dynamics and paleoenvironments in the Canadian Arctic and Greenland, EGU General Assembly 2023, Vienna, Austria, 23–28 Apr 2023, EGU23-12601, https://doi.org/10.5194/egusphere-egu23-12601, 2023.

EGU23-13560 | ECS | Orals | CL4.4

How does imposing a spatially-varying map of background vertical diffusivity with rates and spatial structure informed by observations impact the modelled Arctic Ocean state? 

Benjamin O'Connor, Stephanie Waterman, Jeffrey Scott, Hayley Dosser, and Melanie Chanona

Mixing in the Arctic Ocean drives water mass transformations critical to the heat and freshwater budgets of the Arctic Ocean, impacting sea ice extent and volume, stratification, circulation, and heat and freshwater release to the subpolar N. Atlantic. Observations indicate that mixing rates in the Arctic Ocean are highly variable, however this variability is typically not well-represented in models.

This study uses a regional Arctic Ocean model to addresses the question “How does imposing a spatially-varying map of background vertical diffusivity with rates and spatial structure informed by observations impact the modelled Arctic Ocean state?” It seeks to understand impacts based on model experiments that systematically vary the diffusivity uniformly in space.

It is shown that prescribing the observationally-informed mixing map results in increased heat loss, a redistribution of freshwater storage, and increased heat and freshwater export to the N. Atlantic relative to a control case with an equal-on-average-but-spatially-uniform distribution of mixing. These effects can be understood as the result of enhancing (reducing) mixing on the shelves (basins) relative to the control case. They highlight sensitivities of the Arctic Ocean heat and freshwater budgets to shelf and basin mixing respectively.

These findings are relevant to the impacts of the changing Arctic Ocean mixing environment on Arctic Ocean functioning and subpolar ocean variability. They further suggest ways in which the prescription of Arctic Ocean mixing may be important to improving model representations of Arctic Ocean dynamics.

How to cite: O'Connor, B., Waterman, S., Scott, J., Dosser, H., and Chanona, M.: How does imposing a spatially-varying map of background vertical diffusivity with rates and spatial structure informed by observations impact the modelled Arctic Ocean state?, EGU General Assembly 2023, Vienna, Austria, 23–28 Apr 2023, EGU23-13560, https://doi.org/10.5194/egusphere-egu23-13560, 2023.

EGU23-14677 | ECS | Posters on site | CL4.4 | Highlight

Increasing Arctic River Discharge and Its Role for the Phytoplankton Responses in the Present-day and Future Climate Simulations 

Jung Hyun Park, Seong-Joong Kim, Hyung-Gyu Lim, Jong-seong Kug, Eun Jin Yang, and Baek-Min Kim

With the unprecedented rate of Arctic warming in recent decades, the hydrological cycle over high-latitude landmass began to accelerate, which would lead to increased river discharge into the Arctic Ocean. However, the recent climate models that participated in Coupled Model Intercomparison Project 6 (CMIP6) tend to underestimate Arctic river discharge. This study elucidates the role of overlooked Arctic river discharge for the phytoplankton responses in present-day and future climate simulations. In the present-day climate simulation, the run with additional river discharge simulates the decrease in the spring phytoplankton. Freshening of Arctic seawater leads to high freezing point that increases sea ice concentration in the spring, eventually decreasing phytoplankton due to the less light availability. On the other hand, in the summer, phytoplankton increases due to the surplus of surface nitrate and the increase in the vertical mixing induced by the reduced summer sea ice melting water. In the future climate, the role played by additional input of freshwater is similar to the present-day climate. However, the major phytoplankton responses are shifted from the Eurasian Basin to the Canadian Basin and the East-Siberian Sea. This is mainly due to the shift of the marginal sea ice zone from the Barents-Kara Sea to the East Siberian-Chukchi Sea in the future.

How to cite: Park, J. H., Kim, S.-J., Lim, H.-G., Kug, J., Yang, E. J., and Kim, B.-M.: Increasing Arctic River Discharge and Its Role for the Phytoplankton Responses in the Present-day and Future Climate Simulations, EGU General Assembly 2023, Vienna, Austria, 23–28 Apr 2023, EGU23-14677, https://doi.org/10.5194/egusphere-egu23-14677, 2023.

EGU23-1252 | ECS | Orals | CL4.5

Deployment of the global tide and surge model for estimating sea-level trends along the Dutch coast 

Sanne Muis, Natalia Aleksandrova, Fedor Baart, Willem Stolte, and Jelmer Veentra

The monitoring of the sea level trend is important for decision-making in the near-future. For the Dutch coast, the Sea Level Monitor periodically publishes new estimates of the sea level rise trend. This observed trend, based on a selection of Dutch tide gauge stations, is used for the planning and management of our coastal defenses in the next 10-15 years. To estimate the trend in mean sea level, the influence of land subsidence, long-term tidal cycles and storm surges levels need to be removed from the observations.

In this contribution, we focus on the contribution of storm surges, that are driven by variations of atmospheric pressure and wind. We will present an updated methodology to remove the effects of these variations on the sea-level trend, which is based on monthly mean sea levels derived with a depth-averaged hydrodynamic model instead of a linear regression. A fully automated and portable workflow was developed to deploy Global Tide and Surge Model (GTSM) on a high-performance computing cluster. Leveraging recent updates of the ERA5 climate reanalysis, we extent existing GTSM simulations back to 1950 and to present-day. Based on these new simulations, we will discuss the variability in mean sea levels due to atmospheric conditions, and present how the sea-level trend changes due to the improved correction.

How to cite: Muis, S., Aleksandrova, N., Baart, F., Stolte, W., and Veentra, J.: Deployment of the global tide and surge model for estimating sea-level trends along the Dutch coast, EGU General Assembly 2023, Vienna, Austria, 23–28 Apr 2023, EGU23-1252, https://doi.org/10.5194/egusphere-egu23-1252, 2023.

EGU23-3929 | ECS | Orals | CL4.5

Investigating the sea level budget in the East China Sea 

Christina Strohmenger, Ziyu Liu, Bernd Uebbing, Jürgen Kusche, Lennart Reißner, Yunzhong Shen, Wei Feng, and Qiujie Chen

Sea level change is not uniform around the globe. We focus on regional sea level change in the East China Sea (ECS), a Western Pacific marginal sea of 770.000 km2, with a densely populated and economically important coastal area. Several challenges arise when investigating past and current sea level change and budgets in this region.

Ocean mass change is observed by GRACE(-FO). However, one needs to account for hydrological signals leaking from land into the ocean, as well as for sediment discharge from rivers. Steric contributions are usually measured by Argo floats, but from the shallow inner shelf of the ECS only few data are available. Thus, ocean reanalyses should be handled with caution. Total sea level change from altimetry can be compared to tide gauge data, but gauges are sparsely distributed in the ECS area and only few stations are co-located with GNSS to account for vertical land motion.

In this contribution, we analyze and compare different data products to better understand regional sea level change and its contributors. Time series of ECS- averaged levels (total from altimetry, mass from GRACE and GRACE-FO and steric from ORAS5 reanalysis) are computed and compared in terms of trend, seasonal amplitudes and correlations. Additionally, spatial patterns are investigated, revealing that the shallow coastal regions, vast continental shelf areas and deep sea areas show distinct characteristic behaviors of sea level change. Altimetry and tide gauge data show a correlation of higher than 70% for 11 of 13 available records. Finally, we compare the individual data sets to results of a joint sea level inversion framework (Uebbing, 2022).

How to cite: Strohmenger, C., Liu, Z., Uebbing, B., Kusche, J., Reißner, L., Shen, Y., Feng, W., and Chen, Q.: Investigating the sea level budget in the East China Sea, EGU General Assembly 2023, Vienna, Austria, 23–28 Apr 2023, EGU23-3929, https://doi.org/10.5194/egusphere-egu23-3929, 2023.

EGU23-4017 | ECS | Posters virtual | CL4.5

Global Sea Level Trend, Acceleration and Its Components over 1993-2016 

Fengwei Wang, Yunzhong Shen, Qiujie Chen, and Jianhua Geng

A 24-year global mean barystatic sea level change from January 1993 to December 2016 is derived by the joint use of Tongji-LEO2021 and Tongji-Grace2018 monthly gravity field solutions, with which the global sea level budget is investigated together with altimetry, steric and four mass elements (glaciers, Greenland, Antarctica and land water storage). The derived global mean sea level changes from altimetry, steric and two Tongji solutions generally agree well with each other with three correlation coefficients all higher than 0.90. The results show that the linear trend of global mean sterodynamic sea level change is 2.85±0.30 mm/year from altimetry, close to 2.82±0.19 mm/year of barystatic (1.55±0.15 mm/year) plus steric (1.27±0.12 mm/year) and 2.94±0.13 mm/year of the sum mass contributions (1.67±0.06 mm/year) plus steric, whose misclosure ranges -0.09 to 0.03 mm/year. The acceleration of global mean barystatic sea level change is 0.139±0.019 mm/year2, which is mainly caused by four factors, 0.051±0.002 mm/year2 (~36.7%) by Greenland ice melting, 0.027±0.002 mm/year2 (~19.4%) by Antarctica ice melting, 0.027±0.001 mm/year2 (~19.4%) for other glaciers melting and 0.032±0.010 mm/year2 (~23.0%) for land water storage, respectively. The findings in this study suggested that the global sea level budget was closed from 1993 to 2016 based on altimetry, steric, Tongji solutions and mass elements data.

How to cite: Wang, F., Shen, Y., Chen, Q., and Geng, J.: Global Sea Level Trend, Acceleration and Its Components over 1993-2016, EGU General Assembly 2023, Vienna, Austria, 23–28 Apr 2023, EGU23-4017, https://doi.org/10.5194/egusphere-egu23-4017, 2023.

EGU23-4176 | ECS | Posters virtual | CL4.5

Sea level variability across the Northwest Atlantic shelf 

Anrijs Abele, Sam Royston, and Jonathan Bamber

Ocean dynamics plays a prominent role in the change of sea level variability on approach to the coast. While some studies have focused on decadal changes at tide gauges, a gap remains in understanding higher frequency variability, which provides a significant proportion of total variability in the coastal region. The Northwest Atlantic, an area including the U.S. East coast and Atlantic Canada, is a known hotspot of sea level rise and shows spatial differences in lower frequency variability along the shelf. However, the higher frequency variability is rarely explored, despite being at least partly captured by the observation systems.

In this study, we evaluated the sea level variability across the sub-annual timescales on the shelf of the Northwest Atlantic and linked it to the local and far-field ocean dynamics. The drivers of sea level variability include both wind-driven and buoyancy-driven circulation. We used high-frequency tide gauge records, eddy-resolving high-resolution (1/12°) ocean reanalysis, and high-precision synthetic aperture radar (SAR) altimeter along-track data to obtain sea level anomalies for the analysis. We evaluated the coherence of sea level signal for all sources and with the drivers of ocean circulation.

How to cite: Abele, A., Royston, S., and Bamber, J.: Sea level variability across the Northwest Atlantic shelf, EGU General Assembly 2023, Vienna, Austria, 23–28 Apr 2023, EGU23-4176, https://doi.org/10.5194/egusphere-egu23-4176, 2023.

EGU23-4834 | ECS | Orals | CL4.5 | Highlight

The Timing of Decreasing Coastal Flood Protection Due to Sea-Level Rise 

Tim Hermans, Victor Malagón-Santos, Caroline Katsman, Robert Jane, Dj Rasmussen, Marjolijn Haasnoot, Gregory Garner, Robert Kopp, Michael Oppenheimer, and Aimée Slangen

Sea-level rise (SLR) amplifies the frequency of extreme sea levels as it raises their baseline height. Projections of the frequency amplification of extremes are often computed for arbitrary future years and relative to the historical centennial event, which is not necessarily meaningful locally. Consequently, such projections may not provide salient information to adaptation planners, as they do not indicate when certain flood risk thresholds will be crossed given the current degree of local coastal flood protection.

To better support adaptation planning, we introduce a framework that extends the emerging timing perspective on sea-level rise to the frequency amplification of extreme sea levels. Moreover, by relating amplification factors to local flood protection standards estimated with the FLOPROS modelling approach, we project the timing of decreases in the local degree of protection. The sea-level rise required for such decreases is derived from extreme sea-level distributions inferred from GESLA3 observations and combined with the relative sea-level projections of the Sixth Assessment Report of the IPCC until 2150 to compute the timing of these decreases at tide gauges globally.

Our central estimates indicate that the estimated degrees of protection will be exceeded 10 times as frequently within the next 30 years (the lead time that large adaptation measures may take) at 26 & 32% of the tide gauges considered, and annually at 4 & 8%, for respectively a low & high emissions scenario (SSP1-2.6 & SSP3-7.0). Even though our results are based on estimated degrees of protection, they highlight that at several locations substantial decreases in the degree of protection may occur before large adaptation measures can be completed. Furthermore, we find that under SSP3-7.0, the same decreases in the degree of coastal protection will occur substantially faster in the future as sea-level rise accelerates. Our projection framework adds a new perspective on the frequency amplifications of extremes that may help adaptation planners to assess the available lead time and useful lifetime of protective infrastructure, given unacceptable decreases in the degree of coastal protection.

How to cite: Hermans, T., Malagón-Santos, V., Katsman, C., Jane, R., Rasmussen, D., Haasnoot, M., Garner, G., Kopp, R., Oppenheimer, M., and Slangen, A.: The Timing of Decreasing Coastal Flood Protection Due to Sea-Level Rise, EGU General Assembly 2023, Vienna, Austria, 23–28 Apr 2023, EGU23-4834, https://doi.org/10.5194/egusphere-egu23-4834, 2023.

EGU23-5189 | Orals | CL4.5

The drivers of decadal fluctuation in the global mean sea level rise 

Hyeonsoo Cha, Jae-Hong Moon, Taekyun Kim, and Y. Tony Song

Recent advances in satellite and in-situ measurements have enabled the monitoring of GMSL budget components and provided insights into ocean effects on the Earth’s energy imbalance and hydrology. The global mean sea level rise slowed over the 2000s, which coincides with a global warming hiatus period, but has accelerated again since 2011. This decadal fluctuation in GMSL rise can be attributed to climate-related fluctuation in ocean heat and mass change. Sea level and Earth’s energy budget results demonstrate that the decadal climate variability has resulted in ocean mass loss and decreased ocean heat uptake, slowing the GMSL rise rate during the 2000s. After ~2011, the climate-driven fluctuations of ocean mass, heat, and GMSL rise rate were reversed. This result highlights the importance of natural variability in understanding the ongoing sea-level rise.

How to cite: Cha, H., Moon, J.-H., Kim, T., and Song, Y. T.: The drivers of decadal fluctuation in the global mean sea level rise, EGU General Assembly 2023, Vienna, Austria, 23–28 Apr 2023, EGU23-5189, https://doi.org/10.5194/egusphere-egu23-5189, 2023.

EGU23-5341 | ECS | Posters on site | CL4.5

Coherent modes of coastal sea level variability from altimetry and tide gauge observations 

Julius Oelsmann, Francisco M. Calafat, Marcello Passaro, Chris Piecuch, Kristin Richter, Anthony Wise, Felix Landerer, Caroline Katsman, Chris Hughes, and Svetlana Jevrejeva

Sea level dynamics in the coastal zone can differ significantly from that in the open ocean. The presence of the continental slope, shallow waters and the coastlines give rise to a variety of processes that mediate the response of coastal sea level to open-ocean changes and produce distinct spatiotemporal sea level patterns. Yet how exactly this interplay occurs and, more importantly, the extent to what coastal sea level variations differ from open-ocean variability remain poorly understood. In this work, we use coastal altimetry observations in combination with tide gauge data to determine patterns of coherent coastal sea level variations and the degree of decoupling between such variations and open-ocean changes.

In a first step, we apply Bayesian mixture models to identify clusters of correlated tide gauge observations that explain a significant fraction of the coastal sea level variability. Using altimetry data, we find high regional coherency of along-shore coastal sea level variations, indicating common underlying mechanisms that cause these correlations.

In light of previous research, we confirm that the correlation structures of these coherent patterns are often confined to the continental slopes, particularly in extratropical regions. In regions like the northeastern US continental shelf, correlations decrease with increasing water depth, indicating a decoupling of shelf sea and open-ocean variability. We investigate how these differences between coastal and open ocean sea level variations change as a function of time scale, i.e., from monthly or interannual variations to long-term trends, and validate these results against tide gauge observations. We derive across-shore correlation length scales that provide insights into the space scales of coastal sea level dynamics and are useful to understand how well gridded products can resolve such processes.

We discuss possible causes of the coherent sea level fluctuations, such as wind forcing, coastally trapped waves, and large scale climate modes. The results motivate further research to better understand the driving mechanisms behind these coherent sea level variations, as well as the pathways linking remote forcing to coastal changes.

How to cite: Oelsmann, J., Calafat, F. M., Passaro, M., Piecuch, C., Richter, K., Wise, A., Landerer, F., Katsman, C., Hughes, C., and Jevrejeva, S.: Coherent modes of coastal sea level variability from altimetry and tide gauge observations, EGU General Assembly 2023, Vienna, Austria, 23–28 Apr 2023, EGU23-5341, https://doi.org/10.5194/egusphere-egu23-5341, 2023.

EGU23-6990 | ECS | Orals | CL4.5

Removing Internal Variability as a Means of Improving Regional Emulation of Ocean Dynamic Sea-Level Change 

Víctor Malagón-Santos, Aimée B.A. Slangen, Tim H.J. Hermans, Sönke Dangendorf, Marta Marcos, and Nicola Maher

Regional emulation tools based on statistical relationships, such as pattern scaling, provide a computationally inexpensive way of projecting ocean dynamic sea-level change for a broad range of climate change scenarios. Such approaches usually require a careful selection of one or more predictor variables of climate change so that the statistical model is properly optimized. Even when appropriate predictors have been selected, spatiotemporal oscillations driven by internal climate variability can be a large source of model disagreement. Using pattern recognition techniques that exploit spatial covariance information can effectively reduce internal variability in simulations of ocean dynamic sea level, significantly reducing random errors in regional emulation tools. Here, we test two pattern recognition methods based on Empirical Orthogonal Functions (EOF), namely signal-to-noise maximising EOF pattern filtering and low-frequency component analysis, for their ability to reduce errors in pattern scaling of ocean dynamic sea-level change. These two methods are applied to an initial-condition large ensemble (MPI-GE), so that its externally forced signal is optimally characterized. We show that pattern filtering provides an efficient way of reducing errors compared to other conventional approaches such as a simple ensemble average. For instance, filtering only two realizations by characterising their common response to external forcing reduces the random error by almost 60%, a reduction level that is only achieved by averaging at least 12 realizations. We further investigate the applicability of both methods to single realization modelling experiments, including four CMIP5 simulations for comparison with previous regional emulation analyses. Pattern scaling leads to a varying degree of error reduction depending on the model and scenario, ranging from more than 20% to about 70% reduction in global-mean mean-squared error compared with unfiltered simulations. Our results highlight the relevance of pattern recognition methods as a means of reducing errors in regional emulation tools of ocean dynamic sea-level change, especially when one or a few realizations are available.

How to cite: Malagón-Santos, V., Slangen, A. B. A., Hermans, T. H. J., Dangendorf, S., Marcos, M., and Maher, N.: Removing Internal Variability as a Means of Improving Regional Emulation of Ocean Dynamic Sea-Level Change, EGU General Assembly 2023, Vienna, Austria, 23–28 Apr 2023, EGU23-6990, https://doi.org/10.5194/egusphere-egu23-6990, 2023.

EGU23-7227 | Orals | CL4.5 | Highlight

Contribution of subsidence on relative sea level in Europe 

Rémi Thiéblemont, Gonéri Le Cozannet, Daniel Raucoules, Jérémy Rohmer, Guy Wöppelmann, Floris Calkoen, and Robert J. Nicholls

While the understanding and modelling of relative sea level rise (SLR) due to ocean density and mass changes have greatly improved over the past few decades, SLR contributions due to vertical ground motions (VGMs) remain a major source of uncertainty. Here, VGMs relate to ground motions that have imprints of a few kilometers, as opposed to broad scale land motion such as Glacial Isostatic Adjustment (GIA). VGMs are caused by processes such as natural resource extraction or the load of anthropogenic infrastructure on recent sediment deposits or natural processes (e.g. sismotectonics, volcanism, landslide), all of which vary in space and time, and can strongly inflate SLR locally.

Here, we present a pan-European analysis of relative sea-level changes in Europe considering VGMs based on trends retrieved from the European Ground Motion Service (EGMS). EGMS allows identifying hot spots of robust subsidence along the European coastline such as the north Adriatic coast in Italy, areas such as Palavas (France), Groningen (Netherlands) and many coastal infrastructures such as dikes in La Rochelle (France) where subsidence was not documented earlier. Hence the service delineates where subsidence can have a significant impact to relative sea-level changes in coastal areas. This satisfies a major need from coastal adaptation stakeholders concerned with SLR. EGMS results are complemented and compared with VGMs estimates from permanent Global Navigation Satellite System (GNSS) network stations. The precision of the measurements is discussed: VGMs from GNSS stations derived from 4 different solutions (ULR, NGL, JPL and GFZ) allow accounting for uncertainty in trends estimation techniques. We estimate VGMs residual trends after removing the effect of the GIA from geophysical modelling, but also the effect of contemporary mass redistribution on solid Earth deformation. The results from both GNSS and EGMS suggest that the precision of ground motion velocities can be in the order of a millimetre per year.

Overall, these estimates and their uncertainty can be used to produce a new coastal pan-European relative sea-level set of projections that respond to one major user need, namely the identification of areas where sea level rise is amplified by subsidence. However two other user needs remain unachieved: the local attribution of observed sea-level changes to components with a submillimetric per year accuracy and a quantified projection of subsidence, which would at least require subsidence models.    

How to cite: Thiéblemont, R., Le Cozannet, G., Raucoules, D., Rohmer, J., Wöppelmann, G., Calkoen, F., and Nicholls, R. J.: Contribution of subsidence on relative sea level in Europe, EGU General Assembly 2023, Vienna, Austria, 23–28 Apr 2023, EGU23-7227, https://doi.org/10.5194/egusphere-egu23-7227, 2023.

EGU23-7585 | Posters on site | CL4.5

Assessing sea-level change of the last 300 years using tide gauge and proxy records 

Fiona D. Hibbert, Marta Marcos, Andrew Valentine, Ed Garrett, and W. Roland Gehrels

Detailed sea-level budgets are now available for the 20th and 21st centuries, but separating the differing contributions of sea-level rise prior to 1900 remains difficult, in part due to additional temporal and vertical uncertainties associated with proxy records, and the spatially variable nature of driving processes.

We present tide gauge and proxy reconstructions of sea level since 1700, and analyse their structure using Gaussian process modelling which allows for continuous reconstructions with fully quantified uncertainties. This enables the timing of accelerations, magnitude and rates of change to be determined, and in turn enables site-specific sea-level budgets to be derived. The contribution of different driving mechanisms (e.g., glacio-isostatic adjustment and sterodynamic changes) for each site is assessed, and the evolution of the barystatic contribution for the last 300 years is evaluated.

How to cite: Hibbert, F. D., Marcos, M., Valentine, A., Garrett, E., and Gehrels, W. R.: Assessing sea-level change of the last 300 years using tide gauge and proxy records, EGU General Assembly 2023, Vienna, Austria, 23–28 Apr 2023, EGU23-7585, https://doi.org/10.5194/egusphere-egu23-7585, 2023.

EGU23-8047 | ECS | Posters on site | CL4.5

Monthly sea level fingerprints from 1992-2017, utilising ESA CCI Essential Climate Variables in an ensemble modelling framework 

Stephen Chuter, Andrew Zammit-Mangion, Jonathan Bamber, and Jérôme Benveniste

Sea level rise is one of the greatest socio-economic impacts of climate change in the 21st Century. Whilst global mean sea level is an essential climate variable (ECV) for assessing the integrated response of the Earth system to climate change, regional sea level variability is of primary concern for policy-making decisions and the development of adaptation strategies in coastal localities. Redistribution of terrestrial mass, in the form of hydrological and land ice mass fluxes, partly drives this regional sea level variability due to its impact on the Earth’s gravity, rotation and deformation (GRD), termed ‘Sea Level Fingerprints’ or Barystatic-GRD fingerprints. With increasing mass losses projected from ice sheets and glaciers over the coming centuries, the magnitude and relative contribution of these Barystatic-GRD fingerprints to regional sea level change are expected to increase. As a result, accurately quantifying this phenomenon and its uncertainty is critical when assessing contemporary and future regional sea level variability.

Current contemporary Barystatic-GRD fingerprints are typically either calculated using a single mass loading observation source or provide discontinuous coverage since 1992 (the satellite altimetry era). Here, we present a continuous monthly Barystatic-GRD fingerprint product from 1992-2017, computed from an ensemble of mass loadings derived from differing observation techniques. To achieve this, we use the Ice Sheet and Sea Level Model (ISSM) sea level equation solver, which uses a finite element approach to solving the sea level equation at high spatial-temporal resolution, whilst maintaining computational efficiency. This enables us to use an ensemble modelling framework, ensuring the computed Barystatic-GRD fingerprint encompasses the variability between differing observation techniques. Additionally, it allows us to propagate the observation uncertainties into the fingerprint uncertainty in a robust manner. As well as the total Barystatic-GRD fingerprint, we assess the contribution of individual terrestrial components (Antarctica, Greenland, Glaciers, and hydrological mass change). This work is part of the Fingerprinting Approach to Close Regional Sea Level Budgets using ESA-CCI (FACTORS), a European Space Agency Climate Change Initiative Research Fellowship.

How to cite: Chuter, S., Zammit-Mangion, A., Bamber, J., and Benveniste, J.: Monthly sea level fingerprints from 1992-2017, utilising ESA CCI Essential Climate Variables in an ensemble modelling framework, EGU General Assembly 2023, Vienna, Austria, 23–28 Apr 2023, EGU23-8047, https://doi.org/10.5194/egusphere-egu23-8047, 2023.

EGU23-8186 | Orals | CL4.5

Changes in extreme sea levels along the North Atlantic coasts, over the last century 

Lucia Pineau-Guillou, Pascal Lazure, Guy Wöppelmann, Jean-Baptiste Roustan, and Markus Reinert

Extreme sea levels are the joint contribution of mean sea level, tide and storm surges. The ClimEx project investigates changes in tide and storm surges over the last century, along the North Atlantic coasts. Concerning the tide, we investigated the long-term changes of the principal tidal component M2, from 1846 to 2018 (Pineau-Guillou et al., 2021). The M2 variations are consistent at all the stations in the North-East Atlantic. The changes started long before the 20th century and are not linear. Regarding the possible causes of the observed changes, the similarity between the North Atlantic Oscillation and M2 variations in the North-East Atlantic suggests a possible influence of the large-scale atmospheric circulation on the tide. A possible underlying mechanism is discussed. Concerning the storm surges, we found a clear shift in the storm surge season at Brest (France), between 1950 and 2000 (Reinert et al., 2021). Extreme storm surge events occurred three weeks earlier (mid-December instead of beginning of January) in the winter 2000 than in the 1950s. Analysis of additional stations in Europe reveals a large-scale process (Roustan et al., 2022). Temporal shifts are positive (later events) in northern Europe, and negative (earlier events) in southern Europe. Such a tendency is similar to the one already reported for European river floods between 1960 and 2010 (Blöschl et al., 2017).


References

[1] Pineau-Guillou L., Lazure P. and Wöppelmann G. (2021). Large-scale changes of the semidiurnal tide along North Atlantic coasts from 1846 to 2018. Ocean Sci., 17, 17–34. https://doi.org/10.5194/os-17-17-2021

[2] Reinert M., Pineau-Guillou L., Raillard N., Chapron B. (2021). Seasonal shift in storm surges at Brest revealed by extreme value analysis. J. Geophys. Res. Oceans, 126, e2021JC017794. https://doi.org/10.1029/2021JC017794

[3] Roustan J.-B., Pineau-Guillou L., Chapron B., Raillard N., Reinert M. (2022). Shift of the storm surge season in Europe due to climate variability. Sci. Rep., 12, 8210. https://doi.org/10.1038/s41598-022-12356-5

[4] Blöschl G., Hall J., Parajka J., Perdigão R. A. P., Merz B., Arheimer B. et al. (2017). Changing climate shifts timing of European floods. Science, 357(6351), 588–590. https://doi.org/10.1126/science.aan2506

How to cite: Pineau-Guillou, L., Lazure, P., Wöppelmann, G., Roustan, J.-B., and Reinert, M.: Changes in extreme sea levels along the North Atlantic coasts, over the last century, EGU General Assembly 2023, Vienna, Austria, 23–28 Apr 2023, EGU23-8186, https://doi.org/10.5194/egusphere-egu23-8186, 2023.

EGU23-9023 | ECS | Posters on site | CL4.5

Enhancing projections of sea-level rise with changing seasonality 

Daisy Lee-Browne, Luke Jackson, Pippa Whitehouse, and Sophie Williams

There is evidence to show that anthropogenically-driven climate change will alter large-scale atmospheric circulation in the future. However, limited research has been conducted to explore how these atmospheric changes will impact seasonal sea-level change. The majority of global to local sea-level projections are made on multi-annual timescales, meaning important sub-annual changes in sea level driven by climatic oscillations are not being accounted for. Sea level on the Northwestern European Shelf (NWES) has been shown to vary in response to fluctuations in the North Atlantic Oscillation (NAO). We examine how seasonal sea level may change on the NWES in response to changes in the NAO in the near future (2023-2053). The work uses a statistical approach that incorporates the inverse barometer effect to produce projections of seasonal sea-level change. The main objectives include quantifying the sensitivity of sea level to the NAO over the 20th century using tide gauge and satellite altimetry data in combination with historical records of the NAO index. Projections of mean sea-level change are then updated to account for seasonal variability that may occur on the NWES using CMIP5 and CMIP6 model outputs of sea-level change and the NAO for the period 2023-2053. The research aims to improve understanding of short-term drivers of future sea-level change and explore the ability of a statistical method to accurately detect and project seasonal patterns.

How to cite: Lee-Browne, D., Jackson, L., Whitehouse, P., and Williams, S.: Enhancing projections of sea-level rise with changing seasonality, EGU General Assembly 2023, Vienna, Austria, 23–28 Apr 2023, EGU23-9023, https://doi.org/10.5194/egusphere-egu23-9023, 2023.

EGU23-9181 | ECS | Posters on site | CL4.5

Understanding Regional Sea Level Rise Acceleration Along the North American Eastern Seaboard 

Victoria Schoenwald and Ben Kirtman

The East Coast of North America has experienced rates of sea level rise (SLR) five times larger than the global average. This steep increase in SLR contributed to a higher frequency of coastal flooding events along the southeastern seaboard and the worst nuisance flooding event in Miami, FL during the last 20 years. Using tide gauge data from several stations, empirical mode decomposition (EMD) was used to understand sea level variability along the East Coast of the U.S., and its connectivity to atmospheric and oceanic circulation and thermosteric effects. This is a unique approach in identifying the “in phase” sea level variability and how it relates to the atmosphere and the ocean on varying timescales. The EMD modes were also used to understand the “out of phase” components of sea level variability such as the “hot spot” of SLR between Cape Hatteras, NC and Key West, FL where sea levels increased at rates of 25.5mm/year compared to a global average of 4.5 mm/year. Similar techniques were then applied to climate model simulations using sea surface height at coastal locations as proxies for the tide gauge data. The EMD approach was applied at both ocean eddy parameterized and ocean eddy resolving scales. The goal was to determine if the natural variability in the models have similar characteristics to the observational estimates. And, to assess whether the modes associated with the trend in observations have appropriate analogues to the model simulations. By comparing pre-industrial simulations with historical simulations, we will be assessing whether a changing climate affects the natural variability.

How to cite: Schoenwald, V. and Kirtman, B.: Understanding Regional Sea Level Rise Acceleration Along the North American Eastern Seaboard, EGU General Assembly 2023, Vienna, Austria, 23–28 Apr 2023, EGU23-9181, https://doi.org/10.5194/egusphere-egu23-9181, 2023.

EGU23-9831 | Orals | CL4.5 | Highlight

Unraveling Regional Patterns of Sea Level Change over the Altimeter Era 

R. Steven Nerem, Kristopher Karnauskas, John Fasullo, and Benjamin Hamlington

Satellite altimeters have measured the global mean and regional patterns of sea level change since 1993 with impressive detail and precision. While the global mean rate of sea level rise has been studied extensively and is readily linked to global water budgets, the regional patterns (or deviations from the global mean) are subject to diverse physical mechanisms that span the gauntlet of internal climate dynamics, and models suggest a nuanced relationship to radiative forcing (greenhouse gases, aerosols, etc.). To date, little attempt has been made to synthesize the regional patterns of sea level change across the global ocean with a common diagnostic framework. Here we combine oceanic and atmospheric observations and leverage ensembles of a state-of-the-art global climate model to unravel the mechanisms governing the basin-scale patterns of sea level change around the world ocean. By applying some bedrock principles of physical oceanography and coupled dynamics, we find a leading role for wind forcing—Ekman and Sverdrup dynamics together yield faithful reproductions of the large-scale structure of sea level change from the tropics to the midlatitudes. We argue that the global pattern of sea level rise since 1993 is set, to leading order, by changes in the wind-driven ocean circulation and their influence on sea surface height via ocean heat divergence. Importantly, wind-driven needn’t be synonymous with internal variability—indeed, much of the observed global pattern is recovered by global climate models subject to historical anthropogenic forcings, and single-forcing experiments enable further insight into which forcings are responsible for which regional phenomena. As we move forward into the uncertain future, a better understanding of the causes of regional rates of sea level rise, including distinguishing which features are driven by human activities versus modes of natural variability—or both, is critical for the successful adaptation of humanity and its infrastructure to a rapidly changing climate.

How to cite: Nerem, R. S., Karnauskas, K., Fasullo, J., and Hamlington, B.: Unraveling Regional Patterns of Sea Level Change over the Altimeter Era, EGU General Assembly 2023, Vienna, Austria, 23–28 Apr 2023, EGU23-9831, https://doi.org/10.5194/egusphere-egu23-9831, 2023.

EGU23-10492 | ECS | Posters on site | CL4.5

Projection of local sea-level rise under CMIP6 scenarios (SSP1-2.6, SSP5-8.5) in the Northwestern Pacific marginal seas using dynamical downscaling.  

Yu-Kyeong Kang, Yang-Ki Cho, Yong-Yub Kim, Bong-Kwan Kim, Gwang-Ho Seo, Seok-Jae Kwon, and Hyun-Ju Oh

The global mean sea level has been rising with an acceleration since the twentieth century. Sea level rise is not spatially uniform but shows large regional variation. Local sea level can change due to various physical processes like changes in ocean circulation, atmospheric pressure, and mass redistribution. Projections of global sea level changes are available from the Coupled Model Intercomparison Project Phase 6 (CMIP6) database. However, Global climate models (GCMs) are limited in simulating spatially non-uniform sea level rise in marginal seas due to their coarse resolution and the absence of rivers and tides. High-resolution regional ocean climate models (RCMs) that consider tides and rivers were used to address these limitations in the Northwestern Pacific (NWP) marginal seas through dynamical downscaling. Four GCMs were selected for dynamical downscaling based on a performance evaluation of SST and the SSH along the RCM boundaries. A regional model with high resolution (1/20°) was simulated to project spatially non-uniform changes in the sea level under two CMIP6 scenarios (SSP1-2.6 and SSP5-8.5) from 2015 to 2100. Sea level rise in the NWP marginal seas was ~82 cm under SSP5-8.5 scenario and ~47 cm under SSP1-2.6 scenario, respectively. Under both scenarios, the predicted local sea-level rise was higher in the East/Japan Sea (EJS), where the currents and eddy motions are active, than in the Yellow and East China Seas.


How to cite: Kang, Y.-K., Cho, Y.-K., Kim, Y.-Y., Kim, B.-K., Seo, G.-H., Kwon, S.-J., and Oh, H.-J.: Projection of local sea-level rise under CMIP6 scenarios (SSP1-2.6, SSP5-8.5) in the Northwestern Pacific marginal seas using dynamical downscaling. , EGU General Assembly 2023, Vienna, Austria, 23–28 Apr 2023, EGU23-10492, https://doi.org/10.5194/egusphere-egu23-10492, 2023.

EGU23-10639 | ECS | Orals | CL4.5

Updating sea-level reconstruction since 1900 

Jinping Wang, John Church Church, Xuebin Zhang, and Xianyao Chen

Sea-level rise integrates the responses of several components (ocean thermal expansion, mass loss from glaciers and ice sheets, terrestrial water storage). Before the satellite era, global sea-level reconstructions depend on tide-gauge records and ocean observations. However, the available global mean sea level (GMSL) reconstructions using different methods indicate a spread in sea-level trend over 1900-2008 (1.3~2.0 mm yr-1). With the improved understanding of the causes of sea-level change, here we update the original Church and White (2011) reconstruction by using the latest observations, taking the time-evolving sea-level fingerprint, sterodynamic sea level (SDSL) climate change pattern and local vertical land motion (VLM) into account. The updated trend of GMSL of 1.6 ± 0.2 mm yr-1 (90% confidence level) over 1900-2019 is consistent with the sum of contributions of 1.5 ± 0.2 mm yr-1, slightly lower than 1.8 ± 0.2 mm yr-1 from original reconstruction. The lower trend from the updated reconstruction is mainly due to including residual VLM correction. The trends at tide gauge locations from updated reconstruction agree better with the tide gauge observations, with comparable mean trend of 1.7 mm yr-1 (standard deviation; STD of 2.0 mm yr-1) from observation and 1.7 mm yr-1 (STD of 1.2 mm yr-1) from the updated reconstruction. The inclusion of sea-level fingerprint and SDSL climate change pattern are the dominant contributors for improved reconstruction skill on regional scales at tide gauge locations. This update leads to GMSL solution that are consistent with other reconstructions in terms of long-term trend and 30-year running rate.

How to cite: Wang, J., Church, J. C., Zhang, X., and Chen, X.: Updating sea-level reconstruction since 1900, EGU General Assembly 2023, Vienna, Austria, 23–28 Apr 2023, EGU23-10639, https://doi.org/10.5194/egusphere-egu23-10639, 2023.

EGU23-10695 | Orals | CL4.5

Causal Mechanisms of Sea Level Variations along the U.S. West Coast 

Ian Fenty, Ou Wang, and Ichiro Fukumori

Tide-gauge records along the U.S. West Coast since the mid-1920’s show large ENSO-correlated sea-level variability and a below-average linear trend relative to the global mean over the past three decades. On weekly and longer timescales, sea-level variations in the region are primarily steric, reflecting variations in coastal ocean temperatures rather than that of mass. Previous research into sea-level variability in the region identified coastally-trapped waves forced by nonlocal winds as the main source of long-lasting sea-level variability. Here we offer a rigorous quantification of the contributions of wind-stress and buoyancy forcing anomalies across the entire Pacific Basin on the U.S. West Coast Sea level using a global data-constrained ocean and sea-ice model of the Estimating the Circulation and Climate of the Ocean (ECCO) consortium. Causal relationships are quantified using the model’s adjoint and mechanisms are elucidated via perturbation experiments.

By convolving the adjoint sensitivities with atmosphere forcing anomalies we find that long-term (>1 week) sea level variations along the U.S. West Coast are almost entirely due to wind-stress anomalies while buoyancy anomalies, in contrast, contribute virtually nothing. Interestingly, the wind stress anomalies that contribute to sea level variations in the region come from two sectors: i) a coastally-confined region from 0-45N and ii) and the open-ocean Pacific equatorial waveguide (roughly -/+ 10 degrees latitude). Wind stress anomalies in the coastally-confined sector induce coastally-trapped waves which propagate poleward, depress the thermocline, reduce upwelling/air-sea heat loss and, thereby, lead to positive ocean temperature / steric height anomalies. Zonal wind stress anomalies in the equatorial waveguide induce eastward-propagating equatorial Kelvin waves, some energy of which is converted to coastally-trapped waves upon reaching continent, which lead to positive steric height anomalies following the same causal chain.

This study highlights the benefits of applying the complimentary tools of adjoint-based convolution and perturbation experiments to explain the origin of regional sea-level anomalies.

How to cite: Fenty, I., Wang, O., and Fukumori, I.: Causal Mechanisms of Sea Level Variations along the U.S. West Coast, EGU General Assembly 2023, Vienna, Austria, 23–28 Apr 2023, EGU23-10695, https://doi.org/10.5194/egusphere-egu23-10695, 2023.

EGU23-10796 | Posters on site | CL4.5 | Highlight

A worst case extreme sea levels along the global coastline by 2100 

Svetlana Jevrejeva, Joanne Williams, Michalis Vousdoukas, and Luke Jackson

We calculate the magnitude of a worst case scenario for extreme sea levels along the global coastline by 2100. Our worst case scenario for extreme sea levels is a combination of sea surface height associated with storm surge and wave (100-year return period, the 95th percentile), high tide (the 95th percentile) and a low probability sea level rise scenario (the 95th percentile). We show that by 2100 extreme sea levels have a 5% change of exceeding 4.2 m (global coastal average), compared to 2.6 m during the baseline period (1980-2014). Up to 90% of increases in magnitude of extreme sea levels are driven by future sea level rise, compare to 10% associated with changes in storm surges and waves. By 2030-2040 the present-day 100-year return period for extreme sea levels would be experienced at least once a year in tropical areas. This 100-fold increase in frequency will take place on all global coastlines by 2100. Future changes in magnitude and frequency of extreme sea levels undermine the resilience of coastal communities and ecosystems, considering that sea level rise will increase the magnitude, frequency of extreme sea levels and will reduce the time for post-event recovery.


How to cite: Jevrejeva, S., Williams, J., Vousdoukas, M., and Jackson, L.: A worst case extreme sea levels along the global coastline by 2100, EGU General Assembly 2023, Vienna, Austria, 23–28 Apr 2023, EGU23-10796, https://doi.org/10.5194/egusphere-egu23-10796, 2023.

EGU23-11788 | Orals | CL4.5

Constraining ocean dynamic sea level projections along the coast of the Netherlands 

Dewi Le Bars, Iris Keizer, Franka Jesse, and Sybren Drijfhout

Ocean dynamic sea level (ODSL) is the local height of the sea surface above the geoid. It is computed by atmosphere-ocean coupled general circulation models from the coupled model intercomparison projects (CMIP). In many places it is one of the most important components of sea level projections for the coming century. However, because it depends on climate dynamics, there is a low agreement between climate models. Moreover, the difficulty to estimate ODSL from observations has resulted in IPCC AR5 and AR6 sea level projections using CMIP5 and CMIP6 outputs without model selection nor bias correction.


We use multiple lines of evidence to constrain ODSL along the coast of the Netherlands: ocean reanalyzes, sea-level budget closure using tide gauges and satellite altimetry observations, and direct integration of steric sea level change from observed temperature and salinity together with an estimation of wind influence on sea level.


We find that CMIP6 overestimates ODSL change along the Dutch coast and that this overestimation is not only related to the overestimation of global mean temperature increase. Based on the emergent constraint framework, we provide improved ODSL projections with reduced uncertainty and an increased level of confidence.

How to cite: Le Bars, D., Keizer, I., Jesse, F., and Drijfhout, S.: Constraining ocean dynamic sea level projections along the coast of the Netherlands, EGU General Assembly 2023, Vienna, Austria, 23–28 Apr 2023, EGU23-11788, https://doi.org/10.5194/egusphere-egu23-11788, 2023.

EGU23-11825 | ECS | Posters on site | CL4.5

Characterization of changes in extreme storm surges along the North Atlantic coasts, since 1850 

Julie Cheynel, Lucia Pineau-Guillou, and Pascal Lazure

Severe storms that hit the North Atlantic coasts over the last decades, such as Xynthia storm in Europe, showed the vulnerability of coastal populations to extreme sea levels. There is a need to quantify the changes in extreme sea levels, to enable the implementation of appropriate coastal adaptation measures. Extreme sea levels are the joint contribution of mean sea level, tide and storm surges. Several authors investigated changes in storm surges. Storm surges display strong interannual and multidecadal variability, but no clear long-term trends at most sites globally (Mawdsley and Haigh, 2016; Marcos and Woodworth, 2017). The objective of the present study is to characterize changes in extreme storm surges along the North Atlantic coasts, since 1850. We selected long-term tide gauges with at least 100 years of data, from GESLA-3 dataset (Haigh et al., 2022). This conducted to consider around 30 tide gauges along the U.S. and European coasts. Extreme storm surges were evaluated yearly, using different approaches: (1) the maximum value over a period (e.g. annual maximum), the n-th percentile (e.g. 99th percentile) and (3) the return level associated to a return period (e.g. 1 year return level); this last value is obtained by fitting a Generalized Extreme Value distribution on data. At each station, we characterized changes in extreme storm surges over the last century. We compared the different approaches. We estimated long-term trends and analyzed storm surge variability in link with large-scale atmospheric forcing (e.g. North Atlantic Oscillation index). Regions of similar variations were also identified. These results are a first step towards the understanding of the physical causes behind the observed changes of extreme storm surges in the North Atlantic.


References

[1] Marcos, M. & Woodworth, P. L (2017). Spatiotemporal changes in extreme sea levels along the coast of the North Atlantic and the Gulf of Mexico. J. Geophys. Res. Oceans 122, 7031–7048. https://doi.org/10.1002/2017JC013065

[2] Mawdsley R. J. and Haigh I. D. (2016). Spatial and Temporal Variability and Long-Term Trends in Skew Surges Globally. Front. Mar. Sci. 3:29. https://doi.org/10.3389/fmars.2016.00029

[3] Haigh I. D., Marcos M., Talke S. A., Woodworth P. L., Hunter J. R., Hague B. S., et al. (2022). GESLA Version 3: A major update to the global higher-frequency sea-level dataset. Geosci. Data J., 00, 1–22. https://doi.org/10.1002/gdj3.174


How to cite: Cheynel, J., Pineau-Guillou, L., and Lazure, P.: Characterization of changes in extreme storm surges along the North Atlantic coasts, since 1850, EGU General Assembly 2023, Vienna, Austria, 23–28 Apr 2023, EGU23-11825, https://doi.org/10.5194/egusphere-egu23-11825, 2023.

EGU23-12782 | Orals | CL4.5

Sources and sinks of interannual steric sea level variability 

Antoine Hochet, William Llovel, Florian Sévellec, and Thierry Huck


It is now well established that sea level rise is not uniform and presents large deviations from its global mean trend. 
Indeed, some regions such as the western Pacific ocean or the Indian ocean experience a linear rise 3 times larger than the global mean sea level trend since 1993 (Cazenave and Llovel, 2010; Llovel and Lee, 2015).
Superimposed to the long-term trend, the interannual variability may enhance or reduce sea level change over a shorter time period (few months). It is well known that these variations are linked to the interannual variability of the steric sea level driven by natural modes of climate variability such as El Nino Southern Oscillation (in the tropical Pacific ocean) and the Indian Ocean Dipole (in the north Indian ocean, Llovel et al., 2010). Therefore, investigating the mechanisms of interannual variability of steric sea level appears to be highly relevant for understanding processes at play in regional sea level variability. 

In this work, we investigate the local sources and sinks of interannual steric sea level variability using the ECCOv4 (Estimating the Circulation and Climate of the Ocean, Forget et al., 2015) state estimate over 1993-2014. We find that the variability is, in almost all regions, sustained by interannual fluctuating winds via Ekman transport and damped by both interannual variations of the net heat flux from the atmosphere and by the rectification effect of subannual oceanic circulation. 

This method allows not only the identification of the physical process at play in the interannual steric sea level variability, but also if the latter is a source or a sink of the interannual steric sea level variability. This method presents evident advantages especially to assess the reliability of coupled climate models used to predict future sea level changes.

How to cite: Hochet, A., Llovel, W., Sévellec, F., and Huck, T.: Sources and sinks of interannual steric sea level variability, EGU General Assembly 2023, Vienna, Austria, 23–28 Apr 2023, EGU23-12782, https://doi.org/10.5194/egusphere-egu23-12782, 2023.

EGU23-14558 | Posters on site | CL4.5

Observation-Consistent Nonlinear Ice Melt Contribution to Sea Level Rise and its Implications for Sea-Level Projections 

Sandy Avrutin, Philip Goodwin, Ivan D Haigh, and Robert Nicholls

Sea level rise is a major result of climate change that threatens coastal communities and has the potential to incur significant economic damage. Projecting sea level rise as temperatures rise is therefore crucial for policy and decision-making.

The two modelling methods currently used to project future sea level change are process-based and semi-empirical. Process-based models rely on combining outputs from coupled atmosphere/ocean models for each component of sea level rise. Semi-empirical models calculate sea level as an integrated response to either warming or radiative forcing, using parameters constrained from past observations.

Historically, there is disagreement in sea-level projections between different modelling methods. One source of the discrepancies is uncertainty in land ice response to warming; although nonlinearities exist within processes affecting this response, most existing semi-empirical models treat the relationship between warming and ice-melt as linear.

Non-linear ice melt processes may have not yet affected the observational record (such as tipping points as future warming crosses some threshold) or may have already occurred (such as non-linear effects that apply across all levels of warming, or for which the threshold has already been passed). Here, we examine the effect on semi-empirical projections of sea level rise of nonlinearities in ice melt that have already affected the observed sea level record, by adding a nonlinear term to the relationship between warming and the rate of sea level rise within a large ensemble of historically constrained efficient earth systems model simulations.

Projections reach a median sea level rise of 1.3m by 2300 following SSP245, and 2.6m by 2300 following SSP585. Results suggest that nonlinear interactions can be sub-linear, super-linear or 0, with a mainly symmetrical distribution. This includes high-impact, low-probability super-linear interactions that lead to significantly larger high-end sea level rise projections than when nonlinear interactions are not included. It is key to note that nonlinear interactions that have not yet occurred but that may occur in the future, are not considered – these will lead to an increased projection of sea level rise.

How to cite: Avrutin, S., Goodwin, P., Haigh, I. D., and Nicholls, R.: Observation-Consistent Nonlinear Ice Melt Contribution to Sea Level Rise and its Implications for Sea-Level Projections, EGU General Assembly 2023, Vienna, Austria, 23–28 Apr 2023, EGU23-14558, https://doi.org/10.5194/egusphere-egu23-14558, 2023.

EGU23-15613 | ECS | Orals | CL4.5

Sensitivity of the Antarctic Ice Sheet evolution to different Earth structures using a coupled 3D GIA - ice-sheet model under different future climate scenarios 

Caroline van Calcar, Jorge Bernales, Tijn Berends, Wouter van der Wal, and Roderik van de Wal

The projected decay of the Antarctic Ice Sheet (AIS) over the coming centuries will lead to uplift of the Earth's surface due to Glacial Isostatic Adjustment (GIA). GIA slows down grounding line migration and therefore has a stabilizing effect on the ice sheet evolution. GIA acts on timescales of decades to centennial depending on the magnitude of the mantle viscosity. The mantle viscosity is several orders of magnitude higher in East Antarctica than in West Antarctica and varies with one order of magnitude within West Antarctica. Studies of the AIS evolution over the last glacial cycle have shown that including lateral variations of the Earth's mantle viscosity can lead to 1.5-kilometer thicker ice in West Antarctica at present day. However, current projections do not include GIA, or they use a laterally homogeneous GIA model. One study applied a uniform high mantle viscosity under East Antarctica and a uniform low mantle viscosity under West Antarctica and showed that, on longer timescales of hundreds of years, mass loss projections of Antarctica may be underestimated because spatially uniform GIA models overestimate the stabilizing effect of GIA across East Antarctica. We developed a coupled GIA - ice-sheet model using the ice-sheet model IMAU-ICE, and a 3D GIA finite element model that includes lateral mantle viscosity variations, and a seismic model to determine the patterns of the viscosity. The results of projections for two IPCC scenarios show that including lateral variations in the Earth's mantle viscosity leads to local ice thickness differences of up to 600 meters in West Antarctica  2300. The results underline and quantify the importance of including this local feedback effect in ice-sheet models when projecting the long-term sea level contribution from Antarctica.

How to cite: van Calcar, C., Bernales, J., Berends, T., van der Wal, W., and van de Wal, R.: Sensitivity of the Antarctic Ice Sheet evolution to different Earth structures using a coupled 3D GIA - ice-sheet model under different future climate scenarios, EGU General Assembly 2023, Vienna, Austria, 23–28 Apr 2023, EGU23-15613, https://doi.org/10.5194/egusphere-egu23-15613, 2023.

EGU23-15625 | ECS | Orals | CL4.5

Wind-driven currents and sea-level variability of the northwest European shelf 

Samuel T. Diabaté, Neil J. Fraser, and Gerard D. McCarthy

The shelf northwest of Europe is home to subinertial fluctuations in sea level, whose peak-to-peak amplitude reach several tens of centimetres. These weekly-to-monthly shelf-wide sea-level variations feature at the coast, and therefore understanding their drivers is of prime importance for coastal adaptation. These sea-level changes have been previously hypothesized to reflect the strength of the European slope current (Chafik et al., 2017), a wind and density driven quasi-barotropic circulation lying in the region of the 500 to 1000 m isobaths (Huthnance & Gould, 1989). This interpretation has however not yet been validated by in-situ observations.


Using data from single-point current-meters and acoustic Doppler current profilers moored west of France, Ireland and Scotland, we show that the common mode of northwest European sea-level changes covaries with along-isobath currents on the shelf and on the upper part of the slope (< 400 m of water depth). However, the pattern of variability is different in the slope current and further off-shelf, , with the correlations between shelf sea levels and in-situ currents decreasing moving down-slope (> 400m of water depth).  We discuss whether or not the relationship between European sea levels and shelf and slope currents emerges from momentum balance associated with the slope current existence (joint effect of winds, baroclinicity and bathymetry). We also discuss the relevance for coastal sea levels and associated coastal vulnerability.


Chafik, L., Nilsen, J. E. Ø., & Dangendorf, S. (2017). Impact of North Atlantic teleconnection patterns on Northern European sea level. Journal of Marine Science and Engineering, 5(3), 43.

Huthnance, J. M., & Gould, W. J. (1989). On the northeast Atlantic slope current. In Poleward flows along eastern ocean boundaries (pp. 76-81). Springer, New York, NY.

How to cite: Diabaté, S. T., Fraser, N. J., and McCarthy, G. D.: Wind-driven currents and sea-level variability of the northwest European shelf, EGU General Assembly 2023, Vienna, Austria, 23–28 Apr 2023, EGU23-15625, https://doi.org/10.5194/egusphere-egu23-15625, 2023.

EGU23-15655 | Orals | CL4.5

Towards Physically Consistent Sea Level Rise Storylines for the United Kingdom 

Benjamin Harrison, Matthew Palmer, Lesley Allison, Jonathan Gregory, Tom Howard, Anne Pardaens, and Jonathan Tinker

There is increasing awareness of the need for comprehensive information on potential future sea-level rise to inform adaptation planning and coastal decision-making. The IPCC Sixth Assessment Report (AR6) states that global mean sea level rise approaching 5 m by 2150, and more than 15 m by 2300, cannot be ruled out under high greenhouse gas emissions due to uncertainty in ice sheet processes. Moreover, local sea level rise may be further exacerbated through systematic changes in the climate system, such as a rapid weakening of the Atlantic Meridional Overturning Circulation (AMOC).

We combine the latest United Kingdom national sea-level projections (UKCP18) with recently published projections of Antarctic ice mass loss to develop a small set of physically consistent storylines of local sea-level change that extend to 2300. The storylines span the range of uncertainty assessed by AR6 and deliver continuous sea level rise information around the UK coastline. While we focus on the UK, the methods are generic and can be readily applied to other geographic locations. Further, we consider potential changes in coastal flood hazard associated with a weakening of the AMOC using dynamical downscaling and storm surge modelling of climate model projections.

How to cite: Harrison, B., Palmer, M., Allison, L., Gregory, J., Howard, T., Pardaens, A., and Tinker, J.: Towards Physically Consistent Sea Level Rise Storylines for the United Kingdom, EGU General Assembly 2023, Vienna, Austria, 23–28 Apr 2023, EGU23-15655, https://doi.org/10.5194/egusphere-egu23-15655, 2023.

For sea-level projections along the coast of the Netherlands, ocean dynamic sea level (ODSL) is one of the most important contributors to sea-level rise in the 21st century. The ODSL output from the latest coupled model intercomparison projects (CMIP5 and CMIP6) is used for these projections. These CMIP models overwhelmingly use ocean models with a spatial resolution of 1° and a vertical z-level coordinate. Using these CMIP models for projections does not provide a seamless connection between observations and projections, this study aims to improve on that. To do so, we use a configuration of the Regional Ocean Modelling System (ROMS) for the North Sea with a resolution of 0.25° to downscale the spatial resolution of CMIP6 models and interpolate the vertical coordinate to topography-following sigma levels to improve the projections for the Netherlands.

First, we use ROMS to reconstruct the ODSL along the coast of the Netherlands for the observational period. The regional model is forced using an atmospheric dataset constructed from ERA-interim and ERA-5 surface data and different ocean reanalysis datasets. It is not straightforward to compare the ODSL from different ocean reanalyses, as some datasets assimilate satellite altimetry data, whereas others do not. The ODSL from the reanalysis datasets that assimilate altimetry data are corrected for land ice and terrestrial water storage contributions to correct these differences.

Then, we use ROMS to obtain new projections of ODSL for the coast of the Netherlands that seamlessly connect to the estimate of ODSL from ocean reanalysis data. We extend the forcing datasets for the regional ocean model of the observational period using the anomalies of CMIP6 variables. Using this new method, we obtain improved projections along the coast of the Netherlands.

How to cite: Keizer, I., Le Bars, D., and Drijfhout, S.: Estimating ocean dynamic sea level along the coast of the Netherlands using the regional ocean modelling system (ROMS) to seamlessly connect the observational period to projections for the 21st century., EGU General Assembly 2023, Vienna, Austria, 23–28 Apr 2023, EGU23-16275, https://doi.org/10.5194/egusphere-egu23-16275, 2023.

EGU23-16517 | ECS | Posters on site | CL4.5

Forcing Mechanisms of the Interannual Sea Level Variability in the Midlatitude South Pacific during 2004-2020 

Cyril Germineaud, Denis Volkov, Sophie Cravatte, and William Llovel

Over the past few decades, the global mean sea level rise and superimposed regional fluctuations of sea level have exerted considerable stress on coastal communities, especially in low-elevation regions such as the Pacific Islands in the western South Pacific Ocean. This made it necessary to have the most comprehensive understanding of the forcing mechanisms that are responsible for the increasing rates of extreme sea level events. In this study, we explore the causes of the observed sea level variability in the midlatitude South Pacific on interannual time scales using observations and atmospheric reanalyses combined with a 1.5 layer reduced-gravity model. We focus on the 2004–2020 period, during which the Argo’s global array allowed us to assess year-to-year changes in steric sea level caused by thermohaline changes in different depth ranges (from the surface down to 2000 m). We find that during the 2015–2016 El Niño and the following 2017–2018 La Niña, large variations in thermosteric sea level occurred due to temperature changes within the 100–500 dbar layer in the midlatitude southwest Pacific. In the western boundary region (from 30°S to 40°S), the variations in halosteric sea level between 100 and 500 dbar were significant and could have partially balanced the corresponding changes in thermosteric sea level. We show that around 35°S, baroclinic Rossby waves forced by the open-ocean wind-stress forcing account for 40 to 75% of the interannual sea level variance between 100°W and 180°, while the influence of remote sea level signals generated near the Chilean coast is limited to the region east of 100°W. The contribution of surface heat fluxes on interannual time scales is also considered and shown to be negligible.

How to cite: Germineaud, C., Volkov, D., Cravatte, S., and Llovel, W.: Forcing Mechanisms of the Interannual Sea Level Variability in the Midlatitude South Pacific during 2004-2020, EGU General Assembly 2023, Vienna, Austria, 23–28 Apr 2023, EGU23-16517, https://doi.org/10.5194/egusphere-egu23-16517, 2023.

EGU23-17395 | ECS | Posters virtual | CL4.5

Impact of mean sea level rise in the Rias Baixas hydrodynamics (NW Iberian Peninsula) 

Clara Ribeiro, Magda Catarina Sousa, Carina Lurdes Lopes, Inés Álvarez, and João Miguel Dias

Mean sea level rise is currently a growing and prominent consequence of climate change. The increase in the mean sea level poses a significant threat to low-lying coastal areas that often present high economic and biological value. Recent studies also show that tidal propagation in estuarine systems will be altered due to climate change, intensifying the threat it poses to these systems. The Rias Baixas located in the NW of the Iberian Peninsula, as well as the rest of the Galician coast, are areas of high primary production susceptible to alterations in their hydrodynamics induced by climate change,  negatively impacting the system.

In this context, this study aims to validate a hydrodynamic model of the Rias Baixas and to analyse the effect of mean sea level rise in the local hydrodynamics. The methodology followed comprises the application of a three-dimensional numerical model (Delft3D), with realistic bathymetry and coastline of the NW Iberian Peninsula including the Rias Baixas. The model considers the main physical processes and the main features of circulation. Ambient shelf conditions include TOPEX global tidal solution.

Firstly, the model validation was done through a qualitative and quantitative analysis. The qualitative analysis was done through a visual comparison between model results and observed time series of the water level in several sampling stations, showing good agreement. The quantitative analysis aims to assess the model performance, through the determination of the root mean square error between model results and observations and of the harmonic constituents from both types of data series. After the model validation, the main semidiurnal and diurnal constituents as well as the tidal current magnitude were determined for Ria Baixas for three mean sea level scenarios: present mean sea level and two future scenarios from CMIP6, a more optimistic one (SSP1 - 2.6) and a more pessimistic one (SSP5 - 8.5).

The model results show that the amplitude of the main semidiurnal and diurnal constituents will decreases for future scenarios, whereas the respective phase increases towards the head of the Rias. The results also highlight that tidal current magnitude generally increases with mean sea level rise for future scenarios, although a slight decrease was found at the upstream areas of the Ria Baixas.

Funding: We acknowledge financial support to CESAM by FCT/MCTES (UIDP/50017/2020+UIDB/50017/2020+ LA/P/0094/2020) through national funds.

How to cite: Ribeiro, C., Sousa, M. C., Lopes, C. L., Álvarez, I., and Dias, J. M.: Impact of mean sea level rise in the Rias Baixas hydrodynamics (NW Iberian Peninsula), EGU General Assembly 2023, Vienna, Austria, 23–28 Apr 2023, EGU23-17395, https://doi.org/10.5194/egusphere-egu23-17395, 2023.

Indian Ocean Dipole (IOD) is an air-sea coupled variability in the Tropical Indian Ocean (TIO), which strongly impacts climate variability over the Indian Ocean rim countries. Though many positive IODs co-occurred with El Niño Southern Oscillation (ENSO), IODs do evolve independently, suggesting the possible role of internal dynamics of the Indian Ocean. In this study, the subtropical IOD (SIOD) is reported as one of the triggers for non-ENSO IODs. The study highlights the existence of cyclic feedback between IOD and SIOD through tropical subtropical interaction, a possible mechanism for the biennial tendency of both IOD and SIOD modes. The positive SIOD induce warming in the southwest of the Subtropical South Indian Ocean (SSIO) during April-May months and creates a meridional cell with subsidence over the southwestern TIO region (10oS). The subsidence expands the existing anticyclonic circulation over SSIO towards the equator and develops easterlies along the equator, warming the western TIO region. A zonal-vertical cell with convection over the western TIO and subsidence over the eastern TIO originates during June-July, which subsequently generates positive IOD in the following months. The positive IOD triggers negative SIOD by developing a stationary Rossby wave train in the midlatitudes. The southeastern anticyclonic circulation develops during the IOD peak season as Gill’s response initiates warm SST anomalies in the northeastern subtropics. As a result of the warming, the evolution of upper-level divergence and high absolute vorticity gradient over the subtropics generate an equivalent barotropic Rossby wave number 3 pattern in the extratropics. The cyclonic circulation over the southwest SSIO related to this Rossby wave pattern creates cold SST anomalies there. The cooling in the southwest and the warming in the northeast SSIO persisted from the IOD peak season, which strengthened the cyclonic circulation over SSIO, reinforcing the existing negative and positive SST anomalies through a positive feedback mechanism and generating negative SIOD, which peaks in the following January-March months.

How to cite: Sebastian, A. and Gnanaseelan, C.: Coupled feedback between the tropics and subtropics of the Indian Ocean with emphasis on the coupled interaction between IOD and SIOD, EGU General Assembly 2023, Vienna, Austria, 23–28 Apr 2023, EGU23-373, https://doi.org/10.5194/egusphere-egu23-373, 2023.

Tropical cyclone (TC) activity varies substantially yearly, and tropical cyclone-related damage also changes. Longer-term prediction of tropical cyclones plays an important role in reducing the wear and human loss caused by TCs. In this study, we have used a Causal-network-based algorithm to find the main development regions and precursors responsible for TC genesis and intensification. However, all the extreme events are interconnected through various global links. Therefore, analysis of the teleconnection and correlation of Tropical Cyclones with El Nino Southern Oscillation (ENSO), Indian Ocean Dipole (IOD), and North Atlantic Oscillation (NAO) during the satellite era (1980-2020) over the North Indian Ocean (NIO) basins using this Causal Effect Network (CEN) based algorithms is checked. The most appropriate metric for cyclone energy is Accumulated Cyclone Energy (ACE); its correlation with the various factors are investigated. We examined the variation in TCs activity during all three phases (positive, negative, and neutral phases).

The results show an increasing trend in ACE over the NIO region during that specific period. The duration of most intense cyclones is increased, but their frequency decreases in this period. A shift in ACE starts after 1997 and still rises significantly. Analysis of Sea Surface Temperature (SST), Vertical Wind Shear (VWS) between 850 and 250 hPa, mid-tropospheric (800 hPa) Relative Humidity (RH), low level (850 hPa) Relative Vorticity (RV), and Tropical Cyclone Heat Potential (TCHP) is done, and it shows positive changes and variability of ACE. These results may help get better knowledge about the atmospheric or oceanic teleconnections between the events, and improved tropical cyclone prediction can help reduce the loss caused by the TCs.        

How to cite: kumar sagar, A.: identification of robust predictors of tropical cyclones using causal effect network over the north indian ocean, EGU General Assembly 2023, Vienna, Austria, 23–28 Apr 2023, EGU23-502, https://doi.org/10.5194/egusphere-egu23-502, 2023.

EGU23-595 | ECS | Posters on site | CL4.6

Intra-decadal variability of the Indian Ocean shallow meridional overturning circulation during boreal winter 

Rahul Pai, Anant Parekh, Jasti S Chowdary, and Gnanaseelan Chellappan

The variability of Indian Ocean shallow meridional overturning circulation (SMOC) is studied using the century-long ocean reanalysis simple ocean data assimilation (SODA) data. Though SMOC exhibits stronger southward transport during boreal summer, it displays stronger variability during boreal winter. The spectrum analysis of the winter SMOC index reveals the presence of the highest amplitude between 5 to 7 years at 95% confidence level, suggesting the dominance of intra-decadal SMOC variability. The robustness of intra-decadal SMOC variability is also confirmed in different ocean reanalysis data sets. Composite analysis of filtered upper Ocean Heat Content, sea level, thermocline depth, and Sea Surface Temperature anomalies for strong (weak) SMOC years show negative (positive) anomalies over north and East of Madagascar. Correlation analysis, of filtered SMOC index and sea level pressure (zonal winds) over the Indian Ocean, found a significant negative (positive) correlation coefficient north of 40 °S (around 10 °S) and a significantly positive (negative) correlation coefficient over the 45 °S to 70 °S (20 °S to 50 °S and north of 5 °S). This meridional pattern of the correlation coefficient for sea level pressure, manifesting the out-of-phase relationship between sub-tropics and high latitude mean sea level pressure, resembles Southern Annular Mode (SAM). We conclude that the intra-decadal variability of mean sea level pressure leads to zonal wind variation around 10 °S modulating SMOC, which in turn affects the upper ocean thermal properties in the east and north of Madagascar. This study for the first time brought out coherent intra-decadal evolution of SAM and SMOC during boreal winter.

How to cite: Pai, R., Parekh, A., Chowdary, J. S., and Chellappan, G.: Intra-decadal variability of the Indian Ocean shallow meridional overturning circulation during boreal winter, EGU General Assembly 2023, Vienna, Austria, 23–28 Apr 2023, EGU23-595, https://doi.org/10.5194/egusphere-egu23-595, 2023.

EGU23-864 | ECS | Posters on site | CL4.6

The Teleconnection of Indian Summer Monsoon Clouds with Global Predictors: An Unexplored Measure for Coupled Model development 

Ushnanshu Dutta, Anupam Hazra, Hemantkumar S Chaudhari, Subodh Kumar Saha, Samir Pokhrel, and Utkarsh Verma

The teleconnection studies regarding Indian summer monsoon (ISM) clouds are not focused on detail from both observational and modeling aspects. This is despite the fact that clouds play a seminal role in governing rainfall variability through the modulation of heating and induced circulation. Therefore, we find it essential to explore whether the inter-annual variability of ISM clouds is also remotely influenced by the slowly varying predictable component e.g. Sea Surface Temperature (SST). 

The findings reveal the linkage of observed TCF (and rainfall) over the ISM region with slowly varying forcing (e.g., global SST). The observed/reanalysis teleconnection pattern of TCF-SST is almost similar to that of rainfall-SST.In the long-term period, TCF and SST show a strong and positive correlation with Extra-Tropics (R ~ 0.41), NAO (R ~ 0.51), and AMO (R ~ 0.41) SST regions, in addition to canonical ENSO teleconnection (R ~ −0.39). This is better captured in CMIP6-MME than in CMIP5-MME. The representation of the global teleconnection pattern has been significantly improved in participating models from CMIP5 to CMIP6. The teleconnection with extra-tropics and north Atlantic mode of variability is markedly enhanced in CMIP6-MME compared to CMIP5-MME. The present study has also shown the lag correlations in the teleconnection analysis, i.e., the correlation of June–September (JJAS) mean of rainfall/TCF with October–December (OND) SST from observation/reanalysis, CMIP5-MME, and CMIP6-MME. The CMIP6-MME performs better than CMIP5-MME as compared to observation/reanalysis. 

Thus, the improved understanding of the teleconnection of cloud variables with ENSO and other predictors (ET, NAO, and AMO) will help researchers take up the challenges of improving the ISMR skill far ahead using the new generation coupled climate models. This may facilitate reliable seasonal ISM forecasting.

Keywords: Indian Summer Monsoon, Clouds, Teleconnection, CMIP5, CMIP6

How to cite: Dutta, U., Hazra, A., Chaudhari, H. S., Saha, S. K., Pokhrel, S., and Verma, U.: The Teleconnection of Indian Summer Monsoon Clouds with Global Predictors: An Unexplored Measure for Coupled Model development, EGU General Assembly 2023, Vienna, Austria, 23–28 Apr 2023, EGU23-864, https://doi.org/10.5194/egusphere-egu23-864, 2023.

EGU23-1944 | ECS | Orals | CL4.6

ENSO-driven abrupt phase shift in North Atlantic Oscillation in early January 

Xin Geng, Jiuwei Zhao, and Jong-Seong Kug

El Niño-Southern Oscillation (ENSO) teleconnections exhibit a strong dependency on seasonally and intraseasonally varying mean states, which leads to impactful short-term variations in regional climate. The North Atlantic Oscillation (NAO)-ENSO relation is a typical example, in that its phase relationship reverses systematically between the early and late winter. However, the details and underlying mechanisms of this relationship transition are not well understood yet.

Here based on observations and an ensemble of atmosphere-only climate model simulations, we first reveal that this NAO phase reversal occurs synchronously in early January, which indicates strong abruptness. We demonstrate that this abrupt NAO phase reversal is caused by the change in ENSO-induced Rossby wave-propagating direction from northeastward to southeastward over the northeastern North American region, which is largely governed by a climatological alteration of the local jet meridional shear. We also provide evidence that the North Atlantic intrinsic eddy–low-frequency flow feedback further facilitates and amplifies the NAO responses. This abrupt NAO phase reversal signal is strong enough during the ENSO winter to be useful for intraseasonal climate forecasting in the Euro-Atlantic region.

How to cite: Geng, X., Zhao, J., and Kug, J.-S.: ENSO-driven abrupt phase shift in North Atlantic Oscillation in early January, EGU General Assembly 2023, Vienna, Austria, 23–28 Apr 2023, EGU23-1944, https://doi.org/10.5194/egusphere-egu23-1944, 2023.

Weather type classification is a well-established and thoroughly researched field of study in atmospheric sciences. One of its applications is the analysis of occurrence of and transitions between large scale synoptic types. This is typically done by calculating the moving average of, or estimating linear or polynomial fits to relative frequencies. The presented work points out the theoretical inconsistencies implied by such approaches and, instead, employs binomial and multinomial logistic regression for consistent estimation of long-term trends in occurrence and transition probabilities between synoptic types, while assuming first-order Markovian behaviour throughout. The methodological framework's functioning is demonstrated using two prominent examples of weather type classification schemes with regional focus on Germany and central Europe. Temporal refinement to seasonal and monthly level and aggregation into combined groups of classes allows for tracing of observed trends, providing a more comprehensive understanding of the systems investigated. The results, by and large, fit in well with expectations about circulatory changes suggested by research about global warming induced climate change and can be verified by existing research in some cases. Inspection of transition probability changes allows for differentiation between changes in occurrence probability caused by changes in the mean vs. changes in circulatory dynamics. Limitations and favourable implementational details of the approach are determined and the Wald Null test is recommended for assessing statistical significance.

How to cite: Schoeller, H.: Occurrence and Transition Probabilities for two Weather Classification Systems over Germany, EGU General Assembly 2023, Vienna, Austria, 23–28 Apr 2023, EGU23-2004, https://doi.org/10.5194/egusphere-egu23-2004, 2023.

EGU23-2125 | Orals | CL4.6

Resolving weather fronts increases the large-scale circulation response to Gulf Stream SST anomalies 

Robert Jnglin Wills, Adam Herrington, Isla Simpson, and David Battisti

Canonical understanding based on general circulation models (GCMs) is that the large-scale circulation responds only weakly to extratropical sea-surface temperature (SST) anomalies, compared to the larger influence of tropical SST anomalies. However, the horizontal resolution of modern GCMs, which ranges from roughly 200 km to 25 km, is too coarse to fully resolve mesoscale atmospheric processes such as weather fronts. Here, we investigate the large-scale atmospheric circulation response to idealized Gulf Stream SST anomalies in a variable resolution version of the Community Atmospheric Model (CAM6), with regional grid refinement of 14 km over the North Atlantic, and compare it to versions with 28-km regional grid refinement and global 111-km resolution. The high-resolution simulations show a large positive response of the wintertime North Atlantic Oscillation (NAO) to positive SST anomalies in the Gulf Stream, a 1-standard-deviation NAO anomaly for 2°C SST anomalies. The lower-resolution simulations show a much weaker response, and in some cases, a different spatial structure of the response. The enhanced large-scale circulation response at high resolution results from an increase in resolved vertical motions, which enables SST forcing to have a larger influence on transient-eddy heat and momentum fluxes. In response to positive SST anomalies, these processes contribute to a stronger North Atlantic jet that varies less in latitude, as is characteristic of the positive phase of the NAO. Our results suggest that the atmospheric circulation response to extratropical SST anomalies is fundamentally different at higher resolution. Regional refinement in key regions offers a potential pathway towards improving simulation of the atmospheric response to extratropical SST anomalies and thereby improving multi-year regional climate predictions.

How to cite: Jnglin Wills, R., Herrington, A., Simpson, I., and Battisti, D.: Resolving weather fronts increases the large-scale circulation response to Gulf Stream SST anomalies, EGU General Assembly 2023, Vienna, Austria, 23–28 Apr 2023, EGU23-2125, https://doi.org/10.5194/egusphere-egu23-2125, 2023.

EGU23-5034 | ECS | Orals | CL4.6

Impact of tropical eastern Pacific warming bias on Caribbean climate 

Marta Brotons Blanes, Rein Haarsma, and Nadie Bloemendaal

During the last decades, CMIP5 models simulate a warming trend in the tropical eastern Pacific that has not been present in observations (Seager et al., 2019). Associated with this, the Walker circulation has experienced a westward migration while CMIP5 models simulate an eastward migration. This mismatch is still present in CMIP6 models and might affect climate projections worldwide. In the Caribbean region, CMIP6 models project a strong drying at the end of the 21st century. El Niño-like changes in the Walker circulation are the dominant teleconnections driving the Caribbean drying. The models that project a strong Caribbean drying also simulate generally a strong equatorial eastern Pacific warming trend over the recent decades. Thus, the mismatch between observed and simulated warming trends over the equatorial eastern Pacific questions the reliability of the Caribbean precipitation projections. The warming bias might also have implications for tropical cyclones’ projections in the Atlantic and Pacific through the effect of vertical wind shear, which is related to shifts in the Walker circulation. In addition, the double Intertropical Convergence Zone (ITCZ) bias might be influenced by the mismatching trends. The strong influence of El Niño-Southern Oscillation (ENSO) dynamics on the world’s climate demands more in-depth studies addressing the drivers of the Walker circulation and the equatorial Pacific warming bias.

How to cite: Brotons Blanes, M., Haarsma, R., and Bloemendaal, N.: Impact of tropical eastern Pacific warming bias on Caribbean climate, EGU General Assembly 2023, Vienna, Austria, 23–28 Apr 2023, EGU23-5034, https://doi.org/10.5194/egusphere-egu23-5034, 2023.

Climate change affects the hydrological cycle and induces extreme weather events, such as storms, floods and droughts. Adaptation to climate change needs to be based on assessments of future impacts. The new generation of Coupled Model Inter-comparison Project Phase 6 (CMIP6) is widely used in future flood prediction and drought risk assessment. However, many studies have found that CMIP6 global climate models for simulating land surface water and energy fluxes have significant biases, which poses a problem for using CMIP6 as input data for hydrological impact studies. Therefore, the output of CMIP6 cannot be directly used in hydrological models to project the impacts of future climate change. To overcome this problem, the correction of model output towards observations for its subsequent application in climate change impact studies has now become a standard procedure. And hydrological simulations generally use bias corrected output. But bias correction methods cannot really correct bias. The commonly used bias correction approaches only force the model outputs to match observations, and does not consider the mechanisms within the model and the interaction between variables. This study systematically evaluates water and energy fluxes of CMIP6 model over the Tibetan Plateau. Results show that the inter-model variability is substantial in temperature simulations. Snow that the largest component of the cryosphere responds significantly to changes in temperature. In the study, we study snow depth simulations corresponding to temperature simulations of different models over the Tibetan Plateau. Based on the water balance formula, analysis of how water balance fluxes respond to temperature changes in CMIP6, and determine the sources of error and ultimately lead to improved predictions.

How to cite: Liu, S., Liu, Z., and Duan, Q.: Evaluation of CMIP6 models for water and energy fluxes and analysis of source of errors over the Tibetan Plateau, EGU General Assembly 2023, Vienna, Austria, 23–28 Apr 2023, EGU23-5066, https://doi.org/10.5194/egusphere-egu23-5066, 2023.

EGU23-5176 | ECS | Orals | CL4.6

Global warming induces more internally generated extremes of North Atlantic Oscillation and East Atlantic pattern 

Quan Liu, Johann Jungclaus, Daniela Matei, and Juergen Bader

Increased weather and climate extreme events are often attributed solely to either human-induced climate change or internal variability, under the assumption that external forcing does not influence the internal variability. However, with the development of single-model initial-condition large ensembles, recent research shows the impact of global warming on internal variability. This study investigates how global warming influences the North Atlantic Oscillation (NAO) and the East Atlantic (EA) pattern, which are the dominant large-scale circulation/teleconnection modes in the North Atlantic sector.

The study analyzes the geopotential height data of the Max Planck Institute Grand Ensemble (MPI-GE)  with 100 ensemble members. The internal variability is quantified as the deviation from the ensemble mean. The influence of global warming on the internal variability is checked with a 1pcCO2 experiment, where the  concertation is increased by 1% every year. This experiment provides a scenario for relatively strong global warming based on increasing greenhouse gas concentration alone. The extreme NAO and EA are defined as those years where the indexes are above (positive extremes) or below (negative extremes) 2 standard deviations.

The results show increases in extreme events, especially negative extremes, for both NAO and EA during wintertime, in a warmer climate. While NAO extremes increase consistently across the whole troposphere, EA extremes increase more at higher altitudes (500hpa-200hpa) than at lower altitudes. The warming effect of positive extreme NAO over northern Eurasia gets weaker, while the cooling effect of negative extreme NAO over northern Eurasia gets stronger. The effects of both, positive and negative extremes of EA, extend eastward till Eastern Asia. Overall, this study underlines the impact of global warming onto the internal variability of NAO and EA.

How to cite: Liu, Q., Jungclaus, J., Matei, D., and Bader, J.: Global warming induces more internally generated extremes of North Atlantic Oscillation and East Atlantic pattern, EGU General Assembly 2023, Vienna, Austria, 23–28 Apr 2023, EGU23-5176, https://doi.org/10.5194/egusphere-egu23-5176, 2023.

EGU23-5279 | Orals | CL4.6

Reconciling conflicting evidence for the cause of the observed early 21st century Eurasian Cooling 

Stefan Sobolowski, Stephen Outten, and Camille Li

Arctic amplification of global warming is accompanied by a dramatic decline in sea ice. This, in turn, has been linked to cooling over the Eurasian subcontinent over recent decades, most dramatically during the period 1998-2012. Such a coherent and pronounced cooling is a counterintuitive impact under global warming. Some studies have proposed a causal teleconnection from Arctic sea ice retreat to Eurasian wintertime cooling; others argue that Eurasian cooling is mainly driven by internal variability. Overall, there is an impression of strong disagreement between those holding the “ice-driven” versus “internal variability” viewpoints. We offer an alternative framing that shows that the sea ice and internal variability views can be compatible. Key to this is viewing Eurasian cooling through the dual lens of dynamics (linked primarily to internal variability with a small contribution from sea ice; cools Eurasia) and thermodynamics (linked to sea ice retreat; warms Eurasia). This framing, combined with recognition that there is uncertainty in the hypothesized mechanisms themselves, allows both viewpoints (and others) to co-exist and contribute to our understanding of Eurasian cooling. A simple autoregressive model shows that strong Eurasian cooling is consistent with internal variability, with some periods being more susceptible to strong cooling than others. Rather than posit a “yes-or-no” causal relationship between sea ice and Eurasian cooling, a more constructive way forward is to consider whether the cooling trend was more likely given the observed sea ice loss, as well as other sources of low-frequency variability. Taken in this way both sea ice and internal variability are factors that affect the likelihood of strong regional cooling in the presence of ongoing global warming. Improving our understanding of the underlying mechanisms is critical for quantifying regional responses and impacts as well as producing reliable near-term climate predictions. 

How to cite: Sobolowski, S., Outten, S., and Li, C.: Reconciling conflicting evidence for the cause of the observed early 21st century Eurasian Cooling, EGU General Assembly 2023, Vienna, Austria, 23–28 Apr 2023, EGU23-5279, https://doi.org/10.5194/egusphere-egu23-5279, 2023.

EGU23-5775 | ECS | Orals | CL4.6 | Highlight

Impacts of a weakened AMOC on the European climate 

Katinka Bellomo, Virna Meccia, Roberta D'Agostino, Federico Fabiano, Sarah Larson, Jost von Hardenberg, and Susanna Corti

Previous studies have shown that the response of the Atlantic Meridional Overturning Circulation (AMOC) to increasing greenhouse gas forcing is a key driver of inter-model uncertainties. While all models project an AMOC decline, the inter-model spread in the decline rate drives very different climate change impacts, including temperature, precipitation, and large-scale atmospheric circulation patterns. Here we investigate the impacts of a weakened AMOC by performing idealized climate model experiments using EC-Earth3, a state-of-the-art GCM participating in CMIP6. We compare results from a control experiment run under preindustrial forcing, with an experiment in which we force a weakened AMOC by applying a virtual salinity flux in the North Atlantic/Arctic basin. Here we analyze previously unexplored aspects of the climate response to a weakened AMOC, focusing on impacts on wintertime daily timescales in the Euro-Atlantic region.

We find that a weakened AMOC forces an overall drier climate over most of Europe; however, some regions especially in northwestern Europe experience an increase in the number of very wet days. We investigate drivers of precipitation changes by performing a moisture budget and analyzing the association with changes in weather regimes at daily timescales. We find that an increase in the occurrence of the NAO+ days (going from a frequency of ~26% of occurrence to above 42%) together with an enhanced and more central jet, favors drier conditions over southern Europe and wetter conditions over northwestern Europe. Further, enhanced but drier storms cause dryness over Europe while thermodynamic processes per se, namely the Clausius-Clapeyron constraint on temperature, play a second role. Finally, we explore these relationships in additional experiments in which we keep the AMOC constant in a forced 4xCO2 experiment by applying a reversed virtual salinity flux, which allows us to separate the effects of 4xCO2 forcing from the weakened AMOC on climate change impacts. Our results have broader implications for understanding the role of the AMOC response on future climate change, allowing us to separate the impacts of the AMOC from those of the CO2 increase.

How to cite: Bellomo, K., Meccia, V., D'Agostino, R., Fabiano, F., Larson, S., von Hardenberg, J., and Corti, S.: Impacts of a weakened AMOC on the European climate, EGU General Assembly 2023, Vienna, Austria, 23–28 Apr 2023, EGU23-5775, https://doi.org/10.5194/egusphere-egu23-5775, 2023.

The central role of tropical sea surface temperature (SST) variability in modulating Northern Hemisphere (NH) extratropical climate has long been known. However, the prevailing pathways of teleconnections in observations and the ability of climate models to replicate these observed linkages remain elusive. Here, we apply maximum covariance analysis between atmospheric circulation and tropical SST to reveal two co-existing tropical-extratropical teleconnections albeit with distinctive spatiotemporal characteristics. The first mode, resembling the Pacific-North American (PNA) pattern, favors a Tropical-Arctic in-phase (warm-Pacific-warm-Arctic) teleconnection in boreal spring and winter. The second mode, predominant in summer and autumn, is manifested as an elongated Rossby-wave train emanating from the tropical eastern Pacific that features an out-of-phase relationship (cold-Pacific-warm-Arctic) between tropical Pacific SST and temperature variability over the Arctic. This Pacific-Arctic teleconnection (PARC) mode partially explains the observed summertime warming around the Arctic. The reliability of climate models to replicate these leading teleconnections is of primary interest in this study to improve decadal prediction on regional climate. While climate models participating in CMIP6 appear to successfully simulate the PNA mode and its temporal characteristics, the majority of models’ skill in reproducing the PARC mode is obstructed by apparent biases in simulating low-frequency SST and rainfall variability over the tropical eastern Pacific and the summer climatological mean flow over the North Pacific. Considering the contribution of the PARC mode in shaping low frequency climate variations over the recent decades from the tropics to the Arctic, improving models’ capability to capture the PARC mode is essential to reduce uncertainties associated with decadal prediction and climate change projection over the NH.

How to cite: Feng, X.: Possible causes of model biases in simulating Tropical-Arctic teleconnections in CMIP6, EGU General Assembly 2023, Vienna, Austria, 23–28 Apr 2023, EGU23-6017, https://doi.org/10.5194/egusphere-egu23-6017, 2023.

EGU23-6966 | ECS | Orals | CL4.6

Opposite Impacts of Interannual and Decadal Pacific Variability in the Extratropics 

Melissa Seabrook, Doug Smith, Nick Dunstone, Rosie Eade, Leon Hermanson, Adam Scaife, and Steven Hardiman

It is well established that the positive phase of El Niño Southern Oscillation (ENSO) tends to weaken the Northern Hemisphere stratospheric polar vortex (SPV), promoting a negative North Atlantic Oscillation (NAO). Pacific Decadal Variability (PDV) is characterised by a pattern of sea surface temperatures similar to ENSO, but its impacts are more uncertain: some studies suggest similar impacts of ENSO and PDV on the SPV and NAO, while others find the opposite. We use climate model experiments and reanalysis to find further evidence supporting opposite interannual and decadal impacts of Pacific variability on the extratropics. We propose that the decadal strengthening of the SPV in response to positive PDV is caused by a build-up of stratospheric water vapour leading to enhanced cooling at the poles, an increased meridional temperature gradient and a strengthened extratropical jet. Our results are important for understanding decadal variability, seasonal to decadal forecasts and climate projections.

How to cite: Seabrook, M., Smith, D., Dunstone, N., Eade, R., Hermanson, L., Scaife, A., and Hardiman, S.: Opposite Impacts of Interannual and Decadal Pacific Variability in the Extratropics, EGU General Assembly 2023, Vienna, Austria, 23–28 Apr 2023, EGU23-6966, https://doi.org/10.5194/egusphere-egu23-6966, 2023.

EGU23-7011 | ECS | Orals | CL4.6

AMOC variations modulated by Tropical Indio-Atlantic SST Gradient 

Brady Ferster, Leonard Borchert, Juliette Mignot, and Alexey Fedorov

A potential future slowdown or acceleration of the Atlantic Meridional Overturning Circulation (AMOC) would have profound impacts on global and regional climate. Recent studies have shown that AMOC responds, among many other processes, to anthropogenic changes in tropical Indian ocean (TIO) temperature. However, internal unforced co-variations between these two basins are largely unexplored as of yet. Here, we use the ERSST v5, HadISST v1, and COBE v2 gridded observational products for the period 1870-2014, as well as dedicated simulations with coupled climate models, and show that internal changes in sea surface temperature gradients between the Indian and Atlantic Ocean (SSTgrad) can drive teleconnections that influence internal variations of North Atlantic climate and AMOC.

We separate the unforced observed component (i.e., internal signal) from the forced signal following the residuals method presented by Smith et al. (2019). In the absence of direct AMOC observation we estimate AMOC variability from an SST index (SSTAMOC; Caesar et al., 2018). We find a robust observed relationship between the unforced tropical SSTgrad and SSTAMOC when TIO leads by ~25 years. This time-lag is in line with a recently described mechanism of anomalous tropical Atlantic rainfall patterns that originate from TIO warming and cause anomalously saline tropical Atlantic surface water which slowly propagate northward into the subpolar North Atlantic, ultimately altering oceanic deep convection and AMOC (Hu and Fedorov, 2019; Ferster et al. 2021). Our study now suggests that it is the tropical SSTgrad that drives those AMOC changes, with a limited role for the western tropical Pacific. Pre-industrial control simulations with the IPSL-CM6A-LR model confirm this relationship, indicating a time lag of ~25 years between SSTgrad and SSTAMOC variations. These simulations also confirm that the SSTAMOC is representative of unforced AMOC variations when SSTAMOC leads by 5 years. This work therefore indicates that an unforced pathway between tropical ocean temperature and AMOC exists with a ~20 year lag, which opens the potential for using SSTgrad as precursor to predict future AMOC changes.


Caesar, L., Rahmstorf, S., Robinson, A., Feulner, G., & Saba, V. (2018). Observed fingerprint of a weakening Atlantic Ocean overturning circulation. Nature, 556(7700), 191-196.

Ferster, B. S., Fedorov, A. V., Mignot, J., & Guilyardi, E. (2021). Sensitivity of the Atlantic meridional overturning circulation and climate to tropical Indian Ocean warming. Climate Dynamics, 1-19.

Hu, S., & Fedorov, A. V. (2019). Indian Ocean warming can strengthen the Atlantic meridional overturning circulation. Nature climate change, 9(10), 747-751.

Smith, D. M., Eade, R., Scaife, A. A., Caron, L. P., Danabasoglu, G., DelSole, T. M., ... & Yang, X. (2019). Robust skill of decadal climate predictions. Npj Climate and Atmospheric Science, 2(1), 1-10.

How to cite: Ferster, B., Borchert, L., Mignot, J., and Fedorov, A.: AMOC variations modulated by Tropical Indio-Atlantic SST Gradient, EGU General Assembly 2023, Vienna, Austria, 23–28 Apr 2023, EGU23-7011, https://doi.org/10.5194/egusphere-egu23-7011, 2023.

A detailed assessment of climate variability of the Baltic Sea area for the period 1958-2009 (Lehmann et al. 2011) revealed that recent changes in the warming trend since the mid-1980s, were associated with changes in the large-scale atmospheric circulation over the North Atlantic. The analysis of winter sea level pressure (SLP) data highlighted considerable changes in intensification and location of storm tracks, in parallel with the eastward shift of the North Atlantic Oscillation (NAO) centres of action. Additionally, a seasonal shift of strong wind events from autumn to winter and early spring existed for the Baltic area. Lehmann et al. (2002) showed that different atmospheric circulation regimes force different circulation patterns in the Baltic Sea. Furthermore, as atmospheric circulation, to a large extent, controls patterns of water circulation and biophysical aspects relevant for biological production, such as the vertical distribution of temperature and salinity, alterations in weather regimes may severely impact the trophic structure and functioning of marine food webs (Hinrichsen et al. 2007). To understand the processes linking changes in the marine environment and climate variability, it is essential to investigate all components of the climate system which of course include also the large-scale atmospheric circulation. Here we focus on the link between changes/shifts in the large scale atmospheric conditions and their impact on the regional scale variability over the Baltic Sea area for the period 1950-2021. This work is mostly an extension of previous studies which focused on the response of the Baltic Sea circulation to climate variability for the period 1958-2008 (Lehmann et al. 2011, Lehmann et al. 2014). Now extended time series ECMWF ERA 5 reanalysis for 7 decades are available, highlighting recent changes in atmospheric conditions over the Baltic Sea. The main focus of this work is to identify predominant large scale atmospheric circulation patterns (climate regimes) on a monthly/seasonal time scale influencing the regional atmospheric circulation over the Baltic Sea area. Furthermore, long-term changes on the annual to decadal time scale will also be investigated.

How to cite: Lehmann, A., Post, P., and Myrberg, K.: Changing impact of the large-scale atmospheric circulation on the regional climate variability of the Baltic Sea for the period 1950-2022, EGU General Assembly 2023, Vienna, Austria, 23–28 Apr 2023, EGU23-8461, https://doi.org/10.5194/egusphere-egu23-8461, 2023.

EGU23-10582 | Orals | CL4.6 | Highlight

Impacts of oceanic warming patterns versus CO2 radiative forcing on the Hadley Circulation 

Yong Sun, Gilles Ramstein, Alexey V. Fedorov, Lin Ding, and Bo Liu

The Hadley circulation (hereafter HC) is one of the most prominent meridional overturning circulations in the climate system. In addition to maintaining energy balance and momentum exchange in tropics and extratropics, it can also shape the Intertropical Convergence Zone (ITCZ) and subtropical dry arid zones by regulating the hydrological cycle in tropical and extratropical regions. Weakening and expanding HC and narrowing of the ITCZ are projected with human greenhouse gas emissions. However, no consensus has been achieved regarding the relative importance of direct CO2 radiative effect and indirect effects via SST changes in shaping the future HC changes. This limits our deep understanding of the climate impacts imposed by changes in the HC. Here we analyze a broad range of CMIP5 experiments and show that future changes in SST patterns play the leading role in the determining the future changes in HC and ITCZ. In addition, a series of individual basin perturbation experiments were conducted at 1.5°C, 2°C, and 3°C temperature thresholds to identify key basins that determine HC strength, edges, and ITCZ locations. Our work highlights the overwhelming role of future tropical Indian Ocean warming on the HC and ITCZ changes.

How to cite: Sun, Y., Ramstein, G., Fedorov, A. V., Ding, L., and Liu, B.: Impacts of oceanic warming patterns versus CO2 radiative forcing on the Hadley Circulation, EGU General Assembly 2023, Vienna, Austria, 23–28 Apr 2023, EGU23-10582, https://doi.org/10.5194/egusphere-egu23-10582, 2023.

EGU23-11826 | ECS | Posters on site | CL4.6

Precipitation weather typing over the South Pacific: application to the TRMM satellite product calibration 

Oscar Mirones, Joaquín Bedia, Juan A. Fernández-Granja, Sixto Herrera, Sara O. Van Vloten, Andrea Pozo, Laura Cagigal, and Fernando J. Méndez

In the South Pacific region, the precipitation patterns are mostly driven by a number of processes operating at spatial and temporal scales. One of the most important features is the South Pacific Convergence Zone (SPCZ).

Five Daily Weather Types (WT) of precipitation are presented, based on Principal Component Analysis (PCA) and k-means clustering using ERA5 precipitation and atmospheric circulation variables such as mean sea-level pressure (SLP), day-to-day difference of mean daily SLP or northward and eastward 10-m wind component fields, able to capture distinct precipitation spatio-temporal patterns, interpretable in terms of salient regional climate features such as the SPCZ state and tropical cyclone activity. We then undertake a weather-type conditioned calibration of the TRMM (Tropical Rainfall Measuring Mission) product using in-situ rain gauge records from the PACRAIN database as reference. “Conditioning” is here based on applying separate statistical corrections for each of the generated WTs, since biases might be dependent on specific atmospheric situations that can be partially captured by the clustering procedure, thus adapting the correction factors to specific synoptic conditions. 

Our results indicate that the WT-conditioned calibration provides an overall marginal added value over the unconditioned approach, although it makes a significant difference for a better correction of extreme rainfall events, critical in many impact studies. The approach can be extended to compound extreme events, in which several variables are involved (e.g. precipitation, sea level, wind, etc.), in order to better preserve multi-variable consistency.

How to cite: Mirones, O., Bedia, J., Fernández-Granja, J. A., Herrera, S., Van Vloten, S. O., Pozo, A., Cagigal, L., and Méndez, F. J.: Precipitation weather typing over the South Pacific: application to the TRMM satellite product calibration, EGU General Assembly 2023, Vienna, Austria, 23–28 Apr 2023, EGU23-11826, https://doi.org/10.5194/egusphere-egu23-11826, 2023.

EGU23-11931 | ECS | Posters virtual | CL4.6

The Large-Scale Climate of Alaska - The Effects of the Pacific Decadal Oscillation on the Climate of Alaska 

Jasper Heuer, Martin Stuefer, and Lea Hartl

The climate of the state of Alaska is influenced not only by regional anthropogenic climate change, but also by the effects of large-scale ocean atmosphere systems like the Pacific Decadal Oscillation (PDO). Whereas positive anomalies in the PDO index coincide with warmer (sea surface) temperatures in the Gulf of Alaska and across the state, negative anomalies have the opposite effect. After analyzing the strength and direction of the correlation between the PDO index and the average temperatures in each of the 13 climate divisions of Alaska – both annually, as well as seasonally (DJF, MAM, JJA, and SON) – it becomes apparent, that the PDO affects the southern coastal and Panhandle regions much stronger than the Interior and North Slope. Over the course of a year, the correlations are strongest during the winter months, decrease during the spring and summer, only to increase again in the fall. Since the effects of large-scale circulations such as the PDO are changing under the influence of natural and anthropogenic climate change, reliable predictions on the future of the Alaskan climate are extremely complicated. In the future, further analysis is needed to support policy makers in their efforts to help adept the state’s ecosystems and economies to the changing climate.

How to cite: Heuer, J., Stuefer, M., and Hartl, L.: The Large-Scale Climate of Alaska - The Effects of the Pacific Decadal Oscillation on the Climate of Alaska, EGU General Assembly 2023, Vienna, Austria, 23–28 Apr 2023, EGU23-11931, https://doi.org/10.5194/egusphere-egu23-11931, 2023.

EGU23-12678 | ECS | Orals | CL4.6

Classification of Atmospheric Circulation Patterns That Trigger Rainfall Extremes in the Sudan-Sahel Region 

Manuel Rauch, Jan Bliefernicht, Patrick Laux, and Harald Kunstmann

A better understanding of the rainfall variability and extremes in tropical regions is crucial for the development of improved statistical and numerical approaches used for climate research and weather prediction. In this study, we present a novel fuzzy rule-based method for classifying atmospheric circulation patterns relevant to heavy rainfall in the Sudan-Sahel region over West Africa. In the first step, we determine large-scale atmospheric patterns to describe important seasonal features of the West African Monsoon like the movement of Saharan Heat Low over the African continent. In the second step, meso-scale monsoon patterns are classified to better describe rainfall variability and extremes during the monsoon period. In addition to a comprehensive predictor screening using more than 30 variables at different atmospheric levels, a detailed sensitivity analysis is performed, which aims to improve the transferability of the classification approach to an independent dataset. Furthermore, crucial aspects of the methodological development of fully automatic classification approaches are addressed. Using mean sea level pressure and stream function fields (700hPa) as final predictor variables, we identified 23 circulation patterns as robust solution to represent key atmospheric processes and rainfall variability in the study region. The two wettest patterns are distinguished by an enhanced Saharan Heat Low and cyclonic rotation near the study region, suggesting the presence of a tropical wave trough and triggering about 50% of the rainfall extremes on 6.5% of the days. The identified atmospheric circulation patterns are currently used to develop a variety of improved statistical approaches for this challenging region, such as pattern-dependent bias correction, geostatistical interpolation, and simulation. 

How to cite: Rauch, M., Bliefernicht, J., Laux, P., and Kunstmann, H.: Classification of Atmospheric Circulation Patterns That Trigger Rainfall Extremes in the Sudan-Sahel Region, EGU General Assembly 2023, Vienna, Austria, 23–28 Apr 2023, EGU23-12678, https://doi.org/10.5194/egusphere-egu23-12678, 2023.

EGU23-13294 | ECS | Orals | CL4.6

Regime-oriented causal model evaluation of Atlantic-Pacific teleconnections in CMIP6 

Soufiane Karmouche, Evgenia Galytska, Jakob Runge, Gerald Meehl, Adam Phillips, Katja Weigel, and Veronika Eyring

Regime-oriented causal model evaluation of Atlantic-Pacific teleconnections in CMIP6

Abstract:

The Pacific Decadal Variability (PDV) and the Atlantic Multidecadal Variability (AMV) are two important modes of long-term internal variability that significantly impact the climate system and its spatio-temporal changes. In this study, we use a regime-oriented causal discovery method (Karmouche et al, 2022) to examine the changing interactions between the PDV and AMV. The results of this analysis are used to evaluate the ability of models participating in the Coupled Model Intercomparison Project Phase 6 (CMIP6) to represent the observed changing interactions between the PDV, AMV, and their extra-tropical teleconnections.

Applying the regime-oriented causal discovery method to reanalysis time series revealed that the interactions between AMV and PDV differ from one regime to the other. The results also show that there are both direct and indirect connections between the Atlantic and Pacific oceans, which are established through various teleconnection patterns.

In order to evaluate the ability of climate models to represent these observed interactions, we applied the same regime-oriented causal discovery method to the CMIP6 Large Ensemble historical simulations. We show that several models performed well in simulating the observed causal patterns when AMV and PDV are "out-of-phase", and that the two models with the largest number of members generally outperformed other models in simulating observed causal patterns during longer regimes. This work shows how causal discovery on LEs complements the available diagnostics and statistics metrics of climate variability to provide a powerful tool for climate model evaluation.

Karmouche, S., Galytska, E., Runge, J., Meehl, G. A., Phillips, A. S., Weigel, K., and Eyring, V.: Regime-oriented causal model evaluation of Atlantic-Pacific teleconnections in CMIP6, EGUsphere [preprint], https://doi.org/10.5194/egusphere-2022-1013, 2022.

How to cite: Karmouche, S., Galytska, E., Runge, J., Meehl, G., Phillips, A., Weigel, K., and Eyring, V.: Regime-oriented causal model evaluation of Atlantic-Pacific teleconnections in CMIP6, EGU General Assembly 2023, Vienna, Austria, 23–28 Apr 2023, EGU23-13294, https://doi.org/10.5194/egusphere-egu23-13294, 2023.

EGU23-13299 | Orals | CL4.6

Drivers of the Annual Cycle of Rainfall over Central Africa: The Role of Water Vapor and the Mid-Tropospheric Meridional Circulation 

Georges-Noel T. Longandjo, Bellinda Mashoene Monyela, and Mathieu Rouault

The Intertropical Convergence Zone (ITCZ), with its twice-annual passage over central Africa, is considered as the main driver of the rainfall seasonality. But recently, this paradigm was challenged. To find out what are the main drivers of the annual cycle of rainfall over central Africa, we present a simple comprehensive paradigm with both local forcings and regional-scale processes playing crucial role. Due to the local evaporative cooling effect, the foot of the ascending branch of Hadley cells occurs where the temperature is the warmest, indicating a thermal low. This distorts the southern Hadley cell by developing its bottom-heavy structure. As result, both shallow and deep Hadley cells coexist over central Africa year–round. The deep mode is associated with poleward branches at upper levels that transport the atmospheric energy. The shallow mode is characterized by a meridional return flow in the mid-troposphere that transports the water vapour instead of lower branches as widely reported. This favours the building-up of the mid-tropospheric moisture flux convergence with a limited contribution of the midlevel easterly jet, conducive to deep convection. Embedded in this strong rising branch of Hadley cells at midlevels, the intense convective rainfall, and with it the rainfall maximum position, is seasonally controlled by the dynamics of the midlevel shallow meridional return flow. This highlights the interhemispheric rainfall contrast over central Africa and outlines its unimodal seasonality. On the other hand, forced by the Congo basin cell, the precipitable water regulates the deep convection from the vegetated surface of Congo basin, acting as a continental sea. This nonlinear mechanism separates the rainfall into three distinct regimes – (i) the moisture-convergence-controlled regime, with convective rainfall exclusively occurring in the rainy season and (ii) the local evaporation-controlled regime with drizzle and (iii) the precipitable-water-controlled regime, with exponential increase of rainfall that both occur during the dry season.

How to cite: Longandjo, G.-N. T., Monyela, B. M., and Rouault, M.: Drivers of the Annual Cycle of Rainfall over Central Africa: The Role of Water Vapor and the Mid-Tropospheric Meridional Circulation, EGU General Assembly 2023, Vienna, Austria, 23–28 Apr 2023, EGU23-13299, https://doi.org/10.5194/egusphere-egu23-13299, 2023.

In this communication, we will present results from an analysis of the variability of the vertically averaged (i.e., barotropic) atmospheric circulation simulated by climate models, which integrate the current Coupled Model Intercomparison Project (CMIP6). The variabilities in two ensembles of Atmospheric Model Intercomparison Project (AMIP) simulations were compared with the variabilities in two ensembles of fully coupled simulation counterparts of the current CMIP6 (Castanheira and Marques, 2022).

The atmospheric models simulate less variability of the barotropic atmospheric circulation over the Northern Atlantic and more variability over the North Pacific when compared with the corresponding variabilities in the ERA5 reanalysis (“observations”), at intraseasonal and interannual scales. When integrated over the whole globe, the variability in the coupled climate simulations is smaller than the variability in the corresponding AMIP simulations. The smaller global variability of the coupled simulations results in no mean overestimation of the subtropical jet variability in the North Pacific, but further underestimation of the jet stream variability in the Northern Atlantic. The results suggest that the reduction of the biases in the barotropic atmospheric variability over the North Pacific, in the coupled climate simulations, is achieved through compensating biases in the mean Sea Surface Temperatures (SSTs). Moreover, the reduction of the positive biases in the North Pacific seems to be associated with a reduction of the excitation of the most unstable barotropic mode of the atmospheric circulation, which contributes also to a reduction of the barotropic atmospheric variability in the North Atlantic region.

 Acknowledgements: The CESAM is supported by FCT/MCTES through the project UIDP/50017/2020+ UIDB/ 50017/20201+LA/P/0094/2020.

References

Castanheira, J. M., Marques, C. A. F. (2022). Biases of the Barotropic Atmospheric Circulation Variability in CMIP6 Models. Journal of Climate,  Vol. 35, 5071–5085 DOI: 10.1175/JCLI-D-21-0581.1. 

How to cite: Castanheira, J. M. and Marques, C. A. F.: How can the most unstable barotropic mode of atmospheric models contribute for the explanation of atmospheric variability biases of climate models in the North Atlantic?, EGU General Assembly 2023, Vienna, Austria, 23–28 Apr 2023, EGU23-13716, https://doi.org/10.5194/egusphere-egu23-13716, 2023.

EGU23-13726 | ECS | Posters on site | CL4.6

Causal drivers of central Amazon precipitation variability during austral summer 

Emily Henningsen, Giorgia Di Capua, and Reik V. Donner

The South American monsoon system is one key component of the regional climate of South America, and its interannual as well as intraseasonal variability is of great relevance for water availability over vast parts of the continent. To further develop advanced prediction systems for hydro-meteorological conditions, a better understanding of the underlying atmospheric as well as coupled ocean-atmosphere and land-atmosphere processes governing the intraseasonal variations of rainfall is of paramount importance.


In this work, we focus on rainfall variability over the central Amazon basin (CAB) as a particularly vulnerable region during the peak season of the monsoon (December to February). In order to identify causal precursors of CAB rainfall variability and their mutual causal interdependence structure, we employ a causal discovery tool called Peter and Clark Momentary Conditional Information (PCMCI) algorithm to monthly average sea surface temperature (SST), mean sea level pressure (MSLP) and precipitation fields from reanalysis data sets for two different time periods, 1950-2020 and 1979-2020. As a first step, anomaly maps and correlation maps are used to identify potential candidate drivers of the precipitation variability in the CAB at lead times of up to three months. The causal effect networks resulting from the subsequent application of the PCMCI algorithm unveil the causal dependencies of different climate phenomena with CAB rainfall variability during austral summer, confirming previous results based on standard correlation analyses and allowing for a quantitative assessment of the different effects.


Among others, we find that SST changes in the tropical Pacific Nino1+2 region close to the South American west coast have a causal effect on CAB precipitation, with lower SSTs promoting more rainfall with a lag of one to two months. Notably, we do not find any similar statistically significant causal impact of SST variations in the Nino3.4 region in the central tropical Pacific, which is commonly most closely associated with the El Niño Southern Oscillation. Additionally, the obtained causal effect networks demonstrate that the Southern Annular Mode (SAM) causally influences the Amundsen Sea Low (ASL), which in turn causally affects the CAB rainfall. Both links are negative, i.e. a positive SAM mode leads to a deeper ASL with a lag of one month, and a deeper ASL supports higher precipitation in central Amazonia with a lag of three months. Finally, SST variability in the tropical North Atlantic as well the Madden-Julian Oscillation do not show a significant causal relationship with CAB rainfall. Our obtained findings are qualitatively consistent among the two different time periods. However, when analyzing data starting only after 1979, some links increase in strength while generally less causal links show up in the networks.

How to cite: Henningsen, E., Di Capua, G., and Donner, R. V.: Causal drivers of central Amazon precipitation variability during austral summer, EGU General Assembly 2023, Vienna, Austria, 23–28 Apr 2023, EGU23-13726, https://doi.org/10.5194/egusphere-egu23-13726, 2023.

EGU23-14053 | ECS | Posters virtual | CL4.6

Cyclonic development in the Mediterranean Basin in CMIP6 models using a neural network approach 

George Blougouras, Kostas Philippopoulos, Chris G. Tzanis, and Constantinos Cartalis

The Mediterranean basin is located between the subtropical high-pressure belt and the mid-latitude westerlies and is characterized by complex topography. Its orography, the relatively warm Mediterranean Sea, which is a source of energy and moisture, and the land-sea interactions result in significant cyclonic behavior in the synoptic and sub-synoptic scales. Due to its high sensitivity to climate change forcings, the Mediterranean region is considered a climate change hot spot, with impacts, such as the decline in the projected precipitation, leading to increasing aridification in an already water-stressed area. The above highlight the importance of examining the cyclonic development in the area and assessing the respective changes under different climate change scenarios. In this research, unsupervised machine learning algorithms are used in order to objectively identify cyclonic development in the Mediterranean basin using CMIP6 data for a subset of the different shared socio-economic pathways (SSP) that explore a wide range of possible future outcomes. In more detail, Sea Level Pressure from selected CMIP6 models is used as an input in a Self-Organizing Map (SOM) which is trained to identify the cyclone activity in the Mediterranean Basin for the 1981-2010 reference period. The ability of the network in terms of identifying effectively cyclogenesis regions and the transition probabilities is evaluated. The trained SOM is used to classify CMIP6 mid-century (2031-2060) projections and changes in the frequencies of occurrence of cyclonic development. These are evaluated in terms of physical drivers and regionally specific mechanisms. Examining the responses of cyclonic development to different forcing scenarios will not only shed light on the physical and dynamical processes that govern these circulations but will also allow identifying high–risk regions with potential socio-economic impacts.

How to cite: Blougouras, G., Philippopoulos, K., Tzanis, C. G., and Cartalis, C.: Cyclonic development in the Mediterranean Basin in CMIP6 models using a neural network approach, EGU General Assembly 2023, Vienna, Austria, 23–28 Apr 2023, EGU23-14053, https://doi.org/10.5194/egusphere-egu23-14053, 2023.

EGU23-15027 | ECS | Orals | CL4.6

Representation of relationship between PDO and global precipitation in CMIP6 models 

Jivesh Dixit, Vikram M. Mehta, and Krishna M. AchutaRao

Decadal Climate Variability (DCV) modes perturb regional climatic parameters across the globe at multi-year timescales. Precipitation is one such climatic parameter of socio-economic importance.

Our study examines the ability of Coupled Model Intercomparison Project Phase 6 (CMIP6) models in representing the observed teleconnection of DCV modes; Pacific Decadal Oscillation (PDO) and Tropical Atlantic SST Gradient with the global precipitation. We chose the subset of CMIP6 models that participate in both historical and hindcast experiments.

In this study we examine the relationship between the model's ability to simulate the long-term DCV pattern and its ability to simulate the teleconnection between DCV mode and global precipitation.

HadGEM3-GC31-MM and MPI-ESM-1-2-HR, which simulate the observed global SST anomaly pattern in the warm phase of PDO considerably well, also simulate observed global precipitation patterns during the warm phase of PDO quite well in regions like  central India, Europe, North- and South-America, Eastern Africa, Eastern Australia etc. However, BCC-CSM2-MR and NorCPM1 fail to effectively simulate observed precipitation patterns in the warm phase of PDO in regions like, North- and South-America, Africa etc. 

Hence, we found that models that are able to simulate the PDO pattern of SST are also able to represent the teleconnection between PDO modes and precipitation across the globe. We also examined the regression pattern of wind circulation, and the regression pattern of converging and diverging parts of the wind with PDO index. Models that better represent the observed warm phase of PDO pattern, also well represent the observed circulation pattern in respective phases of PDO. Similar analysis is also performed for TAG.


Keywords: Decadal Climate Variability (DCV), CMIP6, historical experiments, teleconnection, precipitation.

How to cite: Dixit, J., Mehta, V. M., and AchutaRao, K. M.: Representation of relationship between PDO and global precipitation in CMIP6 models, EGU General Assembly 2023, Vienna, Austria, 23–28 Apr 2023, EGU23-15027, https://doi.org/10.5194/egusphere-egu23-15027, 2023.

EGU23-15646 | ECS | Posters on site | CL4.6

Characterization of Mediterranean large-scale atmospheric circulation based on Jenkinson-Collison Weather Type classification. 

Juan Antonio Fernández-Granja, Ana Casanueva, Joaquín Bedia, Swen Brands, and Jesús Fernández

The evaluation of new generations of global climate models (GCMs) with respect to their large-scale circulation features is crucial for model development and has recently been brought into focus by the downscaling community, interested in the suitability of GCMs for downscaling purposes. In such evaluation experiments, additional uncertainties emerge from differences among the reference datasets used for evaluation, typically reanalyses. In this context, weather typing techniques are a useful tool for the classification of the full diversity of data into a few recurrent patterns that can serve as objective characterizations of either global or regional atmospheric circulation. A well-known weather typing classification algorithm is the Jenkinson-Collison Weather Type (JC-WT, Jenkinson and Collison 1977) approach. Although the methodology was originally developed for the British Isles (Lamb, 1972), the JC-WT approach can in principle be applied to any mid-to-high latitude region (Jones et al, 2013). Fernandez-Granja et al (2023) extended the limits of applicability from 23.5º to 80º latitude on both hemispheres, but the suitability of the method is questionable for certain seasons over some areas of the globe, such as the Mediterranean region in summer.

In this study, we first explore the applicability of the JC classification over the Mediterranean by linking the JC-WTs with main northern hemisphere teleconnection indices and blocking conditions. Further, the diversity of JC-WTs and occurrence of the unclassified type are used to examine the suitability of the method. Results show that the application of the JC-WT classification is physically meaningful in large parts of the domain. Secondly, fundamental characteristics of the JC-WTs such as transition probabilities between consecutive types and persistence of the dominant JC-WTs (number of time-steps staying in the same type) obtained for five different reanalyses are compared. Important differences among reanalyses are found, especially in summer, which may bring additional uncertainties when the method is used in model evaluation experiments. 

References:

Fernández-Granja, J. A., Brands, S., Bedia, J., et al (2023) Exploring the limits of the Jenkinson–Collison weather types classification scheme: a global assessment based on various reanalyses. Climate Dynamics. DOI: 10.1007/s00382-022-06658-7

Jenkinson A., Collison F. (1977) An initial climatology of gales over the north sea. synoptic climatology branch memorandum. Meteorological Office, 62

Jones P.D., Harpham C., Briffa K.R. (2013) Lamb weather types derived from reanalysis products. International Journal of Climatology 33(5):1129–1139. DOI: 10.1002/joc.3498

Lamb H. (1972) British isles weather types and a register of daily sequence of circulation patterns 1861-1971. Meteorological Office, Geophysical Memoir 116:1–85

How to cite: Fernández-Granja, J. A., Casanueva, A., Bedia, J., Brands, S., and Fernández, J.: Characterization of Mediterranean large-scale atmospheric circulation based on Jenkinson-Collison Weather Type classification., EGU General Assembly 2023, Vienna, Austria, 23–28 Apr 2023, EGU23-15646, https://doi.org/10.5194/egusphere-egu23-15646, 2023.

EGU23-15694 | Posters on site | CL4.6

Heat Waves over Eastern Balkans: A statistical analysis, possible causes and physical drivers. 

Hristo Popov and Oleg Stepanyuk

Heat wave is a period of prolonged abnormally high surface temperatures relative to those normally expected. Heat waves may form when high pressure system strengthens and remains over a region from several days up to several weeks. Severe and exceptional heat waves, such as those that occurred over the Balkans (2007), France (2003), or Russia (2010), are associated with increased mortality, health hazards, reduced personal work productivity and have significant economic impacts by compromising agricultural harvest. Extremely high air temperature values in the Balkan Region are associated with anticyclones formed at the Azores maximum or high-pressure ridges and advections of hot air from the south and southwest.

In our study we perform statistical analysis of the occurrence, durability and intensity of the heat waves over the Balkan Peninsula for the period 1980-2020 based on historical satellite and reanalysis datasets. We analyse correlation between heat waves occurrence and North Atlantic Oscillation Index and certain historical meteorological data for Atlantic and Mediterranean regions aiming to figure out possible causes and physical drivers of this phenomena. One of the mid-term goals of the project is to develop a CNN based predictive system for short and long-time forecasting of extreme weather conditions over the Balkans.


How to cite: Popov, H. and Stepanyuk, O.: Heat Waves over Eastern Balkans: A statistical analysis, possible causes and physical drivers., EGU General Assembly 2023, Vienna, Austria, 23–28 Apr 2023, EGU23-15694, https://doi.org/10.5194/egusphere-egu23-15694, 2023.

EGU23-16668 | ECS | Orals | CL4.6

Emergence of Low-Frequency Temperature Variability in Instrumental Data and Model Simulations 

Raphael Hébert and Thomas Laepple

The amplitude and spatial distribution of low-frequency natural variability is determinant for regional climate projections, but it is still poorly understood. 


In a previous study, pollen-based temperature reconstructions were used to quantify spatial patterns of millennial temperature variability. This showed an inverse relationship across timescales with sub-decadal variability from instrumental data in extra-tropical regions over land (Hébert et al., 2022, under review). We concluded that due to varying marine influence, regions characterized by stable oceanic climate at sub-decadal timescales experience stronger long-term variability while continental regions with higher sub-decadal variability show weaker long-term variability. Indications of this relationship could also be inferred from instrumental data alone as regions of low sub-decadal variability were more likely to exhibit a steeper increase of variability over multi-decadal timescales and vice versa. 


In the current work, the relationship found in the instrumental data was further investigated using different instrumental products. In addition, a large multi-model ensemble of CMIP6 models, as well as single-model ensembles, were considered for analysis and it was found that they do not systematically reproduce the relationship found in the instrumental data. This indicates a fundamental deficiency in the model simulations with regard to the mechanism driving the emergence of low-frequency climate variability. This characteristic being related to multi-decadal variability thus has important significance for multi-decadal regional climate projections and might be used as an emergent constraint in model evaluation and inter-comparison.

How to cite: Hébert, R. and Laepple, T.: Emergence of Low-Frequency Temperature Variability in Instrumental Data and Model Simulations, EGU General Assembly 2023, Vienna, Austria, 23–28 Apr 2023, EGU23-16668, https://doi.org/10.5194/egusphere-egu23-16668, 2023.

EGU23-16755 | Orals | CL4.6

An Atlantic interhemispheric teleconnection established by South American summer monsoon 

Wan-Ling Tseng, Yi-Chi Wang, Yu-chi Lee, Huang-Hsiung Hsu, and Noel Keenlyside

This paper reports the structure of an interhemispheric atmosphere–ocean coupling pattern, which occurs over the Atlantic Ocean from January to February, and refers to it as the Atlantic symmetric pattern (ASP). The ASP occurs in the middle–upper troposphere, with two trains of cyclonic–anticyclonic–cyclonic anomalous circulations aligned meridionally over the Atlantic Ocean. The sea surface temperature (SST) signature of the ASP, which is composed of a distinct SST dipole, is the leading mode of the interannual SST of the Southwest Atlantic Ocean. Experiments with the linear baroclinic model shows that the interhemispheric wave trains of the ASP can be excited as a Gill-type response to convection in the South American monsoon system and the South Atlantic convergence zone. Further studies are warranted to elucidate other aspects of the ASP, including teleconnection in the Northern Hemisphere and interactions with other climatic modes.

How to cite: Tseng, W.-L., Wang, Y.-C., Lee, Y., Hsu, H.-H., and Keenlyside, N.: An Atlantic interhemispheric teleconnection established by South American summer monsoon, EGU General Assembly 2023, Vienna, Austria, 23–28 Apr 2023, EGU23-16755, https://doi.org/10.5194/egusphere-egu23-16755, 2023.

EGU23-16955 | Posters on site | CL4.6

Tropical to extratropical interactions in the Southern Hemisphere 

Julie Arblaster

Tropical variability has long been identified as having an important influence on climate variability and change in the Southern Hemisphere (SH). In all three ocean basins, heating from tropical convection can generate stationary Rossby waves that propagate polewards and eastwards towards Antarctica, influencing temperature and rainfall patterns along the way. Recent studies have also highlighted the reverse – an influence of the polar regions on changes further north, for example, the stratospheric weakening of the SH polar vortex that contributed to the prolonged drought and extreme fire weather in Australia in the spring and summer of 2019. On longer timescales, the climate of the Southern Hemisphere has undergone significant changes over the past 30-50 years. The extratropical atmosphere has seen a shift to a more positive phase of the Southern Annular Mode and a stronger and more poleward eddy-driven jet, particularly in austral summer. While the influence of anthropogenic forcing such as ozone depletion and increasing greenhouse gases on these changes is well-established, the importance of tropical to extratropical interactions in shaping some recent events is becoming more evident. Examples include the deepening of the Amundsen Sea Low which has been associated with tropical Pacific decadal variability and the rapid decline in Antarctic sea ice in 2016 which was linked to a record positive Indian Ocean Dipole event. Recent insights into tropical to extratropical interactions, including the mechanisms through which they operate and links to observed changes on interannual to interdecadal timescales will be discussed.

How to cite: Arblaster, J.: Tropical to extratropical interactions in the Southern Hemisphere, EGU General Assembly 2023, Vienna, Austria, 23–28 Apr 2023, EGU23-16955, https://doi.org/10.5194/egusphere-egu23-16955, 2023.

EGU23-103 | ECS | Orals | CL4.7

Energetic Constraints on Baroclinic Eddy Heat Transport in a Rotating Annulus 

Cheng Qian, Peter Read, and David Marshall

We measure baroclinic eddy heat transport in a differentially heated rotating annulus laboratory experiment to test mesoscale ocean eddy parameterization frameworks. The differentially heated rotating annulus comprises a fluid placed between two upright coaxial cylinders which are maintained at different temperatures, usually with a cooled inner cylinder and a heated outer.  The annular tank is placed on a rotating table which provides conditions for baroclinic eddies to develop and equilibrate in different flow regimes, depending upon the imposed conditions. As the rotation speed is increased, the equilibrated flow changes from a steady or periodically varying low wavenumber pattern to a more complex, time-varying flow dominated by higher wavenumbers. With a topographic beta effect produced by conically sloping upper boundary, more complex flow regimes are observed combining zonal jets and eddies forming one or more parallel storm tracks. With this possibility to explore varied flow regimes, our experimental approach combines laboratory calorimetry and visualization measurements along with numerical simulations to derive the eddy heat transport properties. In the following, we focus on the visualisation measurement to test related assumptions and parametric dependencies for eddy transport. We first test the assumptions of a down-gradient temperature flux-gradient relationship, determining coefficients of the eddy transport tensor, and exploring scaling relations for the eddy coefficients. A clear statistical scaling is found between eddy heat fluxes and physical variables such as eddy energy, the beta effect, and the temperature contrast.

How to cite: Qian, C., Read, P., and Marshall, D.: Energetic Constraints on Baroclinic Eddy Heat Transport in a Rotating Annulus, EGU General Assembly 2023, Vienna, Austria, 23–28 Apr 2023, EGU23-103, https://doi.org/10.5194/egusphere-egu23-103, 2023.

EGU23-273 | ECS | Posters virtual | CL4.7

Understanding the variability and trend of the regional Hadley Cell over Asia-Pacific 

Pratiksha Priyam Baruah and Neena Joseph Mani

The zonal mean Hadley Cell (HC) has been reported to be expanding poleward in the last few decades. However, there has been no consensus on whether the zonal mean HC is strengthening or weakening. The features of longitudinally averaged HC are collectively modulated by various regional HCs, controlled by the regional differences in land-ocean distribution and topography. However, there have not been many studies exploring the variability and trend of regional HCs in a detailed manner. In this study, we examine the variability and long-term trend of the regional HC over the Asia-Pacific and explore the different factors contributing to the regional HC variability. Moist convection can regulate regional HCs on synoptic time scales through equatorial wave dynamics. The ocean–atmosphere coupled variability associated with the El Niño-Southern Oscillation (ENSO), and the modulation of tropical convection and equatorial waves are considered to exert a dominant control on the regional HC variability in the interannual timescale. In addition to the tropical forcing, the regional HC variability is also affected by fluxes transported by the midlatitude eddies from the subtropics to the tropics. In this study, we will be quantifying the relative role of these tropical and extratropical forcings in modulating the variability of regional HC over Asia-Pacific.


How to cite: Baruah, P. P. and Joseph Mani, N.: Understanding the variability and trend of the regional Hadley Cell over Asia-Pacific, EGU General Assembly 2023, Vienna, Austria, 23–28 Apr 2023, EGU23-273, https://doi.org/10.5194/egusphere-egu23-273, 2023.

EGU23-972 | ECS | Posters on site | CL4.7

Vanishing the El Niño-induced delay effect on the ice mass loss of West Antarctica under global warming 

Hyunju Lee, Emilia Kyung Jin, Byeong-Hoon Kim, and Won Sang Lee

West Antarctica has been losing their ice mass due to global warming, and the El Niño has delayed the ice mass loss by inducing weakening of the Amundsen Sea Low (ASL), encouraging of poleward moisture flux and consequent extreme precipitation. However, it is not yet revealed whether the delay effect will continue in the future. We analyzed future scenarios from the CMIP6 Earth system models (ESMs) to identify future change and identified that the El Niño-driven mass increase by precipitation will vanish in the high-emission future scenarios. Precipitation anomaly in response to El Niño starts to be negative from the 2050s in the SSP5-8.5 and from the 2060s in the SSP3-7.0, which means that the El Niño-driven delay effect disappears. It is because the moisture transport into West Antarctica is prevented due to east-equatorward migration of El Niño-induced ASL anomaly as global warming intensifies. The strengthened polar jet associated with positive Southern Annular Mode (SAM) trend moves the ASL anomaly east- and equatorward under global warming.

How to cite: Lee, H., Jin, E. K., Kim, B.-H., and Lee, W. S.: Vanishing the El Niño-induced delay effect on the ice mass loss of West Antarctica under global warming, EGU General Assembly 2023, Vienna, Austria, 23–28 Apr 2023, EGU23-972, https://doi.org/10.5194/egusphere-egu23-972, 2023.

 We show that the most prominent of the work theorems, the Jarzynski equality and the Crooks relation, can be applied to the momentum transfer at the air-sea interface using a hierarchy of local models. In the more idealized models, with and without a Coriolis force, the variability is provided from a Gaussian white-noise which modifies the shear between the atmosphere and the ocean. The dynamics is Gaussian and the Jarzynski equality and Crooks relation can be obtained analytically solving stochastic differential equations. The more involved model consists of interacting atmospheric and oceanic boundary-layers, where only the dependence on the vertical direction is resolved, the turbulence is modeled through standard turbulent models and the stochasticity comes from a randomized drag coefficient. It is integrated  numerically and can give rise to a non-Gaussian dynamics. Also in this case the Jarzynski equality allows for calculating a dynamic-beta ßD of the turbulent fluctuations (the equivalent of the thermodynamic-beta  ß=(kB T)-1 in thermal fluctuations). The Crooks relation gives the ßD as a function of the magnitude of the work fluctuations. It is well defined (constant) in the Gaussian models and can show a slight variation in the  more involved models. This demonstrates that recent concepts of stochastic thermodynamics used to study micro-systems subject to thermal fluctuations can further the understanding of geophysical fluid dynamics with turbulent fluctuations.

How to cite: Wirth, A.: Jarzynski equality and Crooks relation for local models of air-sea interaction, EGU General Assembly 2023, Vienna, Austria, 23–28 Apr 2023, EGU23-1066, https://doi.org/10.5194/egusphere-egu23-1066, 2023.

The Arctic is warming at a rate faster than any other oceans, a phenomenon known as Arctic amplification that has widespread impact on the global climate. In contrast, the Southern Ocean (SO) and Antarctica have been cooling over the past decades. The projection of these regions under global warming has a non-negligible model spread. Here we show that under a strong warming scenario from 1950 to 2100, comparing a cutting-edge high-resolution climate model to a low-resolution model version, the increase of Arctic amplification is 3 °C more and the SO and Antarctica warming is 2°C less. Previously ice-covered Arctic Ocean will exhibit greater SST variability under future global warming. This is due to an increased SST increase in summer due to sea ice retreat. Extreme warming events in the Arctic and SO, known as marine heat waves (MHW) that influence the ecology, are largely unknown. We find that the MHWs in the Arctic and SO are twice as strong in the high-resolution model version, where the increasing intensity of MHWs in the Arctic corresponds to strong decline (<-6% per decade) of sea ice. In both the high-resolution and low-resolution models, the duration of MHWs in the Arctic and SO shows a declining trend under global warming. The much stronger MHWs in the high-resolution model could be caused by two orders of magnitude more ocean turbulent energy. For example, the spatial patterns of SO MHW intensity correspond to the pattern of SO EKE. We conclude that the Arctic amplification and MHWs at high latitudes might be underestimated by the current generation of climate models with low resolution, and the SO and Antarctica warming might be overestimated. Our eddy- and storm-resolving model is expected to open new frontiers on how the system responds to human activities in a high CO2 world by evaluating the impact on past and future climate and environmental extremes.

How to cite: Gou, R., Lohmann, G., and Wu, L.: Increase in Arctic amplification and high-latitude marine extremes in the 21st century as obtained from high-resolution modelling, EGU General Assembly 2023, Vienna, Austria, 23–28 Apr 2023, EGU23-1649, https://doi.org/10.5194/egusphere-egu23-1649, 2023.

EGU23-1773 | ECS | Posters on site | CL4.7

Tropical Instability Waves in a High-Resolution Oceanic and Coupled GCM 

Li Tianyan and Yu Yongqiang

Tropical instability waves (TIWs) are the dominant mesoscale variability in the eastern equatorial Pacific Ocean. TIWs have direct impacts on the local hydrology, biochemistry and atmospheric boundary layer, and feedback on ocean circulations and climate variability. In this study, the basic characteristics of Pacific Ocean TIWs simulated by an eddy-resolving ocean model and a coupled general circulation model are evaluated. The simulated TIW biases mainly result from the mean climatology state, as TIWs extract eddy energy from the mean potential and kinetic energy. Both the oceanic and coupled models reproduce the observed westward propagating large-scale Rossby waves between approximately 2-8N, but the simulated TIWs have shorter wavelengths than the observed waves due to the shallower thermocline. Meanwhile, the weak meridional shears of background zonal currents and the less-tilted pycnocline in these two models compared to the observations causes weak barotropic and baroclinic instability, which decreases the intensity of the simulated TIWs. We then contrast the TIWs from these two models and identify the roles of atmospheric feedback in modulating TIWs. The latent heat flux feedback is similar to observation in the coupled model but absent in the ocean model, contributing to the stronger standard deviation (STD) of the TIW SST in the ocean model. The ocean model is not able to capture realistic air-sea interaction processes when forced with prescribed atmospheric forcing. However, the misrepresented atmospheric feedback in the ocean model tends to decrease the sea surface height (SSH) variability, and the current feedback damping effect is stronger in the ocean model than in the coupled model. Combined with weaker barotropic conversion rate and baroclinic conversion rate in the ocean model than in the coupled model, the STD of the TIW SSH in the ocean model is weaker.

How to cite: Tianyan, L. and Yongqiang, Y.: Tropical Instability Waves in a High-Resolution Oceanic and Coupled GCM, EGU General Assembly 2023, Vienna, Austria, 23–28 Apr 2023, EGU23-1773, https://doi.org/10.5194/egusphere-egu23-1773, 2023.

EGU23-1985 | ECS | Posters on site | CL4.7

Sensitivity of ocean heat content to atmospheric forcing in the period of global warming hiatus 

Chavely Albert Fernández, Armin Köhl, and Detlef Stammer

Between 1998 and 2012, there was a smaller rate of global warming, known as the "global warming hiatus". One of the suggested causes is that during this period additional heat sequestration occurs into the deep ocean layers such that deep layers warm at a greater rate than the upper layers. This research is focused on the origins of changes in ocean heat content during the hiatus period, defined in this case as the last 10 years of adjoint model run, where the cost function is defined. Adjoint sensitivities are used to determine the influence of atmospheric forcing (heat and freshwater fluxes and wind stress) on the ocean heat content.

The MIT General Circulation Model with a resolution of 2° x 2° is used over the period 1978-2008 to determine adjoint sensitivities of the globally and temporally (over the last 10 years, defined as hiatus period) integrated vertical heat fluxes across various depth levels. The contributions of different forcing components to the vertical heat flux anomalies are obtained from the scalar product between sensitivities and the anomalies of the atmospheric forcing.  For this, the atmospheric forcing anomalies are computed with respect to the climatology calculated over the period 1948-1968 when there was almost no change in the ocean heat content.

A more pronounced increase in ocean heat uptake during the hiatus period has been evidenced by the forward run of the model. Wind anomalies represent more than half of the contribution to the increase in heat flux across 300m, suggesting that the excess of heat stored by the ocean is transferred adiabatically to the deeper layers and that the zonal wind is one of the major drivers of ocean heat uptake. In the Southern Ocean, the sensitivities to the wind stress change from positive to negative when the hiatus starts. This indicates that, during the hiatus, the rate of change of ocean heat content is opposite to the one of the wind stress. The Southern Ocean presents smaller values of the computed amplitude weighted mean time, meaning that this region has the fastest response to changes in surface atmospheric forcing.

How to cite: Albert Fernández, C., Köhl, A., and Stammer, D.: Sensitivity of ocean heat content to atmospheric forcing in the period of global warming hiatus, EGU General Assembly 2023, Vienna, Austria, 23–28 Apr 2023, EGU23-1985, https://doi.org/10.5194/egusphere-egu23-1985, 2023.

 Widespread observed and projected increases in warm extremes, along with decreases in cold extremes, have been confirmed as being consistent with global and regional warming. However, based on observational datasets and state-of-the-art CMIP6 model simulations, we disclose that the decadal variation in the frequency of the surface air temperature (SAT) extremes over mid- to high latitudes over Eurasia (MHEA) in winter is primarily dominated by the thermodynamical effect of the surface heat fluxes release over the midlatitude North Atlantic induced by Atlantic multidecadal oscillation (AMO), which even masks the dynamical large-scale Rossby wave propagation. Besides, the stronger Atlantic meridional overturning circulation (AMOC) gives rise to both warm and cold extremes through increasing the variance of winter SAT over MHEA due to thermodynamical heat release and enhanced dynamical Rossby wave propagation.

How to cite: Wang, H.: Frequency of winter temperature extremes over Eurasia dominated by variabilities over the Atlantic Ocean, EGU General Assembly 2023, Vienna, Austria, 23–28 Apr 2023, EGU23-3106, https://doi.org/10.5194/egusphere-egu23-3106, 2023.

EGU23-3282 | ECS | Posters on site | CL4.7

Physics of the Eddy Memory Kernel of a Baroclinic Midlatitude Atmosphere 

Elian Vanderborght, Jonathan Demeayer, Henk Dijkstra, Georgy Manucharyan, and Woosok Moon

In recent theory trying to explain the origin of low-frequency atmospheric variability, the concept of eddy-memory has been suggested. In this view, the effect of synoptic scale heat fluxes on the mean flow depends on the history of the mean meridional temperature gradient. Mathematically, this involves a convolution of an integral kernel with the mean meridional temperature gradient over past times. In atmospheric studies, it has been proposed that the shape of this integral kernel is linked to the baroclinic wave life cycle. However, this hypothesis has yet to be supported by numerical and observational evidence. In this study we use a low-order two layer quasi-geostrophic atmospheric model (Demaeyer et al., 2020). By perturbing the model with a known forcing, linear response theory can be used to estimate the shape of the integral kernel. Using this methodology, we find an integral kernel that resembles the shape of an exponentially decaying oscillation, different from the simple exponentially decaying integral kernel assumed in most previous studies. By computing the energies and performing a sensitivity analysis, we link the shape of the integral kernel to atmospheric dynamical processes.

References:

J. Demaeyer, L. De Cruz, and S. Vannitsem. qgs: A flexible python framework of reduced-order multiscale climate
models. Journal of Open Source Software, 5(56):2597, 2020.

How to cite: Vanderborght, E., Demeayer, J., Dijkstra, H., Manucharyan, G., and Moon, W.: Physics of the Eddy Memory Kernel of a Baroclinic Midlatitude Atmosphere, EGU General Assembly 2023, Vienna, Austria, 23–28 Apr 2023, EGU23-3282, https://doi.org/10.5194/egusphere-egu23-3282, 2023.

EGU23-3492 | Orals | CL4.7

Variability of summer-time Arctic sea ice: the drivers and the contribution to the sea ice trend and extremes 

Mehdi Pasha Karami, Torben Koenigk, and Bruno Tremblay

Understanding the variability of summer-time Arctic sea ice at interannual to multidecadal time scales in the midst of anthropogenically forced sea ice decline is crucial for better predictions of sea ice conditions in the future climate and rapid changes in sea ice. Here, we apply time-frequency analysis to study the modes of variability, extreme events and the trend in the September Arctic sea ice in 100–150 year datasets. We extract the non-linear trend for the sea ice area and provide an estimate for the anthropogenic-driven sea ice loss. For the used dataset, the anthropogenic-related sea ice loss is found to have a rate of ~-0.25 million km2 per decade in the 1980’s and accelerating to ~-0.47 million km2 per decade in 2010’s. By assuming the same rate of sea ice loss in the future, and without the contribution of the internal variability and feedbacks, we can approximate the occurrence of summer sea-ice free Arctic to be around 2060. Regarding the dominant modes of variability for the September sea ice, we find that they have periods of around 3, 6, 17, 28 and 55 years, and show what drives these modes and how they contribute to sea ice extreme events. The main atmospheric and oceanic drivers of sea ice modes include the Arctic oscillation and Arctic dipole anomaly for the 3-year mode, variability of sea surface temperature (SST) in Gulf Stream region for the 6-year mode, decadal SST variability in the northern North Atlantic Ocean for the 17-year mode, Pacific decadal oscillation (PDO) for the 28-year mode, and Atlantic multidecadal Oscillation (AMO) for the 55-year mode. Results show that changes in the sea ice due to internal variability can be as large as forced changes thus can slow down or accelerate the background anthropogenic-driven sea ice loss. By applying the same method, we also present modes of variability and trend of sea ice in the large ensemble global model simulations of EC-Earth model (SMHI-LENS) for the future climate projections and different climate scenarios.

How to cite: Karami, M. P., Koenigk, T., and Tremblay, B.: Variability of summer-time Arctic sea ice: the drivers and the contribution to the sea ice trend and extremes, EGU General Assembly 2023, Vienna, Austria, 23–28 Apr 2023, EGU23-3492, https://doi.org/10.5194/egusphere-egu23-3492, 2023.

Global circulation patterns are analysed using the mean meridional circulation (MMC) from ERA-Interim for the period of 1979 – 2017. The global isentropic MMC consists of a single overturning cell in each hemisphere with net heat transport from the equator to the pole. Six clusters are identified from daily data that are associated with one of four seasons. Two solstitial MMC clusters represent either stronger or weaker circulation in the winter hemisphere. We show that long-term trends do not reflect a gradual change in the atmospheric circulation, but rather a change in the frequency of preferred short-term circulation regimes. Before the late 1990s the clusters showing a stronger (weaker) winter circulation are becoming less (more) frequent; from around year 2000 the trends have paused. These trends are in close agreement with the change in the low-stratospheric Antarctic ozone trends reported by earlier studies. Our findings also reveal a strong coupling between Southern and Northern Hemispheres during boreal winter. Following Hartmann et al. (2022), we hypothesize that anomalous polar vortex over Antarctica leads to anomalies in the sea surface temperatures (SST) in the tropical Pacific that impact the circulation in both hemispheres. Furthermore, we show that consecutive solstice season demonstrates coherent anomalies in the frequency of circulation regimes. We discuss possible reasons for such relationship.

References:
Hartmann, D. L., Kang, S., Polvani, L. & Xie, S.-P. The Antarctic ozone hole and the pattern effect on climate sensitivity. (2022) doi:10.1073/pnas.

How to cite: Rudeva, I., Boschat, G., and Lucas, C.: How can atmospheric trends be explained by changes in frequency of short-term circulation regimes and what is the role of the Antarctic ozone?, EGU General Assembly 2023, Vienna, Austria, 23–28 Apr 2023, EGU23-4557, https://doi.org/10.5194/egusphere-egu23-4557, 2023.

EGU23-5305 | ECS | Orals | CL4.7

Linking ITCZ migrations to the AMOC and North Atlantic/Pacific SST decadal variability 

Eduardo Moreno-Chamarro, John Marshall, and Tom L. Delworth

This contribution discusses the link between migrations in the intertropical convergence zone (ITCZ) and changes in the Atlantic meridional overturning circulation (AMOC), Atlantic multidecadal variability (AMV), and Pacific decadal oscillation (PDO). We use a coupled climate model that allows us to integrate over climate noise and assess underlying mechanisms. We use an ensemble of ten 300-yr-long simulations forced by a 50-yr oscillatory North Atlantic Oscillation (NAO)-derived surface heat flux anomaly in the North Atlantic, and a 4000-yr-long preindustrial control simulation performed with GFDL CM2.1. In both setups, an AMV phase change induced by a change in the AMOC’s cross-equatorial heat transport forces an atmospheric interhemispheric energy imbalance that is compensated by a change in the cross-equatorial atmospheric heat transport due to a meridional ITCZ shift. Such linkages occur on decadal time scales in the ensemble driven by the imposed forcing, and internally on multicentennial time scales in the control. Regional precipitation anomalies differ between the ensemble and the control for a zonally averaged ITCZ shift of similar magnitude, which suggests a dependence on timescale. Our study supports observational evidence of an AMV–ITCZ link in the twentieth century and further links it to the AMOC, whose long-time-scale variability can influence the phasing of ITCZ migrations. In contrast to the AMV, our calculations suggest that the PDO does not drive ITCZ migrations, because the PDO does not modulate the interhemispheric energy balance.

How to cite: Moreno-Chamarro, E., Marshall, J., and Delworth, T. L.: Linking ITCZ migrations to the AMOC and North Atlantic/Pacific SST decadal variability, EGU General Assembly 2023, Vienna, Austria, 23–28 Apr 2023, EGU23-5305, https://doi.org/10.5194/egusphere-egu23-5305, 2023.

EGU23-5962 | Orals | CL4.7

Tropical precipitation biases in nextGEMS storm-resolving Earth System Models 

Simona Bordoni, Roberta D'Agostino, and Adrian M. Tompkins

Global Earth System Models at storm-resolving resolutions (SR-ESM, with horizontal resolutions of ~4km) are being developed as part of the nextGEMS collaborative European EU’s Horizon 2020 programme. Through breakthroughs in simulation realism, these models will eventually allow us to understand and reliably quantify how the climate will change on a global and regional scale, and how the weather, including its extreme events, will look like in the future.

As part of the Storms & Ocean theme, we are exploring how resolving convective storms, ocean mesoscale eddies, and air-sea interaction on these scales influences the development of tropical SST anomalies and their influence on the mean climate (ITCZ and circulation biases) and its variability. Existing biases in the SR-ESM simulations in the first two development cycles are interpreted using the vertically integrated atmospheric energy budget to disentangle local and remote influences on tropical precipitation. More specifically, these biases are decomposed in hemispherically symmetric and antisymmetric components, which are linked, respectively, to biases in the atmospheric net energy input near the equator (tropical SST biases, low level clouds, etc) and to the cross-equatorial atmospheric energy flux (driven by inter-hemispheric contrast in net energy input, for instance biases in clouds in the southern ocean). We also explore the role that transient eddies, both of extratropical and tropical origin that are usually neglected in this framework, play in the global energetics and tropical precipitation patterns.

How to cite: Bordoni, S., D'Agostino, R., and Tompkins, A. M.: Tropical precipitation biases in nextGEMS storm-resolving Earth System Models, EGU General Assembly 2023, Vienna, Austria, 23–28 Apr 2023, EGU23-5962, https://doi.org/10.5194/egusphere-egu23-5962, 2023.

    Poleward atmospheric energy transport is determined by the overall equator-to-pole radiative imbalance. As this imbalance is projected to remain fairly constant in end-of-century greenhouse gas forcing scenarios, an increase in poleward latent heat transport must be accompanied by a reduction in dry static energy flux. Since midlatitude energy transport is dominated by the eddy component, changes in the energy budget go hand in hand with changes in cyclone characteristics. From a dynamical perspective, the enhanced condensation due to climate change promotes intensification, prolongs lifetime of cyclones, and can increase stationarity of anticyclones. However, it also tends to increase static stability and thereby reduce baroclinicity, which is another important driver of cyclone development. Additionally, baroclinicity is projected to increase at upper levels due to tropical amplification, to decrease at low levels as a result of Arctic amplification, and to be affected by land-sea temperature contrast changes. As these processes are at play simultaneously, isolating the role of moisture is rather complicated. Therefore, in addition to coupled climate model simulations we use idealized aquaplanet simulations to single out the effects of individual physical mechanisms and address the question: if the overall poleward energy transport remains largely unaffected by global warming, how do cyclone characteristics change in the presence of increased moisture in the atmosphere?

    For bridging the gap between the global energy flux and synoptic-scale features, we analyse the role of increasing moisture for shaping midlatitude storm tracks in present and future climates from both an Eulerian and a Lagrangian perspective. We apply the moist static energy (MSE) framework that allows partitioning atmospheric energy fluxes into eddy and mean, dry and moist components. Here, eddies are related to cyclones and anticyclones, while the mean energy flux is associated with planetary waves and the mean meridional overturning circulation. The goal is to relate the eddy MSE fluxes to feature-based results including extratropical cyclone number, lifetime, intensity, location, and tilt. By combining results from both global-scale eddy energy fluxes and synoptic-scale feature quantities, we aim to improve the understanding of the role of latent heating in shaping the mean properties of extratropical storm tracks. Therefore, a central question of this project is whether and how changes in cyclone quantities can be linked to changes in latent heat transport and release. Building on what we learn from bringing the two perspectives together, we will proceed to investigating the impact of increased latent heating on midlatitude storm tracks. 

How to cite: Zibell, J., Schemm, S., and Hermoso Verger, A.: Combining global-scale atmospheric heat transport and synoptic-scale extratropical cyclone characteristics to understand the role of latent heating for midlatitude storm tracks, EGU General Assembly 2023, Vienna, Austria, 23–28 Apr 2023, EGU23-7216, https://doi.org/10.5194/egusphere-egu23-7216, 2023.

EGU23-7348 | ECS | Orals | CL4.7

An Energy Transport View of ENSO Responses to Volcanic Forcing 

Shih-Wei Fang and Claudia Timmreck

El Niño-Southern Oscillation (ENSO) is one of the major climate phenomena impacting the globe. When a volcanic eruption happens, how ENSO will respond has still no consensus in proxy data though climate models tend to have an El Niño tendency. In this study, using 100 members of diverse (in locations and magnitude) idealized volcanic forcing ensembles, we found that the ENSO responses to north and south extra-tropical eruptions are related to the energy transport to the cooling hemisphere and involve direct and indirect responses through atmospheric and oceanic transport. The north extratropical forcing leads to more El Niño up to three years after eruptions, which is related to the direct atmospheric responses of the southward movement of ITCZ for transporting more energy to the north. The indirect oceanic transport then takes over afterward, leading to more La Niña due to more upwelling in the equatorial eastern Pacific. The south extra-tropical eruptions have less El Niño tendency due to the northward replacement of ITCZ. As the indirect oceanic transport also results in equatorial mean state changes, which may lead to distinct ENSO responses. The long-term ENSO responses from extra-tropical cooling will also be investigated through the simulations from the Extratropical-Tropical Interaction Model Intercomparison Project (ETIN-MIP) experiment.

How to cite: Fang, S.-W. and Timmreck, C.: An Energy Transport View of ENSO Responses to Volcanic Forcing, EGU General Assembly 2023, Vienna, Austria, 23–28 Apr 2023, EGU23-7348, https://doi.org/10.5194/egusphere-egu23-7348, 2023.

EGU23-9914 | Posters on site | CL4.7

Changes in river temperature, discharge and heat flux based on new observational data for Yenisei basin and modeling 

Alexander Shiklomanov, Richard Lammers, Alexander Prusevich, Irina Panyushkina, and David Meko

River temperature plays an important role in numerous biological and ecological processes within the Yenisei River basin and it is very sensitive to changes in climatic characteristics and anthropogenic disturbances. Water temperature and river discharge characterize heat or energy flux, which is important in northern latitudes for river freeze-up and ice break-up processes and thermal riverbank erosion. The changes in heat flux in river estuary can also significantly impact various biophysical processes in coastal ocean waters.

We use new water temperature data and river discharge records for 12 observational gauges in the Yenisei River basin to analyze changes in water temperature and heat flux from upstream to downstream over 1950-2018. Preliminary results show significant increases for most gauges in maximum annual water temperature as well as in 10-days mean water temperature during May-June and September-October. There were no significant changes in river temperature during July-August unless the gauges were impacted by reservoir regulations. The river heat flux has significantly increased in central and northern parts of the Yenisei basin and decreased in the south, mainly due to discharge variability.

The gridded hydrological Water Balance Model (WBM) developed at the University of New Hampshire, that takes into account various anthropogenic activities, was used to simulate river discharge and water temperature for entire Yenisei basin with a 5 minute spatial resolution river network using several climate reanalysis products (MERRA2, ERA5 and NCEP-NCAR).  The modeled results were verified with observational data and simulations using the MERRA2 climate drivers demonstrated the best match with observations (Nash-Sutcliffe model efficiencies coefficients were greater than 0.5 for both river temperature and discharge). Maps of modeled changes in runoff, river temperature and heat flux show the opposite changes in the southern and northern parts of Yenisei basin. The model simulations correspond well with observational data even for heavily disturbed river reaches. For example, they show unfrozen water with positive temperatures during the winter below large dams and reservoirs.       

The WBM was also applied to project changes in water temperature, discharge and heat flux up to 2100 for several SSPs and GCMs from CMIP6. In spite of heterogenous projected changes in these parameters across Yenisei basin, significant increases in discharge and heat flux to the Arctic Ocean are expected.

How to cite: Shiklomanov, A., Lammers, R., Prusevich, A., Panyushkina, I., and Meko, D.: Changes in river temperature, discharge and heat flux based on new observational data for Yenisei basin and modeling, EGU General Assembly 2023, Vienna, Austria, 23–28 Apr 2023, EGU23-9914, https://doi.org/10.5194/egusphere-egu23-9914, 2023.

EGU23-11159 | ECS | Orals | CL4.7

Causal model evaluation of Arctic-midlatitude process during the boreal cold season in CMIP6 

Evgenia Galytska, Katja Weigel, Dörthe Handorf, Ralf Jaiser, Raphael Köhler, Jakob Runge, and Veronika Eyring

Linked to increased sea ice loss, the Arctic region has warmed at least four times faster than the global average over the past 40 years. Mutual links between amplified Arctic warming with changes and variability in midlatitude weather have been discussed in several studies. Nevertheless, the lack of consistent conclusions between observations and model simulations obfuscates the interpretation behind the mechanisms of Arctic-midlatitude teleconnections. To contribute to the understanding of Arctic-midlatitude connections that occur in conditions of amplified Arctic warming, we applied causal discovery to analyse causal and contemporaneous links. Initially, we calculated causal dependencies for monthly mean ERA5 reanalysis data from the European Centre for Medium-Range Weather Forecasts (ECMWF) and Hadley Centre Sea Ice and Sea Surface Temperature among local and remote processes. Then, by comparing causal graphs detected in reanalyses data with a number of climate model historical simulations from the Coupled Model Intercomparison Project Phase 6 (CMIP6), we assessed the performance of climate models and evaluated the robustness of the observed Arctic-midlatitude connections in the current climate. By comparing causal graphs from the CMIP6 historical and Scenario Model Intercomparison Project (ScenarioMIP) we estimated future changes in Arctic-midlatitude teleconnections towards the end of the century. In this study, we focus on the differences in the mechanism of Arctic-midlatitude teleconnections that occur during the boreal cold season, i.e. early winter (October-November-December), winter (December-January-February), and late winter (January-February-March). In this study, we will present the major findings of Galytska et al., 2022 discussing how causal model evaluation helps to summarize major differences between causal interdependencies detected in observations and simulated by a number of climate models. Understanding these differences can be the basis for further improvement of the representation of Arctic-midlatitude teleconnections in climate models.

References. 

Evgenia Galytska, Katja Weigel, Dörthe Handorf, Ralf Jaiser, Raphael Köhler, Jakob Runge, and Veronika Eyring. Causal model evaluation of Arctic-midlatitude teleconnections in CMIP6. Authorea. October 06, 2022. DOI: 10.1002/essoar.10512569.1


How to cite: Galytska, E., Weigel, K., Handorf, D., Jaiser, R., Köhler, R., Runge, J., and Eyring, V.: Causal model evaluation of Arctic-midlatitude process during the boreal cold season in CMIP6, EGU General Assembly 2023, Vienna, Austria, 23–28 Apr 2023, EGU23-11159, https://doi.org/10.5194/egusphere-egu23-11159, 2023.

EGU23-12377 | ECS | Posters on site | CL4.7

Thermodynamic assessment of simulations of the last deglaciation with an Earth system model of intermediate complexity 

Muriel Racky, Irene Trombini, Klaus Pfeilsticker, Nils Weitzel, and Kira Rehfeld

As we observe and expect severe changes in the Earth’ climate, the analyses of past climate state transitions is of major value for improving our Earth system understanding. Under this objective, the last deglaciation (~ 21 ka to 9 ka before present), the transition from the Last Glacial Maximum (LGM) to the Holocene, is an ideal case study. During this transition, the orbital configuration gradually changed and greenhouse gases have risen, which caused a sharp decline in northern hemisphere ice sheets and an increase in the global mean surface temperature.

We create an ensemble of deglaciation simulations with a modified version of the Planet Simulator, an Earth system model of intermediate complexity (EMIC). We produce single and combined forcing simulations for further investigation from a thermodynamic perspective. The response to the transiently changing radiative forcing is investigated in terms of energy and entropy budgets of the atmosphere. Here, we focus on the deglacial evolution of the material entropy production (MEP). Its contributions represent the strength of major climate features such as the kinetic energy generation rate, vertical and horizontal heat transport and the hydrological cycle. Preliminary results show an increase of the global mean MEP from the LGM to the Holocene because of a strengthening of the hydrological contribution. In contrast, the relative importance of kinetic energy dissipation and turbulent heat diffusion in the boundary layer decrease. Our work can provide the basis for investigating the MEP as a diagnostic quantity with other models and for other climate state transitions.

How to cite: Racky, M., Trombini, I., Pfeilsticker, K., Weitzel, N., and Rehfeld, K.: Thermodynamic assessment of simulations of the last deglaciation with an Earth system model of intermediate complexity, EGU General Assembly 2023, Vienna, Austria, 23–28 Apr 2023, EGU23-12377, https://doi.org/10.5194/egusphere-egu23-12377, 2023.

EGU23-12939 | Orals | CL4.7

The contribution of Arctic marine heatwaves to the minimum sea ice extent as compound events 

Armineh Barkhordarian, David Nielsen, and Johanna Baehr

On the global scale, the frequency of marine heatwaves (MHWs) is projected to increase further in the twenty-first Century. In our earlier study we demonstrate that the high-impact major marine heatwaves over the northeast Pacific are co-located with a systematically-forced long-term warming pool, which we attribute to forcing by elevated greenhouse gases levels (GHG), and the recent industrial aerosol-load decrease (Barkhordarian et al., 2022).  In current study we show that the magnitude of Arctic MHWs has significantly increased since 2006, and has exceeded the pre-industrial climate bounds since then. We here perform statistical attribution methodologies, and provide a quantitative assessment of whether GHG forcing was necessary for the Arctic MHWs to occur, and whether it is a sufficient cause for such events to continue to repeatedly occur in the future.

The probability of necessary causation of Arctic MHWs intensity, increases with increasing the severity of MHWs, and saturate to 1.0 by the time MHWs intensity exceeds the 2°C, indicating that any MHWs over the Arctic with an intensity higher than 2°C is entirely attributable to the inclusion of GHG forcing. These amplified extreme MHWs in the Arctic have each been accompanied by a record decline in Arctic Sea ice, in particular in the years 2007, 2012, 2016 and 2020. Over the last decade, MHWs occur in the Arctic where sea ice melt in June is 4 %/year faster, the ice-free season is ~3 months longer, the ocean heat-uptake is 50 W/m2 higher, and the sea surface temperature is ~2°C warmer, in comparison with the previous decade. In autumn surface evaporation rate is increasing, the increased low clouds favor more sea ice melt via emitting stronger longwave radiation. In summary, prolonged Arctic marine heatwaves, triggered by faster early summer sea ice melt, will accelerate Arctic warming, and cause Arctic Sea ice extent to shrink even faster in the near future.

Barkhordarian, A., Nielsen, D.M. & Baehr, J. Recent marine heatwaves in the North Pacific warming pool can be attributed to rising atmospheric levels of greenhouse gases. Nature Communications Earth & Environment, 3, 131 (2022). https://doi.org/10.1038/s43247-022-00461-2


How to cite: Barkhordarian, A., Nielsen, D., and Baehr, J.: The contribution of Arctic marine heatwaves to the minimum sea ice extent as compound events, EGU General Assembly 2023, Vienna, Austria, 23–28 Apr 2023, EGU23-12939, https://doi.org/10.5194/egusphere-egu23-12939, 2023.

EGU23-13091 | Posters on site | CL4.7

Emergent constraints on the future Arctic lapse-rate feedback 

Olivia Linke, Nicole Feldl, and Johannes Quaas

Arctic amplification (AA) is largely attributed to the effect of sea ice decline leading to greater surface solar absorption and further ice melt, and the vertical structure of the warming. The latter aspect evokes the positive lapse-rate feedback (LRF), which is commonly understood as an effect of stable stratification: The warming in the Arctic is particularly strong close to the surface, but muted aloft. This limits the outgoing long-wave radiative flux at the top-of-the-atmosphere (TOA) relative to vertically uniform warming.

We estimate the future Arctic LRF in 43 global climate models (GCMs) from the highest emission pathway SSP5 of CMIP6. The GCMs simulate a large spread of future AA (2-8 K above global warming) and Arctic LRF (1-4 K warming contribution) at the end of the century 2070-2099. Our work aims to identify emerging relationships between this spread and observable aspects of the current climate to ultimately narrow down the range of future Arctic climate predictions.

Previous studies have identified an emerging relationship for the surface-albedo feedback based on the observed seasonal cycle of Arctic sea ice. We similarly derive a positive relationship (r=0.70) between future and seasonal LRF, but due to its nature, no direct observation of the LRF exists. However, we find relationships between the future LRF and observable sea ice metrics, namely sea ice concentration, seasonality, extent and area. From these relationships, the sea ice concentration provides the strongest correlation (r=-0.76) for the area-averaged Arctic sea ice cover. This relationship implies a contribution of the LRF to future Arctic warming of approx. 2 K, which further relates to an AA of 4 K above global average at the end of the century.

We further emphasise the physical meaning behind our constraint: The negative emerging relationship implies that models with a lower Pan-Arctic sea ice concentration produce a larger LRF in the future. However, when dividing the entire sea ice area into regions of sea ice retreat (SIR) and persisting sea ice (PSI) in the future prediction, the relationship becomes positive over these two area-averaged regions. Thereby, the negative overall relationship is merely a result of the area-size distribution of SIR vs. PSI across the spread of model simulations. We conclude that while the Pan-Arctic perspective enables the emergent constraint, the physical meaning is hidden: A higher initial sea ice concentration produces a stronger positive Arctic LRF by setting the stage for greater sea ice retreat.

How to cite: Linke, O., Feldl, N., and Quaas, J.: Emergent constraints on the future Arctic lapse-rate feedback, EGU General Assembly 2023, Vienna, Austria, 23–28 Apr 2023, EGU23-13091, https://doi.org/10.5194/egusphere-egu23-13091, 2023.

EGU23-14141 | Orals | CL4.7

Underestimation of Arctic warming trends in sub-seasonal forecasts 

Steffen Tietsche, Frederic Vitart, Michael Mayer, Antje Weisheimer, and Magdalena Balmaseda

The Arctic has warmed substantially over the last decades and will continue to do so owing to global warming in conjunction with polar amplification. The changing mean state poses many challenges to the construction, evaluation and calibration of subseasonal-to-seasonal forecasting systems, because it puts into question the representativeness of the system's retrospective forecasts (reforecasts). Furthermore, any inconsistencies with observed trends degrade the forecast skill and point to deficiencies in either the physical modelling or the initialization methods. Here, we assess the consistency of boreal winter trends of surface air temperature (SAT) in the Eurasian Arctic between the ERA5 reanalysis and ECMWF sub-seasonal reforecasts initialised from ERA5, for the 35-year period 1986-2021. We present methods to quantify robustness and importance of the observed trends, and to quantify the consistency of reforecast trends with these observed trends. We find that, in large parts of the marine Arctic, the reforecasts clearly underestimate the reanalsyis warming trend of about 1 K per decade at lead times beyond two weeks. For longer lead times, the reforecast trend is less than half of the reanalysis trend, with very high statistical significance. We present a series of numerical experiments to investigate potential reasons for the trend underestimation. These concern the sea-ice thermodynamic coupling to the atmosphere, impact of sea surface temperatures, and possible remote atmospheric influences from the North Atlantic and the Tropics. The outcome of these experiments provides guidance for future improvements in the physical forecast model and data assimilation methods needed to faithfully represent and predict Arctic climate variability and change.

How to cite: Tietsche, S., Vitart, F., Mayer, M., Weisheimer, A., and Balmaseda, M.: Underestimation of Arctic warming trends in sub-seasonal forecasts, EGU General Assembly 2023, Vienna, Austria, 23–28 Apr 2023, EGU23-14141, https://doi.org/10.5194/egusphere-egu23-14141, 2023.

EGU23-14470 | Posters on site | CL4.7

A first look at the new PolarRES ensemble of polar regional climate model storylines to 2100 

Ruth Mottram, Priscilla Mooney, and Jose Abraham Torres and the PolarRES Consortium

The Horizon 2020 project PolarRES is coordinating a large international consortium of regional climate modelling groups in building a new ensemble of regional climate projections out to 2100. The ensemble is built at very high resolution (~12km) and using common domains, and set-ups to give directly comparable model outputs. At the same time, all regional climate models have been upgraded to a next-generation set-up, producing an ensemble of unprecedented sophistication.

We use a storyline approach, focused on Arctic amplification and cyclones in the northern hemisphere and Southern Annular Mode variability in Antarctica, to select global climate models for forcing on the boundaries. Each regional climate modelling group will downscale ERA5 and multiple global climate models. The data produced from these simulations will be used to improve process understanding under present and future conditions as well as to identify impacts of climate change in the polar regions.

Here, we present the experimental protocol developed in PolarRES and give details of the different regional climate models used, their setup, processes and domains as well as an overview of the outputs and planned applications. We show preliminary analysis of hindcast outputs to assess the performance of the ensemble. We invite other regional climate modelling groups outside the PolarRES consortium to consider using the same CORDEX -compatible model set-up and we are happy to receive suggestions of further spin-off studies or requests for collaboration.


How to cite: Mottram, R., Mooney, P., and Torres, J. A. and the PolarRES Consortium: A first look at the new PolarRES ensemble of polar regional climate model storylines to 2100, EGU General Assembly 2023, Vienna, Austria, 23–28 Apr 2023, EGU23-14470, https://doi.org/10.5194/egusphere-egu23-14470, 2023.

EGU23-15746 | Orals | CL4.7

Simulating oceanic mesoscale eddy dynamics: A comparison of novel parameterizations and energy diagnostics and their impact on the global ocean circulation 

Stephan Juricke, Sergey Danilov, Marcel Oliver, Anton Kutsenko, and Kai Bellinghausen

In this study, we present a variety of parameterizations for simulating ocean eddy dynamics including novel viscous and kinetic energy backscatter closures. Their effect is analyzed using new diagnostics that allow for application on unstructured meshes.

Ocean mesoscale eddy dynamics play a crucial role for large-scale ocean currents as well as for the variability in the ocean and climate. The interactions between eddies and the mean flow affect strength, position and variations of ocean currents. Mesoscale eddies have a substantial impact on oceanic heat transport and the coupling between the atmosphere and ocean. However, at so-called eddy-permitting model resolutions around ¼°, eddy kinetic energy and variability is often substantially underestimated due to excessive dissipation of energy. Despite ever-increasing model resolutions, eddy-permitting simulations will still be used in uncoupled and coupled climate and Earth system simulations for years to come.

To improve the presentation of eddy dynamics in such resolution regimes, we present and systematically compare a set of viscous and kinetic energy backscatter parameterization with different complexity. These schemes are implemented in the unstructured grid, finite volume ocean model FESOM2 and tested in both idealized channel and global ocean simulations. We show that kinetic energy backscatter and adjusted viscosity parameterizations can alleviate some of the substantial eddy related biases, for example biases in sea surface height variability, mean currents and in water mass properties. We then further analyze the effect of these schemes on energy and dissipation spectra using new diagnostics that can be extended to the unstructured grid used by FESOM2. The rigorous intercomparison allows to make informed decisions on which schemes are the most suitable for a given application, considering the complexity of the schemes, their computational costs, their adaptability to various model resolutions and any simulation improvements related to a specific scheme. We will show that novel viscous and kinetic energy backscatter schemes outperform previously used, classical viscous closures. Furthermore, when compared to higher resolution simulations, they are computationally less expensive but achieve similar results.

How to cite: Juricke, S., Danilov, S., Oliver, M., Kutsenko, A., and Bellinghausen, K.: Simulating oceanic mesoscale eddy dynamics: A comparison of novel parameterizations and energy diagnostics and their impact on the global ocean circulation, EGU General Assembly 2023, Vienna, Austria, 23–28 Apr 2023, EGU23-15746, https://doi.org/10.5194/egusphere-egu23-15746, 2023.

EGU23-1417 | ECS | Posters on site | CL4.8

Assembling the climate story: use of storyline approaches in climate-related science 

Eulàlia Baulenas, Gert Versteeg, Marta Terrado, Julia Mindlin, and Dragana Bojovic

Scenario-based approaches, including the concept of storylines, were introduced in climate science to provide unity of discourse, integrate the physical and socioeconomic components of phenomena, and make climate evolution more tangible. The use of storylines by multiple scholar communities and the novelty of some of its applications renders the concept ambiguous nonetheless, because the term hides behind a wide range of understandings and methodologies that often collide ontologically and epistemically. This semi-systematic literature review identifies three approaches that use storylines as a keystone concept: scenarios –familiar for their use in IPCC reports, discourse-analytical approaches, and physical climate storylines. After screening all peer-reviewed articles that mention climate and storylines, we selected 270 articles, with 158, 55, and 57 in each category. Results indicate that each community works with different methods and understandings. Moreover, these approaches have received criticism in their assembly of storylines: either for lacking explicitness or for the homogeneity of expertise involved. We propose that cross-pollination amongst the approaches could improve the goal to support climate action. Good practices are the involvement of a broader range of disciplines, use of mixed-methods, storyline assessment against a wider set of quality criteria, and stakeholder participation in key stages of the process.

How to cite: Baulenas, E., Versteeg, G., Terrado, M., Mindlin, J., and Bojovic, D.: Assembling the climate story: use of storyline approaches in climate-related science, EGU General Assembly 2023, Vienna, Austria, 23–28 Apr 2023, EGU23-1417, https://doi.org/10.5194/egusphere-egu23-1417, 2023.

EGU23-5082 | ECS | Orals | CL4.8

Representing storylines with causal networks to support decision making 

Taro Kunimitsu, Marina Baldissera Pacchetti, Alessio Ciullo, Jana Sillmann, Theodore G. Shepherd, Ümit Taner, and Bart van den Hurk

Physical climate storylines, which are physically self-consistent unfoldings of events, have been powerful tools in understanding regional climate impacts. We show how embedding physical climate storylines into a causal network framework allows user value judgments to be incorporated into the storyline in the form of probabilistic Bayesian priors, and can support decision making through inspection of the causal network outputs.

We exemplify this through a specific storyline, namely a storyline on the impacts of tropical cyclones on the European Union Solidarity Fund. We outline how the constructed causal network can incorporate value judgments, particularly the prospects on climate change and its impact on cyclone intensity increase, and on economic growth. We also explore how the causal network responds to policy options chosen by the user. The resulting output from the network leads to individualized policy recommendations, allowing the causal network to be used as a possible interface for policy exploration in stakeholder engagements. 

How to cite: Kunimitsu, T., Baldissera Pacchetti, M., Ciullo, A., Sillmann, J., Shepherd, T. G., Taner, Ü., and van den Hurk, B.: Representing storylines with causal networks to support decision making, EGU General Assembly 2023, Vienna, Austria, 23–28 Apr 2023, EGU23-5082, https://doi.org/10.5194/egusphere-egu23-5082, 2023.

EGU23-5133 | Posters on site | CL4.8

Similarity-based storylines of future climate extremes in Switzerland 

Sven Kotlarski, Alina Mastai, Kathrin Wehrli, and Erich M. Fischer

The heatwave of 2003, the flooding of 2005, the drought of 2018, or the snow-scarce winter of 2019/2020 are vivid examples of extreme weather events affecting Switzerland. The CH2018 climate scenarios for Switzerland show that such kind of events will become more intense in the future, depending on the future emission pathway and the considered time horizon. So far, CH2018-based information is typically communicated as changes in the mean or extremes of a climate variable, including the uncertainty of these changes. Presenting information in this manner is scientifically correct, but not tangible for everyone. Interested stakeholders often have difficulties to imagine what the future climate, and in particular how future extreme conditions might look like.

To enhance the uptake of CH2018 scenario information by stakeholders we here present a newly developed method to create similarity-based storylines and apply it to a historic heatwave event. The resulting storylines show local impacts in four different sectors at individual locations in Switzerland. In each case, the historical record-breaking heat summer of 2003 is related to a future extreme summer represented by the CH2018 scenarios assuming the RCP8.5 emission scenario. Specific indicators help to create unique heat-related storylines. In the alpine setting of Davos, the number of dry hiking weather days increases in a future extreme summer to the delight of hikers and alpine summer tourism. In contrast, the southern cities of Sion and Geneva face less favorable prospects. The fire danger massively increases in dry locations such as Sion. The population in Geneva will encounter an even stronger heat exposure compared to 2003. Finally, the living conditions for a potent agricultural pest considerably improve throughout Switzerland, threatening agriculture during a similar future extreme.

The new similarity-based storylines facilitate the understanding of locally relevant processes linked to climate extremes, provide an improved insight into how extreme events quantitatively change with climate change, give examples of possible impacts, and finally try to stimulate public awareness for possible consequences of future climate change.

How to cite: Kotlarski, S., Mastai, A., Wehrli, K., and Fischer, E. M.: Similarity-based storylines of future climate extremes in Switzerland, EGU General Assembly 2023, Vienna, Austria, 23–28 Apr 2023, EGU23-5133, https://doi.org/10.5194/egusphere-egu23-5133, 2023.

EGU23-5164 | ECS | Posters on site | CL4.8

Projected amplification of summer marine heatwave intensity in the Northeast Pacific Ocean in a warming world 

Marylou Athanase, Antonio Sánchez-Benítez, Helge Goessling, Felix Pithan, and Thomas Jung

Marine heatwaves are on the rise: their frequency, intensity, and duration are expected to increase in a warming world. Yet it remains unclear whether local feedback processes could amplify extreme ocean temperatures. A prominent marine heatwave recently occurred in the Northeast Pacific Ocean in summer 2019, exhibiting the highest sea surface temperatures ever recorded in this area since the availability of satellite observations in 1979. Here, we use fully-coupled model experiments, termed “nudged storylines”, in which the evolution of large-scale winds in the free troposphere is nudged to the observed (reanalysed) one before and during the summer 2019 event, to generate close analogues of this record-breaking marine heatwave for past, present, and plausible future climates. We show in particular that future climate analogues of the marine heatwave may warm 50% more than what is expected from the projected global-mean ocean warming. Together with the rapid Northeast Pacific mean warming, air-sea feedback processes lead to a projected warming amplification of 1°C above the 1.9°C global-mean ocean temperature rise. Primary drivers of this amplification are a reduction in clouds and ocean mixed-layer depth, as well as anomalous air advection from fast-warming subpolar regions. Our results show that marine heatwave temperatures may warm substantially faster than the global and regional background temperature, increasing the stress on local ecosystems and fishery resources.

How to cite: Athanase, M., Sánchez-Benítez, A., Goessling, H., Pithan, F., and Jung, T.: Projected amplification of summer marine heatwave intensity in the Northeast Pacific Ocean in a warming world, EGU General Assembly 2023, Vienna, Austria, 23–28 Apr 2023, EGU23-5164, https://doi.org/10.5194/egusphere-egu23-5164, 2023.

EGU23-7354 | ECS | Posters on site | CL4.8

Using pseudo-global-warming storylines and process-based ecosystem models for impact assessment of extreme events on agricultural production. 

Lioba Martin, Edwin Haas, David Kraus, Rüdiger Grote, and Clemens Scheer

With an increasing probability of extreme events, their significance for agricultural production has also grown. Ecosystem models enable us to integrate current knowledge about plant-climate interactions with climate change scenarios. Since impacts of weather extremes differ depending on crop, intensity, length, and timing, a process-based approach is necessary to quantify to what extent extreme events impact agricultural production. We used the ecosystem model LandscapeDNDC to evaluate the effect of extreme conditions, like drought or intense heat waves, on agricultural production. We modified LandscapeDNDC to better account for heat stress by integrating a yield reduction function dependent on the timing and intensity of a heat wave and crop fatality due to stress overload. We validated the model performance using historical yield records at the regional scale.

In the second step, we applied pseudo-global-warming storylines to assess how the extreme heat wave of 2018 – 2022 would have affected yields of maize and wheat in a + 2 K warmer world. This exercise identifies which regions are most vulnerable regarding climate extremes and quantifies to what extent extreme climate events can affect crop yields compared to baseline conditions. Using process-based ecosystem models in combination with storyline-based climate projections is a promising approach to assess the impact of low-probability extreme weather events with a potentially high-impact outcome on agricultural production.

How to cite: Martin, L., Haas, E., Kraus, D., Grote, R., and Scheer, C.: Using pseudo-global-warming storylines and process-based ecosystem models for impact assessment of extreme events on agricultural production., EGU General Assembly 2023, Vienna, Austria, 23–28 Apr 2023, EGU23-7354, https://doi.org/10.5194/egusphere-egu23-7354, 2023.

EGU23-7398 | Posters on site | CL4.8

Devising storylines of Arctic climate change from a large ensemble of CMIP6 models 

Xavier Levine, Ryan Williams, Lise Seland Graff, and Priscilla Mooney

While polar amplification has been established as a defining feature of Arctic climate change, poor quantitative agreement among models remains when assessing its magnitude and spatial pattern. Here, we apply the storyline approach to a large ensemble of CMIP6 models, with the aim of distilling the wide spread in model predictions into four physically plausible outcomes of Arctic climate change. This is made possible by leveraging strong covariability in the climate system: specifically, we find that differences in Barents Sea warming and lower tropospheric warming among CMIP6 models explain most of the intermodel variability in pan-Arctic surface climate response to global warming. Based on this novel finding, we compare regional disparities in climate change across the four storylines, and discuss potential implications for modeling climate change impacts on ecosystems and human activities. 

How to cite: Levine, X., Williams, R., Seland Graff, L., and Mooney, P.: Devising storylines of Arctic climate change from a large ensemble of CMIP6 models, EGU General Assembly 2023, Vienna, Austria, 23–28 Apr 2023, EGU23-7398, https://doi.org/10.5194/egusphere-egu23-7398, 2023.

EGU23-7889 | ECS | Posters on site | CL4.8

Fates of the Beaufort Gyre: Location, Extent and Strength 

Raphael Köhler, Marylou Athanase, Xavier Levine, Ryan Williams, and Céline Heuzé

The Beaufort Gyre is a major reservoir of freshwater in the Arctic Ocean and plays an important role in shaping the sea ice distribution. The variations in Beaufort Gyre strength, and its capacity to accumulate or release freshwater, are primarily determined by the stationary Beaufort High pressure system. Multiple studies have suggested a potential future weakening of the Beaufort High, thus driving a projected weakening of the Beaufort Gyre. Yet, in contrast, the ongoing reduction and thinning of the Arctic sea ice has been shown to strengthen the Gyre in recent years – a trend likely to continue into the future. 

We investigate these potentially competing effects of projected sea ice decline and changing atmospheric patterns on the Beaufort Gyre location, extent, and strength. To this end, we employ a novel storyline approach to identify plausible fates of the Beaufort Gyre in a warming climate, generated from the suite of available CMIP6 models. The different storylines are determined based on the strong or weak modelled response to these two local drivers - Arctic sea ice decline and Beaufort High pressure system weakening - on changes in Beaufort Gyre strength. While the CMIP6 multi-model mean response in the location, extent and strength of the Beaufort Gyre does not exhibit any distinct future changes under emission scenario SSP585, the storylines however reveal contrasting futures. For example, in a future with strong sea ice decline but only a weak decrease of Beaufort High pressure, the storyline indicates a spin-up of the Beaufort Gyre alongside a strong Arctic-wide surface salinity reduction. In contrast, a future with weak sea ice decline but a strong Beaufort High pressure decrease is characterised by a slow-down of the Beaufort Gyre and more regionally confined surface salinity changes. The storyline approach thus highlights that we urgently need to better constrain our model projections in order to reliably predict changes in upper Arctic ocean circulation and freshwater distribution, which play a crucial role for the future Arctic climate and response of both marine and terrestrial ecosystems. 

How to cite: Köhler, R., Athanase, M., Levine, X., Williams, R., and Heuzé, C.: Fates of the Beaufort Gyre: Location, Extent and Strength, EGU General Assembly 2023, Vienna, Austria, 23–28 Apr 2023, EGU23-7889, https://doi.org/10.5194/egusphere-egu23-7889, 2023.

EGU23-8561 | Posters on site | CL4.8

Dynamical Constraints on regional Projections of Extreme Precipitation Events 

Patrick Pieper, Donghe Zhu, Erich Fischer, and Stephan Pfahl

Extreme precipitation events cause major ecological and societal hazards (e.g. river flooding and landslides). Aggravatingly, climate change will likely exacerbate extreme precipitation events on a global scale. Scientifically even more concerning, however, are remaining major uncertainties in projections of regional extreme precipitation events, which hamper and complicate local adaptation measurements around the globe. The arguably largest source of these remaining uncertainties stems from climate models feuding about the dynamic evolution of atmospheric circulation; atmospheric circulation governs moisture transport and profoundly affects the location of extreme precipitation events as well as their severity around the globe. We exploit this feud among climate models to narrow down the arguably largest source of uncertainttiesin projections of extreme precipitation events through a storyline approach. For a given location, the approach: (i) unravels the properties of driving weather systems that repeatedly gave rise to extreme precipitation events in the past, (ii) assesses the fidelity of a large suite of models, participating in the Coupled Model Intercomparison Project 6 (CMIP6), in representing these driving weather systems in historical simulations (1950-2015), and (iii) constrains regional projections of extreme precipitation events based on the ascertained fidelity of models.

Here, we present such a storyline approach that dynamically constrains regional projections of extreme precipitation events. Accompanying the outline of the approach, we identify regions that are particularly plagued by uncertain projections of extreme precipitation events and showcase for a subset of these regions how to track down weather systems that repeatedly gave rise to extreme precipitation events in the past.

How to cite: Pieper, P., Zhu, D., Fischer, E., and Pfahl, S.: Dynamical Constraints on regional Projections of Extreme Precipitation Events, EGU General Assembly 2023, Vienna, Austria, 23–28 Apr 2023, EGU23-8561, https://doi.org/10.5194/egusphere-egu23-8561, 2023.

EGU23-9368 | ECS | Posters on site | CL4.8

Storyline simulations suggest dampening of 2020 Siberian heatwave analogues in warmer climates 

Antonio Sánchez Benítez, Marylou Athanase, Thomas Jung, Felix Pithan, and Helge Goessling

Siberia experienced an exceptionally warm first half of 2020, with temperatures peaking on 20th June, when the weather station at Verkhoyansk registered 38ºC – the highest-ever temperature recorded north of the Arctic Circle. This event led to a state of emergency declaration due to a wide range of natural and human disasters, including permafrost collapse or wildfires. Several previous attribution studies have found anomalous synoptic atmospheric circulation and human-caused climate change as major drivers of this event. However, it remains unclear how such an event would unfold in warmer climates.

In this work, we have constructed analogues of this extreme event in past and future climates, so-called “storylines”, employing spectral nudging experiments using the coupled climate model AWI-CM1. In these simulations, large-scale free-troposphere winds are constrained toward ERA5 data, and the model is run for different boundary and initial conditions (pre-industrial, present, +2K, +3K, +4K climates). By doing so, this approach focuses on the less uncertain thermodynamic influence of climate on extreme events, constraining the much more uncertain dynamical changes.

Our present-climate simulations realistically reproduce the observed Siberian heatwave and the exceptionally warm conditions before the event. When the different background climates are considered, on the one hand, a robust global warming amplification is obtained until spring. On the other hand, a future global warming dampening or even local cooling is observed in phase with the heatwave peak. We examine the mechanisms that damp warming during the heatwave analogue, especially changes in soil moisture and radiative fluxes. 

How to cite: Sánchez Benítez, A., Athanase, M., Jung, T., Pithan, F., and Goessling, H.: Storyline simulations suggest dampening of 2020 Siberian heatwave analogues in warmer climates, EGU General Assembly 2023, Vienna, Austria, 23–28 Apr 2023, EGU23-9368, https://doi.org/10.5194/egusphere-egu23-9368, 2023.

EGU23-9513 | ECS | Orals | CL4.8

Plausible Drying and Wetting Scenarios for Summer Rainfall in Southeastern South America: a storyline approach 

Julia Mindlin, Carolina S. Vera, Theodore G. Shepherd, and Marisol Osman

Summer rainfall trends in Southeastern South America (SES) have received a lot of attention in the past decades because of the socioeconomic impacts affecting an area where around 200 million people live. Literature identifies more than one driving mechanism for them, some of which have opposing effects. However, it is still not clear how much each mechanism has contributed to the observed trends or how their combined influence will affect future trends. In this work, we study SES summer rainfall future trends that can be explained by mechanisms related to large-scale extratropical circulation responses in the Southern Hemisphere (SH) to remote drivers of regional climate change. We find that regional uncertainty in SES during summer is well represented by combining the influence of four remote drivers, two of them characterizing tropical Pacific SST warming patterns, another one related to tropical upper tropospheric amplification of surface warming, and a fourth one related to the delay of the SH stratospheric polar vortex breakdown date. To do so, we quantify the contributions of the different remote drivers to SES rainfall trends and assess the sensitivity of circulation in SH to these drivers. Then, we analyze how the circulation response can mediate the relationship between regional precipitation changes and each of the remote driver responses. We use these quantifications and a storyline framework to answer the following research questions: 

  • Are all of the plausible scenarios for summer rainfall in the SES region characterized by wet conditions only? Is it possible that some plausible scenarios could also involve very weak wetting or even drying trends?
  • Can the differences between these contrasting scenarios be explained by variations in atmospheric circulation patterns forced by large-scale remote drivers?

By applying a storyline approach, the representation of uncertainty in summer precipitation trends in SES is improved and plausible drying scenarios are found in addition to the wetting ones. Our storyline approach is able to identify the highest impact storylines and deal with the complexity of working with four remote drivers. In addition, we show how the definition of the SES regional box can impact the results, given that if the spatial pattern characterizing the dynamical influences are complex and the impacts can be averaged out.

How to cite: Mindlin, J., Vera, C. S., Shepherd, T. G., and Osman, M.: Plausible Drying and Wetting Scenarios for Summer Rainfall in Southeastern South America: a storyline approach, EGU General Assembly 2023, Vienna, Austria, 23–28 Apr 2023, EGU23-9513, https://doi.org/10.5194/egusphere-egu23-9513, 2023.

EGU23-9533 | ECS | Orals | CL4.8

Linking the Filomena snowstorm event in Spain to global warming 

Damián Insua-Costa, Marc Lemus-Cánovas, Martín Senande-Rivera, María del Carmen Llasat, Juan J. González-Alemán, and Gonzalo Miguez-Macho

In early January 2021, an exceptional snowstorm hit Spain, causing widespread damage and chaos across the country. The extreme event was driven by the extratropical cyclone Filomena and left a snow cover of up to 50 cm in the capital, Madrid. In the days following the event, many media outlets hypothesized a link between the episode and climate change. Here we explore this link using a pseudo-global warming attribution approach. Specifically, we reproduce the event using the WRF regional atmospheric model forced with ERA5 reanalysis data. The thermodynamic fields, including temperature and humidity throughout the atmospheric column, skin temperature, and sea surface temperature, are perturbed using five different CMIP6 climate models in order to simulate the event in both a pre-industrial and a future (SSP5-8.5) scenario. In addition, the greenhouse gas concentrations are adjusted to their respective pre-industrial and future values, and the dynamic conditions (i.e., the atmospheric pattern) are fixed using a spectral nudging technique. We found that global warming affects snowfall amounts very unevenly across the country. At higher elevations and especially in northern areas, where the temperature increase is insufficient to convert snow to rain, the amount of snowfall increases due to a general increase in atmospheric water vapor available for precipitation. However, in lower elevations and especially in the south of the country, anthropogenic forcing results in a generalized reduction in snowfall amounts. Under an extreme future warming scenario, increases in snow water equivalent are found to be above +30% in many areas in the north, while in large parts of the south, snow is converted entirely to rain (-100%). Our results demonstrate that the effect of climate change on these cold and wet compound events is highly location-dependent, meaning that in one place the amount of snow recorded during one of these extreme events may increase due to warming, while in another place a few kilometres away the snow may disappear completely.

How to cite: Insua-Costa, D., Lemus-Cánovas, M., Senande-Rivera, M., Llasat, M. C., González-Alemán, J. J., and Miguez-Macho, G.: Linking the Filomena snowstorm event in Spain to global warming, EGU General Assembly 2023, Vienna, Austria, 23–28 Apr 2023, EGU23-9533, https://doi.org/10.5194/egusphere-egu23-9533, 2023.

EGU23-11466 | Orals | CL4.8 | Highlight

Probing the Unfathomable: Ensemble Boosting for Physical Climate Storylines of Unseen Extremes 

Erich Fischer, Urs Beyerle, Luna Bloin-Wibe, Claudia Gessner, Vincent Humphrey, Flavio Lehner, Angeline Pendergrass, Sebastian Sippel, Joel Zeder, and Reto Knutti

Recent unprecedented extremes such as the 2023 New Year’s winter warm spell in Europe, the 2022 summer heat and dryness in China and Europe, the 2021 Pacific Northwest heatwave, the 2021 floods in northwestern Germany and the 2020 Siberian heat anomaly broke previous observed record intensities by large margins. Based on the observations up to the year before the event, some of these record-shattering extremes were inconceivable. Could the scientific community have better quantified the potential for such unseen events based on the current generation of climate models?

Here, we demonstrate how a new ensemble boosting approach can be used to generate physically coherent storylines of such unseen events. In ensemble boosting a fully-coupled free-running climate model (CESM2) is used to develop physical storylines of very rare extremes. To this end, the most extreme events in an initial-condition large ensemble for the near future are re-initialized with slightly perturbed atmospheric initial conditions to efficiently generate events with magnitudes unprecedented in the observational record.

We demonstrate that, with this approach, CESM2 can simulate events that e.g. substantially exceed the magnitude of the 2021 Pacific Northwest (PNW) heatwave anomaly. Even though the most extreme ensemble members were only selected based on the local temperature anomaly over the PNW region, they show a very similar temporal evolution and spatial pattern as the observed event. The associated 500hPa geopotential height anomaly is remarkably similar to the observed event with a strong anticyclone over PNW that is part of a wave pattern extending over much of the Northern Hemisphere. We further show that in some of the storylines pre-conditioning dry soils strongly contributed to the heatwave intensity, whereas in others, heatwaves of similar magnitude occur even at average land surface conditions.

We further develop storylines for heatwaves in the Greater Paris and Chicago regions of much greater intensities than ever observed. Particularly the US Midwest, where no intensification of heatwaves has been observed in recent decades, has not experienced anything close to the heatwave intensities possible in the coming years.

Finally, we demonstrate examples how ensemble boosting can also be used to generate storylines for multi-year drought events and large-scale heavy precipitation extremes and compare the findings to other storyline approaches. Event storylines based on ensemble boosting can be used in impact studies that require physical consistency across variables, e.g., for the evaluation of humid heatwaves or compound events, for assessing wildfire risks or for ecosystem modelling.

How to cite: Fischer, E., Beyerle, U., Bloin-Wibe, L., Gessner, C., Humphrey, V., Lehner, F., Pendergrass, A., Sippel, S., Zeder, J., and Knutti, R.: Probing the Unfathomable: Ensemble Boosting for Physical Climate Storylines of Unseen Extremes, EGU General Assembly 2023, Vienna, Austria, 23–28 Apr 2023, EGU23-11466, https://doi.org/10.5194/egusphere-egu23-11466, 2023.

EGU23-12905 | Posters virtual | CL4.8

Downscaling climate change impacts on socio-economic parameters in a storyline-based investigation 

Reyko Schachtschneider and Jan Saynisch-Wagner

Climate change has drastic impact on our lives and many socio-economic parameters. The exact consequences are hard to quantify and in general not obvious and not clear to the general public. In this work we use the storyline scenarios from within the SCENIC project for the prediction of various socio-economic parameters in warmer climates. We use machine learning algorithms to investigate how parameters that have direct impacts on society and the population develop in different warmer world scenarios. For this purpose we train echo state networks. Input data are temperature and humidity fields over Europe. Output data are time series of, e.g., mortality rates, forest fires, crop yield, and consumer price indices from Germany. The output data are predicted under the investigated climate scenarios of +2K and +4K with respect to pre-industrial time.

How to cite: Schachtschneider, R. and Saynisch-Wagner, J.: Downscaling climate change impacts on socio-economic parameters in a storyline-based investigation, EGU General Assembly 2023, Vienna, Austria, 23–28 Apr 2023, EGU23-12905, https://doi.org/10.5194/egusphere-egu23-12905, 2023.

EGU23-13928 | ECS | Posters on site | CL4.8

Storylines of Southern Hemisphere climate change from CMIP6: Antarctica and the Southern Ocean 

Ryan Williams, Gareth Marshall, Xavier Levine, Lise Graff, and Priscilla Mooney

The manifestation of regional changes in climate at high latitudes is notoriously uncertain according to climate models, aside from the expected polar amplification of the global warming trend. This poses a particular issue for policymakers in designing targeted adaptation and mitigation strategies, in limiting the impact of human-induced climate change. The leading mode of uncertainty arises from the unknown response of the atmospheric circulation to global warming, resulting from inconsistencies in the model representation of key physical processes, which are typically parameterised as they operate on sub-grid spatial scales. 

Using the latest suite of state-of-the-art climate models as part of the sixth phase of the Coupled Model Intercomparison Project (CMIP6), a storyline approach is adopted to derive physically plausible scenarios of climate change over Antarctica and adjacent regions of the Southern Ocean for the end-of-the-century (2070-2099), according to both emission scenarios SSP3-7.0 and SSP5-8.5. We identify two robust features of climate change simulated across all models known to lead to a strengthening and poleward displacement of the eddy-driven mid-latitude jet: (1) the decline in Southern Hemisphere sea ice extent and (2) the strengthening of the wintertime stratospheric polar vortex and delayed summertime breakdown. Whilst the response of these two aspects is consistent in sign, a large intermodel spread exists in terms of magnitude. Using a multi-linear regression framework, we generate storylines of climate change conditional upon the magnitude of change in each driver centred around the multi-model mean response. We examine the response of both the near-surface climate (Southern Annular Mode, air temperature, precipitation) and Southern Ocean (SSTs, salinity and mixed layer depth) for both an extended austral summer (DJFM) and winter season (JJA). Through ancillary evaluations of model historical performance with respect to ERA-5 reanalysis over the 1985-2014 period, including investigation of both prognostic and diagnostic variables, the presented storylines are refined to help minimise the impact of model deficiencies in affecting the realism of the generated storylines. Our results highlight the merit of using the storyline approach to identify future potential scenarios of regional climate response and constrain uncertainty in Antarctic climate predictions. Storyline impact assessments for the Southern Ocean marine ecosystem, particularly the ecologically sensitive South Scotia Sea region, will later be investigated within the EU Horizon 2020 ‘PolarRES’ project through storyline-guided downscaling experiments using regional climate models.  

How to cite: Williams, R., Marshall, G., Levine, X., Graff, L., and Mooney, P.: Storylines of Southern Hemisphere climate change from CMIP6: Antarctica and the Southern Ocean, EGU General Assembly 2023, Vienna, Austria, 23–28 Apr 2023, EGU23-13928, https://doi.org/10.5194/egusphere-egu23-13928, 2023.

EGU23-14387 | ECS | Orals | CL4.8

The role of a weakened Atlantic Meridional Overturning Circulation in modulating temperature and precipitation extremes over Europe 

Qiyun Ma, Xiaoxu Shi, Dmitry Sidorenko, Patrick Scholz, Gerrit Lohmann, and Monica Ionita

The Atlantic meridional overturning circulation (AMOC) plays an important role in regulating global and regional climates, especially the European climate, as it affects northward heat transport. Climate model simulations project a decline in the strength of AMOC under future climate change, although high uncertainties exist across models. The potential slowdown of AMOC could cause large and rapid changes in the climate and is therefore regarded as a ‘low probability-high impact’ event. However, how a weakening AMOC affects temperature and precipitation extremes remains poorly understood. Here we use a state-of-the-art global climate model, a new version of the Alfred Wegener Institute Climate Model (AWI-CM3), to quantify these impacts on Europe. We have performed freshwater hosing experiments to weaken the strength of AMOC and to investigate its sensitivity to different freshwater forcing regions. Our results reveal that the largest decline in AMOC generally appears when additional freshwater is put directly at regions of deepwater formation, especially around the Irminger Sea. As atmospheric responses, widespread cooling and less precipitation are found in the Northern Hemisphere mid-latitudes. We further identify the changes in precipitation and temperature extremes on different timescales. Droughts and cold days are very pronounced under AMOC attenuations, and we argue that they may have a stronger impact than the system's mean responses. Our results provide implications for understanding European weather and climate response to a weakening of AMOC in the past, present, and future.

How to cite: Ma, Q., Shi, X., Sidorenko, D., Scholz, P., Lohmann, G., and Ionita, M.: The role of a weakened Atlantic Meridional Overturning Circulation in modulating temperature and precipitation extremes over Europe, EGU General Assembly 2023, Vienna, Austria, 23–28 Apr 2023, EGU23-14387, https://doi.org/10.5194/egusphere-egu23-14387, 2023.

EGU23-14764 | ECS | Orals | CL4.8

Attribution of a warmer climate on temperature extremes over Europe using high-resolution storyline simulations with ICON-CLM 

Tatiana Klimiuk, Patrick Ludwig, Florian Ehmele, Joaquim Pinto, and Peter Braesicke

Besides ongoing research on general future climate changes, the actual attribution of changed climatic conditions on single extreme events becomes an important topic. The focus of this study is to place historical European temperature extremes into a warmer climate context using the storyline approach. Global storyline simulations show that local near-surface temperature anomalies during a heat wave can be significantly amplified compared to the mean global warming level. To refine these results and for a better process understanding, the storylines produced with the global model of the Alfred Wegener Institute (AWI-CM1; also contributing to CMIP6) are dynamically downscaled with ICON-CLM to the EURO-CORDEX domain (12km) and subsequently nested into a extended Germany domain on convection-permitting scale (3km). After a validation of the present-day ICON-CLM simulation against reanalyses and observations, the dynamical downscaling of two storylines corresponding to the 2K and 4K global warming levels have been performed. In this study, we present results of a case study considering the development of the European heat wave of 2019 at different warming levels with focus on regional temperature anomalies and feedbacks that might cause them. Additionally, the results are compared to the classical EURO-CORDEX CMIP6 projections.

How to cite: Klimiuk, T., Ludwig, P., Ehmele, F., Pinto, J., and Braesicke, P.: Attribution of a warmer climate on temperature extremes over Europe using high-resolution storyline simulations with ICON-CLM, EGU General Assembly 2023, Vienna, Austria, 23–28 Apr 2023, EGU23-14764, https://doi.org/10.5194/egusphere-egu23-14764, 2023.

EGU23-15025 | Orals | CL4.8 | Highlight

Drivers of the increased impact of extreme spring frosts on European vineyards 

Giuseppe Zappa, Marlene Kretschmer, and Theodore Shepherd
A number of unprecedented extreme late spring frosts has recently hit Western Europe, especially France, causing severe impacts on vineyards that had already undergone bud burst. Whether climate change may have contributed to making these events more likely is poorly understood, since it depends on a subtle balance between how much the phenological cycle anticipates due to winter warming and how much cold spring nights warm. Here we shed more light on the key driving factors behind observed changes by taking a novel approach in which the different components of past warming trends, i.e. mean warming, seasonal cycle changes, diurnal temperature changes and frequency of cold snaps, are isolated and separately analysed. Bud burst date is determined using a previously tested phenological model based on growing degree days. A statistical model is introduced to modulate the different components of warming and generate thousands of sample of plausible realisations of internal climate variability. The statistical model is fit to daily mean and night minimum temperature data in 1950-2022 from the ERA5 reanalysis and EOBS.
 
We show that in large parts of Europe even a simple seasonally and daily uniform warming leads to an increase in the risk of frosts after vineyard bud bursts. However, such simple thermodynamic effect is small compared to the observed changes in the frequency of such events. Including the effect of changes in the seasonal cycle, i.e. the winter warming amplification, and in the diurnal temperature range further increases frost risk, but it still explains only up to a third of the observed changes in the frost events. Likewise, changes in internal atmospheric variability are also insufficient to explain the observed trends. We demonstrate that only the increased frequency in an intra-seasonal  atmospheric circulation pattern causing warm winters followed by spring cold snaps, and acting on a warmed seasonal cycle, can explain the observed trends. We then analyse CMIP6 historical simulations to attribute the role of climate change versus internal climate variability. While mean warming and seasonal cycle changes are strongly influenced by climate change, the winter to spring swing in atmospheric circulation is more difficult to attribute and it may result from an extreme realisation of internal variability. We suggest that storylines can be used to illustrate plausible future risks for vineyards depending on the rate of regional warming and the type of circulation changes. 

How to cite: Zappa, G., Kretschmer, M., and Shepherd, T.: Drivers of the increased impact of extreme spring frosts on European vineyards, EGU General Assembly 2023, Vienna, Austria, 23–28 Apr 2023, EGU23-15025, https://doi.org/10.5194/egusphere-egu23-15025, 2023.

EGU23-15532 | Posters on site | CL4.8

Weather-dependent climate change 

Helge Goessling

Climate is defined by the statistics of the weather. We are thus used to the notion that weather depends on climate in the sense that a weather state is a quasi random realization drawn from the climatological distribution of weather states. Consequently, weather obviously also depends on climate change. Here it is argued that it can be very instructive to consider this dependence the other way around and to investigate how climate change depends on the weather. More specifically, the question is how different parts of the climatological distribution change, depending on certain relevant characteristics of the weather. For example, one may ask how the climate at some time of the year and at some location changes between a pre-industrial and a globally +4K warmer climate, considering only days where the local winds at some height blow from a specific direction. Alternatively, one may investigate how the climate change pattern differs between certain large-scale atmospheric circulation regimes, such as NAO+ and NAO- situations. While such conditional climate change analyses can be based for example on reanalysis or CMIP-type climate model data, a more extreme variant are storyline simulations where the evolution of the large-scale circulation is imposed in a climate model using different climate backgrounds, allowing to assess climate change conditional on a specific evolution of the large-scale circulation. Storyline simulations inevitably ignore possible changes in the likelihood of circulation patters. In contrast, analyses based on sufficiently large samples of reanalysis or CMIP-type data also allow for quantifying changes in likelihoods and constitute a proper decomposition of the complete (unconditional) climate change signal. Here the concept of weather-dependent climate change is explained and its potential to help unravel the complexities of climate change is demonstrated.

How to cite: Goessling, H.: Weather-dependent climate change, EGU General Assembly 2023, Vienna, Austria, 23–28 Apr 2023, EGU23-15532, https://doi.org/10.5194/egusphere-egu23-15532, 2023.

EGU23-17183 | ECS | Orals | CL4.8

Attributing Extreme Weather Events and Mean Climate Change using Dynamical and Event Storylines 

Linda van Garderen, Frauke Feser, Julia Mindlin, and Ted Shepherd

The impact of extreme weather events on society, as well as natural systems, have been increasingly damaging. Climate change has altered the frequency and intensity of these extremes. The question remains how quantifiable that influence is, so that society can prepare itself for the future, and reduce possible negative impacts.

Storylines are a conditional attribution method, that aids the understanding of climate change influence on extreme weather events, as well as mean climate change, by quantifying the climate signal. Instead of trying to estimate if or when a certain level of warming would happen, storylines show the effect such a climate change level would produce if it occurs. Conditioning on the dynamical part of the climate change signal strongly reduces uncertainties and makes the attribution quantifiable.

Generally speaking, there are two types of meteorological storylines, what IPCC AR6 refers to as dynamical and event storylines. Dynamical storylines can be evaluated through statistical analysis based on an ensemble of model simulations and used to characterize physically self-consistent mean climate change. Examples of climate change effect on southern-hemisphere precipitation will show how dynamic storylines can be applied. Event storylines recreate the dynamics of an extreme event in worlds with different plausible climate change backgrounds that are also physically self-consistent. The thermodynamic signal of climate change is quantified for the Russian heatwave of 2010. Overall, the storyline method is an important tool to be added to the standard climate change attribution toolbox.

How to cite: van Garderen, L., Feser, F., Mindlin, J., and Shepherd, T.: Attributing Extreme Weather Events and Mean Climate Change using Dynamical and Event Storylines, EGU General Assembly 2023, Vienna, Austria, 23–28 Apr 2023, EGU23-17183, https://doi.org/10.5194/egusphere-egu23-17183, 2023.

EGU23-1235 | Posters on site | CL4.9 | Highlight

Impact of climate change on agro-climatic zones in Europe under different RCPs 

Aristeidis K. Georgoulias, Dimitris Akritidis, Roxanne S. Lorilla, Charalampos Kontoes, Andrej Ceglar, Andrea Toreti, and Prodromos Zanis

The rise of surface temperature due to climate change has a significant impact on the growth of different plant species, including aromatic plants, agricultural crops, fruit trees, and forests. Within the framework of the MICROSERVICES project, that aims on improving the capacity to predict the cascading effects of climate change on microbial diversity, crop-microbiome interactions and agricultural ecosystem functions, we studied the future projection of agro-climatic zones over Europe under two different IPCC Representative Concentration Pathways (RCP4.5 and RCP8.5). To this end, an ensemble of 11 bias-corrected EURO-CORDEX simulations covering the period 1981-2100 was used following the methodology of Ceglar et al. (2019)*. The agro-climatic zones were identified based on two temperature-related parameters, the Growing Season Length (GSL) and the Active Temperature Sum (ATS). The categorization into one of the 8 agro-climatic zones was implemented by applying the k-means clustering method for the reference period 1981-2010. Then, the agro-climatic zone patterns over Europe for the intermediate period 2031-2060 and the end-of-the-century period 2071-2100 were compared against that of the reference period. Our results point towards a strong northward shift of the agroclimatic zones, especially under the no-mitigation emission scenario (RCP8.5) at the end of the century. For the moderate mitigation scenario (RCP4.5), a significant shift of the agroclimatic zones is also observed for the intermediate and the end-of-the-century periods for extended areas in Europe. Our results are in line with that of Ceglar et al. (2019), who studied the migration of agro-climatic zones over Europe under the 2 oC warming level utilizing a subset of the simulations used in this study. *Ceglar et al., Earth's Future, 7, 1088-1101, https://doi.org/10.1029/2019EF001178, 2019.

This research was supported by the MICROSERVICES project funded by the General Secretariat for Research and Innovation (GSRI, Greece) under the Action ERANETs 2021A [Call ID: 037KE - A/A MIS 4888] (Project Number: T12ERA5-00075) and through the 2019-2020 BiodivERsA joint call for research proposals [BiodivClim ERA-Net COFUND programme].

How to cite: Georgoulias, A. K., Akritidis, D., Lorilla, R. S., Kontoes, C., Ceglar, A., Toreti, A., and Zanis, P.: Impact of climate change on agro-climatic zones in Europe under different RCPs, EGU General Assembly 2023, Vienna, Austria, 23–28 Apr 2023, EGU23-1235, https://doi.org/10.5194/egusphere-egu23-1235, 2023.

Consequent to excessive melt water discharge from Greenland forced by higher summer temperatures of the late Holocene Thermal Maximum, enhanced export of Labrador Current low-salinity waters into the Northwest Atlantic peaked ca. 4.2 ka BP, suppressing ocean deep convection and northward ocean heat transport, which implies changes in the Atlantic Meridional Overturning Circulation system.  At around 4.2 ka BP southward migration of the North Atlantic atmospheric Polar Front and the associated storm belt occurred in parallel with insolation-forced southward shift of the ITCZ and subsequent Southern Ocean warming. In the tropics, this rearrangement of global ocean-atmosphere interaction patterns led to temporarily reduced ENSO variability with a dominant La Nina regime. The marine and continental paleoclimate records are supported by present-day ENSO-La Nina climate features and teleconnections.

In the Eastern Hemisphere, the abrupt ~30% megadrought reductions of midlatitude westerlies’ precipitation coinciding with cooling and dust events, documented at decadal resolution, caused the cascading agro-production crises that led to adaptive societal collapses, regional abandonments, and refugia habitat tracking, from Chalcolithic Iberia to Early Bronze Greece and Levant, Akkadian Empire Mesopotamia, and Iran, beginning ~2250 - 2200 BCE. The synchronous four-phased Indian Summer Monsoon (ISM) megadroughts, known from congruent, sub-decadal/decadal precision East and West India lake sediment, marine and speleothem cores, forced adaptive abandonment of the five Harappan cities and habitat tracking eastward beginning ~2200 BCE. The abruptly reduced ISM Ethiopian precipitation, source of Nile River flow, and 4.2 ka BP megadroughts documented at tropical Lake Teli and Lake Turkana, caused abandonment of Old Kingdom Egypt delta settlement and seasonal riverine inundation lands, with violent collapse into First Intermediate Period polities ~2250 BCE. In the West Pacific, the Kuroshio Current was weakened by abrupt La Nina onset documented in Japan marine cores and in the Pacific Northwest, with sub-decadal resolution, in the Mt Logan ice core at 4.2 ka BP. Simultaneous reduction of the East Asian Summer Monsoon forced regional Longshan settlement collapses along the Yangtze River delta and in the East Haidai regions. Tropical Australia synchronously experienced megadrought documented at KNI-51 Cave and Black Springs, Kimberley.

Disruption of the North American Monsoon forced the 4.2 - 3.9 ka BP megadroughts observed in lake sediment cores from Idaho to Massachusetts and Maine.  The precipitation patterns of South America were disrupted from north to south at 4.2 ka BP, from tropical Andean Ecuador to Lake Titicaca and to southern Chile.  The disruptions included the Humboldt Current along the west coast, the continental monsoon along Brazil’s east coast, the ITCZ, and the South Atlantic Convergence Zone that crosses Brazil. The Patagonian series of abrupt 4.2 ka BP dry-cold events extended south to the Marguerite Bay, Antarctica, abrupt transition to colder, icier conditions. The cold snap at King George Island was followed by a 4.2 - 3.7 ka BP warm period. A wet west and dry east Andes are suggested by high resolution 4.2 ka BP event proxies and include the Patagonian 4.2 ka BP volcanic eruptions coeval with Hekla 4, Iceland, and Avellino, Italy.

How to cite: Weiss, H. and Kuijpers, A.: The 4.2 ka BP event: global rearrangement of ocean-atmosphere interaction patterns forced Eastern Hemisphere societal collapses, EGU General Assembly 2023, Vienna, Austria, 23–28 Apr 2023, EGU23-3591, https://doi.org/10.5194/egusphere-egu23-3591, 2023.

EGU23-4158 | ECS | Orals | CL4.9

Precipitation response to climate change in the Mediterranean region – Forcings & Dynamics 

Benny Keller and Chaim Garfinkel

Which forcings and processes govern the projected future drying of the Mediterranean region as CO2 concentrations rise, and how do they interact? An intermediate-complexity moist general circulation model is used to investigate the precipitation response to climate change in the Mediterranean region. In particular, we examine stationary wave changes forced by land–sea contrast, zonal heat fluxes in the ocean, and topography, coupled with a quadrupling of initial CO2 concentrations. Eight different combinations are formed from the three forcings, and the linearity and additivity of the response are investigated. An expected decrease in precipitation over the Mediterranean region is found, accompanied by a strong anomalous ridge, with a significant difference in magnitude between the south-east and north-west of the region, as shown in previous studies. New results suggest that horizontal heat fluxes in the ocean may be a major forcing for future Mediterranean drying, especially over the eastern Mediterranean in winter. The influence of the land-sea contrast is found to be more complex than previously shown, varying from west to east and from north to south of the Mediterranean basin, suggesting further dynamics governing the response in each area. In an attempt to break down the influence of several components of the thermodynamic condition in the Mediterranean, we isolate geographical elements (the Mediterranean, continental Europe , etc.) and examine the precipitation and geopotential height field response, in hope to refine the future projection and better understand the dynamics governing it.

How to cite: Keller, B. and Garfinkel, C.: Precipitation response to climate change in the Mediterranean region – Forcings & Dynamics, EGU General Assembly 2023, Vienna, Austria, 23–28 Apr 2023, EGU23-4158, https://doi.org/10.5194/egusphere-egu23-4158, 2023.

Porto Santo Island  is the northernmost and easternmost island of the archipelago of Madeira, located in the Atlantic Ocean west of Europe and Africa. The island is rare populated as result of historical terrace farming decline because of island slopes erosion and shortage of water resources. Modern days these areas are under afforestation activities.

Our research carried out in summer 2022 indicates that Porto Santo Island was inhabited before it was discovered by the Portuguese. The ruins of megalithic structures priory discovered on the island of Madeira, led to assumption that such ruins could also be found on Porto Santo. When the island, some stone blocks processed with stone tools were found. Additionally, the characteristic shapes given to the stones of ancient megalithic cultures have been determined, and the very simplified treatment of their surface with stone tools has been documented. Fragments of ancient marks and sings are still traceable on the surfaces of some stones, which are being studied. In some parts of the island the concentration of megaliths is higher, and the ruins of building structures can be mostly found in the eastern and northern parts of the island.

Typically, such ruins are not concentrated at the coastal area, but are located on an elevated relief surface at a height of about 130-150 meters. At this level, where the terrain is crossed by ravines with periodically flowing streams, there are places where the ruins of megalithic structures are most often found. In this area the ravine streams are still constant throughout the year, but towards the ocean they completely disappear and resume their flow only during the rainy season.

Most likely, the connection directly to water sources, which is a critical resource for life on the island, has determined the location of the monuments of the megalithic culture. Presumably, such a connection has also existed in the settlements of the inhabitants in unknown antiquity.

The limited number of monumental ruins on the island indicates the relative temporality of the existence of this ancient culture, as well as the small size of its population. When due to climatic changes, the rainy season is short and the amount of precipitation is insufficient for their infiltration, and such a phenomenon lasts for decades, the sources of drinking water dry up irretrievably and people must leave the island. In the case of Porto Santo, it is likely that the ancient inhabitants migrated to the nearby island of Madeira, which is richer in water resources.

Key words: ancient cultures, prehistory, stone processing, stone marks

The study has been founded by Iceland, Liechtenstein and Norway through the EEA and Norway Grants Fund for Regional Cooperation project No.2018-1-0137 “EU-WATERRES: EU-integrated management system of cross-border groundwater resources and anthropogenic hazards”.

How to cite: Kukela, A. and Seglins, V.: Localisation of the ruins of ancient megalithic structures near water sources – a case study at Porto Santo Island, Portugal, EGU General Assembly 2023, Vienna, Austria, 23–28 Apr 2023, EGU23-4396, https://doi.org/10.5194/egusphere-egu23-4396, 2023.

EGU23-4679 | ECS | Posters on site | CL4.9

Hysteresis of European Summer Mean and Extreme Precipitation in a CO2 Removal Experiment 

Nari Im, Daehyun Kim, Soon-Il An, and Jongsoo Shin

This study investigates the changes in the mean and extreme summer precipitation over Europe in a CO2-removal experiment, in which CO2 concentration is quadrupled and reduced back to the current climate level symmetrically over a 280-year period. Due to the pronounced summertime drying caused by greenhouse gas-induced warming, the mean and extreme precipitation decrease and bounce back during the CO2 ramp-up (RU) and ramp-down (RD) period, respectively. Interestingly, the degree of reduction in the mean precipitation is two times that of extreme precipitation. Also, the mean precipitation shows hysteresis with respect to CO2 forcing, which is absent in extreme precipitation. We show that the changes in the mean precipitation, in which convective precipitation is the dominant component, are tightly associated with those of the mean moist convective instability (MCI). Compared to the RU period, the mean MCI is lower during the RD period with a drier lower troposphere which is due to lower soil moisture and weaker surface evaporation. In contrast, the changes in extreme precipitation, whose major component is large-scale precipitation, closely follow those of the mean column relative humidity. Our results suggest that the partitioning of total precipitation into convective and large-scale components in models needs to be considered when analyzing model-simulated future projections of regional precipitation changes.

How to cite: Im, N., Kim, D., An, S.-I., and Shin, J.: Hysteresis of European Summer Mean and Extreme Precipitation in a CO2 Removal Experiment, EGU General Assembly 2023, Vienna, Austria, 23–28 Apr 2023, EGU23-4679, https://doi.org/10.5194/egusphere-egu23-4679, 2023.

Countries of the Middle East and North Africa (MENA Region) are plagued by extremely hot, dry summers and extended warm spells, and are known as a “climate change hot spot”. Results of numerical climate models project heat waves lasting up to 90 days with temperatures of more than 50°C for the late 21st century. Since the region is heavily urbanized, enhanced warming in larger cities leads to outdoor conditions that become unbearable and pose extreme health risks to a large fraction of the human population. Decreases in precipitation are enhanced through heat-related processes and result in extreme water scarcity.

Such conditions need to be addressed by effective and well-founded adaptation strategies in the MENA region. With regard to the provision of potable water, desalination of sea- and brackish water becomes an almost unavoidable requirement for coastal cities. In order to maintain food security in water-scarce agricultural areas, innovative irrigation technologies in combination with smart agricultural practices need to be practiced. Extreme outdoor and indoor temperatures in urban settings require substantial space cooling through electrically driven air conditioners. In addition and preferentially, new buildings should be erected following strict rules for low to zero-energy houses. Existing buildings should undergo significant retrofitting efforts that reduce heat intake and minimize the use of air conditioning. In addition, and already practiced in some of the MENA countries, cities will have to provide “cooling spaces” for those inhabitants that live in poorly insulated buildings and cannot afford costly space cooling.

All of these measures require substantial amounts of electrical energy. This applies in particular to the desalination process, which consumes ca. 4 kWh/m3 of potable water. Assuming a need of ca. 100 lpd (lpd=liters per person per day; 100 lpd=0,1 m3). In a city of, e.g., 250 000 inhabitants, 25 000 m3 of potable water is needed, which requires 100 000 kWh (100 MWh) of electricity per day or 36 500 MWh (36,5 GWh) per year.

The electrical energy required for space cooling amounts to ca. 0,15 kW/m2 of indoor living space. Assuming a daily cooling load of 10 hours in a typical house/apartment will translate into 1,5 kWh/m2/d. Given a nominal requirement of indoor space of ca. 25 m2/person results in an energy need of 37,5 kWh/person/d. Assuming the above-described conditions of future extreme urban warming space cooling will be required for about 8 months (240 days) by 70% of a city’s population of 250 000 (175 000 persons), we derive at an annual electrical energy need of 1 575 GWh or ca. 1,6 TWh.

Given such numbers, it is not surprising that cities currently account for about 80% of energy globally and 75% of greenhouse gas emissions. Given the prospects of extreme climate change in the MENA region, this number is likely to rise. This underlines the urgent need to employ alternative renewable energy sources to satisfy demand. Moreover, it becomes increasingly apparent that effective adaptation strategies that reduce the risks to human communities and natural ecosystems rely on innovative and effective strategies in the framework of a Water-, Energy- and Food-Nexus.

How to cite: Lange, M. A.: Extreme Climate Changes in the MENA Region: Their Impacts and Effective Adaptation Strategies, EGU General Assembly 2023, Vienna, Austria, 23–28 Apr 2023, EGU23-4991, https://doi.org/10.5194/egusphere-egu23-4991, 2023.

Climate change is known to have consequences on both mean and extreme precipitations, with potentially threatening impacts on societies. The Mediterranean region is particularly affected, being a hotspot of temperature and precipitation changes: this region is expected to get much drier, but with more extreme rainfalls. Though the two extremes of precipitations (absence of rain -drought, dry spells etc. - and very heavy rainfalls) are crucial and well-studied, the evolution of the rest of the rain distribution has been quite overlooked in the literature. Still its study might help to get a broader and more coherent picture of the evolution over the last decades. In the Mediterranean, we commonly expect a “water cycle paradox”, i.e. decreasing mean annual precipitation (“drying”) while very heavy rainfalls intensify.

In this presentation, we look at how the whole wet-days precipitation distribution changes, in the Mediterranean region over the recent past. We use reanalysis data (ERA5) covering the whole 1950-2021 period at daily timescale. We study the trends of the rain percentiles and their statistical significance over the last 70 years.

  • We see indeed sub-regions where the “water cycle paradox” is happening, such as the Iberia peninsula as a whole or more specifically Andalusia. For those, the quantile trend curve is in a “U-shape”, with decreasing rain quantiles up to a given threshold (“inversion quantile”) and then an increasing distribution tail. This “inversion quantile” can vary a lot from one place to another.

  • However we also find that the “U-shape” trend behavior is not the norm for the Mediterranean region: the situation is more complex. In fact, two additional behaviors are observed according to the location: some regions where the whole rain distribution decreases, and others where it all increases (which is a behavior more expected in Northern Europe or over the oceans). We give a map of the “U-shape” regions and of those two supplementary behaviors, and test its robustness.

  • By modeling the rainy days distribution with a simple Weibull law (2-parameters), we manage to get an analytical criterion for the type of rainfall percentiles trend behavior. This Weibull model also enables us, for regions having the “U-shape” behavior, to derive an analytical expression for the “inversion quantile”.

How to cite: André, J.: The distributions of precipitations have been changing across the Mediterranean region in the last 70 years… but not always as we expect !, EGU General Assembly 2023, Vienna, Austria, 23–28 Apr 2023, EGU23-5334, https://doi.org/10.5194/egusphere-egu23-5334, 2023.

EGU23-6043 | ECS | Orals | CL4.9

Projected changes in the distribution of global Mediterranean climate-type regions 

George Zittis, Diego Urdiales-Flores, Annalisa Cherchi, and Panos Hadjinicolaou

Mediterranean climate-type regions are characterized by warm-to-hot dry summers and mild, wet winters (Csa and Csb categories in Köppen classification). These regions are especially vulnerable to climate change since temperature and precipitation are expected to change in opposite directions. Impacts of extreme events (e.g., severe heat waves and prolonged droughts), challenges in water availability and food security, as well as other aspects of human livelihood, require a detailed global view of future changes in these unique mid-latitude zones.

Here, we explore the observed trends and future distribution of global Mediterranean climate-type regions (MCR). We analyze gridded observations and a bias-adjusted and statistically downscaled dataset of five global Earth System Models from Coupled Model Intercomparison Project phase 6 (CMIP6). For supporting decision-making and climate mitigation efforts, we focus on different global warming levels (e.g., 1.5, 2, 3, and 4°C) derived from the Shared Socioeconomic Pathway SSP5-8.5.

Our preliminary results show that for the rest of the 21st century, the CMIP6 models project that the total MCR area will not change significantly. However, our analysis highlights a robust poleward and eastward expansion of Csa zones at the expense of cooler climates (incl. Csb) over three regions, corresponding to a 21% increase in their area in the Mediterranean Basin, a 41% increase in North America-California, and 12.2% increase in South America-Central Chile. For every one additional degree of global warming, mean rainfall will likely decrease by about 4-5 % in most of the Mediterranean Basin, Southern Africa, and Southern Australia, while in South America-Central Chile, this decrease is more pronounced (near 10%). On the contrary, for every degree of global warming, mean rainfall will likely increase by about 5% in North America-California.

How to cite: Zittis, G., Urdiales-Flores, D., Cherchi, A., and Hadjinicolaou, P.: Projected changes in the distribution of global Mediterranean climate-type regions, EGU General Assembly 2023, Vienna, Austria, 23–28 Apr 2023, EGU23-6043, https://doi.org/10.5194/egusphere-egu23-6043, 2023.

EGU23-7403 | ECS | Posters on site | CL4.9

Analysis of the impact of climate change on grapevines in Turkey using heat unit accumulation–based indices 

Nazan An, M. Tufan Turp, Bora Orgen, Başak Bilgin, and M.Levent Kurnaz

Temperature is the most important factor influencing grapevine phenology and yield. Various indices have been developed that deal with the temperature sums that grapevines are exposed to during growth and maturation. With the help of these indices, predictions are made about whether the grapes will grow in a certain region and the quality of the grapevines. In this study, the future impacts of climate change on viticultural conditions in Turkey were projected by using Huglin index (HI), Winkler index (WI), and cool night index (CI). Under the RCP8.5 scenario, HI, WI, and CI indices for the future period of 2022–2050 were calculated for Turkey at 10 km spatial resolution with the RegCM4.4 model and compared with the 1972–2000 reference period. As a result of the study, a substantial increase in CI, HI, and WI and at least one level of categorical change were observed in the climatic conditions of the next 30 years in Turkey. These categorical shifts in CI, HI, and WI indicate that there may be changes in the geographical pattern of grapevine species grown in Turkey as well as the aroma and quality.

Acknowledgement: This research has been supported by Boğaziçi University Research Fund Grant Number 17601


How to cite: An, N., Turp, M. T., Orgen, B., Bilgin, B., and Kurnaz, M. L.: Analysis of the impact of climate change on grapevines in Turkey using heat unit accumulation–based indices, EGU General Assembly 2023, Vienna, Austria, 23–28 Apr 2023, EGU23-7403, https://doi.org/10.5194/egusphere-egu23-7403, 2023.

EGU23-7894 | ECS | Orals | CL4.9

Improving the forecast quality of near-term climate projections in the Mediterranean region 

Josep Cos, Francisco Doblas-Reyes, Raül Marcos, and Markus G Donat

The Mediterranean region is often considered a climate change hotspot. State of the art climate projections display a large uncertainty due to factors such as the modeling approach or variability phasing, in particular for projections of the next few decades. With the great amount of climate information from the last Coupled Model Intercomparison Project (CMIP6), it is desirable to constrain the multi-model multi-member ensemble for the near-term future to obtain more robust and better performing projections. We explore different subsetting methods that select those members that better capture the variability at the starting date of the projection’s study period. To find the best information we explore variations of different parameters in the selection method based on relevant climate drivers in the Mediterranean region. Such parameters are the reference against which the best members are selected, and comprise: the time period used, the constraining regions considered and the variable or metric that drive the constraint. We find that these subsetting methods can improve the accuracy of near-term climate projections for the next 20 years compared to the unconstrained projections. This evaluation of the results allows us to make informed and robust decisions about the near-term future projections based on quality estimates borrowed from climate prediction practices.


How to cite: Cos, J., Doblas-Reyes, F., Marcos, R., and Donat, M. G.: Improving the forecast quality of near-term climate projections in the Mediterranean region, EGU General Assembly 2023, Vienna, Austria, 23–28 Apr 2023, EGU23-7894, https://doi.org/10.5194/egusphere-egu23-7894, 2023.

EGU23-9435 | Orals | CL4.9 | Highlight

The central Chile megadrought: World 's champion? 

Rene Garreaud

The last decade (2010–2021) was drier than average in all major Mediterranean Climate Regions (MCRs), except for the Mediterranean Basin, with mean rainfall deficits from -2% (Southwest Australia) to -33% (central Chile). In most cases, dry years have prevailed but intermingled with wet years except for central Chile, along the west coast of subtropical South America, where all years since 2010 were below average. This conforms the so-called central Chile mega drought, the driest decade in local history since at least the 14th century and, as we show in this work, for any of the MCRs since 1901. Within the megadrought, accumulation dropped to <70% of the mean during 2019 and 2021, causing an unprecedented decline in vegetation, shortage of potable water and other detrimental impacts in central Chile.

In addition to placing the central Chile megadrought in planetary context, we summarize the underlying mechanisms behind this climate extreme. While climatic anomalies during the last decade are broadly consistent with projections, natural variability originating in the subtropical southwest Pacific was conducive for dry conditions across the Pacific has been acting in concert with climate-change signal. As a result, the observed mean precipitation deficit was about three times larger than expected for the early decades of this century, more akin to those predicted for 2070-2090 under a heavy greenhouse gases emission scenario.


How to cite: Garreaud, R.: The central Chile megadrought: World 's champion?, EGU General Assembly 2023, Vienna, Austria, 23–28 Apr 2023, EGU23-9435, https://doi.org/10.5194/egusphere-egu23-9435, 2023.

EGU23-10457 | Orals | CL4.9

Climate change, landscapes and human impacts during the 4.2kyr event in Mesopotamia and beyond 

Daniel Hill, Michelle de Gruchy, Katleen Deckers, and Dan Lawrence

The 4.2kyr event saw major changes in civilizations across the world, often attributed to climate change and widespread drought. Indeed, there are high quality palaeohydrological proxies that seem to document a significant drying at this time in Egypt, the Indus Valley and in the Near East. In Mesopotamia, settlements were abandoned, agricultural practices shifted and the Akkadian Empire ended. Climate model simulations covering 5000-3000 years ago are able to reproduce much of the evidence for Holocene climate change and some of the key reductions in mid-late Holocene precipitation. However, unlike some other regions, the annual mean rainfall in Mesopotamia at 4.2kyr is similar to the adjoining millennia. The climate model simulates significant droughts during this time, but these are within the range seen both before and after.

The end of the middle Holocene saw rapid population growth in Mesopotamia, with significant urban centres putting pressure on local resources. Although the models suggest no significant change in climate, the archaeological evidence shows the exploitation of a dryer landscape, both in existing sites and new urban centres in dryer regions. This time also sees changing agricultural practices and the loss of available sources of wood. Vegetation models suggest little impact of climate change on the natural landscape, although drought years bring major losses in net primary productivity. However, human activities in Mesopotamia could have affected the landscape and exacerbated the impacts of existing drought cycles. We suggest that an unexceptional drought, combined with a large population and anthropogenic impacts on the landscape contributed to significant societal change in Mesopotamia at 4.2kyr.

How to cite: Hill, D., de Gruchy, M., Deckers, K., and Lawrence, D.: Climate change, landscapes and human impacts during the 4.2kyr event in Mesopotamia and beyond, EGU General Assembly 2023, Vienna, Austria, 23–28 Apr 2023, EGU23-10457, https://doi.org/10.5194/egusphere-egu23-10457, 2023.

EGU23-11311 | Orals | CL4.9 | Highlight

Persistent anticyclonic conditions and climate change exacerbated the exceptional 2022 European-Mediterranean drought 

Davide Faranda, Salvatore Pascale, and Burak Bulut

A prolonged drought affected Western Europe and the Mediterranean region in the first nine months of 2022 producing large socio-ecological impacts. The role of anthropogenic climate change (ACC) in exacerbating this drought has been often invoked in the public debate, but the link between  atmospheric circulation and ACC has not received much attention so far. Here we address this question by applying the method of circulation analogs, which allows us to identify atmospheric patterns in the period 1836-2021 very similar to those occurred in 2022. By comparing the circulation analogs when global warming was absent (1836-1915) with those occurred recently (1942-2021), and by excluding interannual and interdecadal variability as possible drivers, we identify the contribution of ACC. The 2022 drought was associated with an anticyclonic anomaly over Western Europe persistent over December 2021-August 2022. Circulation analogs of this atmospheric pattern in 1941-2021 feature 500 hPa geopotential height anomalies larger in both extent and magnitude, and higher temperatures at the surface, relative to those in 1836-1915. Both factors exacerbated the drought, by increasing the area affected and enhancing soil drying through evapotranspiration. While the occurrence of the atmospheric circulation associated with the 2022 drought has not become more frequent in recent decades, there is an increase of its interdecadal variability for which the influence of the Atlantic Multidecadal oscillation cannot be ruled-out.

How to cite: Faranda, D., Pascale, S., and Bulut, B.: Persistent anticyclonic conditions and climate change exacerbated the exceptional 2022 European-Mediterranean drought, EGU General Assembly 2023, Vienna, Austria, 23–28 Apr 2023, EGU23-11311, https://doi.org/10.5194/egusphere-egu23-11311, 2023.

EGU23-12418 | ECS | Orals | CL4.9

Assessment of agronomic adaptation strategies to climate change in a Mediterranean watershed with SWAT+ 

Lorenzo Villani, Giulio Castelli, Estifanos Addisu Yimer, Albert Nkwasa, Daniele Penna, Ann van Griensven, and Elena Bresci

The Mediterranean region is considered a hotspot for climate change as it is expected to face more severe impacts compared to other regions of the world. To better understand these impacts and plan more effective adaptation strategies, integrated assessments should consider not only biophysical aspects, but also social, political, and economic ones. Plenty of models are available to simulate these various aspects, but certainly, the more models are included, the higher the complexity, which severely affects the reproducibility of the studies. Even when considering only biophysical aspects, related for example to water and food security, individual crop and/or hydrological models have intrinsic limitations. Integrated, distributed, agro-hydrological models such as the Soil and Water Assessment Tool (SWAT) might be the solution to overcome some of these drawbacks, including the point-scale nature of crop-growth models.

We applied the SWAT+ model in a medium-sized agricultural watershed in Central Italy, the Ombrone watershed, in order to comprehensively assess climate change impacts on crop production and water management and evaluate autonomous agronomic adaptation strategies. By forcing SWAT+ with five bias-corrected EURO-CORDEX climate models, we assessed future precipitation and temperature in the study area. Moreover, we simulated the fluxes of different water balance components and evaluated how they were affected by the increasing CO2 concentration. Then, we simulated future crop yield and water footprint of three representative crops - durum wheat, sunflower and irrigated maize - and evaluated the adaptive capacity of the agricultural systems by simulating simple adaptation strategies such as shifting sowing dates and applying supplemental irrigation. Finally, we estimated the effects of these adaptation strategies on water balance components.

While the temperature was predicted to increase, future precipitation showed much more uncertainty. Furthermore, considering the CO2 fertilization effect enhanced the uncertainty about future aridity conditions, with variables such as potential evapotranspiration that varied up to 50% when considering constant or increasing CO2 concentration. Crop yield was negatively affected mainly by the reduction of crop cycle length caused by increased temperatures, but with adaptation strategies it was possible to reduce losses or even obtain higher production. Finally, management changes such as the inclusion of cover crops in the crop rotation have a significant impact on some water balance components that cannot be neglected. The results of this study show the increasing need to adapt to climate change impacts in the Mediterranean cultivated catchments.

How to cite: Villani, L., Castelli, G., Addisu Yimer, E., Nkwasa, A., Penna, D., van Griensven, A., and Bresci, E.: Assessment of agronomic adaptation strategies to climate change in a Mediterranean watershed with SWAT+, EGU General Assembly 2023, Vienna, Austria, 23–28 Apr 2023, EGU23-12418, https://doi.org/10.5194/egusphere-egu23-12418, 2023.

EGU23-12819 | Posters virtual | CL4.9

Flow reversals and deep-water temperature and salinity trends in a Mediterranean Channel (2003-2019) 

Katrin Schroeder, Sana Ben Ismail, Mireno Borghini, Stefania Sparnocchia, and Jacopo Chiggiato

The Sardinia Channel (Mediterranean Sea) is a wide opening between Tunisia and Sardinia which has a sill at about 1900 m in a narrow deep trench that allows exchanges of the upper part of the deep waters to occur between the Algerian and the Tyrrhenian subbasins. The densest part of Western Mediterranean Deep Water (WMDW), which is trapped in the Algerian subbasin, is thus overflowing the sill when uplifted by recent and even denser WMDW. The less dense WMDW, circulating anticlockwise and alongslope may enter the Sardinia Channel directly following the Algerian slope. There is another water mass exchanged in this region, the Tyrrhenian Deep Water (TDW) which is a mixing product between the WMDW and waters coming from the Eastern Mediterranean.

The monitoring of thermohaline properties and currents has been operated at the sill between 2003 and 2019, to observe the variability of the deep water exchanged between the two adjacent subbasins. The θ time series collected at the sill since July 2003 shows an alternation of WMDW presence (lower θ and S, generally flowing eastward) and TDW presence (“pulses” of higher θ and S, generally flowing westward). Those TDW pulses are generally of short duration (between 1 day and 1 week) and are likely to be due to displacements of the interface between the two deep water masses. Thus, the mooring alternatively sampled WMDW (mainly) and TDW.

The Sardinia Channel trend component shows a continuous warming trend at a rate of 0.0067± 3.47*10-6 °C year-1, accounting for a total deep temperature increase of about 0.114 °C from 2003 to 2019. The salinity trend also shows a salinification at a rate of 0.0032 ±  2.02*10-6 year-1, with a total deep salinity increase of about 0.054 from 2003 to 2019. The density trend component shows a continuous densification at a rate of 0.0011± 9.60*10-7  kg m-3 year-1, with a total deep density increase of about 0.0187 kg m-3 from 2003 to 2019.

The ongoing climate change has amplified the scientific interest in time series and their importance is increasingly recognized even at the political level. Nonetheless, due to their high maintenance costs and the difficulty in maintaining them, they are still widely lacking. It is important to stress that an understanding of physical-chemical-biological processes in the oceans requires regular and long-term observations, that enable us to separate real long-term trends in environmental drivers from the natural variability of the system.

How to cite: Schroeder, K., Ben Ismail, S., Borghini, M., Sparnocchia, S., and Chiggiato, J.: Flow reversals and deep-water temperature and salinity trends in a Mediterranean Channel (2003-2019), EGU General Assembly 2023, Vienna, Austria, 23–28 Apr 2023, EGU23-12819, https://doi.org/10.5194/egusphere-egu23-12819, 2023.

EGU23-12989 | ECS | Orals | CL4.9

Assessment of the relationship of atmospheric blocking and heatwaves over the Mediterranean region 

Iliana Koutsoupi, Constantinos Cartalis, Kostas Philippopoulos, and Ilias Agathangelidis

The increasing trends of extreme heat and record-high temperatures in Europe are linked to large-scale circulation. The aim of this work is to investigate the role of atmospheric blocking on heatwaves over the Mediterranean region and to assess the drivers of such anomalies. The study is focused on the summer period and on the omega block upper-level weather pattern (i.e., a low-high-low pattern that remains stationary and distorts the progression of weather systems). The identification of the omega block patterns is based on the 500 hPa geopotential anomalies from 1981 to 2020 for the European region, using the state-of-the-art ERA5 reanalysis product at a 0.25° x 0.25° horizontal resolution. A duration threshold was employed (5 days) and 75 omega blocks are identified in total. Their persistence was typically between 5 and 10 days, and in a few cases, the pattern was observed for more than 20 days. An omega block classification was developed based on the blocking intensity using the 500 hPa geopotential gradient, and the events are characterized as weak, moderate, or strong. The majority of the events were classified as omega blocks with moderate intensity and only 3 cases as strong. In addition, the effect of the North Atlantic Oscillation (NAO)was examined, and a positive correlation between the omega events and the NAO negative phase was found and the majority of these events (approximately 70%) were located in the western European region. A significant finding based on the omega block characteristics is that during the last decade, an increase is found in their duration and intensity. The identification of the heatwave events over the Mediterranean region was based on the Excess Heat Factor (EHF) which is used to further categorize heatwaves by their severity. The effect of omega blocks on the EHF distribution is illustrated over the examined sector and specific case studies are also discussed. The results of the study illustrate the impact of atmospheric blocking on the predictability of extreme heat.

How to cite: Koutsoupi, I., Cartalis, C., Philippopoulos, K., and Agathangelidis, I.: Assessment of the relationship of atmospheric blocking and heatwaves over the Mediterranean region, EGU General Assembly 2023, Vienna, Austria, 23–28 Apr 2023, EGU23-12989, https://doi.org/10.5194/egusphere-egu23-12989, 2023.

EGU23-13767 | ECS | Posters on site | CL4.9

Revisiting the Moisture Budget of the Mediterranean Region in the ERA5 Reanalysis 

Roshanak Tootoonchi, Simona Bordoni, and Roberta D'Agostino

The climate of the Mediterranean region (MedR) is characterized by mild-wet winters and dry-hot summers. The hydrological cycle is highly sensitive to the spatio-temporal characteristics of winter storms as they move into the region, which results in a distinctive and irregular rainfall pattern (D’Agostino and Lionello 2020).

Recent studies have identified the MedR as a climate change “hotspot” (Seager et al. 2014; D’Agostino and Lionello 2020), marked by intensifying temperature and precipitation (P) reduction. This P reduction cannot be simply attributed to the thermodynamic “wet-gets-wetter” response, pointing to the importance of circulation changes. However, exact dynamical mechanisms are yet to be understood. To this end, we revisit the moisture budget in the MedR using the 5th generation ECMWF reanalysis (ERA5) to: (1) explore how the different terms in the budget contribute to the observed climatological net P (precipitation minus evaporation (E)) patterns in the annual mean over land and sea, (2) assess the role of mean flow and transient eddies, and finally, (3) to expose any trends that might be present in the ERA5 dataset.

Moisture budget analyses reveal that most Mediterranean land areas (e.g., Europe and Turkey) have an excess of P over E. Annually averaged positive net P is particularly strong over high topographic regions (Alps and Balkans). Negative net P over the Mediterranean Sea confirms that, on average, the Mediterranean Sea is an evaporative waterbody.

Positive net P over the Mediterranean land regions is predominantly sustained by the sub-monthly transient eddies converging moisture that originate from the Mediterranean Sea. On the annual average, transient circulations (i.e., storm systems, extratropical cyclones) converge moisture over the Iberian Peninsula as well. In contrast, the annually averaged mean flow diverges moisture over most of the MedR (land and sea), except Adriatic Sea and north-western Africa (Tunisia, northern Algeria).

According to ERA5, net P in the MedR undergoes a significant decreasing trend owing to significant increase in E and a rather steady P in the 1979 – 2020 period. This is in line with previous work which show the projected drying in the MedR is already detectable (Seager et al. 2014). On a global scale, P and E within ERA5 show significant increasing trends during the analysis period. The increase in globally averaged E agrees well with the previous reanalysis product (i.e., ERA- Interim). However, the unrealistic increase in global P from ERA5 remains not well understood (Mayer et al. 2021).


References:

  • D’Agostino, R., & Lionello, P. (2020). The atmospheric moisture budget in the Mediterranean: Mechanisms for seasonal changes in the Last Glacial Maximum and future warming scenario. Quaternary Science Reviews, 241. https://doi.org/10.1016/j.quascirev.2020.106392
  • Mayer, J., Mayer, M., & Haimberger, L. (2021). Consistency and Homogeneity of Atmospheric Energy, Moisture, and Mass Budgets in ERA5. Journal of Climate, 34(10), 3955–3974. https://doi.org/10.1175/JCLI-D-20-0676.1
  • Seager, R., Liu, H., Henderson, N., Simpson, I., Kelley, C., Shaw, T., Kushnir, Y., & Ting, M. (2014). Causes of increasing aridification of the mediterranean region in response to rising greenhouse gases. Journal of Climate, 27(12), 4655–4676. https://doi.org/10.1175/JCLI-D-13-00446.1

How to cite: Tootoonchi, R., Bordoni, S., and D'Agostino, R.: Revisiting the Moisture Budget of the Mediterranean Region in the ERA5 Reanalysis, EGU General Assembly 2023, Vienna, Austria, 23–28 Apr 2023, EGU23-13767, https://doi.org/10.5194/egusphere-egu23-13767, 2023.

EGU23-14381 | Posters virtual | CL4.9

Long-term climatic trends for the Mediterranean region and their association with atmospheric circulation 

Chris G. Tzanis, Aris Nasl Pak, and Kostas Philippopoulos

The Mediterranean region is characterized by high vulnerability and changes in the atmospheric circulation and water cycle with significant socio-economic implications. Many regions in the Mediterranean basin face extreme climate events, while others do not exhibit the same sensitivity to climate change. In this study, the spatial and temporal variability of climatic parameters such as precipitation, temperature, and dew point are investigated. Furthermore, their sensitivity to changes in atmospheric circulation is also examined in terms of the response of the surface climatic conditions for different atmospheric circulation types. Long-term data are extracted from the ERA 5 reanalysis dataset over the period of 1961-2020 (70 years) at a spatial resolution of 0.25° × 0.25°. The analysis procedure includes the identification of trends in the time series using the non-parametric Mann-Kendall and Sen's methods. Regions with statistically significant trends are identified and discussed. Discrepancies are also examined between the trends identified from the ERA 5 reanalysis datasets and from E-OBS and in-situ climate records. The atmospheric circulation framework is based on the following a) Definition of the spatial and temporal scales, b) Standardization of the spatial and temporal time series and data reduction using Principal Components Analysis c) Classification and assignment of cases into atmospheric circulation regimes using the k-means algorithm and d) Atmospheric circulation regimes assembly of the daily regimes (weather types) catalog. Trends and high-impact areas of global warming are identified and therefore the association between atmospheric circulation and climate change is highlighted.

How to cite: Tzanis, C. G., Nasl Pak, A., and Philippopoulos, K.: Long-term climatic trends for the Mediterranean region and their association with atmospheric circulation, EGU General Assembly 2023, Vienna, Austria, 23–28 Apr 2023, EGU23-14381, https://doi.org/10.5194/egusphere-egu23-14381, 2023.

EGU23-14875 | ECS | Posters virtual | CL4.9

Comparison of CMIP5 and CMIP6 mid- and end-century precipitation changes in California 

Desislava Petrova, Patricia Tarin-Carrasco, Aleksandar Sekulic, Jelena Lukovic, Maria Gali Reniu, Xavier Rodo, and Ivana Cvijanovic

Climate models have projected an overall drying in Mediterranean climate zones, with the exception of California, where the models have been split between predicting wetter or drier future conditions. This uncertainty is problematic for a major economy, where water scarcity, especially in southern California, has been an issue of concern during the last few decades. Here we compare the future projections of California’s winter (December, January, February) precipitation changes from the latest Coupled Model Intercomparison Project Phases 6 (CMIP6) and 5 (CMIP5). Over northern California the models from both ensembles agree on wetter future conditions. However, over southern California the models are almost equally divided between wetter or drier conditions, with projections ranging from -30% to +70% in CMIP5 and -20% to +80% in CMIP6 for the end of the century. The CMIP6 ensemble indicates wetter overall conditions, and features a larger model disagreement compared to CMIP5.

Interannual precipitation indicates more extremely wet or dry years over southern California in CMIP6 than in CMIP5. Some models even suggest that the five wettest years will account for as much as ~55% of the total 20-year rainfall considered, and the five driest for as little as ~5%. Dynamically, both ensembles project weakened subsidence over Baja California. This effect is stronger in CMIP6 than in CMIP5, consistent with the wetter mean conditions in CMIP6. In the western tropical Pacific our results point to strengthening of the Hadley circulation in CMIP6 that is not seen in CMIP5, and El Niño conditions prevailing over La Niña. CMIP6 models also project a stronger overall impact of ENSO on California’s precipitation than CMIP5 models.

How to cite: Petrova, D., Tarin-Carrasco, P., Sekulic, A., Lukovic, J., Gali Reniu, M., Rodo, X., and Cvijanovic, I.: Comparison of CMIP5 and CMIP6 mid- and end-century precipitation changes in California, EGU General Assembly 2023, Vienna, Austria, 23–28 Apr 2023, EGU23-14875, https://doi.org/10.5194/egusphere-egu23-14875, 2023.

EGU23-15233 | Posters on site | CL4.9

The new reality of the Mediterranean: accelerating impacts of climate change 

Samira Khodayar Pardo, Paco Pastor, Jose Antonio Valiente, Laura Paredes-Fortuny, and Pau Benetó

The Mediterranean basin is a hot spot for climate change warming up to 1.5 times faster than the rest of the world with the Mediterranean Sea warming three times more than the oceans (MedECC 2020). A consensus exists about the magnification of extreme phenomena in the area under climate change (IPCC 2021). In fact, several types of risks currently affect and will continue affecting the region severely, from more frequent extreme weather events such as heat waves, droughts, or floods, to increasing sea surface temperature and coastal erosion due to rising sea levels. The impacts affect the region's ecosystems, economic activities, and, ultimately, human health. In addition, the effects also spread like “cascades” that generate multiple impacts in all socioeconomic sectors. Current change and future scenarios consistently point to significant and increasing risks during the coming decades in most impact domains such as water and energy resources, ecosystems, agriculture and food, fishery, health, and human security.

The impacts of climate change have accelerated on the Mediterranean coast of the Iberian Peninsula in the last decades. In this presentation, we will discuss this acceleration based on observations of the notorious and progressive rise in atmospheric and sea surface temperature and the generalized reduction of mean accumulated precipitation in the region. In this context, the magnification of extreme weather phenomena in the region will be described in detail focusing on the spatio-temporal evolution of terrestrial and marine heat waves, droughts as well as catastrophic extreme precipitation in the autumn period.

How to cite: Khodayar Pardo, S., Pastor, P., Valiente, J. A., Paredes-Fortuny, L., and Benetó, P.: The new reality of the Mediterranean: accelerating impacts of climate change, EGU General Assembly 2023, Vienna, Austria, 23–28 Apr 2023, EGU23-15233, https://doi.org/10.5194/egusphere-egu23-15233, 2023.

EGU23-15428 | Posters virtual | CL4.9 | Highlight

Climate risk assessment for cereal and livestock sectors in Mediterranean areas 

Valentina Mereu, Josè Maria Costa-Saura, Antonio Trabucco, and Donatella Spano

Assessing climate-related risks on key economic sectors is of paramount relevance to inform policy makers and support the decision making process in designing adaptation plans and strategies to cope with climate change. Agriculture in the Mediterranean area is already experiencing negative impacts of climate changes and urgent adaptation actions are required to increase the resilience of agricultural systems. This study applied the impact chain approach to assess the expected climate risks for the cereal and livestock sectors to support the development of the Regional Adaptation Strategy to Climate Change (SRACC) of Sardinia (Italy) Region. Statistical socio-economic indicators were integrated with crop simulation models output and climate change scenarios to 2050, to investigate the exposure, vulnerability and hazard components according to the IPCC framework. The results were elaborated at the regional and municipal level to provided information for policy-makers at different administrative levels. This information allows the identification of the areas with greatest impact and the most critical aspects for which to focus adaptation efforts.

How to cite: Mereu, V., Costa-Saura, J. M., Trabucco, A., and Spano, D.: Climate risk assessment for cereal and livestock sectors in Mediterranean areas, EGU General Assembly 2023, Vienna, Austria, 23–28 Apr 2023, EGU23-15428, https://doi.org/10.5194/egusphere-egu23-15428, 2023.

EGU23-15435 | Posters virtual | CL4.9

Is climate the main driver of Mid-Holocene settlement dynamics on the Varamin plain? 

Fabian Kirsten, Anne Dallmeyer, Robert Busch, Thomas Böhmer, Reinhard Bernbeck, Susan Pollock, and Brigitta Schütt

For different areas throughout West Asia and the Middle East, settlement discontinuities and periods of cultural decline in the Mid-Holocene have been attested. Whether these phenomena were caused mainly by climatic factors, especially periods of drought, has been an ongoing scientific debate of the last decade(s).  One of these regions, the Varamin plain, is located few kilometers east of Teheran on an alluvial fan along the southern slopes of the Elburs-mountain-range (Northern Iranian Highlands). A recent archaeological survey on the Varamin plain revealed a striking absence of archaeological finds for the end of the Proto-Elamite period (Early Bronze Age) between approximately 5000 and 4100 BP that has been interpreted as a (temporal) abandonment of the plain. This crisis presumably lasted until the beginning of the Iron Age around 3500 BP.

Since paleoenvironmental and paleoclimatic information for this region are scarce, this study makes use of 3 different approaches to unravel the Holocene climate variability in West Asia in general and the Northern Iranian plateau specifically: a) analysis of climate reconstructions, b) a high-resolution snapshot simulation performed in ICON-NWP for the mid-Holocene time-slice (7000 BP) and c) a transient simulation performed with the Max Planck Institute Earth System Model (MPI-ESM) spanning the period from 8000 BP to pre-industrial (PI, 100 BP).

The comparison of the regional proxy-based climate reconstructions reveals a considerable degree of hetegorenity, impeding any straightforward inferences regarding possible paleoclimatic forcings for settlement dynamics. In particular, no specific drought period can be identified that coincides with the settlement crisis.

The model results show that there is a general aridification trend between 7000 BP and PI in West Asia. While absolute annual mean precipitation changes are small, the model data reveal a shift in seasonality of precipitation with drier autumns and winters but substantially wetter conditions during spring during mid-Holocene times. In combination with longer and colder winters during the Mid-Holocene, this may have enhanced water availability and therefore favored agricultural production.  Superimposed on this minor aridification trend, the model shows pronounced climatic variability with distinct multi-decadal wet and dry periods with variations of up to +/-12% in precipitation. Therefore, we cannot exclude that climatic events and variability including their geomorphological responses may have played a role in settlement discontinuties, but we can not clearly identify climate changes as the main driver.

How to cite: Kirsten, F., Dallmeyer, A., Busch, R., Böhmer, T., Bernbeck, R., Pollock, S., and Schütt, B.: Is climate the main driver of Mid-Holocene settlement dynamics on the Varamin plain?, EGU General Assembly 2023, Vienna, Austria, 23–28 Apr 2023, EGU23-15435, https://doi.org/10.5194/egusphere-egu23-15435, 2023.

EGU23-15806 | ECS | Orals | CL4.9

Evolution of the Drivers of Stratification of the Gulf of Lion in a Changing Climate 

Douglas Keller, Yonatan Givon, Florence Sevault, Samuel Somot, Romain Pennel, Shira Raveh-Rubin, and Philippe Drobinski

Deep convection, or open-ocean convection, occurs in the higher latitude regions of the world and is an important ocean circulation process. It is formed when the stable density gradient along the ocean column is eroded by surface buoyancy loss, leading to an overturning that can span the entire depth of the column. In the western basin of the Mediterranean Sea (Med. Sea), this process can occur in the Gulf of Lion (GOL) and assists in the thermohaline circulation of the sea by forming the Western Mediterranean Deep Water (WMDW), which then laterally spreads throughout the western basin. Significant deep convection events occur every few years in the GOL, driven by the Mistral and Tramontane winds and the seasonal atmospheric change. However, in the future these events are expected to stop altogether due to increasing stratification. In this presentation, the changes in atmospheric forcing and stratification in the GOL are examined to determine the driving factor behind the collapse of the deep convection process in the region. This task is completed using NEMO simulations driven by the CMIP6 results of Météo France's RCSM6 regional model. The years from 2015 to 2100 are studied, under the SSP5 8.5 scenario (the worst case SSP scenario). Two sets of simulations are presented, a control and seasonal set. The seasonal set was forced with filtered atmospheric forcing to remove the effect of the Mistral and Tramontane. Comparing the two sets allows to determine the effects of the Mistral and atmospheric forcing separately. Results show an evolution in atmospheric forcing that effectively leads to no net change over time in the energy fluxes at the surface of the ocean. However, the stratification in the gulf increases, driven by advected stratification, with temperature as the primary advected quantity increasing stratification.

How to cite: Keller, D., Givon, Y., Sevault, F., Somot, S., Pennel, R., Raveh-Rubin, S., and Drobinski, P.: Evolution of the Drivers of Stratification of the Gulf of Lion in a Changing Climate, EGU General Assembly 2023, Vienna, Austria, 23–28 Apr 2023, EGU23-15806, https://doi.org/10.5194/egusphere-egu23-15806, 2023.

EGU23-16437 | Posters virtual | CL4.9

Potential effects of climatic trends on crop yield in the Mediterranean 

Emilio F. Santiago-Ventura and Andrea Román-Sánchez

Current climatic conditions tend to increase the frequency of droughts and may lead to increased aridity and evapotranspiration. This trend can cause adverse effects on agricultura due to water stress. Spain is the only country in Europe that is being affected by a characteristic aridity process according to USGS (2017). Andalusia, Southern Spain, is the most important agricultural region in Europe and one of the hardest affected by aridity. However we know little, if anything, about the relationship between aridity and crop yields in this region. Using data from ECAD and AEMET from more than 100 weather stations over the period 1959-2022, the temporal and spatial variability and trend of temperature and precipitation are analysed. Calculations are made for several indices of drought, aridity, continentality and oceanity to examine the relationship between them and the yield of a wide variety of crops. A high concentration and reduction of precipitation has been observed and the results obtained reflect a correlation between these indices of aridity, drought and continentality and the yield of selected crops. The trend of increasing aridity can be considered as a key factor in crop yields, especially in rainfed crops.

How to cite: Santiago-Ventura, E. F. and Román-Sánchez, A.: Potential effects of climatic trends on crop yield in the Mediterranean, EGU General Assembly 2023, Vienna, Austria, 23–28 Apr 2023, EGU23-16437, https://doi.org/10.5194/egusphere-egu23-16437, 2023.

EGU23-17496 | Posters on site | CL4.9

Map viewer of the CLICES project: information analysis tool and educational activity 

Dhais Peña Angulo, Victor Trullenque-Blanco, José Carlos González-Hidalgo, and Santiago Beguería

CLICES project (CLImate of the last Century in Spain) has been focused on temperature and precipitation analyses in mainland Spain during 1916-2015 period. To do that, information from National Meteorological Agency archives have been combined with data rescued from Annual Books (1916-2015) and high resolution grid (10x10 km) have been calculated. A web page has been created during the CLICES project with information on its main results, including a Map viewer section to allow view and consult the distribution of weather stations over time in the mainland Spain. The Map viewer includes information related to weather stations locations for the monthly temperature and precipitation for the 1915-2015 period. In addition, the Map viewer shows auxiliary information that includes elevation (shading), communication routes, and administrative bounderies. One of the great utilities that the Map viewer is to know the history of the spatial distribution of the meteorological stations, which have been linked to the socioeconomic history of mainland Spain itself. For example, the initial stations were mostly located in the main cities (capitals of province) before 1920, and then during 30´to 60´ data were recorded in a dense network stations. Maximum spatial density was achieved around 70´s and then a global decline in the network is observed. All these aforementioned facts must be considered when spatial and temporal analyses of the main elements of climate were performed. Then Map viewer can be used as a useful tool in educational activities from a geographical point of view which allows students to explain certain natural phenomena at different spatial scales, and their relationships with different elements of space. To access the Map viewer of the CLICES project, you must visit the website www.CLICES.unizar.es. Up to date to 2020 is being under current development.

How to cite: Peña Angulo, D., Trullenque-Blanco, V., González-Hidalgo, J. C., and Beguería, S.: Map viewer of the CLICES project: information analysis tool and educational activity, EGU General Assembly 2023, Vienna, Austria, 23–28 Apr 2023, EGU23-17496, https://doi.org/10.5194/egusphere-egu23-17496, 2023.

In this study, the contribution of external forcings on global ocean wave height change during 1961-2020 is investigated. Historical significant wave height (SWH) produced at Ifremer for different CMIP6 external forcing and preindustrial control conditions following the framework of Detection and Attribution Model Intercomparison Project (DAMIP) and other available multi-model simulations are employed. The linear trends (with statistical significance) in SWH computed over regional ocean basins could be mostly associated with greenhouse gas-only (GHG) and aerosol-only (AER) forcing. The SWH in Arctic and Antarctic Ocean shows remarkable trends and GHG induced change could explain most of it. Moreover, this can be attributed to clear decline in sea-ice extent with GHG induced wind speed change. The SWH weakening over North Pacific is majorly influenced by AER forcing rather than GHG, in contrast to SWH weakening over North Atlantic and North Indian Ocean. In addition to the anthropogenic forcings, internal variability estimated from control simulation has important contribution to the total change.

How to cite: Patra, A. and Dodet, G.: Contributions of Anthropogenic Forcing and Internal Variability on Global Wave Height Trend during 1961-2020 - CMIP6/DAMIP Analysis, EGU General Assembly 2023, Vienna, Austria, 23–28 Apr 2023, EGU23-1550, https://doi.org/10.5194/egusphere-egu23-1550, 2023.

EGU23-7740 | ECS | Posters on site | CL4.10

Variability of atmospheric CO2 in Earth System model large-ensemble simulations with an interactive carbon cycle 

Kelli Johnson, Hongmei Li, and Tatiana Ilyina

Atmospheric CO2 concentrations have increased from around 280 parts per million (ppm) in 1800 to over 416 ppm in 2020. This is a direct result of increasing anthropogenic emissions of CO2 since the industrial era. Nearly half of the emitted anthropogenic CO2 is taken up by the ocean and terrestrial ecosystems, while the remaining half remains in the atmosphere, where it is a heat-trapping greenhouse gas. The growth of atmospheric CO2 varies from year to year with inhomogeneous spatial distribution depending on the CO2 uptake by the ocean and land. The CO2 uptake by the natural sinks and atmospheric growth are affected by the climate variations and the long-term changes; in turn, the variations of the carbon cycle also modulate global climate change. The state-of-the-art large ensemble simulations based on Earth System Models (ESMs) prescribe the concentration of atmospheric CO2, but the missing interactive response of atmospheric CO2 changes to the CO2 fluxes into the ocean and the land hinders the investigation of the variability in atmospheric CO2. Furthermore, such simulations will be insufficient to represent the changes in the efficiency of the land and ocean carbon sinks once emissions start to decline. Based on the low-resolution version of the Max Planck Earth System Model v1.2 (MPI-ESM-1.2-LR), we have done a novel set of 30-member ensemble simulations driven by anthropogenic CO2 emissions. In such simulations, atmospheric CO2 concentrations are computed prognostically, modulated by the strength of CO2 fluxes to the land and the ocean. While general trends in atmospheric CO2 concentrations for different Shared Socioeconomic Pathways (SSP) are well known, trends in its global dispersion and variations within the seasons of each year have not been investigated in ESMs with an interactive carbon cycle. In this project, we use MPI-ESM-1.2-LR large ensemble simulations under four SSP scenarios, i.e., SSP1-2.6, SSP2-4.5, SSP3-7.0, SSP5-8.5, together with historical runs to analyze changes of atmospheric CO2 concentrations. We focus on seasonal variability and spatial distribution of atmospheric CO2 changes in the presence of internal climate variability. We address two questions: first, what is the temporal evolution of atmospheric CO2 in regard to its seasonal variability by the end of the century following different emission pathways; and second, how does atmospheric CO2 evolve spatially (horizontally across the globe and vertically into the stratosphere) in the historical period and future projections until 2100? This study aims to refine our understanding of the spatial and temporal variations of CO2 in support of activities to monitor and verify decarbonization measures.

How to cite: Johnson, K., Li, H., and Ilyina, T.: Variability of atmospheric CO2 in Earth System model large-ensemble simulations with an interactive carbon cycle, EGU General Assembly 2023, Vienna, Austria, 23–28 Apr 2023, EGU23-7740, https://doi.org/10.5194/egusphere-egu23-7740, 2023.

EGU23-9611 | ECS | Posters on site | CL4.10 | Highlight

Assessing the occurrence of compound hot and dry events from pre-industrial conditions to present-day extremes 

Elizaveta Felsche, Andrea Böhnisch, and Ralf Ludwig

Heatwaves and dry spells are major climate hazards that severely impact human health, economy, agriculture, and natural ecosystems. Compound hot and dry summers have become more frequent and intense in recent years in Europe. What remains unclear is, however, to which extent the observed trend can be explained by climate change or as a feature of internal climate variability. In this study, we assess the frequency and intensity of compound hot and dry events in Europe by analyzing recent historical events from reanalysis data 1960-2022 and comparing it to i) a counterfactual reference (corresponding to pre-industrial climate conditions), and ii) model data derived from a Single Model Initial-condition Large Ensemble (SMILE).

We use data from the fifth generation of the European Reanalysis (ERA5) to assess the current frequency of the compound hot and dry summers like 2003, 2015, 2018, and 2022 and analyze the intensity of the events. We use the data from the 50-member SMILE Canadian Regional Climate Model Large Ensemble (CRCM5-LE) and calculate the probability of event occurrence for those events in Europe’s current climate. Employing the ensemble allows us to assess the influence of internal climate variability vs. climate change for those events. Additionally, we use pre-industrial conditions (pi-control runs) simulated with CRCM5 to compare the probability of recent hot and dry compound events to a counterfactual world without climate change. 

Our analysis shows that climate change increases the frequency and intensity of compound hot and dry events. We see a substantial increase in occurrence probabilities compared to a pre-industrial world and draw to emerging hotspots of new compound extremes in several European regions. We illustrate the added value of using pi-control runs in a regional SMILE as a novel approach for impact quantification. It provides the means to understand better the already prominent role of climate change on the occurrence, frequency, and intensity of extreme events in a world of still limited warming.

How to cite: Felsche, E., Böhnisch, A., and Ludwig, R.: Assessing the occurrence of compound hot and dry events from pre-industrial conditions to present-day extremes, EGU General Assembly 2023, Vienna, Austria, 23–28 Apr 2023, EGU23-9611, https://doi.org/10.5194/egusphere-egu23-9611, 2023.

EGU23-9617 | ECS | Posters on site | CL4.10

Enhanced sensitivity of atmospheric CO2 growth rate variations to tropical mean temperature anomalies is driven by internal climate variability in a large climate model ensemble 

Na Li, Sebastian Sippel, Nora Linscheid, Christian Rödenbeck, Alexander Winkler, Markus Reichstein, Miguel Mahecha, and Ana Bastos

The atmospheric CO2 growth rate (AGR) shows large year-to-year variations, which are mainly driven by land and ocean carbon uptake variations. Recent studies suggested an approximate doubling of the AGR regressed onto tropical mean temperature anomalies (“sensitivity of AGR to tropical mean temperature anomalies”; Wang et al., 2014; Luo et al., 2022), which was attributed to increasing drought in tropical land vegetation areas in a warming climate (Wang et al., 2014). We hypothesise that at least part of this apparent sensitivity change may instead be explained by extratropical areas and by internal climate variability.

Here, we study the apparent sensitivity changes of AGR to tropical mean temperature in observations, atmospheric inversions, and a large climate model ensemble of historical simulations. First, we identify the main regional drivers of the apparent sensitivity change, including the ocean and extratropical regions in all datasets. Then, we evaluate whether these sensitivity changes can be attributed to anthropogenic forcing in a large climate model ensemble, or whether they are mostly driven by internal climate variability. Our results show that other regions beyond the land tropics contribute to the change in apparent sensitivity of AGR to tropical mean temperature anomalies in atmospheric inversions and in the period 1960 to 2006. Furthermore, the climate model large ensemble shows that such "doubling sensitivity" events can occur due to internal climate variability only. This points to the importance of distinguishing internal climate variability from forced signals when attributing causes to observed changes in the carbon cycle.

Wang, X., Piao, S., Ciais, P. et al. A two-fold increase of carbon cycle sensitivity to tropical temperature variations. Nature 506, 212–215 (2014). https://doi.org/10.1038/nature12915

Luo, X., Keenan, T. F. Tropical extreme droughts drive long-term increase in atmospheric CO2 growth rate variability. Nat Commun 13, 1193 (2022). https://doi.org/10.1038/s41467-022-28824-5

How to cite: Li, N., Sippel, S., Linscheid, N., Rödenbeck, C., Winkler, A., Reichstein, M., Mahecha, M., and Bastos, A.: Enhanced sensitivity of atmospheric CO2 growth rate variations to tropical mean temperature anomalies is driven by internal climate variability in a large climate model ensemble, EGU General Assembly 2023, Vienna, Austria, 23–28 Apr 2023, EGU23-9617, https://doi.org/10.5194/egusphere-egu23-9617, 2023.

EGU23-10531 | Posters on site | CL4.10

Constraining temperature variability projections using SMILEs that best represent observed variability 

Nicola Maher, Laura Suarez-Gutierrez, and Sebastian Milinski

Projecting how temperature variability is likely to change in the future is important for understanding future extreme events. This comes from the fact that such extremes can change due to both changes in the mean climate and its variability. The recent IPCC report found large regions of low model agreement in the change of temperature variability in both December, January, February (DJF) and June, July, August (JJA) when considering 7 Single Model Initial-Condition Large Ensembles (SMILEs). In this study we use the framework described by Suarez-Gutierrez et al, (2021) to constrain future projections of temperature variability by selecting the SMILEs that best represent observed variability. We use 11 SMILEs with CMIP5 and CMIP6 forcing and consider 9 ocean regions and 24 land regions. We then assess, for both DJF and JJA, whether temperature variability projections are constrained by selecting for models capture observed variability in individual regions and seasons. We consider projected changes at various warming levels to account for differences in warming between models and the use of different future scenarios across CMIP5 and 6. We identify MPI-GE and CESM2 as the SMILEs that capture observed variability sufficiently. across most regions (29 & 30 out of 33 in DJF and 28 and 26 in JJA respectively). Whether temperature variability projections are constrained depends on both season and region. For example, in DJF over South East Asia the constraint does not change the already large spread of projections. Conversely, over the Amazon the constraint tells us temperature variability will increase in DJF whereas the entire model archive does not agree on the sign of the change. This method can be used to better constrain our uncertainty in temperature variability projections by selecting SMILEs that best represent observed variability.

How to cite: Maher, N., Suarez-Gutierrez, L., and Milinski, S.: Constraining temperature variability projections using SMILEs that best represent observed variability, EGU General Assembly 2023, Vienna, Austria, 23–28 Apr 2023, EGU23-10531, https://doi.org/10.5194/egusphere-egu23-10531, 2023.

EGU23-12849 | ECS | Posters on site | CL4.10 | Highlight

Interpreting extreme climate impacts from large ensemble simulations — are they unseen or unrealistic? 

Timo Kelder, Tim Marjoribanks, Louise Slater, Niko Wanders, Rob Wilby, and Christel Prudhomme

Large ensemble simulations may be exploited to appreciate plausible extreme climate impacts that we may not yet have seen. Such information can be vital for decision makers to anticipate otherwise unforeseen impacts. Large ensemble simulations can generate larger data samples than the observed record but biases are likely to exist, which may occasionally produce unrealistic extreme events. Interpreting simulated 'unseen' events that are more extreme than those seen in historical records is therefore crucial, but adequate evaluation is complicated by observational uncertainties and natural variability. In this talk, we introduce a three-step procedure to assess the realism of simulated extreme events based on the model properties (step 1), statistical features (step 2), and physical credibility of the extreme events (step 3). We use the global climate model EC-Earth and global hydrological model PCR-GLOBWB to demonstrate these steps for a 2000 year Amazon monthly flood ensemble. The spatial model resolution of 1x1° and daily temporal resolution is coarse, but no reason to dismiss monthly flood simulations over the Amazon a priori. We find that the simulations are statistically inconsistent with the observations, but we cannot determine whether simulations outside observed variability are inconsistent for the right physical reasons. For example, there could be legitimate discrepancies between simulations and observations resulting from infrequent temporal compounding of multiple flood peaks, rarely seen in observations. Physical credibility checks are crucial to assessing their realism and show that the unseen Amazon monthly floods were generated by an unrealistic bias correction of precipitation. Based on this case study, we discuss the takeaway challenges when evaluating extreme climate impacts from large ensemble simulations. Understanding the drivers of simulations outside observed variability helps to gain trust in unseen simulations. Uncovering the characteristics of events in the models may reveal the most important model deficiencies or improve our scientific understanding of unseen events.

How to cite: Kelder, T., Marjoribanks, T., Slater, L., Wanders, N., Wilby, R., and Prudhomme, C.: Interpreting extreme climate impacts from large ensemble simulations — are they unseen or unrealistic?, EGU General Assembly 2023, Vienna, Austria, 23–28 Apr 2023, EGU23-12849, https://doi.org/10.5194/egusphere-egu23-12849, 2023.

EGU23-14112 | Posters on site | CL4.10

First results from ModE-Sim - A medium size AGCM ensemble to study climate variability during the past 600 years 

Ralf Hand, Laura Hövel, Eric Samakinwa, and Stefan Brönnimann

ModE-Sim is a medium size ensemble that can be used to study climate variability of the past 600 years. It was created using the atmospheric general circulation model ECHAM6 in its LR version (T63L47). With 60 ensemble members between 1420 and 1850 and 36 ensemble members from 1850 to 2009 ModE-Sim consists of 31620 simulated years in total. The dataset was designed as an input for a data assimilation procedure that combines historical climate informations with additional constraints from a climate model to produce a novel gridded 3-dimensional dataset of the modern era. Additionally, ModE-Sim on its own is also suitable for many other applications as its various subsets can be used as initial condition ensemble to study climate variability. We show that the ensemble has a realistic response to external forcings and that it is capable of capturing internal variability on monthly to annual time scales. At the example of heat waves we show that ModE-Sim can even be useful to study extreme events.

How to cite: Hand, R., Hövel, L., Samakinwa, E., and Brönnimann, S.: First results from ModE-Sim - A medium size AGCM ensemble to study climate variability during the past 600 years, EGU General Assembly 2023, Vienna, Austria, 23–28 Apr 2023, EGU23-14112, https://doi.org/10.5194/egusphere-egu23-14112, 2023.

EGU23-14461 | Posters on site | CL4.10 | Highlight

Differences in physical drivers of diurnal and nocturnal summer heat waves 

Laura Muntjewerf, Siem Rothengatter, Richard Bintanja, and Karin Van der Wiel

Heat waves place a large burden on society. There are differences in the societal impact between diurnal heatwaves and nocturnal heatwaves. The latter in particular places stress on humans and animals, where exceeding the thermal comfort level may lead to heat-related deaths. Climate change affects not just the mean temperature, but also occurrences of exceptional warmth. We postulate that climate change has a different effect on the occurrence of diurnal and nocturnal heatwaves.

Heat waves are extreme events that, by definition, don’t occur frequently. To study extreme events and to be able to robustly do statistical analyses, we use the large ensemble KNMI-LENTIS. This way, we don’t have to rely on statistical interpolation to have enough events to study. KNMI-LENTIS is a time-slice large ensemble generated with the global climate model EC-Earth3. It consists of 2 time slices: the present-day climate and a future climate that is +2K warmer than the present-day. Each time slice consists of 1600 years.

We investigate the formation and ending of different types of summer heat waves in north-western Europe. Making the distinction between nocturnal, diurnal and compound heat waves allows us to disentangle the physical processes that drive the different types. Particularly we focus on advection and large-scale processes on the one hand, and local processes based on land-atmosphere coupling feedback mechanisms on the other hand.  

How to cite: Muntjewerf, L., Rothengatter, S., Bintanja, R., and Van der Wiel, K.: Differences in physical drivers of diurnal and nocturnal summer heat waves, EGU General Assembly 2023, Vienna, Austria, 23–28 Apr 2023, EGU23-14461, https://doi.org/10.5194/egusphere-egu23-14461, 2023.

EGU23-16537 | ECS | Posters on site | CL4.10

Greater rate of climate zone change in CMIP6 Earth System Models due to stronger warming rates 

Ali Serkan Bayar, M. Tuğrul Yılmaz, İsmail Yücel, and Paul Dirmeyer

Köppen-Geiger climate classification is a valuable tool to define climate zones based on the annual cycles of temperature and precipitation. In this study, we use the high-emission scenario global climate models from the Coupled Model Intercomparison Project phase 6 (CMIP6) and phase 5 (CMIP5) along with observations and apply the Köppen-Geiger climate classification. We aim to address the ecological consequences of climate change and compare the two generations of models. Compared to their predecessors, CMIP6 models show slightly improved performance in representing the reference period (1976-2005) observed climate zones. CMIP6 models project a 42-48% change in climate zones by the end of the century, depending on which ensemble subset is used. The projected change rates based on CMIP6 are above the global average for Europe (81-88%) and North America (57-66%). The reductions in the areas of cold and polar climate zones are more pronounced in CMIP6 models compared to CMIP5. Using an ensemble subset of CMIP6 models that are consistent with the latest evidence for equilibrium climate sensitivity limits the changes in climate zones, and their results converge towards the results based on CMIP5. CMIP6 models also project a greater rate of climate zone change throughout the century than CMIP5. The greater change rate observed in CMIP6 is essentially dominated by the stronger projected warming rates of these models, whose plausibility is a matter of concern.

How to cite: Bayar, A. S., Yılmaz, M. T., Yücel, İ., and Dirmeyer, P.: Greater rate of climate zone change in CMIP6 Earth System Models due to stronger warming rates, EGU General Assembly 2023, Vienna, Austria, 23–28 Apr 2023, EGU23-16537, https://doi.org/10.5194/egusphere-egu23-16537, 2023.

The appraisal of climate change impacts on river hydrology using different Global Climate Models (GCM) and emission scenarios is incomplete, without quantifying the uncertainty associated with it. It is critical to quantify those uncertainties in order to develop beneficial managerial capabilities. The objective of the present study is to model the GCM and scenario uncertainty in Western Ghats (WG) river basins of South India using Reliability Ensemble Average (REA) for the estimation of stream flows. The analysis is carried out grid wise, for monsoon (JJAS) rainfall in near future (2011-2040). The statistically downscaled (kernel regression) rainfall data at 0.25o resolution for three CMIP-6 GCMs CNRM, CCCMA and MPILR for SSP2 4.5 and SSP5 8.5 are used in the present study. The river basins Netravati, (upper region), Kadalundi (middle region) and Manimala (lower region) in different elevation profile (lowland, midland and ghats) of WG are chosen as a criterion for quantifying the uncertainty associated with GCM models and emission scenarios. The uncertainty associated with GCM is found to be more significant than the scenario uncertainty in this region. The GCM model shows good correlation with the latitude profile in WG. The GCM MPILR have higher weightage in lower and middle region as compared to the others while the GCM CNRM is less pronounced in the high elevation zones along the basin.

Keywords: Climate Change, Variable Infiltration Capacity Model, Uncertainty, REA approach.

How to cite: Chandu, N. and Eldho, T. I.: Analysis of  Uncertainty Due to Climate Change Using REA Approach in Different Rivers of Western Ghats, South India, EGU General Assembly 2023, Vienna, Austria, 23–28 Apr 2023, EGU23-17597, https://doi.org/10.5194/egusphere-egu23-17597, 2023.

EGU23-497 | ECS | Posters virtual | CL4.11

Narrowing uncertainties in projected warming by constraining using the past global warming trend with the pattern effect removed 

yongxiao liang, Nathan Gillett, and Adam Monahan

Observational constraint methods based on emergent relationships between observable predictors and future projected warming across multi-model ensembles enable us to constrain multi-model projections. Unforced internal variability in predictors can weaken such emergent relationships. Assessing the Sixth Coupled Model Intercomparison Project (CMIP6) with all accessible realizations, we find that there of sea surface temperature (SST) trend over the eastern tropical pacific (ETP) which is well correlated with the global warming trend. The strong cooling in the ETP in observations induces a global-scale cooling, yet most realizations in the CMIP6 multi-model ensemble cannot reproduce it. Using the observed raw historical global mean near surface air temperature (GSAT) trend as a constraint therefore results in a relatively lower projected 21st century warming. However, by removing the unforced internal variability associated with variation in the ETP in observed and simulated GSAT trends, we find an enhanced correlation between GSAT trends and projected warming and improved results in an imperfect model test. This approach results in a relatively higher 21st century warming than a constrained projection based on the raw GSAT trend, and brings constrained projections into much closer agreement with projections constrained using climatological cloud metrics.

How to cite: liang, Y., Gillett, N., and Monahan, A.: Narrowing uncertainties in projected warming by constraining using the past global warming trend with the pattern effect removed, EGU General Assembly 2023, Vienna, Austria, 23–28 Apr 2023, EGU23-497, https://doi.org/10.5194/egusphere-egu23-497, 2023.

EGU23-2271 | Posters on site | CL4.11

High-resolution (1 km) Köppen-Geiger maps for 1901–2099 based on constrained CMIP6 projections for seven socio-economic scenarios 

Hylke Beck, Tim McVicar, Noemi Vergopolan, Alexis Berg, Nicholas Lutsko, Ambroise Dufour, Zhenzhong Zeng, Xin Jiang, Albert van Dijk, and Diego Miralles

We present Version 2 of our widely used 1-km Köppen-Geiger climate classification maps for historical and future climate conditions. The historical maps (1901–1930, 1931–1960, 1961–1990, 1991–2020) are based on high-resolution, observation-based climatologies, while the future maps (2041–2070 and 2071–2099) are based on downscaled and bias-corrected climate projections for seven shared socio-economic pathways (SSPs). We evaluated 64 climate models from the Coupled Model Intercomparison Project phase 6 (CMIP6) and kept a subset of 40 with the most plausible CO2-induced warming rates. Under the “middle of the road” scenario SSP2-4.5, the global land surface area (excluding Antarctica) with suitable climatic conditions for tropical, arid, temperate, cold, and polar vegetation is projected to show a net change of +9 %, +3 %, 3 %, 2 %, 33 %, respectively, in 2071–2099 (with respect to 1991–2020). The Köppen-Geiger maps, including associated confidence estimates, the underlying monthly air temperature and precipitation data, and sensitivity metrics for CMIP6 climate models are available at www.gloh2o.org/koppen.

How to cite: Beck, H., McVicar, T., Vergopolan, N., Berg, A., Lutsko, N., Dufour, A., Zeng, Z., Jiang, X., van Dijk, A., and Miralles, D.: High-resolution (1 km) Köppen-Geiger maps for 1901–2099 based on constrained CMIP6 projections for seven socio-economic scenarios, EGU General Assembly 2023, Vienna, Austria, 23–28 Apr 2023, EGU23-2271, https://doi.org/10.5194/egusphere-egu23-2271, 2023.

EGU23-3204 | Orals | CL4.11 | Highlight

Dynamical systems approaches to climate response and climate tipping 

Anna von der Heydt

The currently ongoing climate change and the debate about possible measures to be taken to limit the consequences of climate change, requires to know and understand the future response of the climate system to greenhouse gas emissions. Classical measures of climate change such as the Equilibrium Climate Sensitivity (ECS) are inherently linear and unable to account for abrupt transitions due to (interacting) tipping elements.

In this presentation I will discuss more general notions of climate sensitivity defined on a climate attractor that can be useful in understanding the response of a climate state to changes in radiative forcing. For example, a climate state close to a tipping point will have a degenerate linear response to perturbations, which can be associated with extreme values of the ECS. While many identified tipping elements in the climate system are regional and may have no direct impact on the global mean temperature, cascades of tipping elements can potentially have an impact, initiated by the threshold of the leading tipping element in a cascade.

How to cite: von der Heydt, A.: Dynamical systems approaches to climate response and climate tipping, EGU General Assembly 2023, Vienna, Austria, 23–28 Apr 2023, EGU23-3204, https://doi.org/10.5194/egusphere-egu23-3204, 2023.

EGU23-3905 | Orals | CL4.11

Rate-Induced Tipping of the Compost Bomb: Sizzling Summers, Heteroclinic Canards and Metastable Zombie Fires 

Kieran Mulchrone, Eoin O'Sullivan, and Sebastian Wieczorek

The Arctic is the fastest warming region on Earth. Understanding how a rapidly changing climate change impacts Arctic systems is therefore an important challenge. This is the basis of the `Compost-Bomb' instability, a theorized runaway heating of northern latitude peat soils when atmospheric temperature rises faster than some critical rate, first proposed in [Luke & Cox, European Journal of Soil Science (2011), 62.1] and analysed in [Wieczorek et al, Proceedings of the Royal Society A (2011), 467.2129]. The Compost Bomb instability was one of the first examples of what is known as Rate-induced tipping or R-tipping.

The key trigger for the compost bomb instability is heat produced by microbial respiration. Here, the original soil carbon and temperature model of Luke & Cox is augmented with a non-monotone microbial respiration function, for a more realistic representation of the process. This gives rise to a meta-stable state, reproducing the results of [Khvorostyanov et al, Tellus (2008), 60B] where a complex PDE model is used. Two non-autonomous climate forcings are examined: (i) a rise in mean air temperature over decades (ii) a short-lived extreme weather event, with the rate-induced compost bomb observed in each. Using techniques of compactification, singular perturbation theory and desingularisation, we reduce the R-tipping problem to one of heteroclinic orbits, uncovering the tipping mechanism for each climate change scenario.

How to cite: Mulchrone, K., O'Sullivan, E., and Wieczorek, S.: Rate-Induced Tipping of the Compost Bomb: Sizzling Summers, Heteroclinic Canards and Metastable Zombie Fires, EGU General Assembly 2023, Vienna, Austria, 23–28 Apr 2023, EGU23-3905, https://doi.org/10.5194/egusphere-egu23-3905, 2023.

Climatological risk assessments are currently based on simulations for the twenty-first century made using global climate models (GCMs) from the sixth Coupled Model Intercomparison Project Phases (CMIP6) by adopting several hypothetical shared socioeconomic pathways (SSPs) emission scenarios. However, there are large differences in the climatic sensitivity to atmospheric CO2 increase amongst the available climate models: for example, for the CMIP6 GCM the ECS varies between 1.8°C and 5.7°C and the TCR varies from 1.2°C to 2.8°C. There is also mounting evidence that many GCMs are operating "too hot" and are therefore unreliable for informing climate change policy for the future. Here, we assess the performance of 41 CMIP6 GCMs by ranking and comparing them using their literature-provided estimates for the equilibrium climate sensitivity (ECS) and transient climate response (TCR). We discover that the GCM sub-ensemble that performs the best in hindcasting the warming from 1980 to 2021 is that made of the GCMs with ECS ranging between 1.8 and 3.0 °C and TCR ranging between 1.2 and 1.8 °C. A total of 17 models make up this GCM sub-ensemble. The predicted warming of these models for the mid-term (2041-2060) period is 1.5–2.5°C relative to the preindustrial period (1850-1900) according to various SSP scenarios. Thus, the global aggregated impact and risk assessments assuming low to no adaptation appear, therefore, moderate, which also implies that adaptation policies may be adequate to address any unfavorable effects of future climate changes. We also discuss the additional uncertainties surrounding the warming of the Earth's surface temperature by comparing several temperature reconstructions and the warming differences observed between land and ocean to discuss the possibility that ECS and TRC could be furtherly constrained.

Main references:

Scafetta N (2022) Advanced testing of low, medium, and high ECS CMIP6 GCM simulations versus ERA5-T2m. Geophys Res Lett 49:e2022GL097716. https://doi.org/10.1029/2022GL097716

Scafetta, N. CMIP6 GCM ensemble members versus global surface temperatures. Clim Dyn (2022). https://doi.org/10.1007/s00382-022-06493-w

How to cite: Scafetta, N.: Constraining ECS and TCR for 21st century for temperature forecasts and risk assessments by comparing the CMIP6 GCM simulations versus global surface temperature records, EGU General Assembly 2023, Vienna, Austria, 23–28 Apr 2023, EGU23-4493, https://doi.org/10.5194/egusphere-egu23-4493, 2023.

EGU23-4917 | Orals | CL4.11 | Highlight

Theoretical and observational evidence for climate tipping points 

Niklas Boers

Some components of the Earth system could change their state abruptly in response to a warming atmosphere and associated changes in climate conditions. This possibility has been recognized as one of the greatest potential threats associated with anthropogenic climate change. Examples  include the Atlantic Meridional Overturning Circulation, the polar ice sheets, the Amazon rainforest, and possibly the tropical monsoon systems.  The empirical evidence for abrupt climate transitions comes from paleoclimate proxy records, but also in observational records, signs of stability loss for some of the major tipping elements have been suggested. Here we explain some of the key theoretical concepts suggesting that tipping events may happen under ongoing climate change and summarize the empirical evidence for stability loss in some Earth system components with focus on candidates for future abrupt transitions. We argue that the critical forcing levels and rates are subject to large uncertainties and hence difficult to prdict. Improvements will require combining information from paleoclimate records, simulations with a hierarchy of models, and from observation-based data.

How to cite: Boers, N.: Theoretical and observational evidence for climate tipping points, EGU General Assembly 2023, Vienna, Austria, 23–28 Apr 2023, EGU23-4917, https://doi.org/10.5194/egusphere-egu23-4917, 2023.

Low-order coupled models of the atmosphere and ocean can illuminate the role of weather-climate interactions in long-term climate prediction. An important example is models that bring together the interplay between the Atlantic meridional overturning circulation (AMOC) with mid-latitude quasi-geostrophic dynamics of the atmosphere, as in the coupled model introduced by Van Veen et al (2001). In such models, the AMOC can transition from its present thermally driven to a much weaker salinity-driven state, through a tipping point. We show using these coupled models that, for scenarios with intermediate forcing between a strong and weak circulation, the long-term evolution shows extreme sensitivity to initial conditions, due to the appearance of riddled basins of attraction. The literature on dynamical systems has extensively examined such dynamics when two distinct basins of attraction are riddled, that is any small part of one attractor’s basin also includes a piece of the other. Moreover, in the presence of feedback from the atmosphere to the ocean, initial atmospheric conditions are amplified to the extent that long-term prediction in these models is inhibited by the finite precision at which the atmospheric state is known. We propose to describe the various facets of this phenomenon and consider the lessons for understanding and predicting long-term climate (in our case, thermohaline circulation), given initial state uncertainty. Furthermore, the resulting challenges of long-term prediction are not necessarily ameliorated by the real-world asymmetries in the model. When the relevant symmetries that yield riddled basins are broken through perturbations to the vector fields, the asymptotic dynamics become perfectly predictable given the initial conditions; however, long-term uncertainties in the transient state (strong vs weak circulation) persist for centuries, owing to ocean timescales.


How to cite: Seshadri, A. K. and Stainforth, D.: Challenges of long-term AMOC prediction due to riddled basins in coupled atmosphere-ocean models, EGU General Assembly 2023, Vienna, Austria, 23–28 Apr 2023, EGU23-6055, https://doi.org/10.5194/egusphere-egu23-6055, 2023.

EGU23-6484 | ECS | Orals | CL4.11

R-tipping and N-tipping in a vegetation pattern model 

Lilian Vanderveken, Marina Martínez Montero, and Michel Crucifix

Vegetation in semi-arid regions has adapted to low rainfall by organizing itself in patterns, which can be described by reaction-diffusion equations that include local positive feedback (e.g. infiltration) and non-local mitigation (e.g. lateral water flow). This allows the vegetation to survive in lower rainfall conditions and creates multiple stable states, meaning that for a fixed amount of rainfall, the vegetation can exist in different patterns. It is possible to identify these different equilibrium states and to create a bifurcation diagram for the model.
As the climate changes, there is likely to be a shift in the rainfall patterns in the Sahel, although it is not yet clear if there will be an increase or decrease in precipitation. In this context, we use the vegetation pattern model and its bifurcation diagram to understand how it will respond to slow and fast changes in rainfall, and explore the possibility of rate-induced tipping (R-tipping). 
On the other hand, rainfall, land use and fires have a stochastic component, which we represent by adding two types of noise to the system: homogeneous and heterogeneous. This noise can cause a switch from one stable equilibrium to another, known as N-tipping, depending on the type of noise applied. The vegetation pattern is more stable to homogeneous noise than heterogeneous, but when it tips the homogeneous noise kill all the vegetation.
Understanding how patterned systems respond to changing environments and noise is critical for predicting the future evolution of various patterned systems globally, not just vegetation in the Sahel.
This project has received funding from the European Union’s Horizon 2020 research and innovation programme (grant no. 820970). 

How to cite: Vanderveken, L., Martínez Montero, M., and Crucifix, M.: R-tipping and N-tipping in a vegetation pattern model, EGU General Assembly 2023, Vienna, Austria, 23–28 Apr 2023, EGU23-6484, https://doi.org/10.5194/egusphere-egu23-6484, 2023.

EGU23-7393 | Posters on site | CL4.11

The paradox of the darkening planet and the Earth’s climate sensitivity 

Peter Cox, Mark Williamson, Joe Clarke, Chris Huntingford, and Paul Ritchie

Studies of the observed record of global warming suggest that the Earth’s climate sensitivity is at the lower end of the range produced by the CMIP6 Earth System Models (Jimenez and Mauritsen, 2019; Nijsse et al., 2020; Tokarska et al., 2020). However, studies based on top-of-the-atmosphere fluxes often suggest the opposite (Brown et al., 2017; Sherwood et al., 2020).

Earthshine estimates (Goode et al., 2021) and satellite measurements of the planetary albedo from CERES (Loeb et al., 2018) both indicate that the Earth has darkened significantly over the past two decades. Planetary darkening is also simulated in CMIP6 historical simulations , but the models with the highest climate sensitivities tend to fit the observed decline in planetary albedo much better. Observed planetary darkening therefore favours higher climate sensitivities, but constraints based on ground-based global warming records favour lower climate senstivities.

We explore this apparent paradox by calculating the contributions to changes in global warming that arise from diagnosable changes in planetary albedo and effective global emissivity, in both models and observational records. Differences between low and high sensitivity models are found to be predominantly due to the rate at which the modelled planetary albedo declines, which can in principle be due to a combination of forcing and feedbacks. However, planetary darkening in higher sensitivity models is primarily due to reductions in cloud cover, which results in a positive SW cloud feedback.

By contrast, the planetary darkening seen in the CERES satellite record is driven not by reductions in cloud cover, but instead by the darkening of clouds, and to a lesser extent by the darkening of clear skies. This suggest that darkening in CERES is driven by reductions in aerosols, which leads to reductions in negative aerosol forcing.  Planetary darkening in CERES therefore seems to be due primarily to changes in aerosol forcing.

Our proposed resolution to ‘The paradox of the darkening planet and the Earth’s climate sensitivity’ is therefore that climate sensitivity is indeed towards the lower end of the CMIP6 model range (as suggested by observed records of global warming), and that higher sensitivity models get the rate of planetary darkening ‘right’ but by the wrong mechanism (i.e. as a cloud forcing rather than as an aerosol feedback).  We will back this up by comparing the spatial patterns of planetary albedo change from models and the CERES satellite data, and finish by discussing possible implications for the time-varying aerosol precursor fields that are used to drive the CMIP6 simulations.

How to cite: Cox, P., Williamson, M., Clarke, J., Huntingford, C., and Ritchie, P.: The paradox of the darkening planet and the Earth’s climate sensitivity, EGU General Assembly 2023, Vienna, Austria, 23–28 Apr 2023, EGU23-7393, https://doi.org/10.5194/egusphere-egu23-7393, 2023.

EGU23-7869 | ECS | Orals | CL4.11

Observations-based machine learning model constrains uncertainty in future regional warming projections. 

Sophie Wilkinson, Peer Nowack, and Manoj Joshi

Knowledge about future global and regional warming is essential for effective adaptation planning and our current temperature projections are based on the output of global climate models (GCMs). Although GCMs agree on the direction of change, there are still significant discrepancies in the magnitude of the projected response1. 

Here we develop a novel method2,3 for constraining uncertainty in future regional temperature projections based on the predictions of an observationally trained machine learning algorithm, Ridge-ERA5. Ridge-ERA5 - a Ridge regression model4- learns coefficients to represent observed relationships between daily temperature anomalies and a selection of thermodynamic and dynamical variables in the ECMWF Re-Analysis (ERA) 5 dataset5. Climate-invariance of the Ridge relationships is demonstrated in a perfect model framework: we train a set of 23 Ridge-CMIP models on historical data of the Coupled Model Intercomparison Project (CMIP) phase 66 and evaluate their predictions using future scenario data from the most extreme future emissions pathway, SSP 5-8.5.  

Combining the historically constrained Ridge-ERA5 coefficients with normalised inputs from CMIP6 future climate change simulations forms the basis of a new methodology to derive observational constraints on regional climate change. For daily, regional (2°x2°), summer temperatures across the Northern Hemisphere, the Ridge-ERA5 observations-based constraint implies, for example, that a group of higher sensitivity CMIP6 models is inconsistent with observational evidence (including in Eastern, West & Central, and Northern Europe) potentially suggesting that the sensitivity of these models is indeed too high7,8. A key advantage of our new method is the ability to constrain regional projections at very high – daily – temporal resolution which includes extreme events such as heatwaves. 


1) Brient, F. (2019) Reducing Uncertainties in Climate Projections with Emergent Constraints: Concepts, Examples and Prospects. Advances in Atmospheric Sciences 2020 37:1, 37(1), pp. 1–15. 

2) Ceppi, P. and Nowack, P. (2021) Observational evidence that cloud feedback amplifies global warming. PNAS, 118(30). 

3) Nowack, P. et al. An observational constraint on the uncertainty in stratospheric water vapour projections. (in review) 

4) Hoerl, A. E. and Kennard, R. W. (1970) Ridge Regression: Applications to Nonorthogonal Problems. Technometrics, 12(1), pp. 69–82.  

5) Hersbach, H. et al. (2020) The ERA5 global reanalysis. Quarterly Journal of the Royal Meteorological Society, 146(730), pp. 1999–2049.  

6) Eyring, V. et al. (2016) Overview of the Coupled Model Intercomparison Project Phase 6 (CMIP6) experimental design and organization. Geoscientific Model Development, 9(5), pp. 1937–1958.  

7) Zelinka, M. D. et al. (2020) Causes of Higher Climate Sensitivity in CMIP6 Models. Geophysical Research Letters, 47(1). 

8) Zhu, J., Poulsen, C. J. and Otto-Bliesner, B. L. (2020) High climate sensitivity in CMIP6 model not supported by paleoclimate. Nature Climate Change 2020 10:5, 10(5), pp. 378–379. 

How to cite: Wilkinson, S., Nowack, P., and Joshi, M.: Observations-based machine learning model constrains uncertainty in future regional warming projections., EGU General Assembly 2023, Vienna, Austria, 23–28 Apr 2023, EGU23-7869, https://doi.org/10.5194/egusphere-egu23-7869, 2023.

The North Atlantic is a pacemaker of global climate through the Atlantic meridional overturning circulation (AMOC) and a large anthropogenic carbon uptake. Removal of anthropogenic carbon in the atmosphere by the ocean is key mechanism for modulating warming rate of globe. But, there is a large uncertainty in climate models for simulating AMOC and anthropogenic carbon uptake. To reduce the uncertainties in anthropogenic carbon uptake and its associated Northern Hemisphere surface warming, here we apply an emergent constraint. Sea surface salinity is often used to represent ocean circulations through its strong relationship with ocean density. The results suggest that the present-day sea surface salinity in the North Atlantic subpolar region constrains the future warming of the Northern Hemisphere by modulating anthropogenic carbon uptake in the North Atlantic. Models that generate a present-day higher SSS in the North Atlantic subpolar region systematically tend to a greater uptake of anthropogenic carbon, resulting in a slower warming in the Northern Hemisphere.

How to cite: Park, I.-H. and Yeh, S.-W.: North Atlantic carbon uptake modulates warming rate of the future Northern Hemisphere, EGU General Assembly 2023, Vienna, Austria, 23–28 Apr 2023, EGU23-10784, https://doi.org/10.5194/egusphere-egu23-10784, 2023.

The increasing of atmospheric CO2 concentration due to human activities accelerates a warming rate and causes extreme climate events. The atmospheric-terrestrial biosphere carbon cycle is important for achieving the Paris agreement warming target and carbon neutrality with net zero emission. To understand the ecosystem carbon cycle, the Earth system model (ESM) is developed. However, there is a large inter-model uncertainty among ESMs thus reducing this uncertainty through understanding the relationship between atmospheric CO2 concentration and the terrestrial biosphere carbon cycle is important for reliable climate projection. Here, we investigate the impacts of inter-model differences in CO2 concentration over the East Asia on terrestrial carbon cycle using multi-ESMs. There is a larger uncertainty CO2 concentration in ESMs during historical period (1950-2014). To investigate impact of inter-model difference of CO2 concentration in ESMs on terrestrial vegetation in East Asia, we analyze emission-driven historical simulation in CMIP6 by classifying ESMs into two groups based on the averaged CO2 concentration in East Asia. The results show that inter-model difference of CO2 concentration in East Asia is associated with the carbon fertilization effect. ESMs with high CO2 concentration tend to simulate promoted vegetation activity. Furthermore, we analyze the relationship between CO2 concentration, terrestrial biosphere, and climate factors.

How to cite: Park, H.-J. and Yeh, S.-W.: Understanding the impacts of inter-model difference in atmospheric CO2 concentration on terrestrial vegetation, EGU General Assembly 2023, Vienna, Austria, 23–28 Apr 2023, EGU23-11010, https://doi.org/10.5194/egusphere-egu23-11010, 2023.

We describe a new statistical method to narrow uncertainty on estimates of past and climate change. Our approach can be viewed as an adaptation of Kalman Filtering, or Kriging, for Climate Change. The definition of what we call "signal" and "noise" are different from those used in typical weather forecasting systems, but the formalism is pretty similar, and estimation of the "model error" and "observational error" covariance matrices play a central role.


This approach allows us to simultaneously constrain projections, metrics of sensitivity, and to assess human influence on the past climate (attribution). It provides a consistent picture of on-going changes, through merging model simulations and observations in a Bayesian fashion. Cross-validation suggests that our method produces robust results and is not overconfident.


Beyond GSAT results, I will focus on application of this method to narrow uncertainty on regional or local scale warming -- which is a step forward from the AR6. Even at the local scale, we find that observational constraints narrow uncertainty on future warming, and that local observations provide useful information. The case of France will be used as an illustrative example, then I'll describe local results worldwide and show how they constrain warming patterns. I will briefly browse other applications, including some related to the water cycle, and discuss implications of this work. 

How to cite: Ribes, A. and Qasmi, S.: A Kalman Filtering approach to reduce uncertainty on global and regional climate change, EGU General Assembly 2023, Vienna, Austria, 23–28 Apr 2023, EGU23-12523, https://doi.org/10.5194/egusphere-egu23-12523, 2023.

EGU23-13608 | Orals | CL4.11

Evaluation of Precipitation Emergent Constraints in CMIP5 and CMIP6 

Olivia Ferguglia, Elisa Palazzi, and Jost von Hardenberg

An Emergent Constraint (EC) is a physically-explainable relationship between model simulations of a past climate variable (predictor) and projections of a future climate variable (predictand). By constraining the predictor through observations, it is possible to narrow future model projections, if a significant correlation between the predictor and the predictand exists. In our work, the EC technique has been applied to the analysis of precipitation and precipitation extremes, variables that are strongly affected by model uncertainties and still insufficiently analyzed in the context of ECs. One of the main challenges in determining an EC is establishing if the relationship found is physically meaningful and if it is robust to changes in the composition of the model ensemble. Four ECs already documented in the literature and so far tested only with CMIP3 or CMIP5, have been reconsidered in our study. Their existence and robustness are evaluated by developing a systematic methodology that involves different subsets and different scenarios of CMIP5 and CMIP6 models, verifying if an EC found in CMIP3/CMIP5 is still present in the most recent ensemble and assessing its sensitivity to the detailed ensemble composition. Three out of the four ECs considered in our work did not pass the test, being robust in CMIP5 but not in CMIP6, or (in one case) being not robust in both CMIP5 and CMIP6. Only one EC is verified and robust in both model ensembles. These results show the difficulty of identifying robust precipitation ECs and cast doubts on the usability of such ECs as a tool to  reduce uncertainties in future projections of precipitation change. At the same time, this work highlights the importance of the EC technique  as a way to improve our understanding  of climate phenomena and their drivers and to investigate precipitation-related feedbacks, providing evidence of connections between precipitation and different climate variables. This observation lays the path to further explore original ECs.

How to cite: Ferguglia, O., Palazzi, E., and von Hardenberg, J.: Evaluation of Precipitation Emergent Constraints in CMIP5 and CMIP6, EGU General Assembly 2023, Vienna, Austria, 23–28 Apr 2023, EGU23-13608, https://doi.org/10.5194/egusphere-egu23-13608, 2023.

EGU23-14962 | ECS | Posters on site | CL4.11

Tipping the Amazon Rainforest: Regional deforestation and land-climate interactions 

Shabehul Hasson, Benjamin Stuch, Ellen Kynast, Jürgen Böhner, Rüdiger Schaldach, and Hermann Jungkunst

The Amazon rainforest is globally relevant and is considered a tipping element in the global climate system. Studies suggest that deforestation in the Amazon by around 30% may disturb regional convective rain patterns, which could increase drought frequencies and intensities locally and, may activate a cascade of tipping elements in the global climate system. Here, we aim to assess the relationship between deforestation and climate responses at a convection-permitting scale by employing a non-hydrostatic mesoscale Weather Research and Forecasting (WRF) model. For this, we first developed a spatially explicit deforestation model for the South-Western Amazon to see an effect of deforestation intensity ranging from 10% to 60%, and then based on 30% deforestation, we further see the role of deforestation pattern (e.g. deforestation alongside the roads, as a large single or small multiple circular plots, and their geographical positions), and shifts to anticipated land use. Then for each deforestation map, we simulate the land-atmosphere interactions and responses in the regional rainfall and temperatures by dynamically downscaling the ERA5 reanalysis using WRF for the year 2020 at 5km spatial resolution and by explicitly resolving convection. We assess non-linearity in the land-climate interaction to different combinations of deforestation quantities and deforestation patterns. Our preliminary results show a general pattern of decreasing mean and extreme rainfall with deforestation where the geographical location and the pattern of deforestation also play a role. The study will provide an insight into whether the employed quantitative methods are able, or good enough, to simulate relevant processes between the biosphere and the atmosphere that could promote assessing tipping points in the Amazon.

How to cite: Hasson, S., Stuch, B., Kynast, E., Böhner, J., Schaldach, R., and Jungkunst, H.: Tipping the Amazon Rainforest: Regional deforestation and land-climate interactions, EGU General Assembly 2023, Vienna, Austria, 23–28 Apr 2023, EGU23-14962, https://doi.org/10.5194/egusphere-egu23-14962, 2023.

EGU23-17341 | ECS | Posters virtual | CL4.11

Evidence of localised Amazon rainforest dieback in CMIP6 models 

Isobel Parry, Paul Ritchie, and Peter Cox

Amazon forest dieback is seen as a potential tipping point under climate change. These concerns are partly based-on an early coupled climate-carbon cycle simulation that produced unusually strong drying and warming in Amazonia. In contrast, the 5th generation Earth System Models (CMIP5) produced few examples of Amazon dieback under climate change. This presentation examines the results from seven 6th generation models (CMIP6) which include interactive vegetation carbon, and in some cases interactive forest fires. Although these models typically project increases in area-mean forest carbon across Amazonia under CO2-induced climate change, five of the seven models also produce abrupt reductions in vegetation carbon which indicate localised dieback events. The Northern South America region (NSA), which contains most of the rainforest, is especially vulnerable in the models. These dieback events, some of which are mediated by fire, are preceded by an increase in the amplitude of the seasonal cycle in near surface temperature, which is consistent with more extreme dry seasons. Based on the ensemble mean of the detected dieback events we estimate that 7+/-5% of the NSA region will experience abrupt downward shifts in vegetation carbon for every degree of global warming past 1.5°C.

How to cite: Parry, I., Ritchie, P., and Cox, P.: Evidence of localised Amazon rainforest dieback in CMIP6 models, EGU General Assembly 2023, Vienna, Austria, 23–28 Apr 2023, EGU23-17341, https://doi.org/10.5194/egusphere-egu23-17341, 2023.

EGU23-17365 | Posters on site | CL4.11 | Highlight

Do Emergent Constraints on Carbon Cycle Feedbacks hold in CMIP6? 

Manuel Schlund, Sabrina Zechlau, Peter Cox, Pierre Friedlingstein, and Veronika Eyring

Emergent constraints help to better understand Earth system processes in a changing climate and to constrain future climate projections. Here, we analyze the robustness of two previously found emergent constraints on carbon cycle feedbacks using models from the Coupled Model Intercomparison Project (CMIP) of Phases 5 and 6. First, an emergent constraint on the carbon-climate feedback is evaluated, which is found to be robust regarding the choice of model ensemble. For the combined CMIP5 and CMIP6 ensembles, the sensitivity of tropical land carbon uptake to tropical warming is constrained to −37 ± 14 GtC/K. Second, we analyze an emergent constraint on the carbon-concentration feedback. This emergent constraint (originally derived from the CMIP5 models) is not evident in the CMIP6 ensemble. This is in part because the historical increase in the amplitude of the CO2 seasonal cycle is more accurately simulated in CMIP6, such that the models are all now close to the observational constraint.

How to cite: Schlund, M., Zechlau, S., Cox, P., Friedlingstein, P., and Eyring, V.: Do Emergent Constraints on Carbon Cycle Feedbacks hold in CMIP6?, EGU General Assembly 2023, Vienna, Austria, 23–28 Apr 2023, EGU23-17365, https://doi.org/10.5194/egusphere-egu23-17365, 2023.

EGU23-17454 | Posters on site | CL4.11

Natural measures of asymptotically autonomous systems 

Julian Newman and Peter Ashwin

Rate-induced phenomena can be mathematically modelled in terms of a dynamical system with a real-time (as opposed to quasistatic) parameter drift between two values; that is to say, the parameter converges to two different values as time tends to negative and positive infinity, giving rise to a nonautonomous dynamical system that is asymptotically autonomous. Representing stable climate states by attractors of the parameter-dependent autonomous system through which the parameter drift takes place, rate-induced tipping is modelled as the phenomenon that a trajectory of the nonautonomous system that starts in the past in the vicinity of one attractor lands in the vicinity of an attractor representing a different stable climate state in the future. However, if these attractors are chaotic, they exhibit sensitive dependence on initial conditions, which on the one hand makes investigation of any individually selected typical initial condition numerically impossible and physically irrelevant, but on the other hand makes a probabilistic description of long-term behaviour of trajectories an effective tool. This probabilistic description is provided by the "natural measure" on a chaotic attractor; in this poster, we consider the question of when this concept of "natural measures" can be extended from the classical setting of autonomous systems to the setting of asymptotically autonomous systems and hence used to provide a mathematically well-defined quantification of the "probability of tipping" between two stable climate states.

How to cite: Newman, J. and Ashwin, P.: Natural measures of asymptotically autonomous systems, EGU General Assembly 2023, Vienna, Austria, 23–28 Apr 2023, EGU23-17454, https://doi.org/10.5194/egusphere-egu23-17454, 2023.

EGU23-17500 | ECS | Posters on site | CL4.11

Why is climate sensitivity to polar radiative forcings larger than to tropical radiative forcings 

Harpreet Kaur, Govindasamy Bala, and Ashwin Sheshadri

Several previous studies have shown that the climate sensitivity (global mean temperature change per unit global mean radiative forcing) to external forcing is larger for forcing that is concentrated in higher latitudes than in lower latitudes. This is due to differences in radiative feedback processes accompanying the surface temperature change and amplifying the climate change.  The present study investigates the cause for the larger climate sensitivity to radiative forcing imposed in polar regions as compared to lower latitudes using a climate modelling framework. We use the NCAR CAM4 model coupled to a slab ocean model and make a systematic quantitative comparison of the individual climate feedbacks (water vapor, Planck, lapse rate, albedo, and cloud) for three experiments in which we increase the solar insolation separately in three latitude bands:  60°N to 90°N (Arctic case), 20°S to 20°N (Tropical case), and 90°S to 60°S (Antarctic case). The global mean radiative forcing is nearly the same (~4.1 Wm-2) in the three cases. Our results show that the climate sensitivity, which varies inversely with the feedback parameter, is nearly twice and thrice the tropical case for the Arctic and Antarctic cases, respectively. The differences arise mostly due to water vapor, lapse rate, and cloud feedbacks, which vary significantly in the three cases (Table 1). Planck feedback does not vary much among the cases (-2.77, -3.05, -2.81 Wm-2K-1 for the Arctic, Tropical, and Antarctic simulation, respectively), but the albedo feedback is twice for the Arctic (0.5 Wm-2K-1) case when compared to the  tropical (0.23 Wm-2K-1) and Antarctic (0.20 Wm-2K-1) cases. Understanding climate response to latitudinally varying radiative forcing patterns is valuable for understanding the effects of solar radiation modification (SRM) techniques which have been proposed as a potential option to offset global warming effects of increased atmospheric CO2 concentrations. Our study indicates that the lapse rate, water vapor, and cloud feedbacks, and hence the total climate sensitivity, could strongly depend on the region of changed insolation in SRM approaches.


Table 1. The annual average effective radiative forcing, global average surface temperature change, climate sensitivity (calculated as the ratio of surface temperature change and the radiative forcing), the albedo, Planck, lapse rate, water vapor, and cloud feedbacks for the ‘Arctic’, ‘Tropical’, and ‘Antarctic’ experiments. The baseline simulation is a  preindustrial simulation with a CO2 concentration of 284.7 ppm and solar constant of 1361 W m-2.


Arctic

Tropical

Antarctic

Radiative forcing (Wm-2)

4.16

4.17

4.05

Surface temperature change (K)

4.04

1.74

5.14

Climate sensitivity (K/Wm-2)

0.97

0.42

1.27

Albedo feedback (Wm-2K-1)

0.51

0.23

0.20

Planck feedback (Wm-2K-1)

-2.79

-3.07

-2.82

Lapse rate feedback (Wm-2K-1)

0.38

-0.93

0.01

Water vapor feedback (Wm-2K-1)

0.92

1.86

1.01

Cloud feedback (Wm-2K-1)

0.16

-0.41

0.38


How to cite: Kaur, H., Bala, G., and Sheshadri, A.: Why is climate sensitivity to polar radiative forcings larger than to tropical radiative forcings, EGU General Assembly 2023, Vienna, Austria, 23–28 Apr 2023, EGU23-17500, https://doi.org/10.5194/egusphere-egu23-17500, 2023.

EGU23-17519 | Posters virtual | CL4.11

Acceleration of Daily Land Temperature Extremes and Link to Land Forcing 

Chris Huntingford, Peter Cox, Paul Rithie, Joe Clarke, and Mark Williamson

We analyse a large number of Earth System Models (ESMs) and find that there is some evidence that the temperatures of extreme events are rising faster than local background rises in mean summer temperatures. We find this to be true for almost all land regions when analysing the SSP585 scenario and for the decades from now until the end of the 21st Century. We find strong correlations between the level of acceleration and upward trends in sensible heat fluxes. In the few tropical regions where there is less correlation, we instead find a link to background latent plus sensible heat, which acts as a proxy for overall available energy. We then study extreme acceleration in the contemporary period, in both ESMs and ERA5 data. We find in these circumstances particularly strong evidence of faster warming of extreme events, but only for selected regions. We suggest this is a consequence of highly regional effects such as aerosols. Our analysis hints that as atmospheric composition changes move towards alteration by greenhouse gases only, there will be a more general globally-applicable occurrence of high-temperature extremes, with their mean increase more than the more general background warming levels.  

How to cite: Huntingford, C., Cox, P., Rithie, P., Clarke, J., and Williamson, M.: Acceleration of Daily Land Temperature Extremes and Link to Land Forcing, EGU General Assembly 2023, Vienna, Austria, 23–28 Apr 2023, EGU23-17519, https://doi.org/10.5194/egusphere-egu23-17519, 2023.

EGU23-466 | ECS | PICO | ITS2.5/CL4.14

Climate relevant processing of mineral dust by volatile organic compounds: first results on composition of complex dust/organic systems from the uptake of glyoxal 

Francesco Battaglia, Paola Formenti, Mathieu Cazaunau, Vincent Michoud, Antonin Berge, Edouard Pangui, Gael Noyalet, Servanne Chevaillier, Chiara Giorio, Sara D'Aronco, Philippe Decorse, and Jean-Francois Doussin

Mineral dust aerosols, which account for about 40% of global annual aerosol emissions, contribute to the persistent and large uncertainties on the global radiative budget and the oxidative capacity of the atmosphere.

Indeed, the uptake of atmospheric volatile organic compounds (VOCs) on mineral dust particles can contribute to the formation of secondary organic aerosols (SOA), with consequent modification of the chemical and optical properties of the dust.

Glyoxal, one of the most important VOC in the atmosphere, is a precursor of SOA, capable of interacting with mineral dust and forming SOA as a consequence of the interaction.

In this experimental study we investigate the formation of SOA by the uptake of glyoxal on mineral dust particles. We present the results of the heterogeneous interaction obtained in the CESAM atmospheric simulation chamber (Chambre Expérimentale de Simulation Atmosphérique Multiphasique), used to conduct aging experiments in various controlled conditions in terms of relative humidity, irradiation, and gas phase composition. Prior entering the chamber, particles from a real soil sample (Gobi Desert) are size-selected using an aerodynamic aerosol classifier (AAC) in order to obtain a monodispersed size distribution centered at 300 nm in mobility diameter, narrow enough to be able to appreciate a dimensional variation from glyoxal condensation.

In experiments conducted in humid conditions (RH=80%), a rapid uptake of glyoxal was observed on sub micrometric dust particles. 15 minutes after the injection of 1 ppm of glyoxal into the chamber, the mass of the particles increased by about 10%, with a variation of the modal diameter of the size distribution. As a consequence of glyoxal uptake in humid conditions, an increase of the aerosol organic mass concentration occurred immediately after the interaction, which was not observed in dry conditions. At the same time, the aerosol chemical speciation monitor (ACSM) mass spectra of the organic fraction show the increase in intensity of the glyoxal marker signals at m/z 58 and m/z 29. It is interesting to note also the drop of O/C ratio of the dust organic fraction after the injection of the glyoxal from 1.5 (the one of the dust itself) to a value close to 1, that is the one of the glyoxal.

Hence, the first results of the study suggest the presence of a fast glyoxal uptake on submicronic mineral dust particles in high relative humidity conditions. This process modifies the mass and the size distribution of the aerosol, as well as the chemical composition of its organic fraction.

How to cite: Battaglia, F., Formenti, P., Cazaunau, M., Michoud, V., Berge, A., Pangui, E., Noyalet, G., Chevaillier, S., Giorio, C., D'Aronco, S., Decorse, P., and Doussin, J.-F.: Climate relevant processing of mineral dust by volatile organic compounds: first results on composition of complex dust/organic systems from the uptake of glyoxal, EGU General Assembly 2023, Vienna, Austria, 23–28 Apr 2023, EGU23-466, https://doi.org/10.5194/egusphere-egu23-466, 2023.

The flux of wind-driven dust emissions from a susceptible area is determined by a complex relation between the driving force of the wind and the emissivity of the surface.  This relation is also modulated by the availability of sand-sized particles available for saltation, the roughness of the surface, and environmental conditions related to moisture, i.e., soil moisture and relative humidity.  The flux (F, µg m-2 s-1) of dust-sized particles from the surface scales non-linearly with the shear stress (τ, N m-2, or shear velocity u*, m s-1 [τ=ρu*2, where ρ is fluid density]) created by the wind flowing over the surface.  Shear stress or shear velocity are not easily measured without the use of multiple instruments to characterize the vertical gradient of wind speed; vertical flux of particles requires measurement of vertical gradient of particle concentration or application of the eddy covariance method.  Here we describe a simple but effective metric to track changes through time due to physical alteration of a surface or due to changes in the environment.  The metric is based on measuring mean hourly concentrations of particulate matter, e.g., PM10 (µg m-3) and mean hourly wind power density (WPD=0.5×ρ×A×wind speed3, W m-2), which quantifies the power in the moving air.  A is area, that we arbitrarily set at 1 m2.  These hourly values are individually summed over a period of interest (e.g., monthly) to calculate the ratio value of total PM10:total WPD.  These data can also be filtered to isolate the effect of the source area emissions on the receptor site, for example, by wind direction range.  Tracking this metric on a monthly basis across multiple years at the Oceano Dunes State Vehicular Recreation Area has allowed for the characterization of the change in dust (PM10) production due to dust control measures (i.e., hectares of dust control) being placed onto the dunes, as well as the changes to the dust emission system during a period in 2020 when the area was left relatively undisturbed due to restrictions due to COVID-19.  We suggest, and demonstrate, that this method can be broadly applied, is effective in quantifying change, and cost-effective.

How to cite: Gillies, J., Furtak-Cole, E., Nikolich, G., and Etyemezian, V.: A Simple Metric, Total PM10:Total Wind Power Density, to Quantify Changes in Dust Emission from Areas of Interest as a Function of Environmental Change, EGU General Assembly 2023, Vienna, Austria, 23–28 Apr 2023, EGU23-986, https://doi.org/10.5194/egusphere-egu23-986, 2023.

EGU23-990 | PICO | ITS2.5/CL4.14

Dust fertilization: Measurements of CO2 sequestration by coral reefs in the Gulf of Eilat, Israel after atmospheric dust loading. 

Hamish McGowan, Nadav Lensky, Shai Abir, Yonathan Shaked, and Eyal Wurgaft

Coral reefs are complex biophysical, geochemical and hydrodynamic marine environments impacted by meteorological processes. In continental coastal and oceanic locations bordering or downwind of dust source areas, coral reefs are affected by the deposition of dust. Dust may supply nanomolar amounts of nitrate and essential bio-elements including iron, manganese, zinc and copper from natural, industrial and agricultural processes to coral reefs; in turn these are absorbed by the coral algae symbionts, thereby enhancing chlorophyll concentrations. This fertilization of coral reefs by dust increases photosynthesis which lowers the aqueous CO2 partial pressure relative to the overlying air. If this causes a reversal of the coral reef water to air CO2 gradient, then a coral reef will switch from a source to sink of CO2.

Here we present the first direct measurements of air-sea CO2 exchange measured by an eddy covariance tower exclusively over the fringing coral reefs in the Gulf of Eilat, Israel. These show a strong relationship to atmospheric dust load entrained from the surrounding hyper-arid deserts in Israel, Saudi Arabia and North Africa. The coral reefs became CO2 sinks most notably during episodes of moderate to high atmospheric dust load. We conclude that the coral reefs in the Gulf of Eilat are net sinks of atmospheric CO2 due to the deposition of dust and suggest that direct measurements of air – sea CO2 exchange are required over coral reefs in other locations impacted by dust to increase accuracy of marine and global carbon budgets.          

How to cite: McGowan, H., Lensky, N., Abir, S., Shaked, Y., and Wurgaft, E.: Dust fertilization: Measurements of CO2 sequestration by coral reefs in the Gulf of Eilat, Israel after atmospheric dust loading., EGU General Assembly 2023, Vienna, Austria, 23–28 Apr 2023, EGU23-990, https://doi.org/10.5194/egusphere-egu23-990, 2023.

This work investigated seasonal variation of aerosol iron (Fe) solubility for coarse (>1 μm) and fine (<1 μm) particles at Xi’an, a megacity in northwestern China impacted by anthropogenic emission and desert dust. Total Fe concentrations were lowest in summer and similar in other seasons for coarse particles, while lowest in summer and highest in spring for fine particles; for comparison, dissolved Fe concentrations were higher in autumn and winter than spring and summer for coarse particles, while highest in winter and lowest in spring and summer for fine particles. Desert dust aerosol was always the major source of total Fe for both coarse and fine particles in all the four seasons, but it may not be the dominant source for dissolved Fe. Fe solubility was lowest in spring for both coarse and fine particles, and highest in winter for coarse particles and in autumn for fine particles. In general aerosol Fe solubility was found to be higher in air masses originating from local and nearby regions than those arriving from desert regions after long-distance transport. Compared to coarse particles, Fe solubility was similar for fine particles in spring but significantly higher in the other three seasons, and at a given aerosol pH range Fe solubility was always higher in fine particles. Aerosol Fe solubility was well correlated with relative abundance of aerosol acidic species, implying aerosol Fe solubility enhancement by acid processing; moreover, such correlations were better for coarse particles than fine particles in all the four seasons. Fe solubility was found to increase with relative humidity and acid acidity for both coarse and fine particles at Xi’an, underscoring the importance of aerosol liquid water and aerosol acidity in regulating Fe solubility via chemical processing.

How to cite: Tang, M., Zhang, H., and Li, R.: Seasonal variation of aerosol iron solubility in coarse and fine particles at an inland city in northwestern China, EGU General Assembly 2023, Vienna, Austria, 23–28 Apr 2023, EGU23-1097, https://doi.org/10.5194/egusphere-egu23-1097, 2023.

EGU23-1303 | PICO | ITS2.5/CL4.14

Was the 137Cs contained in Saharan dust deposited across Europe in March 2022 emitted by French nuclear tests in Algeria? 

Olivier Evrard, Octave Bryskere, Charlotte Skonieczny, Anthony Foucher, Rémi Bizeul, Thomas Chalaux Clergue, Jean-Sébastien Barbier, Jean-Eudes Petit, José A. Corcho‑Alvarado, Stefan Röllin, Pierre-Alexis Chaboche, and Germán Orizaola

Air masses loaded with mineral dust and originating from the Sahara arrive frequently in Europe, which has multiple impacts on global and regional cycles. However, the occurrence of these processes may further accelerate in the future in response to climate change, and more knowledge is therefore required on the characteristics of the particles transported during these massive dust transport and deposition episodes. Furthermore, questions arise regarding the content of this dust in radionuclides, in relationship with the atmospheric nuclear bomb testing conducted around the world between the 1950s and the 1970s in general, and those tests conducted by France in the Sahara in the early 1960s in particular.

The Saharan dust episode that took place from 13th to 16th March 2022 led to the occurrence of dense dust deposition across multiple European countries, which raised concerns among the population regarding the potential radioactivity content of this dust. To address this question with a representative sample set, a participative science campaign to collect dust across Europe was launched on Twitter on 17th March 2022. Thanks to this initiative, 110 dust samples could be collected along a transect from Southern Spain to Austria.

This unique sample bank was regrouped at University Paris-Saclay, France, to conduct a set of physico-chemical analyses on a selection or on the totality of these dust samples including particle size, colourimetry, mineralogy and fallout radionuclides.

Backward trajectories of air masses that have led to these deposits were calculated, and this analysis confirm their potential origin from Algeria. 137Cs was detected in all dust samples, with variable activity concentrations. A strong relationship was found between the particle size of the analysed particles and the 137Cs activity concentrations, which is consistent with the literature on this topic. Particle size was found to decrease with increasing distances from the source. The colour and mineralogy analyses demonstrated that the dust collected in Austria showed different properties than those samples collected in Spain, France, Luxembourg and Germany, which likely indicates that this material did not fully consist of Saharan dust deposited during the March 2022 episode. Accordingly, the following interpretations did not take the properties of Austrian dust into account.

The mineralogical analyses confirmed the potential origin of the dust from the Maghreb region, including a vast area in Southern Morocco and Southern Algeria. In contrast, the analysis of plutonium isotopic ratios (240Pu/239Pu) and 137Cs/239+240Pu activity ratios, which provide diagnosis tools to investigate the source of artificial radionuclides, in a selection of dust samples collected between Southern Spain and Luxembourg showed that the dust signature was consistent with that of the global fallout largely dominated by the nuclear tests conducted by the USA and the Soviet Union. The 137Cs contained in the dust transported and deposited during this episode was therefore very likely not associated with the French nuclear tests conducted in the early 1960s in Sahara.

In the future, elemental geochemistry analyses will provide additional information on their source provenance. All results will also be published in open-access database and disseminated to the public.

How to cite: Evrard, O., Bryskere, O., Skonieczny, C., Foucher, A., Bizeul, R., Chalaux Clergue, T., Barbier, J.-S., Petit, J.-E., Corcho‑Alvarado, J. A., Röllin, S., Chaboche, P.-A., and Orizaola, G.: Was the 137Cs contained in Saharan dust deposited across Europe in March 2022 emitted by French nuclear tests in Algeria?, EGU General Assembly 2023, Vienna, Austria, 23–28 Apr 2023, EGU23-1303, https://doi.org/10.5194/egusphere-egu23-1303, 2023.

EGU23-1682 | PICO | ITS2.5/CL4.14

The effects of coarse dust in the models and observations in the dust source regions 

Georgiy Stenchikov, Suleiman Mostamandi, Ilia Shevchenko, and Alex Ukhov

In dust source regions, such as the Middle East, dust is a major environmental factor affecting climate, air quality, and human health. Dust also hampers solar energy harvesting by weakening downward solar flux and depositing on optically active surfaces of solar energy devices. In this study, we combine fine-resolution WRF-Chem simulations with size-segregated measurements of dust deposition to quantify the contribution of coarse (2.5 um < r < 10 um) and giant (10 um <r < 100 um) dust particles in aerosols radiative forcing and deposition rates. Most up-to-date models do not represent the particles with r > 10 um. The absence of large particles in the models does not significantly affect the radiative fluxes, as their contribution to AOD is relatively small, but they comprise the most dust-deposited mass. We found that dust deposition rates calculated in WRF-Chem and reanalysis products are 2-3 times smaller than the observed. However, the deposition rate of particulate matter with a diameter smaller than 10 um (PM10) is in good agreement between the models and observations. In the Middle East, fine dust particles are predominantly responsible for the significant reduction (> 5 %) of the downward solar flux hampering solar energy production. Still, dust-deposited mass, primarily associated with coarse particles, causes about a 2% loss of PV panel efficiency daily due to soiling. As was suggested previously, WRF-Chem, like many other models, tends to overestimate the atmospheric concentration of fine (r < 2.5 um) dust particles and underestimate the concentration of coarse particles. As seen from the comparison of the size distribution of deposited dust in simulations and observations, the latter is caused not as much by too fast deposition of large particles but due to underestimating their emission in the models.


How to cite: Stenchikov, G., Mostamandi, S., Shevchenko, I., and Ukhov, A.: The effects of coarse dust in the models and observations in the dust source regions, EGU General Assembly 2023, Vienna, Austria, 23–28 Apr 2023, EGU23-1682, https://doi.org/10.5194/egusphere-egu23-1682, 2023.

EGU23-1698 | PICO | ITS2.5/CL4.14

Desert dust as a plant fertilizer in an ambient and elevated CO2 

Anton Lokshin, Daniel Palchan, and Avner Gross

Desert dust, volcanic ash and fire ash are the most abundant natural atmospheric particles. These particles considered as an important nutrient source that controls the long-term productivity of infertile terrestrial ecosystems, by replenishing soil nutrient stocks. However, currently we do not know whether atmospheric deposition can act as a direct, alternative source for nutrients. These are particles enriched with phosphorus (P) and other essential macro and micronutrients such as: K, Ca, Mg, Zn, Cu, Fe, Mn, Zn, and Mo. These nutrients are vital for plants and support their growth.

The current research shows that elevated CO2 (eCO2) in the atmosphere has positive and negative effects: On the positive side, increase of CO2 levels is predicted to result with an increase in photosynthesis leading to improved primary biomass production and thus enhancement of CO2 capture. On the other hand, at eCO2 plants show decreased concentrations of mineral nutrients in most of their organs, suggesting downregulation of the activity of the membrane transporters involved in root nutrient uptake; a decreased ability to assimilate nutrients from the roots system.

Preliminary results of recent studies had shown that plants can utilize P via foliar nutrient uptake mechanism, directly from dust that settled on the plant’s leaves. Since the efficiency of roots to assimilate nutrients is projected to decrease in future eCO2, foliar nutrient uptake may be a significant alternative pathway for plants to gain needed nutrients. In this work, we used atmospheric fertilization experiments – where we deposited dust directly on plant leaves – to show that atmospheric deposition boosts plant growth and fertilizes them through direct foliar nutrient uptake pathway. The foliar nutrient uptake mechanism was shown both in an ambient and eCO2 levels for the three primary atmospheric particles mentioned above. We saw that volcanic ash had significantly increased biomass at eCO2 compared with ambient CO2 levels. Our results demonstrate that foliar nutrient uptake is a significant mechanism at immediate timescales. Furthermore, that the direct alternative pathway of foliage nutrients assimilation has a potential to regulate carbon sink processes in a terrestrial ecosystem in a future climate.

How to cite: Lokshin, A., Palchan, D., and Gross, A.: Desert dust as a plant fertilizer in an ambient and elevated CO2, EGU General Assembly 2023, Vienna, Austria, 23–28 Apr 2023, EGU23-1698, https://doi.org/10.5194/egusphere-egu23-1698, 2023.

Barkan investigated the synoptics of dust trajectories to Europe, Arctic, E. & W. Mediterranean, and the Atlantic Ocean (Barkan et al. 2004). His most recent research just before he passed away Barkan studied the outstanding Red Snow Event in Eastern Europe on March 2018. In April 2018 the European media published in great headlines a strange occurrence. Red colored snow fell in Bulgaria, Rumania, Ukraine and what was most interesting to the media, was reported in the mountains around Sochi the location of the former winter Olympic Games. Barkan showed that the phenomenon of the red snow in southwestern Europe is the result of a cold trough which penetrated from the north toward the central Mediterranean and Saharan Africa, together with its movement eastward. Consequently, a strong southwesterly flow formed along the eastern flank of the trough. This flow transported a large amount of red Saharan dust which upon mixing with the snowfall in the area painted the snow red (Barkan and Alpert, 2020). In this case the trough developed further east which is not a common occurrence. This has caused heavy dust storms in central Sahara near the most ample dust sources (Barkan, Kutiel and Alpert, 2004). So, it will be shown that the transported dust reached the area together with snow flakes and probably painted it in red or brown.

Another interesting study by late Barkan is on the difference in the synoptic situation between years with a large amount of dust and years with relatively small amount, in the Sahara- this was examined for 1979-1992 (Barkan and Alpert, 2008). For every month the dustiest and the non-dustiest year were chosen and the average of the three months in the season of these years was examined. The examination was made for the atmospheric variables: wind flow, wind velocity, geopotential height and temperature, at the 700 hPa level. The data used were the daily aerosol index from the TOMS satellite born instrument and the daily NCEP/NCAR reanalysis data of the variables mentioned above between the years 1979-1992.

 Other interesting studies will be reviewed including, a novel climatic index for the total Saharan dust being discovered as the Sun insolation; a unique case-study of near-circular Saharan dust transport over the Atlantic Ocean; and dust as a potential tracer for the flow over different topographical shapes employing MODIS-Terra observations.

References:

  • Barkan, P. Kishcha, H. Kutiel, and P. Alpert, "The Synoptics of Dust Intrusion Days from the African Continent into the Atlantic Ocean", J. Geophys. Res., Vol. 109, No. D8, D08201=2010.1029/2003JD004416=20, 2004.
  • Barkan, H. Kutiel and P. Alpert, "Climatology of dust sources over the North African region, based on TOMS data", Indoor-Built Environ., Vol. 13, 407-419, 2004.
  • Barkan, P. Alpert, H. Kutiel, and P. Kishcha,"The Synoptics of dust transportation days from Africa toward Italy and Central Europe", J. Geophy. Res., 110, doi:10.1029/2003 JD004416, 2005.
  • Alpert, J. Barkan, and P. Kishcha, "A potential climatic index for total Saharan dust: the Sun insolation", J Geophy. Res., 111, D01103, doi:10.1029/2005JD006105, 2006.

How to cite: Alpert, P. and Kishcha, P.: Saharan Dust Sources and their World Trajectories - A review in memory of J. Barkan (deceased 27 May 2020), EGU General Assembly 2023, Vienna, Austria, 23–28 Apr 2023, EGU23-1839, https://doi.org/10.5194/egusphere-egu23-1839, 2023.

EGU23-2075 | ECS | PICO | ITS2.5/CL4.14

Exploring the sensitivity of mineral dust aging to parameters of aerosol size distribution in the ICON-ART model 

Mega Octaviani, Rong Tian, Gholamali Hoshyaripour, Roland Rhunke, Oliver Kirner, Christian Scharun, and Martina Klose

Mineral dust is known to play an important role in weather and climate through its interactions with clouds, radiation, and nutrient cycles. Dust aerosols are emitted as water-insoluble particles which experience chemical aging (conversion to water-soluble mixtures) through the accumulation of soluble materials like sulfate and nitrate. This aging process affects the chemical composition and size distribution of the dust particles as well as their optical properties. Within the context of the dust aging mechanism, different approaches are applied in atmospheric models regarding the representation of the aerosol size distribution (bin or modal representation) and the number of microphysical processes included. The ICOsahedral Nonhydrostatic model with Aerosols and Reactive Trace gases (ICON-ART) and the new AERODYN aerosol dynamic module consider the nucleation and condensation of sulfuric acid gas, coagulation and aging of aerosols, size-dependent wet and dry deposition, and sedimentation. The aerosol size distribution in the model is represented by eight unimodal lognormal distributions (also called modes) with constant width. These modes describe four different size groups, two in the submicron range (typically <1 μm) and two in the coarse range (>1 μm), and two hygroscopic classes in a homogeneous or core-shell mixture (insoluble, soluble, and mixed). This approach is a common technique in global aerosol simulations yet implies simplifications of complex aerosol size distributions. It may cause uncertainties in simulating the aging processes of dust aerosols and inaccuracies in representing their observed size distributions. We conduct global simulations using ICON-ART to analyze the sensitivity of simulated dust to parameters representing properties of the modes, namely initial geometric median diameter and standard deviations, and threshold diameters for shifting between modes. We also aim to explore the impact of the mineral dust aging process on the range of dust direct radiative feedback.  This study will show the importance of aerosol size distribution parameter combinations for representing the chemical aging of mineral dust and its climate impacts.

How to cite: Octaviani, M., Tian, R., Hoshyaripour, G., Rhunke, R., Kirner, O., Scharun, C., and Klose, M.: Exploring the sensitivity of mineral dust aging to parameters of aerosol size distribution in the ICON-ART model, EGU General Assembly 2023, Vienna, Austria, 23–28 Apr 2023, EGU23-2075, https://doi.org/10.5194/egusphere-egu23-2075, 2023.

EGU23-2678 | ECS | PICO | ITS2.5/CL4.14

A Climatology of Dust Activity in the Atacama for 1950-2021 

Rovina Pinto and Stephanie Fiedler

Arid and semi-arid regions are sources of mineral-dust aerosols but very little is known of the dust activity in the hyper-arid Atacama Desert. The limited moisture supply and barren landscape should promote dust emission via wind erosion but the Atacama rarely sees strong dust outbreaks. Our study is the first detailed assessment of the observed dust reports for the Atacama. We analysed dust reports and meteorological data from surface synoptic observations spanning 72 years (1950-2021) to quantify the frequency distribution of dust events in the Atacama Desert, analyze changes over time, and evaluate influencing factors on dust events. Furthermore, we computed the threshold wind speeds for dust events at the different stations. A total of 1920 dusty days were recorded over a period of 72 years across the Atacama, where a dusty day is defined as a day with at least one recorded dust event. There is no perceptible trend visible but the results indicate several year-long periods with enhanced dust activity. Most dust events were observed in the 1990s with a rapid decline in dust activity post the early 2000s. Of the 1920 dust days, 72 days had a visibility of less than a kilometre, of which 12 days also reported dust storms. Chañaral was the dustiest station in the region with about 20 dust days per year. There is little seasonality in the dust activity, but a strong diurnal cycle with most dust events between 1500 and 1800 local time. Threshold wind speeds, t5, t25 and t50, are estimated as the minimum wind speed required for 5, 25 and 50% of the dust event frequency distribution. The thresholds allow us to determine the lowest winds capable of emitting dust from the surface and infer spatial differences in soil conditions due to soil moisture or land cover. Given the varying geomorphology of the surfaces in the Atacama, different threshold wind speeds are found at the stations in the Atacama. The t5 threshold wind speeds range from 6 ms-1to 14 ms-1across the desert. The evaluation of all stations yields annual mean threshold wind speeds of 10.9 ±1.6 ms-1, 13.2 ±1.9 ms-1and 15.6 ±2.3 ms-1for t5, t25 and t50. Ongoing research aims to evaluate the findings for the threshold wind speed against measurements from the pi-swerL Atacama Measurement EXperiment (LAMEX) conducted in October 2022.

How to cite: Pinto, R. and Fiedler, S.: A Climatology of Dust Activity in the Atacama for 1950-2021, EGU General Assembly 2023, Vienna, Austria, 23–28 Apr 2023, EGU23-2678, https://doi.org/10.5194/egusphere-egu23-2678, 2023.

EGU23-2699 | PICO | ITS2.5/CL4.14

On the Middle East's severe dust storms in spring 2022: Triggers and impacts 

Diana Francis, Ricardo Fonseca, Narendra Nelli, Deniz Bozkurt, Juan Cuesta, and Emmanuel Bosc

Large amounts of dust in the air can disrupt daily activities and pose a threat to human health. In May 2022, consecutive major dust storms occurred over the Middle East resulting in severe environmental, social and health impacts. In this study, we investigate the exceptional factors driving these storms and the effects of the dust clouds. Using a combination of satellite, in-situ and reanalysis datasets, we identify the atmospheric triggers for the occurrence of these severe dust storms, characterize their three-dimensional structure and evaluate the dust radiative impact. The dust emission was promoted by density currents emanating from deep convection over Turkey. The convective systems were triggered by cut-off lows from mid-latitudes fed by moisture from African atmospheric rivers. Data from the Infrared Atmospheric Sounding Interferometer (IASI) showed that the dust clouds were transported southward at 4 km in altitudes but sunk to ground levels when they reached the southern Arabian Peninsula due to strong subsidence. At a station in coastal UAE, the dust caused a 350 W m−2 drop in the surface downward shortwave flux and a 70 W m−2 increase in the longwave one during the dust episodes. This contributed to a 9 °C increase in nighttime temperatures which exacerbated the effects of the heat for the population. The newly highlighted mechanism for dust emission in the Middle East, in which a cut-off low interacts with an atmospheric river, as well as direct observations of the dust impact on the radiative budget can contribute to reducing associated uncertainties in climate models.

How to cite: Francis, D., Fonseca, R., Nelli, N., Bozkurt, D., Cuesta, J., and Bosc, E.: On the Middle East's severe dust storms in spring 2022: Triggers and impacts, EGU General Assembly 2023, Vienna, Austria, 23–28 Apr 2023, EGU23-2699, https://doi.org/10.5194/egusphere-egu23-2699, 2023.

EGU23-3449 | PICO | ITS2.5/CL4.14

Paleodust cycle in Europe during the last climate cycle 

Denis-Didier Rousseau, Pierre Antoine, Catherine Chauvel, Ségolène Saulnier-Copard, France Lagroix, Christine Hatté, Peter Hopcroft, and Markus Fuchs

The Last Climate Cycle (LCC, 130-15kyr) has shown cold, dusty (GS) and warmer, non-dusty (GI) intervals, when the atmosphere was 2-20 times more loaded with dust than today. The alternations between GS and GI occurred on millennial time scales, involving climate forcings other than orbital. The transition between GS and GI lasted on average 50 yrs, resulting from a complete climate reorganization that is not presently understood. A data-model project has acquired and investigated European loess sequences to get high-resolution and well-dated paleodust records of the LCC showing Europe experienced millennial paleodust variations through paleosol-loess unit alternations. These alternations correspond to the millennial climate variability as expressed in the Greenland ice cores, with the paleosol developments occurring during GIs, and loess deposition during GSs. Although evidenced for the last climate cycle along a 50°N transect from Brittany to Ukraine, such system prevailed at least also during the penultimate climate cycle with evidence of similar millennial climate variability during the past 192-130 ka interval, equivalent to marine isotope stage 6. Earth System Models contribute i) to characterize the source regions of the paleodust and ii) to reproduce past variations in dust deposition for key paleoclimate scenarios.

A key component of our investigation analyses loess samples dated from the last glacial maximum to detect the origin of the deposited material. A first study on the bulk sediment demonstrates that the paleodust deposited over Europe along a long longitudinal transect (about 2000 km) indicates a short distance transport implying local to regional source. Targeting the <2 microns and 2-20 microns grain size fractions and comparing with the previous results from the bulk samples, preliminary results indicate a local to regional origin for the coarse (2-20 microns and bulk) material and a more distant source for the finer fraction (<2 microns), involving longer transport in relation to general atmospheric circulation, for the finer particles. This is a critical new research question because it implies potentially important order of magnitude regional variations in dust radiative forcing that have never been accounted for in simulations of abrupt events.

How to cite: Rousseau, D.-D., Antoine, P., Chauvel, C., Saulnier-Copard, S., Lagroix, F., Hatté, C., Hopcroft, P., and Fuchs, M.: Paleodust cycle in Europe during the last climate cycle, EGU General Assembly 2023, Vienna, Austria, 23–28 Apr 2023, EGU23-3449, https://doi.org/10.5194/egusphere-egu23-3449, 2023.

EGU23-3512 | ECS | PICO | ITS2.5/CL4.14

The WInd-blown Sand Experiment (WISE) – UAE: Introduction and first results 

Narendra Nelli, Diana Francis, Mamadou Sow, Emmanuel Bosc, and Gilles Bergametti

The Arabian Peninsula is among the major dust sources on Earth. Here, dust storms occur frequently as a result of the action of surface winds on desert surface such as the Empty Quarter Desert located in southern Arabian Peninsula. Despite being a frequent occurrence, no direct measurement of dust emission in this region existed to date. In summer 2022, the WInd-blown Sand Experiment (WISE) kicked off in the Empty Quarter area located in southern United Arab Emirates (UAE). The aim of the experiment is to quantify dust emission from this major dust source through direct observations. A full set of instrumentation is being operated to study saltation, winds, temperature, humidity, radiative fluxes, physical and optical properties of dust aerosols, atmospheric electric field, and soil properties. In this presentation, we describe the instrumentation being used in WISE UAE and we show some preliminary results during different weather regimes such as strong wind erosion, local convection, dense radiation fog and land-sea breeze. The analysis of atmospheric electric field data suggests the presence of relatively higher electric field at the onset of sea breeze occurrence and wind erosion events. The detailed investigation on relative humidity, frictional velocity, dust particle size distribution impact on the electric field will be presented. WISE is a first-of-its-kind experiment in the region and it aims ultimately at improving dust parametrizations in numerical models. We hope that this presentation at the EGU can trigger collaborations in this direction.

How to cite: Nelli, N., Francis, D., Sow, M., Bosc, E., and Bergametti, G.: The WInd-blown Sand Experiment (WISE) – UAE: Introduction and first results, EGU General Assembly 2023, Vienna, Austria, 23–28 Apr 2023, EGU23-3512, https://doi.org/10.5194/egusphere-egu23-3512, 2023.

EGU23-3721 | ECS | PICO | ITS2.5/CL4.14

What are coarse dust aerosols, and how do they impact the Earth's climate system? 

Adeyemi Adebiyi, Jasper Kok, Benjamin Murray, Claire Ryder, Jan-Berend Stuut, Ralph Kahn, Peter Knippertz, Paola Formenti, Natalie Mahowald, Carlos Perez García-Pando, Martina Klose, Albert Ansmann, Bjørn Samset, Akinori Ito, Yves Balkanski, Claudia Di Biagio, Manolis Romanias, Yue Huang, and Jun Meng

Mineral dust is an important aerosol specie in the atmosphere that impacts the Earth’s climate system through its interactions with radiation, clouds, hydrology, atmospheric chemistry, and biogeochemistry. Because dust sizes span more than three orders of magnitude in diameter and dust properties are size-dependent, most previous studies separate dust particles into different classes – broadly defined as fine and coarse dust – which could produce distinct impacts on the Earth system. However, there are general inconsistencies in the terminology, the diameter boundaries, and diameter ranges currently attributed to dust size classes across the literature. As part of a comprehensive review of coarse dust recently completed, we propose, with justification, a new uniform classification that defines coarse and super-coarse dust as particles between 2.5 - 10 µm and 10 - 62.5 µm in diameter, respectively. In addition, we will show several lines of observational evidence that indicate coarse and super-coarse dust particles are transported much farther than previously expected and that the abundance of these particles is substantially underestimated in current global models. Despite the limitations of representing coarse and super-coarse dust aerosols in models, we will highlight their unique impacts on several aspects of the Earth's climate system.

How to cite: Adebiyi, A., Kok, J., Murray, B., Ryder, C., Stuut, J.-B., Kahn, R., Knippertz, P., Formenti, P., Mahowald, N., Perez García-Pando, C., Klose, M., Ansmann, A., Samset, B., Ito, A., Balkanski, Y., Di Biagio, C., Romanias, M., Huang, Y., and Meng, J.: What are coarse dust aerosols, and how do they impact the Earth's climate system?, EGU General Assembly 2023, Vienna, Austria, 23–28 Apr 2023, EGU23-3721, https://doi.org/10.5194/egusphere-egu23-3721, 2023.

While the most extensive and active sources of mineral dust are found at mid-latitudes (Sahara, East Asia and the Arabic peninsula), source areas at high latitudes both in northern and the southern Hemispheres, are gaining attention because of their distinct characteristics and impacts at the appropriate regional and semi-hemispheric scales.

Southern Africa is estimated to account for approximately 5% of the global annual emissions of mineral dust and the long-range transport of dust emitted from these regions are shown to head towards the South Atlantic, the southern Oceans, and across the subcontinent by both observations and modelling.

In particular, hundreds distinct point sources have been identified in Namibia, including the topographical lows of the Etosha pan alluvial basin, the dry lands (Kalahari Desert, gravel plains bordering the Namib Deserts), but mostly the numerous ephemeral riverbeds, pans, wetlands and possibly mines along the coastline. By deposition, this windblown dust could impact to the productivity of the waters offshore, but also the formation and the chemical composition of the fog and low marine clouds. Through the fog, the dust emitted has the potential of redistributing nutrients not only to the marine but also to the continental ecosystems. Likewise, the strong and almost omnipresent southerly trade winds driven by the temperature contrast between the cold Benguela current and warm and dry continental desert air masses also provide an opportunity to transport sediment influenced by the nutrient rich aerosols of the ocean further onto land to nourish the nearshore ecosystems. To date, the majority of dust emissions observations from this region have relied heavily on the improved ability of satellite platforms to optically isolate dust aerosols over the ocean surface and despite the consistent high winds from the south, have excluded the potential for dust emission transport processes towards the interior.

This presentation illustrates the new results of recent coordinated research exploring the emissions, the transport, and properties of net transported mineral dust from Namibia sources. These new results rely on model simulations at different spatial resolution, on the analysis of local and regional wind regimes, on field observations, and on laboratory-based experiments on airborne dust generated from natural soils. Our results demonstrate that the frequency of emission might be higher than expected by only easterly berg winds. We also suggest that the Namibian dust may be transported to Antartica and that its processing by marine biogenic emissions could be responsible for the seasonal increase in the dust iron solubility observed in the Austral fall.

How to cite: Formenti, P.: Mineral dust in Namibia: new research on emissions, transport and properties, EGU General Assembly 2023, Vienna, Austria, 23–28 Apr 2023, EGU23-3887, https://doi.org/10.5194/egusphere-egu23-3887, 2023.

EGU23-6167 | PICO | ITS2.5/CL4.14

The northern hight latitude dust belt 

Outi Meinander, Pavla Dagsson-Waldhauserova, and Ana Vucovic Vimic and the HLD team

Identifying the locations of local dust sources and their emission, transport, and deposition processes is important for understanding the multiple impacts of dust on the Earth's systems. We have recently provided a significant update to the scientific understanding on the climatically and environmentally significant high-latitude dust (HLD) sources. Based on the presented evidence (Meinander et al. 2022), we have suggested a “northern high latitude dust belt” (Meinander et al. 2022), defined as the area north of 50 N, with a “transitional HLD-source area” extending at latitudes 50–58 N in Eurasia and 50–55 N in Canada and a “cold HLD-source area” including areas north of 60 N in Eurasia and north of 58 N in Canada, with currently “no dust source” area between the HLD and low-latitude dust (LLD) dust belt, except for British Columbia. We estimate the high-latitude land area with potential dust activity to cover over 560 000 km2 with very high potential for dust emission, and over 240 000 km2 with the highest potential for dust emission.

We have identified, described, and quantified the source intensity (SI) values, which show the potential of soil surfaces for dust emission scaled to values 0 to 1 concerning globally best productive sources, using the Global Sand and Dust Storms Source Base Map (G-SDS-SBM). This includes 64 HLD sources in our collection for the northern (Alaska, Canada, Denmark, Greenland, Iceland, Svalbard, Sweden, and Russia) and southern (Antarctica and Patagonia) high latitudes. Our work also included model results on HLD emission, long-range transport, and deposition at various scales of time and space, and we have specified key climatic and environmental impacts of HLD and related research questions, which could improve our understanding of HLD sources, on clouds and climate feedback, atmospheric chemistry, marine environment, cryosphere, and cryosphere–atmosphere feedbacks. For example, we estimated that about 57% of the dust deposition in snow- and ice-covered Arctic regions was from high latitude dust sources.

We gratefully acknowledge Douglas Hamilton.

Citation: Meinander, O. et al. Newly identified climatically and environmentally significant high-latitude dust sources, Atmos. Chem. Phys., 22, 11889–11930, https://doi.org/10.5194/acp-22-11889-2022, 2022.

How to cite: Meinander, O., Dagsson-Waldhauserova, P., and Vucovic Vimic, A. and the HLD team: The northern hight latitude dust belt, EGU General Assembly 2023, Vienna, Austria, 23–28 Apr 2023, EGU23-6167, https://doi.org/10.5194/egusphere-egu23-6167, 2023.

EGU23-6171 | PICO | ITS2.5/CL4.14

Monitoring present-day Saharan dust above and below the ocean surface 

Jan-Berend Stuut, Catarina Guerreiro, Blanda Matzenbacher, and Michèlle Van der Does

Mineral dust plays an important role in the ocean’s carbon cycle through the input of nutrients

and metals which potentially fertilise phytoplankton, and by ballasting organic matter from the surface ocean to the sea floor. However, time series and records of open-ocean dust deposition fluxes are sparse. Here, we present a series of Saharan dust collected between 2015 and 2022 by dust-collecting buoys that are monitoring dust in the equatorial North Atlantic Ocean, as well as by moored sediment traps at the buoys' positions at ~21°N/21°W and ~11°N/23°W directly below the major dust Saharan-dust plume offshore northwest Africa. We present dust-flux data as well as particle-size distribution data, and make a comparison of the dust collected from the atmosphere at the ocean surface with the dust settling through the ocean and intercepted by the submarine sediment traps.
See: www.nioz.nl/dust

How to cite: Stuut, J.-B., Guerreiro, C., Matzenbacher, B., and Van der Does, M.: Monitoring present-day Saharan dust above and below the ocean surface, EGU General Assembly 2023, Vienna, Austria, 23–28 Apr 2023, EGU23-6171, https://doi.org/10.5194/egusphere-egu23-6171, 2023.

EGU23-8190 | PICO | ITS2.5/CL4.14

The mineralogy of coarse dust aerosols retrieved from its mid−infrared extinction spectra: a laboratory testbed study on dust from worldwide sources 

Claudia Di Biagio, Jean Francois Doussin, Mathieu Cazaunau, Edouard Pangui, Paul Kleiber, Juan Cuesta, Mila Rodenas, and Paola Formenti

The mineralogy of dust aerosols (i.e. the abundance, relative proportions and state of mixing of the different minerals composing the aerosols, including mainly silicates in the form of clays, quartz, and feldspars, carbonates, sulfates, and iron and titanium oxides) is of key relevance in driving its climatic and environmental effects. Ground–based and airborne observations support the evidence that the dust mineralogy is heterogeneous in the atmosphere, varying from local to global scale due to changes in the mineralogical composition of the emitting source soils and atmospheric processing. However, the capability to get regional and global mapping of airborne dust mineralogy is still missing to date. This gap represents a fundamental limitation for properly developing and validating the representation of dust in Earth System Models and constraining its regional and global climate forcing.

Because the different minerals composing the fine and coarse fractions of dust show different spectral absorption signatures, remote sensing spectral and hyperspectral observations can be used to fill this gap by detecting the presence of diverse minerals and reconstructing their relative proportions in the dust aerosols. Based on this idea, recent efforts move into this direction, including the EMIT mission (Earth Surface Mineral Dust Source Investigation) started in 2022.

In this study we demonstrate, starting from exemplary data acquired in the CESAM simulation chamber on dust aerosols from global sources (Di Biagio et al., 2017), that the extinction signature of suspended dust aerosols in the 740−1475 cm−1 infrared spectral range (6.8−13.5 µm) can be used to derive dust mineralogy in terms of its infrared−active and coarse−sized minerals: quartz, clays, feldspars and calcite. We show that diverse spectral infrared signatures allow to distinguish dust aerosols from different sources worldwide with variable composition, and that following the changes of the dust extinction spectra with time informs on particles size−selective mineralogy changes during atmospheric transport. Results from the present study confirm the major advance that hyperspectral infrared remote sensing observations, as those by IASI (Infrared Atmospheric Sounding Interferometer) and the IASI−NG (Next Generation) instruments, can provide to dust science.


Di Biagio, C., Formenti, P., Balkanski, Y., Caponi, L., Cazaunau, M., Pangui, E., Journet, E., Nowak, S., Caquineau, S., Andreae, M. O., Kandler, K., Saeed, T., Piketh, S., Seibert, D., Williams, E., and Doussin, J.-F.: Global scale variability of the mineral dust long-wave refractive index: a new dataset of in situ measurements for climate modeling and remote sensing, Atmos. Chem. Phys., 17, 1901–1929, https://doi.org/10.5194/acp-17-1901-2017, 2017.

How to cite: Di Biagio, C., Doussin, J. F., Cazaunau, M., Pangui, E., Kleiber, P., Cuesta, J., Rodenas, M., and Formenti, P.: The mineralogy of coarse dust aerosols retrieved from its mid−infrared extinction spectra: a laboratory testbed study on dust from worldwide sources, EGU General Assembly 2023, Vienna, Austria, 23–28 Apr 2023, EGU23-8190, https://doi.org/10.5194/egusphere-egu23-8190, 2023.

EGU23-8286 | PICO | ITS2.5/CL4.14

The Jordan Wind erosion And Dust Investigation (J-WADI) 

Martina Klose and Carlos Pérez García-Pando and the J-WADI Team

Knowledge about the particle-size distribution and mineralogical composition of mineral dust at emission are fundamental to advance our understanding and quantification of dust climate effects, yet comprehensive measurements are still largely lacking, especially of super-coarse and giant particles and particle composition. Here, we introduce the Jordan Wind erosion And Dust Investigation (J-WADI), an intensive field measurement campaign conducted in September 2022 north of Wadi Rum in Jordan. The aim of J-WADI is to improve our fundamental understanding of the emission of mineral dust, in particular its full-range size distribution (from fine to giant dust particles) and mineralogical composition. For this purpose, in-situ and ground-based remote sensing instrumentation was installed to measure aerosol properties, e.g. particle numbers and sizes up to about 100 μm, optical  properties, and aerosol distributions; collect soil and aerosol samples for laboratory analysis and experimentation; and to measure meteorological parameters including wind cross sections at high temporal and spatial resolutions and near-surface turbulence. In this contribution, we will present an overview of the J-WADI measurement setup and campaign conditions, together with preliminary results of observed dust events. In the future, J-WADI measurements will serve as a basis to investigate, e.g., (a) the mechanisms leading to the emission and continued suspension of super-coarse and giant dust particles and the possible variability of the emitted dust particle-size distribution; (b) the size-resolved mineralogy of dust at emission, its relationship with the parent soil, and spectroscopic measurement, and (c) dust-radiation and dust-cloud interactions.

How to cite: Klose, M. and Pérez García-Pando, C. and the J-WADI Team: The Jordan Wind erosion And Dust Investigation (J-WADI), EGU General Assembly 2023, Vienna, Austria, 23–28 Apr 2023, EGU23-8286, https://doi.org/10.5194/egusphere-egu23-8286, 2023.

The transport of mineral dust from arid lowlands to higher elevations has profound consequences for the geoecology of mountain ecosystems.  With expanding human populations and widespread disturbance due to land use, dust deposition rates and compositions are changing, presenting unique challenges for human and ecosystem health.  The American Southwest, a region that has experienced a massive increase in dust deposition rates in the past century, is no exception to this trend.  Understanding the flux and composition of dust can help identify where dust is coming from, and can inform management strategies for dust emitting landscapes.  As part of the DUST^2 Critical Zone Thematic Cluster, this project utilized a network of 18 passive dust traps in the southwestern US, 15 of which were deployed on high mountains summits and ridgelines.  The dust traps were emptied biannually between 2020 and 2022 to reveal spatial and temporal differences in dust compositions and depositional fluxes.  Results demonstrate that dust flux is higher in the summer compared to winter; at the 13 collectors with the most complete data, summer fluxes averaged 47.9 mg/m2/day whereas winter fluxes averaged 24.2 mg/m2/day.  Interannual variability is notable: for instance, some collectors received 2x as much dust in summer 2022 vs. 2021, whereas for others the pattern was reversed.  In contrast, all collectors received more dust during winter 2021-22 than in 2020-21.  Superimposed on these temporal differences is a spatial disparity in accumulation rates, with the highest values at the urban sampler in Salt Lake City and at sites immediately downwind.  In contrast, lower fluxes are common at high elevation sites in Nevada, particularly during the winter.  Overall, measured dust fluxes span a wide range from 5.3 to 255 mg/m2/day.   The grain size distribution, color, mineralogy, and geochemistry of dust also vary notably between sites, supporting the interpretation that much of the dust is sourced from the immediately surrounding lowlands.

How to cite: Munroe, J.: Seasonal and Interannual Variability in Dust Flux to High-Elevation Ecosystems in the Southwestern United States, EGU General Assembly 2023, Vienna, Austria, 23–28 Apr 2023, EGU23-9012, https://doi.org/10.5194/egusphere-egu23-9012, 2023.

EGU23-9364 | PICO | ITS2.5/CL4.14

Numerical diffusion on vertical advection due to gravitational settling in WRF: 2D simulations 

Eleni Drakaki, Sotirios Mallios, Vassilis Amiridis, Alexandra Tsekeri, Demetri Bouris, and Petros Katsafados

One of the deficiencies of atmospheric dust models is that they struggle to accurately reproduce the transport of coarse and giant dust particles, according to observational evidence. Among the reasons behind that model incapacity that have been proposed in the literature, is the issue of numerical diffusion inside the advection codes of the models. In this study, we examine the importance of that issue in the WRF-L model. To do so, we update the default numerical scheme (UPWIND) which is used for the vertical advection of dust due to gravitational settling. The diffusive UPWIND scheme is replaced with a non-diffusive one, named UNO3 (third-order Upstream Non-Oscillatory scheme). To test the code performance, we perform simulations reproducing the 2D transport of a dust plume which is released at 4 km height above Cabo Verde towards Barbados. The model is initialized on 13/06/2014 at 12 UTC (which coincides with the day of the SALTRACE flight above Cabo Verde) using meteorological conditions of radiosonde from Tenerife airport and wind profile based on ECMWF model climatology. The results suggest that, in the UNO3 simulation, dust particles with a diameter 26 μm can be transported more than 500 km longer than in the BASE simulation and the dust in the atmosphere can be 10% more in the UNO3 simulation compared to the BASE simulation. In future studies, the UNO3 scheme will be tested in other aerosol types also (e.g. volcanic ash, smoke from fires).

Acknowledgements: Authors acknowledge support by the Hellenic Foundation for Research and Innovation (H.F.R.I.) under the “2nd Call for H.F.R.I. Research Projects to support Post-Doctoral Researchers” (Project Acronym: StratoFIRE, Project number:  3995) and the European Research Council (ERC) under the European Union's Horizon 2020 research and innovation programme (Project Acronym: D-TECT, Grant Agreement: 725698).

How to cite: Drakaki, E., Mallios, S., Amiridis, V., Tsekeri, A., Bouris, D., and Katsafados, P.: Numerical diffusion on vertical advection due to gravitational settling in WRF: 2D simulations, EGU General Assembly 2023, Vienna, Austria, 23–28 Apr 2023, EGU23-9364, https://doi.org/10.5194/egusphere-egu23-9364, 2023.

EGU23-9569 | ECS | PICO | ITS2.5/CL4.14

Constraining spatio-temporal variations in dust emission at global scale with ensemble data assimilation of satellite optical depth retrievals 

Jerónimo Escribano, Enza Di Tomaso, Oriol Jorba, María Gonçalves Ageitos, Martina Klose, Sara Basart, and Carlos Pérez García-Pando

Mineral dust emissions play a fundamental role in the simulation of the dust cycle in numerical models. The emission of dust depends on a number of atmospheric and surface conditions that span a large range of time and spatial scales. Due to the inherent difficulties to physically represent this complexity in a simplified way, the emission of mineral dust is usually parameterized in the atmospheric numerical models. The heterogeneity of available dust emission parametrizations, along with the soil characteristics and meteorological information, the atmospheric models themselves, their tuning, and their boundary and initial conditions, contribute to the large spread of net dust flux estimated with different modeling frameworks.

This work presents a novel approach to estimate dust emissions through the assimilation of dust optical depth filtered retrievals from satellite measurements, by means of an ensemble-based data assimilation scheme. Because of the lagged nature of the emission inversion problem, the assimilation is produced with a slightly modified version of the ensemble Kalman Filter algorithm. We show results of the inversion for 5-year global numerical experiments (2017 to 2021), by using dust-only simulations with three of the available state-of-the-art dust emission schemes implemented in the chemical MONARCH model.

In these three experiments, we assimilate dust optical depth obtained from the SNPP-VIIRS Deep Blue retrievals. The control vector consists of model dust emissions at native spatial resolution (1.4 by 1 degrees) and a 3-days time resolution. We find regional and temporal corrections in the estimated emissions after assimilation that are consistent across the different dust emission scheme experiments, making our findings robust. We compare the dust optical depth of our simulations with the assimilated observations, as well as with independent dust-filtered optical depth from ground-based AERONET sun-photometers. The dust optical depth resulting from the simulations that use the corrected emissions show substantial improvements in the skill scores than the dust optical depth simulated with the uncorrected emissions. Our work paves the road toward quantifying and eventually reducing uncertainties in dust emission schemes and toward better constraining the contribution to climate of the dust sources at sub-regional scale.

How to cite: Escribano, J., Di Tomaso, E., Jorba, O., Gonçalves Ageitos, M., Klose, M., Basart, S., and Pérez García-Pando, C.: Constraining spatio-temporal variations in dust emission at global scale with ensemble data assimilation of satellite optical depth retrievals, EGU General Assembly 2023, Vienna, Austria, 23–28 Apr 2023, EGU23-9569, https://doi.org/10.5194/egusphere-egu23-9569, 2023.

EGU23-11139 | PICO | ITS2.5/CL4.14

4D-Atlantic Dust-Ocean Modelling & Observing Study (DOMOS) 

Stephanie Fiedler, Angela Benedetti, Vassilis Amiridis, Carlos Pérez García-Pando, Jan-Berend Stuut, and Jan Griesfeller and the DOMOS team

The ESA-funded “4D-Atlantic Dust-Ocean Modelling & Observing Study” (DOMOS) kicked off in September 2021, with the overarching objective to advance our fundamental understanding on the complex atmospheric dust-ocean interactions in the Atlantic Ocean in the context of climate change. The project has an innovative approach with the integrated use of modelling, EO-based products and in-situ datasets. 

DOMOS has created and validated a novel EO-based product of dust deposition fluxes against in-situ observations and previously existing datasets of dust deposition. Specifically, the project has developed a product of pure-dust deposition fluxes across the Atlantic Ocean for 2007-2020, based on the exploitation of (1) the CALIPSO-based ESA-LIVAS pure-dust database, (2) the MODIS-MIDAS and Metop-IASI MAPIR/IMARS/LMD/ULB atmospheric pure-dust products, and (3) ERA5 U/V wind components. Moreover, DOMOS has provided a validation of the dust deposition field from the CAMS reanalysis and has performed assimilation tests of IASI and Aeolus aerosol products with the goal of providing a better description of the dust aerosol transport over the Tropical Atlantic. The DOMOS products also contribute to an improved representation of the physical and chemical characteristics of dust deposition over the ocean, which is crucial to interpret past changes in the atmosphere and ocean and to better understand the possible future development. This includes a better understanding and quantification of the contributions from natural and anthropogenic dust to the deposition of soluble iron, compared to depositions associated with biomass burning and anthropogenic aerosols. This has been achieved through new experiments with the climate model EC-Earth3-Iron. 

Finally, DOMOS foresees providing a scientific roadmap to highlight the findings of the project and identify possible gaps in the modeling and the observing approaches of atmospheric dust-ocean interactions. In this presentation, we give an overview of the project and highlight the most important results from the DOMOS dust deposition products and model experiments.

More information can be found at https://www.ecmwf.int/en/research/projects/domos


How to cite: Fiedler, S., Benedetti, A., Amiridis, V., Pérez García-Pando, C., Stuut, J.-B., and Griesfeller, J. and the DOMOS team: 4D-Atlantic Dust-Ocean Modelling & Observing Study (DOMOS), EGU General Assembly 2023, Vienna, Austria, 23–28 Apr 2023, EGU23-11139, https://doi.org/10.5194/egusphere-egu23-11139, 2023.

Current dust storms, originating from afar, are common in Israel and the eastern Mediterranean, and thus most dust sources are considered to be distal. However, recent studies suggest that the latest Quaternary loess accreted in the Northern Negev can also serve as a proximal source of dust. These sources were mostly neglected in past discussions as contributors of dust. Here, we demonstrate that such proximal dust sources, mostly the Negev loess, currently contribute relatively large amounts of recycled dust to the regional dust cycle. We conducted a sampling campaign of deposited dust during individual dust storms and identified high content of coarse silt grains and quartzo-feldspathic minerals within and adjacent to the Negev loess that gradually decreases toward the north. These grains, characteristics of the Negev loess, indicate a short transport distance. In addition, our data reveal that local wind speed is the limiting factor for emitting proximal dust, regardless of the synoptic system. We determined that proximal sources in Israel emit dust during either local events or as a part of regional dust storms originating from afar. We evaluate the minimal contribution of this proximal dust to the total mass of deposited dust as 58–74%, 54–70%, 52–64%, and 26–34% for the northern Negev, central Negev, central mountainous region, and northern Israel, respectively. These estimates indicate that at the desert fringe, both proximal and distal sources of dust should be considered when inferring dust sources from dust geochemistry that can sometimes be similar due to the long dust history.

How to cite: Crouvi, O., Shalom, O., Enzel, Y., and Rosenfeld, D.: Locally recycled late Pleistocene loess feeds modern dust storms at the desert margins of the eastern Mediterranean, Israel, EGU General Assembly 2023, Vienna, Austria, 23–28 Apr 2023, EGU23-11692, https://doi.org/10.5194/egusphere-egu23-11692, 2023.

In this study, we perform simulations with the ECHAM6.3-HAM2.3 aerosol-climate model with two prescribed different reconstructions of sea surface temperatures (SST) for the Last Glacial Maximum (LGM) as boundary conditions. While one of the datasets suggests a global cooling of 4.1°C (GLOMAP; Paul et al., 2021), the other suggests a much stronger cooling of 6.1°C (Tierney et al., 2020) during the LGM compared to pre-industrial climate conditions. The comparison of our simulation results to LGM land surface temperatures reconstructed based on noble gas concentrations in groundwater (Seltzer et al., 2021) does not indicate clearly which SST dataset results in a better agreement between our simulation results and observational data. For further assessment, we also compare for both SST datasets the simulated mineral dust deposition in the Southern Hemisphere to observational data (Kohfeld et al., 2013). While GLOMAP SSTs result in a strong overrepresentation of Australian mineral dust deposited over Antarctica, the SSTs provided by Tierney et al. (2020) indicate Patagonia to be the dominant dust source during the LGM in terms of deposition over Antarctica with minor contributions from Australia and South Africa. Such dominant Patagonian dust source is in agreement with geochemical data from East Antarctic ice cores (Basile et al., 1997; Delmonte et al., 2008). The differences in individual source contributions can be traced back on the one hand to changes in the meteorological conditions in the source regions, including vegetation, wind speed and precipitation. On the other hand, both SST datasets result in different characteristic high- and low-pressure patterns in the Southern Hemisphere, which allow for a more efficient transport of Australian dust for the warmer GLOMAP SSTs and Patagonian dust for the colder Tierney et al. SSTs to Antarctica.

How to cite: Krätschmer, S., Cauquoin, A., Lohmann, G., and Werner, M.: Investigating the Effects of Prescribing Different Sea Surface Temperature Reconstructions on the Mineral Dust Cycle During the Last Glacial Maximum, EGU General Assembly 2023, Vienna, Austria, 23–28 Apr 2023, EGU23-12893, https://doi.org/10.5194/egusphere-egu23-12893, 2023.

EGU23-13450 | ECS | PICO | ITS2.5/CL4.14

On the severe East Asian dust outbreak in March 2021: from atmospheric dynamics to air quality impact 

Feifei Mu, Eduardo Weide Luiz, and Stephanie Fiedler

The Gobi and the Taklamakan Desert are the two main dust source regions in East Asia. Extra-tropical cyclones are known as atmospheric driver for severe dust outbreaks in East Asia. Although previous studies show that dust storm frequency in Northern China have decreased associated with a decrease in near-surface wind speed, a severe dust storm occurred in mid-March 2021. This exceptional dust storm was driven by a Mongolian extra-tropical cyclone and had adverse socio-economic and health impacts. The aim of our study is to investigate the atmospheric dynamics, dust-aerosol contributions from the Gobi Desert and the Taklamakan Desert, as well as dust emission mechanisms involved in the event. We use ground-based observations from Chinese observational networks, satellite images from MODIS, data from ERA5 re-analysis, CAMS forecasts, and MERRA-2 re-analysis.

The passage of the Mongolian cyclone first induced high dust-emitting winds along its cold front. The maximum wind speeds at 10m a.g.l. over the Gobi Desert exceeded the 99th percentile of the 30-year climatology (1992-2021) for March by around 6 ms−1 . The dust aerosols were emitted by these exceptionally strong near-surface winds and transported southeastwards along with the passage of the frontal system of the Mongolian cyclone from the afternoon of 14th March to the morning of 15th March 2021. Hence, high atmospheric PM10 concentrations were first recorded in Northern China on 15th March. As a consequence of the associated poor air quality caused by the high PM10 concentrations, 19 out of 218 stations recorded the lowest atmospheric visibility for March since the past 30 years.

The passage of the Mongolian cyclone then led to a cold air intrusion into the Taklamakan Desert from the afternoon of the 15th onward, which was a few hours after the dust emissions in the Gobi Desert. The cold air intrusion with the associated near-surface temperature inversion was favourable for the formation of Nocturnal Low-Level Jets (NLLJs), which are known as an important mechanism for dust emissions in the dust source regions (e.g., East Asia and North Africa). By comparing the NLLJs from radiosonde observations and an automated detection algorithm applied to ERA5, stronger NLLJs were seen in the Taklamakan Desert in the mornings of 16, 17, and 18 March. The NLLJs breakdown during the morning hours led to sufficiently strong dust-emitting winds in this desert. Consequently, dust emissions are simulated in the mornings of 16, 17, and 18 March 2021 by both CAMS forecasts and MERRA-2 re-analysis. The impacts of the dust aerosols from the Taklamakan Desert were, however, limited to the west of China, supported by spatio-temporal distributions of station observations of the atmospheric PM10 concentrations and visibility.

How to cite: Mu, F., Luiz, E. W., and Fiedler, S.: On the severe East Asian dust outbreak in March 2021: from atmospheric dynamics to air quality impact, EGU General Assembly 2023, Vienna, Austria, 23–28 Apr 2023, EGU23-13450, https://doi.org/10.5194/egusphere-egu23-13450, 2023.

Millions of tonnes of dust are emitted into the atmosphere every year, a large proportion of which is transported and deposited to the oceans. Dust particles can directly affect the climate via dust–radiation interaction and indirectly via dust–cloud interaction, the snow/ice albedo effect and impacts on ocean biogeochemical cycles. Dust impacts on the climate and ecosystems depend on their mineralogical, chemical, microphysical, and optical properties. Over the past 20 years, important progress has been made in determining the properties of low-latitude dust and understanding how they change in the atmosphere.

The mineralogical compositions, including iron mineralogy, of northern African and Asian dust are now better known and show a large variability depending on the source region. Distinctive patterns were found. For example, more calcium minerals (such as calcite) are found in dust from the Taklamakan Desert and palaeolakes in northern Africa than in dust from the Gobi and Sahara Desert; the contribution of iron oxides to the total iron in Saharan dust (25%-40%) is lower than in Sahel dust (ca. 60%), whereas dust from palaeolakes, including that from the Bodele depression, has lower iron oxide content (<25%). Most of the Fe oxide particles from the Sahara and Gobi Desert are as goethite, while more hematite is found in Sahel dust. These new data have allowed a much better modelling of the role of low-latitude dust in the Earth system.

Only until recently, we started to study the properties of high-latitude dust, including from Iceland, Canada (Yukon), and Alaska. Icelandic dust particles are distinguished by the fact that most of them consist primarily of amorphous basaltic materials, up to 90 wt %. The total Fe content is usually very high (10%–13%), and hematite and goethite contribute only 1%–6% of the total Fe, which is significantly lower than in low-latitude dust (except in palaeolakes). Magnetite accounts for 7%–15% of the total Fe, which is orders of magnitude higher than in dust from northern Africa. Nevertheless, about 80%–90% of the Fe is contained in pyroxene and amorphous glass. Data from both low- and high-latitude dust showed that the iron mineralogy is associated with the degree of chemical weathering and the composition of the parent sediments.

The spectral single scattering albedo (SSA) of Icelandic dust falls within the range of low-latitude dust. The complex refractive index of dust is highly dependent on its source region, with Sahel and Icelandic dust showing highest values of imaginary index - k(λ). This indicates that Sahel and Icelandic dust is likely to be more absorbing. The measured spectral optical properties of both low- and high- latitude dust in the short-wave spectrum are consistent with what was predicted from their iron mineralogy.

The iron mineralogy in dust also determines the rate of dissolution during atmospheric processing, and thus its impact on ocean biogeochemical processes after dust deposition. For example, the high dissolution rate in the first few minutes in dust under acidic conditions is related to the content of amorphous Fe oxides.

How to cite: Shi, Z. and Baldo, C.: Key role of iron oxyhydroxides in dust aerosol from high and low latitudes, EGU General Assembly 2023, Vienna, Austria, 23–28 Apr 2023, EGU23-13991, https://doi.org/10.5194/egusphere-egu23-13991, 2023.

EGU23-14601 | ECS | PICO | ITS2.5/CL4.14

Paleogene to Neogene aeolian dust provenance in the Chinese Loess Plateau region 

Katja Bohm, Anu Kaakinen, Thomas Stevens, Yann Lahaye, and Hui Tang

Understanding atmospheric circulation in the geologic past under warm climates is crucial for projection of future climate scenarios. One of the few ways to unravel past atmospheric circulation is to study aeolian mineral dust deposits that link the geosphere to the atmosphere. Atmospheric mineral dust both affects and is affected by climate changes, but its role in the Earth system is poorly constrained. The aeolian dust deposits on the Chinese Loess Plateau (CLP) and adjacent regions provide an exceptionally vast amount of material to study Central-East Asian atmosphere and environments since the Eocene. Moreover, provenance research on these deposits is the key to reconstruct past atmospheric circulation and to understand the evolution of regional aridity and dustiness, which are closely linked with global climate.

In this study, we investigate the Paleogene to Neogene dust deposits in and near the CLP at latitude ~40°N. We present multiproxy provenance data from the Paleogene Ulantatal dust sequence in Inner Mongolia, China, approx. 400 km northwest of the central CLP, and from the Neogene Baode Red Clay in the northern CLP. As the first comprehensive study using detrital rutile trace element geochemistry combined with detrital zircon U-Pb ages in the CLP region, our data reveal both longer- and shorter-term pre-Quaternary provenance trends in the area. The Ulantatal dust sequence shows constant dust provenance during c. 34–29 Ma, including through the Eocene-Oligocene global climate transition. Strikingly, this provenance signal, which suggests dominant northerly to northwesterly dust transport, is very similar to that of the Neogene Baode Red Clay, reinforcing suggestions that a pre-Quaternary East Asian winter monsoon (EAWM) regime existed in the region for at least 30+ million years despite changes in paleogeography. However, the late Miocene (c. 8–7 Ma) extension of dust deposition to the eastern CLP was coupled with an increasing dominance of Northern Tibetan Plateau (NTP) provenance signal in Baode, implying an at least 1–2 Myr period of enhanced dust production in the NTP, a dominance of westerly winds over the EAWM, and/or contribution of silt-sized material by a proto-Yellow River. After, in the latest Miocene and in the Pliocene the EAWM again dominated the dust transport to the northern CLP. While the long-term temporal variability of dust provenance is small through Paleo-Neogene in the northern CLP latitudes, spatial variability of Paleogene dust in the CLP region is similar to that of the Neogene Red Clay and Quaternary loess in the area: the Ulantatal dust provenance differs from the Paleogene southwestern CLP dust provenance. This spatial variability confirms previous conclusions that local sources define most of the dust provenance signals in the silt fraction, complicating the interpretation of possible global climate forcing in the Central-East Asian dust cycle, and reinforcing the need for multiproxy provenance analysis of loess dust.

How to cite: Bohm, K., Kaakinen, A., Stevens, T., Lahaye, Y., and Tang, H.: Paleogene to Neogene aeolian dust provenance in the Chinese Loess Plateau region, EGU General Assembly 2023, Vienna, Austria, 23–28 Apr 2023, EGU23-14601, https://doi.org/10.5194/egusphere-egu23-14601, 2023.

EGU23-14832 | PICO | ITS2.5/CL4.14

Continuous flow analysis of Alpine ice cores: preliminary data and perspectives 

Llorenç Cremonesi, Luca Teruzzi, Claudio Artoni, Claudia Ravasio, Mirko Siano, Marco A. C. Potenza, Barbara Delmonte, and Valter Maggi

Mineral dust aerosol plays an important role in climate and biogeochemical processes by providing nutrients to marine and terrestrial ecosystems and by influencing the radiation balance of the atmosphere. In turn, mineral dust responds to natural and anthropogenic alterations of land cover and land use resulting from several environmental changes that occurred on different timescales. Contamination by aerosols is a very tangible threat to the cryosphere in the European Alps due to its proximity to highly urbanized areas, cultivated landscapes, and the largest hot desert in the world. We recently developed and assembled a continuous flow analysis system for studying the solid content of ice cores with a high time resolution, focusing on optical characterization methods based on light scattering. The line is designed to provide an integrated measurement of dust particles with Single-Particle Extinction and Scattering (SPES), digital holography, and an optical particle sizer (Abakus). Many of the particles found in ice are efficient scatterers and absorbers close to the size range of the visible light wavelength. We report some preliminary results from ice cores drilled during the ADA270 project, aiming at an in-depth characterization of the samples that provide essential information on the fast climate evolution, which is causing a severe degeneration of glaciers, among other consequences.

How to cite: Cremonesi, L., Teruzzi, L., Artoni, C., Ravasio, C., Siano, M., Potenza, M. A. C., Delmonte, B., and Maggi, V.: Continuous flow analysis of Alpine ice cores: preliminary data and perspectives, EGU General Assembly 2023, Vienna, Austria, 23–28 Apr 2023, EGU23-14832, https://doi.org/10.5194/egusphere-egu23-14832, 2023.

EGU23-15181 | ECS | PICO | ITS2.5/CL4.14

Assessing the relationship between Saharan dust input and export of organic material in the deep eastern Mediterranean Sea using a one-year sediment-trap record 

Anouk van Boxtel, Addison Rice, Gert de Lange, Francien Peterse, and Jan-Berend Stuut

Dust deposition can trigger phytoplankton growth in oligotrophic low nutrient low chlorophyl (LNLC) regions by providing essential nutrients to the surface ocean. As LNLC regions comprise 60% of the global ocean, dust fertilisation and potential subsequent increased downward carbon export could affect the strength of the biological carbon pump considerably. Additionally, ballasting effects of large dust particles could enhance downward carbon export even further, independent from fertilisation effects. However, compared to high nutrient low chlorophyl (HNLC) regions, the biogeochemical effect of dust deposition and its sensitivity to future climate change is less well understood for LNLC regions. For the LNLC Mediterranean Sea mesocosm experiments and satellite data suggest that some, but not all, dust events lead to increased primary production. However, the exact relationship between dust deposition, productivity and carbon export remains unresolved.  

Here, we aim to identify and quantify the relationships between Saharan dust deposition (deposition mode, dust source), phytoplankton response (changes in community composition, phytoplankton vs heterotrophic bacterial growth) and carbon export in the eastern Mediterranean Sea by studying an exceptional high-resolution, 30-year sediment-trap time series of settling Saharan dust particles and phytoplankton remains (partly at 500m, 1500m, and 2500m water depth), combining sedimentological, biogeochemical, and remote sensing techniques. We here present a combined record of dust and organic matter fluxes for one full year of the time series (April 2017 to May 2018, 2200m water depth). Furthermore, the response of specific phytoplankton groups to dust input as well as the input of terrestrial plant material associated with desert dust is determined based on the presence and distribution of lipid biomarkers in the trap material.

Dust fluxes vary substantially over this one-year period, but peaks occur during spring 2017 and 2018, summer 2017, as well as some smaller, less pronounced peaks during autumn 2017. Some of these dust events indeed correspond to increased fluxes of lipid biomarkers, suggesting a relationship between dust input and enhanced sinking of organic material. However, due to the depth of trap deployment, the record does not allow to differentiate between the influence of dust input as fertiliser or as ballasting effect. This will later be assessed by comparing biomarker records from sediment traps from different depths representing the surface and deep ocean. Nevertheless, the lipid biomarkers representing different phytoplankton groups (e.g., long-chain alkenones for coccolithophores, 23,24-dimethylcholesta-5,22E-dien-β-ol for diatoms, dinosterol for dinoflagellates, long-chain diols for eustigmatophytes) do not show a uniform response to dust input, indicating that the response of these phytoplankton groups depends on different conditions. Moreover, some dust events do not seem to trigger any phytoplankton response at all as they do not coincide with enhanced biomarker fluxes. This indicates that other factors such as dust source, deposition mode and/or trophic state of the surface ocean determine whether dust input triggers enhanced export of organic material or not. Differences in grain-size distribution and terrestrial plant content (indicated by terrestrial plant biomarkers) indeed suggest that the observed contrasting response might be due to differences in dust source and composition. 

How to cite: van Boxtel, A., Rice, A., de Lange, G., Peterse, F., and Stuut, J.-B.: Assessing the relationship between Saharan dust input and export of organic material in the deep eastern Mediterranean Sea using a one-year sediment-trap record, EGU General Assembly 2023, Vienna, Austria, 23–28 Apr 2023, EGU23-15181, https://doi.org/10.5194/egusphere-egu23-15181, 2023.

The Pleistocene periglacial loess-palaeosol series covers about 70% of the territory of Ukraine. The loess-palaeosol mantle of the Volhynian and Podolian uplands, which are the reference region of our many years of research, is even larger, almost continuous in area. Loess is also widespread on the surfaces of the high river terraces in the Forecarpathians.

Dozens of key sections of the Quaternary deposits were studied in Volhyn-Podillia and Forecarpathians using the most modern analytical methods. Among them are sections of Novovolynsk, Boyanychi, Torchyn, Horokhiv, Korshiv, Dubno, Rivne, Basiv Kut, Zdolbuniv (Volhynian upland), Velykyi Hlybochok, Proniatyn, Ihrovytsia, Ternopil, Malyi Khodachkiv, Pidvolochysk, Volochysk, Krasnosilka, Sharovechka, Yarmolyntsi, Letychiv, Vanzhuliv (Podolian upland), Halych, Kolodiiv, Torhanovychi (transition zone to the Forecarpathian upland), etc. P. Tutkovskyi developed an aeolian hypothesis of loess origin (1899) based on the materials of the study of loess deposits in the west of Ukraine, and W. Łoziński introduced the concept of "periglacial" into scientific circulation in 1909.

In the loess-palaeosol series of the west of Ukraine, a number of well-known Palaeolithic sites were discovered and studied, namely the Lower Palaeolithic site of Korolevo, the Middle Palaeolithic sites of Yezupil I, Yezupil II, Mariampil I, Mariampil V, Velykyi Hlybochok I, Proniatyn, Ihrovytsia, Buhliv V, Upper Palaeolithic sites of Vanzhuliv (Zamchysko), Kulychivka, Lypa and many others.

The significance of the study of the periglacial loess-palaeosol sequences for the study of the Palaeolithic of Ukraine is as follows.

  • Solving the problems of stratification of Palaeolithic cultural horizons, substantiation of their age. The results of absolute dating of the Quaternary deposits are important in this context.
  • Solving the issues of preservation of cultural horizons and their redeposition by diluvial-solifluction processes. Palaeocryogenic analysis, widely used in the study of the loess-palaeosol series of the Pleistocene, is very promising here.
  • Correlation of Palaeolithic cultural horizons with stratigraphic ones.
  • The results of the study of loess-palaeosol sequences make it possible to more thoroughly understand the living conditions of ancient people, to study the ways of their migration and adaptations to climate, landscape and ecosystem change.


Acknowledgements

This study was supported by the project of the National Research Foundation of Ukraine, grant number 2020.02/0165.

How to cite: Tomeniuk, O. and Bogucki, A.: The significance of the Pleistocene periglacial loess-palaeosol sequences study for the knowledge of the Palaeolithic of Ukraine, EGU General Assembly 2023, Vienna, Austria, 23–28 Apr 2023, EGU23-15856, https://doi.org/10.5194/egusphere-egu23-15856, 2023.

EGU23-16284 | ECS | PICO | ITS2.5/CL4.14

Loss of loess in the geological record due to poor preservation 

Niels Meijer and Bas van der Meulen

Loess deposits are widespread in the Quaternary, but relatively rare in older geological records. This disparity is commonly linked to the unique climate conditions of the Quaternary, but those cannot fully explain the scarcity of loess in older records. Instead, we propose that the poor preservation of loess due to its windblown nature also plays an essential role. To test this hypothesis, we assess the preservation potential of loess by quantifying its modern-day distribution in active sedimentary basins. This analysis shows that on the global scale only 20% of loess occurs in basins of which the majority is in a foreland setting, possibly because of the proximity to silt-producing mountains and rain shadow aridity. The other 80% is ultimately either eroded or reworked and therefore poorly preserved in the long term. This conclusion implies that loess deposits may have been more common in pre-Quaternary periods, despite being less abundant in the geological record.

How to cite: Meijer, N. and van der Meulen, B.: Loss of loess in the geological record due to poor preservation, EGU General Assembly 2023, Vienna, Austria, 23–28 Apr 2023, EGU23-16284, https://doi.org/10.5194/egusphere-egu23-16284, 2023.

EGU23-16902 | PICO | ITS2.5/CL4.14

Size distribution of atmospheric particles during the Saharan dust episodes over central Europe in Spring 2021 

Kalliopi Violaki, Andrea Mario Arangio, and Athanasios Nenes

Aeolian dust plays a major role in Earth’s climate, by absorbing and scattering radiation, and by influencing the hydrological and biogeochemical cycles. Saharan dust is a significant carrier of limited nutrients (e.g., iron and phosphorus) in many regions of the global ocean but also transfer toxic elements such as chromium, cadmium, arsenic, and lead, influencing public health and ecosystems. Annually, Europe receives millions of tons of Saharan dust while climate change is expected to increase the frequency and severity of dust episodes, especially in the south and central part, with unknown impact on sensitive ecosystems.  

During this study, aerosol particles were collected with a size-segregated hi-volume sampler (Tisch 230-High Volume Cascade Impactor). The impactor separated the particles in six different stages; from larger than 7.2 µm to less than 0.49 µm. Those samples were used to characterize the properties of dust particles during the severe dust episodes in Spring, 2021 in a forest site near Lausanne, Switzerland. We analyzed trace metals and nutrients (Fe, Cu, P, N), inorganic ions, sugars, and phospholipids. Preliminary results showed that a single dust episode can cause an increase of poisonous metals, such as lead and arsenic, by up to four times, affecting public health. In addition, it could be responsible for a large fraction of nutrients deposition - accounting for a significant part of the total annual deposition in the terrestrial and lake ecosystems in the area.

How to cite: Violaki, K., Arangio, A. M., and Nenes, A.: Size distribution of atmospheric particles during the Saharan dust episodes over central Europe in Spring 2021, EGU General Assembly 2023, Vienna, Austria, 23–28 Apr 2023, EGU23-16902, https://doi.org/10.5194/egusphere-egu23-16902, 2023.

EGU23-17135 | PICO | ITS2.5/CL4.14

Which type of atmospheric circulations promoted formation of loess in the Middle Danube Basin during the last million years? 

Slobodan Markovic, Zhentang Guo, Qingzhen Hao, Patrick Ludwig, Milivoj Gavrilov, Ivana Cvijanovic Begg, and Zoran Peric

Loess covers huge parts of the continents, especially in the middle latitudes of the Northern Hemisphere. However, except in the case of formation of the Chinese Loess Plateau, which is linked with the East Asian Monsoon, we do not know the potential relationship between loess formation and responsible air circulation types in any other loess region. Comparison between Serbian and Chinese loess-paleosol sequences provide general similarities of magnetic records. This transcontinental correlation reveals also that there are significant similarities between the magnetic records of northern Serbia and the central Chinese loess plateau. The general multi-millennial variations of magnetic proxies are almost identical in these distant major loess regions. This correspondence appears to be also similar with the globally integrated marine records, potentially suggesting accordance in soil formation processes on Eurasian scale. However, median grain size and other parameters of textural variations indicate significant differences in variations of median grain size between Serbian and Chinese loess-paleosol records. These textural differences point that Serbian loess is formed as a consequence of completely different air circulation than in the case of Chinese loess plateau. Robust evidence of grain size variations recorded in the Serbian loess indicates significant synchronicity with the appearance of Ice Rafted Debris events identified from deep sea cores in the North Atlantic during the last one million years. Higher contribution of coarse grains, the thickness of loess layers and increase of sedimentation rates in Serbian loess-paleosol sequences is associated with a more pronounced decrease of sea surface temperatures in the Western than in Eastern Mediterranean. These differences in the sea surface temperatures between the Western Mediterranean and Eastern Mediterranean illustrate more polar front fluctuations between the Pyrenees and Alps influencing the more frequent cyclone genesis in Genova gulf, as an important regional climatic anomaly. This enhanced cyclonic activity significantly influences the hydro-climatic process in the Danube Basin responsible for loess formation.

How to cite: Markovic, S., Guo, Z., Hao, Q., Ludwig, P., Gavrilov, M., Begg, I. C., and Peric, Z.: Which type of atmospheric circulations promoted formation of loess in the Middle Danube Basin during the last million years?, EGU General Assembly 2023, Vienna, Austria, 23–28 Apr 2023, EGU23-17135, https://doi.org/10.5194/egusphere-egu23-17135, 2023.

EGU23-17138 | PICO | ITS2.5/CL4.14

Quantifying Ireland’s Dust Bowl: An interdisciplinary assessment of loess genesis, deposition, and dynamics in the Burren 

Gordon Bromley, Colin Bunce, Tom Stevens, Marta Cabello, Martin Nauton, and Kathryn Fitzsimmons

The west coast of Ireland is currently one of the wettest environments in Europe, with year-round precipitation, high humidity, and minimal thermal seasonality maintained by a strongly North Atlantic climate. While such conditions are not conducive to dust entrainment, transport, and deposition today, we report geologic evidence from the limestone Burren uplands for a period of sustained aeolian sedimentation during the last glacial termination. Contrasting with Ireland’s till- and glacial-outwash-dominated lowlands, the Burren’s extant sediment cover comprises a homogenous mineral silt preserved in lee-side zones and karst depressions, the outer reaches of caves, and amongst drumlins. Compositionally, our sedimentologic-geochemical data confirm the quartz minerology of these silts, which are consistent in composition and morphology to similar deposits reported from the England and France previously identified as loess. We used U-Pb age profiling of zircons to establish the primary source of the loess, providing a robust test of whether Irish deposits are locally sourced or instead derived from more distal regions (e.g., central Europe-Asia); both scenarios have ramifications for atmospheric circulation patterns during glacial-interglacial transitions and abrupt climate shifts. While OSL dating of the Burren silts is ongoing, the sedimentary stratigraphy is consistent with deposition during or immediately following ice sheet retreat, which our 10Be-dating of glacial surfaces places during early Heinrich Stadial 1 (HS1). In Ireland, HS1 was also characterised by winter sea ice, extreme thermal seasonality, and relatively low sea level. At multiple Burren sites, a bi-fold stratigraphy suggests the in situ (i.e., airfall) loess is overlain by a subsequently reworked unit of silt that was remobilised during the mid-Holocene, potentially reflecting a combination of climatic and anthropogenic drivers. Thus far, the Burren loess is providing a new aeolian vantage on Europe’s Atlantic margin during the close of the last ice age and has considerable potential for exploring environmental conditions during climatic transitions.

How to cite: Bromley, G., Bunce, C., Stevens, T., Cabello, M., Nauton, M., and Fitzsimmons, K.: Quantifying Ireland’s Dust Bowl: An interdisciplinary assessment of loess genesis, deposition, and dynamics in the Burren, EGU General Assembly 2023, Vienna, Austria, 23–28 Apr 2023, EGU23-17138, https://doi.org/10.5194/egusphere-egu23-17138, 2023.

Mineral dust contributes significantly to the global atmospheric aerosol burden and is an important climate factor. Its model-based description of the atmospheric life cycle and impacts largely depends on an accurate parameterization of dust emissions. The large variability of near-source dust distribution in current forecast and aerosol-climate models is an indication that accurate simulation of dust emissions remains problematic. The occurrence and strength of dust emissions depends on both surface properties and surface winds. While satellite remote sensing offers great potential for determining relevant surface properties such as surface roughness and land use, model simulations of surface winds remain problematic in resolving strong wind events that occur on small spatial and temporal scales. The peak wind speeds of such events have the potential to cause strong dust emissions, but are unlikely to be captured in model simulations with parameterized convection.  Advances in high-resolution convection atmospheric modelling are a major opportunity for overcoming these limitations. Convection permitting simulations and multi-scale model approaches become feasible with the new ICON model framework which has been developed jointly by the German Weather Service (DWD) and the Max Planck Institute for Meteorology in Hamburg. Results of dust simulations with the HAM aerosol model coupled to ICON will be presented. The new model system will advance the flexibility and possibilities to work on understanding the role of mineral dust aerosol and their interactions within the changing climate. The new model system will improve the ability to understand the role of mineral dust aerosols and their interactions with the climate system.

How to cite: Tegen, I. and Kubin, A.: Towards improving dust emission simulations with the ICON-HAM model framework, EGU General Assembly 2023, Vienna, Austria, 23–28 Apr 2023, EGU23-17139, https://doi.org/10.5194/egusphere-egu23-17139, 2023.

The future evolution of the West Antarctic Ice Sheet (WAIS) will strongly influence the global sea-level rise in the coming decades. Ice shelf melting in that sector is partly controlled by the low-pressure system located off the West Antarctic coast, namely the Amundsen Sea Low (ASL). When the ASL is deep, an overall increase in ice shelf melting is noticed. Because of the sparse observational network and the strong internal variability, our understanding of the long-term climate changes in the atmospheric circulation is limited, and therefore its impact on ice melting as well. Among all the processes involved in the West Antarctic climate variability, an increasing number of studies have pointed out the strong impact of the climate in the tropical Pacific. However, most of those studies focus on the past decades, which prevents the analysis of the role of the multi-decadal tropical variability on the West Antarctic climate. Here, we combine annually-resolved paleoclimate records, in particular ice core and coral records, and the physics of climate models through paleoclimate data assimilation to provide a complete spatial multi-field reconstruction of climate variability in the tropics and Antarctic. This allows for studying both the year-to-year and multi-decadal variability of the tropical-Antarctic teleconnections. As data assimilation provides a climate reconstruction that is dynamically constrained, the contribution of the tropical variability on the West Antarctic climate changes can be directly assessed. Our results indicate that climate variability in the tropical Pacific is the main driver of ASL variability at the multi-decadal time scale, with a strong link to the Interdecadal Pacific Oscillation (IPO). However, the deepening of the Amundsen Sea Low over the 20th century cannot be explained by tropical climate variability. By using large ensembles of climate model simulations, our analysis suggests anthropogenic forcing as the primary driver of this 20th century ASL deepening. In summary, the 20th century ASL deepening is explained by the forcing, but the multi-decadal variability related to the  IPO is superimposed on this long-term trend.

How to cite: Dalaiden, Q., Abram, N., and Goosse, H.: Tropical Pacific variability and anthropogenic forcing are the key drivers of the West Antarctic atmospheric circulation variability over the 20th century, EGU General Assembly 2023, Vienna, Austria, 23–28 Apr 2023, EGU23-683, https://doi.org/10.5194/egusphere-egu23-683, 2023.

EGU23-991 | Orals | CR3.2

Future irreversible loss of Thwaites Glacier relative to global warming 

Emilia Kyung Jin, In-Woo Park, Hyun Joo Lee, and Won Sang Lee

The speed of West Antarctic melting is a very important factor in determining the degree of future global sea level rise. Loss of the Thwaites glacier due to global warming will have various regime changes in line with changes in the Earth system. The basal melting as a result of ocean warming can cause loss at an inhomogeneous rate across the underlying topography and overlying ice volume, while the change in precipitation from snow to rain as atmospheric warming can accelerate surface melting and trigger the irreversible loss.  

In this study, the ISSM model was driven with the ocean and atmospheric forcings obtained from the CMIP6 earth system model results, and future prediction experiments were performed until 2300. As a result, the accelerated period of melting of the Thwaites glacier related with forcings and the period of irreversible loss according to the structural characteristics and degree of warming are investigated. The mechanisms and timing that cause rapid ice loss are analyzed and the tipping point at which irreversible losses are triggered has been proposed as a function of warming.

How to cite: Jin, E. K., Park, I.-W., Lee, H. J., and Lee, W. S.: Future irreversible loss of Thwaites Glacier relative to global warming, EGU General Assembly 2023, Vienna, Austria, 23–28 Apr 2023, EGU23-991, https://doi.org/10.5194/egusphere-egu23-991, 2023.

EGU23-1329 | ECS | Orals | CR3.2

Characterizing the influence of idealized atmospheric forcings on firn using the SNOWPACK firn model 

Megan Thompson-Munson, Jennifer Kay, and Bradley Markle

The porous layer of snow and firn that blankets ice sheets can store meltwater and buffer an ice sheet’s contribution to sea level rise. A warming climate threatens this buffering capacity and will likely lead to depletion of the air-filled pore space, known as the firn air content. The timing and nature of the firn’s response to climate change is uncertain. Thus, understanding how the firn may evolve in different climate scenarios remains important. Here we use a one-dimensional, physics-based firn model (SNOWPACK) to simulate firn properties over time. To force the model, we generate idealized, synthetic atmospheric datasets that represent distinct climatologies on the Antarctic and Greenland Ice Sheets. The forcing datasets include temperature, precipitation, humidity, wind speed and direction, shortwave radiation, and longwave radiation, which SNOWPACK uses as input to simulate a firn column through time. We perturb the input variables to determine how firn properties respond to the perturbation, and how long it takes for those properties to reach a new equilibrium. We explore how different combinations of perturbations impact the firn to assess the effects of, for example, a warmer and wetter climate versus a warmer and drier climate. The firn properties of greatest interest are the firn air content, liquid water content, firn temperature, density, and ice slab content since these quantities help define the meltwater storage capacity of the firn layer. In our preliminary analysis, we find that with a relatively warm and wet base climatology representative of a location in southern Greenland, increasing the air temperature by 1 K yields a 48% decrease in firn air content and a 3% increase in the deep firn temperature 100 years after the perturbation. SNOWPACK also simulates near-surface, low-permeability ice slabs that inhibit potential meltwater storage in deeper firn. Conversely, decreasing the air temperature by 1 K yields a 7% increase in firn air content and a <1% decrease in the deep firn temperature in the same amount of time. In this scenario, the effects of warming are more extreme and have more adverse impacts on the firn’s meltwater storage capacity when compared to cooling. This work highlights the sensitivity of the firn to changing atmospheric variables and provides a framework for estimating the timescales and magnitude of firn responses to a changing climate.

How to cite: Thompson-Munson, M., Kay, J., and Markle, B.: Characterizing the influence of idealized atmospheric forcings on firn using the SNOWPACK firn model, EGU General Assembly 2023, Vienna, Austria, 23–28 Apr 2023, EGU23-1329, https://doi.org/10.5194/egusphere-egu23-1329, 2023.

EGU23-3405 | ECS | Orals | CR3.2

Disentangling the drivers of future Antarctic ice loss with a historically-calibrated ice-sheet model 

Violaine Coulon, Ann Kristin Klose, Christoph Kittel, Ricarda Winkelmann, and Frank Pattyn

Recent observations show that the Antarctic ice sheet is currently losing mass at an accelerating rate in areas subject to high sub-shelf melt rates. The resulting thinning of the floating ice shelves reduces their ability to restrain the ice flowing from the grounded ice sheet towards the ocean, hence raising sea level by increased ice discharge. Despite a relatively good understanding of the drivers of current Antarctic mass changes, projections of the Antarctic ice sheet are associated with large uncertainties, especially under high‐emission scenarios. This uncertainty may notably be explained by unknowns in the long-term impacts of basal melting and changes in surface mass balance. Here, we use an observationally-calibrated ice-sheet model to investigate the future trajectory of the Antarctic ice sheet until the end of the millennium related to uncertainties in the future balance between sub-shelf melting and ice discharge on the one hand, and the changing surface mass balance on the other. Our large ensemble of simulations, forced by a panel of CMIP6 climate models, suggests that the ocean will be the main driver of short-term Antarctic mass loss, triggering ice loss in the West Antarctic ice sheet (WAIS) already during this century. Under high-emission pathways, ice-ocean interactions will result in a complete WAIS collapse, likely completed before the year 2500 CE, as well as significant grounding-line retreat in the East Antarctic ice sheet (EAIS). Under a more sustainable socio-economic scenario, both the EAIS and WAIS may be preserved, though the retreat of Thwaites glacier appears to be already committed under present-day conditions. We show that with a regional near-surface warming higher than +7.5°C, which may occur by the end of this century under unabated emission scenarios, major ice loss is expected as the increase in surface runoff outweighs the increase in snow accumulation, leading to a decrease in the mitigating role of the ice sheet surface mass balance.

How to cite: Coulon, V., Klose, A. K., Kittel, C., Winkelmann, R., and Pattyn, F.: Disentangling the drivers of future Antarctic ice loss with a historically-calibrated ice-sheet model, EGU General Assembly 2023, Vienna, Austria, 23–28 Apr 2023, EGU23-3405, https://doi.org/10.5194/egusphere-egu23-3405, 2023.

EGU23-4042 | Posters on site | CR3.2

Experimental design for the the 2nd marine ice sheet and ocean model intercomparison project (MISOMIP2) 

Nicolas Jourdain, Jan De Rydt, Yoshihiro Nakayama, Ralph Timmermann, and Mathias Van Caspel

The 2nd Marine Ice Sheet and Ocean Model Intercomparison Project (MISOMIP2) is a natural progression of previous and ongoing model intercomparison exercises that have focused on the simulation of ice-sheet--ocean processes in Antarctica. The previous exercises motivate the move towards more realistic configurations and more diverse model parameters and resolutions. The first objective of MISOMIP2 is to investigate the robustness of ocean and ocean--ice-sheet models in a range of Antarctic environments, through comparisons to interannual observational data. We will assess the status of ocean--ice-sheet modelling as a community and identify common characteristics of models that are best able to capture observed features. As models are highly tuned based on present-day data, we will also compare their sensitivity to abrupt atmospheric perturbations leading to either very warm or slightly warmer ocean conditions than present-day. The approach of MISOMIP2 is to welcome contributions of models as they are, but we request standardised variables and common grids for the outputs. There will be two target regions, the Amundsen Sea and the Weddell Sea, chosen because they describe two extremely different ocean environments and have been relatively well observed compared to other parts of Antarctica. An observational "MIPkit" is provided to evaluate ocean and ice sheet models in these two regions.

How to cite: Jourdain, N., De Rydt, J., Nakayama, Y., Timmermann, R., and Van Caspel, M.: Experimental design for the the 2nd marine ice sheet and ocean model intercomparison project (MISOMIP2), EGU General Assembly 2023, Vienna, Austria, 23–28 Apr 2023, EGU23-4042, https://doi.org/10.5194/egusphere-egu23-4042, 2023.

EGU23-6642 | ECS | Orals | CR3.2

Snow evolution through the Last Interglacial with a multi-layer snow model 

Thi Khanh Dieu Hoang, Aurélien Quiquet, Christophe Dumas, and Didier M. Roche

The Last Interglacial period (LIG), which occurred approximately between 130 and 116 kyr BP, is characterized by similar/warmer temperatures and higher sea levels compared to the present-day conditions due to the orbital variation of the Earth. Hence, the period provides insights into the behavior of the Earth's system components under stable and prolonged warm climates and their subsequent evolution into a glacial state. 

To better understand the ice sheet's surface mass balance that ultimately drives the advance and retreat of ice-sheets, we study the snow cover changes in the Northern Hemisphere during the LIG. In order to do so, we used BESSI (BErgen Snow Simulator), a physical energy balance model with 15 vertical snow layers and high computational efficiency, to simulate the snowpack evolution. First, BESSI was validated using the regional climate model MAR (Modèle Atmosphérique Régional) as forcing and benchmark for snow cover over the Greenland and Antarctica Ice Sheets under present-day climate. Using two distinct ice sheet climates helps constrain the different processes in place (e.g., albedo and surface melt for Greenland and sublimation for Antarctica). 

For the LIG simulations, the latest version of an Earth system model of intermediate complexity iLOVECLIM was used to force BESSI in different time slices to fully capture the snow evolution in the Northern Hemisphere throughout this period. Impacts of the downscaling component of iLOVECLIM, which provides higher resolution data and accounts for the influences of the topography, on BESSI performance are also discussed.  

The results show that BESSI performs well compared to MAR for the present-day climate, even with a less complex model set-up. Through the LIG, with the ability to model the snow compaction, the change of snow density and snow depth, BESSI simulates the snow cover evolution in the studied area better than the simple snow model (bucket model) included in iLOVECLIM. 

The findings suggest that BESSI can provide a more physical surface mass balance scheme to ice sheet models such as GRISLI of iLOVECLIM to improve simulations of the ice sheet - climate interactions.  

How to cite: Hoang, T. K. D., Quiquet, A., Dumas, C., and Roche, D. M.: Snow evolution through the Last Interglacial with a multi-layer snow model, EGU General Assembly 2023, Vienna, Austria, 23–28 Apr 2023, EGU23-6642, https://doi.org/10.5194/egusphere-egu23-6642, 2023.

EGU23-7020 | ECS | Orals | CR3.2

Uncertainties in Greenland ice sheet evolution and related sea-level projections until 2100 

Charlotte Rahlves, Heiko Goelzer, Petra Langebroek, and Andreas Born

The Greenland ice sheet is currently one of the main contributors to sea-level rise and mass loss from the ice sheet is expected to continue under increasing Arctic warming. Since sea-level rise is threatening coastal communities worldwide, reducing uncertainties in projections of future sea-level contribution from the Greenland ice sheet is of high importance. In this study we address the response of the ice sheet to future climate change. We determine rates of sea-level contribution that can be expected from the ice sheet until 2100 by performing an ensemble of standalone ice sheet simulations with the Community Ice Sheet Model (CISM). The ice sheet is initialized to resemble the presently observed geometry by inverting for basal friction. We examine a range of uncertainties, associated to stand alone ice sheet modeling by prescribing forcing from various global circulations models (GCMs) for different future forcing scenarios (shared socioeconomic pathways, SSPs). Atmospheric forcing is downscaled with the regional climate model MAR. The response of marine terminating outlet glaciers to ocean forcing is represented by a retreat parameterization and sampled by considering different sensitivities. Furthermore, we investigate how the initialization of the ice sheet with forcing from different global circulation models affects the projected rates of sea-level contribution. In addition, sensitivity of the results to the grid spacing of the ice sheet model is assessed. The observed historical mass loss is generally well reproduced by the ensemble. The projections yield a sea-level contribution in the range of 70 to 230 mm under the SSP5-8.5 scenario until 2100. Climate forcing constitutes the largest source of uncertainty for projected sea-level contribution, while differences due to the initial state of the ice sheet and grid resolution are minor.


How to cite: Rahlves, C., Goelzer, H., Langebroek, P., and Born, A.: Uncertainties in Greenland ice sheet evolution and related sea-level projections until 2100, EGU General Assembly 2023, Vienna, Austria, 23–28 Apr 2023, EGU23-7020, https://doi.org/10.5194/egusphere-egu23-7020, 2023.

The precession of the equinoxes has a strong influence on the intensity of summer insolation according to most metrics and we would therefore expect the 23-Kyr and 19-Kyr precession cycles to be strongly reflected in our records of global ice volume, if summer insolation is indeed important for pacing glacial-interglacial cycles as proposed by Milutin Milankovitch. Instead, the precession signal is reduced in amplitude compared with the obliquity cycle in the Late Pleistocene, and in the Early Pleistocene (EP) precession appears completely absent in the δ18O stack. For this reason, the ‘40-Kyr world’ of the EP has been referred to as Milankovitch's other unsolved mystery. Indeed, numerous models of the Northern Hemisphere (NH) ice sheets simulated across the Plio-Pleistocene predict both a strong precessional and obliquity variability during the EP, at odds with the δ18O record. This points to the possibility of a dynamic Antarctic Ice Sheet in the EP that varied out-of-phase with the NH ice sheets at the precession period. In the original theory proposed by Raymo et al., (2006), from 3 to 1 Ma the East Antarctic Ice Sheet may have been land-terminating between 70S to 65S and sensitive to local summer insolation forcing. As precession is out-of-phase between the hemispheres, these variations could be cancelled out in globally integrated proxies of sea-level, concealing the true precession variability of both hemispheres in the marine sediment record. While studies have demonstrated  that precession-driven variations of the Antarctic Ice Sheet could cancel out NH variations in the deep-ocean record, no studies have investigated the actual feasibility of strong precession variability of the Antarctic Ice Sheet in the EP driven by local summer insolation, and whether it would have the magnitudes necessary to offset larger variations of the NH ice sheets. The question remains under what CO2 concentrations and orbital configuration can the East Antarctic Ice Sheet realistically be sensitive to local summer insolation forcing and possibly deglaciated from 70S to 65S, as postulated by Raymo et al. (2006). Can this produce the 10-30 m of sea-level necessary to offset NH variations in ice volume? To investigate the feasibility for anti-phased precession variability between the NH ice sheets and Antarctica in the EP, we use a zonally-averaged energy balance model coupled to a 1-D ice sheet model of a northern and southern hemisphere ice sheet, forced by atmospheric CO2 concentrations and daily insolation fields. The model will simulate glacial cycles across the Quaternary for different CO2 scenarios and determine whether anti-phased precessional cycles in ice volume between the hemispheres is a viable mechanism to explain the 40-Kyr world found in the δ18O record.

How to cite: Gunning, D.: Investigating precession cancellation across the MPT using a zonally averaged energy balance model, EGU General Assembly 2023, Vienna, Austria, 23–28 Apr 2023, EGU23-7385, https://doi.org/10.5194/egusphere-egu23-7385, 2023.

EGU23-7422 | ECS | Orals | CR3.2 | Highlight

(Ir)reversibility of future Antarctic mass loss on multi-millennial timescales 

Ann Kristin Klose, Violaine Coulon, Frank Pattyn, and Ricarda Winkelmann

Given the potentially high magnitudes and rates of future warming, the long-term evolution of the Antarctic Ice Sheet is highly uncertain. While recent projections under Representative Concentration Pathway 8.5 estimate the Antarctic sea-level contribution by the end of this century between -7.8 cm and 30.0 cm sea-level equivalent (Seroussi et al., 2020), sea-level might continue to rise for millennia to come due to ice sheet inertia, resulting in a substantially higher long-term committed sea-level change. In addition, potentially irreversible ice loss due to several self-amplifying feedback mechanisms may be triggered within the coming centuries, but evolves thereafter over longer timescales depending on the warming trajectory. It is therefore necessary to account for the timescale difference between forcing and ice sheet response in long-term sea-level projections by (i) determining the resulting gap between transient and committed sea-level contribution with respect to changing boundary conditions, (ii) testing the reversibility of large-scale ice sheet changes, as well as (iii) exploring the potential for safe overshoots of critical thresholds when reversing climate conditions from enhanced warming to present-day.

Here, we assess the sea-level contribution from mass balance changes of the Antarctic Ice Sheet on multi-millennial timescales, as well as ice loss reversibility. The Antarctic sea-level commitment is quantified using the Parallel Ice Sheet Model (PISM) and the fast Elementary Thermomechanical Ice Sheet (f.ETISh) model by fixing forcing conditions of warming trajectories from state-of-the-art climate models available from the sixth phase of the Coupled Model Intercomparison Project (CMIP6) at regular intervals in time. The ice sheet then evolves for several millennia under constant climate conditions. Finally, the climate forcing is reversed to present-day starting from different stages of ice sheet decline to test for the reversibility of ice loss.

Our results suggest that the Antarctic Ice Sheet may be committed to a strong grounding-line retreat or even a collapse of the West Antarctic Ice Sheet when keeping climate conditions constant at warming levels reached during this century. Fixing climate conditions later in time may additionally trigger a substantial decline of the East Antarctic Ice Sheet. We show that the reversibility of Antarctic ice loss as well as the potential for safe overshoots strongly depend on the timing of the reversal of the forcing.

How to cite: Klose, A. K., Coulon, V., Pattyn, F., and Winkelmann, R.: (Ir)reversibility of future Antarctic mass loss on multi-millennial timescales, EGU General Assembly 2023, Vienna, Austria, 23–28 Apr 2023, EGU23-7422, https://doi.org/10.5194/egusphere-egu23-7422, 2023.

EGU23-7507 | ECS | Posters on site | CR3.2

The influence of temperature variability on the Greenland ice sheet 

Mikkel Lauritzen, Guðfinna Aðalgeirsdóttir, Nicholas Rathmann, Aslak Grinsted, Brice Noël, and Christine Hvidberg

The projected contribution of the Greenland ice sheet to sea-level rise in response to future warming relies upon the state of the present-day ice sheet, and one of the main contributors to uncertainties in projections is due to uncertainties in the initial state of the simulated ice sheet. A previous study showed that including the inter-annual climate variability in an idealized ice sheet model leads to an increased mass loss rate, but the effect on the Greenland ice sheet is not known. Here we present a study using the PISM model to quantify the influence of inter-annual variability in climate forcing on the Greenland ice sheet. 
We construct an ensemble of climate-forcing fields that account for inter-annual variability in temperature using reanalysis data products from RACMO and NOAA-CIRES, and we investigate the steady state and the sensitivity of the simulated Greenland ice sheet under these different scenarios.
We find that the steady state volume decreases by 0.24-0.38% when forced with a variable temperature forcing compared to a constant temperature forcing, corresponding to 21.7±5.0 mm of sea level rise, and the response to abrupt warming is 0.03-0.21 mm SLE a-1 higher depending on climate scenario. The northern basins are particularly sensitive with a change in volume of 1.2-0.9%. Our results emphasize the importance of including climate variability in projections of future mass loss.

How to cite: Lauritzen, M., Aðalgeirsdóttir, G., Rathmann, N., Grinsted, A., Noël, B., and Hvidberg, C.: The influence of temperature variability on the Greenland ice sheet, EGU General Assembly 2023, Vienna, Austria, 23–28 Apr 2023, EGU23-7507, https://doi.org/10.5194/egusphere-egu23-7507, 2023.

EGU23-7553 | ECS | Orals | CR3.2

Examining Possible Retreat Scenarios for the Greenland Ice Sheet during the MIS-11c Interglacial 

Brian Crow, Lev Tarasov, Matthias Prange, and Michael Schulz

The interglacial period spanning ca. 423 to 398 ka and known as Marine Isotope Stage (MIS) 11c has been the subject of much study, due largely to the unique evolution of global temperatures, greenhouse gas levels, and sea levels relative to other interglacials of the late Pleistocene. Particularly concerning is some geological evidence and prior modeling studies which have suggested that a large majority of the Greenland ice sheet (GrIS) disappeared during this period, despite global mean air temperatures only modestly higher than those of the preindustrial period. However, uncertainty is high as to the extent and spatiotemporal evolution of this melt due to a dearth of direct geological constraints. Our study therefore endeavors to better constrain these large uncertainties by using spatiotemporally interpolated climate forcing from CESM v1.2 time slice simulations and an ensemble of ice sheet model parameter vectors derived from a GrIS history matching over the most recent glacial cycle from the Glacial Systems Model (GSM). The use of different ice sheet initialization states from simulations of the previous glacial-interglacial transition helps to capture the large initial condition uncertainty. Two different regional present-day climate modeling datasets are utilized for anomaly correction of CESM precipitation and temperature fields. 

Preliminary analysis indicates that the most robust retreat across most ensemble members happens in the northern, western, and central portions of the ice sheet, while the higher terrain of the south and east retain substantial amounts of ice. This is broadly consistent with indications that ice may have survived the MIS-11c interglacial at the Summit ice core location, but not at DYE-3. Simulations indicate a maximum MIS-11c sea level contribution from the GrIS centered between 408 and 403 ka, with minimum GrIS volumes reaching between 25% and 70% of modern-day values. In part due to the prior constraint of ice-sheet model ensemble parameters from history matching, ensemble parameters controlling downscaling and climate forcing bias correction are the largest parametric sources of output variance in our simulations.  Though CESM uncertainties are unassessed in this study, it is likely they dominate given that the choice of present-day reference temperature climatology for anomaly correction of the climate model output has the largest effect on the GrIS melt response in our simulations.

How to cite: Crow, B., Tarasov, L., Prange, M., and Schulz, M.: Examining Possible Retreat Scenarios for the Greenland Ice Sheet during the MIS-11c Interglacial, EGU General Assembly 2023, Vienna, Austria, 23–28 Apr 2023, EGU23-7553, https://doi.org/10.5194/egusphere-egu23-7553, 2023.

EGU23-7920 | ECS | Orals | CR3.2

The Divergent Futures of Greenland Surface Mass Balance Estimates from Different Regional Climate Models 

Quentin Glaude, Brice Noel, Martin Olesen, Fredrik Boberg, Michiel van den Broeke, Ruth Mottram, and Xavier Fettweis

Arctic amplification is causing global warming to have a more intense impact on arctic regions, with consequences on the surface mass balance and glacier coverage of Greenland. The glaciers of Greenland are also shrinking, contributing to sea level rise as well. Projecting the future evolution of these changes is crucial for understanding the likely impacts of climate change on sea level rise.

In this study, we compared three state-of-the-art Regional Climate Models (RCMs) (MAR, RACMO, and HIRHAM) using a common grid and forcing data from Earth System Models to assess their ability to project future changes in Greenland's surface mass balance up to 2100. We also considered the impact of different Earth System Models and Shared Socioeconomic Pathways.

The results of this comparison showed significant differences in the projections produced by these different models, with a factor-2 difference in mass loss between MAR and RACMO on cumulative Surface Mass Balance anomalies. These differences are important as RCMs are often used as inputs for ice sheet models, which are used to make predictions about sea level rise. Furthermore, we aim to investigate the causes of these differences, as understanding them will be key to improving the accuracy of sea level rise projections.

The uncertainty of the RCMs projections are translated into uncertainties in Sea-Level-Rise projections. The results presented here open the door for deeper investigations in the climate modeling community and the physical reasons linked to these divergences. Our study highlighted the importance of continued research and development of RCMs to better understand the physics implemented in these models and ultimately improve the accuracy of future sea level rise projections.

How to cite: Glaude, Q., Noel, B., Olesen, M., Boberg, F., van den Broeke, M., Mottram, R., and Fettweis, X.: The Divergent Futures of Greenland Surface Mass Balance Estimates from Different Regional Climate Models, EGU General Assembly 2023, Vienna, Austria, 23–28 Apr 2023, EGU23-7920, https://doi.org/10.5194/egusphere-egu23-7920, 2023.

EGU23-8341 | Orals | CR3.2 | Highlight

Antarctic Ice Sheet tipping points in the last 800,000 years 

David Chandler, Petra Langebroek, Ronja Reese, Torsten Albrecht, and Ricarda Winkelmann

Stability of the Antarctic Ice Sheet in the present-day climate, and in future warming scenarios, is of growing concern as increasing evidence points towards the prospect of irreversible ice loss from the West Antarctica Ice Sheet (WAIS) with little or no warming above present. Here, in transient ice sheet simulations for the last 800,000 years (9 glacial-interglacial cycles), we find evidence for strong hysteresis between ice volume and ocean temperature forcing through each glacial cycle, driven by rapid WAIS collapse and slow recovery. Additional equilibrium simulations at several climate states show this hysteresis does not arise solely from the long ice sheet response time, instead pointing to consistent tipping-point behaviour in the WAIS. Importantly, WAIS collapse is triggered when continental shelf bottom water is maintained above a threshold of 0 to 0.25°C above present, and there are no stable states for the WAIS in conditions warmer than present. Short excursions to warmer temperatures (marine isotope stage 7) may not initiate collapse (‘borrowed time’), while the more sustained interglacials (stages 11, 9, 5e) demonstrate an eventual WAIS collapse. Cooling of ca. 2°C below present-day is then required to initiate recovery. Despite the differing climatic characteristics of each glacial cycle, consistency between both the transient and equilibrium behaviour of the ice sheet through several cycles shows there is some intrinsic predictability at millennial time scales, supporting the use of Pleistocene ice sheet simulations and geological evidence as constraints on likely future behaviour.

How to cite: Chandler, D., Langebroek, P., Reese, R., Albrecht, T., and Winkelmann, R.: Antarctic Ice Sheet tipping points in the last 800,000 years, EGU General Assembly 2023, Vienna, Austria, 23–28 Apr 2023, EGU23-8341, https://doi.org/10.5194/egusphere-egu23-8341, 2023.

EGU23-8690 | ECS | Orals | CR3.2

Antarctic sensitivity to oceanic melting parameterizations 

Antonio Juárez-Martínez, Javier Blasco, Marisa Montoya, Jorge Alvarez-Solas, and Alexander Robinson

Ice in Antarctica has been experiencing dramatic changes in the last decades. These variations have consequences in terms of sea level, which could have an impact on human societies and life on the planet in the future. The Antarctic Ice Sheet (AIS) could become the main contributor to sea-level rise in the coming centuries, but there is a great uncertainty associated with its contribution, which is due in part to the complexity of the coupled ice-ocean processes. In this study we investigate the contribution of the AIS to sea-level rise in the coming centuries in the context of the Ice Sheet Model Intercomparison Project (ISMIP6), but covering a range beyond 2100, using the higher-order ice-sheet model Yelmo. We test the sensitivity of the model  to basal melting parameters using several forcings and scenarios for the atmosphere and ocean, obtained from different GCM models. The results show a strong  dependency on variations of the parameter values of the basal melting laws and also on the forcing that is chosen. Higher values of the heat exchange velocity between ice and ocean lead to higher sea-level rise, varying the contribution depending on the forcing. Ice-ocean interactions therefore can be expected to contribute significantly to the uncertainty associated with the future evolution of the AIS.


How to cite: Juárez-Martínez, A., Blasco, J., Montoya, M., Alvarez-Solas, J., and Robinson, A.: Antarctic sensitivity to oceanic melting parameterizations, EGU General Assembly 2023, Vienna, Austria, 23–28 Apr 2023, EGU23-8690, https://doi.org/10.5194/egusphere-egu23-8690, 2023.

EGU23-8853 | ECS | Orals | CR3.2

Sensitivity of Heinrich events to boundary forcing perturbations in a coupled ice sheet-solid Earth model 

Clemens Schannwell, Uwe Mikolajewicz, Marie Kapsch, and Florian Ziemen

Heinrich events are one of the prominent signals of glacial climate variability. They are characterised as abrupt, quasi-periodic episodes of ice-sheet instabilities during which large numbers of icebergs are released from the Laurentide ice sheet. These events affect the evolution of the global climate by modifying the ocean circulation through the addition of freshwater and the atmospheric circulation through changes in ice-sheet height. However, the mechanisms controlling the timing and occurrence of Heinrich events remain enigmatic to this day. Here, we present simulations with a coupled ice-sheet solid Earth model that aim to quantify the importance of different boundary forcings for the timing of Heinrich events. We focus the analysis on two prominent ice streams of the Laurentide ice sheet with the land-terminating Mackenzie ice stream and the marine-terminating Hudson ice stream. Our simulations identify different surge characteristics for the Mackenzie ice stream and the Hudson ice stream. Despite their different glaciological and climatic settings, both ice streams exhibit responses of similar magnitude to perturbations to the surface mass balance and the geothermal heat flux. However, Mackenzie ice stream is more sensitive to changes in the surface temperature. Changes to the ocean temperature and the global sea level have a negligible effect on the timing of Heinrich events in our simulations for both ice streams. We also show that Heinrich events for both ice streams only occur in a certain parameter space. Transitioning from an oscillatory Heinrich event state to a persistent streaming state can lead to an ice volume loss of up to 30%. Mackenzie ice stream is situated in a climate that is particularly close to this transition point, underlining the potential of the ice stream to have contributed to prominent abrupt climate events during glacial-interglacial transitions.

How to cite: Schannwell, C., Mikolajewicz, U., Kapsch, M., and Ziemen, F.: Sensitivity of Heinrich events to boundary forcing perturbations in a coupled ice sheet-solid Earth model, EGU General Assembly 2023, Vienna, Austria, 23–28 Apr 2023, EGU23-8853, https://doi.org/10.5194/egusphere-egu23-8853, 2023.

EGU23-8973 | ECS | Posters on site | CR3.2

How does the Greenland ice sheet respond on a medium-term time scale to various levels of warming? 

Alison Delhasse, Johanna Beckmann, and Christoph Kittel

The Greenland ice sheet is considered as one of the main causes of sea level rise (SLR) at the end of the 21st century. But what if it is already too late to reverse the loss of ice from the Greenland ice sheet? The mass balance (MB) resulting from the coupling between the Regional Atmospheric Model (MAR, ULiège) and the Parallel Ice Sheet Model (PISM, PIK) over Greenland following the CESM2 ssp585 climate indicates that even if we stop the CESM2 warming in 2100 and continue with a +7°C climate until 2200 with respect to the reference period (1961-1990), the GrIS continues to lose mass up to a contribution equivalent to 60 cm of SLR in 2200. From this coupling experiment, we ran several coupled simulations by stabilizing the warming at different thresholds (+ 1, 2, 3, ... °C) with respect to our reference period in order to highlight a kind of tipping point of the ice sheet with respect to atmospheric warming. Other experiments have been launched by reversing the climate imposed by CESM2 from 2100 to 2000, for example, with the aim of identifying whether the GrIS could gain ice mass again with a climate as warm as the present one.

How to cite: Delhasse, A., Beckmann, J., and Kittel, C.: How does the Greenland ice sheet respond on a medium-term time scale to various levels of warming?, EGU General Assembly 2023, Vienna, Austria, 23–28 Apr 2023, EGU23-8973, https://doi.org/10.5194/egusphere-egu23-8973, 2023.

EGU23-9449 | Posters on site | CR3.2

Interactive coupling of the Antarctic Ice Sheet and the global ocean 

Moritz Kreuzer, Willem Huiskamp, Torsten Albrecht, Stefan Petri, Ronja Reese, Georg Feulner, and Ricarda Winkelmann

Increased sub-shelf melting and ice discharge from the Antarctic Ice sheet has both regional and global impacts on the ocean and the overall climate system. Additional meltwater, for example, can reduce the formation of Antarctic Bottom Water, potentially affecting the global thermohaline circulation. Similarly, increased input of fresh and cold water around the Antarctic margin can lead to a stronger stratification of coastal waters, and a potential increase in sea-ice formation, trapping warmer water masses below the surface, which in turn can lead to increased basal melting of the ice shelves.

So far these processes have mainly been analysed in simple unidirectional cause-and-effect experiments, possibly neglecting important interactions and feedbacks. To study the long-term and global effects of these interactions, we have developed a bidirectional offline coupled ice-ocean model framework. It consists of the global ocean and sea-ice model MOM5/SIS and an Antarctic instance of the Parallel Ice Sheet Model PISM, with the ice-shelf cavity module PICO representing the ice-ocean boundary layer physics. With this setup we are analysing the aforementioned interactions and feedbacks between the Antarctic Ice Sheet and the global ocean system on multi-millenial time scales.

How to cite: Kreuzer, M., Huiskamp, W., Albrecht, T., Petri, S., Reese, R., Feulner, G., and Winkelmann, R.: Interactive coupling of the Antarctic Ice Sheet and the global ocean, EGU General Assembly 2023, Vienna, Austria, 23–28 Apr 2023, EGU23-9449, https://doi.org/10.5194/egusphere-egu23-9449, 2023.

EGU23-9747 | Orals | CR3.2

Climate variability as a major forcing of recent Antarctic ice-mass change 

Matt King, Kewei Lyu, and Xuebin Zhang

Antarctica has been losing ice mass for decades, but its link to large-scale modes of climate forcing is not clear. Shorter-period variability has been partly associated with El Niño Southern Oscillation (ENSO), but a clear connection with the dominant climate mode, the Southern Annular Mode (SAM), is yet to be found. We show that space gravimetric estimates of ice-mass variability over 2002-2021 may be substantially explained by a simple linear relation with detrended, time-integrated SAM and ENSO indices, from the whole ice sheet down to individual drainage basins. Approximately 40% of the ice-mass trend over the GRACE period can be ascribed to increasingly persistent positive SAM forcing which, since the 1940s, is likely due to anthropogenic activity. Similar attribution over 2002-2021 could connect recent ice-sheet change to human activity.

How to cite: King, M., Lyu, K., and Zhang, X.: Climate variability as a major forcing of recent Antarctic ice-mass change, EGU General Assembly 2023, Vienna, Austria, 23–28 Apr 2023, EGU23-9747, https://doi.org/10.5194/egusphere-egu23-9747, 2023.

EGU23-9842 | ECS | Orals | CR3.2

The choice of present-day climate forcing can significantly affect modelled future and past Antarctic Ice Sheet evolution 

Christian Wirths, Johannes Sutter, and Thomas Stocker

Model simulations of past and future Antarctic ice sheet (AIS) evolution depend on the applied climatic forcing. To model the present and future Antarctic ice sheet, several different forcings from regional climate models are available. It is therefore critical to understand the influence and the resulting model differences and uncertainties associated with the choice of present-day reference forcing.  

We apply present-day climatic forcings from regional models (RACMO2.3p2, MAR3.10, HIRHAM5 and COSMO-CLM2) combined with climate anomalies from a global climate model (HadGEM2-ES). With this setup, we investigate the future evolution of the AIS under the RCP2.6, RCP4.5 and RCP8.5 scenarios using the Parallel Ice Sheet Model (PISM). We find substantial differences in the future evolution of the AIS depending on the choice of the present-day reference field even under an extreme scenario such as RCP8.5. We discuss the influence of those forcing choices on the projected future AIS dynamics and sea-level contribution, considering a variety of ice sheet model parameterizations. 

With this analysis, we aim to gain a better understanding of the role of climate forcing choices and parameterization-induced uncertainties of sea-level rise projections. 


How to cite: Wirths, C., Sutter, J., and Stocker, T.: The choice of present-day climate forcing can significantly affect modelled future and past Antarctic Ice Sheet evolution, EGU General Assembly 2023, Vienna, Austria, 23–28 Apr 2023, EGU23-9842, https://doi.org/10.5194/egusphere-egu23-9842, 2023.

EGU23-9904 | Orals | CR3.2

Response of the Greenland Ice Sheet to temperature overshoot scenarios  

Michele Petrini, Heiko Goelzer, Petra Langebroek, Charlotte Rahlves, and Jörg Schwinger

As there is no evidence for the implementation of sufficiently ambitious global CO2 emission reductions, it is very unlikely that we will be able to keep the global mean warming at the end of the century below the 1.5 C limit set in the Paris Agreement. However, the development of CO2 removal techniques could potentially allow us to reach the 1.5 C target after a period of temperature overshoot, by offsetting past and current high levels of emissions with net-negative emissions in the future. To assess the effectiveness and the risks associated to such mitigation options, we need to better understand the impact of temperature overshoot scenarios on various components of the Earth System.  

Here, we focus on the Greenland Ice Sheet. We force an ice-sheet model (CISM2) with Surface Mass Balance (SMB) from an ensemble of 400 years-long idealized overshoot simulations, carried out with the Norwegian Earth System Model NorESM2. The SMB, which is calculated in NorESM2 using an energy balance scheme at multiple elevation classes, is downscaled during runtime to the ice-sheet model grid, thus allowing to account explicitly for the SMB-height feedback. In this presentation, we will assess the sea-level contribution of the Greenland Ice Sheet for overshoot pathways, compared to reference pathways without overshoot. Moreover, we will assess the impact of individual processes, such as the SMB-height feedback and the ocean-driven mass loss at marine-terminating margins, on the sea-level contribution of the Greenland Ice Sheet.  

How to cite: Petrini, M., Goelzer, H., Langebroek, P., Rahlves, C., and Schwinger, J.: Response of the Greenland Ice Sheet to temperature overshoot scenarios , EGU General Assembly 2023, Vienna, Austria, 23–28 Apr 2023, EGU23-9904, https://doi.org/10.5194/egusphere-egu23-9904, 2023.

EGU23-10165 | Orals | CR3.2

Competing climate feedbacks of ice sheet freshwater discharge in a warming world 

Dawei Li, Robert DeConto, and David Pollard

Earth's polar ice sheets are projected to undergo significant retreat in the coming centuries if anthropogenic warming were to continue unabated, injecting freshwater stored on land over millennia into oceans and raise the global mean sea level. Ice sheet freshwater flux alters the status of ocean stratification and ocean-atmosphere heat exchange, inducing oceanic surface cooling and subsurface warming, hence an impact on the global climate. How the climate effects of ice sheet freshwater would feedback to influence the retreat of ice sheets, however, remains unsettled. Here we develop a two-way coupled climate-ice sheet modeling tool to assess the interactions between retreating polar ice sheets and the climate, considering a variety of greenhouse gas emission scenarios and modeled climate sensitivities. Results from coupled ice sheet-climate modeling show that ice sheet-ocean interactions give rise to multi-centennial oscillations in ocean temperatures around Antarctica, which would make it challenging to isolate anthropogenic signals from observational data. Future projections unveil both positive and negative feedbacks associated with freshwater discharge from the Antarctic Ice Sheet, while the net effect is scenario-dependent. The West Antarctic Ice Sheet collapses in high-emission scenarios, but the process is slowed significantly by cooling induced by ice sheet freshwater flux.

How to cite: Li, D., DeConto, R., and Pollard, D.: Competing climate feedbacks of ice sheet freshwater discharge in a warming world, EGU General Assembly 2023, Vienna, Austria, 23–28 Apr 2023, EGU23-10165, https://doi.org/10.5194/egusphere-egu23-10165, 2023.

EGU23-10204 | ECS | Orals | CR3.2

Parameter ensemble simulations of the North American and Greenland ice sheets and climate of the Last Glacial Maximum with Famous-BISICLES 

Sam Sherriff-Tadano, Niall Gandy, Ruza Ivanovic, Lauren Gregoire, Jonathan Owen, Charlotte Lang, Jonathan Gregory, Robin Smith, and Tamsin Edwards
Testing the ability of climate-ice sheet coupled models to simulate past ice sheets and climates can provide a way to evaluate the models. One example is the Last Glacial Maximum (LGM), when huge ice sheets covered the Northern Hemisphere, especially over the North America. Here, we perform 200 ensemble member simulations of the North American and Greenland ice sheets and climate of the LGM with an ice sheet-atmosphere-slab ocean coupled model Famous-BISICLES. 16 parameters associated with climate and ice dynamics are varied. The simulated results are evaluated against the LGM global temperature, the total ice volume and the ice extent at the southern margin of the North American ice sheet. In the ensemble simulations, the global temperature is controlled by the combination of precipitation efficiency in the large-scale condensation and entrainment rate in the cumulus convection. Under reasonable LGM global temperature, we find that the surface albedo and Weertman coefficient in the basal sliding law control the North American ice volume. In contrast, the ice volume of Greenland is found to be controlled by the Weertman coefficient. Based on the constraints, the model produces 6 good simulations with reasonable global temperature and North American ice sheet. We also find that warm summer surface temperature biases at the ice sheet interior as well as downscaling of surface mass balance based on altitude can cause strong local ice melting. This implies the need of better representing the atmospheric conditions and surface mass balance in the ice sheet interior.

How to cite: Sherriff-Tadano, S., Gandy, N., Ivanovic, R., Gregoire, L., Owen, J., Lang, C., Gregory, J., Smith, R., and Edwards, T.: Parameter ensemble simulations of the North American and Greenland ice sheets and climate of the Last Glacial Maximum with Famous-BISICLES, EGU General Assembly 2023, Vienna, Austria, 23–28 Apr 2023, EGU23-10204, https://doi.org/10.5194/egusphere-egu23-10204, 2023.

EGU23-10231 | ECS | Orals | CR3.2

The effect of an evolving Greenland ice sheet in NorESM2 projections 

Konstanze Haubner, Heiko Goelzer, Petra Langebroek, and Andreas Born

The Greenland ice sheet's mass loss is increasing and so is its impact to the climate system. Yet, Earth System models mostly keep ice sheets at a constant extent or treat interactions with the ice sheets fairly simple.

Here, we present the first simulations of NorESM2 coupled to the ice sheet model CISM over Greenland. We compare NorESM2 simulations from 1850 to 2300 with and without an evolving ice sheet over Greenland based on the ssp585 scenario and its extension to 2300. Ocean and atmosphere horizontal resolution are on 1deg, while the coupled ice sheet module CISM is running on 4km. The coupling setup is based on CESM2. Ice extent and elevation are provided to the atmosphere every 5years and the land model every year. Whereas the ice sheet receives updated surface mass balance every year.
We show the evolution of the Greenland ice sheet and changes in atmosphere, ocean and sea ice.

Overall global mean surface air temperatures (SAT) change from 14°C to 24°C by 2300 with the steepest increase between 2070-2200.
Over the Southern ocean and Antarctica, SAT are increasing by 10°C, while over the Northern hemisphere we see a change of 15-28°C by 2300. 
At the end of the simulations (year 2300), SAT over Greenland are 6°C warmer when including an evolving ice sheet. In contrast, the ocean surrounding Greenland shows SAT that are 2°C colder in the coupled system, compared to the simulation with a fixed Greenland ice sheet. Sea surface temperatures show the same ~2°C difference around Greenland in coupled and uncoupled simulation. The overall change in sea surface temperatures is 12°C.
Minimum and maximum sea ice extent differs only slightly with and without the coupling, indicating that the overall warming seems to dictate speed of the sea ice retreat.

How to cite: Haubner, K., Goelzer, H., Langebroek, P., and Born, A.: The effect of an evolving Greenland ice sheet in NorESM2 projections, EGU General Assembly 2023, Vienna, Austria, 23–28 Apr 2023, EGU23-10231, https://doi.org/10.5194/egusphere-egu23-10231, 2023.

The mid-Pleistocene Transition (MPT) from 41 kyr to 100 kyr glacial cycles was one of the largest changes in the Earth system over the past 2 million years. The transition happened in the absence of a relevant change in orbital forcing. As such, it presents a challenge for the Milankovitch theory of glacial cycles. A change from a low to high friction bed under the North American Ice Complex through the removal of pre-glacial regolith has been hypothesized to play a critical role in the transition. For testing, this hypothesis requires constraint on pre-glacial regolith cover and topography as well as mechanistic constraint on whether the appropriate amount of regolith can be removed from the required regions to enable MPT occurrence at the right time. To date, however, Pleistocene regolith removal has not been simulated for a realistic, 3D North American ice sheet fully resolving relevant basal processes. A further challenge is very limited constraints on pre-glacial bed elevation and sediment thickness.

Herein, we address these challenges with an appropriate computational model and ensemble-based analysis addressing parametric and initial mean sediment cover uncertainties. We use the 3D Glacial Systems Model that incorporates relevant glacial processes. Specifically, it includes: 3D thermomechanically coupled hybrid SIA/SSA ice physics, fully coupled sediment production and transport, subglacial linked-cavity and tunnel hydrology, isostatic adjustment from dynamic loading and erosion, and climate from a 2D non-linear energy balance model and glacial index. The sediment model includes quarrying and abrasion for sediment production with both englacial and subglacial transport. The coupled system is driven only by atmospheric CO2 and insolation.

We show that the ice, climate, and sediment processes encapsulated in this fully coupled glacial systems model enables capture of the evolution of the Pleistocene North American glacial system. Specifically and within observational uncertainty, our model captures: the shift from 41 to 100 kyr glacial cycles, early Pleistocene extent, LGM ice volume, deglacial ice extent, and the broad present-day sediment distribution. We also find that pre-glacial sediment thickness and topography have a strong influence on the strength and duration of early Pleistocene glaciations.

How to cite: Drew, M. and Tarasov, L.: The pre-Pleistocene North American bed from coupled ice-climate-sediment physics and its strong influence on glacial cycle evolution, EGU General Assembly 2023, Vienna, Austria, 23–28 Apr 2023, EGU23-10318, https://doi.org/10.5194/egusphere-egu23-10318, 2023.

EGU23-10677 | Orals | CR3.2 | Highlight

Impacts of regional sea-level changes due to GRD effects on multi-centennial projections of Antarctic Ice Sheet under the ISMIP6-2300 experimental protocol  

Holly Han, Matt Hoffman, Xylar Asay-Davis, Trevor Hillebrand, and Mauro Perego

Evolution of ice sheets contribute to sea-level change globally by exchanging mass with the ocean, and regionally by causing the solid Earth deformation and perturbation of the Earth’s rotation and gravitational field, so-called “gravitational, rotational and deformational (GRD) effects”. In the last decade, much work has been done to establish the importance of coupling GRD effects particularly in modeling of marine-based ice sheets (e.g., West Antarctic Ice Sheet; WAIS) to capture the interactions between ice sheets, sea level and the solid Earth at the grounding lines. However, coupling of GRD effects has not yet been done widely within the ice-sheet modeling community; for example, GRD effects were not included in any of the ice sheet models that contributed to the most recent recent ice-sheet model intercomparison through 2100 (Ice Sheet Model Intercomparison Project for CMIP6: ISMIP6-2100; Serrousi et al., 2020) cited by the latest IPCC AR6 report.

In this work, we couple the US Department of Energy’s MPAS-Albany Land Ice model (which was one of the models that participated in the ISMIP6-2100 project) to a 1D sea-level model and perform coupled simulations of Antarctica under the new ISMIP6-2300 protocol in which climate forcing is extended beyond 2100 to 2300. Comparing to the standalone ice-sheet simulations with fix bed topography without GRD effects, the results from our coupled simulations show multi-decadal to centennial-scale delays in the retreat of the Thwaites glacier in the West Antarctica. Our results further suggest that the strength of the negative feedback of sea-level changes on the WAIS retreat becomes weaker as the strength of the applied forcing increases, implying the pertinence of our commitment to limiting greenhouse gas emissions. In addition, within our coupled ice sheet-sea level modeling frame, we introduce a new workflow work in which the ISMIP6 protocol-provided ocean thermal forcing is re-extrapolated based on the updated ocean bathymetry. Our preliminary results indicate that bedrock uplift due to ice mass loss can block the bottom warm ocean, providing additional negative feedback, but also can block cold water when/if the vertical ocean temperature profile gets inverted due to climate change (e.g., as represented in the UKESM model - SSP585 scenario results).

How to cite: Han, H., Hoffman, M., Asay-Davis, X., Hillebrand, T., and Perego, M.: Impacts of regional sea-level changes due to GRD effects on multi-centennial projections of Antarctic Ice Sheet under the ISMIP6-2300 experimental protocol , EGU General Assembly 2023, Vienna, Austria, 23–28 Apr 2023, EGU23-10677, https://doi.org/10.5194/egusphere-egu23-10677, 2023.

EGU23-11678 | ECS | Posters on site | CR3.2

Antarctic ice sheet response to AMOC shutdowns during the penultimate deglaciation 

Maxence Menthon, Pepijn Bakker, Aurélien Quiquet, and Didier M. Roche

According to geological records, the sea level during the Last Interglacial (∼ 129–116 ka) peaked 6 to 9 m higher than during the pre-industrial with a major contribution from the Antarctic ice sheet (Dutton et al. 2015). According to Clark et al. 2020, a longer period of reduced Atlantic Meridional Overturning Circulation (AMOC) during the penultimate deglaciation compared to the last deglaciation could have led to greater subsurface warming and subsequent larger Antarctic Ice Sheet retreat.

Here we study the response of the Antarctic ice sheet to climate forcing with a forced AMOC shutdown at different timing and duration during the penultimate deglaciation (∼ 138–128 ka). The simulations are done with the Earth System Model of Intermediate Complexity iLOVECLIM (Roche et al. 2014) and the ice sheet model GRISLI (Quiquet et al. 2018), using the recently implemented sub-shelf melt module PICO (Reese et al. 2018). In the present simulations the GRISLI is forced with the iLOVECLIM simulations and is a step towards a fully coupled climate - ice sheet set up to take into account the climate - ice sheet interactions in a physical way.

We hypothesize that both the duration and timing of reduced AMOC can significantly affect the sensitivity of the Antarctic Ice Sheet. A longer period of AMOC reduction will lead to a larger subsurface warming in the Southern Ocean and subsequently a larger ice sheet retreat. On the other hand, an AMOC reduction earlier (later) in the deglaciation implies that the ice sheet that is affected by this subsurface warming is still fairly large (already small). We will discuss both the individual as well as combined effect of duration and timing on the ice sheet evolution.

How to cite: Menthon, M., Bakker, P., Quiquet, A., and Roche, D. M.: Antarctic ice sheet response to AMOC shutdowns during the penultimate deglaciation, EGU General Assembly 2023, Vienna, Austria, 23–28 Apr 2023, EGU23-11678, https://doi.org/10.5194/egusphere-egu23-11678, 2023.

EGU23-11845 | ECS | Orals | CR3.2

An Adimensional Ice-Sheet-Climate Model for glacial cycles 

Sergio Pérez-Montero, Jorge Alvarez-Solas, Alexander Robinson, and Marisa Montoya

Although the ultimate trigger of glacial cycles is Milankovitch insolation cycles, there are still uncertainties concerning their timing and transitions. These unknowns are believed to be due to intrinsic nonlinearities in the climate system, and there is a deep interest in their solution. However, the longer timescales involved make it infeasible to use comprehensive climate models because of the large computational cost involved. In this context, conceptual models are built to mimic complex processes in a simpler, computationally efficient way. Here we present an adimensional ice-sheet–climate model (AMOD), which aims to study these outstanding paleoclimatic topics. AMOD represents ice sheet dynamics by using common assumptions as in state-of-the-art ice-sheet models, adapted to its dimensionless nature, and it solves surface mass balance processes and the aging of snow and ice. In this way, AMOD is able to run several glacial cycles in seconds and produces results comparable to those of paleoclimatic proxies. Preliminary results indicate nonlinearities related to both ice dynamics and snow aging that determine the timing and shape of deglaciations.

How to cite: Pérez-Montero, S., Alvarez-Solas, J., Robinson, A., and Montoya, M.: An Adimensional Ice-Sheet-Climate Model for glacial cycles, EGU General Assembly 2023, Vienna, Austria, 23–28 Apr 2023, EGU23-11845, https://doi.org/10.5194/egusphere-egu23-11845, 2023.

EGU23-12206 | ECS | Orals | CR3.2

The Glacier-climate Interaction over the High-Mountain Asia during the Last Glacial Maximum 

Qiang Wei, Yonggang Liu, Yongyun Hu, and Qing Yan

Glacier advances affect the local climate, and in turn, can either promote or prohibit its own growth. Such feedback has not been considered in modeling the High-Mountain Asia (HMA) glaciers during the Last Glacial Maximum (LGM; ~28-23 ka), which may contribute to the large spread in some of the published modeling work, with some notable discrepancy with existing reconstruction data. By coupling an ice sheet model (ISSM) with a climate model (CESM1.2.2), we find that the total glacial area is reduced by 10% due to the glacier-climate interaction; glacier growth is promoted along the western rim of HMA, and yet reduced in the interior. Such changes in spatial pattern improve model-data comparison. Moreover, the expansion of glaciers causes an increase in the winter surface temperature of the eastern Tibetan Plateau by more than 2 K, and a decrease of precipitation almost everywhere, especially the Tarim basin, by up to 60%. These changes are primarily due to the increase in surface elevation, which blocks the water vapor brought by westerlies and southwesterlies, reducing precipitation and increasing surface temperatures to the east and northeast of the newly grown glaciers.

How to cite: Wei, Q., Liu, Y., Hu, Y., and Yan, Q.: The Glacier-climate Interaction over the High-Mountain Asia during the Last Glacial Maximum, EGU General Assembly 2023, Vienna, Austria, 23–28 Apr 2023, EGU23-12206, https://doi.org/10.5194/egusphere-egu23-12206, 2023.

The Greenland ice sheet comprises a volume of 7.4 m sea level equivalent and is losing mass rapidly as a result of global warming. It is widely thought that the ice sheet will exhibit tipping behaviour in a warmer climate. In other words, due to ice sheet – climate feedbacks (some of) its contribution to sea level rise may become irreversible once critical thresholds are crossed. This would severely affect the increasing number of people living in low-lying coastal areas worldwide. However, the current understanding of such thresholds and tipping behaviour is very limited, because most modelling studies up to date do not include (local) interactions or feedbacks between the ice sheet (topography and ice extent) and other climate system components (surface mass balance and atmosphere).

To investigate the irreversibility of Greenland’s ice mass loss and the associated processes, we coupled our high-resolution Greenland Ice Sheet Model (GISM) with a renowned high-resolution regional climate model, the Modèle Atmosphérique Régional (MAR). The two-way coupling between both models provides a (more) realistic representation of (local) ice sheet – climate interactions for future ice sheet simulations.

Like all regional climate models, MAR needs 6 hourly atmospheric forcing from a global climate model (GCM). Several coupled model runs with forcing from different GCMs are envisioned over the coming months and years. As they are computationally intensive, simulations up to the end of the century and beyond take several weeks to a few months to complete.

The poster will present the preliminary results from our first coupled model run in an envisioned series of experiments: a two-way coupled MAR-GISM run forced by the IPSL-CM6 6 hourly output, which is available up to 2300. For this timescale, our coupled models can still be run in fully interactive mode, which means the information (surface mass balance and ice sheet extent/topography) between both models can be exchanged on a yearly basis. In addition to its long duration, the IPSL forcing is of particular interest as it is on the high end of the CMIP6 model ensemble projections regarding warming over Greenland. We thus expect the experiment to provide valuable insights regarding Greenland’s potential contribution to future sea-level rise and the associated ice sheet – climate interactions or feedbacks.  

How to cite: Paice, C. M., Fettweis, X., and Huybrechts, P.: Quantifying the response of the Greenland ice sheet in a high-end scenario until 2300 from a coupled high-resolution regional climate and ice sheet model, EGU General Assembly 2023, Vienna, Austria, 23–28 Apr 2023, EGU23-12281, https://doi.org/10.5194/egusphere-egu23-12281, 2023.

EGU23-13350 | Orals | CR3.2

Large effects of ocean circulation change on Greenland ice sheet mass loss 

Miren Vizcaino, Julia Rudlang, Laura Muntjewerf, Sotiria Georgiou, Raymond Sellevold, and Michele Petrini

The Greenland ice sheet (GrIS) is currently losing mass at an accelerated rate, due to atmospheric and ocean warming causing respectively enhanced melt and ice discharge to the ocean. A large part of the uncertainty on future GrIS contribution to sea level rise relates to unknown atmospheric and ocean circulation change. For the later, AR6 models project a weakening of the North Atlantic Meridional Overturning Circulation (NAMOC) during the 21st century. The magnitude of this weakening depends on the greenhouse gas scenario and model, but none of the models project a complete collapse.

Projections of future GrIS evolution in the last IPCC report AR6 are mostly based on simulations with ice sheet models forced with the output of climate models (e.g., Goelzer et al. (2020)). This method permits large ensembles of simulations, however the coupling between climate and GrIS is not represented. Here, we use a coupled Earth System and Ice Sheet Model (ESM-ISM), the CESM2-CISM2 (Muntjewerf et al. 2021) to examine the multi-millennial evolution of the GrIS surface mass balance for a middle-of-the-road CO2 scenario. The model couples realistic simulation of global climate (Danabasoglu et al. 2020), surface processes (van Kampenhout et al. 2020) and ice dynamics (Lipscomb et al. 2019). We use an idealized scenario of 1% CO2 increase until stabilization at two times pre-industrial values.  compare our results with pre-industrial and 1% to 4xCO2 simulations (Muntjewerf et al. 2020).

We find small increases and even reduction of annual temperatures in the GrIS area in connection with strong NAMOC weakening in the first two centuries of simulation. Summer temperatures and surface melt increase moderately with respect to pre-industrial. From simulation year 500, the NAMOC recovers, resulting in strong increases in GrIS melt rates and contribution to sea level rise. We compare the deglaciation pattern over a period of 3,000 years with deglaciation simulations with the same model for the last interglacial (Sommers et al. 2021).


How to cite: Vizcaino, M., Rudlang, J., Muntjewerf, L., Georgiou, S., Sellevold, R., and Petrini, M.: Large effects of ocean circulation change on Greenland ice sheet mass loss, EGU General Assembly 2023, Vienna, Austria, 23–28 Apr 2023, EGU23-13350, https://doi.org/10.5194/egusphere-egu23-13350, 2023.

EGU23-13907 | ECS | Orals | CR3.2

First results of RACMO2.4: A new model version with updated surface and atmospheric processes 

Christiaan van Dalum and Willem Jan van de Berg

In recent years, considerable progress in surface and atmospheric physics parameterizations has been made by the scientific community that could benefit regional climate modelling of polar regions. Therefore, we developed a major update to the Regional Atmospheric Climate Model, referred to as RACMO2.4, that includes several new and updated parameterizations. Most importantly, the surface and atmospheric processes from the European Center for Medium-Range Weather Forecasts (ECMWF) Integrated Forecast System (IFS), which are embedded in RACMO, are updated to cycle 47r1. This includes, among other changes, updates in the cloud, aerosol and radiation scheme, a new lake model, and a new multilayer snow module for non-glaciated regions. Furthermore, a new spectral albedo and radiative transfer scheme in snow scheme, which has been introduced and evaluated in a previous, yet inoperative version, is now operational. Here, we shortly introduce the aforementioned changes and present the first results of RACMO2.4 for several domains, particularly of the Greenland ice sheet.

How to cite: van Dalum, C. and van de Berg, W. J.: First results of RACMO2.4: A new model version with updated surface and atmospheric processes, EGU General Assembly 2023, Vienna, Austria, 23–28 Apr 2023, EGU23-13907, https://doi.org/10.5194/egusphere-egu23-13907, 2023.

EGU23-14088 | Posters on site | CR3.2

Reconstructing the Greenland ice sheet in past warm climates 

Christine S. Hvidberg, Mikkel Lauritzen, Nicholas M. Rathmann, Anne M. Solgaard, and Dorthe Dahl-Jensen

The stability of the Greenland ice sheet through past glacial-interglacial cycles provides knowledge that can contribute to understanding the future mass loss and contribution to sea level from the Greenland ice sheet in a warmer climate. Paleo-climatic records from ice cores provide constraints on the past climate and ice sheet thickness in Greenland through the current interglacial, the Holocene, 11.7 kyr to present, but is limited to a few ice cores from the central areas. In the previous interglacial period, the Eemian, 130 kyr to 110 kyr before present, the ice core constraints are sparse, and beyond the Eemian, the climate evolution is known from Antarctic ice cores and marine sediments. The limited constraints on the past climate in Greenland presents a challenge for reconstructions based on ice flow modelling. Here we present initial results from an ice flow modelling study using the PISM ice flow model to simulate the evolution of the Greenland ice sheet in the Eemian and the Holocene periods. We discuss how paleo-climatic data from ice cores and marine sediments can be combined with ice flow modelling. We find that the Greenland ice sheet retreated to a minimum volume of up to ∼1.2 m sea-level equivalent smaller than present in the early or mid-Holocene, and that the ice sheet has continued to recover from this minimum up to present day. In all our runs, the ice sheet is approaching a steady state at the end of the 20th century. Our studies show that the Greenland ice sheet evolves in response to climate variations on shorter and longer timescales, and that assessment of future mass loss must take into account the history and current state.

How to cite: Hvidberg, C. S., Lauritzen, M., Rathmann, N. M., Solgaard, A. M., and Dahl-Jensen, D.: Reconstructing the Greenland ice sheet in past warm climates, EGU General Assembly 2023, Vienna, Austria, 23–28 Apr 2023, EGU23-14088, https://doi.org/10.5194/egusphere-egu23-14088, 2023.

EGU23-14236 | ECS | Orals | CR3.2

Sensitivity of future projections of ice sheet retreat to initial conditions 

Tijn Berends, Jorjo Bernales, Caroline van Calcar, and Roderik van de Wal

Both the Greenland and Antarctic ice sheets are expected to experience substantial mass loss in the case of unmitigated anthropogenic climate change. The exact rate of future mass loss under high warming scenarios remains uncertain, depending strongly on physical quantities that are difficult to constrain from observations, such as basal sliding and sub-shelf melt. We apply a novel model initialisation protocol, that combines elements from existing approaches such as the equilibrium spin-up, basal inversion, and palaeo spin-up, to models of both the Greenland and Antarctic ice sheets. We show the results in term of sea-level projections including the uncertainties, under different warming scenarios, following the ISMIP6 protocol.

This abstract is a companion to “On the initialisation of ice sheet models: equilibrium assumptions, thermal memory, and present-day states” by Bernales et al. We hope that, if both abstracts are lucky enough to be accepted, the conveners can program the two talks in sequence.

How to cite: Berends, T., Bernales, J., van Calcar, C., and van de Wal, R.: Sensitivity of future projections of ice sheet retreat to initial conditions, EGU General Assembly 2023, Vienna, Austria, 23–28 Apr 2023, EGU23-14236, https://doi.org/10.5194/egusphere-egu23-14236, 2023.

EGU23-14412 | ECS | Orals | CR3.2

Self-adaptive Laurentide Ice Sheet evolution towards the Last Glacial Maximum 

Lu Niu, Gregor Knorr, Uta Krebs-Kanzow, Paul Gierz, and Gerrit Lohmann

Northern Hemisphere summer insolation is regarded as a main control factor of glacial-interglacial cycles. However, internal feedbacks between ice sheets and other climate components are non-negligible. Here we apply a state-of-the-art Earth system model (AWI-ESM) asynchronously coupled to the ice sheet model PISM, focusing on the period when ice sheet grows from an intermediate state (Marine isotope stage 3, around 38 k) to a maximum ice sheet state (the Last Glacial Maximum). Our results show that initial North American ice sheet differences at 38 k are erased by feedbacks between atmospheric circulation and ice sheet geometry that modulate the ice sheet development during this period. Counter-intuitively, moisture transported from the North Atlantic warm pool during summer is the main controlling factor for the ice sheet advance. A self-adaptative mechanism is proposed in the development of a fully-grown NA ice sheet which indicates how the Earth system stabilizes itself via interactions between different Earth System components.

How to cite: Niu, L., Knorr, G., Krebs-Kanzow, U., Gierz, P., and Lohmann, G.: Self-adaptive Laurentide Ice Sheet evolution towards the Last Glacial Maximum, EGU General Assembly 2023, Vienna, Austria, 23–28 Apr 2023, EGU23-14412, https://doi.org/10.5194/egusphere-egu23-14412, 2023.

EGU23-14469 | ECS | Orals | CR3.2 | Highlight

Has the (West) Antarctic Ice Sheet already tipped? 

Ronja Reese, Julius Garbe, Emily A. Hill, Benoît Urruty, Kaitlin A. Naughten, Olivier Gagliardini, Gael Durand, Fabien Gillet-Chaulet, G. Hilmar Gudmundsson, David Chandler, Petra M. Langebroek, and Ricarda Winkelmann

Observations of ocean-driven grounding line retreat in the Amundsen Sea Embayment in Antarctica raise the question of an imminent collapse of the West Antarctic Ice Sheet. Here we analyse the committed evolution of Antarctic grounding lines under the present-day climate. To this aim, we run an ensemble of historical simulations with a state-of-the-art ice sheet model to create model instances of possible present-day ice sheet configurations. Then, we extend the simulations to investigate their evolution under constant present-day climate forcing and bathymetry. We test for reversibility of grounding line movement at different stages of the simulations to analyse when and where irreversible grounding line retreat, or tipping, is initiated.

How to cite: Reese, R., Garbe, J., Hill, E. A., Urruty, B., Naughten, K. A., Gagliardini, O., Durand, G., Gillet-Chaulet, F., Gudmundsson, G. H., Chandler, D., Langebroek, P. M., and Winkelmann, R.: Has the (West) Antarctic Ice Sheet already tipped?, EGU General Assembly 2023, Vienna, Austria, 23–28 Apr 2023, EGU23-14469, https://doi.org/10.5194/egusphere-egu23-14469, 2023.

EGU23-14648 | ECS | Orals | CR3.2

On the initialisation of ice sheet models: equilibrium assumptions, thermal memory, and present-day states 

Jorjo Bernales, Tijn Berends, Caroline van Calcar, and Roderik van de Wal

A significant portion of the spread in future projections of ice sheet volume changes is attributed to uncertainties in their present-day state, and the way this state is represented in ice-sheet models. The scientific literature already contains a variety of classic initialisation approaches used by modelling groups around the globe, each with its own advantages and limitations. We propose a generalised protocol that allows for the quantification of the impact of individual initialisation choices, such as steady-state assumptions, the inclusion of internal paleoclimatic thermal signals, sea level and glacial isostatic effects, and calibration methods. We then apply this protocol to an ensemble of multi-millennia model spin-ups of the present-day Greenland and Antarctic ice sheets and show the importance of the choices made during initialisation.

[This abstract is a companion to “Sensitivity of future projections of ice sheet retreat to initial conditions” by Berends et al. We hope that, if both abstracts are lucky enough to be accepted, the conveners can program the two talks in sequence.]

How to cite: Bernales, J., Berends, T., van Calcar, C., and van de Wal, R.: On the initialisation of ice sheet models: equilibrium assumptions, thermal memory, and present-day states, EGU General Assembly 2023, Vienna, Austria, 23–28 Apr 2023, EGU23-14648, https://doi.org/10.5194/egusphere-egu23-14648, 2023.

EGU23-14666 | Orals | CR3.2

Sensitivity of of coupled climate and ice sheet of modern Greenland to atmospheric, snow and ice sheet parameters 

Charlotte Lang, Tamsin Edwards, Jonathan Owen, Sam Sherriff-Tadano, Jonathan Gregory, Ruza Ivanovic, Lauren Gregoire, and Robin S. Smith

As part of a project working to improve coupled climate-ice sheet modelling by studying the response of ice sheets to changes in climate across different periods since the Last Glacial Maximum, we present an analysis of an ensemble of coupled climate and ice sheet simulations of the modern Greenland using the FAMOUS-BISICLES model and statistical emulation.

FAMOUS-BISICLES, a variant of FAMOUS-ice (Smith et al., 2021a), is a low resolution (7.5°X5°) global climate model that is two-way coupled to a higher resolution (minimum grid spacing of 1.2 km) adaptive mesh ice sheet model, BISICLES. It uses a system of elevation classes to downscale the lower resolution atmospheric variables onto the ice sheet grid and calculates surface mass balance using a multilayer snow model. FAMOUS-ice is computationally affordable enough to simulate the millennial evolution of the coupled climate-ice sheet system as well as to run large ensembles of simulations. It has also been shown to simulate Greenland well in previous work using the Glimmer shallow ice model (Gregory et al., 2020).

The ice sheet volume and area are sensitive to a number of parametrisations related to atmospheric and snow surface processes and ice sheet dynamics. Based on that, we designed a perturbed parameters ensemble using a Latin Hypercube sampling technique and ran simulations with climate forcings appropriate for the late 20th century.

Gaussian process emulation allows us explore parameter space in a more systematic and faster way than with more complex earth system models and make predictions at input parameter values that are not evaluated in the simulations. We find that the mass balance is most correlated to three parameters:

  • n, the exponent in Glen’s flow law, and beta, the coefficient of the basal drag law, both influencing the amount of ice lost through discharge
  • rho_threshold, a parameter setting the minimum value the dense firn albedo can possibly reach

Finally, using a history matching approach, we built an implausibility metric (based on surface mass balance, ice volume loss, near-surface and sea-surface temperature) to identify the regions of the parameter space that produce plausible runs.

How to cite: Lang, C., Edwards, T., Owen, J., Sherriff-Tadano, S., Gregory, J., Ivanovic, R., Gregoire, L., and Smith, R. S.: Sensitivity of of coupled climate and ice sheet of modern Greenland to atmospheric, snow and ice sheet parameters, EGU General Assembly 2023, Vienna, Austria, 23–28 Apr 2023, EGU23-14666, https://doi.org/10.5194/egusphere-egu23-14666, 2023.

EGU23-15230 | Posters on site | CR3.2

Antarctic RINGS to characterize the Antarctic Ice Sheet coastal zone and Antarctic contribution to the global sea-level rise 

Kenichi Matsuoka, Xiangbin Cui, Fausto Ferraccioli, Rene Forsberg, Tom Jordan, Felicity McCormack, Geir Moholdt, and Kirsty Tinto and the Antarctic RINGS

Regions where the Antarctic Ice Sheet reaches the coast are fundamental to our understanding of the linkages between Antarctica and the global climate system. These coastal regions contain multiple potential tipping points for the Antarctic Ice Sheet in the ongoing 2oC warming world, which must be better understood to predict future sea-level rise. The Antarctic Ice Sheet constitutes the largest uncertainty source in future sea-level projections, and this uncertainty is mainly rooted in poorly known bed topography under the ice sheet. Bed topography matters the most in the coastal regions as it controls the stability of the ice sheet. Together with an overview of the current multidisciplinary understandings of the Antarctic coastal regions, we present ensemble analysis of published datasets to present data and knowledge gaps, and their regional distribution is discussed in the context of ice-sheet evolution and instability. Finally, we identify outstanding science priorities and discuss protocols of airborne surveys to develop a comprehensive dataset uniformly all-around Antarctica.

How to cite: Matsuoka, K., Cui, X., Ferraccioli, F., Forsberg, R., Jordan, T., McCormack, F., Moholdt, G., and Tinto, K. and the Antarctic RINGS: Antarctic RINGS to characterize the Antarctic Ice Sheet coastal zone and Antarctic contribution to the global sea-level rise, EGU General Assembly 2023, Vienna, Austria, 23–28 Apr 2023, EGU23-15230, https://doi.org/10.5194/egusphere-egu23-15230, 2023.

EGU23-15361 | ECS | Posters virtual | CR3.2

Sea ice extent and subsurface temperatures in the Labrador Sea across Heinrich events during MIS 3 

Henrieka Detlef, Mads Mørk Jensen, Rasmus Andreasen, Marianne Glasius, Marit-Solveig Seidenkrantz, and Christof Pearce

Heinrich events associated with millennial-scale climate oscillations during the last glacial period are prominent events of ice-sheet collapse, characterized by the dispersal of ice(berg) rafted debris and freshwater across the North Atlantic. Hudson Strait has been suggested as one of the predominant iceberg source regions. One potential mechanism triggering iceberg release invokes cryosphere-ocean interactions, where subsurface warming destabilizes the Laurentide ice sheet. Subsurface warming is facilitated by the expansion of sea ice in the Labrador Sea in combination with a slow down of the Atlantic Meridional Overturning Circulation, which prevents the release and downward mixing of heat in the water column.

Here we present high-resolution reconstructions of sea ice dynamics in the outer Labrador Sea at IODP Site U1302/03 between 30 ka and 60 ka. Sea ice reconstructions are based on a suite of sympagic and pelagic biomarkers, including highly branched isoprenoids and sterols. The results suggest a transition from reduced/seasonal to extended/perennial sea ice conditions preceding the onset of iceberg rafting associated with Heinrich event 3, 4, 5, and 5a by ~0.9 ± 0.5 ka. Ongoing work on the same core and sample material will have to confirm the timing and extent of subsurface warming compared to sea ice advances. 

How to cite: Detlef, H., Mørk Jensen, M., Andreasen, R., Glasius, M., Seidenkrantz, M.-S., and Pearce, C.: Sea ice extent and subsurface temperatures in the Labrador Sea across Heinrich events during MIS 3, EGU General Assembly 2023, Vienna, Austria, 23–28 Apr 2023, EGU23-15361, https://doi.org/10.5194/egusphere-egu23-15361, 2023.

EGU23-16930 | ECS | Orals | CR3.2 | Highlight

Multistability and transient response of the Greenland ice sheet to anthropogenic CO2 emissions 

Dennis Höning, Matteo Willeit, and Andrey Ganopolski

Ongoing CO2 emissions into the atmosphere and associated temperature rise have dramatic consequences for the ice sheets on our planet. In this presentation, we focus on the Greenland ice sheet, which holds so much ice that a complete melting would cause the global sea level to rise by seven meters. However, a prediction of future mass loss of the Greenland ice sheet is challenging because it is a strongly non-linear function of temperature and occurs over very long timescales. With the fully coupled Earth system model of intermediate complexity CLIMBER-X, we study the stability of the Greenland ice sheet and its transient response to CO2 emissions over the next 20 kyr. We find two bifurcation points within a global mean surface air temperature anomaly of 1.5°C. Each of these bifurcation points corresponds to a critical ice volume. If the Greenland ice sheet volume decreases below these critical values, returning to a previous atmospheric CO2 concentration would not cause the ice sheet to grow back to its previous state. We also find increased mass loss rates and increased sensitivity of mass loss to cumulative CO2 emission in the vicinity of these critical ice volumes. Altogether, our results suggest that global warming near the lower 1.5°C limit of the Paris agreement would already cause the Greenland ice sheet to irreversibly melt, although a complete melting would take thousands of years.

How to cite: Höning, D., Willeit, M., and Ganopolski, A.: Multistability and transient response of the Greenland ice sheet to anthropogenic CO2 emissions, EGU General Assembly 2023, Vienna, Austria, 23–28 Apr 2023, EGU23-16930, https://doi.org/10.5194/egusphere-egu23-16930, 2023.

The Eocene-Oligocene transition (EOT) is the turning point of Earth’s Cenozoic climate, during which it stepped into the current “icehouse” state. The absence of a high-resolution, global, evolutionary timeline has limited understanding of the linkages between marine biodiversity and this environmental change. Here, we present a new 28-Myr-long foraminiferal species-richness history with an average temporal resolution of ~26 kyr based on a global dataset and quantitative stratigraphic method, CONOP. A significant richness decline accompanied the EOT, eliminating a great number of foraminifera species. The extinction events in planktonic foraminiferal (PF) and larger benthic foraminiferal (LBF) near the EOT appear to be associated with the combination of a rapid decrease in deep ocean temperature, a eustatic sea-level fall and a positive carbon isotopic excursion. In contrast, the much longer richness decline of small benthic foraminifera (SBF) across the EOT occurred in two phases: the first coincided with turnover of marine primary producers, and the second appears to have been temporally coincident with Afar-Arabian LIP activity, which led to expansion of oceanic anoxia and euxinia. Thus, mega-climatic changes are reflected in the species richness of foraminifera during the Eocene-Oligocene “warmhouse-icehouse” transition.

How to cite: Lu, Z. and Fan, J.: Coupled patterns of foraminiferal species richness and mega-climatic change across the Eocene-Oligocene transition, EGU General Assembly 2023, Vienna, Austria, 23–28 Apr 2023, EGU23-1832, https://doi.org/10.5194/egusphere-egu23-1832, 2023.

EGU23-1833 | Posters on site | NP3.1 | Highlight

Coral record from Bicol in the Philippines in 1770-1850 reveals volcanic cooling 

Hodaka kawahata, Mayuri Inoue, Mutsumi Chihara, Fernando P. Siringan, and Atsuhi Suzuki

Historical variations of surface temperature in relation to anthropogenic warming has been extensively studied to understand and explain changes in the contemporary climate and to estimate future impacts of climate.Inoue and others (in press) reported 228-year records of SST and salinity based on Sr/Ca and d18O analyses with monthly time resolution in Porites coral collected from Bicol, the south of Luzon, Philippines. From the record, we investigated the relationship between the reconstructed temperature and the volcanic eruptions in late 18th and early 19th centuries. There were three great famines during the Edo period (1603-1868), almost corresponding to the Little Ice Age in Japan. Of these, the two were Tenmei-famine in 1782-88 and Tempo-famine in 1833-1837(1839). Both famines killed more than one million people out of a population of 30 million at the time. Our reconstructed SST anomaly fluctuated between -1.5 degree and 1.0 degree. The age model may have the age error of 1 to 3 years before around 1885. Large minima occurred in 1785-1789, 1815-1819, 1822-25, 1827-1830, 1834-1835, and 1843-45. Although Laki eruption, Iceland in 1783 has not been described as large eruption in previous studies, their impact on climatic conditions around the Northern Hemisphere and the globe was widely reported. Local eruption of Asama, Japan in 1783 released volcanic ash over eastern part of Japanese islands, In addition, El Nino event, which often cooled down Japanese islands, occurred around those days. These factors could have been responsible for the coldest anomaly in 1785-1789 recorded in our coral samples. After Tambora eruption in 1815, sharp cooling of around 2.0˚C was observed in our coral sample and almost all over the world. However, this world-scale cooling event have no or little influence on the climate in Japanese islands based upon the historical documents and agriculture records. This indicates that there are areas that do not become exceptionally cold, even by major volcanic eruptions. Large eruption of Galunggung in 1822 brought appreciable degree of cooling anomaly in our coral record. Just after Agung exploded largely in 1843, reconstructed SST significantly dropped. This might be also influenced by another large eruption of Cosiguina in Nicaragua, central America. Cold climate was reported in Japan, New York in USA, Copenhagen, UK in 1840s. It was most likely global in scale in the northern hemisphere.

How to cite: kawahata, H., Inoue, M., Chihara, M., Siringan, F. P., and Suzuki, A.: Coral record from Bicol in the Philippines in 1770-1850 reveals volcanic cooling, EGU General Assembly 2023, Vienna, Austria, 23–28 Apr 2023, EGU23-1833, https://doi.org/10.5194/egusphere-egu23-1833, 2023.

EGU23-2679 | ECS | Orals | NP3.1

Mechanisms behind ocean variability in transient simulations of the early deglaciation 

Marie-Luise Kapsch, Marlene Klockmann, and Uwe Mikolajewicz

The last deglaciation was accompanied by a gradual warming with superimposed abrupt climate changes. In transient simulations of the last deglaciation with the comprehensive Max Planck Institute Earth System Model (MPI-ESM) we show that the timing and occurrence of abrupt climate changes are highly dependent on the utilized ice-sheet boundary condition. Simulations with different ice-sheet reconstructions show that the variability of North Atlantic surface temperatures are dominated by the timing and amplitude of meltwater fluxes from ice sheets, as derived from reconstructions. While some abrupt climate events (e.g. the Younger Dryas) only occur under certain boundary conditions in the transient simulations, other climate events such as the Bølling Allerød warming (about 14.7-14.2 ka BP) cannot be simulated with any of the applied and widely used reconstructions. However, in a sensitivity experiment with changing ice sheets but no addition of meltwater into the ocean, the North Atlantic experiences a warming during the time of the Bølling-Allerød. This warming is associated with a reorganization of the ocean circulation and deep-water formation sites. Prior to this reorganization, during the glacial and early part of the deglaciation, a rather zonal jet stream maintains a strong subpolar gyre in the North Atlantic. In addition, salty and dense water masses form in the Arctic. Until about 16.5 ka BP the Arctic freshens significantly and the surface elevation over the Laurentide ice sheet reduces. The latter leads to a shift in the atmospheric circulation at around 14.2 ka BP. The resulting changes in wind stress strongly reduce the eastward extent of the North Atlantic subpolar gyre. Here, we examine the physical mechanisms behind the reorganization and explore additional simulations with fixed deglacial key parameters (e.g. CO2, insolation, ice sheets) to identify the key drivers of the climate changes during the early deglaciation and Bølling Allerød.

How to cite: Kapsch, M.-L., Klockmann, M., and Mikolajewicz, U.: Mechanisms behind ocean variability in transient simulations of the early deglaciation, EGU General Assembly 2023, Vienna, Austria, 23–28 Apr 2023, EGU23-2679, https://doi.org/10.5194/egusphere-egu23-2679, 2023.

EGU23-3231 | Orals | NP3.1

Synchronization theory for Pleistocene glacial-interglacial cycles 

Takahito Mitsui, Matteo Willeit, and Niklas Boers

The dominant periodicity of glacial cycles changed from 41 kyr to roughly 100 kyr across the Mid-Pleistocene Transition (MPT) around 1 Myr ago. The mechanisms leading to these dominant periodicities and their changes during the MPT remain debated. We propose a synchronization theory explaining these features of glacial cycles and confirm it using an Earth system model that reproduces the MPT under gradual changes in volcanic CO2 outgassing rate and regolith cover. We show that the model exhibits self-sustained oscillations without astronomical forcing. Before the MPT, glacial cycles synchronize to the 41-kyr obliquity cycles because the self-sustained oscillations have periodicity relatively close to 41 kyr. After the MPT the time scale of internal oscillations becomes too long to follow every 41-kyr obliquity cycle, and the Earth's climate system synchronizes to the 100-kyr eccentricity cycles that modulate the amplitude of climatic precession. The latter synchronization is only possible with the help of the 41-kyr obliquity forcing through a mechanism that we term vibration-enhanced synchronization.

How to cite: Mitsui, T., Willeit, M., and Boers, N.: Synchronization theory for Pleistocene glacial-interglacial cycles, EGU General Assembly 2023, Vienna, Austria, 23–28 Apr 2023, EGU23-3231, https://doi.org/10.5194/egusphere-egu23-3231, 2023.

EGU23-4446 | Posters on site | NP3.1

The Fractional Macro Evolution Model: A simple quantitative scaling macroevolution model 

Shaun Lovejoy and Andrej Spiridinov

Scaling fluctuation analyses of the marine animal diversity, extinction and origination rates based on the Paleobiology Database occurrence data have opened new perspectives on macroevolution, supporting the hypothesis that the environment (climate proxies) and life (extinction and origination rates) are scaling over the “megaclimate” biogeological regime (from ≈ 1 Myr to at least 400Myrs).   In the emerging picture, biodiversity is a scaling “cross-over” phenomenon being dominated by the environment at short time scales and by life at long times scales with a cross-over at ≈40Myrs.  These findings provide the empirical basis for constructing the Fractional MacroEvolution Model (FMEM), a simple stochastic model combining destabilizing and stabilizing tendencies in macroevolutionary dynamics.  The FMEM is driven by two scaling processes: temperature and turnover rates. 

Macroevolution models are typically deterministic (albeit sometimes perturbed by random noises), and based on integer ordered differential equations.  In contrast, the FMEM is stochastic and based on fractional ordered equations.   Stochastic models are natural for systems with large numbers of degrees of freedom and fractional equations naturally give rise to scaling processes. 

The basic FMEM drivers are fractional Brownian motions (temperature, T) and fractional Gaussian noises (turnover rates E+) and the responses (solutions), are fractionally integrated fractional Relaxation processes (diversity (D), extinction (E), origination (O) and E- = O - E).  We discuss the impulse response (itself a model for impulse perturbations such as bolide impacts) and derive the full statistical properties including cross covariances.  By numerically solving the model, we verified the mathematical analysis and compared both uniformly and irregularly sampled model outputs to paleobiology series. 

The six series (T, E+, D, E-, O, E) had fluctuation statistics that varied realistically with time scales Δt (lags) over the observed range (≈3 Myrs to ≈ 400 Myrs).  In addition, the 15 pairwise fluctuation correlations (of the six variables) as functions of Δt were also very close to observations even though only two correlations were specified in the model (TE+and TD).  The ability to simulate the effects of irregular temporal sampling was important since model – data agreement was much better with realistic (irregular) sampling than with uniform sampling.  Although the model could easily be made more complex, this may not be warranted until much higher resolution series become available.

How to cite: Lovejoy, S. and Spiridinov, A.: The Fractional Macro Evolution Model: A simple quantitative scaling macroevolution model, EGU General Assembly 2023, Vienna, Austria, 23–28 Apr 2023, EGU23-4446, https://doi.org/10.5194/egusphere-egu23-4446, 2023.

EGU23-6069 | Posters on site | NP3.1

An ocean surface paradox: gas equilibrium with atmosphere 

Brian Durham and Christian Pfrang

Marine science tells us that the surface of Earth’s oceans is in gaseous equilibrium with its atmosphere (Yingxu Wu et al 2022). In the case of the key atmospheric trace gas CO2, the partition across the phase boundary is given by Henry constants as established by Li and Tsui 1971 and by Weiss 1974, while outside the laboratory there are extensive datasets for the atmospheric mol fraction (ppm CO2) embodied in the familiar `Keeling curves’, as measured at oceanic, polar and continental locations (Yuan et al 2019).

Sea surface temperatures are widely available for Earth’s oceans (Kent and Kennedy 2021). We have therefore interpreted the Henry Constants from Li and Tsui (1971) and from Weiss (1974) as headspace mol fractions (ppm CO2) against temperature, and added representative field data from Mauna Loa (https://gml.noaa.gov/ccgg/trends/).

A disparity is evident, which we address as follows: In case the well-known differential between the two 1970s laboratory curves is somehow attributable to pre-treatment including acid in both cases and a biocide in one, we speculate that the outcomes of both might be different if the seawater samples had been treated as biological fluids.

Expanding therefore our studies of atmospheric gas partitioning at a growing ice surface reported to recent EGU conferences, and building on valued conversations with colleagues at EGU 2022, we will present provisional results from gas equilibration in the headspace above freshly-collected (≈`live’) seawater from UK’s Atlantic coast.  

How to cite: Durham, B. and Pfrang, C.: An ocean surface paradox: gas equilibrium with atmosphere, EGU General Assembly 2023, Vienna, Austria, 23–28 Apr 2023, EGU23-6069, https://doi.org/10.5194/egusphere-egu23-6069, 2023.

EGU23-6870 | ECS | Posters on site | NP3.1

A natural history of networks: Modelling higher-order interactions in geohistorical data 

Alexis Rojas, Anton Holmgren, Magnus Neuman, Daniel Edler, Christopher Blöcker, and Martin Rosvall

Geohistorical records, either stratigraphic sections, boreholes, ice cores, or archaeological sites, are inherently complex. Despite their limitations, the high-dimensional and spatiotemporally resolved data retrieved from individual geohistorical records allow for evaluation of past biotic responses to natural and human-induced environmental changes. Network analysis is becoming an increasingly popular alternative for modelling the dynamics of geohistorical data. However, the complexity of geohistorical data raises questions about the limitations of standard network models widely used in paleobiology research. They risk obscuring large-scale patterns by washing out higher-order node interactions when assuming independent pairwise links. Recently introduced higher-order representations and models better suited for the complex relational structure of geohistorical data provide an opportunity to move paleobiology research beyond these challenges. Higher-order networks can represent the spatiotemporal constraints on the information paths underlying geohistorical data, capturing the high-dimensional patterns more accurately. Here we describe how to design higher-order network models of geohistorical data, address some practical decisions involved in modeling complex dependencies, and discuss critical methodological and conceptual issues that make it difficult to compare results across studies in the growing body of network paleobiology. We illustrate multilayer networks, hypergraphs, and varying Markov time models through case studies on the fossil record from continental shelf ecosystems and delineate future research directions for current challenges in the emerging field of network paleobiology.

How to cite: Rojas, A., Holmgren, A., Neuman, M., Edler, D., Blöcker, C., and Rosvall, M.: A natural history of networks: Modelling higher-order interactions in geohistorical data, EGU General Assembly 2023, Vienna, Austria, 23–28 Apr 2023, EGU23-6870, https://doi.org/10.5194/egusphere-egu23-6870, 2023.

EGU23-7748 | ECS | Orals | NP3.1

Response of atmospheric variability in the Northern Hemisphere winter to past climate conditions and elevated CO2 levels 

Arthur Oldeman, Michiel Baatsen, Anna von der Heydt, Aarnout van Delden, and Henk Dijkstra

A specific feature where future climate projections fail to see a consistent response to increasing CO2 levels is Northern Hemisphere winter atmospheric dynamics and variability. This holds specifically for the Northern Annular Mode (NAM) and its regional expression, the North Atlantic Oscillation (NAO). The lack of consensus in future projections is caused in part due to the large internal variations of these modes of atmospheric variability compared to the response to elevated CO2.

The response of interannual and decadal climate variability to warm conditions can be isolated in climate simulations equilibrated at elevated CO2 concentrations. However, we cannot perform a future model-data comparison. Fortunately, we can turn to the past. The last time the Earth saw similar CO2 concentration as the present day was approximately 3 million years ago, in the mid-Pliocene epoch. The mid-Pliocene is often considered the ‘best analog’ to an equilibrated climate at present or near-future CO2 levels. However, can the mid-Pliocene be used to assess the response of Northern Hemisphere winter atmospheric variability, such as the NAO and NAM, to a warm climate?

To answer this question, we have performed a set of sensitivity experiments using a global coupled climate model (CESM1.0.5). We have performed sensitivity studies using a pre-industrial and a mid-Pliocene geography, as well as two levels of radiative forcing (280 ppm and 560 ppm), as a part of intercomparison project PlioMIP2. Our mid-Pliocene simulations generally compare well to proxy reconstructions of sea-surface temperature.

We consider the sea-level pressure (SLP) and zonal wind at 200 hPa using 200 years of January-mean data, and perform principal component analysis. In response to the mid-Pliocene boundary conditions (other than CO2), we find a large increase in the mean SLP along with a decreased variance over the North Pacific Ocean. This is accompanied with a weakened jet stream over the western North Pacific, as well as increased occurrence of a split jet condition over the eastern North Pacific. These findings are connected to a regime shift in the modes of atmospheric variability in the Northern Hemisphere, where the so-called North Pacific Oscillation (NPO) becomes the most dominant mode of variability. We do not see tendencies towards similar behavior in the CO2 doubling experiment indicating that the Pliocene boundary conditions are the main driver of the observed shifts in variability. This suggests that the mid-Pliocene is not a good analog for a warm future climate when considering Northern hemisphere winter atmospheric variability.

How to cite: Oldeman, A., Baatsen, M., von der Heydt, A., van Delden, A., and Dijkstra, H.: Response of atmospheric variability in the Northern Hemisphere winter to past climate conditions and elevated CO2 levels, EGU General Assembly 2023, Vienna, Austria, 23–28 Apr 2023, EGU23-7748, https://doi.org/10.5194/egusphere-egu23-7748, 2023.

EGU23-7943 | Posters on site | NP3.1 | Highlight

Framing origins and dynamics of biodiversity in the paradigm of space and time scaling 

Andrej Spiridonov, Shaun Lovejoy, and Lauras Balakauskas

The biodiversity is the fundamental aspect and transitive measure of biota and the evolutionary process itself. The biodiversity is usually understood as the diversity of morphological or structural types, and also as the number of taxa (species, genera, families etc.) or branches of different ranks in evolutionary trees or networks. The biodiversity is hierarchical and universal feature of biological systems. Despite its conceptual simplicity, the origins and patterns of variability of diversity, except the fact that they are based on the evolutionary process, are rather hardly comprehensively understood. Therefore, the determination of origins, and the dynamics of biodiversity through the space and time, is one of the most fundamental open questions of biology.

                             The theory of evolution reveals a number of possibilities on how biodiversity can change, and also predicts patterns which underlie the mechanism: if the biodiversity is autonomous and self-regulating process, or if opposite is true – the biodiversity is a driven variable dependant on many varying Earth system, and possibly astrophysical components. One of the most promising approaches in characterizing the dynamics of biodiversity, and discriminating between the underlying causes of the dynamics, is the analysis of scaling.

                             The spatial scaling of biodiversity is a well developed field of science. The dependence of species richness on the geographical area is described by power laws. The values of parameters could be interpreted with respect to possible controlling genealogical and ecological mechanisms of evolution. The scaling of biodiversity in space, also suggests the scaling of biodiversity as a function of time scale. The scaling is time scale symmetry which connects the large and small scales, and it reveals the uniformity of a mechanism in a scaling range. Presented approach allows the summarization of macroevolution in very simple terms.

                             Here we present a case of global marine animal biodiversity, and based on the revealed crossover-like time scaling pattern, we suggest that two competing time symmetric scaling mechanisms, with opposite effects on biodiversity (stabilizing versus destabilizing), are responsible for the evolution of the biota at the eon scale. The presented results can serve as a null model in understanding global evolution, and also can serve in sharpening and strengthening of our intuitions in exploring and explaining macroevolutionary patterns.

                             The research was supported by the project S-MIP-21-9 “The role of spatial structuring in major transitions in macroevolution”.

How to cite: Spiridonov, A., Lovejoy, S., and Balakauskas, L.: Framing origins and dynamics of biodiversity in the paradigm of space and time scaling, EGU General Assembly 2023, Vienna, Austria, 23–28 Apr 2023, EGU23-7943, https://doi.org/10.5194/egusphere-egu23-7943, 2023.

EGU23-8513 | ECS | Posters on site | NP3.1 | Highlight

Exploring evolution of feather function in early birds and dinosaurs 

Pierre Cockx and Michael Benton

Feathers are key innovations that underpin the evolutionary success of birds, and biologists have achieved a solid understanding of modern feather types and their functions. Nonetheless, the unexpected recent discoveries of several specialized feather morphologies in extinct birds and related dinosaurs, challenges our views of the overall evolution of feathers. Such discoveries raise large evolutionary questions in a wider group than simply birds (i.e., dinosaurs as well as pterosaurs). These are related, for instance, to the initial function of feathers, subsequent feather diversification and functions, and potential links between such evolution and external factors. We have differentiated and inventoried fossil feather types based on their general morphological structure, and coded these as traits that relate to feather functions. We analyse the dataset through computational phylogenetic comparative methods, including ancestral state reconstructions, to identify the points of origin for each feature and estimate patterns and rates of evolution. Monofilamentous integumentary structures appear synapomorphic to Avemetatarsalia. A loss of monofilamentous integumentary structures occurred within Pennaraptora. While the presence of pennaceous feathers is synapomorphic for Pennaraptora, the presence of pennaceous feathers on the hindlimbs is a synapomorphy of Paraves. There is greater complexity, however, in feather evolution, with uncertainty over convergence and uniqueness of some feather types not seen in modern birds. The analysis allows some connection from feather morphology evolution to the sequence of regulatory gene switches in modern feather ontogenetic development, but the fossils suggest a richness of evolution not directly seen in studies of feather evo-devo.

How to cite: Cockx, P. and Benton, M.: Exploring evolution of feather function in early birds and dinosaurs, EGU General Assembly 2023, Vienna, Austria, 23–28 Apr 2023, EGU23-8513, https://doi.org/10.5194/egusphere-egu23-8513, 2023.

EGU23-9455 | Orals | NP3.1

Was the 4.2 ka event unusual in context of global Holocene climate variability? 

Nicholas McKay, Darrell Kaufman, Stéphanie Arcusa, and Hannah Kolus

Abrupt climate changes are commonly observed between 4500 and 4000 years ago, and particular attention has been paid to the “4.2 ka event”, which now serves as a stratigraphic marker to subdivide the mid and late Holocene globally. However, proxy climate records are commonly marked by large, and often abrupt, changes in temperature and moisture throughout the Holocene, and it remains unclear how abrupt change in the mid-Holocene compares to changes throughout the epoch. Here, we assess how regional and global temperature and moisture changes between 4.5 and 4.0 ka compare with other major climate events across the Holocene, in particular the 8.2 ka event. To conduct this analysis objectively, we assess more than a 1000 previously published paleoclimate datasets that span all continents and oceans and include a wide variety of archive and proxy types. All of the data are open access, and the analyses were conducted using the open-source “Abrupt Change Toolkit in R (actR)” software package to determine the timing and significance of multiple types of abrupt change. These include excursion events (significant short-term deviations from the mean state), regime change events (significant rapid shifts in millennial-scale means) and trend change events (significant changes in the long-term trend). We detect multiple significant abrupt change events throughout the Holocene, and therefore evaluate the spatiotemporal significance of events against a null hypothesis of observed background variability. Events at 8.2 ka stand out as large spatiotemporally coherent excursions of temperature and moisture centered in the North Atlantic and globally significant. In contrast, although we detect multiple types of abrupt change in moisture and temperature during the between 4.5 and 4.0 ka, the event does not significantly exceed the expectation of occurrence from our robust null model nor stand out as a regionally coherent anomaly. These results suggest that local abrupt changes are common throughout the Holocene; many of these are regionally coherent, but few are hemispheric or global in extent.

How to cite: McKay, N., Kaufman, D., Arcusa, S., and Kolus, H.: Was the 4.2 ka event unusual in context of global Holocene climate variability?, EGU General Assembly 2023, Vienna, Austria, 23–28 Apr 2023, EGU23-9455, https://doi.org/10.5194/egusphere-egu23-9455, 2023.

EGU23-11039 | ECS | Posters on site | NP3.1

New Land- vs. Ocean based Global Mean Temperature Reconstructions reveal high consistency except for early 20th Century Ocean Cold Anomaly 

Sebastian Sippel, Nicolai Meinshausen, Erich Fischer, Vincent Humphrey, Robert A. Rohde, Iris de Vries, and Reto Knutti

Global mean surface air temperature (GSAT) is a key diagnostic for understanding and constraining historical climate variability and change, and for climate policy. Yet, global temperature estimates (1) are usually based on blending sea surface temperatures (SST) with near-surface air temperature over land (LSAT), and (2) contain many missing values due to incomplete coverage in the historical record. While these issues are usually accounted for in model-observation comparisons, elucidating the consistency of LSAT and SST recordsand their contribution to GSAT variability and change, remains difficult.

Here, we present a set of new GSAT reconstructions based separately on either the historical LSAT or SST record. The method is based on regularized linear regression models trained on climate model simulations to optimally predict GSAT from the climate model’s LSAT or SST patterns, respectively. We then predict GSAT from the HadSST4 and CRUTEM5 observational data, respectively, for each month from January 1850 up to December 2020.

We demonstrate that the land- or ocean based GSAT estimates show very similar variability and long-term changes, both in the early (1850-1900) as well as in the late record (post-1950). For example, GSAT of the past decade (2011-2020) increased by 1.15°C (LSAT-based) and 1.17°C (SST-based) relative to an early reference period (1850-1900), which is both well within IPCC AR6 estimates.However, the GSAT estimates show pronounced disagreement in the early 20th century (1900 up to around 1930), when the SST-based GSAT estimates appear on average around 0.3°C colder than the LSAT-based estimates. Decadal changes in the LSAT-based estimates are well explained by the multi-model mean of CMIP6 simulations driven with historical forcings, thus implying only a small role of unforced decadal global variability. In contrast, the SST-based estimate highlights pronounced variability during the early 20th century cold anomaly, which may be related to concerns about instrumental cold biases in SST measurements, but overall reasons for the disagreement remain unclear. Further analysis based on physical reasoning, climate models, and proxy reconstructions, indicates that the ocean data may indeed be implausibly cold.

In conclusion, our methodology and results may help to constrain the magnitude of early 20th century warming, and thus to better understand and attribute decadal climate variability.

How to cite: Sippel, S., Meinshausen, N., Fischer, E., Humphrey, V., Rohde, R. A., de Vries, I., and Knutti, R.: New Land- vs. Ocean based Global Mean Temperature Reconstructions reveal high consistency except for early 20th Century Ocean Cold Anomaly, EGU General Assembly 2023, Vienna, Austria, 23–28 Apr 2023, EGU23-11039, https://doi.org/10.5194/egusphere-egu23-11039, 2023.

EGU23-11519 | ECS | Posters on site | NP3.1

“HespDiv” method allows to quantify the dark matter of biosystems 

Liudas Daumantas and Andrej Spiridonov

Bretskyan hierarchy of eco-evolutionary entities is a useful theoretical concept that defines hierarchies of communities of species which reside in the same geographical space and are tied together by ecological interactions and evolutionary history. Bretskyan hierarchy can be employed to define and track the evolving hierarchy of bioregions, allowing all sorts of (paleo)biogeographical investigations to be carried out: from finding the causes why bioregions split or fuse and how this happens at many spatial scales, ie. what drives the internal structure of bioregions in Bretskyan hierarchy. Unfortunately, methodical applications of this concept are challenging due to the hybrid nature of Bretskyan hierarchy entities and fuzziness of their boundaries.

In order to help solve the presented problem of explicit subdivision of contiguous spatial regions, which are in our understanding the units of the Bretskyan hierarchy, we propose a new method, within the newly developed R package “HespDiv” which presents a range of functionalities for the determination of spatial structures/bioregions. The method uses fossil taxa distribution data to subdivide a provided territory into hierarchically related (each bioregion is a strict sub-set of larger bioregion) and topologically contiguous bioregional units. It produces split-lines which are used to subdivide bioregions. This subdivision can be done by employing linear or nonlinear divisor lines inside predetermined area polygons. In a latter case, the inferred bioregions can obtain more realistic shapes. The application of “HespDiv” method to Miocene fauna from the contiguous United States was performed in order to demonstrate the potential of the method. Morisita-Horn similarity index was used to measure differences between fossil taxa communities. The results revealed 25 distinct, topologically contiguous and hierarchically related bioregions had the structure dominated by longitudinal and diagonal boundaries, and the three most distinct bioregions were: West Coast, Central Plains and south-east US.

 The numerical analyses of real world paleobiogeographical data with newly developed “HespDiv” method indeed show a high potential of the approach in objectively defining the hierarchical units of the Bretskyan hierarchy of (paleo)bioregions in sufficiently densely sampled regions and time bins.

                      Presented research is funded by project S-MIP-21-9 “The role of spatial structuring in major transitions in macroevolution”.

How to cite: Daumantas, L. and Spiridonov, A.: “HespDiv” method allows to quantify the dark matter of biosystems, EGU General Assembly 2023, Vienna, Austria, 23–28 Apr 2023, EGU23-11519, https://doi.org/10.5194/egusphere-egu23-11519, 2023.

EGU23-12346 | ECS | Posters on site | NP3.1

Do tree-rings match the low-frequency patterns represented in climate models? 

Mara McPartland, Raphaël Hébert, and Thomas Laepple

Whether tree-rings faithfully archive the low-frequency variability (LFV) in climate remains debated. In theory, trees are fundamentally limited by being relatively short-lived and therefore unable to capture variations in the climate that are longer than their own lifespans. In addition, near universal practices of “detrending” tree-ring records to remove individualistic age-growth trends place further constraints on the amount of LFV that is maintained in final chronologies. Detrending methods designed to boost LFV may increase low-frequency signals, but how well those patterns reflect true variations in climate as opposed to long growth trends is still unclear. In this study, we first compared the spectral properties of the PAGES North America 2k dataset of temperature-sensitive tree-ring records against long temperature records to determine how much variability is retained in tree-rings after detrending, and how detrending method influences agreement in tree-ring power spectra across space. Then, we compare the spectral properties of tree-rings to the CMIP6 last millennium simulation to validate climate models against long proxy records. This research works to resolve discrepancies between temperature proxies and climate models on long timescales in order to improve our understanding of centennial-scale variability in the Earth’s climate system.

How to cite: McPartland, M., Hébert, R., and Laepple, T.: Do tree-rings match the low-frequency patterns represented in climate models?, EGU General Assembly 2023, Vienna, Austria, 23–28 Apr 2023, EGU23-12346, https://doi.org/10.5194/egusphere-egu23-12346, 2023.

EGU23-13323 | Posters on site | NP3.1

Centennial to millennial climate variability across climate states; proxy reconstructions vs. transient model simulations. 

Andrew M. Dolman, Marie Kapsch, Uwe Mikolajewicz, Lukas Jonkers, and Thomas Laepple

In previous model-data comparisons, the centennial to millennial scale variance of local climate (e.g., SST) reconstructed from proxies was significantly higher than that simulated by climate models. One possible explanation is the lack of long-term feedback mechanisms, e.g. from the representation of changes in ice-sheets in models. Additionally, proxy records are short, and sparse, and the climate signal is significantly modified during the processes of encoding, archiving, and recovery.

Here we introduce new methods to infer the climate variability of the past from proxy data and compare them to new transient model simulations of the last deglaciation. This will allow us to estimate the amplitude of climate variability and to evaluate whether climate models are capable of capturing changes in climate variability between different climate states (e.g. glacial vs. interglacial periods), which is also relevant for the accuracy of future projections. We compare the variability of marine d18O reconstructed from proxies with that simulated by a state-of-the-art Earth System Model.

From the proxy side, our analysis is based on a new dataset of marine oxygen isotope data from planktonic foraminifera compiled for the PALMOD project. We use new methods to first calculate power-spectra for the LGM, transition and Holocene and then to correct these spectra by fitting a Bayesian model describing the effects of bioturbation and measurement error on the reconstructed climate signal. From the model side we use marine d18O variability calculated using temperature and salinity from transient model simulations of the last deglaciation, performed within the PALMOD project, that include changes in the ice sheets.

This combination of new data and methods will allow us to investigate the effect of different ice-sheet configurations and physical parametrizations in the model on their ability to characterise long-timescale climate variability and its dependence on climate state.

How to cite: Dolman, A. M., Kapsch, M., Mikolajewicz, U., Jonkers, L., and Laepple, T.: Centennial to millennial climate variability across climate states; proxy reconstructions vs. transient model simulations., EGU General Assembly 2023, Vienna, Austria, 23–28 Apr 2023, EGU23-13323, https://doi.org/10.5194/egusphere-egu23-13323, 2023.

EGU23-14335 | Orals | NP3.1

Multi-annual variability of a new proxy-constrained modeled AMOC from 1450-1780 CE 

Eric Samakinwa, Christoph Riable, Ralf Hand, Andrew Friedman, and Stefan Brönnimann

The ongoing discussion about the AMOC slowdown over the 21st century requires a detailed understanding of preindustrial AMOC variability. Here, we present a surface nudging technique to reconstruct the AMOC variability during the Little Ice Age from 1450–1780 CE. The AMOC reconstruction is based on a 10-member ensemble ocean model simulation nudged to proxy-reconstructed sea surface temperature. This approach validates and improves existing knowledge of the AMOC variability, showing that the AMOC slowdown under stable atmospheric CO2 conditions is mainly driven by a 4 to 7 year lagged effect of surface heat flux associated with the North Atlantic Oscillation.

How to cite: Samakinwa, E., Riable, C., Hand, R., Friedman, A., and Brönnimann, S.: Multi-annual variability of a new proxy-constrained modeled AMOC from 1450-1780 CE, EGU General Assembly 2023, Vienna, Austria, 23–28 Apr 2023, EGU23-14335, https://doi.org/10.5194/egusphere-egu23-14335, 2023.

EGU23-15090 | Orals | NP3.1 | Highlight

Heat extremes in scenario projections: the role of variability 

Claudia Simolo and Susanna Corti

Heat extremes have grown disproportionately since the advent of industrialization and are expected to intensify further under unabated greenhouse warming, spreading unevenly across the globe. However, amplification mechanisms are highly uncertain because of the complex interplay between the regional physical responses to human forcing and the statistical properties of atmospheric temperatures. Here, focusing on the latter, we explain how and to what extent the leading moments of daily thermal distributions sway the future trajectories of heat extremes. We show that historical and future temperature variability are the key to understanding the global patterns of change in the frequency and severity of the extremes and their exacerbation over many areas. Variability is crucial to unravel the highly differential regional sensitivities and may well outweigh the background warming. These findings provide fundamental insights for assessing the reliability of climate models and improving their scenario projections.

How to cite: Simolo, C. and Corti, S.: Heat extremes in scenario projections: the role of variability, EGU General Assembly 2023, Vienna, Austria, 23–28 Apr 2023, EGU23-15090, https://doi.org/10.5194/egusphere-egu23-15090, 2023.

One of the most telling effects of the weather and climate is the occurrence of rare extreme events. As extremes are typically sudden and climate variability is a slower process, it is important to assess how severe changes have become and to aim to understand why. As the climate dynamics of the mean state are altering, can we also establish accurately if there are systematic changes to the extreme temperature process? One main challenge for assessing such climate dynamic alterations across these time scales is how to analyse records across the pre-industrial paleo and instrumental eras of the past 500 years. This analysis focusses on Northern European temperatures and their mean state and extremes changes. The analysis is done using a form of Dominant Frequency State Analysis where the extreme process (modelled as a Generalised Extreme Value process) can be distinguished from the variation of the mean state. The methods used in this approach are generic and can be applied in any study of extremes provided there is data (instrumental, simulated or paleo-proxies) that is of sufficient quality. This work reports how the extreme temperature process properties for Northern Europe appear to have altered across 500 years and I’ll discuss the climate dynamics interpretation of these results.

How to cite: Bruun, J.: Climatic warming changes to Northern European extreme temperature processes over the past 500 years, EGU General Assembly 2023, Vienna, Austria, 23–28 Apr 2023, EGU23-15117, https://doi.org/10.5194/egusphere-egu23-15117, 2023.

EGU23-15592 | ECS | Orals | NP3.1

Recurrence analysis of large-scale dynamical properties of terrestrial mammal evolution 

Robertas Stankevič, Simona Bekeraitė, Andrej Spiridonov, and Ivona Juchnevičiūtė

Contrary to ecology, biology and climate science, analysis of nonlinear dynamics in paleontological time series is still relatively uncommon. Palaeontology tend to focus on events such as mass extinctions or radiations over dynamical processes and relationships. However, all parts of the Earth system, including the biota, are interrelated at multiple scales, showing feedback relations and nonlinearity. Nonlinear analysis of global palaeodiversity dynamics and its coupling with abiotic variables could offer a fresh view into a long-running question of the relative importance of biotic and abiotic factors in macroevolution by identifying interactions and responses not amenable to classical methods of time series analysis.
As a part of our inquiry into causal explanation of the drivers of mammal evolution, we present our analysis of the dynamics of Cenozoic land mammal evolution, based on high resolution time series data and methods of recurrence plots and causal inference.
Using PyRate, a Bayesian palaeodiversity analysis framework, we estimate diversification parameters and individual taxon lifetimes of several extinct Paleogene mammal orders and several extant large bodied orders Carnivora, Proboscidea, Artiodactyla and Perissodactyla. We then use recurrence analysis tools developed by the author to investigate dynamics of the evolution of the aforementioned taxons, identifying regime transitions and regions of deterministic and chaotic regimes over multi-million year timescales.
Abrupt changes in species composition are indentified particularly in Perissodactyla recurrence plots. First and the most abrupt change occured at ca. 32 Ma, corresponding to Eocene-Oligocene extinction event. Another prominent change indentified at ca. 17 Ma, corresponding to Middle Miocene disruption. Both concide with changes in δ13C and δ18O isotopic record (Westerhold et al. 2020).
In search of signatures of general synchronisation, we performed joint-recurrence plot analysis between matrices of diversity composition, δ13C isotopic record and δ18O-derived global temperature time series.
Our preliminary results shed light on diversification dynamics of the main terrestrial mammal orders and similarity over time and coupling with the climatic and carbon cycle dynamics of the Earth. We compare them with findings of causal analysis of climate and diversification time series, using the same datasets and transfer-entropy based causal inference tools. The relative degrees of herbivore and carnivore diversity couplings with climate is also discussed.

How to cite: Stankevič, R., Bekeraitė, S., Spiridonov, A., and Juchnevičiūtė, I.: Recurrence analysis of large-scale dynamical properties of terrestrial mammal evolution, EGU General Assembly 2023, Vienna, Austria, 23–28 Apr 2023, EGU23-15592, https://doi.org/10.5194/egusphere-egu23-15592, 2023.

EGU23-17369 | Posters on site | NP3.1

Spatial and temporal variations of the precipitation regime and trend of the last century in mainland Spain 

Jose Carlos Gonzalez-Hidalgo, Victor Trullenque-Blanco, Dhais Peña-Angulo, and Santiago Beguería

The evolution of the seasonal rainfall regime and trend in mainland Spain (western Mediterranean basin) in the period 1916-2015 has been analyzed with the new high spatial resolution grid of the MOPREDAS_century (10 km2) database, included in CLICES project.

Seasonal rainfall regime changes have been analysed in mainland Spain. Comparison of the seasonal precipitation values in four different periods of 25 years in length were done. The spatial distribution of seasonal rainfall highlights a winter regime to the north and west, autumn to the eastern Mediterranean coastland, and spring predominates in between the aforementioned areas, but the analysis shows that the seasonal distribution of precipitation has undergone remarkable changes between 1916 and 2015. During the first 25 years’ period (1916-1940) winter predominates in 44% of grid, increasing to 55% in 1941-1965 and to 60% in 1966-1990 to decrease in the most recent period (1991-2015) to 38%; in the meantime, spring remain around 30% until 1991-2015 when decrease to 16%, and autumn, initially occupying 33%, decrease in the 2nd and 3rth period to increase in the most recent ones to 50% of grid. These changes have been produce by the different behaviour of rainfall trends, particularly in spring (mostly related to march) and autumn (particularly October). Global spatial changes show the substitution of areas of winter regime by spring, and on the other hand spring substitution by autumn regime, but the analyses of detailed period discover a more complex pattern.
In general, the seasonal rainfall trend present changes throughout the analyzed period, with clear decreases in spring and increases in autumn in the final decades. However, the analysis of temporal scale allows us to observe that since the mid-1970s the seasonal precipitation trends are not statistically significant in the study area. The analysis in four periods of 25 years of the seasonal average values shows that the dominant seasonal regime of precipitations has undergone changes. Between 1916-2015, a replacement of the winter and spring regime for the autumn regime has been detected in extensive areas of the central western peninsular. The results are in line with previous analyzes carried out in the whole of the Mediterranean basin and especially in its western sector and suggest that they may be partly related to the variations in time of the NAO and WeMO atmospheric variability modes. Possible effects on natural systems and human activities are discussed, as a step prior to the adoption of mitigating measures.
The objectives and results obtained in the CLICES project are available on the website www.CLICES.unizar.es.

How to cite: Gonzalez-Hidalgo, J. C., Trullenque-Blanco, V., Peña-Angulo, D., and Beguería, S.: Spatial and temporal variations of the precipitation regime and trend of the last century in mainland Spain, EGU General Assembly 2023, Vienna, Austria, 23–28 Apr 2023, EGU23-17369, https://doi.org/10.5194/egusphere-egu23-17369, 2023.

EGU23-17584 | Orals | NP3.1 | Highlight

Climate change detection and attribution using proxy system models 

Jörg Franke, Mike Evans, Andrew Schurer, and Gabriele Hegerl
Until now, pre-instrumental climate change detection and attribution studies were based on the regression of statistical reconstructions on simulations. This approach is limited by stationarity assumptions and the univariate linear response of the underlying paleoclimatic observations. Here, we present a new procedure, in which we model paleoclimate data observations as a function of paleoclimatic data simulations using a proxy system model. Specifically, we detect and attribute tree-ring width (TRW) observations as a linear function of TRW simulations. These are nonlinear and multivariate TRW simulation driven by climate simulations with single or multiple external forcing. 
 
Temperature- and moisture-sensitive TRW simulations detect distinct patterns in time and space. Northern Hemisphere averages of temperature-sensitive TRW observations and simulations are significantly correlated. We can attribute their variation to volcanic forcing. In decadally smoothed temporal fingerprints, we find the observed responses to be significantly larger and/or more persistent than the simulated responses. The pattern of simulated TRW of moisture-limited trees is consistent with the observed anomalies in the two years following major volcanic eruptions. We can for the first time attribute this spatiotemporal fingerprint in moisture-limited tree-ring records to volcanic forcing. These results suggest that the use of nonlinear and multivariate proxy system models in paleoclimatic detection and attribution studies may permit more realistic, spatially resolved and multivariate fingerprint detection studies and evaluation of the climate sensitivity to external radiative forcing than has previously been possible.

How to cite: Franke, J., Evans, M., Schurer, A., and Hegerl, G.: Climate change detection and attribution using proxy system models, EGU General Assembly 2023, Vienna, Austria, 23–28 Apr 2023, EGU23-17584, https://doi.org/10.5194/egusphere-egu23-17584, 2023.

EGU23-234 | ECS | Posters on site | OS1.4

Future Arctic Ocean atmosphere-ice-ocean momentum transfer and impacts on ocean circulation 

Morven Muilwijk, Tore Hattermann, Sigrid Lind, and Mats Granskog

Over the last few decades, the Arctic has experienced surface warming at more than twice the global rate and extensive sea ice loss. The reduced sea ice cover affects the mechanical and thermodynamical coupling between the atmosphere and the ocean. A commonly repeated hypothesis is that a thinner and more mobile sea ice cover will increase momentum transfer, resulting in a spin-up of upper Arctic Ocean circulation and enhanced vertical mixing. In general, sea ice protects the ocean from interaction with the atmosphere, and a thinning and shrinking sea ice cover implies a more direct transfer of momentum and heat. For example, several observational studies show a more energetic ocean after strong wind events over open water than wind events over ice-covered water. However, previous modeling studies show that seasonality is very important and that the total momentum transfer can decrease with more open water because the ice surface provides greater drag than the open water surface. We here present numerical simulations of future scenarios with the Norwegian Earth System Model (NorESM) and show how the momentum transfer is projected to change with changing sea ice and wind conditions in various regions of the Arctic Ocean. We then compare our results with output from other CMIP6 models and present how different wind conditions and the diminishing ice cover impacts the upper ocean circulation. 

How to cite: Muilwijk, M., Hattermann, T., Lind, S., and Granskog, M.: Future Arctic Ocean atmosphere-ice-ocean momentum transfer and impacts on ocean circulation, EGU General Assembly 2023, Vienna, Austria, 23–28 Apr 2023, EGU23-234, https://doi.org/10.5194/egusphere-egu23-234, 2023.

EGU23-2446 | ECS | Orals | OS1.4

Drivers of Laptev Sea interannual variability in salinity and temperature from satellite data 

Phoebe Hudson, Adrien Martin, Simon Josey, Alice Marzocchi, and Athanasios Angeloudis

Arctic surface air temperatures are warming twice as fast as global average temperatures. This has caused ocean warming, an intensification of the hydrological cycle, snow and ice melt, and increases in river runoff. Rivers play a central role in linking the components of the water cycle and Russian rivers alone contribute ~1/4 of the total freshwater to the Arctic Ocean, maintaining the halocline that covers the Arctic and dominates circulation. Increases in river runoff could further freshen this layer and increase Arctic Ocean stratification. However, the increase in atmosphere-ocean momentum transfer with sea ice loss could counteract or alter this pattern of circulation, mixing this cold fresh water with the warm salty water that currently sits below it. Understanding the interplay between these changes is crucial for predicting the future state of the Arctic system. Historically, studies trying to understand the interplay between these changes have been challenged by the difficulty of collecting in situ data in this region.


Over most of the globe, L-band satellite acquisitions of sea surface salinity (SSS), such as from Aquarius (2011–2015), SMOS (2010- present), and SMAP (2015-present), provide an idea tool to study freshwater storage and transport. However, the low sensitivity of L-band signal in cold water and the presence of sea ice makes retrievals at high latitudes a challenge. Nevertheless, retreating Arctic sea ice cover and continuous progress in satellite product development make the satellite based SSS measurements of great value in the Arctic. This is particularly evident in the Laptev Sea, where gradients in SSS are strong and in situ measurements are sparse. Previous work has demonstrated a good consistency of satellite based SSS data against in situ measurements, enabling greater confidence in acquisitions and making satellite SSS data a truly viable potential in the Arctic. Therefore, this project aims to combine satellite data, particularly SMAP and SMOS sea surface salinity (SSS) data, with model output to improve our understanding of interactions between the components of the Arctic hydrological cycle and how this is changing with our changing climate.


The Laptev Sea was chosen as an initial region of focus for analysis as the Lena river outflows as a large, shallow plume, which is clearly observable from satellite SSS data. The spatial pattern of the Lena river plume varies considerably interannually, responding to variability in atmospheric and oceanic forcing, sea ice extent, and in the magnitude of river runoff.  Numerical model output and satellite products confirm what has previously been suggested from in-situ data: wind forcing is the main driver of river plume variability.

How to cite: Hudson, P., Martin, A., Josey, S., Marzocchi, A., and Angeloudis, A.: Drivers of Laptev Sea interannual variability in salinity and temperature from satellite data, EGU General Assembly 2023, Vienna, Austria, 23–28 Apr 2023, EGU23-2446, https://doi.org/10.5194/egusphere-egu23-2446, 2023.

EGU23-3244 | Orals | OS1.4

Stable oxygen isotopes from the MOSAIC expedition show vertical and horizontal variability of sea-ice and river water signals in the upper Arctic Ocean during winter 

Dorothea Bauch, Nils Andersen, Ellen Damm, Alessandra D'Angelo, Ying-chih Fang, Ivan Kuznetsov, Georgi Laukert, Moein Mellat, Hanno Meyer, Benjamin Rabe, Janin Schaffer, Kirstin Schulz, Sandra Tippenhauer, and Myriel Vredenborg

Our aim is to better understand how local winter modification and advected signals from the Siberian Shelf affect the structure of the upper Arctic Ocean along the Transpolar Drift (TPD). Hereto we use stable oxygen isotopes of the water (δ18O) in combination with salinity to quantify river water contributions (fr) and changes due to sea-ice formation or melting (fi) in the upper ~150m of the water column during the MOSAIC drift. Furthermore, ratios of fi/fr at identical salinities can be used to distinguish waters remnant from the previous summer and those modified locally.

Within the ongoing winter we observed salinification and deepening of the mixed layer (ML) due to sea-ice related brine release together with interleaving waters at the base of the ML and within the main halocline. These interleaving waters with variable sea-ice and river water signals are observed for the first time and have not been observed during summer expeditions before.

The MOSAIC floe drifted in and out of the freshwater-rich part of the TPD and into the Atlantic regime throughout the winter. Despite these strong regime changes the sea-ice related brine content accumulated during the ongoing winter remained visible within the water column. Budgets derived by integration of signals over the upper 100m result in ~1 to 5 m of pure sea-water (34.92 salinity and 0.3‰ δ18O) removed from the water column for ice formation and are much higher than ice thicknesses of ~0.5 to 2 m observed for the MOSAIC floe. For further evaluation scaling factors have to be considered accounting e.g. for the different densities of ice and water as well as for the lower salinity in the halocline relative to pure sea-water. Therefore, our analysis indicates a lower limit of the advected signal relative to local winter modification within the Arctic Ocean halocline.

How to cite: Bauch, D., Andersen, N., Damm, E., D'Angelo, A., Fang, Y., Kuznetsov, I., Laukert, G., Mellat, M., Meyer, H., Rabe, B., Schaffer, J., Schulz, K., Tippenhauer, S., and Vredenborg, M.: Stable oxygen isotopes from the MOSAIC expedition show vertical and horizontal variability of sea-ice and river water signals in the upper Arctic Ocean during winter, EGU General Assembly 2023, Vienna, Austria, 23–28 Apr 2023, EGU23-3244, https://doi.org/10.5194/egusphere-egu23-3244, 2023.

EGU23-3465 | Orals | OS1.4

Ocean heat increase and sea ice reduction in the Fram Strait conveys Arctic Ocean change 

Laura de Steur, Hiroshi Sumata, Dmitry Divine, Mats Granskog, and Olga Pavlova

The sea ice extent in the Arctic Ocean has reduced dramatically with the last 16 years (2007-2022) showing the 16 lowest September extents observed in the satellite era. Besides a declining sea ice cover and increase in ocean heat content in summer, the winter sea ice concentration and thickness have also become more vulnerable to changes. We present results from the Fram Strait Arctic Outflow Observatory showing that the upper ocean temperature in the East Greenland Current in the Fram Strait has increased significantly between 2003 and 2019. While the cold Polar Water now contains more heat in summer due to lower sea ice concentration and longer periods of open water upstream, the warmer returning Atlantic Water has shown a greater presence in winter the central Fram Strait, impacting the winter sea ice thickness and sea ice extent. These processes combined result in a reduced sea ice cover downstream along the whole east coast of Greenland both in summer and winter, which has consequences for winter-time ocean convection in the Greenland Sea.

How to cite: de Steur, L., Sumata, H., Divine, D., Granskog, M., and Pavlova, O.: Ocean heat increase and sea ice reduction in the Fram Strait conveys Arctic Ocean change, EGU General Assembly 2023, Vienna, Austria, 23–28 Apr 2023, EGU23-3465, https://doi.org/10.5194/egusphere-egu23-3465, 2023.

EGU23-3547 | Orals | OS1.4

An increasingly turbulent Arctic Ocean? 

Tom P. Rippeth

Historically, the Arctic Ocean has been considered an ocean of weak turbulent mixing. However, the decline in seasonal sea ice cover over the past couple of decades has led to increased coupling between the atmosphere and the ocean, with potential enhancement of turbulent mixing. Here, we review studies identifying energy sources and pathways that lead to turbulent mixing in an increasingly ice-free Arctic Ocean. We find the evolution of wind-generated, near-inertial oscillations is highly sensitive to the seasonal sea ice cycle, but that the response varies greatly between the continental shelves and the abyssal ocean. There is growing evidence of the key role of tides and continental shelf waves in driving turbulent mixing over sloping topography. Both dissipate through the development of unsteady lee waves. The importance of the dissipation of unsteady lee waves in driving mixing highlights the need for parameterization of this process in regional ocean models and climate simulations.

How to cite: Rippeth, T. P.: An increasingly turbulent Arctic Ocean?, EGU General Assembly 2023, Vienna, Austria, 23–28 Apr 2023, EGU23-3547, https://doi.org/10.5194/egusphere-egu23-3547, 2023.

EGU23-4159 | ECS | Orals | OS1.4

Modes of decadal variability in observed Arctic sea-ice concentration 

Jakob Dörr, Marius Årthun, David B. Bonan, and Robert C. J. Wills

The Arctic sea ice cover is strongly influenced by internal variability on decadal time scales, affecting both short-term trends and the timing of the first ice-free summer. Several mechanisms of variability have been proposed, but the contributions of distinct modes of decadal variability to regional and pan-Arctic sea-ice trends has not been quantified in a consistent manner. The relative contribution of forced and unforced variability in observed Arctic sea ice changes also remains poorly quantified. Here, we identify the dominant patterns of winter and summer decadal Arctic sea-ice variability in the satellite record and their underlying mechanisms using a novel technique called low-frequency component analysis. The identified patterns account for most of the observed regional sea ice variability and trends, and thus help to disentangle the role of forced and unforced sea ice changes since 1979. In particular, we separate a mode of decadal ocean-atmosphere-sea ice variability, with an anomalous atmospheric circulation over the central Arctic, that accounts for approximately 30-50% of the accelerated decline in pan-Arctic summer sea-ice area between 2000 and 2012. For winter, we find that internal variability has so far dominated decadal trends in the Bering Sea, while it plays a smaller role in the Barents and Kara Seas. These results, which detail the first purely observation-based estimate of the contribution of internal variability to decadal trends in sea ice, suggest a lower estimate of the internal variability contribution than most model-based assessments.

How to cite: Dörr, J., Årthun, M., Bonan, D. B., and Wills, R. C. J.: Modes of decadal variability in observed Arctic sea-ice concentration, EGU General Assembly 2023, Vienna, Austria, 23–28 Apr 2023, EGU23-4159, https://doi.org/10.5194/egusphere-egu23-4159, 2023.

EGU23-4822 | ECS | Orals | OS1.4

Ocean response to reduced Arctic sea ice in PAMIP simulations. 

Sourav Chatterjee, Julia Selivanova, Tido Semmler, and James A. Screen

Arctic Amplification (AA) – the greater warming of the Arctic than the global average - is a prominent feature of past and projected future climate change. AA exists due to multiple positive feedbacks involving complex interactions among different components of Arctic atmosphere, ocean, and cryosphere. The loss of sea ice is a key driver of AA. Sea ice loss and resultant AA can influence the global climate system, way beyond the Arctic. The atmospheric response to sea ice loss has been studied extensively. In comparison, the oceanic response has received less attention and our understanding of it is imprecise. Here, we utilize the fully coupled model simulations from the Polar Amplification Model Comparison Project (PAMIP) to explore the oceanic response to projected Arctic sea ice loss at 2o C global warming.

The sea surface warming signal is maximum in the Barents-Kara Sea region in all three models analysed. Results suggest that the observed northward propagation of the Arctic ‘cooling machine’ (region of intensive heat loss to the atmosphere) is largely driven by the reduced sea ice over the northern Barents Sea. Simultaneously, the atmospheric response with stronger south-westerlies over the Norwegian Seas and southern Barents Sea reduces the heat loss therein. This may partly explain the bipolar spatial structure of heat loss in the Norwegian seas and the Northern Barents-Kara Sea. This seesaw heat loss pattern can result in a warmer inflow of Atlantic Waters from the Norwegian Sea to the northern Barents Sea as projected by CMIP6 models. The mixed layer depth response in these regions is consistent with the heat loss patterns, with a deepening of the mixed layer in regions of enhanced heat loss and vice versa. The surface ocean dynamic response is most prominent in the Beaufort Sea. With reduced sea ice, the Beaufort gyre circulation is strengthened due to larger wind forcing and accumulates freshwater within. As a result, surface salinity response shows maximum freshening in this region. In summary, preliminary results from the coupled simulations under the PAMIP protocol indicate that the observed and projected changes in the Arctic Ocean during the 21st century are strongly driven by the reduction in sea ice.

How to cite: Chatterjee, S., Selivanova, J., Semmler, T., and Screen, J. A.: Ocean response to reduced Arctic sea ice in PAMIP simulations., EGU General Assembly 2023, Vienna, Austria, 23–28 Apr 2023, EGU23-4822, https://doi.org/10.5194/egusphere-egu23-4822, 2023.

EGU23-4972 | Posters on site | OS1.4

An 8-year time series of mesozooplankton fluxes in Kongsfjorden, Svalbard 

Patrizia Giordano, Alessandra D'Angelo, Kyle Mayers, Jasmin Renz, Ilaria Conese, Stefano Miserocchi, Federico Giglio, and Leonardo Langone

In Arctic regions, the food availability for epi-pelagic fauna is strictly influenced by environmental stressors, such as solar radiation, ice cover, glacial and watershed runoffs. This study presents an 8-year time-series (2010-2018) of mesozooplankton collected from an automatic sediment trap in the inner part of Kongsfjorden, Svalbard, at ~87m depth. The aim of this study is to observe the temporal variability in the abundance of epipelagic mesozooplankton species, collected as active flux (swimmers). Reference meteorological and hydrological data are also presented as environmental stressors, to evaluate possible relationships with zooplankton populations. A principal component analysis (PCA) applied to the dataset revealed that the physical and chemical characteristics of seawater affected the mesozooplankton abundance and composition. Collectively, this result highlighted the role of the thermohaline characteristics of the water column on the Copepods behavior, and the correlation between siliceous phytoplankton and Amphipods. Overall, the zooplankton within inner Kongsfjorden did not show a clear seasonal trend, suggesting their high adaptivity to extreme environmental conditions. Although the swimmer fluxes have decreased from 2013 onwards, an increase in community diversity has nevertheless been observed, probably due to copepods decline and subsequent higher food availability. Despite the decreasing magnitude of the zooplanktonic community over time, we recorded the intrusion of subarctic boreal species, such as Limacina retroversa, since 2016. The uniqueness of this dataset is an 8-year uninterrupted time series, which provides correlations between environmental and biological parameters in a poorly studied region. Under a warming Kongsfjorden scenario, with increasing submarine and watershed runoff, and the rapid Atlantification of the fjord, major changes in mesozooplankton communities are expected in the medium to long-term due to their adaptation to environmental changes and the introduction of alien species.

How to cite: Giordano, P., D'Angelo, A., Mayers, K., Renz, J., Conese, I., Miserocchi, S., Giglio, F., and Langone, L.: An 8-year time series of mesozooplankton fluxes in Kongsfjorden, Svalbard, EGU General Assembly 2023, Vienna, Austria, 23–28 Apr 2023, EGU23-4972, https://doi.org/10.5194/egusphere-egu23-4972, 2023.

EGU23-4988 | ECS | Posters on site | OS1.4

Spatial and temporal distribution of organic matter in central Arctic: Insights from biomarker proxy 

Akanksha Singh, Sze Ling Ho, and Ludvig Löwemark

Studies have shown that Arctic sea-ice conditions influence the earth’s energy budget by affecting its albedo and global ocean circulation. It also exerts a strong control on the local primary productivity. In addition, by drifting sea ice, it facilitates the transport of sediment and organic matter (OM) from marginal seas across the Arctic Ocean. Over the past decades, there have been several studies on sediment cores from Central Arctic where the major source of OM was shown to be terrigenous. The presence of this elevated terrigenous OM is driven by the transport of sediments and OM from marginal seas to the Central Arctic via drifting ice. However, our understanding of the processes involved in the transport of OM to the central Arctic is still limited. In this study, in order to better understand the pathways of OM transport, we examine spatial and temporal variations in OM flux to the central Arctic. We use organic carbon and biomarker proxies, namely n-alkanes and Glycerol dialkyl glycerol tetraether (GDGT) to explore the spatial and temporal (Marine Isotope Stage 1, 2 and 3) variation of terrigenous input versus marine primary productivity in the central Arctic. To understand the transport of OM in the Central Arctic, biomarkers in 100 samples collected from 9 central Arctic cores were investigated. The presence of terrestrial organic matter in the central Arctic region was confirmed by the high values of the BIT index, which virtually all reached above 0.5 with a maximum of 0.9. The spatial pattern of both terrestrial and marine OM showed higher concentrations at the central Lomonosov ridge and reduced values towards the Lomonosov Ridge off Greenland, with lowest concentrations from the cores located at Morris Jesup Rise (MJR). The pattern of declining terrestrial biomarker concentrations from the central Arctic to MJR, which is closer to the Fram Strait and marks the exit of the Arctic Ocean, are likely caused by sea-ice drift patterns. The sea ice would have been transported by the Transpolar Drift, which allows terrigenous material entrained in the dirty sea ice to get transported towards central Arctic. This spatial pattern remains same for all three studied Marine Isotope Stages. Looking at the temporal variation of the OM into the central Arctic, compared to MIS 3 and MIS 2, TOC as well as both marine and terrestrial biomarkers show enhanced concentration during MIS 1 all over the central Arctic. These increased biomarker concentrations reflect that MIS 1 was warmer with less extensive sea-ice cover than MIS 2 and MIS 3.

How to cite: Singh, A., Ho, S. L., and Löwemark, L.: Spatial and temporal distribution of organic matter in central Arctic: Insights from biomarker proxy, EGU General Assembly 2023, Vienna, Austria, 23–28 Apr 2023, EGU23-4988, https://doi.org/10.5194/egusphere-egu23-4988, 2023.

EGU23-5197 | ECS | Orals | OS1.4

A high-resolution view on mesoscale eddy activity in the Eurasian Basin 

Vasco Müller, Qiang Wang, Sergey Danilov, Nikolay Koldunov, Xinyue Li, and Thomas Jung

Mesoscale eddies might play a substantial role for the dynamics of the Arctic Ocean, making them crucial for understanding future Arctic changes and the ongoing ‘atlantification’ of the Arctic Ocean. However, simulating high latitude mesoscale eddies in ocean circulation models presents a great challenge due to their small size and adequately resolving mesoscale processes in the Arctic requires very high resolution, making simulations computationally expensive.

Here, we use a seven-year simulation from the unstructured‐mesh Finite volumE Sea ice-Ocean Model (FESOM2) with 1-km horizontal resolution in the Arctic Ocean. This very high-resolution model setup can be considered eddy resolving and has previously been used to investigate the distribution of eddy kinetic energy (EKE) in the Arctic. Now, with a simulation spanning several years, we evaluate the changes of EKE in the Eurasian Basin and the connection to other properties like sea-ice cover, baroclinic conversion rate and stratification. EKE seasonality is influenced predominantly by sea-ice changes, while monthly anomalies have different drivers for different depths levels. The mixed layer is strongly linked to the surface and thus to sea-ice variability. Deeper levels on the other hand are shielded from the surface by stratification and influenced more strongly by baroclinic conversion.

How to cite: Müller, V., Wang, Q., Danilov, S., Koldunov, N., Li, X., and Jung, T.: A high-resolution view on mesoscale eddy activity in the Eurasian Basin, EGU General Assembly 2023, Vienna, Austria, 23–28 Apr 2023, EGU23-5197, https://doi.org/10.5194/egusphere-egu23-5197, 2023.

EGU23-5605 | Posters on site | OS1.4

CMIP6/OMIP simulations of the Arctic Ocean and the impact of resolutions 

Chuncheng Guo, Qi Shu, Qiang Wang, Aleksi Nummelin, Mats Bentsen, Alok Gupta, Yang Gao, and Shaoqing Zhang

Underlying the polar climate system are a number of closely coupled processes that are interconnected through complex feedbacks on a range of temporal and spatial scales. Observations are limited in these inaccessible and remote areas, and understanding of these processes often relies on regional and global climate modelling. However, large uncertainties remain due to unresolved key processes in both the regional and global contexts.

In this presentation, we first show that large model spread and biases exist in simulating the Arctic Ocean hydrography from the latest CMIP6/OMIP experiments. Our results indicate that there are almost no improvements compared with the previous CORE-II experiments (with similar OMIP-like protocol) which were thoroughly assessed by the ocean modelling community. The model spread and biases are especially conspicuous in the simulation of subsurface halocline and Atlantic Water, the latter often being too warm, too thick, and too deep for many models. The models largely agree on the interannual/decadal variabilities of key metrics, such as volume/heat/salt transport across main Arctic gateways, as dictated by the common atmospheric forcing reanalysis.

We then examine a hierarchy of global models with horizontal resolutions of the ocean on the order of 1-deg, 0.25-deg, and 0.1-deg. For the 0.1-deg resolution, we take advantage of a recent unprecedented ensemble of high-resolution CESM simulations, as well as NorESM simulations of similar ocean resolution but of shorter integration. High(er) resolutions show signs of improvements and advantages in simulating the Arctic Ocean, but certain biases remain, which will be discussed together with the challenges of high-resolution simulations in the region.

How to cite: Guo, C., Shu, Q., Wang, Q., Nummelin, A., Bentsen, M., Gupta, A., Gao, Y., and Zhang, S.: CMIP6/OMIP simulations of the Arctic Ocean and the impact of resolutions, EGU General Assembly 2023, Vienna, Austria, 23–28 Apr 2023, EGU23-5605, https://doi.org/10.5194/egusphere-egu23-5605, 2023.

EGU23-5780 * | ECS | Orals | OS1.4 | Highlight

Marine Heatwaves in the Arctic Ocean: drivers, feedback mechanisms and interactions with sea ice 

Benjamin Richaud, Eric C.J. Oliver, Xianmin Hu, Sofia Darmaraki, and Katja Fennel

Arctic regions are warming at a rate faster than the global average. Superimposed on this trend, marine heatwaves and other extreme events are becoming more frequent and intense. Simultaneously the sea ice phenology with which these events interact is also changing. While sea ice can absorb atmospheric heat by melting and therefore acts as a heat buffer for the ocean, meltwater-induced stratification and albedo changes can provoke positive feedbacks on the heat content of the upper ocean. Disentangling those effects is key to better understanding and predicting the present and future state of the Arctic Ocean, including how it responds to forcing by extreme events. Using a three-dimensional regional ice-ocean coupled numerical model, we calculate a two-layer heat budget for the surface mixed layer of the Arctic Ocean, using a novel approach for the treatment of residuals. We present a statistical overview of the dominant drivers of marine heatwaves at the regional scale as well as more in-depth analyses of specific events in key regions of interest. The characteristics of marine heatwaves under different sea ice conditions is also considered, to identify anomalous ice-ocean interactions. Finally, potential feedback mechanisms are investigated to verify their existence and quantify their importance.

How to cite: Richaud, B., Oliver, E. C. J., Hu, X., Darmaraki, S., and Fennel, K.: Marine Heatwaves in the Arctic Ocean: drivers, feedback mechanisms and interactions with sea ice, EGU General Assembly 2023, Vienna, Austria, 23–28 Apr 2023, EGU23-5780, https://doi.org/10.5194/egusphere-egu23-5780, 2023.

EGU23-6012 | ECS | Posters on site | OS1.4

Winter Atlantic Water intrusions in Kongsfjorden: atmospheric triggering and oceanic preconditioning 

Francesco De Rovere, Jacopo Chiggiato, Leonardo Langone, Angelo Rubino, and Davide Zanchettin

Kongsfjorden is an Arctic fjord in Svalbard facing the West Spitsbergen Current (WSC) transporting warm and salty Atlantic Water (AW) through the Fram Strait to the Arctic. In this work, winter AW intrusions in Kongsfjorden occurring in the 2010-2020 decade are assessed by means of oceanographic and atmospheric observations, provided by in-situ instrumentations and reanalysis products. Winter AW intrusions are relatively common events, bringing heat and salt from the open ocean to the fjord interior; they are characterized by water temperatures rising by 1-2 °C in just a few days. Several mechanisms have been proposed to explain winter AW intrusions in West Spitsbergen fjords, tracing back to the occurrence of energetic wind events along the shelf slope. Here we demonstrate that the ocean plays a fundamental role as well in regulating the inflow of AW toward Kongsfjorden in winter.

Winter AW intrusions in 2011, 2012, 2016, 2018 and 2020 occurred by means of upwelling from the WSC, triggered by large southerly winds blowing on the West Spitsbergen Shelf (WSS) followed by a circulation reversal with northerly winds. Southerly winds are generated by the setup of a high pressure anomaly over the Barents Sea. In these winters, fjord waters are fresher and less dense than the AW current, resulting in the breakdown of the geostrophic control mechanism at the fjord mouth, allowing AW to enter Kongsfjorden. The low salinity signal is found also on the WSS and hence is related to the particular properties of the Spitsbergen Polar Current (SPC). The freshwater signal is hypothesized to be linked to the sea-ice production and melting in the Storfjorden and Barents Sea regions, as well as the accumulation of glaciers’ runoff. The freshwater transport toward West Spitsbergen is thus the key preconditioning factor allowing winter AW intrusions in Kongsfjorden by upwelling, whilst energetic atmospheric phenomena trigger the intrusions. 

Winter 2014 AW intrusion shows a different dynamic, i.e., an extensive downwelling of warm waters in the fjord lasting several weeks. Here, long-lasting southerly winds stack surface waters toward the coast. The fjord density is larger than the WSC density, forcing the AW intrusion to occur near the surface, then spreading vertically over the water column due to heat loss to the atmosphere. We hypothesize the combination of sustained Ekman transport and the shallower height of the WSC on the water column to be the key factor explaining the AW intrusion in this winter. 

After mixing with the initial AW inflow, fjord waters undergo heat loss to the atmosphere and densification. The water column becomes denser than the WSC, restoring the geostrophic control mechanism and blocking further intrusions of AW.

How to cite: De Rovere, F., Chiggiato, J., Langone, L., Rubino, A., and Zanchettin, D.: Winter Atlantic Water intrusions in Kongsfjorden: atmospheric triggering and oceanic preconditioning, EGU General Assembly 2023, Vienna, Austria, 23–28 Apr 2023, EGU23-6012, https://doi.org/10.5194/egusphere-egu23-6012, 2023.

EGU23-6564 | ECS | Orals | OS1.4

Impact of an isolated summer storm on sea ice and ocean conditions in the Canadian Basin 

Emma Bent, Camille Lique, and Peter Sutherland

The Arctic Ocean has undergone a rapid decrease of sea ice extent for decades and studies have shown that the storm activity has increased in the Arctic. Regions that are seasonally ice-opened experience a greater forcing at the surface, which affects the upper-ocean through mixing, turbulence and air-sea interactions. Previous studies have shown the local and short term impacts of wind and waves on sea ice through negative or positive feedback mechanisms. For instance, increased air-sea flux during the freezing season can lead to a cooling of the upper-ocean and favor ice formation, while an increase in wind forcing can modify the vertical profile of the mixed layer, leading to melting or formation of ice. Given the potential of the mixed layer properties to be modified locally by an increased wind/wave forcing, we question whether this type of forcing could have a seasonal effect on the mixed layer and therefore on the sea ice.

We thus use a 1D coupled ocean-sea ice model (NEMO1D-SI³) to study, in the seasonal ice zone of the Beaufort Sea, the immediate change and the seasonal evolution of the mixed layer when forced by an idealized summer storm. The response of sea ice is also examined. We conduct the experiment for a range of storms varying in intensity, duration and date of forcing. Compared to a situation with no increased forcing, we first find that summer storms thicken the mixed layer through mixing which increases the upper-ocean heat content. In the fall, ice formation is consequently delayed for a maximum of 2 weeks compared to a situation with no increased forcing. Secondly, we show that storm-induced thick mixed layers isolate the sea ice from sub-surface warm waters, allowing for efficient ice growth. Ice is consequently thicker at the end of winter compared to a situation with no increased forcing (maximum difference of 10 cm). Thirdly, we find that these results are amplified for storms that happen earlier in summer and have a strong momentum input to the ocean. Our results suggest that localized storms could be a significant driver of the seasonal evolution of the mixed layer and the sea ice.

How to cite: Bent, E., Lique, C., and Sutherland, P.: Impact of an isolated summer storm on sea ice and ocean conditions in the Canadian Basin, EGU General Assembly 2023, Vienna, Austria, 23–28 Apr 2023, EGU23-6564, https://doi.org/10.5194/egusphere-egu23-6564, 2023.

EGU23-6699 | ECS | Orals | OS1.4

Investigating ventilation and saturation dynamics in the Arctic Ocean using noble gas tracer techniques 

Yannis Arck, Lennart Gerke, Edith Engelhardt, Florian Freundt, Julian Robertz, Stanley Scott, David Wachs, Markus Oberthaler, Toste Tanhua, and Werner Aeschbach

Timescales of ventilation of the Arctic Ocean are still only poorly known. The commonly used tracers for ocean ventilation studies like CFCs and SF6 are limited to young water masses that are either close to the surface or in highly ventilated deep waters. The radioisotope 39Ar with its half-life of 269 years covers time scales of 50 to 1000 years, perfectly suitable to investigate ventilation timescales of deep and intermediate water masses within the Arctic Ocean. The new measurement technique called Argon Trap Trace Analysis (ArTTA) only requires samples sizes of a few liters of ocean water, instead of the previous low-level counting method, which required about 1000 liters of water. The benefit for ocean studies is evident, much more samples can be taken during one cruise if ArTTA is applied. This enables a better resolution of the water column in great depths at the desired sampling location in the Arctic Ocean. Combined with the additional data of the CFC-12 and SF6 measurements, ventilation timescales of the complete water column from surface to bottom are obtained by constraining transit time distributions via this multi-tracer approach.

Another focus of this study is the saturation of all gaseous transient tracers. It is determined by surface conditions as well as interior mixing processes. Measurements of stable noble gas isotopes (He, Ne, Ar, Kr, Xe) are used to determine possible saturation anomalies that arise during air bubble dissolution, rapid cooling and subduction, or ice formation and subsequent interior mixing of water masses. These saturation distortions for different boundary conditions are of key importance to correct the input function for gas tracers in the Arctic Ocean and hence to constrain the ventilation timescales. The uncertainty of the age distributions will be reduced, and ocean circulation models can be improved.

This contribution presents first stable and radioactive noble gas results of the project Ventilation and Anthropogenic Carbon in the Arctic Ocean (VACAO), which is part of the Synoptic Arctic Survey carried out in summer 2021 on the Swedish icebreaker Oden.

How to cite: Arck, Y., Gerke, L., Engelhardt, E., Freundt, F., Robertz, J., Scott, S., Wachs, D., Oberthaler, M., Tanhua, T., and Aeschbach, W.: Investigating ventilation and saturation dynamics in the Arctic Ocean using noble gas tracer techniques, EGU General Assembly 2023, Vienna, Austria, 23–28 Apr 2023, EGU23-6699, https://doi.org/10.5194/egusphere-egu23-6699, 2023.

EGU23-6724 | Orals | OS1.4

On the realism of Arctic Ocean transports in CMIP6 

Susanna Winkelbauer, Michael Mayer, and Leopold Haimberger

This contribution evaluates key components of the Arctic energy budget as represented by the Coupled Model Intercomparison Project Phase 6 (CMIP6) against reanalyses and observations.

The Arctic regions are characterized by a net energy loss to space, which is balanced by northward heat transports in atmosphere and ocean. Mean and variability in the oceanic northward heat transports have major impacts on the state and change of the Arctic Ocean and sea ice. Therefore, an accurate representation of oceanic transports in climate models is a key feature to realistically simulate the Arctic climate. However, the nature of curvilinear ocean model grids and the variety of different grid types used in the CMIP ensemble, make the calculation of oceanic transports on their native grids difficult and time consuming. We developed new tools that enable the precise calculation of volume, heat, salinity and ice transports through any desired oceanic sections or straits for a large number of CMIP6 models as well as ocean reanalyses. Our tools operate on native grids and hence avoid biases that often arise from interpolation to regular grids. Those tools will be made available as open-source Python package enabling easy and effortless calculations of oceanic transports.

In the work presented here, we use the newly developed tools to compare oceanic heat transports (OHT) through the main Arctic gateways from CMIP6 models and reanalyses to those gained from observations and analyze them concerning their annual means, seasonal cycles and trends. We find strong connections between the Arctic’s mean state and lateral OHT, with variations in OHT having major effects on the sea ice cover and ocean warming rate.

Results help us to understand typical model biases. For instance, many models feature systematic biases in oceanic transports in the Arctic main gateways, e.g., some models feature to high sea ice extents due to the underestimation of heat transports entering the Arctic through the Barents Sea Opening. Using those results it is possible to generate physically based metrics to detect outliers from the model ensemble, which may be useful in reducing the spread of future projections of Arctic change.

How to cite: Winkelbauer, S., Mayer, M., and Haimberger, L.: On the realism of Arctic Ocean transports in CMIP6, EGU General Assembly 2023, Vienna, Austria, 23–28 Apr 2023, EGU23-6724, https://doi.org/10.5194/egusphere-egu23-6724, 2023.

EGU23-7774 | ECS | Posters on site | OS1.4

Upper Arctic Ocean properties and water mass pathways during the year-round MOSAiC expedition in the context of historical observations 

Myriel Vredenborg, Wiebke Körtke, Benjamin Rabe, Maren Walter, Sandra Tippenhauer, and Oliver Huhn

The Arctic Ocean is characterized by complex processes coupling the atmosphere, cryosphere, ocean and land, and undergoes remarkable environmental changes due to global warming. To better understand this system of physical, biogeochemical and ecosystem processes, as well as recent changes was the aim of the Multidisciplinary drifting Observatory for the Study of Arctic Climate (MOSAiC) ice drift conducted year-round from autumn 2019 to autumn 2020. Here, we focus on the properties and circulation pathways of upper Arctic Ocean water masses that have been found to change in recent decades, likely in response to changes in sea ice, surface fluxes, and advection of air masses under Arctic amplification.

We use hundreds of hydrographic profiles obtained with two Conductivity Temperature Depth (CTD) systems mounted to rosette water samplers from the drifting ship and at a remote location on the ice to investigate the properties of the polar mixed layer, halocline waters and warm water of Atlantic origin (“Atlantic Water”) in the Eurasian Arctic during the MOSAiC campaign. Additionally, we analyse chemical tracers (noble gases and anthropogenic tracers CFC-12 and SF6) measured from water samples taken with both CTD/Rosette systems to identify pathways of the water masses. We compare these observations with a comprehensive dataset of historical hydrographic data from the region to put our findings into a long-term context.

We find a shoaling and thickening of the Atlantic-Water layer compared to historical observations, as well as signatures of interleaving at the core of the warm Atlantic Water that slowly get eroded during the drift. Along the MOSAiC track the hydrographic data show convective lower halocline waters that are typically formed north of Fram Strait and further downstream, as well as advective-convective lower halocline waters typically formed in the Barents Sea. We see a change in lower halocline properties in the eastern Amundsen Basin compared to historical observations, that could either be caused by local formation or a change in circulation. Further, we use the chemical tracers to investigate possible pathways and formation regions of the observed water masses.

How to cite: Vredenborg, M., Körtke, W., Rabe, B., Walter, M., Tippenhauer, S., and Huhn, O.: Upper Arctic Ocean properties and water mass pathways during the year-round MOSAiC expedition in the context of historical observations, EGU General Assembly 2023, Vienna, Austria, 23–28 Apr 2023, EGU23-7774, https://doi.org/10.5194/egusphere-egu23-7774, 2023.

EGU23-8320 | ECS | Posters on site | OS1.4

Tracing Atlantic water exiting the Fram Strait and its transit in the Arctic Ocean by isolating reprocessing-derived 236U and colored dissolved organic matter 

Gang Lin, jixin Qiao, Rafael Gonçalves‐Araujo, Peter Steier, Paul Dodd, and Colin Stedmon

The Fram Strait, located between Svalbard and Greenland is an important gateway for exchange of salt and heat between the Arctic Ocean and the North Atlantic Ocean and is also a geographically crucial region for investigating Atlantic water transport pathways and transit times, which are necessary to understand the progress of environmental changes in the Arctic. 236U from the two European nuclear reprocessing plants (RPs) at La Hague (LH) and Sellafield (SF) provides a unique signal in Atlantic water for studying its circulation pattern in the Arctic Ocean. In this study we first isolate RP-derived 236U (236URP) using the characteristic 233U/236U signature and then use colored dissolved organic matter (CDOM) to indicate transit pathways and therefore constrain the selection of appropriate 236URP input functions. High CDOM absorbance in the Fram Strait reflects the passage of Atlantic water transported to the Arctic by the Norwegian Coastal Current (NCC) and subsequently along the Siberian shelf where the Ob, Yenisei and Lena rivers supply terrestrial organic matter with high CDOM levels. Conversely low CDOM water represents Atlantic water that has remained off the shelf. Based on CDOM absorbance, potential temperature (θ) and water depth the path of a given body of Atlantic water could be determined and an appropriate RP input function selected so that transit times could be estimated. Waters with high CDOM levels sourced from the NCC and Barents Sea branch water (BSBW) had an average Atlantic water transit time of 12 years. Waters with low CDOM,  θ < 2 °C, and depth < 1500 m were sourced from the Norwegian Atlantic Current (NwAC), had little interaction with riverine freshwater with an advective Atlantic water transit time of 26 years.

How to cite: Lin, G., Qiao, J., Gonçalves‐Araujo, R., Steier, P., Dodd, P., and Stedmon, C.: Tracing Atlantic water exiting the Fram Strait and its transit in the Arctic Ocean by isolating reprocessing-derived 236U and colored dissolved organic matter, EGU General Assembly 2023, Vienna, Austria, 23–28 Apr 2023, EGU23-8320, https://doi.org/10.5194/egusphere-egu23-8320, 2023.

EGU23-9367 | ECS | Posters on site | OS1.4

Wind forcing and tides mediate transport of ocean heat from Storfjordrenna to the Arctic domain of the Barents Sea 

Kjersti Kalhagen, Ragnheid Skogseth, Ilker Fer, Till M. Baumann, and Eva Falck

The Barents Sea is undergoing changes with impacts on the physical environment, e.g., the seasonal sea ice formation and extent and with large consequences for the ecosystems. There are knowledge-gaps concerning the complex pathways of Atlantic Water (AW) through the Barents Sea and the associated distribution of heat and nutrients. Records from a mooring deployed between September 2018 and November 2019 on the 70 m deep saddle between Edgeøya and Hopen islands in the Svalbard archipelago show sporadic exchange between the AW-influenced trough Storfjordrenna and the Arctic domain of the north-western Barents Sea. Forced by sea surface anomalies, the observed currents show a tendency for eastward transport across the saddle year-round. However, the eastward overflow into the Barents Sea is strongly mediated by wind forcing: The predominant north-northeasterly winds with corresponding geostrophic adjustment to Ekman transport tend to hamper and sometimes even reverse this cross-saddle current. Weaker and/or southerly winds on the other hand tend to enhance the eastward flow into the Barents Sea. The strength and shape of the overflow current vary substantially on seasonal and sub-seasonal timescales: during autumn and winter, the current is strong and barotropic, while during summer, the current is weaker and more baroclinic. On shorter time scales, the strongest oscillations occur during the ice-free autumn with a periodicity of a few days. When the area has a partial sea ice cover in winter, the strength decreases and the periodicity increases to a week or more. Further analysis of variability in temperature and current velocity shows that cross-saddle transport of positive temperature anomalies (indicating heat from waters of Atlantic origin) is evident in frequency bands associated with various drivers of mesoscale variability, such as eddies, synoptic events, and tides. There are indications that the studied area will become an increasingly important location for heat transport into the interior of the Barents Sea: A comparison between historical and recent hydrographic records show that AW is warming and shoaling in the water column in Storfjordrenna, which suggests that AW will be more easily transported across the saddle by the mentioned drivers. Furthermore, the ongoing changes in the large-scale weather patterns resulting in more southerly and southwesterly winds is hypothesized to affect the strength and persistence of the overflow on the saddle between Edgeøya and Hopen islands.

How to cite: Kalhagen, K., Skogseth, R., Fer, I., Baumann, T. M., and Falck, E.: Wind forcing and tides mediate transport of ocean heat from Storfjordrenna to the Arctic domain of the Barents Sea, EGU General Assembly 2023, Vienna, Austria, 23–28 Apr 2023, EGU23-9367, https://doi.org/10.5194/egusphere-egu23-9367, 2023.

EGU23-9887 | ECS | Posters virtual | OS1.4

An updated observational record of Davis Strait ocean transports, 2004-2017 

Jed Lenetsky, Craig Lee, Clark Richards, and Alexandra Jahn

The Davis Strait, located in Southern Baffin Bay between Greenland and the Canadian Arctic Archipelago, is a key gateway of oceanic exchange between the Arctic and North Atlantic Oceans. Large fluxes of fresh Arctic Waters through the Davis Strait potentially influence deep-water formation in the Labrador Sea, with implications for the strength of the Atlantic Meridional Overturning Circulation. From 2004-2017, and 2020-present, ocean temperatures, salinities, and velocities have been measured along a moored array spanning the entire strait, allowing for ocean transports to be assessed over both the continental shelves and central channel. Here we will present new data from 2011-2017, extending the previously published data for 2004-2010. Furthermore, the whole record has been updated, filling spatial and short temporal data gaps using average temperature, salinity, and velocity sections from high resolution Seaglider surveys from 2004 to 2010. These updated volume, freshwater, and watermass transports will increase understanding of changing oceanic conditions in Baffin Bay, as well as local and remote physical mechanisms that govern the Davis Strait throughflow on synoptic to interannual timescales.

How to cite: Lenetsky, J., Lee, C., Richards, C., and Jahn, A.: An updated observational record of Davis Strait ocean transports, 2004-2017, EGU General Assembly 2023, Vienna, Austria, 23–28 Apr 2023, EGU23-9887, https://doi.org/10.5194/egusphere-egu23-9887, 2023.

Everything that happens in the Arctic Ocean, be it of physical, biological, or chemical nature, is constrained by the vertical distribution of heat and salt. In this talk, I will share recent results and on-going work aimed at examining questions directly related to vertical mixing below sea ice: (1) How accurately are the physical properties of the Canada Basin simulated in climate models? (2) How do observed changes to the size and speed of a sea ice floe and ocean stratification impact ocean mixing in 2D numerical simulations? (3) Can we, for the first time, examine seasonal ice-ocean boundary layer dynamics in a 20 m × 10 m × 3 m outdoor saltwater pool?

Our results indicate that the majority of climate models do not accurately simulate the surface freshening trend observed in the Canada Basin between 1975 and 2006-2012, nor do they simulate heat from Pacific Water in the same region. We suggest that both of these biases can be partly attributed to unrealistically deep vertical mixing in the models. We next explore one possible source of this model bias related to decadal changes to the underside of ice floes, called ice keels. Results from idealized numerical simulations highlight the importance of ice keel depth, which controls the range over which ocean mixing occurs, as well as ice keel speed and ocean stratification. Further, we estimate that observational uncertainties related to ice keel depth may translate into uncertainties in the sign of current and future changes to below-ice momentum transfer into the ocean. Lastly, we present the instrument setup for our 2022-2023 pilot experiment and on-going outreach work at the Sea-ice Environmental Research Facility (SERF) in Canada. This is a unique facility centres around an outdoor saltwater pool where sea ice evolves under natural atmospheric conditions in a semi-idealized and well-instrumented setting.

How to cite: Rosenblum, E. and the Team: Exploring ice-ocean boundary layer dynamics in climate models, idealized simulations, and outdoor lab experiments, EGU General Assembly 2023, Vienna, Austria, 23–28 Apr 2023, EGU23-10302, https://doi.org/10.5194/egusphere-egu23-10302, 2023.

EGU23-10365 | Orals | OS1.4

Causal Mechanisms of Rising Sea Level and Increasing Freshwater Content of the Beaufort Sea 

Ichiro Fukumori, Ou Wang, and Ian Fenty

Over the last two decades, sea-level across the arctic’s Beaufort Sea has been rising an order of magnitude faster than its global mean. This rapid sea-level rise is mainly a halosteric change, reflecting an increase in Beaufort Sea’s freshwater content. The rising volume of freshwater is greater than that associated with the Great Salinity Anomaly of the 1970s, raising the prospect of future disruptions in large-scale ocean circulation and climate. Here we provide a new perspective of this Beaufort Sea variation using a global data-constrained ocean and sea-ice model of the Estimating the Circulation and Climate of the Ocean (ECCO) consortium. Causal relationships are quantified using the model’s adjoint. Controlling processes are elucidated analyzing property budgets.

The study reveals the multi-decadal variation to be driven jointly by change in wind stress and sea-ice melt. Strengthening anticyclonic winds surrounding the Beaufort Sea intensify the ocean’s lateral Ekman convergence of relatively fresh near-surface waters. The strengthening winds also enhance convergence of sea-ice and ocean heat that increase the amount of Beaufort Sea’s sea-ice melt. Whereas the region’s direct wind-driven kinematic anomalies equilibrate over weeks, sea-ice-melt-driven diabatic changes persist for years owing to Beaufort Sea’s semi-enclosed gyre circulation. The growing disparity between where sea-ice forms and where it melts results in this rare example of melting floating ice causing large-scale sea-level rise. The spin-up difference suggests that, on their own, the sea-ice-melt-driven diabatic change will last much longer than the direct wind-driven kinematic anomaly.

The study highlights the importance of observations and the utility of ECCO’s modeling system. While ocean and sea-ice observations are essential in diagnosing the change, the study also points to a need for expanded observations of the atmosphere, especially the winds that act on the ocean/sea-ice system. ECCO is implementing a novel “point-and-click” interface for analyzing its modeling system, such as conducted here, without requirements for expertise in numerical modeling, and invites exploitation of its new utility (https://ecco-group.org).

How to cite: Fukumori, I., Wang, O., and Fenty, I.: Causal Mechanisms of Rising Sea Level and Increasing Freshwater Content of the Beaufort Sea, EGU General Assembly 2023, Vienna, Austria, 23–28 Apr 2023, EGU23-10365, https://doi.org/10.5194/egusphere-egu23-10365, 2023.

Black carbon (BC) is one of the most important absorbing particles in the atmosphere. BC can reduce the albedo of snow/ice and enhance the absorption of solar radiation at ultraviolet (UV) and visible wavelengths when it deposited on snow/ice surface. The deposition of BC can lead to an acceleration of the melting of snow/ice. To quantify the changing process of BC in snow/ice and its contribution to the melting of snow/ice, a series of sensitivity numerical experiments including the impacts of BC species (hydrophobic and hydrophilic), deposition rate, and scavenging efficiency of BC was completed using the Icepack one-dimensional column model of CICE. Further, we evaluate the effects of BC deposition on Arctic albedo and ice thickness, forced by ERA5 reanalysis data and BC deposition rate from CMIP6, including two simulation results of the historical experiments with GISS-E2 model and EC-Earth3 model. The results indicate that the hydrophobic BC can cause a reduction of snow/ice albedo by 0.43% in the melting season, which is 35% larger than hydrophilic BC with the same deposition rate. When only the hydrophilic BC was considered, the impact on scavenging efficiency halved to BC content in snow/ice is similar to double the deposition rate in the melting season. Additionally, the 2D model results indicate that the existence of BC in snow could enhance the absorption of solar radiation in the snow layer and reduce the transmittance of radiation to the ice layer, leading to a thicker ice thickness before the melting season. The thermodynamic impact of BC is more significant in the marginal ice zone than that in the central Arctic, especially from Barents Sea to Laptev Sea. In this paper, we quantify the effects of BC on the melting of Arctic snow and sea ice and discuss the problems of the parameterizations of BC’s effect. This may contribute to the improvement of the sea ice model.

Key words: Black carbon; CICE model; Sensitivity experiment; Scavenging efficiency; Albedo

How to cite: Wang, Y. and Su, J.: Sensitivity study of the effects of black carbon on Arctic sea ice using CICE sea-ice model, EGU General Assembly 2023, Vienna, Austria, 23–28 Apr 2023, EGU23-10572, https://doi.org/10.5194/egusphere-egu23-10572, 2023.

EGU23-10826 | Posters on site | OS1.4

13-Year Observation of the CH4 across the sea surface in the Western Arctic Ocean 

Tae Siek Rhee, Young Shin Kwon, Mi-Seon Kim, Scott Dalimore, Charles Paull, Jong Kuk Hong, and Young Keun Jin

Methane (CH4) is one of the most important greenhouse gases on Earth. Recent finding of the strong CH4 emissions in the Arctic Seas with shrinking the sea ice may amplify the Arctic warming leading to the positive feedback in the Arctic climate. Korea Polar Research Institute (KOPRI) has ongoing interest in Arctic environmental conditions including the potential release of the CH4 from the seabed to the water column and finally, further to the atmosphere. During the last 13 years throughout a series of campaigns on the Korean ice-breaker, R/V Araon, we measured CH4 concentrations at the surface ocean and overlying air in summer season to estimate the emissions from the western arctic seas including the Chukchi Sea, the Beaufort Sea, and the East Siberian Sea. We compare each of these seas and the Central Arctic Ocean covering the deep Arctic Ocean basin. The surface ocean showed super-saturation almost everywhere with respect to the CH4 in the overlying air. Nonetheless, we have insufficient regional coverage to assess any possible saturation anomaly trend in each sea. Flux densities of outgassing CH4 are modestly larger than the global mean value of the continental shelf except for the Central Arctic Ocean where the CH4 emission is slightly lower. Our estimate of CH4 emission in the East Siberian Sea is far larger than other Arctic Seas abiding by the previous observations, but its magnitude is far lower due likely to the distance from the hot spot area. Future methane flux studies should be extended to shallow, nearshore environments where rate of permafrost degradation should be greatest in response to ongoing marine transgression.

How to cite: Rhee, T. S., Kwon, Y. S., Kim, M.-S., Dalimore, S., Paull, C., Hong, J. K., and Jin, Y. K.: 13-Year Observation of the CH4 across the sea surface in the Western Arctic Ocean, EGU General Assembly 2023, Vienna, Austria, 23–28 Apr 2023, EGU23-10826, https://doi.org/10.5194/egusphere-egu23-10826, 2023.

EGU23-10840 | Posters on site | OS1.4

Upper Arctic Ocean Properties and Relationships with Sea Ice in CMIP6 Historical Simulations 

Wei Cheng, Cecilia Bitz, Lettie Roach, Edward Blanchard-Wriggleworth, Mitch Bushuk, and Qiang Wang

While current-generation CMIP and OMIP models have clear biases in their upper Arctic Ocean hydrography, it is less clear how these biases impact the models' ability to simulate the observed Arctic sea ice mean state and trends. In this study we seek to quantify cross-relationship between sea ice and ocean states in CMIP6 historical simulations and identify common model behaviors. Multi-model mean (MMM) simulations exhibit accelerated changes in the ice and ocean system since the late 20th century. Underlying the MMM is strong inter-model variation in the simulated ice and ocean mean states and their temporal variability including trends. Despite such inter-model differences, all models show a similar ratio between sea ice reduction and upper ocean warming such that models with higher ocean warming also have higher SIE reduction and vice versa. Our results also highlight the urgent needs of reliable Arctic Ocean observations or data products in order to better contextualize modeling results.

How to cite: Cheng, W., Bitz, C., Roach, L., Blanchard-Wriggleworth, E., Bushuk, M., and Wang, Q.: Upper Arctic Ocean Properties and Relationships with Sea Ice in CMIP6 Historical Simulations, EGU General Assembly 2023, Vienna, Austria, 23–28 Apr 2023, EGU23-10840, https://doi.org/10.5194/egusphere-egu23-10840, 2023.

EGU23-10871 | Orals | OS1.4

A First Look at Surface Ocean Measurements during the SASSIE Field Campaign in 2022 

Julian Schanze and the Salinity and Stratification at the Sea Ice Edge (SASSIE)

The NASA Salinity and Stratification at the Sea Ice Edge (SASSIE) field campaign took during place between August and October of 2022. Using three major components, the aim is to understand the relationship between both haline and thermal stratification and sea-ice advance, and to test the hypothesis that a significant fresh layer at the surface can accelerate the formation of sea ice by limiting convective processes. The three components of the field campaign include: 1) A one-month shipboard hydrographic and atmospheric survey in the Beaufort Sea, 2) A concurrent airborne campaign to observe ocean salinity, temperature, and other parameters from a low-flying aircraft, and 3) The deployment of autonomous assets, buoys, and floats that are able to observe both the melt season and the sea ice advance.

Here, we focus on the novel results from the month-long research cruise aboard the R/V Woldstad that took place during September and October of 2022, particularly measurements of salinity and temperature at radiometric depths (1-2 cm) from the salinity snake instrument. These measurements will be contextualized with all other components of the cruise, including uCTD, air-sea flux, airborne, and satellite data to examine the effects of stratification on ocean dynamics in the Beaufort Sea near at the sea ice edge.

How to cite: Schanze, J. and the Salinity and Stratification at the Sea Ice Edge (SASSIE): A First Look at Surface Ocean Measurements during the SASSIE Field Campaign in 2022, EGU General Assembly 2023, Vienna, Austria, 23–28 Apr 2023, EGU23-10871, https://doi.org/10.5194/egusphere-egu23-10871, 2023.

EGU23-11483 | ECS | Posters on site | OS1.4

The Sea Ice Drift Forecast Experiment (SIDFEx): Introduction and applications 

Valentin Ludwig and Helge Gößling and the SIDFEx Team

We introduce the Sea Ice Drift Forecast Experiment (SIDFEx) database. SIDFEx is a collection of close to 180,000 lagrangian drift forecasts for the trajectories of specified assets (mostly buoys) on the Arctic and Antarctic sea ice, at lead times from daily to seasonal scale and mostly daily resolution. The forecasts are based on systems with varying degrees of complexity, ranging from free-drift forecasts to forecasts by fully coupled dynamical general circulation models. Combining several independent forecasts allows us to construct a best-guess consensus forecast, with a seamless transition from systems with lead times of up to 10 days to systems with seasonal lead times. The forecasts are generated by 13 research groups using 23 distinct forecasting systems and sent operationally to the Alfred-Wegener-Institute, where they are archived and evaluated. Many systems send forecasts in near-real time.

One key purpose when starting SIDFEx in 2017 was to find the optimal starting position for the Multidisciplinary Drifting Observatory for the Study of Arctic Climate (MOSAiC). Over the years, more applications evolved: During MOSAiC, the SIDFEx forecasts were used for ordering high-resolution TerraSAR-X images in advance, with a hit rate of 80%. During the Endurance22 expedition, we supported the onboard team with near-real time forecasts, contributing to the success of the mission. Currently, we evaluate drift forecasts for several buoys of the MOSAiC Distributed Network (DN). We know that there is skill in predicting the location of single buoys. Now, we extend this to studying the deformation of the polygon spanned by the DN buoys. Deformation is derived from the spatial velocity derivatives of the buoy array. We find low correlation coefficients between the deformation in the models and the observed deformation for a small-scale DN configuration, but larger and significant correlations around 0.7 for larger configurations and an Arctic-wide buoy array.

How to cite: Ludwig, V. and Gößling, H. and the SIDFEx Team: The Sea Ice Drift Forecast Experiment (SIDFEx): Introduction and applications, EGU General Assembly 2023, Vienna, Austria, 23–28 Apr 2023, EGU23-11483, https://doi.org/10.5194/egusphere-egu23-11483, 2023.

EGU23-12014 | Posters on site | OS1.4

Summer Net Community Production in the northern Chukchi Sea: Comparison between 2017 and 2020 

Doshik Hahm, Soyeon Kwon, Inhee Lee, Keyhong Park, Kyoung-Ho Cho, Jinyoung Jung, Taewook Park, Youngju Lee, Chanhyung Jeon, and Seongbong Seo

The Arctic Ocean experiences warming-induced processes, such as the decrease in sea-ice extent and freshening of the surface layer. While these processes have the potential to alter primary production and carbon export to the deep layer, the changes that will likely occur in them  are still poorly understood. To assess the potential changes in net community production (NCP), a measure of biological carbon export to the deep layer, in response to climate change, we observed the O2/Ar at the surface of the northern Chukchi Sea in the summers of 2017 and 2020. The NCP estimates derived from O2/Ar measurements were largely in the range of 1 -- 11 mmol O2 m-2 d-1 in the northern Chukchi and Beaufort Seas, close to the lower bounds of the values in the global oceans. The average NCP of 1.5 ± 1.7 mmol O2 m-2 d-1 in 2020 was substantially lower than 7.1 ± 7.4  mmol O2 m-2 d-1  in 2017, with the most pronounced decrease occurring in the ice-free region of the northern Chukchi Sea; the NCP of the ice-free region in 2020 was only 12% of that in 2017. The decrease in 2020 was accompanied by a lower salinity of >2, which resulted in shallower mixed layer depths and stronger stratification. We speculated that the anomalously low pressure near the east Russian coast and the lack of strong winds contributed to the strong stratification in 2020. With a continuing decrease in the extent of sea ice, the northern Chukchi Sea will likely experience earlier phytoplankton blooms and nitrate exhaustion. Unless winds blow strong enough to break the stratification, the biological carbon export in late summer is likely to remain weak.  

How to cite: Hahm, D., Kwon, S., Lee, I., Park, K., Cho, K.-H., Jung, J., Park, T., Lee, Y., Jeon, C., and Seo, S.: Summer Net Community Production in the northern Chukchi Sea: Comparison between 2017 and 2020, EGU General Assembly 2023, Vienna, Austria, 23–28 Apr 2023, EGU23-12014, https://doi.org/10.5194/egusphere-egu23-12014, 2023.

EGU23-12032 | ECS | Orals | OS1.4

Anthropogenic Carbon in the Arctic Ocean: Perspectives from different TTD Approaches and Tracer Pairs 

Lorenza Raimondi, Anne-Marie Wefing, and Núria Casacuberta Arola

At present, it is well-known that the fast increase in atmospheric carbon dioxide (CO2) concentrations resulting from human activities (Cant), drives the dramatic changes observed in our environment such as global warming and ocean acidification. The Arctic Ocean has been identified as one of the fastest-changing regions of the world ocean and can therefore be considered as a sentinel for future global scenarios.

Here, Cant-rich waters coming from the Atlantic Ocean become isolated from the atmospheric input of CO2 as they flow at an intermediate depth below the mixed layer, making the Arctic Ocean a key region for intermediate-to-long-term storage of Cant. Despite having such an important role, the magnitude of the Cant inventory and its change over time in the region is yet not fully understood, particularly if we are to consider future changes in ice coverage and therefore ocean circulation.

A way of estimating oceanic Cant inventories is by applying the so-called Transit Time Distribution (TTD) method, which implies the use of transient tracers such as the anthropogenically produced CFC-12 and SF6.

In this work we present a new estimate of Cant inventory for the Arctic Ocean in 2015 assessed with the TTD method using both well-established tracers (CFC-12 and SF6, both having a global source) as well as novel ones (anthropogenic radionuclides 129I and 236U, both having primarily a point-like source represented by European nuclear reprocessing plants, as well as a global one represented by the global fallout from nuclear bomb testing).

The TTD was here applied following a relatively novel approach to infer the statistical parameters that describe the age distribution within a water sample, the mean (G) and the width (D). Unlike the “classical TTD” approach, the one used in this study allows the statistical parameters of the TTD to be constrained for each individual sample rather than finding values that are most representative of the region and time studied. We first show a comparison of the two TTD approaches by comparing mean and mode ages as well D/G ratios of this study (new TTD method) to those presented in Rajasakaren et al. 2019 (classical TTD method), using CFC-12 and SF6 as our tracers’ pair. We then compare TTD results obtained from the two tracers’ pairs, CFC-12/SF6 and 129I-/236U, using the new TTD method.

Finally, we estimate and compare Cant concentrations and inventories obtained with the two pairs of transient tracers to one-another as well as to previous estimates of Cant in the region by Rajasakaren et al (2019) obtained with the “classical TTD”. This study demonstrates for the first time the feasibility of using anthropogenically produced radionuclides with input functions and chemical properties different than CO2 as proxies for Cant estimates.  

How to cite: Raimondi, L., Wefing, A.-M., and Casacuberta Arola, N.: Anthropogenic Carbon in the Arctic Ocean: Perspectives from different TTD Approaches and Tracer Pairs, EGU General Assembly 2023, Vienna, Austria, 23–28 Apr 2023, EGU23-12032, https://doi.org/10.5194/egusphere-egu23-12032, 2023.

EGU23-12592 | ECS | Posters on site | OS1.4

Seasonality and regionality of the vertical structure of the water column in the Arctic Ocean. 

Lucia Gutierrez-Loza and Siv K. Lauvset

The Arctic Ocean is rapidly changing in response to high temperatures and increased atmospheric greenhouse gas concentrations.  As part of these changing conditions, sea-ice loss and increased freshwater inputs are expected to impact the mixing processes and the characteristics of water column in the Arctic region, directly modulating the nutrient availability and primary productivity in the surface water.

Here, we investigate the spatial and temporal variations of the vertical structure of the water column using high-resolution model outputs for the period 2000-2099. We focus on the Atlantic sector of the Arctic, an increasingly temperature-stratified region, where we evaluate the changes on nutrient availability and carbonate chemistry in the upper ocean. Changes in the regionality and seasonality under a medium- to high-end emission scenario (SSP3-7.0), transitioning towards a sea-ice free Arctic, will be used to further understand the upper ocean mixing processes and their impacts on the local and regional biogeochemistry.

How to cite: Gutierrez-Loza, L. and Lauvset, S. K.: Seasonality and regionality of the vertical structure of the water column in the Arctic Ocean., EGU General Assembly 2023, Vienna, Austria, 23–28 Apr 2023, EGU23-12592, https://doi.org/10.5194/egusphere-egu23-12592, 2023.

EGU23-12658 | Orals | OS1.4

Arctic Ocean mixing maps inferred from pan-Arctic observations 

Stephanie Waterman, Hayley Dosser, Melanie Chanona, Nicole Shibley, and Mary-Louise Timmermans

Quantifying ocean mixing rates in the Arctic Ocean is critical to our ability to predict upwards oceanic heat flux, freshwater distribution, and circulation. However, direct ocean mixing measurements in the Arctic are sparse and cannot characterize the high spatiotemporal variability typical of ocean mixing. Further, latitude, ice, and stratification make the Arctic Ocean mixing environment unique, with all of double-diffusive (DD), internal wave (IW)-driven and non-turbulent mixing processes playing a role.

In this work, we use year-round temperature and salinity data from Ice-Tethered Profilers (ITPs), as well as an archived record of ship-based measurements, to construct highly-resolved, pan-Arctic maps characterizing the relative prevalence of DD, IW-driven and non-turbulent mixing mechanisms based on thermohaline staircase identification and estimations of turbulence intensity. We next quantify pan-Arctic maps of estimates of average effective vertical diffusivity inferred from these observations that account for all of DD, IW-driven, and non-turbulent mixing processes. Finally, focusing on the water column segment directly above the Atlantic Water (AW) temperature maximum, we use this mixing regime characterization and regime-specific estimates of effective diffusivity to compute estimates of the pan-Arctic distributions of average vertical heat and buoyancy flux from the AW layer.

We find that estimates of effective vertical diffusivities are highly variable in both space and time. Although variability in diffusivity reflects both variations in the prevalence of the various mixing processes and variability in the strength of IW-driven mixing, the prevalence of the mixing mechanisms (predominantly DD and non-turbulent in the basins vs. IW-driven on the shelf) sets the dominant large-scale spatial patterns and the notable shelf-basin contrast. Estimated heat fluxes out of the AW layer also exhibit distinct regional patterns set by mixing mechanism prevalence and regional patterns in the vertical temperature gradient. Buoyancy fluxes from DD mixing compete with the destabilizing effects of IW-driven mixing in the basins, a competition that may be an important control on stratification in the Arctic Ocean interior.

These results are significant as they show that mixing mechanism prevalence is an important consideration in computing robust estimates of average effective diffusivity. They further suggest that the sensitivity of mixing rates to changing environmental conditions may have important regional dependencies owing to differing prevalence of the various mixing processes.

How to cite: Waterman, S., Dosser, H., Chanona, M., Shibley, N., and Timmermans, M.-L.: Arctic Ocean mixing maps inferred from pan-Arctic observations, EGU General Assembly 2023, Vienna, Austria, 23–28 Apr 2023, EGU23-12658, https://doi.org/10.5194/egusphere-egu23-12658, 2023.

EGU23-13807 | Posters on site | OS1.4

The MOSAiC webODV: Interactive online data exploration, visualization and analysis 

Sebastian Mieruch, Ingrid Linck Rosenhaim, and Reiner Schlitzer

In the frame of the M-VRE (The MOSAiC virtual research environment, https://mosaic-vre.org) project we have set up a webODV application, to serve data from the arctic MOSAiC (https://mosaic-expedition.org) expedition.

webODV is deployed at AWI's computing center under https://mvre.webodv.cloud.awi.de. MOSAiC data have been retrieved from the long-term archive Pangaea (https://pangaea.de). To get the most out of the data with webODV, we have harmonized, aggregated and compiled the datasets into different separated and interdisciplinary data collections.

webODV is operated interactively in the browser via the mouse and keyboard (no programming), it's fast, efficient and easy to use for exploring, visualizing, analyzing, downloading data, creating map projections, scatter plots, section plots, surface plots and station plots and many more.

webODV supports the FAIR data principles and analyses and visualizations are fully reproducible using our so-called "xview" files that can be shared among colleagues or attached to publications. We provide real-time sharing, full author traceability and downloadable lists of all the DOI's used in the analysis or the respective .bib or .ris files including all citations. Extensive documentation is available at https://mosaic-vre.org/docs as well as video tutorials at https://mosaic-vre.org/videos/webodv.

How to cite: Mieruch, S., Linck Rosenhaim, I., and Schlitzer, R.: The MOSAiC webODV: Interactive online data exploration, visualization and analysis, EGU General Assembly 2023, Vienna, Austria, 23–28 Apr 2023, EGU23-13807, https://doi.org/10.5194/egusphere-egu23-13807, 2023.

EGU23-14133 | ECS | Posters on site | OS1.4

Seasonal and regional sensitivity of Arctic sea ice 

Markus Ritschel and Dirk Notz

We examine the seasonal and regional evolution of sea-ice coverage in the Arctic in response to changes in the forcing. Using satellite and reanalysis data in combination with CMIP6 model simulations, we build on previous studies that have found a strong linear relationship between the September sea-ice area of the northern hemisphere and global atmospheric air temperature (TAS) as well as anthropogenic CO2 emissions. Instead of focusing on the whole Arctic and September sea ice only, we perform sensitivity analyses on higher-resolved regional and seasonal scales, aiming to identify the atmospheric and oceanic drivers that govern the evolution of sea-ice coverage on these scales and to derive simple empirical relationships that describe the impact of these processes. We find clear linkages also on these higher-resolved scales, with different regions and different seasons showing diverse sensitivities of sea-ice area evolution with respect to TAS and anthropogenic CO2. Furthermore, we use a multivariate metric to quantify the "quality" of a single simulation matching the observations, thereby considering the different sensitivities of all seasons of the year. Building the combined covariance matrix of observations and simulations as a measure of the joint uncertainties, we can determine how "close" to the observations every single member of the simulations is. This allows us to separate models whose sensitivities are in overall good agreement with the observations from those that are apparently not capable of properly simulating the response of the sea ice to the forcing throughout all months. Based on our findings we can infer the dominant drivers that force Arctic sea-ice evolution on a regional and seasonal scale and also derive projections for the future evolution of Arctic sea ice for different climate scenarios based on simple empirical relationships that can directly be estimated from observational records.

How to cite: Ritschel, M. and Notz, D.: Seasonal and regional sensitivity of Arctic sea ice, EGU General Assembly 2023, Vienna, Austria, 23–28 Apr 2023, EGU23-14133, https://doi.org/10.5194/egusphere-egu23-14133, 2023.

EGU23-16107 | Posters on site | OS1.4

Oceanic gyres in the Arctic 

Yevgeny Aksenov, Stefanie Rynders, Alex Megann, A.J. George Nurser, Chris Wilson, and Andrew C. Coward

The Arctic can be seen as a two-layer ocean: thin (<100m) mixed layer at the surface, and the rest of the weakly-stratified ~5-km water column, separated from the surface waters by the Arctic halocline. The weak subsurface ocean stratification results in most of the ocean flow being depth-uniform and guided by bathymetry. One way to look at the Arctic long-term, large-scale ocean circulation is examining the Arctic gyres and cross-ocean currents, such as the Trans-Polar Drift. Wilson et all 2021[1] show how gyres, saddle points and flow separation structures “separatrices” in the surface ocean circulation changes between years and how these affect cross-basin Arctic oceanic connectivity. We extend the method to the subsurface oceanic flow and examine barotropic circulation in the present-day Arctic Ocean using global NEMO model (Nucleus for European Modelling of the Ocean) at 3-km horizontal resolution. The closed-gyre detection method allows us to map positions of the principal Arctic gyres and quantify their strength. The Montgomery potential analyses complements the study by giving us an insight in the geostrophic flows of the Atlantic and Pacific waters. The results suggest a large year-to-year variability of the Arctic gyres and the changes in the Arctic – the Nordic Sea connectivity, which impacts exports of the freshwater, heat, and biogeochemical tracers from the Arctic.

This work has been funded from LTS-S CLASS (Climate–Linked Atlantic Sector Science, grant NE/R015953/1), from the European Union’s Horizon 2020 research and innovation programme under grant agreement no. 820989 (project COMFORT), from the project EPOC, EU grant 101059547 and UKRI grant 10038003 and from the UK NERC project CANARI (NE/W004984/1).

Reference

[1] Wilson, C., Aksenov, Y., Rynders, S. et al. Significant variability of structure and predictability of Arctic Ocean surface pathways affects basinwide connectivity. Commun. Earth. Environ. 2, 164 (2021). https://doi.org/10.1038/s43247-021-00237-0.

How to cite: Aksenov, Y., Rynders, S., Megann, A., Nurser, A. J. G., Wilson, C., and Coward, A. C.: Oceanic gyres in the Arctic, EGU General Assembly 2023, Vienna, Austria, 23–28 Apr 2023, EGU23-16107, https://doi.org/10.5194/egusphere-egu23-16107, 2023.

EGU23-643 | ECS | Orals | AS1.11

Cloud cover estimation using different methods exploiting solar radiation measurements at various sites in Antarctica 

Claudia Frangipani, Raul Cordero, Adriana M. Gulisano, Angelo Lupi, Hector A. Ochoa, Penny Rowe, and Vito Vitale

Observations at the surface in Antarctica have always been challenging, but cloud observations are particularly scarce due to different factors, among which the polar night and lack of instruments and observers. One way to obtain information on cloud cover, and fill the gap, is through broadband radiation measurements thanks to methods based on the effect that clouds have on solar and terrestrial radiation. In this work three different algorithms have been studied and implemented: i) Long et al.[1] method, which exploits global and diffuse shortwave radiation components; ii) Kasten and Czeplak[2], based on global shortwave component alone; iii) APCADA[3] algorithm, which requires longwave downward radiation measurements and meteorological variables data, and is specially chosen as it yields results also at (polar) night. Different methods were selected to adapt to the data available at each site and to cross-check the results. The algorithms are tested on common-time data sets from three different stations: Marambio (64°14’50’’S - 56°37’39’’W), where upward and downward components for shortwave and longwave radiation are measured along with diffuse shortwave radiation; Professor Julio Escudero (62°12’57’’S - 58°57’35’’W) where downward shortwave and longwave radiation data are available; and Concordia (75°05’59’’S - 123°19’57’’E) where data on all components of both solar and terrestrial radiation are collected. Before any computation, data quality control is executed following tests[4] recommended by the Baseline Surface Radiation Network[5], showing good quality for all three data sets. Sky conditions depend on the location of the stations: Marambio and Escudero are coastal sites located on islands on opposite sides of the Antarctic Peninsula where cloudy skies are expected to occur, while Concordia is situated on the East Antarctic Plateau where the sky should be clearer. Such expectations are confirmed by the preliminary results obtained from the tested algorithms, indicating that clouds occur very often with almost scarce clear sky periods at the coastal stations. 


Bibliography
[1] Long C. N., Ackerman T. P., Gaustad K. L., and Cole J. N. S. (2006): “Estimation of fractional sky cover from broadband shortwave radiometer measurements”, J. Geophys. Res. 111, doi: 10.1029/2005JD006475
[2] Dürr B. and Philipona R. (2004): “Automatic cloud amount detection by surface longwave downward radiation measurements”, J. Geophys. Res. 109, doi: 10.1029/2003JD004182
[3] Kasten F., Czeplak G. (1980): “Solar and terrestrial radiation dependent on the amount and type of cloud”, Solar Energy 24, doi: 10.1016/0038-092X(80)90391-6
[4] Long and Shi (2008): “An automated quality assessment and control algorithm for surface radiation measurements”, Open Atm. Science J. 2, doi: 10.2174/1874282300802010023
[5] https://bsrn.awi.de/

How to cite: Frangipani, C., Cordero, R., Gulisano, A. M., Lupi, A., Ochoa, H. A., Rowe, P., and Vitale, V.: Cloud cover estimation using different methods exploiting solar radiation measurements at various sites in Antarctica, EGU General Assembly 2023, Vienna, Austria, 23–28 Apr 2023, EGU23-643, https://doi.org/10.5194/egusphere-egu23-643, 2023.

EGU23-667 | ECS | Orals | AS1.11 | Highlight

Cloud and precipitation profiles from observations  and Polar-WRF simulations over Vernadsky station (western Antarctic Peninsula) during austral winter 2022 

Anastasiia Chyhareva, Svitlana Krakovska, Irina Gorodetskaya, and Lyudmyla Palamarchuk

Intense moist intrusions originating from the lower latitudes of the Pacific Ocean have been found to have a significant impact on the Antarctic Peninsula (AP), including enhancement of surface melt events, increased runoff, reduction in sea-ice cover and ice shelves destabilization. Clouds play an important role in the surface energy budget during these events and in precipitation formation. Precipitation phase and amounts determine local and regional surface mass and energy budget. Our  research focuses on cloud and precipitation microphysical and dynamic characteristics over the AP region, using  ground based remote sensing at the Ukrainian Antarctic Station Akademic Vernadsky Moreover, an enhanced radiosonde program was launched during the austral winter at the Vernadsky station as part of the Year of Polar Prediction in the Southern Hemisphere (YOPP-SH) international initiative (May-August 2022). Here we present detailed analysis of one of the Targeted Observing Periods (TOPs) during an intense moisture and heat intrusion affecting the AP.

Although there is a lot of research on the atmospheric processes over the AP region, the local dynamic and microphysical characteristics of clouds and precipitation are still poorly understood and misrepresented in the models due to the lack of direct measurements, particularly in winter.

Further we performed  Polar-WRF model simulations, forced by ERA5 reanalysis and configured with Morrison double moment cloud microphysical scheme. The simulations were run at 1-km spatial resolution with 10-minute temporal output centered over the Vernadsky region. Simulation results were verified with precipitation properties derived from Micro Rain Radar-Pro measurements and radiosonde profiles. We found that there is  more snow in PolarWRF outputs in comparison to MRR-Pro measurements. Thus it does not represent mixed phased precipitation properly. At the same time Polar WRF shows warm temperature bias compared to radiosounding. 

Measurements and model output are used to analyze cloud ice and water particle distribution, thickness and precipitation particle spectra over the Vernadsky station and the AP mountains during the extreme precipitation events in the Antarctic Winter. In overall there were five TOPs over the AP region. However, not all of them were associated with extreme precipitation on Vernadsky station.

Our preliminary results show the importance of the transition between dry and wet snowfall during intense moisture transport events at the AP (particularly remarkable during winter at the location of Vernadsky station). Polar-WRF shows differences in simulating the timing and intensity of such transitions probably related to the biases in temperature profiles influencing the melting layer height.

How to cite: Chyhareva, A., Krakovska, S., Gorodetskaya, I., and Palamarchuk, L.: Cloud and precipitation profiles from observations  and Polar-WRF simulations over Vernadsky station (western Antarctic Peninsula) during austral winter 2022, EGU General Assembly 2023, Vienna, Austria, 23–28 Apr 2023, EGU23-667, https://doi.org/10.5194/egusphere-egu23-667, 2023.

EGU23-901 | ECS | Orals | AS1.11 | Highlight

Warm Temperature Anomalies Associated with Snowfall in Antarctica 

Aymeric Servettaz, Cécile Agosta, Christoph Kittel, and Anaïs Orsi

Antarctica, the coldest and driest continent, is home to the largest ice sheet. A common feature of polar regions is the warming associated with snowfall, as moist oceanic air and cloud cover contribute to increase the surface temperature. Consequently, the ice accumulated onto the ice sheet is deposited under unusually warm conditions. Here we use the polar-oriented atmospheric model MAR to study the statistical difference between average and snowfall-weighted temperatures. Most of Antarctica experiences a warming scaling with snowfall, although with strongest warming at sites with usually low accumulation. Heavier snowfalls in winter contribute to cool the snowfall-weighted temperature, but this effect is overwritten by the warming associated with atmospheric perturbations responsible for snowfall, which particularly contrast with the extremely cold conditions in winter. Disturbance in apparent annual temperature cycle and interannual variability may have major implications for water isotopes, which are deposited with snowfall and commonly used for paleo-temperature reconstructions.

How to cite: Servettaz, A., Agosta, C., Kittel, C., and Orsi, A.: Warm Temperature Anomalies Associated with Snowfall in Antarctica, EGU General Assembly 2023, Vienna, Austria, 23–28 Apr 2023, EGU23-901, https://doi.org/10.5194/egusphere-egu23-901, 2023.

On the East Antarctic Plateau, in winter, rapid warming events originated by the advection of warm, moist air from lower latitudes, cause the disruption of the stable thermal structure of the atmosphere, and can be linked to the warming of the Plateau region itself. Continuous monitoring of these events can shed light on temperature trends in East Antarctica, trends which are still not clearly defined in terms of origin and amount.

Since the main mechanism acting in the warming events is the strong increase in cloud cover linked to the higher water content of the advected air, for a systematic monitoring of warming phenomena a simultaneous detection of water vapor vertical profile and cloud properties is needed. These two tasks can be both performed through the analysis of spectrally resolved atmospheric downwelling emitted radiances.

The REFIR (Radiation Explorer in the Far Infrared) Fourier transform spectroradiometer was installed at Concordia station, in the Dome C region of the Antarctic Plateau, in December 2011, and it has been performing continuous measurement since then. REFIR measures the downwelling atmospheric radiance in the 100-1500 cm-1 (6.7-100 µm) spectral interval, with a resolution of 0.4 cm-1, and with a repetition rate of about 10 minutes. The measured spectral interval extends from the far infrared, which includes the water vapor rotational band, to the atmospheric window region (8-14 µm), which provides information about the radiative effects of clouds.

A dedicated inversion code was developed to retrieve vertical profiles of water vapor and temperature from the measured emission spectra. The retrieved profiles allow for the monitoring of the evolution of the vertical structure of the troposphere on a 10 minutes timescale, whereas the spectral radiance itself provides, in a more direct way, information on the cloud cover. Therefore, the dataset produced by the REFIR instrument allow us to detect and obtain statistics about warming events in the Dome C region.

How to cite: Bianchini, G., Belotti, C., Di Natale, G., and Palchetti, L.: Exploiting a decadal time-series of spectrally resolved downwelling infrared radiances at Dome C, Antarctica to assess the occurrence of advective warming events, EGU General Assembly 2023, Vienna, Austria, 23–28 Apr 2023, EGU23-1528, https://doi.org/10.5194/egusphere-egu23-1528, 2023.

EGU23-5075 | Orals | AS1.11

Measuring snowfall properties with the open-source Video In Situ Snowfall Sensor 

Maximilian Maahn, Nina Maherndl, and Isabelle Steinke

We do not know the exact pathways through which ice, liquid, cloud dynamics, and aerosols are interacting in clouds while forming snowfall but the involved processes can be identified by their fingerprints on snow particles. The general shape of individual crystals (dendritic, columns, plates) depends on the temperature and moisture conditions during growth from water vapor deposition. Aggregation can be identified when multiple individual particles are combined into a snowflake. Riming describes the freezing of cloud droplets onto the snow particle and can eventually form graupel. In order to exploit these unique fingerprints of cloud microphysical processes, optical in situ observations are required.

The Video In Situ Snowfall Sensor (VISSS) was specifically developed for a campaign in the high Arctic (MOSAiC) to determine particle shape and particle size distributions. Different to other sensors, the VISSS minimizes uncertainties by using two-dimensional high-resolution images, a large measurement volume, and a design limiting the impact of wind. Tracking of particles over multiple frames allows determining fall speed and particle tumbling. The instrument design and software will be released as open-source. Here, we present the design of the instrument, show how particles are detected and tracked and introduce first results from campaigns in the high Arctic (MOSAiC), in the Colorado Rocky Mountains (SAIL), and in and Hyytiälä (Finland).  

How to cite: Maahn, M., Maherndl, N., and Steinke, I.: Measuring snowfall properties with the open-source Video In Situ Snowfall Sensor, EGU General Assembly 2023, Vienna, Austria, 23–28 Apr 2023, EGU23-5075, https://doi.org/10.5194/egusphere-egu23-5075, 2023.

EGU23-5650 | ECS | Orals | AS1.11

Mixed-phase Multilayer Clouds in the Arctic: A Simulation Study using ICON 

Gabriella Wallentin, Corinna Hoose, Peggy Achtert, and Matthias Tesche

Multilayer clouds (MLCs), defined as individual, vertically overlapping clouds, are frequently occurring worldwide but have been far less studied than single layered clouds. Earlier studies have suggested a clear abundance of MLCs in the Arctic compared with the rest of the world and with data from the MOSAiC campaign in 2019-2020 we have classified multilayered clouds at a 52% frequency of occurrence. The microphysical interaction between these cloud layers is expected to be complicated, such as the seeder- feeder mechanism, and we thus employ a model to further investigate these clouds. 

Cases from the MOCCHA campaign in 2018 as well as the MOSAiC campaign in 2019-2020 have been selected for MLC occurrences. These cloud systems vary from vertically distinct layers with no potential of seeding (subsaturated layer of >3km) to a doubly layered system within the boundary layer with frequent seeding events. The structure of the former can be simulated at a coarse grid spacing, provided appropriate initial conditions and aerosol concentration, whilst the latter is highly dependent on initial and boundary conditions, resolution, and parameterisation for the boundary layer. 

Together with an analysis of the measurements on board of the ships, the ICON (ICOsahedral Non-hydrostatic) model was deployed. The simulations are run with refined nests down to 75 meters horizontal grid spacing in ICON-LEM. Initial and boundary data are supplied by both ICON Global and IFS. As the Arctic aerosol contribution is yet to be parameterised, we are further making use of the prognostic aerosol module ART (Aerosol and Reactive Trace gases) developed by KIT, set up specifically for cloud condensation nuclei activation for sea salt and sulfate. 

Various sensitivity experiments have been performed on these case studies including (i) sensitivity to microphysical parameters, such as CCN and INP parameterisation and concentration, (ii) sensitivity to horizontal and vertical resolution as well as (iii) initial and boundary condition impacts on resolving the cloud layers. Furthermore, the aerosol concentration has been scaled, in the existing parameterisations in ICON, to represent the measurements on site as well as prognostically run using ICON-ART. 

Preliminary results on the modelled multilayer cloud system highlight a high dependency on the initial and boundary data quality as well as domain resolution while the microphysics have a smaller impact on the formation and detailed structure of the multilayer cloud system.

How to cite: Wallentin, G., Hoose, C., Achtert, P., and Tesche, M.: Mixed-phase Multilayer Clouds in the Arctic: A Simulation Study using ICON, EGU General Assembly 2023, Vienna, Austria, 23–28 Apr 2023, EGU23-5650, https://doi.org/10.5194/egusphere-egu23-5650, 2023.

EGU23-5802 | ECS | Orals | AS1.11

Transforming cloudy air masses and surface impacts: a case study confronting MOSAiC observations, reanalyses and coupled model simulations 

Sandro Dahlke, Amélie Solbès, Matthew D. Shupe, Christopher J. Cox, Marion Maturilli, Annette Rinke, Wolfgang Dorn, and Markus D. Rex

Variability in the components of the Arctic surface energy budget and the atmospheric boundary layer (ABL) structure are to a large extent controlled by synoptic-scale changes and associated air mass properties. The transition of air masses between the radiatively clear and cloudy states, along with their characteristic surface impacts in radiation and ABL structure, can occur in either direction and on short time scales. In both states as well as during the transition, insufficient model representation of radiative processes and cloud microphysical properties cause biases in numerical weather prediction- and climate models. We employ observations from radiosondes, MET tower, and the ShupeTurner cloud microphysics product, which itself synthesizes a wealth of instruments, for the classification of an event of transition between low-level mixed phase cloud and clear conditions. The observed air mass properties and transition process are compared to ERA5 reanalysis data and output from a simulation of the coupled regional climate model HIRHAM-NAOSIM which applied non-spectral nudging to ERA5 in order to reproduce the observed synoptic-scale changes. The approach highlights the potential of event-based analysis of transformations of cloudy Arctic air masses by confronting models with observations.


How to cite: Dahlke, S., Solbès, A., Shupe, M. D., Cox, C. J., Maturilli, M., Rinke, A., Dorn, W., and Rex, M. D.: Transforming cloudy air masses and surface impacts: a case study confronting MOSAiC observations, reanalyses and coupled model simulations, EGU General Assembly 2023, Vienna, Austria, 23–28 Apr 2023, EGU23-5802, https://doi.org/10.5194/egusphere-egu23-5802, 2023.

EGU23-5876 | ECS | Orals | AS1.11

Airborne measurements of the cloud impact on the surface radiative energy budget in the Fram Strait 

Sebastian Becker, André Ehrlich, Michael Schäfer, and Manfred Wendisch

Clouds play an important role in the climate system of the Arctic. The interaction of clouds with atmospheric radiation has a significant influence on the radiative energy budget (REB) of the Arctic surface, which is quantified by the surface cloud radiative effect (CRE). Due to the counteraction of the cooling effect of clouds in the solar and their warming effect in the thermal-infrared spectral range, the total CRE depends on a complex interplay of the illumination, surface, thermodynamic, and cloud conditions.

To characterize the CRE for a variety of environmental conditions, broadband radiation measurements were performed during three seasonally distinct airborne campaigns. The flights were conducted over sea ice and open ocean surfaces in the eastern Fram Strait. The analysis focusses on the differences of the CRE with respect to the different campaigns and surface types. It was found that clouds cool the open ocean surface during all campaigns. In contrast, clouds mostly have a warming effect on sea ice–covered surfaces, which neutralizes during mid-summer. Given the seasonal cycle of the sea ice distribution, these results imply a cooling effect of clouds on the surface during the sea ice minimum in late summer and a warming effect during the sea ice maximum in spring in the Fram Strait region. The variability of, e. g., cloud and synoptic conditions causes deviations of the CRE from these statistics. In particular, the study presents the evolution of the CRE during selected cases of warm air intrusions and marine cold air outbreaks.

How to cite: Becker, S., Ehrlich, A., Schäfer, M., and Wendisch, M.: Airborne measurements of the cloud impact on the surface radiative energy budget in the Fram Strait, EGU General Assembly 2023, Vienna, Austria, 23–28 Apr 2023, EGU23-5876, https://doi.org/10.5194/egusphere-egu23-5876, 2023.

EGU23-6007 | ECS | Orals | AS1.11

Impact of Atmospheric Rivers on Poleward Moisture Transport and Arctic Climate on Interannual Timescales 

Marlen Kolbe, Jeroen Sonnemans, Richard Bintanja, Eveline van der Linden, Karin van der Wiel, Kirien Whan, and Imme Benedict

The projected increase in poleward moisture transport (PMT) towards warmer climate has mainly been linked to the larger moisture holding capacity of warmer air masses. However, the future of interannual fluctuations of PMT and associated driving mechanisms are fairly uncertain. This study demonstrates the extent to which atmospheric rivers (ARs) explain the interannual variability of PMT, as well as related variables such as temperature, precipitation and sea ice. Such linkages help to clarify if extreme precipitation or melt events over Arctic regions are dominantly caused by the occurrence of ARs. A main focus is set on the impact of ARs on Arctic sea ice on interannual timescales, which so far has been poorly studied, and varies from colder to warmer climates.

To robustly study these interannual linkages of ARs and Arctic Climate, we examine Arctic ARs in long climate runs of one present and two future climates (+2°C and +3°C), simulated by the global climate model EC-Earth 2.3. To enhance the significance of the results, three different moisture thresholds were used to detect ARs. Further, the use of additional thresholds relative to the 2°C and 3° warmer climates allowed a distinction between thermodynamic and dynamic processes that lead to changes of ARs from colder to warmer climates. It is found that most PMT variability is driven by ARs, and that the share of ARs which explain moisture transport increases towards warmer climates. We also discuss the role of the position and strength of the jet stream in driving AR variability and highlight the importance of ARs in generating interannual fluctuations of Arctic climate variables such as temperature and precipitation.

How to cite: Kolbe, M., Sonnemans, J., Bintanja, R., van der Linden, E., van der Wiel, K., Whan, K., and Benedict, I.: Impact of Atmospheric Rivers on Poleward Moisture Transport and Arctic Climate on Interannual Timescales, EGU General Assembly 2023, Vienna, Austria, 23–28 Apr 2023, EGU23-6007, https://doi.org/10.5194/egusphere-egu23-6007, 2023.

EGU23-7246 | Orals | AS1.11 | Highlight

HALO-(AC)3: Airborne Observations of Arctic Clouds in Airmass Transformations 

André Ehrlich, Manfred Wendisch, Marcus Klingebiel, Mario Mech, Susanne Crewell, Andreas Herber, and Christof Lüpkes and the HALO-(AC)3 team

Clear indications of the phenomenon of Arctic Amplification include the above-average increase of the near-surface air temperature and the related dramatic retreat of sea ice observed in the last decades. The mechanisms behind these features are widely discussed. Especially the role of clouds and of air mass transports into and out of the Arctic associated with related transformation processes are still poorly understood. Therefore, the HALO-(AC)3 campaign was performed to provide observations of meridional air mass transports and corresponding transformations in a quasi-Lagrangian approach. Three research aircraft equipped with state-of-the-art instrumentation performed measurements over the Arctic ocean and sea ice in March/April 2022. The German High Altitude and Long Range Research Aircraft (HALO), equipped with a comprehensive suite of active and passive remote sensing instruments and dropsondes, was operated from Kiruna, Sweden. The flight pattern covered long distances at high altitudes up to the North Pole probing air masses multiple times on their way into and out of the Arctic. The Polar 5 (remote sensing) and Polar 6 (in-situ) aircraft from the Alfred Wegener Institute operated in the lower troposphere out of Longyearbyen in the lower troposphere over Fram Strait West of Svalbard. Several coordinated flights between the three aircraft were conducted with Polar 6 sampling in-situ aerosol, cloud, and precipitation particles within the boundary layer, Polar 5 observing clouds and precipitation from above roughly at 3 km altitude, and HALO providing the large scale view on the scene following air masses.
The observations cover a major warm air intrusion event with atmospheric river embedded bringing warm and moist air far into the Arctic. Multiple cold air outbreaks were characterized in their initial stage close to the sea ice edge with Polar 5 and 6 and in a quasi-Lagrangian perspective with HALO, which allowed to quantify the air mass transformation by changes of thermodynamic profiles, large scale subsidence, and cloud properties over a period of 24 hours. Single events of high latitude Arctic cirrus and the formation of a polar low are included in the data set. The presentation reports on first results of the campaign by illustrating the capabilities of the multi-aircraft operation.

How to cite: Ehrlich, A., Wendisch, M., Klingebiel, M., Mech, M., Crewell, S., Herber, A., and Lüpkes, C. and the HALO-(AC)3 team: HALO-(AC)3: Airborne Observations of Arctic Clouds in Airmass Transformations, EGU General Assembly 2023, Vienna, Austria, 23–28 Apr 2023, EGU23-7246, https://doi.org/10.5194/egusphere-egu23-7246, 2023.

EGU23-7692 | ECS | Orals | AS1.11

The effect of cloud top cooling on the evolution of the Arctic boundary layer observed by balloon-borne measurements 

Michael Lonardi, Christian Pilz, Elisa F. Akansu, André Ehrlich, Matthew D. Shupe, Holger Siebert, Birgit Wehner, and Manfred Wendisch

The presence of clouds significantly affects Arctic boundary layer dynamics. However, the accessibility of clouds over the Arctic sea ice for in-situ observations is challenging. Measurements from tethered balloon platforms are one option to provide high-resolution data needed for model evaluation.

The tethered balloon system BELUGA (Balloon-bornE moduLar Utility for profilinG the lower Atmosphere) was deployed to profile the boundary layer at the Multidisciplinary drifting Observatory for the Study of Arctic Climate (MOSAiC), and in Ny-Alesund. A set of scientific payloads for the observation of broadband radiation, turbulence, aerosol particles, and cloud microphysics properties were operated to study the interactions in the cloudy and cloud-free boundary layer.

Measurements obtained under various cloud conditions, including single-layer and multi-layer clouds, are analyzed. Heating rates profiles are calculated to validate radiative transfer simulations and to study the temporal development of the cloud layers. 

The in-situ observations display the importance of radiation-induced cloud top cooling in maintaining stratocumulus clouds over the Arctic sea ice. Case studies also indicate how the subsequent turbulent mixing can lead to the entrainment of aerosol particles into the cloud layer.

How to cite: Lonardi, M., Pilz, C., Akansu, E. F., Ehrlich, A., Shupe, M. D., Siebert, H., Wehner, B., and Wendisch, M.: The effect of cloud top cooling on the evolution of the Arctic boundary layer observed by balloon-borne measurements, EGU General Assembly 2023, Vienna, Austria, 23–28 Apr 2023, EGU23-7692, https://doi.org/10.5194/egusphere-egu23-7692, 2023.

EGU23-8107 | ECS | Orals | AS1.11 | Highlight

The extraordinary March 2022 East Antarctica heatwave 

Jonathan Wille and the East Antarctica heatwave project

Between March 15-19th 2022, East Antarctica experienced an unprecedented heatwave with widespread 30-45° C temperature anomalies across the ice sheet. This record-shattering event saw numerous monthly temperature records being broken including a new all-time temperature record of -9.4 °C on March 18th at Concordia station despite March typically being a transition month to the Antarctic coreless winter. The driver for these temperature extremes was an unprecedently intense atmospheric river (AR) advecting heat and moisture deep into the Antarctic interior. The scope of the temperature records spurred a large, diverse collaborative effort to study the heatwave’s meteorological drivers, impacts, and historical climate context using an array of observations, models, and analysis techniques. 

 From these efforts, we present the following

  • Temperature observations and records
  • Meteorological drivers including tropically forced Rossby wave activity along with AR and warm conveyor belt dynamics
  • Radiative forcing impacts on surface temperatures and inversions
  • Surface mass balance impacts
  • Discussion of the AR impacts on isotope and cosmic ray measurements from Concordia station
  • AR influence on the Conger Ice Shelf disintegration
  • Event return time analysis
  • Implications on past climate reconstructions
  • Future event likelihood from IPSL-CM6 simulations

How to cite: Wille, J. and the East Antarctica heatwave project: The extraordinary March 2022 East Antarctica heatwave, EGU General Assembly 2023, Vienna, Austria, 23–28 Apr 2023, EGU23-8107, https://doi.org/10.5194/egusphere-egu23-8107, 2023.

EGU23-8500 | ECS | Orals | AS1.11

The effects of warm air intrusions in the high arctic on cirrus clouds 

Georgios Dekoutsidis, Silke Groß, and Martin Wirth

In the last decades scientist have noticed that the average global temperature of the Earth has been increasing. Moreover, the arctic is warming significantly faster than the global average, a phenomenon labeled Arctic Amplification. Two atmospheric components contributing to the warming of the atmosphere in the arctic are water vapor and cirrus clouds. Both have an effect on the radiation budget of the atmosphere and more specifically the longwave radiation. A Warm Air Intrusion (WAI) event is defined as the meridional transport of warm, water-vapor-rich airmasses into the arctic. During such events large amounts of water vapor can be transported into the arctic, which also leads to high supersaturations aiding the formation and longevity of cirrus clouds. There is a strong hypothesis that WAI events in the high arctic are becoming more frequent, so it is important to study the effects these events have on the macrophysical and optical properties of cirrus clouds in the arctic.

The HALO-(AC)3 flight campaign was conducted in March/April 2022 with the central goal of studying WAI events in the arctic regions of the Northern Hemisphere. For this campaign the German research aircraft HALO was equipped with remote sensing instrumentation, including the airborne LIDAR system WALES which we use in this study. WALES is a combined water vapor differential absorption and high spectral resolution lidar. It provides water vapor measurements in a 2D field along the flight track. We combine these measurements with ECMWF temperature data and calculate the Relative Humidity with respect to ice (RHi) inside and in the vicinity of cirrus clouds. For each flight we studied the synoptic situation and created two groups: One containing flights were cirrus that formed in arctic airmasses were measured and another were cirrus were measured during WAI events, henceforth arctic cirrus and WAI cirrus respectively. Our main goal is to compare the humidity characteristics inside and in the vicinity of arctic cirrus clouds and WAI cirrus clouds.

For the arctic cirrus we find that 49 % of the in-cloud data points are supersaturated with RHi mostly below the lower threshold for heterogeneous nucleation (low HET). The cloud-free air around these clouds has a supersaturation percentage of 8.5 %. The WAI cirrus are measured in a wider temperature range and also have a significantly higher supersaturation percentage inside as well as in the cloud-free air, 61.7 % and 9.3 % respectively. The majority is again in the low HET regime. Additionally, WAI cirrus are on average geometrically thicker than arctic cirrus. Finally, regarding the vertical distribution of RHi within these clouds we find that WAI cirrus have their highest supersaturations near the cloud top and become gradually subsaturated towards cloud-bottom. On the other hand, arctic cirrus have their highest supersaturations near cloud-middle, with lower supersaturations at cloud-top and subsaturated cloud-bottom.

How to cite: Dekoutsidis, G., Groß, S., and Wirth, M.: The effects of warm air intrusions in the high arctic on cirrus clouds, EGU General Assembly 2023, Vienna, Austria, 23–28 Apr 2023, EGU23-8500, https://doi.org/10.5194/egusphere-egu23-8500, 2023.

EGU23-9110 | Posters on site | AS1.11

Multi-year precipitation characteristics based on in-situ and remote sensing observations at the Arctic research site Ny-Ålesund, Svalbard 

Kerstin Ebell, Christian Buhren, Rosa Gierens, Melanie Lauer, Giovanni Chellini, Sandro Dahlke, and Pavel Krobot

Precipitation is a key variable in the hydrological cycle. However, observations of precipitation are quite challenging and even more so in remote locations such as the Arctic. The Arctic is experiencing a rapidly changing climate with a strong increase in near-surface air temperature, known as Arctic Amplification. In particular, the Svalbard archipelago is located in the warmest region of the Arctic and reveals the highest temperature increase (Dahlke and Maturilli, 2017). Such changes also affect the hydrological cycle. For example, climate models reveal a strong increase in precipitation in the Arctic (McCrystall et al., 2021) with rain becoming the most dominant precipitation type (Bitanja and Andry, 2017). Continuous detailed observations, which can also be set in context to satellite products and reanalyses data, are necessary to better understand precipitation and precipitation related processes in the Arctic.

In this study, we make use of the complementary precipitation observations performed as part of the Transregional Collaborative Research Centre on Arctic Amplification TR172 (http://www.ac3-tr.de; Wendisch et al., 2017) at the Arctic research station AWIPEV at Ny-Ålesund, Svalbard, to analyze precipitation characteristics in detail. The observations include an OTT Pluvio2 weighing gauge, an OTT Parsivel2 distrometer and a METEK MRR-2 micro rain radar (MRR). While the Pluvio and the Parsivel provide information on surface precipitation amount and type, the MRR provides information on the vertical structure of precipitation up to a height of 1 km. Measurements are available since spring/summer 2017 allowing for an analysis of more than 4 years of data.

First results show that the yearly precipitation amount based on Pluvio ranges from 306 mm to 552 mm (values are uncorrected for undercatch). Using the one-minute resolved data of Parsivel, precipitation frequency is highly variable within the different months ranging from 0.4 % to 18.8 % with solid precipitation being the most dominant type typically from September to March and liquid precipitation in the months May to August. In addition to monthly and yearly statistics, we will also characterize and analyze in detail the individual precipitation events. One question to be addressed is how much of the precipitation is related to atmospheric rivers (ARs). ARs are long, narrow, and transient corridors of strong horizontal water vapor transport which account for 80-90 % of the poleward moisture transport. Although their occurrence in the Arctic is limited, they are a significant source of rain and snow in the Arctic. Understanding linkages between precipitation and weather events and using observational data to evaluate models and reanalysis in the current climate will aid developing more accurate future predictions.

How to cite: Ebell, K., Buhren, C., Gierens, R., Lauer, M., Chellini, G., Dahlke, S., and Krobot, P.: Multi-year precipitation characteristics based on in-situ and remote sensing observations at the Arctic research site Ny-Ålesund, Svalbard, EGU General Assembly 2023, Vienna, Austria, 23–28 Apr 2023, EGU23-9110, https://doi.org/10.5194/egusphere-egu23-9110, 2023.

EGU23-9323 | Posters on site | AS1.11

Observations of ice optical and microphysical properties in Arctic low-level mixed-phase clouds during ACLOUD 

Emma Järvinen, Franziska Nehlert, Guanglang Xu, Fritz Waitz, Guillaume Mioche, Regis Dupuy, Olivier Jourdan, and Martin Schnaiter

Observations of late spring and summer time stratiform clouds over pack ice, marginal sea ice zone and open water during the ACLOUD campaign have shown that relatively high ice particle number concentrations up to 35 L-1 are observed in cases where cloud top temperatures are between -3.8 and -8.7°C. This elevation in ice crystal number can likely be linked with secondary ice production. Simultaneous measurements of ice optical properties showed that a relative low asymmetry parameter between 0.69 and 0.76 can be associated with the mixed-phase cloud ice crystals. The condensed water path is dominated by the liquid phase at the cloud top in most of the studied cases except in one case study of a system with embedded convection where ice extinction exceeded the liquid extinction. Radiative transfer simulations have shown that the ice phase in low-level mixed-phase clouds, otherwise dominated by liquid phase, can also be radiatively important in cases where ice phase contributes to the cloud top extinction. This highlights the importance of an accurate vertical information of ice extinction within Arctic low-level clouds. The results of this study provide an important basis for testing and improving cloud microphysical parameterizations in models in order to accurately predict Arctic warming.

How to cite: Järvinen, E., Nehlert, F., Xu, G., Waitz, F., Mioche, G., Dupuy, R., Jourdan, O., and Schnaiter, M.: Observations of ice optical and microphysical properties in Arctic low-level mixed-phase clouds during ACLOUD, EGU General Assembly 2023, Vienna, Austria, 23–28 Apr 2023, EGU23-9323, https://doi.org/10.5194/egusphere-egu23-9323, 2023.

EGU23-9784 | ECS | Posters on site | AS1.11

Airborne Closure of Moisture Budget inside Arctic Atmospheric Rivers 

Henning Dorff, Heike Konow, Vera Schemann, Davide Ori, Mario Mech, and Felix Ament

Among arctic moist air intrusions, atmospheric rivers (ARs) provide substantial moisture transport over long distances poleward. Along their corridors, warm and moist air masses undergo various transformation processes and can cause regional sea ice decline, especially when they induce precipitation as rain. Quantifying the components of the atmospheric moisture budget in arctic ARs is key to elucidate their precipitation efficiency. We close the AR moisture budget by measurements of the High Altitude LOng range research aircraft (HALO) during the recent HALO-(AC)³ campaign (Spring, 2022) in the vicinity of the Fram Start and Arctic ocean.

Our analysis is based on a strong AR event that HALO observed on two consecutive days during the occurrence of a sequence of moist air intrusions mid of March 2022. Dropsondes detect the vertical atmospheric profile and therefrom quantify the integrated water vapour transport (IVT) along AR cross sections. Applying regression methods then allows calculating the divergence of IVT. Since the limited number of dropsondes may deteriorate such calculations, we estimate the arising uncertainties using the ICOsahedral Nonhydrostatic model (ICON) in a storm-resolving configuration. Retrieved moisture profiles from the microwave radiometer (HAMP) further complement the sporadic sonde-based moisture profiles. We use the nadir cloud and precipitation radar mounted aboard HALO to derive precipitation rates along the flight curtains.

As the comparison with ICON suggests, the set of dropsondes to derive the IVT divergence within a reasonable range. The advection of moisture is roughly twice as strong as mass convergence. Both components act on different heights, with convergence dominating in the boundary layer (0-1 km) near the low-level jet, whereas moisture advection is more elevated (1-4 km). The strongest moisture convergence arises in the warm prefrontal AR sector while precipitation dominates slightly westwards in the AR centre. The investigated AR event caused rain over sea-ice with a melting layer up to 1.5 km. While there was less IVT on the second observation day, mean precipitation increased from the first day. Model simulations show that evaporation makes only a small contribution to the budget.  Within the ICON simulations, the comparison of precipitation purely based on the along-track radar curtain against that over the entire AR corridor indicates that the along-track curtain captures the mean precipitation intensity of the AR corridor, but misrepresents its spatial variability. However, the HALO devices outperform the ICON simulations in terms of the vertical variability of moisture conversion processes.

How to cite: Dorff, H., Konow, H., Schemann, V., Ori, D., Mech, M., and Ament, F.: Airborne Closure of Moisture Budget inside Arctic Atmospheric Rivers, EGU General Assembly 2023, Vienna, Austria, 23–28 Apr 2023, EGU23-9784, https://doi.org/10.5194/egusphere-egu23-9784, 2023.

EGU23-10197 | Orals | AS1.11

Atmospheric moisture intrusion into the Arctic: sources, impact, and trends 

Hailong Wang, Rudong Zhang, Yufei Zou, Weiming Ma, Philip Rasch, and Travis O'Brien

Atmospheric water vapor plays an enormously important role in the water cycle and energy budget of the Arctic. Water vapor in the Arctic also participates in many important feedback mechanisms influencing the climate response to forcing agents and the Arctic amplification. In this study, we conduct analysis of atmospheric moisture transport into the Arctic based on reanalysis products and CMIP6 model simulations. We are particularly interested in the episodic atmospheric-river-like features (AR or moisture intrusion) that play an important role in delivering water to the Arctic. Based on the method of using column-integrated meridional vapor transport for characterizing AR events, we find that the mean AR frequency peaks in the Atlantic sector in all seasons except that it’s more zonally widespread in summer. An increasing trend in the Arctic AR frequency in the recent decades identified from ERA5 can be captured by few CMIP6 models. The historical Arctic AR frequency, sea ice concentration and Arctic warming are highly correlated. Atmospheric circulation patterns that drive the interannual and decadal Arctic AR variation contribute substantially to the historical Arctic warming. We also use the Community Earth System Model (CESM), equipped with a water tagging capability, to quantify contributions of surface evaporation within the Arctic versus from lower-latitude regions as a source of water to the Arctic and characterize moisture transport pathways that control the Arctic water vapor distribution.

How to cite: Wang, H., Zhang, R., Zou, Y., Ma, W., Rasch, P., and O'Brien, T.: Atmospheric moisture intrusion into the Arctic: sources, impact, and trends, EGU General Assembly 2023, Vienna, Austria, 23–28 Apr 2023, EGU23-10197, https://doi.org/10.5194/egusphere-egu23-10197, 2023.

EGU23-10530 | ECS | Orals | AS1.11 | Highlight

Central tropical Pacific convection drives extreme high temperatures and surface melt on the Larsen C Ice Shelf, Antarctic Peninsula 

Kyle Clem, Deniz Bozkurt, Daemon Kennett, John King, and John Turner

Northern sections of the Larsen Ice Shelf, eastern Antarctic Peninsula (AP) have experienced dramatic break-up and collapse since the early 1990s due to strong summertime surface melt, linked to strengthened circumpolar westerly winds. Here we show that extreme summertime surface melt and record-high temperature events over the eastern AP and Larsen C Ice Shelf are triggered by deep convection in the central tropical Pacific (CPAC), which produces an elongated cyclonic anomaly across the South Pacific coupled with a strong high pressure anomaly over Drake Passage. Together these atmospheric circulation anomalies transport very warm and moist air to the southwest AP, often in the form of “atmospheric rivers”, producing strong foehn warming and surface melt on the eastern AP and Larsen C Ice Shelf. Therefore, variability in CPAC convection, in addition to the circumpolar westerlies, is a key driver of AP surface mass balance and the occurrence of extreme high temperatures.

How to cite: Clem, K., Bozkurt, D., Kennett, D., King, J., and Turner, J.: Central tropical Pacific convection drives extreme high temperatures and surface melt on the Larsen C Ice Shelf, Antarctic Peninsula, EGU General Assembly 2023, Vienna, Austria, 23–28 Apr 2023, EGU23-10530, https://doi.org/10.5194/egusphere-egu23-10530, 2023.

EGU23-11436 | Orals | AS1.11 | Highlight

Moisture transport into the Arctic in a past and future climate 

Sabine Eckhardt, Tove Svendby, Birthe Steensen, Gunnar Myhre, Ada Germundsen, and Dirk Olivie

The Arctic is warming at a faster rate than the rest of the globe. There are both remote and local mechanism identified driving this process. While albedo changes and atmospheric stability happens within in the Arctic, transfer transport processes, both in the ocean and atmosphere, heat and moisture into the Arctic. These processes can be analysed in a Eulerien way, by observing the fluxes through a curtain defining the Arctic or/and by Lagrangian analysis which follows this transport processes all the way from uptake in the mid/high latitudes until the inflow into the Arctic. 

We use a Lagrangian Particle Transport model FLEXPART running with ECMWF reanalysis data as well as with data from the norwegian earth system model NorESM, which represents the future climate scenarios until 2100. In this way we investigate the inflow of moisture and energy for the last 50 years, but can also project it in the future by considering the climate model output.

We find that the the transport through the 65N Latitude, defining the Arctic area is highly inhomogenious in space, but has also a distinct seasonal variability. The end of the storm tracks, especially the Northern Atlantic stormtrack show the most important region of inflow. While moisture origins over ocean areas in winter, continental areas in summer act as a source. The patterns in the reanalysis data from ECMWF and in the climate simulations are very similar. Those patterns are stable over time, but intensify in a warming climate.

How to cite: Eckhardt, S., Svendby, T., Steensen, B., Myhre, G., Germundsen, A., and Olivie, D.: Moisture transport into the Arctic in a past and future climate, EGU General Assembly 2023, Vienna, Austria, 23–28 Apr 2023, EGU23-11436, https://doi.org/10.5194/egusphere-egu23-11436, 2023.

EGU23-11620 | Posters on site | AS1.11

Analyzing the development of cold air outbreaks and warm air intrusions based on remote sensing and dropsonde data from (AC)3 campaigns 

Marcus Klingebiel, Lukas Monrad-Krohn, Benjamin Kirbus, Mario Mech, André Ehrlich, and Manfred Wendisch

Within the framework of (AC)3, four airborne campaigns were conducted in the vicinity of Svalbard to investigate the Arctic airmass transformations during warm air intrusions (WAI) and marine cold air outbreaks (CAO). In this study, we will take a deeper look into the development process of CAOs starting from the marginal sea-ice zone towards the open ocean, using data from active and passive remote sensing instruments. In addition, we will present data from more than 450 dropsondes launched during the HALO-(AC)3 campaign and analyze the development of the vertical profiles along WAIs and CAOs. This is done by using a Lagrangian analysis of the campaign, which delivers same-day and next-day trajectory matches of the HALO flights.

How to cite: Klingebiel, M., Monrad-Krohn, L., Kirbus, B., Mech, M., Ehrlich, A., and Wendisch, M.: Analyzing the development of cold air outbreaks and warm air intrusions based on remote sensing and dropsonde data from (AC)3 campaigns, EGU General Assembly 2023, Vienna, Austria, 23–28 Apr 2023, EGU23-11620, https://doi.org/10.5194/egusphere-egu23-11620, 2023.

EGU23-11951 | ECS | Posters on site | AS1.11

Influence of atmospheric rivers, cyclones and fronts on precipitation in the Arctic – a climatological perspective 

Melanie Lauer, Annette Rinke, Irina Gorodetskaya, Michael Sprenger, Mario Mech, and Susanne Crewell

The enhanced warming in the Arctic compared to the global mean – a phenomenon called Arctic Amplification - has different effects, including impacts on the hydrological cycle and thus the precipitation. In the Arctic, there are two major sources of moisture leading to increased precipitation formation: The enhanced local evaporation due to the missing insulation due to reduced sea-ice cover and the increased poleward moisture transport which is often associated with atmospheric rivers (ARs).

Previous studies have shown that ARs are a significant source for rain and snow in the Arctic. ARs are dynamically linked to the extratropical cyclones and fronts. Thus, AR-related precipitation can be not only concentrated within the AR itself, but also occur within the cyclone and frontal boundaries. Therefore, we developed a new method to distinguish precipitation within the AR shape and the precipitation related to cyclones and fronts based on ERA5 reanalysis. Thereby, we estimate how much precipitation occurs within AR, cyclone and frontal boundaries, separately and overlapping together. We applied this method for different case studies during two campaigns performed at and around Svalbard within the Collaborative Research Center “Arctic Amplification: Climate Relevant Atmospheric Surface Processes, and Feedback Mechanisms (AC)3”. Differences in the contributions of ARs, cyclones and fronts to the total precipitation could be identified comparing the both campaigns. During the early summer campaign (ACLOUD), precipitation (both rain and snow) was more confined within the AR shapes, especially in the area in which the AR is connected to fronts. In contrast, during the early spring campaign (AFLUX), precipitation (predominantly snow) was more restricted to the cyclone regions without connection to ARs and fronts. Generally, a higher precipitation intensity was found within ARs, especially when they are connected with cyclones and fronts.

In a climatological perspective, we apply this method to the ERA5 reanalysis data (1979 - 2020) to quantify the occurrence and influence of ARs and related cyclones and fronts. For this extended analysis, we consider the whole Arctic. This allows us to analyse the change of precipitation (in terms of type and frequency) related to the different weather systems during the last four decades. Furthermore, we can assess seasonal differences. In summary, we can investigate in which regions ARs, cyclones and fronts have a greater impact and if and how it also depends on different surface types (sea ice, open ocean, and land).

This work is supported by the DFG funded Transregioproject TR 172 “Arctic Amplification (AC)3“.

How to cite: Lauer, M., Rinke, A., Gorodetskaya, I., Sprenger, M., Mech, M., and Crewell, S.: Influence of atmospheric rivers, cyclones and fronts on precipitation in the Arctic – a climatological perspective, EGU General Assembly 2023, Vienna, Austria, 23–28 Apr 2023, EGU23-11951, https://doi.org/10.5194/egusphere-egu23-11951, 2023.

EGU23-13074 | ECS | Orals | AS1.11

Linking aerosol size distribution and hygroscopicity to cloud droplet formation at an Arctic mountain site 

Ghislain Motos, Gabriel Freitas, Paraskevi Georgakaki, Jörg Wieder, Wenche Aas, Chris Lunder, Radovan Krejci, Julie T. Pasquier, Jan Henneberger, Robert O. David, Claudia Mohr, Paul Zieger, and Athanasios Nenes

The regulation of energy transfer by clouds and fog is a key process affecting the climate of the Arctic, a region that exhibits frequent cloud cover and suffers an extreme vulnerability to climate change. Measurements were performed over a whole year at the Zeppelin station, Ny-Ålesund, Svalbard, Norway from October 2019 to October 2020 in the framework of the NASCENT campaign (Ny-Ålesund AeroSol Cloud ExperimeNT). Aiming at a better understanding of the susceptibility of cloud droplet formation, we analyzed particle number size distributions obtained from differential mobility particle sizers and chemical composition derived from filter samples and an aerosol chemical speciation monitor. Combined with updraft velocity information from a wind lidar and an ultrasonic anemometer, the data were used as input parameters for a state-of-the-art cloud droplet formation parameterization to investigate the particle sizes that can activate to cloud droplets, the levels of supersaturation as well as potential cloud droplet formation and its susceptibility to aerosol. We showed that low aerosol levels in fall and early winter led to clouds that are formed under an aerosol-limited regime, while higher particle concentrations centered around the Arctic Haze together with a drop in cloud supersaturation could be linked to periods of updraft velocity-limited cloud formation regime. In the latter case, we observed that the maximum number of cloud droplets forming - also called the limiting droplet number - and the updraft velocity follow a relationship that is universal, as proved by similar studies previously performed in different environments and cloud types. Finally, we successfully performed a droplet closure, proving, for the first time, the ability of our cloud droplet parameterization to predict cloud droplet number not only in liquid clouds but also in mixed-phase clouds with a very high degree of glaciation. This closure suggests that rime splintering may not be significant enough to affect droplet concentrations, which is consistent with previous observations and model simulations.

How to cite: Motos, G., Freitas, G., Georgakaki, P., Wieder, J., Aas, W., Lunder, C., Krejci, R., T. Pasquier, J., Henneberger, J., O. David, R., Mohr, C., Zieger, P., and Nenes, A.: Linking aerosol size distribution and hygroscopicity to cloud droplet formation at an Arctic mountain site, EGU General Assembly 2023, Vienna, Austria, 23–28 Apr 2023, EGU23-13074, https://doi.org/10.5194/egusphere-egu23-13074, 2023.

EGU23-13124 | ECS | Posters on site | AS1.11

Assessing Arctic low-level clouds and precipitation from above - a radar perspective 

Imke Schirmacher, Susanne Crewell, Katia Lamer, Mario Mech, and Manfred Wendisch

According to satellite-based estimations, a lot of clouds over the Arctic Ocean occur below
2 km. Most information on Arctic low-level clouds come from CloudSat radar measurements.
However, CloudSat lacks a complete representation of low-level clouds because the blind
zone masks the lowest kilometer and the coarse spatial sampling conceals cloud patterns.
Thus, higher resolved observations of cloud characteristics are needed to determine how
the cloud fraction varies close to the ground and how it depends on surface characteristics
and meteorological situation.

Our study investigates the low-level hydrometeor fraction of Arctic clouds over the ocean
using airborne remote sensing measurements by the Microwave Radar/radiometer for Arctic
Clouds (MiRAC) flown on the Polar 5 aircraft. Four campaigns have been conducted in the
vicinity of Svalbard during different seasons: ACLOUD, AFLUX, MOSAiC-ACA, and HALO-
AC3. We convolute the MiRAC radar reflectivity measurements to adapt the fine MiRAC and
coarse CloudSat resolution. The convoluted measurements are compared with the original
airborne observations over all campaigns to investigate the effects of CloudSat’s spatial res-
olution, clutter mask, and sensitivity on the low-level hydrometeor fraction. Measurements
reveal high hydrometeor fractions of up to 60% in the lowest 1.5 km, which CloudSat would
miss due to the blind zone. CloudSat would especially underestimate half of the total pre-
cipitation. During cold air outbreaks, when rolling cloud structures evolve, CloudSat over-
estimates the hydrometeor fraction most. Moreover, CloudSat does not resolve the separate
layers of multilayer clouds but rather merges them because of its coarse vertical resolution.

How to cite: Schirmacher, I., Crewell, S., Lamer, K., Mech, M., and Wendisch, M.: Assessing Arctic low-level clouds and precipitation from above - a radar perspective, EGU General Assembly 2023, Vienna, Austria, 23–28 Apr 2023, EGU23-13124, https://doi.org/10.5194/egusphere-egu23-13124, 2023.

EGU23-13191 | ECS | Orals | AS1.11

The evolution of clouds in Arctic marine cold air outbreaks 

Rebecca Murray-Watson and Edward Gryspeerdt

Marine cold air outbreaks (MCAOs) are important parts of the high-latitude climate system and are characterised by strong surface fluxes generated by the air-sea temperature gradient. These fluxes promote cloud formation, which can be identified in satellite imagery by the distinct transformation of stratiform cloud 'streets' into a broken field of cumuliform clouds downwind of the outbreak. This evolution of cloud morphology changes the radiative properties of the cloud and therefore is of importance to the surface energy budget.  

While the drivers of stratocumulus-to-cumulus transitions have been extensively studied for subtropical clouds, such as aerosols or the sea surface temperature gradient, the factors influencing transitions at higher latitudes are relatively poorly understood. This work uses reanalysis data to create a set of composite trajectories of cold air outbreaks moving off the Arctic ice edge and co-locates these trajectories with data from multiple satellites to generate a unique view of cloud development within cold air outbreaks. 

Clouds embedded in MCAOs have distinctive properties relative to clouds following other, more stable trajectories in the region. The initial instability and aerosol environments have distinct impacts on cloud development within outbreaks. The strength of the outbreak has a lasting effect on the magnitude of cloud properties along the trajectory. However, it does not strongly affect the timing of the transition to cumuliform clouds. In contrast, the initial aerosol concentration changes the timing of cloud break-up rather than the size of the cloud response.

How to cite: Murray-Watson, R. and Gryspeerdt, E.: The evolution of clouds in Arctic marine cold air outbreaks, EGU General Assembly 2023, Vienna, Austria, 23–28 Apr 2023, EGU23-13191, https://doi.org/10.5194/egusphere-egu23-13191, 2023.

EGU23-13388 | Posters on site | AS1.11

Occurrence of multilayer clouds and ice-crystal seeding during the Arctic Ocean 2018 and MOSAiC research campaign 

Peggy Achtert, Matthias Tesche, Gabriella Wallentin, and Corinna Hoose

Previous research on arctic clouds has focused on single-layer clouds. However, the occurrence of multi-layer clouds in the Arctic is of importance, since in such systems upper clouds can influence the phase of lower clouds. This is the case when ice crystals fall from above into supercooled liquid water clouds and trigger the formation of mixed-phase clouds.

The aim of our project is to investigate the occurrence of multi-layer clouds and seeding using the combination of radiosonde and cloud radar observations. The focus is on the MOSAiC campaign. In order to classify and interpret the results, previous measurements will be used as well.

During the Arctic Ocean 2018 campaign multi-layer clouds were observed 56% of the time and 48 % showed a likelihood of seeding. Previous satellite studies on multi-layer-clouds showed an occurrence of 11 %. During the MOSAiC campaign multi-layer clouds occurred around 50 % of the time and showed a latitude dependency, with more multi-layer clouds north of 84°N.

How to cite: Achtert, P., Tesche, M., Wallentin, G., and Hoose, C.: Occurrence of multilayer clouds and ice-crystal seeding during the Arctic Ocean 2018 and MOSAiC research campaign, EGU General Assembly 2023, Vienna, Austria, 23–28 Apr 2023, EGU23-13388, https://doi.org/10.5194/egusphere-egu23-13388, 2023.

EGU23-14418 | ECS | Orals | AS1.11

Simulating the effects of Ice-nucleating particles in Antarctica in COSMO-CLM² 

Florian Sauerland, Niels Souverijns, Anna Possner, Heike Wex, Preben Van Overmeiren, Alexander Mangold, Kwinten Van Weverberg, and Nicole van Lipzig

The remoteness of the Antarctic continent has important implications for the microphysical properties of clouds: In particular, the rare abundance of ice-nucleating particles (INP) limits the primary nucleation of ice crystals. Yet, persistent mixed-phase clouds with ice crystal number concentrations of 0.1-1l-1 are still observed in the Arctic and Antarctic. However, the ability of regional climate models to reproduce these mixed-phase clouds remains limited, much like the knowledge about their climatological effects. Thus, we added a module to the regional climate model COSMO-CLM² aimed at improving the parametrisation of the aerosol-cycle, which allows us to prescribe different concentrations of INPs. We examined the model response to different concentrations by running it in an area around the Belgian Princess Elisabeth Station in Dronning Maud Land for one month and with four different concentration settings: The first, corresponding to the low end of INP concentrations we observed at the station, the second, corresponding to the high end of INP concentrations we observed at the station, and the third and fourth, to the low and high end of continental observations. The performance was evaluated by comparing the simulation results with radar and ceilometer observations taken at the station. Finally, we analysed the differences between the four simulations to determine the overall sensitivity of the model to variability in INP concentrations, which allows us to draw conclusions about the importance of accurately simulating processes related to ice nucleation, and about the climatological implications that a change in aerosol concentrations would have.

How to cite: Sauerland, F., Souverijns, N., Possner, A., Wex, H., Van Overmeiren, P., Mangold, A., Van Weverberg, K., and van Lipzig, N.: Simulating the effects of Ice-nucleating particles in Antarctica in COSMO-CLM², EGU General Assembly 2023, Vienna, Austria, 23–28 Apr 2023, EGU23-14418, https://doi.org/10.5194/egusphere-egu23-14418, 2023.

EGU23-15022 | ECS | Posters on site | AS1.11

Impact of Atmospheric Rivers on the Arctic Surface Energy Budget 

Sofie Tiedeck, Benjamin Kirbus, Melanie Lauer, Susanne Crewell, Irina Gorodetskaya, and Annette Rinke

Atmospheric Rivers (ARs) are long, narrow atmospheric structures which carry anomalously warm and moist air from lower latitudes into higher latitudes. Therefore, ARs are discussed to contribute to Arctic Amplification due to water vapor feedback and cloud-radiation processes. The detailed impact on the surface energy budget (SEB), however, is not fully understood.

We analyze the impact of ARs on the SEB of an early winter and spring case study, using ERA5 reanalysis data and model output from limited area simulations of ICON (ICON-LAM). Both cases show less energy loss of the surface compared to climatology, especially due to more downward longwave radiation and less upward sensible heat. The effect depends on the surface type, open ocean or sea ice. Next, we provide a climatological perspective on the impact of Atmospheric Rivers on the SEB based on ERA5.

How to cite: Tiedeck, S., Kirbus, B., Lauer, M., Crewell, S., Gorodetskaya, I., and Rinke, A.: Impact of Atmospheric Rivers on the Arctic Surface Energy Budget, EGU General Assembly 2023, Vienna, Austria, 23–28 Apr 2023, EGU23-15022, https://doi.org/10.5194/egusphere-egu23-15022, 2023.

EGU23-16007 | ECS | Orals | AS1.11

One year of Aerosol and Cloud measurements in Rothera on the Antarctic Peninsula 

Floortje van den Heuvel, Tom Lachlan-Cope, Jonathan Witherstone, Joanna Dyson, Freya Squires, Daniel Smith, and Michael Flynn

Our limited understanding of clouds is a major source of uncertainty in climate sensitivity and climate model projections. The Southern Ocean is the largest region on Earth where climate models present large biases in short and long wave radiation fluxes which in turn affect the representation of sea surface temperatures, sea ice and ultimately large scale circulation in the Southern Hemisphere. Evidence suggests that the poor representation of mixed phase clouds at the micro- and macro scales is responsible for the model biases in this region. The Southern Ocean Clouds (SOC) project is a multi-scale, multi-platform approach with the aim of improving understanding of aerosol and cloud microphysics in this region, and their representation in numerical models.

In February 2022 we installed a suite of instruments at the Rothera research station on the Antarctic peninsula to measure the physical and chemical properties of aerosol, the number concentrations of Cloud Condensation Nuclei and Ice Nucleating Particles, and cloud height and thickness all year round. Here we will report the first observations and statistics of one full year of aerosol and cloud measurements from the Rothera research station.

How to cite: van den Heuvel, F., Lachlan-Cope, T., Witherstone, J., Dyson, J., Squires, F., Smith, D., and Flynn, M.: One year of Aerosol and Cloud measurements in Rothera on the Antarctic Peninsula, EGU General Assembly 2023, Vienna, Austria, 23–28 Apr 2023, EGU23-16007, https://doi.org/10.5194/egusphere-egu23-16007, 2023.

EGU23-716 | ECS | Posters on site | AS1.14

Analysis of the Genesis Potential Index in Subtropical Cyclones off the Coast of Brazil 

João Gabriel Martins Ribeiro, Gabriel Teodoro da Paz, Michelle Simões Reboita, Luiz Felippe Gozzo, Glauber Willian de Souza Ferreira, and Rosmeri Porfírio da Rocha

The coastal region of southern and southeastern Brazil, which is part of the South Atlantic Ocean basin, is a genesis region for subtropical cyclones and, therefore, is susceptible to weather changes caused by these systems. The first named subtropical cyclone in the South Atlantic basin was Anita in 2010. Since then, some studies on subtropical cyclones have been carried out, but there are still several questions to be investigated. Thus, this study aims to: (a) describe the main physical mechanisms of genesis of the subtropical cyclones that were named in the South Atlantic Ocean between 2010 and 2021 and (b) identify the value of the Genesis Potential Index (GPI) between the pre-cyclogenesis and the phase in which these systems acquire subtropical characteristics. The rationale for analyzing the CPI is that we want to identify a possible pattern that helps in operational weather forecasting. The main database used in the study is the ERA5 reanalysis. Of the 14 cyclones studied, only two systems did not have cyclogenesis with subtropical characteristics, but acquired it 24 hours after cyclogenesis. The results indicate that 5 cyclones have a genesis associated with mid-level troughs in the atmosphere, and 9 with blocking patterns (cutoff low type). As most of the cyclones studied occur in an environment with blocking structure, this indicates that the condition of weak vertical wind shear is an important factor for subtropical cyclones. As the GPI does not show a standard value in the 14 cyclones studied, between pre-cyclogenesis and the moment when these systems become subtropical, as it varies from 0.35 in the Deni genesis to 22.71 in the Anita genesis, perhaps it is not possible to use it with a threshold in operational practices. The authors thank Programa de P&D regulado pela ANEEL e empresa Engie Brasil Energia e a Companhia Energética Estreito for the financial support.

How to cite: Ribeiro, J. G. M., da Paz, G. T., Reboita, M. S., Gozzo, L. F., Ferreira, G. W. D. S., and da Rocha, R. P.: Analysis of the Genesis Potential Index in Subtropical Cyclones off the Coast of Brazil, EGU General Assembly 2023, Vienna, Austria, 23–28 Apr 2023, EGU23-716, https://doi.org/10.5194/egusphere-egu23-716, 2023.

Previous studies showed that the midlatitude atmospheric circulation generally shifts poleward in response to climate change induced by increased greenhouse gas concentration, including the midlatitude storm track and the eddy-driven jet. The magnitude of this shift varies widely between different climate models and depends on the season, hemisphere and longitude. In this study we aim to reexamine the connection between the shifts of the sensible eddy heat flux and the eddy-driven jet in response to climate change and the role of diabatic heating and latent eddy heat flux in this relation. Our approach is to use the constraints of the zonally averaged heat and momentum budgets in order to connect the eddy-driven jet latitude to the heat budget terms. First, we examine the relation between the eddy-driven jet latitude and the eddy heat flux latitude in the inter-model spread of CMIP6 models. We find that the latitudinal separation between the eddy heat flux and eddy-driven jet depends on the amount of diabatic heating in the midlatitude midtroposphere, which varies widely between different models. This relation is explained based on the heat and momentum budgets.

Next, we use an idealized general circulation model with interactive water vapor and full radiation. We customized the model with different levels of saturation vapor pressure by increasing CO2 concentration and by increasing the humidity factor in the Clausius-Clapeyron relation. We found that in both the cases the atmospheric circulation responds in a similar way and the heat budget terms shift upward and poleward, signifying an upward and poleward shift of the storm track. We found that when the diabatic heating rises upward and strengthens enough over the midlatitude mid-troposphere in response to climate change, the adiabatic cooling by the Ferrel cell rising branch balances the diabatic heating and an equatorward shift of the eddy driven jet and the Ferrel cell is observed. These results provide further insight to the relation between the responses of the midlatitude circulation and the poleward energy flux terms to climate change.

How to cite: Ghosh, S., Lachmy, O., and Kaspi, Y.: The latitudinal shift of the midlatitude atmospheric circulation in response to climate change and the role of midlatitude diabatic heating, EGU General Assembly 2023, Vienna, Austria, 23–28 Apr 2023, EGU23-1801, https://doi.org/10.5194/egusphere-egu23-1801, 2023.

EGU23-1812 | ECS | Orals | AS1.14

Extreme rainfall events in Morocco: spatio-temporal characteristics and climate drivers 

Abdelaziz Chaqdid, Alexandre Tuel, Abdelouahed EL Fatimy, and Nabil EL Moçayd

Extreme precipitation drives a series of natural disasters such as floods, flash floods, landslides, or crop losses. These disasters directly impact people's lives, their homes, and their food security. Located at the edge of the subtropics, on the northern edge of the Sahara desert, Morocco is particularly vulnerable to extreme precipitation. Indeed, between 1951 and 2015, Morocco experienced more than 35 major floods, which resulted in significant material and human losses. Understanding the spatio-temporal characteristics of extreme precipitation is key to better predicting and mitigating the risks associated with extreme precipitation events (EPEs). Yet, the spatio-temporal distribution and physical drivers of extreme precipitation in Morocco remain poorly understood. To address this gap, we apply temporal and spatial clustering methods to precipitation data from the ERA5 database as well as from observational databases to identify the main drivers of EPEs in Morocco. We find that Morocco exhibits five spatially coherent regions in terms of EPE timing, corresponding to mixed influences of large-scale extratropical and tropical weather systems. Indeed, EPEs in northern regions are caused by weather patterns similar to the negative phase of the North Atlantic Oscillation (NAO), associated with strong upper air flow enhanced by Greenland blocking and Rossby wave breaking (RWB). By contrast, extreme precipitation in southern regions is associated with tropical-extratropical interactions. There, EPEs are linked to an intense water vapor transport from the tropics and a relatively weak upper air flow.

How to cite: Chaqdid, A., Tuel, A., EL Fatimy, A., and EL Moçayd, N.: Extreme rainfall events in Morocco: spatio-temporal characteristics and climate drivers, EGU General Assembly 2023, Vienna, Austria, 23–28 Apr 2023, EGU23-1812, https://doi.org/10.5194/egusphere-egu23-1812, 2023.

EGU23-1890 | Orals | AS1.14

The thermodynamic differences between winter cyclones from midlatitudes and high latitudes 

Dandan Tao, Camille Li, Richard Davy, Shengping He, Clio Michel, and Andrea Rosendahl

Cyclones carry heat and moisture that impact local conditions along their path. Cyclones with different origins can, however, have different life cycles and cause different impacts. To quantify differences in the thermodynamic evolution of cyclones originating from different latitudes during wintertime, we separate the cyclones according to their origin (cyclogenesis location):  midlatitude (ML) cyclones originating in the North Atlantic and high-latitude (HL) cyclones originating in the Nordic Seas and Barents Seas. It is found that HL cyclones generally carry lower thermodynamic energy as they originate in a cold environment. In contrast, ML cyclones have much higher thermodynamic energy throughout their lifecycle, even though they lose a large amount of heat as they travel long distances from their origin towards the Arctic. For a given region in the high latitudes (e.g., the Barents Sea), the mean vertical profiles of temperature and moisture from the HL group are colder and drier compared to the ones from the ML group, but the maximum values in the HL group can reach those of the ML group. Further analysis for the top 10% warmest profiles in the HL group suggests that these HL cyclones form in a preconditioned warm and moist environment. The precondioning is set up by the large-scale circulation with influences from the upstream North Atlantic. Under special conditions, the formation of high latitude cyclones in a preconditioned warm and moist environment can lead to extreme warming events in the deep Arctic like the one during New Year’s 2015/16.

How to cite: Tao, D., Li, C., Davy, R., He, S., Michel, C., and Rosendahl, A.: The thermodynamic differences between winter cyclones from midlatitudes and high latitudes, EGU General Assembly 2023, Vienna, Austria, 23–28 Apr 2023, EGU23-1890, https://doi.org/10.5194/egusphere-egu23-1890, 2023.

EGU23-2195 | ECS | Orals | AS1.14

Origin of low-tropospheric potential vorticity in Mediterranean cyclones 

Alexander Scherrmann, Emmanouil Flaounas, and Heini Wernli

Mediterranean cyclones are extratropical cyclones, typically of smaller size and weaker intensity than other cyclones that develop over the main open ocean storm tracks. Nevertheless, Mediterranean cyclones can attain high intensities, even comparable to the ones of tropical cyclones, and thus cause large socio-economic impacts in the densely populated coasts of the region. After cyclogenesis takes place, a large variety of processes are involved in the cyclone’s development, contributing with positive and negative potential vorticity (PV) changes to the lower-tropospheric PV anomalies in the cyclone center. Although the diabatic processes that produce these PV anomalies in Mediterranean cyclones are known, it is still an open question whether they occur locally within the cyclone itself or remotely in the environment (e.g., near high orography) with a subsequent transport of high-PV air into the cyclone center. This study introduces a Lagrangian method to determine the origin of the lower-tropospheric PV anomaly, which is applied climatologically to ERA5 reanalysis and to 12 monthly simulations, performed with the IFS model. We define and quantify so-called "cyclonic" and "environmental" PV and find that the main part of the lower-tropospheric PV anomaly (60%) is produced within the cyclone, shortly prior (-12 h) to the cyclones’ mature stage. Nevertheless, in 19.5% of the cyclones the environmental PV production near the mountains surrounding the Mediterranean basin plays a significant role in forming the low-tropospheric PV anomaly, and therefore in determining the intensity of these cyclones. The analysis of PV tendencies from the IFS simulations reveals that the major PV production inside the cyclone is typically due to convection and microphysics, whereas convection and turbulent momentum tendencies evoke most of the positive PV changes in the environment.

How to cite: Scherrmann, A., Flaounas, E., and Wernli, H.: Origin of low-tropospheric potential vorticity in Mediterranean cyclones, EGU General Assembly 2023, Vienna, Austria, 23–28 Apr 2023, EGU23-2195, https://doi.org/10.5194/egusphere-egu23-2195, 2023.

EGU23-4675 | ECS | Posters on site | AS1.14

Storms and associated damages in Norway 

Ashbin Jaison, Asgeir Sorteberg, Clio Michel, and Øyvind Breivik

Extreme winds account for more than half of Norway’s insurance claims related to natural hazards [1]. Quantifying windstorm-damage relations is crucial to prepare for and mitigate the effects of future wind events. However, there has never been an attempt to quantify windstorm-damage relations at the municipality level in Norway. The work in hand employs four different damage functions at the municipality level of Norway. Along with the newly proposed modified Prahl damage function [2], an ensemble means of the damage estimates are tested for 356 municipalities in Norway. We evaluate the damage functions in terms of forecast accuracy. The spatial distribution of losses suggests severe damages along the west coast of Norway. Further inland in Norway, there are seldom any losses due to Norway’s unique topography and demography. The losses above the 99.7th percentile in each municipality constitute 85% of total national loss, and we focus on this extreme loss class. A significant agreement between the observed and estimated losses at the municipality and national levels indicates that the damage functions are suited for forecasting storm-induced damages. The damage functions are also able to successfully reconstruct the spatial spread and pattern of losses caused by very extreme windstorms.

References

1] Finance Norway, Natural Disaster Statistics (NASK), (2019)
[2] B.F. Prahl et al., Applying stochastic small-scale damage functions to German winter storms, Geophysical Research Letters 39, (2012)


How to cite: Jaison, A., Sorteberg, A., Michel, C., and Breivik, Ø.: Storms and associated damages in Norway, EGU General Assembly 2023, Vienna, Austria, 23–28 Apr 2023, EGU23-4675, https://doi.org/10.5194/egusphere-egu23-4675, 2023.

EGU23-5690 | ECS | Posters on site | AS1.14 | Highlight

Investigating the predictability of Mediteranean cyclones and their severity 

Benjamin Doiteau, Florian Pantillon, Matthieu Plu, Laurent Descamps, and Thomas Rieutord

Cyclones are essential elements of the climate and of the water cycle in the Mediterranean. The most intense of them lead to natural disasters because of their violent winds and extreme rainfall, which can cause significant damage to the territories bordering the Mediterranean (coast and mountain ranges). Reliable forecasts of cyclones are therefore essential to better anticipate and prevent their societal impact. However, their predictability is often limited by their particularities: smaller cyclones with a shorter life cycle than in the North Atlantic, complex topography, interactions with the relatively warm sea and air masses laden with dust from the Sahara.

We investigate the predictability of Mediterranean cyclones in a systematic framework using an ensemble prediction system. A reference dataset was first obtained by tracking cyclones in the ERA5 reanalysis (1979-2021), using an algorithm developped for the North Atlantic and adapted for the Mediterranean region. We then investigated the predictability using ARPEGE ensemble reforecasts in a homogeneous configuration over 22 years (2000-2021).

We restricted the study on 500 cases, which were selected using a storm severity index based on wind gusts and adapted for the Mediterranean region. The cases were then divided in several categories following their dynamical context, their intensity and their geographical origin. The predictability of the reforecasts was finally quantified on each of those categories, using probabilistic scores on cyclone trajectories (along and cross track error) and on intensities (mean sea level pressure and storm severity index).

While past studies have been limited by the fact that regular updates of operational forecasting systems do not allow the predictability of cases to be compared with each other, the homogeneous configuration of the ARPEGE ensemble reforecasts makes it possible to systematically identify the limitation to the predictability of Mediterranean cyclones.

How to cite: Doiteau, B., Pantillon, F., Plu, M., Descamps, L., and Rieutord, T.: Investigating the predictability of Mediteranean cyclones and their severity, EGU General Assembly 2023, Vienna, Austria, 23–28 Apr 2023, EGU23-5690, https://doi.org/10.5194/egusphere-egu23-5690, 2023.

A large number of intense cyclones occur every year in the Mediterranean basin, a relatively small and densely populated region, but also a worldwide climate-change hotspot. Given their importance for the variability of the regional climate and its extremes, Mediterranean cyclones have lately attracted much of attention, especially due to the broad range of severe socio-economic and environmental impacts that they produce.

This talk aims at summarizing the concentrated knowledge of the last decade on the dynamics, climatology and relevant impacts of Mediterranean cyclones. We will especially focus on the processes that take place in different spatiotemporal scales triggering cyclogenesis and turning Mediterranean cyclones into catastrophic storms. We will also discuss the role of the unique regional geographical features therein, along with the influence of the latitudinal location of the Mediterranean basin. Finally, we will discuss the different subtypes of Mediterranean cyclones that develop in the region, devoting special attention to medicanes, i.e. cyclones with tropical characteristics and subjects of numerous recent studies. Througout the talk, research perspectives that advance the field of Mediterranean cyclones as a whole will be highlighted, along with current trends in community efforts within the framework of MedCyclones COST Action that address relevant topics to the complex dynamics of Mediterranean cyclones and consequent severe socio-economic impacts.

How to cite: Flaounas, E.: Mediterranean cyclone dynamics and climatology: current knowledge and research perspectives, EGU General Assembly 2023, Vienna, Austria, 23–28 Apr 2023, EGU23-6278, https://doi.org/10.5194/egusphere-egu23-6278, 2023.

EGU23-6570 | Posters on site | AS1.14

Cloud-radiative heating shapes idealized extratropical cyclones by changing atmospheric stability 

Aiko Voigt, Behrooz Keshtgar, and Klara Butz

"All models are wrong. Some are wrong in a useful manner.” (adapted by the authors from George Box) In this presentation, we utilize an error in the surface flux formulation of the ICON-NWP numerical weather prediction model to elucidate how cloud-radiative heating affects the intensity of idealized extratropical cyclones.

We present idealized baroclinic life cycle simulations with two versions of the global atmosphere model ICON-NWP. Both versions simulate the same cyclone when run without radiative heating, but disagree when cloud-radiative heating is allowed to affect atmospheric temperature and the cyclone evolution. In version 2.1, taking into account cloud-radiative heating leads to a weaker cyclone, while in version 2.6 a stronger cyclone results. The simulations use a new modeling technique for which only cloud-radiative heating interacts with the cyclone and clear-sky radiative heating is omitted. The technique circumvents changes in the mean state due to clear-sky radiative heating that has complicated the interpretation of previous work.

A defining difference between the two model versions is the amount of simulated low-level clouds. Compared to version 2.6, version 2.1 simulates twice as many low-level clouds and a twice as strong cooling of the planetary boundary layer by cloud-radiative heating. While the increase in low-level clouds is tied to an error in the surface flux formulation in version 2.1 that was corrected in version 2.6, the error provides an opportunity to probe the impact of cloud-radiative heating in the boundary layer (below 2 km) versus the free-troposphere (above 2 km). Sensitivity studies show that negative cloud-radiative heating in the boundary layer from the tops of low-level clouds weakens the cyclone by making the atmosphere more stable. At the same time, they show that negative cloud-radiative heating near the tropopause from the tops of high-level clouds strengthens the cyclone by decreasing atmospheric stability. The changes in stability are particularly evident in regions of upward motion.

Overall, our results indicate that the vertical distribution of clouds and their radiative heating are an important factor for the dynamics of extratropical cyclones and that model differences in the simulation of low-level clouds can translate to model differences in cyclone intensity.

How to cite: Voigt, A., Keshtgar, B., and Butz, K.: Cloud-radiative heating shapes idealized extratropical cyclones by changing atmospheric stability, EGU General Assembly 2023, Vienna, Austria, 23–28 Apr 2023, EGU23-6570, https://doi.org/10.5194/egusphere-egu23-6570, 2023.

EGU23-6629 | ECS | Posters on site | AS1.14

Effects of climate variability and change on cyclones in the Mediterranean 

Onno Doensen, Martina Messmer, Woon Mi Kim, and Christoph Raible

The Mediterranean is characterized by a high extratropical cyclone activity. These cyclones are an important source for water availability in the region, but at the same time they have the potential to cause extreme weather in the form of precipitation and wind extremes. The Mediterranean is heavily affected by the ongoing anthropogenic climate change, which is expected to have a profound effect on cyclones in this area. In this study, we investigate the effects of internal climate variability and anthropogenic climate change on the characteristics of Mediterranean cyclones. The analysis is based on two simulations from the Community Earth System Model 1.2 (CESM): a seamless simulation spanning 3500 years from 1500 BCE to 2012 CE and a simulation of future RCP8.5 scenario from 2013 to 2300 CE. The simulations have a 1.9°x2.5° horizontal resolution, and cyclones are identified using an established detection and tracking algorithm. Comparison with the ERA5 reanalysis for the period 1981–2010 shows that CESM is able to realistically represent cyclone frequency on a global scale, though it slightly underestimates cyclone activity in the Mediterranean. Our results indicate that cyclone activity in the Mediterranean varies on interdecadal to centennial time scales before 1850 CE. These variations are linked to positive and negative climate anomalies and fluctuations in strength of several modes of circulation, such as the North Atlantic Oscillation. The variations caused by internal variability are, however, of smaller magnitude than the effects of future climate change on the Mediterranean cyclones. In the RCP8.5 scenario, Mediterranean cyclones will become less frequent based on our simulation, and cyclone related precipitation will decrease in addition to that, which is contrary to what is being observed in other important storm track regions, such as the North Atlantic. We hypothesize that the changes in cyclone characteristics are more pronounced in the Western Mediterranean than in the Eastern Mediterranean. Overall, the study suggests that cyclone activity in the Mediterranean is projected to leave the bandwidth of variability of the last 3500 years near the end of the century.

How to cite: Doensen, O., Messmer, M., Kim, W. M., and Raible, C.: Effects of climate variability and change on cyclones in the Mediterranean, EGU General Assembly 2023, Vienna, Austria, 23–28 Apr 2023, EGU23-6629, https://doi.org/10.5194/egusphere-egu23-6629, 2023.

Extratropical cyclone airstreams, such as warm conveyor belts (WCBs), are linked to strong precipitation along with latent heat release at low levels and, thus, changes in the low-level PV distribution. Previous studies have shown significant changes in PV anomalies in a future climate under the RCP8.5 scenario, which are also associated with changes in strong near-surface winds. However, the source of these PV anomalies is still unclear, especially at upper levels. Based on the 1% strongest winter-cyclones in the North Atlantic (NA) region over the two periods 1990-2000 and 2091-2100, we adopt a Lagrangian perspective to investigate such changes in CESM Large Ensemble simulations.
Backward trajectories are computed to explicitly identify the contributions of diabatic processes to future changes in cyclone-associated PV anomalies. Moreover, the role of specific airstreams in PV generation/destruction is examined with Lagrangian composites.
The results show a sinificant change in the mean trajectory properties 24 hours before the maximum cyclone intensity at low and upper levels. This period of 24 hours is taken to construct Lagrangian composites at 700 hPa and 250 hPa, which provide insights into changes in WCB and dry intrusion (DI) airstreams. We further analyze these airstrem changes by constructing cross sections downstream (WCB regime) and at the equatorward side (DI regime) of the cyclone center.
In general, increased diabatic heating along backward trajectories amplifies positive PV anomalies near the cyclone center at both lower and upper levels in a warmer future climate. More specifically, a poleward and upward shift of the WCBs with a larger PV production at middle levels are is found. DIs near the cyclone center are projected to be responsible for stronger PV production at low levels to the south of the cyclone center. At upper levels, the decreased PV anomaly to the south of the cyclone center results from a combined effect of a decreased climatological PV in the NA region and a shift in the origin of the air masses. The increasing importance of diabatic processes in a wamer climate suggests that a better representation of these processes in climate models is necessary to reduce uncertainties.

How to cite: Dolores-Tesillos, E. and Pfahl, S.: Future changes in North Atlantic winter cyclones in CESM-LE simulations from a Lagrangian-composite perspective, EGU General Assembly 2023, Vienna, Austria, 23–28 Apr 2023, EGU23-6851, https://doi.org/10.5194/egusphere-egu23-6851, 2023.

EGU23-7236 | ECS | Posters on site | AS1.14

Objective assessment of storm surge risk in the German Bight – historical events and future climate change 

Laura Schaffer, Nico Becker, Ludwig Schenk, Claudia Hinrichs, Gabriel Ditzinger, Nils H. Schade, Daniel J. Befort, and Tim Kruschke

Storm surges in the German Bight can have great destructive potential. This includes devastating floods, structural damage to infrastructure, and even loss of life. The most important driver of storm surge events in the German Bight is strong winds from north-westerly directions, often related to intense extra-tropical cyclones travelling from the North Atlantic into the North Sea region.

Making use of an objective, impact-oriented identification and tracking scheme, we analyse storm events related to storm surges in the German Bight. This particular version of the tracking algorithm includes the so-called Storm Surge Severity Index (SSSI) and is used as a complementary tool in operational forecasting by the German Federal Maritime and Hydrographic Agency (BSH). The SSSI takes wind speed and direction into account and intends to quantify storm surge risk in the German Bight. However, to date, the SSSI has never been systematically evaluated for past storm surge events. To fill this gap and to prove that the SSSI can be used as a proxy for storm surge risk, we analyse the relationship between SSSI values of past storm events and the associated water levels recorded in the German Bight using ERA5 atmospheric reanalysis data. Moreover, we analyse potentially storm surge-relevant storms in a multi-model ensemble of global climate model simulations to assess potential future changes in storm surge risk in the German Bight.

How to cite: Schaffer, L., Becker, N., Schenk, L., Hinrichs, C., Ditzinger, G., Schade, N. H., Befort, D. J., and Kruschke, T.: Objective assessment of storm surge risk in the German Bight – historical events and future climate change, EGU General Assembly 2023, Vienna, Austria, 23–28 Apr 2023, EGU23-7236, https://doi.org/10.5194/egusphere-egu23-7236, 2023.

EGU23-8826 | ECS | Orals | AS1.14

Global climatology of cyclone clustering in present and future climates 

Chris Weijenborg, Thomas Spengler, and Matthew Priestley

Cyclone clustering, the swift succession of multiple extratropical cyclones in a geographically confined region during a short period of time, constitutes a large fraction of European weather extremes. The idea that several cyclones follow a similar track dates back to the centennial concept of cyclone families of Bjerknes and Solberg. To investigate the dynamical causes of cyclone clustering, it is necessary to diagnose the occurrence of cyclone clustering and to determine their characteristics. So far, most diagnostics focused either on local impact or on a statistical analysis of storm recurrence. While the first cannot be applied globally, the latter is difficult to relate to individual events. We therefore use a novel method to globally detect cyclone clustering that is closer to the original concept of Bjerknes and Solberg, where extratropical cyclones follow similar tracks within a given time period.

Using this novel cyclone clustering diagnostic based on spatio-temporal distance between cyclone tracks, we analyse cyclone clustering globally in Era-Interim for the period 1979 until 2016 as well as for 10 CMIP6 models. We separate the cyclone clusters into two types: one representing the ‘classical’ bjerknes-type clusters, and one representing more stationary clusters. We find that cyclone clustering mainly occurs along the climatological storm tracks, with the bjerknes-type more common at the western side of the storm tracks, while the stationary-type of cyclone clusters occurs more downstream. In general, clustered cyclones are stronger than non-clustered cyclones. While CMIP6 models feature a slight bias towards an equatorward shift of the storm tracks, cyclone clustering in a future climate occurs more poleward. Furthermore, the average number of storms per cluster decreases in a future climate, though the mean intensity of the cyclones that are clustered increases slightly.

How to cite: Weijenborg, C., Spengler, T., and Priestley, M.: Global climatology of cyclone clustering in present and future climates, EGU General Assembly 2023, Vienna, Austria, 23–28 Apr 2023, EGU23-8826, https://doi.org/10.5194/egusphere-egu23-8826, 2023.

EGU23-9393 | ECS | Orals | AS1.14

Growing Pacific Linkage with Western North Atlantic Explosive Cyclones 

Jacob Stuivenvolt-Allen, Simon S.-Y. Wang, Yoshimitsu Chikamoto, Jonathan Meyer, and Zachary Johnson

Explosive cyclones (ECs), defined as developing extratropical cyclones that experience pressure drops of at least 24 hPa in 24 hours, are impactful weather events which occur along highly populated coastal regions in the eastern United States. These storms occur due to a combination of atmospheric and surface processes, such as jet stream intensification and latent heat release. Even though previous literature has elucidated the role of these processes in EC formation, the sources of interannual variability that impact seasonal EC frequency are not well known. To analyze the sources of interannual variability, we track cases of ECs and dissect them into two spatial groups: those that formed near the east coast of North America (coastal) and those in the North Central Atlantic (high latitude). The frequency of high-latitude ECs is strongly correlated with the North Atlantic Oscillation, a well-known feature, whereas coastal EC frequency exhibits a growing relationship with an atmospheric wave-train emanating from the North Pacific in the last 30 years. This wave-train pattern of alternating high-and-low pressure resulted in heightened upper-level divergence and baroclinic instability along the east coast of North America. Using a coupled model experiment, we show that the tropical Pacific Ocean and North Pacific oceans are the main driver of this atmospheric wave train and the subsequent enhancement seasonal baroclinic instability in the North Atlantic.

How to cite: Stuivenvolt-Allen, J., Wang, S. S.-Y., Chikamoto, Y., Meyer, J., and Johnson, Z.: Growing Pacific Linkage with Western North Atlantic Explosive Cyclones, EGU General Assembly 2023, Vienna, Austria, 23–28 Apr 2023, EGU23-9393, https://doi.org/10.5194/egusphere-egu23-9393, 2023.

EGU23-9411 | ECS | Posters on site | AS1.14

Explosive Cyclones in the Mediterranean Sea exploiting ERA5 dataset: detection, classification, statistical and synoptic analysis of their occurrance 

Cosimo Enrico Carniel, Rossella Ferretti, Antonio Ricchi, Gabriele Curci, Mario Marcello Miglietta, Marco Reale, Piero Serafini, Evan David Wellmeyer, and Dino Zardi

In the semi-enclosed basin of the Mediterranean Sea, a wide variety of cyclone mechanisms are known to develop, including baroclinic waves coming from the Atlantic, Mediterranean cyclones originating from the cut-off of baroclinic waves, Warm Seclusions, Tropical-Like Cyclones (TLC), Rapid-Cyclogeneses (RC) and Intense Mediterranean Cyclones (IMC). Depending on the cyclone's type, the characteristic frequency of appearance can vary, ranging from tens per month to around 1-1.5 per year, as in the TLC case. RCs are among the rarest and probably most intense and destructive cyclone events that can develop in nature; they usually originate at high latitudes, during wintertime, and mainly over the sea, preferring areas with high Sea Surface Temperature (SST) gradients. It is generally accepted that these events are described by quick drop of pressure, close to 1hPa/hr for 24 hours, within the eye of the cyclone. Several recent studies investigated the formation of RC’s over Mediterranean Basin (MB). RCs formation is an extremely complicated process, and in the MB  it is mostly driven by dry air intrusions from the stratosphere and by the trigger of Atmospheric Rivers.

Using ERA5 dataset, we firstly conducted a physical and dynamical analysis of the most intense cyclone events occurred in the Mediterranean basin in the period 1979-2020, identifying factors which triggered, generated and contributed to the intensification of such events. According to Sanders’ and Gyakum’s definition of Bergeron, a parameter which describes RCs’ deepening rate and varies from 28mb/(24h) at the pole to 12 mb/(24h) at latitude 25°N, we were able to classify them in the three aforementioned categories. With the help of EOF analysis, we outlined synoptic configuration more likely to drive the phenomena, highlighting the role of SCAND index and NAO-. Moreover, we have investigated the deepening with a new promising approach involving the use of 6 hours timespans, in order to single out the cyclones with higher gradients of pressure and faster evolution in semi enclosed basins. Further analysis is being undertaken to determine the cyclones’ phase and their main morphological characteristics, as well as their correlation with atmospheric rivers and SST anomalies exhibited by the Central Mediterranean Basin.

How to cite: Carniel, C. E., Ferretti, R., Ricchi, A., Curci, G., Miglietta, M. M., Reale, M., Serafini, P., Wellmeyer, E. D., and Zardi, D.: Explosive Cyclones in the Mediterranean Sea exploiting ERA5 dataset: detection, classification, statistical and synoptic analysis of their occurrance, EGU General Assembly 2023, Vienna, Austria, 23–28 Apr 2023, EGU23-9411, https://doi.org/10.5194/egusphere-egu23-9411, 2023.

EGU23-10041 | ECS | Posters on site | AS1.14

Tropical and extratropical circulation biases and the Southern Hemisphere Hadley cell width 

Pia Freisen, Julie Arblaster, Christian Jakob, and José Rodriguez

The widening of the Southern Hemisphere tropical meridional circulation has been attributed to various forcings from increased greenhouse gases, ozone depletion and natural variability. While climate models can reproduce some characteristics of this observed change, there is some uncertainty in the operating mechanisms and driving regions setting the edge of the tropical circulation. Here we examine the impacts of systematic model biases of the atmosphere-only Unified Model onto the simulation of the Southern Hemisphere tropical extent. We utilise nudging experiments with prescribed sea-surface temperatures, where potential temperature and horizontal winds are relaxed back to reanalysis for a 20-year period. Specifically, experiments with regionally-defined bias correction aide to determine the influence of remote model biases on the tropical width. The experiments are applied to different tropical width metrics previously identified to measure the boundary between the tropical to extratropical circulation. We uncover a more consistent improvement of the location of the Hadley cell edge by correcting Southern Hemisphere extratropical circulation biases, than tropical ones. The analysis is further expanded to the range of atmosphere-only model simulations of the Coupled Model Intercomparison Project Phase 6 (CMIP6). We explore the relationships between tropical and extratropical biases and the models’ representation of the Hadley cell.

How to cite: Freisen, P., Arblaster, J., Jakob, C., and Rodriguez, J.: Tropical and extratropical circulation biases and the Southern Hemisphere Hadley cell width, EGU General Assembly 2023, Vienna, Austria, 23–28 Apr 2023, EGU23-10041, https://doi.org/10.5194/egusphere-egu23-10041, 2023.

EGU23-10466 | Posters on site | AS1.14

Extratropical storm track activity change in future climate change scenarios 

Ui-Yong Byun, Eun-Chul Chang, Joowan Kim, Donghyun Cha, Joong-Bae Ahn, and Seung-Ki Min

In the mid-latitudes, synoptic-scale phenomena like high and low-pressure systems generate the variability of the regional-scale weather system. To identify the weather variability of extra-tropical region storm track activity has been analyzed based on observations since the mid-nineteenth century. After early-stage research that directly counted the movement of cyclones, the time filtering method based on grid analysis has been used for an isolated disturbance with periods of 2~7 days. This bandpass filtering method has the advantage of being able to examine the distribution and the variability of the storm track spatially in vertical and horizontal space.

In this study, we confirm the storm track activity in the East Asia region using the dynamical down-scale results from CORDEX (COordinated Regional climate Downscaling EXperiment) East Asia projects. We verify the reproducibility and confirm the temporal change in the storm track activity from various RCM data. In addition to the historical period, we examine the difference in storm track intensity over future climate change scenarios. Through this, we also discuss the role of added value from RCM.


This work was funded by the Korea Meteorological Administration Research and Development Program under Grant KMI2022-01210.

How to cite: Byun, U.-Y., Chang, E.-C., Kim, J., Cha, D., Ahn, J.-B., and Min, S.-K.: Extratropical storm track activity change in future climate change scenarios, EGU General Assembly 2023, Vienna, Austria, 23–28 Apr 2023, EGU23-10466, https://doi.org/10.5194/egusphere-egu23-10466, 2023.

EGU23-10857 | ECS | Posters on site | AS1.14

An assessment of extreme precipitation within cyclone composites using ERA5 

Cameron McErlich, Adrian McDonald, and James Renwick

Extra-tropical cyclones are key components of the atmospheric general circulation due to their ability to transport large quantities of heat, moisture, and momentum. Cyclones are an important contributor to extreme weather as their passage is associated with strong winds, and large precipitation accumulations. Here we connect a cyclone compositing scheme with regionally derived distributions of precipitation to present a framework for classifying spatially dependent extremes relative to the cyclone centre. Using this framework, cyclone composites for both average (50th percentile) and extreme (90th and 98th percentile) precipitation are derived from ERA5 reanalysis output. Composites are then partitioned into different stages of the cyclone lifecycle to assess the spatial and temporal evolution of precipitation extremes. We find that most extreme precipitation occurs within the comma-cloud structure close to the cyclone centre, with the extreme precipitation occurrence and intensity occurring in that region. Extreme precipitation is also identified to be largest during the period of deepening before the maximum cyclone intensity is reached. These regions of the cyclone correspond to places where large fractions of precipitation are above the extreme threshold. Strong spatial correlation are also seen between the average and extreme precipitation during the deepening phase for the precipitation mean, occurrence and fraction. This correlation weakens as the cyclone evolves and as the threshold used to determine extreme precipitation increases.

How to cite: McErlich, C., McDonald, A., and Renwick, J.: An assessment of extreme precipitation within cyclone composites using ERA5, EGU General Assembly 2023, Vienna, Austria, 23–28 Apr 2023, EGU23-10857, https://doi.org/10.5194/egusphere-egu23-10857, 2023.

EGU23-12391 | ECS | Posters on site | AS1.14

High-resolution loss modeling for European Windstorms 

Dhirendra Kumar, Len Shaffrey, Richard Dixon, Hannah Bloomfield, Paul Bates, and John Hillier

European windstorms are a frequent and damaging natural hazard that can cause loss of human life and damage to property and infrastructure. As there is a high degree of uncertainty in climate projections, it is crucial to understand the physical risks and economic losses at regional and local scales associated with European Windstorms. In this study, we develop a simple model to estimate historical windstorm losses over the European region. The model uses winds from the ERA5 reanalysis and different exposure datasets based on countrywide total insured property values, gross domestic product, and historical population density.

We find that the estimated losses associated with major historical storms in North-western Europe and estimated average EU-wide losses are comparable to the reported estimates and those from propriety vendor models. However, estimated losses from windstorms in France and Germany are lower than reported. Differences in the estimated losses are attributed to the contrasts in the regional-level exposure within and between different exposure datasets. We also tested the sensitivity of regional-level vulnerabilities and find that accounting for regional-level vulnerability differences slightly improves the biases in countrywide losses. Further, we also find that the major contribution to the estimated losses comes from the United Kingdom, France, and Germany for most of the storm seasons, and thus it is important to correctly represent the exposure and vulnerabilities over these countries. The ability of the model to estimate reported losses is also limited by the representation of the winds in ERA5, which has limited skill in representing the hazard footprint, especially for specific storms such as the Great October Storm of 1987.

Keywords: Losses, Windstorms, Climate Change, Natural Hazards

How to cite: Kumar, D., Shaffrey, L., Dixon, R., Bloomfield, H., Bates, P., and Hillier, J.: High-resolution loss modeling for European Windstorms, EGU General Assembly 2023, Vienna, Austria, 23–28 Apr 2023, EGU23-12391, https://doi.org/10.5194/egusphere-egu23-12391, 2023.

EGU23-12526 | ECS | Posters virtual | AS1.14

Volcanically induced increase in extra-tropical cyclone frequency 

Laurits Andreasen, Joona Corner, Peter Abbott, Victoria Sinclair, Felix Riede, and Claudia Timmreck

Volcanic eruptions are well known to influence Earth's temperature, however, how eruptions influence the atmosphere's circulation pattern, especially on the scale of everyday weather is poorly understood. Changing Earth's temperature can affect temperature gradients which in turn could affect baroclinicity and hence high- and mid-latitude weather. Yet, to what extent volcanic eruptions do in fact exert  such an influence is not clear.

To answer this, we followed two independent lines of investigation: First, we query the Greenland ice-core proxy record for Indications of increased extra-tropical cyclone frequency that correlates with evidence for volcanism. This is done by comparing the storm proxy sea salt (a substance transported to the ice sheet by wind)  with the volcanological proxy sulfur. Secondly, we simulate eruptions with the MPI-ESM1.2 Earth System Model and use the TRACK algorithm to explore how extra-tropical cyclone frequency is affected in the model  experiments. Both approaches suggest that volcanic eruptions impact high- and mid-latitude weather by increasing the number of extra-tropical cyclones especially at higher latitudes. A detailed interrogation of the simulated eruption scenarios suggests that this increase in cyclone frequency is associated with features such as an increase in isentropic slopes and sea-ice extent most commonly found under  colder climate regimes and is the reverse of what one finds in more equable climates such as that projected for the future.

How to cite: Andreasen, L., Corner, J., Abbott, P., Sinclair, V., Riede, F., and Timmreck, C.: Volcanically induced increase in extra-tropical cyclone frequency, EGU General Assembly 2023, Vienna, Austria, 23–28 Apr 2023, EGU23-12526, https://doi.org/10.5194/egusphere-egu23-12526, 2023.

EGU23-13180 | ECS | Posters on site | AS1.14

Drivers of large footprints of extreme winds and rainfall and their projected future changes 

Colin Manning, Elizabeth Kendon, Hayley J. Fowler, Jennifer L. Catto, Steven C. Chan, and Philip Sansom

Extratropical cyclones produce extreme surface wind speeds and heavy rainfall which can individually and jointly influence impacts and potentially produce large aggregate impacts. Within this study, we assess the UKCP 12-member ensemble of local convection-permitting 2.2 km climate projections. We quantify the likelihood of cyclones producing large footprints of both extreme winds and rainfall over the UK in a control (1981-2000) and future (2061-2080, RCP8.5) climate simulation. Following this, we characterise the convective and frontal drivers of wet and windy conditions within cyclones, and identify the characteristics of cyclones, their tracks and interactions with the jet stream that contribute to the occurrence of large, combined footprints in the control and future simulations. The future simulations project an increased probability of extratropical cyclones producing extremely wet and windy conditions in the same storm, as well as an increase in the land area covered by such conditions. In both the control and future simulations, combined wet and windy extremes largely occur close to cold and warm fronts, likely due to the warm conveyor belt which produces heavy rainfall (due its ascent over the frontal boundaries) and high winds (when occurring within a region of tight pressure gradients). Cyclone composites reveal that the largest changes in joint extremes are closely located within the sector of cyclones where we expect to see the warm conveyor belt, suggesting their change arises partly through the response of this shared driver rather than being a simple consequence of increased rainfall due to thermodynamics. In further analysis, we identify favourable conditions and cyclone characteristics that lead to cyclones producing large rainfall and wind footprints over the UK.

How to cite: Manning, C., Kendon, E., Fowler, H. J., Catto, J. L., Chan, S. C., and Sansom, P.: Drivers of large footprints of extreme winds and rainfall and their projected future changes, EGU General Assembly 2023, Vienna, Austria, 23–28 Apr 2023, EGU23-13180, https://doi.org/10.5194/egusphere-egu23-13180, 2023.

EGU23-13914 | Posters on site | AS1.14

Decadal variability of extreme winds and potential storm losses in Europe using large RCM ensembles 

Jisesh Sethunadh, Joaquim G. Pinto, Patrick Ludwig, Hendrik Feldmann, and Florian Ehmele

Windstorms (major winter storms) are one of the most important natural hazards in Europe. Despite the large observed socioeconomic losses, the impact of windstorms and its decadal variability is not yet fully understood. This study aims to assess the loss potentials associated with European windstorms and the variability in the wind speed climatology across Europe. We use the 12,500-years LAERTES-EU (LArge Ensemble of Regional climaTe modEl Simulations for EUrope) RCM ensemble to study the spatio-temporal distribution and variability of windstorms over Europe. LAERTES-EU is validated against reanalysis data (ERA5) and available ground-based station observations. The associated windstorm losses are estimated by computing statistics of extreme wind speeds and related indices. Different loss indices are validated using historical loss data from the insurance sector. The results reveal that the loss index (LI) is a good proxy for the estimation of potential losses associated with windstorms across Europe in winter. The derived statistics of extreme windstorms such as return periods (RP) show hardly any change in the severity and frequency of windstorms during the covered period 1900-2028, but a strong decadal variability is apparent.

How to cite: Sethunadh, J., Pinto, J. G., Ludwig, P., Feldmann, H., and Ehmele, F.: Decadal variability of extreme winds and potential storm losses in Europe using large RCM ensembles, EGU General Assembly 2023, Vienna, Austria, 23–28 Apr 2023, EGU23-13914, https://doi.org/10.5194/egusphere-egu23-13914, 2023.

EGU23-13929 | ECS | Posters on site | AS1.14

European windstorm risk at the regional scale under recent and future climate conditions 

Inovasita Alifdini, Julia Moemken, and Joaquim G. Pinto

European windstorms are among the natural hazards with the highest economic losses. We investigate the impact of European windstorms under recent and future climate conditions at high spatial resolution. With this aim, we use hourly surface wind data at 30 km resolution from ERA5 reanalysis for 1959-2021, and 3-hourly surface wind data at 12.5 km resolution from 60 different global-to-regional climate model (GCM-RCM) chains from EURO-CORDEX (EUR-11). The windstorm activity is compared in 30-year periods from the historical events (1976-2005) to the future events (under RCP8.5 scenario) at global warming levels (GWL) of +2°C and +3°C.  We apply different indices (meteorological index and loss index) to quantify the severity of windstorms and to estimate the corresponding impacts. For the historical period, storm Wiebke in 1990 (storm names as used by the German Weather Service DWD) caused the highest loss for Central Europe, followed by storm Lothar in 1999. The United Kingdom and Germany are countries in Central Europe that have the highest loss index (more vulnerable to the European windstorms). The results from the EURO-CORDEX ensemble show only small changes in windstorm activity between the historical period and the different GWLs, but display decadal variability.

How to cite: Alifdini, I., Moemken, J., and Pinto, J. G.: European windstorm risk at the regional scale under recent and future climate conditions, EGU General Assembly 2023, Vienna, Austria, 23–28 Apr 2023, EGU23-13929, https://doi.org/10.5194/egusphere-egu23-13929, 2023.

EGU23-14410 | ECS | Posters on site | AS1.14

Estimating worst-case European windstroms, and worst-case seasons, using seasonal forecasts. 

Jacob Maddison, Jennifer Catto, Stefan Siegert, and Sandra Hansen

Windstorms pose continual risk to Europe. Among their associated hazards, strong near-surface winds can be particularly damaging, threatening infrastructure, life and billions of pounds in insured losses. Insurers (and reinsurers) therefore need to prepare for the potential cost of extreme windstorms. Storm severity indices (SSIs) have been developed to quantify the potential losses associated with windstorm winds. Here, the most extreme windstorms that could potentially occur in the current climate are estimated using seasonal forecast data together with a cyclone-tracking algorithm, and their potential losses quantified using an SSI. As maximum wind gusts, the typical input variable for SSIs, are not available in the seasonal forecast dataset, a method is developed to calculate SSIs using wind speed data and a bias correction used to convert to SSI values representative of those obtained when calculated using wind gusts. Nearly 700 extended winter seasons of forecast data are analysed, representing a much larger sample of potential windstorms compared to that available from reanalysis or observational products. The storm track is reasonably well represented in the seasonal forecast data: spatial features are similar to those in a reanalysis, but there exists a slight poleward bias and underestimation of number of storms per season (maximal underestimation of around 10%). Additionally, distributions of SSI values for several countries in Europe are similar in the forecast data and reanalysis. Together, these suggest that the seasonal forecast data is suitable for analysing windstorm statistics and informing on potential extreme storms. We give estimates of worst-case storms, and worst-case seasons, that are identified in the forecast data and compare to those seen in a reanalysis, highlighting the potential insurance loss implications.

How to cite: Maddison, J., Catto, J., Siegert, S., and Hansen, S.: Estimating worst-case European windstroms, and worst-case seasons, using seasonal forecasts., EGU General Assembly 2023, Vienna, Austria, 23–28 Apr 2023, EGU23-14410, https://doi.org/10.5194/egusphere-egu23-14410, 2023.

EGU23-14446 | ECS | Orals | AS1.14

A framework for understanding the correlation between aggregated losses of compound events 

Toby Jones, David Stephenson, and Matthew Priestley

The risk from individual natural hazards (such as extratropical cyclones) can be large, but the aggregate loss over yearly timescales is significantly greater. For example, wind damage from the three major European windstorms in February 2022 caused more than €3.5 billion of insured losses.

This study proposes a random sum modelling framework for understanding the correlation between aggregate risks that occur from compound events. By considering the frequency and intensities of compound events as random variables, the framework provides an expression for correlation between two random sums (which each represent different types of loss from compound events).

The framework shows that this correlation will generally increase monotonically towards one as the dispersion (clustering) of the number of events increases. Under certain conditions, the correlation will always monotonically increase with dispersion.

The framework has been illustrated by applying it to annual sums from 1980-2020 using wind speed and precipitation as proxy measures for insured loss. This is calculated from ERA5 reanalysis data which includes 39587 storm events and covers the European region and Atlantic Ocean (from 30°N 100°W to 75°N 40°E).

The framework performs well, capturing the general behaviour of the correlation, with large positive correlation over the N. Atlantic Ocean and weaker correlations over European land regions.

How to cite: Jones, T., Stephenson, D., and Priestley, M.: A framework for understanding the correlation between aggregated losses of compound events, EGU General Assembly 2023, Vienna, Austria, 23–28 Apr 2023, EGU23-14446, https://doi.org/10.5194/egusphere-egu23-14446, 2023.

EGU23-14695 | Posters on site | AS1.14

Assessing the boundaries of seasonal forecast skill for European winter storms from different hindcast suites 

Gregor C. Leckebusch, Lisa Degenhardt, Elleanor Berrie, Kelvin S. Ng, and Elisa Spreitzer

European winter storms are a significant threat to communities, public infrastructure, and private and commercial properties. On seasonal timescales, potential predictability was evidenced in recent state-of-the-art seasonal hindcast suites e.g., the UK Met Office’s GloSea5. Related positive and potentially usable forecast skill for frequency and intensity measures were based on pre-season model initialisation around the beginning of November for the following core winter (DJF) season’s assessment.

This study expands on these findings by analysing extended lead times of seasonal forecast into autumn and late summer before the winter season. Here, in a systematic way, a multi-model ensemble of hindcasts is analysed to evaluate current models’ capability to forecast the seasonal activity for initialisations from September to November. First results indicate potential predictability precursors already from the September initialisations for storm frequencies. These results vary from model to model though. The presentation will discuss differences between models as well as lead times for both, storm frequency and intensity.

How to cite: Leckebusch, G. C., Degenhardt, L., Berrie, E., Ng, K. S., and Spreitzer, E.: Assessing the boundaries of seasonal forecast skill for European winter storms from different hindcast suites, EGU General Assembly 2023, Vienna, Austria, 23–28 Apr 2023, EGU23-14695, https://doi.org/10.5194/egusphere-egu23-14695, 2023.

CL5 – Tools for Climate studies

Present research focuses on temperature change signals over the Carpathian Basin with a special focus on selected lowland and mountainous sub-regions. Under the framework of the international initiative called COordinated Regional Downscaling EXperiment (CORDEX): EURO-CORDEX and Med-CORDEX provide regional climate model (RCM) simulations targeting Europe. Simulation of near-surface air temperature from a mini-ensemble of high-resolution (0.11°) EURO and Med-CORDEX RCM climate change experiments are analyzed based on raw and bias-adjusted data. The mini-ensemble consists of 8 RCM simulations driven by 5 different general circulation models (GCMs) for the period 1976–2099 under the high-end RCP8.5 (representative concentration pathway) scenario. The high-resolution, homogenized and quality controlled CARPATCLIM was used as a reference dataset during the bias-adjustment procedure. The selected sub-regions cover 8 municipalities located at diverse altitudes: Bratislava, Budapest, Brassov, Debrecen, Hoverla, Novi Sad, Pécs and Poprad. The following near-surface temperature related climate indices assessed over the region of interest: summer days (SU), ice days (ID), frost days (FD), tropical nights (TR), the coldest day (TXn), the warmest day (TXx), the coldest night (TNn) and the warmest night (TNx). In general, TXx, TNx and TNn were overestimated by the raw simulations by 1–4 °C in the central part of the region, but an underestimation was found in the case of TNn and TXn in the Carpathians for the reference period (1976–2005), whilst bias-adjusted RCM data showed almost perfect match with observations. Accordingly, no best performing RCM is found for all indices. The ensemble mean of the bias-adjusted RCM simulations project an increase (decrease) in the annual number of SU and TR (FD and ID) for the near future (2021–2050) and for the far future (2070–2099). Profound warming manifests in the increase of TXx of up to 2–3 °C by the near future and of 5–7 °C by the end of the 21st century. Our results also highlight the need on bias-adjusted data applied by different sectors (e.g. human health, agriculture, transport, tourism, disaster management or heritage conservation) in the context of national adaptation strategies.

How to cite: Simon, C., Kis, A., and Torma, C. Z.: On the need for bias-adjusted CORDEX data: present day and future temperature characteristics over the Carpathians at regional and local level, EGU General Assembly 2023, Vienna, Austria, 23–28 Apr 2023, EGU23-224, https://doi.org/10.5194/egusphere-egu23-224, 2023.

EGU23-494 | ECS | Orals | CL5.1

Error-Uncertainty Trade-off Judgment for Ensemble Member Selection of Regional Climate Models and Climate Change Impacts Modelling 

Amin Minaei, Wazita Scott, Robert Sitzenfrei, and Enrico Creaco

Abstract: Climate change and its impacts on the environment have become more than ever a worldwide challenging issue. Hence, decision makers are seeking reliable climate-impact models to take long term appropriate actions against this phenomena. In this study, ten regional climate models (RCMs) obtained from the European Coordinated Downscaling Experiment (EURO CORDEX) platform are evaluated on the Chiese river catchment located in the northeast of Italy. The models’ ensembles are assessed in terms of the uncertainty and error calculated through different statistical and error indices. The uncertainties are investigated in terms of signal (increase, decrease or neutral changes in the variables) and value uncertainties. Together with the spatial analysis of the data over the catchment, the weighted averaged values are used for the models’ evaluations and data projections. Using weighted catchment variables, climate change impacts are assessed on 10 different hydro-climatological variables showing the changes in the temperature, precipitation, rainfall events’ features and the hydrological variables of the Chiese catchment between historical (1991–2000) and future (2071–2080) decades under RCP (Representative Concentration Path for increasing greenhouse gas emissions) scenario 4.5.  

The results show that, even though the multi-model ensemble mean (MMEM) could cover the outputs’ uncertainty of the models, it increases the error of the outputs. On the other hand, the RCM with the least error could cause high signal and value uncertainties for the results. Hence, different multi-model subsets of ensembles (MMEM-s) of ten RCMs are obtained through a proposed algorithm for different impact models’ calculation and projection, making tradeoffs between two important shortcomings of model outputs, which are error and uncertainty. The single model (SM) and multi-model (MM) outputs imply that catchment warming is obvious in all cases and, therefore, evapotranspiration will be intensified in the future where there are about 1.28 C° and 6% value uncertainties for monthly temperature increase and the decadal relative balance of evapotranspiration. While rainfall events feature higher intensity and shorter duration in the SM, there are no significant differences for the mentioned features in the MM, showing high signal uncertainties in this regard. The unchanged catchment rainfall events’ depth can be observed in two SM and MM approaches implying good signal certainty for the depth feature trend; there is still high uncertainty about the depth values. As a result of climate change, the percolation component change is negligible, with low signal and value uncertainties, while decadal evapotranspiration and discharge uncertainties show the same signal and value. While extreme events and their anomalous outcomes direct the uncertainties in rainfall events' features values towards zero, they remain critical for yearly maximum catchment discharge in 2071–2080 as the highest value uncertainty is observed for this variable.

Keywords: climate change; regional climate model; specific region; ensemble evaluation; spatial analysis; impact model; error; uncertainty; hydrological variables

How to cite: Minaei, A., Scott, W., Sitzenfrei, R., and Creaco, E.: Error-Uncertainty Trade-off Judgment for Ensemble Member Selection of Regional Climate Models and Climate Change Impacts Modelling, EGU General Assembly 2023, Vienna, Austria, 23–28 Apr 2023, EGU23-494, https://doi.org/10.5194/egusphere-egu23-494, 2023.

EGU23-607 | ECS | Orals | CL5.1

The representation of summer monsoon precipitation over northeast India: Assessing the performance of CORDEX-CORE model experiments 

Mohammad Rafijuddin Ali Ahamed, Akanksha Sharma, John Mohd Wani, and Ashok Priyadarshan Dimri

In this study, the performance of the output data from the latest high-resolution Coordinated Regional Climate Downscaling Experiment-Coordinated Output for Regional Evaluations (CORDEX-CORE) model simulations is assessed with respect to the corresponding gridded Indian Meteorological Department (IMD) and ERA5 observations in representing the monsoonal precipitation over northeast India (NEI) for the period 1979-2005. Here, in this study, three different RCM model simulations (COSMO, RegCM4.7 and REMO) downscaled over the South Asian CORDEX domain are used. To understand how these RCMs perform over a data scarce region like NEI, various statistical techniques were used to evaluate their performance. Our results show that the COSMO model experiments perform better (moderate bias) with respect to both the observations as compared to other two RCMs. In contrast, the RegCM model experiments show very wet bias, whereas the REMO model experiments show more dry bias across a significant part of the study area. Quantitatively, the COSMO suite of models exhibits a little overestimation (~7 to 13%) in comparison to IMD, while an underestimation (~14 to 18%) is seen with ERA5. However, with respect to both the observations, the monsoon precipitation is overestimated (~15 to 80%) by the RegCM model and is underestimated (~15 to 50%) by the REMO model experiments. Overall, the output data from the CORDEX-CORE model experiments reproduces the monsoon precipitation over the study region but with biases that vary spatially over the study region. Finally, the results from this study offer a thorough assessment of the output data from the CORDEX-CORE model experiments over the largely unexplored NEI and hence can be considered a good tool to study climatological processes over the data-scare regions.

How to cite: Ahamed, M. R. A., Sharma, A., Wani, J. M., and Dimri, A. P.: The representation of summer monsoon precipitation over northeast India: Assessing the performance of CORDEX-CORE model experiments, EGU General Assembly 2023, Vienna, Austria, 23–28 Apr 2023, EGU23-607, https://doi.org/10.5194/egusphere-egu23-607, 2023.

EGU23-727 | ECS | Posters virtual | CL5.1

Projections of continentality and cold season indices in Ukraine based on the ensembles of Euro-CORDEX RCMs 

Larysa Pysarenko, Svitlana Krakovska, Tetiana Shpytal, Anastasiia Chyhareva, Iryna Trofimova, and Lidiia Kryshtop

The updated climate projections with fine spatial resolution of 0.1⁰ allow to evaluate more precisely regional features as climate change impacts unevenly on various geographical regions. The analysis performed for understanding the quantitative changes of climate characteristics for indicating climate extremity in cold season and daily (DTR) and annual (ATR) temperature ranges, and Ivanov index of thermal continentality (IITC) for Ukraine that can be used as the additional information for economic sectors. This research is based on the observational E-Obs v20.0e dataset and ensembles of 34 RCMs for RCP4.5 and RCP8.5 using the base periods of 1961-1990 and 1991-2010, and future ones – near-term (2021-2040), mid-term (2041-2060), and far-term (2081-2100). All characteristics were averaged for each 20-year period and bias-adjusted with applying the delta-method for avoiding and smoothing unnecessary fluctuations. It has been found that the general tendency for ATR will be decreasing with value 1-2°C and shifting from the west to the east for RCP4.5 and RCP8.5. It could be explained by the general trend of temperature increase and possible shrinking of temperature contrasts between the warmest and the coldest months. In comparison to ATR, DTR has low variations and not such apparent changes. They were detected in some regions with values up to 1°C. According to the results, IITC slightly variates over the region during the studied period, but the continentality increases in south-eastern regions of Ukraine based on RCP8.5 scenario in 2081-2100. In addition to, extreme temperature changes such as numbers of frost (FD) and ice days (ID) have been analyzed. They refer to cold season and are indicators of the harshness of the climate. Selected periods of climate projections allow to analyze the dynamics of climate change. Air temperature rise will provoke a significant decrease in the FD determined by daily minimum temperature (mostly in nights) during cold season up to 2100 for both scenarios. According to RCP4.5, the FD could decrease by the end of the century from 22 in the south to 34 nights or more in northern part of Ukraine. For the RCP8.5 scenario, FD possibly shorten by minimum 40 days on the coasts of Black and Azov Seas to 64 days or more in the north. To sum up, the FD will variate from 30 to 60 a year in Ukraine, except for the Carpathians and the east-northeast. For ID determined by daily maximum temperatures, maximum reduction of over 20 days are projected in the Carpathians and north-eastern part while they are from 15 to 20 days resulted in average 30 ice days per year for the most territory of the country based on RCP4.5. Substantial decrease in ID comparable with the recent one is projected in RCP8.5 till the end of the 21st century. It will result in less than 30 ID at most in northeast part for the country, only 10 days more in the coldest part of the Carpathians and extremely low number of ice days for the warmest part of the country namely Transcarpathia, the south and south-west.

How to cite: Pysarenko, L., Krakovska, S., Shpytal, T., Chyhareva, A., Trofimova, I., and Kryshtop, L.: Projections of continentality and cold season indices in Ukraine based on the ensembles of Euro-CORDEX RCMs, EGU General Assembly 2023, Vienna, Austria, 23–28 Apr 2023, EGU23-727, https://doi.org/10.5194/egusphere-egu23-727, 2023.

EGU23-835 | Posters virtual | CL5.1

Assessment of climatic season changes in Ukraine during 21st century based on an ensemble of 34 RCM projections of Euro-CORDEX 

Svitlana Krakovska, Vira Balabukh, Anastasiia Chyhareva, Tetiana Shpytal, Larysa Pysarenko, Iryna Trofimova, and Lidiia Kryshtop

The last decade proved to be the warmest in Ukraine for the whole period of instrumental weather observations. Recent and projected future warming will cause changes in the duration of climatic seasons in Ukraine with corresponding shifts in dates of their start and end.

As specified by the Expert Team on Climate Change Detection and Indices, climatic seasons are determined as periods from the first day after the start of a year to the first date after 1 July when at least 6 consecutive days mean daily temperature (t) exceeds (drops under) different thresholds. We analysed four climatic periods: warm period (t>0oC), growing season (t>5oC), active vegetation (t>10oC), and summer season (t>15oC).

To assess these projected changes bias-adjusted daily data of EuroCORDEX were used from 34 regional climate models for RCP4.5 and RCP8.5 scenarios for 3 future periods: near-term 2021-2040, mid-term 2041-2060 and far-term 2081-2100. Data of ensemble mean for two scenarios firstly were compared with E-Obs v20.0e results in the base period 1991-2010 and showed different biases for different climatic seasons, but very similar behaviour for both scenarios and both variables (length and start of climatic seasons). The least biases (< 0.5 days) were obtained for growing season, while biases reached -10 days for length of warm season and were within 1-3 days for other two seasons.

In general by the end of the century, under the RCP4.5 scenario in Ukraine, all analysed climatic season lengths may be the same as in the middle of the century under the RCP8.5 scenario.

By the end of the century, for the RCP8.5 scenario, the changes in the climatic seasons range from 40 to almost 70 days, increasing from east to west. As a result, in the coldest in Ukraine region winter is projected to last only from 10 to 30 days, and the vegetation will last throughout the year not only at the southern coast of the Black Sea but also the steppe part of the Crimea and some southern parts of Odesa region. There are almost no differences between scenarios for growing season length, start and end days in the near-term. The area with the longest growing season (from 240 to 260 days) will extend almost 200 km to the north.  

Under the RCP8.5 scenario, the length of active vegetation at the end of the century can range from 200 to 240 days, and in the Crimea and the south of Odesa region - 240-285 days, and summer length can vary from 140 days in the north to over half-year in the Crimea and southern Odesa. At the end of the 21st century, projected summer in Polissya will be as in the Crimea now - 140-160 days. Such climatic conditions were not observed in Ukraine previously. Increasing the length of the growing season and the period of active vegetation will strengthen the agro-climatic potential of Ukraine and contribute to obtaining higher yields of crops if corresponding measures in providing enough water supply will be implemented.

How to cite: Krakovska, S., Balabukh, V., Chyhareva, A., Shpytal, T., Pysarenko, L., Trofimova, I., and Kryshtop, L.: Assessment of climatic season changes in Ukraine during 21st century based on an ensemble of 34 RCM projections of Euro-CORDEX, EGU General Assembly 2023, Vienna, Austria, 23–28 Apr 2023, EGU23-835, https://doi.org/10.5194/egusphere-egu23-835, 2023.

EGU23-1402 | ECS | Orals | CL5.1

Elevation dependence of biases and trends of climatic indices in the EURO-CORDEX ensemble over the European Alps 

Michael Matiu, Anna Napoli, Sven Kotlarski, Dino Zardi, Alberto Bellin, and Bruno Majone

Mountain regions are especially sensitive to climatic changes. At the same time, the complex local topography modulates meteorological and climatic patterns. Here, especially the elevational dependence of meteorological variables is of high relevance, which is found in both observations and models at varying resolutions. However, previous evaluations of regional climate models focused on large scale horizontal spatial patterns and less on elevation dependencies. 

In this study we evaluate the historical EURO-CORDEX ensemble at 0.11° resolution over the European Alps as a function of elevation. In addition to evaluating the standard EURO-CORDEX model output we assess the impact of bias-adjustment as represented in the CORDEX-Adjust ensemble. The model data are compared to high-resolution observational datasets over the entire Alpine region, such as APGD and EOBS, and to national observational datasets. Besides climatic averages, also climatic indices that sample extreme conditions are evaluated. We identify how potential biases depend on elevation, region, and climatic index. In addition, we highlight potential advantages and weaknesses of bias-adjustment methods within CORDEX-Adjust with respect to elevation and climatic index. 

How to cite: Matiu, M., Napoli, A., Kotlarski, S., Zardi, D., Bellin, A., and Majone, B.: Elevation dependence of biases and trends of climatic indices in the EURO-CORDEX ensemble over the European Alps, EGU General Assembly 2023, Vienna, Austria, 23–28 Apr 2023, EGU23-1402, https://doi.org/10.5194/egusphere-egu23-1402, 2023.

EGU23-1616 | ECS | Orals | CL5.1

Impact of the Ocean-Atmosphere coupling on extratropical cyclones around the Mediterranean basin 

Marco Chericoni, Giorgia Fosser, and Alessandro Anav

The Mediterranean basin is well recognized as one of the main climate change hotspots; besides, this region is one the most active cyclogenetic area of the Northern Hemisphere with a large number of intense cyclones occurring every year mainly during winter and fall. The climatology of Mediterranean cyclones has been deeply investigated in the past years, leading to a high agreement on the tracks density, seasonal cycle and favorite locations of cyclogenesis. Nevertheless, open questions still remain on the future evolution of Mediterranean cyclogenesis and associated impacts. Mediterranean cyclones typically present weaker intensities, smaller sizes and shorter lifetimes than tropical cyclones or other mid-latitude cyclones that develop over open oceans. However, they are often responsible for extreme precipitation and wind events leading to severe socio-economic and environmental impacts especially over densely populated regions and coastal areas. Thus, studying the feedbacks of air-sea interactions on Mediterranean cyclones will bring to a better understanding of both the contribution of cyclones to the variability in and extremes of the regional climate and the impacts on the marine ecosystems as well as the associated risks in maritime transportation and coastal structures.

This study aims to investigate the added values of the ocean-atmosphere coupling in regional climate models in reproducing Mediterranean cyclones. To this end, two simulations are performed using the ENEA-REG regional earth system model at 12 km over the Med-CORDEX domain. The first experiment uses the mesoscale WRF model with prescribed Sea Surface Temperature (SST), while in the second WRF is coupled to the MITgcm ocean model. Different tracking methods, based on sea level pressure, are used to account for the uncertainties linked with mathematical and physical definitions of cyclone itself. The simulations are validated against ERA5 reanalysis dataset in terms of their ability to reproduce the Mediterranean cyclone climatology as well as to represent sub-daily fields linked to the cyclones (e.g. SST, heat fluxes, wind, precipitation). Here we show how the coupling of the atmosphere with an interactive ocean model affects the number of cyclones along with their intensity and duration.

How to cite: Chericoni, M., Fosser, G., and Anav, A.: Impact of the Ocean-Atmosphere coupling on extratropical cyclones around the Mediterranean basin, EGU General Assembly 2023, Vienna, Austria, 23–28 Apr 2023, EGU23-1616, https://doi.org/10.5194/egusphere-egu23-1616, 2023.

EGU23-2571 | Posters on site | CL5.1

Long-term impact of urban areas on meteorological conditions: focus on cloud/rain microphysics and convection 

Anahí Villalba-Pradas, Jan Karlický, and Peter Huszár

Urban environments not only affect the warming rate over cities through the so-called urban heat island (UHI) but also induce changes in other relevant meteorological variables. This study aims to evaluate the impact that different combinations of urban, microphysics and convective parameterizations have on a number of meteorological variables, including temperature, wind, and those related to cloud/rain microphysics. Simulations were performed using the WRF model with a domain at 9km horizontal resolution centered over Prague covering central Europe for the 2008-2017 period. The urban schemes used include bulk, the single-layer urban canopy model (SLUCM), and the multilayer urban models (BEP-BEM) with a building energy model including anthropogenic heat due to air conditioning. We further consider another scenario in which the urban land use category is fully replaced by a rural one (NO URBAN). Besides, we also used two different options for the microphysics and convective schemes. These parameterizations are the Purdue and Lin and the WRF Double moment 6-class scheme for the microphysics option, and the Grell3D and the Grell and Freitas schemes for the convective scheme. Our results show that the inclusion of urban canopy schemes leads to an increase in temperature and a decrease in wind speed as well as to changes in other relevant meteorological values such as cloudiness and precipitation, which also depend on the microphysics and convective scheme used.

How to cite: Villalba-Pradas, A., Karlický, J., and Huszár, P.: Long-term impact of urban areas on meteorological conditions: focus on cloud/rain microphysics and convection, EGU General Assembly 2023, Vienna, Austria, 23–28 Apr 2023, EGU23-2571, https://doi.org/10.5194/egusphere-egu23-2571, 2023.

EGU23-3713 | Posters on site | CL5.1 | Highlight

A Multi-Index Examination of Future Fire Season Length and Severity Over the United States 

Melissa Bukovsky, Lee Kessenich, Seth McGinnis, Linda Mearns, John Abatzoglou, and Alison Cullen

Our goal is to better understand the potential effects of climate change on fire danger for the near (2030-2060) and far (2069-2099) future.  We examine changes in fire season length and severity using multiple regional climate model (RCM) simulations and multiple fire indexes for the entire United States.  As different fire indexes make different assumptions about fuel and soil conditions, and different fire indexes are favored for different applications in different regions, we use 8 indexes, with 2 variations on 3 of those, for 11 measures of fire behavior.  We examine changes in the number of days above the 80th, 90th, and 97th percentiles of these indexes, corresponding to thresholds used to assign descriptors of fire danger as high, very high, and severe.  To define fire season length, we use the number of days above the 80th percentile for each given index.     

We employ thirteen simulations produced for the North American component of the Coordinated Regional climate Downscaling Experiment (NA-CORDEX), leveraging RCP8.5 emission scenario simulations for the future projections.  From these simulations, we calculate the KBDI (Keetch-Byram Drought Index), mFFWI (modified Fosberg Fire Weather Index), CFWI (Canadian Fire Weather Index), FM100 and FM1000 (100- and 1000-hour Fuel Moisture), ERC (Energy Release Component), BI (Burning Index), and SFDI (Severe Fire Danger Index).  Two fuel scenarios, G and LAF, are input into ERC, BI, and SFDI.  

By mid-century, most regions are projected to see an increase in the length of fire season, though the magnitude of this projected change varies considerably by region and fire index (and the latter’s sensitivity to precipitation).  Agreement on a lengthening of the season by up to 50% is strongest across simulations and fire indexes over the Southern Plains and Southwest U.S.  Changes in fire season severity are largest and most consistent across indexes for the U.S. west of the Mississippi River, excluding the intermountain West, where uncertainty is higher across the indexes and RCMs.  An approximately 2- to 6-fold increase in the number of days that reach the severe fire danger threshold is projected by mid-century.  Simulations for the far future are qualitatively similar, but the projected changes are quantitatively worse and more widespread.

How to cite: Bukovsky, M., Kessenich, L., McGinnis, S., Mearns, L., Abatzoglou, J., and Cullen, A.: A Multi-Index Examination of Future Fire Season Length and Severity Over the United States, EGU General Assembly 2023, Vienna, Austria, 23–28 Apr 2023, EGU23-3713, https://doi.org/10.5194/egusphere-egu23-3713, 2023.

EGU23-3828 | Orals | CL5.1

Comparison of Regional Climate Model Simulations to Observational Data for Georgia 

Mariam Elizbarashvili, George Mikuchadze, Tímea Kalmár, and Jeremy Pal

The global climate change resulting from natural and growing anthropogenic factors of particular importance for the territory of Georgia as the frequency and intensity of extreme weather events (extreme high temperatures, heavy precipitation levels, and agricultural and ecological droughts) are increasing in the territory. Georgia’s complex orography and proximity to the Black and Caspian Seas necessitates the use of high-resolution models, such as regional climate models, to assess future climate change hazards. In this study, we analyse the output from high-resolution simulation of mean and extreme precipitation and temperature using the Abdus Salam International Centre for Theoretical Physics Regional Climate Model version 4.7.1 for the period of 2010–1014 as an initial assessment of model performance for the territory. The simulation is performed at a 12 km horizontal grid spacing using ERA5 data as boundary conditions. Comparison with observed station data shows that the model performs better in simulating the monthly mean and extreme values of temperature than precipitation. In some mountain stations, the biases between observation and simulated precipitation are high, partly due to the mountainous terrain, when the horizontal resolution of the model (12 km) can lead to a significant discrepancy between the model's points and the locations of weather stations.  

This study represents the first step of Georgia’s first high resolution assessment to better understand how climate change will impact the territory required to climate change policy and decision-making.

This work was supported by Shota Rustaveli National Science Foundation of Georgia (SRNSFG) № FR-19-8110.

How to cite: Elizbarashvili, M., Mikuchadze, G., Kalmár, T., and Pal, J.: Comparison of Regional Climate Model Simulations to Observational Data for Georgia, EGU General Assembly 2023, Vienna, Austria, 23–28 Apr 2023, EGU23-3828, https://doi.org/10.5194/egusphere-egu23-3828, 2023.

This study is part of the CLIENT II-project Drought-ADAPT which investigates droughts in Mainland Southeast Asia (MSEA) with a focus on the Central Highlands of Vietnam and under recent and future climate conditions. For these purposes, we use the regional climate model REMO (v2015). This version, as it is used in recent CORDEX-simulations like CORDEX-SEA and CORDEX-CORE, considers a single-layer soil and static vegetation scheme.

Soil hydrology and vegetation play a key role for mass and energy fluxes between the land surface and the atmosphere. Thus, their adequate representation by schemes is very important to simulate the fluxes. Hence, we replace the single-layer soil scheme by a multilayer one which allows a vertical water movement in the soil. Its application in Central Europe led to improved land surface-atmosphere fluxes. Additionally, the static vegetation is replaced by an interactive vegetation module, called iMOVE, which solely was implemented in REMO2009. It allows the interaction of various plant characteristics with environmental conditions, like a decrease of LAI during dry conditions, while the former static version prescribes monthly static values independent of the prevailing conditions. We’ll show results of the effects both individual changes have on the mentioned fluxes and related variables in the study area of MSEA. Additionally, we’ll present first results of the promising combination of both individual schemes.

How to cite: Abel, D., Ziegler, K., and Paeth, H.: Multilayer soil scheme and interactive vegetation in regional climate models – A case study for Mainland Southeast Asia using REMO, EGU General Assembly 2023, Vienna, Austria, 23–28 Apr 2023, EGU23-5125, https://doi.org/10.5194/egusphere-egu23-5125, 2023.

EGU23-8528 | Orals | CL5.1

Validation of RegCM5 at convection parametrized resolution over the CORDEX-CORE domain and at convection permitting resolution over the Euro-CORDEX domain 

Erika Coppola, Graziano Giuliani, Pichelli Emanuela, Rita Nogherotto, Francesca Raffaele, James Ciarlò, Sabina Abba Omar, Natalia Zazulie, Chen Lu, Luiza Vargas, and Andressa Andrade Cardoso

New evaluation simulations with the ERA5 boundary conditions have been completed with the new model RegCM5 for all CORDEX-CORE domains at 25 km resolution. Model performances are satisfactory for all evaluation metrics for both the mean climate and extreme climate and for temperature, precipitation and cloud variables. For some of the domains the new model is able to remove some well know biases like the dry bias in the Amazon region in the CAM domain or the warm bias in the La Plata basin for the SAM domain. In other domains the RegCM5 performs consistently with the previous model version.  One simulation at convection permitting resolution (CP) has been completed for the first time for the whole Euro-CORDEX domain thanks to the new semi implicit dynamical core implemented in the RegCM5 that allow the model to remain stable at such resolution even with time steps of 30 seconds at 3 km resolution.   The evaluation of the CP simulation is comparable with the previous model evaluation over the ALPS domain with a tendency to improve both the dry and wet bias in summer and winter respectively. Over the whole Euro-CORDEX domain validation of the sub daily statistic for the precipitation frequency, intensity and diurnal cycle confirm the fitness for purposes of this new model version to run at such resolution for such extended region. A further CP configuration is also tested with two overlapping longitudinal stripe domains covering the Euro-CORDEX domain and the comparison is shown between the two CP simulations. 

How to cite: Coppola, E., Giuliani, G., Emanuela, P., Nogherotto, R., Raffaele, F., Ciarlò, J., Abba Omar, S., Zazulie, N., Lu, C., Vargas, L., and Andrade Cardoso, A.: Validation of RegCM5 at convection parametrized resolution over the CORDEX-CORE domain and at convection permitting resolution over the Euro-CORDEX domain, EGU General Assembly 2023, Vienna, Austria, 23–28 Apr 2023, EGU23-8528, https://doi.org/10.5194/egusphere-egu23-8528, 2023.

EGU23-8847 | ECS | Orals | CL5.1

Studying the process of climate change using the continuous form of the Feddema climate classification 

Amanda Imola Szabó, Hajnalka Breuer, Michal Belda, and Ferenc Ács

An important field of application of climate classifications is the study of climate change. Feddema’s climate classification scheme, which is a simplified water-budget based Thornthwaite-type method set out to better define climate parameters to interpret climate change processes for both research and educational purposes. However, pre-defined classes can limit the analysis. For example, grid points with values of the variables required for climate classification close to the climate boundaries can switch to a value belonging to another climate type interval without significant change in the climate variables, and similarly, a significant change is not necessarily will change the category. Feddema's method is suitable not only for determining the direction and extent of expected shifts in the climate and seasonality type changes, but also through the shift of indices expressing annual and seasonal characteristics: annual heat and water availability, seasonal variability, and the seasonally changing variable.

In this study, projected annual and seasonal changes of the Larger Carpathian Region (LCR)'s climate during the 21st century are analysed based on the Feddema-continuous approach. Observational data are taken from the CarpatClim which is the best open access dataset for the region. Projected changes are estimated using an RCA4-EC-EARTH simulation with EUR-11 resolution, following the RCP8.5 scenario from EURO-CORDEX.  According to the results, the Feddema-continuous method allows to show the magnitude and direction of changes of an area classified in a specific climate or seasonality type based on the Feddema-indices determined per grid point. Moreover, it is also presented how the newly occurred warm thermal-category developed according to the changes in the water-budget. The method also allows to determine the trajectory of changes in different climate characteristics during the 21st century.

How to cite: Szabó, A. I., Breuer, H., Belda, M., and Ács, F.: Studying the process of climate change using the continuous form of the Feddema climate classification, EGU General Assembly 2023, Vienna, Austria, 23–28 Apr 2023, EGU23-8847, https://doi.org/10.5194/egusphere-egu23-8847, 2023.

EGU23-9292 | ECS | Orals | CL5.1

The representation of large lakes in high-resolution regional climate models 

Mani Mahdinia, Andre Erler, Yiling Huo, and W. Richard Peltier

It has been found that large lakes, a common component of the North American (NA) landscape, can affect the water cycle and modulate temperatures in the surrounding regions. The purpose of this study is to evaluate different lake representations in regional climate model simulations. We use the Weather Research and Forecasting (WRF) model, a widely-used regional climate model, forced by the ERA5 reanalysis product. The study is performed for a 40 year historic period (1979-2019) at a resolution of 12 km. The lakes of concern include the Laurentian Great Lakes, which straddle the US-Canada border; the Great Slave and Great Bear Lakes of the Northwest Territories; and the Lakes Winnipeg and Winnipegosis. Alongside the default lake model, two new column lake models are employed: FLake, a more widely used model, and GL25, a recent, physics-based model. These models have been somewhat successful at alleviating inadequacies of the default model by introducing additional process representations, such as a more realistic surface albedo formulation and a better parameterization for vertical overturning. Additionally, we consider the effect of vertical eddy diffusivity and lake stratification on the model performance. While no column lake model is expected to perform perfectly, our goal here is to identify when (seasonally) and where (geographically) a model produces reliable results, including ice cover distribution and near-surface temperature. The effect of the lake representation on the surrounding regions (e.g., lake-effect precipitation) is also evaluated. We find that the two new lake models perform reasonably well, but there are significant differences in seasonal biases with GL25 performing better in summer and FLake performing better in winter; in fact, FLake reproduces the ice cover of the Great Lakes very well. Furthermore, the biases do not seem to be affected by surface wind induced circulation, and hence 3D modelling may not be a requirement for lake modelling. This study can help with the selection of lake models for regional climate modelling in the NA region and inform the interpretation of the predictions.

How to cite: Mahdinia, M., Erler, A., Huo, Y., and Peltier, W. R.: The representation of large lakes in high-resolution regional climate models, EGU General Assembly 2023, Vienna, Austria, 23–28 Apr 2023, EGU23-9292, https://doi.org/10.5194/egusphere-egu23-9292, 2023.

The aim of this study is to present an assessment of precipitation, simulated with the non-hydrostatic regional climate model RegCM4.7.1 at a regional and convection-permitting (CP) scale for a decade-long period, over Bulgaria domain. The simulations use a horizontal grid spacing of 3 km and are driven by the ERA-Interim reanalysis (0.75° x 0.75°) through an intermediate driving RegCM4 simulation at 15 km grid spacing using parameterized deep convection. The km-scale simulation is evaluated against E-OBS (0.1° x 0.1°) and CHIRPS (0.05° x 0.05°) datasets and is compared with the coarser-resolution driving simulation. We focus on different precipitation statistics such as seasonal mean daily precipitation, seasonal wet-day intensity, seasonal wet-day frequency, and seasonal heavy precipitation. The simulated period is 2000 - 2010.  The simulations are carried out on the HPC Discoverer supercomputer, located in Sofia Tech Park in Sofia, Bulgaria. 

    Acknowledgements
    This work is supported by the Bulgarian National Science Fund, KP-06-М57/3. We acknowledge Discoverer PetaSC and EuroHPC JU for awarding this project access to Discoverer supercomputer resources.

   Keywords: RegCM4.7.1; km-scale resolution; convection-permitting; extreme precipitation; intensity; frequency; regional climate modelling; Bulgaria

How to cite: Valcheva, R., Popov, I., and Gerganov, N.: Assessment of precipitation statistics with non-hydrostatic regional climate model RegCM4.7.1 at regional and convection-permitting scale over Bulgaria , EGU General Assembly 2023, Vienna, Austria, 23–28 Apr 2023, EGU23-9768, https://doi.org/10.5194/egusphere-egu23-9768, 2023.

Jordan is a Middle Eastern, developing country at significant risk for the adverse effects of human-induced climate change, including drought incidents. The region is highly vulnerable to drought due to being a water-scarce nation that shares limited water resources, the arid and semi-arid climate conditions, and the population explosion owing to the surrounding conflicts. Using regional climate model simulations from the Coordinated Regional Downscaling Experiment (CORDEX) project, a robust study has been developed to analyze current and future drought conditions in Jordan. The country is included in more than one CORDEX domain. This poses the question, as how sensitive is downscaling to the choice of domain? The regional climate models (RCMs) and the global climate models (GCMs) are two other sources of uncertainty. The goal of this first step study is to address the separate contributions of domain selection, downscaling regional models, and forcing global models to simulation uncertainty. This information will direct the best use of CORDEX to produce climate change signals by combining the results from the various CORDEX domains and enhancing the drought analysis. 

 Legasa et al. (2020) and Diez-Sierra et al. (2022) assessed the uncertainty related to the choice of domain as opposed to that of models combining the uncertainty related to RCMs and GCMs. Legasa et al.'s work was conducted over the Mediterranean region. They concluded that the domain selection effect is negligible. 

In this study, seasonal and monthly climatology data of temperature and precipitation variables from MENA (Middle East and North Africa) and Africa CORDEX domains were considered to construct Taylor diagrams and apply the analysis of variance method over Jordan’s region. The results of the two variables show that the domain contributes the least to the variance and is negligible, whereas the GCMs-related uncertainty contributes the most. This result supports the procedure of building a grand ensemble of various model simulations relating to overlapping domains, which will be used to enhance the drought analysis and assist policymakers with planning mitigation and adaptation procedures.


References:

Legasa, M.N., et al. (2020) Assessing multidomain overlaps and grand ensemble generation in CORDEX regional projections. Geophys. Res. Lett. 47, https://doi.org/10.1029/2019GL086799

Diez-Sierra, J., Iturbide, M., Gutiérrez, J. M., Fernandez, J., Milovac, J., Cofiño, A. S., and Cimadevilla, E.: Assessing the consistency of CORDEX multidomain projections in overlapping regions worldwide, EGU General Assembly 2022, Vienna, Austria, 23–27 May 2022, EGU22-6059, https://doi.org/10.5194/egusphere-egu22-6059, 2022


How to cite: Alkhasoneh, H. and Rowe, C.: Assessing the separate contribution of the domain, RCM, and GCM to the uncertainty in CORDEX simulations over the overlapped regions that include Jordan, EGU General Assembly 2023, Vienna, Austria, 23–28 Apr 2023, EGU23-10668, https://doi.org/10.5194/egusphere-egu23-10668, 2023.

EGU23-11412 | ECS | Orals | CL5.1

Assessing and selecting CMIP6 GCMs ensemble runs based on their ability to represent historical climate and future climate change signal 

Ralph Trancoso, Jozef Syktus, Nathan Toombs, and Sarah Chapman

The latest advances in climate change science were recently summarised in the sixth assessment report of the IPCC, including the contribution of CMIP6 models to understand changes in future climate. The CMIP6 is composed of hundreds of simulations, where the same model can have a few dozen different realizations for a single shared socio-economic pathway (SSP). This wealth of environmental data can be challenging for end-users interested in selecting ensemble runs to perform downscaling and impact assessments. Here, we assess the performance of the CMIP6 historical ensemble runs against observational data (Australian Water Availability Project – AWAP) and reanalysis (ERA-Interim) using a combination of metrics such as the Kling Gupta efficiency (KGE) over Australian regions. The assessment was based on precipitation, minimum and maximum temperature and sea surface temperature for the period 1995-2014, accounting for seasonal, monthly and daily time steps. We also assessed the climate change signal for precipitation and temperature for mid-century and end-of-the-century and developed an algorithm to automatically select the best-ranked ensemble runs and represent the spread in the climate change signal – that is the Skill Spread Selection. The results are presented as a performance score ranging from 0 to 100 which can be used to rank and select ensemble runs with distinct future climate signals. The analysis has great potential to inform scientists and practitioners on the strengths and limitations of individual ensemble runs and offers a robust and practical solution for the selection of CMIP6 realizations.

How to cite: Trancoso, R., Syktus, J., Toombs, N., and Chapman, S.: Assessing and selecting CMIP6 GCMs ensemble runs based on their ability to represent historical climate and future climate change signal, EGU General Assembly 2023, Vienna, Austria, 23–28 Apr 2023, EGU23-11412, https://doi.org/10.5194/egusphere-egu23-11412, 2023.

EGU23-11670 | Orals | CL5.1

Comprehensive dataset assessing extreme winds over Europe in Regional Climate Models 

Stephen Outten and Stefan Sobolowski

Extreme events cause vast amounts of damage across Europe every year, with heavy rainfall events often causing the greatest loss of life and extreme wind events often causing the greatest financial losses. The accurate projection of the changes in extreme winds will continues to be invaluable for many industries, including insurance, construction, energy, and afforestation. Adaptation planning requires the estimation of how the magnitude and frequency of extreme events, including extreme winds, will vary in the future.

Extreme winds were examined in a selection of 15 Euro-CORDEX simulations. The peaks-over-threshold approach was used identify the extreme events based on the fitted Generalized Pareto Distributions (GPD), and maps of 30-year return winds for all locations over Europe were derived. Future changes in the frequency of extreme winds were assessed for Northern, Central, and Sothern Europe for three future periods, being the near, mid, and end of this century. The results show that the frequency of extreme wind events will increase from one period to the next over the 21st century in all three regions of Europe.

Recently, a new dataset has been created by extending the analysis to 52 of the Euro-CORDEX simulations, each a unique combination of global and regional model, using both the peaks-over-threshold and annual maxima methods. Since these simulations include multiple downscalings of the same global climate models by different regional climate models, it is possible to intercompare how the different model combinations represent extreme winds. This allowed us to isolate the influence of individual global and regional models in shaping the extreme winds in Euro-CORDEX simulations. From this, we have been able to statistically create maps of extreme winds across Europe for GCM-RCM combinations that were never run. These results will be presented, along with details of the new dataset, and a summary of the original 15-member study.

How to cite: Outten, S. and Sobolowski, S.: Comprehensive dataset assessing extreme winds over Europe in Regional Climate Models, EGU General Assembly 2023, Vienna, Austria, 23–28 Apr 2023, EGU23-11670, https://doi.org/10.5194/egusphere-egu23-11670, 2023.

High-resolution climate change projections are increasingly required to inform climate policy and adaptation planning. Downscaling of global climate models (GCMs) is required to simulate the climate at the spatial scale relevant for local impacts. Here, we dynamically downscaled 15 CMIP6 GCMs to a 10 km resolution over Australia using CCAM (Conformal Cubic Atmospheric model) for SSPs 126, 245 and 370. We compared the host CMIP6 models and downscaled simulations to the AGCD observational dataset, and evaluated performance using Kling-Gupta efficiency, and the Perkins skill score. The new added value index was derived by asssing the daily, monthly (annual cycle and amplitude) and seasonal climate for 1981-2100 period by comparing combined skill of CMIP6 host models and CCAM downscaled simulations. In addition to assesing the Perkins score for entire PDF,  the 5 and 95 percentlile for mean, minimum and maximum teperatures and fraction of dry days and 95 percentile of precipitation were considered. The combined skill score index/added value of downscaling was normalised and relative skill score of individual models can be compared for major IPCC regions and local gavernment planninga areas in Australia. 

Downscaling CMIP6 models improved performance for seasonal  and annual cycles for temperature (10% and 6%) and precipitation (43% and 13%). CCAM downscaling also improved the fraction of dry days, reducing the bias for too many low rain days by nearly half. The largest improvements were found in extremes, with improvements to extreme minimum temperatures in all seasons (varying from 142 to 201%), and improvements of 52% to extreme precipitation in Austral winter (JJA) and 47% in summer (DJF). The ensemble average overall skill score improved by 19% with downscaling. Temperature and precipitation biases were also reduced in mountainous and coastal areas. CCAM downscaling therefore adds value to the CMIP6 models,  so this dataset will be a valuable resource for understanding future climate changes in Australia. The new CMIP6 dataset is the largest in term of number of simulations and resolution for Australia and will contributed to CORDEX and Australian Climate Service database. Work is continuing on deriving climate extreme indices such as drought, heatwaves, fire weather, tropical cycliones and convective extrems, incliuding speciifc focus on climate hazards.


How to cite: Syktus, J., Chapman, S., and Trancoso, R.: Evaluation of dynamically downscaled CMIP6 models using CCAM over Australia. New appraoch to added value of downscaling using information on climate extremes, EGU General Assembly 2023, Vienna, Austria, 23–28 Apr 2023, EGU23-11689, https://doi.org/10.5194/egusphere-egu23-11689, 2023.

EGU23-11741 | Orals | CL5.1

Evaluation of CMIP6 GCMs: the perspective of RCM boundary conditions 

Eva Holtanova, Michal Belda, and Tomas Halenka

Global climate models (GCMs) represent invaluable instrument for various purposes, most prominently studying climate system dynamics, evolution of past climates and climate change projections. The newest set of GCM simulations has been produced under CMIP6 initiative coordinated by the the World Climate Research Programme’s (WCRP) Working Group on Coupled Modelling. Due to their coarse spatial resolution, some kind of downscaling is necessary for applications of GCM outputs on regional and local scales, with dynamical downscaling using regional climate models (RCMs) being a common solution of this issue. Clearly, the outputs of RCMs are influenced by the boundary conditions provided at the lateral boundaries of the integration domain. The magnitude of this influence is subject of ongoing research and depends on various aspects including the geographical region, temporal scale, climatic variable etc. Nevertheless, previous studies proved that an analysis of boundary conditions is needed for for proper RCM evaluation. Especially with regard to potential error propagation.

              In present study we evaluate the simulation of CNRM-ESM2-1, one of the CMIP6 GCMs, and compare it to other CMIP6 ensemble members. The CNRM-ESM2-1 is being used as driving model for convective-permitting simulation of Aladin-CLIMATE RCM within Czech national project PERUN aimed at creation of updated climate change scenarios for the Czech Republic. We concentrate on historical GCM simulations in the period of 1990-2014, and use reanalysis ERA5 as the reference. The analysis is conducted over the boundaries of Aladin-CLIMATE/CZ intergration domain, which covers Central Europe. The deviations of the driving GCM (CNRM-ESM2-1) from reanalysis are compared to other CMIP6 GCMs. We also evaluate uncertainty arising from natural climate variability using perturbed initial conditions ensemble of CNRM-ESM2-1.

How to cite: Holtanova, E., Belda, M., and Halenka, T.: Evaluation of CMIP6 GCMs: the perspective of RCM boundary conditions, EGU General Assembly 2023, Vienna, Austria, 23–28 Apr 2023, EGU23-11741, https://doi.org/10.5194/egusphere-egu23-11741, 2023.

EGU23-11868 | Orals | CL5.1

A perfect model study on the reliability of the added small-scale information in regional climate change projections 

Geert Lenderink, Hylke de Vries, Erik van Meijgaard, Karin van der Wiel, and Frank Selten

The issue of the added value (AV) of high resolution regional climate models is complex and still strongly debated. Here, we approach AV in a perfect model framework within a 16-member single model initial condition ensemble with the regional climate model RACMO2 embedded in the global climate model EC-Earth2.3.  In addition, we also used an ensemble produced by a pseudo global warming (PGW) approach. Results for winter temperature and precipitation are investigated from two different perspectives: i) a signal-to-noise perspective analysing the systematic response to changing emission forcings versus internal climate variability, and ii) a prediction perspective aimed at predicting a 30-year future climate state. Systematic changes in winter temperature and precipitation contain fine-scale response patterns, but in particular for precipitation these patterns are small compared to internal variability.  Therefore, single members of the ensemble provide only limited information on these systematic patterns. However, they can be estimated more reliably from PGW members because of the stronger constraints on internal variability. From the prediction perspective, we analysed AV of fine-scale information by comparing three prediction pairs. This analysis shows that there is AV in the fine-scale information for temperature, yet for precipitation adding fine-scale changes generally deteriorates the predictions. Using only the large-scale change (without fine scales) from a single ensemble member as a delta change on top of the present-day climate state, already provides a robust estimate of the future climate state and therefore can be used as a simple benchmark to measure added value.

How to cite: Lenderink, G., de Vries, H., van Meijgaard, E., van der Wiel, K., and Selten, F.: A perfect model study on the reliability of the added small-scale information in regional climate change projections, EGU General Assembly 2023, Vienna, Austria, 23–28 Apr 2023, EGU23-11868, https://doi.org/10.5194/egusphere-egu23-11868, 2023.

EGU23-12350 | ECS | Posters virtual | CL5.1

Evaluation of Regional Climate Model IITM-RegCM4 for Kashmir Valley in India 

Muhammed Rashid

Climate change caused by human activities is a major topic of discussion in today's world and is of great concern. Currently, India is experiencing several climate anomalies, including changes in the mean temperature and severe natural disasters due to climate change. Kashmir valley in Jammu and Kashmir, India, is considered one of the hotspots for such climate change risk due to its physiographic and geographic location. Therefore, it is essential to study the future trend in climate projections to take necessary mitigation and adaptation measures in this region. Currently, as part of the Coordinated Regional climate Downscaling Experiment (CORDEX), IITM Pune, uses a Regional Climate Model (RegCM4) to downscale global climate projection to a uniform 50 km resolution for the South Asia region. This RCM is driven by six global driving models, namely, CanESM2, CNRM-CM5, CSIRO-Mk3.6, IPSL-CM5A-LR, MPI-ESM-MR, and NOAA-GFDL-ESM2M. In the present study, the performance of the IITM-RegCM4 model coupled with their six driving models was evaluated for its capability to simulate the historical temperature projections over the Kashmir valley for the period of 29 years from 1977 to 2005. The outputs from six CORDEX model experiments of IITM, namely CanESM2-RegCM4, CNRM-RegCM4, CSIRO-RegCM4, IPSL-RegCM4, MPI-RegCM4, and NOAA-RegCM4, were compared with the IMD observational data for the region Srinagar and Qazigund. Comparative analysis of the projections from six models revealed that temperature projections from the CSIRO-RegCM4 model are more promising than all other climate model projections. Further, the future change in temperature in Kashmir Valley was estimated under the RCP 4.5 and 8.5 scenarios for the period 2011–2100. The results indicated an increasing trend in the mean maximum and mean minimum temperatures at both Srinagar and Qazigund stations under both scenarios compared to the base period (1977–2005). It was observed that under both scenarios, the annual mean maximum temperature is projected to increase from 1.6 °C to 1.7 °C during 2030s, 2.8 °C to 3.5 °C during 2060s, and 3.1 °C to 5.9 °C during 2090s. Similarly, the annual mean minimum temperature is projected to increase from 1.5 °C to 1.8 °C during 2030s, 3 °C to 3.9 °C during 2060s, and 3.4 °C to 6.1 °C during 2090s. The results and information generated from this study can be used for framing climate change adaptation and mitigation policies. The estimated variations in temperature can be used for adaptation planning in the Kashmir Valley.

How to cite: Rashid, M.: Evaluation of Regional Climate Model IITM-RegCM4 for Kashmir Valley in India, EGU General Assembly 2023, Vienna, Austria, 23–28 Apr 2023, EGU23-12350, https://doi.org/10.5194/egusphere-egu23-12350, 2023.

EGU23-13259 | Posters on site | CL5.1

Impact of land use change on local climate: regional climate model sensitivity experiments & scenarios within a multi-model set-up over Belgium 

Nicolas Ghilain, Xavier Fettweis, Sebastien Doutreloup, Bert Van Schaeybroek, Josip Bajkovic, Rafiq Hamdi, and Piet Termonia

Testing the sensitivity of regional climate models to the land cover/use changes in temperate regions is a preliminary step in the quantification of the respective contributions from human induced land surface changes and greenhouse gases emissions over Europe. Recently, the LUCAS-FPS (https://ms.hereon.de/cordex_fps_lucas/) initiative from Euro-CORDEX(https://www.euro-cordex.net/) has proposed a common framework and a time varying land cover database (Hoffmann et al., 2022) to build an ensemble of models responding to land use scenarios for the 21st century and ultimately to sort out the signal emerging from the impact of land use changes over Europe. In the meantime, coordinated experiments have been tested at higher resolution over Belgium for national and regional climate services. The present contribution focuses on the plans of coordinated experiments over Belgium (and Europe) with two regional climate models -MAR (Fettweis et al, 2013) and ALARO (Termonia et al, 2018)- :

i) the methodological aspects developed to make the simulations comparable and more in line with Euro-Cordex & LUCAS-FPS requirements ,

ii) the first results from the simulations over these domains by focusing on the changes in key climate variables for the historical past period used for verification and for a scenario of strong land cover change.


Fettweis, X., Franco, B., Tedesco, M., van Angelen, J. H., Lenaerts, J. T. M., van den Broeke, M. R., and Gallée, H.: Estimating the Greenland ice sheet surface mass balance contribution to future sea level rise using the regional atmospheric climate model MAR, The Cryosphere, 7, 469–489, https://doi.org/10.5194/tc-7-469-2013, 2013.


Hoffmann, P., Reinhart, V., Rechid, D. (2021) LUCAS LUC historical land use and land cover change dataset (Version 1.0). World Data Center for Climate (WDCC) at DKRZ.


Termonia, P., Fischer, C., Bazile, E., Bouyssel, F., Brožková, R., Bénard, P., Bochenek, B., Degrauwe, D., Derková, M., El Khatib, R., Hamdi, R., Mašek, J., Pottier, P., Pristov, N., Seity, Y., Smolíková, P., Španiel, O., Tudor, M., Wang, Y., Wittmann, C., and Joly, A.: The ALADIN System and its canonical model configurations AROME CY41T1 and ALARO CY40T1, Geosci. Model Dev., 11, 257–281, https://doi.org/10.5194/gmd-11-257-2018, 2018.

How to cite: Ghilain, N., Fettweis, X., Doutreloup, S., Van Schaeybroek, B., Bajkovic, J., Hamdi, R., and Termonia, P.: Impact of land use change on local climate: regional climate model sensitivity experiments & scenarios within a multi-model set-up over Belgium, EGU General Assembly 2023, Vienna, Austria, 23–28 Apr 2023, EGU23-13259, https://doi.org/10.5194/egusphere-egu23-13259, 2023.

EGU23-13648 | Orals | CL5.1

Examination of the effects of extreme weather events on solar power systems 

Lilian Fejes, Tamás Czira, Rita Pongrácz, Szabolcs Molnár, and Attila Talamon

Current climate change is characterised by a growing number of extreme weather events and their impacts, which can have a significant impact on energy production, transmission and supply systems, with the potential for severe damage to assets and permanent or intermittent supply disruptions. In order to identify the likely regional climate impacts on specific elements of solar power generation systems, a complex analysis of the expected changes, the sensitivity of infrastructure and the possibilities to adapt to these changes is needed.

Accordingly, one of the objectives of the research is to identify and characterize the climatological information and impacts that may pose a risk to solar energy generation facilities in the context of climate change. We investigate the role and significance of extreme weather events and their long-term projected changes for solar power systems in climate impact assessments. The changes of relevant meteorological events due to climate change and their impact on solar energy systems will be evaluated for Hungary based on data from regional climate model simulations available in EURO-CORDEX.

How to cite: Fejes, L., Czira, T., Pongrácz, R., Molnár, S., and Talamon, A.: Examination of the effects of extreme weather events on solar power systems, EGU General Assembly 2023, Vienna, Austria, 23–28 Apr 2023, EGU23-13648, https://doi.org/10.5194/egusphere-egu23-13648, 2023.

EGU23-14063 | ECS | Orals | CL5.1

Attributing runoff changes to present and future climate projections across Europe 

Ilaria Clemenzi, Yiheng Du, and Ilias Pechlivanidis

Weather and climate strongly influence the hydrology of natural and managed river basins. Changes in these forcings affect the water resources and hydrological extremes, i.e., floods and droughts, in time and space. Attributing the effect of climatic drivers on present and future runoff allows to understand the hydrological response of river basin to changing climate at the local and regional scale. Here, we investigated the runoff changes, including hydrological extremes, across Europe in the early (2010-2040), mid (2041-2070) and late (2070-2099) century. We used runoff simulations from the E-HYPE hydrological model and the bias-adjusted EURO-CORDEX climate model projections. The sensitivity of runoff changes to the climatic factors (precipitation and evapotranspiration) compared to the reference period (1981-2000) was evaluated with the climatic elasticity method through a Budyko approach. In addition, to address lack of robustness in our insights, we assessed the spatial consistency and uncertainty of the runoff changes due to the ensemble variability. Results showed that the sensitivity of runoff changes to climate change varies depending on the climatic gradient and basin physiographic properties. These results are a step towards enhanced hydro-climate services that allow attribution of (extreme) events to climate change.

How to cite: Clemenzi, I., Du, Y., and Pechlivanidis, I.: Attributing runoff changes to present and future climate projections across Europe, EGU General Assembly 2023, Vienna, Austria, 23–28 Apr 2023, EGU23-14063, https://doi.org/10.5194/egusphere-egu23-14063, 2023.

EGU23-14262 | ECS | Orals | CL5.1

A new, high-resolution climatological atmospheric dataset for southern New Zealand 

Elena Kropac, Thomas Mölg, and Nicolas J. Cullen

The regional climate of New Zealand’s South Island is shaped by the interaction of the Southern Hemisphere westerlies with the complex orography of the Southern Alps. Due to the geographical setting of New Zealand in the south-west Pacific, the properties of the transported air masses and the regional circulation itself are strongly influenced by the surrounding oceans. Therefore, variations in sea surface temperature (SST) are reflected on a variety of spatial and temporal scales and are statistically detectable through to temperature anomalies and glacier mass balance changes in the high mountains of the Southern Alps. The relationship between SST and high-mountain climate has not yet been investigated from a process perspective, leaving the underlying physical mechanisms that transmit large-scale SST signals to local climate anomalies and glacier mass changes unknown.

We used dynamical downscaling with the Weather Research and Forecasting (WRF) model laterally forced by ERA5 reanalysis data to produce a regional atmospheric modeling dataset for the South Island of New Zealand. The dataset covers the present-day, 16-year period of 2005 to 2020. The high horizontal resolution of 2 km ensures that high-mountain topography and glaciers are resolved realistically, and convection is modeled explicitly. The two-domain setup is centered on Brewster Glacier, a benchmark glacier close to the main divide of the Southern Alps, which is the focus of further process-oriented investigations. The model configuration has been optimized to provide both reasonable output and fast simulation time, allowing for expense-limited follow-up sensitivity experiments.

The dataset is evaluated regionally against an extensive network of observational meteorological data from the National Institute of Water and Atmospheric Research (NIWA) and MetService New Zealand as well as against atmospheric water content from Moderate Resolution Imaging Spectroradiometer (MODIS) imagery. Locally, the model output is compared to high-mountain weather station measurements at Brewster Glacier. The model represents variability in both atmospheric water content and near-surface meteorological conditions generally well, although there are both seasonal and spatial biases that are particularly confined to high elevations. The local climate at Brewster Glacier (where landuse and topographic conditions have been optimized) is remarkably well represented on both seasonal and daily timescales.

Given the fact that the Southern Hemisphere has been understudied in terms of multiscale climate and cryosphere relations, the dataset provides a unique and valuable tool for investigations of climate change and related impacts in southern New Zealand with high interdisciplinary relevance. Data from the finest-resolution model domain are available for download at daily temporal resolution from a public repository.

How to cite: Kropac, E., Mölg, T., and Cullen, N. J.: A new, high-resolution climatological atmospheric dataset for southern New Zealand, EGU General Assembly 2023, Vienna, Austria, 23–28 Apr 2023, EGU23-14262, https://doi.org/10.5194/egusphere-egu23-14262, 2023.

EGU23-14434 | Orals | CL5.1

Using climate model projections to provide relevant climate information to Arctic reindeer herding communities 

Heidrun Matthes, J. Otto Habeck, Roza Laptander, Teresa Komu, Kirill Istomin, Tim Horstkotte, Hans Tømmervik, Sirpa Rasmus, Jussi T. Eronen, and Bruce C. Forbes

Reindeer herding is a culturally and economically significant livelihood of local communities in the circumpolar North, strongly depending on environmental conditions. Providing climate information for such a target group requires brining together local knowledge and climate model projections.

In this study, information collected in interviews with reindeer herders on what makes a year good or bad for them (critical conditions) was used as a basis for defining indices that can be calculated from climate model projections. In this process, we associated the critical condition to meteorological variables, for example “temperatures above 20°C in June and July” were related to an index tasmax20, which counts the number of days in June and July with daily maximum temperatures above 20°C. In this way, we identified three types of critical conditions/indices (1) indices that can be calculated relatively easily, some of them conforming to climate extreme indices common in climate change analysis; (2) indices that need either more specific information from herders (eg to make a condition “July and August should not be cold”, a specific definition of “cold” is needed) or scientific background knowledge (e.g. “abundance of mosquitos” needs information on the necessary meteorological variables and their thresholds) so they can be calculated; and (3) indices that cannot be calculated from the output climate models commonly provide, because they require for example variables like daily soil temperature (rain on frozen ground) or river ice.

We have focussed our analysis on Fennoscandia and northwestern Russia, using data from the CMIP6, EURO CORDEX and Polar CORDEX data bases to calculate in a first step indices from category (1) for different RCP futures. For example, exposure multiplication factors reveal that for tasmax20, increases by the end of the century are up to a factor of 10 for RCP4.5 and a factor of 20 for RCP8.5, with obvious latitudinal patterns.

How to cite: Matthes, H., Habeck, J. O., Laptander, R., Komu, T., Istomin, K., Horstkotte, T., Tømmervik, H., Rasmus, S., Eronen, J. T., and Forbes, B. C.: Using climate model projections to provide relevant climate information to Arctic reindeer herding communities, EGU General Assembly 2023, Vienna, Austria, 23–28 Apr 2023, EGU23-14434, https://doi.org/10.5194/egusphere-egu23-14434, 2023.

EGU23-14895 | Orals | CL5.1

Understanding precipitation extremes with a multi-feature tracking tool 

Priscilla Mooney, Andreas Prein, and James Done

We present a new method to track weather features that is designed to understand and evaluate regional climate processes and hydrological extremes in models. Tracked phenomena include extratropical cyclones, fronts, atmospheric rivers, high-pressure systems, mesoscale convective systems, tropical cyclones, and their relationship to extreme precipitation. The tracker is applied to ERA5 reanalysis data to explore specific historical events and build up climatologies of object frequencies and characteristics such as intensity, size, and trajectories. The key benefit of this multi-feature tracking method is to understand connections across features, such as the location of atmospheric rivers relative to extra-tropical cyclones or the role of blocking high-pressure systems in heat waves and downstream extreme precipitation. This provides a more process-based understanding of hydrologically relevant weather systems than can be obtained through Eulerian-based assessments. Future work will apply this multi-feature tracking method to Euro-CORDEX and Polar CORDEX simulations and compare with the more traditional Eulerian-based skill scores. This work contributes to the Big Data and Climate FRONTIER project that seeks to mitigate future challenges associated with the exponential increase in climate data expected over the next decade using smart design processes and big data methods.

How to cite: Mooney, P., Prein, A., and Done, J.: Understanding precipitation extremes with a multi-feature tracking tool, EGU General Assembly 2023, Vienna, Austria, 23–28 Apr 2023, EGU23-14895, https://doi.org/10.5194/egusphere-egu23-14895, 2023.

EGU23-15005 | Orals | CL5.1

Systematic errors in regional climate simulation of East Asian winter monsoon 

Seok-Woo Shin, Minkyu Lee, Chang-Young Park, Eunji Kim, Taeho Mun, Ana Juzbašić, and Dong-Hyun Cha

East Asian Winter Monsoon (EAWM) is an important system, which has impact on extreme winter phenomena, in East Asia including the Korean Peninsula. EAWM is characterized by the Siberian high with cold air and the Aleutian low with warm air, low-level northerly wind between them, East Asian trough in the middle troposphere, and East Asian jet stream in the upper troposphere. According to some previous studies, the variability of EAWM, which can be influenced by human activity and climate change, is strongly correlated with the occurrence of cold waves in East Asia. Additionally, EAWM variability has been shown to affect the precipitation during winter on the Korean Peninsula. Extreme boreal winter phenomena such as cold waves and heavy snow related to EAWM can induce disruptions to regular life and socio-economic damage. Regional climate models (RCMs) have added value in the simulations of extreme climate phenomena, but also have internal variability, which can increase uncertainty in future climate projections. Therefore, in this study, to closely understand EAWM and reduce the uncertainty in future climate projection, the performance of two RCMs (SNURCM and WRF) for EAWM simulation was evaluated. The results showed that two RCMs had the ability to capture the interannual variability and climatological spatial pattern of EAWM despite the systematic biases of EAWM in the lower troposphere (e.g., comparatively low correlation and larger temporal-spatial variability than reanalysis). Additionally, two RCMs presented significant cold bias over the Manchuria and wet bias over the Kuroshio Current. In further analysis, their systematic errors were positively correlated with EAWM, which had a larger pressure gradient between the Siberian high and the Aleutian low and colder advection over Manchuria than those of the ERA5. Wet biases over the Kuroshio Current could be related to unreasonable simulation EAWM induced by uncoupled air-sea interaction in RCMs.

How to cite: Shin, S.-W., Lee, M., Park, C.-Y., Kim, E., Mun, T., Juzbašić, A., and Cha, D.-H.: Systematic errors in regional climate simulation of East Asian winter monsoon, EGU General Assembly 2023, Vienna, Austria, 23–28 Apr 2023, EGU23-15005, https://doi.org/10.5194/egusphere-egu23-15005, 2023.

EGU23-15038 | Orals | CL5.1

The emergence of projected scaled patterns of extreme weather events over Europe 

Tugba Ozturk, Emine Canbaz, Başak Bilgin, Dominic Matte, Mehmet Levent Kurnaz, and Jens Hesselbjerg Christensen

This work investigates the scalability of wet and dry persisting condition patterns over the European domain with global warming levels. For this aim, we have used the EURO-CORDEX ensemble of regional climate projections at 0.11° grid-mesh for daily minimum and maximum temperature and precipitation to analyze future changes in extreme weather events addressing climate warming levels of 1°C, 2°C, and 3°C, respectively. A simple scaling with the annual mean global mean temperature change modeled by the driving GCM is applied. The annual minimum of daily minimum temperature (TNN) is found to increase more compared to the annual maximum of daily maximum temperature (TXX) at the end of the century. We also identify the emergence of the scaled patterns of minimum and maximum temperatures and wet and dry persisting conditions about certain extreme weather indices. The emergence of the scaled patterns of TNN occurs from around 2040, whereas TXX pattern is emerging around 2050. Individual GCM-RCM pairs tend to have stable spatial patterns since then for both indices. The ensemble mean patterns are emerging earlier than the individual models.

Acknowledgments 
This study was funded by the Scientific and Technological Research Council of Turkey (TUBITAK) ARDEB 3501 Grant No 121Y587.

How to cite: Ozturk, T., Canbaz, E., Bilgin, B., Matte, D., Kurnaz, M. L., and Christensen, J. H.: The emergence of projected scaled patterns of extreme weather events over Europe, EGU General Assembly 2023, Vienna, Austria, 23–28 Apr 2023, EGU23-15038, https://doi.org/10.5194/egusphere-egu23-15038, 2023.

EGU23-15193 | Orals | CL5.1

Hot spots of Global Temperature of Emergence of several CIDs for the European region 

Francesca Raffaele, Rita Nogherotto, Natalia Zazulie, and Erika Coppola

One important type of information for stakeholders is the time of emergence (TOE) of a particular climatic impact-driver (CID) in a specific region as reported also in the latest IPCC AR6. The TOE is the time when a certain signal emerges from the natural variability, thus it is an indicator of the magnitude of the climate change signal and it can be very important in a risk framework for mitigation purposes.

There is no single metric for ToE. It depends on user-driven choices of variables, space and time scales, the baseline relative to which changes are measured, and the threshold at which emergence is defined. In the present study, after testing different metrics, we chose the one based on the literature and  we calculated together with ToE, the Global Temperature of Emergence (GToE), where time is replaced with the global mean temperature and there is no more dependence on models differences and emission pathways. 

The GToE is thus defined on the basis of thresholds of temperature, the Global Warming Levels (GWL), expressed as changes in surface global temperature relative to the period 1850-1900.

The probability of reaching a specific GWL threshold is then estimated for each CID and each region of interest. 

In this study, we use GWL 1.0 1.5, 2.0, 3.0 and 4.0 as thresholds and we evaluated the probability of crossing them for several CIDs based on the Euro-CORDEX regional climate projections.

As expected the probability of crossing a certain threshold increases with the increase of GWLs. There are regions where high probability is shown even at lower GWLs and those indicate "CID hot spots" in the domain, such as in the Mediterranean for example, but also in Scandinavia for other specific CIDs.

How to cite: Raffaele, F., Nogherotto, R., Zazulie, N., and Coppola, E.: Hot spots of Global Temperature of Emergence of several CIDs for the European region, EGU General Assembly 2023, Vienna, Austria, 23–28 Apr 2023, EGU23-15193, https://doi.org/10.5194/egusphere-egu23-15193, 2023.

EGU23-15548 | ECS | Orals | CL5.1

A storyline approach to select the CMIP6 model ensemble to be downscaled for the South America domain 

Andressa Andrade Cardoso, Erika Coppola, Julia Mindlin, and Theodore G. Shepherd

The selection of the Global Climate Models (GCMs) needed to provide the initial and boundary conditions for the Regional Climate Model (RCM) downscaling is the first research question to answer for each RCM simulation in a given domain. The methodology is not unique and depends on the second research question that is typically behind any study based on dynamical downscaling, which is the physical process we want to study and which are the mechanisms that are relevant for it, or in a more general way which is the storyline of large-scale circulation we are interested in. In the South America region there are several large-scale circulation features that are relevant to describe the climate of this region together with the specific geographical characteristics and local scale processes and their interaction. In this work we will focus on two different large-scale circulation features: the South America Monsoon and the extratropical cyclones. For each of the two a criterion needs to be established to select which CMIP6 ensemble is more suitable for one or the other or for both, and to represent the uncertainty in their future evolution. To this aim we have defined and used a series of indicators derived from the comparison between the observation and the model and based on precipitation in specific regions of interest like La Plata and Amazon basin, and Southeastern Brazil region. A second set of indicators were based on the mean sea level pressure and wind at two different levels (850 hPa and 200 hPa) aimed at characterizing the main large scale circulation patterns (South American Low-Level jets, South Atlantic Subtropical High, South Pacific Subtropical High, trade winds, Bolivian High, cyclonic circulation vortex and upper-level jet stream). By mean of these indicators a sub set of CMIP6 models has been identified for each of the large-scale circulation features and the fitness for purpose of the whole ensemble evaluated. It is common to use different model climate sensitivities to represent the uncertainty in future evolution. Here we take a different approach and represent the uncertainty in terms of the influence of a small set of large-scale drivers, including both tropical and polar regions, which are known to affect the local circulation feature of interest and which optimally span the range of local circulation response uncertainty. The uncertainty in climate sensitivity is handled by expressing these dynamical storylines of change in terms of global warming levels. In this way, a small set of CMIP6 models can be chosen which is both fit for purpose and which avoids missing plausible worst-case scenarios for regional climate risk.

How to cite: Andrade Cardoso, A., Coppola, E., Mindlin, J., and G. Shepherd, T.: A storyline approach to select the CMIP6 model ensemble to be downscaled for the South America domain, EGU General Assembly 2023, Vienna, Austria, 23–28 Apr 2023, EGU23-15548, https://doi.org/10.5194/egusphere-egu23-15548, 2023.

EGU23-15733 | Orals | CL5.1

Future characteristics of tropical cyclones over CORDEX East Asia domain in Multi-RCMs under the SSP scenarios 

Eunji Kim, Taehyung Kim, Taeho Mun, Seok-Woo Shin, Minkyu Lee, Dong-Hyun Cha, Eun-Chul Chang, Joong-Bae Ahn, Seung-Ki Min, Jin Wook Kim, and Young Hwa Byun

Tropical cyclones (TCs), which often form over the western North Pacific (WNP), have a large socioeconomic impact and result in destructive damages in East Asian countries. Therefore, it is critical to estimate future changes in TCs characteristics under the global warming. In this study, future characteristics of TCs using five regional climate models (RCMs) (i.g., RegCM4, GRIMs, WRF, CCLM, and HadGEM3-RA) were investigated in Coordinated Regional Climate Downscaling Experiment (CORDEX) East Asia domain. Five RCMs were forced by the UK Earth System Model (UKESM) under the historical and two Shared Socioeconomic Pathways (SSP) scenarios (SSP1-2.6 and SSP5-8.5). The simulation experiments were conducted at about 25-km horizontal resolution. The multi-RCM ensemble mean was used for analysis to reduce the uncertainty of a single RCM. In the historical period (1985-2014) during the TC season (June-November), the ensembled RCMs properly reproduced the TC genesis over the WNP comparable to the best track data. In the future climate, the RCMs tended to migrate the core region of TCs genesis more northward compared in the present climate. This migration could be related to weakening of vertical wind shear over the mid-latitudes, due to decreased meridional sea surface temperature gradient.

How to cite: Kim, E., Kim, T., Mun, T., Shin, S.-W., Lee, M., Cha, D.-H., Chang, E.-C., Ahn, J.-B., Min, S.-K., Kim, J. W., and Byun, Y. H.: Future characteristics of tropical cyclones over CORDEX East Asia domain in Multi-RCMs under the SSP scenarios, EGU General Assembly 2023, Vienna, Austria, 23–28 Apr 2023, EGU23-15733, https://doi.org/10.5194/egusphere-egu23-15733, 2023.

EGU23-16016 | Orals | CL5.1

Future changes in heat stress over CORDEX East Asia phase 2 domain by the end of the century 

Ana Juzbasic, Dong-Hyun Cha, and Joong-Bae Ahn

Changes in summer heat extremes have been recorded all over the globe in recent years. East Asia is one of the most vulnerable areas for climate change, owing to a combination of natural and anthropogenic factors. The human experience of heat, however, does not only depend on the temperature itself but rather the combination of factors that regulate the exchange of heat with the environment. The present study uses Net Effective Temperature (NET), an index that combines the effects of temperature, humidity, and wind, to assess heat stress perception and its potential changes by the end of the century over East Asia. The data used in the study are maximums calculated from the three-hourly output of the 10 Coupled General Circulation Model (CGCM) - Regional Climate Model (CGM) chains participating in the Coordinated Regional Climate Downscaling Experiment (CORDEX)-East Asia phase 2. As human beings can acclimate to their environment, not only maximum values but also 95th percentiles of maximum values have been used. The assessment of the models showed that all of the models reproduced the current climate reasonably. The present study utilized two different scenarios, RCP8-5, and SSP5-8.5. In both scenarios, the increase in averages and 95th percentiles of both maximum temperatures and NETs over the whole domain has been projected. The increase in NET was projected to be higher than the increase in temperature itself, and the increase in the SSP5-8.5 scenario was projected to be higher than the increase in the RCP8.5 scenario, but the details of the warming patterns were dependent on the choice of model. Additionally, the Korean Peninsula and Japan have been shown to have the largest difference in the increase between heat stress and temperature, while the highest overall increase of both temperature and NET was projected over the North-Western part of the domain in both scenarios.

How to cite: Juzbasic, A., Cha, D.-H., and Ahn, J.-B.: Future changes in heat stress over CORDEX East Asia phase 2 domain by the end of the century, EGU General Assembly 2023, Vienna, Austria, 23–28 Apr 2023, EGU23-16016, https://doi.org/10.5194/egusphere-egu23-16016, 2023.

EGU23-16125 | ECS | Posters on site | CL5.1

Effect of an irrigation scheme implemented in a regional climate model over Central Asia 

Praveen Rai, Daniel Abel, Katrin Ziegler, Felix Pollinger, and Heiko Paeth

Since irrigation plays an important role in Central Asia, this study focuses on the effects of irrigation within the regional climate model REMO (version 2015) and variants of REMO on the simulation of Central Asia in a resolution of 0.11°. Besides the standard version, a coupling with an interactive vegetation scheme (iMOVE) and a multilayer soil hydrological scheme (REMO-5L) as well as the combination of these two modules (iMOVE-5L) is examined. The usage of the multilayer soil scheme enabled the introduction of a simple flooding irrigation scheme. Consequently, these two model versions using the multilayer soil scheme are run with this irrigation scheme as well. Generally, irrigation is applied once per day between April and September.

We observe a cooling effect on the 2m temperature in the irrigation simulations compared to the non-irrigated locations and simulations which is caused by the partitioning of surface energy fluxes more towards latent heat in comparison to sensible heat and, thus, an increase in evapotranspiration. Furthermore, the combination of interactive vegetation and multilayer soil scheme (iMOVE-5L) leads to warm biases in the southwestern part which were present earlier as a cold bias in the standalone iMOVE version. The extreme temperatures i.e. maximum and minimum are simulated better in the case of a multilayer soil scheme in comparison to other experiments. For precipitation, irrigation leads to an overestimation caused by higher evapotranspiration. The wet biases present over northern and orographic regions in standard REMO and iMOVE get reduced in REMO-5L and iMOVE-5L with slightly better representation in REMO-5L.

How to cite: Rai, P., Abel, D., Ziegler, K., Pollinger, F., and Paeth, H.: Effect of an irrigation scheme implemented in a regional climate model over Central Asia, EGU General Assembly 2023, Vienna, Austria, 23–28 Apr 2023, EGU23-16125, https://doi.org/10.5194/egusphere-egu23-16125, 2023.

EGU23-16270 | Orals | CL5.1

Assessing long-term climatology of convection permitting simulation of precipitation and associated local circulation over southeastern South America 

Rosmeri Porfírio da Rocha, Leidinice Silva, Maria Laura Bettolli, Michelle Reboita, and Marta Llopart

The convection permitting (CP) version of Regional Climate Model (RegCM) has been applied to investigate extreme events in southeastern South America in the context of CORDEX collaborative network Flagship Pilot Studies. In this context, we developed a long-term RegCM simulation (from June 2018 to June 2021) at CP resolution (4 km of horizontal grid spacing). RegCM simulation was forced by ERA5 reanalysis and its domain extends from center to southeast (from ~ 15o to 35oS) of South America. In this assessment, simulated daily climatology was compared with both ERA5 reanalysis and with a great number of local stations. These comparisons will help us to understand if CP simulation aggregates relevant information to the ERA5 reanalysis in reproducing local aspects of the climate.  Using the winds from stations,  the ability of CP simulation in reproducing the local circulations, such as sea-breeze, is also investigated. We also discuss how well long-term CP simulation captures long dry and wet periods that were observed in southeastern South America.

How to cite: Porfírio da Rocha, R., Silva, L., Bettolli, M. L., Reboita, M., and Llopart, M.: Assessing long-term climatology of convection permitting simulation of precipitation and associated local circulation over southeastern South America, EGU General Assembly 2023, Vienna, Austria, 23–28 Apr 2023, EGU23-16270, https://doi.org/10.5194/egusphere-egu23-16270, 2023.

EGU23-16395 | ECS | Orals | CL5.1 | Highlight

Projecting the evolution of the urban climate of metropolitan French cities using a convection-permitting model 

Yohanna Michau, Aude Lemonsu, Philippe Lucas-Picher, and Cécile Caillaud

Urban areas will not be spared from the effect of climate change and will face more and more extreme weather events (e.g., heatwaves and floods). Such changes already cause severe environmental issues, economics damages, and many casualties, especially in cities where most activities and populations are concentrated. Evaluating the impacts of future extreme events on urban areas is a major challenge to prepare the adaptation.

Urban areas are very complex systems that require specific modeling tools. The latest advances in regional climate modeling allow simulations to be performed over longer time periods with finer horizontal resolutions of up to few kilometers. The scientific community emphasizes the considerable improvements in using Convection-Permitting Models (CPM), especially for the representation of small-scale phenomena. Also, CPMs offer an interesting modeling framework for studying the interaction between regional climate and urban effects (especially urban heat island) and city-scale impacts through the explicit coupling of the atmospheric climate model with a dedicated urban surface model.

In this study, the CNRM-AROME CPM, coupled with the Town Energy Balance (TEB) urban-canopy model, is used at 2.5-km horizontal resolution. Climate simulations were performed on an extended France domain (northwestern Europe) as part of the EUropean Climate Prediction system (EUCP) project over an historical period (1986-2005) and two future periods (mid-term, 2041-2050 and long-term, 2080-2099) using the RCP8.5 emission scenario. Here, scientific objectives are (1) to evaluate the urban heat island evolution for some metropolitan French cities, and (2) to quantify the evolution of specific meteorological hazards on cities and population. With this aim, we selected indicators related to heatwaves (based on Ouzeau et al. (2016) methodology) and heavy precipitation event, considered as some of the most relevant extreme meteorological events. These indicators were tested and evaluated on the evaluation simulation, and then analyzed in a changing climate to quantify the impacts on the cities. The multi-city approach makes it possible to investigate the variability that can exist between cities depending on their geographical and climatic contexts.

How to cite: Michau, Y., Lemonsu, A., Lucas-Picher, P., and Caillaud, C.: Projecting the evolution of the urban climate of metropolitan French cities using a convection-permitting model, EGU General Assembly 2023, Vienna, Austria, 23–28 Apr 2023, EGU23-16395, https://doi.org/10.5194/egusphere-egu23-16395, 2023.

EGU23-16645 | Posters virtual | CL5.1

Added value of modeling regional climate over areas characterized by complex terrain: precipitation over the Colombian Andes 

Astrid Baquero-Bernal and Javier Fernando Espitia-Rodríguez

The added value (AV) of the dynamic downscaling of precipitation over the Colombian territory was investigated using simulations made with the RegCM4 regional model in the context of the CORDEX experiment. The simulations were forced by two different global models (GCM) from the CMIP5 project (HadGEM2-ES and MPI-ESM-MR), cover the period 1981-2005, and have resolutions of 0.44° and 0.22°. The comparison with the CHIRPS/GPCC reference data showed that RegCM4 degrades the results of the GCMs, that is, it does not provide AV for all selected metrics and this occurs not only when going to fine scales but also when we scale up to the resolution of the GCMs.

How to cite: Baquero-Bernal, A. and Espitia-Rodríguez, J. F.: Added value of modeling regional climate over areas characterized by complex terrain: precipitation over the Colombian Andes, EGU General Assembly 2023, Vienna, Austria, 23–28 Apr 2023, EGU23-16645, https://doi.org/10.5194/egusphere-egu23-16645, 2023.

The so-called sea spray effect is known to considerably influence the stable isotope fingerprint of coastal samples (plants, soil, bones, teeth). However, the impact of sea spray on radiocarbon analyses in environmental samples from coastal sites has not been investigated, yet. Sea spray aerosols, containing, e.g., HCO3- or CO32- of marine origin, enter the terrestrial environment, shifting stable isotope values of terrestrial samples towards a seemingly marine isotope signature. Moreover, the sea spray is always accompanied by physiological effects in the sprayed plants, e.g., due to the salinity of the incorporated water, also visible in, e.g., stable carbon isotope data. A terrestrial herbivore, never consuming any marine food, can show a marine isotope signal due to the sea spray effect. While the marine reservoir effect, resulting from the consumption of marine food sources, can be investigated by calculating isotopic mixing models based on the δ13Ccollagen and δ15Ncollagen values of archaeological animal and human bones, the sea spray effect remains undetected in the δ13Ccollagen and δ15Ncollagen values of individuals consuming terrestrial protein (i.e., plant sources) influenced by marine aerosols. Therefore, it is important to investigate the influence of the sea spray on the radiocarbon signature.

The impact of either the direct or the accompanied, indirect sea spray effect can be visualized by an artificial sea spray experiment which was performed in a greenhouse. European beach grass (Ammophila arenaria, L.) was sprayed with mineral salt solution of different ion concentration but only traces of NaCl, with salty water from the Schlei inlet, collected next to the archaeological site of Haithabu (Germany), and with seawater from the Baltic Sea, collected at the western coast of Fehmarn island (Germany), respectively. Plants of all treatment groups were irrigated with Munich tap water (mainly originating from Mangfall valley). Radiocarbon analyses (F14C), stable as well as radiogenic isotope analyses (δ13CDIC, δ13Cbulk, δ13Ccellulose, δ18Ocellulose, δ18Osulfate, δ34Ssulfate, δ34Stotal S, 87Sr/86Sr), and (trace) elemental analyses were conducted on the plant, soil, and water samples (spray water, irrigation water) using mass spectrometry (AMS, IRMS, TIMS, ICP-MS, IC).

Radiocarbon analyses of the plants showed an impact due to the artificial sea spray. The indirect sea spray effect, resulting from either salinity (NaCl) or HCO3- stress, has an impact on plants’ F14C. The study demonstrates that a substantial proportion of 14C, which is taken up by the sprayed plants, originates from either irrigation or spray water. Stomatal conductance is markedly reduced due to both salinity and bicarbonate stress. Accordingly, less atmospheric 14CO2 can enter the plants via their stomata, while H14CO3-/14CO32-/14CO2 (aq.) can still be incorporated via the roots.

A multi-dimensional approach with a combined analysis of stable (δ13C, δ18O, δ34S), radiogenic (87Sr/86Sr), and radiocarbon isotopes in environmental samples allows to depict a detailed image of biochemical and physiological processes associated with the sea spray effect and will help to reveal new insights into the sea spray impact on the isotopic fingerprint of plants, animals, and humans, including potential caveats for radiocarbon analyses in coastal regions.

How to cite: Göhring, A., Hüls, C. M., Hölzl, S., Mayr, C., and Strauss, H.: Indirect sea spray effects on radiocarbon data of coastal plants – how physiological reactions in plants can be visualized by a combined investigation of stable, radiogenic, and radiocarbon isotopes in a greenhouse experiment, EGU General Assembly 2023, Vienna, Austria, 23–28 Apr 2023, EGU23-128, https://doi.org/10.5194/egusphere-egu23-128, 2023.

Last glacial loess in Poland was deposited under periglacial conditions nearby to the regional maximum advance of the Scandinavian Ice Sheet during the Weichselian glaciation. Its glacier advance and retreat stages are expected to be mirrored in Loess-Paleosol Sequences (LPS) calling for reliable and exact dating. In the Bayreuth luminescence laboratory (BT) established modern SAR protocols of optical dating (OSL, pIRSL) were applied to the 4-11µm fine grain fraction of 38 loess samples from four LPS, distributed from Silesia to the Volhynian upland. Results were compared to published results from the Gliwice luminescence laboratory. Pleasing basic agreement even for surprising results is overshadowed however by somewhat differing apparent ages complicating a sound palaeoclimatic interpretation. A comparison of OSL and pIRIR ages obtained in BT poses a similar problem. OSL ages from quartz are prone to dose-dependent age underestimates but the critical absorbed dose may be grainsize-dependent. Experiences in BT resulted in favoring the fine grains from quartz, allowing for higher credible ages. Nevertheless, our quartz ages > ca. 50 ka are possibly but not necessarily underestimated, obviously dependent on the site and the providence of the quartz grains. In contrast, pIRIR ages turn out to be prone to overestimates due to incomplete bleaching leaving an unknown residual dose at deposition, a serious problem for beds with strong periglacial reworking.

Loess stratigraphy in Poland is well-based mainly on lithostratigraphy, palaeopedology, and periglacial geomorphology. Apart from – often problematic – radiocarbon dating and contradictory previous TL and OSL ages there is a lack however of independent physical dating methods and also of tephrostratigraphic markers. But at least the age of a prominent interstadial soil (or soil complex) now labelled L1SS1 at the end of the Middle Pleniglacial can now be fixed between ca. 30 and ca. 40 ka. Interpretation of dating results from samples older than L1SS1 is challenging. The observed diverging ages (OSL, pIRIR) are critical for the accurate time bracketing of geomorphologic and pedostratigraphic features such as ice wedging, thermokarst erosion events and interstadial soil formations and for their attribution to marine isotope stages. Alternative interpretations are discussed including possible periglacial mirroring of pre-LGM regional ice advances (Ristinge and Klintholm advances) in the southwestern Baltic Sea area.

I suggest that the strange behavior of quartz ages from different grain sizes is caused by various sources (ranging from Paleozoic crystalline rocks to Quaternary glacial drift) with very different geological and thermal histories, stored due to the very high resistance of quartz against weathering. Local and remote sources contribute to individual sedimentary beds of LPSs to varying extents. Thus, fine grains and coarser grains from an individual sample may be derived from diverse sources. In spite of the addressed uncertainties, for honesty reasons it is so far recommended aiming at age bracketing as narrowly as possible, simultaneously using OSL from different quartz fractions and pIRIR from fine polymineral grains. A refinement of this approach remains challenging as far as the sole reliable dating protocol is not ensured.

How to cite: Zoeller, L.: Ambiguity of luminescence ages from periglacial loess in Poland – “As you like it” or honesty with users?, EGU General Assembly 2023, Vienna, Austria, 23–28 Apr 2023, EGU23-1003, https://doi.org/10.5194/egusphere-egu23-1003, 2023.

EGU23-1396 | ECS | Posters on site | CL5.2

Tephra compositional data: are we doing it right? 

Simon Larsson and Matthew Bolton

Tephrochronology is often used for dating of natural archives and for correlation between study sites. Volcanic ashes (tephra) extracted from cores used for climate reconstructions function as common time-marker horizons and become anchor points in comparisons of age models from different studies. Given these uses, tephrochronology is well placed to help overcome the chronological challenges that hinder sufficiently precise dating of palaeoclimate records.

Tephras are identified based on their geographic and stratigraphic contexts, glass shard morphology, and geochemical composition. The geochemistry is most commonly analysed by electron probe microanalyser and presented as weight percentages of oxides of the nine or ten most abundant elements, often normalised to a 100 % total for ease of comparison. A simple exploration of such results and comparison to published data of previous tephra findings is usually enough for confident identification. However, compositional data of tephra findings from new studies continuously add to the complexity of tephrochronological investigations by increasing the amount of data available for comparison, including the addition of new potential candidates for identification. The increased likelihood of multiple candidates—sometimes with overlapping geochemistries—means that statistical data analyses are increasingly necessary.

Tephrochronologists have used principal component analysis and discriminant function analysis in situations needing statistical approaches, but these methods’ validity often requires certain assumptions not to be violated. A rarely considered example of such an issue is that compositional data suffers from the constant-sum constraint and must be converted by log-ratio transformations for some statistical analyses to function properly. As there is presently no consensus on a tephra compositional data curation procedure including log-ratio transformations, we have explored several variations and compared the results to see if a formal recommendation for such a procedure is relevant for the tephra community.

How to cite: Larsson, S. and Bolton, M.: Tephra compositional data: are we doing it right?, EGU General Assembly 2023, Vienna, Austria, 23–28 Apr 2023, EGU23-1396, https://doi.org/10.5194/egusphere-egu23-1396, 2023.

EGU23-1481 | Orals | CL5.2

How accurate are marine Δ14CDIC modelling approaches? 

Martin Butzin, Peter Köhler, Christoph Völker, Ying Ye, and Gerrit Lohmann

It has been estimated that Δ14C values of marine dissolved inorganic radiocarbon (Δ14CDIC) are primarily governed by transport and radioactive decay. This implies that Δ14CDIC can be considered as a radioconservative tracer which can be implemented into Earth system models without a full marine carbon cycle model. Here we evaluate the accuracies of the radioconservative modelling approach and of a further modelling approach which considers a different simplified representation of the marine radiocarbon cycle, presenting simulation results obtained with the ocean general circulation model FESOM and the marine biogeochemistry model REcoM. The relative uncertainties between the two simplified and the comprehensive treatments of the marine radiocarbon cycle are less than 5%. Therefore, the simplified Δ14CDIC modelling approaches should be sufficiently accurate for many marine radiocarbon studies. 

How to cite: Butzin, M., Köhler, P., Völker, C., Ye, Y., and Lohmann, G.: How accurate are marine Δ14CDIC modelling approaches?, EGU General Assembly 2023, Vienna, Austria, 23–28 Apr 2023, EGU23-1481, https://doi.org/10.5194/egusphere-egu23-1481, 2023.

EGU23-1551 | ECS | Posters on site | CL5.2

Continuous Radiocarbon Records by Laser Ablation – Status Report 

Melina Wertnik, Lukas Wacker, Nicolas Brehm, and Caroline Welte

The unique laser ablation (LA) setup at ETH Zurich (Switzerland), coupled to a MICADAS accelerator mass spectrometer (AMS), enables rapid 14C analyses and has been successfully employed for a broad range of carbonate archives such as stalagmites (Welte et al., 2021), otoliths (Andrews et al., 2019), and shells of Arctica islandica. An 193 nm ArF excimer laser is used to liberate CO and CO2 from the sample surface by ablation. The gas is then flushed with helium into the gas ion source of the AMS for online measurement.

Advantages of the novel techniques are a significant reduction in labour-intensive sample preparation and the speed of measurement, which minimises the expensive beam-time of the AMS. However, as a transient signal is measured where each sampling location is only measured for a short duration, uncertainties associated with LA-AMS are significantly higher than for conventional measurement techniques. Still, it is possible to locate strong signals such as a growth stop or the bomb spike very rapidly and precisely using only two scans of the sample. Here we present the status of the setup and progress on data reduction aimed at reducing the larger uncertainties. Preliminary results from comparisons of parallel tracks on a stalagmite allow testing the data reduction strategy and will be shown.

Andrews, A. et al. (2019), Marine and Freshwater Research, https://doi.org/10.1071/mf18265

Welte, C. et al. (2021), Climate of the Past, 17(5), 2165–2177, https://doi.org/10.5194/cp-17-2165-2021

How to cite: Wertnik, M., Wacker, L., Brehm, N., and Welte, C.: Continuous Radiocarbon Records by Laser Ablation – Status Report, EGU General Assembly 2023, Vienna, Austria, 23–28 Apr 2023, EGU23-1551, https://doi.org/10.5194/egusphere-egu23-1551, 2023.

EGU23-2836 | ECS | Orals | CL5.2

The Role of Aged Organic Carbon in North Atlantic Fjord Sediments 

Craig Smeaton, Negar Haghipour, William Austin, and Timothy Eglington

Fjords are recognised as important hotspots for the burial and storage of organic carbon (OC) within their sediment, which potentially provides a long-term climate regulation service. Annually, it is estimated that 18 Mt of OC is buried within fjord sediments with between 55 – 62% of the OC originating from the terrestrial environment. The transfer of OC from the terrestrial environment to the fjord sediments is likely a significant pathway for aged OC to reach the coastal ocean. By estimating the quantity and mapping the spatial distribution of aged OC within the fjord sediments, we can develop a better understanding of the processes that govern the transfer of terrestrial OC from the catchment to the sediment of fjords, further constraining their role in long-term climate regulation.

Here we bring together radiocarbon analysis with isotopic and biomarker measurements to investigate the age of the surficial sediments within 46 fjords across the North Atlantic. The fjords in this study range from Scottish systems with catchments dominant with OC rich peat to the glaciated systems of Svalbard and Greenland.  The results from this analysis highlight that a multiple natural and anthropogenic processes govern the quantity and distribution of aged OC across North Atlantic fjords ranging between glacial input of fossil OC to the erosion of aged terrestrial material facilitated by deforestation.  This study highlights the fundamental need to understand the processes that govern the transfer of OC across the land-ocean interface to allow the role these marine sedimentary systems play in long-term climate regulation to be constrained.    

How to cite: Smeaton, C., Haghipour, N., Austin, W., and Eglington, T.: The Role of Aged Organic Carbon in North Atlantic Fjord Sediments, EGU General Assembly 2023, Vienna, Austria, 23–28 Apr 2023, EGU23-2836, https://doi.org/10.5194/egusphere-egu23-2836, 2023.

EGU23-2934 | ECS | Posters on site | CL5.2

Novel methods for determining the 14C age of microbially assimilated soil carbon 

Kari Finstad, Erin Nuccio, Katherine Grant, Jennifer Pett-Ridge, and Karis McFarlane

Soils are a significant component of the Earth’s carbon (C) cycle, yet a mechanistic understanding of what controls the turnover of this large C pool remains elusive. Microbial respiration of organic C accounts for roughly half of the total CO2 production from soils, though limited options exist for accurately identifying the source of C assimilated by microbial communities. Currently, radiocarbon (14C) analysis of evolved CO2 from soil incubations is the most common laboratory method for this, however they can introduce artifacts due to sample disruption and processing and can take months to produce sufficient CO2 for analysis. We present novel extraction methods which allow for the direct 14C analysis of microbial biomolecules and compare the results to laboratory incubations. Preliminary results suggest that in the upper 50 cm soil depths, the Δ14C from incubations is indistinguishable from that of extracted microbial biomass. Below 50 cm, the Δ14C of the microbial biomass is more depleted than that of the incubations, either due to the stimulation of labile C decomposition in the incubations, or the inclusion of biomolecules from non-living cells in the biomass extractions. Work is ongoing to identify the source of the extracted biomass pool and additional methods for isolating specific, short-lived biomolecules such as RNA, are underway to unambiguously determine the Δ14C of organic molecules being assimilated by active microbial communities.

How to cite: Finstad, K., Nuccio, E., Grant, K., Pett-Ridge, J., and McFarlane, K.: Novel methods for determining the 14C age of microbially assimilated soil carbon, EGU General Assembly 2023, Vienna, Austria, 23–28 Apr 2023, EGU23-2934, https://doi.org/10.5194/egusphere-egu23-2934, 2023.

EGU23-4545 | Orals | CL5.2

Evaluating the accuracy of the Greenland Ice-Core Chronology (GICC) 

Sune Olander Rasmussen, Giulia Sinnl, Anders Svensson, and Bo Møllesøe Vinther

The full potential of palaeoclimate data relies on reliable time scales, i.e., a relation tying the physical dimension of the palaeoclimate archive with age. For many records, including ice cores, identification and counting of annual layers is the most direct and accurate way to obtain a time scale provided that high-resolution measurements of parameters showing annual variability are available. Annual-layer counting can provide very precise estimates of event durations and rates of change, but as errors accumulate with age, the accuracy decreases with depth/time. In contrast, radiometric methods often have good accuracy, and in principle, the two approaches can be combined to form highly accurate and precise time scales provided that the archives and their time scales can be robustly aligned. This can be done based on e.g. volcanic markers, common and correlatable features in cosmogenic isotope records, or on climatic wriggle-matching when the possible leads and lags between records is considered.

The Central Greenland ice cores are drilled in the interior areas of the ice sheet where precipitation rates are appropriate for the formation and preservation of annual layers, thereby allowing annual layers to be identified in the Holocene period and well into the last glacial period. The Greenland Ice-Core Chronology (GICC) is an attempt to derive a consistent, common time scale for the Greenland ice cores by combining data from multiple cores, using for each time period all available annually resolved data and then applying the time scale to the other cores by means of matching patterns of volcanic eruptions and other reference horizons. In this way, data from all the ice cores can be interpreted together on a common time scale (i.e., with very small relative dating uncertainty), greatly reducing the risk of artificial offsets due to misinterpretation of individual records. The first version of GICC, named GICC05, was published in 2006 and 2008, where the dating covered the time period back to 60 ka b2k, at which point the layers had thinned too much to continue with continuous annual layer counting.

Since then, high-resolution data from the newer Greenland ice cores NEEM and EGRIP have appeared, and comparisons to other palaeoclimate records on radiometric time scales have shown that in some sections, GICC05 was not as accurate as initially estimated, motivating a revision on the time scale. The top 3.8 ka of the time scale was recently revised, leading to changes in age of 10-15 years for the section older than 2500 years (see presentation by Giulia Sinnl). Here, we review the older sections of GICC05 in the context of other well-dated palaeoclimate archives and cosmogenic isotope records, as well as model-based estimates of climate leads and lags relevant when aligning climate records, and outline a plan for how to continue the revision of GICC05.

How to cite: Rasmussen, S. O., Sinnl, G., Svensson, A., and Vinther, B. M.: Evaluating the accuracy of the Greenland Ice-Core Chronology (GICC), EGU General Assembly 2023, Vienna, Austria, 23–28 Apr 2023, EGU23-4545, https://doi.org/10.5194/egusphere-egu23-4545, 2023.

EGU23-6028 | Posters on site | CL5.2

Radiocarbon signatures of carbon phases exported by swiss rivers in the Anthropocene 

Timo Rhyner, Lisa Bröder, Margot White, Benedict Mittelbach, Florian Storck, Lucas Passera, Negar Haghipour, and Timothy Eglinton

Lateral carbon mobilization processes are particularly prone to anthropogenic perturbations due to human intervention of the land surface as well as aquatic corridors yet remain poorly constrained despite their importance as a key component of the C-cycle. A major source of this uncertainty involves processes modulating the sources and fate of carbon along the freshwater aquatic continuum. This study examines the radiocarbon (14C) signatures of particulate and dissolved organic carbon (POC, DOC, respectively) and dissolved inorganic carbon (DIC) transported by Swiss rivers with a view to assessing controls on the origin and cycling of carbon within corresponding watersheds. Twenty-one rivers were selected that span a range of watershed properties and are monitored by the National Long-Term Surveillance of Swiss Rivers (NADUF) program, enabling radiocarbon data to be interpreted within a broader hydrological and geochemical context.  Samples were collected during high-flow conditions in summer 2021, a year of extreme rain events. Average discharge of our sample set (n=21) was 299.76 +/- 513.87 m3/s, while the annual average discharge of all stations was 184.90 ± 264.92 m3/s. The range of D14C values of POC was -158‰ to - 446‰ (n = 21), while corresponding ranges of  D14C values for DOC and DIC were - 43‰ to - 377‰ and - 40‰ to - 301‰, respectively, indicating the presence of pre-aged carbon in all three pools. Hydrological properties such as discharge, runoff and precipitation did not appear as major significant controlling factors. Except for DI14C where annual average runoff of the past decade showed a significant negative correlation. Instead, based on Multivariate Regression Analysis, “alpine” variables such as mean basin elevation, slope, and barren areas were negatively correlated with D14C values of all three D14C-phases, while rivers draining lower elevation terrain, where agricultural land-use is more extensive were associated with higher D14C values in -the organic carbon pools (POC, DOC). Repeated sampling under different hydrological conditions and associated 14C (and 13C) measurements are being used to provide additional insights into the controls on the amount and nature of carbon exported by Swiss rivers, the interconnectivity between different carbon pools within the corresponding drainage basins and ecoregions, as well as to predict long-term trends in the context of changing climate and anthropogenic forcing.

How to cite: Rhyner, T., Bröder, L., White, M., Mittelbach, B., Storck, F., Passera, L., Haghipour, N., and Eglinton, T.: Radiocarbon signatures of carbon phases exported by swiss rivers in the Anthropocene, EGU General Assembly 2023, Vienna, Austria, 23–28 Apr 2023, EGU23-6028, https://doi.org/10.5194/egusphere-egu23-6028, 2023.

EGU23-6579 | Posters on site | CL5.2

An empirical study on the variability of luminescence ages for coeval loess samples 

Daniela Constantin, Robert Begy, Dimitri Vandenberghe, Daniel Veres, and Alida Timar-Gabor

An increasing number of studies exploit the advantages of a single-aliquot regenerative-dose protocol (SAR) for equivalent dose determination with sampling at relatively closely-spaced vertical intervals (of the order of 10-30 cm). The resulting ages are, at least in principal, ideally suited for age-depth modelling. The modelling, however, is made difficult owing to the variety and complex combination of uncertainties associated with luminescence dating. Moreover, we previously reported on a variability in age results for coeval loess samples that is significantly larger than expected and remains to be understood.

In this study, we examine this problem explicitly by observing the degree of precision and accuracy that can be achieved by luminescence dating of multiple coeval loess samples of known age. The main goal is to improve our understanding of how luminescence ages are to be incorporated into age-depth models, thus increasing their robustness and accuracy.

Fourteen samples were taken at closely-spaced horizontal intervals from loess deposits immediately over- and underlying the Campanian Ignimbrite/Y5 tephra layer (40Ar/39Ar dated to 39.2±0.1 ka), as exposed at a section in the Lower Danube Basin in southeastern Europe. Luminescence analyses were carried out using the single-aliquot regenerative-dose (SAR) protocol and OSL signals from 63-90 µm quartz fraction. We report an average age of 46 ka for the samples collected below the tephra layer and 40 ka for the samples collected above it. The individual random and systematic uncertainties contributing to the individual ages vary from 1.9 % to 5.4 % and from 6.0 % to 6.1 %, respectively. We obtain an improved overall precision on the age of the sedimentary context by calculating the weighted average age and combining the individual random and systematic uncertainties following Aitken (1985, Appendix B). Thus we report weighted average ages of 46 ka and 40 ka for the horizontally sampled sediment layers intercalating the ash layer and associated overall random uncertainties of 1.3 % and 1.1 %. The overall systematic uncertainties are 6.1 % and 6.0 %. The insights gained from this are discussed in relation to age-modelling studies of luminescence-dated paleoclimate archives, and loess deposits in particular.

Keywords: luminescence dating; precision; random uncertainty; quartz

How to cite: Constantin, D., Begy, R., Vandenberghe, D., Veres, D., and Timar-Gabor, A.: An empirical study on the variability of luminescence ages for coeval loess samples, EGU General Assembly 2023, Vienna, Austria, 23–28 Apr 2023, EGU23-6579, https://doi.org/10.5194/egusphere-egu23-6579, 2023.

EGU23-7006 | ECS | Posters on site | CL5.2

A global synthesis of speleothem radiocarbon data – is it a sensitive proxy for past ecosystem processes? 

Franziska A. Lechleitner, Christopher Day, Jens Fohlmeister, Sophie Warken, Norbert Frank, Heather Stoll, and Caroline Welte

Speleothems, secondary cave carbonate precipitates, can serve as tools to reconstruct past terrestrial ecosystem processes, particularly related to soil and vegetation. Radiocarbon, often in conjunction with other geochemical proxies, has been increasingly used for this purpose, as the speleothem reservoir effect retains useful information on local ecosystem conditions. On the other hand, speleothems are also of interest to the radiocarbon community as they can be dated very precisely with the U-Th method, which may allow the reconstruction of atmospheric radiocarbon levels in time if the reservoir effect remained constant.

Over the past decades, a growing number of speleothem radiocarbon records have been generated from vastly different climate zones and ecosystem types. While much progress has been made in the interpretation of these records, a unified and global view of the factors driving variability in speleothem radiocarbon is still lacking. We compiled a global dataset of averaged speleothem radiocarbon measurements, and provide a critical evaluation of the applicability of the radiocarbon reservoir effect as a proxy for past ecosystem conditions. We compare our dataset to geographic (latitude, elevation), climatic (temperature and precipitation), and ecosystem and geological parameters (soil and bedrock thickness, soil age, vegetation type, and land cover). Our preliminary results show that it is difficult to extract a strong globally relevant driving factor for the mean absolute value in the reservoir effect at the investigated cave sites, and highlights the importance of detailed reporting of local conditions.

To provide insight into the amplitude range of processes affecting published speleothem radiocarbon records we perform a series of numerical forward modeling experiments. We test how the effects of changing soil age, soil pCO2, carbonate dissolution regime, and pyrite oxidation affect carbon isotopes in stalagmites.

Together, the global synthesis and modeling experiments provide us with the first global overview of how cave site parameters and climate and ecosystem processes affect speleothem radiocarbon records, and allow us to assess the sensitivity of this proxy as a tool for past ecosystem conditions.

How to cite: Lechleitner, F. A., Day, C., Fohlmeister, J., Warken, S., Frank, N., Stoll, H., and Welte, C.: A global synthesis of speleothem radiocarbon data – is it a sensitive proxy for past ecosystem processes?, EGU General Assembly 2023, Vienna, Austria, 23–28 Apr 2023, EGU23-7006, https://doi.org/10.5194/egusphere-egu23-7006, 2023.

EGU23-7936 | ECS | Posters on site | CL5.2

Sources of cave CO2 at Milandre cave, Switzerland constrained through multipool analysis of 14C and δ13C. 

Sarah Rowan, Marc Luetscher, Sönke Szidat, Thomas Laemmel, Oliver Kost, and Franziska Lechleitner

The cycling of subsurface karst CO2 is not well constrained in terms of its source and transportation pathway. The classical model suggests that cave CO2 is produced by the respiration of soils and vegetation in the catchment. In contrast, several new studies have proposed that the dominant source of CO2 is from the respiration of older organic matter situated deeper within the karst, or from the degassing of supersaturated drip water.

We present over a year of monitoring data from Milandre cave, northern Switzerland, whereby we evaluated the 14CO2 and δ13CO2 composition of the atmosphere in the cave catchment, catchment soil gas, well gas, and cave air. Drip waters located throughout the cave also underwent various analysis. The cave 14CO2 is more depleted compared to the soil and gas samples. The Keeling plot intercept of atmospheric and cave δ13CO2 is ~-26‰, indicating a dominant contribution from biological respiration. The dissolved inorganic carbon from various cave drips have an F14C from ~ 0.84 to 0.96 and δ13C from ~ -16‰ to -11‰. F14C and δ13C are inversely correlated.  Considering both the 14C and δ 13C results, this suggests either a source of CO2 from an aged reservoir of respiring organic matter contributing to the cave gas or substantial influence from degassing of 14C fossil carbonate CO2 from drip water. These results have implications for the understanding of the subterranean carbon cycle and the interpretation of speleothem carbon isotope records for paleoclimate studies.

How to cite: Rowan, S., Luetscher, M., Szidat, S., Laemmel, T., Kost, O., and Lechleitner, F.: Sources of cave CO2 at Milandre cave, Switzerland constrained through multipool analysis of 14C and δ13C., EGU General Assembly 2023, Vienna, Austria, 23–28 Apr 2023, EGU23-7936, https://doi.org/10.5194/egusphere-egu23-7936, 2023.

The surficial 10 cm of Scotland’s saltmarshes are estimated to store 1.35 ± 0.33 Mt CO2 equivalent, approximately 3.37% of Scotland’s national greenhouse gas emissions in 20201,2. This is largely achieved through effective preservation of organic matter (OM) in low oxygen, sulphidic soils1. Saltmarshes gain organic carbon (OC) through in-situ (autochthonous) production by vegetation and benthic microalgae, and the accumulation of marine and terrestrial material during tidal inundation (allochthonous)3.

A key blue carbon challenge is to empirically understand, under current and predicted warmer conditions, the sources of OC accreted into and respired from saltmarshes. This can determine the proportion of the total OC pool which is additional through in-situ sequestration or from increased preservation of allochthonous OM3. Alongside 13C and 15N isotopes, radiocarbon (14C) analysis/dating can be used to determine the sources of saltmarsh surficial soil OC4.

We hypothesise that at ambient temperatures the younger and more labile, and predominantly autochthonous OM, will be preferentially decomposed.  But at elevated temperatures the aged, and predominantly allochthonous, OM pool will increasingly contribute to the respired greenhouse gases.

To test this hypothesis, we collected soil cores and surficial sediment samples from three contrasting Scottish saltmarshes. We analysed them for 14C to gain an understanding of the age and sources of the autochthonous and allochthonous OM accumulating. We also aerobically incubated sub-samples of the soil in temperature-controlled experiments at 11.1 ± 1°C (ambient) and 20 ± 1°C (elevated). The evolved CO2 was collected on molecular sieve traps and analysed for 14C content/age.

Our results will facilitate comparison of the age of the bulk OM and the respired CO2 to the thermogravimetrically measured reactivity of the OM determined using the recently developed Carbon Reactivity Index5. We will present our findings and introduce our ongoing work on anaerobic incubations of the same soils, which includes the novel measurement of the evolved 14CH4.

Our research contributes to a growing evidence base for emissions from saltmarshes, and the sources of OC accreting in their soils, which is vital for understanding how they cycle carbon and their ability to mitigate climate change. It will contribute to the creation of saltmarsh carbon cycle models and inform work to include saltmarshes in the UK’s Nationally Determined Contributions.

References

  • Smeaton C, Burden A, Ruranska P, et al. Using citizen science to estimate surficial soil Blue Carbon stocks in Great British saltmarshes. Front Mar Sci. 2022;9. Accessed November 28, 2022. https://www.frontiersin.org/articles/10.3389/fmars.2022.959459
  • Scottish Goverment. Scottish Greenhouse Gas Statistics 2020.; 2022. https://www.gov.scot/publications/scottish-greenhouse-gas-statistics-2020/
  • McTigue ND, Walker QA, Currin CA. Refining Estimates of Greenhouse Gas Emissions From Salt Marsh “Blue Carbon” Erosion and Decomposition. Front Mar Sci. 2021;8. Accessed January 26, 2022. https://www.frontiersin.org/article/10.3389/fmars.2021.661442
  • Hajdas I, Ascough P, Garnett MH, et al. Radiocarbon dating. Nat Rev Methods Primer. 2021;1(1):1-26. doi:10.1038/s43586-021-00058-7
  • Smeaton C, Austin WEN. Quality Not Quantity: Prioritizing the Management of Sedimentary Organic Matter Across Continental Shelf Seas. Geophys Res Lett. 2022;49(5):e2021GL097481. doi:10.1029/2021GL097481

How to cite: Houston, A., Austin, W., and Garnett, M.: A Novel Method for Radiocarbon Dating Greenhouse Gas Emissions from Saltmarsh Soils to Address Key Blue Carbon Challenges, EGU General Assembly 2023, Vienna, Austria, 23–28 Apr 2023, EGU23-8033, https://doi.org/10.5194/egusphere-egu23-8033, 2023.

EGU23-8148 | ECS | Posters on site | CL5.2

Using the radiocarbon bomb spike to constrain the age of soil organic carbon delivered to Lake Constance sediments. 

Benedict V.A. Mittelbach, Margot E. White, Timo Rhyner, Stephan Wartenweiler, Negar Haghipour, Martin Wessels, Thomas M. Blattmann, Nathalie Dubois, and Timothy I. Eglinton

The residence time of carbon in terrestrial ecosystems, such as soils and freshwater, sets the pace of the terrestrial carbon cycle. Understanding export pathways and turnover times of soil organic carbon (OCSoil) is crucial to assess responses to climate and land use changes. Our study aims to quantify the average turnover time of OCSoil in the catchment of perialpine Lake Constance. Lake sedimentary sequences integrate organic carbon from their catchment and aquatic primary productivity. They act as both burial sites of organic carbon (OC) and time series archives of catchment processes. Thus, they can bridge the gap between plot scale observations, e.g., on soil carbon turnover, and observations made at the outlet of major river systems.

Sedimentary organic carbon sources include aquatic primary productivity, OCSoil, and rock-derived (petrogenic) OC. Stable carbon isotopes (δ13C) can be used to identify the relative contribution of these pools. The 5700-year half-life of radiocarbon (14C) coupled with the atmospheric nuclear bomb spike in the early 1960s can be used to infer the age and turnover rate of the OC pools on millennial to annual timescales. Bulk OC isotope analysis of a varved sediment core spanning the past ca. 110 years at quasi-annual resolution was used to constrain the age of soil carbon delivered to Lake Constance. We combined the geochemical data with a Markov-Chain-Monte-Carlo-based approach to identify the most probable age structure of aquatic and soil-derived OC components and to quantify their respective contributions in addition to petrogenic OC.

Radiocarbon analysis of sedimentary bulk OC reveals a well-defined but muted bomb spike in the early 1960s. However, bulk Δ14COC values remain below 0‰, implying a predominance of aged OC. Based on the δ13C-based three-component linear mixing model, we found these values to be the result of an OC mixture containing approx. 40% pre-aged soil carbon and up to 20% fossil petrogenic carbon.  Accounting for these inputs, we estimated that soil-derived OC delivered to Lake Constance is centennial in age, implying interim storage prior or subsequent to erosion from the landscape.

How to cite: Mittelbach, B. V. A., White, M. E., Rhyner, T., Wartenweiler, S., Haghipour, N., Wessels, M., Blattmann, T. M., Dubois, N., and Eglinton, T. I.: Using the radiocarbon bomb spike to constrain the age of soil organic carbon delivered to Lake Constance sediments., EGU General Assembly 2023, Vienna, Austria, 23–28 Apr 2023, EGU23-8148, https://doi.org/10.5194/egusphere-egu23-8148, 2023.

EGU23-8195 | Orals | CL5.2

Lateglacial to interglacial sediment infills in Alpine valleys: timing, sediment provenance and paleo-environmental conditions 

Pierre Valla, Yann Rolland, Romain Delunel, Julien Carcaillet, and Christian Crouzet

Glacial/interglacial transitions in mountainous areas are marked by significant glacier retreat from forelands to inner massifs, resulting in large-scale and ephemeral lake formation that are subsequently filled (or not) by sediment transfer during lateglacial to postglacial times. When valley paleo-infills are preserved, they form precious archives to investigate (1) Alpine erosion dynamics and paleo-environmental conditions during key transition periods from full glacial stages to interglacials, and (2) glacial erosion patterns during susbequent glaciation.

In this contribution, we investigate such sedimentary deposits (locally called as "banquettes") in the French western Alps, and more precisely along the Isère valley and Val du Bourget. Previous research have attributed these deposits to the Riss – Würm transition due to their position under a basal compact till and to the MIS 6/5 transition up to early MIS 4 from palynological constraints, although no absolute ages has been available so far. Based on existing mapping of their spatial distribution and stratigraphic reconstructions, we sampled coarse-sand and sandy-gravel layers within these deposits for constraining both sediment deposition time (OSL dating) and provenance (glacial/postglacial origin, using terrestrial cosmogenic nuclide TCN 10Be in quartz). In addition, their spatial distribution provides estimates of maximum glacial erosion during the last glacial cycle, which can be subsequently used as spatial constraints for ice model predictions.

Our results confirm deposition times of these sedimentary units at the MIS 6/5 transition, with dating constraints from the late MIS 6 (ca. 145 ka) to the early MIS 5 (Eemien, 115-130 ka) for sandy layers. Upper sandy-gravel layers have younger deposition ages of ca. 80 ka, illustrating sediment fluxes at the transition from late MIS 5 to early MIS 4. We compare this temporal sequence to more recent sediment infills of the Isère valley (14C and OSL dating) during the Lateglacial to Holocene (MIS 2/1) transition. TCN data from sand samples also illustrate the sharp transition from full glacial to interglacial conditions, with a significant increase in 10Be concentrations from Lateglacial to post-glacial sediments. We propose that the observed signal can reflect changes in erosion rates, but also in glacier expansion or in paleo-environmental conditions, with export of stored subglacial sediments as well as the re-establishment of sediment/soil production and transfer along the catchment routing system following glacier retreat.

How to cite: Valla, P., Rolland, Y., Delunel, R., Carcaillet, J., and Crouzet, C.: Lateglacial to interglacial sediment infills in Alpine valleys: timing, sediment provenance and paleo-environmental conditions, EGU General Assembly 2023, Vienna, Austria, 23–28 Apr 2023, EGU23-8195, https://doi.org/10.5194/egusphere-egu23-8195, 2023.

EGU23-8323 | ECS | Orals | CL5.2

Using radiocarbon to identify the impact of climate and mineralogy on soil organic matter turnover 

Margaux Moreno Duborgel, Luisa Isabell Minich, Negar Haghipour, Beatriz González-Domíngez, Timothy Eglinton, and Frank Hagedorn

Soils are the largest carbon (C) reservoir in terrestrial ecosystems. There are still numerous uncertainties concerning the fate of soil organic carbon and its feedback on climate change. Radiocarbon is a useful approach to better understanding the carbon cycle. The nuclear weapon testing in the 1960s induced a peak in 14C atmospheric concentration – a signal that can be used to trace the incorporation and turnover of C in soil. By separating the soil in different fractions and measuring the 14C in them, we can quantify how much C and for how long is stored in soils, and where soil organic carbon is stabilised.

Our study aimed at identifying the impact of climate and mineralogy on soil organic matter turnover on a regional scale. We analysed C pools and 14C contents in the organic layer, mineral soil (0-20cm) and its fractions from 54 sites across Switzerland. These 54 sites are systematically spread across natural climatic and geological gradients and were repeatedly sampled in the 1990s and 2014. The mineral soil was incubated for 181 days and 14C was measured in the respired CO2. The mineral soil was fractionated according to density into particulate organic matter (POM) and mineral-associated organic matter (MAOM). We then oxidised the mineral-associated organic matter with hydrogen peroxide to remove its labile fraction of carbon. Our 14C dataset was analysed together with ancillary data comprising soil properties and climatic variables from the studied sites.

Our radiocarbon dataset showed that the carbon that was respired from the mineral soil originated predominantly from particulate organic matter. The bomb spike signal was incorporated in the organic layer and in the particulate organic matter, while the mineral-associated organic matter had turnover times on centennial to millennial time scales (from 94 to 3060 years). Further chemical oxidation of MAOM using hydrogen peroxide revealed a stronger depletion in radiocarbon of the residual fraction with Δ14C values ranging between -173 ‰ and -47 ‰. This indicates that the MAOM is a mixture of 14C-enriched organic matter and very old material.

With respect to the controlling factors of soil organic matter turnover time, the radiocarbon signature of the POM is most strongly affected by climatic variables such as mean annual temperatures. In contrast to POM, the mineral-associated organic matter, comprising the greatest pool of soil organic carbon is driven by chemical soil properties. For instance, older 14C ages are found in acidic soils with low pH values ranging between 3 and 4. In these soils, Al and Fe oxides concentrations are high. We showed that the concentrations of pedogenic oxides in the soil correlate with soil organic carbon concentrations in the mineral-associated organic matter. In soils with higher pH (>7), we can also find old 14C ages. In these soils, C is stabilised by interactions with calcium ions and carbonates.

Overall, our regional scale dataset shows that the net accumulation of labile soil organic matter seems to be climate sensitive, while mineralogy and weathering contribute most significantly to the stabilisation of organic carbon in the soil.


How to cite: Moreno Duborgel, M., Minich, L. I., Haghipour, N., González-Domíngez, B., Eglinton, T., and Hagedorn, F.: Using radiocarbon to identify the impact of climate and mineralogy on soil organic matter turnover, EGU General Assembly 2023, Vienna, Austria, 23–28 Apr 2023, EGU23-8323, https://doi.org/10.5194/egusphere-egu23-8323, 2023.

EGU23-8974 | Posters on site | CL5.2

New developments in techniques for the sampling and analysis of atmospheric 14CO2 and 14CH4 at ETHZ and UNIBE, Switzerland 

Soenke Szidat, Thomas Laemmel, Dylan Geissbühler, Sarah Rowan, Philip Gautschi, Franziska Lechleitner, and Lukas Wacker

Radiocarbon (14C) measurements of atmospheric greenhouse gases such as carbon dioxide (CO2) and methane (CH4) are central in our capability to identify their provenance. The 14C content of these gases provides more insight into the age of their sources and mainly allows the distinction between fossil and modern ones. 14CO2 measurements can be used to analyze the nature of anthropogenic emissions (mostly fossil), or to discern on what organic matter pool respiration is taking place in a given environment. 14CH4 can also be used to detect anthropogenic emissions (from leaks of natural gas, for example) as well as natural emissions produced by methanogenesis, for example from ruminants or in wetlands.

The 14C analysis of atmospheric gases is made challenging due to their usual low concentration. Thus making the use of appropriate sampling methods, preconcentration and extraction techniques necessary to reach a sufficient amount of carbon for Accelerator Mass Spectrometry (AMS) analysis. We propose here a general view of the techniques that were developed at the Laboratory for Ion Beam Physics (ETHZ, Zurich), and at the Laboratory for the Analysis of Radiocarbon with AMS (UNIBE, Bern) for the purpose of analyzing CO2 and CH4 in atmospheric samples. We then discuss the practicability and the potential bias introduction of each of them.

The techniques are as follows :

  • Automated Graphitization Equipment with Automated Loading Facility (AGE-ALF)
  • Automated Graphitization Equipment with Cryogenic Trap (AGE-CT)
  • Methane Preconcentration and Purification System (MPPS)

Generally, samples were collected in sampling bags, either in 5-15L capacity for CO2 or larger than 60L for CH4. Types of samples that are considered are atmospheric CO2 and CH4 samples, CO2 from soil respiration, and CO2 from cave air. The different techniques are presented, and 14C results from standard gases are compared between the extraction lines and two MICADAS AMS systems at ETHZ and UNIBE.

How to cite: Szidat, S., Laemmel, T., Geissbühler, D., Rowan, S., Gautschi, P., Lechleitner, F., and Wacker, L.: New developments in techniques for the sampling and analysis of atmospheric 14CO2 and 14CH4 at ETHZ and UNIBE, Switzerland, EGU General Assembly 2023, Vienna, Austria, 23–28 Apr 2023, EGU23-8974, https://doi.org/10.5194/egusphere-egu23-8974, 2023.

EGU23-9064 | ECS | Orals | CL5.2

Paleoclimate and weathering on volcanic islands: insights from well-dated paleosols spanning the last Myr in the Central Azores 

Francisco Hevia-Cruz, Anthony Hildenbrand, Nathan D. Sheldon, François Chabaux, Fernando O. Marques, Julie Carlut, and Vittorio Zanon

Paleosols (PSs) contain valuable information about the climatic conditions under which they formed and constitute an outstanding archive of past weathering processes. Nevertheless, paleosol dating over most of the Quaternary remains challenging. Volcanic environments are unique sites for such purposes, as precise radiometric age determination can be achieved on volcanic units ‘bracketing’ PSs. Here, we present a combined geochemical and geochronological study of PSs spanning the last Myr in the Central Azores archipelago (Pico, Faial and São Jorge Islands; central North Atlantic). Precise K-Ar dating of lava flows on groundmass separates (unspiked Cassignol-Gillot technique) yield ages with a typical uncertainty of a few kyr, allowing us to tightly constrain PS ages and weathering rates near key paleoclimatic transitions. PS geochemistry further allowed us to reconstruct weathering conditions and estimate Mean Annual Precipitation and Temperature (MAP & MAT) by two proxies previously validated for other volcanic terranes (CIA-K and Clayeyness).

Four periods of PSs formation are constrained at 870-845 ka, ~725 ka, 320-280 ka and 130-45 ka. Most PSs formed just after interglacial peaks, with a few exceptions. Our MAP reconstructions are variable (600-1,500 mm/yr), but generally lower than current annual precipitations (~1,000 mm/yr). MAT estimates (14-28°C) are higher than present-day annual temperatures (~17.5°C). MAP & MAT variations are in general agreement with global climatic curves; the highest values (28°C, 1,500 mm/yr) are reached at ~855 ka, coinciding with an interglacial peak. The younger PSs (130-45 ka) indicate more stable MAP & MAT in the ranges 650-1,000 mm/yr and 15-20°C, respectively and seem to show a temperature decrease after the MIS5e interglacial stage.

Most paleosols were formed in a few kyr under high MAT (>17°C) and moderate to high MAP (>700 mm/yr), supporting a major influence of temperature on weathering kinetics. Parental material texture also had an important role, as several PSs formed upon pyroclastic deposits over most of their depth, whereas those developed on lava flows were generally restricted to the highly fragmented upper brecciated parts. Minimum vertical soil formation rates are in the range of ~0.3-4.5 cm/kyr, with a mean of ~1.7 cm/kyr and an outlier around ~10 cm/kyr. Those generally high values can be explained by the highly vesicular parental material, and by an exceptionally feldspar-rich (easily weathered) parental rock for the outlier.

As current precipitation and temperatures are higher than the threshold values of ~700 mm/yr and ~17°C under which most PSs formed, enhanced soil formation is expected for the near future, especially in the context of global warming and particularly in volcanic contexts. This may have important and fast impacts on local human activities, but also regarding CO2 consumption by rock weathering and geological hazards.

How to cite: Hevia-Cruz, F., Hildenbrand, A., Sheldon, N. D., Chabaux, F., Marques, F. O., Carlut, J., and Zanon, V.: Paleoclimate and weathering on volcanic islands: insights from well-dated paleosols spanning the last Myr in the Central Azores, EGU General Assembly 2023, Vienna, Austria, 23–28 Apr 2023, EGU23-9064, https://doi.org/10.5194/egusphere-egu23-9064, 2023.

EGU23-10967 | ECS | Posters on site | CL5.2

Initial radiocarbon (14C) results of compound class persistence across a climate gradient in California grassland soils 

Katherine Grant, Marisa Repasch, Kari Finstad, Taylor Broek, Jennifer Pett-Ridge, and Karis McFarlane

Soils mediate the rapid cycling of carbon through the critical zone. Soil organic carbon (SOC) is composed of a complex mixture of plant and microbial derived organic compounds with distinct cycling timescales. The residence time of individual SOC components depends on a combination of factors, including compound reactivity, mineral association, and climate conditions, making it difficult to accurately quantify. However, radiocarbon analysis of specific compound classes can disentangle the mixture of SOC ages within a single sample. We modified methods to measure the Δ14C of distinct compound classes (lipids, amino acids, and carbohydrates) from bulk and physically fractionated grassland soils. Additionally, we measured the Δ14C of the water-extractable fraction (WEOC) and the residual acid-insoluble fraction. Samples were collected from a series of grassland meadows across California ranging in climatic conditions including temperature and precipitation. Sites include grassland meadows in Angelo Coast Range Reserve, Hopland Extension Reserve and Sedgwick reserve, and which receives 2160, 940, and 380 mm yr-1 of rainfall and is dominated by Avena spp. We sampled 1m soil pits by ~10cm intervals to study changes in SOC persistence with depth. We used solid state 13C-NMR to measure the relative abundance of the target compound classes in soil. The Δ14C of bulk soil decreased from about +50‰ to about +10‰ in the O-horizons to a range of about -150‰ to about -650‰ in the deepest horizons. At the Hopland site, the clay fraction (<63μm) had higher Δ14C values than both the bulk (<2mm) and sand (<2mm to >63μm) fractions. WEOC Δ14C values ranged from modern to about -45.6‰. Δ14C values of total extracted lipids ranged from 36±4‰ at the surface to -215±3‰ at depth. Quantifying the age distribution of distinct compound classes gives a direct measurement of the persistence between these phases.

How to cite: Grant, K., Repasch, M., Finstad, K., Broek, T., Pett-Ridge, J., and McFarlane, K.: Initial radiocarbon (14C) results of compound class persistence across a climate gradient in California grassland soils, EGU General Assembly 2023, Vienna, Austria, 23–28 Apr 2023, EGU23-10967, https://doi.org/10.5194/egusphere-egu23-10967, 2023.

EGU23-11287 | ECS | Orals | CL5.2

14C-based deconvolution of relationships between carbon pools in Icelandic rivers and streams 

Nora Gallarotti, Lisa Bröder, Julie Lattaud, Negar Haghipour, and Timothy Eglinton

Rivers are important agents in the lateral transfer of carbon from terrestrial to the marine realm, thus forming a key component of the global carbon cycle. Carbon sources and transformations along the land-ocean aquatic continuum are dynamic with a complex interplay between dissolved and particulate, and inorganic and organic carbon pools. Elucidating interrelationships between these pools is hindered by multiple sources and processes that influence the carbon signatures of these pools in a dissimilar fashion. Icelandic streams and rivers offer an opportunity to directly assess the fluvial carbon pool dynamics due to the virtual absence of sedimentary rocks (e.g., shales, carbonates with a radiocarbon dead signature) that otherwise “muddy the waters” with respect to apparent sources and turnover times.

In order to characterize carbon transport patterns of Icelandic rivers and streams, we collected water samples from 43 river systems with watersheds that cover a wide range of catchment properties such as size, water discharge, climate as well as landcover. Here we assess the concentrations as well as the isotopic composition (13C, 14C) of particulate and dissolved organic carbon (POC; DOC, respectively) as well as dissolved inorganic carbon (DIC) alongside stable water isotopes (δ2H, δ18O) and major ion geochemistry.
Radiocarbon content (reported as fraction modern; F14C) of POC, DOC and DIC show similar patterns: lower F14C values (i.e., highest radiocarbon ages) are mostly associated with glacial runoff while higher F14C values (younger carbon) correspond to higher soil organic carbon content within the respective catchment. This dataset is but a first glimpse at carbon transport patterns in Icelandic rivers. Biomarker concentrations and isotopic compositions such as leaf waxes (n-alkanes, n-alkanoic acids) and soil derived lipids (branched glycerol dialkyl glycerol tetraether) will be used to further investigate provenance, transport and storage mechanisms in the diverse suite of Icelandic catchments.

How to cite: Gallarotti, N., Bröder, L., Lattaud, J., Haghipour, N., and Eglinton, T.: 14C-based deconvolution of relationships between carbon pools in Icelandic rivers and streams, EGU General Assembly 2023, Vienna, Austria, 23–28 Apr 2023, EGU23-11287, https://doi.org/10.5194/egusphere-egu23-11287, 2023.

EGU23-11860 | Posters on site | CL5.2

A new UV-Oxidation set up for AMS radiocarbon analysis for small dissolved organic carbon in marine and fresh water samples 

Negar Haghipour, Maarten Lupker, Lukas Wacker, Margot White, Lisa Bröder, and Timothy I. Eglinton

Radiocarbon measurements of dissolved organic carbon (DOC) can give us valuable information about origin and age of DOC, a major, yet little understood component in the global carbon cycle. One way to measure DOC in water is to remove dissolved inorganic carbon first, oxidize organic carbon with UV irradiation and ultimately analyses the formed inorganic CO2 for 14C. The main challenge of UV-Oxidation (UVox) methods is to extract the typically low concentrations of DOC with low blanks required for relatively high precision 14C measurements. A disadvantage of currently used UVox methods is that only one sample can be oxidized in a laborious process at the same time in large volume. Here we present a UV-Oxidation system where up to 12 water samples can be oxidized simultaneously in 12 separate quartz reactors arranged around a single UV lamp in a compact setup. The simple setup further uses helium instead of vacuum typically used by conventional extraction lines to speed up the extraction of the formed CO2 after oxidation. The key improvements of the new UVox setup are: 1) Reduced amount of water needed (30- 60 ml) as samples are measured for 14C with the Micadas gas ion source., 2) UV oxidation efficiency for standards is high (96%), 3) No KI trap is needed, 4) Required time for sample preparation of up to 12 samples is 4-6 h, 5) combined the CO2 from different reactors to one trap.  We obtained 2.6 ± 0.6 µgC with F14C= 0.27±0.05 for processing blank.  We will present the first measurments of DOC samples from Swiss lakes, Canadian Beaufort Sea and the reproducibility of the line.

How to cite: Haghipour, N., Lupker, M., Wacker, L., White, M., Bröder, L., and Eglinton, T. I.: A new UV-Oxidation set up for AMS radiocarbon analysis for small dissolved organic carbon in marine and fresh water samples, EGU General Assembly 2023, Vienna, Austria, 23–28 Apr 2023, EGU23-11860, https://doi.org/10.5194/egusphere-egu23-11860, 2023.

EGU23-12735 | Orals | CL5.2

14C analysis of atmospheric methane: development of a portable sampling system 

Giulia Zazzeri, Lukas Wacker, Negar Haghipour, Philip Gautschi, and Heather Graven

Measurements of radiocarbon (14C) in atmospheric methane (CH4) provide a powerful tool to distinguish fossil from biogenic methane emissions, because fossil methane is completely devoid of 14C. However, these measurements are particularly challenging as CH4 is at low concentration in the atmosphere and large volumes of air must be sampled.

At the Laboratory of Ion Beam Physics (LIP), ETH, we developed a portable sampler based on the laboratory prototype in Zazzeri et al. 2021 [1]. The new system enables extraction of carbon from CH4 while sampling in the field, reducing the sample processing in the laboratory and allowing collection of a hundred liters of air onto a 0.5 g zeolite trap.

Here we present an overview of the sampling system and the technical developments that have been implemented at LIP. The relatively small size of the sampler and its interface with the gas ion source of the AMS system make 14CH4 measurements much easier to perform. Its portability will enable collection of CH4 samples in any environment, with the potential of assessing the radiocarbon signature of methane emissions that have not been yet characterized.

[1] Zazzeri, G., Xu, X., & Graven, H. (2021). Environmental Science & Technology, 55(13), 8535-8541.

How to cite: Zazzeri, G., Wacker, L., Haghipour, N., Gautschi, P., and Graven, H.: 14C analysis of atmospheric methane: development of a portable sampling system, EGU General Assembly 2023, Vienna, Austria, 23–28 Apr 2023, EGU23-12735, https://doi.org/10.5194/egusphere-egu23-12735, 2023.

EGU23-14183 | ECS | Posters on site | CL5.2

Radiocarbon constraints on lateral export of soil organic carbon in rivers of Switzerland 

Alexander Brunmayr, Heather Graven, Timo Rhyner, Margaux Moreno Duborgel, and Negar Haghipour

Lateral carbon transport through inland waters plays a critical yet often overlooked role in the delicate balance of carbon exchanges controlling the net uptake and storage of anthropogenic carbon in terrestrial ecosystems. Though new terrestrial carbon cycle models are increasingly making an effort to explicitly represent these traditionally neglected lateral fluxes, the parameters governing lateral carbon transport, particularly the composition and ages of exported soil carbon, remain ill-constrained. In this study, we explore the power of combined river and soil 14C datasets as a parameter constraint when calibrating a novel carbon cycle model connecting the terrestrial and riverine systems in catchments of Switzerland. For the riverine data, we use 14C measurements of particulate organic carbon (POC), dissolved organic carbon (DOC) and dissolved inorganic carbon (DIC) for water samples collected during high-discharge events in 2021 across Switzerland. Within those river catchments, we have forest soil 14C data at various depths down to 60cm for up to three samples in time (mid 1990s, 2014, and 2022). The soil samples were split into the following representative fractions: soil dissolved organic carbon (soil-DOC), particulate organic carbon (soil-POC), and mineral-associated organic carbon (soil-MOC), which represents the older and more recalcitrant component of soil carbon. This study investigates to what extent using these fraction-specific 14C measurements together with 13C and nitrogen data for both rivers and soils allows us to not only distinguish the different sources of riverine carbon but further analyze the composition and age of the soil organic carbon ending up in Swiss rivers.

How to cite: Brunmayr, A., Graven, H., Rhyner, T., Moreno Duborgel, M., and Haghipour, N.: Radiocarbon constraints on lateral export of soil organic carbon in rivers of Switzerland, EGU General Assembly 2023, Vienna, Austria, 23–28 Apr 2023, EGU23-14183, https://doi.org/10.5194/egusphere-egu23-14183, 2023.

EGU23-141 | ECS | Posters on site | CL5.3 | Highlight

Transitioning: the role of disturbances on instigating cross-overs of vegetation zones (a biome perspective) 

Bikem Ekberzade, Omer Yetemen, Omer Lutfi Sen, and H. Nuzhet Dalfes

This study considers the potential shift of biomes due to simulated changes in climatic drivers up until the end of this century, and how these changes effect the frequency of disturbances which in turn may affect the ranges of vegetation life zones. The study area is mainly the Anatolian Peninsula and its immediate surroundings, a unique location harboring high species diversity and high rates of endemism. Forcing a global to regional dynamic vegetation model with five Global Circulation Model contributions to Coupled Model Intercomparison Project (CMIP6, bias-corrected with ERA5-Land), we looked not only at the changes in the distribution and composition of key forest taxa, but the range shifts of vegetation formations from a biome perspective (classified per The International Geosphere–Biosphere Programme’s nomenclature) focusing on transition zones. Our results simulated a potential increase in the ranges of all 4 woody biomes: forest, transitional woodland, woody grassland and shrubland, with a potential retreat in grasslands. This shift is continuous throughout the simulation period of 1961-2099, with the Central Anatolian grasslands being taken over by tree taxa – comprised mostly of pines and oaks – even for the historical simulation period (1961-2021), but more significantly towards the end of the century. From a biome perspective, the increase in forest biomass and the retreat in grasslands is somewhat contrary to expectations that dryland mechanisms will become more common even in mesic environments as climate change progresses, however in line when we look at the overall picture from a taxon-specific perspective, as species that make up the composition of the simulated woody grasslands in Central Anatolia are mainly drought resistant taxa. One potential reason behind this woody plant encroachment may be the changes in fire frequency and intensity in the absence of anthropogenic interference. Our ongoing research is focusing on this curious pattern as we further analyze this phenomenon with more detailed climate input data with different time windows and with a special focus on disturbances.

How to cite: Ekberzade, B., Yetemen, O., Sen, O. L., and Dalfes, H. N.: Transitioning: the role of disturbances on instigating cross-overs of vegetation zones (a biome perspective), EGU General Assembly 2023, Vienna, Austria, 23–28 Apr 2023, EGU23-141, https://doi.org/10.5194/egusphere-egu23-141, 2023.

EGU23-1685 | Posters on site | CL5.3

CHASE: a model of human migration under environmental changes 

Rachata Muneepeerakul

This presentation focuses on migration of the most influential mammal species: humans! For humans, migration is one of the most drastic adaptation strategies against unfavorable conditions. This model is named after the factors it includes to capture migration probability by humans, namely CH = Changing mindset, A = Agglomeration, S = Social ties, and E = the Environment. Because many of these factors are not typically included in migration models of other non-human species, the CHASE model has the potential to give rise to different dynamics and patterns, which may in turn be useful for understanding and modeling migration of other species. Here we performed numerical experiments on the model by subjecting the human agents in the model to two different kinds of disturbances: sudden shocks and gradual changes. Preliminary results on the dynamics and patterns will be reported, compared, and discussed. Discussion with other presenters and comparison to other presentations in this session should lead to new ideas useful for modeling migration of humans and other species alike.

How to cite: Muneepeerakul, R.: CHASE: a model of human migration under environmental changes, EGU General Assembly 2023, Vienna, Austria, 23–28 Apr 2023, EGU23-1685, https://doi.org/10.5194/egusphere-egu23-1685, 2023.

Initialised climate predictions demonstrate ultra long-range predictability of atmospheric angular momentum, Earth's rotation and length of day. We show how slow, poleward propagating anomalies in the atmospheric angular momentum field allow interannual 'memory', well beyond currently assumed limits of atmospheric predictability. The mechanism involves wave-mean flow interaction between transient eddies and zonal winds in the troposphere and supports the persistence and poleward migration of both positive and negative anomalies. We discuss some of the implications and opportunities this presents for multiyear prediction and show how it leads to new teleconnections that are important for interpreting the observed record of climate variability.

How to cite: Scaife, A.: Multiyear predictability of atmospheric angular momentum and its implications., EGU General Assembly 2023, Vienna, Austria, 23–28 Apr 2023, EGU23-3388, https://doi.org/10.5194/egusphere-egu23-3388, 2023.

EGU23-3433 | Orals | CL5.3

The relative role of the subsurface Southern Ocean in driving negative Antarctic Sea ice extent anomalies in 2016-2021 

Liping Zhang, Thomas L. Delworth, Xiaosong Yang, Fanrong Zeng, feiyu lu, Yushi Morioka, and Mitchell Bushuk

The low Antarctic sea ice extent (SIE) following its dramatic decline in late 2016 has persisted over a multiyear period. However, it remains unclear to what extent this low SIE can be attributed to changing ocean conditions. Here, we investigate the causes of this period of low Antarctic SIE using a coupled climate model partially constrained by observations. We find that the subsurface Southern Ocean (SO) played a smaller role than the atmosphere in the extreme SIE low in 2016, but was critical for the persistence of negative anomalies over 2016-2021. Prior to 2016, the subsurface SO warmed in response to enhanced westerly winds. Decadal hindcasts show that subsurface warming has persisted and gradually destabilized the ocean from below, reducing SIE over several years. The simultaneous variations in the atmosphere and ocean after 2016 have further amplified the decline in Antarctic SIE.

How to cite: Zhang, L., Delworth, T. L., Yang, X., Zeng, F., lu, F., Morioka, Y., and Bushuk, M.: The relative role of the subsurface Southern Ocean in driving negative Antarctic Sea ice extent anomalies in 2016-2021, EGU General Assembly 2023, Vienna, Austria, 23–28 Apr 2023, EGU23-3433, https://doi.org/10.5194/egusphere-egu23-3433, 2023.

EGU23-5446 | Orals | CL5.3

Effect of initialisation within a 20yr multi-annual climate prediction system 

André Düsterhus and Sebastian Brune

Decadal climate predictions use state-of-the-art climate models and combine them with initialisation procedures to create information about our future. Their development has proven successful in the past years and offer a wide range of applications. One of them is the option to learn about the used climate models. With predictions usually aiming at time periods up to ten lead years it is often assumed that initialisation will wear off over time and the model will regress to results comparable to uninitialised simulations.

This contribution investigates decadal predictions over lead times of up to twenty years. The decadal prediction system is based on the Max Planck Institute Earth system model (MPI-ESM), uses atmospheric nudging and an oceanic Ensemble Kalman filter for initialisation and is applied for periods from 1960 onwards. We demonstrate that the effect of initialisation within the prediction can be found for long lead years and does not necessarily regresses back to the uninitialised simulation.

We show that in some areas the prediction skill varies over time, while in others it persists or drops quickly. Examples are a consistently increased prediction skill compared to historical simulations in the North East Pacific or decreased prediction skill for lead years longer than ten in the South Atlantic. We also take a look at the Atlantic Meridional Overturning Circulation (AMOC) and its development over time. We show that the AMOC drifts on short time scales towards a new state, which is reached after about ten lead years. For decadal predictions with MPI-ESM we find that for large areas of the globe the correct determination of future developments of external forcings plays an important role. This asks the question whether the current approach to hindcasts is appropriate to determine our capability to predict the future.

How to cite: Düsterhus, A. and Brune, S.: Effect of initialisation within a 20yr multi-annual climate prediction system, EGU General Assembly 2023, Vienna, Austria, 23–28 Apr 2023, EGU23-5446, https://doi.org/10.5194/egusphere-egu23-5446, 2023.

EGU23-6838 | ECS | Posters on site | CL5.3 | Highlight

Changes in Arctic climate variability and extremes: effects on migratory birds 

Nomikos Skyllas and Richard Bintanja

The climate is changing most rapidly in the Arctic because of Arctic amplification, influencing migratory bird species that depend on the short, but productive Arctic summer climate. A potential increase in climate variability can lead to reduced reproductive success and even be a major source of mortality for these birds. Most studies so far, focus on mean changes in climate, telling part of the story. However, along with changes in the mean, changes in the variability of climate will occur. These two combined (changes in mean and variability) can lead to more/less frequent extreme events such as heatwaves, droughts and excessive snowfall or melt.

Here we focus on changes in variability and extremes of Arctic bird-related climatic variables, such as temperature, precipitation, snow cover, primary productivity, solar radiation, and soil moisture. We investigate how strongly these climatic variables vary on a daily, monthly, annual and decadal basis. Furthermore, we infer changes in variability between four distinct climate states (0.5x, 1x, 2x & 4x CO2 level): will the variability and probability for extreme events change in warmer or colder climates? How will this potentially affect Arctic migratory birds? For example, snowfall and ground snow cover are expected to decrease in a warmer climate, resulting in more areas available for nesting. However, snowfall variability is projected to increase, making conditions more unpredictable on an annual basis.

To this end, we carried out four long (500 years), steady-state runs (constant CO2 level), using the state-of-the-art Earth System Model EC-Earth3. We used two versions of the model (EC-Earth3-Veg & EC-Earth3-CC) and 4 CO2 levels: 0.5x, 1x, 2x & 4x CO2 concentration of the year 2022. The end result is 4,000 years of model output data, allowing us to study climate-related changes in climate variability of Arctic bird-related variables.

How to cite: Skyllas, N. and Bintanja, R.: Changes in Arctic climate variability and extremes: effects on migratory birds, EGU General Assembly 2023, Vienna, Austria, 23–28 Apr 2023, EGU23-6838, https://doi.org/10.5194/egusphere-egu23-6838, 2023.

EGU23-9190 | Posters on site | CL5.3

On the optimization of grand multi-model probabilistic performance and the independence of the contributing seasonal prediction systems 

Andrea Alessandri, Franco Catalano, Kristian Nielsen, and Alberto Troccoli

To optimize the performance of seasonal climate forecasts we used a Grand Multi-Model Ensemble (MME) approach. The Grand MME consists of five Seasonal Prediction Systems (SPSs) provided by the European Copernicus Climate Change Service (C3S) and of other six SPSs independently developed by centres outside Europe, five by the North American (NMME) plus the SPS by the Japan Meteorological Agency (JMA).

All the possible Grand MME combinations have been evaluated for temperature and precipitation, for different geographical regions. Results show that, in general, only a limited number of SPSs is required to maximize the skill. Although the selection of models that optimize performance is usually different depending on the region, variable and season, it is shown that the performance of the Grand-MME seasonal predictions is enhanced with the increase of the independence of the contributing SPSs.

Independence is measured by using  a novel metric developed here, named the Brier score covariance (BScov), which estimates the relative independence of the SPSs. Together with probabilistic skill metrics, BScov is used to develop a strategy for an effective identification of the combinations of SPSs that optimize the probabilistic performance of the predictions, thus avoiding the inefficient and ineffective use of all SPSs available.

How to cite: Alessandri, A., Catalano, F., Nielsen, K., and Troccoli, A.: On the optimization of grand multi-model probabilistic performance and the independence of the contributing seasonal prediction systems, EGU General Assembly 2023, Vienna, Austria, 23–28 Apr 2023, EGU23-9190, https://doi.org/10.5194/egusphere-egu23-9190, 2023.

EGU23-10571 | Posters on site | CL5.3

Simulating hydrology and tracer dynamics in a subglacial environment underneath the Greenland ice sheet 

Ankit Pramanik, Sandra Arndt, Mauro Werder, and Frank Pattyn

The Greenland ice-sheet surface melt has increased substantially in intensity and spatial extent over the recent decades. The rapid migration of melt towards upstream areas of Greenland ice sheet is expected to incur major changes in hydrological behaviour of the ice-sheet and outlet glaciers along with changes in export fluxes of carbon, methane, and other nutrient fluxes, which, in turn, will further affect the downstream ecosystem of rivers, fjords and oceans. Subglacial environments are emerging as ecological hotspots, urging detailed understanding of interaction between subglacial-hydrology and biogeochemistry. However, due to their inaccessibility, the hydrology and biogeochemistry of subglacial environment thus far lacks a detailed understanding. Numerical models are, in combination with observational data, ideal tools to advance our understanding.

Here, we developed a novel process-based model to investigate the interplay between subglacial-hydrology and (passive and active) tracer dynamics underneath the rapidly changing Greenland ice sheet on seasonal, inter-annual and climate warming relevant timescales. We set up the subglacial-hydrology model GlaDS (Glacier Drainage System model) to simulate seasonal and interannual evolution of distributed and channelized subglacial water flow for Leverett glacier (Southwest Greenland) to explore the geometry, connectivity, and flow dynamics in the seasonally evolving drainage system.

We then use the GlaDS results to inform a reaction-transport model (RTM) of Leverett’s subglacial system following the GlaDS set-up. The RTM is run to conduct a series of idealized tracer experiments with the aim of disentangling the transport and reaction controls on subglacial tracer distribution and outflow. Tracers are injected to the system through moulins with the surface meltwater and are either passively transported (passive) or also consumed/produced (active) during their transit through the system. Model results are validated with long-term measurements in this area. Results show that the tracer transport is primarily controlled by subglacial drainage system efficiency, which is regulated by discharge magnitude, topography and moulin locations. The spatial and temporal variation in tracer concentration is further dependent on hydrological interaction between different subglacial components (cavities and channels), location and type of branching of channels, and bed properties.

In the future, we will extend the model to wider area of Greenland ice sheet and couple it to multi-component biogeochemical reaction networks with the. aim to understand the evolution of biogeochemical process along with the evolution of hydrology in warming climate.

How to cite: Pramanik, A., Arndt, S., Werder, M., and Pattyn, F.: Simulating hydrology and tracer dynamics in a subglacial environment underneath the Greenland ice sheet, EGU General Assembly 2023, Vienna, Austria, 23–28 Apr 2023, EGU23-10571, https://doi.org/10.5194/egusphere-egu23-10571, 2023.

EGU23-10719 | Posters virtual | CL5.3 | Highlight

Seasonal prediction and predictability of wind power potential over North America 

Xiaosong Yang, Thomas Delworth, Liwei Jia, Nathaniel Johnson, Feiyu Lu, and Colleen McHugh

The capacity factor (CF) is a critical indicator for quantifying wind turbine efficiency, and therefore has been widely used to measure the impact of interannual wind variability on wind energy production. Using the seasonal prediction products from GFDL’s Seamless System for Predicton and Earth System (SPEAR), we assess the seasonal prediction skill of CF over North America. SPEAR shows high skill in predicting winter CF over the western United States. The seasonal wind speed and CF variations associated with large-scale circulation anomalies are examined to understand the predictability mechanism of CF. The source of the skillful seasonal CF prediction can be attributed to year-to-year variations of ENSO and North Pacific Oscillation, which produce large-scale anomalous wind patterns over North America. The skillful seasonal prediction of CF is potentially beneficial to various stakeholders in the energy sector, including wind energy production, trading, and transmission.  

How to cite: Yang, X., Delworth, T., Jia, L., Johnson, N., Lu, F., and McHugh, C.: Seasonal prediction and predictability of wind power potential over North America, EGU General Assembly 2023, Vienna, Austria, 23–28 Apr 2023, EGU23-10719, https://doi.org/10.5194/egusphere-egu23-10719, 2023.

EGU23-11884 | Posters on site | CL5.3

Migration ecology in insects: integrative approaches to trace long-distance movements of the Painted Lady butterfly (Vanessa cardui) 

Gerard Talavera, Luise Gorki, Eric Toro-Delgado, Roger López-Mañas, Megan Reich, Mattia Menchetti, Cristina Domingo-Marimon, Llorenç Sáez, Naomi Pierce, Roger Vila, Clément Bataille, and Tomasz Suchan

Migratory insects may move in very large numbers, even surpassing migratory vertebrates in biomass. However, the extent of aerial flows of insects circulating around the planet, as well as their impact on ecosystems and biogeography, remain almost unstudied because of methodological challenges associated with tracking small, short-lived, organisms. In this presentation, I will show how a novel integrative approach allows reconstructing long-range insect movements, through a combination of tools on genetics, isotope ecology, ecological niche modelling, pollen metabarcoding, field ecology, and citizen science.

I will show the latest discoveries on the migrations of the Painted Lady butterfly (Vanessa cardui). This butterfly species is the most cosmopolitan of all butterflies, and it is known by its regular trans-Saharan migrations, that entail distances of >4000 km, similar to those of some birds. First, we track a migratory outbreak of V. cardui butterflies taking place at a continental scale in Europe, the Middle East, and Africa from March 2019 to November 2019. We use DNA metabarcoding to identify plants from pollen transported by the insects. From 265 butterflies collected in 14 countries over 7 months, we molecularly identify 398 plants. We develop a novel geolocation approach based on combining probability rasters from species distribution modelling of each identified plant, and thus trace back the location of the outbreak’s origin and the origin of each of the subsequent generations. We show a strong representation of plants of Middle Eastern distribution in butterfly swarms collected in Eastern Europe in early spring. Swarms collected in Northern Europe in late spring were highly represented by plants of Mediterranean origin, and swarms collected in the summer in the Mediterranean likely originated in central and Northern Europe.

Second, we report the first proven transatlantic crossing by individual insects, a journey of at least 4,200 km from West Africa to South America. This discovery was possible through gathering evidence from multiple sources, including coastal field surveys, wind trajectory modelling, phylogeography, pollen metabarcoding, and multi-isotope geolocation of natal origins. Wind trajectories were exceptionally favourable for the butterflies to disperse across the Atlantic from West Africa. Population genetic analyses clustered the butterflies collected in South America with the European-African population, ruling out the possibility that the migrants originated in America. Pollen metabarcoding showed highly represented plants endemic to the Sahelian region. Finally, a dual isotope analysis of hydrogen (δ2H) and strontium (87Sr/86Sr) combined with a spatio-temporal niche model of suitable reproductive habitat geolocated the natal origins of the migrants to regions in Mali, Morocco, or Portugal, and thus not discarding a journey also involving a trans-Saharan crossing.

In summary, this work contributes new methodological avenues to advance our understanding of the dispersal and migration of insects. The findings here reported suggest that we may be underestimating long-range dispersal in insects, and highlight the importance of aerial highways connecting continents by trade winds. Overall, we will discuss the scale and potential implications that insect migratory movements represent for ecosystems and nature conservation worldwide.

How to cite: Talavera, G., Gorki, L., Toro-Delgado, E., López-Mañas, R., Reich, M., Menchetti, M., Domingo-Marimon, C., Sáez, L., Pierce, N., Vila, R., Bataille, C., and Suchan, T.: Migration ecology in insects: integrative approaches to trace long-distance movements of the Painted Lady butterfly (Vanessa cardui), EGU General Assembly 2023, Vienna, Austria, 23–28 Apr 2023, EGU23-11884, https://doi.org/10.5194/egusphere-egu23-11884, 2023.

EGU23-11922 | ECS | Orals | CL5.3

Is your ensemble of CMIP6 models consistent with IPCC AR6? 

Vincent Humphrey, Anna Merrifield, and Reto Knutti

The Intergovernmental Panel on Climate Change (IPCC) assesses the sensitivity of the climate system to increases in greenhouse gas concentrations using multiple lines of evidence, covering paleoclimate data, historical observations, and numerical Earth system model (ESM) simulations. Within IPCC’s latest Assessment Report (AR6), there is, for the first time, a non-negligible difference between the most likely rate of warming estimated in the report and the average warming rate simulated by the ESMs that participated in the Coupled Model Intercomparison Project (CMIP6). This discrepancy occurs because a large number of CMIP6 models have projected future warming rates that are higher than previously reported but quite unlikely according to historical observations. The consequence is that using a random selection of CMIP6 simulations is likely to overestimate historical and future warming (compared to what is assessed in the IPCC report), potentially leading to avoidable inconsistencies when compared to observations or greater projected changes compared to what could be inferred from CMIP5.

As this constitutes a wide-spread obstacle and limitation to using CMIP6 simulations ‘out of the box’, we propose here a simple model weighting method with the objective to address this problem. Our approach can be used to 1) evaluate the extent to which any given set of CMIP6 simulations is consistent with IPCC-assessed warming rates and 2) calculate the appropriate model weights so that potential inconsistencies are reduced as much as possible. The calculation of the weights is solely based on the user’s selection of a CMIP6 subset and does not require any data manipulation. The weights can then be easily implemented in existing analyses to calculate weighted (i.e. instead of just arithmetic) multi-model means, weighted quantiles, etc. We demonstrate the interest and flexibility of the method with some examples, including global to regional assessments of historical and projected changes in temperature and precipitation. We illustrate the extent to which applying model weights can reconcile otherwise divergent scientific results and provide assessments that are more robust across CMIP generations.

How to cite: Humphrey, V., Merrifield, A., and Knutti, R.: Is your ensemble of CMIP6 models consistent with IPCC AR6?, EGU General Assembly 2023, Vienna, Austria, 23–28 Apr 2023, EGU23-11922, https://doi.org/10.5194/egusphere-egu23-11922, 2023.

EGU23-12428 | ECS | Orals | CL5.3

Effects of the realistic vegetation cover on predictions at seasonal and decadal time scales 

Emanuele Di Carlo, Andrea Alessandri, Fransje van Oorschot, Annalisa Cherchi, Susanna Corti, Giampaolo Balsamo, Souhail Boussetta, and Timothy Stockdale

Vegetation is a relevant and highly dynamic component of the Earth System controlling, amongst others, surface roughness, albedo and evapotranspiration; its variability shows changes in seasons, interannual, decadal and longer timescales. In this study, we investigate the effects of improved representation of vegetation dynamics on climate predictions at different timescales: seasonal and decadal. To this aim, the latest generation satellite datasets of vegetation characteristics have been exploited, and a novel and improved parameterization of the effective vegetation cover has been developed. The new parameterization is implemented in the land surface scheme HTESSEL shared by two state-of-the-art Earth system models: ECMWF SEAS5 and EC-Earth3. The former model is used for sensitivity at seasonal timescale, while the latter is used for sensitivity at decadal timescale.

Both seasonal and decadal experiments show considerable sensitivity of models' surface climate bias with large effects on December-January-February (DJF) T2M, mean sea level pressure and zonal wind over middle-to-high latitudes. Consistently, a significant improvement in the skill for DJF T2M is found, especially over Euro-Asian Boreal forests. In seasonal experiments, this improvement displays a strong interannual coupling with the local surface albedo. From the region with the most considerable T2M improvement, over Siberia, originates a large-scale effect on circulation encompassing Northern Hemisphere middle-to-high latitudes from Siberia to the North Atlantic. As a result, in seasonal experiments, the correlation between the model NAO index against the ERA5 NAO index improves significantly.

These results show a non-negligible effect of the vegetation cover on the general circulation, especially for the northern hemisphere and on the prediction skill.

How to cite: Di Carlo, E., Alessandri, A., van Oorschot, F., Cherchi, A., Corti, S., Balsamo, G., Boussetta, S., and Stockdale, T.: Effects of the realistic vegetation cover on predictions at seasonal and decadal time scales, EGU General Assembly 2023, Vienna, Austria, 23–28 Apr 2023, EGU23-12428, https://doi.org/10.5194/egusphere-egu23-12428, 2023.

EGU23-13998 | ECS | Orals | CL5.3

Variability in ENSO-induced carbon flux patterns 

István Dunkl and Tatiana Ilyina

El Niño-Southern Oscillation (ENSO) is not only a driver of global carbon cycle variability, but it also provides several mechanisms of predictability. Although most Earth system models (ESMs) can reproduce the relationship between ENSO and atmospheric CO2 concentrations, the question remains whether the ESMs agree on the origins of these ENSO-related GPP anomalies. We analyse the patterns of ENSO-induced GPP anomalies in 17 ESMs to determine from which regions these GPP anomalies come from, and whether the differences among the models are driven by climate forcing or biochemistry. While most of the GPP anomalies originate from Southeast Asia and northern South America, there are large deviations among the ESMs. The combined GPP anomaly of these two regions ranges between 26% and 75% of the global anomaly among the ESMs. To find out what causes the differences, we examined two major drivers of the GPP anomalies: the size of the ENSO-induced climate anomalies, and the sensitivity of GPP to climate. On the global average, ENSO-induced climate anomalies and GPP sensitivity have similar uncertainty among the ESMs, contributing equally to the variations in ENSO-induced GPP anomaly patterns. This analysis reveals model biases in teleconnection patterns and biochemistry. Addressing these biases is a tangible goal for model developers to decrease the uncertainty in the reproduction of the global carbon cycle, and to increase its predictability.

How to cite: Dunkl, I. and Ilyina, T.: Variability in ENSO-induced carbon flux patterns, EGU General Assembly 2023, Vienna, Austria, 23–28 Apr 2023, EGU23-13998, https://doi.org/10.5194/egusphere-egu23-13998, 2023.

EGU23-14304 | ECS | Posters on site | CL5.3 | Highlight

Decadal prediction along the Western Irish Coast 

Catherine O'Beirne, Gerard McCarthy, and André Düsterhus

Over the last decade there have been vast improvements in the field of global decadal climate prediction; however, on a regional scale there is still limited confidence. Previous studies with the Max Plank Institute Earth System Model (MPI-ESM) have demonstrated that it can replicate water properties on a regional scale in the North Sea and Barents Sea.

In this study we investigate the prediction skill at depth along the Western Irish Coast using the MPI-ESM. For this we compare Hindcast simulations with Historical simulations. The employed Hindcast simulations consists of an ensemble mean of 16 members over the time frame 1961-2008 with a 2-to-5-year lead time. The Historical simulations over the same time frame also consist of an ensemble mean of 16 members.

For this contribution we investigate further the MPI-ESM predictability at depth for temperature and salinity along three transects that influence the Western Irish Coast at the Extended Ellet Line northwest, Galway Transect west, and Goban Spur southwest. A lead time analysis determines the improvement of prediction skill by initialisation. We discuss potential applications for this work in areas such as fisheries, coastal security, and marine leisure, for Ireland and its surrounding seas.

How to cite: O'Beirne, C., McCarthy, G., and Düsterhus, A.: Decadal prediction along the Western Irish Coast, EGU General Assembly 2023, Vienna, Austria, 23–28 Apr 2023, EGU23-14304, https://doi.org/10.5194/egusphere-egu23-14304, 2023.

EGU23-14401 | Orals | CL5.3

A case study to investigate the role of aerosols reduction on the East Asian summer monsoon seasonal prediction 

Annalisa Cherchi, Etienne Tourigny, Juan C Acosta Navarro, Pablo Ortega, Paolo Davini, Andrea Alessandri, Franco Catalano, and Twan van Noije

In the late 20th century, both the East Asian and the South Asian summer monsoons weakened because of increased emissions of anthropogenic aerosols over Asia, counteracting the warming effect of increased greenhouse gases (GHGs). During the spring 2020, when restrictions to contain the spread of the coronavirus were implemented worldwide, reduced emissions of gases and aerosols were detected and found to be quite extended over Asia.

Following on from the above and using the EC-Earth3 coupled model, a case-study forecast for summer 2020 (May 1st start date) has been designed and produced with and without the reduced atmospheric forcing due to covid-19 related restrictions in the SSP2-4.5 baseline scenario, as estimated and adopted within CMIP6 DAMIP covidMIP experiments (hereinafter “covid-19 forcing”). The forecast ensembles (sensitivity and control experiments, meaning with and without covid-19 forcing) consist of 60 members each to better account for the internal variability (noise) and to maximize the capability to identify the effects of the reduced emissions.

The analysis focuses on the effects of the covid-19 forcing on the forecasted evolution of the monsoon, with a specific focus on the performance in predicting the summer precipitation over India and over other parts of South and East Asia. The results indicate that in 2020 a more realistic representation of the atmospheric forcing in the spring preceding the core monsoon season improves the skill of the predicted summer precipitation, mostly over East Asia. Beyond the testbed considered in this analysis, the result helps improving the understanding of the processes at work over the Asian monsoons regions, with positive implications on the usefulness of seasonal predictions products.

How to cite: Cherchi, A., Tourigny, E., Acosta Navarro, J. C., Ortega, P., Davini, P., Alessandri, A., Catalano, F., and van Noije, T.: A case study to investigate the role of aerosols reduction on the East Asian summer monsoon seasonal prediction, EGU General Assembly 2023, Vienna, Austria, 23–28 Apr 2023, EGU23-14401, https://doi.org/10.5194/egusphere-egu23-14401, 2023.

EGU23-14731 | ECS | Posters on site | CL5.3

Assessing the predictability of droughts through seasonal forecasts 

Thomas Dal Monte, Annalisa Cherchi, Andrea Alessandri, and Marco Gaetani

Atmospheric circulations at the mid-latitudes are marked by circulation regimes, structures evolving in space very slowly and persisting over time. Their persistence and duration in a context such as Europe's, could lead to weather patterns, such as heat waves and drought, that have a­­ major impact on many socio-economic sectors. Forecasts at seasonal timescale are becoming then crucial to plan or give relevant indicators for societal applications. Predictability of such events could be of great use in further applications related to energy and management of water supplies. Also, this may provide useful insights to understanding the increase in frequency and intensity of these extreme events and their location.

The late purpose of this study is to investigate the predictability of European droughts in a forecast range of 1-3 months. To this aim, drought events are firstly identified, and state-of-the-art seasonal forecast products are analysed to compute the skill for targeted drought-related climate variables and/or circulation patterns. Observational datasets, high-resolution reanalysis and latest generation satellite observations will be used for the characterization of drought events and the forecast validation.

How to cite: Dal Monte, T., Cherchi, A., Alessandri, A., and Gaetani, M.: Assessing the predictability of droughts through seasonal forecasts, EGU General Assembly 2023, Vienna, Austria, 23–28 Apr 2023, EGU23-14731, https://doi.org/10.5194/egusphere-egu23-14731, 2023.

EGU23-14765 | Orals | CL5.3

Variations of the CO2 fluxes and atmospheric CO2 in multi-model predictions with an interactive carbon cycle 

Hongmei Li, Aaron Spring, istvan Dunkl, Sebastian Brune, Raffaele Bernardello, Laurent Bopp, William Merryfield, Juliette Mignot, Reinel Sospedra-Alfonso, Etienne Tourigny, Michio Watanabe, and Tatiana Ilyina

Variable fluxes of anthropogenic CO2 emissions into the land and the ocean and the remaining proportion in the atmosphere reflect on the global carbon budget variations and further modulate global climate change. A more accurate reconstruction of the global carbon budget in the past decades and a more reliable prediction of the variations in the next years are crucial for assessing the effectiveness of climate change mitigation policies and supporting global carbon stocktaking and monitoring in compliance with the goals of the Paris Agreement.

In this study, we investigate reconstructions and predictions of the CO2 fluxes and atmospheric CO2 growth from ensemble prediction simulations using 5 Earth System Model (ESM) - based decadal prediction systems. These novel prediction systems driven by CO2 emissions with an interactive carbon cycle enable prognostic atmospheric CO2 and represent atmospheric CO2 growth variations in response to the strength of CO2 fluxes into the ocean and the land, which are missing in the conventional concentration-driven decadal prediction systems with prescribed atmospheric CO2 concentration.

The reconstructions generated by assimilating physical ocean and atmosphere data products into the prediction systems are able to reproduce the annual mean historical variations of the CO2 fluxes and atmospheric CO2 growth. Multi-model ensemble means best match the assessments of CO2 fluxes and atmospheric CO2 growth rate from the Global Carbon Project with correlations of 0.79, 0.82, and 0.98 for atmospheric CO2 growth rate, air-land CO2 fluxes, and air-sea CO2 fluxes, respectively. The CO2 emission-driven prediction systems with an interactive carbon cycle still maintain the predictive skill of CO2 fluxes and atmospheric CO2 growth as found in conventional concentration-driven prediction systems, i.e., about 2 years for the air-land CO2 fluxes and atmospheric CO2 growth, the air-sea CO2 fluxes have higher skill up to 5 years. The ESM-based prediction systems are capable to reconstruct and predict the variations in the global carbon cycle and hence are powerful tools for supporting carbon budgeting and monitoring, especially in the decarbonization processes. Furthermore, we investigate the contribution of uncertainty in the predictions of CO2 fluxes and atmospheric CO2 growth rate from internal climate variability, different model responses, and emission-forcing reductions to identify the prominent challenge in limiting the skill of CO2 predictions. 

How to cite: Li, H., Spring, A., Dunkl, I., Brune, S., Bernardello, R., Bopp, L., Merryfield, W., Mignot, J., Sospedra-Alfonso, R., Tourigny, E., Watanabe, M., and Ilyina, T.: Variations of the CO2 fluxes and atmospheric CO2 in multi-model predictions with an interactive carbon cycle, EGU General Assembly 2023, Vienna, Austria, 23–28 Apr 2023, EGU23-14765, https://doi.org/10.5194/egusphere-egu23-14765, 2023.

EGU23-15373 | Orals | CL5.3

DWD’s operational climate predictions – towards a seamless climate prediction website - towards a seamless climate prediction website 

Birgit Mannig, Andreas Paxian, Miriam Tivig, Klaus Pankatz, Kristina Fröhlich, Sabrina Wehring, Alexander Pasternack, Philip Lorenz, Amelie Hoff, Katharina Isensee, Saskia Buchholz, and Barbara Früh

Germany's National Meteorological Service, Deutscher Wetterdienst (DWD), is working on an operational seamless climate prediction approach: What started in 2016 with operational seasonal climate predictions, was later complemented with decadal climate predictions. Since 2022, DWD publishes decadal, seasonal, and subseasonal climate predictions on one single, comprehensive climate prediction website www.dwd.de/climatepredictions [1].

While global simulations of decadal and seasonal predictions are produced by DWD’s climate prediction systems, global subseasonal predictions are retrieved from the European Centre of Medium-Range Weather Forecast (ECMWF). The next step in the operational processing chain is the empirical-statistical downscaling EPISODES [2], which results in high-resolution climate predictions (approx. 5 km) for Germany.

Both global and regional climate predictions are evaluated using the Meteorological Analyzation and Visualization System MAVIS, a fork of the FREVA system (Free Evaluation System Framework for Earth System Modeling) [3]. We evaluate ensemble mean predictions using the Mean Squared Error Skill Score (MSESS) and the Pearson Correlation Coefficient. Probabilistic climate predictions are evaluated using the Ranked Probability Skill Score (RPSS).

Ensemble mean and probabilistic climate prediction results of global and downscaled simulations, as well as the evaluation results are jointly published on DWD’s climate prediction website. The user-friendly graphical presentation is consistent for all displayed regions (global, Europe, Germany, and German cities) and across all time scales and was developed as a co-design between DWD and various national users.

We work on several extensions of the website: multi-year seasonal predictions (e.g. 5-year summer means), the prediction of drought indices and El Nino Southern Oscillation predictions. In addition, a seamless time series combining observations, climate predictions and climate projections is in preparation.


[1] A. Paxian, B. Mannig, M. Tivig, K. Reinhardt, K. Isensee, A. Pasternack, A. Hoff, K. Pankatz, S. Buchholz, S. Wehring, P. Lorenz, K. Fröhlich, F. Kreienkamp, B. Früh (2023). The DWD climate predictions website: towards a seamless outlook based on subseasonal, seasonal and decadal predictions. Manuscript in review.

[2] Kreienkamp, F., Paxian, A., Früh, B., Lorenz, P., Matulla, C., 2018. Evaluation of the Empirical-Statistical Downscaling method EPISODES. Clim. Dyn. 52, 991–1026 (2019). https://doi.org/10.1007/s00382-018-4276-2.

[3] Kadow, C., Illing, S., Lucio-Eceiza, E.E., Bergemann, M., Ramadoss, M., Sommer, P.S., Kunst, O., Schartner, T., Pankatz, K., Grieger, J., Schuster, M., Richling, A., Thiemann, H., Kirchner, I., Rust, H.W., Ludwig, T., Cubasch, U. and Ulbrich, U., 2021. Introduction to Freva – A Free Evaluation System Framework for Earth System Modeling. Journal of Open Research Software, 9(1), p.13. DOI: http://doi.org/10.5334/jors.253

How to cite: Mannig, B., Paxian, A., Tivig, M., Pankatz, K., Fröhlich, K., Wehring, S., Pasternack, A., Lorenz, P., Hoff, A., Isensee, K., Buchholz, S., and Früh, B.: DWD’s operational climate predictions – towards a seamless climate prediction website - towards a seamless climate prediction website, EGU General Assembly 2023, Vienna, Austria, 23–28 Apr 2023, EGU23-15373, https://doi.org/10.5194/egusphere-egu23-15373, 2023.

EGU23-16200 | Posters virtual | CL5.3

Random Forest approach to forecast onset date and duration of rainy season in Tanzania 

Kristian Nielsen, Alberto Troccoli, Indrani Roy, and Meshack Mliwa

In the SADC region of Eastern Africa the onset and duration of the rainy season is of high importance to the agriculture and general water resource management. The planting time, selection of crops and success of different crops is linked to how skillfully this date can be forecasted.  
 
As part of the Horizon 2020 project called FOCUS-Africa, in order to forecast this specific onset-date and duration for a specific location in Tanzania, we have constructed a statistical model utilizing the Random Forest algorithm. This is being trained using a mix of observation of past teleconnection indices such as IOD and ENSO3.4 from recent months that from earlier studies have shown to be connected to the onset date and dynamical seasonal forecast of precipitation with a daily temporal resolution. At this stage three dynamical models are included. Finally, the observed precipitation of the previous months is being used as predictors as well.  
 
The first results have shown an improvement of the statistical model over using climatic information such as mean onset date as the reference forecast. This can be achieved 2-3 months ahead of the onset date. Furthermore, a relatively large importance of the seasonal forecast systems and the teleconnection indices seems to be present several months ahead of the observed onset date. This also indicates the importance of mixing observations and dynamical models in order to optimize the best possible overall skill of the system in predicting the onset date of the rainy season and thereby supporting local agriculture. 

How to cite: Nielsen, K., Troccoli, A., Roy, I., and Mliwa, M.: Random Forest approach to forecast onset date and duration of rainy season in Tanzania, EGU General Assembly 2023, Vienna, Austria, 23–28 Apr 2023, EGU23-16200, https://doi.org/10.5194/egusphere-egu23-16200, 2023.

EGU23-17225 | Posters virtual | CL5.3

Exploring the Role of Hybrid Energy Systems for Enhancing Green Energy Potential in Urban Areas 

Deepak Kumar and Nick P. Bassill

Hybrid energy systems for improving sustainable urban energy attempt to combine energy supply, public transport modernization, and residential/commercial energy demand reduction. Due to reduced nonrenewable resources, alternative and augmented energy sources are required everywhere. The development of science and industry has increased the energy required to achieve environmental goals with reduced gas emissions. Solar and wind energy are cleaner, more efficient alternatives to polluting energy sources, so the attention is now on large-scale hybrid energy systems. Lots of attempts have been made to show technological advancement and research has analyzed the functionality of energy systems, but urban applications have received little attention. The proposed work imitates the feasibility analysis of hybrid urban energy systems. The research acknowledged the development of research purpose, methodology, research, and data collection approach to reporting the technological, scientific, and industrial developments. This research explains a typical urban environment to determine the hourly load profile for any urban region to exhibit the role of a hybrid energy system to raise energy potential. It summarizes past, present, and future trends in energy system design, development, and implementation. The design can be enlarged to implementations with several other combinations to provide cleaner and cheaper energy.

How to cite: Kumar, D. and Bassill, N. P.: Exploring the Role of Hybrid Energy Systems for Enhancing Green Energy Potential in Urban Areas, EGU General Assembly 2023, Vienna, Austria, 23–28 Apr 2023, EGU23-17225, https://doi.org/10.5194/egusphere-egu23-17225, 2023.

The subseasonal prediction with a lead time of 10–30 days is the gap between weather (<10 days) and climate (>30 days) predictions. Improving the forecast skill of extreme weather events at the subseasonal range is crucial for risk management of disastrous events. In this study, three deep-learning (DL) models based on the methods of convolutional neural network and gate recurrent unit are constructed to predict the rainfall anomalies and associated extreme events in East China at the lead times of 1–6 pentads. All DL models show skillful prediction of the temporal variation of rainfall anomalies (in terms of temporal correlation coefficient skill) over most regions in East China beyond 4 pentads, outperforming the dynamical models from the China Meteorological Administration (CMA) and the European Centre for Medium Range Weather Forecasts (ECMWF). The spatial distribution of the rainfall anomalies is also better predicted by the DL models than the dynamical models; and the DL models show higher pattern correlation coefficients than the dynamical models at lead times of 3 to 6 pentads. The higher skill of DL models in predicting the rainfall anomalies will help to improve the accuracy of extreme-event predictions. The Heidke skill scores of the extreme rainfall event forecast performed by the DL models are also superior to those of the dynamical models at a lead time beyond about 4 pentads. Heat map analysis for the DL models shows that the predictability sources are mainly the large-scale factors modulating the East Asian monsoon rainfall.

How to cite: Hsu, P.-C. and Xie, J.: Skillful subseasonal prediction of rainfall and extreme events in East China based on deep learning, EGU General Assembly 2023, Vienna, Austria, 23–28 Apr 2023, EGU23-17300, https://doi.org/10.5194/egusphere-egu23-17300, 2023.

EGU23-17423 | Posters virtual | CL5.3

The role of multi-scale interaction on subseasonal prediction of extreme events 

June-Yi Lee, Pang-Chi Hsu, Doo-Young Lee, Young-Min Yang, and Jinhui Xie

The northward/northwestward propagation of boral summer intraseasonal oscillation (BSISO) modulates the subtropical variability ad typhoon activity and has significant impacts on the extreme weather and climate events in Asia. BSISO strongly interacts with background mean fields and tends to be stronger and longer in its northward propagation during La Nina than El Nino summers. It is further found that BSISO-related convections are stronger and more organized with northward propagation on 30-60-day timescales during El Nino developing than decaying summers over the western Pacific. Thus, for skillful subseasonal prediction of extreme events in Asia, it is crucial for climate models to well represent BSISO and its interaction with the background mean state and synoptic variability. Our case study shows that the rare extreme flooding event in Henan Province, China, during July 2021 (referred to as the “21.7” flooding event) was a result of scale interactions between the background mean field associated with the weak La Nina condition, intraseasonal oscillations, and synoptic disturbances. The two distinct modes of the BSISO (10-30- and 30-90-day modes) unusually had a crucial combined role in moisture convergence, aided by the increased seasonal-mean moisture content, maintaining persistent rainfall during the 21.7 event. Synoptic-scale moisture convergence was also contributed to the extreme values in the peak day of the event. The five state-of-the art subseasonal-to-seasonal prediction models showed limited skills in predicting this extreme event one to two weeks in advance, partly because of their biases in representing the BSISO and multiscale interactions. Our results highlight that an accurate prediction of subseasonal perturbations and their interactions with the background moisture content is crucial for improving the extended-range forecast skill of extreme precipitation events.

How to cite: Lee, J.-Y., Hsu, P.-C., Lee, D.-Y., Yang, Y.-M., and Xie, J.: The role of multi-scale interaction on subseasonal prediction of extreme events, EGU General Assembly 2023, Vienna, Austria, 23–28 Apr 2023, EGU23-17423, https://doi.org/10.5194/egusphere-egu23-17423, 2023.

EGU23-162 | ECS | PICO | CL5.5

Evaluation and projection of global terrestrial near-surface wind speed based on CMIP6 GCMs 

Cheng Shen, Jinlin Zha, Zhibo Li, Cesar Azorin-Molina, Lorenzo Minola, and Deliang Chen

We evaluate the performance of Coupled Model Intercomparison Project Phase 6 (CMIP6) models in simulating the observed global terrestrial near-surface wind speed (NSWS) and project its future changes under three different Shared Socioeconomic Pathways (SSPs). Results show that the CESM2 has the best ability in reproducing the observed NSWS trends, although all models examined are generally not doing well. Based on projections of CESM2, the global NSWS will decrease from 2021 to 2100 under all three SSPs. The projected NSWS declines significantly over the north of 20°N, especially across North America, Europe, and the mid-to-high latitudes of Asia; meanwhile, it increases over the south of 20°N. Under SSP585, there would be more light-windy days and fewer strong-windy days than those under SSP245, which leads to a significant global NSWS decline. Robust hemispheric-asymmetric changes in the NSWS could be due to the temperature gradient in the two hemispheres under global warming, with −1.2%, −3.5%, and −4.1% in the Northern Hemisphere, and 0.8%, 1.0%, and 1.5% in the Southern Hemisphere, for the near-term (2021–2040), mid-term (2041–2060), and long-term (2081–2100), respectively.

How to cite: Shen, C., Zha, J., Li, Z., Azorin-Molina, C., Minola, L., and Chen, D.: Evaluation and projection of global terrestrial near-surface wind speed based on CMIP6 GCMs, EGU General Assembly 2023, Vienna, Austria, 23–28 Apr 2023, EGU23-162, https://doi.org/10.5194/egusphere-egu23-162, 2023.

EGU23-1729 | PICO | CL5.5

Progress of reprocessed long-term data records from Fengyun satellites 

Ling Sun, Peng Zhang, Shengli Wu, Hong Qiu, Lin Chen, Yang Guo, Na Xu, Dawei An, and Chengli Qi

NSMC/CMA has been continuously pushing forward the reprocessing of Fengyun series dataset for better quality, especially L1 product. A comprehensive Fengyun historical data rescue and reprocessing task has been completed. At present, the early historical data of FY-1 archive was rescued and L1 data was reproduced providing full data record since 1988. The long-term L1 data reprocessing includes 7 instrument series on 13 satellites in FY-1, FY-2 and FY-3 missions. There are 3 optical imagers with 2 in polar orbit and 1 in geostationary orbit, 1 infrared sounder, 1 microwave imager, and 2 microwave sounders. After reprocessing, the sensor related instability issues caused by instrument degradation and instrument status changes are solved. The inter-platform consistency is also improved by radiometric reference transfer correction in each instrument series. The Fengyun fundamental climate data records (FCDRs) for 7 instruments have been evaluated by radiometric comparison with reference instruments or RTM simulations. The reprocessed L1 dataset has also supported long-term dataset generation for several geophysical parameters. This paper gives an overview of the data reprocessing efforts. 

How to cite: Sun, L., Zhang, P., Wu, S., Qiu, H., Chen, L., Guo, Y., Xu, N., An, D., and Qi, C.: Progress of reprocessed long-term data records from Fengyun satellites, EGU General Assembly 2023, Vienna, Austria, 23–28 Apr 2023, EGU23-1729, https://doi.org/10.5194/egusphere-egu23-1729, 2023.

Outgoing longwave radiation (OLR) of the atmosphere top (TOA) is an important component of the radiation energy balance of the TOA. The Medium Resolution Imaging Spectrometer (MERSI) carried by the FY-3D and FY-3E satellites can be used for OLR calculation. This paper described the algorithm of MERSI OLR, and the consistency and accuracy of FY-3D MERSI and FY-3E MERSI instantaneous OLR were evaluated based on AQUA CERES OLR. The inspection results showed that the FY-3D and FY-3E MERSI OLR accuracy were basically consistent. And there was uniformly negative deviation compared AQUA CERES instantaneous OLR, the average deviation was about -3 W m-2, and the RMSE was about 6-7 W m-2. On this basis, the ability of daily mean OLR retrieved from FY-3D MERSI and FY-3E MERSI was discussed. The results showed that the accuracy of OLR from four-time observation per day was higher than that from two-time observation per day. The average OLR of the four-time observation per day could be better represent the diurnal variation of that, and the diurnal variation characteristics of OLR also was provided with seasonal changes. In general, the OLR retrieval capabilities of FY-3D and FY-3E satellites are equivalent, and the joint use of them is better on daily mean OLR retrieval. This study can provide a basis for users to analyze OLR data of Fengyun satellites.


How to cite: Zhang, W.: Evaluation of daily average OLR retrieved jointly by FY-3 multiple satellites, EGU General Assembly 2023, Vienna, Austria, 23–28 Apr 2023, EGU23-2465, https://doi.org/10.5194/egusphere-egu23-2465, 2023.

EGU23-2966 | ECS | PICO | CL5.5

Extending the Air-Sea Essential Climate Variables CDR with AMSR3 and MWI Microwave Radiances 

Katherine Wentz, Lucrezia Ricciardulli, Thomas Meissner, and Frank Wentz

Remote Sensing Systems (RSS) provides a global community of researchers and decision makers with inter-calibrated microwave radiances and Air-Sea Essential Climate Variable (AS-ECV) geophysical retrievals originating from passive spaceborne sensors. The geophysical retrievals include: sea-surface temperature, near-surface ocean wind speed and direction, columnar atmospheric water vapor, columnar cloud liquid water, and sea-surface rain rate. In total, RSS generates microwave radiance and AS-ECV data from 14 microwave radiometers that span a time period of 35+ years. Consistent calibration procedures and retrieval methods have been applied during the data processing to ensure these datasets are suitable for climate research. Geophysical retrievals from two new sensors will be added to the RSS data repository in the 2023 to 2024 timeframe: GOSAT-GW AMSR3 and WSF-M MWI. The addition of these two microwave sensors, with their excellent spatial and temporal coverage, will extend the microwave AS-ECV climate data record (CDR) by up to ten years. In this presentation, we will present the intercalibration framework for integrating AS-ECVs from AMSR3 and MWI into the current CDR.

Historically, the RSS Radiative Transfer Model (RTM) developed for the SSMI sensor was the primary standard for inter-calibrating passive microwave radiances ranging from 6 to 89 GHz. Now, the calibration is tied to GMI onboard GPM. GMI’s unique design enabled absolute calibration of its antenna temperatures and brightness temperatures using various known calibration parameters, including hot load and cold sky antenna temperature tie points, coefficients that describe the non-linearity between sensor counts and antenna temperatures, and cold space spillover. In this presentation, we will describe how the GMI radiances will be used to calibrate AMSR3 and MWI. GMI’s 65-degree inclined orbit is not sun-synchronous, and it allows tight collocation windows with other satellite sensors. This is particularly useful for calibrating AMSR3 and MWI day and night observations. For a set of collocations, a double difference method will be used to find the AMSR3 and MWI calibration parameters that best match the GMI absolutely-calibrated radiances. We will present the inter-calibration process in detail, including the optimization of calibration parameters, the AS-ECVs used in the RTM in order to correct for small differences between sensors, and cases where the sensor radiance channel is not present in GMI.

How to cite: Wentz, K., Ricciardulli, L., Meissner, T., and Wentz, F.: Extending the Air-Sea Essential Climate Variables CDR with AMSR3 and MWI Microwave Radiances, EGU General Assembly 2023, Vienna, Austria, 23–28 Apr 2023, EGU23-2966, https://doi.org/10.5194/egusphere-egu23-2966, 2023.

EGU23-3507 | PICO | CL5.5

Climatology of day-to-day temperature changes in Europe 

Radan Huth and Tomáš Krauskopf

An important aspect of temperature variability is day-to-day temperature difference. Only a few previous studies have looked into its climatology. It is known that the distribution of day-to-day temperature changes in central Europe is asymmetrical, with large temperature increases prevailing over large decreases in winter, and vice versa in summer. A detailed study into the climatology of day-to-day temperature change and its properties is still missing, however.

This study attempts to fill in this knowledge gap. We present climatology of the mean absolute value of day-to-day temperature changes, its standard deviation, values of extreme quantiles, and skewness for Europe in winter and summer. We examine several datasets, including station data (from ECA&D database), an interpolated gridded dataset (E-OBS), and reanalyses (NCEP-NCAR, JRA55, and 20CR). The comparison of various types of datasets allows us to identify their specific behaviour, pointing to potential errors and biases.

This contribution is a part of our efforts to describe and understand long-term changes in short-term (intraseasonal) atmospheric variability and their mechanisms.

How to cite: Huth, R. and Krauskopf, T.: Climatology of day-to-day temperature changes in Europe, EGU General Assembly 2023, Vienna, Austria, 23–28 Apr 2023, EGU23-3507, https://doi.org/10.5194/egusphere-egu23-3507, 2023.

EGU23-3571 | ECS | PICO | CL5.5

Evaluation of Climate Data from ECMWF Reanalyses over Siberia and the Russian Far East 

Andrew Clelland, Gareth Marshall, and Robert Baxter

Reanalysis data provide a complete picture of the past climate by re-running previous forecasts using modern methods and assimilating with observations. In this work three reanalysis datasets from the European Centre for Medium-Range Weather Forecasts (ECMWF), ERA-Interim, ERA5 and ERA5-Land, were validated against data from 29 meteorological stations across Siberia and the Russian Far East. ERA5 offers improved spatial and temporal resolutions compared to ERA-Interim, as well as starting twenty years earlier in 1959 and being continually updated to the present day with little delay. ERA5-Land replays the land component of ERA5 over an improved 9km spatial resolution and the dataset begins in 1950. The validation was conducted at daily, monthly, seasonal and annual timescales for seven climate variables first to 1979, then additionally to 1959 for ERA5 and ERA5-Land. We found that the snow depth values in ERA5 are only assimilated with meteorological station data from 1992 onwards, leading to significant and inhomogeneous overestimations before this time. As ERA5-Land uses the ERA5 values as its boundary conditions, the snow depth values in this dataset are further from the observations. The mean sea level pressure in the reanalyses is closest to those from the meteorological stations. The daily minimum 2-metre air temperature is noticeably weak during the summer months, however on broader timescales the reanalyses perform very well for the minimum, average and maximum temperatures. Total precipitation and wind speed consistently have the lowest correlations at all temporal and spatial resolutions. Despite the increased spatial resolution, we found no improvement to using ERA5-Land over ERA5, however we would recommend using ERA5 over ERA-Interim due to the larger amount of data available.

How to cite: Clelland, A., Marshall, G., and Baxter, R.: Evaluation of Climate Data from ECMWF Reanalyses over Siberia and the Russian Far East, EGU General Assembly 2023, Vienna, Austria, 23–28 Apr 2023, EGU23-3571, https://doi.org/10.5194/egusphere-egu23-3571, 2023.

EGU23-3666 | PICO | CL5.5

Climate Data Record Derived from Hyperspectral Sounders on AQUA, S-NPP and NOAA 20 

Xu Liu, wan Wu, liqiao lei, Xiaozhen Xiong, and Qiguang yang

Climate products are typically derived by performing spatial and temporal averaging of level-2 products. It is a time-consuming process to generate level-2 data products since modern hyperspectral satellite sensors have millions of observations each day with thousands of spectral channels for each observation.  Additionally, differences in level-2 retrieval algorithms for different satellite sensors can lead to errors in the climate products. We have developed a Climate Fingerprinting Sounder Product (ClimFiSP), which is derived from spatiotemporally averaged level-1 hyperspectral radiances directly.  The ClimFiSP algorithm uses consistent radiative kernels and a robust spectral fingerprinting method. It provides accurate data climate data fusion products from multiple satellite sensors. It eliminates or reduces the errors due to inconsistent L2 algorithms. We have applied this method to both AIRS and CrIS (on SNPP and on NOAA 20) data and generated two decades climate data records for atmospheric temperature, water vapor, cloud, trace gases, and surface skin temperature.  The ClimFiSP are being transitioned to NASA data centers for routine generations level-3 products.

How to cite: Liu, X., Wu, W., lei, L., Xiong, X., and yang, Q.: Climate Data Record Derived from Hyperspectral Sounders on AQUA, S-NPP and NOAA 20, EGU General Assembly 2023, Vienna, Austria, 23–28 Apr 2023, EGU23-3666, https://doi.org/10.5194/egusphere-egu23-3666, 2023.

EGU23-3906 | PICO | CL5.5

Reducing biases and representation errors in the global historical insitu upper-air network 

Leopold Haimberger, Federico Ambrogi, and Ulrich Voggenberger

In preparation for the next generation Copernicus reanalysis ERA6, we aim at augmenting the global insitu upper-air dataset with additional data and metadata, in order to reduce observation and representation errors in those data. 

For all available data, the balloon drift is calculated from the available wind data information. Also the actual launch time is supplied for as many ascents as possible, to reduce representation errors. Results indicate that background departures (from ERA5) are almost uniformly reduced for temperature, humidity and wind, with strongest reductions near the extratropical jet streams, if balloon drift is taken into account. 

The data set also contains background departures, calculated offline, for data not assimilated in ERA5, which helps spotting spurious data episodes. Background departures were calculated with respect to ERA5, before 1940 a bias-adjusted version of the NOAA/CIRES/DOE reanalysis v3 was used as reference. For the first time, we also include ascents launched from ships. 

The background departures form the basis for comprehensive statistics-based adjustment of biases in temperature, wind direction and also humidity, using the RAOBCORE/RICH method. The corresponding software has been completely rewritten in python and has an improved handling of data gaps. 

Results from bias-adjusted records indicate realistic spatial trend heterogeneity and very good fit to reprocessed satellite data products. Background departures from ERA5 increase substantially when going back to the early 1950s and 1940s, even after bias adjustments,  but are still better than departures found when comparing to the 20th century reanalysis. 


How to cite: Haimberger, L., Ambrogi, F., and Voggenberger, U.: Reducing biases and representation errors in the global historical insitu upper-air network, EGU General Assembly 2023, Vienna, Austria, 23–28 Apr 2023, EGU23-3906, https://doi.org/10.5194/egusphere-egu23-3906, 2023.

EGU23-4090 | PICO | CL5.5 | Highlight

Changes in global wind patterns since the late 1700s from American whaling ship logbooks and reanalyses 

Caroline Ummenhofer, Timothy Walker, Bastian Münch, Neele Sander, Tyson George, and Milon Miah

Maritime weather data contained in U.S. whaling ship logbooks are used to assess historical changes in global wind patterns. We focus on unexploited caches of archival documentation, namely U.S. whaling logbooks of voyages spanning the period 1785 to 1910 from New England archives housed by the New Bedford Whaling Museum, Nantucket Historical Association, and Providence Public Library. The logbooks, often covering multi-year voyages around the globe, contain systematic weather observations (e.g., wind strength/direction, sea state, precipitation) at daily to sub-daily temporal resolution. The qualitative, descriptive wind recordings are quantified and compared with reanalysis products where applicable. They are also employed to help address contemporary questions in climate science, such as long-term shifts in position and strength of the Southern Hemisphere westerlies since the late 1700s, changes in characteristics of the subtropical high pressure systems (e.g., Azores High, Mascarene High) and associated circulation regimes in the 19th century, as well as changes in South Asian monsoon characteristics.

The historical records provide an important long-term context for changing maritime wind patterns in remote ocean regions lacking high-quality observational records. The project is predicated on historical climate data rescue and recovery through the extraction of data from under-utilised archived documentation, and advocating and facilitating the digitisation of such materials.

How to cite: Ummenhofer, C., Walker, T., Münch, B., Sander, N., George, T., and Miah, M.: Changes in global wind patterns since the late 1700s from American whaling ship logbooks and reanalyses, EGU General Assembly 2023, Vienna, Austria, 23–28 Apr 2023, EGU23-4090, https://doi.org/10.5194/egusphere-egu23-4090, 2023.

EGU23-5860 | ECS | PICO | CL5.5

Development of a daily gridded wind speed observation product using artificial intelligence in Spain 

Nuria P. Plaza Martin, Makki Khorchani, Cesar Azorin-Molina, Lihong Zhou, Zhenzhong Zeng, Borja Latorre, Sergio M. Vicente Serrano, Tim R. McVicar, Deliang Chen, and Jose A. Guijarro

Historical near-surface wind speed (NSWS; ~10 m above the ground) measurements from terrestrial weather stations are crucial for assessing NSWS changes and variability and its implications for various socioeconomic and environmental issues, such as wind energy. However, currently there is no all-Spain gridded NSWS observation product with higher spatial coverage than station-based wind series. A new methodological approach based on image reconstruction using artificial intelligence could help to solve this limitation. We use a partial convolutional neural network (PCNN) and station-based NSWS series from the Spanish Meteorological Agency (AEMET) to create a 0.1º daily gridded wind speed observation product over Spain for 1961-2021. The deep neural network is trained with wind data from the ERA5-Land reanalysis (at 9-km grid-spacing, ECMWF), and a mask where grid points with historical wind observations are identified. Thus, the 0.1º resolution wind distribution grid is treated as the pixel values of an image with the masked grid points being pixels to be reconstructed. The training process allows the PCNN model to learn the physical laws, such as momentum conservation, present as internal relationships between pixels in the reanalysis data. The learned laws were then implemented to estimate the wind speed of the masked grid points. During the training process, the PCNN model predictions are iteratively compared to the reanalysis data and improved according to the error (i.e., MAE or RMSE) between prediction and the original reanalysis data. Once trained, the model is applied to NSWS measurements in the target domain to predict wind at locations with no observations. The gridded NSWS product provides a high-resolution wind speed data for whole Spain that respects the available observations and reliably predict wind speed in unsampled places, which is useful to many applications requiring wind information.

How to cite: Plaza Martin, N. P., Khorchani, M., Azorin-Molina, C., Zhou, L., Zeng, Z., Latorre, B., Vicente Serrano, S. M., McVicar, T. R., Chen, D., and Guijarro, J. A.: Development of a daily gridded wind speed observation product using artificial intelligence in Spain, EGU General Assembly 2023, Vienna, Austria, 23–28 Apr 2023, EGU23-5860, https://doi.org/10.5194/egusphere-egu23-5860, 2023.

EGU23-8119 | ECS | PICO | CL5.5

Estimating exposure biases in early instrumental land surface temperature data 

Emily Wallis, Timothy Osborn, and Michael Taylor

Exposure biases are non-climatic changes in the surface air temperature record which were introduced due to changes in the way thermometers were protected from solar radiation. The possible presence of the exposure bias in early instrumental temperature datasets is a well-known issue, and the impact of changing thermometer exposures, particularly the transition between historic exposures and the Stevenson screen, has been explored by previous studies. However, despite this, very few adjustments have been made to account for the bias, with the exception of a handful of localised studies. As a result, the exposure bias still accounts for significant uncertainty in global surface air temperature compilations, such as HadCRUT5.

In this work we report an attempt to address the exposure bias for extratropical weather stations in a version of CRUTEM5 that has been extended back in time to 1781 (CRUTEM5_ext). We developed statistical models to predict the bias introduced by transitions from four main categories of historic exposure – open, wall-mounted, intermediate and closed – to the Stevenson screen. The models are based on an empirical analysis of the characteristics of the exposure bias observed in 20 parallel measurement studies, together with the temperature and radiation variables that were a priori expected to influence the magnitude of the bias in mean temperatures on a monthly timescale. Separately, we have compiled a database detailing the historic exposures in use at stations and the timing (or approximate timing when a precise time is not known) of the transition to the Stevenson screen. The statistical models, where robust, are then applied to the individual stations within CRUTEM5_ext to make adjustments for the exposure changes according to the database of historic exposures.

This presentation will outline the model development, give a brief overview of the evolution of thermometer exposures in use in the early instrumental period for extratropical stations, and will illustrate the impact the exposure bias adjustments have on the CRUTEM5_ext data. This work forms part of the NERC-funded GloSAT project (https://www.glosat.org/) which is developing a global surface air temperature dataset starting in 1781. Where appropriate, stations used to create the GloSAT dataset will be adjusted for the exposure bias using the models presented here. 

How to cite: Wallis, E., Osborn, T., and Taylor, M.: Estimating exposure biases in early instrumental land surface temperature data, EGU General Assembly 2023, Vienna, Austria, 23–28 Apr 2023, EGU23-8119, https://doi.org/10.5194/egusphere-egu23-8119, 2023.

EGU23-9774 | PICO | CL5.5

ERA5-Land: More than 7 decades of land surface consistency with timely updates 

Joaquin Munoz-Sabater, Gianpaolo Balsamo, Carlo Buontempo, Samantha Burgess, Hans Hersbach, John Hodkinson, Anna Mueller-Quintino, Raluca Radu, Iryna Rozum, and Sebastien Villaume

Reanalysis is a key activity within the Copernicus Climate Change Service (C3S), which is funded by the European Union Copernicus programme and implemented by the European Centre for Medium-Range Weather Forecasts (ECMWF). Currently, the latest generation of European Reanalysis, ERA5 and ERA5-Land, are available through the C3S Climate Data Store (https://cds.climate.copernicus.eu/). ERA5 provides hourly snapshots of the Earth's atmosphere, land surface and ocean waves from 1950 to present, thus providing a global view of the evolution of the Earth’s climate without temporal or spatial gaps for the last seven decades. The land surface component, although part of the ERA5 portfolio, contains few inconsistencies. For instance, significant regional steps between different production segments are present, compromising the reliability of long-term trends. In addition, ERA5 does not provide sufficient resolution for a large and growing number of land applications.

ERA5-Land was designed to overcome the above-mentioned shortcomings of the land branch of reanalysis. For instance, steps in the seam between production segments may be avoided by applying a long spin-up strategy for the initialization of each production segment. ERA5-Land is a unique dataset of its kind, providing a global scale description of the continental water and energy cycles through a series of 50 key surface variables, hourly at a spatial resolution of 9 km, from 1950 to present. ERA5-Land is driven by the near-surface meteorology of ERA5, and temperature is adjusted by considering the orographic differences between ERA5 and ERA5-Land numerical grids. The fidelity of ERA5-Land was assessed by comparing the main fields to a large number of available in-situ observations distributed along the world from 2000 onwards. The variables under analysis were soil moisture, snow depth, lake surface water temperature, river discharge, surface latent and sensible heat fluxes, and skin temperature. The results of the evaluation analysis suggested significant improvements of the ERA5-Land hydrological cycle in comparison to those of ERA5 and ERA-Interim.

The number of ERA5-Land users is counted in thousands. Very recently and similarly to ERA5T, the ERA5-Land-T facility was enabled, which means that preliminary updates are made available daily with only 5-days delay with respect to real time. The final quality-checked product is published with 2-3 month delay with respect to real time. ERA5-Land-T is the result of a requirement of users needing more recent data and opens the door to new applications such as flood forecasting or biomass monitoring.

In this paper the main characteristics of ERA5-Land dataset will be highlighted, its main strengths and weaknesses, as well as the current status.

How to cite: Munoz-Sabater, J., Balsamo, G., Buontempo, C., Burgess, S., Hersbach, H., Hodkinson, J., Mueller-Quintino, A., Radu, R., Rozum, I., and Villaume, S.: ERA5-Land: More than 7 decades of land surface consistency with timely updates, EGU General Assembly 2023, Vienna, Austria, 23–28 Apr 2023, EGU23-9774, https://doi.org/10.5194/egusphere-egu23-9774, 2023.

EGU23-9977 | ECS | PICO | CL5.5

A NASA GISTEMP Observational Uncertainty Ensemble: Regional and Monthly Uncertainty 

Nathan Lenssen, Gavin Schmidt, Michael Hendrickson, Peter Jacobs, Matthew Menne, and Reto Ruedy

The historical global temperature record is an essential data product for quantifying the variability and change of the Earth system. In recent years, better characterization of observational uncertainty in global and hemispheric trends has become available, but the methodologies are not necessarily applicable to analyses at smaller regional areas, or monthly means, where station sparsity and other systematic issues contribute to greater uncertainty.

This work details a gridded uncertainty ensemble of historical temperature anomalies from the Goddard Institute for Space Studies (GISS) Surface Temperature product (GISTEMP) product. This ensemble characterizes the complex spatial and temporal correlation structure of uncertainty in gridded historical temperature, enabling proper uncertainty propagation for climate and social science at regional and monthly scales. This work details the methodology for generating the uncertainty ensemble, key statistics of the uncertainty evolution over space and time, and provides best practices for using the uncertainty ensemble in future studies. Summary statistics from the uncertainty ensemble are in good agreement with production GISTEMP.

Two applications of the uncertainty ensemble are also presented. First, the warmest year on record is shown to most likely be 2016 with a 53.2% chance and 2020 as the second most likely with a 44.4% chance. Second, it is shown that the arctic is warming 2.5 - 5 times faster than the globe, significantly faster than the regularly quoted twice as fast.

How to cite: Lenssen, N., Schmidt, G., Hendrickson, M., Jacobs, P., Menne, M., and Ruedy, R.: A NASA GISTEMP Observational Uncertainty Ensemble: Regional and Monthly Uncertainty, EGU General Assembly 2023, Vienna, Austria, 23–28 Apr 2023, EGU23-9977, https://doi.org/10.5194/egusphere-egu23-9977, 2023.

EGU23-10640 | ECS | PICO | CL5.5

Secure Consistency of COMS/MI and GK-2A/AMI Shortwave Radiation product based on machine learning 

Jongho Woo, Kyung-soo Han, Sungwon Choi, Noh-hun Seong, Daeseong Jung, Suyoung Sim, Nayeon Kim, and Eunha Sohn

 Satellite-based solar radiation data is widely used to monitor global climate and environmental changes and is also actively used to analyze weather data and predict particulate matter. Korea can continuously retrieval solar radiation in the observation area due to the generational shift of COMS (Communication, Ocean and Meteorological Satellite)/MI (Meteorological Imager sensor) and GK-2A (GEO-KOMPSAT-2A)/AMI(Advanced Meteorological Imager sensor). However, The quality of each solar radiation output is different due to difference between the algorithms, input data and resolution. Therefore, it is possible to produce a climate resource map for the Korean Peninsula for continuous climate change monitoring by analyzing the error characteristics between the solar radiation of COMS/MI and GK-2A/AMI and expanding the retrieval period through correction between the two products. In this study. We analyzed the error characteristics of the two satellites compare to the meteorological observation data of Korea and the satellite CERES solar radiation data in overlapping periods. As a result of error analysis, the RMSE of COMS/MI was 85.6 (W/m2), lower than the RMSE of GK-2A/AMI, 95.6 (W/m2). Considering the solar radiation data error characteristics of these satellites, a correction model based on machine learning techniques was created to secure the consistency of solar radiation data. When this was verified with in situ data for a period of 10 years, RMSE was 89.21 (W/m2) and Bias was 17.39 (W/m2), which was stable in the temporal consistency test, and the annual increase in solar radiation on the Korean Peninsula was confirmed.


※ This work was supported by the "Graduate school of Particulate matter specialization." of Korea Environmental Industry & Technology Institute grant funded by the Ministry of Environment, Republic of Korea.

How to cite: Woo, J., Han, K., Choi, S., Seong, N., Jung, D., Sim, S., Kim, N., and Sohn, E.: Secure Consistency of COMS/MI and GK-2A/AMI Shortwave Radiation product based on machine learning, EGU General Assembly 2023, Vienna, Austria, 23–28 Apr 2023, EGU23-10640, https://doi.org/10.5194/egusphere-egu23-10640, 2023.

EGU23-11545 | ECS | PICO | CL5.5

Trends of sea breezes over the Western Mediterranean basin,1981-2021: are they affected by large-scale atmosphericcirculation changes? 

Shalenys Bedoya-Valestt, Cesar Azorin-Molina, Lorenzo Minola, Luis Gimeno, and Miguel Andres-Martin

Western Mediterranean sea-breezes are becoming more frequent during winter and less frequent in summer. Further, observed trends in the mean wind speed show a weakening of the sea-breezes in all time scales. These changes could have direct implications for the air pollution dispersion in winter, or for the hydrologic cycle and desertification due to the sea-breeze thunderstorm losses in summer; among other environmental effects.  The drivers and physical mechanisms that underpin long-term sea-breeze changes are yet to be understood, but the response of the atmospheric circulation patterns to the anthropogenic driven warming might be one of the main triggers for the increased occurrence over the Western Mediterranean basin. Recent studies focused on the Eastern Iberian Peninsula suggest that more frequent anticyclonic circulations might be behind the increase of sea-breeze occurrence in winter. This work aims to advance on the likely causes driving sea-breeze changes by investigating their relationship with the Jenkinson and Collison weather type classification. To do so, we will analyze homogenized hourly wind speed data from 40 weather stations across the Western Mediterranean basin (i.e., Spain, France, Italy, Tunisia and Algeria) for 1981-2021. Sea-breeze episodes will be identified by applying a robust automated algorithm based on objective criteria considering the large- and local-scale conditions. The sign, magnitude and statistical significance of the trends in the occurrence, wind speed and gusts of Western Mediterranean sea-breezes will be quantified, as well as for the Jenkinson and Collison weather type regimes. Finally, we will estimate the relationship between these sea-breeze parameters and the synoptic weather classification. This study will provide new knowledge about the historical changes and multidecadal variability of sea-breezes across the Western Mediterranean basin and its response to global atmospheric circulation changes.

How to cite: Bedoya-Valestt, S., Azorin-Molina, C., Minola, L., Gimeno, L., and Andres-Martin, M.: Trends of sea breezes over the Western Mediterranean basin,1981-2021: are they affected by large-scale atmosphericcirculation changes?, EGU General Assembly 2023, Vienna, Austria, 23–28 Apr 2023, EGU23-11545, https://doi.org/10.5194/egusphere-egu23-11545, 2023.

EGU23-11968 | PICO | CL5.5

Using the GTO-ECV total ozone and GOP-ECV ozone profile climate data records for analyzing global and regional trend patterns 1995-2021 

Melanie Coldewey-Egbers, Diego Loyola, Klaus-Peter Heue, Christophe Lerot, Michel van Roozendael, Richard Siddans, Barry Latter, and Brian Kerridge

In this study, we analyze global and regional patterns of total and height-resolved ozone trends 1995-2021 based on two data records: (1) the GOME-type Total Ozone Essential Climate Variable (GTO-ECV) generated in the framework of the European Union project Copernicus Climate Change Service (C3S) and (2) the GOME-type Ozone Profile Essential Climate Variable (GOP-ECV) developed in the framework of the European Space Agency’s Climate Change Initiative (ESA-CCI) ozone project. Both GTO-ECV and GOP-ECV combine measurements from a series of nadir-viewing ultra-violet satellite sensors of the GOME-type including GOME, SCIAMACHY, OMI, GOME-2A, and GOME-2B. On top of that, GTO-ECV incorporates also GOME-2C and TROPOMI/Sentinel-5P measurements. For the retrieval of the total columns the GOME Direct Fitting version 4 (GODFIT_V4) algorithm is used, and for the retrieval of ozone profiles the Rutherford Appleton Laboratory (RAL) scheme is applied. Both the total columns and the profiles from the single sensors are merged into two homogeneous long-term gridded level-3 data records, carefully taking into account and reducing inter-sensor differences. As a final step, the ozone profile record is homogenized with respect to the well-established GTO-ECV total column record in order to achieve consistency between both products. The homogenization relies on an altitude-dependent scaling of the profiles in order to match the total column product. We apply a standard multiple linear least-squares regression to both longitudinally-resolved data records and present estimates of the long-term trend and the correlations with explanatory variables such as the Quasi-Biennial Oscillation, the solar cycle, or the El Nino-Southern Oscillation index. Of particular interest are the search for signs of ozone recovery related to decreasing amounts of Ozone Depleting Substances, the evaluation of the long-term evolution in the lower stratosphere, and the investigation of regional structures in the observed trend patterns.

How to cite: Coldewey-Egbers, M., Loyola, D., Heue, K.-P., Lerot, C., van Roozendael, M., Siddans, R., Latter, B., and Kerridge, B.: Using the GTO-ECV total ozone and GOP-ECV ozone profile climate data records for analyzing global and regional trend patterns 1995-2021, EGU General Assembly 2023, Vienna, Austria, 23–28 Apr 2023, EGU23-11968, https://doi.org/10.5194/egusphere-egu23-11968, 2023.

Reanalysis products are becoming an increasingly popular option for monitoring climate due to (1) their comprehensive assessment of Earth processes (providing multiple variables of different domains), (2) their absence of gaps, (3) their global spatial coverage, and (4) their long temporal coverage, with some products extending back to the 1950s. However, reanalysis estimates have larger uncertainties than satellite products and may also present stability issues, so the fitness of each reanalysis variable for monitoring a particular climate application needs to be assessed. Reanalysis datasets combine numerical models and observations with a data assimilation scheme that controls the observations assimilated and their weight in the model. Both uncertainty and stability of reanalysis datasets strongly depend on this assimilation scheme and the number of observations available.  

Producing a data assimilation scheme that optimizes both uncertainty and stability is not straightforward as both properties have opposing requirements. On the one hand, the uncertainty of reanalysis estimates is reduced by increasing the number (and weight) of observations assimilated. This is typically achieved in most recent years due to the abundance of satellite and in-situ observations. On the other hand, the former approach creates a stability challenge. Both the satellite and in-situ observations available exponentially increase in time, so artificial trends and discontinuities can be potentially introduced in the climate data record. The magnitude of these trends/discontinuities depends on the variable evaluated (observations are assimilated only for some variables), the change in the number of observations in time, the spatial region (some observations are unevenly distributed), and the weight given to the observations. All these factors need to be evaluated to determine whether the uncertainty, and particularly the stability, of a reanalysis product is adequate for monitoring a specific climate variable based on the requirements established by GCOS. 

In this study, we evaluate the data assimilation scheme of the most well-known atmospheric reanalyses (ERA5, JRA-55, MERRA-2) and the land component of ERA5 (ERA5-Land). We focus on two variables with different assimilation schemes: snow cover, a variable with direct assimilation of in-situ and satellite observations, and snow albedo, a variable without direct assimilation of observations that depends strongly on the snow data assimilated. The products evaluated also present different assimilation schemes: ERA5 and JRA-55 assimilate an increasing number of snow observations in time, ERA5-Land does not directly assimilate observations but is indirectly forced by ERA5 fields, and MERRA-2 assimilates precipitation observations but not snow observations. We evaluate their fitness for climate monitoring by using in-situ snow depth observations as a reference to quantify their uncertainty and stability. We also inter-compare their global/regional snow cover and snow albedo trends to evaluate their stability globally. 

How to cite: Urraca, R. and Gobron, N.: How much is the stability of reanalysis products affected by the increasing number of observations assimilated?, EGU General Assembly 2023, Vienna, Austria, 23–28 Apr 2023, EGU23-12325, https://doi.org/10.5194/egusphere-egu23-12325, 2023.

EGU23-12790 | PICO | CL5.5

Homogenization of extreme temperatures in Chile with GNSSfast 

ricardo vasquez, Enric Aguilar, and Claudia Villarroel

In Chile, in the last 20 years, significant changes have led to a notoriously warmer climate, which translates into meteorological records being recorded every year. For this reason, it is increasingly necessary for the National Meteorological Service to have reliable data to respond to the information needs of society and stakeholders.

Changes and modifications in meteorological stations, such as relocations, instruments, and environmental changes, can alter the estimation of means and long-term trends. Data homogenization consists of correcting these abrupt changes that are not associated with climate through different statistical methods to obtain reliable estimates. The most widely used homogenization methods are the relative ones, consisting of creating reference series from nearby stations, assuming they have the same long-term climatic signal.

In this work, the changing points of daily series of extreme temperatures were evaluated for 17 meteorological stations in Chile in the period 1961-2021. The segmentation method available in the R GNSSfast library was applied to the difference between a candidate series and a reference series created from neighboring stations. The correction of the inhomogeneous series was done through the difference in the daily median of the different segments, taking the most current period as a reference.

A total of 15 changepoints were detected in both minimum and maximum temperatures for 11 measurement stations, where 3 and 4 points were explained with dates of changes in the metadata, respectively. The most significant differences in the trend estimation with and without homogenization were observed in the weather stations of the country's central zone.

How to cite: vasquez, R., Aguilar, E., and Villarroel, C.: Homogenization of extreme temperatures in Chile with GNSSfast, EGU General Assembly 2023, Vienna, Austria, 23–28 Apr 2023, EGU23-12790, https://doi.org/10.5194/egusphere-egu23-12790, 2023.

EGU23-14403 | PICO | CL5.5

Progress on FCDR of MWRI onboard FY-3 Series Satellites 

Shengli Wu, Ling Sun, Fenglin Sun, Songyan Gu, and Peng Zhang

A long time series fundamental climate data record (FCDR) have been developed using operational L0 data from Microwave Radiation Imager (MWRI) onboard FengYun-3 series satellites. This FCDR contains re-calibrated brightness temperature data from three MWRIs mounted on FY-3B/3C/3D satellites from 2010 to 2021. Corresponding to the very unique on-orbit calibration system design of MWRI, the calibration error of the sensors may come from the hot-load reflector back-lobe, hot-load reflector emissivity, hot-load efficiency, cold reflector RFI, and receiver non-linearity. Therefore, a comprehensive error analysis is performed by using the double-difference (DD) method. GPM Microwave Imager (GMI) data are also used as a reference sensor. Simultaneous Conical Overpassing (SCO) method is selected to sample the paired data from two satellites. Based on temporal and spatial SCO rules, the required DD thresholds over a stable ocean surface or rain forest is determined and the optimized re-calibration parameters are derived from the multiple iterations. After reprocessing, the obvious improvement for all channels from 10GHz to 89GHz is shown in the root mean squared error (RMSE) of MWRI with respect to GMI which is significantly reduced from 5K to 1K. The RMSE of all 3 instruments and all channels is decreased to less than 1.5K. Most of the channels' RMSE is around 1K or even less. The bias time series between MWRI and GMI also shows very stable from 10GHz/18GHz.

Recently, some typical climate parameters retrieval using FCDR of MWRI have been done by different researchers, including sea ice concerntration, soil moisture, soil frozen and thaw detection, land surface microwave emissivity. The results are very encourage compared with operational MWRI datasets.

How to cite: Wu, S., Sun, L., Sun, F., Gu, S., and Zhang, P.: Progress on FCDR of MWRI onboard FY-3 Series Satellites, EGU General Assembly 2023, Vienna, Austria, 23–28 Apr 2023, EGU23-14403, https://doi.org/10.5194/egusphere-egu23-14403, 2023.

EGU23-15301 | ECS | PICO | CL5.5

Impact of Cloud Changes on the Radiation Budget Under Global Warming 

Hyebin Song, Yong-Sang Choi, and Hyoji Kang

Clouds play a significant role in our climate system by influencing radiative balances. Global clouds, by changing the amount and optical property, alter the amount of the net radiation by trapping outgoing longwave radiation or reflecting the incoming solar radiation. Therefore, under global warming, the future cloud change and its impact on the radiation budget is a question at issue. This study examined the trend in cloud radiative effect in current models and satellite observations. We targeted Total Cloud Fraction (TCF) and net radiation using the Coupled Model Intercomparison Project-6 (CMIP6) for 1950-2100 over the globe. We utilized historical data (1950-2014) and the shared socio-economic pathway (SSP) (2015-2100) data. This 1950-2100 period spans a period from the rapid growth point in global surface temperature relative to 1850-1900 according to the IPCC AR6 to the future climate provided by the SSP scenarios. The modeled trends of TCF and net radiation are calculated based on linear regression analysis. As a result, net radiation increases by 0.16 W/m2/decade with −0.14 %/decade changing TCF over the globe. In more detail, TCF changes an average of −0.15±0.8 %/decade and −0.20±1.6 %/decade in low and middle latitudes, whereas TCF increases by 0.08±2.5 %/decade in high latitudes for both hemispheres. On the other hand, the net radiation increases an average of 0.1±0.9 W/m2/decade, 0.22±1.06 W/m2/decade, and 0.22±1.38 W/m2/decade in low, middle, and high latitudes for both hemispheres. Therefore, the decrease in TCF may have allowed more solar radiation into the earth, contributing to surface warming in mid and low latitudes. The clear cloud radiative effects will be investigated by the difference between cloudy and clear-sky radiation trends. In high latitudes where surface albedo is high, the increase in TCF does not necessarily mean a decrease in net radiation although increased clouds reflect more incident solar radiation. This is because the reduction of sea ice albedo has a larger effect on the net radiation than the cloud increase. These model results were validated by the Clouds and the Earth’s Radiant Energy System (CERES) satellite data for 2001-2021. The correlation coefficients of TCF between CMIP6 and CERES are an average of −0.05, 0.32, and 0.2 in low, middle, and high latitudes for both hemispheres. Net radiation shows the correlation coefficients as an average of −0.18, 0.41, and 0.26 in low, middle, and high latitudes for both hemispheres. We will show cloud trends for each level (low, middle, and high) using CloudSat and the Cloud-Aerosol Lidar and Infrared Pathfinder Satellite Observation (CALIPSO) data during 2007-2015 in order to investigate the contribution of vertical clouds to each zonal mean net radiation trend. This study would contribute to the enhancement of cloud parameterization in climate models.

How to cite: Song, H., Choi, Y.-S., and Kang, H.: Impact of Cloud Changes on the Radiation Budget Under Global Warming, EGU General Assembly 2023, Vienna, Austria, 23–28 Apr 2023, EGU23-15301, https://doi.org/10.5194/egusphere-egu23-15301, 2023.

EGU23-15322 | PICO | CL5.5

An observational record of global near surface air temperature change over land and ocean from 1781 to present 

Colin Morice, David Berry, Richard Cornes, Kevin Cowtan, Thomas Cropper, John Kennedy, Elizabeth Kent, Nick Rayner, Timothy Osborn, Michael Taylor, Emily Wallis, and Jonathan Winn

We present a new data set of air temperature change across land and ocean extending back to the late-18th century. This new data set uses marine air temperature observations rather than the sea surface temperature measurements typically used by pre-existing data sets. This allows the new data set to extend further into the past than existing instrumental temperature records, which typically have start dates in the mid-to-late 19th century. The new data set brings together advances in understanding of measurement biases affecting all-day marine air temperature observations with a new assessment of the effects of non-standard thermometer enclosures used at land meteorological stations in the early instrumental record. A further innovation is the use of kriging to obtain localised temperature estimates that allow land air temperature records to be converted into anomalies even for stations without observations during the baseline period. Global and hemispheric series show close agreement with those based on sea-surface temperature for much of the overlapping period of their records, some of the interesting differences will be presented. This data set has been developed under the GloSAT project (https://www.glosat.org/).

How to cite: Morice, C., Berry, D., Cornes, R., Cowtan, K., Cropper, T., Kennedy, J., Kent, E., Rayner, N., Osborn, T., Taylor, M., Wallis, E., and Winn, J.: An observational record of global near surface air temperature change over land and ocean from 1781 to present, EGU General Assembly 2023, Vienna, Austria, 23–28 Apr 2023, EGU23-15322, https://doi.org/10.5194/egusphere-egu23-15322, 2023.

EGU23-15951 | PICO | CL5.5

Development of a Quasi-Global Fundamental Climate Data Record for Observations from Geostationary Satellites 

Rob Roebeling, Viju John, Joerg Schulz, Jaap Onderwaater, Oliver Sus, Ken R. Knapp, Andrew Heidinger, Tasuku Tabata, Arata Okuyama, Frank Ruethrich, Paul Poli, Mike Grant, Roope Tervo, and Timo Hanschmann

The utilisation of observations of past, present, and future geostationary satellites for climate monitoring is a challenge. Since the late 1970s, space agencies operated up to 50 geostationary satellite missions with a variety of instrumentation. Merging these observations in a quasi-global geostationary 'ring' data record is essential for the provision of satellite-based data records of Essential Climate Variables (ECVs). EUMETSAT is engaged in data rescue, uncertainty characterisation, recalibration, and harmonisation of these observations and aims at the provision of the data to users on its joint EUMETSAT-ECMWF cloud infrastructure the so called European Weather Cloud and the EUMETSAT Data Store. The process of preparing satellite data for climate monitoring and analysis - such as undertaken by WCRP’s project GEWEX - is tedious and only recently being recognised as fundamental first step in preparing records ECVs from these data. 

Past and present geostationary data come with the possibility of unforeseen radiometric, geometric, and metadata anomalies. These anomalies may be related to the instrument or the data processing. EUMETSAT developed a system that performs an automatic anomaly analysis to the observations of past and present Meteosat and JMA satellites. The system is able to detect the most common types of anomalies with a high probability of detection and low false alarm rate. The anomalies are stored in a data base so as to inform downstream processing. As the anomalies are flagged on a pixel-by-pixel basis the loss of data is kept to a minimum.

EUMETSAT recalibrated its anomaly screened infrared channel observations from MVIRI on Meteosat First Generation (MFG) and SEVIRI on Meteosat Second Generation (MSG) measurements against IASI, AIRS, and HIRS measurements. The recalibration improved the radiometric accuracy of MVIRI and SEVIR to less than 0.5 K. Such improvements allow the seamless use of these observations for the retrievals of ECVs data records from geostationary orbit covering more than 40 years. Similarly, EUMETSAT applied its recalibration approach to the instruments operated on JMA’s geostationary satellites, resulting in similar improvements as made for the Meteosat satellites. Regarding satellite data quality, first steps have been made to provide recalibrated data with quantitative uncertainty estimates, as developed in the framework of the EU-H2020 FIDUCEO project. Such estimates add another dimension of quality information that is essential to make a data record a true climate data record.  With the aim to close the geostationary 'ring', EUMETSAT and NOAA now started applying the methods presented above to the US geostationary sensor data as well.

Once available, the individual time-series of recalibrated geostationary satellite data of the three collaborating organisations (EUMETSAT, JMA, and NOAA) will be quality controlled, cross-calibrated and merged into a single geostationary ‘ring’ product. Hereto the methods developed by the ISCPP-NG will be used. The collaborating organisations plan to use the cloud computing infrastructure to work on the data that are distributed over three continents.

How to cite: Roebeling, R., John, V., Schulz, J., Onderwaater, J., Sus, O., Knapp, K. R., Heidinger, A., Tabata, T., Okuyama, A., Ruethrich, F., Poli, P., Grant, M., Tervo, R., and Hanschmann, T.: Development of a Quasi-Global Fundamental Climate Data Record for Observations from Geostationary Satellites, EGU General Assembly 2023, Vienna, Austria, 23–28 Apr 2023, EGU23-15951, https://doi.org/10.5194/egusphere-egu23-15951, 2023.

EGU23-16205 | PICO | CL5.5

Metop ASCAT soil moisture trends: Mitigating the effects of long-term land cover changes 

Sebastian Hahn, Wolfgang Wagner, Oto Alves, Pavan Muguda Sanjeevamurthy, Mariette Vreugdenhil, and Thomas Melzer

The Satellite Application Facility on Support to Operational Hydrology and Water Management (H SAF) is providing surface soil moisture data record products based on a change detection technique applied to the Advanced Scatterometer (ASCAT) on-board the series of Metop satellites. At the moment two of the three Metop satellites are still operational (Metop-B and Metop-C), while the first satellite (Metop-A), launched in 2007, completed its mission in November 2021. Thus, the latest ASCAT surface soil moisture data record product covers a period of more than 15 years (2007-2022).

First analysis of long-term trends in the H SAF ASCAT surface soil moisture data record product have indicated strong anomalies for specific regions around the globe. Trend similarities have been found compared to other data sets such as soil moisture information provided by the ERA5 land surface model. However, certain soil moisture anomaly pattern did not match spatially or in their trend direction. It has been observed that land cover changes contribute to the overall ASCAT backscatter signal with a noticeable impact on the retrieved soil moisture information especially over longer time periods (>10 years). Most notably are areas with slowly changing ground conditions such as growing cities or regions suffering deforestation.

In this study we want to present a new method to mitigate the effects of long-term land cover changes based on a regular re-calibration of the dry and wet backscatter reference. It is important to address and remove this non-climatic effects from the surface soil moisture data record products to correctly detect and monitor climate extremes.

How to cite: Hahn, S., Wagner, W., Alves, O., Muguda Sanjeevamurthy, P., Vreugdenhil, M., and Melzer, T.: Metop ASCAT soil moisture trends: Mitigating the effects of long-term land cover changes, EGU General Assembly 2023, Vienna, Austria, 23–28 Apr 2023, EGU23-16205, https://doi.org/10.5194/egusphere-egu23-16205, 2023.

EGU23-2381 | PICO | CL5.6

The performance of scientific, indigenous, and hybrid weather forecasts: Systematic evaluation and farmers’ perception in Bangladesh 

Samuel Sutanto, Spyridon Paparrizos, Uthpal Kumar, Dilip Datta2, and Fulco Ludwig

Access to reliable and skillful weather information could assist smallholder farmers in Bangladesh to reduce their vulnerability to rainfall variability and extremes. The available weather forecast information, however, is still limited in the provision of daily location-specific weather information for smallholder farmers in Bangladesh. Because of this reason, the use of local forecasts is a more favorable and affordable way of accessing weather information for many farmers in low-latitude developing countries. In the WATERAPPscale project, we have initiated a climate information service that provides timely and location-specific weather forecasts for smallholders and established 16 farmer’s weather schools across Bangladesh, where training on interpretation of scientific forecasts (SF), collection of local forecasts (LF) data, and sharing forecast information took place. This study aims to systematically evaluate the performance of the SF and LF used by farmers, by applying a dichotomous method to distinguish yes/no rainfall events. The results were compared with farmers’ perception of the forecast skills. In addition, the skill of a simple hybrid forecast (HF), which is an integrated system of SF and LF, was assessed. The SF and LF data were obtained from the meteoblue hindcast and from the questionnaires, respectively. This study used ERA5 and ground observation datasets as benchmarks for the weather forecasts. Results show that overall, the LF has slightly higher skill than the SF when compared to the ERA5 dataset. The forecast performance, however, reduces by almost half when the ground-based observation is used instead of ERA5, associated with a high false alarm. The evaluation results, however, are contradictory to the farmers’ perception that SF has a much higher performance than LF. Combining the SF and LF into a simple HF generates higher skill than any single forecast alone, which highlights the necessity to develop a hybrid forecast that combines scientific and indigenous weather forecasting for farm decision-making. The developed HF system will deliver a reliable forecast, trustworthy, and conserved indigenous knowledge that has been passed down from generation to generation.   

How to cite: Sutanto, S., Paparrizos, S., Kumar, U., Datta2, D., and Ludwig, F.: The performance of scientific, indigenous, and hybrid weather forecasts: Systematic evaluation and farmers’ perception in Bangladesh, EGU General Assembly 2023, Vienna, Austria, 23–28 Apr 2023, EGU23-2381, https://doi.org/10.5194/egusphere-egu23-2381, 2023.

EGU23-3613 | ECS | PICO | CL5.6 | Highlight

Opening the ‘black-box’ of climate risk assessments for real estate portfolios: lessons from The Netherlands 

Timo Kelder, Hasse Goosen, Jan Kadijk, and Felix van Veldhoven

The real estate sector is in the spotlight of EU regulations given its high environmental impact. Technical screening criteria were established, and organisations now need to align with the EU Taxonomy. As these organisations often lack climate change expertise, a large number of (often commercial) providers have developed different methods to support the real estate sector in assessing physical climate risk. This created the challenge of transparency, the lack of which limits trust and the ability to improve, compare and combine the results of different assessments: the ‘black-box’ approaches.

In an attempt to ‘open the black box’ in the Netherlands, a large consortium of financial institutions, knowledge institutes, consultants and governments has developed a ‘Framework for Climate Adaptive Buildings’. We will present this framework with the aim of laying the foundations for a common language and a level playing field for climate adaptation in the built environment. The framework combines an estimation of climate threats to the surroundings of buildings with the vulnerability of the building itself to identify appropriate adaptation measures. We will discuss the process of developing this framework, which featured extensive end-user involvement and co-production. Much emphasis was placed on the comparability and reproducibility of the resulting climate risk assessments by referring to freely available, national-level climate data, with transparency about the underlying methods.

Climate service providers can use the framework as a starting point and build upon it with their existing approaches. As such, the framework ensures a level playing field for climate risk assessments for the real estate sector for Dutch assets. Upscaling the framework to the wider EU region is of great interest, as many investors have assets in multiple countries. A large challenge is the trade-off between comparable EU-wide datasets or less comparable but more reliable local data sources. We will discuss this challenge based on our experiences through the H2020 REACHOUT project before concluding with the takeaways from both the Dutch Framework for Climate Adaptive Buildings and the REACHOUT project.

How to cite: Kelder, T., Goosen, H., Kadijk, J., and van Veldhoven, F.: Opening the ‘black-box’ of climate risk assessments for real estate portfolios: lessons from The Netherlands, EGU General Assembly 2023, Vienna, Austria, 23–28 Apr 2023, EGU23-3613, https://doi.org/10.5194/egusphere-egu23-3613, 2023.

EGU23-5225 | PICO | CL5.6

Impacts of climate change on temporal fragmentation of energy demand in Europe 

Hajar Filahi, Hiba Omrani, Philippe Drobinski, and Sandra Claudel

The energy demand will potentially be affected by climate change in the future. The heating needs are expected to decrease while the cooling needs are expected to increase under projected future global warming. The question addressed in this work in the impact and the quantification of this changes on the temporal fragmentation of energy demand during winter and summer. This fragmentation creates a need for flexibility in energy production which constitutes a challenge for energy systems. In this work, the question is addressed by exploiting a biais-corrected and downscaled climate projections from CMIP6 simulations using a statistical method at a spatial resolution of 0.25° x 0.25° over Europe. Ten variables were used to estimate the main change on energy demand related to heating degree days (HDD) and cooling degree days (CDD) under four scenarios (ssp1-2.6, ssp2-4.6, ssp3-7.0 and ssp5-8.5). The results showed a large decrease of HDD over Europe and an increase of CDD under all of scenarios ssp considered in this work. The analyses of the heating and air conditioning period duration and frequency showed a fragmentation of the periods of use of heating during winter in the future which can lead potentially to a fragmentation of energy demand related to heating. On the other hand, the periods of use of air conditioning in summer are expected to be more frequent and longer but still very fragmented in time compared to the present climate.

How to cite: Filahi, H., Omrani, H., Drobinski, P., and Claudel, S.: Impacts of climate change on temporal fragmentation of energy demand in Europe, EGU General Assembly 2023, Vienna, Austria, 23–28 Apr 2023, EGU23-5225, https://doi.org/10.5194/egusphere-egu23-5225, 2023.

EGU23-5880 | PICO | CL5.6 | Highlight

Climate services for finance, lessons learned and feedback for the public sector 

Claire Burke, Sally Woodhouse, Nick Leach, James Brennan, Graham Reveley, Laura Ramsamy, Hamish Mitchell, and Kamil Kluza

There has been a recent increase in demand for climate data and insights on the potential impacts of climate change. This is particularly true in the finance sector - in the past 18 months financial regulators in the UK, Europe, USA, Canada and elsewhere globally have all stipulated that large and listed firms are legally required to understand their climate risk and do something to mitigate that risk. The finance sector is not well placed to generate these climate risk insights, motivating the rise of multiple climate risk data providers.

Climate X is a private-sector provider of climate risk analytics and services. Our in-house science team makes use of a wealth of publicly available data in the science that underpins the services we provide; data such as climate models and remote sensing data. We provide science as a service and deliver our data in a way that is useful and used within the finance sector.

I will briefly outline how we use publicly available data to derive climate risk information that is relevant to the finance sector, and how we deliver that data in away that is meaningful to our end users. I will discuss why the data in its raw form doesn’t address sector requirements, and feedback from the sector on how publicly available climate and remote sensing data is used. I will summarise lessons learned from our engagement with finance on how the public sector could provide data which is tailored to end user needs, and is more immediately relevant and useful for adaptation action in this industry.

How to cite: Burke, C., Woodhouse, S., Leach, N., Brennan, J., Reveley, G., Ramsamy, L., Mitchell, H., and Kluza, K.: Climate services for finance, lessons learned and feedback for the public sector, EGU General Assembly 2023, Vienna, Austria, 23–28 Apr 2023, EGU23-5880, https://doi.org/10.5194/egusphere-egu23-5880, 2023.

EGU23-6438 | PICO | CL5.6

The DROP app: a soil moisture enabled climate information service tailored to smallholder farmerseeds 

Lisanne Nauta, Samuel Sutanto, Spyridon Paparrizos, and Iwan Supit

Weather and Climate Information Services (WCIS) for agriculture provide weather
and climate forecasts on various timescales, but soil moisture information that is crucial for plant
growth and optimizing the agricultural yield is still missing. We, therefore, have developed DROP
app, a WCIS with a soil moisture module. This app was designed with and for smallholder farmers
working on rainfed agriculture in northern Ghana and has three main features: 1) information on
location-specific scientific weather forecasts (SF), 2) local weather forecasts (LF) from smallholder
farmers, and 3) the soil moisture forecasts. The forecasts generate a high probability of rain
detection (POD), with a minimum value of 0.7 obtained from LF. The hybrid forecast (HF) that
integrates the SF and LF yields the highest POD value of 0.9. However, the hybrid system also
has a high number of false alarms which results in an overall lower forecast performance of HF
compared to SF. More than half of the farmers (58%) perceived that soil moisture forecasts have
good performance. After the implementation of the app, farmers involved in the study were mostly
satisfied with the use and the features of the app. By using the app, they were able to adjust their
farming activities, such as sowing, planting and weeding dates, fertilizer and herbicide application,
and harvesting. Although some limitations exist, the DROP app has potential to be used worldwide
in order to deliver actionable knowledge on WCIS for climate-smart farm decision-making.

How to cite: Nauta, L., Sutanto, S., Paparrizos, S., and Supit, I.: The DROP app: a soil moisture enabled climate information service tailored to smallholder farmerseeds, EGU General Assembly 2023, Vienna, Austria, 23–28 Apr 2023, EGU23-6438, https://doi.org/10.5194/egusphere-egu23-6438, 2023.

EGU23-6868 | PICO | CL5.6

WeCENT – a prototype of climate service for tourism 

Liliana Velea and Alessandro Gallo

Tourism is an important socio-economic sector, contributing in 2021 with about 6.6% to EU GDP and accounting for 10.3% of the total labour force (https://wttc.org/DesktopModules/MVC/FactSheets/pdf/704/38_20220613172620_EuropeanUnionLCU2022_.pdf ). It is also important for the well-being of both tourists and residents (e.g. Uysal et al, 2015; Godovykh et al, 2021) by providing extending opportunities for leisure activities, social and cultural interactions, economic benefits etc. Climate data and services bring their contribution in this area too. Most information available and easily accessible for tourists on weather, climate and other environmental aspects is not too specific, usually referring to single, well-known meteorological parameters (air temperature, precipitation, sunshine duration) and being in the form of monthly means and extremes. But the tourists may benefit and are interested as well in information assembled from several meteorological parameters, able to give an overall, more concentrated indication on weather characteristics suitable for outdoor leisure activities. Also, there are climate and environmental information of greater interest for tourists depending on the type of destination (e.g., rural) and which are not easily accessible for the usual tourist.

Aiming to answer to this interest, the WeCENT (Weather, Climate and Environmental Information for Tourism) project proposes a prototype of a climate service targeting the tourists. A variety of tourism-customized information, adapted for urban, rural, mountain and beach destinations in Italy and Romania is built based on climate reanalysis, satellite-based products, analysis and forecast products. The information is freely available and accessible through the project website (https://pric.unive.it/projects/wecent/home#c4213).


References

Godovykh, M., Ridderstaat, J. and Fyall, A. (2021): The well-being impacts of tourism: Long-term and short-term effects of tourism development on residents’ happiness, Tourism Economics, 2021, Vol. 0(0) 1–20, DOI: 10.1177/13548166211041227

Uysal, M., et al., Quality of life (QOL) and well-being research in tourism, Tourism Management (2015), http:// dx.doi.org/10.1016/j.tourman.2015.07.013

How to cite: Velea, L. and Gallo, A.: WeCENT – a prototype of climate service for tourism, EGU General Assembly 2023, Vienna, Austria, 23–28 Apr 2023, EGU23-6868, https://doi.org/10.5194/egusphere-egu23-6868, 2023.

EGU23-6963 | PICO | CL5.6

Tailoring climate change information to assess the vulnerability of Greek airports, in support of prioritising adaptation measures 

Tim van der Schriek, Christos Giannakopoulos, Nikolaos Roukounakis, Anna Karali, Gianna Kitsara, Giannis Lemesios, and Myrto Gratsea

This study assesses the vulnerability of Greek airports to the impacts of future climate change. Its key aim is to increase the understanding and usability of climate information for airport operators and airlines. The extraction of relevant climate change information from published, and in-house produced, scientific data is therefore informed by a dialogue with the end-users and thus tailored by the needs of the airport operators. The vulnerability assessment methodology uses risk categories and, specifically, critical climate change threshold values concerning airport infrastructure. The approach is aligned with the current airport industry standard as outlined in “ACI Policy Brief – Airport’s Resilience and Adaptation to a Changing Climate (2018)”. The vulnerability matrix has been adapted to the Greek situation and may be used in future regional infrastructure reviews.

This study used projected climate change data from: (i) the Greek “Regional Adaptation Action Plans” (RAAPS), (ii) the national climate change adaptation strategy, developed in the framework of the EU integrated project “LIFE-IP AdaptInGR” (https://www.adaptivegreece.gr), and (iii) the assessment of the impacts of climate change and extremes in Greece derived from the nationally funded CLIMPACT project (www.climpact.gr). Extreme weather trends were assessed using up-to-date climate change projections on a regional scale. Specific reference is made to considerations of whether design inputs/standards for infrastructure works are likely to change in the future.

This vulnerability study addresses the need for the early identification of climate change risks associated with Greek airports and their effective management through implementing adaptation measures. Recommendations may feed into individual Master Plans of airports. We show how climate services can successfully facilitate airport adaptation to climate change by providing information that is tailored to the real user need.

How to cite: van der Schriek, T., Giannakopoulos, C., Roukounakis, N., Karali, A., Kitsara, G., Lemesios, G., and Gratsea, M.: Tailoring climate change information to assess the vulnerability of Greek airports, in support of prioritising adaptation measures, EGU General Assembly 2023, Vienna, Austria, 23–28 Apr 2023, EGU23-6963, https://doi.org/10.5194/egusphere-egu23-6963, 2023.

EGU23-7306 | PICO | CL5.6

National climate services for the German coasts 

Kerstin Jochumsen, Frank Janssen, Tim Kruschke, Jennifer Brauch, and Birte-Marie Ehlers

The German coastal areas of the North Sea and Baltic Sea: Wadden Sea World Heritage Site, 23000 km² of shipping lanes, around 600 km of dyke line and home of over 7 million people.

Numerous actors such as coastal conservationists and port operators work on and with the coast. Climate change poses challenges for all of them. In order to meet these, knowledge about changes to the system due to climate change must be compiled. Possible impacts on the various fields of action must be evaluated and communicated.

The Federal Maritime and Hydrographic Agency (BSH) is providing climate information based on observations and remote sensing data as well as water level forecasts, storm surge warnings and ice information for the German coast. In recent years, these fully established services were complemented by the DAS core service “Climate and Water” which is one of the measures translating the political framework “German Strategy for Adaption to Climate Change” (DAS) into action.

We will provide information on the existing product portfolio of the national climate services, ranging from historical ice conditions to information on storms and sea level variations. Additionally, our service now includes information from high resolution climate simulations, and first results of the BSH model runs will be presented here. Special focus will be on the establishement of a feedback loop with important customers  and on the challenges in the user-provider-dialog.

How to cite: Jochumsen, K., Janssen, F., Kruschke, T., Brauch, J., and Ehlers, B.-M.: National climate services for the German coasts, EGU General Assembly 2023, Vienna, Austria, 23–28 Apr 2023, EGU23-7306, https://doi.org/10.5194/egusphere-egu23-7306, 2023.

EGU23-7848 | PICO | CL5.6

Selection of a sub-ensemble of CMIP6 projections for the EDF in-house climate service 

Paul-Antoine Michelangeli, Sylvie Parey, Julien Boé, Hiba Omrani, Hajar Filahi, Lila Collet, Boutheina Oueslati, Katy Pol, and Carole Legorgeu

As a power company, EDF must adapt its activities and assets to the ongoing climate change. EDF/R&D has been involved in climate research for a long time and giving the ever-growing number of climate impact studies to conduct, it has been decided in 2014 to create an in-house climate service. This service is meant as a bridge between the scientific community and EDF’s operational needs. It relies on three main pillars: data, tools and expertise.

With the availability of the new CMIP6 climate projections and the huge amount of data involved, the question of the choice of projections to be downloaded has arisen. It has been studied in collaboration with the CERFACS global change team. Using a set of criteria, a sub-ensemble of around 20 climate models with four emission scenarios (SSP1-2.6, SSP2-4.5, SSP3-7.0 and SSP5-8.5) has been selected. The criteria are the following:

  • availability of the necessary variables at the daily timescale
  • available projections for the 4 scenarios
  • consideration of model dependencies and Equilibrium Climate Sensitivity
  • representation of the ensemble spread in terms of climate response
  • model performance across France

Models with an ECS inside the very likely range of observed climate sensitivity estimated in IPCC AR6 are preferred, while one or two higher sensitivity models are also selected as “low likelihood high impact” scenarios, used for the most sensitive assets.

Once all the projections have been retrieved, this database stands as the reference database for all EDF impact studies. Then, depending on the impact study, a further step of sub-sampling inside the database may be necessary.

The selection will be presented and motivated, together with some examples of use in impact studies, with or without further sub-sampling.

How to cite: Michelangeli, P.-A., Parey, S., Boé, J., Omrani, H., Filahi, H., Collet, L., Oueslati, B., Pol, K., and Legorgeu, C.: Selection of a sub-ensemble of CMIP6 projections for the EDF in-house climate service, EGU General Assembly 2023, Vienna, Austria, 23–28 Apr 2023, EGU23-7848, https://doi.org/10.5194/egusphere-egu23-7848, 2023.

EGU23-11152 | ECS | PICO | CL5.6

Co-creating a visualization tool for adaptation to urban heat in Swedish municipalities 

Lotten Wiréhn, Tina-Simone Neset, Carlo Navarra, and Jorge H. Amorim

The heatwave in summer of 2018 raised the urgency for adaptation to urban heat in Sweden, today and in the future, due to the experienced challenges and the associated risks with rising temperatures that are amplified by hard constructed surfaces, urban heat island effects, densely populated areas, and an aging population. Planning for adaptation or adaptation-related decision-making demands adequate and tailored data and information. However, research repeatedly argues for the need to co-create climate services with the intended end-users to increase the usability and relevance of climate information. While this has been emphasized for more than a decade, gaps between provided climate information and what stakeholders consider usable remains a challenge. The present study applies a co-creation methodology to design and provide an interactive visualization tool prototype for municipal stakeholders to assist urban climate adaptation in three Swedish cities – Stockholm, Linköping and Norrköping. Close collaboration and dialogues between scientists and municipal stakeholders intend to facilitate the development of usable and relevant climate information. The study is part of a four-year project, BRIGHT - Advancing knowledge and tools for the adaptation of Swedish cities to heat (https://www.smhi.se/forskning/forskningsenheter/meteorologi/bright-1.181447).

We present results of the initial phase of the co-creation process. Within this first phase of interactive dialogues and workshops with municipal stakeholders, adaptation to urban heat has been identified as a new challenge for municipalities in Sweden, which needs to be considered in a similar manner as e.g., flood risks. Thorough analyses of the complex interactions of factors affecting the exposure and vulnerability to heat are required to inform adaptation decisions and planning within the three Swedish cities. Urban climate information may serve multiple objectives for the municipalities, and hence for different municipal users, calling for user-oriented design of the visualization tool. Three objectives were identified based on the stakeholder dialogues: to use the visualization tool (i) as a basis for municipality officials’ communication with politicians; (ii) in the administrative strategy work for municipal organizations such as childcare, health and social care institutions and, (iii) in the urban planning process for adaptation measures. Stakeholders stressed that municipalities’ adaptation must both focus on existing environments and planned environments, and moreover, that the urban climate information and relevant supplementary information differ depending on planning process or objective. In addition to high-resolution simulated climate data, information on people’s locations and movements, perceptions of heat, current buildings and planned changes in the environment, tree crown canopy, access to cool areas, and the value of green urban environments, are examples of variables suggested to be included in the tool to serve these objectives.

As the co-creation process continues, the tool will be designed, validated, and evaluated together with stakeholders to ensure the tailoring of climate information to the needs and requirements of users to decrease the usability gap. 

How to cite: Wiréhn, L., Neset, T.-S., Navarra, C., and Amorim, J. H.: Co-creating a visualization tool for adaptation to urban heat in Swedish municipalities, EGU General Assembly 2023, Vienna, Austria, 23–28 Apr 2023, EGU23-11152, https://doi.org/10.5194/egusphere-egu23-11152, 2023.

EGU23-11278 | PICO | CL5.6

Seasonal forecasts and heat stress in an eastern Mediterranean environment 

Konstantinos V. Varotsos, Anna Karali, and Christos Giannakopoulos

In this study we examine the use of seasonal forecasts on predicting the heat stress conditions in the summer months over the region of Attica in Greece using a number of meteorologically based heat stress indices, namely effective temperature, humidex, discomfort index and heat index (Buzan et al. 2015). To this aim, the fifth generation ECMWF seasonal forecasting system (SEAS5) hindcasts for the period 1993 to 2016 available in C3S Climate Data Store are used. The variables to calculate daily heat stress indices values include instantaneous outputs at 12 UTC for 2-meter temperature, northward and eastward near-surface wind components, as well as 2-m dewpoint temperature. In order to statistically downscale and verify seasonal forecasts, the state-of-the-art global reanalysis dataset ERA5-Land of Copernicus CDS is used. The verification of the heat stress indices re-forecasts is performed using adequate probabilistic verification measures of discrimination and reliability.

Preliminary results indicate that for the majority of the indices, forecasts initialized in June and to a lesser extent in May exhibit statistically significant skill scores in predicting above normal heat stress conditions, while for forecasts initialized in March and April no statistically significant skill is found identifying these forecasts in the not useful category.

How to cite: Varotsos, K. V., Karali, A., and Giannakopoulos, C.: Seasonal forecasts and heat stress in an eastern Mediterranean environment, EGU General Assembly 2023, Vienna, Austria, 23–28 Apr 2023, EGU23-11278, https://doi.org/10.5194/egusphere-egu23-11278, 2023.

EGU23-13063 | ECS | PICO | CL5.6

Co-created Climate information with local agents for nautical sports activities in the central-western Mediterranean 

Anna Boqué Ciurana, Jon Xavier Olano Pozo, Mercè Cisneros Bermejo, Caterina Cimolai, Ricardo Vásquez Yañez, Daniel Dermit, and Enric Aguilar

Coastal Tourist destinations need to adapt to climate variability and change to maintain their tourist competitiveness and appeal. To do this, it is crucial to know the climatic potential of the activities which the destination offers and to manage the location’s natural resources. The Sustainable development goals (SDG) offer guidelines for the development of a tourist destination. In the TURLIT-ODS project, we aim to contribute directly to SDG 3, Good health and well being; SDG 8, decent work and economic growth; SDG 12, Responsible consumption and production and SDG 13, Climate Action.

The last decades have seen advances in climate services for multiple fields. Despite this, the determination of the expected optimal days for different nautical sports activities around the central-western Mediterranean has not been done yet.

The present research explores, through a co-creation process with local agents, how the atmospheric/oceanic conditions influence nautical sports activity development. With the gained knowledge, we computed the optimal expected days for the specific activities identified by the stakeholders using ocean buoy data and wind and wave data from the SIMAR numerical model owned by Puertos del Estado.

Thanks to this approach, we transform raw data into structured information to provide the knowledge of optimal expected days for different nautical sports activities: sailing, stand-up paddling, kayaking, windsurfing, swimming in open waters, diving, snorkeling, water walking, underwater fishing, SUP- yoga, rowing, kitesurfing, surfing, wing foil, jet ski and other recreative uses (like the banana boat).

The computation of the optimal days for each one of these activities along Tarragona’s province coast allows us to understand the availability of that conditions and assist decision-making by looking at information that facilitates the definition of diversification strategies of the tourist activities.

By considering the meteorological-oceanographical conditions of a territory and, according to the results related to a destination, new tourist products and/or redesigned products offered are depicted. In this way, the destination of Tarragona’s province makes a step closer to the path of the sustainability of their leisure and tourist activities settled on the shore.

We acknowledge  Diputació Provincial de Tarragona for funding the project TURLIT (T22240S), Puertos del Estado (Ministry of Transport, Mobility and Urban Agenda of Spain), which provided the data for this study, and the Municipality of Calafell for supporting the project and facilitating spaces to generate the co-creation process.

How to cite: Boqué Ciurana, A., Olano Pozo, J. X., Cisneros Bermejo, M., Cimolai, C., Vásquez Yañez, R., Dermit, D., and Aguilar, E.: Co-created Climate information with local agents for nautical sports activities in the central-western Mediterranean, EGU General Assembly 2023, Vienna, Austria, 23–28 Apr 2023, EGU23-13063, https://doi.org/10.5194/egusphere-egu23-13063, 2023.

EGU23-13344 | ECS | PICO | CL5.6

European Extreme Events Climate Index (E3CI) 

Giuseppe Giugliano, Guido Rianna, Alessandro Pugliese, Giuliana Barbato, Marta Ellena, Paola Mercogliano, Antonio Tirri, and Francesco LoConti

The European Extreme Events Climate Index (E3CI) is an innovative climate service (operational since January 2021) to assess the frequency and severity of weather-induced hazards over Europe. This service has been funded by Foundation Big Data and Artificial Intelligence for Human Development (IFAB) and developed through the collaboration between Fondazione CMCC Euro-Mediterranean Center on Climate Change (CMCC) and Leithà Unipol Group. Specifically, E3CI proposes to define a synthetic index aimed at providing information about the areas affected by different types of weather-induced hazards and the significance of such events. At this stage, E3CI permits equipping Europe, SADC (Southern African Development Community) and North America with an index similar to Actuaries Climate Index, (NA-ACI; actuariesclimateindex.org) developed over North America and already fully operational. 

From a methodological point of view, using ERA5 reanalysis data (Hersbach et al., 2020), E3CI permits evaluating seven main dynamics: cold and heat stresses, droughts, extreme precipitation, winds, the predisposing conditions leading to hail events and forest fire. Furthermore, five E3CI components are tested using a subset of regional climate projections from the EURO-CORDEX (Jacob et al., 2014, 2020; Giorgi and Gutowski, 2015) program at the highest available resolution (about 11 km) considering three different future periods (2011-2040; 2041-2070; 2017-2100) and three different concentration scenarios. The data are aggregated at different Administrative unit levels and combined into a single index providing an overall view for the domain and period of interest. A key aspect of E3CI is the standardization of the different components over a reference thirty-year period (1981-2010). It is a key aspect of the process because it makes comparable the outputs returned according to different approaches and for different issues; it can limit, in a way, also the influence of potential weaknesses affecting the original datasets used for computation. 

E3CI applications range in a wide area comprising both scientific and technical use cases. Such information can be useful to adjust rate adequacy levels, improve budgeting capabilities and risk management, designing index-linked financial instruments and new insurance and reinsurance products. In addition, E3CI can be adopted to pursue education and sustainability targets, such as to increase awareness about climate change impacts, to support public decision-making processes for sustainable development, to provide a scientifically-sounding measure to monitor climate trends. Finally, this service can change the way financial and insurance markets operate by providing indices that allow to more accurately measure risks related to extreme weather conditions.

How to cite: Giugliano, G., Rianna, G., Pugliese, A., Barbato, G., Ellena, M., Mercogliano, P., Tirri, A., and LoConti, F.: European Extreme Events Climate Index (E3CI), EGU General Assembly 2023, Vienna, Austria, 23–28 Apr 2023, EGU23-13344, https://doi.org/10.5194/egusphere-egu23-13344, 2023.

EGU23-13442 | PICO | CL5.6

Showcasing stakeholders’ experiences: lessons learnt from MED-GOLD final online event 

Alessandro Dell'Aquila, Luigi Ponti, Marta Terrado, Andria Nicodemou, Freddy Rivas, Marta Bruno Soares, and Massimiliano Pasqui

The MED-GOLD H2020 project held its final showcase event online on 29-30 March 2022, with more than 200 participants, to disseminate and share end-user success stories from early adopters of the pilot climate services developed under the MED-GOLD project for Grape/wine, OLives/olive oil and Durum wheat/pasta sectors. See https://www.med-gold.eu/event/med-gold-final-showcase-event/  

A major focus of the event was to provide a hands-on approach to understanding and using the uncertainty associated with climate services. The attendees had the opportunity to learn about the climate services developed throughout this 4-year EU-funded project and how they can help the agriculture sector face the challenges posed by climate change.

The two-day event provided an insight into the lessons learned during the project. MED-GOLD users from the agriculture sector, representing the grapes, olives and durum wheat crops – the Portuguese wine company SOGRAPE, the Spanish cooperative Dcoop, and the Italian food company Barilla – presented their success stories as early adopters of the MED-GOLD climate services. The users also stressed the importance of a co-production approach in creating useful and usable tools for the agriculture sector. The event was also the opportunity to discuss the climate and policies nexus for enlightening cross-beneficial needs, success stories and best practices in supporting adaptation and green transition action. Involved panelists, with a wide range of personal and professional experiences, discussed the gap between knowledge and action, bringing their evidence to identify success stories and the missing gaps.

Attendees also had the chance to engage in discussions with the presenters and other project participants, as well as to visit the virtual stands and view the posters, videos, and other materials produced by the MED-GOLD team.

How to cite: Dell'Aquila, A., Ponti, L., Terrado, M., Nicodemou, A., Rivas, F., Bruno Soares, M., and Pasqui, M.: Showcasing stakeholders’ experiences: lessons learnt from MED-GOLD final online event, EGU General Assembly 2023, Vienna, Austria, 23–28 Apr 2023, EGU23-13442, https://doi.org/10.5194/egusphere-egu23-13442, 2023.

EGU23-13802 | ECS | PICO | CL5.6

Evaluation of reference evapotranspiration techniques for seasonal forecasting applications in Croatia 

Petra Sviličić, Andrej Ceglar, Mislav Anić, and Velimir Milić

Seasonal climate predictions are becoming important to increase preparedness and adapt agricultural decision making before and within the growing season. Evapotranspiration represents a major component of the water cycle and agricultural water balance, and is thus of key relevance also for assessment of crop growth and irrigation water needs. This study investigates the comparison of different empirical methods for reference evapotranspiration calculation with the reference Penman Monteith method, implemented in the AquaCrop model, over different climate zones of Croatia using national high resolution high quality meteorological dataset in comparison with EOBS and AgERA5 datasets. This research aims to address the appropriateness of using the method with limited data to reduce uncertainty in crop yield modelling with seasonal climate forecasts.

The motivation for the research stems from the need to use a reduced number of parameters for ETo calculation, which as such enters the crop yield model. Estimation of seasonal predictions of ETo relies on the skill of prediction of multiple meteorological variables; in the case of Penman Monteith, the estimates would rely on the skill of temperature, vapour pressure, winds speed and global solar radiation prediction. Reducing the number of input variables for estimating the reference evapotranspiration might reduce the overall reliance on the limited skill of seasonal predictions of above-mentioned meteorological variables. 

In testing the usefulness of the methods, the interpolated field of the national data network, EOBS dataset, and AgERA5 for the period from 1981 to 2020 are used. Preliminary results show that for the continental area of Croatia the Trajkovic method is satisfactory for ETo calculation, and the EOBS dataset provides better results than AgERA5 when compared to high resolution national dataset. In addition, we analyse the ETo seasonal prediction skill by comparing both methods, original Penman Monteith and Trajkovic method with reduced number of input variables. This will give us an important insight on the relevance of the meteorological dataset choice as well as the ET0 method selection for seasonal prediction purposes. Since there is no comprehensive research on the reference crop evapotranspiration in Croatia, this research fills the gap of knowledge at the local level, but also contributes to the global picture

How to cite: Sviličić, P., Ceglar, A., Anić, M., and Milić, V.: Evaluation of reference evapotranspiration techniques for seasonal forecasting applications in Croatia, EGU General Assembly 2023, Vienna, Austria, 23–28 Apr 2023, EGU23-13802, https://doi.org/10.5194/egusphere-egu23-13802, 2023.

EGU23-14170 | ECS | PICO | CL5.6

Climate Services Ecosystems: an opportunity to increase optimization 

Carmen Gonzalez Romero, Angel G. Muñoz, Lisa Goddard, Asuncion Ledas St.Clair, Francisco Doblas- Reyes, Marta Terrado, and Dragana Bojovic

Societies use climate services as part of their mitigation and adaptation strategies to a changing climate (e.g., Cortekar et al., 2016; Vaughan and Dessai, 2014; Scott, Lemieux and Malon, 2011), and have been defined and framed around particular single applications or sectors, either agriculture, health, energy, water management or disaster risk management (WMO, 2009, Council, 2001)- just to mention a few. Whilst this can bring potential benefits such as high specialization and adaptation (WMO, 2019; Lemos, 2015), co-benefits of articulated climate services among different sectors have not been fully assessed in the broader societal system, where these are developed and implemented. Understanding and valuing the nexus between the sectors during the design, development and implementation of climate services might help project optimization, and eventually benefit the community, country, entire region or society.

Climate services ecosystems are defined -slightly modifying the business-perspective definition of Vargo and Akaka (2012)- as relatively self-contained, self-adjusting systems of resource-integrating actors connected by shared institutional goals, and mutual-value creation through exchange of climate services (Goddard, Gonzalez Romero, et al., 2020). In other words, a climate-services ecosystem involves interactions between different sectors sharing the same or similar climate services, which enhances resilience, and lends efficiency and value, by optimally orchestrating the available solutions. These ecosystems tend to be more robust to climate impacts than a collection of climate services focused on certain applications or just one sector, because shocks to one part of the ecosystem are redistributed and dampened through the entire network.


Since by definition these ecosystems take advantage of existing climate services in different society-relevant sectors, the overall benefit is directly dependent on the ecosystem configuration itself. The ability to scale high-quality climate services, not just to other locations but to other sectors, and the ability for these climate-service networks to organize into ecosystems is hypothesized to be a crucial ingredient to resilience in the face of climate variability and change, given that resources are finite.The analysis of the ecosystems though Dynamical Casual Network Theory allows us to understand, characterize and forsee potential behaviour and changes in relationships between the elements of the networks, supporting the decision-making processes within. In combination with projects like Climateurope2, this concept of climate services ecosystems can help with the standardization of climate services.

How to cite: Gonzalez Romero, C., Muñoz, A. G., Goddard, L., St.Clair, A. L., Doblas- Reyes, F., Terrado, M., and Bojovic, D.: Climate Services Ecosystems: an opportunity to increase optimization, EGU General Assembly 2023, Vienna, Austria, 23–28 Apr 2023, EGU23-14170, https://doi.org/10.5194/egusphere-egu23-14170, 2023.

This work describes an exploratory approach to assist decision-makers in urban areas for addressing heat hazard risks in near real-time (https://rebrand.ly/suhi_eu). The proposed service utilizes MSG Land Surface Temperature - All Sky (MLST-AS) data to compute the surface urban heat island (SUHI) and other relevant indicators for major cities in Europe on a daily basis.

The MLST-AS data has a temporal resolution of 30 minutes and a spatial resolution of 3.1 km2 at nadir. The SUHI is a measure of the difference in temperature between urban and rural areas and can significantly impact the local climate and environment. The climate service, which is based on a Shiny application written in R and Python, provides an interactive format that allows users to visualize the daily evolution of the SUHI computed from the MLST-AS data for each city, as well as relevant indicators computed at each grid point for the entire European continent. The SUHI is calculated using the methodology proposed in a previous study (https://doi.org/10.1016/j.uclim.2021.101056) and the results are presented in an easy-to-use format suitable for a wide range of end users, including policymakers, city planners, and the general public. The use of the MLST-AS data allows for accurate and detailed analysis of the SUHI and other indicators in these cities, providing valuable information for urban planning and climate adaptation efforts. The main outcome of this work is the development of an interactive tool for understanding and analysing the SUHI and other indicators in European cities, which can have important implications for urban design and climate resilience measures.

This study has been funded by the project Synergies between Urban Heat Island and Heat Wave Risks in Romania: Climate Change Challenges and Adaptation Options (SynUHI) PN-III-P4-PCE-2021-1695. We gratefully acknowledge the use of the European Weather Cloud in the context of this research.

How to cite: Dumitrescu, A. and Cheval, S.: Climate service for managing the heat hazard risk in urban areas using all-sky land surface temperature, EGU General Assembly 2023, Vienna, Austria, 23–28 Apr 2023, EGU23-14668, https://doi.org/10.5194/egusphere-egu23-14668, 2023.

EGU23-14935 | PICO | CL5.6

Introducing the French national programme TRACCS: TRAnsformative Advances in Climate modelling for Climate Services 

Masa Kageyama, Samuel Morin, Sandrine Anquetin, Nathalie de Noblet, Laurent Terray, Olivier Boucher, Julie Deshayes, Gaël Durand, David Salas y Mélia, Ludovic Bouilloud, and Pascale Braconnot

TRACCS (TRAnsformative Advances in Climate modelling for Climate Services) is a new French programme which will start in 2023 and run for the next eight years. TRACCS will combine several types of activities:
i) process modelling for simulating climate from global to local scales, so as to provide reliable climate information for assessing both mitigation scenarios and local adaptation actions and their feedback effects on the climate,
ii) adaptation of computer codes to new computing architectures, to seize the opportunities offered by exascale in terms of increasing spatial resolution, better representing the complexity of the climate system, and exploring large sets of simulations and obtain better information on model and scenario-related uncertainties,
iii) the use of advanced statistical methods and artificial intelligence to characterise climate extremes, accelerate models, and develop emulators (fast statistical models) to better quantify uncertainties,
iv) the estimation of the impacts of climate change on different activity sectors and different territories in order to co-construct adaptation,
and v) the development of a dialogue between scientists and stakeholders, teaching and communication with all audiences in order to co-construct prototypes of climate services in a transdisciplinary approach.
These activities, together with the training of a new generation of experts in climate change and its impacts, have the ambition to transform the way scientific advances on climate change are shared with stakeholders, thereby multiplying the capacity for science-based adaptation and mitigation.

The programme is jointly managed by CNRS and Meteo-France and involves key partners (CEA, IRD, CERFACS, Université-Grenoble-Alpes, Sorbonne Université, Université Versailles-Saint-Quentin, Université Paris-Saclay) in modelling and understanding climate change and its potential impacts.

Our poster presentation will give us an opportunity to present this new project and build collaborations with similar projects at the European and international level.

How to cite: Kageyama, M., Morin, S., Anquetin, S., de Noblet, N., Terray, L., Boucher, O., Deshayes, J., Durand, G., Salas y Mélia, D., Bouilloud, L., and Braconnot, P.: Introducing the French national programme TRACCS: TRAnsformative Advances in Climate modelling for Climate Services, EGU General Assembly 2023, Vienna, Austria, 23–28 Apr 2023, EGU23-14935, https://doi.org/10.5194/egusphere-egu23-14935, 2023.

EGU23-15003 | ECS | PICO | CL5.6

Future residential electricity consumption under climate change in France: application of a fine-granularity thermosensitivity model. 

Qiqi Tao, Marie Naveau, Alexis Tantet, Jordi Badosa, and Philippe Drobinski

The residential sector is the leading electricity consumer in France, representing more than one-third of the final electricity uses. As a major contributor to the energy demand, this sector must implement a pathway to reduce energy demand and greenhouse gas emissions. However, the relevance of related policies may depend on the correct estimation of the evolution of future Residential Electricity Consumption (REC) under future climate. Future REC has already been studied at the national scale. However, since the important determinants of the future REC, such as evolution in the use of AC and the meteorological conditions, especially the temperature, have a large geographical variability, REC should be studied locally. To project the French REC in a warmer climate at a fine spatial scale, a linear thermosensitivity model fitted by annual observed electricity consumption data and historical temperature is applied at the smallest French geographic census unit named Ilots Regreoupés pour l'Information Statistical (IRIS), which divides the territory into meshes of about 2000 inhabitants per unit cell. Once the current electricity sensitivity is fitted for each IRIS, the future REC is computed by applying the model to temperature projections under climate change scenario RCP8.5 up until 2100 based on 5 CORDEX climate simulations. At the same time, extreme cases of two non-climatic factors related to the use of Air-Conditioning (AC, the AC adoption rate and electricity sensitivity in cooling conditions) are also studied for future cooling needs. If only the temperature evolves, the results show that the future REC should decline with decreasing heating needs in most cells but with spatial variability and an increase in the REC for some cells. Results also show a larger disparity within administrative regions containing between a few hundred and a few thousand IRIS than between administrative regions, which justifies that future REC studies based on climate projections should be studied locally. Including AC scenarios may modify the REC negative trend in more parts of France: the REC is expected to increase in the South-East. Such an increase in electricity demand due to AC usage may have detrimental effects, not only because the total REC may increase by 4\% by 2040 and even 45\% until 2100 under the most extreme AC scenario and should thus emit more greenhouse gas, but also because the use of AC is expected to increase outdoor temperature and the heat island effect. Further studies need to focus on alternative solutions to improve inhabitants' comfort during heat waves, such as large-scale urban greening and white-coated buildings, to reduce potential AC uses, especially for the regions that may face an increase in REC. Also, the thermal performance of the building, as well as the energy efficiency of AC appliances, need to be improved in those regions. Our study can help quantify the range of improvement needed to maintain at least energy demand for cooling unchanged in a warmer climate.

How to cite: Tao, Q., Naveau, M., Tantet, A., Badosa, J., and Drobinski, P.: Future residential electricity consumption under climate change in France: application of a fine-granularity thermosensitivity model., EGU General Assembly 2023, Vienna, Austria, 23–28 Apr 2023, EGU23-15003, https://doi.org/10.5194/egusphere-egu23-15003, 2023.

EGU23-15040 | PICO | CL5.6

Prototyping cutting edge science: the EUCP project experience 

Elisa Delpiazzo, Katharina Buelow, Eulalia Baulenas Serra, Claas Teichmann, Jens Hesselbjerg Christensen, Dragana Bojovic, Peter Kalverla, and Dominic Matte

At national and European levels development of climate services is seen as a bridge between climate research and decision makers, meant to mitigate and create a sound basis to adapt to Climate Change. To enhance the quality and relevance of climate services, several actors, namely users, providers, purveyors, and researchers participate to identify and provide through co-design, co-development, and co-delivery the improvements and innovations in climate services that are needed to better inform decision-making processes. Strengthening the two-way interaction between climate modelers and climate service providers will enhance the scientific basis for these services and the relevance of climate research and modelling outputs.

The H2020 EUCP (European Climate Prediction System) project aimed to produce climate information to deliver to intermediate users, such as climate service providers and consultants, that ultimately should enter the decision domain. For this reason, one of the main objectives of the project was to produce prototypes to showcase how project’s resulting climate information could be used in the real world and how they can make a difference. One of the main goals of the engagement approach in the EUCP project is to reduce the gap between ‘top-down’ climate information driven by science and ‘bottom-up’ end-user requirements to increase the credibility and usability of climate information. This is a major barrier to the use of climate information in decision making at present. To overcome this barrier, it is widely recognized that prototyping is a key element that allows users to understand the “science behind” as well as how it could be applied in specific case studies providing valuable comments to improve the prototypes to close the gap with end users.

Similarly, to what happens in producing operational climate services, EUCP prototype production was based on a cycle of prototyping through user trials following the 5Es approach: Explore, Exploit, Expose, Examine, and Expand. It is not a series of sequential steps but an iterative process where a step forward does not imply leaving that stage and not considering it anymore. For instance, understanding the users’ needs is a step that should be considered many times during the development; at the beginning understanding users’ needs should inform the scientific community about research areas of interests, then, user needs should affect how results are shown through an effective display.

This presentation reviews how the 5Es approach was developed throughout the project, who were the actors involved and what instruments for users’ engagement were applied and used in this framework. Moreover, some examples of prototypes will be discussed in detail demonstrating how the 5Es approach is flexible enough to prototype different products. Finally, some lessons learnt in the project will be summarized as guidelines for future research.

How to cite: Delpiazzo, E., Buelow, K., Baulenas Serra, E., Teichmann, C., Hesselbjerg Christensen, J., Bojovic, D., Kalverla, P., and Matte, D.: Prototyping cutting edge science: the EUCP project experience, EGU General Assembly 2023, Vienna, Austria, 23–28 Apr 2023, EGU23-15040, https://doi.org/10.5194/egusphere-egu23-15040, 2023.

EGU23-15101 | PICO | CL5.6

Bias-adjusted SPI seasonal forecasts for the Euro-Mediterranean domain 

Massimiliano Pasqui, Ramona Magno, Sara Quaresima, Leandro Rocchi, Elena Rapisardi, Arianna Di Paola, and Edmondo Di Giuseppe

Water management received increasing attention in the last decades since it is a key to coping with climate change and global warming. Within this framework, water scarcity will be one of the main issues to be addressed by humans, mainly because of its subsequent effects on, but not limited to, the agricultural sector. To tackle this challenge, the Drought Observatory (DO) of CNR-IBE developed an operational climate service to provide seasonal forecasting, of the Standardized Precipitation Index (SPI) to support drought risk management over the Mediterranean area. 

The forecast tool stands on the most recent and evolute version of the ECMWF numerical seasonal forecast system, named SEAS, (5 and 5.1). Each month, from 2017 onwards, SEAS5 provides an ensemble of 51 members of daily simulations, lasting seven months each; these simulations are freely accessible from the Copernicus Data Store (CDS). In addition, from 1981 to 2016, CDS provided a hindcast of 25 members simulation runs (named System 4). SEAS daily precipitation seasonal forecasts, with a horizontal resolution of 1°x1°, are then bias adjusted using the Multi-Source Weighted-Ensemble Precipitation (MSWEP) dataset (version 2.8). MSWEP is a global precipitation product with an original 3-hourly, 0.1° resolution available from 1979 to the present; it merges gauges, satellite, and reanalysis data to obtain high-quality precipitation estimates at every location. The bias adjustment is computed using the CSTools R Package (CSTools: Assessing Skill of Climate Forecasts on Seasonal-to-Decadal Timescales) applying a quantile-quantile mapping algorithm. This algorithm adjusts/corrects the quantiles of the modelled distribution (the raw SEAS5 daily precipitation distribution) by using an observed distribution set as a reference (the MSWEP daily precipitation distribution). Thus each SEAS5 grid-points of each ensemble member is 1) reprojected onto the highest resolution MSWEP dataset, and then 2) the resulting high-resolution daily time-series precipitation distribution is adjusted using a quantile transformation. A 1981 – 2016 period is selected to adjust and train the quantile mapping algorithm. From the resulting high resolution and bias-adjusted daily rainfall forecast dataset, we then compute the SPI index for a series of timescales: 1, 3 and 6 months, for the period 1981 onwards.  

From the verification analysis seasonal forecast skills vary on time and geographical areas. It is thus possible to identify windows of opportunity for specific tasks in cooperation with users. Within this framework, bias-corrected seasonal forecasts are valuable supporting information for water resources management and decision-making processes. During the drought that occurred in the summer of 2022, the DO was widely used by national and international media to deliver accurate information on the drought trend. This fact underlines the need for timely and science-based data to inform also the wider public. 

These new bias-adjusted forecasts, along with the empirical seasonal forecasts and other monitoring drought and vegetation indices, will be freely accessible through the Drought Observatory Climate Service (https://drought.climateservices.it). 

How to cite: Pasqui, M., Magno, R., Quaresima, S., Rocchi, L., Rapisardi, E., Di Paola, A., and Di Giuseppe, E.: Bias-adjusted SPI seasonal forecasts for the Euro-Mediterranean domain, EGU General Assembly 2023, Vienna, Austria, 23–28 Apr 2023, EGU23-15101, https://doi.org/10.5194/egusphere-egu23-15101, 2023.

The 3rd version of the Climate Vulnerability Monitor (CVM3) is an independent global assessment of the impacts of climate change in the 21st century developed by a scientific consortium for the Climate Vulnerability Forum. It presents specific estimated climate change–attributable impact data that is internationally comparable in 32 biophysical, human health and economic indicators for most countries and all world regions. Based on the latest scenarios developed for the IPCC’s Sixth Assessment Report, the CVM3 assesses impacts for three scenarios (1.5°C scenario, a below 2°C scenario and a “no climate action” scenario) and three time slices (near-term (2030– mid-point year for 2021–2040), medium (2050) and end of the century (2090)).

The free online tool “CVM Data Explorer” draws on information, data and results of the different work packages made available by the partners through three respective application programming interfaces (APIs). While the health data explorer shows potential changes in climate-related health risks, the economics data explorer illustrates the extent to which climate change is projected to alter macroeconomic indicators. The biophysical explorer presents estimate changes in indicators like near-surface air temperature and precipitation, offers an overview of present attributable impacts as well as covering current and future vulnerability of over 180 countries. based on the given emission scenarios. The tool displays these results of current and projected impacts with maps for the different pathways and timeframes and the underlying data is freely available for download.

A multimedia part (“scrolly-telling”) of the tool takes a narrative-explorative approach to the results using different types of media such as video interviews, animations and interactive elements with local experts. These impact stories for five chosen countries (Bangladesh, Ghana, Kenya, Philippines, St. Lucia) aim to bring global databases together with regional to local impact and vulnerability information and showcase the CVM3 results in a narrative, concrete and exemplary manner.

How to cite: Rott, R., Lissner, T., Martyr-Koller, R., Saeed, F., and Hezel, B.: The 3rd version of the Climate Vulnerability Monitor: a free online tool providing globally comparable biophysical, macroeconomic and health climate impact information at the national level, EGU General Assembly 2023, Vienna, Austria, 23–28 Apr 2023, EGU23-15464, https://doi.org/10.5194/egusphere-egu23-15464, 2023.

EGU23-15499 | PICO | CL5.6

Sharing climate data through ICA&D 

Marlies van der Schee, Else van den Besselaar, Gerard van der Schrier, Gé Verver, Omar Baddour, Lisa-Anne Jepsen, Claire Ransom, Aris Suwondo, Henri Songoto, and Teddy Allen

Historical climate data is fundamental for understanding local climate trends and extremes and evaluating the impact of climate change on agriculture, food security and water resources. In addition, the data is  used for implementing adaptation measures for protecting lives and adapting socio-economic sectors to the changing climate conditions. While global climate trends can already be assessed with available data, regional data disparities result in blind-spots for climate change assessments—particularly for areas which are the most vulnerable.

To contribute to filling this gap, the International Climate Assessment & Dataset (ICA&D) has been extended to the climate-vulnerable areas of the Caribbean, the Pacific and in 5 sub-regions in Africa. ICA&D provides an accessible, web-based system to collect, prepare, quality control, and analyze basic climatological data with daily resolution. The system was developed over 25 years ago by the Meteorological Service of the Netherlands (KNMI) as the backbone of the European WMO data-node of the Regional Climate Centre (https://www.ecad.eu/) and implemented in Southeast Asia by meteorological service of Indonesia (BMKG). Now, with support from the EU-funded ClimSA project, under which WMO is implementing a €5.5 million grant, ICA&D will be further extended and run by Regional Climate Centers assigned and supported by WMO.

WMO and KNMI collaborated in 2022 through CLIMSA project to expand ICA&D to two pilot regions, the Caribbean and West-Africa on https://caribbean.icad-wmo.org/ and http://west-africa.icad-wmo.org/. The collaboration has led to setting up new websites which are designed to be user friendly and highly cyber secure. The websites, one for each region, consist of information platforms, including a geographical map with the locations of the stations’ datasets, and a feature to quickly plot timeseries from derived data and an e-learning module on the website’s functions. The data sharing policy ensures that access to raw observational data from National Meteorological and Hydrological Services (NMHS) remain restricted while allowing derived indices to be accessed by the public. Indices alone can monitor critical areas and impacts of climate change, such as the temperature of the warmest night of the year, the subsequent impact on health and  induced excess of mortality.

How to cite: van der Schee, M., van den Besselaar, E., van der Schrier, G., Verver, G., Baddour, O., Jepsen, L.-A., Ransom, C., Suwondo, A., Songoto, H., and Allen, T.: Sharing climate data through ICA&D, EGU General Assembly 2023, Vienna, Austria, 23–28 Apr 2023, EGU23-15499, https://doi.org/10.5194/egusphere-egu23-15499, 2023.

Large-scale climate variability is analysed, modelled, and predicted mainly based on general circulation models and low-dimensional association analysis. The models’ equational basis makes it difficult to produce mathematical analysis results and clear interpretations, whereas the association analysis cannot establish causation sufficiently to make invariant predictions. However, the macroscale causal structures of the climate system may accomplish the tasks of analysis, modelling, and prediction according to the concepts of causal emergence and causal prediction’s invariance.

Under the assumptions of no unobserved confounders and linear Gaussian models, we examine whether the macroscale causal structures of the climate system can be inferred not only to model but also to predict the large-scale climate variability. Specifically, first, we obtain the causal structures of the macroscale air-sea interactions of El Niño–Southern Oscillation (ENSO), which are interpretable in terms of physics. The structural causal models constructed accordingly can model the ENSO diversity realistically and predict the ENSO variability. Second, this study identifies the joint effect of ENSO and three other winter climate phenomena on the interannual variability in the East Asian summer monsoon. Using regression, these causal precursors can predict the monsoon one season ahead, outperforming association-based empirical models and several climate models. Third, we introduce a framework that infers ENSO’s air-sea interactions from high-dimensional data sets. The framework is based on aggregating the causal discovery results of bootstrap samples to improve high-dimensional variable selection. It is also based on spatial-dimension reduction to allow of clear interpretations at the macroscale.

While further integration with nonlinear non-Gaussian models will be necessary to establish the full benefits of inferring causal structures as a standard practice in research and operational predictions, our study may offer a route to providing concise explanations of the climate system and reaching accurate invariant predictions.

How to cite: He, S., Yang, S., and Chen, D.: Inferring Causal Structures to Model and Predict ENSO and Its Effect on Asian Summer Monsoon, EGU General Assembly 2023, Vienna, Austria, 23–28 Apr 2023, EGU23-102, https://doi.org/10.5194/egusphere-egu23-102, 2023.

EGU23-239 | ECS | Orals | ITS1.14/CL5.8

Toward a hybrid tropical cyclone global model 

Roberto Ingrosso and Mathieu Boudreault

The future evolution of tropical cyclones (TCs) in a warming world is an important issue, considering their potential socio-economic impacts on the areas hit by these phenomena. Previous studies provide robust responses about the future increase in intensity and in the global proportion of major TCs (Category 4–5). On the other hand, high uncertainty is associated to a projected future decrease in global TCs frequency and to potential changes in TC tracks and translation speed.

Risk management and regulatory actions require more robust quantification in how the climate change affects TCs dynamics.  A probabilistic hybrid TC model based upon statistical and climate models, physically coherent with TCs dynamics, is being built to investigate the potential impacts of climate change. Here, we provide preliminary results, in terms of present climate reconstruction (1980-2021) and future projections (2022-2060) of cyclogenesis locations and TC tracks, based on different statistical models, such as logistic and multiple linear regressions and random forest.  Physical predictors associated with the TC formation and motion and produced by reanalysis (ERA5) and the Community Earth System Model (CESM) ensemble are considered in this study.


How to cite: Ingrosso, R. and Boudreault, M.: Toward a hybrid tropical cyclone global model, EGU General Assembly 2023, Vienna, Austria, 23–28 Apr 2023, EGU23-239, https://doi.org/10.5194/egusphere-egu23-239, 2023.

EGU23-492 | ECS | Posters on site | ITS1.14/CL5.8

Separation of climate models and observations based on daily output using two machine learning classifiers 

Lukas Brunner, Sebastian Sippel, and Aiko Voigt

Climate models are primary tools to investigate processes in the climate system, to project future changes, and to inform decision makers. The latest generation of models provides increasingly complex and realistic representations of the real climate system while there is also growing awareness that not all models produce equally plausible or independent simulations. Therefore, many recent studies have investigated how models differ from observed climate and how model dependence affects model output similarity, typically drawing on climatological averages over several decades.

Here, we show that temperature maps from individual days from climate models from the CMIP6 archive can be robustly identified as “observation” or “model” even after removing the global mean. An important exception is a prototype high-resolution simulation from the ICON model family that can not be so  unambiguously classified into one category. These results highlight that persistent differences between observed and simulated climate emerge at very short time scales already, but very high resolution modelling efforts may be able to overcome some of these shortcomings.

We use two different machine learning classifiers: (1) logistic regression, which allows easy insights into the learned coefficients but has the limitation of being a linear method and (2) a convolutional neural network (CNN) which represents rather the other end of the complexity spectrum, allowing to learn nonlinear spatial relations between features but lacking the easy interpretability logistic regression allows. For CMIP6 both methods perform comparably, while the CNN is also able to recognize about 75% of samples from ICON as coming from a model, while linear regression does not have any skill for this case.

Overall, we demonstrate that the use of machine learning classifiers, once trained, can overcome the need for multiple decades of data to investigate a given model. This opens up novel avenues to test model performance on much shorter times scales.

How to cite: Brunner, L., Sippel, S., and Voigt, A.: Separation of climate models and observations based on daily output using two machine learning classifiers, EGU General Assembly 2023, Vienna, Austria, 23–28 Apr 2023, EGU23-492, https://doi.org/10.5194/egusphere-egu23-492, 2023.

EGU23-753 | ECS | Orals | ITS1.14/CL5.8 | Highlight

Finding regions of similar sea level variability with the help of a Gaussian Mixture Model 

Lea Poropat, Céline Heuzé, and Heather Reese

In climate research we often want to focus on a specific region and the most prominent processes affecting it, but how exactly do we select the borders of that region? We also often need to use long-term in situ observations to represent a larger area, but which area exactly are they representative for? In ocean sciences we usually consider basins as separate regions or even simpler, just select a rectangle of the ocean, but that does not always correspond to the real, physically relevant borders. As alternative, we use an unsupervised classification model, Gaussian Mixture Model (GMM), to separate the northwestern European seas into regions based on the sea level variability observed by altimetry satellites.

After performing a principal component (PC) analysis on the 24 years of monthly sea level data, we use the stacked PC maps as input for the GMM. We used the Bayesian Information Criterion to determine into how many regions our area should be split because GMM requires the number of classes to be selected a priori. Depending on the number of PCs used, the optimal number of classes was between 12 and 18, more PCs typically allowing the separation into more regions. Due to the complexity of the data and the dependence of the results on the starting randomly chosen weights, the classification can differ to a degree with every new run of the model, even if we use the exact same data and parameters. To tackle that, instead of using one model, we use an ensemble of models and then determine which class does each grid point belong to by soft voting, i.e., each of the models provides a probability that the point belongs to a particular class and the class with the maximal sum of probabilities wins. As a result, we obtain both the classification and the likelihood of the model belonging to that class.

Despite not using the coordinates of the data points in the model at all, the obtained classes are clearly location dependent, with grid points belonging to the same class always being close to each other. While many classes are defined by bathymetry changes, e.g., the continental shelf break and slope, sometimes other factors come into play, such as for the split of the Norwegian coast into two classes or for the division in the Barents Sea, which is probably based on the circulation. The North Sea is also split into three distinct regions, possibly based on sea level changes caused by dominant wind patterns.

This method can be applied to almost any atmospheric or oceanic variable and used for larger or smaller areas. It is quick and practical, allowing us to delimit the area based on the information we cannot always clearly see from the data, which can facilitate better selection of the regions that need further research.

How to cite: Poropat, L., Heuzé, C., and Reese, H.: Finding regions of similar sea level variability with the help of a Gaussian Mixture Model, EGU General Assembly 2023, Vienna, Austria, 23–28 Apr 2023, EGU23-753, https://doi.org/10.5194/egusphere-egu23-753, 2023.

EGU23-849 | ECS | Orals | ITS1.14/CL5.8

Drivers of sea level variability using neural networks 

Linn Carlstedt, Lea Poropat, and Céline Heuzé

Understanding the forcing of regional sea level variability is crucial as many people all over the world live along the coasts and are endangered by the sea level rise. The adding of fresh water into the oceans due to melting of the Earth’s land ice together with thermosteric changes has led to a rise of the global mean sea level (GMSL) with an accelerating rate during the twentieth century, and has now reached a mean rate of 3.7 mm per year according to IPCCs latest report. However, this change varies spatially and the dynamics behind what forces sea level variability on a regional to local scale is still less known, thus making it hard for decision makers to mitigate and adapt with appropriate strategies.

Here we present a novel approach using machine learning (ML) to identify the dynamics and determine the most prominent drivers forcing coastal sea level variability. We use a recurrent neural network called Long Short-Term Memory (LSTM) with the advantage of learning data in sequences and thus capable of storing some memory from previous timesteps, which is beneficial when dealing with time series. To train the model we use hourly ERA5 10-m wind, mean sea level pressure (MSLP), sea surface temperature (SST), evaporation and  precipitation data between 2009-2017 in the North Sea region. To reduce the dimensionality of the data but still preserve maximal information we conduct principal component analysis (PCA) after removing the climatology which are calculated by hourly means over the years. Depending on the explained variance of the PCs for each driver, 2-4 PCs are chosen and cross-correlated to eliminate collinearity, which could affect the model results. Before being used in the ML model the final preprocessed data are normalized by min-max scaling to optimize the learning. The target data in the model are hourly in-situ sea level observations from West-Terschelling in the Netherlands. Using in-situ observations compared to altimeter data enhances the ability of making good predictions in coastal zones as altimeter data has a tendency to degrade along the coasts. The sea level time series is preprocessed by tidal removal and de-seasoned by subtracting the hourly means. To determine which drivers are most prominent for the sea surface variability in our location, we mute one driver at a time in the training of the network and evaluate the eventual improvement or deterioration of the predictions.

Our results show that the zonal wind is the most prominent forcing of sea level variability in our location, followed by meridional wind and MSLP. While the SST greatly affects the GMSL, SST seems to have little to no effect on local sea level variability compared to other drivers. This approach shows great potential and can easily be applied to any coastal zone and is thus very useful for a broad body of decision makers all over the world. Identifying the cause of local sea level variability will also enable the ability of producing better models for future predictions, which is of great importance and interest.

How to cite: Carlstedt, L., Poropat, L., and Heuzé, C.: Drivers of sea level variability using neural networks, EGU General Assembly 2023, Vienna, Austria, 23–28 Apr 2023, EGU23-849, https://doi.org/10.5194/egusphere-egu23-849, 2023.

EGU23-984 | ECS | Orals | ITS1.14/CL5.8

Data-driven Attributing of Climate Events with Climate Index Collection based on Model Data (CICMoD) 

Marco Landt-Hayen, Willi Rath, Sebastian Wahl, Nils Niebaum, Martin Claus, and Peer Kröger

Machine learning (ML) and in particular artificial neural networks (ANNs) push state-of-the-art solutions for many hard problems e.g., image classification, speech recognition or time series forecasting. In the domain of climate science, ANNs have good prospects to identify causally linked modes of climate variability as key to understand the climate system and to improve the predictive skills of forecast systems. To attribute climate events in a data-driven way with ANNs, we need sufficient training data, which is often limited for real world measurements. The data science community provides standard data sets for many applications. As a new data set, we introduce a collection of climate indices typically used to describe Earth System dynamics. This collection is consistent and comprehensive as we use control simulations from Earth System Models (ESMs) over 1,000 years to derive climate indices. The data set is provided as an open-source framework that can be extended and customized to individual needs. It allows to develop new ML methodologies and to compare results to existing methods and models as benchmark. Exemplary, we use the data set to predict rainfall in the African Sahel region and El Niño Southern Oscillation with various ML models. We argue that this new data set allows to thoroughly explore techniques from the domain of explainable artificial intelligence to have trustworthy models, that are accepted by domain scientists. Our aim is to build a bridge between the data science community and researchers and practitioners from the domain of climate science to jointly improve our understanding of the climate system.

How to cite: Landt-Hayen, M., Rath, W., Wahl, S., Niebaum, N., Claus, M., and Kröger, P.: Data-driven Attributing of Climate Events with Climate Index Collection based on Model Data (CICMoD), EGU General Assembly 2023, Vienna, Austria, 23–28 Apr 2023, EGU23-984, https://doi.org/10.5194/egusphere-egu23-984, 2023.

EGU23-1135 | ECS | Posters on site | ITS1.14/CL5.8

Curation of High-level Molecular Atmospheric Data for Machine Learning Purposes 

Vitus Besel, Milica Todorović, Theo Kurtén, Patrick Rinke, and Hanna Vehkamäki

As cloud and aerosol interactions remain large uncertainties in current climate models (IPCC) they are of special interest for atmospheric science. It is estimated that more than 70% of all cloud condensation nuclei origin from so-called New Particle Formation, which is the process of gaseous precursors clustering together in the atmosphere and subsequent growth into particles and aerosols. After initial clustering this growth is driven strongly by condensation of low volatile organic compounds (LVOC), that is molecules with saturation vapor pressures (pSat) below 10-6 mbar [1]. These origin from organic molecules emitted by vegetation that are subsequently rapidly oxidized in the air, so-called Biogenic LVOC (BLVOC).

We have created a big data set of BLVOC using high-throughput computing and Density Functional Theory (DFT), and use it to train Machine Learning models to predict pSat of previously unseen BLVOC. Figure 1 illustrates some sample molecules form the data.

Figure 1: Sample molecules, for small, medium large sizes.     Figure 2: Histogram of the calculated saturation vapor pressures.

Initially the chemical mechanism GECKO-A provides possible BLVOC molecules in the form of SMILES strings. In a first step the COSMOconf program finds and optimizes structures of possible conformers and provides their energies for the liquid phase on a DFT level of theory. After an additional calculation of the gas phase energies with Turbomole, COSMOtherm calculates thermodynamical properties, such as the pSat, using the COSMO-RS [1] model. We compressed all these computations together in a highly parallelised high-throughput workflow to calculate 32k BLVOC, that include over 7 Mio. molecular conformers. See a histogram of the calculated pSat in Figure 2.

We use the calculated pSat to train a Gaussian Process Regression (GPR) machine learning model with the Topological Fingerprint as descriptor for molecular structures. The GPR incorporates noise and outputs uncertainties for predictions on the pSat. These uncertainties and data cluster techniques allow for the active choosing of molecules to include in the training data, so-called Active Learning. Further, we explore using SLISEMAP [2] explainable AI methods to correlate Machine Learning predictions, the high-dimensional descriptors and human-readable properties, such as functional groups.

[1] Metzger, A. et al. Evidence for the role of organics in aerosol particle formation under atmospheric conditions. Proc. Natl. Acad. Sci. 107, 6646–6651, 10.1073/pnas.0911330107 (2010)
[2] Klamt, A. & Schüürmann, G. Cosmo: a new approach to dielectric screening in solvents with explicit expressions for the
screening energy and its gradient. J. Chem. Soc., Perkin Trans. 2 799–805, 10.1039/P29930000799 (1993).
[3] Björklund, A., Mäkelä, J. & Puolamäki, K. SLISEMAP: supervised dimensionality reduction through local explanations. Mach Learn (2022). https://doi.org/10.1007/s10994-022-06261-1

How to cite: Besel, V., Todorović, M., Kurtén, T., Rinke, P., and Vehkamäki, H.: Curation of High-level Molecular Atmospheric Data for Machine Learning Purposes, EGU General Assembly 2023, Vienna, Austria, 23–28 Apr 2023, EGU23-1135, https://doi.org/10.5194/egusphere-egu23-1135, 2023.

EGU23-1244 | Posters on site | ITS1.14/CL5.8

Machine learning for non-orographic gravity waves in a climate model 

Steven Hardiman, Adam Scaife, Annelize van Niekerk, Rachel Prudden, Aled Owen, Samantha Adams, Tom Dunstan, Nick Dunstone, and Melissa Seabrook

There is growing use of machine learning algorithms to replicate sub-grid parametrisation schemes in global climate models.  Parametrisations rely on approximations, thus there is potential for machine learning to aid improvements.  In this study, a neural network is used to mimic the behaviour of the non-orographic gravity wave scheme used in the Met Office climate model, important for stratospheric climate and variability.  The neural network is found to require only two of the six inputs used by the parametrisation scheme, suggesting the potential for greater efficiency in this scheme.  Use of a one-dimensional mechanistic model is advocated, allowing neural network hyperparameters to be trained based on emergent features of the coupled system with minimal computational cost, and providing a test bed prior to coupling to a climate model.  A climate model simulation, using the neural network in place of the existing parametrisation scheme, is found to accurately generate a quasi-biennial oscillation of the tropical stratospheric winds, and correctly simulate the non-orographic gravity wave variability associated with the El Nino Southern Oscillation and stratospheric polar vortex variability.  These internal sources of variability are essential for providing seasonal forecast skill, and the gravity wave forcing associated with them is reproduced without explicit training for these patterns.

How to cite: Hardiman, S., Scaife, A., van Niekerk, A., Prudden, R., Owen, A., Adams, S., Dunstan, T., Dunstone, N., and Seabrook, M.: Machine learning for non-orographic gravity waves in a climate model, EGU General Assembly 2023, Vienna, Austria, 23–28 Apr 2023, EGU23-1244, https://doi.org/10.5194/egusphere-egu23-1244, 2023.

EGU23-1502 | ECS | Orals | ITS1.14/CL5.8

Adapting Transfer Learning for Multiple Channels in Satellite Data Applications 

Naomi Simumba and Michiaki Tatsubori

Transfer learning is a technique wherein information learned by previously trained models is applied to new learning tasks. Typically, weights learned by a network pretrained on other datasets are copied or transferred to new networks. These new networks, or downstream models, are then are then used for assorted tasks. Foundation models extend this concept by training models on large datasets. Such models gain a contextual understanding which can then be used to improve performance of downstream tasks in different domains. Common examples include GPT-3 in the field on natural language processing and ImageNet trained models in the field of computer vision.

Beyond its high rate of data collection, satellite data also has a wide range of meaningful applications including climate impact modelling and sustainable energy. This makes foundation models trained on satellite data very beneficial as they would reduce the time, data, and computational resources required to obtain useful downstream models for these applications.

However, satellite data models differ from typical computer vision models in a crucial way. Because several types of satellite data exist, each with its own benefits, a typical use case for satellite data involves combining multiple data inputs in configurations that are not readily apparent during pretraining of the foundation model. Essentially, this means that the downstream application may have a different number of input channels from the pretrained model, which raises the question of how to successfully transfer information learned by the pretrained model to the downstream application.

This research proposes and examines several architectures for the downstream model that allow for pretrained weights to be incorporated when a different number of input channels is required. For evaluation, models pretrained with self-supervised learning on precipitation data are applied to a downstream model which conducts temporal interpolation of precipitation data and requires two inputs. The effect of including perceptual loss to enhance model performance is also evaluated. These findings can be used to guide adaptation for applications ranging from flood modeling, land use detection, and more.

How to cite: Simumba, N. and Tatsubori, M.: Adapting Transfer Learning for Multiple Channels in Satellite Data Applications, EGU General Assembly 2023, Vienna, Austria, 23–28 Apr 2023, EGU23-1502, https://doi.org/10.5194/egusphere-egu23-1502, 2023.

Unprecedented flash floods (FF) in urban regions are increasing due to heavy rainfall intensity and magnitude as a result of human-induced climate and land-use changes. The changes in weather patterns and various anthropogenic activities increase the complexity of modelling the FF at different spatiotemporal scales: which indicates the importance of multi-resolution forcing information. Towards this, developing new methods for processing coarser resolution spatio-temporal datasets are essential for the efficient modelling of FF. While a wide range of methods is available for spatial and temporal downscaling of the climate data, the multi-temporal downscaling strategy has not been investigated for ungauged stations of streamflow. The current study proposed a multi-temporal downscaling (MTD) methodology for gauged and ungauged stations using Adaptive Emulator Modelling concepts for daily to sub-daily streamflows. The proposed MTD framework for ungauged stations comprise a hybrid framework with conceptual and machine learning-based approaches to analyze the catchment behavior and downscale the model outputs from daily to sub-daily scales. The study area, Peachtree Creek watershed (USA), frequently experiences flash floods; hence, selected to validate the proposed framework. Further, the study addresses the critical issues of model development, seasonality, and diurnal variation of MTD data. The study obtained MTD data with minimal uncertainty on capturing the hydrological signatures and nearly 95% of accuracy in predicting the flow attributes over ungauged stations. The proposed framework can be highly useful for short- and long-range planning, management, and mitigation measurements, where the absence of fine resolution data prohibits flash flood modeling.

How to cite: Budamala, V., Wadhwa, A., and Bhowmik, R. D.: Multi-Temporal Downscaling of Streamflow for Ungauged Stations/ Sub-Basins from Daily to Sub-Daily Interval Using Hybrid Framework – A Case Study on Flash Flood Watershed, EGU General Assembly 2023, Vienna, Austria, 23–28 Apr 2023, EGU23-1855, https://doi.org/10.5194/egusphere-egu23-1855, 2023.

EGU23-2289 | ECS | Posters on site | ITS1.14/CL5.8

Towards understanding the effect of parametric aerosol uncertainty on climate using a chemical transport model perturbed parameter ensemble. 

Meryem Bouchahmoud, Tommi Bergman, and Christina Williamson

Aerosols in the climate system have a direct link to the Earth’s energy balance. Aerosols interact directly with the solar radiation through scattering and absorption; and indirectly by changing cloud properties. The effect aerosols have on climate is one of the major causes of radiative forcing (RF) uncertainty in global climate model simulations. Thus, reducing aerosol RF uncertainty is key to improving climate prediction. The objective of this work is to understand the magnitude and causes of aerosol uncertainty in the chemical transport model TM5.

Perturbed Parameter Ensembles (PPEs) are a set of model runs created by perturbing an ensemble of parameters. Parameters are model inputs, for this study we focus on parameters describing aerosol emissions, properties and processes, such as dry deposition, aging rate, emissions to aerosols microphysics. PPEs vary theses parameters over their uncertainty range all at once to study their combine effect on TM5.

Varying these parameters along with others through their value range, will reflect on TM5 outputs. The TM5 outputs parameters we are using in our sensitivity study are the cloud droplet number concentration and the ambient aerosol absorption optical thickness at 550nm.

Here we discuss the design of the PPE, and one-at-a-time sensitivity studies used in this process. The PPE samples the parameter space to enable us to use emulation. Emulating is a machine learning technique that uses a statistical surrogate model to replace the chemical transport model. The aim is to provide output data with more dense sampling throughout the parameter space. We will be using a Gaussian process emulator, which has been shown to be an efficient technique for quantifying parameter sensitivity in complex global atmospheric models.

We also describe plans to extend this work to emulate an aerosol PPE for EC-Earth. The PPE for EC-Earth will also contain cloud parameters that will vary over their uncertainty range together with the aerosol parameters to examine the influence of aerosol parametric uncertainty on RF.


How to cite: Bouchahmoud, M., Bergman, T., and Williamson, C.: Towards understanding the effect of parametric aerosol uncertainty on climate using a chemical transport model perturbed parameter ensemble., EGU General Assembly 2023, Vienna, Austria, 23–28 Apr 2023, EGU23-2289, https://doi.org/10.5194/egusphere-egu23-2289, 2023.

EGU23-2541 | ECS | Posters on site | ITS1.14/CL5.8

Machine learning based automated parameter tuning of ICON-A using satellite data 

Pauline Bonnet, Fernando Iglesias-Suarez, Pierre Gentine, Marco Giorgetta, and Veronika Eyring

Global climate models use parameterizations to represent the effect of subgrid scale processes on the resolved state. Parameterizations in the atmosphere component usually include radiation, convection, cloud microphysics, cloud cover, gravity wave drag, vertical turbulence in the boundary layer and other processes. Parameterizations are semi-empirical functions that include a number of tunable parameters. Because these parameters are loosely constraint with experimental data, a range of values are typically explored by evaluating model runs against observations and/or high resolution runs. Fine tuning a climate model is a complex inverse problem due to the number of tunable parameters and observed climate properties to fit. Moreover, parameterizations are sources of uncertainties for climate projections, thus fine tuning is a crucial step in model development.

Traditionally, tuning is a time-consuming task done manually, by iteratively updating the values of the parameters in order to investigate the parameter space with user-experience driven choices. To overcome such limitation and search efficiently through the parameter space one can implement automatic techniques. Typical steps in automatic tuning are: (i) constraining the scope of the study (model, simulation setup, parameters, metrics to fit and corresponding reference values); (ii) conducting a sensitivity analysis to reduce the parameter space and/or building an emulator for the climate model; and (iii) conducting a sophisticated grid search to define the optimum parameter set or its distribution (e.g., rejection sampling and history matching). The ICOsahedral Non-hydrostatic (ICON) model is a modelling framework for numerical weather prediction and climate projections. We implement a ML-based automatic tuning technic to tune a recent version of ICON-A with a spatial resolution typically used for climate projections. We evaluate the tuned ICON-A model against satellite observations using the Earth System Model Evaluation Tool (ESMValTool). Although automatic tuning technics allow to reach the optimum parameter values in less steps than with the manual tuning, they still require some experience-driven choices throughout the tuning process. Moreover, the performances of the tuned model is limited by the structural errors of the model, inherent to the mathematical description of the parameterizations included in the model.

How to cite: Bonnet, P., Iglesias-Suarez, F., Gentine, P., Giorgetta, M., and Eyring, V.: Machine learning based automated parameter tuning of ICON-A using satellite data, EGU General Assembly 2023, Vienna, Austria, 23–28 Apr 2023, EGU23-2541, https://doi.org/10.5194/egusphere-egu23-2541, 2023.

EGU23-3404 | ECS | Posters on site | ITS1.14/CL5.8 | Highlight

Deep learning-based generation of 3D cloud structures from geostationary satellite data 

Sarah Brüning, Stefan Niebler, and Holger Tost

Clouds and their interdependent feedback mechanisms remain a source of insecurity in climate science. This said, overcoming relating obstacles especially in the context of a changing climate emphasizes the need for a reliable database today more than ever. While passive remote sensing sensors provide continuous observations of the cloud top, they lack vital information on subjacent levels. Here, active instruments can deliver valuable insights to fill this gap in knowledge.

This study sets on to combine the benefits of both instrument types. It aims (1) to reconstruct the vertical distribution of volumetric radar data along the cloud column and (2) to interpolate the resultant 3D cloud structure to the satellite’s full disk by applying a contemporary Deep-Learning approach. Input data was derived by an automated spatio-temporally matching between high-resoluted satellite channels and the overflight of the radar. These samples display the physical predictors that were fed into the network to reconstruct the cloud vertical distribution on each of the radar’s height levels along the whole domain. Data from the entire year 2017 was used to integrate seasonal variations into the modeling routine.

The results demonstrate not only the network’s ability to reconstruct the cloud column along the radar track but also to interpolate coherent structures into a large-scale perspective. While the model performs equally well over land and water bodies, its applicable time frame is limited to daytime predictions only. Finally, the generated data can be leveraged to build a comprehensive database of 3D cloud structures that is to be exploited in proceeding applications.

How to cite: Brüning, S., Niebler, S., and Tost, H.: Deep learning-based generation of 3D cloud structures from geostationary satellite data, EGU General Assembly 2023, Vienna, Austria, 23–28 Apr 2023, EGU23-3404, https://doi.org/10.5194/egusphere-egu23-3404, 2023.

EGU23-3418 | ECS | Posters on site | ITS1.14/CL5.8

Building a physics-constrained, fast and stable machine learning-based radiation emulator 

Guillaume Bertoli, Sebastian Schemm, Firat Ozdemir, Fernando Perez Cruz, and Eniko Szekely

Modelling the transfer of radiation through the atmosphere is a key component of weather and climate models. The operational radiation scheme in the Icosahedral Nonhydrostatic Weather and Climate Model (ICON) is ecRad. The radiation scheme ecRad is accurate but computationally expensive. It is operationally run in ICON on a grid coarser than the dynamical grid and the time step interval between two calls is significantly larger. This is known to reduce the quality of the climate prediction. A possible approach to accelerate the computation of the radiation fluxes is to use machine learning methods. Machine learning methods can significantly speed up computation of radiation, but they may cause climate drifts if they do not respect essential physical laws. In this work, we study random forest and neural network emulations of ecRad. We study different strategies to compare the stability of the emulations. Concerning the neural network, we compare loss functions with an additional energy penalty term and we observe that modifying the loss function is essential to predict accurately the heating rates. The random forest emulator, which is significantly faster to train than the neural network is used as a reference model that the neural network must outperform. The random forest emulator can become extremely accurate but the memory requirement quickly become prohibitive. Various numerical experiments are performed to illustrate the properties of the machine learning emulators.

How to cite: Bertoli, G., Schemm, S., Ozdemir, F., Perez Cruz, F., and Szekely, E.: Building a physics-constrained, fast and stable machine learning-based radiation emulator, EGU General Assembly 2023, Vienna, Austria, 23–28 Apr 2023, EGU23-3418, https://doi.org/10.5194/egusphere-egu23-3418, 2023.

EGU23-3457 | Orals | ITS1.14/CL5.8

Evaluating Vegetation Modelling in Earth System Models with Machine Learning Approaches 

Ranjini Swaminathan, Tristan Quaife, and Richard Allan

The presence and amount of vegetation in any given region controls Gross Primary Production (GPP) or  the flux of carbon into the land driven by the process of photosynthesis. Earth System Models (ESMs) give us the ability to simulate GPP through modelling the various interactions between the atmosphere and biosphere including under different climate change scenarios in the future. GPP is the largest flux of the global carbon cycle and plays an important role including in carbon budget calculations.  However, GPP estimates from ESMs not only vary widely but also have much uncertainty in the underpinning attributors for this variability.  

We use data from pre-industrial Control (pi-Control) simulations to avail of the longer time period to sample data from as well as to exclude the influence of anthropogenic forcing in GPP estimation thereby leaving GPP to be largely attributable to two factor - (a) input atmospheric forcings and (b) the processes using those input climate variables to diagnose GPP. 

We explore the processes determining GPP with a physically-guided Machine Learning framework applied to a set of Earth System Models (ESMs) from the Sixth Coupled Model Intercomparison Project (CMIP6). We use this framework to examine whether differences in GPP across models are caused by differences in atmospheric state or process representations. 

Results from our analysis show that models with similar regional atmospheric forcing do not always have similar GPP distributions. While there are regions where climate models largely agree on what atmospheric variables are most relevant for GPP, there are regions such as the tropics where there is more uncertainty.  Our analysis highlights the potential of ML to identify differences in atmospheric forcing and carbon cycle process modelling across current state-of-the-art ESMs. It also allows us to extend the analysis with observational estimates of forcings as well as GPP for model improvement. 

How to cite: Swaminathan, R., Quaife, T., and Allan, R.: Evaluating Vegetation Modelling in Earth System Models with Machine Learning Approaches, EGU General Assembly 2023, Vienna, Austria, 23–28 Apr 2023, EGU23-3457, https://doi.org/10.5194/egusphere-egu23-3457, 2023.

EGU23-3619 | ECS | Posters on site | ITS1.14/CL5.8

TCDetect: A new method of Detecting the Presence of Tropical Cyclones using Deep Learning 

Daniel Galea, Julian Kunkel, and Bryan Lawrence

Tropical cyclones are high-impact weather events which have large human and economic effects, so it is important to be able to understand how their location, frequency and structure might change in a future climate.

Here, a lightweight deep learning model is presented which is intended for detecting the presence of tropical cyclones during the execution of numerical simulations for use in an online data reduction method. This will help to avoid saving vast amounts of data for analysis after the simulation is complete. With run-time detection, it might be possible to reduce the need for some of the high-frequency high-resolution output which would otherwise be required.

The model was trained on ERA-Interim reanalysis data from 1979 to 2017 and the training concentrated on delivering the highest possible recall rate (successful detection of cyclones) while rejecting enough data to make a difference in outputs.

When tested using data from the two subsequent years, the recall or probability of detection rate was 92%. The precision rate or success ratio obtained was that of 36%. For the desired data reduction application, if the desired target included all tropical cyclone events, even those which did not obtain hurricane-strength status, the effective precision was 85%.

The recall rate and the Area Under Curve for the Precision/Recall (AUC-PR) compare favourably with other methods of cyclone identification while using the smallest number of parameters for both training and inference. 

Work was performed under the auspices of the U.S. Department of Energy by Lawrence Livermore National Laboratory under Contract DE-AC52-07NA27344. LLNL-ABS-843612

How to cite: Galea, D., Kunkel, J., and Lawrence, B.: TCDetect: A new method of Detecting the Presence of Tropical Cyclones using Deep Learning, EGU General Assembly 2023, Vienna, Austria, 23–28 Apr 2023, EGU23-3619, https://doi.org/10.5194/egusphere-egu23-3619, 2023.

EGU23-3875 | ECS | Posters on site | ITS1.14/CL5.8

Explainable AI for oceanic carbon cycle analysis of CMIP6 

Paul Heubel, Lydia Keppler, and Tatiana Iliyna

The Southern Ocean acts as one of Earth's major carbon sinks, taking up anthropogenic carbon from the atmosphere. Earth System Models (ESMs) are used to project its future evolution. However, the ESMs in the Coupled Model Intercomparison Project version 6 (CMIP6) disagree on the biogeochemical representation of the Southern Ocean carbon cycle, both with respect to the phasing and the magnitude of the seasonal cycle of dissolved inorganic carbon (DIC), and they compare poorly with observations.

We develop a framework to investigate model biases in 10 CMIP6 ESMs historical runs incorporating explainable artificial intelligence (xAI) methodologies. Using both a linear Random Forest feature relevance approach to a nonlinear self organizing map - feed forward neural network (SOM-FFN) framework, we relate 5 drivers of the seasonal cycle of DIC in the Southern Ocean in the different CMIP6 models. We investigate temperature, salinity, silicate, nitrate and dissolved oxygen as potential drivers. This analysis allows us to determine dominant statistical drivers of the seasonal cycle of DIC in the different models, and how they compare to the observations. Our findings inform future model development to better constrain the seasonal cycle of DIC.

How to cite: Heubel, P., Keppler, L., and Iliyna, T.: Explainable AI for oceanic carbon cycle analysis of CMIP6, EGU General Assembly 2023, Vienna, Austria, 23–28 Apr 2023, EGU23-3875, https://doi.org/10.5194/egusphere-egu23-3875, 2023.

EGU23-4044 | ECS | Orals | ITS1.14/CL5.8

DailyMelt: Diffusion-based Models for Spatiotemporal Downscaling of (Ant-)arctic Surface Meltwater Maps 

Björn Lütjens, Patrick Alexander, Raf Antwerpen, Guido Cervone, Matthew Kearney, Bingkun Luo, Dava Newman, and Marco Tedesco

Motivation. Ice melting in Greenland and Antarctica has increasingly contributed to rising sea levels. Yet, the exact speed of melting, existence of abrupt tipping points, and in-detail links to climate change remain uncertain. Ice shelves essentially prevent the ice sheet from slipping into the ocean and better prediction of collapses is needed. Meltwater at the surface of ice shelves indicates ice shelf collapse through destabilizing ice shelves via fracturing and flexural processes (Banwell et al., 2013) and is likely impacted by a warming climate ( Kingslake et al., 2017). Maps of meltwater have been created from in-situ and remote observations, but their low and irregular spatiotemporal resolution severely limits studies (Kingslake et al., 2019).

Research Gap. In particular, there does not exist daily high-resolution (< 500m) maps of surface meltwater. We propose the first daily high-resolution surface meltwater maps by developing a deep learning-based downscaling method, called DailyMelt, that fuses observations and simulations of varying spatiotemporal resolution, as illustrated in Fig.1. The created maps will improve understanding of the origin, transport, and controlling physical processes of surface meltwater. Moreover, they will act as unified source to improve sea level rise and meltwater predictions in climate models. 

Data. To synthesize surface meltwater maps, we leverage observations from satellites (MODIS, Sen-1 SAR) which are high-resolution (500m, 10m), but have substantial temporal gaps due to repeat time and cloud coverage. We fuse them with simulations (MAR) and passive microwave observations (MEaSURE) that are daily, but low-resolution (6km, 3.125km). In a significant remote sensing effort, we have downloaded, reprojected, and regridded all products into daily observations for our study area over Greenland’s Helheim glacier. 

Approach and expected results. Within deep generative vision models, diffusion-based models promise sharp and probabilistic predictions. We have implemented SRDiff (Li H. et al., 2022) and tested it on spatially downscaling external data. As a baseline model, we have implemented a statistical downscaling model that is a local hybrid physics-linear regression model (Noel et al., 2016). In our planned benchmark, we expect a baseline UNet architecture that minimizes RMSE to create blurry maps and a generative adversarial network that minimizes adversarial loss to create sharp but deterministic maps. We have started with spatial downscaling and will include temporal downscaling. 

In summary, we will create the first daily high-resolution (500m) surface meltwater maps, have introduced the first diffusion-based model for downscaling Earth sciences data, and have created the first benchmark dataset for downscaling surface meltwater maps.


References.

Banwell, A. F., et al. (2013), Breakup of the Larsen B Ice Shelf triggered by chain reaction drainage of supraglacial lakes, Geophys. Res. Lett., 40 

Kingslake J, et al. (2017), Widespread movement of meltwater onto and across Antarctic ice shelves, Nature, 544(7650)

Kingslake J., et al. (2019), Antarctic Surface Hydrology and Ice Shelf Stability Workshop report, US Antarctic Program Data Center

Li H., et al. (2022), SRDiff: Single image super-resolution with diffusion probabilistic models, Neurocomputing, 479

Noël, B., et al. (2016), A daily, 1 km resolution data set of downscaled Greenland ice sheet surface mass balance (1958–2015), The Cryosphere, 10

How to cite: Lütjens, B., Alexander, P., Antwerpen, R., Cervone, G., Kearney, M., Luo, B., Newman, D., and Tedesco, M.: DailyMelt: Diffusion-based Models for Spatiotemporal Downscaling of (Ant-)arctic Surface Meltwater Maps, EGU General Assembly 2023, Vienna, Austria, 23–28 Apr 2023, EGU23-4044, https://doi.org/10.5194/egusphere-egu23-4044, 2023.

EGU23-4350 | ECS | Orals | ITS1.14/CL5.8

Physics-Constrained Deep Learning for Downscaling 

Paula Harder, Venkatesh Ramesh, Alex Hernandez-Garcia, Qidong Yang, Prasanna Sattigeri, Daniela Szwarcman, Campbell Watson, and David Rolnick

The availability of reliable, high-resolution climate and weather data is important to inform long-term decisions on climate adaptation and mitigation and to guide rapid responses to extreme events. Forecasting models are limited by computational costs and, therefore, often generate coarse-resolution predictions. Statistical downscaling can provide an efficient method of upsampling low-resolution data. In this field, deep learning has been applied successfully, often using image super-resolution methods from computer vision. However, despite achieving visually compelling results in some cases, such models frequently violate conservation laws when predicting physical variables. In order to conserve physical quantities, we develop methods that guarantee physical constraints are satisfied by a deep learning downscaling model while also improving their performance according to traditional metrics. We compare different constraining approaches and demonstrate their applicability across different neural architectures as well as a variety of climate and weather data sets, including ERA5 and WRF data sets.

How to cite: Harder, P., Ramesh, V., Hernandez-Garcia, A., Yang, Q., Sattigeri, P., Szwarcman, D., Watson, C., and Rolnick, D.: Physics-Constrained Deep Learning for Downscaling, EGU General Assembly 2023, Vienna, Austria, 23–28 Apr 2023, EGU23-4350, https://doi.org/10.5194/egusphere-egu23-4350, 2023.

EGU23-5431 | ECS | Orals | ITS1.14/CL5.8

Towards Robust Parameterizations in Ecosystem-level Photosynthesis Models 

Shanning Bao, Nuno Carvalhais, Lazaro Alonso, Siyuan Wang, Johannes Gensheimer, Ranit De, and Jiancheng Shi

Photosynthesis model parameters represent vegetation properties or sensitivities of photosynthesis processes. As one of the model uncertainty sources, parameters affect the accuracy and generalizability of the model. Ideally, parameters of ecosystem-level photosynthesis models, i.e., gross primary productivity (GPP) models, can be measured or inversed from observations at the local scale. To extrapolate parameters to a larger spatial scale, current photosynthesis models typically adopted fixed values or plant-functional-type(PFT)-specific values. However, the fixed and PFT-based parameterization approaches cannot capture sufficiently the spatial variability of parameters and lead to significant estimation errors. Here, we propose a Simultaneous Parameter Inversion and Extrapolation approach (SPIE) to overcome these issues. 

SPIE refers to predicting model parameters using an artificial neural network (NN) constrained by both model loss and ecosystem features including PFT, climate types, bioclimatic variables, vegetation features, atmospheric nitrogen and phosphorus deposition and soil properties. Taking a light use efficiency (LUE) model as an example, we evaluated SPIE at 196 FLUXNET eddy covariance flux sites. The LUE model accounts for the effects of air temperature, vapor pressure deficit, soil water availability (SW), light saturation, diffuse radiation fraction and CO2 on GPP using five independent sensitivity functions. The SW was represented using the water availability index and can be optimized based on evapotranspiration. Thus, we optimized the NN by minimizing the model loss which consists of GPP errors, evapotranspiration errors, and constraints on sensitivity functions. Furthermore, we compared SPIE with 11 typical parameter extrapolating approaches, including PFT- and climate-specific parameterizations, global and PFT-based parameter optimization, site-similarity, and regression methods using Nash-Sutcliffe model efficiency (NSE), determination coefficient (R2) and normalized root mean squared error (NRMSE).

The results in ten-fold cross-validation showed that SPIE had the best performance across various temporal and spatial scales and across assessing metrics. None of the parameter extrapolating approaches reached the same performance as the on-site calibrated parameters (NSE=0.95), but SPIE was the only approach showing positive NSE (=0.68) in cross-validation across sites. Moreover, the site-level NSE, R2, and NRMSE of SPIE all significantly outperformed per biome and per climate type. Ranges of parameters were more constrained by SPIE than site calibrations.

Overall, SPIE is a robust parameter extrapolation approach that overcomes strong limitations observed in many of the standard model parameterization approaches. Our approach suggests that model parameterizations can be determined from observations of vegetation, climate and soil properties, and expands from customary clustering methods (e.g., PFT-specific parameterization). We argue that expanding SPIE to other models overcomes current limits in parameterization and serves as an entry point to investigate the robustness and generalization of different models.

How to cite: Bao, S., Carvalhais, N., Alonso, L., Wang, S., Gensheimer, J., De, R., and Shi, J.: Towards Robust Parameterizations in Ecosystem-level Photosynthesis Models, EGU General Assembly 2023, Vienna, Austria, 23–28 Apr 2023, EGU23-5431, https://doi.org/10.5194/egusphere-egu23-5431, 2023.

EGU23-5487 * | ECS | Posters on site | ITS1.14/CL5.8 | Highlight

Harvesting historical spy imagery by evaluating deep learning models for state-wide mapping of land cover changes between 1965-1978 

Lucas Kugler, Christopher Marrs, Eric Kosczor, and Matthias Forkel

Remote sensing has played a fundamental role for land cover mapping and change detection at least since the launch of the Landsat satellite program in 1972. In 1995, the Central Intelligence Agency of the United States of America released previously classified spy imagery taken from 1960 onwards with near-global coverage from the Keyhole programme, which includes the CORONA satellite mission. CORONA imagery is a treasure because it contains information about land cover 10 years before the beginning of the civilian Earth observation and has a high spatial resolution < 2m. However, this imagery is only pan-chromatic and usually not georeferenced, which has so far prevented a large-scale application for land cover mapping or other geophysical and environmental applications.

Here, we aim to harvest the valuable information about past land cover from CORONA imagery for a state-wide mapping of past land cover changes between 1965 and 1978 by training, testing and validating various deep learning models.

To the best of our knowledge, this is the first work to analyse land cover from CORONA data on a large scale, dividing land cover into six classes based on the CORINE classification scheme. The particular focus of the work is to test the transferability of the deep learning approaches to unknown CORONA data.

To investigate the transferability, we selected 27 spatially and temporally distributed study areas (each 23 km²) in the Free State of Saxony (Germany) and created semantic masks to train and test 10 different U-shaped neuronal network architectures to extract land cover from CORONA data. As input, we use either the original panchromatic pixel values and different texture measures. From these input data, ten different training datasets and test datasets were derived for cross-validation.

The training results show that a semantic segmentation of land cover from CORONA data with the used architectures is possible. Strong differences in model performance (based on cross validation and the intersection over union metric, IOU) were detected among the classes. Classes with many sample data achieve significantly better IOU values than underrepresented classes. In general, a U-shaped architecture with a Transformer as Encoder (Transformer U-Net) achieved the best results. The best segmentation performance (IOU 83.29%), was obtained for forests, followed by agriculture (74.21%). For artificial surfaces, a mean IOU of 68.83% was achieved. Water surfaces achieved a mean IOU of 66.49%. For the shrub vegetation and open areas classes only IOU values mostly below 25% were achieved. The deep learning models were successfully transferable in space (between test areas) and time (between CORONA imagery from different years) especially for classes with many sample data. The transferability of deep learning models was difficult for the mapping of water bodies. Despite the general good model performance and successful transferability for most classes, the transferability was limited especially for imagery of very poor quality. Our approach enabled the state-wide mapping of land cover in Saxony between 1965 and 1978 with a spatial resolution of 2 m. We identify an increase in urban cover and a decrease in cropland cover

How to cite: Kugler, L., Marrs, C., Kosczor, E., and Forkel, M.: Harvesting historical spy imagery by evaluating deep learning models for state-wide mapping of land cover changes between 1965-1978, EGU General Assembly 2023, Vienna, Austria, 23–28 Apr 2023, EGU23-5487, https://doi.org/10.5194/egusphere-egu23-5487, 2023.

EGU23-5583 | ECS | Posters on site | ITS1.14/CL5.8

Identifying and Locating Volcanic Eruptions using Convolutional Neural Networks and Interpretability Techniques 

Johannes Meuer, Claudia Timmreck, Shih-Wei Fang, and Christopher Kadow

Accurately interpreting past climate variability can be a challenging task, particularly when it comes to distinguishing between forced and unforced changes. In the  case of large volcanic eruptions, ice core records are a very valuable tool but still often not sufficient to link reconstructed anomaly patterns to a volcanic eruption at all or to its geographical location. In this study, we developed a convolutional neural network (CNN) that is able to classify whether a volcanic eruption occurred and its location (northern hemisphere extratropical, southern hemisphere extratropical, or tropics) with an accuracy of 92%.

To train the CNN, we used 100 member ensembles of the MPI-ESM-LR global climate model, generated using the easy volcanic aerosol (EVA) model, which provides the radiative forcing of idealized volcanic eruptions of different strengths and locations. The model considered global sea surface temperature and precipitation patterns 12 months after the eruption over a time period of 3 months.

In addition to demonstrating the high accuracy of the CNN, we also applied layer-wise relevance propagation (LRP) to the model to understand its decision-making process and identify the input data that influenced its predictions. Our study demonstrates the potential of using CNNs and interpretability techniques for identifying and locating past volcanic eruptions as well as improving the accuracy and understanding of volcanic climate signals.

How to cite: Meuer, J., Timmreck, C., Fang, S.-W., and Kadow, C.: Identifying and Locating Volcanic Eruptions using Convolutional Neural Networks and Interpretability Techniques, EGU General Assembly 2023, Vienna, Austria, 23–28 Apr 2023, EGU23-5583, https://doi.org/10.5194/egusphere-egu23-5583, 2023.

EGU23-5967 | ECS | Posters on site | ITS1.14/CL5.8

Potentials and challenges of using Explainable AI for understanding atmospheric circulation 

Sebastian Scher, Andreas Trügler, and Jakob Abermann

Machine Learning (ML) and AI techniques, especially methods based on Deep Learning, have long been considered as black boxes that might be good at predicting, but not explaining predictions. This has changed recently, with more techniques becoming available that explain predictions by ML models – known as Explainable AI (XAI). These have seen adaptation also in climate science, because they could have the potential to help us in understanding the physics behind phenomena in geoscience. It is, however, unclear, how large that potential really is, and how these methods can be incorporated into the scientific process. In our study, we use the exemplary research question of which aspects of the large-scale atmospheric circulation affect specific local conditions. We compare the different answers to this question obtained with a range of different methods, from the traditional approach of targeted data analysis based on physical knowledge (such as using dimensionality reduction based on physical reasoning) to purely data-driven and physics-unaware methods using Deep Learning with XAI techniques. Based on these insights, we discuss the usefulness and potential pitfalls of XAI for understanding and explaining phenomena in geosciences. 

How to cite: Scher, S., Trügler, A., and Abermann, J.: Potentials and challenges of using Explainable AI for understanding atmospheric circulation, EGU General Assembly 2023, Vienna, Austria, 23–28 Apr 2023, EGU23-5967, https://doi.org/10.5194/egusphere-egu23-5967, 2023.

EGU23-6061 | ECS | Orals | ITS1.14/CL5.8 | Highlight

Using reduced representations of atmospheric fields to quantify the causal drivers of air pollution 

Sebastian Hickman, Paul Griffiths, Peer Nowack, and Alex Archibald

Air pollution contributes to millions of deaths worldwide every year. The concentration of a particular air pollutant, such as ozone, is controlled by physical and chemical processes which act on varying temporal and spatial scales. Quantifying the strength of causal drivers (e.g. temperature) on air pollution from observational data, particularly at extrema, is challenging due to the difficulty of disentangling correlation and causation, as many drivers are correlated. Furthermore, because air pollution is controlled in part by large scale atmospheric phenomena, using local (e.g. individual grid cell level) covariates for analysis is insufficient to fully capture the effect of these phenomena on air pollution. 


Access to large spatiotemporal datasets of air pollutant concentrations and atmospheric variables, coupled with recent advances in self-supervised learning, allow us to learn reduced representations of spatiotemporal atmospheric fields, and therefore account for non-local and non-instantaneous processes in downstream tasks.


We show that these learned reduced representations can be useful for tasks such as air pollution forecasting, and crucially to quantify the causal effect of varying atmospheric fields on air pollution. We make use of recent advances in bounding causal effects in the presence of unobserved confounding to estimate, with uncertainty, the causal effect of changing atmospheric fields on air pollution. Finally, we compare our quantification of the causal drivers of air pollution to results from other approaches, and explore implications for our methods and for the wider goal of improving the process-level treatment of air pollutants in chemistry-climate models.

How to cite: Hickman, S., Griffiths, P., Nowack, P., and Archibald, A.: Using reduced representations of atmospheric fields to quantify the causal drivers of air pollution, EGU General Assembly 2023, Vienna, Austria, 23–28 Apr 2023, EGU23-6061, https://doi.org/10.5194/egusphere-egu23-6061, 2023.

EGU23-6306 | ECS | Orals | ITS1.14/CL5.8 | Highlight

Data-Driven Cloud Cover Parameterizations 

Arthur Grundner, Tom Beucler, Pierre Gentine, Marco A. Giorgetta, Fernando Iglesias-Suarez, and Veronika Eyring

A promising approach to improve cloud parameterizations within climate models, and thus climate projections, is to train machine learning algorithms on storm-resolving model (SRM) output. The ICOsahedral Non-hydrostatic (ICON) modeling framework permits simulations ranging from numerical weather prediction to climate projections, making it an ideal target to develop data-driven parameterizations for sub-grid scale processes. Here, we systematically derive and evaluate the first data-driven cloud cover parameterizations with coarse-grained data based on ICON SRM simulations. These parameterizations range from simple analytic models and symbolic regression fits to neural networks (NNs), populating a performance x complexity plane. In most models, we enforce sparsity and discourage correlated features by sequentially selecting features based on the models' performance gains. Guided by a set of physical constraints, we use symbolic regression to find a novel equation to parameterize cloud cover. The equation represents a good compromise between performance and complexity, achieving the highest performance (R^2>0.9) for its complexity (13 trainable parameters). To model sub-grid scale cloud cover in its full complexity, we also develop three different types of NNs that differ in the degree of vertical locality they assume for diagnosing cloud cover from coarse-grained atmospheric state variables. Using the game-theory based interpretability library SHapley Additive exPlanations, we analyze our most non-local NN and identify an overemphasis on specific humidity and cloud ice as the reason why it cannot perfectly generalize from the global to the regional coarse-grained SRM data. The interpretability tool also helps visualize similarities and differences in feature importance between regionally and globally trained NNs, and reveals a local relationship between their cloud cover predictions and the thermodynamic environment. Our results show the potential of deep learning and symbolic regression to derive accurate yet interpretable cloud cover parameterizations from SRMs.

How to cite: Grundner, A., Beucler, T., Gentine, P., Giorgetta, M. A., Iglesias-Suarez, F., and Eyring, V.: Data-Driven Cloud Cover Parameterizations, EGU General Assembly 2023, Vienna, Austria, 23–28 Apr 2023, EGU23-6306, https://doi.org/10.5194/egusphere-egu23-6306, 2023.

EGU23-6450 | ECS | Orals | ITS1.14/CL5.8

The key role of causal discovery to improve data-driven parameterizations in climate models 

Fernando Iglesias-Suarez, Veronika Eyring, Pierre Gentine, Tom Beucler, Michael Pritchard, Jakob Runge, and Breixo Solino-Fernandez

Earth system models are fundamental to understanding and projecting climate change, although there are considerable biases and uncertainties in their projections. A large contribution to this uncertainty stems from differences in the representation of clouds and convection occurring at scales smaller than the resolved model grid. These long-standing deficiencies in cloud parameterizations have motivated developments of computationally costly global high-resolution cloud resolving models, that can explicitly resolve clouds and convection. Deep learning can learn such explicitly resolved processes from cloud resolving models. While unconstrained neural networks often learn non-physical relationships that can lead to instabilities in climate simulations, causally-informed deep learning can mitigate this problem by identifying direct physical drivers of subgrid-scale processes. Both unconstrained and causally-informed neural networks are developed using a superparameterized climate model in which deep convection is explicitly resolved, and are coupled to the climate model. Prognostic climate simulations with causally-informed neural network parameterization are stable, accurately represent mean climate and variability of the original climate model, and clearly outperform its non-causal counterpart. Combining causal discovery and deep learning is a promising approach to improve data-driven parameterizations (informed by causally-consistent physical fields) for both their design and trustworthiness.

How to cite: Iglesias-Suarez, F., Eyring, V., Gentine, P., Beucler, T., Pritchard, M., Runge, J., and Solino-Fernandez, B.: The key role of causal discovery to improve data-driven parameterizations in climate models, EGU General Assembly 2023, Vienna, Austria, 23–28 Apr 2023, EGU23-6450, https://doi.org/10.5194/egusphere-egu23-6450, 2023.

EGU23-7457 | ECS | Posters on site | ITS1.14/CL5.8

Towards the effective autoencoder architecture to detect weather anomalies 

Dusan Fister, Jorge Pérez-Aracil, César Peláez-Rodríguez, Marie Drouard, Pablo G. Zaninelli, David Barriopedro Cepero, Ricardo García-Herrera, and Sancho Salcedo-Sanz

To organise weather data as images, pixels represent coordinates and magnitude of pixels represents the state of the observed variable in a given time. Observed variables, such as air temperature, mean sea level pressure, wind components and others, may be collected into higher dimensional images or even into a motion structure. Codification of formers as a spatial and the latter as a spatio-temporal allows them to be processed using the deep learning methods, for instance autoencoders and autoencoder-like architectures. The objective of the original autoencoder is to reproduce the input image as much as possible, thus effectively equalising the input and output during the training. Then, an advantage of autoencoder can be utilised to calculate the deviations between (1) true states (effectively the inputs), which are derived by nature, and the (2) expected states, which are derived by means of statistical learning. Calculated deviations can then be interpreted to identify the extreme events, such as heatwaves, hot days or any other rare events (so-called anomalies). Additionally, by modelling deviations by statistical distributions, geographical areas with higher probabilities of anomalies can be deduced at the tails of the distribution. The capability of reproduction of the (original input) images is hence crucial in order to avoid addressing arbitrary noise as anomaly. We would like to run experiments to realise the effective architecture that give reasonable solutions, verify the benefits of implementing the variational autoencoder, realise the effect of selecting various statistical loss functions, and find out the effective architecture of the decoder part of the autoencoder.

How to cite: Fister, D., Pérez-Aracil, J., Peláez-Rodríguez, C., Drouard, M., G. Zaninelli, P., Barriopedro Cepero, D., García-Herrera, R., and Salcedo-Sanz, S.: Towards the effective autoencoder architecture to detect weather anomalies, EGU General Assembly 2023, Vienna, Austria, 23–28 Apr 2023, EGU23-7457, https://doi.org/10.5194/egusphere-egu23-7457, 2023.

EGU23-7465 | ECS | Posters on site | ITS1.14/CL5.8

Invertible neural networks for satellite retrievals of aerosol optical depth 

Paolo Pelucchi, Jorge Vicent, J. Emmanuel Johnson, Philip Stier, and Gustau Camps-Valls

The retrieval of atmospheric aerosol properties from satellite remote sensing is a complex and under-determined inverse problem. Traditional retrieval algorithms, based on radiative transfer models, must make approximations and assumptions to reach a unique solution or repeatedly use the expensive forward models to be able to quantify uncertainty. The recently introduced Invertible Neural Networks (INNs), a machine learning method based on Normalizing Flows, appear particularly suited for tackling inverse problems. They simultaneously model both the forward and the inverse branches of the problem, and their generative aspect allows them to efficiently provide non-parametric posterior distributions for the retrieved parameters, which can be used to quantify the retrieval uncertainty. So far INNs have successfully been applied to low-dimensional idealised inverse problems and even to some simpler scientific retrieval problems. Still, satellite aerosol retrievals present particular challenges, such as the high variability of the surface reflectance signal and the often comparatively small aerosol signal in the top-of-the-atmosphere (TOA) measurements.

In this study, we investigate the use of INNs for retrieving aerosol optical depth (AOD) and its uncertainty estimates at the pixel level from MODIS TOA reflectance measurements. The models are trained with custom synthetic datasets of TOA reflectance-AOD pairs made by combining the MODIS Dark Target algorithm’s atmospheric look-up tables and a MODIS surface reflectance product. The INNs are found to perform emulation and inversion of the look-up tables successfully. We initially train models adapted to different surface types by focusing our application on limited regional and seasonal contexts. The models are applied to real measurements from the MODIS sensor, and the generated AOD retrievals and posterior distributions are compared to the corresponding Dark Target and AERONET retrievals for evaluation and discussion.

How to cite: Pelucchi, P., Vicent, J., Johnson, J. E., Stier, P., and Camps-Valls, G.: Invertible neural networks for satellite retrievals of aerosol optical depth, EGU General Assembly 2023, Vienna, Austria, 23–28 Apr 2023, EGU23-7465, https://doi.org/10.5194/egusphere-egu23-7465, 2023.

The rapid development of deep learning approaches has conquered many fields, and precipitation prediction is one of them. Precipitation modeling remains a challenge for numerical weather prediction or climate models, and parameterization is required for low spatial resolution models, such as those used in climate change impact studies. Machine learning models have been shown to be capable of learning the relationships between other meteorological variables and precipitation. Such models are much less computationally intensive than explicit modeling of precipitation processes and are becoming more accurate than parametrization schemes.

Most existing applications focus either on precipitation extremes aggregated over a domain of interest or on average precipitation fields. Here, we are interested in spatial extremes and focus on the prediction of heavy precipitation events (>95th percentile) and extreme events (>99th percentile) over the European domain. Meteorological variables from ERA5 are used as input, and E-OBS data as target. Different architectures from the literature are compared in terms of predictive skill for average precipitation fields as well as for the occurrence of heavy or extreme precipitation events (threshold exceedance). U-Net architectures show higher skills than other variants of convolutional neural networks (CNN). We also show that a shallower U-Net architecture performs as well as the original network for this application, thus reducing the model complexity and, consequently, the computational resources. In addition, we analyze the number of inputs based on the importance of the predictors provided by a layer-wise relevance propagation procedure.

How to cite: Horton, P. and Otero, N.: Predicting spatial precipitation extremes with deep learning models. A comparison of existing model architectures., EGU General Assembly 2023, Vienna, Austria, 23–28 Apr 2023, EGU23-7862, https://doi.org/10.5194/egusphere-egu23-7862, 2023.

EGU23-8085 | ECS | Posters on site | ITS1.14/CL5.8

Improving the spatial accuracy of extreme tropical cyclone rainfall in ERA5 using deep learning 

Guido Ascenso, Andrea Ficchì, Leone Cavicchia, Enrico Scoccimarro, Matteo Giuliani, and Andrea Castelletti

Tropical cyclones (TCs) are one of the costliest and deadliest natural disasters due to the combination of their strong winds and induced storm surges and heavy precipitation, which can cause devastating floods. Unfortunately, due to its high spatio-temporal variability, complex underlying physical process, and lack of high-quality observations, precipitation is still one of the most challenging aspects of a TC to model. However, as precipitation is a key forcing variable for hydrological processes acting across multiple space-time scales, accurate precipitation input is crucial for reliable hydrological simulations and forecasts.

A popular source of precipitation data is the ERA5 reanalysis dataset, frequently used as input to hydrological models when studying floods. However, ERA5 systematically underestimates TC-induced precipitation compared to MSWEP, a multi-source observational dataset fusing gauge, satellite, and reanalysis-based data, currently one of the most accurate precipitation datasets. Moreover, the spatial distribution of TC-rainfall in ERA5 has large room for improvement.

Here, we present a precipitation correction scheme based on U-Net, a popular deep-learning architecture. Rather than only adjusting the per-pixel precipitation values at each timestep of a given TC, we explicitly design our model to also adjust the spatial distribution of the precipitation; to the best of our knowledge, we are the first to do so. The key novelty of our model is a custom-made loss function, based on the combination of the fractions skill score (FSS) and mean absolute error (MAE) metrics. We train and validate the model on 100k time steps (with an 80:20 train:test split) from global TC precipitation events. We show how a U-Net trained with our loss function can reduce the per-pixel MAE of ERA5 precipitation by nearly as much as other state-of-the-art methods, while surpassing them significantly in terms of improved spatial patterns of precipitation. Finally, we discuss how the outputs of our model can be used for future research.

How to cite: Ascenso, G., Ficchì, A., Cavicchia, L., Scoccimarro, E., Giuliani, M., and Castelletti, A.: Improving the spatial accuracy of extreme tropical cyclone rainfall in ERA5 using deep learning, EGU General Assembly 2023, Vienna, Austria, 23–28 Apr 2023, EGU23-8085, https://doi.org/10.5194/egusphere-egu23-8085, 2023.

EGU23-8496 | ECS | Posters on site | ITS1.14/CL5.8

Utilizing AI emulators to Model Stratospheric Aerosol Injections and their Effect on Climate 

Eshaan Agrawal and Christian Schroder de Witt

With no end to anthropogenic greenhouse gas emissions in sight, policymakers are increasingly debating artificial mechanisms to cool the earth's climate. One such solution is stratospheric atmospheric injections (SAI), a method of solar geoengineering where particles are injected into the stratosphere in order to reflect the sun’s rays and lower global temperatures. Past volcanic events suggest that SAI can lead to fast substantial surface temperature reductions, and it is projected to be economically feasible. Research in simulation, however, suggests that SAI can lead to catastrophic side effects. It is also controversial among politicians and environmentalists because of the numerous challenges it poses geopolitically, environmentally, and for human health. Nevertheless, SAI is increasingly receiving attention from policymakers. In this research project, we use deep reinforcement learning to study if, and by how much, carefully engineered temporally and spatially varying injection strategies can mitigate catastrophic side effects of SAI. To do this, we are using the HadCM3 global circulation model to collect climate system data in response to artificial longitudinal aerosol injections. We then train a neural network emulator on this data, and use it to learn optimal injection strategies under a variety of objectives by alternating model updates with reinforcement learning. We release our dataset and code as a benchmark dataset to improve emulator creation for solar aerosol engineering modeling. 

How to cite: Agrawal, E. and Schroder de Witt, C.: Utilizing AI emulators to Model Stratospheric Aerosol Injections and their Effect on Climate, EGU General Assembly 2023, Vienna, Austria, 23–28 Apr 2023, EGU23-8496, https://doi.org/10.5194/egusphere-egu23-8496, 2023.

Multiple studies have now demonstrated that machine learning (ML) can give improved skill for simulating fairly typical weather events in climate simulations, for tasks such as downscaling to higher resolution and emulating and speeding up expensive model parameterisations. Many of these used ML methods with very high numbers of parameters, such as neural networks, which are the focus of the discussion here. Not much attention has been given to the performance of these methods for extreme event severities of relevance for many critical weather and climate prediction applications, with return periods of more than a few years. This leaves a lot of uncertainty about the usefulness of these methods, particularly for general purpose models that must perform reliably in extreme situations. ML models may be expected to struggle to predict extremes due to there usually being few samples of such events. 
 
This presentation will review the small number of studies that have examined the skill of machine learning methods in extreme weather situations. It will be shown using recent results that machine learning methods that perform reasonably for typical weather events can have very large errors in extreme situations, highlighting the necessity of testing the performance for these cases. Extrapolation to extremes is found to work well in some studies, however. 
 
It will be argued that more attention needs to be given to performance for extremes in work applying ML in climate science. Research gaps that seem particularly important are identified. These include investigating the behaviour of ML systems in events that are multiple standard deviations beyond observed records, which have occurred in the past, and evaluating performance of complex generative models in extreme events. Approaches to address these problems will be discussed.

How to cite: Watson, P.: Machine learning applications for weather and climate need greater focus on extremes, EGU General Assembly 2023, Vienna, Austria, 23–28 Apr 2023, EGU23-8615, https://doi.org/10.5194/egusphere-egu23-8615, 2023.

EGU23-8661 | Posters on site | ITS1.14/CL5.8

An urban climate neural network screening tool 

Robert von Tils and Sven Wiemers

Microscale RANS (Reynolds Averaged Navier Stokes) models are able to simulate the urban climate for entire large cities with a high spatial resolution of up to 5 m horizontally. They do this using data from geographic information systems (GIS) that must be specially processed to provide the models with information about the terrain, buildings, land use, and resolved vegetation. If high-performance computers, for example from research institutions, are not available for the simulations or are beyond the financial scope, the calculation on commercially available servers can take several weeks. The calculation of a reference initial state for a city is often followed by questions regarding adaptation measures due to climate change or the influence of smaller and larger future building developments on the urban climate. These changes lead locally to a change of the urban climate but are also influenced by the urban climate itself.

In order to save computational time and to comfortably give a quantitative fast initial assessment, we trained a neural network that predicts the simulation results of a RANS model (for example: air temperature at night and during the day, wind speed, cold air flow) and implemented this network in a GIS. The tool allows to calculate the impact of development projects on the urban climate in a fraction of the time required by a RANS simulation and comes close to the RANS model in terms of accuracy. It can also be used by people without in-depth knowledge of urban climate modeling and is therefore particularly suitable for use, for example, in specialized offices of administrative departments or by project developers.

How to cite: von Tils, R. and Wiemers, S.: An urban climate neural network screening tool, EGU General Assembly 2023, Vienna, Austria, 23–28 Apr 2023, EGU23-8661, https://doi.org/10.5194/egusphere-egu23-8661, 2023.

EGU23-8666 | ECS | Posters on site | ITS1.14/CL5.8

Drivers of Natural Gas Use in United States Buildings 

Rohith Teja Mittakola, Philippe Ciais, Jochen Schubert, David Makowski, Chuanlong Zhou, Hassan Bazzi, Taochun Sun, Zhu Liu, and Steven Davis

Natural gas is the primary fuel used in U.S. residences, especially during winter, when cold temperatures drive the heating demand. In this study, we use daily county-level gas consumption data to assess the spatial patterns of the relationships and sensitivities of gas consumption by U.S. households considering outdoor temperatures. Linear-plus-plateau functions are found to be the best fit for gas consumption and are applied to derive two key coefficients for each county: the heating temperature threshold (Tcrit) below which residential heating starts and the rate of increase in gas consumption when the outdoor temperature drops by one degree (Slope). We then use interpretable machine learning models to evaluate the key building properties and socioeconomic factors related to the spatial patterns of Tcrit and Slope based on a large database of individual household properties and population census data. We find that building age, employment rates, and household size are the main predictors of Tcrit, whereas the share of gas as a heating fuel and household income are the main predictors of Slope. The latter result suggests inequalities across the U.S. with respect to gas consumption, with wealthy people living in well-insulated houses associated with low Tcrit and Slope values. Finally, we estimate potential reductions in gas use in U.S. residences due to improvements in household insulation or a hypothetical behavioral change toward reduced consumption by adopting a 1°C lower Tcrit than the current value and a reduced slope. These two scenarios would result in 25% lower gas consumption at the national scale, avoiding 1.24 million MtCO2 of emissions per year. Most of these reductions occur in the Midwest and East Coast regions. The results from this study provide new quantitative information for targeting efforts to reduce household gas use and related CO2 emissions in the U.S.

How to cite: Mittakola, R. T., Ciais, P., Schubert, J., Makowski, D., Zhou, C., Bazzi, H., Sun, T., Liu, Z., and Davis, S.: Drivers of Natural Gas Use in United States Buildings, EGU General Assembly 2023, Vienna, Austria, 23–28 Apr 2023, EGU23-8666, https://doi.org/10.5194/egusphere-egu23-8666, 2023.

EGU23-8921 | ECS | Posters on site | ITS1.14/CL5.8

Identification of sensitive regions to climate change and anticipation of climate events in Brazil 

Angelica Caseri and Francisco A. Rodrigues

In Brazil, the water system is essential for the electrical system and agribusiness. Understanding climate changes and predicting long-term hydrometeorological phenomena is vital for developing and maintaining these sectors in the country. This work aims to use data from the SIN system (National Interconnected System) in Brazil, from the main hydrological basins, as well as historical rainfall data, in complex networks and deep learning algorithms, to identify possible climate changes in Brazil and predict future hydrometeorological phenomena. Through the methodology developed in this work, the predictions generated showed satisfactory results, which allows identifying regions more sensitive to climate change and anticipating climate events. This work is expected to help the energy generation system in Brazil and the agronomy sector, the main sectors that drive the country's economy.

How to cite: Caseri, A. and A. Rodrigues, F.: Identification of sensitive regions to climate change and anticipation of climate events in Brazil, EGU General Assembly 2023, Vienna, Austria, 23–28 Apr 2023, EGU23-8921, https://doi.org/10.5194/egusphere-egu23-8921, 2023.

EGU23-9337 | ECS | Posters on site | ITS1.14/CL5.8

Modeling landscape-scale vegetation response to climate: Synthesis of the EarthNet challenge 

Vitus Benson, Christian Requena-Mesa, Claire Robin, Lazaro Alonso, Nuno Carvalhais, and Markus Reichstein

The biosphere displays high heterogeneity at landscape-scale. Vegetation modelers struggle to represent this variability in process-based models because global observations of micrometeorology and plant traits are not available at such fine granularity. However, remote sensing data is available: the Sentinel 2 satellites with a 10m resolution capture aspects of localized vegetation dynamics. The EarthNet challenge (EarthNet2021, [1]) aims at predicting satellite imagery conditioned on coarse-scale weather data. Multiple research groups approached this challenge with deep learning [2,3,4]. Here, we evaluate how well these satellite image models simulate the vegetation response to climate, where the vegetation status is approximated by the NDVI vegetation index.

Achieving the new vegetation-centric evaluation requires three steps. First, we update the original EarthNet2021 dataset to be suitable for vegetation modeling: EarthNet2021x includes improved georeferencing, a land cover map, and a more effective cloud mask. Second, we introduce the interpretable evaluation metric VegetationScore: the Nash Sutcliffe model efficiency (NSE) of NDVI predictions over clear-sky observations per vegetated pixel aggregated through normalization to dataset level. The ground truth NDVI time series achieves a VegetationScore of 1, the target period mean NDVI a VegetationScore of 0. Third, we assess the skill of two deep neural networks with the VegetationScore: ConvLSTM [2,3], which combines convolutions and recurrency, and EarthFormer [4], a Transformer adaptation for Earth science problems. 

Both models significantly outperform the persistence baseline. They do not display systematic biases and generally catch spatial patterns. Yet, both neural networks achieve a negative VegetationScore. Only in about 20% of vegetated pixels, the deep learning models do beat a hypothetical model predicting the true target period mean NDVI. This is partly because models largely underestimate the temporal variability. However, the target variability may partially be inflated by the noisy nature of the observed NDVI. Additionally, increasing uncertainty for longer lead times decreases scores: the mean RMSE in the first 25 days is 50% lower than between 75 and 100 days lead time. In general, consistent with the EarthNet2021 leaderboard, the EarthFormer outperforms the ConvLSTM. With EarthNet2021x, a more narrow perspective to the EarthNet challenge is introduced. Modeling localized vegetation response is a task that requires careful adjustments of off-the-shelf computer vision architectures for them to excel. The resulting specialized approaches can then be used to advance our understanding of the complex interactions between vegetation and climate.


 [1] Requena-Mesa, Benson, Reichstein, Runge and Denzler. EarthNet2021: A large-scale dataset and challenge for Earth surface forecasting as a guided video prediction task. CVPR Workshops, 2021.

 [2] Diaconu, Saha, Günnemann and Zhu. Understanding the Role of Weather Data for Earth Surface Forecasting Using a ConvLSTM-Based Model. CVPR Workshops, 2022.

 [3] Kladny, Milanta, Mraz, Hufkens and Stocker. Deep learning for satellite image forecasting of vegetation greenness. bioRxiv, 2022.

 [4] Gao, Shi, Wang, Zhu, Wang, Li and Yeung. Earthformer: Exploring Space-Time Transformers for Earth System Forecasting. NeurIPS, 2022.

How to cite: Benson, V., Requena-Mesa, C., Robin, C., Alonso, L., Carvalhais, N., and Reichstein, M.: Modeling landscape-scale vegetation response to climate: Synthesis of the EarthNet challenge, EGU General Assembly 2023, Vienna, Austria, 23–28 Apr 2023, EGU23-9337, https://doi.org/10.5194/egusphere-egu23-9337, 2023.

EGU23-9434 | ECS | Posters on site | ITS1.14/CL5.8

Enhancing environmental sensor data quality control with graph neural networks 

Elżbieta Lasota, Julius Polz, Christian Chwala, Lennart Schmidt, Peter Lünenschloß, David Schäfer, and Jan Bumberger

The rapidly growing number of low-cost environmental sensors and data from opportunistic sensors constantly advances the quality as well as the spatial and temporal resolution of weather and climate models. However, it also leads to the need for effective tools to ensure the quality of collected data.

Time series quality control (QC) from multiple spatial, irregularly distributed sensors is a challenging task, as it requires the simultaneous integration and analysis of observations from sparse neighboring sensors and consecutive time steps. Manual QC is very often time- and labour- expensive and requires expert knowledge, which introduces subjectivity and limits reproducibility. Therefore, automatic, accurate, and robust QC solutions are in high demand, where among them one can distinguish machine learning techniques. 

In this study, we present a novel approach for the quality control of time series data from multiple spatial, irregularly distributed sensors using graph neural networks (GNNs). Although we applied our method to commercial microwave link attenuation data collected from a network in Germany between April and October 2021, our solution aims to be generic with respect to the number and type of sensors, The proposed approach involves the use of an autoencoder architecture, where the GNN is used to model the spatial relationships between the sensors, allowing for the incorporation of contextual information in the quality control process. 

While our model shows promising results in initial tests, further research is needed to fully evaluate its effectiveness and to demonstrate its potential in a wider range of environmental applications. Eventually, our solution will allow us to further foster the observational basis of our understanding of the natural environment.

How to cite: Lasota, E., Polz, J., Chwala, C., Schmidt, L., Lünenschloß, P., Schäfer, D., and Bumberger, J.: Enhancing environmental sensor data quality control with graph neural networks, EGU General Assembly 2023, Vienna, Austria, 23–28 Apr 2023, EGU23-9434, https://doi.org/10.5194/egusphere-egu23-9434, 2023.

EGU23-9810 | ECS | Orals | ITS1.14/CL5.8

Integration of a deep-learning-based fire model into a global land surface model 

Rackhun Son, Nuno Carvalhais, Lazaro Silva, Christian Requena-Mesa, Ulrich Weber, Veronika Gayler, Tobias Stacke, Reiner Schnur, Julia Nabel, Alexander Winkler, and Sönke Zaehle

Fire is an ubiquitous process within the Earth system that has significant impacts in terrestrial ecosystems. Process-based fire models quantify fire disturbance effects in stand-alone dynamic global vegetation models (DGVMs) and within coupled Earth system models (ESMs), and their advances have incorporated both descriptions of natural processes and anthropogenic drivers. However, we still observe a limited skill in modeling and predicting fire at global scale, mostly due to the stochastic nature of fire, but also due to the limits in empirical parameterizations in these process-based models. As an alternative, statistical approaches have shown the advantages of machine learning in providing robust diagnostics of fire damages, though with limited value for process-based modeling frameworks. Here, we develop a deep-learning-based fire model (DL-fire) to estimate gridded burned area fraction at global scale and couple it within JSBACH4, the land surface model used in the ICON ESM. We compare the resulting hybrid model integrating DL-fire into JSBACH4 (JDL-fire) against the standard fire model within JSBACH4 and the stand-alone DL-fire results. The stand-alone DL-fire model forced with observations shows high performance in simulating global burnt fraction, showing a monthly correlation (Rm) with the Global Fire Emissions Database (GFED4) of 0.78 and of 0.8 at global scale during the training (2004-10) and validation periods (2011-15), respectively. The performance remains nearly the same when evaluating the hybrid modeling approach JDL-fire (Rm=0.76 and 0.86 in training and evaluation periods, respectively). This outperforms the currently used standard fire model in JSBACH4 (Rm=-0.16 and 0.22 in training and evaluation periods, respectively) by far. We further evaluate the modeling results across specific fire regions and apply layer-wise relevance propagation (LRP) to quantify importance of each predictor. Overall, land properties, such as fuel amount and water contents in soil layers, stand out as the major factors determining burnt fraction in DL-fire, paralleled by meteorological conditions, over tropical and high latitude regions. Our study demonstrates the potential of hybrid modeling in advancing the predictability of Earth system processes by integrating statistical learning approaches in physics-based dynamical systems.

How to cite: Son, R., Carvalhais, N., Silva, L., Requena-Mesa, C., Weber, U., Gayler, V., Stacke, T., Schnur, R., Nabel, J., Winkler, A., and Zaehle, S.: Integration of a deep-learning-based fire model into a global land surface model, EGU General Assembly 2023, Vienna, Austria, 23–28 Apr 2023, EGU23-9810, https://doi.org/10.5194/egusphere-egu23-9810, 2023.

EGU23-10219 | ECS | Posters on site | ITS1.14/CL5.8

Identifying compound weather prototypes of forest mortality with β-VAE 

Mohit Anand, Friedrich Bohn, Lily-belle Sweet, Gustau Camps-Valls, and Jakob Zscheischler

Forest health is affected by many interacting and correlated weather variables over multiple temporal scales. Climate change affects weather conditions and their dependencies. To better understand future forest health and status, an improved scientific  understanding of the complex relationships between weather conditions and forest mortality is required. Explainable AI (XAI) methods are increasingly used to understand and simulate physical processes in complex environments given enough data. In this work, an hourly weather generator (AWE-GEN) is used  to simulate 200,000 years of daily weather conditions representative of central Germany. It is capable of simulating low and high-frequency characteristics of weather variables and also captures the inter-annual variability of precipitation. These data are then used to drive an individual-based forest model (FORMIND) to simulate the dynamics of a beech, pine, and spruce forest. A variational autoencoder β-VAE is used to learn representations of the generated weather conditions, which include radiation, precipitation and temperature. We learn shared and specific variable latent representations using a decoder network which remains the same for all the weather variables. The representation learning is completely unsupervised. Using the output of the forest model, we identify single and compounding weather prototypes that are associated with extreme forest mortality. We find that the prototypes associated with extreme mortality are similar for pine and spruce forests and slightly different for beech forests. Furthermore, although the compounding weather prototypes represent a larger sample size (2.4%-3.5%) than the single prototypes (1.7%-2.2%), they are associated with higher levels of mortality on average. Overall, our research illustrates how deep learning frameworks can be used to identify weather patterns that are associated with extreme impacts.


How to cite: Anand, M., Bohn, F., Sweet, L., Camps-Valls, G., and Zscheischler, J.: Identifying compound weather prototypes of forest mortality with β-VAE, EGU General Assembly 2023, Vienna, Austria, 23–28 Apr 2023, EGU23-10219, https://doi.org/10.5194/egusphere-egu23-10219, 2023.

Hydrological models and machine learning models are widely used in streamflow simulation and data reconstruction. However, a global assessment of these models is still lacking and no synthesized catchment-scale streamflow product derived from multiple models is available over the globe. In this study, we comprehensively evaluated four conceptual hydrological models (GR2M, XAJ, SAC, Alpine) and four machine learning models (RF, GBDT, DNN, CNN) based on the selected 16,218 gauging stations worldwide, and then applied multi-model weighting ensemble (MWE) method to merge streamflow simulated from these models. Generally, the average performance of the machine learning model for all stations is better than that of the hydrological model, and with more stations having a quantified simulation accuracy (KGE>0.2); However, the hydrological model achieves a higher percentage of stations with a good simulation accuracy (KGE>0.6). Specifically, for the average accuracy during the validation period, there are 67% (27%) and 74% (21%) of stations showed a “quantified” (“good”) level for the hydrological models and machine learning models, respectively. The XAJ is the best-performing model of the four hydrological models, particularly in tropical and temperate zones. Among the machine learning models, the GBDT model shows better performance on the global scale. The MWE can effectively improve the simulation accuracy and perform much better than the traditional multi-model arithmetic ensemble (MAE), especially for the constrained least squares prediction combination method (CLS) with 82% (28%) of the stations having a “qualified” (“good”) accuracy. Furthermore, by exploring the influencing factors of the streamflow simulation, we found that both machine-learning models and hydrological models perform better in wetter areas.

How to cite: Zhang, J. and Liu, J.: Simulation and reconstruction of global monthly runoff based on hydrological models and machine learning models, EGU General Assembly 2023, Vienna, Austria, 23–28 Apr 2023, EGU23-10391, https://doi.org/10.5194/egusphere-egu23-10391, 2023.

Physical process-based numerical prediction models (NWPs) and radar-based probabilistic methods have been mainly used for short-term precipitation prediction. Recently, radar-based precipitation nowcasting models using advanced machine learning (ML) have been actively developed. Although the ML-based model shows outstanding performance in short-term rainfall prediction, it significantly decreases performance due to increased lead time. It has the limitation of being a black box model that does not consider the physical process of the atmosphere. To address these limitations, we aimed to develop a hybrid precipitation nowcasting model, which combines NWP and an advanced ML-based model via an ML-based ensemble method. The Weather Research and Forecasting (WRF) model was used as NWP to generate a physics-based rainfall forecast. In this study, we developed the ML-based precipitation nowcasting model with conditional Generative Adversarial Network (cGAN), which shows high performance in the image generation tasks. The radar reflectivity data, WRF hindcast meteorological outputs (e.g., temperature and wind speed), and static information of the target basin (e.g., DEM, Land cover) were used as input data of cGAN-based model to generate physics-informed rainfall prediction at the lead time up to 6 hours. The cGAN-based model was trained with the data for the summer season of 2014-2017. In addition, we proposed an ML-based blending method, i.e., XGBoost, that combines cGAN-based model results and WRF forecast results. To evaluate the hybrid model performance, we analyzed the performance of precipitation predictions on three heavy rain events in South Korea. The results confirmed that using the blending method to develop a hybrid model could provide an improved precipitation nowcasting approach.


Acknowledgements

 This work was supported by a grant from the National Research Foundation of Korea funded by the Ministry of Science, ICT & Future Planning (2020R1A2C2007670).

How to cite: Choi, S. and Kim, Y.: Developing hybrid precipitation nowcasting model with WRF and conditional GAN-based model, EGU General Assembly 2023, Vienna, Austria, 23–28 Apr 2023, EGU23-10431, https://doi.org/10.5194/egusphere-egu23-10431, 2023.

EGU23-10568 | ECS | Orals | ITS1.14/CL5.8

Extended-range predictability of stratospheric extreme events using explainable neural networks 

Zheng Wu, Tom Beucler, and Daniela Domeisen

Extreme stratospheric events such as extremely weak vortex events and strong vortex events can influence weather in the troposphere from weeks to months and thus are important sources of predictability of tropospheric weather on subseasonal to seasonal (S2S) timescales. However, the predictability of weak vortex events is limited to 1-2 weeks in state-of-the-art forecasting systems, while strong vortex events are more predictable than weak vortex events. Longer predictability timescales of the stratospheric extreme events would benefit long-range surface weather prediction. Recent studies showed promising results in the use of machine learning for improving weather prediction. The goal of this study is to explore the potential of a machine learning approach in extending the predictability of stratospheric extreme events in S2S timescales. We use neural networks (NNs) to predict the monthly stratospheric polar vortex strength with lead times up to five months using the first five principal components (PCs) of the sea surface temperature (SST), mean sea level pressure (MSLP), Barents–Kara sea-ice concentration (BK-SIC), poleward heat flux at 100 hPa, and zonal wind at 50, 30, and 2 hPa as precursors. These physical variables are chosen as they are indicated as potential precursors for the stratospheric extremes in previous studies. The results show that the accuracy and Brier Skill Score decrease with longer lead times and the performance is similar between weak and strong vortex events. We then employ two different NN attribution methods to uncover feature importance (heat map) in the inputs for the NNs, which indicates the relevance of each input for NNs to make the prediction. The heat maps suggest that precursors from the lower stratosphere are important for the prediction of the stratospheric polar vortex strength with a lead time of one month while the precursors at the surface and the upper stratosphere become more important with lead times longer than one month. This result is overall consistent with the previous studies that subseasonal precursors to the stratospheric extreme events may come from the lower troposphere. Our study sheds light on the potential of explainable NNs in searching for opportunities for skillful prediction of stratospheric extreme events and, by extension, surface weather on S2S timescales.

How to cite: Wu, Z., Beucler, T., and Domeisen, D.: Extended-range predictability of stratospheric extreme events using explainable neural networks, EGU General Assembly 2023, Vienna, Austria, 23–28 Apr 2023, EGU23-10568, https://doi.org/10.5194/egusphere-egu23-10568, 2023.

One of the main challenges for forecasting fire activity is the tradeoff between accuracy at finer spatial scales relevant to local decision making and predictability over seasonal (next 2-4 months) and subseasonal-to-seasonal (next 2 weeks to 2 months) timescales. To achieve predictability at long lead times and high spatial resolution, several analyses in the literature have constructed statistical models of fire activity using only antecedent climate predictors. However, in this talk, I will present preliminary seasonal forecasts of wildfire frequency and burned area for the western United States using SMLFire1.0, a stochastic machine learning (SML) fire model, that relies on both observed antecedent climate and vegetation predictors and seasonal forecasts of fire month climate. In particular, I will discuss results obtained by forcing the SMLFire1.0 model with seasonal forecasts from: a) downscaled and bias-corrected North American Multi-Model Ensemble (NMME) outputs, and b) skill-weighted climate analogs constructed using an autoregressive ML model. I will also comment upon the relative contribution of uncertainties, from climate forecasts and fire model simulations respectively, in projections of wildfire frequency and burned area across several spatial scales and lead times. 

How to cite: Buch, J., Williams, A. P., and Gentine, P.: Seasonal forecasts of wildfire frequency and burned area in the western United States using a stochastic machine learning fire model, EGU General Assembly 2023, Vienna, Austria, 23–28 Apr 2023, EGU23-11238, https://doi.org/10.5194/egusphere-egu23-11238, 2023.

EGU23-11355 | Posters on site | ITS1.14/CL5.8

Estimation of Fine Dust Concentration from BGR Images in Surveillance Cameras 

Hoyoung Cha, Jongyun Byun, Jongjin Baik, and Changhyun Jun

  This study proposes a novel approach on estimation of fine dust concentration from raw video data recorded by surveillance cameras. At first, several regions of interest are defined from specific images extracted from videos in surveillance cameras installed at Chung-Ang University. Among them, sky fields are mainly considered to figure out changes in characteristics of each color. After converting RGB images into BGR images, a number of discrete pixels with brightness intensities in a blue channel is mainly analyzed by investigating any relationships with fine dust concentration measured from automatic monitoring stations near the campus. Here, different values of thresholds from 125 to 200 are considered to find optimal conditions from changes in values of each pixel in the blue channel. This study uses the Pearson correlation coefficient to calculate the correlation between the number of pixels with values over the selected threshold and observed data for fine dust concentration. As an example on one specific date, the coefficients reflect their positive correlations with a range from 0.57 to 0.89 for each threshold. It should be noted that this study is a novel attempt to suggest a new, simple, and efficient method for estimating fine dust concentration from surveillance cameras common in many areas around the world.


Keywords: Fine Dust Concentration, BGR Image, Surveillance Camera, Threshold, Correlation Analysis


Acknowledgment

  This work was supported by the National Research Foundation of Korea(NRF) grant funded by the Korea government(MSIT) (No. NRF-2022R1A4A3032838) and this work was funded by the Korea Meteorological Administration Research and Development Program under Grant KMI2022-01910 and this work was supported by the National Research Foundation of Korea(NRF) grant funded by the Korea government(MSIT) (2020R1G1A1013624).

How to cite: Cha, H., Byun, J., Baik, J., and Jun, C.: Estimation of Fine Dust Concentration from BGR Images in Surveillance Cameras, EGU General Assembly 2023, Vienna, Austria, 23–28 Apr 2023, EGU23-11355, https://doi.org/10.5194/egusphere-egu23-11355, 2023.

EGU23-12137 | ECS | Posters on site | ITS1.14/CL5.8

Identifying mechanisms of low-level jets near coast of Kurzeme using Principal Component Analysis 

Maksims Pogumirskis, Tija Sīle, and Uldis Bethers

Low-level jets are maximums in the vertical profile of the wind speed profile in the lowest levels of atmosphere. Low-level jets, when present, can make a significant impact on the wind energy. Wind conditions in low-level jets depart from traditional assumptions about wind profile and low-level jets can also influence the stability and turbulence that are important for wind energy applications.

In literature commonly an algorithm of identifying low-level jets is used to estimate frequency of low-level jets. The algorithm searches for maximum in the lowest levels of the atmosphere with a temperature inversion above the jet maximum. The algorithm is useful in identifying the presence of the low-level jets and estimating their frequency. However, low-level jets can be caused by a number of different mechanisms which leads to differences in low-level jet characteristics. Therefore, additional analysis is necessary to distinguish between different types of jets and characterize their properties. We aim to automate this process using Principal Component Analysis (PCA) to identify main patterns of wind speed and temperature. By analyzing diurnal and seasonal cycles of these patterns a better understanding about climatology of low-level jets in the region can be gained.

This study focuses on the central part of the Baltic Sea. Several recent studies have identified the presence of low-level jets near the coast of Kurzeme. Typically, maximums of low-level jets are located several hundred meters above the surface, while near the coast of Kurzeme maximums of low-level jets are usually within the lowest 100 meters of the atmosphere.

Data from UERRA reanalysis with 11 km horizontal resolution on 12 height levels in the lowest 500 meters of atmosphere was used. The algorithm that identifies low-level jets was applied to the data, to estimate frequency of low-level jets in each grid cell of the model. Jet events were grouped by the wind direction to identify main trajectories of low-level jets in the region. Several atmosphere cross-sections that low-level jets frequently flow through were chosen for further analysis.

Model data was interpolated to the chosen cross-sections and PCA was applied to the cross-section data of wind speed, geostrophic wind speed and temperature. Main patterns of these meteorological parameters, such as wind speed maximum, temperature inversion above the surface of the sea and temperature difference between sea and land were identified by the PCA. Differences of principal components between cross-sections and diurnal and seasonal patterns of principal components helped to gain better understanding of climatology, extent and mechanisms of low-level jets in the region.

How to cite: Pogumirskis, M., Sīle, T., and Bethers, U.: Identifying mechanisms of low-level jets near coast of Kurzeme using Principal Component Analysis, EGU General Assembly 2023, Vienna, Austria, 23–28 Apr 2023, EGU23-12137, https://doi.org/10.5194/egusphere-egu23-12137, 2023.

EGU23-12528 | ECS | Orals | ITS1.14/CL5.8

Evaluation of explainable AI solutions in climate science 

Philine Bommer, Marlene Kretschmer, Anna Hedstroem, Dilyara Bareeva, and Marina M.-C. Hoehne

Explainable artificial intelligence (XAI) methods serve as a support for researchers to shed light onto the reasons behind the predictions made by deep neural networks (DNNs). XAI methods have already been successfully applied to climate science, revealing underlying physical mechanisms inherent in the studied data. However, the evaluation and validation of XAI performance is challenging as explanation methods often lack ground truth. As the number of XAI methods is growing, a comprehensive evaluation is necessary to enable well-founded XAI application in climate science.

In this work we introduce explanation evaluation in the context of climate research. We apply XAI evaluation to compare multiple explanation methods for a multi-layer percepton (MLP) and a convolutional neural network (CNN). Both MLP and CNN assign temperature maps to classes based on their decade. We assess the respective explanation methods using evaluation metrics measuring robustness, faithfulness, randomization, complexity and localization. Based on the results of a random baseline test we establish an explanation evaluation guideline for the climate community. We use this guideline to rank the performance in each property of similar sets of explanation methods for the MLP and CNN. Independent of the network type, we find that Integrated Gradients, Layer-wise relevance propagation and InputGradients exhibit a higher robustness, faithfulness and complexity compared to purely Gradient-based methods, while sacrificing reactivity to network parameters, i.e. low randomisation scores. The contrary holds for Gradient, SmoothGrad, NoiseGrad and FusionGrad. Another key observation is that explanations using input perturbations, such as SmoothGrad and Integrated Gradients, do not improve robustness and faithfulness, in contrast to theoretical claims. Our experiments highlight that XAI evaluation can be applied to different network tasks and offers more detailed information about different properties of explanation method than previous research. We demonstrate that using XAI evaluation helps to tackle the challenge of choosing an explanation method.

How to cite: Bommer, P., Kretschmer, M., Hedstroem, A., Bareeva, D., and Hoehne, M. M.-C.: Evaluation of explainable AI solutions in climate science, EGU General Assembly 2023, Vienna, Austria, 23–28 Apr 2023, EGU23-12528, https://doi.org/10.5194/egusphere-egu23-12528, 2023.

EGU23-12657 | Orals | ITS1.14/CL5.8 | Highlight

DeepExtremes: Explainable Earth Surface Forecasting Under Extreme Climate Conditions 

Karin Mora, Gunnar Brandt, Vitus Benson, Carsten Brockmann, Gustau Camps-Valls, Miguel-Ángel Fernández-Torres, Tonio Fincke, Norman Fomferra, Fabian Gans, Maria Gonzalez, Chaonan Ji, Guido Kraemer, Eva Sevillano Marco, David Montero, Markus Reichstein, Christian Requena-Mesa, Oscar José Pellicer Valero, Mélanie Weynants, Sebastian Wieneke, and Miguel D. Mahecha

Compound heat waves and drought events draw our particular attention as they become more frequent. Co-occurring extreme events often exacerbate impacts on ecosystems and can induce a cascade of detrimental consequences. However, the research to understand these events is still in its infancy. DeepExtremes is a project funded by the European Space Agency (https://rsc4earth.de/project/deepextremes/) aiming at using deep learning to gain insight into Earth surface under extreme climate conditions. Specifically, the goal is to forecast and explain extreme, multi-hazard, and compound events. To this end, the project leverages the existing Earth observation archive to help us better understand and represent different types of hazards and their effects on society and vegetation. The project implementation involves a multi-stage process consisting of 1) global event detection; 2) intelligent subsampling and creation of mini-data-cubes; 3) forecasting methods development, interpretation, and testing; and 4) cloud deployment and upscaling. The data products will be made available to the community following the reproducibility and FAIR data principles. By effectively combining Earth system science with explainable AI, the project contributes knowledge to advancing the sustainable management of consequences of extreme events. This presentation will show the progress made so far and specifically introduce how to participate in the challenges about spatio-temporal extreme event prediction in DeepExtremes.

How to cite: Mora, K., Brandt, G., Benson, V., Brockmann, C., Camps-Valls, G., Fernández-Torres, M.-Á., Fincke, T., Fomferra, N., Gans, F., Gonzalez, M., Ji, C., Kraemer, G., Marco, E. S., Montero, D., Reichstein, M., Requena-Mesa, C., Valero, O. J. P., Weynants, M., Wieneke, S., and Mahecha, M. D.: DeepExtremes: Explainable Earth Surface Forecasting Under Extreme Climate Conditions, EGU General Assembly 2023, Vienna, Austria, 23–28 Apr 2023, EGU23-12657, https://doi.org/10.5194/egusphere-egu23-12657, 2023.

EGU23-12889 | Orals | ITS1.14/CL5.8

New Berkeley Earth High Resolution Temperature Data Set 

Robert A. Rohde and Zeke Hausfather

Berkeley Earth is premiering a new high resolution analysis of historical instrumental temperatures.

This builds on our existing work on climate reconstruction by adding a simple machine learning layer to our analysis.  This new approach extracts weather patterns from model, satellite, and reanalysis data, and then layers these weather patterns on top of instrumental observations and our existing interpolation methods to produce new high resolution historical temperature fields.  This has quadrupled our output resolution from the previous 1° x 1° lat-long to a new global 0.25° x 0.25° lat-long resolution.  However, this is not simply a downscaling effort.  Firstly, the use of weather patterns derived from physical models and observations increases the spatial realism of the reconstructed fields.  Secondly, observations from regions with high density measurement networks have been directly incorporated into the high resolution field, allowing dense observations to be more fully utilized.  

This new data product uses significantly more observational weather station data and produces higher resolution historical temperature fields than any comparable product, allowing for unprecedented insights into historical local and regional climate change.  In particular, the effect of geographic features such as mountains, coastlines, and ecosystem variations are resolved with a level of detail that was not previously possible.  At the same time, previously established techniques for bias corrections, noise reduction, and error analysis continued to be utilized.  The resulting global field initially spans 1850 to present and will be updated on an ongoing basis.  This project does not significantly change the global understanding of climate change, but helps to provide local detail that was often unresolved previously.  The initial data product focuses on monthly temperatures, though a proposal exists to also create a high resolution daily temperature data set using similar methods.

This talk will describe the construction of the new data set and its characteristics.  The techniques used in this project are accessible enough that they are likely to be useful for other types of instrumental analyses wishing to improve resolution or leverage basic information about weather patterns derived from models or other sources.

How to cite: Rohde, R. A. and Hausfather, Z.: New Berkeley Earth High Resolution Temperature Data Set, EGU General Assembly 2023, Vienna, Austria, 23–28 Apr 2023, EGU23-12889, https://doi.org/10.5194/egusphere-egu23-12889, 2023.

EGU23-12948 | ECS | Orals | ITS1.14/CL5.8

Identifying drivers of river floods using causal inference 

Peter Miersch, Shijie Jiang, Oldrich Rakovec, and Jakob Zscheischler

River floods are among the most devastating natural hazards, causing thousands of deaths and billions of euros in damages every year. Floods can result from a combination of compounding drivers such as heavy precipitation, snowmelt, and high antecedent soil moisture. These drivers and the processes they govern vary widely both between catchments and between flood events within a catchment, making a causal understanding of the underlying hydrological processes difficult.

Modern causal inference methods, such as the PCMCI framework, are able to identify drivers from complex time series through causal discovery and build causally aware statistical models. However, causal inference tailored to extreme events remains a challenge due to data length limitations. To overcome data limitations, here we bridge the gap between synthetic and real world data using 1,000 years of simulated weather to drive as state-of-the-art hydrological model (the mesoscale Hydrological Model, mHM) over a wide range of European catchments. From the simulated time series, we extract high runoff events, on which we evaluate the causal inference approach. We identify the minimum data necessary for obtaining robust causal models, evaluate metrics for model evaluation and comparison, and compare causal flood drivers across catchments. Ultimately, this work will help establish best practices in causal inference for flood research to identify meteorological and catchment specific flood drivers in a changing climate.

How to cite: Miersch, P., Jiang, S., Rakovec, O., and Zscheischler, J.: Identifying drivers of river floods using causal inference, EGU General Assembly 2023, Vienna, Austria, 23–28 Apr 2023, EGU23-12948, https://doi.org/10.5194/egusphere-egu23-12948, 2023.

EGU23-13250 | ECS | Posters on site | ITS1.14/CL5.8

From MODIS cloud properties to cloud types using semi-supervised learning 

Julien Lenhardt, Johannes Quaas, and Dino Sejdinovic

Clouds are classified into types, classes, or regimes. The World Meteorological Organization distinguishes stratus and cumulus clouds and three altitude layers. Cloud types exhibit very different radiative properties and interact in numerous ways with aerosol particles in the atmosphere. However, it has proven difficult to define cloud regimes objectively and from remote sensing data, hindering the understanding we have of the processes and adjustments involved.

Building on the method we previously developed, we combine synoptic observations and passive satellite remote-sensing retrievals to constitute a database of cloud types and cloud properties to eventually train a cloud classification algorithm. The cloud type labels come from the global marine meteorological observations dataset (UK Met Office, 2006) which is comprised of near-global synoptic observations. This data record reports back information about cloud type and other meteorological quantities at the surface. The cloud classification model is built on different cloud-top and cloud optical properties (Level 2 products MOD06/MYD06 from the MODIS sensor) extracted temporally close to the observation time and on a 128km x 128km grid around the synoptic observation location. To make full use of the large quantity of remote sensing data available and to investigate the variety in cloud settings, a convolutional variational auto-encoder (VAE) is applied as a dimensionality reduction tool in a first step. Furthermore, such model architecture allows to account for spatial relationships while describing non-linear patterns in the input data. The cloud classification task is subsequently performed drawing on the constructed latent representation of the VAE. Associating information from underneath and above the cloud enables to build a robust model to classify cloud types. For the training we specify a study domain in the Atlantic ocean around the equator and evaluate the method globally. Further experiments and evaluation are done on simulation data produced by the ICON model.

How to cite: Lenhardt, J., Quaas, J., and Sejdinovic, D.: From MODIS cloud properties to cloud types using semi-supervised learning, EGU General Assembly 2023, Vienna, Austria, 23–28 Apr 2023, EGU23-13250, https://doi.org/10.5194/egusphere-egu23-13250, 2023.

EGU23-13462 | ECS | Orals | ITS1.14/CL5.8

Double machine learning for geosciences 

Kai-Hendrik Cohrs, Gherardo Varando, Markus Reichstein, and Gustau Camps-Valls

Hybrid modeling describes the synergy between parametric models and machine learning [1]. Parts of a parametric equation are substituted by non-parametric machine learning models, which can then represent complex functions. These are inferred together with the parameters of the equation from the data. Hybrid modeling promises to describe complex relationships and to be scientifically interpretable. These promises, however, need to be taken with a grain of salt. With too flexible models, such as deep neural networks, the problem of equifinality arises: There is no identifiable optimal solution. Instead, many outcomes describe the data equally well, and we will obtain one of them by chance. Interpreting the result may lead to erroneous conclusions. Moreover, studies have shown that regularization techniques can introduce a bias on jointly estimated physical parameters [1].

We propose double machine learning (DML) to solve these problems [2]. DML is a theoretically well-founded technique for fitting semi-parametric models, i.e., models consisting of a parametric and a non-parametric component. DML is widely used for debiased treatment effect estimation in economics. We showcase its use for geosciences on two problems related to carbon dioxide fluxes: 

  • Flux partitioning, which aims at separating the net carbon flux (NEE) into its main contributing gross fluxes, namely, RECO and GPP.
  • Estimation of the temperature sensitivity parameter of ecosystem respiration Q10.

First, we show that in the case of synthetic data for Q10 estimation, we can consistently retrieve the true value of Q10 where the naive neural network approach fails. We further apply DML to the carbon flux partitioning problem and find that it is 1) able to retrieve the true fluxes of synthetic data, even in the presence of strong (and more realistic) heteroscedastic noise, 2) retrieves main gross carbon fluxes on real data consistent with established methods, and 3) allows us to causally interpret the retrieved GPP as the direct effect of the photosynthetically active radiation on NEE. This way, the DML approach can be seen as a causally interpretable, semi-parametric version of the established daytime methods. We also investigate the functional relationships inferred with DML and the drivers modulating the obtained light-use efficiency function. In conclusion, DML offers a solid framework to develop hybrid and semiparametric modeling and can be of widespread use in geosciences.


[1] Reichstein, Markus, et al. “Combining system modeling and machine learning into hybrid ecosystem modeling.” Knowledge-Guided Machine Learning (2022). https://doi.org/10.1201/9781003143376-14

[2] Chernozhukov, Victor, et al. “Double/debiased machine learning for treatment and structural parameters.” The Econometrics Journal, Volume 21, Issue 1, 1 (2018): C1–C68. https://doi.org/10.1111/ectj.12097

How to cite: Cohrs, K.-H., Varando, G., Reichstein, M., and Camps-Valls, G.: Double machine learning for geosciences, EGU General Assembly 2023, Vienna, Austria, 23–28 Apr 2023, EGU23-13462, https://doi.org/10.5194/egusphere-egu23-13462, 2023.

EGU23-13622 | ECS | Posters on site | ITS1.14/CL5.8

Towards explainable marine heatwaves forecasts 

Ayush Prasad and Swarnalee Mazumder

In recent years, both the intensity and extent of marine heatwaves have increased across the world. Anomalies in sea surface temperature have an effect on the health of marine ecosystems, which are crucial to the Earth's climate system. Marine Heatwaves' devastating impacts on aquatic life have been increasing steadily in recent years, harming aquatic ecosystems and causing a tremendous loss of marine life. Early warning systems and operational forecasting that can foresee such events can aid in designing effective and better mitigation techniques. Recent studies have shown that machine learning and deep learning-based approaches can be used for forecasting the occurrence of marine heatwaves up to a year in advance. However, these models are black box in nature and do not provide an understanding of the factors influencing MHWs. In this study, we used machine learning methods to forecast marine heatwaves. The developed models were tested across four historical Marine Heatwave events around the world. Explainable AI methods were then used to understand and analyze the relationships between the drivers of these events.

How to cite: Prasad, A. and Mazumder, S.: Towards explainable marine heatwaves forecasts, EGU General Assembly 2023, Vienna, Austria, 23–28 Apr 2023, EGU23-13622, https://doi.org/10.5194/egusphere-egu23-13622, 2023.

EGU23-14493 | ECS | Orals | ITS1.14/CL5.8

Interpretable probabilistic forecast of extreme heat waves 

Alessandro Lovo, Corentin Herbert, and Freddy Bouchet
Understanding and predicting extreme events is one of the major challenges for the study of climate change impacts, risk assessment, adaptation, and the protection of living beings. Extreme heatwaves are, and likely will be in the future, among the deadliest weather events. They also increase strain on water resources, food security and energy supply. Developing the ability to forecast their probability of occurrence a few days, weeks, or even months in advance would have major consequences to reduce our vulnerability to these events. Beyond the practical benefits of forecasting heat waves, building statistical models for extreme events which are interpretable is also highly beneficial from a fundamental point of view. Indeed, they enable proper studies of the processes underlying extreme events such as heat waves, improve dataset or model validation, and contribute to attribution studies. Machine learning provides tools to reach both these goals.
We will first demonstrate that deep neural networks can predict the probability of occurrence of long-lasting 14-day heatwaves over France, up to 15 days ahead of time for fast dynamical drivers (500 hPa geopotential height field), and at much longer lead times for slow physical drivers (soil moisture). Those results are amazing in terms of forecasting skill. However, these machine learning models tend to be very complex and are often treated as black boxes. This limits our ability to use them for investigating the dynamics of extreme heat waves.
To gain physical understanding, we have then designed a network architecture which is intrinsically interpretable. The main idea of this architecture is that the network first computes an optimal index, which is an optimal projection of the physical fields in a low-dimensional space. In a second step, it uses a fully non-linear representation of the probability of occurrence of the event as a function of the optimal index. This optimal index can be visualized and compared with classical heuristic understanding of the physical process, for instance in terms of geopotential height and soil moisture. This fully interpretable network is slightly less efficient than the off-the-shelf deep neural network. We fully quantify the performance loss incurred when requiring interpretability and make the connection with the mathematical notion of committor functions.
This new machine learning tool opens the way for understanding optimal predictors of weather and climate extremes. This has potential for the study of slow drivers, and the effect of climate change on the drivers of extreme events.

How to cite: Lovo, A., Herbert, C., and Bouchet, F.: Interpretable probabilistic forecast of extreme heat waves, EGU General Assembly 2023, Vienna, Austria, 23–28 Apr 2023, EGU23-14493, https://doi.org/10.5194/egusphere-egu23-14493, 2023.

EGU23-14856 | ECS | Orals | ITS1.14/CL5.8

Classification of Indoor Air Pollution Using Low-cost Sensors by Machine Learning 

Andrii Antonenko, Viacheslav Boretskij, and Oleksandr Zagaria

Air pollution has become an integral part of modern life. The main source of air pollution can be considered combustion processes associated with energy-intensive corporate activities. Energy companies consume about one-third of the fuel produced and are a significant source of air pollution [1]. State and public air quality monitoring networks were created to monitor the situation. Public monitoring networks are cheaper and have more coverage than government ones. Although the state monitoring system shows more accurate data, an inexpensive network is sufficient to inform the public about the presence or absence of pollution (air quality). In order to inform the public, the idea arose to test the possibility of detecting types of pollution using data from cheap air quality monitoring sensors. In general, to use a cheap sensor for measurements, it must first be calibrated (corrected) by comparing its readings with a reference device. Various mathematical methods can be used for this. One of such method is neural network training, which has proven itself well for correcting PM particle readings due to relative humidity impact [2].

The idea of using a neural network to improve data quality is not new, but it is quite promising, as the authors showed in [3]. The main problem to implement this method is connected with a reliable dataset for training the network. For this, it is necessary to register sensor readings for relatively clean air and for artificially generated or known sources of pollution. Training the neural network on the basis of collected data can be used to determine (classify) types of air: with pollution (pollutant) or without. For this, an experiment was set up in the "ReLab" co-working space at the Taras Shevchenko National University of Kyiv. The sensors were placed in a closed box, in which airflow ventilation is provided. The ZPHS01B [4] sensor module was used for inbox measurements, as well as, calibrated sensors PMS7003 [5] and BME280 [6]. Additionally, IPS 7100 [7] and SPS30 [8] were added to enrich the database for ML training. A platform based on HiLink 7688 was used for data collecting, processing, and transmission.

Data was measured every two seconds, independently from each sensor. Before each experiment, the room was ventilated to avoid influence on the next series of experiments.

References

1. Zaporozhets A. Analysis of means for monitoring air pollution in the environment. Science-based technologies. 2017, Vol. 35, no3. 242-252. DOI: 10.18372/2310-5461.35.11844

2. Antonenko A, (2021) Correction of fine particle concentration readings depending on relative humidity, [Master's thesis, Taras Shevchenko National University of Kyiv], 35 pp.

3. Lee, J. Kang, S. Kim, Y. Im, S. Yoo , D. Lee, “Long-Term Evaluation and Calibration of Low-Cost Particulate Matter (PM) Sensor”, Sensors 2020, vol. 20, 3617, 24 pp., 2020.`

4. ZPHS01B Datasheet URL: https://pdf1.alldatasheet.com/datasheet-pdf/view/1303697/WINSEN/ZPHS01B.html

5. Plantower PMS7003 Datasheet URL: https://www.espruino.com/datasheets/PMS7003.pdf

6. Bosch 280 Datasheet URL: https://www.mouser.com/datasheet/2/783/BST-BME280-DS002-1509607.pdf

7. https://pierasystems.com/intelligent-particle-sensors/

8. https://sensirion.com/products/catalog/SPS30/

How to cite: Antonenko, A., Boretskij, V., and Zagaria, O.: Classification of Indoor Air Pollution Using Low-cost Sensors by Machine Learning, EGU General Assembly 2023, Vienna, Austria, 23–28 Apr 2023, EGU23-14856, https://doi.org/10.5194/egusphere-egu23-14856, 2023.

EGU23-15000 | ECS | Orals | ITS1.14/CL5.8 | Highlight

Causal inference to study food insecurity in Africa 

Jordi Cerdà-Bautista, José María Tárraga, Gherardo Varando, Alberto Arribas, Ted Shepherd, and Gustau Camps-Valls

The current situation regarding food insecurity in the continent of Africa, and the Horn of Africa in particular, is at an unprecedented risk level triggered by continuous drought events, complicated interactions between food prices, crop yield, energy inflation and lack of humanitarian aid, along with disrupting conflicts and migration flows. The study of a food-secure environment is a complex, multivariate, multiscale, and non-linear problem difficult to understand with canonical data science methodologies. We propose an alternative approach to the food insecurity problem from a causal inference standpoint to discover the causal relations and evaluate the likelihood and potential consequences of specific interventions. In particular, we demonstrate the use of causal inference for understanding the impact of humanitarian interventions on food insecurity in Somalia. In the first stage of the problem, we apply different data transformations to the main drivers to achieve the highest degree of correlation with the interested variable. In the second stage, we infer causation from the main drivers and interested variables by applying different causal methods such as PCMCI or Granger causality. We analyze and harmonize different time series, per district of Somalia, of the global acute malnutrition (GAM) index, food market prices, crop production, conflict levels, drought and flood internal displacements, as well as climate indicators such as the NDVI index, precipitation or land surface temperature. Then, assuming a causal graph between the main drivers causing the food insecurity problem, we estimate the effect of increasing humanitarian interventions on the GAM index, considering the effects of a changing climate, migration flows, and conflict events. We show that causal estimation with modern methodologies allows us to quantify the impact of humanitarian aid on food insecurity.


References


[1] Runge, J., Bathiany, S., Bollt, E. et al. Inferring causation from time series in Earth system sciences. Nat Commun 10, 2553 (2019). https://doi.org/10.1038/s41467-019-10105-3

[2] Sazib Nazmus, Mladenova lliana E., Bolten John D., Assessing the Impact of ENSO on Agriculture Over Africa Using Earth Observation Data, Frontiers in Sustainable Food Systems, 2020, 10.3389/fsufs.2020.509914. https://www.frontiersin.org/article/10.3389/fsufs.2020.509914

[3] Checchi, F., Frison, S., Warsame, A. et al. Can we predict the burden of acute malnutrition in crisis-affected countries? Findings from Somalia and South Sudan. BMC Nutr 8, 92 (2022). https://doi.org/10.1186/s40795-022-00563-2

How to cite: Cerdà-Bautista, J., Tárraga, J. M., Varando, G., Arribas, A., Shepherd, T., and Camps-Valls, G.: Causal inference to study food insecurity in Africa, EGU General Assembly 2023, Vienna, Austria, 23–28 Apr 2023, EGU23-15000, https://doi.org/10.5194/egusphere-egu23-15000, 2023.

EGU23-15185 | ECS | Posters on site | ITS1.14/CL5.8

Deep learning to support ocean data quality control 

Mohamed Chouai, Felix Simon Reimers, and Sebastian Mieruch-Schnülle

In this study, which is part of the M-VRE [https://mosaic-vre.org/about] project, we aim to improve a quality control (QC) system on arctic ocean temperature profile data using deep learning. For the training, validation, and evaluation of our algorithms, we are using the UDASH dataset [https://essd.copernicus.org/articles/10/1119/2018/]. In the classical QC setting, the ocean expert or "operator", applies a series of thresholding (classical) algorithms to identify, i.e. flag, erroneous data. In the next step, the operator visually inspects every data profile, where suspicious samples have been identified. The goal of this time-consuming visual QC is to find "false positives", i.e. flagged data that is actually good, because every sample/profile has not only a scientific value but also a monetary one. Finally, the operator turns all "false positive" data back to good. The crucial point here is that although these samples/profiles are above certain thresholds they are considered good by the ocean expert. These human expert decisions are extremely difficult, if not impossible, to map by classical algorithms. However, deep-learning neural networks have the potential to learn complex human behavior. Therefore, we have trained a deep learning system to "learn" exactly the expert behavior of finding "false positives" (identified by the classic thresholds), which can be turned back to good accordingly. The first results are promising. In a fully automated setting, deep learning improves the results and fewer data are flagged. In a subsequent visual QC setting, deep learning relieves the expert with a distinct workload reduction and gives the option to clearly increase the quality of the data.
Our long-term goal is to develop an arctic quality control system as a series of web services and Jupyter notebooks to apply automated and visual QC online, efficient, consistent, reproducible, and interactively.

How to cite: Chouai, M., Simon Reimers, F., and Mieruch-Schnülle, S.: Deep learning to support ocean data quality control, EGU General Assembly 2023, Vienna, Austria, 23–28 Apr 2023, EGU23-15185, https://doi.org/10.5194/egusphere-egu23-15185, 2023.

EGU23-15286 | ECS | Orals | ITS1.14/CL5.8

Spatio-temporal downscaling of precipitation data using a conditional generative adversarial network 

Luca Glawion, Julius Polz, Benjamin Fersch, Harald Kunstmann, and Christian Chwala

Natural disasters caused by cyclones, hail, landslides or floods are directly related to precipitation. Global climate models are an important tool to adapt to these hazards in a future climate. However, they operate on spatial and temporal discretizations that limit the ability to adequately reflect these fast evolving, highly localized phenomena which has led to the development of various downscaling approaches .

Conditional generative adversarial networks (cGAN) have recently been applied as a promising downscaling technique to improve the spatial resolution of climate data. The ability of GANs to generate ensembles of solutions from random perturbations can be used to account for the stochasticity of climate data and quantify uncertainties. 

We present a cGAN for not only downscaling the spatial, but simultaneously also the temporal dimension of precipitation data as a so-called video super resolution approach. 3D convolutional layers are exploited for extracting and generating temporally consistent  rain events with realistic fine-scale structure. We downscale coarsened gauge adjusted and climatology corrected precipitation data from Germany from a spatial resolution of 32 km to 2 km and a temporal resolution of 1 hr to 10 min, by applying a novel training routine using partly normalized and logarithmized data, allowing for improved extreme value statistics of the generated fields.

Exploiting the fully convolutional nature of our model we can generate downscaled maps for the whole of Germany in a single downscaling step at low latency. The evaluation of these maps using a spatial and temporal power spectrum analysis shows that the generated temporal and spatial structures are in high agreement with the reference. Visually, the generated temporally evolving and advecting rain events are hardly classifiable as artificial generated. The model also shows high skill regarding pixel-wise error and localization of high precipitation intensities, considering the FSS, CRPS, KS and RMSE. Due to the underdetermined downscaling problem a probabilistic cGAN approach yields additional information to deterministic models which we use for comparison. The method is also capable of preserving the climatology, e.g., expressed as the annual precipitation sum. Investigations of temporal aggregations of the downscaled fields revealed an interesting effect. We observe that structures generated in networks with convolutional layers are not placed completely at random, but can generate recurrent structures, which can also be discovered within other prominent DL downscaling models. Although they can be mitigated by adequate model selection, their occurrence remains an open research question.

We conclude that our proposed approach can extend the application of cGANs for downscaling to the time dimension and therefore is a promising candidate to supplement conventional downscaling methods due to the high performance and computational efficiency.

How to cite: Glawion, L., Polz, J., Fersch, B., Kunstmann, H., and Chwala, C.: Spatio-temporal downscaling of precipitation data using a conditional generative adversarial network, EGU General Assembly 2023, Vienna, Austria, 23–28 Apr 2023, EGU23-15286, https://doi.org/10.5194/egusphere-egu23-15286, 2023.

EGU23-15540 | ECS | Posters on site | ITS1.14/CL5.8 | Highlight

USCC: A Benchmark Dataset for Crop Yield Prediction under Climate Extremes 

Adrian Höhl, Stella Ofori-Ampofo, Ivica Obadic, Miguel-Ángel Fernández-Torres, Ridvan Salih Kuzu, and Xiaoxiang Zhu

Climate variability and extremes are known to represent major causes for crop yield anomalies. They can lead to the reduction of crop productivity, which results in disruptions in food availability and nutritional quality, as well as in rising food prices. Extreme climates will become even more severe as global warming proceeds, challenging the achievement of food security. These extreme events, especially droughts and heat waves, are already evident in major food-production regions like the United States. Crops cultivated in this country such as corn and soybean are critical for both domestic use and international supply. Considering the sensitivity of crops to climate, here we present a dataset that couples remote sensing surface reflectances with climate variables (e.g. minimum and maximum temperature, precipitation, and vapor pressure) and extreme indicators. The dataset contains the crop yields of various commodities over the USA for nearly two decades. Given the advances and proven success of machine learning in numerous remote sensing tasks, our dataset constitutes a benchmark to advance the development of novel models for crop yield prediction, and to analyze the relationship between climate and crop yields for gaining scientific insights. Other potential use cases include extreme event detection and climate forecasting from satellite imagery. As a starting point, we evaluate the performance of several state-of-the-art machine and deep learning models to form a baseline for our benchmark dataset.

How to cite: Höhl, A., Ofori-Ampofo, S., Obadic, I., Fernández-Torres, M.-Á., Salih Kuzu, R., and Zhu, X.: USCC: A Benchmark Dataset for Crop Yield Prediction under Climate Extremes, EGU General Assembly 2023, Vienna, Austria, 23–28 Apr 2023, EGU23-15540, https://doi.org/10.5194/egusphere-egu23-15540, 2023.

EGU23-15817 | ECS | Posters on site | ITS1.14/CL5.8

Evaluating the generalization ability of a deep learning model trained to detect cloud-to-ground lightning on raw ERA5 data 

Gregor Ehrensperger, Tobias Hell, Georg Johann Mayr, and Thorsten Simon

Atmospheric conditions that are typical for lightning are commonly represented by proxies such as cloud top height, cloud ice flux, CAPE times precipitation, or the lightning potential index. While these proxies generally deliver reasonable results, they often need to be adapted for local conditions in order to perform well. This suggests that there is a need for more complex and holistic proxies. Recent research confirms that the use of machine learning (ML) approaches for describing lightning is promising.

In a previous study a deep learning model was trained on single spatiotemporal (30km x 30km x 1h) cells in the summer period of the years 2010--2018 and showed good results for the unseen test year 2019 within Austria. We now improve this model by using multiple neighboring vertical atmospheric columns to also address for horizontal moisture advection. Furthermore data of successive hours is used as input data to enable the model to capture the temporal development of atmospheric conditions such as the build-up and breakdown of convections.

In this work we focus on the summer months June to August and use data from parts of Central Europe. This spatial domain is thought to be representative for Continental Europe since it covers mountainous aswell as coastal regions. We take raw ERA5 parameters beyond the tropopause enriched with a small amount of meta data such as the day of the year and the hour of the day for training. The quality of the resulting paramaterized model is then evaluated on Continental Europe to examine the generalization ability.

Using parts of Central Europe to train the model, we evaluate its ability to generalize on unseen parts of Continental Europe using EUCLID data. Having a model that generalizes well is a building block for a retrospective analysis back into years where the structured recording of accurate lightning observations in a unified way was not established yet.

How to cite: Ehrensperger, G., Hell, T., Mayr, G. J., and Simon, T.: Evaluating the generalization ability of a deep learning model trained to detect cloud-to-ground lightning on raw ERA5 data, EGU General Assembly 2023, Vienna, Austria, 23–28 Apr 2023, EGU23-15817, https://doi.org/10.5194/egusphere-egu23-15817, 2023.

EGU23-16098 | Posters on site | ITS1.14/CL5.8

Identifying Lightning Processes in ERA5 Soundings with Deep Learning 

Tobias Hell, Gregor Ehrensperger, Georg J. Mayr, and Thorsten Simon

Atmospheric environments favorable for lightning and convection are commonly represented by proxies or parameterizations based on expert knowledge such as CAPE, wind shears, charge separation, or combinations thereof. Recent developments in the field of machine learning, high resolution reanalyses, and accurate lightning observations open possibilities for identifying tailored proxies without prior expert knowledge. To identify vertical profiles favorable for lightning, a deep neural network links ERA5 vertical profiles of cloud physics, mass field variables and wind to lightning location data from the Austrian Lightning Detection & Information System (ALDIS), which has been transformed to a binary target variable labelling the ERA5 cells as lightning and no lightning cells. The ERA5 parameters are taken on model levels beyond the tropopause forming an input layer of approx. 670 features. The data of 2010 - 2018 serve as training/validation. On independent test data, 2019, the deep network outperforms a reference with features based on meteorological expertise. Shapley values highlight the atmospheric processes learned by the network which identifies cloud ice and snow content in the upper and mid-troposphere as relevant features. As these patterns correspond to the separation of charge in thunderstorm cloud, the deep learning model can serve as physically meaningful description of lightning. 

How to cite: Hell, T., Ehrensperger, G., Mayr, G. J., and Simon, T.: Identifying Lightning Processes in ERA5 Soundings with Deep Learning, EGU General Assembly 2023, Vienna, Austria, 23–28 Apr 2023, EGU23-16098, https://doi.org/10.5194/egusphere-egu23-16098, 2023.

EGU23-16163 | ECS | Posters on site | ITS1.14/CL5.8

A comparison of methods for determining the number of classes in unsupervised classification of climate models 

Emma Boland, Dani Jones, and Erin Atkinson

Unsupervised classification is becoming an increasingly common method to objectively identify coherent structures within both observed and modelled climate data. However, the user must choose the number of classes to fit in advance. Typically, a combination of statistical methods and expertise is used to choose the appropriate number of classes for a given study, however it may not be possible to identify a single ‘optimal’ number of classes. In this
work we present a heuristic method for determining the number of classes unambiguously for modelled data where more than one ensemble member is available. This method requires robustness in the class definition between simulated ensembles of the system of interest. For demonstration, we apply this to the clustering of Southern Ocean potential temperatures in a CMIP6 climate model, and compare with other common criteria such as Bayesian Information Criterion (BIC) and the Silhouette Score.

How to cite: Boland, E., Jones, D., and Atkinson, E.: A comparison of methods for determining the number of classes in unsupervised classification of climate models, EGU General Assembly 2023, Vienna, Austria, 23–28 Apr 2023, EGU23-16163, https://doi.org/10.5194/egusphere-egu23-16163, 2023.

EGU23-16186 | ECS | Posters on site | ITS1.14/CL5.8

A review of deep learning for weather prediction 

Jannik Thümmel, Martin Butz, and Bedartha Goswami

Recent years have seen substantial performance-improvements of deep-learning-based
weather prediction models (DLWPs). These models cover a large range of temporal and
spatial resolutions—from nowcasting to seasonal forecasting and on scales ranging from
single to hundreds of kilometers. DLWPs also exhibit a wide variety of neural architec-
tures and training schemes, with no clear consensus on best practices. Focusing on the
short-to-mid-term forecasting ranges, we review several recent, best-performing models
with respect to critical design choices. We emphasize the importance of self-organizing
latent representations and inductive biases in DLWPs: While NWPs are designed to sim-
ulate resolvable physical processes and integrate unresolvable subgrid-scale processes by
approximate parameterizations, DLWPs allow the latent representation of both kinds of
dynamics. The purpose of this review is to facilitate targeted research developments and
understanding of how design choices influence performance of DLWPs. While there is
no single best model, we highlight promising avenues towards accurate spatio-temporal
modeling, probabilistic forecasts and computationally efficient training and infer

How to cite: Thümmel, J., Butz, M., and Goswami, B.: A review of deep learning for weather prediction, EGU General Assembly 2023, Vienna, Austria, 23–28 Apr 2023, EGU23-16186, https://doi.org/10.5194/egusphere-egu23-16186, 2023.

EGU23-16443 | ECS | Orals | ITS1.14/CL5.8

Hybrid machine learning model of coupled carbon and water cycles 

Zavud Baghirov, Basil Kraft, Martin Jung, Marco Körner, and Markus Reichstein

There is evidence for a strong coupling between the terrestrial carbon and water cycles and that these cycles should be studied as an interconnected system (Humphrey et al. 2018). One of the key methods to numerically represent the Earth system is process based modelling, which is, however, still subject to large uncertainties, e.g., due to wrong or incomplete process knowledge (Bonan and Doney 2018). Such models are often rigid and only marginally informed by Earth observations. This is where machine learning (ML) approaches can be advantageous, due to their ability to learn from data in a flexible way. These methods have their own shortcomings, such as their “black-box” nature and lack of physical consistency.

Recently, it has been suggested by Reichstein et al. (2019) to combine process knowledge with ML algorithms to model environmental processes. The so-called hybrid modelling approach has already been used to model different components of terrestrial water storage (TWS) in a global hydrological model (Kraft et al. 2022). This study follows-up on this work with the objective to improve the parameterization of some processes (e.g., soil moisture) and to couple the model with the carbon cycle. The coupling could potentially reduce model uncertainties and help to better understand water-carbon interactions.

The proposed hybrid model of the coupled water and carbon cycles is forced with reanalysis data from ERA-5, such as air temperature, net radiation, and CO2 concentration from CAMS. Water-carbon cycle processes are constrained using observational data products of water-carbon cycles. The hybrid model uses a long short-term memory (LSTM) model—a member of the recurrent neural networks family—at its core for processing the time-series Earth observation data. The LSTM simulates a number of coefficients which are used as parameters in the conceptual model of water and carbon cycles. Some of the key processes represented in the conceptual model are evapotranspiration, snow, soil moisture, runoff, groundwater, water use efficiency (WUE), ecosystem respiration, and net ecosystem exchange. The model partitions TWS into different components and it can be used to assess the impact of different TWS components on the CO2 growth rate. Moreover, we can assess the learned system behaviors of water and carbon cycle interactions for different ecosystems.

References:

Bonan, Gordon B, and Scott C Doney. 2018. “Climate, Ecosystems, and Planetary Futures: The Challenge to Predict Life in Earth System Models.” Science 359 (6375): eaam8328.

Humphrey, Vincent, Jakob Zscheischler, Philippe Ciais, Lukas Gudmundsson, Stephen Sitch, and Sonia I Seneviratne. 2018. “Sensitivity of Atmospheric CO2 Growth Rate to Observed Changes in Terrestrial Water Storage.” Nature 560 (7720): 628–31.

Kraft, Basil, Martin Jung, Marco Körner, Sujan Koirala, and Markus Reichstein. 2022. “Towards Hybrid Modeling of the Global Hydrological Cycle.” Hydrology and Earth System Sciences 26 (6): 1579–1614.

Reichstein, Markus, Gustau Camps-Valls, Bjorn Stevens, Martin Jung, Joachim Denzler, Nuno Carvalhais, et al. 2019. “Deep Learning and Process Understanding for Data-Driven Earth System Science.” Nature 566 (7743): 195–204.

How to cite: Baghirov, Z., Kraft, B., Jung, M., Körner, M., and Reichstein, M.: Hybrid machine learning model of coupled carbon and water cycles, EGU General Assembly 2023, Vienna, Austria, 23–28 Apr 2023, EGU23-16443, https://doi.org/10.5194/egusphere-egu23-16443, 2023.

EGU23-16449 | Orals | ITS1.14/CL5.8

Data-driven seasonal forecasts of European heat waves 

Stefano Materia, Martin Jung, Markus G. Donat, and Carlos Gomez-Gonzalez

Seasonal Forecasts are critical tools for early-warning decision support systems, that can help reduce the related risk associated with hot or cold weather and other events that can strongly affect a multitude of socio-economic sectors. Recent advances in both statistical approaches and numerical modeling have improved the skill of Seasonal Forecasts. However, especially in mid-latitudes, they are still affected by large uncertainties that can limit their usefulness.

The MSCA-H2020 project ARTIST aims at improving our knowledge of climate predictability at the seasonal time-scale, focusing on the role of unexplored drivers, to finally enhance the performance of current prediction systems. This effort is meant to reduce uncertainties and make forecasts efficiently usable by regional meteorological services and private bodies. This study focuses on seasonal prediction of heat extremes in Europe, and here we present a first attempt to predict heat wave accumulated activity across different target seasons. An empirical seasonal forecast is designed based on Machine Learning techniques. A feature selection approach is used to detect the best subset of predictors among a variety of candidates, and then an assessment of the relative importance of each predictor is done, in different European regions for the four main seasons.

Results show that many observed teleconnections are caught by the data-driven approach, while a few features that show to be linked to the heat wave propensity of a season deserve a deeper understanding of the underpinning physical process.

How to cite: Materia, S., Jung, M., Donat, M. G., and Gomez-Gonzalez, C.: Data-driven seasonal forecasts of European heat waves, EGU General Assembly 2023, Vienna, Austria, 23–28 Apr 2023, EGU23-16449, https://doi.org/10.5194/egusphere-egu23-16449, 2023.

EGU23-16846 | ECS | Orals | ITS1.14/CL5.8

Learning causal drivers of PyroCb 

Emiliano Díaz, Gherardo Varando, Fernando Iglesias-Suarez, Gustau Camps-Valls, Kenza Tazi, Kara Lamb, and Duncan Watson-Parris

Discovering causal relationships from purely observational data is often not possible. In this case, combining observational and experimental data can allow for the identifiability of the underlying causal structure. In Earth Systems sciences, carrying out interventional experiments is often impossible for ethical and practical reasons. However, “natural interventions”, are often present in the data, and these represent regime changes caused by changes to exogenous drivers. In [3,4], the Invariant Causal Prediction (ICP) methodology was presented to identify the causes of a target variable of interest from a set of candidate causes. This methodology takes advantage of natural interventions, resulting in different cause variables distributions across different environments.  In [2] this methodology is implemented in a geoscience problem, namely identifying the causes of Pyrocumulunimbus (pyroCb), and storm clouds resulting from extreme wildfires. Although a set of plausible causes is produced, certain heuristic adaptations to the original ICP methodology were implemented to overcome some of the practical. limitations of ICP: a large number of hypothesis tests required and a failure to identify causes when these have a high degree of interdependence. In this work, we try to circumvent these difficulties by taking a different approach. We use a learning paradigm similar to that presented in [3] to learn causal representations invariant across different environments. Since we often don’t know exactly how to define the different environments best, we also propose to learn functions that describe their spatiotemporal extent. We apply the resulting algorithm to the pyroCb database in [1] and other Earth System sciences datasets to verify the plausibility of the causal representations found and the environments that describe the so-called natural interventions.. 


[1] Tazi et al. 2022. https://arxiv.org/abs/2211.13052

[2] Díaz et al. 2022 .https://arxiv.org/abs/2211.08883

[3] Arjovsky et al. 2019. https://arxiv.org/abs/1907.02893

[4] Peters et al.2016.  https://www.jstor.org/stable/4482904

[5] Heinze-Deml et al. 2018. https://doi.org/10.1515/jci-2017-0016

How to cite: Díaz, E., Varando, G., Iglesias-Suarez, F., Camps-Valls, G., Tazi, K., Lamb, K., and Watson-Parris, D.: Learning causal drivers of PyroCb, EGU General Assembly 2023, Vienna, Austria, 23–28 Apr 2023, EGU23-16846, https://doi.org/10.5194/egusphere-egu23-16846, 2023.

EGU23-17082 | ECS | Posters on site | ITS1.14/CL5.8

A statistical approach on rapid estimations of climate change indices by monthly instead of daily data 

Kristofer Hasel, Marianne Bügelmayer-Blaschek, and Herbert Formayer

Climate change indices (CCI) defined by the expert team on climate change detection and indices (ETCCDI) profoundly contribute to understanding climate and its change. They are used to present climate change in an easy to understand and tangible way, thus facilitating climate communication. Many of the indices are peak over threshold indices needing daily and, if necessary, bias corrected data to be calculated from. We present a method to rapidly estimate specific CCI from monthly data instead of daily while also performing a simple bias correction as well as a localisation (downscaling). Therefore, we used the ERA5 Land data with a spatial resolution of 0.1° supplemented by a CMIP6 ssp5-8.5 climate projection to derive different regression functions which allow a rapid estimation by monthly data. Using a climate projection as a supplement in training the regression functions allows an application not only on historical periods but also on future periods such as those provided by climate projections. Nevertheless, the presented method can be adapted to any data set, allowing an even higher spatial resolution.

How to cite: Hasel, K., Bügelmayer-Blaschek, M., and Formayer, H.: A statistical approach on rapid estimations of climate change indices by monthly instead of daily data, EGU General Assembly 2023, Vienna, Austria, 23–28 Apr 2023, EGU23-17082, https://doi.org/10.5194/egusphere-egu23-17082, 2023.

EGU23-17197 | Posters on site | ITS1.14/CL5.8

Machine learning workflow for deriving regional geoclimatic clusters from high-dimensional data 

Sebastian Lehner, Katharina Enigl, and Matthias Schlögl

Geoclimatic regions represent climatic forcing zones, which constitute important spatial entities that serve as a basis for a broad range of analyses in earth system sciences. The plethora of geospatial variables that are relevant for obtaining consistent clusters represent a high-dimensionality, especially when working with high-resolution gridded data, which may render the derivation of such regions complex. This is worsened by typical characteristics of geoclimatic data like multicollinearity, nonlinear effects and potentially complex interactions between features. We therefore present a nonparametric machine learning workflow, consisting of dimensionality reduction and clustering for deriving geospatial clusters of similar geoclimatic characteristics. We demonstrate the applicability of the proposed procedure using a comprehensive dataset featuring climatological and geomorphometric data from Austria, aggregated to the recent climatological normal from 1992 to 2021.
 
The modelling workflow consists of three major sequential steps: (1) linear dimensionality reduction using Principal Component Analysis, yielding a reduced, orthogonal sub-space, (2) nonlinear dimensionality reduction applied to the reduced sub-space using Uniform Manifold Approximation and Projection, and (3) clustering the learned manifold projection via Hierarchical Density-Based Spatial Clustering of Applications with Noise. The contribution of the input features to the cluster result is then assessed by means of permutation feature importance of random forest models. These are trained by treating the clustering result as a supervised classification problem. Results show the flexibility of the defined workflow and exhibit good agreement with both quantitatively derived and synoptically informed characterizations of geoclimatic regions from other studies. However, this flexibility does entail certain challenges with respect to hyperparameter settings, which require careful exploration and tuning. The proposed workflow may serve as a blueprint for deriving consistent geospatial clusters exhibiting similar geoclimatic attributes.

How to cite: Lehner, S., Enigl, K., and Schlögl, M.: Machine learning workflow for deriving regional geoclimatic clusters from high-dimensional data, EGU General Assembly 2023, Vienna, Austria, 23–28 Apr 2023, EGU23-17197, https://doi.org/10.5194/egusphere-egu23-17197, 2023.

EGU23-17333 | ECS | Posters on site | ITS1.14/CL5.8

Emulating the regional temperature responses (RTPs) of short-lived climate forcers 

Maura Dewey, Hans Christen Hansson, and Annica M. L. Ekman

Here we develop a statistical model emulating the surface temperature response to changes in emissions of short-lived climate forcers as simulated by an Earth system model. Short-lived climate forcers (SLCFs) are chemical components in the atmosphere that interact with radiation and have both an immediate effect on local air quality, and regional and global effects on the climate in terms of changes in temperature and precipitation distributions. The short atmospheric residence times of SLCFs lead to high atmospheric concentrations in emission regions and a highly variable radiative forcing pattern. Regional Temperature Potentials (RTPs) are metrics which quantify the impact of emission changes in a given region on the temperature or forcing response of another, accounting for spatial inhomogeneities in both forcing and the temperature response, while being easy to compare across models and to use in integrated assessment studies or policy briefs. We have developed a Gaussian-process emulator using output from the Norwegian Earth System Model (NorESM) to predict the temperature responses to regional emission changes in SLCFs (specifically back carbon, organic carbon, sulfur dioxide, and methane) and use this model to calculate regional RTPs and study the sensitivity of surface temperature in a certain region, e.g. the Arctic, to anthropogenic emission changes in key policy regions. The main challenge in developing the emulator was creating the training data set such that we included maximal SLCF variability in a realistic and policy relevant range compared to future emission scenarios, while also getting a significant temperature response. We also had to account for the confounding influence of greenhouse gases (GHG), which may not follow the same future emission trajectories as SLCFs and can overwhelm the more subtle temperature response that comes from the direct and indirect effects of SLCF emissions. The emulator can potentially provide accurate and customizable predictions for policy makers to proposed emission changes with minimized climate impact.

How to cite: Dewey, M., Hansson, H. C., and Ekman, A. M. L.: Emulating the regional temperature responses (RTPs) of short-lived climate forcers, EGU General Assembly 2023, Vienna, Austria, 23–28 Apr 2023, EGU23-17333, https://doi.org/10.5194/egusphere-egu23-17333, 2023.

EGU23-40 | PICO | CR2.2

Investigating firn and ice anisotropy around the EastGRIP Camp, North East Greenland Ice Stream, from ambient noise surface waves 

Emma Pearce, Dimitri Zigone, Charlie Schoonman, Steven Franke, Olaf Eisen, and Joachim Rimpot

We use cross-correlations of ambient seismic noise data between pairs of 9 broadband three component seismometers to investigate variations in velocity structure and anisotropy in the vicinity of the EastGRIP camp along and across flow of the Northeast Greenland Ice Stream (NEGIS).

From the 9-component correlation tensors associated with all station pairs we derive dispersion curves of Rayleigh and Love wave group velocities between station pairs at frequencies from 1 to 25 Hz. The distributions of the Rayleigh and Love group velocities exhibit anisotropy variations for the along and across flow component. To better assess those variations, we invert the dispersions curves to shear wave velocities in the horizontal (Vsh) and vertical (Vsv) direction for the top 300 m of the NEGIS using a Markov Chain Monte Carlo approach.

The reconstructed 1-D shear velocity model revels radial anisotropy in the NEGIS. Along and across flow vertical shear wave velocities (Vsv) identify comparable velocity profiles for all depths. However, horizontal shear wave velocities (Vsh) are faster by approximately 250 m/s in the along flow direction below a depth of 100 m, i.e. below the firn-ice transition.

This type of anisotropy seems to arise from the alignment of a crystallographic preferred orientation, due to deformation associated with shear zones. The role of anisotropy as e.g. created by air bubbles in the firn and ice matrix, is yet unclear.

Faster Vsh velocities in the along flow direction support that the NEGIS has crystal orientation alignment normal to the plane of shear compression (i.e. ice crystals orientated across flow) within the upper 300 m of the ice stream and are in alignment with the results from other methods. We demonstrate that simple, short duration (2-3 weeks), passive seismic deployment and environmental noise-based analysis can be used to determine the anisotropy of the upper part of ice masses.

How to cite: Pearce, E., Zigone, D., Schoonman, C., Franke, S., Eisen, O., and Rimpot, J.: Investigating firn and ice anisotropy around the EastGRIP Camp, North East Greenland Ice Stream, from ambient noise surface waves, EGU General Assembly 2023, Vienna, Austria, 23–28 Apr 2023, EGU23-40, https://doi.org/10.5194/egusphere-egu23-40, 2023.

EGU23-92 | ECS | PICO | CR2.2

Improving identification of glacier bed materials using converted-wave seismics 

Ronan Agnew, Adam Booth, Alex Brisbourne, Roger Clark, and Andy Smith

When modelling ice sheet and glacier dynamics, a consideration of basal conditions is essential. Bed topography, hydrology and materials provide important controls on ice flow; however, the materials underlying large sections of the polar ice sheets are unknown. Seismic amplitude-versus-offset (AVO) analysis provides a means of inferring glacier bed properties, namely acoustic impedance and Poisson's ratio, by measuring bed reflectivity as a function of incidence angle.

However, existing methods of applying AVO to glaciology only consider the compressional-wave component of the wavefield and solutions suffer from non-uniqueness. This can be addressed using multi-component seismic datasets, in which a strong converted-wave arrival (downgoing compressional-wave energy converted to shear-wave energy upon reflection at the glacier bed) is often present. We present a method of jointly inverting compressional (PP) and converted-wave (PS) seismic data to improve constraint of glacier bed properties.

Using synthetic data, we demonstrate that for typical survey geometries, joint inversion of PP- and PS-wave AVO data delivers better-constrained bed acoustic impedance and Poisson’s ratio estimates compared with PP-only inversion. Furthermore, joint inversion can produce comparably constrained results to PP inversion when using input data with a smaller range of incidence angles/offsets (0-30 degree incidence for joint inversion, versus 0-60 degrees for PP- only). This could simplify future field acquisitions on very thick ice, where obtaining data at large incidence angles is difficult.

Joint AVO inversion therefore has the potential to improve identification of glacier bed materials and simplify field acquisitions of glacial AVO data. We also present preliminary results from Korff Ice Rise, West Antarctica, where better constraints on bed conditions can help improve our knowledge of ice sheet history in the Weddell Sea sector. Routine measurements of this kind will help constrain ice-sheet model inputs and reduce uncertainty in predictions of sea-level rise.

How to cite: Agnew, R., Booth, A., Brisbourne, A., Clark, R., and Smith, A.: Improving identification of glacier bed materials using converted-wave seismics, EGU General Assembly 2023, Vienna, Austria, 23–28 Apr 2023, EGU23-92, https://doi.org/10.5194/egusphere-egu23-92, 2023.

EGU23-93 | ECS | PICO | CR2.2

Efficient neural network-based detection of seismicity in fibre optic data from Store Glacier, West Greenland 

Andrew Pretorius, Adam Booth, Emma Smith, Andy Nowacki, Sjoerd de Ridder, Poul Christoffersen, and Bryn Hubbard

Seismic surveys are widely used to characterise the properties of glaciers, their basal material and conditions, and ice dynamics. The emerging technology of Distributed Acoustic Sensing (DAS) uses fibre optic cables as seismic sensors, allowing observations to be made at higher spatial resolution than possible using traditional geophone deployments. Passive DAS surveys generate large data volumes from which the rate of occurrence and failure mechanism of ice quakes can be constrained, but such large datasets are computationally expensive and time consuming to analyse. Machine learning tools can provide an effective means of automatically identifying seismic events within the data set, avoiding a bottleneck in the data analysis process.

Here, we present a novel approach to machine learning for a borehole-deployed DAS system on Store Glacier, West Greenland. Data were acquired in July 2019, as part of the RESPONDER project, using a Silixa iDAS interrogator and a BRUsens fibre optic cable installed in a 1043 m-deep borehole. The data set includes controlled-source vertical seismic profiles (VSPs) and a 3-day passive record of cryoseismicity.  To identify seismic events in this record, we used a convolutional neural network (CNN). A CNN is a deep learning algorithm and a powerful classification tool, widely applied to the analysis of images and time series data, i.e. to recognise seismic phases for long-range earthquake detection.

For the Store Glacier data set, a CNN was trained on hand-labelled, uniformly-sized time-windows of data, focusing initially on the high-signal-to-noise-ratio seismic arrivals in the VSPs. The trained CNN achieved an accuracy of 90% in recognising seismic energy in new windows. However, the computational time taken for training proved impractical. Training a CNN instead to identify events in the frequency-wavenumber (f-k) domain both reduced the size of each data sample by a factor of 340, yet still provided accurate classification. This decrease in input data volume yields a dramatic decrease in the time required for detection. The CNN required only 1.2 s, with an additional 5.6 s to implement the f-k transform, to process 30 s of data, compared with 129 s to process the same data in the time domain. This suggests that f-k approaches have potential for real-time DAS applications.

Continuing analysis will assess the temporal distribution of passively recorded seismicity over the 3 days of data. Beyond this current phase of work, estimated source locations and focal mechanisms of detected events could be used to provide information on basal conditions, internal deformation and crevasse formation. These new seismic observations will help further constrain the ice dynamics and hydrological properties of Store Glacier that have been observed in previous studies of the area.

The efficiency of training a CNN for event identification in the f-k domain allows detailed insight to be made into the origins and style of glacier seismicity, facilitating further development to passive DAS instrumentation and its applications.

How to cite: Pretorius, A., Booth, A., Smith, E., Nowacki, A., de Ridder, S., Christoffersen, P., and Hubbard, B.: Efficient neural network-based detection of seismicity in fibre optic data from Store Glacier, West Greenland, EGU General Assembly 2023, Vienna, Austria, 23–28 Apr 2023, EGU23-93, https://doi.org/10.5194/egusphere-egu23-93, 2023.

EGU23-952 | PICO | CR2.2

Variability of surface density at Dotson Ice Shelf, West Antarctica 

Clare Eayrs, Lucas Beem, Choon-Ki Lee, Won Sang Lee, Jiwoong Chung, Christopher Pierce, Jamey Stutz, and David Holland

The ice mass balance of Antarctica has been steadily and strongly decreasing over recent decades, with major ramifications for global sea levels. Satellite remote sensing offers global, daily coverage of ice mass changes, which is essential for understanding land ice changes and their effects on global climate. However, we need to correct for processes including firn densification, glacial isostatic adjustment, elastic compensation of the Earth’s surface, ocean tides, and inverse barometer effect. Of these corrections, understanding the changes to the firn layer constitutes one of the largest uncertainties in making estimates of the surface mass balance from space. Furthermore, the development of firn models that aid our understanding of firn densification processes is hampered by a lack of observations.

Radar sounder reflections contain information about the roughness and permittivity of the reflecting interface, allowing us to map the spatial variability of the ice surface characteristics. In 2022, a helicopter-mounted ice-penetrating radar system developed by the University of Texas Institute for Geophysics collected high-quality radar observations over the Dotson Ice Shelf, West Antarctica. These surveys obtained clearly defined surface and bed reflections. We derived near-surface density along these survey flight lines using the radar statistical reconnaissance method developed by Grima, 2014. We calibrated our estimates with contemporary observations, including ground penetrating radar, a shallow ice core, an Autonomous phase-sensitive Radio Echo-sounder (ApRES), and radar soundings of well-defined surfaces from a calibration flight.

How to cite: Eayrs, C., Beem, L., Lee, C.-K., Lee, W. S., Chung, J., Pierce, C., Stutz, J., and Holland, D.: Variability of surface density at Dotson Ice Shelf, West Antarctica, EGU General Assembly 2023, Vienna, Austria, 23–28 Apr 2023, EGU23-952, https://doi.org/10.5194/egusphere-egu23-952, 2023.

EGU23-1137 | ECS | PICO | CR2.2

Hydraulic behaviour of a mountain permafrost subsoil revealed by an infiltration experiment and ERT time-lapse measurements 

Mirko Pavoni, Jacopo Boaga, Alberto Carrera, Giulia Zuecco, Luca Carturan, and Matteo Zumiani

Although rock glaciers represent a common periglacial landform in the alpine environment, and have a significant contribution to the hydrological regime of the related areas, their hydrodynamic is relatively less defined if compared to moraines, talus, and hillslope deposits. So far, the hydraulic behaviour of frozen layers that may be found inside rock glaciers has been investigated only with geochemical analysis of their spring water. These previous studies observed that the frozen layer acts as an aquiclude (or aquitard) and separates a supra-permafrost flow component, originating from snow-ice melting and rainwater, and a deeper aquifer at the bottom of the rock glacier systems.

In this work we verified, for the first time with a geophysical monitoring method, the low-permeability hydraulic behaviour associated to the frozen layer of mountain permafrost subsoils. In the inactive rock glacier of Sadole Valley (Southern Alps, Trento Province, Italy) we performed an infiltration experiment combined with 2D electrical resistivity tomography (ERT) measurements in time-lapse configuration. Considering the same ERT transect, a time zero dataset (t0) has been collected before the water injection, subsequently about 800 liters of salt water have been spilled (approximately in a point) on the surface of the rock glacier in the middle of the electrodes array, and 10 ERT datasets have been collected periodically in the following 24 hours. To highlight the variations of electrical resistivity in the frozen subsoil, related to the injected salt water flow, only the inverted resistivity model derived from t0 dataset has been represented in terms of absolute resistivities, while the other time steps results have been evaluated in terms of percentage changes of resistivity with respect to the t0 initial model.

Our results clearly agree with the assumption that a frozen layer acts as an aquiclude (or aquitard) in a mountain permafrost aquifer, since during the infiltration experiment the injected salt water was not able to infiltrate into the underlying permafrost layer. The positive outcome of this test, fronting impervious environment and logistic constraints, opens up interesting future scenarios regarding the application of this geophysical monitoring method for the hydraulic characterization of rock glaciers. The experiment, used in this work to evaluate the permeability of the frozen layer, could be adapted in future to evaluate (in a quantitative way) the hydraulic conductivity of the active layer in rock glacier aquifers.

How to cite: Pavoni, M., Boaga, J., Carrera, A., Zuecco, G., Carturan, L., and Zumiani, M.: Hydraulic behaviour of a mountain permafrost subsoil revealed by an infiltration experiment and ERT time-lapse measurements, EGU General Assembly 2023, Vienna, Austria, 23–28 Apr 2023, EGU23-1137, https://doi.org/10.5194/egusphere-egu23-1137, 2023.

EGU23-2250 | ECS | PICO | CR2.2

Ice slab thickening drives surface runoff expansion from the Greenland Ice Sheet’s percolation zone - and vice versa 

Nicolas Jullien, Andrew Tedstone, and Horst Machguth

On the Greenland Ice Sheet, the firn layer holds the potential to trap and refreeze surface meltwater within its pore space. Acting as a buffer, it prevents meltwater from leaving the ice sheet. However, several meter-thick ice slabs have developed in the firn during the last two decades, reducing subsurface permeability and inhibiting vertical meltwater percolation. Ice slabs are located above the long-term equilibrium line along the west, north and northeast coasts of the ice sheet. Through time, ice slabs have thickened while new ones have developed at higher elevations. Concomitantly, the area of the ice sheet drained by surface rivers has increased by 29% from 1985 to 2020. Nowadays, 5-10% of surface losses through meltwater runoff originates from these newly drained areas, which correspond strongly with where ice slabs are located.

Here, we demonstrate that the highest elevation which is drained by surface rivers – termed the maximum visible runoff limit – is controlled by the ice content in the subsurface firn. Using ice slab thickness derived from the accumulation radar and annual maximum visible limit retrievals from Landsat imagery from 2002 to 2018, we show that a sub-surface ice content threshold triggers the shift from a ‘firn deep percolation regime’ to a ‘firn runoff regime’. Although ice slabs act as an aquitard, vertical meltwater percolation can still take place where visible meltwater ponds at the surface. We show that once the firn runoff regime is underway, ice slabs are thicker in locations with active surface hydrology compared to locations where no meltwater is visible at the surface. Spatial heterogeneity in ice slab thickness is therefore predominantly controlled by surface hydrology features.

How to cite: Jullien, N., Tedstone, A., and Machguth, H.: Ice slab thickening drives surface runoff expansion from the Greenland Ice Sheet’s percolation zone - and vice versa, EGU General Assembly 2023, Vienna, Austria, 23–28 Apr 2023, EGU23-2250, https://doi.org/10.5194/egusphere-egu23-2250, 2023.

EGU23-2856 | ECS | PICO | CR2.2

New Representation of Synthetic Aperture Radar Images for Enhanced Ice-Sounding Interpretation 

Álvaro Arenas-Pingarrón, Hugh F.J. Corr, Paul V. Brennan, Carl Robinson, Tom A. Jordan, Alex Brisbourne, and Carlos Martín

The processing of Synthetic Aperture Radar (SAR) images is based on the coherent integration of Doppler frequencies. The associated Doppler spectrum is generated from the variation of the relative location between the radar and the scatterer. In geometries where the moving radar-platform follows a straight trajectory at constant velocity, the Doppler frequency depends on the angle of elevation from the radar to the scatterer, according to the electromagnetic (EM) propagation. In ice-sounding by airborne SAR, the EM path depends on the air-ice interface and the firn ice properties. For any of the scatterers under test, after integrating the received radar echoes from the multiple radar locations into a single pixel, the resulting amplitude image forgets which is the backscattering angle from each of the radar locations. However, this information is still within the Doppler spectrum of the image. We decompose the Doppler spectrum of the SAR image into three non-overlapping sub-bands; assign to each sub-band one of the primary colours red, green or blue, forming three sub-images; and finally merge the sub-images into a single one. Rather than a single full-beamwidth averaged amplitude value, the new composition now includes angular backscattering information, coded by one of the primary colours. Blue colour is assigned to scattering received from forwards, when the scatterer is ahead of the radar (positive Doppler frequencies); green approximately from the vertical (near zero-Doppler geometries); and red to scattering received from backwards (negative Doppler). Thus, heterogeneous scattering will be represented by one or two colours, whereas homogeneous scattering will be grey, with all the primary colours uniformly weighted. Features like internal layering, crevasses, SAR focussing quality and discrimination of multiple reflections from surface and bottom, can now be better interpreted. We present and discuss the results from the British Antarctic Survey (BAS) airborne radar PASIN2 for deep-ice sounding, in Recovery and Rutford ice streams, respectively in East and West Antarctica during seasons 2016/17 and 2019/20.

How to cite: Arenas-Pingarrón, Á., Corr, H. F. J., Brennan, P. V., Robinson, C., Jordan, T. A., Brisbourne, A., and Martín, C.: New Representation of Synthetic Aperture Radar Images for Enhanced Ice-Sounding Interpretation, EGU General Assembly 2023, Vienna, Austria, 23–28 Apr 2023, EGU23-2856, https://doi.org/10.5194/egusphere-egu23-2856, 2023.

In many regions of the Northern Hemisphere, permafrost is thawing due to climate change. In steep terrain, this permafrost degradation can affect slope stability. In one of Iceland's eastern fjords, Seyðisfjörður, nine major landslide cycles have occurred in the last century, originating from the lower parts (< 500 m a.s.l.) of the Strandartindur slopes, with the largest landslide event ever recorded in Iceland occurring in December 2020. Its triggering mechanism is being intensively studied and its development is being monitored. In addition to these instabilities, slow movements are also observed in the upper part (> 500 - 1010 m a.s.l.) of these slopes. In these upper areas, it is not known whether permafrost is present in the subsurface or what is causing it to creep downward. To further investigate the stability of these slopes, it is important to know and map the distribution and condition of possible permafrost layers. Therefore, electrical resistivity tomography (ERT) and ground penetrating radar (GPR) measurements were performed to study the presence and distribution of permafrost in the mountain, Strandartindur, above Seyðisfjörður. A combination of measurements is used as ERT responds primarily to the electrical resistivity of the subsurface, but this can depend strongly on other factors such as porosity, water content, etc., and GPR can help map the presence of different interfaces in the soil determined by their different physical properties, such as relative electrical permittivity, but also conductivity, which is the reciprocal of resistivity. Combining the two methods allows us to get a clearer picture of the subsurface. As a benchmark for ERT measurements in the field, a laboratory setup was performed with soil and rock samples at different temperatures and water saturations to study the behavior of frozen and non-frozen conditions in our geologic environment. With all of these measurements, we aim to answer the questions of whether permafrost is present in the selected area, what the distribution of permafrost is, whether we can use laboratory ERT to establish reference resistivity values, and if these methods are appropriate for this area.

How to cite: von der Esch, A., Piispa, E. J., and Sæmundsson, Þ.: Electrical Resistivity Tomography and Ground-Penetrating Radar Measurements for Permafrost Detection on a Mountain Slope at Strandartindur, Seyðisfjörður - East Iceland, EGU General Assembly 2023, Vienna, Austria, 23–28 Apr 2023, EGU23-4135, https://doi.org/10.5194/egusphere-egu23-4135, 2023.

EGU23-4895 | ECS | PICO | CR2.2

Detecting permafrost freeze-thaw front propagation using time-laps ERT observations in a large column experiment 

Jelte de Bruin, Victor Bense, and Martine van der Ploeg

Cold regions are increasingly subjected to higher air temperatures, causing warming of permafrost and a deepening of the active layer. This activates hydrogeological groundwater flow and new groundwater pathways to emerge. Monitoring of the active layer depth occurs mainly with the use of temperature observations, but a more flexible and non-invasive method to study transient subsurface processes is with the use of Electrical Resistivity Tomography (ERT) observations. 

Automated time-laps ERT arrays are used to monitor the frozen ground evolution during various seasons, observing resistivity variations during freezing and thawing. Similarly, the leaching of meltwater into the ground under freezing/thawing conditions can be observed. Not only geophysical changes such as fluctuations in water content and water table, but also temperature variations affect the electrical resistivity field. In order to track the development of permafrost active-layer freeze-thaw fronts using ERT observations, it is thus essential that the effect of temperature on the resistivity is clearly defined at realistic scales representing field conditions. Our aim is to determine fluid resistivity at various stages during freezing and thawing and validate current temperature–resistivity relations for partly frozen soils.

This study used a soil column (0.4 m diameter, 1 m heigh) equipped with 96 stainless steel electrodes placed at 8 horizontal rings of 12 electrodes each at various heights around the circumference of the column alongside with temperature sensors. The column was fully insulated on the sides and top except for the bottom, creating a 1D heat transfer system. The soil column was filled with quartzite sand with a D50 of 350 (μm) and organic matter content of 5 (wgt %). The experimental setup was placed within a climate chamber where the column was frozen to -4 °C and thawed to 3 °C over a 3-month period. During the freezing and thawing phase, a full 3D resistivity image was collected using the ERT at a weekly interval. Initial results show that the setup is capable of simulating permafrost freezing and thawing dynamics and ongoing work focuses on the relation between the temperature and time lapse ERT resistivity observations.

How to cite: de Bruin, J., Bense, V., and van der Ploeg, M.: Detecting permafrost freeze-thaw front propagation using time-laps ERT observations in a large column experiment, EGU General Assembly 2023, Vienna, Austria, 23–28 Apr 2023, EGU23-4895, https://doi.org/10.5194/egusphere-egu23-4895, 2023.

EGU23-5545 | ECS | PICO | CR2.2

High resolution maps of the sub-ice platelet layer in Atka Bay from electromagnetic induction sounding 

Mara Neudert, Stefanie Arndt, Markus Schulze, Stefan Hendricks, and Christian Haas

We present maps of the sub-ice platelet layer (SIPL) thickness and ice volume fraction beneath the land-fast sea ice in Atka Bay adjacent to the Ekström Ice Shelf (southeastern Weddell Sea, Antarctica). The widespread SIPL beneath Antarctic fast ice is indicative of basal melt of nearby ice shelves, contributes to the sea ice mass balance and provides a unique ecological habitat. Where plumes of supercooled Ice Shelf Water (ISW) rise to the surface rapid formation of platelet ice can lead to the presence of a semi-consolidated SIPL beneath consolidated fast ice.

Here we present data from extensive electromagnetic (EM) induction surveying with the multi-frequency EM sounder GEM-2 between May and December, 2022. It includes monthly survey data along a fixed transect line across Atka Bay between May and October, as well as comprehensive mapping across the entire bay in November and December. The GEM-2 surveys were supplemented by drill hole thickness measurements, ice coring and CTD profiles. A new data processing and inversion scheme was successfully applied to over 1000 km of EM profiles with a horizontal resolution of one meter. We obtained layer thicknesses of the consolidated ice plus snow layer, the SIPL, and the respective layer conductivities. The latter were used to derive SIPL ice volume fraction and an indicator for flooding at the snow-ice interface. The robustness of the method was validated by drill hole transects and CTD profiles.

Our results support conclusions about the spatial variability of the ocean heat flux linked to outflow of ISW from beneath the ice shelf cavity. Temporally, we found that the end of SIPL growth and the onset of its thinning in summer can be linked to the disappearance of supercooled water in the upper water column.

How to cite: Neudert, M., Arndt, S., Schulze, M., Hendricks, S., and Haas, C.: High resolution maps of the sub-ice platelet layer in Atka Bay from electromagnetic induction sounding, EGU General Assembly 2023, Vienna, Austria, 23–28 Apr 2023, EGU23-5545, https://doi.org/10.5194/egusphere-egu23-5545, 2023.

EGU23-5851 | PICO | CR2.2

Measuring snow and avalanche properties using acoustic and seismic distributed fiber optic sensing 

Alexander Prokop, Nicola P. Agostinetti, and Bernhard Graseman

Since 2012 we monitor avalanche activity using distributed acoustic and seismic fiber optic sensing at our avalanche test area at Lech am Arlberg, Austria. The method is based on an optical time domain reflectometer system that detects seismic vibrations and acoustic signals on a fiber optic cable that can have a length of up to 30 km in 80 cm resolution. While in the first years we focused on successfully developing an operational avalanche detection system that is able to tell in real time reliably when an avalanche was triggered and what the size of the avalanche is, we now present our investigations of the seismic signals to measure snow properties such as snow depth and avalanche properties such as flow behavior. Our test in winter 2022 recorded by blasting triggered avalanches and during data post processing we extracted seismic guided waves. We discuss methods for extracting information from guided waves for measuring snow depth, which was verified against spatial snow depth measurements from terrestrial laser scanning. Analyzing the seismic signals of avalanches with run-out distances ranging from a few metres to approximately 250 m allows us to differentiate between wet and snow avalanches, which is discussed in the context of avalanche dynamics.

How to cite: Prokop, A., Agostinetti, N. P., and Graseman, B.: Measuring snow and avalanche properties using acoustic and seismic distributed fiber optic sensing, EGU General Assembly 2023, Vienna, Austria, 23–28 Apr 2023, EGU23-5851, https://doi.org/10.5194/egusphere-egu23-5851, 2023.

EGU23-6935 | PICO | CR2.2

A new view of a 1970s radar dataset from Greenland 

Nanna Bjørnholt Karlsson, Dustin Schroeder, Louise S. Sørensen, Winnie Chu, Thomas Teisberg, Angelo Tarzano, Niels Skou, and Jørgen Dall

The short observational record is one of the main obstacles to improving the present understanding of the future of the Polar ice sheets. While the quantity and quality of observations presently are increasing observations from before the 1990s are scarce. Here, we present the first results from a newly digitized ice-penetrating radar dataset acquired over the Greenland Ice Sheet in the 1970s. The data consist of more than 170,000 km of radar flight lines. While the ice thickness information from the data has been digitized by previous studies, the data itself (notably the z-scopes) were until recently only available as 35-mm films, microfiche copies of the films, and enlarged positives: Formats that are not usable for digital analysis.

In 2019, the film rolls were scanned by a digital scanner and subsequently, a large effort has been directed at carrying out quality control of the data with the view of making them publicly available.  Here we present the first results from this digitization. The overall data quality is good, and we are able to retrieve valuable information on layer stratigraphy and ice-flow dynamics.

How to cite: Karlsson, N. B., Schroeder, D., Sørensen, L. S., Chu, W., Teisberg, T., Tarzano, A., Skou, N., and Dall, J.: A new view of a 1970s radar dataset from Greenland, EGU General Assembly 2023, Vienna, Austria, 23–28 Apr 2023, EGU23-6935, https://doi.org/10.5194/egusphere-egu23-6935, 2023.

EGU23-7198 | PICO | CR2.2

Climatic imprint in the mechanical properties of ice sheets and its effect on ice flow: Observations fromSouth Pole and EPICA Dome C ice cores 

Carlos Martin, Robert Mulvaney, Howard Conway, Michelle Koutnik, C. Max Stevens, Hugh Corr, Catherine Ritz, Keith Nicholls, Reinhard Drews, and M. Reza Ershadi

The climatic conditions over ice sheets at the time of snow deposition and compaction imprint distinctive crystallographic properties to the resulting ice. As it gets buried, its macroscopic structure evolves due to vertical compression but retains traces of the climatic imprint that generate distinctive mechanical, thermal and optical properties. Because climate alternates between glacial periods, that are colder and dustier, and interglacial periods, the ice sheets are composed from layers with alternating mechanical properties. Here we compare ice core dust content, crystal orientation fabrics and englacial vertical strain-rates, measured with a phase-sensitive radar (ApRES), at the South Pole and EPICA Dome C ice cores. In agreement with previous observations, we show that ice deposited during glacial periods develops stronger crystal orientation fabrics. In addition, we show that ice deposited during glacial periods is harder in vertical compression and horizontal extension, up to about three times, but softer in shear. These variations in mechanical properties are ignored in ice-flow models but they could be critical for the interpretation of ice core records. Also, we show that the changes in crystal orientation fabrics due to transitions from interglacial to glacial conditions can be detected by radar. This information can be used to constrain age-depth at future ice-core locations.

How to cite: Martin, C., Mulvaney, R., Conway, H., Koutnik, M., Stevens, C. M., Corr, H., Ritz, C., Nicholls, K., Drews, R., and Ershadi, M. R.: Climatic imprint in the mechanical properties of ice sheets and its effect on ice flow: Observations fromSouth Pole and EPICA Dome C ice cores, EGU General Assembly 2023, Vienna, Austria, 23–28 Apr 2023, EGU23-7198, https://doi.org/10.5194/egusphere-egu23-7198, 2023.

EGU23-7695 | ECS | PICO | CR2.2

Spatial variation of ice crystal fabric and implications of anisotropic flow in the Northeast Greenland Ice Stream 

Tamara Gerber and Olaf Eisen and the NEGIS community

Anisotropic crystal fabrics in ice sheets develop as a consequence of deformation and hence record information of past ice flow. Simultaneously, the fabric affects the present-day bulk mechanical properties of glacier ice because the susceptibility of ice crystals to deformation is highly anisotropic. This is particularly relevant in dynamic areas such as fast-flowing glaciers and ice streams, where the formation of strong fabrics might play a critical role in facilitating ice flow. Anisotropy is ignored in most state-of-the-art ice sheet models, and while its importance has long been recognized, accounting for fabric evolution and its impact on the ice viscosity has only recently become feasible. Both the application of such models to ice streams and their verification through in-situ observations are still rare. We present an extensive dataset of fabric anisotropy derived from ground-based and air-borne radar data, covering approximately 24,000 km2 of the Northeast Greenland Ice Stream onset region. Our methods yield the horizontal anisotropy and are based on travel time anisotropy as well as birefringence-induced power modulation of radar signals. These methods complement each other and show good agreement. We compare the in-situ observations with the results obtained from a fabric-evolution model employed along flow line bundles in the ice stream onset to discuss the fabric in light of past flow history and its significance for the current flow mechanics of the ice stream.


How to cite: Gerber, T. and Eisen, O. and the NEGIS community: Spatial variation of ice crystal fabric and implications of anisotropic flow in the Northeast Greenland Ice Stream, EGU General Assembly 2023, Vienna, Austria, 23–28 Apr 2023, EGU23-7695, https://doi.org/10.5194/egusphere-egu23-7695, 2023.

EGU23-8197 | ECS | PICO | CR2.2

Ice rise evolution derived from radar investigations at a promontory triple junction, Dronning Maud Land, East Antarctica 

M. Reza Ershadi, Reinhard Drews, Veronica Tsibulskaya, Sainan Sun, Clara Henry, Falk Oraschewski, Inka Koch, Carlos Martin, Jean-Louis Tison, Sarah Wauthy, Paul Bons, Olaf Eisen, and Frank Pattyn

Promontory ice rises are locally grounded features adjacent to ice shelves that are still connected to the ice sheet. Ice rises are an archive for the atmospheric and ice dynamic history of the respective outflow regions where the presence, absence, or migration of Raymond arches in radar stratigraphy represents a memory of the ice-rise evolution. However, ice rises and their inferred dynamic history are not yet used to constrain large-scale ice flow model spin-ups because matching the arch amplitudes includes many unknown parameters, e.g., those pertaining to ice rheology. In particular, anisotropic ice flow models predict gradients in ice fabric anisotropy on either side of an ice divide. However, this has thus far not been validated with observations.


The ground-based phase-sensitive Radio Echo Sounder (pRES) has previously been used to infer ice fabric types for various flow regimes using the co-polarized polarimetric coherence phase as a metric to extract information from the birefringent radar backscatter. Here, we apply this technique using quad-polarimetric radar data along a 5 km transect across a ridge near the triple junction of Hammarryggen Ice Rise at the Princess Ragnhild Coast. A comparison with ice core data collected at the dome shows that the magnitude of ice fabric anisotropy can reliably be reconstructed from the quad-polarimetric data. We use the combined dataset also to infer the spatial variation of ice fabric orientations in the vicinity of the triple junction. The observations are integrated with airborne radar profiles and strain rates based on the shallow ice approximation. We then discuss whether estimated anisotropy from radar polarimetry on ice rises, in general, can be another observational constraint to better ice rises as an archive of ice dynamics.

How to cite: Ershadi, M. R., Drews, R., Tsibulskaya, V., Sun, S., Henry, C., Oraschewski, F., Koch, I., Martin, C., Tison, J.-L., Wauthy, S., Bons, P., Eisen, O., and Pattyn, F.: Ice rise evolution derived from radar investigations at a promontory triple junction, Dronning Maud Land, East Antarctica, EGU General Assembly 2023, Vienna, Austria, 23–28 Apr 2023, EGU23-8197, https://doi.org/10.5194/egusphere-egu23-8197, 2023.

EGU23-9273 | ECS | PICO | CR2.2

Layer-optimized SAR processing with a mobile pRES to illuminate the internal layering of an alpine glacier 

Falk M. Oraschewski, Inka Koch, Mohammadreza Ershadi, Jonathan Hawkins, Olaf Eisen, and Reinhard Drews

The internal, isochronous layering of glaciers is shaped by accumulation and ice deformation. Information about these processes can be inferred from observing the layers using radar sounding. The reflectivity of the layers depends on density (permittivity) and acidity (conductivity) contrasts which tend to decrease with depth. At places like alpine glaciers where logistic limitations often only allow the deployment of lightweight and power-constrained ground-penetrating radar systems, it can therefore be challenging to illuminate the deeper radio-stratigraphy.

The phase-sensitive Radio Echo Sounder (pRES) is a lightweight frequency modulated continuous wave radar which allows the use of coherent Synthetic Aperture Radar (SAR) processing techniques to improve the signal-to-noise ratio of internal reflection horizons. Using a mobile pRES we collected a radar profile on an alpine glacier (Colle Gnifetti, Italy/Switzerland). Here, we demonstrate how to apply layer-optimized SAR techniques to make deep internal layers visible, which could not be seen by a conventional pulsed radar. We evaluate the requirements on spatial resolution and positioning accuracy during data acquisition, necessary for applying layer-optimized SAR processing, as they constrain the feasibility of the method. We further discuss implications on how density and acidity contribute to decreasing dielectric contrasts.

How to cite: Oraschewski, F. M., Koch, I., Ershadi, M., Hawkins, J., Eisen, O., and Drews, R.: Layer-optimized SAR processing with a mobile pRES to illuminate the internal layering of an alpine glacier, EGU General Assembly 2023, Vienna, Austria, 23–28 Apr 2023, EGU23-9273, https://doi.org/10.5194/egusphere-egu23-9273, 2023.

EGU23-9619 | ECS | PICO | CR2.2

High-density 3D and 4D GPR data acquisitions over alpine glaciers using a newly developed drone-based system. 

Bastien Ruols, Ludovic Baron, and James Irving

We have developed a drone-based GPR system at the University of Lausanne that allows for the safe and efficient acquisition of large, high-density, 3D and 4D datasets over alpine glaciers. The system is able to record approximately 4 line-km of high-quality GPR data per set of drone batteries in less than 30 minutes of operation which, combined with multiple sets of batteries and/or the possibility of charging at the field site, means that 3D datasets over a large area can be acquired with unprecedented efficiency. The latter performance is possible thanks to (i) a custom-made real-time-sampling GPR controller that has been specifically designed for glaciers studies, (ii) minimization of the total payload weight using custom-built antennas and carbon-fiber components, and (iii) development of an optimized survey methodology. Further, because the drone is equipped with real-time kinematic GPS positioning, survey paths can be repeated with great precision, which opens new opportunities in term of 4D data acquisitions.

In the summer of 2022, we acquired both 3D and 4D data over two Swiss glaciers. On the Otemma glacier, we surveyed a grid of 462 profiles representing a total length of 112 line-km of data in only four days. After 3D binning, the trace spacing intervals in the in-line and crossline directions were respectively 0.4 m and 1 m, making this arguably the largest 3D GPR dataset of such density ever recorded over ice. The interface between the ice and the bedrock, visible on all profiles, extends to 1000 ns which translates into a depth of approximately 80 m. In addition, internal englacial and subglacial 3D structures are clearly detectable.

In parallel, we visited the Rhône glacier on a monthly basis between June and September 2022. A collapse feature, identified by the presence of large circular crevasses, had formed and was evolving close to the snout of the glacier. This represented a great opportunity to test the 4D acquisition capabilities of our system. We collected four high-density 3D datasets on the same survey grid. The repeatability of the trajectories was excellent as the paths differ only by a few centimeters between occurrences. Clear variations in the internal structure of the glacier are visible which will be investigated in the upcoming months.

How to cite: Ruols, B., Baron, L., and Irving, J.: High-density 3D and 4D GPR data acquisitions over alpine glaciers using a newly developed drone-based system., EGU General Assembly 2023, Vienna, Austria, 23–28 Apr 2023, EGU23-9619, https://doi.org/10.5194/egusphere-egu23-9619, 2023.

The Whillans Ice Stream (WIS) is a major outlet of the West Antarctic Ice Sheet. Significantly, the downstream portion of the WIS is presently decelerating, possibly stagnating by the end of this century. Additionally, this downstream region of WIS is unique in that it moves primarily by stick-slip motion. However, both the rate of deceleration as well as the percent of motion accommodated by stick-slip motion is spatially variable. Such spatial variability is potentially linked to associated variability in basal conditions. Active source seismic measurement are capable of providing high-resolution insights into basal conditions, however, they are time-consuming to collect, limiting the spatial extent over which they can be acquired. In this presentation, we will use passive seismic measurements collected at over 50 seismic stations to map sediment thickness and ice-bed conditions across the region. This will be done using the receiver function method which images the depth and physical properties of sediments by modeling the arrival times and amplitudes of seismic waves that interact with subglacial sedimentary structures. We will first map conditions at the ice-bed interface by using relatively high-frequency waveforms (> 2 Hz) as they are sensitive to the physical properties of the shallow (< 20m ) subglacial sediments layers. Across the entirety of the study region, we find that this uppermost layer of sediments is characterized by relatively high porosity sediments.  Second, we will utilize lower frequencies (< 2 Hz) to map the depth basement, finding that the entire region is underlain 100’s of meters of sediments (Gustafson et al., Science, 2022). We will use our maps of sediment properties and thickness to investigate potential mechanisms for the observed variability in deceleration and stick-slip behavior of the WIS.  

How to cite: Winberry, J. P.: Basal Conditions and Sedimentary Structure of the Whillans Ice Stream., EGU General Assembly 2023, Vienna, Austria, 23–28 Apr 2023, EGU23-9621, https://doi.org/10.5194/egusphere-egu23-9621, 2023.

Englacial temperature and water content play critical roles in glacier dynamics, both within ice sheets and mountain glaciers. As radio wave attenuation is sensitive to both of these properties, radio-echo sounding (RES) serves as a useful tool for mapping out their distributions within glaciers. Ground-based bistatic surveys, in which multi-offset measurements are taken, provide a large diversity in bed incidence angles and travel-path lengths. Provided the anomaly of interest is sufficiently sampled, these measurements can be exploited to perform attenuation tomography, thereby recovering the distribution of englacial radio wave attenuation from which englacial temperature can be estimated. Extensive RES surveys have been carried out over Antarctica using airborne radar; however, due to the monostatic geometry, methods for estimation of englacial radio wave attenuation and basal roughness have relied primarily on nadir returns. These estimates are often derived from 2D spatial correlation of basal return power and ice thickness or by employing layer-tracking methods. These techniques are limited in that the former uses echoes from a large spatial footprint, preventing the detection of small-scale anomalies, while the latter assumes a known, spatially invariant reflectivity for tracked layers. However, by considering returns from off-nadir in airborne surveys, techniques from multi-offset surface surveys can be modified and extended to perform airborne attenuation tomography. While not reaching the range of path diversity achievable in surface-based surveys due to limitations imposed by total internal reflection at the ice-air interface, airborne off-nadir returns contain valuable information about subglacial and englacial conditions that is often ignored. Thus, we propose a method for estimating englacial attenuation and basal roughness using the drop in power from the peak to tail of hyperbolic scattering events in unfocussed radargrams associated with the rough bed surface. The travel-paths of the bed returns across a given hyperbolic event vary in both length and bed incidence angle. Thus, the drop in return power across a hyperbolic event gives insight into both the integrated attenuation along a travel-path, as well as the scattering function at the bed. Specular reflections from internal layers with varying dips similarly provide diversity in travel-path lengths, allowing the derivation of a relationship between path length and return power without the complications brought about by diffuse scattering at rough surfaces. Using the diverse path lengths and angles through the ice, a tomographic inversion to map the spatial distribution englacial attenuation anomalies can be implemented. This technique is applied to synthetic data, as well as data collected using the British Antarctic Survey’s Polarimetric-radar Airborne Science Instrument (PASIN), specifically to lines collected over the Eastern Shear Margin of Thwaites Glacier. This location was chosen as constraining bed conditions and identifying expected englacial thermal anomalies are critical to understanding the history and modelling the future of Thwaites.

How to cite: May, D., Schroeder, D., and Young, T. J.: Radar Attenuation Tomography for Mapping Englacial Temperature Distributions Using Off-Nadir Airborne Radio-Echo Sounding, EGU General Assembly 2023, Vienna, Austria, 23–28 Apr 2023, EGU23-9833, https://doi.org/10.5194/egusphere-egu23-9833, 2023.

EGU23-10127 | ECS | PICO | CR2.2

Monitoring lake ice with acoustic sensors 

Christoph Wetter, Cédric Schmelzbach, and Simon C. Stähler

Monitoring of the thickness and elastic parameters of floating ice on lakes and the sea is of interest in understanding the climate change impact on Alpine and Arctic environments, assessing ice safety for recreational and engineering purposes, studying ice shelves as well as exploring possibilities for the future exploration of the icy crusts of ocean worlds in our solar system. A multitude of geophysical methods exist today to monitor sea and lake ice thickness as well as elastic parameters. Mostly, seismic and radar measurements are used. Both methods have in common that they come with significant logistical effort and expensive equipment. In this study, we present a novel low cost approach using acoustic sensors for ice monitoring.

We explored the possibility of using microphones deployed on frozen lakes in the Swiss Alps to monitor the lake ice-thickness using acoustic signals originating from frequently occurring ice quakes. Data were obtained during a three-month-long field campaign at Lake St. Moritz in Switzerland in winter 2021/2022. Three microphone stations were placed on the lake in addition to five conventional seismometers. These seismometers were used to compare the acoustic signals with the seismic ice quake recordings. Additionally, also active-source experiments were conducted using hammer strokes as source, which were used to constrain elastic parameters of the ice.

The acoustic recordings of ice quakes allowed us to exploit the unique characteristics of so-called air-coupled waves to determine time-dependent ice thickness curves of Lake St. Moritz for winter 2021/2022 using acoustic data only. Furthermore, the acoustic data allowed us to gain new insights into the ice/air coupling of seismic waves in ice. 

How to cite: Wetter, C., Schmelzbach, C., and Stähler, S. C.: Monitoring lake ice with acoustic sensors, EGU General Assembly 2023, Vienna, Austria, 23–28 Apr 2023, EGU23-10127, https://doi.org/10.5194/egusphere-egu23-10127, 2023.

EGU23-11787 | ECS | PICO | CR2.2

Validating manual measurements of snow water equivalent against a reference standard 

Alexander Radlherr and Michael Winkler

The snowpack is a key component in several fields like climatology, hydrology, or natural hazards research and mitigation, not least in mountainous regions. One of the most considerable snowpack features is the snow water equivalent (SWE), representing the mass of water stored in the snowpack and – in another perspective – the weight straining objects the snow is settling on (snow load). In comparison to snow depth, measuring SWE is rather complex and prone to errors. Consecutive observations of SWE do not have a long tradition in many regions.

Despite various recent developments in measuring SWE by means of remote sensing or other noninvasive methods, e.g. with scales, GNSS reflectometry, signal attenuation and time delay techniques, cosmic-ray neutron sensing, etc. the standard measuring technique still are snow tubes or gauging cylinders, often in combination with digging pits. Tubing-technique is commonly used as reference for the validation of named modern methods, although studies addressing its accuracy, precision and repeatability are very rare.

This contribution provides results from comparing different types of SWE measurement tubes with reference standard oberservation. Several field tests were executed at different sites in the Austrian Alps covering a great variety of snow conditions (e.g. dry and wet), snow depths and SWEs. For the reference observation 3x4 m rectangular fields were dug snow-free and the respective snow masses have been weighted stepwise using ca. 50-liter-buckets. Due to the large total mass of snow of typically around two tons per rectangular, relative uncertainties are extremely small and the results highly accurate. Additionally, different snow tubes were compared to each other. The cylinder or tube designs vary a lot: from meters long metal coring tubes of typical inner diameters of ca. 4-7 cm (without the need of pits) or PVC cylinders with typical lengths of 0.5 to 1.5 m and diameters ranging from about 5-20 cm to small aluminum tubes holding a maximum of 0.5 liter of snow.  

Many statistical measures like variance and bias vary quite a lot primarily depending on the equipment used, but also on the different snow conditions. A synopsis on the suitability of the various methods depending on the questioning or objective of the observation is provided.

How to cite: Radlherr, A. and Winkler, M.: Validating manual measurements of snow water equivalent against a reference standard, EGU General Assembly 2023, Vienna, Austria, 23–28 Apr 2023, EGU23-11787, https://doi.org/10.5194/egusphere-egu23-11787, 2023.

EGU23-13127 | PICO | CR2.2

Snow depth sensitivity to mean temperature and elevation in the European Alps 

Matthew Switanek, Wolfgang Schöner, and Gernot Resch

Many of the gauged snow depth measurements in the European Alps began in the late 19th and early 20th centuries. We leverage this reasonably long period of record to investigate the historical sensitivity of snow depths as a function of precipitation, mean temperature, and elevation. By controlling for changes in precipitation, we can isolate the influence that different temperature changes have on snow depths at varying elevation bands. This simple, yet effective, approach to defining our historical sensitivity can provide a robust observational framework to evaluate the impact that a range of different future warming scenarios would have on snow depths across the Alps. As a result, adaptation and mitigation measures can be put in place for a variety of end users, such as ski tourism and water resource management. Furthermore, this provides an observational reference by which to evaluate the performance of climate model simulations.

How to cite: Switanek, M., Schöner, W., and Resch, G.: Snow depth sensitivity to mean temperature and elevation in the European Alps, EGU General Assembly 2023, Vienna, Austria, 23–28 Apr 2023, EGU23-13127, https://doi.org/10.5194/egusphere-egu23-13127, 2023.

EGU23-14390 | ECS | PICO | CR2.2

Long-time permafrost evolution in alpine bedrock: quantifying climate change effects with geoelectrical monitoring 

Riccardo Scandroglio, Maike Offer, and Michael Krautblatter

While climate change driven increase in air temperature has been correctly modeled in recent decades, the extent of its consequences is still uncertain. In high alpine environments, especially in steep rock walls, permafrost degradation reduces slope stability with critical consequences for people and infrastructures: to properly assess the risk, the rate of these changes must be monitored. In the last decades, electrical resistivity tomography (ERT) has been used in more than hundred studies to detect permafrost, but there are only limited long-term monitoring cases that mostly do not provide quantitative information. 

Here we compare ERT measurements from two alpine landforms with different altitude and lithology: Steintälli ridge (3160m asl, CH) and Mt. Zugspitze rock wall (2750 m asl, DE/AT). Standard procedures and permanently installed electrodes allow the collection of a unique dataset of consistent measurements since 2006. Supporting information like resistivity-temperature calibration from former studies, rock surface and borehole temperatures as well as active seismic refraction measurements enable an advanced quantitative interpretation of the results. 

Permafrost at both sites is close to disappearing and in both cases resistivity changes are evident and in good agreement with air temperature increase, although with different magnitudes according to the landform. The yearly 3D measurements of the Steintälli ridge show a sudden and conspicuous degradation (~40% of the volume in 15 years), while the monthly 2D monitoring of the north face of Mt. Zugspitze shows slow constant decrease in summer (~15% of the surface in 15 years) and a strong variation in winter in correlation with snow-height. 

For the first time we provide a quantification of alpine permafrost degradation rates in different landforms over 15 years. These datasets help to better understand the different characteristics of the thermal responses to the climate change induced stress on alpine permafrost environments.

How to cite: Scandroglio, R., Offer, M., and Krautblatter, M.: Long-time permafrost evolution in alpine bedrock: quantifying climate change effects with geoelectrical monitoring, EGU General Assembly 2023, Vienna, Austria, 23–28 Apr 2023, EGU23-14390, https://doi.org/10.5194/egusphere-egu23-14390, 2023.

EGU23-16308 | ECS | PICO | CR2.2

Thwaites Glacier Eastern Shear Margin: Insights from two broadband seismic arrays 

Emma C. Smith, Marianne Karplus, Jake Walter, Nori Nakata, Adam D. Booth, Lucia Gonzalez, Andrew Pretorius, Ronan Agnew, Stephen Veitch, Eliza J. Dawson, Daniel May, Paul Summers, Tun Jan Young, Poul Christoffersen, and Slawek Tulaczyk

The stability of Thwaites Glacier, the second largest marine ice stream in West Antarctica, is a major source of uncertainty in future predictions of global sea level rise. Critical to understanding the stability of Thwaites Glacier, is understanding the dynamics of the shear margins, which provide important lateral resistance that counters basal weakening associated with ice flow acceleration and forcing at the grounding line. The eastern shear margin is of interest, as it is poorly topographically constrained, meaning it could migrate rapidly, causing further ice flow acceleration and drawing a larger volume of ice into the fast-flowing ice stream. 

We present initial insights from a 2-year-long seismic record, from two broadband seismic arrays each with 7 stations, deployed across the eastern shear margin of Thwaites Glacier. We have applied a variety of processing methods to these data to detect and locate icequakes from different origins and analyse them in the context of shear-margin dynamics. Preliminary results suggest there is basal seismicity concentrated near the ice-bed interface on the slow-moving side of the margin, as opposed to within the ice-stream itself. Some of the identified seismic events appear to exhibit clear shear-wave splitting, suggesting a strong anisotropy in the ice, which would be consistent with polarization observed in recently published radar studies from the field site. Further analysis of the split shear-waves will allow us to better constrain the region's ice-fabric, infer past shear-margin location, and assess the future stability of this ice rheology.  

With such a large quantity of data, manual event identification is unpractical, and hence we are employing machine-learning approaches to identify and locate icequakes of interest in these data. Our results and forthcoming results from upcoming active-seismic field seasons have important implications for better understanding the stability of glacier and ice stream shear margins. 

How to cite: Smith, E. C., Karplus, M., Walter, J., Nakata, N., Booth, A. D., Gonzalez, L., Pretorius, A., Agnew, R., Veitch, S., Dawson, E. J., May, D., Summers, P., Young, T. J., Christoffersen, P., and Tulaczyk, S.: Thwaites Glacier Eastern Shear Margin: Insights from two broadband seismic arrays, EGU General Assembly 2023, Vienna, Austria, 23–28 Apr 2023, EGU23-16308, https://doi.org/10.5194/egusphere-egu23-16308, 2023.

EGU23-16342 | PICO | CR2.2

Intercomparison of quantification methods for snow microstructure during the SnowAPP experiment 

Anna Kontu, Leena Leppänen, Roberta Pirazzini, Henna-Reetta Hannula, Juha Lemmetyinen, Petri Räisänen, Amy McFarlane, Pedro Espin Lopez, Kati Anttila, Aleksi Rimali, Hanne Suokanerva, Jianwei Yang, Teruo Aoki, Masashi Niwano, Ghislain Picard, Ines Ollivier, Laurent Arnaud, Margaret Matzl, Ioanna Merkouriad, and Martin Schneebeli

Snow microstructure defines the physical, mechanical and electromagnetic properties of snow. Accurate information of snow structure is needed by many applications, including avalanche forecasting (Hirashima et al., 2008) and numerical weather prediction (de Rosnay et al., 2014). The interaction of electromagnetic waves with snow properties can be applied in satellite remote sensing to retrieve, for example, global information of snow mass (Pulliainen et al., 2020). Objective in-situ observations of snow microstructure are needed to validate and develop both physical models and satellite snow retrieval algorithms. Conventional measurements of snow grain size are unsatisfactory in this regard, as the parameter is difficult to measure objectively, and even its definition is ambiguous (Mätzler, 2002). Hence, recent efforts have focused on developing forward models of microwave interactions and snow specific surface area (SSA), which can be objectively measured in field and laboratory conditions using various methods. A recently proposed approach links SSA to microwave scattering properties through another physically defined parameter (Picard et al., 2022).

In the SnowAPP project, three field campaigns were carried out at the Finnish Meteorological Institute Arctic Research Centre in Sodankylä, with the goal of collecting data on snow microstructural properties and establishing the relation of microstructure to both optical reflectance and microwave emission and scattering from snow.  During the spring 2019 campaign, six different methods were used for measuring SSA; and several methods were used for measuring snow density, another important factor affecting especially the extinction of microwave energy. Furthermore, multi-frequency radiometry and a wide-band, high resolution spectrometer were used to measure microwave emission and reflectance. In this study, we compare objectively the SSA and density values obtained by the different methods in a round-robin exercise. The relation of measured snow microstructures to measured spectral properties of snow are discussed.

SnowAPP was funded by the Academy of Finland, with contributions from WSL Institute for Snow and Avalanche Research SLF, Centre Tecnològic de Telecomunicacions de Catalunya, Beijing Normal University, National Institute for Polar Research, Meteorological Research Institute (Japan), and Université Grenoble Alpes.


de Rosnay, P., Balsamo, G., Albergel, C., Muñoz-Sabater, J., & Isaksen, L. (2014). Initialisation of land surface variables for numerical weather prediction. Surveys in Geophysics, 35(3), 607–621. https://doi.org/10.1007/s10712-012-9207-x

Hirashima, H., Nishimura, K., Yamaguchi, S., Sato, A., & Lehning, M. (2008). Avalanche forecasting in a heavy snowfall area using the snowpack model. Cold Regions Science and Technology, 51(2–3), 191–203. https://doi.org/10.1016/j.coldregions.2007.05.013

Mätzler, C., 2002. Relation between grain-size and correlation length of snow. J. Glaciol., (48)162: 461-466.

Picard, G., Löwe, H., Domine, F., Arnaud, L., Larue, F., Favier, V., & Meur, E. le. (2022). The Microwave Snow Grain Size: A New Concept to Predict Satellite Observations Over Snow-Covered Regions. https://doi.org/10.1029/2021AV000630

Pulliainen, J., Luojus, K., Derksen, C., Mudryk, L., Lemmetyinen, J., Salminen, M., Ikonen, J., Takala, M., Cohen, J., Smolander, T., & Norberg, J. (2020). Patterns and trends of Northern Hemisphere snow mass from 1980 to 2018. Nature, 581(7808), 294–298. https://doi.org/10.1038/s41586-020-2258-0


How to cite: Kontu, A., Leppänen, L., Pirazzini, R., Hannula, H.-R., Lemmetyinen, J., Räisänen, P., McFarlane, A., Espin Lopez, P., Anttila, K., Rimali, A., Suokanerva, H., Yang, J., Aoki, T., Niwano, M., Picard, G., Ollivier, I., Arnaud, L., Matzl, M., Merkouriad, I., and Schneebeli, M.: Intercomparison of quantification methods for snow microstructure during the SnowAPP experiment, EGU General Assembly 2023, Vienna, Austria, 23–28 Apr 2023, EGU23-16342, https://doi.org/10.5194/egusphere-egu23-16342, 2023.

EGU23-16522 | ECS | PICO | CR2.2

Resolving ice content heterogeneity within permafrost peatlands using high-frequency induced polarisation. 

Madhuri Gopaldas Sugand, Andreas Hördt, and Andrew Binley

Permafrost peatlands are highly vulnerable ecosystems in a warming climate; their thaw greatly impacts carbon storage capacity and endangers existing landscape morphology. Due to their remoteness and, in some cases, protected status, it is difficult to characterise and monitor the subsurface using invasive methods. Geophysical investigations are useful in such cases allowing relatively rapid and extensive subsurface mapping. We focus here on the emerging high-frequency induced polarisation (HFIP) method, which can be effective in permafrost hydrology research as the geoelectrical properties of frozen water display a characteristic frequency-dependence between ranges of 100 Hz and 100 kHz.

HFIP field measurements were conducted using the Chameleon-II equipment (Radic Research) on two peat permafrost sites located in Abisko, Northern Sweden: Storflaket mire and Heliport mire. The sites have been subject to routine permafrost monitoring since 1978 and are known to have an upper peat layer underlain by a silt-rich subsoil. We present the results of 2D surveys measuring frequencies ranging from 1 Hz to 57 kHz, which capture a high-frequency phase shift peak. Field data are inverted for each measured frequency separately with ResIPy, using an appropriate data error quantification model. The spectral data analysis captures heterogeneity within the subsurface, i.e., layered medium, permafrost mire boundary and ice-rich versus ice-poor regions. Identification of spectrally distinct regions allows the application of an appropriate relaxation model. For this study, we apply a two-component mixture model for ice-content estimation. Our results extend the existing knowledge at this site by quantifying ice content in a 2D plane, thus improving the foundation for further modelling studies.

How to cite: Sugand, M. G., Hördt, A., and Binley, A.: Resolving ice content heterogeneity within permafrost peatlands using high-frequency induced polarisation., EGU General Assembly 2023, Vienna, Austria, 23–28 Apr 2023, EGU23-16522, https://doi.org/10.5194/egusphere-egu23-16522, 2023.

Compared to the Western European Alps, the ice extent during the Last Glacial Maximum (LGM) and the subsequent deglaciation history of the Eastern Alps east of the Tauern Window remains less well constrained. Also, considerable discrepancies exist between the mapped LGM ice margin (Ehlers and Gibbard, 2011; van Husen, 2004, 2011) and the ice extent predicted by ice-sheet models (Seguinot et al., 2018). Here we present the first 10Be surface exposures ages from two regions east of the Tauern window (Gurktal and Lavantal Alps), which provide constraints on the LGM ice extent and the deglaciation history (Wölfler et al., 2022). Our results show that the deglaciation of the Gurktal Alps occurred between 16-14 ka, which agrees with the predictions from ice-sheet models and implies that the LGM ice cover was greater than mapped. This finding also supported by our analysis of high-resolution DEMs that revealed glacially streamlined ridges and macroscale glacial striations consistent with modelled ice flow directions (Seguinot et al., 2018). In contrast, the 10Be ages from the Lavantal Alps located farther east are either LGM in age or pre-date the LGM, indicating that these regions were ice-free or only partially covered by LGM ice. Based on these results, our future investigations will aim at obtaining more age data from the Eastern Alps to refine the location of the LGM ice margin and the deglaciation history, which is also crucial for climate-evolution and postglacial-rebound models.


References

Ehlers J, Gibbard PL, Hughes PD (2011) Quaternary glaciations - Extent and chronology. A closer look. Developments in Quaternary Science 15.

Seguinot J., Ivy-Ochs S, Jouvet G, Huss M, Funk M, Preusser F. (2018) Modelling last glacial cycle ice dynamics in the Alps. The Cryosphere 12: 3265–3285.

van Husen D. (2004) Quaternary glaciations in Austria. In: Quaternary Glaciations: Extent and Chronology Part I: Europe, Ehlers J, Gibbard PL (eds). Elsevier: London: 1–13.

van Husen D (2011) Quaternary Glaciations in Austria. In Quaternary Glaciations – Extent and Chronology: A Closer Look, Ehlers J, Gibbard PL, Hughes PD (eds). 15: 15–28.

Wölfler A, Hampel A, Dielforder A, Hetzel R, Glotzbach C (2022) LGM ice extent and deglaciation history in the Gurktal and Lavantal Alps (eastern European Alps): first constraints from 10Be surface exposure dating of glacially polished quartz veins, Journal of Quaternary Science  37: 677-687. https:// doi.org/10.1002/jqs.3399

How to cite: Hampel, A., Wölfler, A., Dielforder, A., Hetzel, R., and Glotzbach, C.: LGM ice extent and deglaciation history in the Gurktal and Lavantal Alps (Eastern European Alps): first constraints from 10Be surface exposure dating of glacially polished quartz veins, EGU General Assembly 2023, Vienna, Austria, 23–28 Apr 2023, EGU23-1380, https://doi.org/10.5194/egusphere-egu23-1380, 2023.

EGU23-2068 | Posters on site | GM2.6

Old orogen - young topography: Landscape Rejuvenation in the Bohemian Massif 

Jörg Robl, Kurt Stüwe, Fabian Dremel, Moritz Liebl, Christoph von Hagke, and Derek Fabel

The Bohemian Massif is the relic of a major Paleozoic mountain range that is known to have exhumed and its surface levelled in the Permian. The southern part of the Bohemian Massif with high grade metamorphic rocks and magmatic intrusions dips towards the south under the weakly consolidated Neogene sediments of the Molasse Basin. However, Neogene landscape evolution is largely unconstrained, but the occurrence of marine sediments several hundred meters above sea level is a clear indication of significant surface uplift during the last few million years. The landscape is characterized by rolling hills and extended planation surfaces above an elevation of about 500 m. However, at lower elevations deeply incised gorges confined by steep hillslopes are abundant and contrast impressively with the low relief landscapes above. A continental drainage divide follows the central ridge of the Bohemian Massif with the Vlatava (Moldau) and the Danube (Donau) draining the regions north and south of the drainage divide. In this study we aim quantifying spatial and temporal variations of landscape change in the Bohemian Massif during the last few million years. To characterize the two contrasting landscape states, we computed landscape metrics based on digital elevation models (e.g. normalized steepness index, geophysical relief). To determine the rate landscape change we determined catchment-wide erosion rates from the concentration of cosmogenic 10Be in river sands.

Results show that the landscape is characterized by out-of-equilibrium river profiles with knickpoints abundantly occurring at elevations between 450 m and 550 m separating steep channel segments at lower elevations from less steep channels at higher elevations. Hypsometric maxima at or close above knickpoint elevations along with high and low values in geophysical relief downstream and upstream of major knickpoints support the idea of landscape bimodality. Furthermore, we found a strong drainage divide asymmetry, which evidences for the reorganization of the drainage network of the region. Across-divide gradients in channel steepness predict the northward migration of the Danube-Vltava drainage divide including growth and shrinkage of tributary catchments. Erosion rates of the 20 investigated catchments are very low (20 – 50 m per million year) compared to the Alps or other active mountain ranges. The lowest erosion rates occur in catchments with a large fraction of planation surfaces at mid-altitudes. Highest erosion rates occur in elongated catchments of Danube tributaries. Based on our results we suggest that the occurrence of contrasting bedrock properties between Molasse sediments and the crystalline basement represents a superior control on the topographic evolution of the entire region. The transition from soft sediments of the Molasse basin to much less erodible basement rocks during progressive river incision in a setting of low but long last uplift distinctly changes the channel steepness and relief, the course of the receiving streams, and their susceptibility to sudden changes in flow direction (river capture) of the million years’ time scale.

How to cite: Robl, J., Stüwe, K., Dremel, F., Liebl, M., von Hagke, C., and Fabel, D.: Old orogen - young topography: Landscape Rejuvenation in the Bohemian Massif, EGU General Assembly 2023, Vienna, Austria, 23–28 Apr 2023, EGU23-2068, https://doi.org/10.5194/egusphere-egu23-2068, 2023.

EGU23-2346 | Posters on site | GM2.6

Surface uplift of the Eastern Alps. Much faster than we thought? 

Kurt Stüwe, Gerit Gradwohl, Joerg Robl, Lukas Plan, Derek Fabel, and Fin Stuart

We present cosmogenic nucleide data that help to understand the ill-constrained  uplift history of the Eastern Aps. Well accepted, but indirect evidence  for this uplift history includes: (a) the onset of flexural subsidence of the foreland basins, or (b) the formation of the Periadriatic line (recording the onset of continent-continent collision in the Alps). Both are often used to suggest about 30 Ma as the starting date for the surface uplift of the range. Since this time the fine interplay of many kilometres of upwards rock uplift and downwards erosion resulted in net surface uplift of some 2-3 kilometres but reference frames that allow to discern between rock uplift and surface uplift are often hard to identify. One way of measuring surface uplift rates is through the study of areas where erosion did not occur. That is, dating and identifying relicts of ancient base levels for example in caves, sediments or paleosurfaces.

In this contribution we present 10Be, 21Ne, 26Al cosmogenic nucleide data of fluvial sediments sampled in some 50 caves across the Eastern Alps from elevations between 300 and 2500 m surface elevation. We collected samples that were interpreted to have been deposited during cave formation at the vadose-phreatic transition. As such, they form markers for base level and  the age of their burial into the cave may be interpreted as the time the cave was at base level some few hundreds of meters above sea level. Interpretation of our data indicates that the uplift rate of the Eastern Alps may be in the order of 200 m – 500 m per Million years for much of the Pliocene. As such, much of the observed surface uplift of the Eastern Alps may have occurred since the late Miocene and surface uplift is thus much faster than previously thought.


How to cite: Stüwe, K., Gradwohl, G., Robl, J., Plan, L., Fabel, D., and Stuart, F.: Surface uplift of the Eastern Alps. Much faster than we thought?, EGU General Assembly 2023, Vienna, Austria, 23–28 Apr 2023, EGU23-2346, https://doi.org/10.5194/egusphere-egu23-2346, 2023.

EGU23-4811 | ECS | Posters virtual | GM2.6

Inferring Long Term Averaged Soil Redistribution Pattern using Meteoric 10Be 

Arkaprabha Sarkar, Vimal Singh, Pankaj Kumar, Pavitra V. Kumar, and Rajveer Sharma

Soil loss is one of the major environmental threats the world is facing due to horizontal expansion of cities and increasing land abuse. It has been previously shown by workers that the abuse or improper use of land and soil had adversely affected early civilisations. Keeping into consideration the imminent threat, a number of methods have been proposed to estimate soil loss e.g. numerical models, monitoring-based field methods. However, these are either time-consuming or inherently carry a degree of uncertainty.

One method involves using environmental fallout nuclides as tracers of soil erosion and mapping areas of soil loss and accumulation. The commonly used nuclides in this technique are 137Cs and 7Be. 137Cs is a nuclear fission product and cannot be used to track soil dynamics older than 1940s, while 7Be has a very short half-life and is used to study soil dynamics in a seasonal scale.

In this study, we have proposed a method of using meteoric 10Be to trace long-term soil redistribution in a landscape. This cosmogenic nuclide is produced in the atmosphere and reaches the land surface by dry and wet fallout. Once it reaches the surface, it is adsorbed by the soil particles and it mobilizes along with the soil. Thus, higher concentrations indicate net soil accumulation, whereas, lower concentrations are due to net soil loss. The rate of delivery of 10Be flux estimated from global circulation models (GCMs) has been used to calculate rates of erosion.

We tested our method in Pranmati catchment, a small river catchment (~93 km2) in Uttarakhand, India and validated by comparing our findings with previously proposed geomorphic transport laws. Our results show that soil erodes from the high lying divergent (convex) topography and accumulates in the low lying convergent (concave) topography. The rates of erosion are also influenced by land cover – erosion in forests is much slower compared to grassland.

How to cite: Sarkar, A., Singh, V., Kumar, P., Kumar, P. V., and Sharma, R.: Inferring Long Term Averaged Soil Redistribution Pattern using Meteoric 10Be, EGU General Assembly 2023, Vienna, Austria, 23–28 Apr 2023, EGU23-4811, https://doi.org/10.5194/egusphere-egu23-4811, 2023.

EGU23-5206 | ECS | Orals | GM2.6

Erosion rate maps of the Northern Andes highlight spatio-temporal patterns of uplift and quantify sediment export 

Richard Ott, Nicolas Perez-Consuegra, Dirk Scherler, Andres Mora, Kimberley Huppert, Jean Braun, and Gregory Hoke

Erosion rates are commonly used to study tectonic uplift and sediment export from mountain ranges. However, the scarcity of erosion rate data often hinders detailed tectonic interpretations. Here, we present 25 new erosion rates from the Northern Andes of Colombia, determined from cosmogenic 10Be measurements, to study spatial and temporal patterns of uplift along the Central and Eastern Cordillera. These rates, along with published data and precipitation-corrected normalized channel steepness measurements, were used to create high-resolution erosion rate maps. The results show that the southern Central Cordillera has relatively uniform erosion rates, averaging around 0.3 mm/a, while the northern Central Cordillera exhibits rapidly eroding canyons dissecting slowly eroding low-relief surfaces. We interpret that long-term, steep slab subduction has led to an erosional steady-state in the southern Cordillera Central, while Late Miocene slab flattening caused an acceleration in uplift in the northern Cordillera Central which the landscape has not yet adjusted to. The Eastern Cordillera also displays pronounced erosional disequilibrium, with a slowly eroding central plateau rimmed by faster eroding western and eastern flanks. Our maps suggest recent topographic growth of the Eastern Cordillera, with deformation focused along the eastern flank, which is also supported by balanced cross-sections and thermochronologic data. Spatial gradients in predicted erosion rates along the eastern flank of the Eastern Cordillera suggest transient basin-ward migration of thrusts. By using our erosion maps to estimate sediment fluxes, we find that the Eastern Cordillera exports nearly four times more sediment than the Central Cordillera. Our analysis shows that accounting for spatial variations in erosion parameters and climate gradients reveals important variations in tectonic forcing that would otherwise be obscured in traditional river profile analyses. Moreover, given relationships between tectonic, and topographic evolution, we propose that the dynamic landscape evolution of the Northern Andes, as revealed by our erosion maps, is primarily linked to spatial and temporal variations in slab dip, with potentially additional influences from inherited Mesozoic rift structures.

How to cite: Ott, R., Perez-Consuegra, N., Scherler, D., Mora, A., Huppert, K., Braun, J., and Hoke, G.: Erosion rate maps of the Northern Andes highlight spatio-temporal patterns of uplift and quantify sediment export, EGU General Assembly 2023, Vienna, Austria, 23–28 Apr 2023, EGU23-5206, https://doi.org/10.5194/egusphere-egu23-5206, 2023.

EGU23-6006 | Orals | GM2.6

Last ice sheet recession and landscape emergence above sea level in east central Sweden, evaluated using 14C produced in situ in quartz 

Bradley W. Goodfellow, Arjen P. Stroeven, Alexander Lewerentz, Kristina Hippe, Jakob Heyman, Nathaniel A. Lifton, Marc W. Caffee, and Jens-Ove Näslund

The aim of this study is to test the Holocene relative sea-level (RSL) curve (or shoreline displacement curve) for east central Sweden using 14C produced in situ in quartz-bearing bedrock (in-situ 14C). The original RSL curve is instead based on radiocarbon dating of organic material from isolation basins. Having an accurate RSL curve is crucial from at least two aspects. In Sweden’s safety assessments for a planned spent nuclear fuel repository and for the existing repository for low- and intermediate level waste, the RSL curve is used to constrain the emergence above sea level in landscape development models. Also, the RSL is used to constrain model estimates of rates and depths of glacial and subaerial erosion from cosmogenic 10Be and 26Al produced in situ in quartz in bedrock surfaces.

Avoiding vein quartz and hydrothermally altered bedrock, five samples of granitoid bedrock were taken along an elevation transect extending southwards from Forsmark, the location of the planned spent nuclear fuel repository. Because all samples derive from bedrock outcrops positioned below the highest postglacial shoreline, they target the timing of progressive landscape emergence above sea level. To further assess the accuracy of in-situ 14C dating, we took an additional five samples from bedrock outcrops 100 km west of Forsmark, above the highest postglacial shoreline. The in-situ 14C concentrations in these samples should reflect local deglaciation ages.

The ten new in-situ 14C measurements provide robust age constraints that compare favorably with the original RSL curve derived from radiocarbon dating of organic material in isolation basins and with the regional deglaciation chronology. Inferences of limited rates and depths of bedrock erosion over the past 1 Myr, inferred from 10Be and 26Al inheritance and which are critically dependent on the RSL curve, therefore glean strong support from these new in-situ 14C measurements.

How to cite: Goodfellow, B. W., Stroeven, A. P., Lewerentz, A., Hippe, K., Heyman, J., Lifton, N. A., Caffee, M. W., and Näslund, J.-O.: Last ice sheet recession and landscape emergence above sea level in east central Sweden, evaluated using 14C produced in situ in quartz, EGU General Assembly 2023, Vienna, Austria, 23–28 Apr 2023, EGU23-6006, https://doi.org/10.5194/egusphere-egu23-6006, 2023.

EGU23-6902 | ECS | Orals | GM2.6

Deriving basin-wide denudation rates of basaltic rocks using cosmogenic Kr isotopes, vulcanic complex Vogelsberg, Germany 

Sabrina Niemeyer, Hella Wittmann, and Tibor J. Dunai

The Vogelsberg area in Hessen, Germany, comprises the largest contiguous volcanic complex in Central Europe, covering an area of about 2300 km². After volcanic activity ceased during the mid-Miocene, the complex was subject to extensive erosion and weathering. Fluvial erosion has shaped the area, which is now characterised by Pleistocene valleys and a radial river system exposing primitive alkali basalts and basanites. However, the inference of catchment-wide weathering and erosion rates from the most commonly used cosmogenic nuclide – mineral pair (e.g. 10Be from quartz) remains challenging in such an environment due to the mafic nature and nominally quartz-free composition of the local bedrock. Due to these method-related obstacles only few cosmogenic studies have focused on basaltic regions until now, even though basalt weathering is globally an important CO2 sink.

The development and establishment of the novel method using terrestrial cosmogenic krypton (Kr) in the weathering-resistant mineral zircon (Dunai et al. 2022) allows quantification of denudation on quartz-poor lithologies over hundreds of kyr timescales. We exploit the method’s advantage and sampled zircons from sediments of streams radially draining the Vogelsberg and measured Kr isotope abundances to assess the time-integrated erosion patterns shaping the volcanic complex. Integrating over millennial timescales, the 10Be(meteoric)/9Be system will be applied to the same catchments. The 10Be/9Be system can be measured on sediment of any type of lithology including mafic rock (Dannhaus et al. 2018), and thus presents an inter-method validation of the Kr method. We will present the krypton results and discuss basalt weathering in a currently temperate climate through the lens of the different methodological approaches applied.


Dunai et al. (2022) Geochronology, https://doi.org/10.5194/gchron-4-65-2022

Dannhaus et al. (2018) GCA, https://doi.org/10.1016/j.gca.2017.11.005

How to cite: Niemeyer, S., Wittmann, H., and Dunai, T. J.: Deriving basin-wide denudation rates of basaltic rocks using cosmogenic Kr isotopes, vulcanic complex Vogelsberg, Germany, EGU General Assembly 2023, Vienna, Austria, 23–28 Apr 2023, EGU23-6902, https://doi.org/10.5194/egusphere-egu23-6902, 2023.

EGU23-6922 | ECS | Orals | GM2.6

Post-glacial catchment denudation rates from 14C concentrations in Glen Feshie, Scotland 

Anya Towers, Simon Mudd, Mikael Attal, Steven Binnie, Fiona Clubb, and Tibor Dunai

Inferring erosion rates from 10Be or 26Al concentrations in stream sediments has become standard practice in geomorphology. In formerly glaciated landscapes, however, this technique is problematic because repeated phases of shielding and exposure during the past glacial and interglacial periods can lead to 10Be or 26Al concentrations that are difficult to interpret. Cosmogenic in-situ 14C has a short half-life (~5,730 years) that means 14C atoms in stream sediments cannot be inherited from before the glacial period and inferred erosion rates will reflect post-glacial, Holocene erosion. Using cosmogenic in-situ 14C, we report the first millennial-scale erosion rates in the post-glacial landscapes of Glen Feshie, within the Cairngorm mountains of Scotland.

The River Feshie contains active gravel reaches that cut through glacial outwash terraces. We counterintuitively find the lowest inferred erosion rates (0.06 mm/yr) in the steepest side tributary and the highest inferred erosion rates at the low-relief outlet of Glen Feshie near the confluence with the River Spey (0.21 mm/yr). Based on field observations, we interpret that hillslopes have been largely inactive and contributed limited sediment fluxes. To provide further insight into the highest erosion rate documented furthest downstream, we consider the hypothesis that sediment from the hillslopes with higher concentrations of 14C has been diluted with lower concentration material from the terraces. Further, we hypothesise that if terraces that border the channel increase in height downstream, their incision could have remobilised an increasing amount of sediment with lower 14C concentrations downstream, leading to increased dilution and the observed concentrations. Results show terrace height above the channels does not increase downstream and averages approximately 2 meters. We therefore suggest terrace height does not account for higher erosion rates, and present a cosmogenic-nuclide mixing model to explore the degree to which the input of sediment that has been shielded from cosmic rays in terraces can explain the observed concentrations in stream sediments.   

How to cite: Towers, A., Mudd, S., Attal, M., Binnie, S., Clubb, F., and Dunai, T.: Post-glacial catchment denudation rates from 14C concentrations in Glen Feshie, Scotland, EGU General Assembly 2023, Vienna, Austria, 23–28 Apr 2023, EGU23-6922, https://doi.org/10.5194/egusphere-egu23-6922, 2023.

The Early to Mid-Pleistocene Transition (MPT) between ~ 1.2 Ma to ~500 ka (also termed as ‘900 ka event’) marks a change in climatic periodicity, from 41 ka cycles to 100 ka cycles of increased intensity. In non-glaciated areas of Europe this climatic shift has been associated with pronounced acceleration of river incision, in part driven by increased sediment loads from periglacial hillslope processes. Until the Pleistocene, low-relief landscapes are thought to have dominated throughout Europe. Utilizing novel in-situ cosmogenic Krypton in zircon methodology (Dunai et al. 2022), we find direct evidence that this was indeed the case, and that these landscapes were profoundly transformed during the MPT.

Our study area (Vogtland, Saxony, Germany) was never glaciated but was within 50 km of the ice margins during the largest Quaternary glaciations. For our study, we utilize a unique source of megacryst zircons (Ebersbrunn diatreme), whose exhumation, dispersal and burial history is recorded by cosmogenic Krypton. The megacryst zircons are found in the fluvial sediments of the current catchments downstream of the source (Raumbach, Göltzsch, Weiße Elster), however, also in a distal catchment (Weida), now disconnected from the source due to late Pleistocene superimposed drainage (Weiße Elster valley).

The cosmogenic Krypton data from the megacryst zircons is commensurate with a long (1 to 3 Myr) exposure at or near the surface, or exhumation at a very low rate (<0.1 mMyr-1), followed by a period of burial of 600 to 900 kyr and a recent re-emergence in the active fluvial system. Samples collected further from the source (≥15 vs. 5 km) have longer burial histories. The extremely low erosion rates inferred prior to burial (<0.1 mMyr-1) are unprecedented for temperate regions in Europe, and late Quaternary erosion rates of landscapes with similarly moderate relief are two orders of magnitude faster. In situ cosmogenic 10Be and 26Al results on vein-quartz from the region address the latter findings.

Based on our data and external constraints on climate and landscape evolution in Europe, the most likely scenario is that of a formerly stable, low-relief Plio-Pleistocene landscape whose transformation in response to periglacial processes commenced during marine isotope stage (MIS) 22 and was largely concluded by MIS 16. Incision of drainage that developed during and after the MPT formed the current moderate relief landscape.

Dunai et al. (2022) Geochronology, https://doi.org/10.5194/gchron-4-65-2022

How to cite: Dunai, T. J. and Binnie, S. A.: Transformation of a low-relief periglacial landscape during the Mid Pleistocene Transition revealed by cosmogenic Krypton, EGU General Assembly 2023, Vienna, Austria, 23–28 Apr 2023, EGU23-7262, https://doi.org/10.5194/egusphere-egu23-7262, 2023.

EGU23-7899 | Posters on site | GM2.6

Calculation of cosmogenic radionuclide burial ages: a comparison of two models 

Zsófia Ruszkiczay-Rüdiger, Stephanie Neuhuber, Esther Hintersberger, Jesper Nørgaard, and Régis Braucher

Two published cosmogenic radionuclide (CRN) 26Al/10Be burial age calculation methods developed to correct for post-depositional production of nuclides in settings with low sediment overburden are compared. The advantages and limitations of simple (ISO; [1], [2]) and inverse modelling (INV, [3]) isochrons are investigated.

The studied dataset originates from the gravel of a Danube terrace in the Central Vienna Basin (Austria) [4]., where two horizons (5.5 m and at 11.8 m subsurface depth) were sampled. Each sample set contained 6 quartz or quartzite cobbles.

The advantage of ISO is that it is uninfluenced by changes in sample depth over time. However, the initial 26Al/10Be ratio is fixed and no pre- and post-burial denudation rates can be calculated. In addition to age, INV models source and sink denudation rates, but assumes constant depth over burial time.

For correct application of ISO and INV outliers, must be excluded. The robustness of both methods is tested by systematically including or excluding data points (bootstrapping) to estimate the dependence of numerical ages on sample selection either in the field, or during outlier identification.

For outlier identification the traditional method of data exclusion of points above or below the isochron line is used. In addition, a new way is introduced here: the post-burial production is calculated using the modelled burial age and denudation rate and compared to the measured inventories of 10Be and 26Al. If the fraction of post-burial production is equal or higher compared to the measured inventory and its ratio is considerably different for the two isotopes from the same sample, the datapoint is invalid.

In addition, the influence of each sample on the modelled burial age, tested by bootsrapping, is used to exclude samples with a large effect on the age.

The resulting ages at both levels using ISO and INV agree within errors with ISO being systematically slightly younger. The importance of outlier removal is stressed by the fact that inclusion of all samples results in a considerably older age of the stratigraphically higher level compared to the underlying one.   When outliers are excluded, burial ages of the two sampled horizons overlap within uncertainty, suggesting one single deposition event for the whole sediment package.

Interestingly, when the entire dataset is merged, both methods provide similar ages regardless of the outliers being excluded or kept in. This demonstrates that a larger sample number increases the robustness of a dataset considerably and decreases the sensitivity of either method to potential outliers.

In summary, both ISO and INV are robust ways of CRN burial age determination, provided that model presumptions are not violated and outliers are excluded or the sample number large enough to overprint the influence of outliers.

Funding: NKFIH FK124807; OMAA 90ou17; OMAA 98ou17.


References

[1] Balco, G., Rovey, C.W., 2008. American Journal of Science 308(10), 1083-1114.

[2] Erlanger, E.D., et al., 2012. Geology 40(11), 1019-1022.

[3] Pappu, S. et al., 2011. Science, 331(6024), 1596-1599.

[4] Ruszkiczay-Rüdiger, Zs. et al., 2021. Journal of Radioanalytical and Nuclear Chemistry, 329(3), 1523-1536.

How to cite: Ruszkiczay-Rüdiger, Z., Neuhuber, S., Hintersberger, E., Nørgaard, J., and Braucher, R.: Calculation of cosmogenic radionuclide burial ages: a comparison of two models, EGU General Assembly 2023, Vienna, Austria, 23–28 Apr 2023, EGU23-7899, https://doi.org/10.5194/egusphere-egu23-7899, 2023.

EGU23-8283 | ECS | Posters on site | GM2.6

Englacial transport time of rock debris: new constraints from luminescence rock surface burial dating 

Audrey Margirier, Georgina King, Christoph Schmidt, Julien Brondex, and Ann Rowan

In recent decades, most mountain glaciers have been losing mass in response to climate change, and the area of the ablation zone covered by rock debris is expanding. Debris-covered glaciers are expected to have a longer life expectancy than climatically equivalent clean-ice glaciers because supraglacial debris insulates the underlying ice surface and reduces ablation. In order to accurately predict how debris-covered glaciers will evolve under a changing climate it is essential to quantify the processes controlling their behaviour. We used luminescence rock surface burial dating to constrain the englacial transport time of debris within an alpine debris-covered glacier. We collected 24 samples embedded in the ice in the ablation zone of the Miage Glacier, in the Mont-Blanc Massif (Italy). The natural luminescence signal of rock slices was measured from the surface to a depth of ~10 mm using a protocol comprising IRSL50, IRSL225 and OSL125 measurements. Nine of our samples showed a plateau within the first 2 to 3 discs suggesting that the luminescence signal has the potential to be used to date the burial duration of debris. Among them, 5 and 7 samples passed the dose recovery test for the IR50 signal within 10% and 20% of unity respectively. Only 3 samples passed the dose recovery test for the IR225 signal within 10% of unity. After 24h bleaching in the solar simulator, typical residual doses are as high as 20-40% of the natural equivalent dose measured. We obtained preliminary non fading corrected ages for 5 samples in the range from ~0.8 to ~11 ka. Glacier model estimated englacial rock debris transport times are an order of magnitude lower than the oldest ages obtained suggesting either that some clasts were stored on hillslopes or within moraines prior to englacial transport or that calibration issues may have contributed to age overestimation. Further luminescence signal processing quality checks are required to assess the quality of our ages. If ultimately successful, our results, and the application of luminescence rock surface burial dating to englacially transported debris, will enhance understanding of the dynamics of debris-covered glaciers and inform the use of glacier models for debris covered glaciers, which will improve projections of the contribution of mountain glaciers to the sustainability of water resources in vulnerable catchments such as those in High Mountain Asia and South America.

How to cite: Margirier, A., King, G., Schmidt, C., Brondex, J., and Rowan, A.: Englacial transport time of rock debris: new constraints from luminescence rock surface burial dating, EGU General Assembly 2023, Vienna, Austria, 23–28 Apr 2023, EGU23-8283, https://doi.org/10.5194/egusphere-egu23-8283, 2023.

EGU23-8714 | ECS | Orals | GM2.6

Spatial and temporal distribution of glacial erosion as recorded by apatite (U-Th)/He and 4He/3He thermochronology. 

Maxime Bernard, Peter van der Beek, Cody Colleps, and Julien amalberti

Constraining the impact of Quaternary glaciations on landscape dynamics is required to better understand the interaction between tectonics, climate, and erosion. Over the years, low-temperature thermochronology such as apatite (U-Th)/He (AHe) has been used to quantify glacial erosion in different climatic and tectonic settings. However, in some contexts, AHe records lack temporal resolution because of limited exhumation due to glacial incision and/or low geothermal gradients. In addition, significant spatial variability in erosion can affect the quality of thermal-kinematic inversions when combining spatially distributed AHe data. This effect may be significant in glacial settings where a switch from a fluvial to a glacial landscape induced a significant change in the spatial distribution of erosion.

However, the 4He/3He thermochronology can extract lower-temperature and higher-resolution thermal histories from an AHe dataset. The method uses the spatial distribution of natural 4He in an apatite crystal, which reflects the rate of cooling through the AHe partial retention zone. It has been successfully applied to track glacial incision and relief-development histories that would have been untraceable with conventional AHe thermochronology. Consequently, thermochronology data can now provide more detailed and localized thermal history. While 4He/3He thermochronology has been successfully used in settings where background exhumation rates are moderate, the sensitivity of the technique remains untested in settings with notably low exhumation-rates, such as at passive margins.

Here, we couple a glacial landscape-evolution model (iSOSIA) with a new version of a thermo-kinematic model (PecubeGUI), incorporating radiation-damage effects on helium diffusion, to explore the ability of apatite (U-Th)/He and 4He/3He thermochronometers to record glacial incision. To do so, we model a range of synthetic glacial scenarios in different tectonic, climatic, and thermal settings.  Our landscape-evolution models include glacial, fluvial and hillslope erosion, as well as sediment transport. We assess model predictions of thermochronologic parameters, including age-elevation relationships and 4He/3He spectra, and their evolution when switching from a steady-state fluvial to a glacial topography. This modelling exercise aims to provide a guide for sampling strategies and interpretations for both conventional apatite (U-Th)/He and 4He/3He thermochronology when working in glacial settings, considering their particular tectonic and climatic context.

How to cite: Bernard, M., van der Beek, P., Colleps, C., and amalberti, J.: Spatial and temporal distribution of glacial erosion as recorded by apatite (U-Th)/He and 4He/3He thermochronology., EGU General Assembly 2023, Vienna, Austria, 23–28 Apr 2023, EGU23-8714, https://doi.org/10.5194/egusphere-egu23-8714, 2023.

EGU23-9975 * | Orals | GM2.6 | Highlight

Cosmogenic nuclide dating applied to human evolution 

Darryl Granger

Cosmogenic nuclides have become a well-established tool in geomorphology for quantifying surface process rates and for dating landforms and sedimentary deposits such as terraces, alluvial fans, lakes, and cave infills.  In many cases, these sedimentary deposits can tell us not only about landscape evolution, but if they contain artifacts or fossils, they can also inform us about human evolution, migration, and the development of stone tool technology.   

Burial dating with 26Al and 10Be is becoming increasingly important in archaeology and paleoanthropology, particularly in areas that lack volcanic rocks suitable for dating. The development of isochron methods has improved both the precision and reliability of dating results, lending confidence to the age interpretations.  However, because cosmogenic nuclides reflect the exposure and burial history of rocks near the ground surface, it is important to recognize that properly interpreting the depositional age requires understanding the surface processes responsible for sediment erosion and deposition. 

Cosmogenic nuclides have now been applied to archaeology and human evolution at a variety of sites across Africa, Asia, and Europe.  In most cases, the new dates conform to pre-existing models and provide a fuller picture of human occupation of the landscape.  However, a few sites have challenged current paradigms.  I will present recent studies from caves and terraces in South Africa and China that have produced surprising results, pushing the boundaries of where early humans were found. 

How to cite: Granger, D.: Cosmogenic nuclide dating applied to human evolution, EGU General Assembly 2023, Vienna, Austria, 23–28 Apr 2023, EGU23-9975, https://doi.org/10.5194/egusphere-egu23-9975, 2023.

EGU23-10655 | Posters on site | GM2.6

10Be dating of middle-late Pleistocene uplifted marine terraces in northern Pacific coast of Northeastern Japan 

Sachi Wakasa, Tatsuya Ishiyama, Daisuke Hirouchi, Nobuhisa Matta, Natsuko Fujita, and Tomoo Echigo

Surface exposure ages of marine and fluvial terraces based on in situ 10Be dating were determined to estimate formation ages and long-term rates of coastal uplift along the northern Pacific coast of Northeastern Japan. Surface rock samples were collected along the northern and southern coasts of Sanriku based on a reinterpretation of dispersed marine and fluvial terraces using DEM and aerial photographs. We collected three samples at the Samuraihama site from outcrops of pairs of marine and fluvial terraces distributed over the east-facing flank of the Kitakami Mountains. At the Yoshihama site, in contrast, where bedrock surfaces could be better exposed, we took vertical samples from weathered granite rocks on small trench walls dug on the middle marine terrace at Yoshihama Bay. Surface exposure ages from 10Be concentrations in quartz calculated from the measured 10Be/9Be ratios commonly suggest slow in both sites, whereas steep (~ 10°) dip domains on the marine terraces along the northern Sanriku coast may imply localized permanent strain accumulation.

How to cite: Wakasa, S., Ishiyama, T., Hirouchi, D., Matta, N., Fujita, N., and Echigo, T.: 10Be dating of middle-late Pleistocene uplifted marine terraces in northern Pacific coast of Northeastern Japan, EGU General Assembly 2023, Vienna, Austria, 23–28 Apr 2023, EGU23-10655, https://doi.org/10.5194/egusphere-egu23-10655, 2023.

EGU23-11243 | ECS | Posters on site | GM2.6

Cenozoic uplift history and topographic rejuvenation of the northern Atlas-Meseta system (Morocco) 

Romano Clementucci, Paolo Ballato, Lionel Siame, Faccenna Claudio, Racano Simone, Torreti Giacomo, Lanari Riccardo, Leanni Laetitia, and Valery Guillou

Transient topography represents an opportunity for extracting information on the combined effect of tectonics, mantle-driven processes, lithology and climate across different temporal and spatial scales. The geomorphic signature of transient conditions can be used to unravel the landscape evolution and to assess perturbations in uplift rates, especially in areas devoid of stratigraphic constraints. The Atlas-Meseta system experienced a large scale topographic rejuvenation during the Cenozoic through a combination of different processes. Despite the uplift, the Western Moroccan Meseta (WMM) represents a quiescent tectonic domain with deeply incised valleys and high-standing erosional surfaces (relict landscape). This topography is characterized by elevated non-lithological knickpoints, that delimit an uplifted relict landscape, implying a transient response to a change in uplift rates. Here, we determine denudation rates of selected watersheds and bedrock outcrops from cosmogenic nuclides and perform stream profile, regional and basin-scale geomorphic analysis. Denudation rates of the relict and the rejuvenated landscape range from 15 to 20 m/Myr and from 30 to 40 m/Myr, respectively. These results allow estimating the erodibility parameter for performing river-profile inversions and hence extracting rock uplift rates through time. Inverted rock uplift rates are 10-25 m/Myr from 45 to 22 Ma and 30-55 m/Myr from 22 to 10 Ma. Despite the different time scales, the inverted rates are consistent with 10Be averaged denudation rates (15-20 and 30-40 m/Myr) and river incision values from Pleistocene lava flows (<10 and ~50 m/Myr) for the rejuvenated and relict regions of the WMM. These results agree with geological data and indicate that the observed 400 m of surface uplift in the WMM started to develop at ~22-20 Ma. Given the wavelength of the topographic swell forming the topography of the WMM, uplift is here interpreted to reflect localized crustal thickening through magma addition or lithospheric thinning through mantle delamination. This event, however, represents only a first episode of uplift. The occurrence of ~7-Myr-old marine sediments at ~1200 m of elevation indicates that the adjacent Folded Middle Atlas experienced a more recent surface uplift at ~170 m/Myr. Considering the cumulative amount of surface uplift that varies eastward from 400 to 800 and 1200 m from the Meseta to the Tabular and the Folded Middle Atlas, as well as the spatio-temporal pattern of alkaline volcanism (middle Miocene and Pliocene to Present), we suggest that the most recent episode (second phase) of surface uplift was induced by a larger-scale process that most likely included upwelling of asthenospheric mantle and to a lesser extent crustal shortening and thickening in the Folded Middle Atlas.

How to cite: Clementucci, R., Ballato, P., Siame, L., Claudio, F., Simone, R., Giacomo, T., Riccardo, L., Laetitia, L., and Guillou, V.: Cenozoic uplift history and topographic rejuvenation of the northern Atlas-Meseta system (Morocco), EGU General Assembly 2023, Vienna, Austria, 23–28 Apr 2023, EGU23-11243, https://doi.org/10.5194/egusphere-egu23-11243, 2023.

EGU23-11600 | ECS | Orals | GM2.6

High-relief exhumation history in the Japanese Alps within the past 1 Ma inferred from trapped charge thermochronometry 

Melanie Bartz, Georgina E. King, Frédéric Herman, Leif S. Anderson, Shigeru Sueoka, Sumiko Tsukamoto, and Takahiro Tagami

The interactions between Earth surface processes, climate and tectonics determine the landscape in mountain regions. The Japanese Alps uplifted throughout the Quaternary and now reach elevations of up to 3,000 m. However, quantifying relief changes in response to tectonic activity, magmatism and Late Quaternary glaciation is challenging due to the young age of the Japanese Alps and the difficulty of measuring surface processes at the timescale of glacial-interglacial cycles. Here, we use ultra-low temperature thermochronometers based on the luminescence of feldspar minerals and the electron spin resonance (ESR) of quartz minerals, in combination with inverse modelling to derive rock cooling rates and exhumation rates histories at 104-106 years timescales. We focus on the Tateyama region in the Hida range of the Japanese Alps, which was glaciated during the late Quaternary period. In total, 19 new samples were analyzed by luminescence and ESR thermochronometry. While most luminescence signals have already reached their upper dating limit, ESR signals (Al and Ti centres) yielded ESR ages of between 0.5-0.9 Ma. In general, thermal stability is lower for the Al centre compared to that of the Ti centre, but both centres constrain similar exhumation rates. Inversions reveal rock cooling rates on the order of 30-80 °C/Ma, which can be inverted to erosion rates of <1 mm/a within the past 1 Ma. In the next step, we will relate these rates to the climate and tectonic history of the Tateyama region.

How to cite: Bartz, M., King, G. E., Herman, F., Anderson, L. S., Sueoka, S., Tsukamoto, S., and Tagami, T.: High-relief exhumation history in the Japanese Alps within the past 1 Ma inferred from trapped charge thermochronometry, EGU General Assembly 2023, Vienna, Austria, 23–28 Apr 2023, EGU23-11600, https://doi.org/10.5194/egusphere-egu23-11600, 2023.

EGU23-11839 | Posters on site | GM2.6

Will ESR thermochronometry reveal the timing of Rhône valley incision? 

Georgina King, Xiaoxia Wen, Melanie Bartz, Leif Anderson, Lily Bossin, Sumiko Tsukamoto, Yan Li, Frédéric Herman, Manabu Ogata, and Shigeru Sueoka

The impact of Quaternary climate change on landscape evolution, and more specifically the timing of incision of the overdeepened Alpine valleys, remains difficult to quantify with existing thermochronometric methods. Thermochronometers are used to determine rates of rock cooling, however most techniques are insensitive to temperature changes <60 °C that occur within the last kms of Earth’s crust. Recording cooling rates within this temperature range is essential if the impact of glacial-interglacial cycles on rock exhumation is to be resolved.

Electron spin resonance (ESR) thermochronometry applied to quartz minerals has the potential to span this thermal (and temporal) gap. We are developing this method by building upon previous studies (e.g. Scherrer, 1993) with the ultimate aim of constraining the timing of incision of the Rhône valley. Preliminary data from the Japanese Alps (King et al., 2020) indicate that ESR thermochronometry could resolve rates of <1 mm/yr over Quaternary timescales.

To determine a rock cooling history using ESR thermochronometry, signal accumulation and signal thermal loss must be robustly determined within the laboratory. We have collected a series of geological samples including rocks from boreholes that have known isothermal histories to investigate the potential of this technique. Our objective is to use the latter rocks to confirm the validity of our laboratory measurements and data-fitting/numerical models. Specifically, we have investigated known-thermal history samples from the MIZ1 borehole (Japan) and the KTB borehole (Germany) as well as samples from Sion in the Western European Alps.

Preliminary data reveal that the ESR dose response and thermal decay of different quartz samples is highly variable. Whereas the Al-centre of some samples exhibits linear dose response to laboratory irradiation up to 15 kGy, the Al-centre of other samples exhibits exponential, or double-exponential growth and saturates at doses of 3-4 kGy. The Ti-centre of most samples is well described by a single saturating exponential function, however samples from the MIZ1 borehole exhibit pronounced sub-linearity in the low-dose response region. Furthermore, whereas for some samples the Al-centre is less thermally stable than the Ti-centre, for other samples the inverse is observed. These observations suggest that a uniform measurement protocol and data-fitting approach may not be appropriate for quartz ESR data.

Inversion of two KTB samples yielded temperatures within uncertainty of borehole temperature, however results for the MIZ1 borehole are more variable and can only recover temperature at best within ~10%. Investigations into the cause of the poor results for the MIZ1 borehole are ongoing (i.e. measurement protocol, data-fitting/numerical model) and will be discussed. Preliminary data from Sion are promising and reveal consistent cooling rates.


Scherer, T., Agel, A., and Hafner S. S.: Determination of uplift rates using ESR investigations of quartz, KTB Rep. 93-2. Kontinentales Tiefbohrprogram der Bundesrepublic Deutschland Niedersächs. Landesamt Bodenforsch., Hannover, 121–124, 1993.

King, G.E., Tsukamoto, S., Herman, F., Biswas, R.H., Sueoka, S., Tagami, T. Electron spin resonance (ESR) thermochronometry of the Hida range of the Japanese Alps: validation and future potential. Geochronology 2, no. 1 (2020): 1-15.


How to cite: King, G., Wen, X., Bartz, M., Anderson, L., Bossin, L., Tsukamoto, S., Li, Y., Herman, F., Ogata, M., and Sueoka, S.: Will ESR thermochronometry reveal the timing of Rhône valley incision?, EGU General Assembly 2023, Vienna, Austria, 23–28 Apr 2023, EGU23-11839, https://doi.org/10.5194/egusphere-egu23-11839, 2023.

EGU23-17271 | ECS | Posters on site | GM2.6

Muon Paleotopometry – Measuring crustal thickness variations with muons? 

Gerald Raab, John Gosse, and Alan Hidy

Understanding topographic relief evolution and its changes over hundreds of thousands to million-year timescales remains challenging. Recent approaches usually combine numerical modelling of terrestrial cosmogenic nuclide (TCN) exposure ages on strath terraces, exhumation histories based on thermochronology, drainage basin evolution, and basin stratigraphy. However, even when combined, these methods are unable to measure the rate changes with precisions needed to differentiate climate from tectonic drivers over multiple glacial cycles and longer timescales.

Muon-paleotopometry is a new approach that may address the methodological gap in determining relief generation. Muon-paleotopometry utilizes the dependence of cosmic ray muon flux on crustal shielding depth. The spatial pattern of concentrations of multiple muon-induced TCN measured along a near-horizontal transect under valleys and peaks relates directly to the history of changes (positive or negative) in crustal thickness. It enables paleotopometry above the sample datum over an isotope-specific monitoring duration. By sampling at depths of hectametres, long-lived TCNs are not sensitive to minor short-term (<105-yr) changes owing to cut and fill terraces or transgressions for instance, but short-lived isotopes may provide constraints on this. The method uses concentration differences among samples, so is not significantly impacted by limitations in knowledge of muon flux and interactions at those depths. Early proof-of-concept investigations at Dalhousie (M. Soukup, Hon. Thesis, 2017) provided encouraging results to allow for the current large-scale relief investigation of the European Alps.

How to cite: Raab, G., Gosse, J., and Hidy, A.: Muon Paleotopometry – Measuring crustal thickness variations with muons?, EGU General Assembly 2023, Vienna, Austria, 23–28 Apr 2023, EGU23-17271, https://doi.org/10.5194/egusphere-egu23-17271, 2023.

EGU23-4478 | Posters on site | ST1.5

The deep space environment simulation vacuum chamber and large radiometry calibration facilities at Shenzhen University 

Ping Zhu, Huizeng Liu, Mi Song, Shaopeng Huang, and Qingquan Li

The space environment simulation facilities are the key to any successful space experiments and missions. To characterize and validate the optical space instrument, Shenzhen university is started to design a large vacuum chamber with various integrated standard radiation sources, covering a wavelength range from UV to near-infrared. The large radiometry calibration facilities (LRCF) will be traced to standard scale factors such as those maintained by the World Radiation Center at the Physikalisch Meteorologisches Observatorium Davos, Switzerland. In this presentation, we will introduce the LRCF and the broadband radiometer developed for the moon-based earth observation system and how to use the LRCF to characterize the radiometer.

How to cite: Zhu, P., Liu, H., Song, M., Huang, S., and Li, Q.: The deep space environment simulation vacuum chamber and large radiometry calibration facilities at Shenzhen University, EGU General Assembly 2023, Vienna, Austria, 23–28 Apr 2023, EGU23-4478, https://doi.org/10.5194/egusphere-egu23-4478, 2023.

Earth Radiation Budget (ERB) measurement is one of the main missions of Chinese second generation of polar orbiting meteorological satellites ---FengYun-3 (FY-3) series. There are two instruments, the Solar Irradiance Monitor(SIM) and the Earth Radiation Budget (ERB), on board FY-3 satellite to observe the earth incoming and reflected solar radiance and the emitted radiance.  The ERMs on FY-3/A/B/C observe the Earth atmosphere within a narrow scanning field of view (NFOV)and a wide non-scanning field of view (WFOV). For each field of view, the measurements are made from two broadband channels: a total waveband channel covering 0.2 – 50 μm and a Short Wave (SW) band covering 0.2 - 4.3 μm. Because the sudden degradation happened that the SW channel of NFOV has stopped working after 20 months for FY-3A and 8 months for FY-3B in orbit. The observation from ERM on FY-3C has been in good condition for 9 years  In this presentation the performance of ERMs calibration in orbit is evaluated with CERES from EOS/Aqua and GERB-3 from Meteosat. The ERM LW and SW unfiltered radiance produced with spectral correction based on atmospheric transfer modelling has a good consistence with the other data. The new ERM instrument(ERM-II), which has a broadband LW channel covering 5-50 μm besides the Total and SW channels with a NFOV scanning mode, will be launch in the coming 2023 and provide 8 years global ERB observation from next FY-3 morning satellite.

How to cite: Qiu, H. and Qi, J.: Earth Radiation Budget Measurements on Chinese FY-3 Series Polar Orbit Satellites, EGU General Assembly 2023, Vienna, Austria, 23–28 Apr 2023, EGU23-4590, https://doi.org/10.5194/egusphere-egu23-4590, 2023.

EGU23-4921 | ECS | Orals | ST1.5

Estimating the Anisotropic Factor of Angular Distribution Models from Radiative Fluxes 

Huizeng Liu, Ping Zhu, Shaopeng Huang, and Qingquan Li

Global climate change has aroused widespread concerns in society regarding the sustainable development of human beings. The Earth’s radiation budget (ERB) at the Top-of-Atmosphere (TOA) includes incident solar radiation, Earth-reflected shortwave radiation, and outgoing longwave radiation. The accuracy of the existing spaceborne instruments still cannot meet the measurement requirement of the Earth’s TOA shortwave and longwave radiation. In recent years, several novel observing platforms and sensors have been proposed for ERB. Hitherto, most of those concepts for ERB are still in the phase of design and development, and studies have been mainly carried out based on simulations. Simulating the sensor-measured signals of the proposed novel platforms, sensors or constellations could help to optimize the sensor parameters, determine the number of satellites in the constellation, explore their potentials in characterizing the ERB. The anisotropic factor, depicting the anisotropy of Earth’s radiation, is essential in the simulation. However, developing angular distribution models involves complex procedures of data preparation, processing, and modeling. This study, targeting at simplifying the procedure of simulating the signals of ERB sensors, proposed an approach of estimating the longwave anisotropic factors directly from the Earth’s radiative fluxes. The approach was implemented with CERES data and the neural network algorithm. Models were developed for 10 scene types based on Earth’s surface types. Results showed that the longwave anisotropic factors were accurately estimated with the correlation coefficient (r) varying between 0.85 and 0.98 and MAPE within 1.20% for the test dataset. With the estimated anisotropic factors, the sensor-measured radiances were accurately retrieved with r=1.00 and MAPE=0.53%. Therefore, the proposed approach is promising in accurate and efficient simulations of novel ERB platforms and sensors like the Moon-based Earth Radiation.

How to cite: Liu, H., Zhu, P., Huang, S., and Li, Q.: Estimating the Anisotropic Factor of Angular Distribution Models from Radiative Fluxes, EGU General Assembly 2023, Vienna, Austria, 23–28 Apr 2023, EGU23-4921, https://doi.org/10.5194/egusphere-egu23-4921, 2023.

EGU23-5900 | Posters on site | ST1.5

Solar total radiation input and terrestrial temperature in the two millennia of 600-2600 

Valentina Zharkova, Irina Vasilieva, and Elena Popova

The  long-term millennial oscillations of the baseline  solar background magnetic field (SBMF) and the ephemeris of  the Sun-Earth distances are compared with the oscillations of solar irradiance at the terrestrial biomass (Hallstatt's cycle).    

Based  the Sun-Earth distances derived from the current JPL ephemeris based on solar inertial motion and gravitational effects on the Sun by four large planets: Jupiter, Saturn, Neptune and Uranus we  demonstrate the S-E distance is reduced by 0.005 au in the millennium M1 600-1600 and 0.011 au in millennium M2 1600-2600. We show that variations of the Sun-Earth distances  are accountable for the increase of the solar irradiance by about $20-25$ $Wm^{-2}$ since 1700 that will continue to last until 2500. he decrease of the S-E distance per century in the current millennium follows the  rate of the terrestrial temperature increase reported since MM. We evaluate that this difference of the Sun-Earth distances caused by SIM  leads to the different magnitudes of solar irradiance deposited in the Northern and Southern hemispheres  in M2 with thee Northern hemisphere to obtain more radiation compared to the Southern one. These estimations show that in the next 600 years the Sun will continue moving towards the Earth  that will result in a further increase of solar irradiance and the baseline terrestrial temperature  in 2500-2600. These variations are expected to be over-imposed by a reduction of solar activity during two grand solar minima (GSMs) with a reduce terrestrial temperatures by 1C  to occur  in 2020-2053 and 2370-2415. 

How to cite: Zharkova, V., Vasilieva, I., and Popova, E.: Solar total radiation input and terrestrial temperature in the two millennia of 600-2600, EGU General Assembly 2023, Vienna, Austria, 23–28 Apr 2023, EGU23-5900, https://doi.org/10.5194/egusphere-egu23-5900, 2023.

EGU23-7190 | ECS | Orals | ST1.5

A new approach to determine the Top of Atmosphere earth Outgoing Radiation using the Geant4 toolkit 

Manal Yasmine Boudjella, Ahmed Hafid Belbachir, Samy Anis Amine Dib, and Mustapha Meftah

Monitoring accurately the amount of the incoming solar radiation reaching the ground surface and the outgoing radiation at the top of the atmosphere (TOA) is crucial for quantifying the earth's energy budget as well as for understanding and modelling the climate system and its evolution. In the present investigation, we explore the use of the Geant4 Monte Carlo toolkit and a new reference spectrum SOLAR/SOLSPEC [1] to develop a new model to estimate the spectral distribution of Top of Atmosphere Outgoing Radiation (TOR). The system is implemented in Geant4, a toolkit [2] that simulates the passage of particles through matter. SOLAR-ISS is a high resolution solar spectrum with a mean absolute uncertainty of 1.26% at 1σ. The TOR is estimated for a clear atmosphere and at different air mass (AM). For quality analysis, the performance of this model is examined and evaluated by comparing Geant4 simulation results with those of the DISORT code, where the relative mean difference is less than 7.29% overall the spectral domain from 280 to 3000 nm for a well defined case. The characteristics, such as transmittance and reflectance, etc., of the present and previous results will be analysed and compared to evaluate the performance of Geant4. We can upgrade the current tools with more powerful, efficient, and accurate prototyping. Furthermore, We will consider the design of a graphical user interface for the creation of the simulation input file, this utility will serve as a guideline that helps the user to run a simulation.

How to cite: Boudjella, M. Y., Belbachir, A. H., Dib, S. A. A., and Meftah, M.: A new approach to determine the Top of Atmosphere earth Outgoing Radiation using the Geant4 toolkit, EGU General Assembly 2023, Vienna, Austria, 23–28 Apr 2023, EGU23-7190, https://doi.org/10.5194/egusphere-egu23-7190, 2023.

EGU23-7221 | Posters on site | ST1.5

Total Solar Irradiance and Terrestrial Outgoing Longwave Radiation Measurements obtained with CLARA onboard NorSat-1 

Margit Haberreiter, Wolfgang Finsterle, Jean-Philippe Montillet, Manfred Gyo, Dany Pfiffner, Martin Mostad, Ivar Spydevold, Alex Beattie, Bo Andersen, and Werner Schmutz

The Earth Radiation Budget at the Top of the Atmosphere (ToA) governs the status of climate change on our planet. The ERB is the balance between the incoming Total Solar Irradiance (TSI) and total outgoing radiation at the ToA. If more energy is stored in the system the Earth Energy Imbalance is positive and the temperature in the system rises. The Compact Lightweight Absolute RAdiometer (CLARA) experiment onboard the Norwegian micro satellite NorSat-1 is an SI traceable radiometer with the primary science goal to measure TSI from space. Besides TSI, CLARA also measures the terrestrial Outgoing Longwave Radiation (OLR) at the ToA on the night side of Earth. We present the latest status of the data and degradation correction obtained with this SI-traceable radiometer and compare the CLARA TSI and OLR time series with other available observations and reanalysis data. The validation of these measurements is key to advance our capability to determine the Earth Energy Imbalance from space. 

How to cite: Haberreiter, M., Finsterle, W., Montillet, J.-P., Gyo, M., Pfiffner, D., Mostad, M., Spydevold, I., Beattie, A., Andersen, B., and Schmutz, W.: Total Solar Irradiance and Terrestrial Outgoing Longwave Radiation Measurements obtained with CLARA onboard NorSat-1, EGU General Assembly 2023, Vienna, Austria, 23–28 Apr 2023, EGU23-7221, https://doi.org/10.5194/egusphere-egu23-7221, 2023.

EGU23-9007 | Posters on site | ST1.5

The DARA/PROBA-3 radiometer: results from the preflight calibration campaign 

Jean-philippe Montillet, Werner Schmutz, Wolfgang Finsterle, Greg Kopp, Silvio Koller, Daniel Pfiffner, Manfred Gyo, Ricco Soder, Matthias Gander, Lloyd Beeler, Patrick Langer, Marcel Spescha, Pascal Schlatter, Jakob Föller, Margit Haberreiter, Karl Heuerman, and Andrei Zukhov

The Project for On-Board Autonomy-3 (PROBA-3) is the fourth satellite technology development and demonstration precursor mission within ESA's GSTP (General Support Technology Program) series. The primary mission objective is to demonstrate the technologies required for formation flying of multiple spacecrafts. The PROBA-3 mission concept comprises two independent minisatellites in highly-elliptical Earth orbits in precise formation flying, close to one another with the ability to accurately control the attitude and separation of the two satellites. The mission launch is scheduled for end of 2023.

PROBA-3 mission consists of a coronograph spacecraft, hosting the coronograph APIICS, and the occulter spacecraft with the Digital Absolute RAdiometer (DARA).  The radiometer to record total solar irradiance is mounted on the front satellite pointing to the Sun. DARA is  developed and manufactured in Switzerland by the PMOD/WRC. We have done two pre-flight calibration campaigns: one at the World Radiation Center in Davos, Switzerland, and one at the Total Solar Irradiance (TSI) Radiometer Facility of the Laboratory for Atmospheric and Space Physics in Boulder Colorado, USA. We report on the results of the laboratory comparisons and discuss uncertainties of several instrument parameters, which are used to transform the raw measurements, which are voltage and current, into solar irradiance values. 

How to cite: Montillet, J., Schmutz, W., Finsterle, W., Kopp, G., Koller, S., Pfiffner, D., Gyo, M., Soder, R., Gander, M., Beeler, L., Langer, P., Spescha, M., Schlatter, P., Föller, J., Haberreiter, M., Heuerman, K., and Zukhov, A.: The DARA/PROBA-3 radiometer: results from the preflight calibration campaign, EGU General Assembly 2023, Vienna, Austria, 23–28 Apr 2023, EGU23-9007, https://doi.org/10.5194/egusphere-egu23-9007, 2023.

EGU23-9484 | Posters on site | ST1.5

High-resolution solar spectrum obtained from TGO orbiting Mars reveals new solar lines in the 0.7-1.7 µm range 

Abdanour Irbah, Jean-Loup Bertaux, Franck Montmessin, Alexander Trokhimovskiy, Oleg Korablev, and Anna Fedorova

The ACS-NIR spectrometer on board the Trace Gas Orbiter (TGO) is currently used to probe the atmosphere of Mars. It is, however, capable of measuring the near-infrared solar spectrum in the 0.7-1.7 µm domain with high spectral resolution when pointed at the Sun and its line of sight is above the atmosphere of Mars i.e. with its Solar Occultation mode. Specific observations were therefore made during 10 months in order to construct the solar spectrum in this spectral domain. The observations consist in recording all the diffraction orders of ACS-NIR by continuously varying the frequency of its AOTF (Acousto-Optic Tunable Filters, a component used to separate the orders). We will first present how we have treated each order of diffraction to improve the solar spectrum on the 0.7-1.7 µm band by considering for this purpose off-center images attached to certain AOTF frequencies. This method makes it possible to avoid contamination between the successive diffraction orders but also to increase the detection of the solar lines at the ends of each order where the intensity is low due to the Blaze function. We will then show the final version of the solar spectrum that we obtain. It will be compared to the reference spectrum, which is that of Toon. We will finish by showing and discuss some results revealing new solar lines appearing in certain diffraction orders of the ACS-NIR spectrometer and which are not present in the corresponding parts of the reference solar spectrum. 

How to cite: Irbah, A., Bertaux, J.-L., Montmessin, F., Trokhimovskiy, A., Korablev, O., and Fedorova, A.: High-resolution solar spectrum obtained from TGO orbiting Mars reveals new solar lines in the 0.7-1.7 µm range, EGU General Assembly 2023, Vienna, Austria, 23–28 Apr 2023, EGU23-9484, https://doi.org/10.5194/egusphere-egu23-9484, 2023.

EGU23-10082 | Orals | ST1.5

GOES EUVS Magnesium II Index: The beginning of a new climate data record 

Martin Snow, William McClintock, Janet Machol, Frank Eparvier, and Don Woodraska

The GOES-R series spacecraft include a new operational measurement for GOES satellites, the Magnesium II (MgII) core-to-wing index.  This solar activity proxy has been measured at a daily cadence beginning in 1978.  It is widely used in solar spectral irradiance models such as the NRLSSI CDR (Coddington et al. 2016).  The C Chanel of the Extreme and Ultraviolet Spectrograph (EUVSC) on GOES 16 began making operational MgII index measurements at high cadence in early 2017.  There are currently three such instruments in orbit on GOES 16, 17, and 18 as part of the EXIS suite of solar irradiance instruments.  In the past, the MgII index was only measured a few times per day, but EXIS makes measurements at a 3-second cadence to monitor rapid changes in the Sun.

In this presentation, we will describe the available data product and how it compares with previous measurements.  On long timescales it can be used to extend the historical record, and on short timescales it reveals solar activity of interest to space weather practitioners.

How to cite: Snow, M., McClintock, W., Machol, J., Eparvier, F., and Woodraska, D.: GOES EUVS Magnesium II Index: The beginning of a new climate data record, EGU General Assembly 2023, Vienna, Austria, 23–28 Apr 2023, EGU23-10082, https://doi.org/10.5194/egusphere-egu23-10082, 2023.

EGU23-10126 | Posters on site | ST1.5

GHOTI: GOES-R High-cadence Operational Total Irradiance 

Steven Penton, Martin Snow, Stephane Beland, Woodraska Don, and Coddington Odele

The EXIS (Extreme ultraviolet and X-ray Irradiance Sensors) detectors on the GOES-R spacecraft (GOES-16, GOES-17 & GOES-18) use quad-diode Sun Positioning Sensors (SPS) to maintain precision pointing. The 4 Hz quad-diode signal is high-precision and we attempt to use this signal as a high-cadence proxy for Total Solar Irradiance (TSI) and use the MgII index + NRLSS2 models to predict high-cadence spectra. The quad-diode signal must be calibrated for spacecraft velocity (a 1AU correction), instrument temperature, and diode degradation with usage. In the 2nd year of this 3-year project, we report the progress of these calibrations and our efforts toward defining our TSI proxy and high-cadence spectral data products.

How to cite: Penton, S., Snow, M., Beland, S., Don, W., and Odele, C.: GHOTI: GOES-R High-cadence Operational Total Irradiance, EGU General Assembly 2023, Vienna, Austria, 23–28 Apr 2023, EGU23-10126, https://doi.org/10.5194/egusphere-egu23-10126, 2023.

EGU23-10290 | ECS | Posters on site | ST1.5

The TSIS-2 TIM Instrument Pre-Flight Calibration and Uncertainty 

Ed Thiemann, Karl Heuerman, Andres Villani-Davila, and Erik Richard

The total solar irradiance (TSI) is Earth’s primary source of energy, and accurate knowledge of its value and variability is crucial for understanding Earth’s climate and variability. In order to continue the existing 44 year data record of TSI measurements from space, NASA is developing the Total and Spectral Irradiance Sensors (TSIS) -2 mission. TSIS-2 consists of the Total Irradiance Monitor (TIM) and Spectral Irradiance Monitor (SIM) on a free flyer satellite, with an anticipated launch in the latter half of 2024. The TSIS-2/TIM is the latest iteration of the TIM instrument, prior versions of which flew onboard the SORCE, TCTE and TSIS-1 missions, and a direct rebuild of the TSIS-1 instrument. We present the pre-flight ground calibration of the TSIS-2/TIM instrument and its uncertainties. A key difference between the calibrations of the TSIS-1 and TSIS-2 instruments is the use of a novel low noise ambient temperature radiometer for TSIS-2 that significantly reduces the uncertainty in validating the component level calibrations through an end-to-end measurement. We compare component level (e.g. aperture area, detector reflectance, etc.) measurements and uncertainties for TSIS-2 with those from TSIS-1, and focus on areas where the uncertainty analysis differs from that applied to TIM instruments on prior missions and the implications of these differences.

How to cite: Thiemann, E., Heuerman, K., Villani-Davila, A., and Richard, E.: The TSIS-2 TIM Instrument Pre-Flight Calibration and Uncertainty, EGU General Assembly 2023, Vienna, Austria, 23–28 Apr 2023, EGU23-10290, https://doi.org/10.5194/egusphere-egu23-10290, 2023.

EGU23-10751 | Orals | ST1.5 | Highlight

On the future of Earth radiation and energy imbalance measurements 

Maria Z. Hakuba, Peter Pilewskie, and Graeme Stephens and the Libera Science Team

Libera, NASA’s first Earth Venture Continuity Mission, is in preparation to provide seamless continuity to current Earth outgoing radiance measurements conducted and processed by the Clouds and Earth’s Radiant Energy System (CERES) project. Leveraging advanced detector technologies, Libera will measure the broadband total, longwave, and shortwave radiances akin to CERES and achieve radiometric uncertainty of approximately 0.2%. Beyond the crucial radiation budget continuity goal, Libera will carry a fourth radiometer in the shortwave near-infrared to advance our understanding of shortwave energy deposition in the climate system, such as related to the characterization of processes relevant for shortwave absorption, climate feedbacks, and Earth’s albedo variability with added insight into hemispheric albedo symmetry given the hemispheric differences in ocean, continent and cloud distributions. We use global model simulations and radiative transfer calculations as proxies for Libera’s future data record to demonstrate applications of the shortwave sub-band knowledge in climate science. Although Libera’s absolute accuracy is unprecedented, it is still insufficient to adequately close Earth’s energy budget. We will therefore discuss current and future avenues to indirectly and directly measure EEI from space. The latter is potentially feasible through sensing radiation pressure-induced accelerations acting on near-spherical spacecrafts, which under optimal conditions, are directly proportional to the net radiative flux experienced at the satellite’s location. This approach has been considered in the past, and the feasibility to achieve a measurement accuracy within 0.3 Wm-2 is currently under investigation. 


How to cite: Hakuba, M. Z., Pilewskie, P., and Stephens, G. and the Libera Science Team: On the future of Earth radiation and energy imbalance measurements, EGU General Assembly 2023, Vienna, Austria, 23–28 Apr 2023, EGU23-10751, https://doi.org/10.5194/egusphere-egu23-10751, 2023.

EGU23-12178 | ECS | Orals | ST1.5

The Earth Climate Observatory (ECO) space mission concept for themonitoring of the Earth Energy Imbalance (EEI) 

Lien Smeesters, Steven Dewitte, and Thorsten Mauritsen

Monitoring the Earth Radiation Budget (ERB) and in particular the Earth
Energy Imbalance (EEI), is of paramount importance for a predictive
understanding of global climate change.   We propose the new Earth
Climate Observatory (ECO) space mission concept for the monitoring of
the EEI.

The EEI is defined as the small difference between the two nearly equal
terms of the incoming solar radiation, and the outgoing terrestrial
radiation lost to space. Making a significant measurement of the EEI
from space is very challenging, and requires a differential measurement
with one single instrument of both the incoming solar radiation and the
outgoing terrestrial radiation. The instrument that allows such a
differential measurement is an improved wide field of view electrical
substitution cavity radiometer.

The wide field of view radiometer will observe the earth from limb to
limb. A single measurement footprint is a circle with a diameter around
6300 km. For the discrimination of cloudy and clear skies, a higher
spatial resolution is needed. This will be obtained from two wide field
of view cameras, a visible wide field of view camera for the
characterisation of the spatial distribution of the reflected solar
radiation, and a thermal infrared wide field of view camera for the
characterisation of the spatial distribution of the emitted thermal
radiation.

How to cite: Smeesters, L., Dewitte, S., and Mauritsen, T.: The Earth Climate Observatory (ECO) space mission concept for themonitoring of the Earth Energy Imbalance (EEI), EGU General Assembly 2023, Vienna, Austria, 23–28 Apr 2023, EGU23-12178, https://doi.org/10.5194/egusphere-egu23-12178, 2023.

EGU23-12185 | ECS | Orals | ST1.5

INSPIRE-SAT7: Pre-Flight radiometric validation and calibration of a miniaturized Earth’s Radiative Budget satellite 

Lionel Van Laeken, David Bolsée, Nuno Pereira, Mustapha Meftah, Alain Sarkissian, Luc Damé, Christophe Dufour, and the INSPIRE-SAT team

INSPIRE-SAT 7 is a French 2-Unit CubeSat primarily designed for Earth and Sun observations.  This mission is part of the International Satellite Program in Research and Education (INSPIRE). This satellite will be deployed in Low Earth Orbit (LEO) in 2023 as the first step of the so-called ‘Terra-F’ constellation that will provide spatio-temporal resolution for Earth Energy Imbalance (EEI) measurements.

This new scientific and technological pathfinder CubeSat mission (INSPIRE-SAT 7) is equipped with various channels on all sides. Among them: the Total Solar Irradiance Sensor (TSIS) payload, the Ultra-Violet Sensor (UVS) using a new generation of solar blind detectors designed to monitor the integrated Solar Spectral Irradiance (SSI) in the Hertzberg continuum, and the Earth Radiative Sensor (ERS) payload, designed to measure some Earth’s Radiative budget (ERB) components such as the outgoing short and long wave radiation at the top-of-the atmosphere for climate change studies.

The Belgian Radiometry Characterization Laboratory (B.RCLab) of the Royal Belgian Institute for Space Aeronomy (BIRA-IASB) is the partner responsible for the pre-flight absolute calibration and radiometric characterization of INSPIRE-SAT7 TSIS and UVS payloads.

In this work we will first describe the INSPIRE-SAT7 concept, design, scientific and operational objectives. We will then present B.RCLab facilities along with its radiometric characterization benches, including the absolute calibration capabilities and its traceability. Finally, the main results of the INSPIRE-SAT7 pre-flight calibration campaign, which took place in November 2022, will be presented. These results allowed to calculate the sensors on-orbit calibration coefficients that are crucial to perform traceable absolute EEI measurements. A radiometric comprehensive uncertainty budget will be presented along the sensors’ calibration coefficients.

How to cite: Van Laeken, L., Bolsée, D., Pereira, N., Meftah, M., Sarkissian, A., Damé, L., Dufour, C., and team, T. I.-S.: INSPIRE-SAT7: Pre-Flight radiometric validation and calibration of a miniaturized Earth’s Radiative Budget satellite, EGU General Assembly 2023, Vienna, Austria, 23–28 Apr 2023, EGU23-12185, https://doi.org/10.5194/egusphere-egu23-12185, 2023.

TRUTHS (Traceable Radiometry Underpinning Terrestrial- and Helio-Studies) is an operational climate mission, aiming to enhance up to an order-of-magnitude our ability to estimate the Earth radiation budget through direct measurements of spectrally resolved solar reflected Earth radiances and Sun irradiances becoming a ‘gold standard’ reference in support of climate emergency research and operational applications. It aims to establish a “metrology laboratory in space” by creating a fiducial, SI-traceable reference data set to cross-calibrate other sensors and improve the quality of their data.

TRUTHS main objective is to establish a reference baseline measurement (benchmark) of the state of the planet, against which past and future observations can be compared, in order to:

  • allow climate model improvements and forecast testing, and
  • provide observational evidence of climate change, including mitigation strategies in the shortest time possible.

TRUTHS will primarily measure the incoming and outgoing energy from the climate system with an accuracy needed to detect climate trends in the shortest possible time.

The datasets needed to meet this objective have many additional applications, such as:

  • SI traceable measurements of the incoming and reflected solar spectrum, to address direct science questions.
  • Operational products for removing radiometric biases in other satellite instruments by cross-calibration with TRUTHS data, improving accuracy and enabling inter-operability including improvement of retrieval algorithms.
  • Transferring radiometric reference values to existing Cal/Val infrastructure, e.g. RadCalNet, Pseudo-Invariant Calibration sites, In-situ ocean colour reference observations; selected surface reflectance test-sites (fluxnet ..), both nadir and multi-angular; to the Moon.

The mission comprises an “agile” satellite capable to point and image the Earth, the Moon and the Sun in a polar orbit hosting the Hyperspectral Imaging Spectrometer (HIS) capable to provide an accurate, continuously calibrated, dataset of spectrally resolved solar and lunar irradiance and Top of Atmosphere (ToA) Earth-reflected radiance in the near-UV/Visible/NIR/SWIR (320 nm to 2400 nm) waveband with a spectral sampling between 2 and 6 nm and a spatial sampling of 50 m. The payload utilises a novel SI traceable on-board calibration system, the Cryogenic Solar Absolute Radiometer (CSAR), as part of an innovative On-Board Calibration System (OBCS), allowing the HIS observations to achieve its unprecedented in-space accuracy, targeting an expanded radiometric uncertainty tied to international SI standards of 0.3% (k=2).

TRUTHS is implemented by the European Space Agency (ESA) as a UK led Earth Watch mission in collaboration with Switzerland, Czech Republic, Greece, Romania and Spain. The mission was conceived by the UK national metrology institute, NPL, in response to challenges highlighted by the worlds space agencies, through bodies such as CEOS, in relation to interoperability and accuracy. The mission is being developed by an industrial consortium led by Airbus Defence and Space UK.

The TRUTHS mission targets a launch in 2030 with a minimal life-time of 5 years, and design goal to reach 8 years, of in-orbit operations. It will become part of a future fleet of SI-Traceable Satellites (SITSATs) currently being developed by different space agencies, including CLARREO-Pathfinder (NASA) and CSRB (CMA), and together with FORUM (ESA) and IASI-NG (EUMETSAT) will provide spectrally resolved Earth radiance information from the UV to the Far-Infrared in the coming decade.

How to cite: Fehr, T., Fox, N., Marini, A., and Remedios, J.: Traceable Radiometry Underpinning Terrestrial- and Helio- Studies (TRUTHS) – A ‘gold standard’ imaging spectrometer in space to support climate emergency reseaerch, EGU General Assembly 2023, Vienna, Austria, 23–28 Apr 2023, EGU23-12399, https://doi.org/10.5194/egusphere-egu23-12399, 2023.

EGU23-12518 | Orals | ST1.5 | Highlight

Fengyun Program and Solar Observation Activities 

Peng Zhang, Jin Qi, Xin Ye, Yu Huang, and Ping Zhu

Fengyun 3 series (FY-3) is the second generation polar orbiting meteorological satellite in China. There are 5 satellites have been launched since the first satellite FY-3A in 2008. The solar irradiance is one of important parameters to measure by FY-3 series. The instrument to measure the solar irradiance is called Solar Irradiance Monitor (SIM). The SIM was deployed on the orbit since FY-3A (morning orbit AM) in 2008 and FY-3B (afternoon orbit PM) in 2010. SIM was upgraded to SIM-II mounted on FY-3C (AM orbit) in 2013. The sensitivity, absolute accuracy and stability of the instrument has been improved with the more accurate control on the solar disk tracking system and instrument environment temperature maintaining system. The SIM-II together with the Solar Spectral Irradiation Monitor (SSIM) have been deployed on the orbit mounted on FY-3E (early-morning orbit EM) in 2021. This presentation overviews the FY program. The specification and performance of SIM, SIM-II and SSIM have been illustrated. The measured Total Solar Irradiance (TSI) product has been compared with the similar measurements on SOHO/VIRGO, SORCE, TSIS-1, etc. The future plan for the solar measurements in FY-3 series has been presented in the last part.

How to cite: Zhang, P., Qi, J., Ye, X., Huang, Y., and Zhu, P.: Fengyun Program and Solar Observation Activities, EGU General Assembly 2023, Vienna, Austria, 23–28 Apr 2023, EGU23-12518, https://doi.org/10.5194/egusphere-egu23-12518, 2023.

EGU23-13188 | Posters on site | ST1.5

The TSI and SSI measurement from Fengyun-3E Satellite 

Jin Qi, Peng Zhang, Hong Qiu, Ling Sun, Xin Ye, Wei Fang, and Yu Huang

Fengyun-3E is an early-morning orbit meteorological satellite which provided more opportunity to observe solar activities and was launched on July 5, 2021. The total solar irradiance is measured by Solar Irradiance Monitor-II (SIM-II) which has been improved on degradation monitor compared to earlier Fengyun satellite. The spectral solar irradiance is observed by the new payload Solar Spectral Irradiance Monitor (SSIM) which could provide continuous spectra from 165nm~2400nm. The SSIM instrument has three wavebands: UV band from 165 nm to 320 nm, VIS band from 285 nm to 700 nm, NIR band from 650 nm to 2400 nm, with spectral resolution as 1nm, 1nm and 8nm, respectively. In this work, we will present the design of solar observation, instruments on-orbit performance and preliminary results of FY-3E solar measurement.

How to cite: Qi, J., Zhang, P., Qiu, H., Sun, L., Ye, X., Fang, W., and Huang, Y.: The TSI and SSI measurement from Fengyun-3E Satellite, EGU General Assembly 2023, Vienna, Austria, 23–28 Apr 2023, EGU23-13188, https://doi.org/10.5194/egusphere-egu23-13188, 2023.

EGU23-15415 | ECS | Orals | ST1.5

Validation of DSCOVR-based albedo estimate using a weather model 

Maksym Vasiuta, Lauri Tuppi, Antti Penttilä, Karri Muinonen, and Heikki Järvinen

The Deep Space Climate Observatory (DSCOVR) is located near the Lagrangian L1 point of the Earth. Their EPIC images indicate exceptionally large values of the Earth's planetary albedo in December 2020, having daily average surged above 0.320 for consecutive three weeks. Independent evaluation of the Earth’s albedo using a numerical weather prediction model (OpenIFS of ECMWF) suggests that this is an over-estimate. Given the difference between satellite-based and model-based albedo estimates, the reconstructed from images top-of-atmosphere short-wave radiosity is over-estimated. We suggest the discrepancy is explained by a weakness of short-wave angular distribution models (ADMs) based on Clouds and the Earth's Radiant Energy System’s The Tropical Rainfall Measuring Mission (CERES/TRMM) in full back-scattering geometry. This conclusion is supported by disk-integrated short-wave anisotropy factors in December 2020, estimated using CERES ADMs, being lower than measured by NIST Advanced Radiometer (NISTAR).

How to cite: Vasiuta, M., Tuppi, L., Penttilä, A., Muinonen, K., and Järvinen, H.: Validation of DSCOVR-based albedo estimate using a weather model, EGU General Assembly 2023, Vienna, Austria, 23–28 Apr 2023, EGU23-15415, https://doi.org/10.5194/egusphere-egu23-15415, 2023.

EGU23-15701 | ECS | Posters on site | ST1.5

Solar irradiance estimation for planetary studies 

Isabela de Oliveira, Krishnamurthy Sowmya, Nina-Elizabeth Nèmec, and Laurent Gizon

Solar irradiance is the main source of energy input to the planets of the Solar System. The solar rotation and the evolution of active regions on the surface of the Sun are two of the sources of solar irradiance variability. Nèmec et al. (2020) showed that the variability of solar irradiance is dominated by one of these two sources depending on the timescale of interest. The solar rotation dominates the variability for periods between 4-5 days and the synodic solar rotation period (27.3 days), while the evolution of active regions dominate for the remaining timescales.

Usually, the irradiance measurements at Earth are extrapolated to estimate the irradiance at other planets and study the effect of solar irradiance on other planets' atmospheres (Thiemann et al., 2017). In this "lighthouse model", the irradiance source regions on the surface of the Sun are assumed to simply rotate with a Carrington sidereal period of 25.38 days. This means that the solar rotation is the only cause of variability of the irradiance in this model, and the evolution of active regions is neglected.

In this work, we develop a model to calculate the irradiance at other planets by accounting for the evolution of magnetic features. Our method follows the Spectral And Total Irradiance REconstruction (SATIRE; Fligge et al. 2000; Krivova et al. 2003) approach and works by Nèmec et al. (2020) and Sowmya et al. (2021). First, the Surface Flux Transport Model (SFTM; Cameron et al. 2010) is used to obtain the time-dependent surface distribution of magnetic features (faculae and spots). Then, the solar irradiance is calculated as the sum of the contributions from the quiet Sun (i.e., regions with no magnetic activity), faculae, and spots. 

Our method allows calculating the solar irradiance directly at a given position within the ecliptic, regardless of the position of the Earth. We compare our irradiance calculations with those of the extrapolation method. We find that taking the evolution of active regions into account improves the estimation of solar irradiance significantly, especially when it comes to wavelengths in the visible and infrared ranges. Therefore, we suggest that our method provides more accurate estimates of solar irradiance to be used as input in studies of planetary atmospheres.

We would like to note that our method of irradiance calculation is currently only statistical. We use the SFTM as we do not have information of the areas of the far-side of the Sun, which are needed in order to get the correct rotational variability. To determine real daily values of irradiance, we need to combine our calculations with methods of helioseismology, which is still a work in progress.

How to cite: de Oliveira, I., Sowmya, K., Nèmec, N.-E., and Gizon, L.: Solar irradiance estimation for planetary studies, EGU General Assembly 2023, Vienna, Austria, 23–28 Apr 2023, EGU23-15701, https://doi.org/10.5194/egusphere-egu23-15701, 2023.

EGU23-16293 | Orals | ST1.5

Reconstructing solar irradiance over the period 1996-2022 

Ilaria Ermolli and Theodosios Chatzistergos

Knowledge of solar irradiance variability is critical to Earth's climate models and understanding the solar influence on Earth's climate. Direct measurements of the Total Solar Irradiance (TSI) have only been available since 1978 from instruments onboard multiple missions. Different calibrations of the individual instruments make estimates of the possible long-term trend in the TSI still uncertain. Knowledge of the Solar Spectral Irradiance (SSI) is even more undetermined. Here we use the carefully reduced observations from the Rome Precision Solar Photometric Telescope (Rome/PSPT) and semi-empirical irradiance models to reconstruct solar irradiance variations over the period 1996-2022. Results are discussed with respect to direct measurements and existing composite reconstructions.

How to cite: Ermolli, I. and Chatzistergos, T.: Reconstructing solar irradiance over the period 1996-2022, EGU General Assembly 2023, Vienna, Austria, 23–28 Apr 2023, EGU23-16293, https://doi.org/10.5194/egusphere-egu23-16293, 2023.

EGU23-16858 | Posters on site | ST1.5

Exploring New Instrument deGradation Models and Algorithms (ENIGMA) 

Stéphane Béland and Steven Penton

The Solar Radiation and Climate Experiment measured Total Solar Irradiance (TSI) 
and Solar Spectral Irradiance (SSI) from 2003 to 2020. The Solar Irradiance Monitor (SIM) 
instrument measured SSI from 200nm to 2400 nm on a daily basis. The current SORCE-SIM
instrument degradation correction uses a measurement equation derived from
accessible telemetry, the known instrument refraction geometry, inter-detector comparisons,
and inter-spectrometer comparisons. While the current degradation model captures much of the
long-term trending, some of the parameters were adjusted without well-defined physical
interpretations.

The degradation model used for SORCE-SIM is not unique. We're reporting on work to Explore New
Instrument degradation Models and Algorithms (ENIGMA) to address issues with the current
model and with the derived corrected irradiances. The development of enhanced SORCE-SIM
measurement equations permits the evaluation, and potential inclusion, of degradation
mechanisms not captured in the present model.

We present an initial updated degradation model which improves our ability to construct a 
composite irradiance time series in combination with TSIS-SIM, whose measurements overlap 
with SORCE for 2 years and has well-defined uncertainties. Combining the two datasets, allowed
the construction of a consistent composite irradiance time series from 2003-2023. 

How to cite: Béland, S. and Penton, S.: Exploring New Instrument deGradation Models and Algorithms (ENIGMA), EGU General Assembly 2023, Vienna, Austria, 23–28 Apr 2023, EGU23-16858, https://doi.org/10.5194/egusphere-egu23-16858, 2023.

EGU23-17162 | Posters on site | ST1.5

The first light from the joint total solar irradiance measurement experiment onboard the FY3-E meteorological satellite 

Xin Ye, Ping Zhu, Jean-Philippe Montillet, Xiuqing Hu, Jinhua Wang, Dongjun Yang, Jin Qi, Wolfgang Finsterle, Peng Zhang, Wei Fang, Silvio Koller, Daniel Pfiffner, Baoqi Song, Zhitao Luo, Kai Wang, Margit Haberreiter, Duo Wu, and Werner Schmutz

The Fengyun 3E (FY3E) spacecraft was launched on the 4th of July 2021 at 23h 28min UTC according to CASC (China Aerospace Science and Technology Corp.) on a Long March 4C vehicle from JSLC (Jiuquan Space Launch Center) in China. The orbit is a sun-synchronous near-circular with an altitude of 800 km, and an inclination of 98.7 degrees. The nominal lifetime of the satellite is eight years. The JTSIM experiments belong to the solar activities monitoring package. The solar radiation is absorbed by the black-coated cavity and the induced different heat-flux between the primary and reference cavity is measured, and the electrically calibrated differential heat-flux is used to compute the solar irradiance. SIAR has three identical channels A, B, and C, and each channel has a different solar exposure time to study the instrument’s nonlinear drift due to degradation. DARA also has three cavity radiometers and electrical substitution radiometers (Channel A, Channel B, and Channel C). The difference is that they are aligned in a triangle. Compared to VIRGO/PMO6, DARA inverts the aperture geometry to eliminate stray light. DARA and SIAR absolute radiometers are not operating at the same time due to the different designs and measurement sequences. On August 18, 2021, both instruments successfully passed the first commission phase, and they started to observe the total solar irradiance since then.

How to cite: Ye, X., Zhu, P., Montillet, J.-P., Hu, X., Wang, J., Yang, D., Qi, J., Finsterle, W., Zhang, P., Fang, W., Koller, S., Pfiffner, D., Song, B., Luo, Z., Wang, K., Haberreiter, M., Wu, D., and Schmutz, W.: The first light from the joint total solar irradiance measurement experiment onboard the FY3-E meteorological satellite, EGU General Assembly 2023, Vienna, Austria, 23–28 Apr 2023, EGU23-17162, https://doi.org/10.5194/egusphere-egu23-17162, 2023.

EGU23-920 | Posters on site | NP1.1 | Highlight

An alternative approach to the ocean eddy parameterization roblem 

Igor Shevchenko

It is typical for low-resolution ocean simulations to miss not only small- but also large-scale patterns of the flow dynamics compared with their high-resolution analogues. It is usually attributed to the inability of coarse-grid models to properly reproduce the effects of the unresolved small-scale dynamics on the resolved large scales. In part, the reason for that is that coarse-grid models fail to at least keep the coarse-grid solution within the region of phase space occupied by the reference solution  (the high-resolution solution projected onto the coarse grid). 

In this presentation we discuss two methods to solve this problem: (1) computation of the image point in the phase space restricted to the region of the reference flow dynamics, and (2) reconstruction of a dynamical system from the available reference solution data. The proposed methods show encouraging results for both low- and high-dimensional phase spaces.

One of the important and general conclusions that can be drawn from our results is that not only mesoscale eddy parameterisation is possible in principle but also it can be highly accurate (up to reproducing individual vortices). This conclusion provides great optimism for the ongoing parameterisation studies.

How to cite: Shevchenko, I.: An alternative approach to the ocean eddy parameterization roblem, EGU General Assembly 2023, Vienna, Austria, 23–28 Apr 2023, EGU23-920, https://doi.org/10.5194/egusphere-egu23-920, 2023.

EGU23-1680 | ECS | Posters on site | NP1.1 | Highlight

From Sea Level Rise to COVID-19: Extending a Bayesian Hierarchical Model to unfamiliar problems with the 4D-Modeller framework 

John M. Aiken, Xueqing Yin, Samantha Royston, Yann Ziegler, and Jonathan L. Bamber

The recently completed European Research Council project “Global Mass” (www.globalmass.eu) aimed to reconcile the global sea-level budget as measured through a variety of satellite and in-situ data sources using a space-time Bayesian Hierarchical Model (BHM). The BHM uses Gaussian latent processes to estimate the contribution and uncertainty of different physical processes such as land hydrology, ocean thermal expansion, and glacier melt, to ongoing sea-level rise. Each process has a unique spatial and temporal length scale, which can be provided as a prior or inferred from the observations within the model. The BHM can separate the physical process sources represented in the data, model the stationarity of these processes, and estimate their uncertainty globally. A particular strength of the BHM is its ability to estimate and separate the different processes, from data with disparate spatial and temporal sampling and for observations that are influenced by multiple processes. This is often termed the source separation problem and we utilize novel statistical methods to solve for this and for dimensional reduction to allow the problem to be computationally tractable. We use the Integrated Nested Laplace Approximation (INLA) framework to approximate the observation layer and for the inference itself due to its accuracy and computational speed. The BHM has the potential to address a wider class of spatio-temporal inference problems and here we introduce the model structure (named 4D-modeller) and apply it to new classes of problem to extend its versatility. We apply it to COVID-19 transmittability in England and hydrology uncertainties related to hydropower reservoirs in Norway: problems that span social and physical sciences.  

How to cite: Aiken, J. M., Yin, X., Royston, S., Ziegler, Y., and Bamber, J. L.: From Sea Level Rise to COVID-19: Extending a Bayesian Hierarchical Model to unfamiliar problems with the 4D-Modeller framework, EGU General Assembly 2023, Vienna, Austria, 23–28 Apr 2023, EGU23-1680, https://doi.org/10.5194/egusphere-egu23-1680, 2023.

EGU23-3217 | Orals | NP1.1 | Highlight

The velocity of climate change revisited: Smooth velocity field and ecological relevance 

Jérôme Kasparian, Iaroslav Gaponenko, Laure Moinat, Guillaume Rohat, Stéphane Goyette, and Patrycja Paruch

Describing climate change in terms of spatial velocity is essential to assess the ability for ecosystems or individual species to migrate at a sufficient pace to keep environmental conditions allowing their survival. While climate models provide a temporal evolution of a number of  variables at each point of their computational grid, Loarie et al. introduced a velocity of climate change, defined as the ratio of the temporal derivative to the spatial gradient of temperature, or any other variable such as precipitations [1]. This amounts to assume that isotherms shift along the temperature gradient. Although intuitive, this idea is mathematically correct only for straight isotherms parallel to each other [2]. Whenever this condition is not met, e.g., due to complex topography or coastlines, the gradient-based velocity field will display artefacts in the form of local convergence or divergence that are likely to bias the analysis.

We show that these artefacts can be fixed by defining a much more regular velocity field. This alternative approach to the velocity of climate change determines the direction of the velocity vector by minimising the local vorticity rather than by the gradient. From a fundamental point of view, the resulting smoother velocity field allow an analysis at finer temporal and spatial scales. It also allows to define the climate trajectory of a given origin point. Our approach also provides tools to estimate the stability of climate trajectories depending on the behaviour of their "return" trajectory obtained by reversing time [3].  

From an ecological point of view, we discuss preliminary results on the relevance of each definition of the velocity of climate change, based on comparisons of the obtained climate trajectories with ecological trajectories from observational data relative to species distribution areas.

References

1. S. R. Loarie et al., Nature 462, 1052 (2009)

2. J. Rey, G. Rohat, M. Perroud, S. Goyette, J. Kasparian, Env. Res. Lett. 15, 034027 (2020)

3. I. Gaponenko, G. Rohat, S. Goyette, P. Paruch, J. Kasparian, Sci. Rep., 12, 2997, (2022)

How to cite: Kasparian, J., Gaponenko, I., Moinat, L., Rohat, G., Goyette, S., and Paruch, P.: The velocity of climate change revisited: Smooth velocity field and ecological relevance, EGU General Assembly 2023, Vienna, Austria, 23–28 Apr 2023, EGU23-3217, https://doi.org/10.5194/egusphere-egu23-3217, 2023.

EGU23-3509 | ECS | Orals | NP1.1

Cascading Transitions in the Weak and Strong Coupling Limit 

Sacha Sinet, Christian Kuehn, Robbin Bastiaansen, Anna S. von der Heydt, and Henk A. Dijkstra

Many components of the Earth system are thought to be prone to dangerous transitions, presenting a big challenge for human societies. Known as tipping elements, those form an intricate network of interacting subsystems, creating the possibility of cascading critical transitions. The presence of those interacting tipping events makes it hard to predict the outcome of climate change. In this research, we investigate those phenomena above the usual approach of linearly interacting bistable components.

We propose to study generic nonlinear systems under generic nonlinear interaction. As a first step, we focus on unilaterally coupled components, where a leading and a following subsystem are naturally identified. Using singular perturbation methods, we show how the stability landscape can be approached semi-analytically when considering the weak and strong coupling limit. With only limited knowledge about the system's structure, this method applies to a wide class of interacting systems and allows for approaching steady states with a controlled error. This provides information on important structural features of the bifurcation diagram such as the presence of steady branches, their stability, and bifurcations. Finally, we illustrate our results using climate relevant conceptual models.

How to cite: Sinet, S., Kuehn, C., Bastiaansen, R., von der Heydt, A. S., and Dijkstra, H. A.: Cascading Transitions in the Weak and Strong Coupling Limit, EGU General Assembly 2023, Vienna, Austria, 23–28 Apr 2023, EGU23-3509, https://doi.org/10.5194/egusphere-egu23-3509, 2023.

Large and/or long-lived convective clusters are associated with extreme weather, drive the global circulation by forcing atmospheric waves, and affect the energy budget of the atmosphere by modulating outgoing longwave radiation in their vicinity. The majority of tropical clusters follow scale-free occurrence frequency distributions for cluster sizes and the rainfall integrated over a cluster (intensity). The relationships between intensity and area, and circumference and area also follow scaling laws. The exponents of all of these four scaling laws follow when we assume that precipitation clusters inherit their properties from the geometry of the integrated column water vapor field. Specifically, the column water vapor field would have to be a self-affine surface with a roughness exponent H=0.4. Coincidentally, H=0.4 is the prediction of the Kardar-Parisi-Zhang universality class in two dimensions.

I analyze the statistics of precipitation clusters and the column water vapor field in observations (using data from CMORPH and ERA5) and thirteen one-year global simulations performed with the ICON model at a horizontal resolution of 10 km. The simulations differ for example in their forcing (RCE or realistic forcing), in their rotation (no rotation, real rotation, constant Coriolis parameter), in their sea surface temperatures (SSTs; realistic and with land, zonal mean with land, constant without land, latitudinal gradient without land) etc. They are designed to test how robust the scaling laws of precipitation and column water vapor are.

What changes drastically between the simulations is the probability density distribution of points in the phase space of column water vapor and tropospheric bulk temperature. This distribution occupies a very narrow space in the RCE simulations, but a very wide space in the realistic simulation with land. The critical column water vapor, where precipitation starts to occur, is approximately a linear function of temperature. It turns out that the column water vapor axes and the temperatures axes can be rescaled so that the onset curves of all simulations collapse onto one line (approximately). The results show that there is a good match with the observed scaling in most simulations, with the control simulation (realistic SSTs and land) showing the closest match. I speculate what the results may imply for interpreting observed scalings based on the Kardar-Parisi-Zhang equation.

How to cite: Stephan, C.: Testing the robustness of precipitation cluster scalings with an ensemble of aquaplanet simulations, EGU General Assembly 2023, Vienna, Austria, 23–28 Apr 2023, EGU23-3901, https://doi.org/10.5194/egusphere-egu23-3901, 2023.

The climate system can be regarded as a non-equilibrium dynamical system that relaxes toward a steady state under the continuous input of solar radiation and dissipative mechanisms over a multitude of temporal and spatial scales. The steady state is not necessarily unique. A useful tool to describe the possible steady states of the climate system is the bifurcation diagram, where the long-term behaviour of a state variable (like surface air temperature) is plotted as a function of force intensity. This diagram reveals the regions of multi-stability, the position of B-tipping (bifurcation points at critical forcing values giving rise to an abrupt and irreversible climate change), the range of stability of each attractor and the intensity of climate variability needed to induce transitions between states (N-tipping).

The construction of the bifurcation diagram requires to run long simulations from a huge ensemble of initial conditions until convergence to a steady state is attained (standard method). This procedure has prohibitive computational costs in general circulation models of the climate that include deep ocean dynamics relaxing on timescales of the order of thousand years, or other feedback mechanisms with even longer time scales, like continental ice or carbon cycle.

Using a coupled setup of the MIT general circulation model, we propose two techniques that require lower computational costs and show complementary advantages. We test them in a numerical setup that includes deep ocean dynamics and we compare the resulting bifurcation diagram with the one obtained with the standard method. The first technique is based on the introduction of random fluctuations in the forcing and allows one to explore a large part of the phase space. The second, based on the estimate of internal variability and relaxation time, is more precise in finding B-tipping.

How to cite: Brunetti, M. and Ragon, C.: Steady states in complex climate models and different methods for the construction of the bifurcation diagram, EGU General Assembly 2023, Vienna, Austria, 23–28 Apr 2023, EGU23-6502, https://doi.org/10.5194/egusphere-egu23-6502, 2023.

Ocean models relying on geopotential (Z) vertical coordinates suffer from spurious diapycnal mixing created by advection due to the misalignment of isopycnal and grid-layer surfaces. Given the delicateness of diapycnal mixing in ocean models, several studies have been performed to determine its impact, mainly by means of global analyses. Here we present a local analysis of spurious diapycnal mixing based on tracer variance decay. We apply the discrete variance decay (DVD) method proposed by Klingbeil et al. (2014) to diagnose numerical mixing created by several third-order advection schemes used in FESOM (Finite volumE Sea ice Ocean Model). The analysis is applied for an idealized channel flow test setup with Z* vertical coordinates and a linear equation of state. This ensures numerical DVD to be entirely diapycnal enabling identification of its spatial distribution. Further modification of the DVD method is proposed which allows for splitting of total diapycnal mixing into individual contributions from advection and diffusion. The new modifications are then used to compare spurious diapycnal mixing due to advection and explicit horizontal diffusion with parameterized physical diapycnal mixing due to vertical diffusion.

How to cite: Banerjee, T., Danilov, S., and Klingbeil, K.: Diagnosing spurious diapycnal mixing and its spatial distribution due to advection in Z-coordinate ocean models using discrete variance decay, EGU General Assembly 2023, Vienna, Austria, 23–28 Apr 2023, EGU23-6887, https://doi.org/10.5194/egusphere-egu23-6887, 2023.

EGU23-7813 | ECS | Orals | NP1.1

Drivers and predictability of extreme summer Arctic sea ice reduction with rare event simulation methods 

Jerome Sauer, Francesco Ragone, François Massonnet, Jonathan Demaeyer, and Giuseppe Zappa

Various studies have identified possible drivers of extreme Arctic sea ice reduction, as observed in the summers of 2007 and 2012, including preconditioning, the oceanic heat transport and the synoptic-scale to large-scale atmospheric circulation. However, a quantitative statistical assessment of these drivers and a better understanding of the seasonal predictability of these events are hindered by the poor statistics of extremes in observations and in numerical simulations with computationally expensive climate models. Recent studies have addressed the problem of sampling extreme events in climate models by using rare event algorithms, computational techniques developed in statistical physics to increase the sampling efficiency of rare events in numerical models. In this work, we study the statistics of summer seasons with extremely low pan-Arctic sea ice area under pre-industrial greenhouse gas conditions, applying a rare event algorithm to the intermediate complexity coupled climate model PlaSim. Using the rare event algorithm, we oversample dynamical trajectories leading to events with extremely low summer and September mean pan-Arctic sea ice area. Compared to standard simulations of the same computational cost, we increase the sample size of the extremes by several orders of magnitude, which allows to perform statistically robust composite analyses of dynamical quantities conditional on these events. In addition, we have access to ultra-rare events with return times of up to 105 years. We exploit the improved statistics of summers with extremely low pan-Arctic sea ice area to study precursors of these events, including a surface energy budget analysis to disentangle the oceanic and atmospheric forcing on the sea ice. Particularly, we investigate the linkage between the extremes in summer Arctic sea ice area and the preceding states of the Arctic Oscillation and of the Arctic Dipole Anomaly pattern, as well as between the extremes and the preconditioning in the sea ice-ocean system during the onset of the melt season.

How to cite: Sauer, J., Ragone, F., Massonnet, F., Demaeyer, J., and Zappa, G.: Drivers and predictability of extreme summer Arctic sea ice reduction with rare event simulation methods, EGU General Assembly 2023, Vienna, Austria, 23–28 Apr 2023, EGU23-7813, https://doi.org/10.5194/egusphere-egu23-7813, 2023.

EGU23-8133 | ECS | Orals | NP1.1

On flow decomposition in realistic ocean models 

Silvano Rosenau, Manita Chouksey, and Carsten Eden

Oceanic flow comprises of a fast and a slow evolving component. Decomposing the flow field into these components is necessary to understand processes like mesoscale eddy dissipation and spontaneous wave emission. These processes are potentially important wave sources and lead to an energy transfer between the slow and the fast component. The first order approach is to decompose in geostrophic and non-geostrophic components. Since a part of the non-geostrophic component evolves slowly due to nonlinear interactions between both component, this approach is not precise enough to quantify energy transfers. To obtain higher accuracy in decomposing the flow field, more precise methods are required, such as optimal balance or nonlinear normal mode decomposition. However, their application is limited to idealized model settings that neither include topography nor a varying Coriolis parameter. Here, we modified the optimal balance method with a time averaging procedure, such that it is applicable in more realistic ocean models. We compared the new modified method with existing methods in a shallow water model and in a non-hydrostatic model. For longer time averaging periods, the modified optimal balance method converges against the original method.

How to cite: Rosenau, S., Chouksey, M., and Eden, C.: On flow decomposition in realistic ocean models, EGU General Assembly 2023, Vienna, Austria, 23–28 Apr 2023, EGU23-8133, https://doi.org/10.5194/egusphere-egu23-8133, 2023.

EGU23-8616 | ECS | Orals | NP1.1

A new calibration method for the stochastic rotating shallow water model 

Oana Lang, Dan Crisan, and Alexander Lobbe

In recent years, the applications of stochastic partial differential equations to geophysical fluid dynamics has increased massively, as there are several complex dynamic models which can be represented using systems of SPDEs. An important problem to be adressed in this context is the correct noise calibration such that the resulting stochastic model efficiently incorporates the a priori unrepresented sub-scale geophysical processes. In this talk I will present a new method of stochastic calibration which can be applied to a class of stochastic fluid dynamics models. I will focus on an application specifically tailored for the stochastic rotating shallow water model. 

How to cite: Lang, O., Crisan, D., and Lobbe, A.: A new calibration method for the stochastic rotating shallow water model, EGU General Assembly 2023, Vienna, Austria, 23–28 Apr 2023, EGU23-8616, https://doi.org/10.5194/egusphere-egu23-8616, 2023.

EGU23-9433 | Orals | NP1.1

Progess in non-Markovian (and Fractional) StochasticClimate Modelling: A GLE-based perspective 

Nicholas Wynn Watkins, Raphael Calel, Sandra Chapman, Aleksei Chechkin, Ian Ford, Rainer Klages, and David Stainforth

The mathematical stochastic energy balance models (SEBMs) pioneered by Hasselmann and Mitchell  have long been known to climate scientists to be important aids to gaining both qualitative insight and quantitative information about global mean temperatures. SEBMs are now much more widely visible, after the award of the 2021 Physics Nobel Prize to Hasselmann,  Manabe and Parisi. The earliest univariate SEBMs were, however, built around the simplest linear and Markovian stochastic process, enabling Hasselmann and his successors to exploit their equivalence to the Langevin equation of 1908. Multivariate SEBMs have now been extensively studied  but this presentation focuses on the continuing value of univariate SEBMs, especially when coupled to economic models, or when used to study longer-ranged memory than the exponential type seen in Hasselmann's Markovian case.

I will highlight how we and others are now going beyond the first SEBMs to incorporate more general temporal dependence, motivated by increasing evidence of non-Markovian, and in particular long-ranged, memory in the climate system. This effort has brought new and interesting challenges, both in mathematical methods and physical interpretation. I will highlight our recent paper [Calel et al, Nature Communications, 2021] on using a Markovian Hasselmann-type EBM to study the economic impacts of climate change and variability and our other ongoing work on generalisations (in particular fractional ones) of Hasselmann SEBMs.

This presentation updates our preprints [Watkins et al, arXiv; Watkins et al, in preparation for submission to Chaos] to show how the overdamped generalised Langevin equation can be mapped onto an SEBM that generalises Lovejoy et al's FEBE and I will give a progress report on this work. I will also briefly discuss  the relation of such non-Markovian SEBMs to fluctuation-dissipation relations.

How to cite: Watkins, N. W., Calel, R., Chapman, S., Chechkin, A., Ford, I., Klages, R., and Stainforth, D.: Progess in non-Markovian (and Fractional) StochasticClimate Modelling: A GLE-based perspective, EGU General Assembly 2023, Vienna, Austria, 23–28 Apr 2023, EGU23-9433, https://doi.org/10.5194/egusphere-egu23-9433, 2023.

EGU23-9628 | ECS | Orals | NP1.1 | Highlight

A Resource Dependent Competition Model 

Robert Garvey and Andrew Fowler

There have been five major mass extinction events and a number of smaller extinction events throughout geological time. Each of these events characterises a widespread decrease in species diversity. The largest of these was the End-Permian extinction which saw about 90% of species go extinct. Extinction may be caused by a variety of factors such as asteroid impacts, CO2 driven ocean acidification, large igneous provinces, global warming/cooling, and oceanic anoxic events. All of these factors cause stress on the environment.

The ability of a species to avoid extinction is dependent on its environmental tolerances, i.e., the ability of a species to tolerate, or survive, changes in environmental conditions.

In population biology one way in which species may become extinct is through competition. The classical theory of competitive exclusion does not consider the type of interaction between species. We create a new mathematical model of competition between species in which the maximum population of a species is dependent on the availability of resources (or food supply) and competition is in the form of competition for these resources. We find this model always leads to stable coexistence. Another way in which populations can go extinct is through extreme oscillations in predator-prey systems; we explain how this can occur and illustrate this with a specific realistic predator-prey model that we then couple to our competition model.

How to cite: Garvey, R. and Fowler, A.: A Resource Dependent Competition Model, EGU General Assembly 2023, Vienna, Austria, 23–28 Apr 2023, EGU23-9628, https://doi.org/10.5194/egusphere-egu23-9628, 2023.

EGU23-9798 | Orals | NP1.1

Linear response for stochastic models of geophysical fluid dynamics with medium complexity 

Jochen Broecker, Giulia Carigi, and Tobias Kuna

An important question of climate science is the effect of a changing climate on the long term statistical properties of the atmosphere and ocean dynamics. Mathematically speaking, the question is whether and how statistical quantities of the dynamics (e.g. correlations, averages, variabilities etc) react to changes in the external forcing of the system.

A (stochastic or deterministic) dynamical system is said to exhibit linear response if the statistical quantities describing the long term behaviour of the system depend differentiably on the relevant parameter (i.e. the forcing), and therefore a small change in the forcing will result in a small and proportional change of the statistical quantity. A methodology to establish response theory for a class of nonlinear stochastic partial differential equations has recently been provided in [1]. This contribution will discuss the ``ingredients'' necessary for this methodology on an intuitive level. In particular, the required mathematical properties of the system are related to their physical counterparts. The results are applied to stochastic single-layer and two-layer quasi-geostrophic models which are popular in the geosciences to study atmosphere and ocean dynamics.

[1] G. Carigi, T. Kuna and J. Bröcker, Linear and fractional response for nonlinear dissipative SPDEs, arXiv, doi = 10.48550/ARXIV.2210.12129, 2022.

How to cite: Broecker, J., Carigi, G., and Kuna, T.: Linear response for stochastic models of geophysical fluid dynamics with medium complexity, EGU General Assembly 2023, Vienna, Austria, 23–28 Apr 2023, EGU23-9798, https://doi.org/10.5194/egusphere-egu23-9798, 2023.

EGU23-9799 | Orals | NP1.1 | Highlight

Sample Path Large Deviations for Climate, Ocean, and Atmosphere 

Tobias Grafke

Rare and extreme events are notoriously hard to handle in any complex stochastic system: They are simultaneously too rare to be reliably observable in numerics or experiment, but at the same time too important to be ignored if they have a large impact. This is a particular complication in climate science, atmosphere and ocean dynamics that deals with a large number of strongly coupled degrees of freedom. Often these rare events come in the form of a stochastically induced transition between different viable macrostates. Examples include atmospheric jets, oceanic currents, etc, that correspond to large coherent structures which are long live-lived, but might ultimately disappear. In this talk, I discuss rare events algorithms based on instanton calculus and large deviation theory that are capable of computing probabilities of such transitions happening, as well as their most likely pathway of occurrence.

How to cite: Grafke, T.: Sample Path Large Deviations for Climate, Ocean, and Atmosphere, EGU General Assembly 2023, Vienna, Austria, 23–28 Apr 2023, EGU23-9799, https://doi.org/10.5194/egusphere-egu23-9799, 2023.

EGU23-9865 | ECS | Posters on site | NP1.1

Seasonal evolution of the Arctic sea ice thickness distribution 

Srikanth Toppaladoddi, Woosok Moon, and John Wettlaufer

The Thorndike et al., (J. Geophys. Res. 80, 4501, 1975) theory of the ice thickness distribution, g(h), treats the dynamic and thermodynamic aggregate properties of the ice pack in a novel and physically self-consistent manner. Therefore, it has provided the conceptual basis of the treatment of sea-ice thickness categories in climate models. The approach, however, is not mathematically closed due to the treatment of mechanical deformation using the redistribution function ψ, the authors noting "The present theory suffers from a burdensome and arbitrary redistribution function ψ.''  Toppaladoddi and Wettlaufer (Phys. Rev. Lett. 115, 148501, 2015) showed how ψ can be written in terms of g(h), thereby solving the mathematical closure problem and writing the theory in terms of a Fokker-Planck equation, which they solved analytically to quantitatively reproduce the observed winter g(h). Here, we extend this approach to include open water by formulating a new boundary condition for their Fokker-Planck equation, which is then coupled to the observationally consistent sea-ice growth model of Semtner (J. Phys. Oceanogr. 6(3), 379, 1976) to study the seasonal evolution of g(h). We find that as the ice thins, g(h) transitions from a single- to a double-peaked distribution, which is in agreement with observations. To understand the cause of this transition, we construct a simpler description of the system using the equivalent Langevin equation formulation and solve the resulting stochastic ordinary differential equation numerically. Finally, we solve the Fokker-Planck equation for g(h) under different climatological conditions to study the evolution of the open-water fraction.

How to cite: Toppaladoddi, S., Moon, W., and Wettlaufer, J.: Seasonal evolution of the Arctic sea ice thickness distribution, EGU General Assembly 2023, Vienna, Austria, 23–28 Apr 2023, EGU23-9865, https://doi.org/10.5194/egusphere-egu23-9865, 2023.

Stirring and mixing plays a central role in the oceans and atmosphere, where the large-scale circulation is characterized by strong anisotropy. When the tracer evolution has no effect on the inertia of the velocity field, i.e., the tracer is passive, the governing evolution equation for the tracer is linear no matter how complicated the advecting velocity field is. Exploiting the linearity of the problem, we present a general approach for computing analytical solutions to the governing tracer equation for prescribed, time-evolving velocity fields. We apply it to analyze the evolution of a passive tracer in the case the advecting velocity field is a form of renewing flow, a prototype of chaotic advection, with stronger transport along a preferred axis. We consider both the freely decaying case and the case with a source of scalar variance (equilibrated), and discuss the possibility to generalize this approach for reacting tracers (biogeochemistry) and more complicated time-varying velocity fields.

How to cite: Jimenez-Urias, M. A. and Haine, T.: A mathematical investigation of stirring and mixing of passive tracers by an anisotropic flow field characterized by chaotic advection, EGU General Assembly 2023, Vienna, Austria, 23–28 Apr 2023, EGU23-10911, https://doi.org/10.5194/egusphere-egu23-10911, 2023.

EGU23-11488 | Posters on site | NP1.1 | Highlight

A Critical Analysis of Optimal Fingerprinting Methods for Climate Change through the Lens of Linear Response Theory 

Valerio Lucarini and Mickaël D. Chekroun

Detection and attribution studies have played a major role in shaping contemporary climate science and have provided key motivations supporting global climate policy negotiations. The goal of such studies is to associate observed climatic patterns of climate change with acting forcings - both anthropogenic and natural ones - with the goal of making statements on the acting drivers of climate change. The statistical inference is usually performed using regression methods referred to as optimal fingerprinting. We show here how a fairly general formulation of linear response theory relevant for nonequilibrium systems provides the physical and mathematical foundations behind the optimal fingerprinting approach for the climate change detection and attribution problem. Our angle allows one to clearly frame assumptions, strengths and potential pitfalls of the method.


How to cite: Lucarini, V. and Chekroun, M. D.: A Critical Analysis of Optimal Fingerprinting Methods for Climate Change through the Lens of Linear Response Theory, EGU General Assembly 2023, Vienna, Austria, 23–28 Apr 2023, EGU23-11488, https://doi.org/10.5194/egusphere-egu23-11488, 2023.

EGU23-14148 | Orals | NP1.1 | Highlight

Ensemble Design: Sensitivity Beyond Initial Values 

David A. Stainforth

Climate change is a complex, multidisciplinary problem which relates our physical understanding of the consequences of greenhouse gas emissions with economic and socio-political actions to mitigate and adapt to those consequences. An important role that the mathematics of climate change can play involves utilising and developing understanding of nonlinear systems in such a way as to guide the design of ensembles of Global Climate and Earth System Models (ESMs), as well as integrated assessment and economic models. To this end it is informative to view these computer models as high-dimensional nonlinear systems and ask what we can learn about ensemble design from somewhat related, low-dimensional nonlinear systems.


This talk will discuss what it means to make a prediction of climate change within a computer model as well as how we can design ensembles to reflect our uncertainty in the real-world, physical climate system. The Lorenz ’84/Stommel ’61 (L84-S61) system will be introduced as a valuable tool for studying issues of ensemble design and will be used to illustrate key sources of uncertainty and sensitivity.


First amongst these senstitivities is initial value sensitivity of the sort explored in a variety of single model large ensembles (see session CL4.10/NH11/OS4) - these are known as micro-initial-condition ensembles. However, the results of such ensembles can themselves be dependent on large scale features of the starting conditions - so-called macro-initial-condition uncertainty. Lastly, the sensitivity of ensemble results to model structure and parameter value selection is crucial. How can we identify how close to the target system a model has to be to make useful probabilistic forecasts at different lead times? This question raises the prospect that climate predictions could be vulnerable to the “hawkmoth effect” - the potential for probabilistic forecasts based on initial condition ensembles to be highly sensitive to the finest details of model formulation.


Here the different types of initial value and model parameter sensitivities will be illustrated with the L84-S61 system. Based on these, a series of design questions will be raised - questions which suitably-designed ensembles of low-dimensional systems could help us understand and answer, and which could be extremely valuable in improving the design of ensembles of GCMs and ESMs.

How to cite: Stainforth, D. A.: Ensemble Design: Sensitivity Beyond Initial Values, EGU General Assembly 2023, Vienna, Austria, 23–28 Apr 2023, EGU23-14148, https://doi.org/10.5194/egusphere-egu23-14148, 2023.

EGU23-15021 | ECS | Orals | NP1.1 | Highlight

Computing precipitations with a vertical radiative-convective model with no adjustable parameters, using the maximum entropy production hypothesis. 

Quentin Pikeroen, Didier Paillard, Bérengère Dubrulle, and Karine Watrin

The state-of-the-art General Circulation Models or Earth System Models are based on conservation equations like the conservation of mass, momentum (Navier-Stokes), energy, and water... These equations are written in the form of partial derivative equations and are resolved on a grid whose spatial increment is a few tens or hundreds of kilometers and whose time increment is a few minutes. This means that phenomena acting below the numerical resolution are not computed. But because of the nonlinearity of equations, large scales are not independent of small scales, therefore the cutoff in resolution induces errors. For example, the linear relation between energy fluxes and temperature gradients (Fourier law) is not true for a grid of this size. To overcome this issue, it is usual to add new equations in order to close the conservation equations. In these new equations, new parameters are added and are generally tuned to fit observations. Though they are all based on the same physics, every climate model has a different set of "closure equations" and tuned parameters, leading to different results. For instance, while model comparisons are satisfying when looking at temperatures, results may differ significantly between two models when looking at precipitations.

Now, I am going to present an alternative way of resolving the climate system using zero tunable parameters. To achieve this, a paradigm change is needed. Partial derivative equations are no longer used, and variables are resolved with an optimization problem: maximizing a function under constraints (of conservations). The maximized function is the entropy production due to energy transfers and depends on temperatures only. Because solving the optimization problem isn't straightforward, the climate system is for now reduced to a vertical atmosphere, with only vertical energy fluxes. Such kind of model is sometimes called "radiative-convective" model and can be compared to tropical atmospheric observations because horizontal fluxes are less important there. The constraints imposed are the conservation of energy, the conservation of mass, and the conservation of water. Surprisingly, adding this last constraint to the model enables us to predict precipitations of about 1.2 m/year, in the good order of magnitude of average tropical precipitations. Theoretically, this means that precipitations depend mostly on the radiative transfer in the atmosphere.

The maximization of entropy production is probably not a generic "law of Nature" and might not apply to any out-of-equilibrium system. Here, we choose not to enter the debate whether it should be true for the climate or not, but only to show that this procedure can be a useful and efficient tool to close equations without introducing any tunable parameters, even when applied to precipitations. Though the optimization problem may rapidly become intractable, we can still envision building a more complete model of the atmospheric water cycle on these premises.

How to cite: Pikeroen, Q., Paillard, D., Dubrulle, B., and Watrin, K.: Computing precipitations with a vertical radiative-convective model with no adjustable parameters, using the maximum entropy production hypothesis., EGU General Assembly 2023, Vienna, Austria, 23–28 Apr 2023, EGU23-15021, https://doi.org/10.5194/egusphere-egu23-15021, 2023.

Many systems in nature are characterized by the coexistence of different stable states for a given set of environmental parameters and external forcing. Examples for such behavior can be found in different fields of Earth system, e.g. ecosystems and climate dynamics. As a consequence of the coexistence of a multitude of stable states, the final state of the system depends strongly on the initial condition.  The set of initial conditions which all converge to the same stable state is called the basin of attraction. In addition, the dynamics of complex systems is often characterized by the different time scales on which certain processes act. We show that the interplay of these different time scales is important particularly for the case of rate-induced tipping. This tipping phenomenon occurs when the rate of change of an internal parameter or an external forcing is varying on a different timescale as the intrinsic timescale of the system.  The system can track its original stable state under such time-dependent forcing as long as the rate of environmental change is slow. If this rate is larger than a critical rate the system will tip and obey a rather different dynamical behavior, either by approaching a different stable state or by visiting temporarily different parts of the state space.  We study the role of the relative size of the basins of attraction and the location of their boundaries in rate-induced tipping and demonstrate that the decision whether a trajectory tips or tracks the original stable state depends crucially on the changes in the basins of attraction, in particular their size and, more importantly on their boundaries, that also “move” in state space under a time-dependent variation of intrinsic parameters/external forcing.  This dependence is discussed for the two cases of smooth basin boundaries made up by the stable manifolds of saddle points and fractal basin boundaries where chaotic saddles embedded in the boundary influence the tipping of trajectories. 

How to cite: Feudel, U.: The role of multiple time scales for rate-induced tipping phenomena, EGU General Assembly 2023, Vienna, Austria, 23–28 Apr 2023, EGU23-15095, https://doi.org/10.5194/egusphere-egu23-15095, 2023.

EGU23-15627 | ECS | Orals | NP1.1

Towards a subgrid momentum closure via stochastic backscatter and its linkages with the Gent-McWilliams parametrization 

Ekaterina Bagaeva, Stephan Juricke, Sergey Danilov, and Marcel Oliver

Parametrizing physical processes in the ocean is a universal approach to overcome resolution limitations across different scales. Parametrizations represent the mean effect of processes occurring on the scales less than the grid scale (i.e. on the subgrid) on the resolved mean flow through parametric equations. In this work, a viscous momentum closure, equipped with a backscatter operator that returns excessively dissipated energy back to the system, is used to parametrize mesoscale range processes on eddy-permitting mesh resolutions.

The part of the variability that is not represented by the deterministic backscatter operator is modelled stochastically. We propose a stochastic field component, based on the patterns of variability extracted from the output of model simulations with different grid resolutions.

As a continuation of this work, we propose an interaction of the backscatter parametrization with the Gent-McWilliams parametrization which is generally applied for coarser grids corresponding to non-eddy resolving resolutions. This connection is relevant to link kinetic and potential energy backscatter.

The implementations are tested on two intermediate complexity setups of the global ocean model FESOM2: a doubly-periodic channel and a double-gyre box model. In this contribution, we present an increase of eddy activity and show that a greater complexity of setup enhances response to the implementation.  

Keywords: mesoscale eddies, parametrization, backscatter, stochastic parametrization, GM parametrization.

How to cite: Bagaeva, E., Juricke, S., Danilov, S., and Oliver, M.: Towards a subgrid momentum closure via stochastic backscatter and its linkages with the Gent-McWilliams parametrization, EGU General Assembly 2023, Vienna, Austria, 23–28 Apr 2023, EGU23-15627, https://doi.org/10.5194/egusphere-egu23-15627, 2023.

EGU23-15700 | ECS | Posters on site | NP1.1

On the numerical dependence of balance state in geophysical flows 

Manita Chouksey, Carsten Eden, Gökce Tuba Masur, and Marcel Oliver

Balance flows dictate the evolution and dynamics of geophysical flows, such as the atmosphere and ocean, that are central to the Earth's climate. Here, balance geophysical flows are balanced using two different methods and compared in simulations of the single-layer shallow water model with two different numerical model codes and two different initial conditions over a range of different parameters. Both methods: nonlinear higher order balancing and optimal balance, add to the linear geostrophic mode, the linear wave mode contributions. The resulting approximately balanced states are characterized by very small residual wave emission during time evolution of the flow. Overall, the performance of both methods is comparable. Cross-balancing suggests that both methods find approximately the same balanced states. The results contradict previous studies claiming significant spontaneous wave emission from balanced flow. Further, the results clearly show that the notion of balance in numerical models of geophysical flows is ultimately related to the particular discretization.

How to cite: Chouksey, M., Eden, C., Masur, G. T., and Oliver, M.: On the numerical dependence of balance state in geophysical flows, EGU General Assembly 2023, Vienna, Austria, 23–28 Apr 2023, EGU23-15700, https://doi.org/10.5194/egusphere-egu23-15700, 2023.

EGU23-16258 | Orals | NP1.1

Analysis of proxy response and sensitivities in a coupled general circulation model 

Francesco Ragone, Robbin Bastiaansen, Valerio Lembo, and Valerio Lucarini

In the analysis and interpretation of climate data, both from model simulations and observations, it is often of interest to establish relations between the responses of different observables to a global forcing. This problem in its generality is relevant in the context of the identification of emergent constraints for the climate system, detection and attribution studies, and the analysis of proxy data. Recently it has been discussed how in linear response theory it is possible to build proxy response operators, that allow to use the response of one observable to a forcing to predict the response of another observable. The spectral properties of the proxy response functions determine then the properties of statistical predictability at different time scales for the pair of observables. The skill and feasibility of this approach for complex climate data has however not been fully tested yet. In this work we analyse the properties of proxy response in experiments with the coupled general circulation model MPI-ESM v.1.2. We consider ensemble simulations of abrupt CO2 doubling and 1% per year CO2 increase scenarios. We study the response of different atmospheric and oceanic variables, and we compute proxy response functions for different pairs of observables. We analyse the predictive power for the different cases, and interpret differences in skills in terms of causal relations among observables. We also study the relation between statistical variability and long term sensitivity, and we discuss differences between ensemble and internal variability in unforced and forced states. We then link our results to the discussion on the interpretation of emergent constraints in climate change simulations.

How to cite: Ragone, F., Bastiaansen, R., Lembo, V., and Lucarini, V.: Analysis of proxy response and sensitivities in a coupled general circulation model, EGU General Assembly 2023, Vienna, Austria, 23–28 Apr 2023, EGU23-16258, https://doi.org/10.5194/egusphere-egu23-16258, 2023.

We study methods that aim to reduce the dimension of a finite dimensional solution space, in which the solution corresponding to a certain parametrized Optimal Control Problems governed by environmental models, e.g. Quasi-Geostrophic flow, is sought. The parameter is modeled as a random variable to incorporate possible uncertainty, for example in parametric measurements. For such a reduction to be useful, it should be guaranteed, for every possible parameter value, that it results in an acceleration of the solution process while maintaining an accurate approximate solution. In order to do this, conditions are formulated, and under those conditions, several versions of a specific reduction method known as Proper Orthogonal Decomposition are implemented. We consider examples and show that a simplification of the general state of the art reduction method performs equally well.

How to cite: Carere, G.: Reduced Basis Methods for Optimal Control Problems with Random Inputs in Environmental Science, EGU General Assembly 2023, Vienna, Austria, 23–28 Apr 2023, EGU23-16389, https://doi.org/10.5194/egusphere-egu23-16389, 2023.

EGU23-16458 | ECS | Orals | NP1.1

Limits of large deviation theory in predicting transition paths of climate tipping events 

Reyk Börner, Ryan Deeley, Calvin Nesbitt, Raphael Römer, Tobias Grafke, Ulrike Feudel, and Valerio Lucarini

Following Hasselmann’s ansatz, the climate system may be viewed as a multistable dynamical system internally driven by noise. Its long-term evolution will then feature noise-induced critical transitions between the competing attracting states. In the weak-noise limit, large deviation theory allows predicting the transition rate and most probable transition path of these tipping events. However, the limit of zero noise is never obtained in reality. In this work we show that, even for weak finite noise, sample transition paths may disagree with the large deviation prediction – the minimum action path, or instanton – if multiple timescales are at play. We illustrate this behavior in selected box models of the bistable Atlantic Meridional Overturning Circulation (AMOC), where different restoring times of temperature and salinity induce a fast-slow characteristic. While the minimum action path generally crosses the basin boundary at a saddle point, we demonstrate cases in which ensembles of sample transition paths cross far away from the saddle. We discuss the conditions for saddle avoidance and relate this to the flatness of the quasipotential, a central object of large deviation theory. We further probe the vicinity of the weak-noise limit by applying a pathspace method that generates transition samples for arbitrarily weak noise. Our results highlight that predictions by large deviation theory must be treated cautiously in multiscale dynamical systems.

How to cite: Börner, R., Deeley, R., Nesbitt, C., Römer, R., Grafke, T., Feudel, U., and Lucarini, V.: Limits of large deviation theory in predicting transition paths of climate tipping events, EGU General Assembly 2023, Vienna, Austria, 23–28 Apr 2023, EGU23-16458, https://doi.org/10.5194/egusphere-egu23-16458, 2023.

We discuss a derivation of the analytic solution of the wave equations in complex structures perturbed by local defects, long waveguides, and various sources. After obtaining the exact analytic form of the solution, the numerical implementation becomes more or less straightforward. The corresponding real-time simulations will be demonstrated. Another important point is that the analytic solutions do not have disadvantages associated with the noise of reflections from the artificial boundaries of the model and other drawbacks inherent in purely numerical simulations. The solution is based on integral and algebraic transforms, including the active use of special functions. Even for linear waves that propagate in inhomogeneous structures, the solution is very complex. This fact probably makes the process of obtaining exact analytic solutions for nonlinear waves practically hopeless.

How to cite: Kutsenko, A.: Analytic solution of the wave equation in complex structures with defects, waveguides, sources, EGU General Assembly 2023, Vienna, Austria, 23–28 Apr 2023, EGU23-16558, https://doi.org/10.5194/egusphere-egu23-16558, 2023.

Recently, Ehret and Dey (2022) suggested the c-u-curve method to analyze, classify and compare dynamical systems of arbitrary dimension, deterministic or probabilistic, by the two key features uncertainty and complexity. It consists of subdividing the system’s time-trajectory into a number of time slices. For all values in a time slice, the Shannon information entropy is calculated, measuring within-slice variability. System uncertainty is expressed by the mean entropy of all time slices. System complexity is then defined as “uncertainty about uncertainty”, expressed by the entropy of the entropies of all time slices. Calculating and plotting uncertainty u and complexity c for many different numbers of time slices yields the c-u-curve. Systems can be analyzed, compared and classified by the c-u-curve in terms of i) its overall shape, ii) mean and maximum uncertainty, iii) mean and maximum complexity, and iv) its characteristic time scale expressed by the width of the time slice for which maximum complexity occurs.

In our contribution, we will briefly revisit the basic concepts of the c-u-curve method, and then present results from applying it to hydro-meteorological time series of 512 catchments from the CAMELS-US data set (Newman et al., 2015). We will show how c-u-curve properties i) relate to hydro-climatological features, ii) how they can be used for catchment classification, and iii) how the classes compare to existing classifications by Knoben et al. (2018) and Jehn et al. (2020).

References

Ehret, U., and Dey, P.: Technical note: c-u-curve: A method to analyse, classify and compare dynamical systems by uncertainty and complexity, Hydrol. Earth Syst. Sci. Discuss., 2022, 1-12, 10.5194/hess-2022-16, 2022.

Jehn, F. U., Bestian, K., Breuer, L., Kraft, P., and Houska, T.: Using hydrological and climatic catchment clusters to explore drivers of catchment behavior, Hydrol. Earth Syst. Sci., 24, 1081-1100, 10.5194/hess-24-1081-2020, 2020.

Knoben, W. J. M., Woods, R. A., and Freer, J. E.: A Quantitative Hydrological Climate Classification Evaluated With Independent Streamflow Data, Water Resources Research, 54, 5088-5109, https://doi.org/10.1029/2018WR022913, 2018.

Newman, A. J., Clark, M. P., Sampson, K., Wood, A., Hay, L. E., Bock, A., Viger, R. J., Blodgett, D., Brekke, L., Arnold, J. R., Hopson, T., and Duan, Q.: Development of a large-sample watershed-scale hydrometeorological data set for the contiguous USA: data set characteristics and assessment of regional variability in hydrologic model performance, Hydrol. Earth Syst. Sci., 19, 209-223, 10.5194/hess-19-209-2015, 2015.

How to cite: Ehret, U., Baste, S., and Dey, P.: Analyzing and classifying dynamical hydrological systems by uncertainty and complexity with the c-u-curve method, EGU General Assembly 2023, Vienna, Austria, 23–28 Apr 2023, EGU23-1464, https://doi.org/10.5194/egusphere-egu23-1464, 2023.

EGU23-2400 | ECS | Orals | NP4.1

Identifying soil signatures from soil moisture time series via a changepoint-based approach 

Mengyi Gong, Rebecca Killick, Christopher Nemeth, John Quinton, and Jessica Davis

Healthy soil plays a critical role in sustaining biodiversity, maintaining food production, and mitigating climate change through carbon capture. Soil moisture is an important measure of soil health that scientists model via soil drydown curves. The typical modelling process requires manually separating the soil moisture time series into segments representing the drying process and fitting exponential decay models to these segments to obtain an estimation of the key parameters. With the advancement of sensor technology, scientists can now obtain higher frequency measurements over longer periods in a larger number of locations. To enable automatic data processing and to obtain a dynamic view of the soil moisture drydown, a changepoint-based approach is developed to automatically identify structural changes in soil moisture time series.

Specifically, timings of the sudden rises in soil moisture over a long time series are captured and the parameters characterising the drying processes following the sudden rises are estimated simultaneously. An algorithm based on the penalised exact linear time (PELT) method was developed to identify the changepoints and estimate the model parameters. This method can be considered as a complement to the conventional soil moisture modelling. It requires little data pre-processing and can be applied to a soil moisture time series directly. Since each drying segment has its unique parameters, the method also has the potential of capturing any temporal variations in the drying process, thus providing a more comprehensive summary of the data.

The method was applied to the hourly soil moisture time series of nine field sites from the NEON data portal (https://data.neonscience.org/). Distributions and summary statistics of key model parameters, such as the exponential decay rate and the asymptotic soil moisture level, are produced for each field site. Investigating and comparing these quantities from different field sites enables the identification of soil signatures which can reflect the hydrological properties of the soil. Visualising the model parameters as a time series reveals the subtle temporal pattern of the drying process in some field sites. 

How to cite: Gong, M., Killick, R., Nemeth, C., Quinton, J., and Davis, J.: Identifying soil signatures from soil moisture time series via a changepoint-based approach, EGU General Assembly 2023, Vienna, Austria, 23–28 Apr 2023, EGU23-2400, https://doi.org/10.5194/egusphere-egu23-2400, 2023.

EGU23-3968 | ECS | Posters on site | NP4.1

Influence of Environmental Parameters on Highly Sensitive Instruments at Moxa Geodynamic Observatory 

Valentin Kasburg, Alexander Breuer, Martin Bücker, and Nina Kukowski

Strainmeters measure the change in length between two known fixed points and are used primarily to identify and estimate tectonic strain. In addition to tectonic strain, these instruments also record changes in strain caused by other phenomena such as Earth tides and fluctuations of meteorological signals like changes in groundwater levels caused by precipitation, which may be much larger than tectonic strain and thus mask its signals. To avoid meteorological influences as far as possible, horizontal strainmeters often are maintained in galleries such that tectonically induced strain signals are not affected by other sources of noise.

At Moxa Geodynamic Observatory, located in central Germany, two laser strainmeters with a base length of 26 m each are maintained in galleries oriented north-south and east-west. Their resolution is in the nano-scale and sampling rate is 0.1 Hz. Mountain overburden in the gallery is comparatively low at approx. 30 m and in addition, the hydrogeological situation of the subsurface surrounding the observatory, is very heterogeneous. Therefore, amplitudes of meteorological phenomena are still quite high. In order to correct meteorological influences in the recorded strain time-series, they first need to be better understood. For doing so, long time-series - a decade at least – are needed. As the laser strainmeters continuously record since summer 2011, these are now available.

We present the results of weighting various meteorological parameters on the strainmeter recordings by training Long Short Term Memory Networks and perturbing input parameters for the test data. In this way, the contribution of each parameter to the meteorologically induced strain signals can be estimated. This knowledge is subsequently used to eliminate meteorological influences from the time-series recordings of strain.

How to cite: Kasburg, V., Breuer, A., Bücker, M., and Kukowski, N.: Influence of Environmental Parameters on Highly Sensitive Instruments at Moxa Geodynamic Observatory, EGU General Assembly 2023, Vienna, Austria, 23–28 Apr 2023, EGU23-3968, https://doi.org/10.5194/egusphere-egu23-3968, 2023.

EGU23-4698 | ECS | Orals | NP4.1

The power low in information geometry: Attempt from the viscoelastic relaxation of rock 

Mitsuhiro Hirano and Hiroyuki Nagahama

It is known that power law exists in the background of various natural phenomena. One example is the viscoelastic behavior of rocks. In the flow laws of high temperature of rocks, strain rate is in proportion to the power of stress. It can be replaced by the one that relaxation modulus (the ratio of stress to strain) is in proportion to the power of time with fractal dimension as power exponent. From Laplace transform for the relaxation modulus, the distribution of relaxation time (relaxation spectrum) with the power of relaxation time is derived. It indicates the existence of fractal distribution of different relaxation times in material elements in rocks. On the other hand, these strain-relaxation modulus-stress relations can be recaptured as the input-response-output relation in an ideal complex system with the power law of component. When input and output are stochastic with probability functions, the response corresponds to the change in differential geometric structure on a statistical manifold with a point as a probability function. Although previous studies suggested the correspondence between the power exponent (fractal dimension) and the constant (alpha) characterizing invariant geometric structure (alpha-connection), its details have not been discussed yet. In this presentation, we would reveal the correspondence between the power exponent (fractal dimension) and the constant (alpha) based on q-exponential family in information geometry, which is a more general exponential family.

How to cite: Hirano, M. and Nagahama, H.: The power low in information geometry: Attempt from the viscoelastic relaxation of rock, EGU General Assembly 2023, Vienna, Austria, 23–28 Apr 2023, EGU23-4698, https://doi.org/10.5194/egusphere-egu23-4698, 2023.

EGU23-4919 | Posters on site | NP4.1

Long-term sensor drift of pressure gauges characterized by a pressure balance 

Hiroyuki Matsumoto, Hiroaki Kajikawa, and Eiichiro Araki

It is postulated that a pressure gauge has potential for detection of vertical crustal deformation associated with plate convergence since the measurement resolution is higher than the expected deformation. However, it has been long known that the sensor drift being a few of hPa (cm) per year or larger rate is identified in the long-term pressure observation at the seafloor. We have investigated the sensor drift of pressure gauges pressurized by a pressure balance in the laboratory. Two types of pressure gauges were examined; one is quartz resonant pressure gauges which are traditionally used for in-situ pressure observations and the other is silicon resonant pressure gauges which can be used for oceanographic observations in the future. Full scale of all pressure gauges examined in the present experiment is 70 MPa. Pressure calibration curves were obtained by applying the standard pressure from zero to full scale to characterize hysteresis and repeatability of pressure gauges. Comparing pressure calibration curves under the different temperature condition, only zero offset is changed for the tested quartz pressure gauges, whereas both zero offset and span are changed for some silicon pressure gauges. Then, static pressure of 20 MPa equivalent to 2000 m water depth is applied to the pressure gauges simultaneously for a period of approximately 100 days under the low temperature condition. Some silicon pressure gauges were pressurized under the normal temperature condition. Pressure calibrations were conducted about 50 times repeatedly by providing the standard pressure of 20 MPa using the pressure balance during the experiment. Differences between the standard pressure and the sensor’s output over time were calculated to evaluate the sensor drift. The results suggest that the lower ambient temperature can contribute to the shorter relaxation time (i.e., the elapsed time to disappear initial abrupt change) and the smaller sensor drift (i.e., the linear trend) in the both types of pressure gauges. The sensor drift between the quartz and the silicon pressure gauges were comparable except for the specific silicon pressure gauges. It is noted that the quartz pressure gauges are more sensitive to temperature than the silicon pressure gauges in the present experiment.

How to cite: Matsumoto, H., Kajikawa, H., and Araki, E.: Long-term sensor drift of pressure gauges characterized by a pressure balance, EGU General Assembly 2023, Vienna, Austria, 23–28 Apr 2023, EGU23-4919, https://doi.org/10.5194/egusphere-egu23-4919, 2023.

EGU23-5840 | Orals | NP4.1 | Highlight

Advances in Bayesian time series analysis of palaeoclimate data 

Michel Crucifix, Linda Hinnov, Anne-Christine Da Silva, David De Vleeschouwer, Stephen Meyers, Andrew Parnell, Matthias Sinnesael, Thomas Westerhold, and Sébastien Wouters

Time series analysis of palaeoclimate data is used to identify quasi-periodic changes attributable to astronomical forcing of insolation by Earth’s axial obliquity and precession, and orbital eccentricity, i.e., Milankovitch cycles. Hays et al. (1976) applied time series analysis – including spectral analysis, filtering, tuning and hypothesis testing – on palaeoclimatic data from the most recent 500 Ka of Earth history to demonstrate forcing from these astronomical parameters. The CENOGRID “splice” (Westerhold et al., 2000) has since extended this evidence to 66 Ma. Investigators have also recognised the imprint of Milankovitch cycles in palaeoclimatic records reaching back into the Precambrian. 

Palaeoclimate time series present unique challenges: sample spacing is generally not constant; measured data represent combinations of palaeoenvironmental factors; most problematic of all, palaeoclimate time scales are almost never known with adequate certainty. Important time constraints are provided by geochronology from volcanic ash layers, geomagnetic reversals and selected chemostratigraphic events, but only at isolated, widely spaced points along geologic time, and only extremely rarely do they provide a precision sufficient to determine the time-periodicity of palaeoclimate variations at Milankovitch scales. Investigators must also grapple with uncertainties in celestial mechanics, and in the theory of climate change, sedimentation and alteration. From this collective information, one may choose to investigate mechanisms of climate or environmental change (climate modelling); estimate the chronology and duration of stratigraphic series of palaeoclimate data (cyclostratigraphy); and constrain the celestial mechanics of Earth’s distant past. 

In principle, all of these objectives can be obtained through application of a hierarchical Bayesian model: astronomical forcing -> climate -> environment -> sedimentation -> alteration -> observation. Bayesian theory allows us to reverse all of the arrows and to update information about sedimentation, the environment, climate, and astronomical forcing. However, in Bayesian statistics, expressing a likelihood function is a fundamental step and requires parameterising stochastic quantities. One needs to be clear and explicit about errors. We present an example that considers an explicit-likelihood route for Quaternary data (Carson et al., 2019). In the more distant geologic past, uncertainties about climate and sedimentation are increasingly challenging. Strategies tend to be based on pattern identification by the investigator, with or without numerical techniques. Examples include recognising orbital eccentricity bundling in paleoclimatic data sequences that exhibit precession cycling, and studying the relationships between frequency and amplitudes (Meyers and Malinverno, 2018). We review examples illustrating the relationship between frequency and amplitude together with the supporting theory. 

References: Carson et al., Proc. R. Soc. A (2019), 475, 20180854; Hays et al., Sci. (1976), 194(4270), 1121-1132; Meyers, S.R., Malinverno, A., Proc. Natl. Acad. Sci. U.S.A. (2018), 115(25), 6363-6368; Westerhold et al., Sci. (2020), 369, 1383-1387.

How to cite: Crucifix, M., Hinnov, L., Da Silva, A.-C., De Vleeschouwer, D., Meyers, S., Parnell, A., Sinnesael, M., Westerhold, T., and Wouters, S.: Advances in Bayesian time series analysis of palaeoclimate data, EGU General Assembly 2023, Vienna, Austria, 23–28 Apr 2023, EGU23-5840, https://doi.org/10.5194/egusphere-egu23-5840, 2023.

EGU23-6327 | Orals | NP4.1

Understanding and modeling meteorological drivers of the number of hospital admissions for malaria in South Africa 

Suzana Blesic, Milica Tosic, Neda Aleksandrov, Thandi Kapwata, Rajendra Maharaj, and Caradee Wright

We preformed statistical analysis of two sets of malaria incidence time series: of daily admissions from two large public hospitals in Limpopo Province in South Africa (records taken in the period 2002-2017), and of weekly epidemiological reports from five districts in the same province (for the period 2000-2020). We analysed these time series in relation to time series of temperature and rainfall ground or satellite data from the same geographical area.

Firstly, we used wavelet transform (WT) cross-correlation analysis to monitor and characterize coincidences in daily changes of meteorological variables and variations in hospital admissions. All our daily admission records had global wavelet power spectra (WTS) of the power-law type, indicating that they are outputs of complex sets of causes acting on different time scales. We found that malaria in South Africa is a seasonal multivariate event, initiated by co-occurrence of heat and rainfall. We then proceeded to utilize obtained results for the analysis of the weekly cases data, using the WTS superposition of signals rule to discern WTS peaks that are time lags between the onset of combined meteorological drivers and hospital admissions for malaria. We presumed that all these peaks are characteristic times connected to the characteristic periods of development, distribution and survival of either mosquitos, as disease vectors, the pathogens they transmit, or the times needed for human incubation of the disease. Thus, we were able to propose a regression model for the number of admissions (for malaria) cases, and to provide critical values of temperature and rainfall for the initiation of the disease spread.

Finally, using the developed model we investigated how future changes of meteorological variables and their combination can affect malaria dynamics, and thus provide information that can be of use for public health preparedness.

How to cite: Blesic, S., Tosic, M., Aleksandrov, N., Kapwata, T., Maharaj, R., and Wright, C.: Understanding and modeling meteorological drivers of the number of hospital admissions for malaria in South Africa, EGU General Assembly 2023, Vienna, Austria, 23–28 Apr 2023, EGU23-6327, https://doi.org/10.5194/egusphere-egu23-6327, 2023.

The impact of climate change on weather pattern dynamics over the North Atlantic is explored through the lens of the information theory of forced dissipative dynamical systems.

The predictability problem is first tackled by investigating the evolution of block entropies on observational time series of weather patterns produced by the Met Office, which reveals that predictability is increasing as a function of time in the observations during the 19th century and beginning of the 20th century, while the trend is reversed at the end of the 20th century and beginning of the 21st century. This feature is also investigated in the 15-member ensemble of the UK Met Office CMIP5 model for the 20th and 21st centuries under two climate change scenarios, revealing a wide range of possible evolutions depending on the realization considered, with an overall decrease in predictability in the 21st century for both scenarios.

Lower bounds of the information entropy production are also extracted, providing information on the degree of time asymmetry and irreversibility of the dynamics. The analysis of the UK Met Office model runs suggests that the information entropy production will increase by the end of the 21st century, by a factor of 10% in the Representative Carbon Pathway RCP2.6 scenario and a factor of 30 %–40% in the RCP8.5 one, as compared to the beginning of the 20th century. This allows one to make the conjecture that the degree of irreversibility is increasing, and hence heat production and dissipation will also increase under climate change, corroborating earlier findings based on the analysis of the thermodynamic entropy production.

How to cite: Vannitsem, S.: Weather pattern dynamics over western Europe under climate change: predictability, information entropy and production, EGU General Assembly 2023, Vienna, Austria, 23–28 Apr 2023, EGU23-6728, https://doi.org/10.5194/egusphere-egu23-6728, 2023.

EGU23-7450 | ECS | Posters on site | NP4.1

Geodynamic studies in the Pieniny Klippen  Belt in  2004-2020 

Dominika Staniszewska

The Pieniny Klippen Belt is located in the middle part of the zone between the Inner Carpathians and Outer Carpathians. Researches at the Pieniny Geodynamic Test Field dates back to the 1960s.

Previous geodynamic studies in the area of the Pieniny Klippen Belt  have indicated neotectonic activity. Currently, starting in 2004, a GNSS survey campaign is held annually in early September.

The subject of the study was to check whether the Pieniny Klippen Belt (PKB) shows neotectonic activity in the relation to the surrounding structures - the Podhale Flysh (FP) and the Magura Nape (MN).

This study was based on the  survey of the movement of stations located in the area of the aforementioned three structures, which create the Pieniny Geodynamic Test Field.

The Pieniny Geodynamic Test Field consists of 15 GNSS stations, including 6 stations inside the PKB, 5 stations within the MN and 4 stations within the FP. The whole geodynamic test field is supplemented by 4 GNSS stations located in the Tatra Mountains.

To determine the horizontal movements of the geodynamic units, the results of satellite measurements made between 2004 and 2020 were processed. The coordinates and velocities of the stations were determined in two reference systems - IGb08 and IGb14.

To define the IGb08 and IGb14 systems, 24 EUREF stations (Euref Parmanent GNSS Network) were used. The stations were selected based on the following criteria: location, length of available data and the fewest number of discontinuities. The stations were basign to be located at the shortest distance from the Pieniny Geodynamic Test Field, as well as to be distributed evenly. Data from the CODE Analysis Center was used to process the GNSS data. GNSS datasets were processed using Bernese 5.2 GNSS Software. The adjustment was prefared in two variants due to inconsistencies between the orbits of the satellites and the IGb14 system. The differences between the ITRF2008 and ITRF2014 are quite small and are due to new or updated antenna calibrations.

Then, the obtained velocities were converted to ETRF2014. Station velocities were determined in two ways-analytically, using transformation parameters between the ITRF and ETRF2014 systems for the 2010.0 epoch, and using the EPN CB Coordinate Transformation Tool shared by the EUREF Permanent Network (EPN).

Horizontal coordinates were determined in both short-period solutions - daily and long-period solutions - covering sixteen measurement epochs.

To check the validity of the adjustment, a comparison of the velocities calculated for the reference stations with the EUREF model was performed.

The velocities of stations located in the Pieniny Geodynamic Test Field were also compared with those obtained in a study done in 2016.

The realized comparison of calculations allowed us to conclude that the performed alignment does not deviate from the solutions presented in the model and in the previous study.

The obtained results shows the tectonic activity of the Pieniny Klippen Belt and surrounding units. Horizontal point movements are small, i.e. 0.2 - 0.7mm/year, although changes in the position of points show a linear character. The trend in the direction of these changes and their magnitude is also preserved.

How to cite: Staniszewska, D.: Geodynamic studies in the Pieniny Klippen  Belt in  2004-2020, EGU General Assembly 2023, Vienna, Austria, 23–28 Apr 2023, EGU23-7450, https://doi.org/10.5194/egusphere-egu23-7450, 2023.

EGU23-7730 | Orals | NP4.1

Power spectrum estimation for extreme events data 

Norbert Marwan and Tobias Braun

The estimation of power spectral density (PSD) of time series is an important task in many quantitative scientific disciplines. However, the estimation of PSD from discrete data, such as extreme event series is challenging. We present a novel approach for the estimation of a PSD of discrete data. Combining the edit distance metric with the Wiener-Khinchin theorem provides a simple yet powerful PSD analysis for discrete time series (e.g., extreme events). This method works directly with the event time series without interpolation. We demonstrate the method's potential on some prototypical examples and on event sequences of atmospheric rivers (AR), narrow filaments of extensive water vapor transport in the lower troposphere. Considering the spatial-temporal event series of ARs over Europe, we investigate the presence of a seasonal cycle as well as periodicities in the multi-annual range for specific regions, likely related to the North-Atlantic Oscillation (NAO).

How to cite: Marwan, N. and Braun, T.: Power spectrum estimation for extreme events data, EGU General Assembly 2023, Vienna, Austria, 23–28 Apr 2023, EGU23-7730, https://doi.org/10.5194/egusphere-egu23-7730, 2023.

A Measurement Node for the continuous gravity and tilt observations in an active

geodynamic area of southern Italy: the Calabrian Arc system

Anna Albano1, Vincenzo Carbone1, Francesco Lamonaca2

1Dipartimento di Fisica, Università della Calabria, Arcavacata di Rende (CS), Italy

2Dipartimento di Ingegneria Informatica, Modellistica, Elettronica e Sistemistica,
Università della Calabria, Arcavacata di Rende (CS), Italy


Calabria (southern Italy) is a site of considerable seismic activity related to the ongoing evolution of the Calabrian Arc system, where a complex lithospheric structure is present. For over a century the Calabrian region has been going through a period of relative seismic quietness, yet its seismic hazard is at the highest levels in the Mediterranean basin due to several catastrophic earthquakes present in the historical records. In order to strengthen the geophysical monitoring of this region, a gravity and tilt recording station was set up in the premises of the University of Calabria. The measurement node is composed by the gravimeter G-1089 from LaCoste & Romberg; the tilt-meter Model 714 from Applied Geomechanics; a 6 and ½ digits multimeter Agilent 34970A data acquisition and switching unit used to converts the analog signals of the gravimeter and tilt-meter in the corresponding digital ones; a computer used to store, elaborate and present the signals. The delay among the input channels of the multimeter is evaluated and the optimal configuration is achieved in order to make such a delay negligible for the time correlation of the input signals. The measurement node is positioned on the ground of the cube 41C. Finally, the information about the temperature and the atmospheric pressure is obtained by the nearby environmental station positioned on the roog of cube 41B. The recorded signals should allow to estimate a tidal anomaly, possibly correlated with the difference between some local feature of the lithosphere or geodynamic activity and the corresponding characteristics of the model used to calculate the reference gravity tide. A reliable model of the gravity tide is necessary for accurate processing of discrete absolute and relative gravimetric measurements and to detect in the gravity signals possible components correlated to major seismic activity. The Ocean Tide Load (OTL) effect was accounted for in the determination of the tidal field spectral parameters. The most widespread DDW99/ NH Earth’s model, adopted here as reference, fits the obtained results well enough.

How to cite: Albano, A., Carbone, V., and Lamonaca, F.: A Measurement Node for the continuous gravity and tilt observations in an activegeodynamic area of southern Italy: the Calabrian Arc system, EGU General Assembly 2023, Vienna, Austria, 23–28 Apr 2023, EGU23-8485, https://doi.org/10.5194/egusphere-egu23-8485, 2023.

EGU23-9762 | Posters on site | NP4.1

Estimating intermittency significance by means of surrogate data: implications for stationarity 

Eliza Teodorescu, Marius Echim, Jay Johnson, and Costel Munteanu

Intermittency is a property of turbulent astrophysical plasmas, such as the solar wind, that implies non-uniformity in the transfer rate of energy carried by non-linear structures from large to small scales. We evaluate the intermittency level of the turbulent magnetic field measured by the Parker Solar Probe in the slow solar wind in the proximity of the Sun, at about 0.17 AU, during the probe’s first encounter. A quantitative measure of the intermittency of a time-series can be deduced based on the normalized forth order moment of the probability distribution functions, the flatness parameter. We observe that when dividing the data into contiguous samples of various lengths, from three to twenty-four hours, flatness differs significantly from sample to sample, suggestive of alternating intermittency-free time intervals with highly intermittent samples. In order to describe this variability, we apply an elaborate statistical test tailored to identify nonlinear dynamics in a time series which involves the construction of surrogate data that eliminate all nonlinear correlations contained in the dynamics of the signal but are otherwise consistent with an “underlying” linear process, i.e. the null hypothesis that we want to falsify. If a discriminating statistic for the original signal, such as the flatness parameter, is found to be significantly different than that of the ensemble of surrogates, then the null hypothesis is not valid, and we can conclude that the computed flatness reliably reflects the intermittency level of the underlying non-linear processes. We determine that non-stationarity of the time-series strongly influences the flatness of both the data and surrogates and the null hypothesis cannot be falsified. The intermittency level detected in such cases reflects the effects of isolated and, maybe, statistically not meaningful events, consequently, we stress upon the importance of careful data selection and evaluating the significance of the evaluated discriminating statistic.

How to cite: Teodorescu, E., Echim, M., Johnson, J., and Munteanu, C.: Estimating intermittency significance by means of surrogate data: implications for stationarity, EGU General Assembly 2023, Vienna, Austria, 23–28 Apr 2023, EGU23-9762, https://doi.org/10.5194/egusphere-egu23-9762, 2023.

EGU23-10009 | Posters virtual | NP4.1

26 August 2018 Geomagnetic Storm: Fractal Analysis of Earth Magnetic Field  

Anna Wawrzaszek, Renata Modzelewska, Agata Krasińska, Agnieszka Gil, and Vasile Glavan

We perform a systematic and comparative analysis of the fractal dimension estimators as a proxy for data complexity. In particular, we focus on the analysis of the horizontal geomagnetic field components registered by four stations (Belsk, Hel, Sodankylä and Hornsund) at various latitudes during the period of 22 August–1 September, when the 26 August 2018 geomagnetic storm appeared. To identify the fractal scaling and to compute the fractal dimension, we apply and compare three selected methods: structure function scaling, Higuchi, and detrended fluctuation analysis. The obtained results show the temporal variation of the fractal dimension of horizontal geomagnetic field components, revealing differences between their irregularity (complexity). Moreover, the values of fractal dimension seem to be sensitive to the change of physical conditions related to interplanetary shock, the coronal mass ejection, the corotating interaction region, and the high-speed stream passage during the storm development. Especially, a significant decrease in the fractal dimension for all stations is observed immediately following the interplanetary shock, which was not straightforwardly visible in the geomagnetic field components data.

How to cite: Wawrzaszek, A., Modzelewska, R., Krasińska, A., Gil, A., and Glavan, V.: 26 August 2018 Geomagnetic Storm: Fractal Analysis of Earth Magnetic Field , EGU General Assembly 2023, Vienna, Austria, 23–28 Apr 2023, EGU23-10009, https://doi.org/10.5194/egusphere-egu23-10009, 2023.

The dynamics of the Earth's magnetosphere are a tremendously complex system that exhibit nonlinear dynamics in response to variations in the solar wind and interplanetary magnetic field. It has been amply demonstrated in the past that scale-invariant processes define magnetospheric dynamics as measured by geomagnetic indices. Forced and/or Self Organized Criticality, a term coined by T.S. Chang in the 90s, describes the plasma dynamics in the magnetospheric tail region. The multifractal structure of the variations of geomagnetic indices is another distinctive feature of the Earth's magnetospheric response.  Here, we use the joint multifractal measures approach first proposed by Meneveau et al. (1990) and low and high latitude geomagnetic indices  (AE, AL, Sym-H, Asy-H ,etc) to examine the link between the intermittency degrees of high and low latitude dynamics. The findings are examined in regard to the coupling of storms and substorms. 

How to cite: Consolini, G.: Joint-Multifractal Analysis of High and Low Latitude Magnetospheric Dynamics., EGU General Assembly 2023, Vienna, Austria, 23–28 Apr 2023, EGU23-11060, https://doi.org/10.5194/egusphere-egu23-11060, 2023.

EGU23-11304 | Posters virtual | NP4.1

Long term investigations at the Mont Terri rock laboratory of tilt and their near and far field influences 

Dorothee Rebscher, Finnegan G. Reichertz, and Senecio Schefer

Underground research laboratories provide advantageous conditions to observe a broad range of various rock parameters to characterise rock matrix and geological features, and to enhance knowledge of their dynamic behaviour, all under relatively undisturbed conditions. One of their favorable features is that the overburden protects against large environmental changes, although those influences cannot be mitigated in full. Especially for long term investigations, a holistic observation of ambient environmental parameters is necessary on the local scale and beyond.

The Swiss Mont Terri rock laboratory is situated in the Jura Mountains about 250 m below the surface. Starting in 1996, the international Mont Terri Consortium has conducted about 150 experiments in the native Opalinus Clay. Embedded in several of the ongoing in situ experiments, platform tiltmeters assist in the often interdisciplinary investigations. Two different types of biaxial instruments with resolutions of 0.1 urad and better than nrad are distributed throughout the laboratory, together forming a small, growing array, with the first tiltmeters installed in April 2019.

Tiltmeters observe the direct local deformation, they are exposed to near field but also far field impacts. Known local influences are mainly temperature, air pressure, and humidity. In Mont Terri, all of these parameters are registered directly at the location of the tilt sensors with the same relatively high sampling of once every few seconds. In addition, Mont Terri's comprehensive database imparts valuable complementing information. However, the detected deformation pattern is also influenced on a much larger spatial scale, e.g. far field, extensive changes in weather patterns, earth tides, and teleseismic events.

Therefore, to allow detection, identification, and realistic interpretation of complex signal responses on different spatial scales, it is mandatory to distinguish transient and long term signals, natural and anthropogenic disturbances. Their understanding is essential for the evaluation of stability and the safety of a rock laboratory for the benefit of its personnel and visitors. Obviously, long term, continuous data series require long term commitments. But the efforts pays off, not the least, as decade-long deformation studies contribute to multifaceted technical and scientific aspects of long term behavior of barrier rocks, and these are relevant for the exploitation of the deep geological subsurface such as nuclear waste disposal, geological storage of carbon dioxide, use of geothermal energy, or inter-seasonal thermal energy storage.

How to cite: Rebscher, D., Reichertz, F. G., and Schefer, S.: Long term investigations at the Mont Terri rock laboratory of tilt and their near and far field influences, EGU General Assembly 2023, Vienna, Austria, 23–28 Apr 2023, EGU23-11304, https://doi.org/10.5194/egusphere-egu23-11304, 2023.

EGU23-11340 | ECS | Posters on site | NP4.1

Observing climate zones boundaries change: Kazakhstan's case study 

Kalamkas Yessimkhanova and Mátyás Gede

Presently, climate change is an urging topic and mapping the effects of climate change is a crucial part. According to the evaluation by United Nations Development Programme, more than half of the territory of Kazakhstan exposed ecological crisis as drought, extreme weather events, fires and others. In this regard, this study is important for conducting research on both observation and visualization of the boundaries change of climatic zones on the land area of Kazakhstan. The Köppen climate classification was applied as a reference. In particular, such variables as temperature and precipitation were used for climatic zones classification. Extensive database of Google Earth Engine spatial analysis platform allows to leverage climate reanalysis datasets for many decades. Although, World Metereological Organization recommends considering 30-year period to witness the climate change, there is limited data access for the region of interest. Thus, only 21-year time frame was analyzed, specifically, time range between 2000 and 2021. Results are presented as time-series maps of classified climate zones and may benefit other researchers on their projects related to climate change.

How to cite: Yessimkhanova, K. and Gede, M.: Observing climate zones boundaries change: Kazakhstan's case study, EGU General Assembly 2023, Vienna, Austria, 23–28 Apr 2023, EGU23-11340, https://doi.org/10.5194/egusphere-egu23-11340, 2023.

Statistical associations between variables of interest are commonly assessed by applying similarity measures like Pearson correlation to corresponding observational time series. Most traditional measures focus on continuous variables and their associated complete variability, while there is a vast amount of practical examples where only times with specific conditions (e.g. extreme events) are of interest. For the latter cases, concepts like event synchronization strength or event coincidence rates have been introduced as proper similarity measures, and have proven their broad applicability across many areas of research. However, recent work has shown that such event based similarity measures may have conceptual as well as practical limitations when studying co-occurrence statistics between temporally clustered or extended events that do not meet the common assumption of serially uncorrelated point processes.

In this work, we introduce and discuss a straightforward extension of event coincidence analysis (ECA) to studying statistical associations between sequences of persistent events, which we tentatively call interval coincidence analysis (InCA). Here, each event of interest corresponds to a well-defined time interval, and the discrete counts of event co-occurrences in ECA are replaced by the fractions of time during which event intervals in two sequences mutually overlap. A statistical significance test for the obtained interval coincidence rates is realized by block bootstrapping event and non-event intervals, retaining the event duration and waiting time distributions of the persistent events in both sequences.

We demonstrate the practical potentials of InCA, as well as its similarities and differences with ECA, for a specific case study on atmospheric dynamics. Specifically, we apply both methods to studying the likelihood of co-occurrences between boreal summer (June to August) heatwaves in different parts of the Northern hemisphere and hemispheric anomalies of the atmospheric circulation, such as a jet stream pattern exhibiting two distinct wind bands known as double-jet. Our analysis reveals large-scale regions of markedly elevated likelihood of co-occurrences over Northern Europe, Central to Eastern Siberia, Northeastern Canada as well as the Middle East, Eastern China, the Southwestern and Northeastern United States and Northwest Africa, indicating a particular vulnerability of those regions to the presence of double-jet patterns.

How to cite: Donner, R., Diedrich, D., Praast, S., and Di Capua, G.: Quantifying statistical associations among persistent events: Interval coincidence analysis between Northern hemisphere heatwaves and different types of circulation anomalies, EGU General Assembly 2023, Vienna, Austria, 23–28 Apr 2023, EGU23-12070, https://doi.org/10.5194/egusphere-egu23-12070, 2023.

EGU23-12560 | ECS | Posters on site | NP4.1

Understanding monsoonal rainfall patterns with a complex network approach  

Guruprem Bishnoi, Reik Donner, Chandrika Thulaseedharan Dhanya, and Rakesh Khosa

The Indian summer monsoon (ISM), which accounts for the majority of India’s yearly rainfall, has a significant influence on the nation’s economy. Understanding monsoonal dynamics is a challenge because of the related small-scale processes and their spatiotemporal complexity. Nevertheless, in the past decades, complex networks have become a key mathematical tool in the analysis of complex systems like the monsoon. However, multi-scale interactions and the coupling between rainfall and atmospheric circulation have remained underrepresented in the corresponding functional network studies. In this study, we exploit coupled rainfall networks to investigate simultaneous interactions of rainfall with other atmospheric variables. Firstly, rainfall networks are investigated by considering various network measures. Secondly, a coupled network is developed based on several atmospheric variables and their point-wise correlation with rainfall fields. Furthermore, the contrasts between the rainfall network and its coupled equivalent are emphasized. By comparison, the resulting coupled network includes both horizontal and vertical interconnections of the spatially enclosed time sequences, representing both the inherent structure of a single meteorological variable and the interaction structure with rainfall fields. It is expected to help with understanding the dynamics of monsoonal rainfall. This study, therefore, demonstrates the application of a complex network approach to studying highly dynamic phenomena such as the ISM. Our results are anticipated to provide the scientific community with new insights into how the interplay of the atmospheric systems leads to the heavy rainfall episodes that take place during the ISM.


How to cite: Bishnoi, G., Donner, R., Dhanya, C. T., and Khosa, R.: Understanding monsoonal rainfall patterns with a complex network approach , EGU General Assembly 2023, Vienna, Austria, 23–28 Apr 2023, EGU23-12560, https://doi.org/10.5194/egusphere-egu23-12560, 2023.

EGU23-13601 | ECS | Posters virtual | NP4.1

Empirical Distortions in Climate Networks 

Moritz Haas, Bedartha Goswami, and Ulrike von Luxburg

Climate networks have become a popular tool for detecting complex structures in spatio-temporal data. However, they require to estimate correlation values on many edges based on limited and noisy time series. Consequently any constructed network likely contains false and missing edges. To measure how severely and in which ways estimated networks are distorted by statistical errors, we simulate time-dependent isotropic random fields on the sphere. We comprehensively present several patterns of distortion in local as well as global network characteristics and demonstrate which network construction methods enhance statistical robustness. When the data has a locally coherent correlation structure, spurious link bundle teleconnections and spurious high-degree clusters have to be expected. Anisotropic estimation variance can also induce severe biases into empirical networks. We validate all our findings with ERA5 reanalysis data. Finally, we explain why commonly applied resampling procedures  are insufficient for evaluating statistical significance of network structures, and introduce a new ensemble construction framework that aims to alleviate most of the discussed shortcomings.

How to cite: Haas, M., Goswami, B., and von Luxburg, U.: Empirical Distortions in Climate Networks, EGU General Assembly 2023, Vienna, Austria, 23–28 Apr 2023, EGU23-13601, https://doi.org/10.5194/egusphere-egu23-13601, 2023.

EGU23-14863 | Orals | NP4.1

Windowed recurrence plot approach in semiarid grasslands 

Ana M. Tarquis, Andres F. Almeida-Ñauñay, Ernesto Sanz, Juan C. Losada, and Rosa M. Benito

Being one of the essential ecosystems, grasslands represent an important ecological area for water and biodiversity conservation. In this line, remote sensing instruments are a helpful tool for assessing vegetation status. The Modified Soil-Adjusted Vegetation Index (MSAVI) time-series are used to monitor drought events and to consider the soil influence in vegetation monitoring. In this sense, Recurrence plots (RPs) techniques have been demonstrated to be one of the most capable tools to unravel the complex dynamics of the time-series analysis. This work highlights the recurrence techniques' benefits in visualising and quantifying vegetation dynamics.

We chose a study area in the centre of Spain, where the Mediterranean climate dominates. We selected the MODQ1.V006 product from the MODIS imagery collection, with a spatial resolution of 250x250m. Then, an average MSAVI time series from pixels that met predefined criteria were analysed. RPs and Cross recurrence plots (CRPs) were computed to reveal the dynamics of the time series. Furthermore, diagonal-wise profiles (DWP)  and windowed-cross recurrence plots (WCRPs) were included in the analysis at different time scales. In the end, RPs, CRPs and WCRPs are quantified through the recurrence quantification analysis (RQA).

RPs displayed different patterns depending on the studied time series. Precipitation showed a stochastic dynamic, emphasising the unstable behaviour of Mediterranean rainfalls. On the opposite, temperature revealed a diagonal-like pattern in the RP. This fact pointed out the temperature's seasonal behaviour over time. Concerning MSAVI, RP presented a mixture of both patterns.

CRPs between precipitation and MSAVI showed a delayed consequence of MSAVI to precipitation events. Contrary to precipitation, CRPs between temperature and MSAVI did not show a delayed response in the studied period. WCRPs indicated characteristic phases in the time series, revealing interactions between vegetation and climate and being different between wet and dry seasons.

RPs techniques have been demonstrated to be a valuable instrument for uncovering the complex dynamics between vegetation and climate. Therefore, they should be considered a viable alternative in the vegetation time series analysis.


Acknowledgements: The authors acknowledge the support of Clasificación de Pastizales Mediante Métodos Supervisados - SANTO from Universidad Politécnica de Madrid (project number: RP220220C024).

References

Almeida-Ñauñay, A.F., Benito, R.M., Quemada, M., Losada, J.C., Tarquis, A.M., 2022. Recurrence plots for quantifying the vegetation indices dynamics in a semiarid grassland. Geoderma 406, 115488. https://doi.org/10.1016/j.geoderma.2021.115488

Almeida-Ñauñay, A.F., Benito, R.M., Quemada, M., Losada, J.C., Tarquis, A.M., 2021. The Vegetation–Climate System Complexity through Recurrence Analysis. Entropy 23, 559. https://doi.org/10.3390/e23050559

Martín-Sotoca, J.J., Saa-Requejo, A., Moratiel, R., Dalezios, N., Faraslis, I., Tarquis, A.M., 2019. Statistical analysis for satellite-index-based insurance to define damaged pasture thresholds. Nat. Hazards Earth Syst. Sci. 19, 1685–1702. https://doi.org/10.5194/nhess-19-1685-2019

Sanz, E., Saa-Requejo, A., Díaz-Ambrona, C.H., Ruiz-Ramos, M., Rodríguez, A., Iglesias, E., Esteve, P., Soriano, B., Tarquis, A.M., 2021. Normalized Difference Vegetation Index Temporal Responses to Temperature and Precipitation in Arid Rangelands. Remote Sens. 13, 840. https://doi.org/10.3390/rs13050840

How to cite: Tarquis, A. M., Almeida-Ñauñay, A. F., Sanz, E., Losada, J. C., and Benito, R. M.: Windowed recurrence plot approach in semiarid grasslands, EGU General Assembly 2023, Vienna, Austria, 23–28 Apr 2023, EGU23-14863, https://doi.org/10.5194/egusphere-egu23-14863, 2023.

EGU23-16971 | Posters on site | NP4.1

Ocean Networks Canada: Long-term ocean observing on a Northeast Pacific cabled ocean observatory 

Richard Dewey, Martin Scherwath, Steve Milahy, Martin Heesemann, Fabio De Leo, Lanfranco Muzi, Kohen Bauer, and Kim Juniper

Long time series observations in the ocean are rare. In the Northeast Pacific, Ocean Networks Canada (ONC) of the University of Victoria operates a number of permanent cabled ocean observatories. The first was installed in 2006, and they have successfully produced many interdisciplinary high-resolution time series over the years, the longest being over 16 years in duration. The cabled observatories operated by ONC include the VENUS coastal observatory and the NEPTUNE off-shore deep-sea observatory. Each observatory has several sites where an observatory node provides continuous power and high bandwidth communications to a wide range of ocean and geophysical sensors. Various long high-resolution time series will be presented and the assessment of climate, decadal, inter-seasonal, annual, and even daily cycles, variations, and signals will be discussed. Such long time series, including environmental baselines, are key for evaluating physicochemical and biological change in the oceans in response to natural variations and climate change. In this way, recent efforts to leverage our time series data in robust monitoring, measurement, reporting, and verification (M2RV) frameworks in the context of different marine carbon dioxide removal (mCDR) approaches, will also be presented.

How to cite: Dewey, R., Scherwath, M., Milahy, S., Heesemann, M., De Leo, F., Muzi, L., Bauer, K., and Juniper, K.: Ocean Networks Canada: Long-term ocean observing on a Northeast Pacific cabled ocean observatory, EGU General Assembly 2023, Vienna, Austria, 23–28 Apr 2023, EGU23-16971, https://doi.org/10.5194/egusphere-egu23-16971, 2023.

EGU23-229 | ECS | Posters virtual | ESSI3.5

A web-based strategy to reuse grids in geographic modeling 

Yuanqing He, Min Chen, Yongning Wen, and Songshan Yue

Integrated application of geo-analysis models is critical for geo-process research. Due to the continuity of the real world, the geo-analysis model cannot be applied immediately over the entire space. To date, the method of regrading space as a sequence of computing units (i.e. grid) has been widely used in geographic study. However, the model's variances in division algorithms result in distinct grid data structures. At first, researchers must install and setup the various software to generate the structure-specific grid data required by the models. This method of localized processing is inconvenient and inefficient. Second, in order to integrate the models that use different structural grid data, researchers need to design a specific conversion method based on the integration scenario. Due to difference of researcher’s development habits, it is difficult to reuse the conversion method in another runtime environment. The open and cross-platform character of web services enables users to generate data without the assistance of software programs. It has the potential to revolutionize the present time-consuming process of grid generation and conversion, hence increasing efficiency.

Based on the standardized model encapsulation technology proposed by OpenGMS group, this paper presents a grid-service method tailored to the specific requirements of open geographic model integration applications, and the research work is carried out in the following three areas:

  • The basic strategy of grid servitization. The heterogeneity of the grid generation method is a major factor that prevents it from being invoked via a unified way by web services. To reduce the heterogeneous of the grid generation method, this study proposes a standardized description method based on the Model Description Language (MDL).
  • Method for constructing a grid data generating service. A unified representation approach for grid data is proposed in order to standardize the description of heterogeneous grid data; an encapsulation method for grid generating algorithms is proposed; and grid-service is realized by merging the main idea of grid servitization.
  • Method for constructing a grid data conversion service . A box-type grid indexing approach is provided to facilitate the retrieval of grid cells with a large data volume; two conversion types, topologically similar and topologically inaccessible grid data conversion, are summarized, along with the related conversion procedures. On this foundation, a grid conversion engine is built using the grid service-based strategy as a theoretical guide and integrated with the grid conversion strategy.

Based on the grid service approach proposed in this paper, researchers can generate and converse grid data without tedious steps for downloading and installing programs. Thus, there are more time spend on geography problem solving, hence increasing efficiency.

How to cite: He, Y., Chen, M., Wen, Y., and Yue, S.: A web-based strategy to reuse grids in geographic modeling, EGU General Assembly 2023, Vienna, Austria, 23–28 Apr 2023, EGU23-229, https://doi.org/10.5194/egusphere-egu23-229, 2023.

EGU23-2744 | Orals | ESSI3.5

Provenance powered microservices: a flexible and generic approach fostering reproducible research in Earth Science 

Alessandro Spinuso, Ian van der Neut, Mats Veldhuizen, Christian Pagé, and Daniele Bailo

Scientific progress requires research outputs to be reproducible, or at least persistently traceable and analysable for defects through time. This can be facilitated by coupling analysis tools that are already familiar to scientists, with reproducibility controls designed around common containerisation technologies and formats to represent metadata and provenance. Moreover, modern interactive tools for data analysis and visualisation, such as computational notebooks and visual analytics systems, are built to expose their functionalities through the Web. This facilitates the development of integrated solutions that are designed to support computational research with reproducibility in mind, and that, once deployed onto a Cloud infrastructure, benefit from operations that are securely managed and perform reliably. Such systems should be able to easily accommodate specific requirements concerning, for instance, the deployment of particular scientific software and the collection of tailored, yet comprehensive, provenance recordings about data and processes. By decoupling and generalising the description of the environment where a particular research took place from the underlying implementation, which may become obsolete through time, we obtain better chances to recollect relevant information for the retrospective analysis of a scientific product in the long term, enhancing preservation and reproducibility of results.

In this contribution we illustrate how this is achievable via the adoption of microservice architectures combined with a provenance model that supports metadata standards and templating. We aim at empowering scientific data portals with Virtual Research Environments (VREs) and provenance services, that are programmatically controlled via high-level functions over the internet. Our system SWIRRL deals, on behalf of the clients, with the complexity of allocating the interactive services for the VREs on a Cloud platform. It runs staging and preprocessing workflows to gather and organise remote datasets, making them accessible collaboratively. We show how Provenance Services manage provenance records about the underlying environment, datasets and analysis workflows, and how these are exploited by researchers to control different reproducibility use cases. Our solutions are currently being implemented in more contexts in Earth Science. We will provide an overview on the progress of these efforts for the EPOS and IS-ENES research infrastructures, addressing solid earth and climate studies, respectively.

Finally, although the reproducibility challenges can be tackled to a large extent by modern technology, this will be further consolidated and made interoperable via the implementation and uptake of the FDOs. To achieve this goal, it is fundamental to establish the conversation between engineers, data-stewards and researchers early in the process of delivering a scientific product. This fosters the definition and implementation of suitable best practices to be adopted by a particular research group. Scientific tools and repositories built around modern FAIR enabling resources can be incrementally refined thanks to this mediated exchange. We will briefly introduce success stories towards this goal in the context of the IPCC Assessment Reports.

How to cite: Spinuso, A., van der Neut, I., Veldhuizen, M., Pagé, C., and Bailo, D.: Provenance powered microservices: a flexible and generic approach fostering reproducible research in Earth Science, EGU General Assembly 2023, Vienna, Austria, 23–28 Apr 2023, EGU23-2744, https://doi.org/10.5194/egusphere-egu23-2744, 2023.

The AuScope 3D Geomodels Portal is a website designed to display a variety of geological models and associated datasets and information from all over the Australian continent. The models are imported from publicly available sources, namely Australian government geological surveys and research organisations. Often the models come in the form of downloadable file packages designed to be viewed in specialised geological software applications. They usually contain enough information to view the model’s structural geometry, datasets and a minimal amount of geological textual information. Seldom do they contain substantial metadata, often they were created before the term ‘FAIR’ was coined or the importance of metadata had dawned upon many of us. This creates challenges for data providers and aggregators trying to maintain a certain standard of FAIR compliance across all their offerings. How to improve the standard of FAIR compliance of metadata extracted from these models? How to integrate these models into existing metadata infrastructure? For the Geomodels portal, these concerns are alleviated within the automated model transformation software. This software transforms the source file packages into a format suitable for display in a modern WebGL compliant browser. Owing to the nature of the model source files only a very modest amount of metadata can be extracted. Hence other sources of metadata must be introduced. For example, often the dataset provider will publish a downloadable PDF report file or a description on a web page associated with the model. Automated textual analysis is used to extract more information from these sources. At the end of the transformation process, an ISO-compliant metadata record is created for importing into a geonetwork catalogue. The geonetwork catalogue record can be used for integration with other applications. For example, AuScope’s flagship portal, the AuScope Portal displays information, download links and a geospatial footprint of models on a map. The metadata can also be displayed in the Geomodels Portal.

How to cite: Fazio, V.: How AuScope 3D Geomodels Portal integrates relatively metadata poor geological models into its metadata infrastructure, EGU General Assembly 2023, Vienna, Austria, 23–28 Apr 2023, EGU23-3006, https://doi.org/10.5194/egusphere-egu23-3006, 2023.

EGU23-3711 | Orals | ESSI3.5

Lessons in FAIR software from the Community Surface Dynamics Modeling System 

Gregory Tucker, Albert Kettner, Eric Hutton, Mark Piper, Tian Gan, Benjamin Campforts, Irina Overeem, and Matthew Rossi

The Community Surface Dynamics Modeling System (CSDMS) is a US-based science facility that supports computational modeling of diverse Earth and planetary surface processes, ranging from natural hazards and contemporary environmental change to geologic applications. The facility promotes open, interoperable, and shared software. Here we review approaches and lessons learned in advancing FAIR principles for geoscience modeling. To promote sharing and accessibility, CSDMS maintains an online Model Repository that catalogs over 400 shared codes, ranging from individual subroutines to large and sophisticated integrated models. Thanks to semi-automated search tools, the Repository now includes ~20,000 references to literature describing these models and their applications, giving prospective model users efficient access to information about how various codes have been developed and used. To promote interoperability, CSDMS develops and promotes the Basic Model Interface (BMI): a lightweight, language-agnostic API standard that provides control, query, and data-modification functions. BMI has been adopted by a number of academic, government, and quasi-private institutions for coupled-modeling applications. BMI specifications are provided for common scientific languages, including as Python, C, C++, Fortran, and Java. One challenge lies in broader awareness and adoption; for example, self-taught code developers may be unaware of the concept of an API standard, or may not perceive value in designing around such a standard. One way to address this challenge is to provide open-source programming libraries. One such library that CSDMS curates is Landlab Toolkit: a Python package that includes building blocks for model development (such as grid data structures and I/O functions) while also providing a framework for assembling integrated models from component parts. We find that Landlab can greatly speed model development, while giving user-developers an incentive to follow common patters and contribute new components to the library. However, libraries by themselves do not solve the reproducibility challenge. Rather than reinventing the wheel, the CSDMS facility has approached reproducibility by partnering with the Whole Tale initiative, which provides tools and protocols to create reproducible archives of computational research. Finally, we have found that a central challenge to FAIR modeling lies in the level of community knowledge. FAIR is a two-way street that depends in part on the technical skills of the user. Are they fluent in a particular programming language? How familiar are they with the numerical methods used by a given model? How familiar are they with underlying scientific concepts and simplifying assumptions? Are they conversant with modern version control and collaborative-development technology and practices? Although scientists should not need to become software engineers, in our experience there is a basic level of knowledge that can substantially raise the quality and sustainability of research software. To address this, CSDMS offers training programs, self-paced learning materials, and online help resources for community members. The vision is to foster a thriving community of practice in computational geoscience research, equipped with ever-improving modeling tools written by and for the community as a whole.

How to cite: Tucker, G., Kettner, A., Hutton, E., Piper, M., Gan, T., Campforts, B., Overeem, I., and Rossi, M.: Lessons in FAIR software from the Community Surface Dynamics Modeling System, EGU General Assembly 2023, Vienna, Austria, 23–28 Apr 2023, EGU23-3711, https://doi.org/10.5194/egusphere-egu23-3711, 2023.

This is a report from the chapter editor's perspective of a high visibility publication effort to foster the adoption of the FAIR principles (Findable, Accessible, Interoperable, Reusable) by encouraging the adoption of Persistent Identifiers (PID) and repository-based workflows in geospatial open source software communities as good practices. Lessons learned are detailed about how to communicate the benefits of PID adoption to software project communities focussing on professional software-development and meritocracy. Also encountered communication bottleneck patterns, the significance of cross-project  multiplicators, remaining challenges and emerging opportunities for publishers and repository infrastructures are reported. For the second Edition of the Springer Handbook of Geographic Information, a team of scientific domain experts from several software communities was tasked to rewrite a chapter about Open Source Geographic Information Systems (DOI: 10.1007/978-3-030-53125-6_30). For this, a sample of representative geospatial open source projects was selected, based on the range of projects integrated in the OSGeo live umbrella project (DOI: 10.5281/zenodo.5884859). The chapters authors worked in close contact with the respective Open Source software project communities. Since the editing and production process for the Handbook of Geographic Information was delayed due to the pandemic, this provided the opportunity to explore, improve and implement good practices for state of the art PID-based citation of software projects and versions, but also project communities, data and related scientific video ressources. This was a learning process for all stakeholders involved in the publication project. At the completion of the project, the majority of the involved software projects had minted Digital Object Identifiers (DOI) for their codebases. While the adoption level of software versioning with automated PID-generation and metadata quality remains heterogeneous, the insights gained from this process can simplify and accelerate the adoption of PID-based best software community practices for other open geospatial projects according to the FAIR principles.

How to cite: Löwe, P.: Going FAIR by the book: Accelerating the adoption of PID-enabled good practices in software communities through reference publication., EGU General Assembly 2023, Vienna, Austria, 23–28 Apr 2023, EGU23-4354, https://doi.org/10.5194/egusphere-egu23-4354, 2023.

EGU23-4525 | ECS | Posters on site | ESSI3.5

GCIMS – Integration: Reproducible, robust, and scalable workflows for interoperable human-Earth system modeling 

Zarrar Khan, Chris Vernon, Isaac Thompson, and Pralit Patel

The number of models, as well as data inputs and outputs, are continuously growing as scientists continue to push the boundaries of spatial, temporal, and sectoral details being captured. This study presents the framework being developed to manage the Global Change Intersectoral Modeling System (GCIMS) eco-system of human-Earth system models. We discuss the challenges of ensuring continuous deployment and integration, reproducibility, interoperability, containerization, and data management for the growing suite of GCIMS models. We investigate the challenges of model version control and interoperability between models using different software, operating on different temporal and spatial scales, and focusing on different sectors. We also discuss managing transparency and accessibility to models and their corresponding data products throughout our integrated modeling lifecycle.

How to cite: Khan, Z., Vernon, C., Thompson, I., and Patel, P.: GCIMS – Integration: Reproducible, robust, and scalable workflows for interoperable human-Earth system modeling, EGU General Assembly 2023, Vienna, Austria, 23–28 Apr 2023, EGU23-4525, https://doi.org/10.5194/egusphere-egu23-4525, 2023.

EGU23-4939 * | Orals | ESSI3.5 | Highlight

Open Science: How Open is Open? 

Shelley Stall and Kristina Vrouwenvelder

Open science is transformative, removing barriers to sharing science and increasing reproducibility and transparency. The benefits of open science are maximized when its principles are incorporated throughout the research process, through working collaboratively with community members and sharing data, software, workflows, samples, and other aspects of scientific research openly where it can be reused, distributed, and reproduced. However, the paths toward Open Science are not always apparent, and there are many concepts, approaches, tools to learn along the way.  

Open Science practices are along a continuum where researchers can make incremental adjustments to their research practices that may seem small but can have valuable benefits. Here we will share the first steps in a researcher’s open science journey and how to lead your own research team in adopting Open Science practices.

How to cite: Stall, S. and Vrouwenvelder, K.: Open Science: How Open is Open?, EGU General Assembly 2023, Vienna, Austria, 23–28 Apr 2023, EGU23-4939, https://doi.org/10.5194/egusphere-egu23-4939, 2023.

EGU23-6375 | Posters on site | ESSI3.5

A machine-actionable workflow for the publication of climate impact data of the ISIMIP project 

Jochen Klar and Matthias Mengel

The Inter-Sectoral Impact Model Intercomparison Project (ISIMIP) is a community-driven climate impact modeling initiative that aims to contribute to a quantitative and cross-sectoral synthesis of the various impacts of climate change, including associated uncertainties. ISIMIP is organized into simulation rounds for which a simulation protocol defines a set of common scenarios. Participating modeling groups run their simulations according to these scenarios and with a common set of climatic and socioeconomic input data. The model output data are collected by the ISIMIP team at the Potsdam Institute for Climate Impact Research (PIK) and made publicly available in the ISIMIP repository. Currently the ISIMIP Repository at data.isimip.org includes data from over 150 impact models spanning across 13 different sectors. It comprises of over 100 Tb of data.

As the world's largest data archive of model-based climate impact data, ISIMIP output data is used by a very diverse audience inside and outside of academia, for all kind of research and analyses. Special care is taken to enable persistent identification, provenience, and citablity. A set of workflows and tools ensure the conformity of the model output data with the protocol and the transparent management of caveats and updates to already published data. Datasets are referenced using unique internal IDs and hash values are stored for each file in the database.

In recent years, this process has been significantly improved by introducing a machine-readable protocol, which is version controlled on GitHub and can be accessed over the internet. A set of software tools for quality control and data publication accesses this protocol to enforce a consistent data quality and to extract metadata. Some of the tools can be used independently by the modelling groups even before submitting the data. After the data is published on the ISIMIP Repository, it can be accessed via web or using an API (e.g. for access from Jupyter notebooks) using the same controlled vocabularies from the protocol. In order to make the data citable, DOI for each output sector are registered with DataCite. For each DOI, a precise list of each contained dataset is maintained. If data for a sector is added or replaced, a new, updated DOI is created.

While the specific implementation is highly optimized to the peculiarities of ISIMIP, the general ideas should be transferable to other projects. In our presentation, we will discuss the various tools and how they interact to create an integrated curation and publishing workflow.

How to cite: Klar, J. and Mengel, M.: A machine-actionable workflow for the publication of climate impact data of the ISIMIP project, EGU General Assembly 2023, Vienna, Austria, 23–28 Apr 2023, EGU23-6375, https://doi.org/10.5194/egusphere-egu23-6375, 2023.

EGU23-6726 | ECS | Posters on site | ESSI3.5

Data compilations for enriched reuse of sea ice data sets 

Anna Simson, Anil Yildiz, and Julia Kowalski

A vast amount of in situ cryospheric data has been collected during publicly funded field campaigns to the polar regions over the past decades. Each individual data set yields important insights into local thermo-physical processes, but they need to be assembled into informative data compilations to unlock their full potential to produce regional or global outcomes for climate change related research. The efficient and sustainable interdisciplinary reuse of such data compilations is of large interest to the scientific community. Yet, the creation of such compilations is often challenging as they have to be composed of often heterogeneous data sets from various data repositories. We will focus on the reuse of data sets in this contribution, while generating extendible data compilations with enhanced reusability.

Data reuse is typically conducted by researchers other than the original data producers, and it is therefore often limited by the metadata and provenance information available. Reuse scenarios include the validation of physics-based process models, the training of data-driven models, or data-integrated predictive simulations. All these use cases heavily rely on a diverse data foundation in form of a data compilation, which depends on high quality information. In addition to metadata, provenance, and licensing conditions, the data set itself must be checked for reusability. Individual data sets containing the same metrics often differ in structure, content, and metadata, which challenges data compilation.

In order to generate data compilations for a specific reuse scenario, we propose to break down the workflow into four steps:
1) Search and selection: Searching, assessing, optimizing search, and selecting data sets.
2) Validation: Understanding and representing data sets in terms of the data collectors including structure, terms used, metadata, and relations between different metrics or data sets.
3) Specification: Defining the format, structure, and content of the data compilation based on the scope of the data sets.
4) Implementation: Integrating the selected data sets into the compilation.

We present a workflow herein to create a data compilation from heterogeneous sea ice core data sets following the previously introduced structure. We report on obstacles encountered in the validation of data sets mainly due to missing or ambiguous metadata. This leaves the (re)user space for subjective interpretation and thus increases uncertainty of the compilation. Examples are challenges in relating different data repositories associated with the same location or the same campaign, the accuracy of measurement methods, and the processing stage of the data. All of which often require a bilateral iteration with the data acquisition team. Our study shows that enriching data reusability with data compilations requires quality-ensured metadata on the individual data set level.

How to cite: Simson, A., Yildiz, A., and Kowalski, J.: Data compilations for enriched reuse of sea ice data sets, EGU General Assembly 2023, Vienna, Austria, 23–28 Apr 2023, EGU23-6726, https://doi.org/10.5194/egusphere-egu23-6726, 2023.

EGU23-7417 | ECS | Posters on site | ESSI3.5 | Highlight

Data-integrated executable publications for reproducible geohazards research 

Anil Yildiz and Julia Kowalski

Investigating the mechanics of physical processes involved in various geohazards, e.g. gravitational, flow-like mass movements, shallow landslides or flash floods, predicting their temporal or spatial occurrence, and analysing the associated risks clearly benefit from advanced computational process-based or data-driven models. Reproducibility is needed not only for the integrity of the scientific results, but also as a trustbuilding element in practical geohazards engineering. Various complex numerical models or pre-trained machine learning algorithms exist in the literature, for example, to determine landslide susceptibility in a region or to predict the run-out of torrential flows in a catchment. These use FAIR datasets with increasing frequency, for example DEM data to set up the simulation, or open access landslide databases for training and validation purposes. However, we maintain that workflow reproducibility is not ensured simply due to the FAIRness of input or output datasets. Underlying computational or machine learning model needs to be (re)structured to enable the reproducibility and replicability of every step in the workflow so that a model can be (re)built to either reproduce the same results, or can be (re)used to elaborate on new cases or new applications. We propose a data-integrated, platform-independent scientific model publication approach combining self-developed Python packages, Jupyter notebooks, version controlling, FAIR data repositories and high-quality metadata. Model development in the form of a Python package guarantees that model can be run by any end-user, and defining submodules of analysis or visualisation within the package helps the users to build their own models upon the model presented. Publishing the manuscript as a data- and model-integrated Jupyter notebook creates a transparent application of the model, and the user can reproduce any result either presented in the manuscript or in the datasets. We demonstrate our workflow with two applications from geohazards research herein while highlighting the shortcomings of the existing frameworks and suggesting improvements for future applications.

How to cite: Yildiz, A. and Kowalski, J.: Data-integrated executable publications for reproducible geohazards research, EGU General Assembly 2023, Vienna, Austria, 23–28 Apr 2023, EGU23-7417, https://doi.org/10.5194/egusphere-egu23-7417, 2023.

EGU23-7427 | Posters on site | ESSI3.5

Integrating sample management and semantic research-data management in glaciology 

Florian Spreckelsen, Henrik tom Wörden, Daniel Hornung, Timm Fitschen, Alexander Schlemmer, and Johannes Freitag

The flexible open-source research data management toolkit CaosDB is used in a diversity of fields such as turbulence physics, legal research, maritime research and glaciology. It is used to link research data and make it findable and retrievable and to keep it consistent, even if the data model changes.

CaosDB is used in the glaciology department at the Alfred Wegener Institute in Bremerhaven for the management of ice core samples and related measurements and analyses. Researchers can use the system to query for ice samples linked to, e.g., specific measurements for which they then can request to borrow for further analyses. This facilitates inter-laboratory collaborative research on the same samples. The system helped to solve a number of needs for the researchers, such as: A revision system which intrinsically keeps track of changes to the data and in which state samples were, when certain analyses were performed. Automated gathering of information for the publication in a meta-data repository (Pangaea). Tools for storing, displaying and  querying geospatial information and graphical summaries of all the measurements and analyses performed on an ice core. Automatic data extraction and refinement into data records in CaosDB so that users do not need to enter the data manually. A state machine which guarantees certain workflows, simplifies development and can be extended to trigger additional actions upon transitions.

We demonstrate how CaosDB enables researchers to create and work with semantic data objects. We further show how CaosDB's semantic data structure enables researchers to publish their data as FAIR Digital Objects.

How to cite: Spreckelsen, F., tom Wörden, H., Hornung, D., Fitschen, T., Schlemmer, A., and Freitag, J.: Integrating sample management and semantic research-data management in glaciology, EGU General Assembly 2023, Vienna, Austria, 23–28 Apr 2023, EGU23-7427, https://doi.org/10.5194/egusphere-egu23-7427, 2023.

EGU23-7532 | Posters on site | ESSI3.5

Virtual Earth Cloud: a multi-cloud framework for improving replicability of scientific models 

Mattia Santoro, Paolo Mazzetti, and Stefano Nativi

Humankind is facing unprecedented global environmental and social challenges in terms of food, water and energy security, resilience to natural hazards, etc. To address these challenges, international organizations have defined a list of policy actions to be achieved in a relatively short and medium-term timespan (e.g., the UN SDGs). The development and use of knowledge platforms is key in helping the decision-making process to take significant decisions and avoid potentially negative impacts on society and the environment.

Scientific models are key tools to transform into information and knowledge the huge amount of data currently available online. Executing a scientific model (implemented as an analytical software) commonly requires the discovery and use of different types of digital resources (i.e. data, services, and infrastructural resources). In the present geoscience technological landscape, these resources are generally provided by different systems (working independently from one another) by utilizing Web technologies (e.g. Internet APIs, Web Services, etc.). In addition, a given scientific model is often designed and developed for execution in a specific computing environment. These are important barriers to enable reproducibility, replicability, and reusability of scientific models –becoming key interoperability requirements for a transparent decision-making process.

This presentation introduces the Virtual Earth Cloud concept, a multi-cloud framework for the generation of information/knowledge from Big Earth Data analytics. The Virtual Earth Cloud allows the execution of computational models to process and extract knowledge from Big Earth Data, in a multi-cloud environment, and thus improving their reproducibility, replicability and reusability.

The development and prototyping of the Virtual Earth Cloud is carried out in the context of the GEOSS Platform Plus (GPP) project, funded by the European Union’s Horizon 2020 Framework Programme, aims to contribute to the implementation of the Global Earth Observation System of Systems (GEOSS) by evolving the European GEOSS Platform components to allow access to tailor-made information and actionable knowledge.

How to cite: Santoro, M., Mazzetti, P., and Nativi, S.: Virtual Earth Cloud: a multi-cloud framework for improving replicability of scientific models, EGU General Assembly 2023, Vienna, Austria, 23–28 Apr 2023, EGU23-7532, https://doi.org/10.5194/egusphere-egu23-7532, 2023.

EGU23-8321 | Orals | ESSI3.5

Facilitating provenance documentation with a model-driven-engineering approach. 

Lucy Bastin, Owen Reynolds, Antonio Garcia-Dominguez, and James Sprinks

Evaluating the quality of data is a major concern within the scientific community: before using any dataset for study, a careful judgement of its suitability must be conducted. This requires that the steps followed to acquire, select, and process the data have been thoroughly documented in a methodical manner, in a way that can be clearly communicated to the rest of the community. This is particularly important in the field of citizen science, where a project that can clearly demonstrate its protocols, transformation steps, and quality assurance procedures have much more chance of achieving social and scientific impact through the use and re-use of its data.

A number of specifications have been created to provide a common set of concepts and terminology, such as ISO 19115-3 or W3C PROV. These define a set of interchange formats, but in themselves, they do not provide tooling to create high-quality dataset descriptions. The existing tools built on these standards (e.g. GeoNetwork, USGS metadata wizard, CKAN) are overly complex for some users (for example, many citizen science project managers) who, despite being experts in their own fields, may be unfamiliar with the structure and context of metadata standards or with semantic modelling. 

In this presentation, we will describe a prototype authoring tool that was created using a Model-driven engineering (MDE) software development methodology. The tool was authored using JetBrains Meta Programming System (MPS) to implement a modelling language based on the ISO19115-3 model. A user is provided with a “text-like” editing environment, which assists with the formal structures needed to produce a machine-parable document.

This allows a user to easily describe data lineage and generic processing steps while reusing recognised external vocabularies with automated validation, autocompletion, and transformation to external formats (e.g. the XML format 19115-3 or JSON-LD). We will report on the results of user testing aimed at making the tool accessible to citizen scientists (through dedicated projections with simplified structures and dialogue-driven model creation) and evaluating with those users any new possibilities that comprehensive and machine-parsable provenance information may create for data integration and sharing. The prototype will also serve as a test pilot of the integration between ISO 19115-3 and existing/upcoming third-party vocabularies (such as the upcoming ISO data quality measures registry).

How to cite: Bastin, L., Reynolds, O., Garcia-Dominguez, A., and Sprinks, J.: Facilitating provenance documentation with a model-driven-engineering approach., EGU General Assembly 2023, Vienna, Austria, 23–28 Apr 2023, EGU23-8321, https://doi.org/10.5194/egusphere-egu23-8321, 2023.

EGU23-8526 | ECS | Orals | ESSI3.5

openEO Platform – showcasing a federated, accessible platform for reproducible large-scale Earth Observation analysis 

Benjamin Schumacher, Patrick Griffiths, Edzer Pebesma, Jeroen Dries, Alexander Jacob, Daniel Thiex, Matthias Mohr, and Christian Briese

openEO Platform holds a large amount of free and open as well as commercial Earth Observation (EO) data which can be accessed and analysed with openEO, an open API that enables cloud computing and EO data access in a unified and reproducible way. Additionally, client libraries are available in R, Python and Javascript. A JupterLab environment and the Web Editor, a graphical interface, allow a direct and interactive development of processing workflows. The platform is developed with a strong user focus and various use cases have been implemented to illustrate the platform capabilities. Currently, three federated backends support the analysis of EO data from pixel to continental scale.  

The use cases implemented during the platform’s main development phase include a dynamic landcover mapping, an on-demand analysis-ready-data creation for Sentinel-1 GRD, Sentinel-2 MSI and Landsat data, time series-based forest dynamics analysis with prediction functionalities, feature engineering for crop type mapping and large-scale fractional canopy mapping. Additionally, three new use cases are being developed by platform users. These include large scale vessel detection based on Sentinel-1 and Sentinel-2 data, surface water indicators using the ESA World Water toolbox for a user-defined area of interest and monitoring of air quality parameters using Sentinel-5P data. 

The future evolution of openEO Platform in terms of data availability and processing capabilities closely linked to community requirements, facilitated by feature requests from users who design their workflows for environmental monitoring and reproducible research purposes. This presentation provides an overview of the completed use cases, the newly added functionalities such as user code sharing, and user interface updates based on the new use cases and user requests. openEO Platform exemplifies how the processing and analysing large amounts of EO data to meaningful information products is becoming easier and largely compliant with FAIR data principles supporting the EO community at large. 

How to cite: Schumacher, B., Griffiths, P., Pebesma, E., Dries, J., Jacob, A., Thiex, D., Mohr, M., and Briese, C.: openEO Platform – showcasing a federated, accessible platform for reproducible large-scale Earth Observation analysis, EGU General Assembly 2023, Vienna, Austria, 23–28 Apr 2023, EGU23-8526, https://doi.org/10.5194/egusphere-egu23-8526, 2023.

EGU23-9852 | Posters on site | ESSI3.5

Proposal of a simple procedure to derive a more FAIR open data archive than a spreadsheet or a set of CSV files 

Filippo Giadrossich, Ilenia Murgia, and Roberto Scotti

NuoroForestrySchool (a study center of the Department of Agriculture, University of Sassari, Italy) has developed and published a ‘data documentation procedure’ (link to NFS-DDP) enabling the improvement of the dataset FAIRness that any data collector wishes to share as open data. Datasets are frequently shared as spreadsheet files. While this tool is very handy in data preparation and preliminary analysis, its structure and composition are not very effective for storing and sharing consolidated data, unless data structures are extremely simple. NFS-DDP takes in input a spreadsheet in which data are organized as relational tables, one per sheet, while four additional sheets contain metadata standardized according to the Dublin Core specifications. The procedure outputs an SQLite relational database (including data and metadata) and a pdf-file documenting the database structure and contents. A first example application of the proposed procedure was shared by Giadrossich et al. (2022) on the PANGEA repository, concerning experimental data of erosion in forest soil measured during artificial rainfall. The zip-archive that can be downloaded contains the experiment data and metadata processed by NFS-DDP. At the following link is available a test document where basic statistics are computed to show how NFS-DDProcedure facilitates the understanding and correct processing of the shared dataset. 

The NFS-DataDocumentationProcedure provides a simple solution for organizing and archiving data aiming to i) achieve a more FAIR archive, ii) exploit data consistency and comprehensibility of semantic connections in the relational database, ii) produce a report documenting the collection and organization of data, providing an effective and concise overview of the whole with all details at hand.

Giadrossich, F., Murgia, I., Scotti, R. (2022). Experiment of water runoff and soil erosion with and without forest canopy coverage under intense artificial rainfall. PANGAEA. DOI:10.1594/PANGAEA.943451


How to cite: Giadrossich, F., Murgia, I., and Scotti, R.: Proposal of a simple procedure to derive a more FAIR open data archive than a spreadsheet or a set of CSV files, EGU General Assembly 2023, Vienna, Austria, 23–28 Apr 2023, EGU23-9852, https://doi.org/10.5194/egusphere-egu23-9852, 2023.

EGU23-12443 | Posters on site | ESSI3.5 | Highlight

Landlab: a modeling platform that promotes the building of FAIR research software 

Eric Hutton and Gregory Tucker

Landlab is an open-source Python package designed to facilitate creating, combining, and reusing 2D numerical models. As a core component of the Community Surface Dynamics Modeling System (CSDMS) Workbench, Landlab can be used to build and couple models from a wide range of domains. We present how Landlab provides a platform that fosters a community of model developers and aids them in creating sustainable and FAIR (Findable, Accessible, Interoperable, Reusable) research software.

Landlab’s core functionality can be split into two main categories: infrastructural tools and community-contributed components. Infrastructural tools address the common needs of building new models (e.g. a gridding engine, and numerical utilities for common tasks). Landlab’s library of community-contributed components consists of several dozen components that each model a separate physical process (e.g. routing of shallow water flow across a landscape, calculating groundwater flow, or biologic evolution over a landscape). As these user-contributed components are incorporated into Landlab, they are able to attach to the Landlab infrastructure so that they also become both findable and accessible (through, for example, standardized metadata and versioning) and are maintained by the core Landlab developers.

One key aspect of Landlab’s design is its use of a standard programming interface for all components. This ensures that all Landlab components are interoperable with one another and with other software tools, allowing researchers to incorporate Landlab's components into their own workflows and analyses. By separating processes into individual components, they become reusable and allow researchers to combine components in new ways without having to write new components from scratch.

Overall, Landlab's design and development practices support the principles of FAIR research software, promoting the ability for scientific research to be easily shared and built upon. This design also provides a platform onto which model developers are able to attach their model components and take advantage of Landlab’s development practices and infrastructure and ensure their components also follow FAIR principles.

How to cite: Hutton, E. and Tucker, G.: Landlab: a modeling platform that promotes the building of FAIR research software, EGU General Assembly 2023, Vienna, Austria, 23–28 Apr 2023, EGU23-12443, https://doi.org/10.5194/egusphere-egu23-12443, 2023.

EGU23-12864 | Orals | ESSI3.5 | Highlight

Who Done It? Reproducibility of Data Products Also Requires Lineage to Determine Impact and Give Credit Where Credit is Due. 

Lesley Wyborn, Nigel Rees, Jens Klump, Ben Evans, Rebecca Farrington, and Tim Rawling

Reproducible research necessitates full transparency and integrity in data collection (e.g. from observations) or generation of data, and further data processing and analysis to generate research products. However, Earth and environmental science data are growing in complexity, volume and variety and today, particularly for large-volume Earth observation and geophysics datasets, achieving this transparency is not easy. It is rare for a published data product to be created in a single processing event by a single author or individual research group. Modern research data processing pipelines/workflows can have quite complex lineages, and it is more likely that an individual research product is generated through multiple levels of processing, starting from raw instrument data at full resolution (L0) followed by successive levels of processing (L1-L4), which progressively convert raw instrument data into more useful parameters and formats. Each individual level of processing can be undertaken by different research groups using a variety of funding sources: rarely are those involved in the early stages of processing/funding properly cited.

The lower levels of processing are where observational data essentially remains at full resolution and is calibrated, georeferenced and processed to sensor units (L1) and then geophysical variables are derived (L2). Historically, particularly where the volumes of the L0-L2 datasets are measured in Terabytes to Petabytes, processing could only be undertaken by a minority of specialised scientific research groups and data providers, as few had the expertise/resources/infrastructures to process them on-premise. Wider availability of colocated data assets and HPC/cloud processing means that the full resolution, less processed forms of observational data can now be processed remotely in realistic timeframes by multiple researchers to their specific processing requirements, and also enables greater exploration of parameter space allowing multiple values for the same inputs to be trialled. The advantage is that better-targeted research products can now be rapidly produced. However, the downside is that far greater care needs to be taken to ensure that there is sufficient machine-readable metadata and provenance information to enable any user to determine what processing steps and input parameters were used in each part of the lineage of any released dataset/data product, as well as be able to reference exactly who undertook any part of the acquisition/processing and identify sources of funding (including instruments/field campaigns that collected the data).

The use of Persistent Identifiers (PIDs) for any component objects (observational data, synthetic data, software, model inputs, people, instruments, grants, organisations, etc.) will be critical. Global and interdisciplinary research teams of the future will be reliant on software engineers to develop community-driven software environments that aid and enhance the transparency and reproducibility of their scientific workflows and ensure recogniton. The advantage of the PID approach is that not only will reproducibility and transparency be enhanced, but through the use of Knowledge Graphs it will also be possible to trace the input of any researcher at any level of processing, whilst funders will be able to determine the impact of each stage from the raw data capture through to any derivative high-level data product. 


How to cite: Wyborn, L., Rees, N., Klump, J., Evans, B., Farrington, R., and Rawling, T.: Who Done It? Reproducibility of Data Products Also Requires Lineage to Determine Impact and Give Credit Where Credit is Due., EGU General Assembly 2023, Vienna, Austria, 23–28 Apr 2023, EGU23-12864, https://doi.org/10.5194/egusphere-egu23-12864, 2023.

EGU23-12971 | Posters on site | ESSI3.5

Reproducible quality control of time series data with SaQC 

David Schäfer, Bert Palm, Peter Lünenschloß, Lennart Schmidt, and Jan Bumberger

Environmental sensor networks produce ever-growing volumes of time series data with great potential to broaden the understanding of complex spatiotemporal environmental processes. However, this growth also imposes its own set of new challenges. Especially the error-prone nature of sensor data acquisition is likely to introduce disturbances and anomalies into the actual environmental signal. Most applications of such data, whether it is used in data analysis, as input to numerical models or modern data science approaches, usually rely on data that complies with some definition of quality.

To move towards high-standard data products, a thorough assessment of a dataset's quality, i.e., its quality control, is of crucial importance. A common approach when working with time series data is the annotation of single observations with a quality label to transport information like its reliability. Downstream users and applications are hence able to make informed decisions, whether a dataset in its whole or at least parts of it are appropriate
for the intended use.

Unfortunately, quality control of time series data is a non-trivial, time-consuming, scientifically undervalued endeavor and is often neglected or executed with insufficient rigor. The presented software, the System for automated Quality Control (SaQC), provides all basic and many advanced building blocks to bridge the gap between data that is usually faulty but expected to be correct in an accessible, consistent, objective and reproducible way. Its user interfaces address different audiences ranging from the scientific practitioner with little access to the possibilities of modern software development to the trained programmer. SaQC delivers a growing set of generic algorithms to detect a multitude of anomalies and to process data using resampling, aggregation, and data modeling techniques. However, one defining component of SaQC is its innovative approach to storing runtime process information. In combination with a flexible quality annotation mechanism, SaQC allows to extend quality labels with fine-grained provenance information appropriate to fully reproduce the system's output.

SaQC is proving its usefulness on a daily basis in a range of fully automated data flows for large environmental observatories. We highlight use cases from the TERENO Network, showcasing how reproducible automated quality control can be implemented into real-world, large-scale data processing workflows to provide environmental sensor data in near real-time to data users, stakeholders and decision-makers.


How to cite: Schäfer, D., Palm, B., Lünenschloß, P., Schmidt, L., and Bumberger, J.: Reproducible quality control of time series data with SaQC, EGU General Assembly 2023, Vienna, Austria, 23–28 Apr 2023, EGU23-12971, https://doi.org/10.5194/egusphere-egu23-12971, 2023.

EGU23-13108 | Orals | ESSI3.5 | Highlight

The reality of implementing FAIR principles in the IPCC context to support open science and provide a citable platform to acknowledge the work of authors. 

Charlotte Pascoe, Lina Sitz, Diego Cammarano, Anna Pirani, Martina Stockhause, Molly MacRae, and Emily Anderson

A new paradigm for Intergovernmental Panel on Climate Change (IPCC) Working Group I (WGI) data publication has been implemented.  IPCC Data Distribution Centre (DDC) partners at the Centre for Environmental Data Analysis (CEDA), the German Climate Computing Centre (DKRZ) and the Spanish Research Council (CSIC) have worked with the IPCC Technical Support Unit (TSU) for WGI to publish figure data from the Sixth Assessment Report (AR6). The work was guided by the IPCC Task Group on Data Support for Climate Change Assessments (TG-Data) recommendations for Open Science and FAIR data (making data Findable, Accessible, Interoperable, and Reusable) with a general aim to enhance the transparency and accessibility of AR6 outcomes.  We highlight the achievement of implementing FAIR for AR6 figure data and discuss the lessons learned on the road to FAIRness in the unique context of the IPCC.

  • Findable - The CEDA catalogue record for each figure dataset enhances findability. Keywords can be easily searched. Records are organised into collections for each AR6 chapter. There is a two-way link between the catalogue record and the figure on the AR6 website. CEDA catalogue records are duplicated on the IPCC-DDC. 
  • Accessible - Scientific language is understandable, acronyms and specific terminology are fully explained. CEDA services provide tools to access and download the data. 
  • Interoperable - Where possible data variables follow standard file format conventions such as CF-netCDF and have standard names, where this is not feasible readme files describe the file structure and content. 
  • Reusable - The data can be reused, shared and adapted elsewhere, with credit, under a Creative Commons Attribution 4.0 licence (CC BY 4.0). Catalogue records link to relevant documentation such as the Digital Object Identifier (DOI) for the code and other supplementary information. The code used to create the figures allows users to reproduce the figures from the report independently. 

CEDA catalogue records provide a platform to acknowledge the specific work of IPCC authors and dataset creators whose work supports the scientific basis of AR6. 

Catalogue records for figure datasets were created at CEDA with data archived in the CEDA repository and the corresponding code stored on GitHub and referenced via Zenodo.  For instances where the data and code were blended in a processing chain that could not be easily separated, we developed criteria to categorise the different blends of data and code and created a decision tree to decide how best to archive them. Key intermediate datasets were also archived at CEDA.

Careful definition of metadata requirements at the beginning of the archival process is important for handling the diversity of IPCC figure data which includes data derived from climate model simulations, historical observations and other sources of climate information. The reality of the implementation meant that processes for gathering data and information from authors were specified later in the preparation of AR6. This presented challenges with data management workflows and the separation of figure datasets from the intermediate data and code that generated them. 

We present recommendations for AR7 and scaling up this work in a feasible way.

How to cite: Pascoe, C., Sitz, L., Cammarano, D., Pirani, A., Stockhause, M., MacRae, M., and Anderson, E.: The reality of implementing FAIR principles in the IPCC context to support open science and provide a citable platform to acknowledge the work of authors., EGU General Assembly 2023, Vienna, Austria, 23–28 Apr 2023, EGU23-13108, https://doi.org/10.5194/egusphere-egu23-13108, 2023.

In our project we are employing semantic data management with the Open Source research data management system (RDMS) CaosDB [1] to link empirical data and simulation output from Earth System Models [2]. The combined management of these data structures allows us to perform complex queries and facilitates the integration of data and meta data into data analysis workflows.

One particular challenge for analyses of model output is to keep track of all necessary meta data of each simulation during the whole digital workflow. Especially for open science approaches it is of great importance to properly document - in human- and computer-readable form - all the information necessary to completely reproduce obtained results. Furthermore, we want to be able to feed all relevant data from data analysis back into our data management system, so that we are able to perform complex queries also on data sets and parameters stemming from data analysis workflows.

A specific aim of this project is to re-analyse existing sets of simulations under different research questions. This endeavour can become very time consuming without proper documentation in an RDMS.

We implemented a workflow, combining semantic research data management with CaosDB and Jupyter notebooks, that keeps track of data loaded into an analysis workspace. Procedures are provided that create snapshots of specific states of the analysis. These snapshots can automatically be interpreted by the CaosDB crawler that is able to insert and update records in the system accordingly. The snapshots include links to the input data, parameter information, the source code and results and therefore provide a high-level interface to the full chain of data processing, from empirical and simulated raw data to the results. For example, input parameters of complex Earth System Models can be extracted automatically and related to model performance. In our use case, not only automated analyses are feasible, but also interactive approaches are supported.

  • [1] Fitschen, T.; Schlemmer, A.; Hornung, D.; tom Wörden, H.; Parlitz, U.; Luther, S. CaosDB—Research Data Management for Complex, Changing, and Automated Research Workflows. Data 2019, 4, 83. https://doi.org/10.3390/data4020083
  • [2] Schlemmer, A., Merder, J., Dittmar, T., Feudel, U., Blasius, B., Luther, S., Parlitz, U., Freund, J., and Lennartz, S. T.: Implementing semantic data management for bridging empirical and simulative approaches in marine biogeochemistry, EGU General Assembly 2022, Vienna, Austria, 23–27 May 2022, EGU22-11766, https://doi.org/10.5194/egusphere-egu22-11766, 2022.

How to cite: Schlemmer, A. and Lennartz, S.: Transparent and reproducible data analysis workflows in Earth System Modelling combining interactive notebooks and semantic data management, EGU General Assembly 2023, Vienna, Austria, 23–28 Apr 2023, EGU23-13347, https://doi.org/10.5194/egusphere-egu23-13347, 2023.

EGU23-14845 | Orals | ESSI3.5

Open geospatial standards and reproducible research 

Massimiliano Cannata, Gregory Giuliani, Jens Ingensand, Olivier Ertz, and Maxime Collombin

In the era of cloud computing, big data and Internet of things, research is very often data-driven: based on the analysis of data, increasingly available in large quantities and collected by experiments, observations or simulations. These data are very often characterized as being dynamic in space and time and as continuously expanding (monitoring) or change (data quality management or survey). Modern Spatial Data Infrastructures (e.g.  swisstopo or INSPIRE), are based on interoperable Web services which expose and serve large quantities of data on the Internet using widely accepted and used open standards defined by the Open Geospatial Consortium (OGC) and the International Organization for Standardization (ISO). These standards mostly comply with FAIR principles but do not offer any capability to retrieve a dataset how it was in a defined instant, to refer to its status in that specific instant and to guarantee its immutability. These three aspects hinder the replicability of research based on such a kind of services. We discuss the issue here and the state of the art  and propose a possible solution to fill this gap, using or extending when needed the existing standards and or adopting best practices in the fields of sensor data, satellite data and vector data.

How to cite: Cannata, M., Giuliani, G., Ingensand, J., Ertz, O., and Collombin, M.: Open geospatial standards and reproducible research, EGU General Assembly 2023, Vienna, Austria, 23–28 Apr 2023, EGU23-14845, https://doi.org/10.5194/egusphere-egu23-14845, 2023.

EGU23-15384 | Orals | ESSI3.5 | Highlight

A peer review process for higher reproducibility of publications in GIScience can also work for Earth System Sciences 

Daniel Nüst, Frank O. Ostermann, and Carlos Granell

The Reproducible AGILE initiative (https://reproducible-agile.github.io/) successfully established a code execution procedure following the CODECHECK principles (https://doi.org/10.12688/f1000research.51738.2) at the AGILE conference series (https://agile-online.org/conference). The AGILE conference is a medium-sized community-led conference in the domains of Geographic Information Science (GIScience), geoinformatics, and related fields. The conference is organised under the umbrella of the Association of Geographic Information Laboratories in Europe (AGILE).

Starting with a series of workshops on reproducibility from 2017 to 2019, a group of Open Science enthusiasts with the support of the AGILE Council (https://agile-online.org/agile-actions/current-initiatives/reproducible-publications-at-agile-conferences) was able to introduce guidelines for sharing reproducible workflows (https://doi.org/10.17605/OSF.IO/CB7Z8) and establish a reproducibility committee that conducts code executions for all accepted full papers.
In this presentation, we provide details of the taken steps and the encountered obstacles towards the current state. We revisit the process and abstract a series of actions that similar events or even journals may take to introduce a shift towards higher reproducibility of research publications in a specific community of practice.

We discuss the taken approach in the light of the challenges for reproducibility in Earth System Sciences (ESS) around four main ideas.
First, Reproducible AGILE’s human-centered process is able to handle the increasingly complex, large and varying data-based workflows in ESS because of the clear guidance on responsibilities (What should the author provide? How far does the reproducibility reviewer need to go?).
Second, the communicative focus of the process is very well suited to, over time, help to establish a shared practice based on current technical developments, such as FAIR Digital Objects, and to reform attitudes towards openness, transparency and sharing. A code execution following the CODECHECK principles is a learning experience that may sustainably change researcher behaviours and practice. At the same time, Reproducible AGILE’s approach avoids playing catch-up with technology and does not limit researcher freedom or includes a need to unitise researcher workflows beyond providing instructions suitable for a human evaluator, similar to academic peer review.
Third, while being agnostic of technology and infrastructures, a supportive framework of tools and infrastructure can of course increase the efficiency of conducting a code execution. We outline how existing infrastructures may serve this need and what is still missing.
Fourth, we list potential candidates of event series or journals that could introduce a code checking procedure because of their organisational setup or steps towards more open scholarhip that were already taken.

How to cite: Nüst, D., Ostermann, F. O., and Granell, C.: A peer review process for higher reproducibility of publications in GIScience can also work for Earth System Sciences, EGU General Assembly 2023, Vienna, Austria, 23–28 Apr 2023, EGU23-15384, https://doi.org/10.5194/egusphere-egu23-15384, 2023.

EGU23-15391 | Posters on site | ESSI3.5

Data Management for PalMod-II – data workflow and re-use strategy 

Swati Gehlot, Karsten Peters-von Gehlen, Andrea Lammert, and Hannes Thiemann

German climate research initiative PalMod phase II (www.palmod.de) is presented here as an exclusive example where the project end-product is unique, scientific paleo-climate data. PalMod-II data products include output from three state-of-the-art coupled climate models of varying complexity and spatial resolutions simulating the climate of the past 130,000 years. In addition to the long time series of modeling data, a comprehensive compilation of paleo-observation data is prepared to facilitate model-model and model-proxy intercomparison and evaluation. Being a large multidisciplinary project, a dedicated RDM (Research Data Management) approach is applied within the cross-cutting working group for PalMod-II. The DMP (Data Management Plan), as a living document, is used for documenting the data-workflow framework that defines the details of paleo-climate data life-cycle. The workflow containing the organisation, storage, preservation, sharing and long-term curation of the data is defined and tested.  In order to make the modeling data inter-comparable across the PalMod-II models and easily analyzable by the global paleo-climate community, model data standardization (CMORization) workflows are defined for individual PalMod models and their sub-models. The CMORization workflows contain setup, definition, and quality assurance testing of CMIP61 based standardization processes adapted to PalMod-II model simulation output requirements with a final aim of data publication via ESGF2. PalMod-II data publication via ESGF makes the paleo-climate data an asset which is (re-)usable beyond the project life-time.

The PalMod-II RDM infrastructure enables common research data management according to the FAIR3 data principles across all the working groups of PalMod-II using common workflows for the exchange of data and information along the process chain. Applying data management planning within PalMod-II made sure that all the data related workflows were defined, continuously updated if needed and made available to the project stakeholders. End products of PalMod-II which consist of unique long term scientific paleo-climate data (model as well as paleo-proxy data) are made available for re-use via the paleo-climate research community as well as other research disciplines (e.g., land-use, socio-economic studies etc.).

1. Coupled Model Intercomparison Project phase 6 (https://www.wcrp-climate.org/wgcm-cmip/wgcm-cmip6)

2. Earth System Grid Federation (https://esgf.llnl.gov)

3. Findable, Accessible, Interoperable, Reusable

How to cite: Gehlot, S., Peters-von Gehlen, K., Lammert, A., and Thiemann, H.: Data Management for PalMod-II – data workflow and re-use strategy, EGU General Assembly 2023, Vienna, Austria, 23–28 Apr 2023, EGU23-15391, https://doi.org/10.5194/egusphere-egu23-15391, 2023.

EGU23-16288 | Orals | ESSI3.5 | Highlight

The UK’s NCAS Data Project: establishing transparent observational data workflows from field to user 

Graham Parton, Barbara Brooks, Ag Stephens, and Wendy Garland

Within the UK the National Centre for Atmospheric Science (NCAS) operates a suite of observational instruments for atmospheric dynamics, chemistry and composition studies. These are principally made available through two facilities: the Atmospheric Measurement and Observations Facility (AMOF) and the Facility for Airborne Atmospheric Measurements (FAAM). Between these two facilities instrumentation can be on either campaign or long-term deployed in diverse environments (from polar to maritime; surface to high altitude), on a range of platforms (aircraft, ships) or dedicated atmospheric observatories.

The wide range of instruments, spanning an operational time period from the mid 1990s to present, has traditionally been orientated to specific communities, resulting in a plethora of different operational practices, data standards and workflows. The resulting data management and usage challenges have been further exacerbated over time by changes of staff, instruments and end-user communities and their requirements. This has been accompanied by the wider end-user community seeking greater access to and improved use of the data, with necessary associated improvements in data production to ensure transparency, quality, veracity and, thus, overall reproducibility. Additionally, these enhancemed workflows further ensure FAIR data outputs, widening long-term re-use of the data. 

Seeking to address these challenges in a more harmonious approach across the range of AMOF and FAAM facilities, NCAS established the NCAS Data Project in 2018 bringing together key players in the data workflows to break down barriers and common standards and procedures through improved dialogue. The resulting NCAS ‘Data Pyramid’ approach, brings together representatives from the data provider, data archive and end-user communities alongside supporting software engineers within a common framework that enables cross-working between all partners. This has lead to new data standards and workflows being established to ensure 3 key objectives: 1) capturing and flow of the necessary metadata to automate data flows and quality control as much as possible in a timely fashion ‘from field to end-user’; 2) enhanced transparency and traceability in data production via linked externally visible documentation, calibration and code repositories; and, 3) data products meeting end-user requirements in terms of their content and established quality control. Finally, data workflows are further enhanced thanks to scriptable conformance checking throughout the data production lifecycle, built on the controlled data product and metadata standards.

Thus, through the established workflows of the NCAS Data Project, the necessary details are captured and conveyed by both internal file-level and catalogue-level metadata to ensure that all three corners of the triangle of reproducibility, quality information, and provenance are able to be achieved in combination.

How to cite: Parton, G., Brooks, B., Stephens, A., and Garland, W.: The UK’s NCAS Data Project: establishing transparent observational data workflows from field to user, EGU General Assembly 2023, Vienna, Austria, 23–28 Apr 2023, EGU23-16288, https://doi.org/10.5194/egusphere-egu23-16288, 2023.

EGU23-17263 | Posters on site | ESSI3.5

Towards reproducible workflows in simulation based Earth System Science 

Ivonne Anders, Hannes Thiemann, Martin Bergemann, Christopher Kadow, and Etor Lucio-Eceiza

Some disciplines, e.g. Astrophysics or Earth system sciences, work with large to very large amounts of data. Storing this data, but also processing it, is a challenge for researchers because novel concepts for processing data and workflows have not developed as quickly. This problem will only become more pronounced with the ever increasing performance of High Performance Computing (HPC) – systems.

At the German Climate Computing Center, we analysed the users, their goals and working methods. DKRZ provides the climate science community with resources such as high-performance computing (HPC), data storage and specialised services and hosts the World Data Center for Climate (WDCC). In analysing users, we distinguish between two main groups: those who need the HPC system to run resource-intensive simulations and then analyse them, and those who reuse, build on and analyse existing data. Each group subdivides into subgroups. We have analysed the workflows for each identified user and found identical parts in an abstracted form and derived Canonical Workflow Modules. In the process, we critically examined the possible use of so-called FAIR Digital Objects (FDOs) and checked to what extent the derived workflows and workflow modules are actually future-proof.

We will show the analysis of the different users, the Canonical workflow and the vision of the FDOs. Furthermore, we will present the framework Freva and further developments and implementations at DKRZ with respect to the reproducibility of simulation-based research in the ESS.

How to cite: Anders, I., Thiemann, H., Bergemann, M., Kadow, C., and Lucio-Eceiza, E.: Towards reproducible workflows in simulation based Earth System Science, EGU General Assembly 2023, Vienna, Austria, 23–28 Apr 2023, EGU23-17263, https://doi.org/10.5194/egusphere-egu23-17263, 2023.

EGU23-1095 | Orals | NP5.2

Recent offline land data assimilation results and future steps towards coupled DA at Meteo-France 

Jean-Christophe Calvet, Bertrand Bonan, and Yiwen Xu

Land data assimilation aims to monitor the evolution of soil and vegetation variables. These variables are driven by climatic conditions and by anthropogenic factors such as agricultural practices. Monitoring terrestrial surfaces involves a number of variables of the soil-plant system such as land cover, snow, surface albedo, soil water content and leaf area index. These variables can be monitored by integrating satellite observations into models. This process is called data assimilation. Integrating observations into land surface models is particularly important in changing climate conditions because environmental conditions and trends never experienced before are emerging. Because data assimilation is able to weight the information coming from contrasting sources of information and to account for uncertainties, it can produce an analysis of terrestrial variables that is the best possible estimation. In this work, data assimilation is implemented at a global scale by regularly updating the model state variables of the ISBA land surface model within the SURFEX modelling platform: the LDAS-Monde sequential assimilation approach. Model-state variable analysis is done for initializing weather forecast atmospheric models. Weather forecast relies on observations to a large extent because of the chaotic nature of the atmosphere. Land variables are not chaotic per se but rapid and complex processes impacting the land carbon budget such as forest management (thinning, deforestation, ...), forest fires and agricultural practices are not easily predictable with a good temporal precision. They cannot be monitored without integrating observations as soon as they are available. We focus on the assimilation of leaf area index (LAI), using land surface temperature (LST) for verification. We show that (1) analyzing LAI together with root-zone soil moisture is needed to monitor the impact of irrigation and heat waves on the vegetation, (2) LAI can be forecasted after properly initializing ISBA. This paves the way to more interactive assimilation of land variables into numerical weather forecast and seasonal forecast models, as well as in atmospheric chemistry models.


How to cite: Calvet, J.-C., Bonan, B., and Xu, Y.: Recent offline land data assimilation results and future steps towards coupled DA at Meteo-France, EGU General Assembly 2023, Vienna, Austria, 23–28 Apr 2023, EGU23-1095, https://doi.org/10.5194/egusphere-egu23-1095, 2023.

EGU23-1846 | Posters on site | NP5.2 | Highlight

Hybrid covariance super-resolution data assimilation 

Sébastien Barthélémy, Julien Brajard, Laurent Bertino, and François Counillon

This work extends the concept of "Super-resolution data assimilation" (SRDA, Barthélémy et al. 2022)) to the case of mixed-resolution ensembles pursuing two goals: (1) emulate the Ensemble Kalman Filter while (2) benefit from high-resolution observations. The forecast step is performed by two ensembles at two different resolutions, high and low-resolution. Before the assimilation step the low-resolution ensemble is downscaled to the high-resolution space, then both ensembles are updated with high-resolution observations. After the assimilation step, the low-resolution ensemble is upscaled back to its low-resolution grid for the next forecast. The downscaling step before the data assimilation step is performed either with a neural network, or with a simple cubic spline interpolation operator. The background error covariance matrix used for the update of both ensembles is a hybrid matrix between the high and low resolution background error covariance matrices. This flavor of the SRDA is called "Hybrid covariance super-resolution data assimilation" (Hybrid SRDA). We test the method with a quasi-geostrophic model in the context of twin-experiments with the low-resolution model being twice and four times coarser than the high-resolution one. The Hybrid SRDA with neural network performs equally or better than its counterpart with cubic spline interpolation, and drastically reduces the errors of the low-resolution ensemble. At equivalent computational cost, the Hybrid SRDA outperforms both the SRDA (8.4%) and the standard EnKF (14%). Conversely, for a given value of the error, the Hybrid SRDA requires as little as  50% of the computational resources of  the EnKF. Finally, the Hybrid SRDA can be formulated as a low-resolution scheme, in the sense that the assimilation is performed in the low-resolution space, encouraging the application of the scheme with realistic ocean models.

How to cite: Barthélémy, S., Brajard, J., Bertino, L., and Counillon, F.: Hybrid covariance super-resolution data assimilation, EGU General Assembly 2023, Vienna, Austria, 23–28 Apr 2023, EGU23-1846, https://doi.org/10.5194/egusphere-egu23-1846, 2023.

All-sky radiance assimilation often has non-Gaussian observation error distributions, which can be exacerbated by high model spatial resolutions due to better resolved nonlinear physical processes. For ensemble Kalman filters, observation ensemble perturbations can be approximated by linearized observation operator (LinHx) that uses the observation operator Jacobian of ensemble mean rather than full observation operator (FullHx). The impact of observation operator on infrared radiance data assimilation is examined here by assimilating synthetic radiance observations from channel 1025 of GIIRS with increased model spatial resolutions from 7.5 km to 300 m. A tropical cyclone is used, while the findings are expected to be generally applied. Compared to FullHx, LinHx provides larger magnitudes of correlations and stronger corrections around observation locations, especially when all-sky radiances are assimilated at fine model resolutions. For assimilating clear-sky radiances with increasing model resolutions, LinHx has smaller errors and improved vortex intensity and structure than FullHx. But when all-sky radiances are assimilated, FullHx has advantages over LinHx. Thus for regimes with more linearity, LinHx provides stronger correlations and imposes more corrections than FullHx; but for regimes with more nonlinearity, LinHx provides detrimental non-Gaussian prior error distributions in observation space, unrealistic correlations and overestimated corrections, compared to FullHx.

How to cite: Lei, L.: Impacts of Observation Forward Operator on Infrared Radiance Data Assimilation with Fine Model Resolutions, EGU General Assembly 2023, Vienna, Austria, 23–28 Apr 2023, EGU23-3011, https://doi.org/10.5194/egusphere-egu23-3011, 2023.

EGU23-3086 | Posters on site | NP5.2

Comparison of optimization methods for the maximum likelihood ensemble filter 

Takeshi Enomoto and Saori Nakashita

The Newton method, which requires the Hessian matrix, is prohibitively expensive in adjoint-based variational data assimilation (VAR). It may be rather attractive for ensemble-based VAR because the ensemble size is usually several orders of magnitude smaller than that of the state size. In the present paper the Newton method is compared against the conjugate-gradient (CG) method, which is one of the most popular choices in adjoint-based VAR. To make comparisons, the maximum likelihood ensemble filter (MLEF) is used as a framework for data assimilation experiments. The Hessian preconditioning is used with CG as formulated in the original MLEF. Alternatively we propose to use the Hessian in the Newton method. In the exact Newton (EN) method, the Newton equation is solved exactly, i.e. the step size is fixed to unity avoiding a line search. In the 1000-member wind-speed assimilation test, CG is stagnated early in iteration and terminated due to a line search error while EN converges quadratically. This behaviour is consistent with the workings of the EN and CG in the minimization of the Rosenbrock function. In the repetitive cycled experiments using the Korteweg-de Vries-Burgers (KdVB) model with a quadratic observation operator, EN performs competitively in accuracy to CG with significantly enhanced stability. These idealized experiments indicate the benefit of adopting EN for the optimization in MLEF.

How to cite: Enomoto, T. and Nakashita, S.: Comparison of optimization methods for the maximum likelihood ensemble filter, EGU General Assembly 2023, Vienna, Austria, 23–28 Apr 2023, EGU23-3086, https://doi.org/10.5194/egusphere-egu23-3086, 2023.

EGU23-3761 | ECS | Posters on site | NP5.2

Observation space localizations for the maximum likelihood ensemble filter 

Saori Nakashita and Takeshi Enomoto

The maximum likelihood ensemble filter (MLEF) can handle nonlinearity of observation operators more appropriately than conventional ensemble Kalman filters. Here we consider the observation space localization method for MLEF to enable application to large-scale problems in the atmosphere. Optimization of the cost function in MLEF, however, impedes local analysis, suitable for massive parallel computers, in the same manner as the local ensemble transform Kalman filter (LETKF). In this study two approaches to observation space localization for MLEF (LMLEF) are compared. The first method introduces local gradients to minimize the global cost function (Yokota et al. 2016). An alternative approach, proposed here, defines a local cost function for each grid assuming a constant ensemble weight in the local domain to enable embarrassingly parallel analysis. The two approaches are compared to LETKF in cycled data assimilation experiments using the Lorenz-96 and the SPEEDY models. LMLEFs are found to be more accurate and stable than LETKF when nonlinear observations are assimilated into each model. Our proposed method is comparable to Yokota's global optimization method when dense observations are assimilated into the Lorenz-96 model. This result is consistent with the fact that ensemble weights have high spatial correlations with those at neighboring grids. Although our method also yields similar analysis in the SPEEDY experiments with a more realistic observation network, Yokota’s global optimization method shows faster error convergence in the earlier cycles. The error convergence rate seems to be related to the difference between global and local optimization and the validity of the assumption of constant weights, which depends strongly on the observation density.

How to cite: Nakashita, S. and Enomoto, T.: Observation space localizations for the maximum likelihood ensemble filter, EGU General Assembly 2023, Vienna, Austria, 23–28 Apr 2023, EGU23-3761, https://doi.org/10.5194/egusphere-egu23-3761, 2023.

EGU23-4668 | ECS | Posters virtual | NP5.2 | Highlight

A particle filter based target observation method and its application to two types of El Niño events 

Meiyi Hou and Youmin Tang

The optimal observational array for improving the El Niño-Southern Oscillation (ENSO) prediction is investigated by exploring sensitive areas for target observations of two types of El Niño events in the Pacific. A target observation method based on the particle filter and pre-industrial control runs from six coupled model outputs in Coupled Model Intercomparison Project Phase 5 (CMIP5) experiments are used to quantify the relative importance of the initial accuracy of sea surface temperature (SST) in different Pacific areas. The initial accuracy of the tropical Pacific, subtropical Pacific, and extratropical Pacific can influence both types of El Niño predictions. The relative importance of different areas changes along with different lead times of predictions. Tropical Pacific observations are crucial for decreasing the root mean square error of predictions of all lead times. Subtropical and extratropical observations play an important role in reducing the prediction uncertainty, especially when the prediction is made before and throughout the boreal spring. To consider different El Niño types and different start months for predictions, a quantitative frequency method based on frequency distribution is applied to determine the optimal observations of ENSO predictions. The final optimal observational array contains 31 grid points, including 21 grid points in the equatorial Pacific and 10 grid points in the North Pacific, suggesting the importance of the initial SST conditions for ENSO predictions in the tropical Pacific and also in the area outside the tropics. Furthermore, the predictions made by assimilating SST in sensitive areas have better prediction skills in the verification experiment, which can indicate the validity of the optimal observational array designed in this study. This result provided guidance on how to initialize models in predictions of El Niño types. 

How to cite: Hou, M. and Tang, Y.: A particle filter based target observation method and its application to two types of El Niño events, EGU General Assembly 2023, Vienna, Austria, 23–28 Apr 2023, EGU23-4668, https://doi.org/10.5194/egusphere-egu23-4668, 2023.

EGU23-5421 | ECS | Posters on site | NP5.2

Estimation of Spatially and Temporally Varying Biogeochemical Parameters in a Global Ocean Model 

Nabir Mamnun, Christoph Völker, Mihalis Vrekoussis, and Lars Nerger

Ocean biogeochemical (BGC) models are, in addition to measurements, the primary tools for investigating ocean biogeochemistry, marine ecosystem functioning, and the global carbon cycle. These models contain a large number of not precisely known parameters and are highly uncertain regarding those parametrizations.  The values of these parameters depend on the physical and biogeochemical context, but in practice values derived from limited field measurements or laboratory experiments are used in the model keeping them constant in space and time. This study aims to estimate spatially and temporally varying parameters in a global ocean BGC model and to assess the effect of those estimated parameters on model fields and dynamics. Utilizing the BGC model Regulated Ecosystem Model 2 (REcoM2), we estimate ten selected BGC parameters with heterogeneity in parameter values both across space and over time using an ensemble data assimilation technique. We assimilate satellite ocean color and BGC-ARGO data using an ensemble Kalman filter provided by the Parallel Data Assimilation Framework (PDAF) to simultaneously estimate the BGC model states and parameters. We assess the improvement in the model predictions with space and time-dependent parameters in reference to the simulation with globally constant parameters against both assimilative and independent data. We quantify the spatiotemporal uncertainties regarding the parameter estimation and the prediction uncertainties induced by those parameters. We study the effect of estimated parameters on the biogeochemical fields and dynamics to get deeper insights into modeling processes and discuss insights from spatially and temporally varying parameters beyond parameter values.

How to cite: Mamnun, N., Völker, C., Vrekoussis, M., and Nerger, L.: Estimation of Spatially and Temporally Varying Biogeochemical Parameters in a Global Ocean Model, EGU General Assembly 2023, Vienna, Austria, 23–28 Apr 2023, EGU23-5421, https://doi.org/10.5194/egusphere-egu23-5421, 2023.

EGU23-5506 | ECS | Posters on site | NP5.2

Empirical optimal vertical localization derived from large ensembles 

Tobias Necker, Philipp Griewank, Takemasa Miyoshi, and Martin Weissmann

Ensemble-based estimates of error covariances suffer from limited ensemble size due to computational restrictions in data assimilation systems for numerical weather prediction. Localization of error covariances can mitigate sampling errors and is crucial for ensemble-based data assimilation. However, finding optimal localization methods, functions, or scales is challenging. We present a new approach to derive an empirical optimal localization (EOL) from a large ensemble dataset. The EOL allows for a better understanding of localization requirements and can guide toward improved localization.

Our study presents EOL estimates using 40-member subsamples assuming a 1000-member ensemble covariance as truth. The EOL is derived from a 5-day training period. In the presentation, we cover both model and observation space vertical localization and discuss:

  • vertical error correlations and EOL estimates for different variables and settings;

  • the effect of the EOL compared to common localization approaches, such as distance-dependent localization with a Gaspari-Cohn function;

  • and vertical localization of infrared and visible satellite observations in the context of observation space localization.

Proper observation space localization of error covariances between non-local satellite observations and state space is non-trivial and still an open research question. First, we evaluate requirements for optimal localization for different variables and spectral channels. And secondly, we investigate the situation dependence of vertical localization in convection-permitting NWP simulations, which suggests an advantage of using adaptive situation-dependent localization approaches.

How to cite: Necker, T., Griewank, P., Miyoshi, T., and Weissmann, M.: Empirical optimal vertical localization derived from large ensembles, EGU General Assembly 2023, Vienna, Austria, 23–28 Apr 2023, EGU23-5506, https://doi.org/10.5194/egusphere-egu23-5506, 2023.

EGU23-6050 | ECS | Posters on site | NP5.2 | Highlight

Unbalanced emission reductions of different species and sectors in China during COVID-19 lockdown derived by multi-species surface observation assimilation 

Lei Kong, Xiao Tang, Jiang Zhu, Zifa Wang, Yele Sun, Pingqing Fu, Meng Gao, Huangjian Wu, Jie Li, Xiaole Pan, Lin Wu, Hajime Akimoto, and Gregory R. Carmichael

The unprecedented lockdown of human activities during the COVID-19 pandemic have significantly influenced the social life in China. However, understanding of the impact of this unique event on the emissions of different species is still insufficient, prohibiting the proper assessment of the environmental impacts of COVID-19 restrictions. Here we developed a multi-air pollutant inversion system to simultaneously estimate the emissions of NOx, SO2, CO, PM2.5 and PM10 in China during COVID-19 restrictions with high temporal (daily) and horizontal (15km) resolutions. Subsequently, contributions of emission changes versus meteorology variations during COVID-19 lockdown were separated and quantified. The results demonstrated that the inversion system effectively reproduced the actual emission variations of multi-air pollutants in China during different periods of COVID-19 lockdown, which indicate that the lockdown is largely a nationwide road traffic control measurement with NOx emissions decreased substantially by ~40%. However, emissions of other air pollutants were found only decreased by ~10%, both because power generation and heavy industrial processes were not halted during lockdown, and residential activities may actually have increased due to the stay-at-home orders. Consequently, although obvious reductions of PM2.5 concentrations occurred over North China Plain (NCP) during lockdown period, the emission change only accounted for 8.6% of PM2.5 reductions, and even led to substantial increases of O3. The meteorological variation instead dominated the changes in PM2.5 concentrations over NCP, which contributed 90% of the PM2.5 reductions over most parts of NCP region. Meanwhile, our results also suggest that the local stagnant meteorological conditions together with inefficient reductions in PM2.5 emissions were the main drivers of the unexpected COVID-19 haze in Beijing. These results highlighted that traffic control as a separate pollution control measure has limited effects on the coordinated control of O3 and PM2.5 concentrations under current complex air pollution conditions in China. More comprehensive and balanced regulations for multiple precursors from different sectors are required to address O3 and PM2.5 pollution in China.

How to cite: Kong, L., Tang, X., Zhu, J., Wang, Z., Sun, Y., Fu, P., Gao, M., Wu, H., Li, J., Pan, X., Wu, L., Akimoto, H., and Carmichael, G. R.: Unbalanced emission reductions of different species and sectors in China during COVID-19 lockdown derived by multi-species surface observation assimilation, EGU General Assembly 2023, Vienna, Austria, 23–28 Apr 2023, EGU23-6050, https://doi.org/10.5194/egusphere-egu23-6050, 2023.

EGU23-7480 | ECS | Orals | NP5.2 | Highlight

Supermodelling: synchronising models to further improve predictions 

Francine Schevenhoven, Mao-Lin Shen, Noel Keenlyside, Jeffrey B. Weiss, and Gregory S. Duane

Instead of combining data from an ensemble of different models after the simulations are already performed, as in a standard multi-model ensemble, we let the models interact with each other during their simulation. This ensemble of interacting models is called a supermodel. By exchanging information, models can compensate for each other's errors before the errors grow and spread to other regions or variables. Effectively, we create a new dynamical system. The exchange between the models is frequent enough such that the models synchronize, in order to prevent loss of variance when the models are combined. In previous work, we experimented successfully with combining atmospheric models of intermediate complexity in the context of parametric error. Here we will show results of combining two different AGCMs, NorESM1-ATM and CESM1-ATM. The models have different horizontal and vertical resolutions. To combine states from the different grids, we convert the individual model states to a ‘common state space’ with interpolation techniques. The weighted superposition of different model states is called a ‘pseudo-observation’. The pseudo-observations are assimilated back into the individual models, after which the models continue their run. We apply recently developed methods to train the weights determining the superposition of the model states, in order to obtain a supermodel that will outperform the individual models and any weighted average of their outputs.

How to cite: Schevenhoven, F., Shen, M.-L., Keenlyside, N., Weiss, J. B., and Duane, G. S.: Supermodelling: synchronising models to further improve predictions, EGU General Assembly 2023, Vienna, Austria, 23–28 Apr 2023, EGU23-7480, https://doi.org/10.5194/egusphere-egu23-7480, 2023.

EGU23-7719 | ECS | Orals | NP5.2

The role of anchor observations in disentangling observation and model bias corrections in 4DVar 

Devon Francis, Alison Fowler, Amos Lawless, Stefano Migliorini, and John Eyre

Data assimilation theory relies on the assumption that the background, model, and observations are unbiased. However, this is often not the case and, if biases are left uncorrected, this can cause significant systematic errors in the analysis. When bias is only present in the observations, Variational Bias Correction (VarBC) can correct for observation bias, and when bias is only present in the model, Weak-Constraint 4D Variational Assimilation (WC4DVar) can correct for model bias. However, when both observation and model biases are present, it can be very difficult to understand how the different bias correction methods interact, and the role of anchor (unbiased) observations becomes crucial for providing a frame of reference from which the biases may be estimated. This work presents a systematic study of the properties of the network of anchor observations needed to disentangle between model and observation biases when correcting for one or both types of bias in 4DVar.

We extend the theory of VarBC and WC4DVar to include both biased and anchor observations, to find that the precision and timing of the anchor observations are important in reducing the contamination of model/observation bias in the correction of observation/model bias. We show that anchor observations have the biggest impact in reducing the contamination of bias when they are later in the assimilation window than the biased observations, as such, operational systems that rely on anchor observations that are earlier in the window will be more susceptible to the contamination of model and/or observation biases. We also compare the role of anchor observations when VarBC/WC4DVar/both are used in the presence of both observation and model biases. We find that the ability of VarBC to effectively correct for observation bias when model bias is present, is very dependent on precise anchor observations, whereas correcting model bias with WC4DVar or correcting for both biases performs reasonably well regardless of the precision of anchor observations (although more precise anchor observations reduces the bias in the state analysis compared with less precise anchor observations for all three cases). This demonstrates that, when it is not possible to use anchor observations, it may be better to correct for both observation and model biases, rather than relying on only one bias correction technique.

We demonstrate these results in a series of idealised numerical experiments that use the Lorenz 96 model as a simplified model of the atmosphere.

How to cite: Francis, D., Fowler, A., Lawless, A., Migliorini, S., and Eyre, J.: The role of anchor observations in disentangling observation and model bias corrections in 4DVar, EGU General Assembly 2023, Vienna, Austria, 23–28 Apr 2023, EGU23-7719, https://doi.org/10.5194/egusphere-egu23-7719, 2023.

EGU23-8030 | Posters on site | NP5.2

Assessment of short-range forecast atmosphere-ocean cross-covariances from the Met Office coupled NWP system 

Amos Lawless, Maria Valdivieso, Nancy Nichols, Daniel Lea, and Matthew Martin

As part of the design of future coupled forecasting systems, operational centres such as the Met Office are starting to include interactions between the atmosphere and the ocean within the data assimilation system. This requires an improved understanding and representation of the correlations between short-range forecast errors in different variables. To understand the potential benefit of further coupling in the data assimilation scheme it is important to understand the significance of any cross-correlations between atmosphere and ocean short-range forecast errors as well as their temporal and spatial variability. In this work we examine atmosphere-ocean cross-covariances from an ensemble of the Met Office coupled NWP system for December 2019, with particular focus on short-range forecast errors that evolve at lead times up to 6 hours.

We find that significant correlations exist between atmosphere and ocean forecast errors on these timescales, and that these vary diurnally, from day to day, spatially and synoptically. Negative correlations between errors in sea-surface temperature (SST) and 10m wind correlations strengthen as the solar radiation varies from zero at night (local time) to a maximum insolation around midday (local time). In addition, there are significant variations in correlation intensities and structures in response to synoptic-timescale forcing. Significant positive correlations between SST and 10m wind errors appear in the western North Atlantic in early December and are associated with variations in low surface pressures and their associated high wind speeds, that advect cold, dry continental air eastward over the warmer Atlantic ocean. Negative correlations across the Indo-Pacific Warm Pool are instead associated with light wind conditions on these short timescales.

When we consider the spatial extent of cross-correlations, we find that in the Gulf Stream region positive correlations between wind speed and sub-surface ocean temperatures are generally vertically coherent down to a depth of about 100m, consistent with the mixing depth; however, in the tropical Indian and West Pacific oceans, negative correlations break down just below the surface layer. This is likely due to the presence of surface freshwater layers that form from heavy precipitation on the tropical oceans, manifested by the presence of salinity-stratified barrier layers within deeper isothermal layers that can effectively limit turbulent mixing of heat between the ocean surface and the deeper thermocline.

How to cite: Lawless, A., Valdivieso, M., Nichols, N., Lea, D., and Martin, M.: Assessment of short-range forecast atmosphere-ocean cross-covariances from the Met Office coupled NWP system, EGU General Assembly 2023, Vienna, Austria, 23–28 Apr 2023, EGU23-8030, https://doi.org/10.5194/egusphere-egu23-8030, 2023.

EGU23-8640 | Orals | NP5.2

Forecast error growth: A stochastic differential equation model 

Michael Ghil, Eviatar Bach, and Dan Crisan

There is a history of simple error growth models designed to capture the key properties of error growth in operational numerical weather prediction models. We propose here such a scalar model that relies on the previous ones, but captures the effect of small scales on the error growth via additive noise in a nonlinear stochastic differential equation (SDE). We nondimensionalize the equation and study its behavior with respect to the error saturation value, the growth rate of small errors, and the magnitude of noise. We show that the addition of noise can change the curvature of the error growth curve. The SDE model seems to improve substantially the fit to operational error growth curves, compared to the deterministic counterparts.

How to cite: Ghil, M., Bach, E., and Crisan, D.: Forecast error growth: A stochastic differential equation model, EGU General Assembly 2023, Vienna, Austria, 23–28 Apr 2023, EGU23-8640, https://doi.org/10.5194/egusphere-egu23-8640, 2023.

EGU23-9529 | Orals | NP5.2

Nonlinear Data Assimilation for State and Parameter Estimation in Earthquake Simulation 

Femke Vossepoel, Arundhuti Banerjee, Hamed Diab Montero, Meng Li, Celine Marsman, Rob Govers, and Ylona van Dinther

The highly nonlinear dynamics of earthquake sequences and the limited availability of stress observations near subsurface faults make it very difficult, if not impossible, to forecast earthquakes. Ensemble data-assimilation methods provide a means to estimate state variables and parameters of earthquake sequences that may lead to a better understanding of the associated fault-slip process and contribute to the forecastability of earthquakes. We illustrate the challenges of data assimilation in earthquake simulation with an overview of three studies, each with different objectives and experiments.

In the first study, by reconstructing a laboratory experiment with an advanced numerical simulator we perform synthetic twin experiments to test the performance of an ensemble Kalman Filter (EnKF) and its ability to reconstruct fault slip behaviour in 1D and 3D simulations. The data assimilation estimates and forecasts earthquakes, even when having highly uncertain observations of the stress field. In these experiments, we assume the friction parameters to be perfectly known, which is typically not the case in reality.

A bias in a friction parameter can cause a significant change in earthquake dynamics, which will complicate the application of data assimilation in realistic cases. The second study addresses how well state estimation and state-parameter estimation can account for friction-parameter bias. For this, we use a 0D model for earthquake recurrence with a particle filter with sequential importance resampling. This shows that in case of intermediate to large uncertainty in friction parameters, combined state-and-parameter estimation is critical to correctly estimate earthquake sequences. The study also highlights the advantage of a particle filter over an EnKF for this nonlinear system.

The post- and inter-seismic deformations following an earthquake are rather gradual and do not pose the same challenges for data assimilation as the deformation during an earthquake event. To estimate the model parameters of surface displacements during these phases, a third study illustrates the application of the Ensemble Smoother-Multiple Data Assimilation and the particle filter with actual GPS data of the Tohoku 2011 earthquake.

Based on the comparison of the various experiments, we discuss the choice of data-assimilation method and -approach in earthquake simulation and suggest directions for future research.

How to cite: Vossepoel, F., Banerjee, A., Diab Montero, H., Li, M., Marsman, C., Govers, R., and van Dinther, Y.: Nonlinear Data Assimilation for State and Parameter Estimation in Earthquake Simulation, EGU General Assembly 2023, Vienna, Austria, 23–28 Apr 2023, EGU23-9529, https://doi.org/10.5194/egusphere-egu23-9529, 2023.

EGU23-11889 | ECS | Posters on site | NP5.2

Data Assimilation and Subsurface Flow Modeling: Interactions between Groundwater and the Vadose Zone 

Bastian Waldowski, Insa Neuweiler, and Natascha Brandhorst

Reliable estimates of soil water content and groundwater levels are essential in evaluating water availability for plants and as drinking water and thus both subsurface components (vadose zone and groundwater) are commonly monitored. Such measurements can be used for data assimilation in order to improve predictions of numerical subsurface flow models. Within this work, we investigate to what extent measurements from one subsurface component are able to improve predictions in the other one.
For this purpose, we utilize idealized test cases at a subcatchment scale using a Localized Ensemble Kalman Filter to update the water table height and soil moisture at certain depths with measurements taken from a numerical reference model. We do joint, as well as single component updates. We test strongly coupled data assimilation, which implies utilizing correlations between the subsurface components for updating the ensemble and compare it to weakly coupled data assimilation. We also update soil hydraulic parameters and examine the role of their heterogeneity with respect to data assimilation. We run simulations with both a complex 3D model (using TSMP-PDAF) as well as a more simplified and computationally efficient 2.5D model, which consists of multiple 1D vadose-zone columns coupled iteratively with a 2D groundwater-flow model. In idealized settings, such as homogeneous subsurface structures, we find that predictions in one component consistently benefit from updating the other component.

How to cite: Waldowski, B., Neuweiler, I., and Brandhorst, N.: Data Assimilation and Subsurface Flow Modeling: Interactions between Groundwater and the Vadose Zone, EGU General Assembly 2023, Vienna, Austria, 23–28 Apr 2023, EGU23-11889, https://doi.org/10.5194/egusphere-egu23-11889, 2023.

EGU23-12304 | ECS | Posters on site | NP5.2

Analysis of airborne-derived sea ice emissivities up to 340 GHz in preparation for future satellite missions 

Nils Risse, Mario Mech, Catherine Prigent, Gunnar Spreen, and Susanne Crewell

Passive microwave radiometers onboard polar-orbiting satellites provide global information on the atmospheric state. The underlying retrievals require accurate knowledge of the surface radiative properties to distinguish atmospheric from surface contributions to the measured radiance. Polar surfaces such as sea ice contribute up to 400 GHz to the measured radiance due to the high atmospheric transmissivity under cold and dry conditions. Currently, we lack an understanding of sea ice parameters driving the variability in its radiative properties, i.e., its emissivity, at frequencies above 200 GHz due to limited field data and the heterogeneous sea ice structure. This will limit the use of future satellite missions such as the Ice Cloud Imager (ICI) onboard Metop-SG and the Arctic Weather Satellite (AWS) in polar regions.

To better understand sea ice emission, we analyze unique airborne measurements from 89 to 340 GHz obtained during the ACLOUD (summer 2017) and AFLUX (spring 2019) airborne campaigns and co-located satellite observations in the Fram Strait. The Polar 5 aircraft carried the Microwave Radar/radiometer for Arctic Clouds (MiRAC) cloud radar MiRAC-A with an 89 GHz passive channel and MiRAC-P with six double-sideband channels at 183.31 GHz and two window channels at 243 and 340 GHz. We calculate the emissivity with the non-scattering radiative transfer equation from observed upwelling radiation at 25° (MiRAC-A) and 0° (MiRAC-P) and Passive and Active Microwave radiative TRAnsfer (PAMTRA) simulations. The PAMTRA simulations are based on atmospheric profiles from dropsondes and surface temperatures from an infrared radiometer.

The airborne-derived sea ice emissivity (O(0.1km)) varies on small spatial scales (O(1km)), which align with sea ice properties identified by visual imagery. High-resolution airborne-derived emissivities vary more than emissivities from co-located overflights of the GPM constellation due to the smaller footprint size, which resolve sea ice variations. The emissivity of frozen and snow-free leads separates clearly from more compact and snow-covered ice flows at all frequencies. The comparison of summer and spring emissivities reveals an emissivity reduction due to melting. We will also conduct evaluations of emissivity parameterizations (e.g. TELSEM²) and provide insights into observations at ICI and AWS frequencies over Arctic sea ice. Findings based on the field data may be useful for the assimilation of radiances from existing and future microwave radiometers into weather prediction models in polar regions.

How to cite: Risse, N., Mech, M., Prigent, C., Spreen, G., and Crewell, S.: Analysis of airborne-derived sea ice emissivities up to 340 GHz in preparation for future satellite missions, EGU General Assembly 2023, Vienna, Austria, 23–28 Apr 2023, EGU23-12304, https://doi.org/10.5194/egusphere-egu23-12304, 2023.

EGU23-14227 | Orals | NP5.2

Combining sea-ice and ocean data assimilation with nudging atmospheric circulation in the AWI Coupled Prediction System 

Svetlana N. Losa, Longjiang Mu, Marylou Athanase, Jan Streffing, Miguel Andrés-Martínez, Lars Nerger, Tido Semmler, Dmitry Sidorenko, and Helge F. Goessling

Assimilation of sea ice and ocean observational data into coupled sea-ice, ocean and atmosphere models is known as an efficient approach for providing a reliable sea-ice prediction (Mu et al. 2022). However, implementations of the data assimilation in the coupled systems still remain a challenge. This challenge is partly originated from the chaoticity possessed in the atmospheric module, which leads to biases and, therefore, to divergence of predictive characteristics. An additional constrain of the atmosphere is proposed as a tool to tackle the aforementioned problem. To test this approach, we use the recently developed AWI Coupled Prediction System (AWI-CPS). The system is built upon the AWI climate model AWI-CM-3 (Streffing et al. 2022) that includes FESOM2.0 as a sea-ice ocean component and the Integrated Forecasting System (OpenIFS) as an atmospheric component. An Ensemble-type Kalman filter within the Parallel Data Assimilation Framework (PDAF; Nerger and Hiller, 2013) is used to assimilate sea ice concentration, sea ice thickness, sea ice drift, sea surface height, sea surface temperature and salinity, as well as temperature and salinity vertical profiles. The additional constrain of the atmosphere is introduced by relaxing, or “nudging”, the AWI-CPS large-scale atmospheric dynamics to the ERA5 reanalysis data. This nudging of the large scale atmospheric circulation towards reanalysis has allowed to reduce biases in the atmospheric state, and, therefore, to reduce the analysis increments. The most prominent improvement has been achieved for the predicted sea ice drift. Comprehensive analyses will be presented based upon the new system’s performance over the time period 2003 – 2022.

Mu, L., Nerger, L., Streffing, J., Tang, Q., Niraula, B., Zampieri, L., Loza, S. N. and H. F. Goessling, Sea-ice forecasts with an upgraded AWI Coupled Prediction System (Journal of Advances in Modeling Earth Systems, 14, e2022MS003176. doi: 10.1029/2022MS003176.

Nerger, L. and Hiller, W., 2013. Software for ensemble-based data assimilation systems—Implementation strategies and scalability. Computers & Geosciences, 55, pp.110-118.

Streffing, J., Sidorenko, D., Semmler, T., Zampieri, L., Scholz, P., Andrés-Martínez, M., Koldunov, N., Rackow, T., Kjellsson, J., Goessling, H., Athanase, M., Wang, Q., Sein, D., Mu, L., Fladrich, U., Barbi, D., Gierz, P., Danilov, S.,  Juricke, S., Lohmann, G. and Jung, T. (2022) AWI-CM3 coupled climate model: Description and evaluation experiments for a prototype post-CMIP6 model, EGUsphere, 2022, 1—37, doi: 10.5194/egusphere-2022-32

How to cite: Losa, S. N., Mu, L., Athanase, M., Streffing, J., Andrés-Martínez, M., Nerger, L., Semmler, T., Sidorenko, D., and Goessling, H. F.: Combining sea-ice and ocean data assimilation with nudging atmospheric circulation in the AWI Coupled Prediction System, EGU General Assembly 2023, Vienna, Austria, 23–28 Apr 2023, EGU23-14227, https://doi.org/10.5194/egusphere-egu23-14227, 2023.

EGU23-14826 | Posters virtual | NP5.2 | Highlight

Inverse modelling for trace gas surface flux estimation, impact of a non-diagonal B-matrix 

Ross Bannister
One of the most appealing uses of data assimilation is to infer useful information about a dynamical system that is not observed directly. This is the case for the estimation of surface fluxes of trace gases (like methane). Such fluxes are not easy to measure directly on a global scale, but it is possible to measure the trace gas itself as it is transported around the globe. This is the purpose of INVICAT (the inverse modelling system of the chemical transport model TOMCAT), which has been developed here. INVICAT interprets observations of (e.g.) methane over a time window to estimate the initial conditions (ICs) and surface fluxes (SFs) of the TOMCAT model.
This talk will show how INVICAT has been expanded from a diagonal background error covariance matrix (B-matrix, DB) to allow an efficient representation of a non-diagonal B-matrix (NDB). The results of this process are mixed. A NDB-matrix for the SF field improves the analysis against independent data, but a NDB-matrix for the IC field appears to degrade the analysis. This paper presents these results and suggests that a possible reason for the degraded analyses is the presence of a possible bias in the system.

How to cite: Bannister, R.: Inverse modelling for trace gas surface flux estimation, impact of a non-diagonal B-matrix, EGU General Assembly 2023, Vienna, Austria, 23–28 Apr 2023, EGU23-14826, https://doi.org/10.5194/egusphere-egu23-14826, 2023.

EGU23-14985 | ECS | Orals | NP5.2

Reconstructing North Atlantic Ocean Heat Content Using Convolutional Neural Networks 

Simon Lentz, Dr. Sebastian Brune, Dr. Christopher Kadow, and Prof. Dr. Johanna Baehr

Slowly varying ocean heat content is one of the most important variables when describing cli-
mate variability on interannual to decadal time scales. Since observation-based estimates of
ocean heat content require extensive observational coverage, incomplete observations are often
combined with numerical models via data assimilation to simulate the evolution of oceanic heat.
However, incomplete observations, particularly in the subsurface ocean, lead to large uncertain-
ties in the resulting model-based estimate. As an alternative approach, Kadow et al (2020) have
proven that artificial intelligence can successfully be utilized to reconstruct missing climate in-
formation for surface temperatures. In the following, we investigate the possibility to train their
three-dimensional convolutional neural network to reconstruct missing subsurface temperatures
to obtain ocean heat content estimates with a focus on the North Atlantic ocean.
The network is trained and tested to reconstruct a 16 member Ensemble Kalman Filter assimi-
lation ensemble constructed with the Max-Planck Institute Earth System Model for the period
from 1958 to 2020. Specifically, we examine whether the partial convolutional U-net represents
a valid alternative to the Ensemble Kalman Filter assimilation to estimate North Atlantic sub-
polar gyre ocean heat content.
The neural network is capable of reproducing the assimilation reduced to datapoints with ob-
servational coverages within its ensemble spread with a correlation coefficient of 0.93 over the
entire time period and of 0.99 over 2004 – 2020 (the Argo-Era). Additionally, the network is
able to reconstruct the observed ocean heat content directly from observations for 12 additional
months with a correlation of 0.97, essentially replacing the assimilation experiment by an extrap-
olation. When reconstructing the pre-Argo-Era, the network is only trained with assimilations
from the Argo-Era. The lower correlation in the resulting reconstruction indicates higher un-
certainties in the assimilation outside of its ensemble spread at times with low observational
density. These uncertainties are highlighted by inconsistencies in the assimilation’s represen-
tations of the North Atlantic Current at times and grid points without observations detected
by the neural network. Our results demonstrate that a neural network is not only capable of
reproducing the observed ocean heat content over the training period, but also before and after
making the neural network a suitable candidate to step-wise extend or replace data assimilation.

How to cite: Lentz, S., Brune, Dr. S., Kadow, Dr. C., and Baehr, P. Dr. J.: Reconstructing North Atlantic Ocean Heat Content Using Convolutional Neural Networks, EGU General Assembly 2023, Vienna, Austria, 23–28 Apr 2023, EGU23-14985, https://doi.org/10.5194/egusphere-egu23-14985, 2023.

EGU23-15189 | ECS | Orals | NP5.2

A coupled data assimilation framework with an integrated surface and subsurface hydrological model 

Qi Tang, Hugo Delottier, Oliver S. Schilling, Wolfgang Kurtz, and Philip Brunner

We developed an ensemble based data assimilation (DA) system for an integrated hydrological model to facilitate real-time operational simulations of water quantity and quality. The integrated surface and subsurface hydrologic model HydroGeoSphere (HGS) (Brunner & Simmons, 2012) which simulates surface water and variably saturated groundwater flow as well as solute transport, was coupled with the Parallel Data Assimilation Framework (PDAF) (Nerger et al., 2005). The developed DA system allows joint assimilation of multiple types of observations such as piezometric heads, streamflow, and tracer concentrations. By explicitly considering tracer and streamflow data we substantially expand the hydrologic information which can be used to constrain the simulations.    Both the model states and the parameters can be separately or jointly updated by the assimilation algorithm.  

A synthetic alluvial plain model set up by Delottier et al., (2022) was used as an example to test the performance of our DA system.  For flow simulations, piezometric head observations were assimilated, while for transport simulations, noble gas concentrations (222Rn, 37Ar, and 4He) were assimilated. Both model states (e.g., hydraulic head or noble gas concentrations) and parameters (e.g. hydraulic conductivities and porosity) are jointly updated by the DA. Results were evaluated by comparing the estimated model variables with independent observation data between the assimilation runs and the free run where no data assimilation was conducted. In a further evaluation step, a real-world, field scale model featuring realistic forcing functions and material properties was set up for a site in Switzerland and carried out for numerical simulations with the developed DA system. The synthetic and real-world examples demonstrate the significant potential in combing state of the art numerical models, data assimilation and novel tracer observations such as noble gases or Radon.

How to cite: Tang, Q., Delottier, H., Schilling, O. S., Kurtz, W., and Brunner, P.: A coupled data assimilation framework with an integrated surface and subsurface hydrological model, EGU General Assembly 2023, Vienna, Austria, 23–28 Apr 2023, EGU23-15189, https://doi.org/10.5194/egusphere-egu23-15189, 2023.

EGU23-16806 | Orals | NP5.2

Coupled data assimilation for numerical weather prediction at ECMWF 

Patricia de Rosnay, Phil browne, Eric de Boisséson, David Fairbairn, Sébastien Garrigues, Christoph Herbert, Kenta Ochi, Dinand Schepers, Pete Weston, and Hao Zuo

In this presentation we introduce coupled assimilation activities conducted in support of seamless Earth system approach developments for Numerical Weather Prediction and climate reanalysis at the European Centre for Medium-Range Weather Forecasts (ECMWF). For operational applications coupled assimilation requires to have reliable and timely access to observations in all the Earth system components and it relies on consistent acquisition and monitoring approaches across the components. We show recent and future infrastructure developments and implementations to support consistent observations acquisition and monitoring for land and ocean at ECMWF. We discuss challenges of surface sensitive observations assimilation and we show ongoing forward operator and coupling developments to enhance the exploitation of interface observations over land and ocean surfaces. We present plans to use new and future observation types from future observing systems such as the Copernicus Expansion missions.

How to cite: de Rosnay, P., browne, P., de Boisséson, E., Fairbairn, D., Garrigues, S., Herbert, C., Ochi, K., Schepers, D., Weston, P., and Zuo, H.: Coupled data assimilation for numerical weather prediction at ECMWF, EGU General Assembly 2023, Vienna, Austria, 23–28 Apr 2023, EGU23-16806, https://doi.org/10.5194/egusphere-egu23-16806, 2023.

The Salish Sea is a semi-enclosed coastal sea between Vancouver Island and the coast of British Columbia and Washington State, invaluable from both an economic and ecologic perspective. Pacific inflow to the Sea is the main contributor of many biologically important constituents. The contribution of Pacific water masses to the flow through Juan de Fuca Strait (JdF), the Salish Sea’s primary connection to the Pacific Ocean, is explored. Quantitative Lagrangian particle tracking using Ariane was applied to two numerical ocean models (CIOPS-W in the shelf region, and SalishSeaCast in the Salish Sea) matched together within JdF. Water parcels seeded near the entrance of JdF were integrated forwards and backwards in time to assess water mass path (and properties while on this path) from the shelf region and once within the Salish Sea in more detail than previously possible. During summer upwelling, intermediate flow from the north shelf and offshore dominate inflow, while during winter downwelling, intermediate flow from the south shelf and surface flow from the Columbia River plume are the dominant sources. A weaker and less consistent estuarine flow regime in the winter led to less Pacific inflow overall and a smaller percentage of said inflow reaching the Salish Sea's inner basins than in the summer. Nevertheless, it was found that winter dynamics are the main driver of interannual variability, in part due to the strongly anti-correlated behaviour and distinct properties of the two dominant winter sources. This analysis extends the knowledge on the dynamics of Pacific inflow to the Salish Sea and highlights the importance of winter inflow to the interannual variability in biogeochemical conditions in the region.

How to cite: Beutel, B. and Allen, S.: Interannual and seasonal water mass analysis in the Salish Sea using Lagrangian particle tracking, EGU General Assembly 2023, Vienna, Austria, 23–28 Apr 2023, EGU23-316, https://doi.org/10.5194/egusphere-egu23-316, 2023.

EGU23-2725 | ECS | Posters on site | NP6.3

Lagrangian Spatiotemporal Fingerprints of Dissolved Inorganic Carbon in Eighteen Degree Water Formation 

Daan Reijnders, Dorothee Bakker, and Erik van Sebille

Mode waters are defined as thick, weakly stratified layers with homogeneous properties. They have the ability to store these properties, such as heat, carbon and nutrients, and exchange these with the surface or atmosphere during outcropping events or with other layers via mixing processes. Eighteen Degree Water (EDW) is the subtropical mode water of the western North Atlantic. Its yearly outcropping events in late winter makes it an important regulator of ocean heat, nutrients and carbon in the North Atlantic on annual timescales.

Previous studies have given insight into the formation and destruction of Eighteen Degree Water. These have largely focused on physical aspects such as EDW formation rates. Due to the importance of EDW formation in setting the biogeochemical environment in the North Atlantic, it is instructive to investigate how biogeochemical tracers are altered along EDW formation routes. This study investigates in particular how dissolved inorganic carbon (DIC) is altered along ocean water parcel trajectories as EDW is formed. To do so, we compute Lagrangian trajectories of subducted EDW backwards in time using a coupled hydrodynamic and biogeochemical model. By sampling biogeochemical tracer values along Lagrangian pathways, we construct timeseries which we use to map the dominant locations at which DIC concentrations are altered in space and time to identify the Lagrangian fingerprint of DIC in Eighteen Degree Water.

How to cite: Reijnders, D., Bakker, D., and van Sebille, E.: Lagrangian Spatiotemporal Fingerprints of Dissolved Inorganic Carbon in Eighteen Degree Water Formation, EGU General Assembly 2023, Vienna, Austria, 23–28 Apr 2023, EGU23-2725, https://doi.org/10.5194/egusphere-egu23-2725, 2023.

EGU23-3970 | ECS | Posters on site | NP6.3 | Highlight

Lagrangian trajectories to assess marine plastic pollution distribution in the Canary Islands 

Marcos Cividanes García, Borja Aguiar González, May Gómez Cabrera, Alicia Herrera Ulibarri, Ico Martínez Sánchez, Ángel Rodríguez Santana, and Francisco José Machín Jiménez

The increasing presence of plastics in the ocean is a harmful problem for marine ecosystems and the socio-economic sector. A recurrent type of debris gathered in waters of the Canary Islands are the identification tags employed at lobster traps deployed at the north-eastern coast of North America. Since 2016 to the present, these debris have been routinely collected and classified by the EOMAR group (MICROTROFIC Project) through coastal sampling focused on the eastern part of the Canary archipelago. In order to address this problem, a further understanding of the distribution and dynamics of these debris in the ocean is demanding. In this work, a pre-existing tool in Matlab has been upgraded to produce Lagrangian trajectories based on Marine Copernicus surface current velocity (GLORYS12V1). The main goal is to assess the trajectories that floating particles might follow in the North Atlantic subtropical gyre when released over a grid in the north-eastern coast of North America (Gulf of Maine). Our results provide a quantitative basis about the link between the North American north-eastern coast and the Canary Islands, where the presence of these and other debris is of increasing concern.

How to cite: Cividanes García, M., Aguiar González, B., Gómez Cabrera, M., Herrera Ulibarri, A., Martínez Sánchez, I., Rodríguez Santana, Á., and Machín Jiménez, F. J.: Lagrangian trajectories to assess marine plastic pollution distribution in the Canary Islands, EGU General Assembly 2023, Vienna, Austria, 23–28 Apr 2023, EGU23-3970, https://doi.org/10.5194/egusphere-egu23-3970, 2023.

EGU23-4003 | ECS | Orals | NP6.3

Quasi-Objective Eddy Visualization from Sparse Drifter Data 

Alex Pablo Encinas Bartos, Nikolas O. Aksamit, and George Haller

Lagrangian eddies, generally referred to as elliptic Lagrangian coherent structures (LCS) in the dynamical systems literature, are material objects that trap and transport floating particles over large distances in the ocean in a coherent fashion. In order to expand our understanding of the transport of marine tracers, we need to accurately and reliably track the evolution of vortical flow structures. Drifter trajectories represent a valuable but sparse source of information for this purpose. We employ a recently developed single-trajectory Lagrangian diagnostic tool, the trajectory rotation average (TRA), to visualize oceanic vortices (or eddies) from sparse drifter data in a quasi-objective fashion. We apply the TRA to two drifter data sets that cover various oceanographic scales: the Grand Lagrangian Deployment (GLAD) and the Global Drifter Program (GDP). Based on the TRA, we develop a general algorithm that extracts approximate eddy boundaries. We find that the TRA outperforms other available single-trajectory-based eddy detection methodologies on sparse drifter data and identifies eddies on scales that are unresolved by satellite-altimetry.

How to cite: Encinas Bartos, A. P., O. Aksamit, N., and Haller, G.: Quasi-Objective Eddy Visualization from Sparse Drifter Data, EGU General Assembly 2023, Vienna, Austria, 23–28 Apr 2023, EGU23-4003, https://doi.org/10.5194/egusphere-egu23-4003, 2023.

EGU23-6036 | Orals | NP6.3

A versatile Lagrangian-data aggregation framework for marine biological dispersal studies 

Willi Rath, Lara Schmittmann, Carola Trahms, Felix Kirch, Leon Mock, and Arne Biastoch

Lagrangian particle dispersal simulations are widely used for studying directed connectivity between different locations in the ocean. They are used, both, for the understanding of ocean physics and for interdisciplinary questions. One biological example is the dispersal of passively drifting marine organisms.

The typical modus operandi of such “bio-physical” studies is to design an underlying Lagrangian simulation in close synchronisation with a specific biological research question. This leads to a conflation of concerns between physical and biological aspects of the study. This conflation might result in repeated and slow development cycles of re-calculation for different scenarios and hence inhibit scientific progress.

We aim at improving the separation of concerns between biological and physical components for bio-physical Lagrangian studies, by aggregating physical Lagrangian data into directed multigraphs encoding locations as nodes and multiple parallel pathways as directed edges. Those graphs condense the physics-based information on directed oceanic relations and thus serve as a basis for simultaneously answering various biological questions on connectivity. As the proposed aggregation retains the distinction of different pathways between locations, it can, to some extent, also provide information of underway environmental conditions. This greatly enhances the range of applications of our approach over existing aggregations of Lagrangian data as connectivity probability graphs.

We present a specific set of biological case studies — the multi-year spreading of two oyster diseases in the North Sea — and develop a framework that facilitates efficiently and simultaneously testing multiple biological hypotheses for marine diseases of various species based on the same processed physical data set.

How to cite: Rath, W., Schmittmann, L., Trahms, C., Kirch, F., Mock, L., and Biastoch, A.: A versatile Lagrangian-data aggregation framework for marine biological dispersal studies, EGU General Assembly 2023, Vienna, Austria, 23–28 Apr 2023, EGU23-6036, https://doi.org/10.5194/egusphere-egu23-6036, 2023.

EGU23-6537 | ECS | Orals | NP6.3

Forecast of Particle Spreading Using Machine Learning in a Complex Multiple-Inlet Coastal System 

Jeancarlo M. Fajardo-Urbina, Yang Liu, Ulf Gräwe, Sonja Georgievska, Meiert W. Grootes, Herman J.H. Clercx, Theo Gerkema, and Matias Duran-Matute

The implementation of continuous operational forecast systems using numerical models for coastal environments are scarce, computationally expensive, and difficult to maintain. As an alternative, computationally cheaper tools such as machine learning models can be employed. This is especially relevant when the time to produce a forecast is paramount like in oil spills, marine litter spread due to container-ship accidents, and search and rescue operations. Working in this direction, we tested the skill of an advanced deep learning model, namely a convolutional long short-term memory network (ConvLSTM), to predict the Lagrangian advection (the displacement vector of the center of mass) and the dispersion (the spread described by a covariance matrix) of patches of passive tracers. This model was trained with data from a realistic numerical simulation of the Dutch Wadden Sea: a multiple-inlet system of great ecological importance. Using the relevant drivers (wind, tidal amplitude, and atmospheric pressure), the model was set to learn the advection and dispersion after one tidal period of clouds of particles released on a 200 x 200 m grid, covering the entire DWS. Our results show that the model learned the system-wide temporal variability of both advection and dispersion, while the local spatial features were better reproduced for advection than for dispersion. We use the predicted advection and dispersion as inputs to a set of stochastic differential equations for the reconstruction of particle trajectories, as it is commonly done in particle tracking applications that employ diffusion instead of dispersion. We were able to predict the temporal evolution over several tidal periods of particle patches released from specific locations under contrasting cases like calm and stormy conditions. Our method was employed to predict only the horizontal spreading, but it can be extended to predict the 3D evolution of the particle clouds. Finally, our approach requires simulation data and relevant drivers (e.g. atmospheric forcing and tidal amplitudes) for training and the same drivers from any typical forecast systems for forecasting the evolution of particle patches, which makes it a promising operational tool.

How to cite: Fajardo-Urbina, J. M., Liu, Y., Gräwe, U., Georgievska, S., Grootes, M. W., Clercx, H. J. H., Gerkema, T., and Duran-Matute, M.: Forecast of Particle Spreading Using Machine Learning in a Complex Multiple-Inlet Coastal System, EGU General Assembly 2023, Vienna, Austria, 23–28 Apr 2023, EGU23-6537, https://doi.org/10.5194/egusphere-egu23-6537, 2023.

EGU23-7212 | ECS | Orals | NP6.3

Lagrangian tracer spreading in surface ocean turbulence with ageostrophic dynamics 

Michael Maalouly, Gilmar Mompean, and Stefano Berti

Ocean submesoscales are characterized by horizontal scales smaller than approximately 10 km that evolve with timescales of O(1) day. Due to their small size and rapid temporal evolution, they are notoriously difficult to measure. In particular, the associated velocity field is not resolved in current satellite altimetry products. At these scales, surface ocean flows are populated by small eddies, and filaments linked with strong gradients of physical properties, such as temperature. Several recent studies indicate that submesoscale fronts are associated with important vertical velocities, thus playing a significant role in vertical transport. On that account, these fine-scale flows are key to the dynamical coupling between the interior and the surface of the ocean, as well as to plankton dynamics and marine ecology. In spite of their importance, the understanding of submesoscale ocean dynamics is still incomplete. In particular, a relevant open question concerns the role played by the ageostrophic components of the surface velocity field that manifest at these scales.

By means of numerical simulations, we investigate ocean submesoscale turbulence in the SQG+1 model, which accounts for ageostrophic motions generated at fronts, and which is obtained as a small-Rossby-number approximation of the primitive equations. In the limit of vanishing Rossby number, this system gives surface quasi-geostrophic (SQG) dynamics. In this study, we explore the effect of the ageostrophic flow components on the spreading process of Lagrangian tracer particles on the horizontal. We particularly focus on the characterization of pair-dispersion regimes and particle clustering, as a function of the Rossby number, using different indicators. The observed Lagrangian behaviours are further related to the structure of the underlying turbulent flow. We find that relative dispersion is essentially unaffected by the ageostrophic flow components. However, these components are found to be responsible for (temporary) particle aggregation in cyclonic frontal regions. These results appear interesting for the modelling of submesoscale dynamics and for comparison purposes with the new high-resolution surface current data that will be soon provided by the satellite SWOT.

How to cite: Maalouly, M., Mompean, G., and Berti, S.: Lagrangian tracer spreading in surface ocean turbulence with ageostrophic dynamics, EGU General Assembly 2023, Vienna, Austria, 23–28 Apr 2023, EGU23-7212, https://doi.org/10.5194/egusphere-egu23-7212, 2023.

EGU23-7220 | ECS | Orals | NP6.3

Impact of Model Resolution on Mixing and Dispersion in the Gulf of Mexico 

Nektaria Ntaganou, Eric Chassignet, and Alexandra Bozec

We investigate the importance of model resolution in identifying the nature of mixing and dispersion in the Gulf of Mexico, by comparing two data-assimilative, high-resolution simulations, one of which is submesoscale-resolving. By employing both Eulerian and Lagrangian metrics, upper-ocean differences between the mesoscale- and submesoscale-resolving simulations are examined. Focusing on regions characterized by high submesoscale activity, we approach the notion of mixing by tracking the generation of Lagrangian Coherent Structures (LCSs) and transport barriers. Finite-time Lyapunov exponents (FTLE) fields reveal higher separation rates of fluid particles in the submesoscale-resolving case which indicates more vigorous mixing. Using probability density functions (PDFs), the extent of mixing homogeneity is also explored, with preliminary results suggesting that mixing is more homogeneous in the submesosclae-resolving case. Finally, we aim to identify regions of convergence in the areas of interest by advecting passive tracers that tend to organize themselves along attracting LCSs. Applications of passive tracer advection are then translated to extreme event situations, such as the Deepwater Horizon.  

How to cite: Ntaganou, N., Chassignet, E., and Bozec, A.: Impact of Model Resolution on Mixing and Dispersion in the Gulf of Mexico, EGU General Assembly 2023, Vienna, Austria, 23–28 Apr 2023, EGU23-7220, https://doi.org/10.5194/egusphere-egu23-7220, 2023.

EGU23-8646 | Orals | NP6.3

Mixing and transport across the Atlantic Meridional Overturning Circulation: a 3D geometrical perspective 

Ana M. Mancho, Renzo Bruera, Jezabel Curbelo, and Guillermo Garcia-Sanchez

Vertical motions across the ocean are central to processes, like CO2 fixation, heat removal or pollutant transport, which are essential to the Earth’s climate. This presentation describes 3D conveyor routes across the Atlantic Meridional Overturning Circulation (AMOC), with the support of Lagrangian Coherent Structures. Our findings show the geometry of mixing structures in the upper and deep ocean layers. We identify among others, zones linked to vertical transport and characterize vertical transport time scales.


Acknowledgments: RB acknowledges support of a CSIC JAE intro fellowship.  AMM and GGS acknowledge the support of a CSIC PIE project Ref. 202250E001 and MICINN grants PID2021-123348OB-I00 and EIN2020-112235. AMM is an active member of the CSIC Interdisciplinary Thematic Platforms POLARCSIC. JC acknowledges the support of the RyC project RYC2018-025169, the Spanish grant PID2020-114043GB-I00 and the Catalan Grant No. 2017SGR1049 and the ``Beca Leonardo a Investigadores y Creadores Culturales 2022 de la Fundación BBVA''.

How to cite: Mancho, A. M., Bruera, R., Curbelo, J., and Garcia-Sanchez, G.: Mixing and transport across the Atlantic Meridional Overturning Circulation: a 3D geometrical perspective, EGU General Assembly 2023, Vienna, Austria, 23–28 Apr 2023, EGU23-8646, https://doi.org/10.5194/egusphere-egu23-8646, 2023.

On 13 August 2021, the Fukutoku-Okanoba submarine volcano in the North Pacific Ocean was erupted. Satellites detected many pumice rafts that drifted westward to reach southern Japan in about two months. To cope with potential danger due to the pumice rafts, it is crucial to predict their trajectories. Using a Lagrangian particle tracking model, the trajectories of the rafts were investigated. The model results showed strong sensitivity to the windage coefficient of pumice rafts, which is uncertain and could cause large errors. By comparing the model results with satellite images using a skill score, the distance between a simulated particle and the nearest observed raft divided by the travel distance of the particle, an optimal windage coefficient was estimated. The optimal windage coefficients ranging between 2 to 3% produced pathways comparable to the obervation using satellites. The pumice rafts  moved from Fukutoku-Okanoba, toward the Ryukyu Islands for approximately two months before being pushed toward Taiwan by the intensified wind. The techniques presented here may become helpful in managing coastal hazards due to diverse marine debris.

How to cite: Park, Y.-G., Iskandar, M. R., kim, K., and Jin, H.: Tracking the pumice rafts from the recent eruption of the submarine volcano Fukutoku-Okanoba, Japan using Satellites and Lagrangian Particles tracking, EGU General Assembly 2023, Vienna, Austria, 23–28 Apr 2023, EGU23-10296, https://doi.org/10.5194/egusphere-egu23-10296, 2023.

EGU23-11091 | Posters virtual | NP6.3

Detection of materially coherent eddies in the Bay of Bengal 

Lijin Jayan, Jishad Mandayi, Neeraj Agarwal, Rashmi Sharma, and Manikandan Mathur

Eddies are prominent features in the ocean and these energetic circulatory motions influence lateral and vertical transport of heat, mass and momentum. Ability of these eddies to coherently transport various scalar species is an important consideration in understanding freshwater transport, locating regions of harmful algal blooms, oxygen deficient zones and potential fishing zones. In this study, we present an implementation of Lagrangian Averaged Vorticity Deviation (LAVD) technique to detect materially coherent eddies from satellite derived sea surface currents in the Bay of Bengal (BoB). We also evaluate the efficacy of a Eulerian method based on sea surface height (SSH) in capturing materially coherent eddies in the BoB. Parameter values for robust detection of eddies are determined by performing a systematic sensitivity analysis in both the methods. Finite time material behaviour of eddies detected using both the methods are evaluated by numerical particle advection experiments. We then focus on material coherence of Sri Lanka Dome (SLD), an annually occurring cyclonic eddy of dynamical relevance in the BoB. SLD characteristics including its spatio-temporal evolution is discussed by analysing ocean surface currents data spanning 27 years from 1993 to 2019.

How to cite: Jayan, L., Mandayi, J., Agarwal, N., Sharma, R., and Mathur, M.: Detection of materially coherent eddies in the Bay of Bengal, EGU General Assembly 2023, Vienna, Austria, 23–28 Apr 2023, EGU23-11091, https://doi.org/10.5194/egusphere-egu23-11091, 2023.

EGU23-13939 | ECS | Orals | NP6.3

Inertial effects on the transport of an anisotropic particle in surface gravity waves 

Himanshu Mishra and Anubhab Roy

We study the transportation and rotational dynamics of a finite-sized spheroidal particle in a linear monochromatic surface gravity wave to better understand the transport dynamics of microplastics in oceanic flows. A spheroidal particle, modeled as an anisotropic tracer, attains preferential alignment in a linear wavy flow. We analyze the drift of a finite-size anisotropic particle and find that the horizontal drift of such particles can either increase or decrease depending on the initial orientation and the ratio of the size of the particle to the wavelength of the background wave field. Next, we derive the finite-size modification to the preferred alignment of the spheroidal particle with the flow propagation direction of the wave. In most scenarios, particles in the ocean can have a wide range of densities and are classified into positively and negatively buoyant particles. Negatively buoyant particles settle in a wavy flow with complex trajectories. We study the effect of the orientation and size of such particles on settling and show that the aspect ratio of the particle could alter the trajectory in the wave propagation direction. We also obtain a non-zero vertical Stokes drift. Finally, we consider the effects of fluid and particle inertia in our coupled evolution equations and study the drift and the orientation of an anisotropic particle in a wavy flow field. We demonstrate that considering such an effect could provide a complete picture of the transport and dynamics of microplastics in the upper part of the ocean that can be described more accurately. 

How to cite: Mishra, H. and Roy, A.: Inertial effects on the transport of an anisotropic particle in surface gravity waves, EGU General Assembly 2023, Vienna, Austria, 23–28 Apr 2023, EGU23-13939, https://doi.org/10.5194/egusphere-egu23-13939, 2023.

EGU23-14947 | Posters on site | NP6.3

Small-scale Lagrangian modelling of air bubbles and oil droplets under breaking waves 

Tor Nordam and Arsalan Mostaani

Lagrangian transport modelling is commonly applied for marine environmental transport problems. When applied to problems on a timescale of days to weeks, such as marine oil spills, Lagrangian models are often forced with environmental data from operational models for atmosphere, waves and ocean currents. These models typically have a temporal resolution of around 1 hour. Effects that take place on shorter timescale, such as entrainment of oil droplets and air bubbles due to breaking waves, must therefore be parametereised.

On short timescales, the random flight approach is clearly more realistic than a random walk, since the particles have a well-defined and realistic velocity, regardless of the length of the timestep, and since particles in real turbulence do not instantaneously change their direction by arbitrarily large amounts. A consequence of this is that in random flight, particles exhibit superdiffusion on short timescales, and normal diffusion on long timescales, compared to the de-correlation time of the turbulent motion. Random walk methods, on the other hand, always behave as diffusion. Hence, random flight methods are expected to be more relevant for small-scale modelling of transport on short timescale under breaking waves.

Here, we consider small-scale modelling of oil droplet and air bubble entrainment, modelling the transport close to the surface, and at high temporal resolution. We use two different Lagrangian methods: random walk (AR0) and random flight (AR1), and compare the two modelling approaches to each other, as well as to pre-existing parameterisations of the average effects of entrainment. Input parameters to the Lagrangian models are informed by experimental turbulence measurements in a wave flume, and RANS-modelling of the breaking wave. Comparison of particle transport to observations in experimental flume work is ongoing.

How to cite: Nordam, T. and Mostaani, A.: Small-scale Lagrangian modelling of air bubbles and oil droplets under breaking waves, EGU General Assembly 2023, Vienna, Austria, 23–28 Apr 2023, EGU23-14947, https://doi.org/10.5194/egusphere-egu23-14947, 2023.

EGU23-15421 | ECS | Posters on site | NP6.3

Lagrangian dynamics of heavy inertial particles on vortical flows 

Anu Viswanathan Sreekumari Nath and Anubhab Roy

We study the dynamics of dust particles in various vortical flows which is relevant to geophysical context. The inertial particles are advected by the background vortex flow. The dynamics is tracked using the Maxey-Riley equation. The finite inertia of the particles make their dynamics different from passive fluid parcels, which is interesting. The dust particles may show periodic dynamics or chaotic diffusion depending on parametric variations. The result contradicts the earlier predictions that only density matched inertial particles can have chaotic dynamics, which we justify through our explanation. In addition, the heavy inertial particles in a self rotating vortex patch is observed to be attracted near the vortical region, which is contrary to the physics where they should ideally centrifuged out. The reason behind this phenomena also we explore in detail here.

How to cite: Viswanathan Sreekumari Nath, A. and Roy, A.: Lagrangian dynamics of heavy inertial particles on vortical flows, EGU General Assembly 2023, Vienna, Austria, 23–28 Apr 2023, EGU23-15421, https://doi.org/10.5194/egusphere-egu23-15421, 2023.

EGU23-15441 | ECS | Posters on site | NP6.3

Measurements of bubble size distribution underneath breaking waves 

Arsalan Mostaani, Tor Nordam, and Emlyn Davies

Entrainment of particles by breaking waves are an important process for several applications. For example, entrainment of air bubbles is relevant for air-sea gas exchange, which in turn is relevant for climate modelling. Entrainment of oil droplets in a marine oil spill will have an effect on the fate of the oil, and help determine environmental effects. Hence, being able to measure and model these entrainment effects are important.

We are conducting experiments in a linear wave flume, with piston-type wave maker, looking at entrainment of air bubbles under breaking waves. Using a camera system with a uniform backlight and a telecentric lens, the SINTEF SilCam, we can image bubbles ranging in size from tens of micrometers, to cm scale. By accurately constraining the measurement volume, we can determine concentration of bubbles of different sizes. Taking images at high frequency, and repeating the same breaking wave many times, we are able to measure the time-development of the ensemble-average bubble size distribution.

In this poster, we describe the camera system and the image analysis pipeline, and we present some preliminary results and discuss some of the inherent challenges in measuring bubble size distributions close to the surface underneath breaking waves.

How to cite: Mostaani, A., Nordam, T., and Davies, E.: Measurements of bubble size distribution underneath breaking waves, EGU General Assembly 2023, Vienna, Austria, 23–28 Apr 2023, EGU23-15441, https://doi.org/10.5194/egusphere-egu23-15441, 2023.

EGU23-2843 | ECS | PICO | ESSI1.1

Geography-Aware Masked Autoencoders for Change Detection in Remote Sensing 

Lukas Kondmann, Caglar Senaras, Yuki M. Asano, Akhil Singh Rana, Annett Wania, and Xiao Xiang Zhu

Increasing coverage of commercial and public satellites allows us to monitor the pulse of the Earth in ever-shorter frequency (Zhu et al., 2017). Together with the rise of deep learning in artificial intelligence (AI) (LeCun et al., 2015), the field of AI for Earth Observation (AI4EO) is growing rapidly. However, many supervised deep learning techniques are data-hungry, which means that annotated data in large quantities are necessary to help these algorithms reach their full potential. In many Earth Observation applications such as change detection, this is often infeasible because high-quality annotations require manual labeling which is time-consuming and costly.  

Self-supervised learning (SSL) can help tackle the issue of limited label availability in AI4EO. In SSL, an algorithm is pretrained with tasks that only require the input data without annotation. Notably, Masked Autoencoders (MAE) have shown promising performances recently where a Vision Transformer learns to reconstruct a full image with only 25% of it as input. We hypothesize that the success of MAEs also extends to satellite imagery and evaluate this with a change detection downstream task. In addition, we provide a multitemporal DINO baseline which is another widely successful SSL method. Further, we test a second version of MAEs, which we call GeoMAE. GeoMAE incorporates the location and date of the satellite image as auxiliary information in self-supervised pretraining. The coordinates and date information are passed as additional tokens to the MAE model similar to the positional encoding. 
The pretraining dataset used is the RapidAI4EO corpus which contains multi-temporal Planet Fusion imagery for a variety of locations across Europe. The dataset for the downstream task also uses Planet Fusion in pairs as input data. These are provided on a 600m * 600m patch level three months apart together with a classification if the respective patch has changed in this period. Self-supervised pretraining is done for up to 150 epochs where we take the model with the best validation performance on the downstream task as a starting point for the test set. 

We find that the regular MAE model scores the best on the test set with an accuracy of 81.54% followed by DINO with 80.63% and GeoMAE with 80.02%. Pretraining MAE with ImageNet data instead of satellite images results in a notable performance loss down to 71.36%. Overall, our current pretraining experiments can not yet confirm our hypothesis that GeoMAE is advantageous compared to regular MAE. However, in similar spirit, Cong et al. (2022) recently introduced SatMAE which outlines that for other remote sensing applications, the combination of auxiliary information and novel masking strategies is a key factor. Therefore, it seems that a combination of location and time inputs together with adapted masking may also hold the most potential for change detection. There is ample potential for future research in geo-specific applications of MAEs and we provide a starting point for this with our experimental results for change detection. 

How to cite: Kondmann, L., Senaras, C., Asano, Y. M., Rana, A. S., Wania, A., and Zhu, X. X.: Geography-Aware Masked Autoencoders for Change Detection in Remote Sensing, EGU General Assembly 2023, Vienna, Austria, 23–28 Apr 2023, EGU23-2843, https://doi.org/10.5194/egusphere-egu23-2843, 2023.

EGU23-3267 | ECS | PICO | ESSI1.1

Decomposition learning based on spatial heterogeneity: A case study of COVID-19 infection forecasting in Germany 

Ximeng Cheng, Jost Arndt, Emilia Marquez, and Jackie Ma

New models are emerging from Artificial Intelligence (AI) and its sub-fields, in particular, Machine Learning and Deep Learning that are being applied in different application areas including geography (e.g., land cover identification and traffic volume forecasting based on spatial data). Different from well-known datasets often used to develop AI models (e.g., ImageNet for image classification), spatial data has an intrinsic feature, i.e., spatial heterogeneity, which leads to varying relationships across different regions between the independent (i.e., the model input X) and dependent variables (i.e., the model output Y). This makes it difficult to conduct large-scale studies with a single robust AI model. In this study, we draw on the idea of modular learning, i.e., to decompose large-scale tasks into sub-tasks for specific sub-regions and use multiple AI models to achieve these sub-tasks. The decomposition is based on the spatial characteristics to ensure that the relationship between independent and dependent variables is similar in each sub-region. We explore this approach for forecasting COVID-19 cases in Germany using spatiotemporal data (e.g., weather data and human mobility data) as an example and compare the prediction tasks with a single model to the proposed decomposition learning procedure in terms of accuracy and efficiency. This study is part of the project DAKI-FWS which is funded by the Federal Ministry of Economic Affairs and Climate Action in Germany to develop an early warning system to stabilize the German economy.

How to cite: Cheng, X., Arndt, J., Marquez, E., and Ma, J.: Decomposition learning based on spatial heterogeneity: A case study of COVID-19 infection forecasting in Germany, EGU General Assembly 2023, Vienna, Austria, 23–28 Apr 2023, EGU23-3267, https://doi.org/10.5194/egusphere-egu23-3267, 2023.

EGU23-4929 | PICO | ESSI1.1

Using AI and ML to support marine science research 

Ilaria Fava, Peter Thijsse, Gergely Sipos, and Dick Schaap

The iMagine project is devoted to developing and delivering imaging data and services for aquatic science. Started in September 2022, the project will provide a portfolio of image data collections, high-performance image analysis tools empowered with Artificial Intelligence, and best practice documents for scientific image analysis. These services and documentation will enable better and more efficient processing and analysis of imaging data in marine and freshwater research, accelerating our scientific insights about processes and measures relevant to healthy oceans, seas, and coastal and inland waters. By building on the European Open Science Cloud compute platform, iMagine delivers a generic framework for AI model development, training, and deployment, which researchers can adopt for refining their AI-based applications for water pollution mitigation, biodiversity and ecosystem studies, climate change analysis and beach monitoring, but also for developing and optimising other AI-based applications in this field. The iMagine AI development and testing framework offers neural networks, parallel post-processing of extensive data, and analysis of massive online data streams in distributed environments. The synergies among the eight aquatic use cases in the project will lead to common solutions in data management, quality control, performance, integration, provenance, and FAIRness and contribute to harmonisation across RIs. The resulting iMagine AI development and testing platform and the iMagine use case applications will provide another component to the European marine data management landscape, valid for the Digital Twin of the Ocean, EMODnet, Copernicus, and international initiatives. 

How to cite: Fava, I., Thijsse, P., Sipos, G., and Schaap, D.: Using AI and ML to support marine science research, EGU General Assembly 2023, Vienna, Austria, 23–28 Apr 2023, EGU23-4929, https://doi.org/10.5194/egusphere-egu23-4929, 2023.

EGU23-6818 | ECS | PICO | ESSI1.1

Eddy identification from along-track altimeter data with multi-modal deep learning 

Adili Abulaitijiang, Eike Bolmer, Ribana Roscher, Jürgen Kusche, and Luciana Fenoglio-Marc

Eddies are circular rotating water masses, which are usually generated near the large ocean currents, e.g., Gulf Stream. Monitoring eddies and gaining knowledge on eddy statistics over a large region are important for fishery, marine biology studies, and testing ocean models.

At mesoscale, eddies are observed in radar altimetry, and methods have been developed to identify, track and classify them in gridded maps of sea surface height derived from multi-mission data sets. However, this procedure has drawbacks since much information is lost in the gridded maps. Inevitably, the spatial and temporal resolution of the original altimetry data degrades during the gridding process. On the other hand, the task of identifying eddies has been a post-analysis process on the gridded dataset, which is, by far, not meaningful for near-real time applications or forecasts. In the EDDY project at the University of Bonn, we aim to develop methods for identifying eddies directly from along track altimetry data via a machine (deep) learning approach.

Since eddy signatures (eddy boundary and highs and lows on sea level anomaly, SLA) are not possible to extract directly from along track altimetry data, the gridded altimetry maps from AVISO are used to detect eddies. These will serve as the reference data for Machine Learning. The eddy detection on 2D grid maps is produced by open-source geometry-based approach (e.g., py-eddy-tracker, Mason et al., 2014) with additional constraints like Okubo-Weiss parameter. Later, Sea Surface Temperature (SST) maps of the same region and date (also available from AVISO) are used for manually cleaning the reference data. Noting that altimetry grid maps and SST maps have different temporal and spatial resolution, we also use the high resolution (~6 km) ocean modeling simulation dataset (e.g., FESOM, Finite Element Sea ice Ocean Model). In this case, the FESOM dataset provides a coherent, high-resolution SLA and SST, salinity maps for the study area and is a potential test basis to develop the deep learning network.

The single modal training via a Conventional Neural Network (CNN) for the 2D altimetry grid maps produced excellent dice score of 86%, meaning the network almost detects all eddies in the Gulf Stream, which are consistent with reference data. For the multi-modal training, two different training networks are developed for 1D along-track altimetry data and 2D grid maps from SLA and SST, respectively, and then they are combined to give the final classification output. A transformer model is deemed to be efficient for encoding the spatiotemporal information from 1D along track altimetry data, while CNN is sufficient for 2D grid maps from multi-sensors.

In this presentation, we show the eddy classification results from the multi-modal deep learning approach based on along track and gridded multi-source datasets for the Gulf stream area for the period between 2017 and 2019. Results show that multi-modal deep learning improve the classification by more than 20% compared to transformer model training on along-track data alone.

How to cite: Abulaitijiang, A., Bolmer, E., Roscher, R., Kusche, J., and Fenoglio-Marc, L.: Eddy identification from along-track altimeter data with multi-modal deep learning, EGU General Assembly 2023, Vienna, Austria, 23–28 Apr 2023, EGU23-6818, https://doi.org/10.5194/egusphere-egu23-6818, 2023.

EGU23-8479 | ECS | PICO | ESSI1.1

Model evaluation strategy impacts the interpretation and performance of machine learning models 

Lily-belle Sweet, Christoph Müller, Mohit Anand, and Jakob Zscheischler

Machine learning models are able to capture highly complex, nonlinear relationships, and have been used in recent years to accurately predict crop yields at regional and national scales. This success suggests that the use of ‘interpretable’ or ‘explainable’ machine learning (XAI) methods may facilitate improved scientific understanding of the compounding interactions between climate, crop physiology and yields. However, studies have identified implausible, contradicting or ambiguous results from the use of these methods. At the same time, researchers in fields such as ecology and remote sensing have called attention to issues with robust model evaluation on spatiotemporal datasets. This suggests that XAI methods may produce misleading results when applied to spatiotemporal datasets, but the impact of model evaluation strategy on the results of such methods has not yet been examined.

In this study, machine learning models are trained to predict simulated crop yield, and the impact of model evaluation strategy on the interpretation and performance of the resulting models is assessed. Using data from a process-based crop model allows us to then comment on the plausibility of the explanations provided by common XAI methods. Our results show that the choice of evaluation strategy has an impact on (i) the interpretations of the model using common XAI methods such as permutation feature importance and (ii) the resulting model skill on unseen years and regions. We find that use of a novel cross-validation strategy based on clustering in feature-space results in the most plausible interpretations. Additionally, we find that the use of this strategy during hyperparameter tuning and feature selection results in improved model performance on unseen years and regions. Our results provide a first step towards the establishment of best practices for model evaluation strategy in similar future studies.

How to cite: Sweet, L., Müller, C., Anand, M., and Zscheischler, J.: Model evaluation strategy impacts the interpretation and performance of machine learning models, EGU General Assembly 2023, Vienna, Austria, 23–28 Apr 2023, EGU23-8479, https://doi.org/10.5194/egusphere-egu23-8479, 2023.

EGU23-9437 | PICO | ESSI1.1

On Unsupervised Learning from Environmental Data 

Mikhail Kanevski

Predictive learning from data usually is formulated as a problem of finding the best connection between input and output spaces by optimizing well-defined cost or risk functions.

In geo-environmental studies input space is usually constructed from the geographical coordinates and features generated from different sources of available information (feature engineering), by applying expert knowledge, using deep learning technologies and taking into account the objectives of the study. Often, it is not known in advance if the input space is complete or contains redundant features. Therefore, unsupervised learning (UL) is essential in environmental data analysis, modelling, prediction and visualization. UL also helps better understand the data and phenomena they describe as well as in interpreting/communicating modelling strategies and the results in the decision-making process.

The main objective of the present investigation is to review some important topics in unsupervised learning from environmental data: 1) quantitative description of the input space (“monitoring network”) structure using global and local topological and fractal measures, 2) dimensionality reduction, 3) unsupervised feature selection and clustering by applying a variety of machine learning algorithms (kernel-based, ensemble learning, self-organizing maps) and visualization tools.

Major attention is paid to the simulated and real spatial data (pollution, permafrost, geomorphological and wind fields data).  Considered case studies have different input space dimensionality/topology and number of measurements. It is confirmed that UL should be considered an integral part of a generic methodology of environmental data analysis. Comprehensive comparisons and discussions of the results conclude the research.


How to cite: Kanevski, M.: On Unsupervised Learning from Environmental Data, EGU General Assembly 2023, Vienna, Austria, 23–28 Apr 2023, EGU23-9437, https://doi.org/10.5194/egusphere-egu23-9437, 2023.

EGU23-11601 | PICO | ESSI1.1

Clustering Geodata Cubes (CGC) and Its Application to Phenological Datasets 

Francesco Nattino, Ou Ku, Meiert W. Grootes, Emma Izquierdo-Verdiguier, Serkan Girgin, and Raúl Zurita-Milla

Unsupervised classification techniques are becoming essential to extract information from the wealth of data that Earth observation satellites and other sensors currently provide. These datasets are inherently complex to analyze due to the extent across multiple dimensions - spatial, temporal, and often spectral or band dimension – their size, and the high resolution of current sensors. Traditional one-dimensional cluster analysis approaches, which are designed to find groups of similar elements in datasets such as rasters or time series, may come short of identifying patterns in these higher-dimensional datasets, often referred to as data cubes. In this context, we present our Clustering Geodata Cubes (CGC) software, an open-source Python package that implements a set of co- and tri-clustering algorithms to simultaneously group elements across two and three dimensions, respectively. The package includes different implementations to most efficiently tackle datasets that fit into the memory of a single machine as well as very large datasets that require cluster computing. A refining strategy to facilitate data pattern identification is also provided. We apply CGC to investigate gridded datasets representing the predicted day of the year when spring onset events (first leaf, first bloom) occur according to a well-established phenological model. Specifically, we consider spring indices computed at high spatial resolution (1 km) and continental scale (conterminous United States) for the last 40+ years and extract the main spatiotemporal patterns present in the data via CGC co-clustering functionality.  

How to cite: Nattino, F., Ku, O., Grootes, M. W., Izquierdo-Verdiguier, E., Girgin, S., and Zurita-Milla, R.: Clustering Geodata Cubes (CGC) and Its Application to Phenological Datasets, EGU General Assembly 2023, Vienna, Austria, 23–28 Apr 2023, EGU23-11601, https://doi.org/10.5194/egusphere-egu23-11601, 2023.

EGU23-12773 | PICO | ESSI1.1

Industrial Atmospheric Pollution Estimation Using Gaussian Process Regression 

Anton Sokolov, Hervé Delbarre, Daniil Boldyriev, Tetiana Bulana, Bohdan Molodets, and Dmytro Grabovets

Industrial pollution remains a major challenge in spite of recent technological developments and purification procedures. To effectively monitor atmosphere contamination, data from air quality networks should be coupled with advanced spatiotemporal statistical methods.

Our previous studies showed that standard interpolation techniques (like inverse distance weighting, linear or spline interpolation, kernel-based Gaussian Process Regression, GPR) are quite limited for the simulation of a smoke-like narrow-directed industrial pollution in the vicinity of the source (a few tenths of kilometers). In this work, we try to apply GPR, based on statistically estimated covariances. These covariances are calculated using СALPUFF atmospheric pollution dispersion model for a one-year simulation in the Kryvyi Rih region. The application of GPR permits taking into account high correlations between pollution values in neighboring points revealed by modeling. The result of the GPR covariance-based technique is compared with other interpolation techniques. It can be used then in the estimation and optimization of air quality networks.

How to cite: Sokolov, A., Delbarre, H., Boldyriev, D., Bulana, T., Molodets, B., and Grabovets, D.: Industrial Atmospheric Pollution Estimation Using Gaussian Process Regression, EGU General Assembly 2023, Vienna, Austria, 23–28 Apr 2023, EGU23-12773, https://doi.org/10.5194/egusphere-egu23-12773, 2023.

EGU23-12933 | ECS | PICO | ESSI1.1

Estimating vegetation carbon stock components by linking ground databases with Earth observations 

Daniel Kinalczyk, Christine Wessollek, and Matthias Forkel

Land ecosystems dampen the increase of atmospheric CO2 by storing carbon in soils and vegetation. In order to estimate how long carbon stays in land ecosystems, a detailed knowledge about the distribution of carbon in different vegetation components is needed. Current Earth observation products provide estimates about total above-ground biomass but do not further separate between carbon stored in trees, understory vegetation, shrubs, grass, litter or woody debris. Here we present an approach in which we link several Earth observation products with a ground-based database to estimate biomass in various vegetation components. Therefore, we use information about the statistical distribution of biomass components provided by the North American Wildland Fuels Database (NAWFD), which are however not available as geocoded data. We use ESA CCI AGB version 3 data from 2010 as a proxy in order to link the NAWFD data to the spatial information from Earth observation products. The biomass and corresponding uncertainty from the ESA CCI AGB and a map of vegetation types are used to select the likely distribution of vegetation biomass components from the set of in-situ measurements of tree biomass. We then apply Isolation Forest outlier detection and bootstrapping for a robust comparison of both datasets and for uncertainty estimation. We use Random Forest and Gaussian Process regression to predict the biomass of trees, shrubs, snags, herbaceous vegetation, coarse and fine woody debris, duff and litter from ESA CCI AGB and land cover, GEDI canopy height, Sentinel-3 LAI and bioclimatic data. The regression models reach high predictive power and allow to also extrapolate to other regions. Our derived estimates of vegetation carbon stock components provide a more detailed view on the land carbon storage and contribute to an improved estimate of potential carbon emissions from respiration, disturbances and fires.

How to cite: Kinalczyk, D., Wessollek, C., and Forkel, M.: Estimating vegetation carbon stock components by linking ground databases with Earth observations, EGU General Assembly 2023, Vienna, Austria, 23–28 Apr 2023, EGU23-12933, https://doi.org/10.5194/egusphere-egu23-12933, 2023.

EGU23-13196 | ECS | PICO | ESSI1.1

From Super-Resolution to Downscaling - An Image-Inpainting Deep Neural Network for High Resolution Weather and Climate Models 

Maximilian Witte, Danai Filippou, Étienne Plésiat, Johannes Meuer, Hannes Thiemann, David Hall, Thomas Ludwig, and Christopher Kadow

High resolution in weather and climate was always a common and ongoing goal of the community. In this regards, machine learning techniques accompanied numerical and statistical methods in recent years. Here we demonstrate that artificial intelligence can skilfully downscale low resolution climate model data when combined with numerical climate model data. We show that recently developed image inpainting technique perform accurate super-resolution via transfer learning using the HighResMIP of CMIP6 (Coupled Model Intercomparison Project Phase 6) experiments. Its huge data base offers a unique training opportunity for machine learning approaches. The transfer learning purpose allows also to downscale other CMIP6 experiments and models, as well as observational data like HadCRUT5. Combined with the technology of Kadow et al. 2020 of infilling missing climate data, we gain a neural network which reconstructs and downscales the important observational data set (IPCC AR6) at the same time. We further investigate the application of our method to downscale quantities predicted from a numerical ocean model (ICON-O) to improve computation times. In this process we focus on the ability of the model to predict eddies from low-resolution data.

An extension to:

Kadow, C., Hall, D.M. & Ulbrich, U. Artificial intelligence reconstructs missing climate information. Nature Geoscience 13, 408–413 (2020). https://doi.org/10.1038/s41561-020-0582-5

How to cite: Witte, M., Filippou, D., Plésiat, É., Meuer, J., Thiemann, H., Hall, D., Ludwig, T., and Kadow, C.: From Super-Resolution to Downscaling - An Image-Inpainting Deep Neural Network for High Resolution Weather and Climate Models, EGU General Assembly 2023, Vienna, Austria, 23–28 Apr 2023, EGU23-13196, https://doi.org/10.5194/egusphere-egu23-13196, 2023.

EGU23-14716 | ECS | PICO | ESSI1.1

Spatial-temporal transferability assessment of remote sensing data models for mapping agricultural land use 

Jayan Wijesingha, Ilze Dzene, and Michael Wachendorf

To assess the impact of anthropogenic and natural causes on land use and land use cover change, mapping of spatial and temporal changes is increasingly applied. Due to the availability of satellite image archives, remote sensing (RS) data-based machine learning models are in particular suitable for mapping and analysing land use and land cover changes. Most often, models trained with current RS data are employed to estimate past land cover and land use using available RS data with the assumption that the trained model predicts past data values similar to the accuracy of present data. However, machine learning models trained on RS data from particular locations and times may not be well transferred to new locations and time datasets due to various reasons. This study aims to assess the spatial-temporal transferability of the RS data models in the context of agricultural land use mapping. The study was designed to map agricultural land use (5 classes: maize, grasslands, summer crops, winter crops, and mixed crops) in two regions in Germany (North Hesse and Weser Ems) between the years 2010 and 2018 using Landsat archive data (i.e., Landsat 5, 7, and 8). Three model transferability scenarios were evaluated, a) temporal - S1, b) spatial - S2 and c) spatial-temporal - S3. Two machine learning models (random forest - RF and Convolution Neural Network - CNN) were trained. For each transferability scenario, class-level F1 and macro F1 values were compared between the reference and targeted transferability systems. Moreover, to explain the results of transferability scenarios, transferability results were further explored using dissimilarity index and area of applicability (AOA) concepts. The average macro F1 value of the trained model for the reference scenario (no transferability) was 0.75. For assessed transferability scenarios, the average macro F1 values were 0.70, 0.65 and 0.60, for S1, S2, and S3 respectively. It shows that, when predicting data from different spatial-temporal contexts, the model performance is decreasing. In contrast, the average proportion of the data inside the AOA did not show a clear pattern for different scenarios. In the context of RS data-related model building, spatial-temporal transferability is essential because of the limited availability of the labelled data. Thus, the results from this case study provide an understanding of how model performance changes when the model is transferred to new settings with data from different temporal and spatial domains.

How to cite: Wijesingha, J., Dzene, I., and Wachendorf, M.: Spatial-temporal transferability assessment of remote sensing data models for mapping agricultural land use, EGU General Assembly 2023, Vienna, Austria, 23–28 Apr 2023, EGU23-14716, https://doi.org/10.5194/egusphere-egu23-14716, 2023.

EGU23-16096 | ECS | PICO | ESSI1.1

Limitations of machine learning in a spatial context 

Jens Heinke, Christoph Müller, and Dieter Gerten

Machine learning algorithms have become popular tools for the analysis of spatial data. However, a number of studies have demonstrated that the application of machine learning algorithms in a spatial context has limitations. New geographic locations may lie outside of the data range for which the model was trained, and estimates of model performance may be too optimistic, when spatial autocorrelation of geographic data is not properly accounted for in cross-validation. We here use artificially created spatial data fields to conduct a series of experiments to further investigate the potential pitfalls of random forest regression applied to spatial data. We provide new insights on previously reported limitations and identify further limitations. We demonstrate that the same mechanism that leads to overoptimistic estimates of model performance (when based on ordinary random k-fold cross-validation) can also lead to a deterioration of model performance. When covariates contain sufficient information to deduce spatial coordinates, the model can reproduce any spatial pattern in the training data even if it is entirely or partly unrelated to the covariates. The presence of spatially correlated residuals in the training data changes how the model utilizes the information of the covariates and impedes the identification of the actual relationship between covariates and response. This reduces model performance when the model is applied to data with a different spatial structure. Under such conditions, machine learning methods that are sufficiently flexible to fit to autocorrelated residuals (such as random forest) may not be an optimal choice. Better models may be obtained using less flexible but more transparent approaches such as generalized linear models or additive models.

How to cite: Heinke, J., Müller, C., and Gerten, D.: Limitations of machine learning in a spatial context, EGU General Assembly 2023, Vienna, Austria, 23–28 Apr 2023, EGU23-16096, https://doi.org/10.5194/egusphere-egu23-16096, 2023.

EGU23-16768 | PICO | ESSI1.1

Knowledge Representation of Levee Systems - an Environmental Justice Perspective 

Armita Davarpanah, Anthony.l Nguy Robertson, Monica Lipscomb, Jacob.w. McCord, and Amy Morris

Levee systems are designed to reduce the risk of water-related natural hazards (e.g., flooding) in areas behind levees. Most levees in the U.S. are designed to protect people and facilities against the impacts of the 100-year floods. However, the current climate change is increasing the probability of the occurrence of 500-year flood events that in turn increases the likelihood of economic loss, environmental damage, and fatality that disproportionately impacts communities of color and low-income groups facing socio-economic inequities in leveed areas. The increased frequency and intensity of flooding is putting extra pressure on emergency responders that often require diverse, multi-dimensional data originating from different sources to make sound decisions. Currently, the integration of these heterogeneous data acquired by diverse sensors and emergency agencies about environmental, hydrological, and demographic indicators requires costly and complex programming and analysis that hinder rapid disaster management efforts. Our domain ‘Levee System Ontology (LSO)’ resolves the data integration and software interoperability issues by semantically modeling the static aspects, dynamic processes, and information content of the levee systems by extending the well-structured, top-level Basic Formal Ontology (BFO) and mid-level Common Core Ontologies (CCO). LSO’s class and property names follow the terminology of the National Levee Database (NLD), allowing data scientists using NLD data to constrain their classifications based on the knowledge represented in LSO. In addition to modeling the information related to the characteristics and status of the structural components of the levee system, LSO represents the residual risk in leveed areas, economic and environmental losses, and damage to facilities in case of breaching and/or overtopping of levees. LSO enables reasoning to infer components and places along levees and floodwalls where the system requires inspection, maintenance, and repair based on the status of system components. The ontology also represents the impact of flood management activities on different groups of people from an environmental justice perspective, based on the principles of DEI (diversity, equity, inclusion) as defined by the U.N. Sustainable Development Goals.

How to cite: Davarpanah, A., Nguy Robertson, A. L., Lipscomb, M., McCord, J. w., and Morris, A.: Knowledge Representation of Levee Systems - an Environmental Justice Perspective, EGU General Assembly 2023, Vienna, Austria, 23–28 Apr 2023, EGU23-16768, https://doi.org/10.5194/egusphere-egu23-16768, 2023.

In most places on the planet vegetation thrives: it is known as “greening Earth”. However in certain regions, especially in the Arctic, there are areas exhibiting a browning trend. This phenomenon is well known but not fully understood yet, and grasping its impact on local ecosystems requires involvement of scientists from different disciplines, including social sciences and humanities, as well as local populations. Here we focus on the Troms and Finnmark counties in northern Norway to assess the extent of the problem and any link with local environmental conditions as well as potential impacts. 

We have chosen to adopt an open and collaborative process and take advantage of the services offered by RELIANCE on the European Open Science Cloud (EOSC). RELIANCE delivers a suite of innovative and interconnected services that extend the capabilities of the European Open Science Cloud (EOSC) to support the management of the research lifecycle within Earth Science Communities and Copernicus Users. The RELIANCE project has delivered 3 complementary  technologies: Research Objects (ROs), Data Cubes and AI-based Text Mining. RoHub is a Research Object management platform that implements these 3 technologies and enables researchers to collaboratively manage, share and preserve their research work. 

We will show how we are using these technologies along with EGI notebooks to work open and share an executable Jupyter Notebook that is fully reproducible and reusable. We use a number of Python libraries from the Pangeo software stack such as Xarray, Dask and Zarr. Our Jupyter Notebook is bundled with its computational environment, datacubes and related bibliographic resources in an executable Research Object. We believe that this approach can significantly speed up the research process and can drive it to more exploitable results. 

Up to now, we have used indices derived from satellite data (in particular Sentinel-2) to assess how the vegetation cover in Troms and Finnmark counties has changed. To go a bit further we are investigating how to relate such information to relevant local parameters obtained from meteorological reanalysis data (ERA5 and ERA5-land from ECMWF). That should give a good basis for training an Artificial Intelligence algorithm and testing it, with the objective of getting an idea about the possibility of “predicting” what is likely to happen in the near future with certain types of vegetation like mosses and lichens which are essential for local populations and animals.

How to cite: Iaquinta, J. and Fouilloux, A.: Using FAIR and Open Science practices to better understand vegetation browning in Troms and Finnmark (Norway), EGU General Assembly 2023, Vienna, Austria, 23–28 Apr 2023, EGU23-2579, https://doi.org/10.5194/egusphere-egu23-2579, 2023.

EGU23-3639 | Orals | ESSI2.8

Data Proximate Computation; Multi-cloud approach on European Weather Cloud and Amazon Web Services  

Armagan Karatosun, Michael Grant, Vasileios Baousis, Duncan McGregor, Richard Care, John Nolan, and Roope Tervo

Although utilizing the cloud infrastructure for big data processing algorithms is increasingly common, the challenges of utilizing cloud infrastructures efficiently and effectively are often underestimated. This is especially true in multi-cloud scenarios where data are available only on a subset of the participating clouds. In this study, we have iteratively developed a solution enabling efficient access to ECMWF’s Numerical Weather Prediction (NWP) and EUMETSAT’s satellite data on the European Weather Cloud [1], in combination with UK Met Office assets in Amazon Web Services (AWS), in order to provide a common template for multi-cloud processing solutions in meteorological application development and operations in Europe.  

Dask [2] was chosen as the computing framework due to its widespread use in the meteorological community, its ability to automatically spread processing, and its flexibility in changing how workloads are distributed across physical or virtualized infrastructures while maintaining scalability. However, the techniques used here are generally applicable to other frameworks. The primary limitation in using Dask is that all nodes should be able to intercommunicate freely, which is a serious limitation when nodes are distributed over multiple clouds. Although it is possible to route between multiple cloud environments over the Internet, this introduces considerable administrative work (firewalls, security) as well as networking complexities (e.g., due to extensive use of potentially-clashing private IP ranges and NAT in clouds, or cost for public IPs). Virtual Private Networks (VPNs) can hide these issues, but many use a hub-and-spokes model, meaning that communications between workers pass through a central hub. By use of a mesh network VPN (WireGuard) between clusters using IPv6 private addressing, all these difficulties can be avoided, in addition to providing a simplified network addressing scheme with extremely high scalability. Another challenge was to ensure the Dask worker nodes were aware of data locality, both in terms of placing work near data and in terms of minimizing transfers. Here, the UK Met Office’s work on labeling resource pools (in this case, data) and linking scheduling decisions to labels was the key. 

In summary, by adapting Dask's concept of resourcing [3] into resource pools [4], building an automated start-up process, and effectively utilizing self-configuring IPv6 VPN mesh networks, we managed to provide a “cloud-native” transient model where all resources can be easily created and disposed of as needed. The resulting “throwaway” multi-cloud Dask framework is able to efficiently place processing on workers proximate to the data while minimizing necessary data traffic between clouds, thus achieving results more quickly and cheaper than naïve implementations, and with a simple, automated setup suitable for meteorological developers. The technical basis of this work was published on the Dask blog [5] but is covered more holistically here, particularly regarding the application side and challenges of developing cloud-native applications which can effectively utilize modern multi-cloud environments, with future applicability to distributed (e.g., Kubernetes) and serverless computing models. 

References: 

[1] https://www.europeanweather.cloud 
[2] https://www.dask.org 
[3] https://distributed.dask.org/en/stable/resources.html
[4] https://github.com/gjoseph92/dask-worker-pools  
[5] https://blog.dask.org/2022/07/19/dask-multi-cloud  

How to cite: Karatosun, A., Grant, M., Baousis, V., McGregor, D., Care, R., Nolan, J., and Tervo, R.: Data Proximate Computation; Multi-cloud approach on European Weather Cloud and Amazon Web Services , EGU General Assembly 2023, Vienna, Austria, 23–28 Apr 2023, EGU23-3639, https://doi.org/10.5194/egusphere-egu23-3639, 2023.

The National Oceanic and Atmospheric Administration (NOAA) established the Earth Prediction Innovation Center (EPIC) to be the catalyst for community research and modeling focused on informing and accelerating advances in our nation’s operational NWP forecast modeling systems. The Unified Forecast System (UFS) is a community-based, coupled, comprehensive Earth modeling system. The UFS numerical applications span local to global domains and predictive time scales from sub-hourly analyses to seasonal predictions. It is designed to support the Weather Enterprise and to be the source system for NOAA‘s operational numerical weather prediction applications. EPIC applies an open-innovation and open-development framework that embraces open-source code repositories integrated with automated Continuous Integration/Continuous Deployment (CI/CD) pipelines on cloud and on-prem HPCs. EPIC also supports UFS public releases, tutorials and training opportunities (e.g., student workshops, hackathons, and codesprints), and advanced user support via a virtual community portal (epic.noaa.gov). This framework allows community developers to track the status of their contributions, and facilitate rapid incorporation of innovation by implementing consistent and transparent, standardized and community-driven validation and verification tests. In this presentation, I will demonstrate capabilities in the EPIC framework using the UFS Short-range Weather (SRW) Application as an example in the follow aspects:

  • Public Releases of a Cloud-ready UFS SRW application with a scalable container following a modernize continuous release paradigm 
  • Test cases for challenging forecast environments released with datasets
  • Training and Tutorials for users and developers
  • Baseline for benchmarking in skill and computation on cloud HPCs , and
  • An Automated CI/CD pipeline to enable seamless transition to operations

How to cite: Huang, M.: An Open-innovation and Open-development Framework for the Unified Forecast System Powered by the Earth Prediction Innovation Center, EGU General Assembly 2023, Vienna, Austria, 23–28 Apr 2023, EGU23-3738, https://doi.org/10.5194/egusphere-egu23-3738, 2023.

EGU23-4298 | Orals | ESSI2.8

BUILDSPACE: Enabling Innovative Space-driven Services for Energy Efficient Buildings and Climate Resilient Cities 

Stamatia Rizou, Vaggelis Marinakis, Gema Hernández Moral, Carmen Sánchez-Guevara, Luis Javier Sánchez-Aparicio, Ioannis Brilakis, Vasileios Baousis, Tijs Maes, Vassileios Tsetsos, Marco Boaria, Piotr Dymarski, Michail Bourmpos, Petra Pergar, and Inga Brieze

BUILDSPACE aims to couple terrestrial data from buildings (collected by IoT platforms, BIM solutions and other) with aerial imaging from drones equipped with thermal cameras and location annotated data from satellite services (i.e., EGNSS and Copernicus) to deliver innovative services for the building and urban stakeholders and support informed decision making towards energy-efficient buildings and climate resilient cities. The platform will allow integration of these heterogeneous data and will offer services at building scale, enabling the generation of high fidelity multi-modal digital twins and at city scale providing decision support services for energy demand prediction, urban heat and urban flood analysis. The services will enable the identification of environmental hotspots that increase pressure to local city ecosystems and raise probability for natural disasters (such as flooding) and will issue alerts and recommendations for action to local governments and regions (such as the support of policies for building renovation in specific vulnerable areas). BUILDSPACE services will be validated and assessed in four European cities with different climate profiles. The digital twin services at building level will be tested during the construction of a new building in Poland, and the city services validating the link to digital twin of buildings will be tested in 3 cities (Piraeus, Riga, Ljubljana) across EU. BUILDSPACE will create a set of replication guidelines and blueprints for the adoption of the proposed applications in building resilient cities at large. 

How to cite: Rizou, S., Marinakis, V., Hernández Moral, G., Sánchez-Guevara, C., Sánchez-Aparicio, L. J., Brilakis, I., Baousis, V., Maes, T., Tsetsos, V., Boaria, M., Dymarski, P., Bourmpos, M., Pergar, P., and Brieze, I.: BUILDSPACE: Enabling Innovative Space-driven Services for Energy Efficient Buildings and Climate Resilient Cities, EGU General Assembly 2023, Vienna, Austria, 23–28 Apr 2023, EGU23-4298, https://doi.org/10.5194/egusphere-egu23-4298, 2023.

EGU23-5807 | Orals | ESSI2.8

The EuroHPC Center of Excellence for Exascale in Solid Earth 

Arnau Folch, Josep DelaPuente, Antonio Costa, Benedikt Halldórson, Jose Gracia, Piero Lanucara, Michael Bader, Alice-Agnes Gabriel, Jorge Macías, Finn Lovholt, Vadim Montellier, Alexandre Fournier, Erwan Raffin, Thomas Zwinger, Clea Denamiel, Boris Kaus, and Laetitia le Pourhiet

The second phase (2023-2026) of the Center of Excellence for Exascale in Solid Earth (ChEESE-2P), funded by HORIZON-EUROHPC-JU-2021-COE-01 under the Grant Agreement No 101093038, will prepare 11 European flagship codes from different geoscience domains (computational seismology, magnetohydrodynamics, physical volcanology, tsunamis, geodynamics, and glacier hazards). Codes will be optimised in terms of performance on different types of accelerators, scalability, containerisation, and continuous deployment and portability across tier-0/tier-1 European systems as well as on novel hardware architectures emerging from the EuroHPC Pilots (EuPEX/OpenSequana and EuPilot/RISC-V) by co-designing with mini-apps. Flagship codes and workflows will be combined to farm a new generation of 9 Pilot Demonstrators (PDs) and 15 related Simulation Cases (SCs) representing capability and capacity computational challenges selected based on their scientific importance, social relevance, or urgency. The SCs will produce relevant EOSC-enabled datasets and enable services on aspects of geohazards like urgent computing, early warning forecast, hazard assessment, or fostering an emergency access mode in EuroHPC systems for geohazardous events including access policy recommendations. Finally, ChEESE-2P will liaise, align, and synergise with other domain-specific European projects on digital twins and longer-term mission-like initiatives like Destination Earth.

How to cite: Folch, A., DelaPuente, J., Costa, A., Halldórson, B., Gracia, J., Lanucara, P., Bader, M., Gabriel, A.-A., Macías, J., Lovholt, F., Montellier, V., Fournier, A., Raffin, E., Zwinger, T., Denamiel, C., Kaus, B., and le Pourhiet, L.: The EuroHPC Center of Excellence for Exascale in Solid Earth, EGU General Assembly 2023, Vienna, Austria, 23–28 Apr 2023, EGU23-5807, https://doi.org/10.5194/egusphere-egu23-5807, 2023.

EGU23-6768 | ECS | Orals | ESSI2.8

SarXarray: an Xarray extension for SLC SAR data processing 

Ou Ku, Francesco Nattino, Meiert Grootes, Pranav Chandramouli, and Freek van Leijen

Satellite-based Interferometric Synthetic Aperture Radar (InSAR) plays a significant role for numerous surface motion monitoring applications, e.g. civil-infrastructure stability, hydrocarbons extraction, etc. InSAR monitoring is based on a coregistered stack of Single Look Complex (SLC) SAR images. Due to the long temporal coverage, broad spatial coverage and high spatio-temporal resolution of an SLC SAR stack, handling it in an efficient way is a common challenge within the community. Aiming to meet this need, we present SarXarray: an open-source Xarray extension for SLC SAR stack processing. SarXarray provides a Python interface to read and write a coregistered stack of SLC SAR data, with basic SAR processing functions. It utilizes Xarray’s support on labeled multi-dimensional datasets to stress the space-time character of an SLC SAR stack. It also leverages Dask to perform lazy evaluation of the operations. SarXarray can be integrated to existing Python workflows in a flexible way. We provide a case study of creating a SAR Mean Reflectivity Map to demonstrate the functionality of SarXarray.

How to cite: Ku, O., Nattino, F., Grootes, M., Chandramouli, P., and van Leijen, F.: SarXarray: an Xarray extension for SLC SAR data processing, EGU General Assembly 2023, Vienna, Austria, 23–28 Apr 2023, EGU23-6768, https://doi.org/10.5194/egusphere-egu23-6768, 2023.

EGU23-6857 | ECS | Posters on site | ESSI2.8

Convergence of HPC, Big Data and Machine Learning for Earth System workflows 

Donatello Elia, Sonia Scardigno, Alessandro D'Anca, Gabriele Accarino, Jorge Ejarque, Francesco Immorlano, Daniele Peano, Enrico Scoccimarro, Rosa M. Badia, and Giovanni Aloisio

Typical end-to-end Earth System Modelling (ESM) workflows rely on different steps including data pre-processing, numerical simulation, output post-processing, as well as data analytics and visualization. The approaches currently available for implementing scientific workflows in the climate context do not properly integrate the entire set of components into a single workflow and in a transparent manner. The increasing usage of High Performance Data Analytics (HPDA) and Machine Learning (ML) in climate applications further exacerbate the issues. A more integrated approach would allow to support next-generation ESM and improve the workflow in terms of execution and energy consumption.

Moreover, a seamless integration of components for HPDA and ML into the ESM workflow will open the floor to novel applications and support larger scale pre- and post-processing. However, these components typically have different deployment requirements spanning from HPC (for ESM simulation) to Cloud computing (for HPDA and ML). It is paramount to provide scientists with solutions capable of hiding the technical details of the underlying infrastructure and improving workflow portability.

In the context of the eFlows4HPC project, we are exploring the use of innovative workflow solutions integrating approaches from HPC, HPDA and ML for supporting end-to-end ESM simulations and post-processing, with a focus on extreme events analysis (e.g., heat waves and tropical cyclones). In particular, the envisioned solution exploits PyCOMPSs for the management of parallel pipelines, task orchestration and synchronization, as well as PyOphidia for climate data analytics and ML frameworks (i.e., TensorFlow) for data-driven event detection models. This contribution presents the approaches being explored in the frame of the project to address the convergence of HPC, Big Data and ML into a single end-to-end ESM workflows.

How to cite: Elia, D., Scardigno, S., D'Anca, A., Accarino, G., Ejarque, J., Immorlano, F., Peano, D., Scoccimarro, E., Badia, R. M., and Aloisio, G.: Convergence of HPC, Big Data and Machine Learning for Earth System workflows, EGU General Assembly 2023, Vienna, Austria, 23–28 Apr 2023, EGU23-6857, https://doi.org/10.5194/egusphere-egu23-6857, 2023.

EGU23-6960 | Orals | ESSI2.8

Remote Sensing Deployable Analysis environmenT 

Pranav Chandramouli, Francesco Nattino, Meiert Grootes, Ou Ku, Fakhereh Alidoost, and Yifat Dzigan

Remote-sensing (RS) and Earth observation (EO) data have become crucial in areas ranging from science to policy, with their use expanding beyond the ‘usual’ fields of geosciences to encompass ‘green’ life sciences, agriculture, and even social sciences. Within this context, the RS-DAT project has developed and made available a readily deployable framework enabling researchers to scale their analysis of EO and RS data on HPC systems and associated storage resources. Building on and expanding the established tool stack of the Pangeo Community, the framework integrates tools to access, retrieve, explore, and process geospatial data, addressing common needs identified in the EO domain. On the computing side RS-DAT leverages Jupyter (Python), which provides users a web-based interface to access (remote) computational resources, and Dask, which enables to scale analysis and workflows to large computing systems. Both Jupyter and Dask are well-established tools in the Pangeo community and can be deployed in several ways and on different infrastructures. RS-DAT provides an easy-to-use deployment framework for two targets: the generic case of SLURM-based HPC systems (for example, Dutch Supercomputer Snellius/Spider) which offer flexibility in computational resources; and the special case of an ansible-based cloud-computing infrastructure (Surf Research Cloud (SRC)) which is more straight-forward for the user but less flexible. Both these frameworks enable the easy scale-up of workflows, using HPCs, to access, manipulate and process large-scale datasets as commonly found in EO. On the data access and storage side RS-DAT integrates two python packages, STAC2dCache and dCacheFS, which were developed to facilitate data retrieval from online STAC catalogs (STAC2dCache) and its storage on the HPC system or local mass storage, specifically dCache.  This ensures efficient computation for large-scale analyses where data retrieval and handling can cause significant bottlenecks. User-defined input/output to Zarr file format is also supported within the framework. We present an application of the tools developed to the calculation of leaf-spring indices for North America using the Daymet dataset at a 1km resolution for 42 years (~940 GiB, completed in under 5 hours using 60 cores on the Dutch supercomputing system) and look forward to on-going work integrating both deployment targets in the case of the Dutch HPC ecosystem.

How to cite: Chandramouli, P., Nattino, F., Grootes, M., Ku, O., Alidoost, F., and Dzigan, Y.: Remote Sensing Deployable Analysis environmenT, EGU General Assembly 2023, Vienna, Austria, 23–28 Apr 2023, EGU23-6960, https://doi.org/10.5194/egusphere-egu23-6960, 2023.

With the amount of high resolution earth observation data available it is not feasible anymore to do all analysis on local computers or even local cluster systems. To achieve high performance for out-of-memory datasets we develop the YAXArrays.jl package in the Julia programming language. YAXArrays.jl provides both an abstraction over chunked n-dimensional arrays with labelled axes and efficient multi-threaded and multi-process computation on these arrays.
In this contribution we would like to present the lessons we learned from scaling an analysis of high resolution Sentinel-1 time series
data. By bringing a Sentinel-1 change detection use case which has been performed on a small local area of interest to a whole region we test the ease and performance of distributed computing on the European Open Science Cloud (EOSC) in Julia.

How to cite: Gans, F. and Cremer, F.: Scaling up a Sentinel 1 change detection pipeline using the Julia programming language, EGU General Assembly 2023, Vienna, Austria, 23–28 Apr 2023, EGU23-7825, https://doi.org/10.5194/egusphere-egu23-7825, 2023.

EGU23-8096 | ECS | Posters on site | ESSI2.8

Spatio-Temporal Asset Catalog (STAC) for in-situ data 

Justus Magin and Tina Odaka

In order to make use of a collection of datasets – for example, scenes from a SAR satellite – more efficient, it is important to be able to search for datasets relevant for a specific application. In particular, one might want to search for a specific period in time, for the spatial extent, or perform searches over multiple collections together.

For SAR data or data obtained from optical satellites, Spatio-Temporal Asset Catalogs (STAC) have become increasingly popular in the past few years. Defined as JSON and backed by databases with geospatial extensions, STAC servers (endpoints) have the advantage of being efficient, language-agnostic and following a standardized API.

Just like satellite scenes, in-situ data is growing in size very quickly and thus would benefit from being catalogued. However, the sequential nature of in-situ data and its sparse distribution in space makes it difficult to fit into STAC's standard model.

In the session, we present a experimental STAC extension that defines the most common properties of in-situ data as identified from ArgoFloat and  biologging data.

How to cite: Magin, J. and Odaka, T.: Spatio-Temporal Asset Catalog (STAC) for in-situ data, EGU General Assembly 2023, Vienna, Austria, 23–28 Apr 2023, EGU23-8096, https://doi.org/10.5194/egusphere-egu23-8096, 2023.

EGU23-8756 | Posters on site | ESSI2.8

Pangeo framework for training: experience with FOSS4G, the CLIVAR bootcamp and the eScience course 

Anne Fouilloux, Pier Lorenzo Marasco, Tina Odaka, Ruth Mottram, Paul Zieger, Michael Schulz, Alejandro Coca-Castro, Jean Iaquinta, and Guillaume Eynard Bontemps

The ever increasing number of scientific datasets made available by authoritative data providers (NASA, Copernicus, etc.) and provided by the scientific community opens new possibilities for advancing the state of the art in many areas of the natural sciences. As a result, researchers, innovators, companies and citizens need to acquire computational and data analysis skills to optimally exploit these datasets. Several educational programs dispense basic courses to students, and initiatives such as “The Carpentries” (https://carpentries.org/) complement this offering but also reach out to established researchers to fill the skill gap thereby empowering them to perform their own data analysis. However, most researchers find it challenging to go beyond these training sessions and face difficulties when trying to apply their newly acquired knowledge to their own research projects. To this regard, hackathons have proven to be an efficient way to support researchers in becoming competent practitioners but organising good hackathons is difficult and time consuming. In addition, the need for large amounts of computational and storage resources during the training and hackathons requires a flexible solution. Here, we propose an approach where researchers  work on realistic, large and complex data analysis problems similar to or directly part of  their research work. Researchers access an infrastructure deployed on the European Ocean Science Cloud (EOSC)  that supports intensive data analysis (large compute and storage resources). EOSC is a European Commission initiative for providing a federated and open multi-disciplinary environment where data, tools and services can be shared, published, found and re-used. We used jupyter book for delivering a collection of FAIR training materials for data analysis relying on Pangeo EOSC deployments as its primary computing platform. The training material (https://pangeo-data.github.io/foss4g-2022/intro.html, https://pangeo-data.github.io/clivar-2022/intro.html, https://pangeo-data.github.io/escience-2022/intro.html) is customised (different datasets with similar analysis) for different target communities and participants are taught the usage of Xarray, Dask and more generally how to efficiently access and analyse large online datasets. The training can be completed by group work where attendees can work on larger scale scientific datasets: the classroom is split into several groups. Each group works on different scientific questions and may use different datasets. Using the Pangeo (http://pangeo.io) ecosystem is not always new for all attendees but applying Xarray (http://xarray.pydata.org)  and Dask (https://www.dask.org/) on actual scientific “mini-projects” is often a showstopper for many researchers. With this approach, attendees have the opportunity to ask questions, collaborate with other researchers as well as Research Software Engineers, and apply Open Science practices without the burden of trying and failing alone. We find the involvement of scientific computing research engineers directly in the training is crucial for success of the hackathon approach. Feedback from attendees shows that it provides a solid foundation for big data geoscience and helps attendees to quickly become competent practitioners. It also gives infrastructure providers and EOSC useful feedback on the current and future needs of researchers for making their research FAIR and open. In this presentation, we will provide examples of achievements from attendees and present the feedback EOSC providers have received.

How to cite: Fouilloux, A., Marasco, P. L., Odaka, T., Mottram, R., Zieger, P., Schulz, M., Coca-Castro, A., Iaquinta, J., and Eynard Bontemps, G.: Pangeo framework for training: experience with FOSS4G, the CLIVAR bootcamp and the eScience course, EGU General Assembly 2023, Vienna, Austria, 23–28 Apr 2023, EGU23-8756, https://doi.org/10.5194/egusphere-egu23-8756, 2023.

EGU23-9095 | Posters on site | ESSI2.8

Pangeo@EOSC: deployment of PANGEO ecosystem on the European Open Science Cloud 

Guillaume Eynard-Bontemps, Jean Iaquinta, Sebastian Luna-Valero, Miguel Caballer, Frederic Paul, Anne Fouilloux, Benjamin Ragan-Kelley, Pier Lorenzo Marasco, and Tina Odaka

Research projects heavily rely on the exchange and processing of data and in this context Pangeo (https://pangeo.io/), a world-wide community of scientists and developers, thrives to facilitate the deployment of ready to use and community-driven platforms for big data geoscience. The European Open Science Cloud (EOSC) is the main initiative in Europe for providing a federated and open multi-disciplinary environment where European researchers, innovators, companies and citizens can share, publish, find and re-use data, tools and services for research, innovation and educational purposes. While a number of services based on Jupyter Notebooks were already available, no public Pangeo deployments providing fast access to large amounts of data and compute resources were accessible on EOSC. Most existing cloud-based Pangeo deployments are USA-based, and members of the Pangeo community in Europe did not have a shared platform where scientists or technologists could exchange know-how. Pangeo teamed up with two EOSC projects, namely EGI-ACE (https://www.egi.eu/project/egi-ace/) and C-SCALE (https://c-scale.eu/) to demonstrate how to deploy and use Pangeo on EOSC and emphasise the benefits for the European community. 

The Pangeo Europe Community together with EGI deployed a DaskHub, composed of Dask Gateway (https://gateway.dask.org/) and JupyterHub (https://jupyter.org/hub), with Kubernetes cluster backend on EOSC using the infrastructure of the EGI Federation (https://www.egi.eu/egi-federation/). The Pangeo EOSC JupyterHub deployment makes use of 1) the EGI Check-In to enable user registration and thereby authenticated and authorised access to the Pangeo JupyterHub portal and to the underlying distributed compute infrastructure; and 2) the EGI Cloud Compute and the cloud-based EGI Online Storage to distribute the computational tasks to a scalable compute platform and to store intermediate results produced by the user jobs. 

To facilitate future Pangeo deployments on top of a wide range of cloud providers (AWS, Google Cloud, Microsoft Azure, EGI Cloud Computing, OpenNebula, OpenStack, and more), the Pangeo EOSC JupyterHub deployment is now possible through the Infrastructure Manager (IM) Dashboard (https://im.egi.eu/im-dashboard/login). All the computing and storage resources are currently supplied by CESNET (https://www.cesnet.cz/?lang=en) in the frame of EGI-ACE project (https://im.egi.eu/). Several deployments have been made to serve the geoscience community, both for teaching and for research work. To date, more than 100 researchers have been trained on Pangeo@EOSC deployments and more are expected to join, in particular with easy access to large amounts of Copernicus data through a recent collaboration established with the C-SCALE project. In this presentation, we will provide details on the different deployments, how to get access to JupyterHub deployments and more generally how to contribute to Pangeo@EOSC.


How to cite: Eynard-Bontemps, G., Iaquinta, J., Luna-Valero, S., Caballer, M., Paul, F., Fouilloux, A., Ragan-Kelley, B., Marasco, P. L., and Odaka, T.: Pangeo@EOSC: deployment of PANGEO ecosystem on the European Open Science Cloud, EGU General Assembly 2023, Vienna, Austria, 23–28 Apr 2023, EGU23-9095, https://doi.org/10.5194/egusphere-egu23-9095, 2023.

EGU23-10697 | Orals | ESSI2.8 | Highlight

The Joint Effort for Data Assimilation Integration (JEDI): A unified data assimilation framework for Earth system prediction supported by NOAA, NASA, U.S. Navy, U.S. Air Force, and UK Met Office 

Dom Heinzeller, Maryam Abdi-Oskouei, Stephen Herbener, Eric Lingerfelt, Yannick Trémolet, and Tom Auligné

The Joint Effort for Data assimilation Integration (JEDI), is an innovative data assimilation system for Earth system prediction, spearheaded by the Joint Center for Satellite Data Assimilation (JCSDA) and slated for implementation in major operational modeling systems across the globe in the coming years. Funded as an inter-agency development by NOAA, NASA, the U.S. Navy and Air Force, and with contributions from the UK Met Office, JEDI must operate on a wide range of computing platforms. The recent move towards cloud computing systems puts portability, adaptability and performance across systems, from dedicated High Performance Computing systems to commercial clouds and workstations, in the critical path for the success of JEDI.

JEDI is a highly complex application that relies on a large number of third-party software packages to build and run. These packages can include I/O libraries, workflow engines, Python modules for data manipulation and plotting, several ECMWF libraries for complex arithmetics and grid manipulations, and forecast models such as the Unified Forecast System (UFS), the Goddard Earth Observing System (GEOS), the Modular Ocean Model (MOM6), the Model for Prediction across Scales (MPAS), the Navy Environmental Prediction sysTem Utilizing the NUMA corE (NEPTUNE), and the Met Office Unified Model (UM).

With more than 100 contributors and rapid code development it is critical to perform thorough automated testing, from basic unit tests to comprehensive end-to-end-tests. This presentation summarizes recent efforts to leverage cloud computing environments for research, development, and near real-time applications of JEDI, as well as for developing a Continuous Integration/Continuous Delivery (CI/CD) pipeline. These efforts rest on a newly developed software stack called spack-stack, a joint effort of JCSDA, the NOAA Environmental Modeling Center (EMC) and the U.S. Earth Prediction Innovation Center (EPIC). Automatic testing in JEDI is implemented with modern software development tools such as GitHub, Docker containers, various Amazon Web Services (AWS), and CodeCov for testing and evaluation of code performance. End-to-end testing is realized in JCSDA’s newly developed Skylab Earth system data assimilation application, which combines JEDI with the Research Repository for Data and Diagnostics (R2D2) and the Experiments and Workflow Orchestration Kit (EWOK), and which leverages the AWS Elastic Compute Cloud (EC2) for testing, research, development and production.

How to cite: Heinzeller, D., Abdi-Oskouei, M., Herbener, S., Lingerfelt, E., Trémolet, Y., and Auligné, T.: The Joint Effort for Data Assimilation Integration (JEDI): A unified data assimilation framework for Earth system prediction supported by NOAA, NASA, U.S. Navy, U.S. Air Force, and UK Met Office, EGU General Assembly 2023, Vienna, Austria, 23–28 Apr 2023, EGU23-10697, https://doi.org/10.5194/egusphere-egu23-10697, 2023.

EGU23-11117 | Orals | ESSI2.8

Modeling the Earth System on Modular Supercomputing Architectures: coupled atmosphere-ocean simulations with ICON 

Olaf Stein, Abhiraj Bishnoi, Luis Kornblueh, Lars Hoffmann, Norbert Eicker, Estela Suarez, and Catrin I. Meyer

Significant progress has been made in recent years to develop km-scale versions of global Earth System Models (ESM), combining the chance of replacing uncertain model parameterizations by direct treatment and the improved representation of orographic and land surface features (Schär et al., 2020, Hohenegger et al., 2022). However, adapting climate codes to new hardware and at the same time keeping the performance portability, still remains a major issue. Given the long development cycles, the various maturity of ESM modules and their large code bases, it is not expected that all code parts can be brought to the same level of exascale readiness in the near future. Instead, short term model adaptation strategies need to focus on software abilities as well as hardware availability. Moreover, energy use efficiency is of growing importance on both sides, supercomputer providers and scientific projects employing climate simulations.

Here, we present results from first simulations of the coupled atmosphere-ocean modelling system ICON-v2.6.6-rc on the supercomputing system JUWELS at the Jülich Supercomputing Centre (JSC) with a global resolution of 5 km, using significant parts of the HPC system. While the atmosphere part of ICON (ICON-A) is capable of running on GPUs, model I/O currently performs better on a CPU cluster and the ocean module (ICON-O) has not been ported to modern accelerators yet. Thus, we make use of the modular supercomputing architecture (MSA) of JUWELS and its novel batch job options for the coupled ICON model with ICON-A running on the NVIDIA A100 GPUs of JUWELS Booster, while ICON-O and the model I/O are running simultaneously on the CPUs of the JUWELS Cluster partition. As expected, ICON performance is limited by ICON-A. Thus we chose the performance-optimal Booster-node configuration for ICON-A considering also memory requirements (84 nodes) and adapted ICON-O configuration to achieve minimum waiting times for simultaneous time step execution and data exchange (63 cluster nodes).  We compared runtime and energy efficiency to cluster-only simulations (on up to 760 cluster nodes) and found only small improvements in runtime for the MSA case, but energy consumption is already reduced by 26% without further improvements in vector length applied with ICON. When switching to even higher ICON resolutions, cluster-only simulations are not fitting to most of current HPC systems and upcoming exascale systems will rely to a large extent on GPU acceleration. Thus exploiting MSA capabilities is an important step towards performance portable and energy efficient use of km-scale climate models.

References:

Hohenegger et al., ICON-Sapphire: simulating the components of the Earth System and their interactions at kilometer and subkilometer scales, https://doi.org/10.5194/gmd-2022-171, in review, 2022.

Schär et al., Kilometer-Scale Climate Models: Prospects and Challenges, https://doi.org/10.1175/BAMS-D-18-0167.1, 2020.


How to cite: Stein, O., Bishnoi, A., Kornblueh, L., Hoffmann, L., Eicker, N., Suarez, E., and Meyer, C. I.: Modeling the Earth System on Modular Supercomputing Architectures: coupled atmosphere-ocean simulations with ICON, EGU General Assembly 2023, Vienna, Austria, 23–28 Apr 2023, EGU23-11117, https://doi.org/10.5194/egusphere-egu23-11117, 2023.

EGU23-12539 | Orals | ESSI2.8

European Weather Cloud: A community cloud tailored for big Earth modelling and EO data processing 

Roberto Cuccu, Vasileios Baousis, Umberto Modigliani, Charalampos Kominos, Xavier Abellan, and Roope Tervo

The European Centre for Medium-Range Weather Forecasts (ECMWF) together with the European Organisation for the Exploitation of Meteorological Satellites (EUMETSAT) have worked together to offer to their Member States a new paradigm to access and consume weather data and services. The “European Weather Cloud-(EWC)” (https://www.europeanweather.cloud/), concluded its pilot phase and is expected to become operational during the first months of 2023.

This initiative aims to offer a community cloud infrastructure on which Member and Co‐operating States of both organizations can create on demand virtual compute (including GPUs) and storage resources to gain easy and high throughput access to the ECMWF’s Numerical Weather Predication (NWP) and EUMETSAT’s satellite data in a timely and configurable fashion. Moreover, one of the main goals is to involve more National Meteorological Services to jointly form a federation of clouds/data offered from their Member States, for the maximum benefit of the European Meteorological Infrastructure (EMI). During the pilot phase of the project, both organizations have jointly hosted user and technical workshops to actively engage with the meteorological community and align the evolution of the EWC to reflect and satisfy their operational goals and needs.

The EWC, in its pilot phase hosted several use cases, mostly aimed at users in the developers’ own organisations. These broad categories of these cases are:

  • Web services to explore hosted datasets
  • Data processing applications
  • Platforms to support the training of machine learning models on archive datasets
  • Workshops and training courses (e.g., ICON model training, ECMWF training etc)
  • Research in collaboration with external partners
  • World Meteorological Organization (WMO) support with pilots and PoC.

Some examples of the use cases currently developed at the EWC are:

  • The German weather service DWD, which is already feeding maps generated by a server it deployed on the cloud into its public GeoPortal service.
  • EUMETSAT and ECMWF joint use case assesses bias correction schemes for the assimilation of radiance data based on several satellite data time series
  • the Royal Netherlands Meteorological Institute (KNMI) hosts a climate explorer web application based on KNMI climate explorer data and ECMWF weather and climate reanalyses
  • The Royal Meteorological Institute of Belgium prepares ECMWF forecast data for use in a local atmospheric dispersion model.
  • NordSat, a collaboration of northern European countries which is developing and testing imagery generation tools in preparation for the Meteosat Third Generation (MTG) satellite products.
  • UK Met Office with the DataProximateCompute use case, which distributes compute workload close to data, with the automatic creation and disposal of Dask clusters, as well as the data plane VPN network, on demand and in heterogeneous cloud environments.

In this presentation, the status of the project, the offered services and how these are accessed by the end users along with examples of the existing use cases will be analysed. The plans, next steps for the evolution of the EWC and its relationship with other projects and initiatives (like DestinE) will conclude the presentation.

How to cite: Cuccu, R., Baousis, V., Modigliani, U., Kominos, C., Abellan, X., and Tervo, R.: European Weather Cloud: A community cloud tailored for big Earth modelling and EO data processing, EGU General Assembly 2023, Vienna, Austria, 23–28 Apr 2023, EGU23-12539, https://doi.org/10.5194/egusphere-egu23-12539, 2023.

EGU23-12785 | Orals | ESSI2.8

A Scalable Near Line Storage Solution for Very Big Data 

Neil Massey, Jack Leland, and Bryan Lawrence

Managing huge volumes of data is a problem now, and will only become worse with the advent of exascale computing and next generation observational systems. An important recognition is that data needs to be more easily migrated between storage tiers. Here we present a new solution, the Near-Line Data store (NLDS), for managing data migration between user facing storage systems and tape by using an object storage cache.  NLDS builds on lessons learned from previous experience developing the ESIWACE funded Joint Data Migration App (JDMA) and deploying it at the Centre for Environmental Data Analysis (CEDA). 
 
CEDA currently has over 50PB of data stored on a range of disk based storage systems.  These systems are chosen on cost, power usage and accessibility via a network, and include three different types of POSIX disk and object storage. Tens of PB of additional data are also stored on tape. Each of these systems has different workflows, interfaces and latencies, causing difficulties for users.  

NLDS, developed with ESIWACE2 and other funding, is a multi-tiered storage solution using object storage as a front end to a tape library.  Users interact with NLDS via a HTTP API, with a Python library and command-line client provided to support both programmatic and interactive use.  Files transferred to NLDS are first written to the object storage, and a backup is made to tape.  When the object storage is approaching capacity, a set of policies is interrogated to determine which files will be removed from it.  Upon retrieving a file, NLDS may have to first transfer the file from tape to the object storage, if it has been deleted by the policies.  This implements a multi-tier of hot (disk), warm (object storage) and cold (tape) storage via a single interface. While systems like this are not novel, NLDS is open source, designed for ease of redeployment elsewhere, and for use from both local storage and remote sites. 

NLDS is based around a microservice architecture, with a message exchange brokering communication between the microservices, the HTTP API and the storage solutions.  The system is deployed via Kubernetes, with each microservice in its own Docker container, allowing the number of services to be scaled up or down, depending on the current load of NLDS.  This provides a scalable, power efficient system while ensuring that no messages between microservices are lost.  OAuth is used to authenticate and authorise users via a pluggable authentication layer. The use of object storage as the front end to the tape allows both local and remote cloud-based services to access the data, via a URL, so long as the user has the required credentials. 

NLDS is a a scalable solution to storing very large data for many users, with a user-friendly front end that is easily accessed via cloud computing. This talk will detail the architecture and discuss how the design meets the identified use cases.

How to cite: Massey, N., Leland, J., and Lawrence, B.: A Scalable Near Line Storage Solution for Very Big Data, EGU General Assembly 2023, Vienna, Austria, 23–28 Apr 2023, EGU23-12785, https://doi.org/10.5194/egusphere-egu23-12785, 2023.

EGU23-12851 | Orals | ESSI2.8

From the Copernicus satellite data to an environmentally aware field decision 

Fabien Castel and Emma Rizzi

Tackling complex environmental issues requires accessing and processing a wide range of voluminous data. The Copernicus spatial data is a very complete and valuable source for many earth science domains, in particular thanks to its Core Services (Land, Atmosphere, Marine…). For almost five years now, Copernicus DIAS platforms have provided broad access to the core services products through the cloud. Among these platforms, the Wekeo platform operated by EUMETSAT, Mercator Ocean, ECMWF and EEA provides wider access to Copernicus Core Service data.

However, Copernicus data needs an additional layer of processing and preparation to be presented and understood by the general public and decision makers. Murmuration has developed data processing pipelines to produce environmental indicators from Copernicus data constituting powerful tools to put environmental issues at the centre of decision-making processes.

Throughout its use, limitations on the DIAS platforms were observed. Firstly, the cloud service offerings are basic in comparison to the market leaders (such as AWS and GCP). In particular, there is no built-in solution for automating and managing data processing pipelines, which must be set up at the user's expense. Secondly, the cost of resources is higher than market price. Limiting the activities on DIAS to edge data processing and relying on a cheaper offering for applications not requiring the direct access to raw Copernicus data is a cost effective choice.  FInally, the performance and reliability requirements to access the data can sometimes not be met when relying on a single DIAS platform. Implementing a multi-DIAS approach ensures backup data sources. This raises the question of the automation and orchestration of such a multi-cloud system.

We propose an approach combining the wide data offer of the DIAS platforms, the automation features provided by the Prefect platform and the usage of efficient cloud technologies to build a repository of environmental indicators. Prefect is a hybrid orchestration platform dedicated to automation of data processing flows. It does not host any data processing flow itself and rather connects in a cloud-agnostic way to any cloud environment, where periodic and triggered flow executions can be scheduled. Prefect centrally controls flows that run on different cloud environments through a single platform.

Technologies leveraged to build the system allow to efficiently produce and disseminate the environmental indicators: firstly, containerisation and clustering (using Docker and Kubernetes) to manage processing resources; secondly object storage combined with cloud native access (Zarr data format); and finally, the Python scientific software stack (including pandas, scikit-learn, etc.) complemented by the powerful Xarray library. Data processing pipelines ensure a path from the NetCDF Copernicus Core Services products to cloud-native Zarr products. The Zarr format allows windowed read/write operations, avoiding unnecessary data transfers. This efficient data access allows plugging into the data repository fast data dissemination services following well-established OGC standards and feeding interactive dashboards for decision makers. The cycle is complete, from the Copernicus satellite data to an environmentally aware field decision.

How to cite: Castel, F. and Rizzi, E.: From the Copernicus satellite data to an environmentally aware field decision, EGU General Assembly 2023, Vienna, Austria, 23–28 Apr 2023, EGU23-12851, https://doi.org/10.5194/egusphere-egu23-12851, 2023.

EGU23-13768 | ECS | Posters on site | ESSI2.8

FAIR Notebooks: opportunities and challenges for the geoscience community 

Alejandro Coca-Castro, Anne Fouilloux, J. Scott Hosking, and Environmental Data Science Book community

Making assets in scientific research Findable, Accessible, Interoperable and Reusable (FAIR) is still overwhelming for many scientists. When considered as an afterthought, FAIR research is indeed challenging, and we argue that its implementation is by far much easier when considered at an early stage and focusing on improving the researchers' day to day work practices. One key aspect is to bundle all the research artefacts in a FAIR Research Object (RO) using RoHub (https://reliance.rohub.org/), a Research Object management platform that enables researchers to collaboratively manage, share and preserve their research work (data, software, workflows, models, presentations, videos, articles, etc.). RoHub implements the full RO model and paradigm: resources associated to a particular research work are aggregated into a single FAIR digital object, and metadata relevant for understanding and interpreting the content is represented as semantic metadata that are user and machine readable. This approach provides the technical basis for implementing FAIR executable notebooks: the data and the computational environment can be “linked” to one or several FAIR notebooks that can then be executed via EGI Binder Service with scalable compute and storage capabilities. However, the need for defining clear practises for writing and publishing FAIR notebooks that can be reused to build upon new research has quickly arised. This is where a community of practice is required. The Environmental Data Science Book (or EDS Book) is a pan-european community-driven resource hosted on GitHub and powered by Jupyter Book. EDS Book provides practical guidelines and templates that help to translate research outputs into curated, interactive, shareable and reproducible executable notebooks. The quality of the FAIR notebooks is ensured by a collaborative and transparent reviewing process supported by GitHub related technologies. This approach provides immediate benefits for those who adopt it and can feed fruitful discussions to better define a reward system that would benefit Science and scientific communities. All the resources needed for understanding and executing the notebook are gathered into an executable Research Object in RoHub. To date, the community has successfully published ten FAIR notebooks covering a wide range of topics in environmental data science. The notebooks consume open-source python libraries e.g. intake, iris, xarray, hvplot for fetching, processing and interactively visualising environmental research.  While these notebooks are currently python-based, EDS Book supports other programming languages such as R and Julia, and we are aiming at engaging with computational notebooks communities alike towards improving the research practices in environmental science.

How to cite: Coca-Castro, A., Fouilloux, A., Hosking, J. S., and community, E. D. S. B.: FAIR Notebooks: opportunities and challenges for the geoscience community, EGU General Assembly 2023, Vienna, Austria, 23–28 Apr 2023, EGU23-13768, https://doi.org/10.5194/egusphere-egu23-13768, 2023.

EGU23-14507 | Orals | ESSI2.8

geokube: A Python Package for Data Analysis and Visualization in Geoscience 

Marco Mancini, Mirko Stojiljkovic, and Jakub Walczak

geokube is a Python package for data analysis and visualisation in geoscience that  provides high level abstractions in terms of both Data Model, inspired by Climate Forecast and Unidata Common Data Models, and Application Programming Interface (API), inspired by xarray. Key features of geokube are the capabilities to: (i) perform georeferenced axis-based indexing on data structures and specialised geospatial operations according to different types of geo scientific datasets like structured grids, point observations, profiles etc. (e.g. extracting a bounding box or a multipolygon of variable values defined on a rotated pole grid), (ii) perform operations on the variables that are either instantaneous or defined over intervals, (iii) convert to/from xarray data structures and to read/write CF-compliant netCDF datasets.

How to cite: Mancini, M., Stojiljkovic, M., and Walczak, J.: geokube: A Python Package for Data Analysis and Visualization in Geoscience, EGU General Assembly 2023, Vienna, Austria, 23–28 Apr 2023, EGU23-14507, https://doi.org/10.5194/egusphere-egu23-14507, 2023.

EGU23-14515 | ECS | Orals | ESSI2.8

Intaking DKRZ ESM data collections 

Fabian Wachsmann

In this showcase, we present to you how Intake and its plugin Intake-ESM are utilized at DKRZ to provide highly FAIR data collections from different projects, stored on different types of storages in different formats.

The Intake Plugin Intake-ESM allows users to not only find the data of interest, but also load them as analysis-ready-like Xarray datasets. We utilize this tool to provide users with access to many available data collections at our institution from only one single access point, the main DKRZ intake catalog at www.dkrz.de/s/intake. The functionality of this package works independently of data standards and formats and therefore enables full metadata-driven data access including data processing. Intake-esm catalogs increase the FAIRness of the data collections in all aspects but especially in terms of Accessibility and Interoperability.

Started with a collection of DKRZ’s CMIP6 Data Pool, DKRZ now hosts catalogs for more than 10PB of data on different local storages. The Intake-ESM package has been well integrated into ESM data provisioning workflows.

  • Early sharing and making accessible: The co-developed inhouse ICON model generates an intake-esm catalog on each run.
  • Uptake from other technologies: E.g., intake-esm catalogs serve as templates for the more advanced DKRZ STAC Catalogs. 
  • Making accessible all storage types: tools used for writing data to the local institutional cloud allow users to create Intake-ESM catalogs for the written data.
  • Data archiving: Catalogs for projects in the archive can be created from its metadata database.

For future activities, we plan to make use of new functionalities like the support for kerchunked data and the derived variable registry.

The DKRZ data management team develops and maintains local services around intake-esm for a positive user experience. In this showcase, we will present excerpts of seminars, workflows and integrations.

How to cite: Wachsmann, F.: Intaking DKRZ ESM data collections, EGU General Assembly 2023, Vienna, Austria, 23–28 Apr 2023, EGU23-14515, https://doi.org/10.5194/egusphere-egu23-14515, 2023.

EGU23-14547 | Orals | ESSI2.8

PANGEO multidisciplinary test case for Earth and Environment Big data analysis in FAIR-EASE Infra-EOSC project 

Marine Vernet, Erwan Bodere, Jérôme Detoc, Christelle Pierkot, Alessandro Rizzo, and Thierry Carval

Earth observation and modelling is a major challenge for research and a necessity for environmental and socio-economic applications. It requires voluminous and heterogeneous data from distributed and domain-dependent data sources, managed separately by various national and European infrastructures.

In a context of unprecedented data wealth and growth, new challenges emerge to enable inter-comparison, inter-calibration and comprehensive studies and uses of earth system and environmental data.

To this end, the FAIR-EASE project aims to provide integrated and interoperable services through the European Open Science Cloud to facilitate the discovery, access and analysis of large volumes of heterogeneous data from distributed sources and from different domains and disciplines of Earth system science.

This presentation will explain how the PANGEO stack will be used within FAIR EASE to improve data access, interpolation and analysis, but will also explore its integration with existing services (e.g. Galaxy) and underlying IT infrastructure to serve multidisciplinary research uses.

How to cite: Vernet, M., Bodere, E., Detoc, J., Pierkot, C., Rizzo, A., and Carval, T.: PANGEO multidisciplinary test case for Earth and Environment Big data analysis in FAIR-EASE Infra-EOSC project, EGU General Assembly 2023, Vienna, Austria, 23–28 Apr 2023, EGU23-14547, https://doi.org/10.5194/egusphere-egu23-14547, 2023.

Observational meteorological data is central to understanding atmospheric processes, and is thus a key requirement for the calibration and validation of atmospheric and numerical weather prediction models. While recent decades have seen the development of notorious platforms to make satellite data easily accessible, observational meteorological data mostly remains scattered through the sites of regional and national meteorological service, each potentially offering different magnitudes, temporal coverage and data formats. 

In order to overcome these shortcomings, we propose meteostations-geopy, a Pythonic library to access data from meteorological stations. The central objective is to provide a common interface to retrieve observational meteorological data, therefore reducing the amount of time required to process and wrangle the data. The library interacts with APIs from different weather services, handling authentication if needed and transforming the requested information into geopandas data frames of geolocated and timestamped observations that are homogeneously structured independently of the provider. 

The project is currently in an early development stage with support for two providers only. Current and future work is organized in three interrelated main axes, namely integration of further providers, implementation of native support of distributed data structures and organization of the library into the intake technical structure with drivers, catalogs, metadata sharing and plugin packages that are provider specific.

How to cite: Bosch, M.: meteostations-geopy: a Pythonic interface to access data from meteorological stations, EGU General Assembly 2023, Vienna, Austria, 23–28 Apr 2023, EGU23-14774, https://doi.org/10.5194/egusphere-egu23-14774, 2023.

EGU23-15964 | ECS | Orals | ESSI2.8

A novel data ecosystem for coastal analyses 

Floris Calkoen, Fedor Baart, Etiënne Kras, and Arjen Luijendijk

The coastal community widely anticipates that in the next years data-driven studies are going to make essential contributions to bringing about long-term coastal adaptation and mitigation strategies at continental scale. This view is also supported by CoCliCo, a Horizon 2020 project, where coastal data form the fundamental building block for an open-web portal that aims to improve decision making on coastal risk management and adaptation. The promise of data is likely triggered by several coastal analyses that showed how the coastal zone can be be monitored at unprecedented spatial scales using geospatial cloud platforms . However, we note that when analyses become more complex, i.e., require specific algorithms, pre- and post-processing or include data that are not hosted by the cloud provider, the cloud-native processing workflows are often broken, which makes analyses at continental scale impractical.

We believe that the next generation of data-driven coastal models that target continental scales can only be built when: 1) processing workflows are scalable; 2) computations are run in proximity to the data; 3) data are available in cloud-optimized formats; 4) and, data are described following standardized metadata specifications. In this study, we introduce these practices to the coastal research community by showcasing the advantages of cloud-native workflows by two case studies.

In the first example we map building footprints in areas prone to coastal flooding and estimate the assets at risk. For this analysis we chunk a coastal flood-risk map into several tiles and incorporate those into a coastal SpatioTemporal Asset Catalog (STAC). The second example benchmarks instantaneous shoreline mapping using cloud-native workflows against conventional methods. With data-proximate computing, processing time is reduced from the order of hours to seconds per shoreline km, which means that a highly-specialized coastal mapping expedition can be upscaled from regional to global level.

The analyses mostly rely on "core-packages" from the Pangeo project, with some additional support for scalable geospatial data analysis and cloud I/O, although they can essentially be run on a standard Python Planetary Computer instance. We publish our code, including self-explanatory Juypter notebooks, at https://github.com/floriscalkoen/egu2023.

To conclude, we foresee that in next years several coastal data products are going to be published, of which some may be considered "big data". To incorporate these data products into the next generation of coastal models, it is urgently required to agree upon protocols for coastal data stewardship. With this study we do not only want to show the advantages of scalable coastal data analysis; we mostly want to encourage the coastal research community to adopt FAIR data management principles and workflows in an era of exponential data growth.

How to cite: Calkoen, F., Baart, F., Kras, E., and Luijendijk, A.: A novel data ecosystem for coastal analyses, EGU General Assembly 2023, Vienna, Austria, 23–28 Apr 2023, EGU23-15964, https://doi.org/10.5194/egusphere-egu23-15964, 2023.

EGU23-16117 | ECS | Orals | ESSI2.8

Virtual aggregations to improve scientific ETL and data analysis for datasets from the Earth System Grid Federation 

Ezequiel Cimadevilla, Maialen Iturbide, and Antonio S. Cofiño

The ESGF Virtual Aggregation (EVA) is a new data workflow approach that aims to advance the sharing and reuse of scientific climate data stored in the Earth System Grid Federation (ESGF). The ESGF is a global infrastructure and network of internationally distributed research centers that together work as a federated data archive, supporting the distribution of global climate model simulations of the past, current and future climate. The ESGF provides modeling groups with nodes for publishing and archiving their model outputs to make them accessible to the climate community at any time. The standardization of the model output in a specified format, and the collection, archival and access of the model output through the ESGF data replication centers have facilitated multi-model analyses. Thus, ESGF has been established as the most relevant distributed data archive for climate data, hosting the data for international projects such as CMIP and CORDEX. As of 2022 it includes more than 30 PB of data distributed across research institutes all around the globe and it is the reference archive for Assessment Reports (AR) on Climate Change produced by the Intergovernmental Panel on Climate Change (IPCC). However, explosive data growth has confronted the climate community with a scientific scalability issue. Conceived as a distributed data store, the ESGF infrastructure is designed to keep file sizes manageable for both sysadmins and end users. However, use cases in scientific research often involve calculations on datasets spanning multiple variables, over the whole time period and multiple model ensembles. In this sense, the ESGF Virtual Aggregation extends the federation capabilities, beyond file search and download, by providing out of the box remote climate data analysis capabilities over data analysis ready, virtually aggregated, climate datasets, on top of the existing software stack of the federation. In this work we show an analysis that serves as a test case for the viability of the data workflow and provides the basis for discussions on the future of the ESGF infrastructure, contributing to the debate on the set of reliable core services upon which the federation should be built.

Acknowledgements

This work it’s been developed under support from IS-ENES3 which is funded by the European Union’s Horizon 2020 research and innovation programme under grant agreement No 824084.

This work it’s been developed under support from CORDyS (PID2020-116595RB-I00) funded by MCIN/AEI/10.13039/501100011033.

How to cite: Cimadevilla, E., Iturbide, M., and Cofiño, A. S.: Virtual aggregations to improve scientific ETL and data analysis for datasets from the Earth System Grid Federation, EGU General Assembly 2023, Vienna, Austria, 23–28 Apr 2023, EGU23-16117, https://doi.org/10.5194/egusphere-egu23-16117, 2023.

EGU23-17029 | Orals | ESSI2.8

Establishing a Geospatial Discovery Network with efficient discovery and modeling services in multi-cloud environments 

Campbell Watson, Hendrik Hamann, Kommy Weldemariam, Thomas Brunschwiler, Blair Edwards, Anne Jones, and Johannes Schmude

The ballooning volume and complexity of geospatial data is one of the main inhibitors for advancements in climate & sustainability research. Oftentimes, researchers need to create bespoke and time-consuming workflows to harmonize datasets, build/deploy AI and simulation models, and perform statistical analysis. It is increasingly evident that these workflows and the underlying infrastructure are failing to scale and exploit the massive amounts of data (Peta and Exa-scale) which reside across multiple data centers and continents. While there have been attempts to consolidate relevant geospatial data and tooling into single cloud infrastructures, we argue that the future of climate & sustainability research relies on networked/federated systems. Here we present recent progress towards multi-cloud technologies that can scale federated geospatial discovery and modeling services across a network of nodes. We demonstrate how the system architecture and associated tooling can simplify the discovery and modeling process in multi-cloud environments via examples of federated analytics for AI-based flood detection and efficient data dissemination inspired by AI foundation models.

How to cite: Watson, C., Hamann, H., Weldemariam, K., Brunschwiler, T., Edwards, B., Jones, A., and Schmude, J.: Establishing a Geospatial Discovery Network with efficient discovery and modeling services in multi-cloud environments, EGU General Assembly 2023, Vienna, Austria, 23–28 Apr 2023, EGU23-17029, https://doi.org/10.5194/egusphere-egu23-17029, 2023.

EGU23-17494 | Orals | ESSI2.8

Enabling simple access to a data lake both from HPC and Cloud using Kerchunk and Intake 

Thierry Carval, Erwan Bodere, Julien Meillon, Mathiew Woillez, Jean Francois Le Roux, Justus Magin, and Tina Odaka

We are experimenting with hybrid access from Cloud and HPC environments using the Pangeo platform to make use of a data lake in an HPC infrastructure “DATARMOR”.  DATARMOR is an HPC infrastructure hosting ODATIS services (https://www.odatis-ocean.fr) situated at “Pôle de Calcul et de Données pour la Mer” in IFREMER. Its parallel file system has a disk space dedicated for shared data, called “dataref”.  Users of DATARMOR can access these data, and some of those data are cataloged by sextant service (https://sextant.ifremer.fr/Ressources/Liste-des-catalogues-thematiques/Datarmor-Donnees-de-reference ) and is open and accessible from the internet, without duplicating the data. 

In the cloud environment, the ability to access files in a parallel manner is essential for improving the speed of calculations. The Zarr format (https://zarr.readthedocs.io) enables parallel access to data sets, as it consists of numerous chunked “object data” files and some “metadata” files. Although it enables multiple data access, it is simple to use since all the collections of data stored in a Zarr format are accessible through one access point.  

For HPC centers, the numerous “object data” files create a lot of metadata on parallel file systems, slowing the data access time. Recent progress on development of Kerchunk (https://fsspec.github.io/kerchunk/), which recognize the chunks in a file (e.g. NetCDF / HDF5) as a Zarr chunk and its capability to recognize a series of files as one Zarr file, is solving these technical difficulties in our PANGEO use cases at DATARMOR. Thanks to Kerchunk and Intake (https://intake.readthedocs.io/) it is now possible to use different sets of data stored in DATARMOR in an efficient and simple manner.    

We are further experimenting with this workflow using the same use cases on the PANGEO-EOSC cloud.   We make use of the same data stored at the data lake in DATARMOR, but based on Kerchunk and Intake catalog through ODATIS access, without duplicating the source data. In the presentation we will share our recent experiences from these experiments. 

How to cite: Carval, T., Bodere, E., Meillon, J., Woillez, M., Le Roux, J. F., Magin, J., and Odaka, T.: Enabling simple access to a data lake both from HPC and Cloud using Kerchunk and Intake, EGU General Assembly 2023, Vienna, Austria, 23–28 Apr 2023, EGU23-17494, https://doi.org/10.5194/egusphere-egu23-17494, 2023.

EGU23-2379 | PICO | ESSI4.1

Visualizing and communicating probabilistic flood forecasts maps for decision-making 

Marie-Amélie Boucher, Valérie Jean, Anissa Frini, and Dominic Roussel

Probabilistic flood forecasts often concentrate on streamflow, but water depth and extent might convey more tangible flood information for some people. Water depths and extent can also be used more directly than streamflow as part of an impact-based forecasting set-up. However, within a probabilistic or ensemble approach, the uncertainty inherent to water extent and depth applies to all three spatial dimensions: the depth itself is uncertain, and so is the extent in terms of latitude and longitude. The notion of forecast uncertainty is generally well accepted by users, and on the one hand, the addition of new information (flood extent, depth, velocity, etc.) has the potential to be useful for decision makers. On the other hand, it also has the potential to be overwhelming and confusing. Therefore, visualising probabilistic flood forecast maps and communicating the information to the general public and to decision-makers poses multiple challenges. In this presentation we will synthesise the results from a large-scale survey of forecast users, including 28 government representatives, 52 municipalities, 9 organisations, as well as 37 citizens and farmers. Those different groups have different roles, realities, and perspectives. They also have different needs and preferences in terms of hydrological forecasts. The survey consisted of individual and group interviews. The participants were asked a variety of open questions regarding their needs and preferences for hydrological forecasts and also for the visualisation and the communication of those forecasts. One key element of the interviews was the presentation of four alternative visualisation prototypes for probabilistic forecasts of flood depth and extent. The participants were asked to compare those prototypes, to express their preferences in terms of colour maps, wording and the representation of uncertainty. They also provided useful comments on potential modifications to those prototypes and sometimes suggested ideas for entirely new prototypes. Our results highlight that most participants, regardless of their role or background, had the same overall preference in terms of the proposed prototypes, with prototype number 2 the overall favorite (all prototypes will be shown and explained during the presentation). Nevertheless, we also found several specificities among the respective preferences of different user groups. Our results also highlight specific issues related to the understanding of probabilities in the context of flood forecast maps.  The results of this research are currently being used to inform the design of the new forecast communication and visualisation platform in the province of Quebec, Canada.

How to cite: Boucher, M.-A., Jean, V., Frini, A., and Roussel, D.: Visualizing and communicating probabilistic flood forecasts maps for decision-making, EGU General Assembly 2023, Vienna, Austria, 23–28 Apr 2023, EGU23-2379, https://doi.org/10.5194/egusphere-egu23-2379, 2023.

EGU23-3624 | ECS | PICO | ESSI4.1

ESM Data Exploration with the Model Data Explorer 

Philipp S. Sommer, Linda Baldewein, Hatef Takyar, Rehan Chaudhary, Mostafa Hadizadeh, Housam Dibeh, Max Böcke, Christof Lorenz, Tilman Dinter, Stefan Pinkernell, Klaus Getzlaff, and Ulrike Kleeberg

Making Earth-System-Model (ESM) Data accessible is challenging due to the large amount of data that we are facing in this realm. The upload is time-consuming, expensive, technically complex, and every institution has their own procedures.

Non-ESM experts face a lot of problems and pure data portals are hardly usable for inter- and trans-disciplinary communication of ESM data and findings, as this level of accessibility often requires specialized web or computing services. 

With the Model Data Explorer, we want to simplify the generation of web services from ESM data, and we provide a framework that allows us to make the raw model data accessible to non-ESM experts.

Our decentralized framework implements the possibility for an efficient remote processing of distributed ESM data. Users interface with an intuitive map-based front-end to compute spatial or temporal aggregations, or select regions to download the data. The data generators (i.e. the scientist with access to the raw data) use a light-weight and secure python library based on the Data Analytics Software Framework (DASF, https://digital-earth.pages.geomar.de/dasf/dasf-messaging-python) to create a back-end module. This back-end module runs close to the data, e.g. on the HPC-resource where the data is stored. Upon request, the module generates and provides the required data for the users in the web front-end.

Our approach is intended for scientists and scientific usage! We aim for a framework where web-based communication of model-driven data science can be maintained by the scientific community. The Model Data Explorer ensures fair reward for the scientific work and adherence to the FAIR principles without too much overhead and loss in scientific accuracy. 

The Model Data Explorer is in the progress of development at the Helmholtz-Zentrum Hereon, together with multiple scientific and data management partners in other German research centers. The full list of contributors is constantly updated and can be accessed at https://model-data-explorer.readthedocs.io.

How to cite: Sommer, P. S., Baldewein, L., Takyar, H., Chaudhary, R., Hadizadeh, M., Dibeh, H., Böcke, M., Lorenz, C., Dinter, T., Pinkernell, S., Getzlaff, K., and Kleeberg, U.: ESM Data Exploration with the Model Data Explorer, EGU General Assembly 2023, Vienna, Austria, 23–28 Apr 2023, EGU23-3624, https://doi.org/10.5194/egusphere-egu23-3624, 2023.

EGU23-3652 | ECS | PICO | ESSI4.1

A new set of tools to explore, analyze, and communicate animal movements with environmental and anthropogenic context 

Justine Missik, Gil Bohrer, Madeline Scyphers, Sarah Davidson, Roland Kays, Nilanjan Chatterjee, Allicia Kelly, Ashley Lohr, Andrea Kölzsch, Martin Wikelski, and John Fieberg

The Yellowstone to Yukon Conservation Corridor (Y2Y) is North America's largest nature corridor and connectivity project for wildlife. The 2,000-mile swath of land between Wyoming, USA and the Yukon Territory of Canada is one of the last remaining intact mountain ecosystems on Earth, and home to many endangered and at-risk species. The Y2Y is a mosaic of protected and unprotected land including Canadian and US national/state/provincial/territory parks, federally/state managed wildland and national forests, Indigenous territories, and privately managed conservation easements. We are developing a collaborative animal-movement archive for the Y2Y and research tools to study and communicate the effectiveness of protected areas, drivers of migration, and movement connectivity. These tools are applied by end users throughout the Y2Y to support decision making and land and wildlife management.

Our Movebank-based archive of in situ animal location observations provides a uniform data format and QA protocol for conducting large-scale, long-term, and multi-species analyses in support of wildlife management efforts in the region. These data will contribute to biodiversity assessments related to climate and other regional and global changes, and provide a baseline against which to detect early signals of local or large-scale ecosystem changes. We have developed an array of interactive tools for preparing and analyzing movement data using the MoveApps platform, a GUI-based App-development environment for data processing and analysis tools. These tools facilitate the integration of contextual environmental data from remote sensing and weather data products, and additional local environmental data layers. We have developed Apps to detect and quantify events of interest, particularly road crossings, parturition events and kill clusters, and are developing additional Apps to conduct resource and step-selection analyses using data from multiple studies at varying resolutions. To facilitate data exploration and data-based outreach and communication, we have developed ECODATA – a set of data preparation and visualization software packages in MATLAB and Python for building custom animated maps of animal movements along with contextual land management and environmental data layers.

MoveApps and ECODATA are general tools that can be applied to any animal movement dataset. Initial research questions and applications, catered to the decision-making needs of our end users in the Y2Y project, include: How are protected lands utilized by mammals throughout the Y2Y? How is connectivity between conservation areas influenced by current and predicted future environmental characteristics and anthropogenic disturbances (roads in particular)? Continuous joint development and application of tools with active collaboration with our end users guarantee that the research tools we develop answer the management and research needs of end users, while answering new and exciting questions about environmental drivers of movement in the Y2Y.

How to cite: Missik, J., Bohrer, G., Scyphers, M., Davidson, S., Kays, R., Chatterjee, N., Kelly, A., Lohr, A., Kölzsch, A., Wikelski, M., and Fieberg, J.: A new set of tools to explore, analyze, and communicate animal movements with environmental and anthropogenic context, EGU General Assembly 2023, Vienna, Austria, 23–28 Apr 2023, EGU23-3652, https://doi.org/10.5194/egusphere-egu23-3652, 2023.

EGU23-8381 | ECS | PICO | ESSI4.1

Construction of a Fluvial Facies Knowledge Graph and Its Application in Sedimentary Facies Identification 

Lei Zhang, Mingcai Hou, Anqing Chen, Hanting Zhang, Ogg James, and Dongyu Zheng

Lithofacies paleogeography is a data-intensive discipline that involves the interpretation and compilation of sedimentary facies. Traditional sedimentary facies analysis is a labor-intensive task with the added complexity of using unstructured knowledge and unstandardized terminology. Therefore, it is very difficult for beginners or non-geology scholars who lack a systematic knowledge and experience in sedimentary facies analysis. These hurdles could be partly alleviated by having a standardized, structured and systematic knowledge base coupled with an efficient automatic machine-assisted sedimentary facies identification system. To this end, this study constructed a knowledge system for fluvial facies and carried out knowledge representation. Components include a domain knowledge graph for types of fluvial facies (meandering, braided and other river depositional environments) and their characteristic features (bedforms, grain-size distribution, etc.) with visualization, a method for query and retrieval on a graph database platform, a hierarchical knowledge tree-structure, a data-mining clustering algorithm for machine-analysis of publication texts, and an algorithm model for this area of sedimentary facies reasoning. The underlying sedimentary facies identification and knowledge reasoning system is based on expert experience and synthesis of publications. For testing, 17 sets of literature publications data that included details of sedimentary facies data (bedforms, grain sizes, etc.) were submitted to the AI model, then compared and validated. This testing set of automated reasoning results yielded an interpretation accuracy of about 90% relative to the published interpretations in those papers. Therefore, the model and algorithm provide an efficient and automated reasoning technology, which provides a new approach and route for the rapid and intelligent identification of other types of sedimentary facies from literature data and direct use in the field.

How to cite: Zhang, L., Hou, M., Chen, A., Zhang, H., James, O., and Zheng, D.: Construction of a Fluvial Facies Knowledge Graph and Its Application in Sedimentary Facies Identification, EGU General Assembly 2023, Vienna, Austria, 23–28 Apr 2023, EGU23-8381, https://doi.org/10.5194/egusphere-egu23-8381, 2023.

EGU23-9258 | ECS | PICO | ESSI4.1

Lexcube: An Interactive Earth Science Data Cube Visualization 

Maximilian Söchting, Miguel D. Mahecha, David Montero Loaiza, and Gerik Scheuermann

A variety of Earth system data streams are being captured and derived from remote sensing observations and modelling approaches. Since the spatial and temporal resolutions of these datasets continuously rise, global and local insights become more difficult to obtain and only specialists are able to effectively access and explore the data.

Here we present the Leipzig Explorer of Earth Data Cubes (lexcube.org), the first fully interactive viewer for large Earth system data cubes, enabling the exploration and visualization of terabytes of data through space and time. Lexcube runs in the web browser and on many modern devices, including phones and tablets, works with a weak network connection and requires no coding skills. It can also be used to support field research by displaying the current geolocation of the user device in the visualization, allowing to compare past Earth system data to the current real-world situation in the field. 

Currently, lexcube.org allows to explore the Earth System Data Cube with 73 parameters from various domains, the ECMWF CAMS global reanalysis of atmospheric composition EAC4 and a data set of 97 different spectral indices from the national park Hainich in Germany. As of January 2023, lexcube.org has seen over 2,500 users who have generated over 145,000 API requests since its release in May 2022. Utilizing the open-source library xarray, Lexcube is capable of browsing any supported gridded data set in space and time, integrating into the existing data cube open-source ecosystem. Lexcube itself will be released in 2023 as an accessible, easy-to-use open-source package.

How to cite: Söchting, M., Mahecha, M. D., Montero Loaiza, D., and Scheuermann, G.: Lexcube: An Interactive Earth Science Data Cube Visualization, EGU General Assembly 2023, Vienna, Austria, 23–28 Apr 2023, EGU23-9258, https://doi.org/10.5194/egusphere-egu23-9258, 2023.

EGU23-9952 | PICO | ESSI4.1 | Highlight

The Earth Data Portal for Finding and Exploring Research Content 

Robin Heß, Karen Albers, Peter Konopatzky, Roland Koppe, and Andreas Walter

Digitization and the Internet in particular have created new ways to find, re-use, and process scientific research data. Many scientists and research centers want to make their data available to the public and other researchers, but often the data is still not easy to find because it is distributed across different infrastructures. Rights of use and citability are sometimes unclear, and access to the data may have to be requested manually from the persons in charge.

The Earth Data Portal aims to provide a single point of entry for discovery and re-use of scientific research data in compliance with the FAIR principles. The portal aggregates data of the earth and environment research area from various providers and improves its findability. We also encourage publishing with permanent identifiers so that data is citable according to good scientific practice. As part of the German Marine Research Alliance and the Helmholtz-funded DataHub project, leading German research centers are working on joint data management concepts, including the data portal.

The portal offers a modern web interface with a full-text search, facets and explorative visualization tools. Seamless integration into the Observation to Analysis and Archives Framework (O2A) developed by the Alfred Wegener Institute also enables automated data flows from data collection to publication in the PANGAEA data repository and visibility in the portal. Current metadata on research missions and platforms also finds its way into the portal.

Logged in users get access to a common workspace that enables data processing on a shared infrastructure. This includes access to a shared file system, a Linux shell and a JupyterHub. The common workspace is strongly integrated into the automated data flow and enables access to automatically ingested data.

Another important part of the project is a comprehensive framework for data visualization, which brings user-customizable map viewers into the portal. Pre-curated viewers currently enable the visualization and exploration of data products from maritime research. The login feature also empowers users to create their own viewers including OGC services-based data products from different sources.

In the development of the portal, we use state of the art web technologies to offer user-friendly and high-performance tools for scientists. Regular demonstrations, feedback loops and usability workshops ensure implementation with added value.

How to cite: Heß, R., Albers, K., Konopatzky, P., Koppe, R., and Walter, A.: The Earth Data Portal for Finding and Exploring Research Content, EGU General Assembly 2023, Vienna, Austria, 23–28 Apr 2023, EGU23-9952, https://doi.org/10.5194/egusphere-egu23-9952, 2023.

EGU23-11191 | PICO | ESSI4.1

Making complex climate information available for a stakeholder dialogue: the Climate Monitor for Northern Germany 

Markus Benninghoff, Philipp S. Sommer, Linda Baldewein, and Insa Meinke

Climate research in Northern Germany provides important information to enable adaption to climate change. However, the increasing complexity and the amount of data that needs to be processed makes the information inaccessible for external parties outside of the climate modeling community. Since 2007 the Coastal and Climate Office for Northern Germany at Helmholtz-Zentrum Hereon has maintained a long term stakeholder dialogue. In this context, we make knowledge on coastal climate research available to the public, and to decision-makers. Our range of stakeholders consists of adjacent scientific research groups, interested individuals, governmental bodies, non-governmental organizations, media, education and more.

Web applications, such as the Climate Monitor for Northern Germany, play a central role in our efforts to transfer scientific knowledge to our stakeholders. Originally released in 2014, the monitor comprehends data derived from freely available climate datasets of the last few decades, such as CoastDat, eOBS, CRU TS and more. We provide derived climate information for the most-requested parameters, namely temperature, precipitation, humidity, wind, cloudiness, and vegetation but also analyze indices on extremes such as heat, severe rain fall and storms. We answer the questions of our regional stakeholders, e.g. “How does a changing climate affect our interests?”, by visualizing spatial averages (municipality to state-level scale), as well as comprehensive, interactive and comparable time-series and a descriptive interpretation of both. This tool has been proven to be a valuable asset in stakeholder communication and allows everyone to access crucial climate information for their region of interest.

In our latest release we take user needs into account and redesign the front-end using a mixture of open-source libraries and OGC services provided by ESRI. With the re-design we introduce interactive webmaps and apps, intended to simplify navigability through this complex theme and its far-reaching visualization collection. We aim to increase user engagement through a familiar user interface, consistent with similar web applications. Our data processing pipelines have been streamlined to make the results conform to the FAIR principles. Besides the visual representation of the results, we provide download options for the raw data, and the computational methods are published open-source in the form of Jupyter notebooks. We focus on ease of maintenance, accessibility and on instantaneous publication of the latest results. In this presentation we highlight the workflows and experiences behind creating this user centric web tool, and discuss where we see the benefits of integrating web tools in knowledge transfer.

How to cite: Benninghoff, M., Sommer, P. S., Baldewein, L., and Meinke, I.: Making complex climate information available for a stakeholder dialogue: the Climate Monitor for Northern Germany, EGU General Assembly 2023, Vienna, Austria, 23–28 Apr 2023, EGU23-11191, https://doi.org/10.5194/egusphere-egu23-11191, 2023.

EGU23-12762 | ECS | PICO | ESSI4.1

FORESTER – Interactive visualization of tree-based machine learning 

David Strahl, Robert Reinecke, and Thorsten Wagener

Visualizations are crucial for machine learning as they allow practitioners to understand, analyze, and communicate their models. They help interpret complex models by providing a graphical representation of both data and model performance. Visualizations can be used to understand the underlying patterns and trends in the data, identify biases and errors, and diagnose problems with the model. They also help in communicating the results of the model to a non-technical audience by providing an intuitive and interactive way to present the findings.

Tree-based machine learning methods, such as Classification and Regression Trees or Random Forest, are well-established and widely used in the Earth Sciences. However, visualization tools provided by common machine-learning environments in Python, R, or Matlab often provide graphical representations that could be more visually appealing or helpful in conveying a clear message.

Here we present FORESTER, a web-based and open-source software that produces visually appealing tree-based visualizations. Forester produces publication-ready plots that are, at the same time, interactive figures that can guide the user in interpreting the model. Visualizations can be streamlined to the user's requirements and offer a wide variety of insightful techniques. This makes Forester a promising alternative to currently used environments. Forester is open to collaborations, so we hope it will be extended within the Earth Science community and beyond, proving useful in other machine-learning-related fields.

How to cite: Strahl, D., Reinecke, R., and Wagener, T.: FORESTER – Interactive visualization of tree-based machine learning, EGU General Assembly 2023, Vienna, Austria, 23–28 Apr 2023, EGU23-12762, https://doi.org/10.5194/egusphere-egu23-12762, 2023.

EGU23-14349 | PICO | ESSI4.1

EPOS-Norway Portal 

Jan Michálek, Kuvvet Atakan, Lars Ottemøller, Øyvind Natvik, Tor Langeland, Ove Daae Lampe, Gro Fonnes, Jeremy Cook, Jon Magnus Christensen, Ulf Baadshaug, Halfdan Pascal Kierulf, Bjørn Ove Grøtan, John Dehls, Odleiv Olesen, and Valerie Maupin

The European Plate Observing System (EPOS) is a European project about building a pan-European infrastructure for accessing solid Earth science data, governed now by EPOS ERIC (European Research Infrastructure Consortium). The EPOS-Norway project (EPOS-N; RCN-Infrastructure Programme - Project no. 245763) is a Norwegian project funded by National Research Council. The aim of the Norwegian EPOS e‑infrastructure is to integrate data from the seismological and geodetic networks, as well as the data from the geological and geophysical data repositories. Among the six EPOS-N project partners, four institutions are providing data – University of Bergen (UIB), - Norwegian Mapping Authority (NMA), Geological Survey of Norway (NGU) and NORSAR.

In this contribution, we present the EPOS-Norway Portal as an online, open access, interactive tool, allowing visual analysis of multidimensional data. It supports maps and 2D plots with linked visualizations. Currently access is provided to more than 300 datasets (18 web services, 288 map layers and 14 static datasets) from four subdomains of Earth science in Norway. New datasets are planned to be integrated in the future. EPOS-N Portal can access remote datasets via web services like FDSNWS for seismological data and OGC services for geological and geophysical data (e.g. WMS). Standalone datasets are available through preloaded data files. Users can also simply add another WMS server or upload their own dataset for visualization and comparison with other datasets. This portal provides unique way (first of its kind in Norway) for exploration of various geoscientific datasets in one common interface. One of the key aspects is quick simultaneous visual inspection of data from various disciplines and test of scientific or geohazard related hypothesis. One of such examples can be spatio-temporal correlation of earthquakes (1980 until now) with existing critical infrastructures (e.g. pipelines), geological structures, submarine landslides or unstable slopes. 

The EPOS-N Portal is implemented by adapting Enlighten-web, a server-client program developed by NORCE. Enlighten-web facilitates interactive visual analysis of large multidimensional data sets, and supports interactive mapping of millions of points. The Enlighten-web client runs inside a web browser. An important element in the Enlighten-web functionality is brushing and linking, which is useful for exploring complex data sets to discover correlations and interesting properties hidden in the data. The views are linked to each other, so that highlighting a subset in one view automatically leads to the corresponding subsets being highlighted in all other linked views.

How to cite: Michálek, J., Atakan, K., Ottemøller, L., Natvik, Ø., Langeland, T., Lampe, O. D., Fonnes, G., Cook, J., Christensen, J. M., Baadshaug, U., Kierulf, H. P., Grøtan, B. O., Dehls, J., Olesen, O., and Maupin, V.: EPOS-Norway Portal, EGU General Assembly 2023, Vienna, Austria, 23–28 Apr 2023, EGU23-14349, https://doi.org/10.5194/egusphere-egu23-14349, 2023.

The MOSAiC Expedition 2019/20 (https://mosaic-expedition.org) brought together scientists from different research institutes around the globe for a year in the Central Arctic. They collected an incredible amount of data to expand the understanding of the Arctic, its distinct features, and the consequences of a changing climate. Since January 2023, the data collected during the MOSAiC Expedition is available as Open Source in the long-term archive Pangaea (https://pangaea.de) for anyone who would like to learn and study the Arctic Ocean and its features. The M-VRE webODV Project (https://mosaic-vre.org) aims to offer an interactive online exploration, visualization, and analysis of the MOSAiC data in a user-friendly environment. In the M-VRE webODV (https://mvre.webodv.cloud.awi.de), these data are presented as Data Collections that consist of similar datasets aggregated into singular collections and Interdisciplinary Collections, where complementary datasets are aggregated into collections. However, for the MOSAiC data to be explored, visualized, and analyzed with webODV, it has to be converted from the tab file format used in the Pangaea archive to an ODV readable format. Therefore, the data is converted through a six steps process: search, filtering, download of datasets, data aggregation, metadata preparation, and data conversion into the ODV format. Although several datasets after those steps are ready to be uploaded to the M-VRE webODV, other datasets need special and individualized conversions. As a result of the data conversion process and the special conversions, the Data Collections and Interdisciplinary Collections of MOSAiC Expedition data are uploaded to the M-VRE webODV and available for user exploration, visualization, and analysis. The M-VRE webODV is since January 2023 open to the global community, and the number of available Collections is increasing.

*MOSAiC – Multidisciplinary drifting Observatory for the Study of Arctic Climate

*M-VRE webODV – MOSAiC Virtual Research Environment web Ocean Data View

How to cite: Linck Rosenhaim, I., Mieruch-Schnülle, S., and Schlitzer, R.: Data preparation for the development of a user-friendly, free, online, and interactive platform for the visualization and analysis of interdisciplinary data, EGU General Assembly 2023, Vienna, Austria, 23–28 Apr 2023, EGU23-14352, https://doi.org/10.5194/egusphere-egu23-14352, 2023.

EGU23-15375 | PICO | ESSI4.1

O3as: Ozone trend visualisations and return dates developed within within EOSC-synergy 

Tobias Kerzenmacher, Valentin Kozlov, Borja Esteban Sanchis, Ugur Cayoglu, Marcus Hardt, and Peter Braesicke

The O3as service is a tool designed to support the assessment of atmospheric ozone levels and trends. It was developed as one of the thematic services of the EOSC-Synergy project. It allows for the analysis of large datasets from chemistry-climate models and presents the information in a user-friendly format for a broad range of users, including scientists, pupils, and interested citizens. The service utilizes a unified approach to process the data, employs CF conventions for homogenization, and generates figures that can be published or downloaded as csv files. It was developed as part of the EOSC-Synergy project, and it runs on a cloud-based, containerized architecture orchestrated by Kubernetes and HPC resources, and uses the Large Scale Data Facility (LSDF) at the KIT for data storage. The service is developed with best software practices, including quality assurance, continuous integration and delivery, and compliance with the FAIR principles. 

This presentation will focus in particular on the architecture and functionality of the O3as service, with an example demonstration of its usage.

How to cite: Kerzenmacher, T., Kozlov, V., Esteban Sanchis, B., Cayoglu, U., Hardt, M., and Braesicke, P.: O3as: Ozone trend visualisations and return dates developed within within EOSC-synergy, EGU General Assembly 2023, Vienna, Austria, 23–28 Apr 2023, EGU23-15375, https://doi.org/10.5194/egusphere-egu23-15375, 2023.

EGU23-17202 * | ECS | PICO | ESSI4.1 | Highlight

Visualising high-resolution global land use change of six decades 

Karina Winkler, Richard Fuchs, Mark Rounsewell, and Martin Herold

People have shaped the land surface for many centuries. However, the global expansion of land use is fuelling climate change and threatening biodiversity. At the same time, there is an ever-increasing need to supply our growing world population with food, energy and materials. Despite the crucial role of land use for solving global sustainability challenges, existing data on long-term land use change lacks the spatial, temporal and thematic detail to comprehensively capture the changes in its full dynamics.


We synergistically combined multiple open data streams (remote sensing-based land cover maps, land use reconstructions and statistics) to examine the spatio-temporal patterns of global land use change of global land use change. For this, we developed the HIstoric Land Dynamics Assessment+ (HILDA+), a modelling framework providing data-derived, annual gross changes between six land use/cover categories (urban, cropland, pasture/rangeland, forest, unmanaged grass/shrubland, sparse/no vegetation) at a spatial resolution of 1km and for a reference period of 1960-2020. Derived land use/cover maps are published as Open Data.


In this live demo, we present our findings through an interactive map viewer - a visualisation of global land use change of the past six decades. The data visualisation builds on the open-source server GeoServer. We will interactively explore the extent of land use change and its diverging patterns across the globe.

How to cite: Winkler, K., Fuchs, R., Rounsewell, M., and Herold, M.: Visualising high-resolution global land use change of six decades, EGU General Assembly 2023, Vienna, Austria, 23–28 Apr 2023, EGU23-17202, https://doi.org/10.5194/egusphere-egu23-17202, 2023.

EGU23-946 | ECS | Orals | NP5.1

Combining Bayesian Neural Networks with explainable AI techniques for trustworthy probabilistic post-processing 

Mariana Clare, Zied Ben Bouallegue, Matthew Chantry, Martin Leutbecher, and Thomas Haiden

The large data volumes available in weather forecasting make post-processing an attractive field for applying machine learning. In turn, novel statistical machine learning methods that can be used to generate uncertainty information from a deterministic forecast are of great interest to forecast users, especially given the computational cost of running high resolution ensembles. In this work, we show how one such method, a Bayesian Neural Network (BNN), can be used to post-process a single global high resolution forecast for 2m temperature. This methodology improves both the accuracy of the forecast and adds uncertainty information, by predicting the distribution of the forecast error relative to its own analysis.

Here we assess both model and data uncertainty using two different BNN approaches. In the first approach, the BNN’s parameters are defined to be distributions rather than deterministic parameters, thereby generating an ensemble of models that can be used to quantify model uncertainty. In the second approach, the BNN remains deterministic but predicts a distribution rather than a deterministic output thereby quantifying data uncertainty. Our BNN results are benchmarked against simpler statistical methods, as well as statistics from the ECMWF operational ensemble.

Finally, in order to add trustworthiness to the BNN predictions, we apply an explainable AI technique (Layerwise Relevance Propagation) so as to understand whether the variables on which the BNN bases its prediction are physically reasonable or whether it is instead learning spurious correlations.

How to cite: Clare, M., Ben Bouallegue, Z., Chantry, M., Leutbecher, M., and Haiden, T.: Combining Bayesian Neural Networks with explainable AI techniques for trustworthy probabilistic post-processing, EGU General Assembly 2023, Vienna, Austria, 23–28 Apr 2023, EGU23-946, https://doi.org/10.5194/egusphere-egu23-946, 2023.

EGU23-1365 | Posters virtual | NP5.1

Improving post-processing of East African precipitation forecasts using a generative machine learning model 

Bobby Antonio, Andrew McRae, Dave MacLeod, Fenwick Cooper, John Marsham, Laurence Aitchison, Tim Palmer, and Peter Watson

Existing weather models are known to have poor skill over Africa, where there are regular threats of drought and floods that present significant risks to people's lives and livelihoods. Improved precipitation forecasts could help mitigate the negative effects of these extreme weather events, as well as providing significant financial benefits to the region. Building on work that successfully applied a state-of-the-art machine learning method (a conditional Generative Adversarial Network, cGAN) to postprocess precipitation forecasts in the UK, we present a novel way to improve precipitation forecasts in East Africa. We address the challenge of realistically representing tropical convective rainfall in this region, which is poorly simulated in conventional forecast models. We use a cGAN to postprocess ECMWF high resolution forecasts at 0.1 degree resolution and 6-18h lead times, using the iMERG dataset as ground truth, and investigate how well this model can correct bias, produce reliable probability distributions and create samples of rainfall with realistic spatial structure. We will also present performance in extreme rainfall events. This has the potential to enable cost effective improvements to early warning systems in the affected areas.

How to cite: Antonio, B., McRae, A., MacLeod, D., Cooper, F., Marsham, J., Aitchison, L., Palmer, T., and Watson, P.: Improving post-processing of East African precipitation forecasts using a generative machine learning model, EGU General Assembly 2023, Vienna, Austria, 23–28 Apr 2023, EGU23-1365, https://doi.org/10.5194/egusphere-egu23-1365, 2023.

EGU23-2592 | ECS | Orals | NP5.1

U-Net based Methods for the Postprocessing of Precipitation Ensemble Forecasting 

Romain Pic, Clément Dombry, Maxime Taillardat, and Philippe Naveau

Most Numerical Weather Prediction (NWP) systems use statistical postprocessing methods to correct for bias and underdispersion errors made by ensemble forecasting. This underdispersion leads to an underestimation of extreme events. Thus, many statistical postprocessing methods have been used to take into consideration the extremal behavior of meteorological phenomena such as precipitation. State-of-the-art techniques are based on Machine Learning combined with knowledge from Extreme Value Theory in order to improve forecasts. However, some of the best techniques do not consider the spatial dependency between locations. For example, Taillardat et al. (2019) trains a different Quantile Regression Forest at each location of interest and Rasp & Lerch (2018) uses neural networks with an embedding for the station's information in order to train a global model.
The dataset used corresponds to 3-h precipitation amounts produced by the radar-based observations of ANTILOPE and the 17-members ensemble forecast system called PEAROME. The dataset spans over the south of France with a grid resolution of 0.025 degrees. Our method uses a U-Net-like neural network in order to take into account the spatial structure of the data and the output of our model is a parameterized law at each grid point. Among the choices available in the literature, we focused on the Extended Generalized Pareto Distribution  and the truncated logistic with a point mass in 0. The model is trained by minimizing the scoring rules such as the Continuous Ranked Probability Score, the Log-Score or weighted versions of the aforementioned scoring rules. The method developed here is then compared to the raw ensemble as well as state-of-the-art techniques through scoring rules, skill scores and ROC curves.

References :

  • L. Pacchiardi, R. Adewoyin, P. Dueben, and R. Dutta. Probabilistic forecasting with generative networks via scoring rule minimization. Dec. 2021. arXiv:2112.08217
  • M. Taillardat, A.-L. Fougères, P. Naveau, and O. Mestre. Forest-based and semiparametric methods for the postprocessing of rainfall ensemble forecasting. Weather and Forecasting, 34(3):617–634, jun 2019. doi: 10.1175/waf-d-18-0149.1.

How to cite: Pic, R., Dombry, C., Taillardat, M., and Naveau, P.: U-Net based Methods for the Postprocessing of Precipitation Ensemble Forecasting, EGU General Assembly 2023, Vienna, Austria, 23–28 Apr 2023, EGU23-2592, https://doi.org/10.5194/egusphere-egu23-2592, 2023.

EGU23-2628 | ECS | Posters on site | NP5.1

Seasonal Weather Forecast Biases Dependence on Static and Dynamic Environmental Variables in the Alpine Region 

Sameer Balaji Uttarwar, Anna Napoli, Diego Avesani, and Bruno Majone

Global seasonal weather forecasts have inherent biases compared to observational datasets over mountainous regions. This can be attributed to the model's inaccurate representation of local and global environmental processes on the Earth. In this context, the objective of this study is to assess the variation of seasonal weather forecast biases with respect to static and dynamic environmental variables over the Trentino-South Tyrol region (north-eastern Italian Alps), characterized by complex terrain.

The research employs the latest fifth-generation seasonal weather forecast system (SEAS5) dataset produced by the European Center for Medium-Range Weather Forecast (ECMWF), available at a horizontal grid resolution of 0.125° x 0.125° with 25 ensemble members in a re-forecast period from 1981 to 2016. The reference dataset is a high-resolution gridded observation (250 m x 250 m) over the region of interest. The spatiotemporal variation of monthly weather (i.e., precipitation and temperature) forecast biases over the region is inferred using several statistical indicators at observational dataset grid resolution. The static and dynamic environmental variables (i.e., respectively, terrain characteristics and large-scale atmospheric circulation indices) are used univariately to interpret their relationship with monthly weather forecast biases using the linear regression technique. A statistically significant linear relation between monthly weather forecast biases and terrain characteristics, as well as large-scale atmospheric circulation indices, has been found depending on seasonality and ensemble members.

Given significant univariate linear correlation, a simple linear bias reduction model is developed and assessed by implementing a random subsampling technique in which the regression parameters are simulated by splitting the data into calibration (70%) and validation (30%). The results reveal a reduction in the monthly weather forecast bias over the region.

This study demonstrates that the local and global environmental variables should be explicitly considered in the bias correction and downscaling of the seasonal weather forecasts over complex terrain.

How to cite: Uttarwar, S. B., Napoli, A., Avesani, D., and Majone, B.: Seasonal Weather Forecast Biases Dependence on Static and Dynamic Environmental Variables in the Alpine Region, EGU General Assembly 2023, Vienna, Austria, 23–28 Apr 2023, EGU23-2628, https://doi.org/10.5194/egusphere-egu23-2628, 2023.

This work investigates several statistical tests in the context of probabilistic weather forecasting and ensemble postprocessing. The tests are commonly used for comparing predictive performance of e.g. two statistical postprocessing models.  

In the first part of the analysis a case study is conducted on temperature data consisting of observations and ensemble forecasts. The tests are applied to compare the performance of two probabilistic temperature forecasts at different stations, for different lead times, investigating several standard verification metrics to measure prediction performance. The analysis shows that the tests generally behave consistently in the context of temperature forecasts. However, for certain scenarios some tests might be be preferred over the others. In general, the combination of the original Diebold-Mariano test with the continuous ranked probability score (CRPS) to assess forecast accuracy leads to the most consistent and reliable results.

The second part of the analysis uses simulated data to investigate the general behaviour of the tests in different postprocessing scenarios as well as their size and power properties. Again, the original Diebold-Mariano test appears to perform most reliably and shows no noticeable inconsistent behaviour for different simulation settings.

How to cite: Möller, A. and Grupe, F.: Investigating properties of statistical tests for comparing predictive performance with application to probabilistic weather forecasting, EGU General Assembly 2023, Vienna, Austria, 23–28 Apr 2023, EGU23-2701, https://doi.org/10.5194/egusphere-egu23-2701, 2023.

EGU23-2902 | ECS | Posters virtual | NP5.1

D-Vine Copula based Postprocessing of Wind Speed Ensemble Forecasts 

David Jobst, Annette Möller, and Jürgen Groß

Statistical postprocessing of ensemble forecasts has become a common practice in research to correct biases and errors in calibration. Meanwhile, machine learning methods such as quantile regression forests or neural networks are often suggested as promising candidates in literature. However, interpretation of these methods is not always straightforward. 
Therefore, we propose the D-vine (drawable-vine) copula based postprocessing, where for the construction of a multivariate conditional copula the graphical D-vine model serves as building plan. The conditional copula is based on this tracetable model using bivariate copulas, which allow to describe linear as well as non-linear relationships between the response variable and its covariates. Additionally, our highly data-driven model selects the covariates based on their predictive strength and thus provides a natural variable selection mechanism, facilitating interpretability of the model. Finally, (non-crossing) quantiles from the obtained conditional distribution can be utilized as postprocessed ensemble forecasts. 
In a case study for the postprocessing of 10 m surface wind speed ensemble forecasts with 24 hour lead time we compare local and global D-vine copula based models to the zero-truncated ensemble model output statistics (tEMOS) for different sets of predictor variables at 60 surface weather stations in Germany. Furthermore, we investigate different types of training periods for both methods. We observe that the D-vine based postprocessing yields a comparable performance with respect to tEMOS models if wind speed ensemble variables are included only and a significant improvement if additional meteorological and station specific weather variables are integrated. The case study indicates that training periods capturing seasonal patterns are performing best for both models. Additionally, we provide a criterion for calculating the variable importance in D-vine copulas and utilize it to outline which predictor variables are the most important for the correction of 10 m surface wind speed ensemble forecasts.

How to cite: Jobst, D., Möller, A., and Groß, J.: D-Vine Copula based Postprocessing of Wind Speed Ensemble Forecasts, EGU General Assembly 2023, Vienna, Austria, 23–28 Apr 2023, EGU23-2902, https://doi.org/10.5194/egusphere-egu23-2902, 2023.

EGU23-5821 | ECS | Posters on site | NP5.1

A multivariate approach to combine general circulation models using graph cuts 

Lucas Schmutz, Soulivanh Thao, Mathieu Vrac, and Gregoire Mariethoz

General circulation models (GCMs) are of extreme importance to making future climate projections. Those are used extensively by policymakers to manage responses to anthropogenic global warming and climate change.

To extract a robust global signal and evaluate uncertainties, individual models are often assembled in Multi-Model Ensembles (MMEs). Various approaches to combine individual models have been developed, such as the Multi-Model Mean (MMM) or its weighted variants.

Recently, Thao et al. (2022) proposed a model comparison approach based on graph cuts. Graph cut optimization was developed in the field of computer vision to efficiently approximate a solution for low-level computer vision tasks such as image segmentation (Boykov et al., 2001). Applied to MMEs, it allows selecting for each gridpoint the best-performing model and produces a patchwork of models that maximizes performances while avoiding spatial discontinuities. Thus, it considers the local performance of individual models in contrast with approaches such as MMM or similar methods that use global weights.

Here we propose a new multivariate combination approach of MMEs based on graph cuts. Compared to the existing univariate method, our approach ensures that the relationships between variables, that are present in GCMs, are locally preserved while providing coherent spatial fields. Moreover, we measure the local performance of models using the Hellinger distance between multi-decadal distributions. This allows a combination of models that is not only indicative of the average behavior (e.g. mean temperature or mean precipitation) but of the entire multivariate distribution, including more extreme values that have a high societal and environmental impact.

REFERENCES 

Boykov, Y., Veksler, O., & Zabih, R. (2001). Fast approximate energy minimization via graph cuts. IEEE Transactions on Pattern Analysis and Machine Intelligence, 23(11), 1222–1239. https://doi.org/10.1109/34.969114

Thao, S., Garvik, M., Mariethoz, G., & Vrac, M. (2022). Combining global climate models using graph cuts. Climate Dynamics, February. https://doi.org/10.1007/s00382-022-06213-4

How to cite: Schmutz, L., Thao, S., Vrac, M., and Mariethoz, G.: A multivariate approach to combine general circulation models using graph cuts, EGU General Assembly 2023, Vienna, Austria, 23–28 Apr 2023, EGU23-5821, https://doi.org/10.5194/egusphere-egu23-5821, 2023.

EGU23-8594 | ECS | Posters on site | NP5.1

Joint Generalized Neural Models and Censored Spatial Copulas for Probabilistic Rainfall Forecasting 

David Huk, Rilwan Adewoyin, and Ritabrata Dutta

This work develops a novel method for generating conditional probabilistic rainfall forecasts with temporal and spatial dependence. A two-step procedure is employed. Firstly, marginal location-specific distributions are modelled independently of one another. Secondly, a spatial dependency structure is learned in order to make these marginal distributions spatially coherent.
To learn marginal distributions over rainfall values, we propose a class of models termed Joint Generalised Neural Models (JGNMs). These models expand the linear part of generalised linear models with a deep neural network allowing them to take into account non-linear trends of the data while learning the parameters for a distribution over the outcome space.
In order to understand the spatial dependency structure of the data, a model based on censored copulas is presented. It is designed for the particularities of rainfall data and incorporates the spatial aspect into our approach. Uniting our two contributions, namely the JGNM and the Censored Spatial Copulas into a single model, we get a probabilistic model capable of generating possible scenarios on short to long-term timescales, able to be evaluated at any given location, seen or unseen. We show an application of it to a precipitation downscaling problem on a large UK rainfall dataset and compare it to existing methods.

How to cite: Huk, D., Adewoyin, R., and Dutta, R.: Joint Generalized Neural Models and Censored Spatial Copulas for Probabilistic Rainfall Forecasting, EGU General Assembly 2023, Vienna, Austria, 23–28 Apr 2023, EGU23-8594, https://doi.org/10.5194/egusphere-egu23-8594, 2023.

EGU23-8824 | ECS | Posters on site | NP5.1

Evaluating probabilistic forecasts of extremes using continuous ranked probability score distributions 

Maxime Taillardat, Anne-Laure Fougères, Philippe Naveau, and Raphaël De Fondeville

Verifying probabilistic forecasts for extreme events is a highly active research area because popular media and public opinions are naturally focused on extreme events, and biased conclusions are readily made. In this context, classical verification methods tailored for extreme events, such as thresholded and weighted scoring rules, have undesirable properties that cannot be mitigated, and the well-known continuous ranked probability score (CRPS) is no exception.

Here, we define a formal framework for assessing the behavior of forecast evaluation procedures with respect to extreme events, which we use to demonstrate that assessment based on the expectation of a proper score is not suitable for extremes. Alternatively, we propose studying the properties of the CRPS as a random variable by using extreme value theory to address extreme event verification. An index is introduced to compare calibrated forecasts, which summarizes the ability of probabilistic forecasts for predicting extremes. The strengths and limitations of this method are discussed using both theoretical arguments and simulations.

How to cite: Taillardat, M., Fougères, A.-L., Naveau, P., and De Fondeville, R.: Evaluating probabilistic forecasts of extremes using continuous ranked probability score distributions, EGU General Assembly 2023, Vienna, Austria, 23–28 Apr 2023, EGU23-8824, https://doi.org/10.5194/egusphere-egu23-8824, 2023.

The ERA5 global reanalysis has been compared against a high-resolution regional reanalysis (COSMO-REA6) by means of scale-separation diagnostics based on 2d Haar discrete wavelet transforms. The presented method builds upon existing methods and enables the assessment of bias, error and skill for individual spatial scales, separately. A new skill score (evaluated against random chance) and the Symmetric Bounded Efficiency are introduced. These are compared to the Nash-Sutcliffe and the Kling-Gupta Efficiencies, evaluated on different scales, and the benefits of symmetric statistics are illustrated. As expected, the wavelet statistics show that the coarser resolution ERA5 products underestimate small-to-medium scale precipitation compared to COSMO-REA6. The newly introduced skill score shows that the ERA5 control member (EA-HRES), despite its higher variability, exhibits better skill in representing small-to-medium scales with respect to the smoother ensemble members. The Symmetric Bounded Efficiency is suitable for the intercomparison of reanalyses, since it is invariant with respect to the order of comparison.

How to cite: Casati, B., Lussana, C., and Crespi, A.: Scale-separation diagnostics and the Symmetric Bounded Efficiency for the inter-comparison of precipitation reanalyses, EGU General Assembly 2023, Vienna, Austria, 23–28 Apr 2023, EGU23-9083, https://doi.org/10.5194/egusphere-egu23-9083, 2023.

EGU23-9328 | Orals | NP5.1

The EUPPBench postprocessing benchmark 

Jonas Bhend, Jonathan Demaeyer, Sebastian Lerch, Cristina Primo, Bert Van Schaeybroeck, Aitor Atencia, Zied Ben Bouallègue, Jieyu Chen, Markus Dabernig, Gavin Evans, Jana Faganeli Pucer, Ben Hooper, Nina Horat, David Jobst, Janko Merše, Peter Mlakar, Annette Möller, Olivier Mestre, Maxime Taillardat, and Stéphane Vannitsem

Statistical postprocessing of forecasts from numerical weather prediction systems is an important component of modern weather forecasting systems. A growing variety of postprocessing methods has been proposed, but a comprehensive, community-driven comparison of their relative performance is yet to be established. Important reasons for this lack include the absence of a fair intercomparison protocol, and, the difficulty of constructing a common comprehensive dataset that can be used to perform such intercomparison. Here we introduce the first version of the EUPPBench, a dataset of time-aligned medium-range forecasts and observations over Central Europe, with the aim to facilitate and standardize the intercomparison of postprocessing methods. This dataset is publicly available [1], includes station and gridded data, ensemble forecasts for training (20 years) and validation (2 years) based on the ECMWF system. The initial dataset is the basis of an ongoing activity to establish a benchmarking platform for postprocessing of medium-range weather forecasts. We showcase a first benchmark of several methods for the adjustment of near-surface temperature forecasts and outline the future plans for the benchmark activity. 


[1] https://github.com/EUPP-benchmark/climetlab-eumetnet-postprocessing-benchmark

How to cite: Bhend, J., Demaeyer, J., Lerch, S., Primo, C., Van Schaeybroeck, B., Atencia, A., Ben Bouallègue, Z., Chen, J., Dabernig, M., Evans, G., Faganeli Pucer, J., Hooper, B., Horat, N., Jobst, D., Merše, J., Mlakar, P., Möller, A., Mestre, O., Taillardat, M., and Vannitsem, S.: The EUPPBench postprocessing benchmark, EGU General Assembly 2023, Vienna, Austria, 23–28 Apr 2023, EGU23-9328, https://doi.org/10.5194/egusphere-egu23-9328, 2023.

The established benefits of post-processing the results of multi-model ensembles, even by simple averaging, suggest a more radical approach: The models should be combined more frequently in run-time so as to form a single “supermodel”.  Simple nudging of models to one another, as frequently as the models might assimilate data from observations, combines model fusion with a reasonable degree of model autonomy.

Key to the success of the supermodeling approach is the phenomenon of chaos synchronization, known in the field of nonlinear dynamics, wherein two chaotic systems synchronize when connected through only a few of their variables, despite sensitive dependence on initial conditions. Synchronization gives rise to consensus among models. The nudging coefficients can be trained so that that consensus agrees with observations, because the effective dynamics of the trained supermodel, regarded as a single dynamical system, matches the dynamics of nature. Yet the number of independent nudging coefficients that must be trained is far less than the number of trainable parameters in a typical climate model.

It is expected that supermodeling will be especially useful for improving the representation of localized structures, such as blocking patterns, which will wash out if de-synchronized output fields of different models are combined by averaging.  We confirm a hypothesis that such coherent structures will synchronize even when the underlying fields do not, because the internal synchronization within each structure re-enforces synchronization between models: A configuration of CAM4 and CAM5 models, of different resolution, connected by nudging, exhibits correlated blocking activity even when the flows do not otherwise synchronize.  

We further explore the basis for correlated blocking activity in a pair of coupled quasi-geostrophic channel models. The local synchronization error is lower in a region of the channels where blocks form than elsewhere in the channels. Blocking correlations emerge as a vestige of “chimera synchronization”, the phenomenon in which complete synchronization of two spatially extended systems is intermittent in space as well as time. Such partial synchronization of different models in the regions of blocks - and of other structures such as jets, fronts, and large-scale convection - would be particularly useful for projecting climate-change patterns in extreme events associated with those structures.

How to cite: Duane, G., Schevenhoven, F., and Weiss, J.: Synchronization of Blocking Patterns in Diifferent Models, Connected So As to Form a “Supermodel” of Future Climate, EGU General Assembly 2023, Vienna, Austria, 23–28 Apr 2023, EGU23-10153, https://doi.org/10.5194/egusphere-egu23-10153, 2023.

EGU23-11230 | Posters on site | NP5.1

Mathematical Properties of Continuous Ranked Probability Score Forecasting 

Clément Dombry, Romain Pic, Philippe Naveau, and Maxime Taillardat

The theoretical advances on the properties of scoring rules over the past decades have broaden the use of scoring rules in probabilistic forecasting. In meteorological forecasting, statistical postprocessing techniques are essential to improve the forecasts made by deterministic physical models. Numerous state-of-the-art statistical postprocessing techniques are based on distributional regression evaluated with the Continuous Ranked Probability Score (CRPS). However, theoretical properties of such minimization of the CRPS have mostly considered the unconditional framework (i.e. without covariables) and infinite sample sizes. We circumvent these limitations and study the rate of convergence in terms of CRPS of distributional regression methods. We find the optimal minimax rate of convergence for a given class of distributions. Moreover, we show that the nearest neighbor method and the kernel method for distributional regression reach the optimal rate of convergence in dimension larger than 2 and in any dimension, respectively.
Associated article: https://doi.org/10.1016/j.ijforecast.2022.11.001

How to cite: Dombry, C., Pic, R., Naveau, P., and Taillardat, M.: Mathematical Properties of Continuous Ranked Probability Score Forecasting, EGU General Assembly 2023, Vienna, Austria, 23–28 Apr 2023, EGU23-11230, https://doi.org/10.5194/egusphere-egu23-11230, 2023.

It is often stated that the goal of probabilistic forecasting is to issue predictive distributions that are as sharp as possible, subject to being calibrated. To assess the calibration of ensemble forecasts, it is customary to employ rank histograms. Rank histograms not only assess whether or not an ensemble prediction system is calibrated, but they also reveal what (if any) systematic biases are present in the forecasts. This information can readily be relayed back to forecasters, helping to improve future predictions. Such is the utility of rank histograms, several extensions have been proposed to evaluate the calibration of probabilistic forecasts for multivariate outcomes. These extensions typically introduce a so-called pre-rank function that condenses the multivariate forecasts and observations into univariate objects, from which a standard rank histogram can be constructed. Several different approaches to construct multivariate rank histograms have been proposed, each of which differs in the choice of pre-rank function. Existing pre-rank functions typically aim to preserve as much information as possible when condensing the multivariate forecasts and observations into univariate objects. Although this is sensible when testing for multivariate calibration, the resulting rank histograms are often difficult to interpret, and are therefore rarely used in practice.        
We argue that the principal utility of these histogram-based diagnostic tools is that they provide forecasters with additional information regarding the deficiencies that exist in their forecasts, in turn allowing them to address these shortcomings more readily; interpretation is therefore a key requirement. We demonstrate that there are very few restrictions on the choice of pre-rank function when constructing multivariate rank histograms, meaning forecasters need not restrict themselves to the few proposed already, but can instead choose a pre-rank function on a case-by-case basis, depending on what information they want to extract from their forecasts. We illustrate this by introducing a range of possible pre-rank functions when assessing the calibration of probabilistic spatial field forecasts. The pre-rank functions that we introduce are easy to interpret, easy to implement, and they provide complementary information. Several pre-rank functions can therefore be employed to achieve a more complete understanding of the multivariate forecast performance. Finally, having chosen suitable pre-rank functions, tests for univariate calibration based on rank histograms can readily be applied to the multivariate rank histograms. We illustrate this here using e-values, which provide a theoretically attractive way to sequentially test for the calibration of probabilistic forecasts.

How to cite: Allen, S. and Ziegel, J.: Assessing the calibration of multivariate ensemble forecasts: E-values and the choice of pre-rank function, EGU General Assembly 2023, Vienna, Austria, 23–28 Apr 2023, EGU23-11660, https://doi.org/10.5194/egusphere-egu23-11660, 2023.

EGU23-12232 | ECS | Posters on site | NP5.1

Impacts of uni- and multivariate bias adjustment methods on simulations of hydrological signatures in high latitude catchments 

Faranak Tootoonchi, Andrijana Todorović, Thomas Grabs, and Claudia Teutschbein

Climate models are used to generate future hydroclimatic projections for exploring how climate change may affect water resources. Their outputs, however, feature systematic errors due to parametrization and simplification of processes at the spatiotemporal scales required for impact studies. To minimize the adverse effects of such biases, an additional bias adjustment step is typically required.

Over the past decade, adjustment methods with different levels of complexity have been developed that consider one or several variables at a time, consequently adjusting one or multiple features of climate model simulations. Despite attempts in developing such methods and the growing use of some, the selection of methods for accurate simulation of streamflow remains subjective and still highly debated. In this study, we seek to answer whether sophisticated multivariate bias adjustment methods outperform simple univariate methods in the simulation of streamflow signatures.

To this end, we systematically investigated the ability of two simple univariate and two advanced multivariate methods to accurately represent various hydrological signatures relevant for water resources management in high latitudes. We offer practical guidelines for choosing the most suitable bias adjustment methods based on the objective of each study (i.e., hydrologic signatures of interest) and the hydroclimatic regime of the study catchments.

How to cite: Tootoonchi, F., Todorović, A., Grabs, T., and Teutschbein, C.: Impacts of uni- and multivariate bias adjustment methods on simulations of hydrological signatures in high latitude catchments, EGU General Assembly 2023, Vienna, Austria, 23–28 Apr 2023, EGU23-12232, https://doi.org/10.5194/egusphere-egu23-12232, 2023.

Spatial sampling remains a conundrum for verification. The observations that are required are rarely on a grid, nor are they homogenously spaced. They are often located where there are people, easy access and do not sample the variable in a representative way. In an aggregate sense, scores derived from such observation locations, will give areas with greater observation density more weight in the aggregate if the variations in network density are not accounted for. Furthermore the performance in some parts of the domain may not be represented at all if there are no observations there. Gridded analyses on the other hand often provide complete coverage, and offer great ease of use, but adjacent grid boxes are not independent. Given this relative wealth of coverage and uniform sampling, we tend to use all available grid points for computing aggregate scores for an area or region, despite knowing that this is likely to produce too-narrow confidence intervals and inflate any statistical significance that may be present. 

In this presentation a variety of approaches, both empirical and statistical, are explored to establish what we ought to include when computing aggregate scores. Three different empirical sampling approaches are compared to selections from statistical coverage or network design algorithms. The empirical options include what is termed “strict” sub-sampling, whereby a sample is taken from the full grid and the reduction in sample size is explored by systematically continually taking a sub-sample from the sub-sample. The second is a systematic reduction in sample size from the original grid whereby each sample is drawn from the original grid, taken every other grid point, then every 3rd grid point, every 4th etc. The third is a mean computed from N random draws of reducing sample size. These empirical options do not respect land or sea locations. They are purely intended at looking at the behaviour and stability of the sample score. The coverage design algorithms provide a methodology for deriving homogeneous samples for irregularly spaced surface networks over land, and regularly spaced sampling of grids over the ocean, to achieve an optimal blend of sampling for regions that cover both land and sea.  These sample sizes and sample scores are compared to a statistically computed effective sample size. 

Some interesting and surprising results emerge. One of which is that as little as 1% of the total number of grid points may be sufficient for measuring the performance of the forecast on a grid, though the proportion of the total will always be dependent on (to varying degrees) the variable, the threshold or event of interest, the metric or score, and the characteristics of the geographical region of interest. 

How to cite: Mittermaier, M. and Gilleland, E.: Exploring empirical and statistical approaches for determining an appropriate sample size for aggregate scores, EGU General Assembly 2023, Vienna, Austria, 23–28 Apr 2023, EGU23-12242, https://doi.org/10.5194/egusphere-egu23-12242, 2023.

EGU23-12316 | Posters on site | NP5.1

On the reliability of bivariate forecasts 

Zied Ben Bouallegue

Reliability is a key attribute of an ensemble forecast. Typically, this means that one expects that the ensemble spread reflects the potential error of the corresponding ensemble mean forecast. In the realistic case of an unperfect forecast, reliability deficiencies can be diagnosed with tools such as the reliability diagram and the rank histogram. Along with the computation of scores, the use of these diagnostic tools is common practice in ensemble forecast verification when assessing univariate forecasts. But what does reliability mean in practical terms when assessing multivariate forecasts? Here the concept of reliability is revisited in the simplest of the multivariate cases: the bivariate forecast. As a result, we propose a set of new diagnostic tools with an emphasis on the cross-variable reliability aspect. Real case examples are used for illustration and discussion.

How to cite: Ben Bouallegue, Z.: On the reliability of bivariate forecasts, EGU General Assembly 2023, Vienna, Austria, 23–28 Apr 2023, EGU23-12316, https://doi.org/10.5194/egusphere-egu23-12316, 2023.

EGU23-13327 | ECS | Posters on site | NP5.1

Towards a machine learning based multimodel for precipitation forecast over the italian peninsula 

Luca Monaco, Roberto Cremonini, and Francesco Laio

Direct model output forecasts by Numerical Weather Prediction models (NWPs) present some limitations caused by errors mostly due to sensitivity to initial conditions, sensitivity to boundary conditions and deficiencies in parametrization schemes (i.e. orography).
These sources of error are unavoidable, and atmospheric chaotic dynamics make prediction errors spread rapidly in time in the course of the forecast, inducing both systematic and random errors.
Nonetheless, in the last 50 years, NWPs had a significant decrease in the impact of these sources of errors, even in the long-term forecast, thanks for instance to an ever-increasing computational capability, but their relevance is still not neglectable.
Moreover, different NWPs present specific different pros and cons which are findable empirically. For instance, in the case of precipitation forecast in north-west Italy, low-resolution models (e.g. ECMWF-IFS) are more reliable in terms of space and time in predicting the average precipitation, while high-resolution models (e.g. COSMO-2I) tend to forecast better the maximum precipitation. Research purposes apart, actual limitations must be seen in an operational context, where weather forecasts’ skillfulness and associated uncertainty are information of the utmost importance to the forecaster and in general to the user of a certain forecasts system.

To tackle these limitations of NWPs and the need for an uncertainty-quantified meteorological forecast, we propose a machine learning-based multimodel post-processing technique for precipitation forecast. We focus on precipitation since it is the most important variable in the issue of spatially localized weather alert notice by the Italian Civil Protection system and at the same time it is one of the most challenging variables to forecast. 
We use a Convolutional Neural Network (CNN) to obtain deterministic and probabilistic forecast grids over 24h up to 48h focusing on North-West Italy, using several high and low-resolution deterministic NWPs as input and using high-resolution rain-gauge corrected radar observations for the training. The effect of the usage of different convolutional parameters (e.g. stride, padding) is taken into account. The deterministic output grid is chosen as the grid with the lowest mean square error obtained during the training, and it is compared with the linear regression of the input NWPs and with every single model. The probabilistic output grid is generated by considering the statistical ensemble of the twenty grids with the lowest mean square error obtained during the training, and it is compared with the logistic regression of the input NWPs and with ECMWF-EPS as a benchmark, both at different precipitation thresholds.

How to cite: Monaco, L., Cremonini, R., and Laio, F.: Towards a machine learning based multimodel for precipitation forecast over the italian peninsula, EGU General Assembly 2023, Vienna, Austria, 23–28 Apr 2023, EGU23-13327, https://doi.org/10.5194/egusphere-egu23-13327, 2023.

In recent years neural networks have successfully been applied to probabilistic post-processing of numerical weather prediction forecasts. In the Bernstein Quantile Networks (BQN) method predictive quantile distributions are specified by Bernstein polynomials and their coefficients linked to input features through flexible neural networks. However, precipitation presents an additional challenge due to its mixed distributed nature with a considerable proportion of dry events for short accumulation periods. In this presentation, it is demonstrated how the BQN method can be modified to mixed distributed variables like precipitation by introducing a latent variable and treating zero precipitation cases as censored data. The method is tested on both synthetic and real precipitation forecast data and compared to an approach where a model of the probability of precipitation is combined with a model of precipitation amounts using the laws of probability.


How to cite: Bremnes, J. B.: Censored Bernstein quantile networks for probabilistic precipitation forecasting, EGU General Assembly 2023, Vienna, Austria, 23–28 Apr 2023, EGU23-13849, https://doi.org/10.5194/egusphere-egu23-13849, 2023.

EGU23-14425 | ECS | Posters on site | NP5.1

Lead time continuous statistical post-processing of ensemble weather forecasts 

Jakob Wessel, Chris Ferro, and Frank Kwasniok

Numerical weather prediction (NWP) models usually output their forecasts at a multiplicity of different lead times. For example, the Met Office ensemble prediction system for the UK (MOGREPS-UK) predicts atmospheric variables on a 2.2km grid for up 126h on hourly and sub-hourly timesteps. Even though for applications, information is often required on this range of lead times, many post-processing methods in the literature are either applied at fixed lead time or by fitting individual models for each lead time. This is also the case in systems used in practice such as the Met Office IMPROVER system. However, this is 1) computationally expensive because it requires the training of multiple models if users are interested in information at multiple lead times and 2) prohibitive because it restricts the training data used for training post-processing models and the usability of fitted models.

In this work we investigate lead time dependence of ensemble post-processing methods by looking at ensemble forecasts in an idealized Lorenz96 system as well as temperature forecast data from the Met Office MOGREPS-UK system. First, we investigate the lead time dependence of estimated model parameters in non-homogenous Gaussian regression (NGR -- a standard ensemble post-processing technique) and find substantial smoothness. Secondly, we look at the usability of models fitted for one lead time and employed at another to then thirdly fit models that are “lead time continuous”, meaning they work for multiple lead times simultaneously by including lead time as a covariate using spline regression. We show that these models can achieve similar performance to the classical “lead time separated” models, whilst saving substantial computation time. Fourthly and finally we make first steps towards the development of a cheap computational model including seasonality and working continuously over the lead time, needing to be fit only once.

How to cite: Wessel, J., Ferro, C., and Kwasniok, F.: Lead time continuous statistical post-processing of ensemble weather forecasts, EGU General Assembly 2023, Vienna, Austria, 23–28 Apr 2023, EGU23-14425, https://doi.org/10.5194/egusphere-egu23-14425, 2023.

EGU23-14560 | ECS | Posters on site | NP5.1

Quantile regression forests for post-processing ECWMF ensemble precipitation forecasts: hyperparameter optimization and comparison to EMOS 

Eva van der Kooij, Antonello Squintu, Kirien Whan, and Maurice Schmeits

Ensemble forecasts are important due to their ability to characterize forecast uncertainty, which is fundamental when forecasting extreme weather. Ensemble forecasts are however often biased and underdispersed and thus need to be post-processed.

A common approach for this is the use of ensemble model output statistics (EMOS), where a parametric distribution is fitted with a limited number of predictors. With recent advances in computer science and increased amounts of data available, machine learning techniques, like random forests, are becoming more popular for high dimensional regression problems. In this research, we explore the use of the quantile regression forest (QRF), a random forest adapted for conditional quantile estimation, applied to medium range gridded probabilistic precipitation forecasts. QRFs are non-parametric and allow for a larger number of predictors, which means they can possibly consider more dependencies that might otherwise not be captured with a simple EMOS.

A QRF takes several hyperparameters that influence the way the decision trees in the forest are constructed. We explore the minimum number of samples needed in a leaf to split it (minimum node size) and the number of predictors explored in each split (mtry). A hyperparameter space is constructed by setting ranges for both minimum node size and mtry, and the optimal hyperparameter set is determined by performing a cross validated grid search. Here, each model is assessed based on the continuous ranked probability skill score (CRPSS). For comparison, EMOS is applied with a zero-adjusted gamma (ZAGA) distribution, using a limited number of predictors that are physically correlated to precipitation. Both methods are verified on a separate testing data set and evaluated using several scores, including CRPSS and Brier skills score (BSS).

We consider 4 years (November 2018 – October 2022) of archived operational ECMWF-IFS ensemble forecasts for the Netherlands. The data is split into November 2018 – October 2021 for training and cross-validation, and October 2021 – October 2022 for testing, separating data for season, initialization time and lead-time. Forecasts are post-processed up to +10 days. Ensemble statistics on 60+ forecast variables are used as predictors. Spatially and temporally aggregated, gauge-adjusted radar observations are used as predictand. The raw ensemble is considered as the benchmark.

The results of this research will determine what method will be used to post-process the ensemble precipitation forecasts in the context of the early warning center (EWC) of the Royal Netherlands Meteorological Institute. The most suitable method could differ between shorter and longer lead times.

How to cite: van der Kooij, E., Squintu, A., Whan, K., and Schmeits, M.: Quantile regression forests for post-processing ECWMF ensemble precipitation forecasts: hyperparameter optimization and comparison to EMOS, EGU General Assembly 2023, Vienna, Austria, 23–28 Apr 2023, EGU23-14560, https://doi.org/10.5194/egusphere-egu23-14560, 2023.

EGU23-14712 | ECS | Orals | NP5.1

NWP model updates and post-processing: a strategy for an EMOS model on ECMWF wind gusts forecasts 

Antonello A. Squintu, Eva van der Kooij, Kirien Whan, and Maurice Schmeits

In the framework of KNMI’s Early Warning Center (EWC), ECMWF ensemble (ENS) predictions are used to issue medium-range forecasts of severe weather. Timely forecasts of wind gusts extremes are important to prevent potential damage. However, ensemble forecasts are affected by biases and under- or over-dispersion. These errors lead to a reduction in the skill of the forecasts, especially for long lead-times and for extreme cases, such as windstorms and deep convective episodes. Hence, statistical post-processing is a fundamental step in the establishment of a skillful weather alert system for extreme wind gust events.     

However, weather models like ECMWF-IFS are subject to frequent updates, which include changes in the calculation of certain diagnostic variables and by consequence in statistical features of their ensemble distribution. This is the case for ECMWF wind gusts forecasts, whose bias has been reduced with the last update in October 2021. Therefore, the use of pre-update wind gusts forecasts in the training of the post-processing model must be considered with care.

In the context of the development of an Ensemble Model Output Statistics (EMOS) model, this limitation has been tackled by reconstructing wind-gusts forecasts with a preliminary EMOS model. This step has been performed by including in the regression those variables that are used by ECMWF for the calculation of wind gusts, which were less affected by the update.

The reconstructed wind gusts forecasts have been added to a set of summary statistics of the ensemble distribution of variables physically related to wind gusts. A process of forward selection has been applied to identify the most relevant contributions to the general EMOS model, highlighting reconstructed wind gusts as the most important predictor for all lead-times.

The post-processed forecasts obtained with this experimental EMOS model have been verified and compared to those calculated with a conventional EMOS model (performed ignoring the above caveats) and with the results of a non-parametric Quantile Regression Forest. These models have been trained on the same period (2018-2021) and tested on the period that has followed the update (2021-2022), including only grid-points and stations that cover the territory of the Netherlands and distinguishing between summer and winter half-years. The method showing the best performance will be employed operationally for the post-processing of ECMWF-ENS wind gust forecasts over the Netherlands and will be used in the EWC weather alert system.

How to cite: Squintu, A. A., van der Kooij, E., Whan, K., and Schmeits, M.: NWP model updates and post-processing: a strategy for an EMOS model on ECMWF wind gusts forecasts, EGU General Assembly 2023, Vienna, Austria, 23–28 Apr 2023, EGU23-14712, https://doi.org/10.5194/egusphere-egu23-14712, 2023.

EGU23-15152 | ECS | Posters on site | NP5.1

Towards sub-kilometer resolution probabilistic analysis of surface wind in complex terrain 

Francesco Zanetta, Daniele Nerini, Matteo Buzzi, and Mark A. Liniger

Correctly representing surface wind is critical for applications such as renewable energy, snow modelling or warning systems. However, numerical weather prediction models with their limited resolution cannot fully represent the strong variability due to complex topography. Downscaling techniques – functionally equivalent to postprocessing when the ground truth is given by observational data - can achieve remarkable results in reducing systematic biases of raw models and can be calibrated to yield accurate probabilistic information at any point in space. 

These techniques can be further improved at analysis time by including real-time measurements, allowing to produce a probabilistic sub-grid resolution analysis of surface wind. Such a product would enable other interesting applications, such as detailed climatologies or nowcasting, and could serve as a ground truth for training deep learning-based postprocessing models with generative approaches, allowing to model spatially and temporally consistent ensembles.  

The first important challenge is to integrate measurements in a statistically optimized and efficient way. Here, we share our ongoing work and preliminary results in a comparative analysis of different approaches, from naïve interpolations to geostatistical techniques or novel approaches based on neural networks. The analysis is based on a multi-year archive of hourly wind observations and NWP analyses from the operational COSMO-1E model over Switzerland. 

How to cite: Zanetta, F., Nerini, D., Buzzi, M., and Liniger, M. A.: Towards sub-kilometer resolution probabilistic analysis of surface wind in complex terrain, EGU General Assembly 2023, Vienna, Austria, 23–28 Apr 2023, EGU23-15152, https://doi.org/10.5194/egusphere-egu23-15152, 2023.

EGU23-17348 | Orals | NP5.1

Postprocessing of ensemble precipitation forecasts over India using weather types 

Martin Widmann, Noemi Gonczol, Michael Angus, and Robert Neal

Accurate predictions of heavy precipitation in India are vital for impact-orientated forecasting, and an essential requirement for mitigating the impact of damaging flood events. Operational forecasts from non-convection-permitting models can have large biases in the intensities of heavy precipitation, and while convection-permitting models can perform better, their operational use over large areas is not yet feasible. Statistical postprocessing can reduce these biases for relatively little computational cost, but few studies have focused on postprocessing forecasts of monsoonal rainfall.

We present a postprocessing method for operational precipitation forecasts based on local precipitation distributions for 30 Indian weather types. It is applied to ensemble forecasts for daily precipitation with 12km spatial resolution and lead times of up to 10 days from the Indian National Centre for Medium Range Weather Forecasting (NCMRWF) Ensemble Prediction System (NEPS). The method yields local probabilistic forecasts that are the weighted mean of the observed local precipitation distributions for each weather type, with weights given by the relative frequency of the weather types in the forecast ensemble.

The general forecast skill is determined through the Continuous Ranked Probability Skill Score (CRPSS) and the skill for predicting the exceedance of the local 90th percentile is quantified through the Brier Skill Score (BSS). The CRPSS shows moderate improvement over most of India for forecasts with one day lead time, and substantial improvements almost everywhere for longer lead times. The BSS for one day forecasts indicates a spatially complex pattern of higher and lower performance, while for longer lead times the forecasts for heavy precipitation are improved almost everywhere. The improvements with respect to both measures are particularly high over mountainous or wet regions. We will also present reliability diagrams for the raw and postprocessed forecasts of threshold exceedances.


How to cite: Widmann, M., Gonczol, N., Angus, M., and Neal, R.: Postprocessing of ensemble precipitation forecasts over India using weather types, EGU General Assembly 2023, Vienna, Austria, 23–28 Apr 2023, EGU23-17348, https://doi.org/10.5194/egusphere-egu23-17348, 2023.

The deposition of heavy metals on water bodies and soil has adverse consequences on
human health. The elevated Coal-based energy production and increased industrial emissions
have also prompted us to study about heavy metals reactive nitrogen species in the
atmosphere. In the present work, the samples of rain water were collected from a residential
site in south-west Delhi. The samples were analyzed for selected heavy metals by using ICP-
OES. The heavy metals analysis involved voltammetry method using 797 VA Computrace
(Metrohm, Switzerland) instrument. The analysis of Total Nitrogen (TN) and dissolved
organic carbon (DOC) was carried out by using chemiluminescence based TN/TOC analyzer
(Shimadzu model TOC-LCPH E200 ROHS). The mean values of Cu, Mn, Zn, Al, As and Hg
were calculated as 34.5 mg/l, 19.5 mg/l, 52.7 mg/l, 392.3 mg/l, 9.8 mg/l and 1.6 mg/l
respectively. The mean values for TN and DOC were 12.7mg/l and 2.8 mg/l respectively. The
detailed results will be discussed in the EGU General Assembly Meeting.

Keywords: Total Nitrogen, wet deposition, ICP-OES, voltammetry, agricultural area.

How to cite: sunaina, S.: Wet deposition of heavy metals, reactive nitrogen species and dissolved organic carbonat a residential site in Delhi region, India, EGU General Assembly 2023, Vienna, Austria, 23–28 Apr 2023, EGU23-345, https://doi.org/10.5194/egusphere-egu23-345, 2023.

EGU23-1075 | ECS | Posters on site | GI1.3

What can we learn from nested IoT low-cost sensor networks for air quality?  A case study of PM2.5 in Birmingham UK. 

Nicole Cowell, Clarissa Baldo, William Bloss, and Lee Chapman

Birmingham is a city within the West Midlands region of the United Kingdom. In June 2021, coinciding with the introduction of the Clean Air Zone by Birmingham City Council (BCC), multiple low-cost IoT sensor networks for air pollution were deployed across the city by both the University of Birmingham and BCC. Low-cost sensor networks are growing in popularity due to their lower costs compared to regulatory instruments (£10’s-£1000’s per unit compared to £10,000+ per unit) and the reduced need for specialised staff allow for deployments at greater spatial scales (1-3).  Although such low-cost sensing is often associated with uncertainty, the measurement of PM2.5 optical particle counters have been generally shown to perform well, giving indicative insight into concentrations following calibrations and corrections for external influence such as humidity (4-7). 

One common problem with sensor networks is they tend to be isolated and unopen deployments, deployed and maintained by an interested party with the focus of their own monitoring goal. To tackle this, Birmingham Urban Observatory was an online platform created and used by researchers at the University of Birmingham to host and share open access meteorological and air pollution data from low-cost sensor deployments. Whilst hosting and displaying data from two of their own deployments of air quality sensors (Zephyrs by Earthsense and AltasensePM: an in-house designed PM sensor), the platform also pulled data from the DEFRA AURN sites and collaborated with local government to pull data from their own low-cost sensor network. The result was a real-time view of environmental data produced from a series of nested arrays of sensors.

This poster presents findings from this combined low-cost network, considering the successes and pitfalls of the low-cost monitoring network alongside insight into regional and local PM2.5 concentrations. Colocations against reference instruments within the network demonstrate good performance of the low-cost sensors after calibration and data validation but the project experienced challenges in deploying the network and sensor reliability. Low-cost sensor data generally gives novel insight into spatial analysis of PM2.5 across the city and this is presented alongside other experiences of deploying and using sensor networks for air quality.

1 Lewis et al., (2016) https://doi.org/10.1039/C5FD00201J

2 Chong and Kumar. (2003) doi: 10.1109/JPROC.2003.814918

3 Snyder et al., (2013) https://doi.org/10.1021/es4022602

4 Magi et al., (2020) https://doi.org/10.1080/02786826.2019.1619915

5 Crilley et al., (2018) https://doi.org/10.5194/amt-11-709-2018

6 Cowell et al., (2022) https://doi.org/10.3389/fenvs.2021.798485

7 Cowell et al., (2022) https://doi.org/10.1039/D2EA00124A

How to cite: Cowell, N., Baldo, C., Bloss, W., and Chapman, L.: What can we learn from nested IoT low-cost sensor networks for air quality?  A case study of PM2.5 in Birmingham UK., EGU General Assembly 2023, Vienna, Austria, 23–28 Apr 2023, EGU23-1075, https://doi.org/10.5194/egusphere-egu23-1075, 2023.

EGU23-2847 | Posters on site | GI1.3

Atmospheric ammonia in-situ long-term monitoring: review worldwide strategies and recommendations for implementation 

Aude Bourin, Pablo Espina-Martin, Anna Font, Sabine Crunaire, and Stéphane Sauvage

Ammonia (NH3) is the major alkaline gas in the atmosphere and the third most abundant N-containing species, after N2 and N2O. It plays an important role in N deposition processes, responsible of several damages on ecosystems, and it is also a precursor of fine particulate matter, known to cause numerous impacts on human health. Despite this, not many countries have implemented long-term monitoring of NH3 in their air quality programs due to the lack of consensus on limit values for ambient levels and a reference method of measuring this gas. In the climate change context, governments and health organizations are increasingly concerned about NH3 and its effects. As a proof, the revision of the EU air quality directives proposes the inclusion of NH3 as a mandatory pollutant for several urban and rural supersites for all member states.

Currently, there are only 12 long term programs worldwide dedicated specifically to measure NH3 or including gas-phase measurements of NH3. The longest NH3 time series come from UK and Africa, where measurements start in mid-1990. The rest of locations have started after 2000 and they have lower temporal coverage, between 5 and 22 years. The objectives pursued by these networks are to follow long term spatio-temporal trends, assess the N deposition on sensitive ecosystems, validate emission and/or chemistry transport models and help to understand the effectiveness of air pollution control and mitigation policies. Most of these networks operate using a combination of low-cost samplers with a high spatial density with few collocated sites with high time resolution instrumentation to help calibrate passive samplers and to better monitor the fine temporal variability of NH3. This combined approach has proven to be successful for most of the proposed objectives.

However, there are several differences that may difficult harmonizing the information at both the technical and scientific level. At the technical level these include type and number of passive samplers per site, calibration protocol, data control and quality analysis, exposure duration and type of high time resolution sampling method. On the scientific level, increased difficulty understanding the operative parameters and scientific results may come from language barriers (non-English reports), availability of the data (whether it is public or not), and gaps on the knowledge of NH3 levels on a spatial scale due to differences in the implementation of monitoring strategies within the same country.

This work aims to review synthetically the world current long-term NH3 networks and provide some insight and recommendations for other countries and supranational programs aiming to establish long term monitoring networks of NH3, based on cost-effective, technical, and operational criteria.

How to cite: Bourin, A., Espina-Martin, P., Font, A., Crunaire, S., and Sauvage, S.: Atmospheric ammonia in-situ long-term monitoring: review worldwide strategies and recommendations for implementation, EGU General Assembly 2023, Vienna, Austria, 23–28 Apr 2023, EGU23-2847, https://doi.org/10.5194/egusphere-egu23-2847, 2023.

EGU23-2984 | ECS | Posters virtual | GI1.3

The COllaborative Carbon Column Observing Network COCCON: Showcasing GHG observations at the COCCON Tsukuba site 

Matthias Max Frey, Isamu Morino, Hirofumi Ohyama, Akihiro Hori, Darko Dubravica, and Frank Hase

Greenhouse gases (GHGs) play a crucial role regarding global warming. Therefore, precise and accurate observations of anthropogenic GHGs, especially carbon dioxide and methane, are of utmost importance for the estimation of their emission strengths, flux changes and long-term monitoring. Satellite observations are well suited for this task as they provide global coverage. However, like all measurements these need to be validated.

The COllaborative Carbon Column Observing Network (COCCON) performs ground-based observations to retrieve column-averaged dry air mole fractions of GHGs (XGAS) with reference precision. The instrument used by the network is the EM27/SUN, a solar-viewing Fourier Transform infrared (FTIR) spectrometer. COCCON data are of high accuracy as COCCON uses species dependent airmass-independent and airmass-dependent adjustments for tying the XGAS products to TCCCON (Total Carbon Column Observing Network) and thereby to the World Meteorological Organization (WMO) reference scale. Moreover, instrument specific characteristics are measured for each COCCON spectrometer, and taken into account in the data analysis.

Here we first introduce the COCCON network in general and summarize its capabilities for various challenges including satellite and model validation, long-term observation of GHGs, and local and regional GHG source emission strength estimations. By example of the COCCON Tsukuba station we highlight in detail its usefulness for the above-mentioned applications.

How to cite: Frey, M. M., Morino, I., Ohyama, H., Hori, A., Dubravica, D., and Hase, F.: The COllaborative Carbon Column Observing Network COCCON: Showcasing GHG observations at the COCCON Tsukuba site, EGU General Assembly 2023, Vienna, Austria, 23–28 Apr 2023, EGU23-2984, https://doi.org/10.5194/egusphere-egu23-2984, 2023.

EGU23-7462 | ECS | Orals | GI1.3

Data infrastructure for nitrogen compound emissions monitoring 

Daniel Bertocci, Burcu Celikkol, Shaojie Zhuang, and Jasper Fabius

Emissions of nitrogen compounds, including nitrogen dioxide (NO2) and ammonia (NH3), have significant impacts on air quality and the environment. To effectively monitor the spatial and temporal variability of these emissions and the efficacy of emission mitigation measures, OnePlanet Research Center is developing a low-cost sensor system to monitor outdoor NO2 and NH3concentrations. This sensor system is designed to be deployable in fine-grained networks to accurately capture the dispersion from an emitting source. The deployment of multitudes of such sensor systems will result in large volumes of data. For this purpose, we developed a data infrastructure using the OGC SensorThings API and TimescaleDB, a time-series database extending PostgreSQL. This infrastructure allows for the efficient storage, management, and analysis of large volumes of spatiotemporal data from various sources, such as air quality monitoring networks, meteorological data, and agricultural practices. We demonstrate the potential of this infrastructure by using it in citizen science project COMPAIR, combining data from various sensors to gain insights on the air quality impact of urban circulation policies. The resulting data platform will facilitate the development of decision support tools and the implementation of targeted emission reduction strategies.

How to cite: Bertocci, D., Celikkol, B., Zhuang, S., and Fabius, J.: Data infrastructure for nitrogen compound emissions monitoring, EGU General Assembly 2023, Vienna, Austria, 23–28 Apr 2023, EGU23-7462, https://doi.org/10.5194/egusphere-egu23-7462, 2023.

Even in the presence of more reliable air quality tools, low-cost sensors have the benefit of recording data on highly localized spatial and temporal scales, allowing for multiple measurements within a single satellite pixel and on pixel boundaries. However, they are less accurate than their regulatory-grade counterparts, requiring regular co-locations with accepted instruments to ensure their validity. Thus, the addition of low-cost sensors to a field campaign – where reference-grade air quality instruments are abundant – not only provides ample opportunities for low-cost sensor co-location and calibration, but also allows the low-cost instruments to be used for sub-pixel validation, covering more surface area than the regulatory instruments alone with a network of sensors. During the summer of 2014, our low-cost sensor network was deployed during the Front Range Air Pollution and Photochemistry Éxperiment (FRAPPÉ) campaign conducted to sample the composition of air at and above ground level in northeastern Colorado, USA. The low-cost sensor platform included a suite of gas-phase sensors, notably NO2 and two generalized volatile organic compound (VOC) sensors, which were leveraged together to quantify speciated hydrocarbons such as formaldehyde. These key pollutants were chosen for their impacts on human health and climate change, as well as their inclusion on the TEMPO satellite launching this year. Airborne campaign measurements included slant column optical observations of formaldehyde (HCHO), nitrogen dioxide (NO2), and ozone (O3). Myriad additional in-situ instruments described chemical composition up to approximately 5 km above surface level. Ground-based instrumentation included both stationary and mobile regulatory-grade instruments, which were used for sensor calibration. Machine learning techniques such as artificial neural networks (ANNs) were used to match the low-cost signals to that of the reference-grade instruments. Here, we compare calibrated low-cost sensor data collected at ground level in a variety of locations along Colorado’s Front Range to various data sources from the FRAPPÉ campaign to better understand how well airborne and regulatory ground-based measurements can be extrapolated to other locations. Further, as the slant column measurements act as satellite simulators, we explore how low-cost instruments can be used for satellite validation purposes. Comparisons among these different data types also have important implications in data fusion.

How to cite: Okorn, K., Iraci, L., and Hannigan, M.: Comparing Low-Cost Sensors with Ground-Based and Airborne In-Situ and Column Observations of NO2 and HCHO during the FRAPPE Field Campaign in Colorado, USA, EGU General Assembly 2023, Vienna, Austria, 23–28 Apr 2023, EGU23-7839, https://doi.org/10.5194/egusphere-egu23-7839, 2023.

EGU23-8631 | Posters on site | GI1.3 | Highlight

Ambient conditions and infrared sky brightness in the Chilean Atacama Desert 

Wolfgang Kausch, Stefan Kimeswenger, Stefan Noll, and Roland Holzlöhner

The Atacama Desert in the Chilean Andes region is one of the dryest areas in the world. Due to its unique location with stable subtropical meteorological conditions and high mountains, it is an ideal site for the astronomical telescope facilities of the European Southern Observatory (ESO). The special meteorological conditions are continuously monitored at Cerro Paranal (the location of the Very Large Telescope) by measuring various parameters like temperature, pressure, humidity, precipitable water vapour (PWV), wind speed and direction, and sky radiance and bolometric sky temperature, respectively, the latter being crucial for astronomical observations in the thermal infrared regime. ESO operates several site monitoring systems for that purpose, e.g. the ESO MeteoMonitor, the Differential Image Motion Monitor (DIMM) and a Low Humidity And Temperature PROfiler (L-HATPRO) microwave radiometer providing detailed water vapour and temperate profiles up to a height of 12km in various directions. 


We have assembled all available data for a period of 4.5 years (2015-07-01 through 2019-12-31) and created a unique data set from it. This period also covers the strong El Niño event at the end of 2015. In this poster we present statistical results on the overall conditions and trends, and compare our measurements of the nocturnal sky brightness with an empirical model as function of the ambient temperature, PWV and zenith distance.

How to cite: Kausch, W., Kimeswenger, S., Noll, S., and Holzlöhner, R.: Ambient conditions and infrared sky brightness in the Chilean Atacama Desert, EGU General Assembly 2023, Vienna, Austria, 23–28 Apr 2023, EGU23-8631, https://doi.org/10.5194/egusphere-egu23-8631, 2023.

Air quality monitoring networks provide invaluable data for studying human health, environmental impacts, and the effects of policy changes,  but obtaining high quality data can be costly, with each site in a monitoring network requiring instrumentation and skilled operator time. It is therefore important to ensure that each monitor in the network is providing unique data to maximize the value of the entire network.  Differences in measurement approaches for the same chemical between monitoring stations may also result in discontinuities in the network data.  Both of these factors suggest the need for objective, machine-learning methodologies for monitoring network data analysis.   

Air quality models are another valuable tool to augment monitoring networks.  The models simulate air quality over a large region where monitoring may be sparse. The gridded output from air-quality models thus contain inherent information on the similarity of sources, chemical oxidation pathways and removal processes for chemicals of interest, provided appropriate tools are available to identify these similarities on a gridded basis.  The output from these models can be immense, again requiring the use of special, highly optimized tools for post-processing analysis.

Spatiotemporal clustering is a family of techniques that have seen widespread use in air quality, whereby time-series taken at different locations are grouped based on the level of similarity between time-series data within the dataset.   Hierarchical clustering is one such algorithm, which has the advantage of not requiring an a priori assumption about how many clusters there might be (unlike K-means).  However, traditional approaches for hierarchical clustering become computationally expensive as the number of time-series increases in size, resulting in prohibitive computational costs  when the total number of time-series to be compared rises above 30,000, even on a supercomputer.  Similarly, the comparison and clustering of large numbers of discrete data (such as multiple mass spectrometer data sampled at high time resolution from a moving laboratory platform) becomes computationally prohibitive using conventional methods. 

In this study we present a high-performance hierarchical clustering algorithm which is able to run in parallel over many nodes on massively parallel computer systems, thus allowing for efficient clustering for very large monitoring network and model output datasets.   The new high-performance program is able to cluster 290,000 annual time series (from either monitoring network data or gridded model output) in 13 hours on 800 nodes. We present here some example results showing how the algorithm can be used to analyse very large datasets, providing new insights into “airsheds” depicting regions of similar chemical origin and history, different spatial regimes for nitrogen, sulphur, and base cation deposition, .  These analyses show how different processes control each species at different potential monitoring site locations, via cluster-generated airshed maps for each species. The efficiency and flexibility of the algorithm allows for extremely large datasets to be analysed in hours of wall-clock time instead of weeks or months. The new algorithm is being used as the numerical engine for a new tool for the analysis of EU monitoring network data. 

How to cite: Lee, C., Makar, P., and Soares, J.: Spatio-temporal clustering on a high-performance computing platform for high-resolution monitoring network analysis, EGU General Assembly 2023, Vienna, Austria, 23–28 Apr 2023, EGU23-8841, https://doi.org/10.5194/egusphere-egu23-8841, 2023.

22 cost-efficient (aka ‘low-cost’) commercially available particulate matter (PM) measurement devices were installed in a diverse urban area in Leipzig, Germany. The instruments measure mostly PM2.5, some additionally PM10, and are equipped with methods for quality assurance such as conditioning to a defined temperature and regular internal calibration. In order to investigate the spread between the instruments and to enable a pre-campaign calibration, all instruments were setup in the laboratory and the outside air and compared against the same reference measurements.

Since July 2022, the measurement network was installed. It covers roughly 2x2 km2 and holds different urban features like residential and commercial buildings, important main roads, city parks, and small open building gaps. Within the network there is an official air quality monitoring station located directly at a main road. In addition, at two further official monitoring stations as well as at observation stations of the Leibniz Institute for Tropospheric Research instruments were installed to study the long-term performance, dependence on meteorological conditions and comparison to reference measurements. The measurements will take place until end of 2023.

The cost-efficient instruments perform generally quite well after the calibration. In particularly for higher PM loads > 10 µg m-3 the agreement against references is mostly satisfying. However, under very high relative humidity and cold temperatures, some instruments lacked to condition the air sufficiently. Despite these difficulties, the chosen instruments have the potential for application in monitoring of air quality limit values, i.e. the answer the question how often are certain limits exceeded.

Furthermore, differences between different local features in the observation area could be observed in e.g., the diurnal cycle but also peak and mean concentrations.

This work is co-financed with tax funds on the basis of the budget passed by the Saxon State Parliament (funding number 100582357).

How to cite: Schrödner, R., Alas, H., and Voigtländer, J.: Application of cost-efficient particulate matter measurement devices in an urban network and comparison to state-of-the-art air quality monitoring, EGU General Assembly 2023, Vienna, Austria, 23–28 Apr 2023, EGU23-9356, https://doi.org/10.5194/egusphere-egu23-9356, 2023.

EGU23-9537 | Posters on site | GI1.3

The Global Environmental Measurement and Monitoring Initiative – An International Network for Local Impact 

Daniel Klingenberg, D. Michelle Bailey, David Lang, and Mark Shimamoto

The Global Environmental Measurement and Monitoring (GEMM) Initiative is an international project of Optica and the American Geophysical Union seeking to provide precise and usable environmental data for local impact. The Initiative brings together science, technology, and policy stakeholders to address critical environmental challenges and provide solutions to inform policy decisions on greenhouse gases (GHGs) and air and water quality. GEMM Centers are currently established in Scotland, Canada, New Zealand, and the United States. These Centers represent partnerships with leading institutions that are actively working toward developing or deploying new measurement technology and improved climate models. Additional Centers are under development in India and Australia with plans to expand to Asia and Africa.

In addition to establishing monitoring centers worldwide, GEMM actively engages with other sectors (including industry, standards organizations, and regional or national governments) to support the incorporation or adoption of these evidence-based approaches into decision making processes. For example, Glasgow, Scotland is piloting the GEMM Urban Air Project, deploying a low-cost, real-time, ground-based network of devices that continuously monitors GHGs and air pollutants at a neighborhood scale. The sensor network in Glasgow is increasing the precision of local models that can provide the city with information to assess current policies and support future action. Here we will share the progress and outputs of the GEMM Initiative to date and highlight paths forward to grow the network.

How to cite: Klingenberg, D., Bailey, D. M., Lang, D., and Shimamoto, M.: The Global Environmental Measurement and Monitoring Initiative – An International Network for Local Impact, EGU General Assembly 2023, Vienna, Austria, 23–28 Apr 2023, EGU23-9537, https://doi.org/10.5194/egusphere-egu23-9537, 2023.

Since the discovery of the chlorofluorocarbons (CFCs) implication in stratospheric ozone destruction, the Montreal Protocol (1987) has aimed at controlling the production of CFCs and other ozone depleting substances (ODS) in order to protect and then recover the ozone layer. Consequently, temporary substitutes for CFCs have been developed and produced by the industry. First substitute molecules were hydrochlorofluorocarbons (HCFCs), which have smaller ozone depletion potentials (ODP) than CFCs since their atmospheric lifetimes are shorter. Nevertheless, HCFCs still contain chlorine atoms and hence, also deplete the stratospheric ozone, requiring them to be banned in turn. Thus, chlorine-free molecules, i.e. hydrofluorocarbons (HFCs) such as CH2FCF3 (HFC-134a) were introduced to replace both CFCs and HCFCs. Even if HFCs do not contribute to ozone depletion, they are very powerful greenhouse gases since they have great global warming potentials (GWPs). Consequently, the Kigali amendment (2016) to the Montreal Protocol aimed for their phase-out.

The atmospheric concentrations of CFCs have decreased in response to the phase-out and ban of their production by the Montreal Protocol and its subsequent amendments, while the HCFCs burden is now leveling off. In contrast, the atmospheric concentrations of HFCs have increased notably in the last two decades.

We present the first retrievals of HFC-134a from Fourier Transform Infra-Red (FTIR) solar spectra obtained from a remote site of the Network for the Detection of Atmospheric Composition Change (NDACC.org): the Jungfraujoch station (Swiss Alps). We discuss of the applicability of our retrieval strategy to other NDACC sites, for future quasi global monitoring from ground-based observations. We further perform first comparisons with other datasets as ACE-FTS satellite observations.


How to cite: Pardo Cantos, I. and Mahieu, E.: First HFC-134a retrievals and analysis of long-term trends from FTIR solar spectra above NDACC network stations: the Jungfraujoch case, EGU General Assembly 2023, Vienna, Austria, 23–28 Apr 2023, EGU23-11033, https://doi.org/10.5194/egusphere-egu23-11033, 2023.

Monitoring networks, able to effectively provide high-frequency geochemical data for characterizing the geochemical behavior of the main greenhouse gases (i.e., CO2 and CH4) and pollutants (e.g., heavy metals) are crucial tools for the assessment of air quality and its role in climate changes. However, the provision of measurement stations dedicated to monitor gas species and particulate in polluted areas is complicated by the high cost of their set-up and maintenance. In the last decade, traditional instruments have tentatively been coupled with low-cost sensors for improving spatial coverage and temporal resolution of air quality surveys. The main concerns of this new approach regard the in-field accuracy of the low-cost sensors, being significantly dependent on: (i) cross-sensitivities to other atmospheric pollutants, (ii) environmental parameters (e.g., relative humidity and temperature), and (iii) detector signal degradation over time.

This study presents the results of a geochemical survey carried out in the Greve River Basin (Chianti territory, Central Italy) from May to September 2022 by adopting two measuring strategies: (i) deployment of a mobile station, along predefined transepts within the Greve valley, equipped with a Picarro G2201-i analyzer to measure CO2 and CH4 concentrations and δ13C-CO2 and δ13C-CH4 values (‰ vs. V-PDB) by Wavelength-Scanned Cavity Ring-Down Spectroscopy (WS-CRDS); (ii) continuous monitoring, at five fixed sites positioned at different altitudes, of CO2 and CH4 concentrations through prototyped low-cost stations, coupled with atmospheric deposition and rain samplers to collect particulate samples for chemical lab analysis. The low-cost monitoring stations housed (i) a non-dispersive infrared (NDIR) sensor for CO2 concentrations, (ii) a solid-state metal oxide sensor (MOS) for CH4 concentrations, (iii) a laser light scattering sensor (LSPs) for PM2.5 and PM10 concentrations, and (iv) a sensor for temperature and relative humidity in the air. The CO2 and CH4 sensors have been calibrated in-field based on parallel measurements with the Picarro G2201-i and elaborating the calibration data with the Random Forest machine learning-based algorithm.

The measurements carried out along the transepts showed that the downstream areas next to the metropolitan city of Florence were affected by the highest concentrations of CO2 and CH4, marked by isotopic signatures revealing a clear anthropogenic origin, mainly ascribed to vehicular traffic. The distribution of these carbon species reflected the evolution of the atmospheric boundary layer, displaying higher concentrations during the early morning, when gas accumulation occurred due to stable atmospheric conditions, and lower concentrations during daytime when the heating of the surface favored the dilution of air pollutants due to the establishment of convective turbulence. These observations were confirmed by the network of low-cost stations, which allowed to simultaneously monitor the distribution of the atmospheric pollutants at different altitudes in the valley. The distribution of particulate was consistent with that of the gaseous species, and the main sources were clearly distinguished based on the chemical composition of the atmospheric deposition in the collection sites. The promising results from the present study could result in an affordable approach to effectively improve air quality monitoring strategies and support data-driven policy actions to reduce carbon emissions.

How to cite: Biagi, R., Ferrari, M., Tassi, F., and Venturi, S.: Multi-instrumental approach for air quality monitoring: characterization and distribution of greenhouse gases and atmospheric metal deposition in the Greve River Basin (Chianti territory, Central Italy)., EGU General Assembly 2023, Vienna, Austria, 23–28 Apr 2023, EGU23-11385, https://doi.org/10.5194/egusphere-egu23-11385, 2023.

EGU23-13997 | ECS | Posters on site | GI1.3

Correction, gap filling and homogenization on daily level of the historical DMI station network temperature data 

Dina Rapp, Bo Møllesøe Vinther, Jacob L. Høyer, and Eigil Kaas

As climate change is amplified in the Arctic, it is crucial to have temperature records of high temporal resolution and quality in this area. This will help improve understanding of the involved physical mechanisms, assessment of the past changes and improve predictions for the future temperature development in the Arctic. In this study temperature measurements from the DMI Greenland station network spanning 1784-present day are corrected, gap-filled and homogenized on a daily level. Currently homogenized data is only available on a monthly level, and the more recent data has not been homogenized. The data is currently used for purposes like assessment and predictions of the surface mass balance of the Greenland Ice Sheet, temperature/climate reanalyses, validation of proxy data, etc.  

This study presents a method for improving the calculation of daily average temperatures, from the current practice of averaging the available measurements without considering what time of day they are from and how the measurements are distributed. The method is based on a moving average taking into consideration time of day, time of year and latitude/longitude of the station in question. An estimate of the related uncertainty is also calculated. Following the generation of daily average temperatures, different gap filling methods are tested. The different algorithms tested and compared are: simple gap filling by linear interpolation with other stations, single station temporal linear interpolation and MEM (Maximum Entropy Method). Finally, homogenization on daily level is performed. These steps will in turn also improve the monthly and annual average temperatures for the DMI Greenland station network. 

How to cite: Rapp, D., Møllesøe Vinther, B., L. Høyer, J., and Kaas, E.: Correction, gap filling and homogenization on daily level of the historical DMI station network temperature data, EGU General Assembly 2023, Vienna, Austria, 23–28 Apr 2023, EGU23-13997, https://doi.org/10.5194/egusphere-egu23-13997, 2023.

The Global Atmosphere Watch (GAW) Programme was established in 1989 in recognition of the need for improved scientific understanding of the increasing influence of human activities on atmospheric composition and subsequent societal impacts. It is implemented as an activity of the World Meteorological Organization, a specialized agency of the United Nations system, and is funded by the organization member countries.

As an international programme, GAW supports a broad spectrum of applications from atmospheric composition-related services to contribution to environmental policy. The examples of the later include provision of a comprehensive set of high quality and long-term globally harmonized observations and analysis of atmospheric composition for the United Nations Framework Convention on Climate Change (UNFCCC), the Montreal Protocol on Substances that Deplete the Ozone Layer and follow-up amendments, and the Convention on Long-Range Transboundary Air Pollution (CLRTAP).

The programme includes six focal areas: Greenhouse Gases, Ozone, Aerosols, Reactive Gases, Total Atmospheric Deposition and SolarUltraviolet Radiation.

The surface-based observational network of the programme includes Global (31 stations) and Regional (about 400 stations) stations where observations of various GAW parameters occur. These stations are complemented by regular ship cruises and various contributing networks. All observations are linked to common reference standards and the observational data are made available at seven designated World Data Centres (WDC).

Surface-based observations are complemented by airborne and space-based observations that help to characterize the upper troposphere and lower stratosphere, with regards to ozone, solar radiation, aerosols, and certain trace gases.

Requirements to become a GAW station are detailed in the GAW Implementation Plan 2016-2023 (WMO, 2017). A new IP is in preparation, the four strategic objectives will be presented.

  • The GAW Quality Management comprises: Data Quality Objectives, Measurement Guidelines, Standard Operating Procedures and Data Quality Indicators. Throughout the programme the common quality assurance principles apply, that include requirements for the long-term sustainability of the observations, use of one network standard for each variable and implementation of the measurement practices that satisfy the set data quality objectives. GAW implements open data policy and requires observational data be made available in the dedicated data centers operated by WMO Member countries.

The programme relies on different types of central facilities: Central Calibration Laboratories, Quality Assurance/Science Activity Centres, World and Regional Calibration Centres, which are also directly supported and implemented by the individual Member countries for the global services.

Majority of the recommendations regarding measurement and quality assurance procedures are developed by the expert and advisory groups within the programme, often those rely on the expertise withing the contributing networks and collaborating organizations, like the Aerosol, Clouds and Trace Gases Research Infrastructure (ACTRIS) or the Integrated Carbon Observation System (ICOS).

One of the GAW priorities is to expand and strengthen partnerships with contributing networks, through development of statements and strategies to articulate the mutual benefits for the collaborations and stream-line processes of data reporting and exchange of QA standards and metadata. This involves collaboration with national and regional environmental protection agencies and the development of harmonized metadata and data exchange and quality information.

How to cite: Moreno, S.: The WMO Global Atmosphere Watch Programme new implementation plan and strategic objectives, EGU General Assembly 2023, Vienna, Austria, 23–28 Apr 2023, EGU23-14442, https://doi.org/10.5194/egusphere-egu23-14442, 2023.

EGU23-14459 | ECS | Orals | GI1.3

Developing and testing a validation procedure to successfully use on-the-move sensors in urban environments 

Francesco Barbano, Erika Brattich, Carlo Cintolesi, Juri Iurato, Vincenzo Mazzarella, Massimo Milelli, Abdul Ghafoor Nizamani, Maryam Sarfraz, Antonio Parodi, and Silvana Di Sabatino

With the increasing attempt to empower citizens and civil society in promoting virtuous behaviours and relevant climate actions, novel user-friendly and low-cost tools and sensors are nowadays being developed and distributed on the market. Most of these sensors are typically easy to install with a ready-to-use system, while measured data are automatically uploaded on a mobile application or a web dashboard which also guarantees secure and open access to measurements gathered by other users. However, the quality of the datum and the calibration of these sensors are often ensured against research-grade instrumentations only in the laboratory and rarely in real-world measurement. The discrepancies arising between these low-cost sensors and research-grade instrumentations are such that the first might be impossible to use if a validation (and re-calibration if needed) under environmental conditions is not performed. Here we propose a validation procedure applied to the MeteoTracker, a recently developed portable sensor to monitor atmospheric quantities on the move. The ultimate scope is to develop and implement a general procedure to test and validate the quality of the MeteoTracker data to compile user guidelines tailored for on-the-move sensors. The result will evaluate the feasibility of MeteoTracker (and potentially other on-the-move sensors) to integrate the existing monitoring networks on the territory, improve the atmospheric data local coverage and support the informed decision by the authorities. The procedure will include multi-sensor testing of all the sensor functionalities, validation of all data simultaneously acquired by several sensors under similar conditions, methods and applications of comparisons with research-grade instruments. The first usage of the MeteoTracker will be also presented for different geographical contexts where the sensors will be used for citizen science activities and develop a monitoring network of selected Essential Variables within the HORIZON-EU project I-CHANGE (Individual Change of HAbits Needed for Green European transition).

How to cite: Barbano, F., Brattich, E., Cintolesi, C., Iurato, J., Mazzarella, V., Milelli, M., Nizamani, A. G., Sarfraz, M., Parodi, A., and Di Sabatino, S.: Developing and testing a validation procedure to successfully use on-the-move sensors in urban environments, EGU General Assembly 2023, Vienna, Austria, 23–28 Apr 2023, EGU23-14459, https://doi.org/10.5194/egusphere-egu23-14459, 2023.

EGU23-15087 | Posters on site | GI1.3

Applications of an advanced clustering tool for EU AQ monitoring network data analysis 

Joana Soares, Christoffer Stoll, Islen Vallejo, Colin Lee, Paul Makar, and Leonor Tarrasón

Air quality monitoring networks provide invaluable data for studying human health, environmental impacts, and the effects of policy changes. In a European legislative context, the data collected constitutes the basis for reporting air quality status and exceedances under the Ambient Air Quality Directives (AAQD) following specific requirements. Consequently, the network's representativity and ability to accurately assess the air pollution situation in European countries become a key issue. The combined use of models and measurements is currently understood as the most robust way to map the status of air pollution in an area, allowing it to quantify both the spatial and temporal distribution of pollution. This spatial-temporal information can be used to evaluate the representativeness of the monitoring network and support air quality monitoring design using hierarchical clustering techniques.

The hierarchical clustering methodology applied in this context can be used as a screening tool to analyse the level of similarity or dissimilarity of the air concentration data (time-series) within a monitoring network. Hierarchical clustering assumes that the data contains a level of (dis)similarity and groups the station records based on the characteristics of the actual data. The advantage of this type of clustering is that it does not require an a priori assumption about how many clusters there might be, but it can become computationally expensive as the number of time-series increases in size. Three dissimilarity metrics are used to establish the level of similarity (or dissimilarity) of the different air quality measurements across the monitoring network: (1) 1-R, where R is the Pearson linear correlation coefficient, (2) the Euclidean distance (EuD), and (3) multiplication of metric (1) and (2). The metric based on correlation assesses dissimilarities associated with the changes in the temporal variations in concentration. The metric based on the EuD assesses dissimilarities based on the magnitude of the concentration over the period analysed. The multiplication of these two metrics (1-R) x EuD assesses time variation and pollution levels correlations, and it has been demonstrated to be the most useful metric for monitoring network optimization.

This study presents the MoNET webtool developed based on the hierarchical clustering methodology. This webtool aims to provide an easy solution for member states to quality control the data reported as a tier-2 level check and evaluate the representativeness of the air quality network reporting under the AAQD. Some examples from the ongoing evaluation of the monitoring site classification carried out as a joint exercise under the Forum for Air Quality Modeling (FAIRMODE) and the National Air Quality Reference Laboratories Network (AQUILA) are available to show the usability of the tool. MoNet should be able to identify outliers, i.e., issues with the data or data series with very specific temporal-magnitude profiles, and to distinguish, e.g., pollution regimes within a country and if it resembles the air quality zones required by the AAQD and set by the member states; stations monitoring high-emitting sources; background regimes vs. a local source driving pollution regime in cities.

How to cite: Soares, J., Stoll, C., Vallejo, I., Lee, C., Makar, P., and Tarrasón, L.: Applications of an advanced clustering tool for EU AQ monitoring network data analysis, EGU General Assembly 2023, Vienna, Austria, 23–28 Apr 2023, EGU23-15087, https://doi.org/10.5194/egusphere-egu23-15087, 2023.

EGU23-15609 | ECS | Posters on site | GI1.3

A compact and customisable street-level sensor system for real-time weather monitoring and outreach in Freiburg, Germany 

Gregor Feigel, Marvin Plein, Matthias Zeeman, Ferdinand Briegel, and Andreas Christen

Climate adaptation and emergency management are major challenges in cities, that benefit from the incorporation of real-time weather, air quality, differential exposure and vulnerability data. We therefore need systems that allow us to map, for example, localised thermal heat stress, heavy precipitation events or air quality spatially resolved across cities at high temporal resolution. Key to the assessment of average conditions and weather extremes in cities are systems that are capable of resolving intra-urban variabilities and microclimates at the level of people, hence in the urban canopy layer at street-level. Placing sensors at street-level, however, is challenging: Sensors need to be small, rugged, safe, and they must measure a number of quantities within limited space. Such systems may ideally require little or no external power, provide remote accessibility, sensor interoperability and real-time data transfer and must be cost-effective for mass deployment. However, these characteristics as well as a wide spectrum of observed variables are not available in current commercial sensor network solutions, hence we designed and implemented a custom partly in-house developed two-tiered sensor system for mounting and installation at 3 m height on city-owned street lights in Freiburg, Germany.

Our partly in-house developed two-tiered sensor network, consisting of fifteen fully self-developed, cost-effective “Tier-I stations” and 35 commercial “Tier-II stations” (LoRAIN, Pessl Instruments GmbH), aims to fill these gaps and to provide a modular, user-friendly WSN with a high spatial density and temporal resolution for research, practical applications and the general public. The Tier-I stations were designed and optimised from the ground up, including the printed circuit board (PCB), for temporally high-resolution WSNs that support wide ranges of sensors and that is expandable. The core of the system is a low-power embedded computer (Raspberry Pi Zero) running a custom multithreaded generic logging and remote control software that locally stores the data and transmits it to a custom vapor-based TCP server via GSM. The software also features system monitoring and error detection functions, as well as remote logging. The setup can easily be expanded on the fly by adding predefined sensors to a configuration file. For better modularity, each station registers itself on the server and will be automatically integrated in all further processes and vice versa. Custom frontends as well as bidirectional communication and task distribution protocols enable remote access and across node interaction, resulting in a more easy-to-maintain system. 

In addition to air temperature, humidity and precipitation measured by the Tier II stations, the Tier-I station feature a ClimaVUE 50 all-in-one weather sensor and a BlackGlobe (Campbell Scientific, Inc.) that provides data on wind, radiation, pressure, lightning, solar radiation and black globe temperatures. That allows for calculation of thermal comfort indices in real-time. A webpage and the self-developed “uniWeather” (iOS-App, API) offers near-realtime data access and data interpretation for stakeholders and public outreach.

How to cite: Feigel, G., Plein, M., Zeeman, M., Briegel, F., and Christen, A.: A compact and customisable street-level sensor system for real-time weather monitoring and outreach in Freiburg, Germany, EGU General Assembly 2023, Vienna, Austria, 23–28 Apr 2023, EGU23-15609, https://doi.org/10.5194/egusphere-egu23-15609, 2023.

EGU23-16779 | Orals | GI1.3 | Highlight

An integrated meteorological forecasting system for emergency response 

Alexander Haefele, Maxime Hervo, Philipp Bättig, Daniel Leuenberger, Claire Merker, Daniel Regenass, Pirmin Kaufmann, and Marco Arpagaus

EMER-Met is the new meteorological forecasting system for the protection of the population in Switzerland. It provides the meteorological basis for coping with all types of emergencies, especially in case of nuclear and chemical accidents. EMER-Met consists of a dedicated upper air measurement network and a high-resolution numerical weather prediction model. The measurement network is composed of state-of-the-art remote sensing instruments to measure accurate wind and temperature profiles in the boundary layer. At three sites, a radar wind profiler PCL1300, a Doppler lidar Windcube-200s and a microwave radiometer Hatpro-G5 are installed. The data from the measurement network are assimilated into the operational 1-km ensemble numerical weather prediction (NWP) system. In the case of the microwave radiometers, we assimilate the brightness temperatures using an adapted version of the RTTOV observation operator. To ensure best impact on the NWP results, the data quality of the measurements is of high importance and is monitored closely on a daily and monthly basis against radiosondes and the NWP model itself. EMER-Met is operational since 2022 and to our best knowledge, it is the first time that the brightness temperatures measured by surface-based microwave radiometers are assimilated operationally. This presentation will focus on the upper air network performance and its impact on NWP. 

How to cite: Haefele, A., Hervo, M., Bättig, P., Leuenberger, D., Merker, C., Regenass, D., Kaufmann, P., and Arpagaus, M.: An integrated meteorological forecasting system for emergency response, EGU General Assembly 2023, Vienna, Austria, 23–28 Apr 2023, EGU23-16779, https://doi.org/10.5194/egusphere-egu23-16779, 2023.

EGU23-17535 | ECS | Orals | GI1.3

ACTRIS - CiGas side-by-side interlaboratory comparison of new and classical techniques for formaldehyde measurement in the nmol/mol range 

Therese Salameh, Emmanuel Tison, Evdokia Stratigou, Sébastien Dusanter, Vincent Gaudion, Marina Jamar, Ralf Tillmann, Franz Rohrer, Benjamin Winter, Teresa Verea, Amalia Muñoz, Fanny Bachelier, Véronique Daele, and Audrey Grandjean

Formaldehyde is an important hazardous air pollutant, classified as carcinogenic to humans by the International Agency for Research on Cancer (IARC). It is emitted directly by many anthropogenic and natural sources, and formed as a secondary product from volatile organic compounds (VOCs) photo-oxidation. Formaldehyde is, as well, a significant source of radicals in the atmosphere resulting in ozone and secondary organic aerosols formation. Routine measurements of formaldehyde in regulatory networks within Europe (EMEP) and USA (EPA Compendium Method TO 11A) rely on sampling with DNPH (2,4-Dinitrophenylhydrazine)- impregnated silica cartridges, followed by analysis with HPLC (High-performance liquid chromatography).

In the framework of the EURAMET-EMPIR project « MetClimVOC » (Metrology for climate relevant volatile organic compounds: http://www.metclimvoc.eu/), the European ACTRIS (Aerosol, Cloud and Trace Gases Research InfraStructure: https://www.actris.eu/) Topical Centre for Reactive Trace Gases in-situ Measurements (CiGas), IMT Nord Europe unit – France, organized a side-by-side intercomparison campaign in Douai-France, dedicated to formaldehyde measurement in a low amount fraction range of 2 - 20 nmol/mol, from 30 May to 8 June 2022. The objectives of the intercomparison are to evaluate the instruments metrological performance under the same challenging conditions, and to build best practices and instrumental knowledge.

Here, we present the results from the intercomparison, where ten instruments belonging to seven different techniques were challenged with the same formaldehyde gas mixture generated either from a cylinder or from a permeation system, in different conditions (amount fractions, relative humidity, interference, blanks, etc.), flowing through a high-flow (up to 50 L/min) Silcosteel-coated manifold. The advantages/drawbacks of the techniques will be discussed.

How to cite: Salameh, T., Tison, E., Stratigou, E., Dusanter, S., Gaudion, V., Jamar, M., Tillmann, R., Rohrer, F., Winter, B., Verea, T., Muñoz, A., Bachelier, F., Daele, V., and Grandjean, A.: ACTRIS - CiGas side-by-side interlaboratory comparison of new and classical techniques for formaldehyde measurement in the nmol/mol range, EGU General Assembly 2023, Vienna, Austria, 23–28 Apr 2023, EGU23-17535, https://doi.org/10.5194/egusphere-egu23-17535, 2023.

EGU23-135 | ECS | Orals | GI4.2

Deep-Pathfinder: A machine learning algorithm for mixing layer height detection based on lidar remote sensing data 

Jasper Wijnands, Arnoud Apituley, Diego Alves Gouveia, and Jan Willem Noteboom

The mixing layer height (MLH) indicates the change between vertical mixing of air near the surface and less turbulent air above. MLH is important for the dispersion of air pollutants and greenhouse gases, and assessing the performance of numerical weather prediction systems. Existing lidar-based MLH detection algorithms typically do not use the full resolution of the ceilometer, require manual feature engineering, and often do not enforce temporal consistency of the MLH profile. Given the large-scale availability of lidar remote sensing data and the high temporal and spatial resolution at which it is recorded, this domain is very suitable for machine learning approaches such as deep learning. This presentation introduces a completely new approach to estimate MLH: the Deep-Pathfinder algorithm, based on deep learning techniques for image segmentation.

The concept of Deep-Pathfinder is to represent the 24-hour MLH profile as a mask (i.e., black indicating the mixing layer, white indicating the non-turbulent atmosphere above) and directly predict the mask from an image with lidar observations. Range-corrected signal (RCS) data at 12-second temporal and 10-meter vertical resolution was obtained from Lufft CHM 15k ceilometers at five locations in the Netherlands (2020–2022). High-resolution annotations were created for 50 days, informed by a visual inspection of the RCS image, the manufacturer's layer detection algorithm, gradient fields, thermodynamic MLH estimates, and humidity profiles of the 213-meter mast at Cabauw.

Our model is based on a customised U-Net architecture with MobileNetV2 encoder to ensure fast inference times. A nighttime variable indicated whether the sample occurred between sunset and sunrise and hence, whether an estimate of the stable or convective boundary layer was required. Model calibration was performed on the Dutch National Supercomputer Snellius. First, input samples were randomly cropped to 224x224 pixels, covering a 45-minute period and maximum altitude of 2240 meters. Then, the model was pre-trained on 19.4 million samples of unlabelled data. Finally, the labelled data was used to fine-tune the model for the task of mask prediction. Performance on a test set was compared to MLH estimates from ceilometer manufacturer Lufft and the STRATfinder algorithm.

Results showed that days with a clear convective boundary layer were captured well by all three methods, with minimal differences between them. The Lufft wavelet covariance transform algorithm contained a slight temporal shift in MLH estimates. Further, it had more missing data in complex atmospheric conditions. STRATfinder estimates for the nocturnal boundary layer were consistently low due to guiding restrictions in the algorithm. In contrast, Deep-Pathfinder followed short-term fluctuations in MLH more closely due to the use of high-resolution input data. Path optimisation algorithms like STRATfinder have good temporal consistency but can only be evaluated after a full day of ceilometer data has been recorded. Deep-Pathfinder retains the advantages of temporal consistency by assessing MLH evolution in 45-minute samples, however, it can also provide real-time estimates. This makes a deep learning approach as presented here valuable for operational use, as real-time MLH detection better meets the requirements of users in aviation, weather forecasting and air quality monitoring.

How to cite: Wijnands, J., Apituley, A., Alves Gouveia, D., and Noteboom, J. W.: Deep-Pathfinder: A machine learning algorithm for mixing layer height detection based on lidar remote sensing data, EGU General Assembly 2023, Vienna, Austria, 23–28 Apr 2023, EGU23-135, https://doi.org/10.5194/egusphere-egu23-135, 2023.

EGU23-1387 | ECS | Posters on site | GI4.2

Optical properties of birch pollen using a synergy of three lidar instruments 

Maria Filioglou, Ari Leskinen, Ville Vakkari, Minttu Tuononen, Xiaoxia Shang, and Mika Komppula

Pollen has important implications for health, but also for the climate as it can act as cloud condensation nuclei or ice nuclei in cloud processing. Active remote sensing instruments equipped with polarization capability can extend the detection of pollen from the surface up to several kilometres in the atmosphere maintaining continuous and high time resolution operation. In this study, we use a synergy of three lidars, namely, a multi-wavelength PollyXT lidar, a Vaisala CL61 ceilometer and a Halo Photonics StreamLine Doppler lidar, to investigate the optical properties of birch pollen particles. All three lidars are equipped with polarization channels enabling the investigation of the wavelength dependence at 355, 532, 910 and 1565 nm. Together with pollen observations from a Hirst-type spore sampler and aerosol in situ observations, we were able to characterize the linear particle depolarization ratio (PDR) and backscatter-related Angstrom exponents of the pollen particles. Both optical properties have been extensively used in aerosol classification algorithms and they are therefore highly desired in the lidar community. We found that birch pollen exhibits a spectral dependence in the PDR, and its classification is feasible when, preferably, two or more polarization wavelengths are available.

How to cite: Filioglou, M., Leskinen, A., Vakkari, V., Tuononen, M., Shang, X., and Komppula, M.: Optical properties of birch pollen using a synergy of three lidar instruments, EGU General Assembly 2023, Vienna, Austria, 23–28 Apr 2023, EGU23-1387, https://doi.org/10.5194/egusphere-egu23-1387, 2023.

Ice clouds in the Arctic are expected to have different radiative properties compared to mid latitude cirrus, because of the different humidity and temperature profile and also the prevalent aerosol loading in northern latitudes which govern their formation. During the late winter and early spring 2022 the HALO-(AC)3 campaign was conducted out of Kiruna (Sweden) to probe artic clouds with an airborne remote sensing payload. For this purpose, the German research aircraft HALO was equipped with a water vapor Differential Absorption Lidar (DIAL), a cloud radar, micro-wave radiometers, radiation measurements in the visible, near infrared and thermal region and a drop-sonde dispenser. A total of 25 flights where performed mainly over the sea between Svalbard and Greenland and up to nearly 90°N.

The primary observable to study ice cloud formation is the relative humidity, which is not directly measurable by lidar, but can only be computed with the aid of additional temperature information. By comparison with a large number of dropsondes launched during flight, we will show that the temperature field from ECMWF IFS analyses and short-term forecasts provides sufficient accuracy to retrieve the relative humidity for ice cloud studies. Using this method we will analyse different scenarios of arctic cirrus formation: under stable artic conditions, during a warm air intrusion and while a cold air outbreak. An interesting special case is the modification of cirrus properties by the presence of an aerosol layer which is most probably composed of long range transported Sharan dust. 

How to cite: Wirth, M. and Groß, S.: Characterisation of Arctic Cirrus by Airborne Water Vapor and High Spectral Resolution Lidar, EGU General Assembly 2023, Vienna, Austria, 23–28 Apr 2023, EGU23-2024, https://doi.org/10.5194/egusphere-egu23-2024, 2023.

The atmospheric boundary layer is a layer that directly responds to energy emitted or absorbed from the ground into the atmosphere, and is greatly affected by various meteorological factors, which change the concentration of air pollutants. There is generally an inversion layer above the atmospheric boundary layer, so most of the air pollutants emitted by humans cannot escape to the outside of the atmospheric boundary layer and remain there. Ulsan Metropolitan City in Korea is known as the largest industrial city in Korea. These industrial cities generally emit more air pollutants than other cities. Since these air pollutants are greatly affected by the boundary layer, it is important to accurately calculate the height of the boundary layer. In this study, we compare the height of the atmospheric boundary layer based on LiDAR and the height of the atmospheric boundary layer in the Weather Research and Forecasting numerical model, and examine how the height of the atmospheric boundary layer affects the change in the concentration of air pollutants.

How to cite: Choi, K. and Song, C.: Effect of air pollutant concentration according to the height of the Planetary boundary layer in Ulsan, EGU General Assembly 2023, Vienna, Austria, 23–28 Apr 2023, EGU23-3042, https://doi.org/10.5194/egusphere-egu23-3042, 2023.

EGU23-3068 | ECS | Posters on site | GI4.2

Improvement of wind vector retrieval method for increasing data acquisition rate of the wind profiler and the wind lidar 

Yujin Kim, Byung Hyuk Kwon, Jiwoo Seo, Geon Myeong Lee, and KyungHun Lee

Representative meteorological instruments that utilize the Doppler effect include Doppler radar, wind profiler, and wind lidar. The latter two instruments produce a vertical profile of winds in high spatio-temporal resolution, in the atmospheric boundary layer. Wind lidar observes with a vertical resolution of 50 m or less and a temporal resolution in minutes, so it fills the observation gap in the lower layer where the wind profiler misses meteorological data. The wind lidar makes the wind vector using DBS (Doppler Beam Swinging) and VAD (Velocity Azimuth Display) methods. It is known that the wind by the VAD method is more accurate than the wind by the DBS method. The DBS method has the advantage of obtaining a wind profile with a fast scan time. On the other hand, there is a restriction that requires at least two beams including vertical beams (one of the east and west beams, and one of the south and north beams), which causes a decrease in the data acquisition rate. The VAD method was improved to produce more wind vector of the wind profiler as well as the wind lidar, which generally uses 5 beams. First, the Fourier series was estimated with the radial velocity by the DBS method. Next, the wind vector was determined by setting the azimuth interval and applying the radial velocity by the Fourier series to the VAD method. The wind vectors were retrieved at the altitude where the wind was not calculated by the DBS method, and the results of the two methods were consistent at the altitude where the wind was calculated by the DBS and the improved VAD method. In this study, we propose a method to increase the data acquisition rate even if the vertical beam or one of the inclined beams is insufficient.

How to cite: Kim, Y., Kwon, B. H., Seo, J., Lee, G. M., and Lee, K.: Improvement of wind vector retrieval method for increasing data acquisition rate of the wind profiler and the wind lidar, EGU General Assembly 2023, Vienna, Austria, 23–28 Apr 2023, EGU23-3068, https://doi.org/10.5194/egusphere-egu23-3068, 2023.

EGU23-4339 | Orals | GI4.2

Climatological assessment of the vertically resolved optical aerosol properties by lidar measurements and their influence on radiative budget over the last two decades at UPC Barcelona 

Simone Lolli, Adolfo Comeron, Cristina Gíl-Diaz, Tony Landi, Constantin Munoz-Porcar, Daniel Oliveira, Alejandro Rodriguez-Gomez, Michael Sïcard, Andrés Alastuey, Xavier Querol, and Cristina Reche

In the last two decades, several scientific studies have highlighted the adverse effects, primarily on population health, transportation, and climate, of urban atmospheric particulate due to anthropogenic emissions. For these reasons, aerosols have been monitored through both, remote sensing and in-situ observation platforms, also to establish if the reduction emission policies implemented at the government level have had positive outcomes. In this study, for the first time, we assess how the vertically resolved properties of the atmospheric particulate have changed and consequently their radiative effect during the last twenty years in Barcelona, Spain, one of the largest metropolitan areas of the Mediterranean basin. This study is carried out in the frame of the ACTRIS project through synergy between lidar measurements and the meteorological variables, e.g. wind, temperature, and humidity at the surface. This research, thanks to twenty-year measurements, can shed some light on the meteorological processes and conditions that can lead to haze formation and can help decision-makers to adopt mitigation strategies to preserve large marine Mediterranean metropolitan regions.

How to cite: Lolli, S., Comeron, A., Gíl-Diaz, C., Landi, T., Munoz-Porcar, C., Oliveira, D., Rodriguez-Gomez, A., Sïcard, M., Alastuey, A., Querol, X., and Reche, C.: Climatological assessment of the vertically resolved optical aerosol properties by lidar measurements and their influence on radiative budget over the last two decades at UPC Barcelona, EGU General Assembly 2023, Vienna, Austria, 23–28 Apr 2023, EGU23-4339, https://doi.org/10.5194/egusphere-egu23-4339, 2023.

EGU23-5753 | Posters on site | GI4.2

Latent flow measurement by Wind Lidar and Raman Lidar during WaLiNeas campaign 

Donato Summa, Paolo Di Girolamo, Noemi Franco, Ilaria Gandolfi, Marco Di Paolantonio, Marco Rosoldi, Fabio Madonna, Aldo Giunta, and Davide Dionisi

A network of water vapor Raman lidars  WaLiNeas (Lidar Network Assimilation) for improving heavy precipitation forecasting in the Mediterranean Sea has been designed among with the aim of providing water vapor measurements with high spatial-temporal resolution and accuracy, in order to be assimilated into AROME mesoscale models using a four-dimensional ensemble-variational approach with 15-min updates. The CONCERNIG Lidar from University of Basilicata and a Wind Lidar form CNR–IMAA are co-located in the University of Toulone between October 2022 and January 2023 in order to reach the campaign objective. For this scope a of vertical profiles of latent heat flux were obtained  as a  Covariance matrices from vertical wind component (w') and mixing ratio (q') are estimated as a retrieval of a Wind Lidar and Raman Lidar UV respectively.

In this way, a time series of vertical wind profiles from the selected case (31 Oct to 03 Nov) are computed. with temporal resolution Δt = 15 min and vertical resolution Δz = 90 m.  The specific humidity flux < w’ · q’>  [g/kg · m/s] is converted into the flux of latent heat (W/m2) by multiplication with the air density ρ obtained from the radiosonde and the latent heat of vaporization of water Lv. A flux comparison with ground-based water vapour Raman and wind lidar shows agreement within the instruments and the results will be presented during the conference

How to cite: Summa, D., Di Girolamo, P., Franco, N., Gandolfi, I., Di Paolantonio, M., Rosoldi, M., Madonna, F., Giunta, A., and Dionisi, D.: Latent flow measurement by Wind Lidar and Raman Lidar during WaLiNeas campaign, EGU General Assembly 2023, Vienna, Austria, 23–28 Apr 2023, EGU23-5753, https://doi.org/10.5194/egusphere-egu23-5753, 2023.

EGU23-7065 | Orals | GI4.2

Nitrous Oxide, N2O: Spectroscopic Investigations for Future Lidar Applications 

Christoph Kiemle, Christian Fruck, and Andreas Fix

Nitrous Oxide, N2O, is the third most important GHG contributing to human-induced global warming, after carbon dioxide and methane. Its growth rate is constantly increasing and its global warming potential is estimated to be 273 times higher than that of CO2 over 100 years. The major anthropogenic source is nitrogen fertilization in croplands. Soil N2O emissions are increasing due to interactions between nitrogen inputs and global warming, constituting an emerging positive N2O-climate feedback. The recent increase in global N2O emissions exceeds even the most pessimistic emission trend scenarios developed by the IPCC, underscoring the urgency of mitigating N2O emissions (Global Carbon Project, 2020). Estimating N2O emissions from agriculture is inherently complex and comes with a high degree of uncertainty, due to variability in weather and soil characteristics, in agricultural management options and in the interaction of field management with environmental variables. Further sources of N2O are processes in the chemical industry and combustion processes. The sink of N2O in the stratosphere increases the NOx concentration which catalytically depletes ozone. Better N2O measurements thus are urgently needed, particularly by means of remote sensing.

Airborne or satellite based N2O lidar remote sensing combines the advantages of high measurement accuracy, large-area coverage and nighttime measurement capability. Past initial feasibility studies revealed that Integrated-Path Differential-Absorption (IPDA) lidar providing vertical column concentrations of N2O would be the method of choice. In this current study we use the latest HITRAN spectroscopic data in order to identify appropriate N2O absorption lines in the wavelength region between 2.9 and 4.6 µm. The infrared spectral region challenges both lidar transmission and detection options. On the transmitter side, the use of optical parametric conversion schemes looks promising, while HgCdTe avalanche photodiode (APD), superconducting nanowire single-photon (SNSPD) or upconversion detectors (UCD) could offer high-efficiency low-noise signal detection. These options are implemented into a lidar simulation model in order to identify the optimal lidar system configuration for measuring N2O from aircraft or satellite using state-of-the-art technology.

How to cite: Kiemle, C., Fruck, C., and Fix, A.: Nitrous Oxide, N2O: Spectroscopic Investigations for Future Lidar Applications, EGU General Assembly 2023, Vienna, Austria, 23–28 Apr 2023, EGU23-7065, https://doi.org/10.5194/egusphere-egu23-7065, 2023.

EGU23-7093 | ECS | Orals | GI4.2

Ceilometer aerosol retrieval and comparison with in-situ tower-measurements 

Marcus Müller, Ulrich Löhnert, and Birger Bohn

In recent years there is a growing interest in real-time aerosol profiling and in this context, the use of automated lidars and ceilometers (ALC) for aerosol remote sensing increased. Ceilometers were originally developed to measure cloud-base height automatically. Apart from this, they also provide vertically resolved backscatter information. Several algorithms have been developed to calibrate this signal and to derive aerosol concentration from it, bringing up new opportunities in air quality monitoring and boundary layer research.

The quality of ALCs is often evaluated by comparing the attenuated backscatter to measurements from high-power lidars. This approach is suitable to validate the backscatter signal. However, for the validation of the aerosol concentration, a direct comparison with an in-situ, optical aerosol measurement is more significant.

In this work, a comparison study was performed using the Jülich Observatory for Cloud Evolution. Data were processed and calibrated with algorithms by E-Profile (https://www.eumetnet.eu/activities/observations-programme/current-activities/e-profile/alc-network/). The aerosol retrieval was performed using a Klett inversion algorithm. Close to the JOYCE site a 120 m meteorological tower is located. This tower was used as a platform for the in-situ aerosol measurement, where an optical particle sizer was mounted 100 m above the ceilometer position.

We will show the setup and data processing of the in-situ measurements as well as an approach how ceilometer raw data can be processed, calibrated and used to retrieve aerosol concentration. First results of the comparison will be presented to evaluate the quality of ALC aerosol-measurement.

How to cite: Müller, M., Löhnert, U., and Bohn, B.: Ceilometer aerosol retrieval and comparison with in-situ tower-measurements, EGU General Assembly 2023, Vienna, Austria, 23–28 Apr 2023, EGU23-7093, https://doi.org/10.5194/egusphere-egu23-7093, 2023.

EGU23-7775 | Posters on site | GI4.2

Several months of continuous operation of two thermodynamic Raman lidars in the frame of WaLiNeAs 

Paolo Di Girolamo, Noemi Franco, Marco Di Paolantonio, Donato Summa, Davide Dionisi, Annalisa Di Bernardino, Anna Maria Iannarelli, and Tatiana Di Iorio

The University of Basilicata, in cooperation with ISMAR-CNR, deployed two compact Raman lidars, namely the system CONCERNING and the system MARCO, in Southern France in the frame of the “Water Vapor Lidar Network Assimilation (WaLiNeAs)” experiment. WaLiNeAs, primarily funded by the “French National Research Agency” (ANR), is an international field experiment aimed at studying extreme precipitation events and improving their predictability through the assimilation of water vapour profile measurements from a network of Raman lidar systems into mesoscale numerical models. The experiment has a specific geographical focus on Southern France. The measurement strategy implies the exploitation of seven Raman lidars along the Mediterranean coasts of Spain and France, capable to provide real-time measurements of water vapour mixing ratio profiles over a three-month period starting on October 1st, 2022.

CONCERNING (COmpact RamaN lidar for Atmospheric CO2 and ThERmodyNamic ProfilING), developed in the frame of a cooperation between University of Basilicata, ISMAR-CNR and University of Rome, is a compact and transportable Raman lidar system designed for long-term all-weather continuous operation, capable to perform high-resolution and accurate carbon dioxide and water vapour mixing ratio profile measurements, together with temperature and multi-wavelength (355, 532 and 1064 nm) particle backscattering/extinction/depolarization profile measurements. The system relies on a 45-cm diameter Newtonian telescope and on a diode-pumped Nd:Yag laser source, capable of emitting pulses at the three traditional wavelengths of this laser source(355, 532 and 1064 nm), with a single pulse energy at 355 nm of 110 mJ and an average emitted power of 11 watts, based on a pulse repetition frequency of 100 Hz.

MARCO (Micropulse Atmospheric Optical Radar for Climate Observations) is also a compact and easily transportable Raman lidar system, developed around a high- frequency laser source (20 kHz), capable to perform 24/7 high-resolution and accurate CO2 and water vapour mixing ratio profile measurements, together with temperature and single-wavelength (355 nm) particle backscattering/extinction/depolarization measurements. In the frame of WaLiNeAs, as a result of the restrictions imposed by air traffic authority in the use of the visible and infrared laser radiation, only the 355 wavelength was exploited in CONCERNING, the temperature channel was not available in MARCO, while the CO2 channels, not needed for the purposes of WaLiNeAs, were temporarily deactivated in both systems.

Both systems have been recently designed and developed and WaLiNeAs represents the first international field deployment for both. CONCERNING was deployed at the University of Toulon in La Garde (Lat.: 43.136040 N, Long.: 6.011650 E, Elev.: 65 m, with continuous measurements since 29 September 2022, i.e. over more than 100 days up to now), while MARCO, was deployed at the Direction de Services Techniques in Port-Saint-Louis-du-Rhône, Camargue (Lat.: 43.392570 N, Long.: 4.813480 E, Elev.: 5 m, with continuous measurements since 19 October 2022, i.e. over more than 80 days up to now). At the time of the submission of this abstract, both system are still operational with a tbc date for the stop of the operation of 31 January 2023. Preliminary results from these two systems will be illustrated and discussed during the Conference.

How to cite: Di Girolamo, P., Franco, N., Di Paolantonio, M., Summa, D., Dionisi, D., Di Bernardino, A., Iannarelli, A. M., and Di Iorio, T.: Several months of continuous operation of two thermodynamic Raman lidars in the frame of WaLiNeAs, EGU General Assembly 2023, Vienna, Austria, 23–28 Apr 2023, EGU23-7775, https://doi.org/10.5194/egusphere-egu23-7775, 2023.

EGU23-8014 | ECS | Posters on site | GI4.2

A compact general-purpose Doppler Lidar for lidar networks 

Jan Froh, Josef Höffner, Alsu Mauer, Thorben Mense, Ronald Eixmann, Gerd Baumgarten, Franz-Josef Lübken, Alexander Munk, Sarah Scheuer, Michael Strotkamp, and Bernd Jungbluth

We present the state of the VAHCOLI (Vertical and Horizontal COverage by Lidar) project for investigating small- to large-scale processes in the atmosphere. In the future, an array of compact lidars with multiple fields of view will allow for measurements of temperatures, winds and aerosols with high temporal and vertical resolution.

Doppler lidars, in particular resonance Doppler lidars, with daylight capability are challenging systems because of the small field of view, spectral filtering and other additional subsystems required compared to observations at night. We developed a universal Doppler lidar platform (~1m3, ~500kg) with all required technologies for automatic operation. The system is capable of studying Mie scattering (aerosols), Rayleigh scattering (air molecules), and resonance fluorescence on free potassium atoms in the middle atmosphere from 5 km to 100 km. Unique spectral methods and narrowband optical components allow precise wind, temperature, and aerosol measurements by studying the Doppler shift and broadening of the scattered signals. The combination of cost-efficient design and fast assembling of such a system allows the construction of a Doppler lidar network with identical units

We will show the latest results and discuss the next scientific and technical steps for network operation and transferring the technology into industry.

How to cite: Froh, J., Höffner, J., Mauer, A., Mense, T., Eixmann, R., Baumgarten, G., Lübken, F.-J., Munk, A., Scheuer, S., Strotkamp, M., and Jungbluth, B.: A compact general-purpose Doppler Lidar for lidar networks, EGU General Assembly 2023, Vienna, Austria, 23–28 Apr 2023, EGU23-8014, https://doi.org/10.5194/egusphere-egu23-8014, 2023.

EGU23-8149 | ECS | Orals | GI4.2

Water vapor retrieval from mini Raman lidar HORUS in the framework of the WaLiNeAs campaign 

Frédéric Laly, Patrick Chazette, Julien Totems, and Jérémy Lagarrigue

The Mediterranean Rim, and more particularly the western Mediterranean area, is one of the most sensitive regions to climate change. The associated environmental changes are already evident through periods of drought and intense rainfall. The predictions of these phenomena are a major societal issue, which led us to use lidar systems to constrain regional modelling. The Raman lidars HORUS-1 and -2 are each composed of two telescopes of 15 cm diameter.  For each telescope N2 and H2O channels are associated. Lidars components have been specifically defined for this task and put into operation during the international Water vapor Lidar Network Assimilation (WaLiNeAs) campaign led by French research teams. Among the three stations managed by the LSCE team, two of them were equipped with HORUS lidar systems at the Port Camargue (43.52 N 4.13 E) and Coursan (43.23 N 3.06 E) sites. The main difference between the two HORUS lidars is the laser used. For HORUS-1 we used an ULTRA laser (optimally pumped by a flash lamp at 30 mJ/20Hz) which showed a good reliability since the beginning of the lidar installation. However, the MERION-C laser (optimally pumped by diodes at 30 mJ/100 Hz) installed in HORUS-2 did not live up to our expectations with several failures, to the point of stopping the measurements in Coursan. We will nevertheless discuss the relative interest of these two lasers in projection of future Raman lidar networks. Observations available from these two lidar systems will be presented and discussed with respect to the meteorological processes encountered during their operating periods.

We give a special acknowledgment to the ANR grant #ANR-20-CE04-0001 for the contribution to the WaLiNeAs program and a special acknowledgment to Meteo France and to the CNRS INSU national LEFE program for their financial contribution for this project. The CEA is acknowledged for the provision of its staff and facilities.

How to cite: Laly, F., Chazette, P., Totems, J., and Lagarrigue, J.: Water vapor retrieval from mini Raman lidar HORUS in the framework of the WaLiNeAs campaign, EGU General Assembly 2023, Vienna, Austria, 23–28 Apr 2023, EGU23-8149, https://doi.org/10.5194/egusphere-egu23-8149, 2023.

Since there are only a very few suitable remote sensing measurements, the thermodynamic field of the atmospheric boundary layer and lower free troposphere is largely still Terra Incognita. To close this gap, we developed an automated thermodynamic profiler based on the Raman lidar technique, the Atmospheric Raman Temperature and Humidity Sounder (ARTHUS) (Lange et al. 2019).

It uses only the ice-safe 355-nm radiation of an injection-seeded Nd:YAG laser as transmitter. The laser power is about 20 W at 200 Hz. The diameter of the receiving telescope is 40 cm. Four receiving channels (elastic, water vapor, two rotational Raman signals) allow for four independently measured parameters: temperature (T), water vapor mixing ratio (WVMR), particle extinction coefficient, and particle backscatter coefficient.

With these data, ARTHUS resolves, e.g., the strength of the inversion layer at the atmospheric boundary layer (ABL) top, elevated lids in the free troposphere, and turbulent fluctuations. Furthermore, in combination with Doppler lidars, sensible and latent heat flux profiles in the convective ABL and thus flux-gradient relationships can be studied (Behrendt et al. 2020). Consequently, ARTHUS can be applied for process studies of land-atmosphere feedback, weather and climate monitoring, model verification, and data assimilation.

Resolutions of the measurements are a few seconds and meters in the lower troposphere. With the data, also the statistical uncertainties of the measured parameters are derived. Continuous operations over long periods were achieved not only at the Land Atmosphere Feedback Observatory (LAFO) at University of Hohenheim but also during several field campaigns elsewhere covering a large variety of atmospheric conditions.

During the EUREC4A field campaign (Stevens et al, 2020), ARTHUS was deployed onboard the research vessel Maria S Merian between 18 January and 18 February 2020 to study ocean-atmosphere interaction. Here, ARTHUS was collocated with two Doppler lidars: one in vertically pointing mode and one in a 6-beam scanning mode.

Between 15 July and 20 September 2021, ARTHUS was deployed at the Lindenberg Observatory of the German Weather Service (DWD). The objective of the campaign was to investigate the long-term stability of ARTHUS by comparisons with four local radiosondes. Indeed, the very high accuracy during day and night were verified.

ARTHUS participated in WaLiNeAs (Water Vapor Lidar Network Assimilation) between 15 September and 10 December 2022. For this campaign, ARTHUS was deployed at the west coast of Corsica. The objective was to implement an integrated prediction tool to enhance the forecast of heavy precipitation events in southern France, primarily demonstrating the benefit of assimilating vertically resolved WVMR lidar data in the new version of the French operational AROME numerical weather prediction system.

At the conference, highlights of ARTHUS’ measurements during WaLiNeAs will be shown.

References:

Behrendt et al. 2020, https://doi.org/10.5194/amt-13-3221-2020

Lange et al. 2019, https://doi.org/10.1029/2019GL085774

Stevens et. al. 2021, https://doi.org/10.5194/essd-2021-18

How to cite: Lange, D., Behrendt, A., and Wulfmeyer, V.: The Atmospheric Raman Temperature and Humidity Sounder: Highlights of Four Years of Automated Measurements of the Atmospheric Boundary Layer and Free Troposphere, EGU General Assembly 2023, Vienna, Austria, 23–28 Apr 2023, EGU23-10606, https://doi.org/10.5194/egusphere-egu23-10606, 2023.

The increasing atmospheric carbon dioxide (CO2) is the most important factor forcing climate change. However, due to lack of observation data about large-scale range-resolved CO2, there remains substantial uncertainty in current global atmospheric CO2 budget, which hinders giving insight into CO2 cycle and modeling its forcing to climate change. Space-based range-resolved differential absorption lidar (range-resolved DIAL), is a promising and powerful means for obtaining large-scale range-resolved CO2 data, but has been rarely studied. Prior to developing spaceborne range-resolved DIAL, a preliminary study on optimization of on/off-line wavelengths must be performed to ensure high signal-to-noise (SNR), high sensitivity to near surface region and minimize the interference of atmospheric factors. This study aims to find the optimum wavelength scenarios in terms of random errors determined by SNR, weighting functions used to assess sensitivity to near-surface region, and systematic errors affected by atmospheric factors. Firstly, we find the optimal on/off-line wavelengths at 1.57μm and 2.05μm, which are widely used and show good results for measuring CO2 concentration, after estimating on-line and off-line wavenumbers separately using evaluation indexes called  and . Furthermore, we get the optimum wavelength scenarios of spaceborne range-resolved DIAL by comparing the random, systematic errors and weighting functions of optimal on-line and off-line wavelengths at 1.57μm and 2.05μm. Results show that the wavelength scenario at 2.05μm is the optimal for spaceborne range-resolved CO2 detection. To satisfy the requirement that the relative random errors are smaller than 0.01 (<1%), systems at 2.05μm wavelength scenario with vertical resolution of 0.5 km, 0.7 km, 0.8 km, 0.9 km separately require that SNR values of on-line wavelength at 0 km height are larger than 10, 9, 8, 7.

How to cite: Hu, L., Yu, Z., Huang, Y., and Ma, R.: Performance Simulation of Spaceborne Range-resolved Differential Absorption Lidar System For CO2 Profile Detection At 1.57μm and 2.05μm Wavelength Scenarios, EGU General Assembly 2023, Vienna, Austria, 23–28 Apr 2023, EGU23-11104, https://doi.org/10.5194/egusphere-egu23-11104, 2023.

Cirrus clouds, forming in the cold upper troposphere, are composed of ice crystals with various sizes and nonspherical shapes. They are observed at all latitudes covering over 30% of the Earth’s surface. Studies reveal that they have a significant impact on the radiation balance of our planet and, consequently, on the climate evolution. The radiative effect of cirrus clouds is strongly determined by the cloud microphysical, thermal, and optical properties. Furthermore, global aviation affects the Earth’s radiation balance by inducing contrails and exerting an indirect effect on the microphysical properties of naturally-formed cirrus clouds. In the last decades, the Arctic surface has been warming faster than other regions of the globe, which is known as Arctic Amplification. The thin and small-coverage cirrus clouds over the Arctic are presumed to largely contribute to it. Unfortunately, however, the optical and microphysical properties of cirrus clouds over the Arctic and the exact role they play in the elevated warming of the Arctic are far from understanding. Compared with the intensive studies of cirrus clouds in the tropics and midlatitude regions, cirrus cloud measurements and model studies at high latitudes are sparse. In this study, we present the comparisons of the particle linear depolarization ratio (PLDR) and occurrence rates of cirrus clouds at midlatitudes (35–60 oN; 30 oW–30 oE) and high latitudes (60–80 oN; 30 oW–30 oE) based on the analysis of lidar measurements of CALIPSO in the years 2018–2021. The results show that cirrus clouds at high latitudes appear at lower altitudes than the midlatitude cirrus clouds. The PLDR and occurrence rates of cirrus clouds at high latitudes are smaller than the midlatitude cirrus clouds. Furthermore, air traffic over Europe was significantly reduced in 2020 (starting from March) and only moderately reduced in 2021 due to the COVID-19 pandemic. Under this condition we are able to study the difference in the aviation impacts on the cirrus cloud properties at high latitudes and midlatitudes.

How to cite: Li, Q. and Groß, S.: CALIPSO observations of cirrus cloud properties: investigation of latitude differences and possible aviation impacts, EGU General Assembly 2023, Vienna, Austria, 23–28 Apr 2023, EGU23-11893, https://doi.org/10.5194/egusphere-egu23-11893, 2023.

EGU23-12585 | Posters on site | GI4.2

Investigation of 2021 summer wildfires in the Eastern Mediterranean: The ERATOSTHENES Centre of Excellence capabilities for atmospheric studies 

Rodanthi-Elisavet Mamouri, Dragos Ene, Holger Baars, Ronny Engelmann, Argyro Nisantzi, Maria Prodromou, Diofantos Hadjimitsis, and Albert Ansmann

In the summer of 2021, several wildfires were reported in the south of Turkey, fires that are considered one of the worst in the history of Turkey. Due to atmospheric conditions, the smoke plume travelled south between 27 July to 5 August 2021, and smoke layers arrived above Cyprus. 

In this work, the capabilities of the newly established ERATOSTHENES Centre of Excellence (CoE), to study large-scale atmospheric events is presented. The study is based on the synergistic use of different datasets of remote sensing techniques both from ground and space. The EARLINET multiwavelength-Raman-polarization lidar PollyXT-CYP hosted by the ERATOSTHENES CoE is continuously running since October 2020 in Limassol, and during summer 2021, the lidar observed smoke plumes from these extreme wildfires on the south coast of Turkey.  

The PollyXT-CYP is a key research infrastructure of the Cyprus Atmospheric Remote Sensing Observatory (CARO) of the ERATOSTHENES CoE established through the EXCELSIOR H2020 EU Teaming project coordinated by the Cyprus University of Technology. CARO will consist of two high-tech containers housing the PollyXT-CYP lidar and state-of-the art doppler lidar, cloud radar and radiometric equipment which will be used to measure the air quality, the dust transport, and the cloud properties over Cyprus. The CARO is a planning National Facility of the Republic of Cyprus for Aerosol and Cloud Remote Sensing Observations.

Land cover information which shows the type of burned vegetation is used together with satellite products to capture additionally the burned area and to investigate the carbon monoxide of the smoke plume. The study is focusing on the optical characteristics of the plume, as it was detected by the PollyXT-CYP lidar at Limassol. An intense fresh smoke layer was detected on 28-29 July 2021, at an altitude between 2.5 to 4.0 km, having a volume depolarization ratio of ~15% at 355n and ~20% at 532nm, and lidar ratio of 75-80sr at 355nm and 65-70sr at 532nm.


Acknowledgements

The authors acknowledge the ‘EXCELSIOR’: ERATOSTHENES: EΧcellence Research Centre for Earth Surveillance and Space-Based Monitoring of the Environment H2020 Widespread Teaming project (www.excelsior2020.eu). The ‘EXCELSIOR’ project has received funding from the European Union’s Horizon 2020 research and innovation programme under Grant Agreement No 857510, from the Government of the Republic of Cyprus through the Directorate General for the European Programmes, Coordination and Development and the Cyprus University of Technology. The PollyXT-CYP was funded by the German Federal Ministry of Education and Research (BMBF) via the PoLiCyTa project (grant no. 01LK1603A). The study is supported by “ACCEPT” project (Prot. No: LOCALDEV-0008) co-financed by the Financial Mechanism of Norway (85%) and the Republic of Cyprus (15%) in the framework of the programming period 2014 - 2021.

How to cite: Mamouri, R.-E., Ene, D., Baars, H., Engelmann, R., Nisantzi, A., Prodromou, M., Hadjimitsis, D., and Ansmann, A.: Investigation of 2021 summer wildfires in the Eastern Mediterranean: The ERATOSTHENES Centre of Excellence capabilities for atmospheric studies, EGU General Assembly 2023, Vienna, Austria, 23–28 Apr 2023, EGU23-12585, https://doi.org/10.5194/egusphere-egu23-12585, 2023.

A newly available Raman lidar (Purple Pulse Lidar Systems) for vertical profiling of atmospheric water vapor, temperature and aerosols was evaluated during the TEAMx pre-campaign (TEAMx-PC22) in summer 2022 in the Inn Valley (Austria). TEAMx (Multi-scale transport and exchange processes in the atmosphere over mountains – programme and experiment) is an international research program addressing exchange processes in the atmosphere over mountains and their parametrization in numerical weather models and climate models. Prior to the multi disciplinary measurement campaign, planned in 2024/2025, the pre-campaign 2022 was rather performed for testing (new) instruments and measurement sites and finding synergies between certain devices.

The Raman lidar system is capable of profiling water vapor and temperature throughout the entire planetary boundary layer (typically 3 km to 4 km agl. on summer days) continuously with a basic temporal resolution of 10 s and a reasonable vertical resolution of 30 m to 100 m. Depending on conditions and temporal averaging, water vapor profiles could even be obtained up to ~7.5 km agl. during nighttime. The lidar system was located at the University of Innsbruck (downtown). It was operated side by side with a vertically staring Doppler wind lidar and a nearby (50 m) scanning Doppler wind lidar on the rooftop of the university building, which provide vertical profiles of the vertical wind component at a 1-s interval and vertical profiles of the three-dimensional wind vector at a 10-min interval, respectively. During the measurement period (Aug 2022 to Sep 2022), operational radiosondes were launched in close proximity, at Innsbruck Airport, roughly 3 km to the west of the lidar site. In addition to the daily ascent at 2 UTC, radiosondes were launched at about 8, 14 and 20 UTC on selected days with potentially complex meteorological conditions. We present a first assessment of the Raman lidar measurements through comparisons with the radiosonde data. Together with data from the wind lidars, we also present an interpretation for significant meteorological situations and events, such as foehn, a passing front, a thunderstorm and the formation of a convective boundary layer during a warm period.

How to cite: Vogelmann, H., Federer, M., Speidel, J., and Gohm, A.: Assessing the performance of a Combined Water Vapor / Temperature / Aerosol Raman Lidar within the TEAMx pre-campaign in the Inn Valley (Innsbruck, Austria) during Summer 2022, EGU General Assembly 2023, Vienna, Austria, 23–28 Apr 2023, EGU23-13101, https://doi.org/10.5194/egusphere-egu23-13101, 2023.

EGU23-13218 | ECS | Orals | GI4.2

ARC and ATLAS: CARS software tools for the data analysis and quality assurance of lidar measurements performed within ACTRIS 

Nikolaos Siomos, Ioannis Binietoglou, Peristera Paschou, Mariana Adam, Giuseppe D'Amico, Benedikt Gast, Moritz Haarig, and Volker Freudenthaler

We present newly developed software for the data analysis and quality assurance of lidar systems operated in the ACTRIS (Aerosol Clouds and Trace Gases Research Infrastructure) research infrastructure. The software development is coordinated by the Meteorological Institute of Munich (MIM), which operates as one of the central facilities of the Center of Aerosol Remote Sensing (CARS) of ACTRIS. In the frame of ACTRIS, a large number of national facilities (NF) are operating lidar systems for aerosol remote sensing. In order to ensure homogeneously high data quality, CARS is developing appropriate common software tools to assist data processing, system intercomparison, and routine quality assurance of lidar data. Here, we present two such software tools, developed and tested using the long experience of the EARLINET (European Aerosol Research Lidar Network) community.

The ARC (Algorithm for Rayleigh Calculations) has been designed to calculate the cross-section and depolarization ratio of molecular back-scattering. The effect of Rotational Raman (RR) scattering is included line-by-line in ARC considering especially the partial blocking of the RR spectrum due to transmission through narrow-band interference filters. The algorithm supports calculation in variable meteorological conditions for an atmosphere that consists of up to five major gas components (N2, O2, CO2, Ar, H2O). Such a tool is needed in order to properly take into account the effect of air temperature in the molecular depolarization ratio measured by the NF lidar systems. It is also crucial for designing lidars that rely on RR scattering such as temperature and RR aerosol lidars and can even be applied for the algorithmic correction of unwanted effects introduced by the interference filter in such systems.

The second software package developed by CARS-MIM is ATLAS (AuTomated Lidar Analysis Software). It has been designed for the operational analysis of the quality assurance tests that should be regularly performed and submitted to CARS by the NF for the ACTRIS labeling process. ATLAS currently supports the analysis of all main CARS test procedures, that is, the Rayleigh fit, the Telecover, and the Polarization Calibration. It can also be used to directly compare signals from two lidar systems; It has already been applied in the first intercomparison campaign of CARS reference systems, organized in September 2022 in Magurele, Romania. The software takes raw lidar data as input so the user can detect otherwise-hidden issues in the preprocessing steps. At the time of writing, ATLAS is compatible with all ACTRIS lidar systems. Future updates will include automated syncing of the system metadata from the handbook of instruments of the network, currently hosted by the Single Calculus Chain (SCC), and a graphical user interface that will facilitate its adoption by the NF users. Both software packages are written in python and are open-source projects.

How to cite: Siomos, N., Binietoglou, I., Paschou, P., Adam, M., D'Amico, G., Gast, B., Haarig, M., and Freudenthaler, V.: ARC and ATLAS: CARS software tools for the data analysis and quality assurance of lidar measurements performed within ACTRIS, EGU General Assembly 2023, Vienna, Austria, 23–28 Apr 2023, EGU23-13218, https://doi.org/10.5194/egusphere-egu23-13218, 2023.

EGU23-13416 | Orals | GI4.2

Merging clouds retrieved from ALADIN/Aeolus and CALIOP/CALIPSO spaceborne lidars 

Artem Feofilov, Hélène Chepfer, and Vincent Noël

Clouds play an important role for the energy budget of Earth. But, when it comes to predicting the climate's future, their behavior in response to climate change is a major source of uncertainty. To understand and accurately predict the Earth's energy budget and climate, it is necessary to have a thorough understanding of the cloud variability, including their vertical distribution and optical properties.

Satellite observations have been able to provide ongoing monitoring of clouds all around the globe. Among them, active sounders hold a special place thanks to their capability of measuring the vertical position of the cloud with an accuracy of about 100 meters and with a typical horizontal sampling on the order of hundreds of meters. However, clouds retrieved from two spaceborne lidars are different, because the instruments use different wavelengths, pulse energies, pulse repetition frequencies, telescopes, and detectors. In addition, they do not overpass the atmosphere at the same local time.

In this work, we discuss the approach to merging the clouds retrieved from the space-borne lidar ALADIN/Aeolus, which has been orbiting the Earth since August 2018 and operating at 355nm wavelength with the clouds measured since 2006 by CALIPSO lidar, which operates at 532nm.

We demonstrate how to compensate for the existing instrumental differences to get an almost comparable cloud dataset and we discuss the importance of the aforementioned differences between the instruments. The method developed in this study sets the path for adding future lidars (e.g. ATLID/EarthCare) to the global climate lidar cloud record.

How to cite: Feofilov, A., Chepfer, H., and Noël, V.: Merging clouds retrieved from ALADIN/Aeolus and CALIOP/CALIPSO spaceborne lidars, EGU General Assembly 2023, Vienna, Austria, 23–28 Apr 2023, EGU23-13416, https://doi.org/10.5194/egusphere-egu23-13416, 2023.

EGU23-13419 | ECS | Orals | GI4.2

Columnar heating rate and  radiative effects of dust aerosols using 20 years of lidar observations. 

Benedetto De Rosa, Lucia Mona, Simone Lolli, Aldo Amodeo, and Michalis Mytilinaios

The uncertainties of the Earth-atmosphere energy budget are associated with a poor understanding of direct and indirect aerosol effects. Dust is a mixture of different minerals, and its chemical and microphysical properties change during transport. Therefore, the influence of dust aerosols on radiative effects is characterized by great uncertainty. Due to meteorological atmospheric patterns, aerosol intrusions are very frequent in the Mediterranean, which is a climatic hot spot and where climate change is much stronger than in other parts of the world. In this study, we analyzed and assessed long-term trends of the surface and columnar heating rate and the radiative effects of dust aerosols using lidar observations. These measurements were taken in the framework of the European Aerosol Research Lidar Network (EARLINET) at Istituto di Metodologie per l'Analisi Ambientale (IMAA) with the Raman/elastic lidar MUSA (40°36′N, 15°44′E). The radiative transfer model Fu–Liou–Gu (FLG) was used to solve aerosol (no clouds) radiative fluxes, with aerosol extinction coefficient profiles from lidar observations as input data. All the cases of dust intrusion that occurred in the last twenty years were selected to understand how they affected the Earth-atmosphere radiative budget, both at the surface and at the top-of-the-atmosphere. In the future, these studies will be important for improving the accuracy of climate predictions.

How to cite: De Rosa, B., Mona, L., Lolli, S., Amodeo, A., and Mytilinaios, M.: Columnar heating rate and  radiative effects of dust aerosols using 20 years of lidar observations., EGU General Assembly 2023, Vienna, Austria, 23–28 Apr 2023, EGU23-13419, https://doi.org/10.5194/egusphere-egu23-13419, 2023.

EGU23-13643 | ECS | Orals | GI4.2

Is your aerosol backscatter retrieval afflicted by a sign error? 

Johannes Speidel and Hannes Vogelmann

Precise knowledge about the prevailing aerosol content in the atmosphere is very important for several reasons, as aerosols are involved in multiple important processes that not only have a direct impact on air quality, but also influence cloud formation and the earth's radiation budget. Besides that, continuous aerosol observations provide valuable information on atmospheric transport dynamics.
Aerosol backscatter coefficient measurements with elastic backscatter lidars are conducted since multiple decades [1], while the implemented retrieval algorithms predominantly refer to the seminal publications by Klett 1985, Fernald 1984 and Sasano 1985 [2,3,4]. The respective inversion algorithm is often simply called the 'Klett inversion', being a main reason why this algorithm is most often adapted. While more sophisticated aerosol lidars (e.g. Raman lidars, HSRL, ...) have been developed since, simple elastic backscatter lidar measurements are still very frequently conducted as they are technically easy to implement, often as a byproduct. In most cases, the corresponding retrieval algorithms still refer to the 'Klett inversion'.
Unfortunately, the inversion algorithm by Klett 1985 is afflicted by a sign error. In his publication, the sign error is hidden within a substitute, making it very hard to be recognized, representing a major pitfall. A comprehensive literature review revealed, that large parts of the aerosol lidar community are aware of this problem and have tacitly corrected it or, to a much smaller amount, even referred to an erratum which was published by Kaestner in 1986 [5].
However, at the same time and up to this date, a considerable error propagation can be found in literature as well, using and referring to the incorrect algorithm with the sign error included.
Therefore, we want to renew the awareness towards this sign error and show a corrected and slightly improved Klett inversion algorithm. In addition, we present the overall implication resulting from the uncorrected inversion algorithm by using exemplary case studies. Depending on the lidar location and prevailing atmospheric conditions, potential errors reach from marginal to major, often preventing error detection solely based on the magnitude of the calculated results. Simple a posteriori corrections are not possible, as the error magnitude depends on multiple factors.

[1] T. Trickl, H. Giehl, H. Jäger, and H. Vogelmann. 35 yr of stratospheric aerosol measurements at Garmisch-Partenkirchen: From Fuego to Eyjafjalla-   jökull, and beyond. Atmospheric Chemistry and Physics, 13(10):5205–5225, 2013.
[2] James D. Klett. Lidar inversion with variable backscatter/extinction ratios. Appl. Opt., 24(11):1638–1643, June 1985.
[3] Frederick G. Fernald. Analysis of atmospheric lidar observations: Some comments. Appl. Opt., 1984.
[4] Yasuhiro Sasano, Edward V. Browell, and Syed Ismail. Error caused by using a constant extinction/backscattering ratio in the lidar solution. Appl. Opt., 24(22):3929–3932, November 1985.
[5] Martina Kaestner. Lidar inversion with variable backscatter/extinction ratios: Comment. Applied Optics, 25(6):833–835, March 1986.

How to cite: Speidel, J. and Vogelmann, H.: Is your aerosol backscatter retrieval afflicted by a sign error?, EGU General Assembly 2023, Vienna, Austria, 23–28 Apr 2023, EGU23-13643, https://doi.org/10.5194/egusphere-egu23-13643, 2023.

EGU23-13823 | ECS | Posters on site | GI4.2

Development of a Carbon Dioxide Raman Lidar 

Moritz Schumacher, Andreas Behrendt, Diego Lange, and Volker Wulfmeyer

Carbon dioxide (CO2) is one of the most important greenhouse gases and therefore its detailed measurement is of high interest. As the concentration varies significantly with altitude and time, it is desirable to be able to measure vertical CO2 profiles with high temporal resolution. Profiles of high resolution will improve our understanding of atmospheric systems and the impact of the local environment, e.g., due to natural and anthropogenic sources and sinks. The use of these data in data assimilation provides the potential of improving climate models.

For water vapor and temperature the Atmospheric Raman Temperature and Humidity Sounder (ARTHUS) system has proven to be able to provide profiles with high resolution (10-60 s in time and 7.5-100 m vertically) and accuracy in the lower troposphere. Now this successful system will be expanded with a CO2 Raman channel, which is currently in development. After successful integration it will be possible to simultaneously measure CO2, water vapor and temperature profiles. Challenges are the weak signal of the backscattered light due to the low concentration and the small Raman backscatter cross section of CO2.

Further information on the CO2 Raman lidar will be given at the conference.

How to cite: Schumacher, M., Behrendt, A., Lange, D., and Wulfmeyer, V.: Development of a Carbon Dioxide Raman Lidar, EGU General Assembly 2023, Vienna, Austria, 23–28 Apr 2023, EGU23-13823, https://doi.org/10.5194/egusphere-egu23-13823, 2023.

Extreme heavy precipitation events (HPEs) pose a threat to human life but, despite regular improvement, remain difficult to predict because of the lack of adequate high frequency and high-resolution water vapor (WV) observations in the low troposphere (below 3 km). To fill this observational gap, The Water vapor Lidar Network Assimilation (WaLiNeAs) initiative aims at implementing an integrated prediction tool (IPT), coupling network measurements of WV profiles, and a numerical weather prediction system to try to improve the  forecasts of  the amount, timing, and location of rainfall associated with HPEs in southern France (struck by ~ 7 HPEs per year on average during the fall).

In the fall/winter of 2022-2023, a network of 6 mobile Raman WV lidars was specifically implemented in Southern France (Aude, Gard, Var and Bouche du Rhone) and in Corsica. The network was complemented by 2 fixed Raman WV lidars in Barcelona and Valencia with the aim to provide measurements with high vertical resolution and accuracy to be assimilated in the French Application of Research to Operations at Mesoscale (AROME-France) model, using a four-dimensional ensemble-variational approach with 15-min updates in addition to the observations operationally assimilated (radar, satellites, …). This innovative IPT is expected to enhance the model capability for kilometer-scale prediction of HPEs over southern France up to 48 h in advance.

The field campaign was conducted from October of 2022 to January 2023, to cover the period most propitious to heavy precipitation events in southern France. A consortium of French, German, Italian, and Spanish research groups operated the Raman WV lidar network

In this presentation, we will provide an overview of the precipitation events in southern France during the WaLiNeAs campaign, as well as an outline of the operations period of the different Raman WV lidars and the lidar data monitoring procedure implemented during the experiment. We will highlight the cases of interest and provide an outlook at next steps towards lidar data assimilation in AROME.

How to cite: Flamant, C. and the WaLiNeAs Team: A network of water vapor Raman lidars for improving heavy precipitation forecasting in southern France: introducing the WaLiNeAs initiative and first highlights from the 2022 field campaign, EGU General Assembly 2023, Vienna, Austria, 23–28 Apr 2023, EGU23-14747, https://doi.org/10.5194/egusphere-egu23-14747, 2023.

Each year, during both boreal winter and summer, large amounts of Saharan mineral dust particles get carried westwards over the Atlantic Ocean towards the Caribbean. During their transport, Saharan dust particles can affect the Earth’s radiation budget in different ways. They can either directly scatter, absorb and emit radiation or have an indirect effect by modifying cloud properties through their interactions as cloud condensation nuclei or ice nucleating particles. While during the summer months – the peak season of transatlantic mineral dust transport – the particles are mostly advected in elevated Saharan Air Layers at altitudes of up to 6 km and at latitudes around 15°N, wintertime transport takes place at lower atmospheric levels (<3 km altitude) and lower latitudes. Our recent studies have shown that, during both boreal winter and summer, transported Saharan dust layers are characterized by enhanced concentrations of water vapor compared to the surrounding atmosphere. In this way the dust layers have to potential to modify the radiation budget not only through particle-radiation-interactions, but also through the absorption and emission of radiation by water vapor. This in turn may affect the atmospheric stability and stratification in and around the aerosol layers.

In this study, the turbulent structure as well as the atmospheric stability in and around transported Saharan mineral dust is analyzed and possible differences between summer and wintertime are investigated. Therefore, measurements by both the water vapor and aerosol lidar WALES as well as by dropsondes are studied. They were collected upstream the Caribbean island of Barbados aboard the German research aircraft HALO (High Altitude and Long Range). To identify possible seasonal differences, not only data collected in boreal summer in the framework of the NARVAL-II campaign (August 2016), but also data collected in winter during the EUREC4A research campaign (January & February 2020) are analyzed. During both campaigns several research flights were designed to lead over long-range-transported Saharan mineral dust, thus allowing and in-depth investigation of their properties. The analysis shows that dust layers are highly turbulent and therefore help dust particles to stay airborne for a longer time. Additionally, the dust layers modify the atmospheric stability in a way that the evolution of marine clouds can be affected.

In our presentation, we will give an overview of the performed measurements over long-range-transported Saharan dust layers and present the conducted analyses on atmospheric stability and turbulence from dropsonde measurements and calculated power spectra from lidar data.

How to cite: Gutleben, M. and Groß, S.: Atmospheric turbulence and stability in and around long-range-transported Saharan dust layers as observed by airborne lidar and dropsondes, EGU General Assembly 2023, Vienna, Austria, 23–28 Apr 2023, EGU23-15538, https://doi.org/10.5194/egusphere-egu23-15538, 2023.

EGU23-15605 | Posters on site | GI4.2

How good are temperature and humidity measurements with lidar? 

Andreas Behrendt, Diego Lange, and Volker Wulfmeyer

In this contribution, we will discuss the performance of state-of-the-art automatic temperature and humidity lidar (e.g., Wulfmeyer and Behrendt 2022). As example, we will investigate ARTHUS (Lange et al., 2019), a lidar system developed at University of Hohenheim. This automatic mobile instrument participated in recent years in a number of field campaigns.

ARTHUS technical configuration is the following: A strong diode-pumped Nd:YAG laser is used as transmitter. It produces 200 Hz laser pulses with up to 20 W average power at 355 nm. Only this UV light is sent after beam expansion into the atmosphere so that the system remains eye safe. The atmospheric backscatter signals are collected with a 40 cm telescope. A polychromator extracts the elastic backscatter signal and three inelastic signals, namely the vibrational Raman signal of water vapor, and two pure rotational Raman signals. The detection resolution of these backscatter signals are 1 to 10 s and 3.75 to 7.5 m. All four signals are simultaneously analyzed and stored in both photon-counting (PC) mode and voltage (so-called “analog” mode) in order to make optimum use of the large intensity range of the backscatter signals covering several orders of magnitude.

From these eight primary signals measured by ARTHUS, four independent atmospheric parameters are calculated merging the PC and analog signals: temperature, water vapor mixing ratio, particle backscatter coefficient, and particle extinction coefficient. The temporal resolution of these data is also 1 to 10 s, allowing studies of boundary layer turbulence (Behrendt et al, 2015) and - in combination with a vertical pointing Doppler lidar - sensible and latent heat fluxes (Behrendt et al, 2020).

From the measured number of photon counts in each range bin, the statistical uncertainty of the measured data due to so-called shot-noise can directly be calculated. This value, however, while determining the major part of the uncertainty, does not cover the total uncertainty because additional noise of the analog signals is not included. So the shot-noise uncertainty alone underestimates the uncertainties in the near range where the analog data is used. To solve with this problem, higher-order analyses of the turbulent fluctuations can be performed which allow to determine the total statistical uncertainty of the measurements (Behrendt et al, 2020).

Finally, to investigate the stability of the calibration and thus the accuracy of the measured data, we decided to compare averaged ARTHUS data with local radiosondes. In order to cope with the unavoidable sampling of different air masses between these different instruments, we are investigating the average of a larger number of profiles.  We found that the performance of the measured data of ARTHUS reaches even the stringent requirements of WMO.

The results will be presented at the conference.


References:

Behrendt et al. 2015, https://doi.org/10.5194/acp-15-5485-2015

Behrendt et al. 2020, https://doi.org/10.5194/amt-13-3221-2020

Lange et al. 2019, https://doi.org/10.1029/2019GL085774

Wulfmeyer and Behrendt 2022, https://doi.org/10.1007/978-3-030-52171-4_25

How to cite: Behrendt, A., Lange, D., and Wulfmeyer, V.: How good are temperature and humidity measurements with lidar?, EGU General Assembly 2023, Vienna, Austria, 23–28 Apr 2023, EGU23-15605, https://doi.org/10.5194/egusphere-egu23-15605, 2023.

EGU23-15696 | Posters on site | GI4.2

A new filtering approach for multiple Doppler Lidar setups 

Kevin Wolz, Christopher Holst, Frank Beyrich, and Matthias Mauder

We compare the wind measurements of a virtual tower triple Doppler Lidar setup to those of a sonic anemometer located at a height of 90 m above ground on an instrumented tower and with those of a single Doppler Lidar. The instruments were set up at the boundary-layer field site of the German Meteorological Service (DWD) in July and August of 2020 during the FESST@MOL (Field Experiment on sub-mesoscale spatio-temporal variability at the Meteorological Observatory Lindenberg) 2020 campaign.  The triple Lidar setup was operated in a stare and in a step/stare mode at six heights between 90 and 500 m above ground, while the single Lidar was operated in a continuous scan Velocity-Azimuth-Display (VAD) mode with an azimuthal resolution of around 1.5 ° and a zenith angle of 55.5 °. Overall, both Lidar methods showed a good agreement for the whole study period for different averaging times and scan modes compared to the sonic anemometer. Additionally, we developed and show a new filtering approach based on a Median Absolute Deviation (MAD) filter for the virtual tower setup and compare it to a filtering approach based on a signal-to-noise ratio SNR threshold. The advantage of the MAD filter is that it is not based on a strict threshold but on the MAD of each 30-second period and can, therefore, better adapt to changing atmospheric conditions. In the comparison the MAD filter leads to a greater data availability while upholding similar comparability and bias values between the triple Lidar and sonic anemometer setups. Our results also show that a single Doppler Lidar is a viable method for measuring wind speed and direction with only small disadvantages, at least for measurement heights similar to our investigation and for comparable heterogeneous but flat landscapes.

How to cite: Wolz, K., Holst, C., Beyrich, F., and Mauder, M.: A new filtering approach for multiple Doppler Lidar setups, EGU General Assembly 2023, Vienna, Austria, 23–28 Apr 2023, EGU23-15696, https://doi.org/10.5194/egusphere-egu23-15696, 2023.

EGU23-15942 | ECS | Posters on site | GI4.2

Study of the Atmospheric Boundary Layer and Land-Atmosphere Interaction with Lidars 

Syed Abbas, Andreas Behrendt, Florian Späth, Diego Lange, Osama Alnayef, and Volker Wulfmeyer

Investigating the dynamics of the atmospheric boundary layer (ABL) is essential for studies of air quality, the energy and water cycles and for the improvement of weather and climate models. During daytime in convective conditions, the convective boundary layer (CBL) is formed. Here, we present our approach of how to continuously study CBL characteristics with an improved algorithm including fuzzy logic. The Land-Atmosphere Feedback Observatory (LAFO) of University of Hohenheim consists of two Doppler lidars, a Doppler Cloud Radar, the Atmospheric Raman Temperature and Humidity Sounder (ARTHUS), and Eddy covariance stations. These are excellent tools for observing high resolution atmospheric wind profiles, clouds and precipitation events, as well as thermodynamic profiles and surface fluxes. The data are collected at LAFO by operating continuously two Doppler lidars, one in vertical and one in six-beam scanning mode, to obtain vertical and horizontal wind profiles. Both Doppler lidars are operated with resolutions of 1 s and 30 m. The six-beam staring Doppler lidar is used for obtaining time series of turbulent kinetic energy (TKE), momentum flux, TKE dissipation rate and horizontal wind profiles statistics. The vertically staring Doppler lidar is used to compute statistics of higher-order moments of vertical wind fluctuations, the CBL height, and cloud base height. With these data, the land-atmosphere coupling processes and the associated nonlinear feedbacks are investigated as well as their impact on the turbulent structure of the CBL.

We will present analyses of two three-month periods covering different weather conditions: 1 May to 31 July 2021 and 2022.

How to cite: Abbas, S., Behrendt, A., Späth, F., Lange, D., Alnayef, O., and Wulfmeyer, V.: Study of the Atmospheric Boundary Layer and Land-Atmosphere Interaction with Lidars, EGU General Assembly 2023, Vienna, Austria, 23–28 Apr 2023, EGU23-15942, https://doi.org/10.5194/egusphere-egu23-15942, 2023.

EGU23-16149 | ECS | Orals | GI4.2

Performance Simulation and Preliminary Measurements of a Raman Lidar for the Retrieval of CO2 Atmospheric Profiles 

Marco Di Paolantonio, Paolo Di Girolamo, Davide Dionisi, Annalisa Di Bernardino, Tatiana Di Iorio, Noemi Franco, Giovanni Giuliano, Anna Maria Iannarelli, Gian Luigi Liberti, and Donato Summa

Within the frame of the project CONCERNING (COmpact RamaN lidar for Atmospheric CO2 and ThERmodyNamic ProfilING), we investigated the feasibility and the limits of a ground-based Raman lidar system dedicated to the measurement of CO2 profiles. The performance of the lidar system was evaluated through a set of numerical simulations. The possibility of exploiting both CO2 Raman lines of the ν1:2ν2 resonance was explored. An accurate quantification of the contribution of the Raman O2 lines on the signal and other (e.g., aerosol, absorbing gases) disturbance sources was carried out. The signal integration over the vertical and over time required to reach a useful signal to noise ratio both in day-time and night-time needed for a quantitative analysis of carbon dioxide sources and sinks was evaluated. The above objectives were obtained developing an instrument simulator software consisting of a radiative transfer model able to simulate, in a spectrally resolved manner, all laser light interaction mechanisms with atmospheric constituents, a consistent background signal, and all the devices present in the considered Raman lidar experimental setup. The results indicate that the simulated lidar system, provided to have a low overlap height, could perform measurements on the low troposphere (<1 km) gradients (1-5 ppm) with sufficient precision both in day-time and night-time with an integration time of 1-3 h and a vertical resolution of 75 m. The selected Raman lidar setup is currently being tested and we aim to present preliminary results during the conference.

How to cite: Di Paolantonio, M., Di Girolamo, P., Dionisi, D., Di Bernardino, A., Di Iorio, T., Franco, N., Giuliano, G., Iannarelli, A. M., Liberti, G. L., and Summa, D.: Performance Simulation and Preliminary Measurements of a Raman Lidar for the Retrieval of CO2 Atmospheric Profiles, EGU General Assembly 2023, Vienna, Austria, 23–28 Apr 2023, EGU23-16149, https://doi.org/10.5194/egusphere-egu23-16149, 2023.

EGU23-16192 | ECS | Posters on site | GI4.2

Investigation of Boundary Layer Aerosol Processes with Turbulence-Resolving Lidar 

Osama Alnayef, Andreas Behrendt, Diego Lange, Florian Späth, Volker Wulfmeyer, and Syed Abbas

Our research focuses on the vertical transport of aerosol particles, and the properties of these aerosol particles in dependence on relative humidity. For this, we use the synergy of Raman and Doppler lidar systems operated during the Land-Atmosphere Feedback Experiment (LAFE) (see https://www.arm.gov/research/campaigns/sgp2017lafe).

We will present our first results of investigating the aerosol flux. For this, we use the aerosols backscatter coefficient and vertical wind velocity collected with Raman lidar and Doppler lidar.

The LAFE project was executed at the Southern Great Plains (SGP) site of the Atmospheric Radiation Measurement (ARM) program in August 2017 in the USA.  In addition, data collected at the Land-Atmosphere Feedback Observatory (LAFO) at the University of Hohenheim, Germany is used. Results of the combined aerosol backscatter measurements with water-vapor and temperature lidar measurements to detail insights into the relative humidity dependencies on the growth of aerosols.

How to cite: Alnayef, O., Behrendt, A., Lange, D., Späth, F., Wulfmeyer, V., and Abbas, S.: Investigation of Boundary Layer Aerosol Processes with Turbulence-Resolving Lidar, EGU General Assembly 2023, Vienna, Austria, 23–28 Apr 2023, EGU23-16192, https://doi.org/10.5194/egusphere-egu23-16192, 2023.

EGU23-16695 | ECS | Orals | GI4.2

Preliminary Studies and Performance Simulations in support of the mission “CALIGOLA” 

Noemi Franco, Paolo Di Girolamo, Donato Summa, Marco Di Paolantonio, and Davide Dionisi

CALIGOLA (Cloud Aerosol Lidar for Global Scale Observations of the Ocean-Land-Atmosphere System) is a mission funded by the Italian Space Agency (ASI), aimed at the development of a space-borne Raman Lidar. A Phase A study to assess the technological feasibility of the laser source and receiver system is currently underway at the Leonardo S.p.A., while scientific studies in support of the mission are conducted by the University of Basilicata. Scientific and technical studies are furthermore supported by other Italian institutions (CNR-ISMAR, CNR-IMAA), with NASA also having expressed an interest in contributing to the mission .

Mission objectives include the observation of the Earth atmosphere, surface (ocean and land). Among the atmospheric objectives, the characterization of the global scale distribution of natural and anthropogenic aerosols, their radiative properties and interactions with clouds, and the measurements of ocean color, suspended particulate matter and marine chlorophyll.

The expected performance of CALIGOLA has been assessed based on the application of an end-to-end lidar simulator. Specifically, sensitivity studies have been carried out to define the technical specifications for the laser source, the telescope, the optics of transceiver, the detectors and the acquisition system. Simulations reveal that the system can measure Rotational Raman echoes from nitrogen and oxygen molecules stimulated at the three lengths wavelength of 355, 532 and 1064 nm. Simulations also reveal that elastic signals are strong enough to meet the requirements under different environmental conditions. As reference signal, several options have been considered. Among others, a temperature-insensitive rotational Raman signal including rotational lines from nitrogen and oxygen molecules.

A careful analysis of different potential orbits is ongoing, with the goal to identify solutions which maximize performance and scientific impact of both atmospheric and oceanic measurements. Near noon-midnight equatorial crossing times are preferable on the ocean side for diel vertical migration and phytoplankton observations, but degrade significantly the performances of atmospheric measurements due to the high solar background. For this reason is essential to find an orbit in which the solar contribution is low enough to obtain acceptable atmospheric results and at the same time the oceanic measurements are far enough from the night-day transitions for as many days a year as possible to assure correct interpretation of phytoplankton physiology. To counterbalance the degraded signal performances also lower obit height are considered, as well as the use of polarized filters to reduce the amount of solar radiation. The estimated performances under different conditions and considering different orbits will be showed during the presentation.

How to cite: Franco, N., Di Girolamo, P., Summa, D., Di Paolantonio, M., and Dionisi, D.: Preliminary Studies and Performance Simulations in support of the mission “CALIGOLA”, EGU General Assembly 2023, Vienna, Austria, 23–28 Apr 2023, EGU23-16695, https://doi.org/10.5194/egusphere-egu23-16695, 2023.

Geomorphological mapping is one of the primary research methods used to collect data on glacial landforms and reconstruct glaciological processes. The most common approach is a combination of field-based and remote mapping using data obtained from various sensors. However, one of the crucial methodical problems is collecting remote sensing data in the appropriate spatial resolution for the analyzed landform, which directly affects the data collection time and costs. This study aims to find the optimal resolution of digital elevation models (DEMs) to map subtle glacial landforms: kame terraces, eskers, flutes, and push moraine. Such landforms contain valuable information about the glacial process–form relationships, however, are often too subtle to be recognized on satellite data, and therefore more detailed data (e.g., UAV-based) are required. By “optimal”, we mean the resolution high enough to enable recognition of the landforms mentioned above, and at the same time, as low as possible to minimize the time spent on data collection during the fieldwork.

To find out the optimal resolution, we used detailed (0.02 – 0.04 m ground sampling distance [GSD]) DEMs of the glacier forelands in Iceland (Kvíárjökull, Fjallsjökull and Svinafellsjökull), created based high-resolution images from an unmanned aerial vehicle (UAV). The DEMs were resampled to 0.05, 0.10, 0.15, 0.20, 0.30, 0.40, 0.50, 1.00 and 2.00 m GSD and selected glacial landforms were mapped independently by two operators and cross-checked. The results indicate that 2.0 m resolution is insufficient to properly recognize landforms such as pushed moraines or flutes; however, it can be sufficient to detect kame terraces and major glacifluvial channels. For general mapping of locations of forms such as annual pushed moraines or fluting, the 0.5 m resolution is required. However, to obtain geomorphometric characteristics of the landforms (e.g., height, width, volume) resolution between 0.1 and 0.2 m is necessary. Finer resolution (better than 0.05 m GSD) does not increase the ability to detect landforms or better characterize their geometric properties; however, in some cases might be useful to obtain information about clast characteristics. The experiment proved that decimeter-scale spatial resolution is sufficient for mapping of some geomorphological forms (annual pushed moraines, flutes), which allows for planning UAV missions at a higher elevation above the ground and, therefore, minmizing the duration of field surveys. Moreover, some of the more prominent landforms (e.g., kame terraces, larger moraines) can be successfully detected from aerial or satellite-based DEMs (e.g. freely available ArcticDEM) with a resolution of 2.00 m, the use of which reduces the costs of field research to a minimum.

This research was funded by the National Science Centre, Poland, Grant Number 2019/35/B/ST10/03928.

How to cite: Śledź, S. and Ewertowski, M.: Optimal resolution of UAV-based digital elevation models (DEMs) for mapping of selected subtle glacial landforms, EGU General Assembly 2023, Vienna, Austria, 23–28 Apr 2023, EGU23-151, https://doi.org/10.5194/egusphere-egu23-151, 2023.

EGU23-3292 | Posters on site | GI6.1

CO2 concentration and stable isotope surveys in the ambient air of populated areas of La Palma (Canary Islands) by means of mobile Delta Ray measurements using an electrical car 

Nemesio M. Pérez, María Asensio-Ramos, José Barrancos, Eleazar Padrón, Gladys V. Melián, Fátima Rodríguez, Germán D. Padilla, Violeta T. Albertos, Pedro A. Hernández, Antonio J. Álvarez Díaz, Héctor de los Ríos Díaz, David Afonso Falcón, and Juan Cutillas

Anomalous CO2 degassing of volcanic origin was observed by the end of November 2021 in the neighborhoods of La Bombilla and Puerto Naos, located in the western flank of La Palma, about 5 km distance southwestern of the 2021 Tajogaite eruption vents (Hernández et al., 2021). In this study zone, continuous monitoring of CO2 concentration in the outdoors ambient air at 200 cm from the surface has reached a daily average of maximum and mean values about 28,000 and 10,000 ppm, respectively. We started recently to perform CO2 concentration and stable isotope surveys in the outdoors ambient air of Puerto Naos at 140 cm from the surface by means of a Delta Ray analyzer installed in an electrical car which was driving through the streets of Puerto Naos. This instrument is a high performance, mid-infrared laser-based, isotope ratio infrared spectrometer (IRIS) which offers the possibility of performing simultaneous determination of δ13C and δ18O in CO2 at ambient concentrations with a precision as low as 0.05‰. One major advantage of IRIS techniques with respect to more traditional ones (e.g., isotopic ratio mass spectrometry -IRMS-) is the possibility to perform (semi)continuous measurements at high temporal resolution. Since October 2022, seven surveys have been performed at Puerto Naos making up a total of about 600 measurements. The observed CO2 concentrations and the δ13C-CO2 values in the outdoors ambient air ranged from 420 to 3,500 ppm and from -9.0 to -3.2 ‰ vs. VPDB, respectively. Survey data analysis showed a good spatial correlation between relatively high CO2 concentrations with δ13C-CO2 values less 13C-depleted (i.e., volcanic CO2). These observations highlight that stable isotope surveys allow to evaluate the impact of volcanic degassing on the air CO2 concentration and provide valuable results to identify the volcanic CO2 gas hazard zones.

Hernández, P. A., Padrón, E., Melián, G. V., Pérez, N. M., Padilla, G., Asensio-Ramos, M., Di Nardo, D., Barrancos, J., Pacheco, J. M., and Smit, M.: Gas hazard assessment at Puerto Naos and La Bombilla inhabited areas, Cumbre Vieja volcano, La Palma, Canary Islands, EGU General Assembly 2022, Vienna, Austria, 23–27 May 2022, EGU22-7705, https://doi.org/10.5194/egusphere-egu22-7705, 2022.

How to cite: Pérez, N. M., Asensio-Ramos, M., Barrancos, J., Padrón, E., Melián, G. V., Rodríguez, F., Padilla, G. D., Albertos, V. T., Hernández, P. A., Álvarez Díaz, A. J., de los Ríos Díaz, H., Afonso Falcón, D., and Cutillas, J.: CO2 concentration and stable isotope surveys in the ambient air of populated areas of La Palma (Canary Islands) by means of mobile Delta Ray measurements using an electrical car, EGU General Assembly 2023, Vienna, Austria, 23–28 Apr 2023, EGU23-3292, https://doi.org/10.5194/egusphere-egu23-3292, 2023.

EGU23-3620 | ECS | Posters on site | GI6.1

SO2 emissions during the post-eruptive phase of the Tajogaite eruption (La Palma, Canary Islands) by means of ground-based miniDOAS measurements in transverse mode using a car and UAV 

Oscar Rodríguez, José Barrancos, Juan Cutillas, Victor Ortega, Pedro A. Hernández, Iván Cabrera, and Nemesio M. Pérez

Throughout the 85 days that lasted the Tajogaite eruption at Cumbre Vieja volcano (La Palma, Canary Islands, Spain), observations of SO2 emissions were made using ground-based instruments, in transverse mode, static scanners and on-board drones, as well as by numerous satellite instruments. The initial estimates of the total SO2 emission from the eruption were 2.4 Mt from TROPOMI and 1.2 Mt from the traverse data. These measurements formed part of the official monitoring effort, providing insights into the eruption’s evolution and informing the civil defence response throughout the eruption (Hayer C. et al., 2022; Albertos V. T. et al., 2022). Once the Tajogaite eruption was over, we continued performing a SO2 monitoring release to the atmosphere by the Tajogaite volcanic vent since the low ambient concentrations of SO2 make it an ideal volcanic gas monitoring candidate even during the post-eruptive phase. SO2 measurements had been carried out a using a car-mounted and UAV-mounted ground-based miniDOAS measurements throughout this post-eruptive phase. About 80 measurements of SO2 emission rates were performed from December 15, 2021 to December 17, 2022. The standard deviation of the estimated values obtained daily was ~ 20%. The range of estimated SO2 emission values has been from 670 to 17 tons per day, observing a clear decreasing trend of SO2 emissions during the post-eruptive phase. During the first month of the post-eruptive phase, it was observed that the average value of the estimated SO2 emission was about 219 tons/day, while it dropped to 107 tons/day during the second and third month after the end of the Tajogaite eruption. This average value continued decreasing during the fourth month of the post-eruptive phase, about 67 tons/day, and recently measurements provide an average SO2 emission value of 13 tons/day. These relatively low observed SO2 emissions during the post eruptive of the Tajogaite eruption phase seems to be clearly related to shallow magma cooling processes within the Tajogaite volcanic edificie.

Hayer, C., Barrancos, J., Burton, M., Rodríguez, F., Esse, B., Hernández, P., Melián, G., Padrón, E., Asensio-Ramos, M., and Pérez, N.: From up above to down below: Comparison of satellite- and ground-based observations of SO2 emissions from the 2021 eruption of Cumbre Vieja, La Palma, EGU General Assembly 2022, Vienna, Austria, 23–27 May 2022, EGU22-12201, https://doi.org/10.5194/egusphere-egu22-12201, 2022.

Albertos, V. T., Recio, G., Alonso, M., Amonte, C., Rodríguez, F., Rodríguez, C., Pitti, L., Leal, V., Cervigón, G., González, J., Przeor, M., Santana-León, J. M., Barrancos, J., Hernández, P. A., Padilla, G. D., Melián, G. V., Padrón, E., Asensio-Ramos, M., and Pérez, N. M.: Sulphur dioxide (SO2) emissions by means of miniDOAS measurements during the 2021 eruption of Cumbre Vieja volcano, La Palma, Canary Islands, EGU General Assembly 2022, Vienna, Austria, 23–27 May 2022, EGU22-5603, https://doi.org/10.5194/egusphere-egu22-5603, 2022.

How to cite: Rodríguez, O., Barrancos, J., Cutillas, J., Ortega, V., Hernández, P. A., Cabrera, I., and Pérez, N. M.: SO2 emissions during the post-eruptive phase of the Tajogaite eruption (La Palma, Canary Islands) by means of ground-based miniDOAS measurements in transverse mode using a car and UAV, EGU General Assembly 2023, Vienna, Austria, 23–28 Apr 2023, EGU23-3620, https://doi.org/10.5194/egusphere-egu23-3620, 2023.

EGU23-3819 | Posters virtual | GI6.1

Using tunable diode laser (TDL) system in urban environments to measure anomalous CO2 concentrations: the case of Puerto Naos, La Palma, Canary Islands 

José Barrancos, Germán D. Padilla, Gladys V. Melián, Fátima Rodríguez, María Asensio-Ramos, Eleazar Padrón, Pedro A. Hernández, Jon Vilches Sarasate, and Nemesio M. Pérez

Carbon dioxide (CO2) is a colourless and odourless gas. It is non-flammable, chemically non-reactive and 1.5 times as heavy as air; therefore, may accumulate at low elevations. CO2 is a toxic gas at high concentration, as well as an asphyxiant gas (due to reduction in oxygen). Irritation of the eyes, nose and throat occurs only at high concentrations. Since the Tajogaite eruption ended on December 13, 2021, high concentrations of CO2 up to 20% (200.000 ppmv) have been observed inside of buildings of the neighborhoods of La Bombilla and Puerto Naos (La Palma, Canary Islands), which are located about 5 km distance from the Tajogaite eruption vent. Anomalous concentrations of CO2 are manily detected in the ground-floor and basement of the buildings in Puerto Naos, and the distribution of relatively high CO2 concentrations  is not homogeneous or uniform throughout the Puerto Naos area (Hernández P.A. et al, 2022).

The purpose of this study was to use the Tunable Laser Diode (TDL) absorption spectroscopy method to monitor the indoor CO2 concentration of the ground-floor of one of the buildings of Puerto Naos. A CO2-TDL was installed on 9 January 2022 and continues measuring the CO2 concentration along an optical path of about 6 meters. During the period January-March 2022, daily averages of CO2 concentrations from fifteen-minute data ranged from 5000 to 25000 ppmv reaching values up to 40000 ppmv (4%). Over time, a clear decreasing trend of the indoor CO2 concentration has been observed at this observation site and the daily CO2 averages from fifteen-minute data during the last 3 months (October-December 2022) ranged from 1000 to 2500 ppmv. This clear decreasing trend over time has not been observed at other observation sites where the concentration of CO2 inside buildings is being monitored. This observation indicates the complexity of the problem and the need to install a dense network of sensors to monitor CO2 for civil protection purposes.


Hernández, P. A., Padrón, E., Melián, G. V., Pérez, N. M., Padilla, G., Asensio-Ramos, M., Di Nardo, D., Barrancos, J., Pacheco, J. M., and Smit, M.: Gas hazard assessment at Puerto Naos and La Bombilla inhabited areas, Cumbre Vieja volcano, La Palma, Canary Islands, EGU General Assembly 2022, Vienna, Austria, 23–27 May 2022, EGU22-7705, https://doi.org/10.5194/egusphere-egu22-7705, 2022.

How to cite: Barrancos, J., Padilla, G. D., Melián, G. V., Rodríguez, F., Asensio-Ramos, M., Padrón, E., Hernández, P. A., Vilches Sarasate, J., and Pérez, N. M.: Using tunable diode laser (TDL) system in urban environments to measure anomalous CO2 concentrations: the case of Puerto Naos, La Palma, Canary Islands, EGU General Assembly 2023, Vienna, Austria, 23–28 Apr 2023, EGU23-3819, https://doi.org/10.5194/egusphere-egu23-3819, 2023.

EGU23-3834 | Posters on site | GI6.1

Modeling outdoor dispersion of CO2 at Puerto Naos (La Palma, Canary Islands) 

Luca D Auria, Alba Santos, Pedro A. Hernández, Gladys V. Melián, Antonio J. Álvarez Díaz, María Asensio-Ramos, Alexis M. González Pérez, and Nemesio M. Pérez

The 2021 Tajogaite eruption in Cumbre Vieja volcano (La Palma, Canary Islands), which started on Sep. 19, 2021, and lasted 85 days, caused extensive damages because of the lava flows and ash fall. However, since the middle of Nov. 2021, some areas located about 5 km SW of the eruptive center started to be affected by intense diffuse CO2 emission. Among them are the urban centers of La Bombilla and Puerto Naos (Hernández et al., 2022). These emissions prevented the population of these two centers from returning to their houses because of high  concentrations of CO2 in indoor and outdoor environments.

In this work, we model the CO2 dispersion process in Puerto Naos to obtain hazard maps with the maximum CO2 concentrations which can be reached in the town in the outdoor environment. To achieve these results, we combined field observations with numerical modelling. Field surveys were realized in low wind conditions, measuring the CO2 concentration with portable sensors  at 15 and 150 cm from the ground at measurement points spaced approximately 10 m from each other along the streets of Puerto Naos.

We realized numerical modelling using the software TWODEE-2, a code for modeling the dispersion of heavy gases based on the solution of shallow water equations (Folch et al., 2009). For this purpose, we used a detailed digital topographic model, including the edifices of Puerto Naos. Using a trial-and-error approach, we determined the gas emission rates from a set of discrete source points in no-wind conditions. Subsequently, we repeated the numerical modelling, keeping the same sources and simulating all the realistic wind conditions in terms of direction and intensity. For each simulation, we determined the maximum CO2 concentration at different elevations from the ground. This allowed obtaining a hazard map with the maximum CO2 outdoor concentrations for each part of the town

The main results highlight that the outdoor environment is affected by a dense layer of CO2, whose flow is strongly conditioned by the urban infrastructures. Furthermore, we evidenced how even light winds can change the gas concentration pattern radically in a few minutes, evidencing the possibility of sudden changes in the CO2 concentration outdoors with no warning.

Folch A., Costa A., Hankin R.K.S., 2009. TWODEE-2: A shallow layer model for dense gas dispersion on complex topography, Comput. Geosci., doi:10.1016/j.cageo.2007.12.017

Hernández, P. A., Padrón, E., Melián, G. V., Pérez, N. M., Padilla, G., Asensio-Ramos, M., Di Nardo, D., Barrancos, J., Pacheco, J. M., and Smit, M.: Gas hazard assessment at Puerto Naos and La Bombilla inhabited areas, Cumbre Vieja volcano, La Palma, Canary Islands, EGU General Assembly 2022, Vienna, Austria, 23–27 May 2022, EGU22-7705, https://doi.org/10.5194/egusphere-egu22-7705, 2022.

How to cite: D Auria, L., Santos, A., Hernández, P. A., Melián, G. V., Álvarez Díaz, A. J., Asensio-Ramos, M., González Pérez, A. M., and Pérez, N. M.: Modeling outdoor dispersion of CO2 at Puerto Naos (La Palma, Canary Islands), EGU General Assembly 2023, Vienna, Austria, 23–28 Apr 2023, EGU23-3834, https://doi.org/10.5194/egusphere-egu23-3834, 2023.

EGU23-5223 | Orals | GI6.1

Event-oriented observation across scales and environmental systems: MOSES started operation. 

Ute Weber and Claudia Schuetze and the MOSES-Team

The novel observing system „Modular Observation Solutions for Earth Systems (MOSES)“, is an initiative of the Helmholtz Association of German Research Centers that aims at investigating the interactions of short-term events and long-term trends across environmental systems. MOSES is a mobile and modular infrastructure and its component measuring systems are managed by the participating research centers. By quantifying energy, water, nutrient and greenhouse gas states and fluxes during events such as heat waves, droughts, heavy precipitation, floods, rapid thaw of permafrost or of ocean eddies, and subsequently along the related event chains, the system delivers data to examine potential long-term impacts of these events and to gain a better understanding of extreme events that are expected to increase in frequency and intensity in a changing climate. In order to obtain comprehensive data sets, a cross-system approach is followed, covering the atmosphere, land surface and hydrosphere. These event-related data sets complement long-term and/or large scale data sets of established national and international monitoring programs and satellite data such as TERENO, ICOS, eLTER, SENTINEL, etc. After a 5-year setup period, MOSES was successfully put into operation in 2022 (Weber et al., 2022, https://doi.org/10.1175/BAMS-D-20-0158.1).

While long-term trends are typically assessed with stationary observation networks and platforms specifically designed for long-term monitoring, proven event-oriented observation systems and strategies are still missing. Event-oriented observation campaigns require a combination of a) measuring systems that can be rapidly deployed at “hot spots” and in “hot moments”, b) mobile equipment to monitor spatial dynamics in high-resolution, c) in situ measuring systems to record temporal dynamics in high-resolution, and d) interoperable measuring systems to monitor the interactions between atmosphere, land surface and hydrosphere. We will present the observation system and the observing strategy on examples from two past test campaigns: 1) The “Swabian MOSES campaign” of 2021 that captured the formation and evolution of supercells, hail and heavy precipitation and the resulting local flash floods (Kunz et al., 2022, https://doi.org/10.3389/feart.2022.999593). 2) The MOSES campaign of 2019 that captured the historical low flow situation along the Elbe River and into the German Bight (e.g., Kamjunke et al., 2021, https://doi.org/10.1002/lno.11778). As an outlook, upcoming national and international campaigns and potential future deployments will be presented.

How to cite: Weber, U. and Schuetze, C. and the MOSES-Team: Event-oriented observation across scales and environmental systems: MOSES started operation., EGU General Assembly 2023, Vienna, Austria, 23–28 Apr 2023, EGU23-5223, https://doi.org/10.5194/egusphere-egu23-5223, 2023.

EGU23-5684 | ECS | Posters on site | GI6.1

Random Forest Classification of Proterozoic and Paleozoic rock types of Tsagaan-uul area, Mongolia 

Munkhsuren Badrakh, Narantsetseg Tserendash, Erdenejargal Choindonjamts, and Gáspár Albert

The Tsagaan-uul area of the Khatanbulag ancient massif in the Central Asian Orogenic Belt is located in the southern part of Mongolia, which belongs to the Gobi Desert. It has a low vegetation cover, and because of this, remotely sensed data can be used without difficulty for geological investigations. Factors such as sparse population and underdeveloped infrastructure in the region further create a need for combining traditional geological mapping with remote sensing technologies. In existing geology maps of the area, the formations are lithologically very diverse and their boundaries were mapped variously, so a need for a more precise lithology-based map arouse.

This study investigated combinations of fieldwork, multispectral data, and petrography for the rock type classification. A random forest classification method using multispectral Sentinel-2A data was employed in order to distinguish different rocks within Proterozoic Khulstai (NP1hl) metamorphic complex, which is dominated by gneiss, andesite, sandstone, limestone, amphibolite, as well as the Silurian terrigenous-carbonate Khukh morit (S1hm) formation, Tsagaan-uul area. Based on the ground samples collected from field surveys, ten kinds of rock units plus Quaternary sediments were chosen as training areas. In addition, morphometric parameters derived from SRTM data and band ratios used for iron-bearing minerals from Sentinel 2 bands are selected as variables in the accuracy of classification. The result showed that gneisses were recognized with the highest accuracy in the Khulstai complex, and limestones and Quaternary sediments were also well predicted. Moreover, the tectonic pattern was also well recognized from the results and compared to the existing maps provided a more detailed geological image of the area. This study emphasized the need for samples as baseline data to improve the machine learning methods, and the method provides an appropriate basis for fieldwork.


How to cite: Badrakh, M., Tserendash, N., Choindonjamts, E., and Albert, G.: Random Forest Classification of Proterozoic and Paleozoic rock types of Tsagaan-uul area, Mongolia, EGU General Assembly 2023, Vienna, Austria, 23–28 Apr 2023, EGU23-5684, https://doi.org/10.5194/egusphere-egu23-5684, 2023.

EGU23-5689 | Posters on site | GI6.1

Post-earthquake geoenvironmental changes in landslide-affected watersheds in Atsuma, Hokkaido (Japan) 

Yuichi S. Hayakawa, Tennyson Lo, Azim Zulhilmi, Xinyue Yu, and Xiaoxiao Wang

Following drastic changes in geoenvironmental components by coseismic landslides in mountainous watersheds, more gradual changes can be observed in the elements, including bare-land surface conditions, sediment connectivity, and vegetation recovery on sloping terrains. Such geoenvironmental changes may continue for years to decades, with complex interrelationships among various geomorphological and ecological factors. Their assessments are also crucial for local to regional environmental management. After the occurrence of numerous coseismic landslides triggered by the 2018 Hokkaido Eastern Iburi Earthquake in northern Japan, geomorphological and geoecological changes were explored using optical and laser sensors on uncrewed aerial systems. Morphological characteristics of the landslide-affected slopes in the watersheds were assessed with structure-from-motion multi-view stereo photogrammetry and light detection and ranging topographic datasets, while vegetation recovery on the slopes was examined with visible-light and near-infrared images. Although spatial relationships among morphological developments, sediment mobility, and vegetation recovery were not clearly observed, their general temporal trends may be correspondent. Dominant processes affecting the morphological developments are supposed to be frost heave in the cold climate and non-frequent high-intensity rainfalls, and these can be conditioning vegetation growth. Such local changes will be further examined on a wider, regional scale. 

How to cite: Hayakawa, Y. S., Lo, T., Zulhilmi, A., Yu, X., and Wang, X.: Post-earthquake geoenvironmental changes in landslide-affected watersheds in Atsuma, Hokkaido (Japan), EGU General Assembly 2023, Vienna, Austria, 23–28 Apr 2023, EGU23-5689, https://doi.org/10.5194/egusphere-egu23-5689, 2023.

EGU23-5750 | Posters on site | GI6.1

Aseismic creep and coseismic dislocation at an active fault in volcanic area: the case of Ischia Island 

Stefano Carlino, Nicola Alessandro Pino, Lisa Beccaro, and Prospero De Martino

Understanding the fault dynamics in volcanic areas is not a simple task, mainly due to both the heterogeneity of volcanic structures and the local stress distribution. The presence of high temperature-high pressure geothermal fluids and relative high strain rates, and the occurrence of viscous processes in the deeper part of the volcano further contribute to generate complex patterns of strain load and release, possibly with aseismic creep and differential movements along the faults.

We present the case of an active fault located Casamicciola Terme town – in northern area of the volcanic caldera of Ischia Island (Southern Italy) – where repeated destructive earthquakes occurred at least since 1769, even causing thousands of victims in a single event, with the last one striking in 2017. To assess a possible mechanism leading to the activation of the Ischia main seismogenic fault, its cyclic nature and the related hazard, we performed a joined analysis of the ground vertical movements, obtained from cGPS (2001-present), DInSAR (2015-2018) time-series, and levelling data of the island (1987-2010). The geodetic data indicate that Casamicciola seismogenic fault is characterized by a complex dynamic, with some pre- and post-seismic aseismic dislocation, along sectors that move differentially, in response to the long-term subsidence of the island. Based on the ground deformation rate and on the distribution of degassing areas, we speculate that fluid pressure variations may have a major role in modulating the apparent non-stationarity of the Ischia stronger earthquakes. Furthermore, we suggest that a punctual monitoring of the distribution in space and time of the aseismic creep could provide clues on the state of strain of the seismogenic fault.

How to cite: Carlino, S., Pino, N. A., Beccaro, L., and De Martino, P.: Aseismic creep and coseismic dislocation at an active fault in volcanic area: the case of Ischia Island, EGU General Assembly 2023, Vienna, Austria, 23–28 Apr 2023, EGU23-5750, https://doi.org/10.5194/egusphere-egu23-5750, 2023.

EGU23-6832 | ECS | Orals | GI6.1

Quantifying karstic geomorphologies using Minkowski tensors and graph theory: Applications to SLAM Lidar data from carbonate caves in Northern Bavaria (Germany) 

Rahul Prabhakaran, Ruaridh Smith, Daniel Koehn, Pierre-Olivier Bruna, and Giovanni Bertotti

Karstification is a ubiquitous feature in carbonate rocks. The origins can be hypogenic or epigenic based on the source of the reacting fluids. The presence of karstified lithologies and their spatial heterogeneity poses a major risk in subsurface energy utilization goals (hydrocarbons, geothermal etc). Such dissolution features tend to organize as spatial networks, with their evolution controlled by a complex interplay of several factors, including natural mineralogical variations in host rocks, effects of pre-existing structures, directional history of palaeo-flow paths, and competition between convective transport and dissolution. Accurate quantification of the spatial distribution of karst is difficult owing to resolution issues in 3D data such as seismic and ground penetrating radar. Recent advances in Simultaneous Location and Mapping (SLAM) Lidar technology have made possible to acquire karst cave passage geometries at very high-resolution with relative ease compared to conventional terrestrial lidar. In this contribution, we present a unique dataset of more than 80 caves, scanned using SLAM lidar, in Jurassic carbonates from northern Bavaria, Germany. We introduce a methodology for robustly deriving morphometrics of karstic caves using Minkowski tensors and spatial graph theory. The method is based on a combination representation of cave passage skeletons as spatial graphs and 2D passage cross-sections using Minkowski functionals. The enriched topological representation enables detailed analysis of internal spatial variation within a single cave and also comparison with cave geometries from other caves. We derive a typology of cave systems based on the degree of structural control on karstification using the database.

How to cite: Prabhakaran, R., Smith, R., Koehn, D., Bruna, P.-O., and Bertotti, G.: Quantifying karstic geomorphologies using Minkowski tensors and graph theory: Applications to SLAM Lidar data from carbonate caves in Northern Bavaria (Germany), EGU General Assembly 2023, Vienna, Austria, 23–28 Apr 2023, EGU23-6832, https://doi.org/10.5194/egusphere-egu23-6832, 2023.

EGU23-7265 | Posters on site | GI6.1

Low Power, Rugged Edge Computing provides a low cost, powerful solution for on the ground remote sensing in extreme environments 

Nicholas Frearson, Terry Plank, Einat Lev, LingLing Dong, and Conor Bacon

Ground based remote sensing devices increasingly incorporate low cost single board computers such as a Raspberry Pi to capture and analyze images and data from the environment. Useful and cheap as these devices are, they are not designed for use in extreme conditions and as a consequence often suffer from early failure. Here we describe a system that incorporates a commercially available rugged Edge Computer running embedded Linux that is designed to operate in remote and extreme environments. The AVERT system  (Anticipating Volcanic Eruptions in  Real Time) developed at Columbia University in New York and funded by the Moore Foundation uses solar and wind powered Sensor nodes configured in a spoke and hub architecture currently operating on two volcanoes overseen by the Alaska Volcano Observatory in the Aleutian Islands, Alaska. Multiple Nodes distributed around the volcanoes are each controlled by an Edge Computer which manages and monitors local sensors, processes and parses their data via radio link to a central Hub and schedules system components to wake and sleep to conserve power. The Hub Edge Computer collects and assembles data from multiple Nodes and passes it via satellite, cellular modem or radio links to servers located elsewhere in the world or cloud for near real-time analysis. The local computer enables us to minimize local power demand to just a few watts in part due to the extremely low power sleep modes that are incorporated into these devices. For instance, a Node incorporating a webcam, IRCam, weather station, Edge Computer, network switch, communications radio and power management relays draws only 4.5W on average. In addition, this level of local computing power and a mature Linux operating environment enables us to run AI algorithms at source that process image and other data to flag precursory indicators of an impending eruption. This also helps to reduce data volume passed across the network at times of low network connectivity. We can also remotely interrogate any part of the system and implement new data schemes to best monitor and react to ongoing events. Future work on the AI algorithm development will incorporate local multisensor data analytics to enhance our anticipatory capability.

How to cite: Frearson, N., Plank, T., Lev, E., Dong, L., and Bacon, C.: Low Power, Rugged Edge Computing provides a low cost, powerful solution for on the ground remote sensing in extreme environments, EGU General Assembly 2023, Vienna, Austria, 23–28 Apr 2023, EGU23-7265, https://doi.org/10.5194/egusphere-egu23-7265, 2023.

EGU23-8673 | Orals | GI6.1

Are they radon or random signals? Analysis of time series of 222Rn activity concentrations in populated areas of La Palma (Canary Islands, Spain) 

Antonio Eff-Darwich, Germán D. Padilla, José Barrancos, José A. Rodríguez-Losada, Pedro A. Hernández, Nemesio M. Pérez, Antonio J. Álvarez Díaz, Alexis M. González Pérez, Jesús García, José M. Santana, and Eleazar Padrón

Radon, 222Rn, is a radioactive constituent of the surface layer of the atmosphere. The analysis of the temporal and spatial variations in the flux of radon across the soil–air interface is a promising tool to study geo-dynamical processes. However, many of these variations are induced by external variables, such as temperature, barometric pressure, rainfall, or the location of the instrumentation, among others.

Anomalous CO2 degassing has been observed since the end of November 2021 in the neighborhoods of La Bombilla and Puerto Naos, located in the western flank of La Palma, about 5 km distance southwestern of the 2021 Tajogaite eruption vents (Hernández et al. 2022). In order to complement these observations with other independent parameters, a set of radon monitoring stations have been deployed in that area. In an attempt to filter out non-endogenous variations in the radon signal, we have implemented time-series numerical filtering techniques based on multi-variate and frequency domain analysis. A background level for radon emissions at various locations could therefore be defined, by which correlations between radon concentration, gaseous emissions and dynamical processes could be carried out. Some preliminary results corresponding to the first 3 months of data (october-december 2022) are presented.

Hernández, P. A., Padrón, E., Melián, G. V., Pérez, N. M., Padilla, G., Asensio-Ramos, M., Di Nardo, D., Barrancos, J., Pacheco, J. M., and Smit, M.: Gas hazard assessment at Puerto Naos and La Bombilla inhabited areas, Cumbre Vieja volcano, La Palma, Canary Islands, EGU General Assembly 2022, Vienna, Austria, 23–27 May 2022, EGU22-7705, https://doi.org/10.5194/egusphere-egu22-7705, 2022.

How to cite: Eff-Darwich, A., Padilla, G. D., Barrancos, J., Rodríguez-Losada, J. A., Hernández, P. A., Pérez, N. M., Álvarez Díaz, A. J., González Pérez, A. M., García, J., Santana, J. M., and Padrón, E.: Are they radon or random signals? Analysis of time series of 222Rn activity concentrations in populated areas of La Palma (Canary Islands, Spain), EGU General Assembly 2023, Vienna, Austria, 23–28 Apr 2023, EGU23-8673, https://doi.org/10.5194/egusphere-egu23-8673, 2023.

EGU23-8795 | ECS | Orals | GI6.1

Integration of Seismic and Quasi-Static Signals for Improved Volcanic Monitoring 

Joe Carthy, Alejandra Vásquez Castillo, Manuel Titos, Luciano Zuccarello, Flavio Cannavò, and M. Carmen Benitez

The time scale of ground displacement at volcanoes varies between short, sub second seismic events, to days, months or even years. This study is focused on data from seismic and GNSS stations located around Mount Etna. The GNSS and seismic stations operate at different time scales. Data from these different time scales is extracted and combined in order to better understand the subsurface dynamics. The overall aim of this research is to improve volcanic forecasting and monitoring. It does this in a novel way by applying signal processing and machine learning techniques to the rich dataset.

Mount Etna offers an interesting case study as it is a widely monitored volcano with a variety of sensors and with a rich pool of data to analyse. Additionally the volcanic dynamics at Mount Etna are complex. This is a volcano where there is a variety of different sub-surface dynamics due to the movement of both deep and shallow magma. This allows for rich insights to be drawn through the combination of different signal types.

This study looks at combining the information obtained from the seismic array at Mount Etna, with the information obtained from various GNSS stations on the volcano. The seismic array has been able to capture ground velocity data in the frequency range 0.025 Hz to 50 Hz from a range of stations at different locations across the volcano. The GNSS stations measure ground displacement with a sampling frequency of 1 Hz, and they allow for longer term ground dynamic analysis.

We analyse different seismic events, and relate the type and number of the seismic events to the long term ground deformation that we see in the recorded GNSS data. Where links between the two signal types have been identified, research is ongoing to establish a direct connection with known volcanic activity on Mount Etna. This will help establish what the relationship that we are seeing signifies. This integration of data from different types of sensors is a significant step into bridging the gap between seismic and quasi-static ground displacement at active volcanoes and should open the path toward more in depth volcanic monitoring and forecasting.

How to cite: Carthy, J., Vásquez Castillo, A., Titos, M., Zuccarello, L., Cannavò, F., and Benitez, M. C.: Integration of Seismic and Quasi-Static Signals for Improved Volcanic Monitoring, EGU General Assembly 2023, Vienna, Austria, 23–28 Apr 2023, EGU23-8795, https://doi.org/10.5194/egusphere-egu23-8795, 2023.

EGU23-10069 | ECS | Orals | GI6.1

Vredefort impact site modelling through inhomogeneous depth weighted inversion. 

Andrea Vitale and Maurizio Fedi

We are showing an application of the 3D self-constrained depth weighted inversion of the inhomogeneous gravity field (Vitale and Fedi, 2020) of the Vredefort impact site.

This method is based on two steps, the first being the search in the 3D domain of the homogenous degree of the field, and the second being the inversion of the data using a power-law weighting function with a 3D variable exponent. It does not involve directly data at different altitudes, but it is heavily conditioned by a multiscale search of the homogeneity degree.

The main difference between this inversion approach and the one proposed by Li and Oldenburg algorithm (1996) and Cella and Fedi (2012) is therefore about the depth weighting function, whose exponent is a constant through the whole space in the original Li and Oldenburg and Cella and Fedi approaches, while it is a 3D function in the method which we will discuss here.

The model volume of the area reaches 20 km in depth, while along x and y its extension is respectively 41 by 63 km. The trend at low and middle altitudes of the estimated β related to the main structures is fitting the expectations because the results relate to two main structures, which are geometrically different: the core is like a spheroid body (β ≈ 3) and the distal rings are like horizontal pipes or dykes (1 < β < 2).

With a homogeneous depth weighting function, we recover a smooth solution and both the main sources, the main core and the rings of the impact, are still visible at the bottom of the model (20 km). This is not in agreement with the result by Henkel and Reimold (1996, 1998), which, based on gravity and magnetic inversion supported by seismic data, proposed a model where the bottom of the rings is around 10 km and the density contrast effect due to the core structure loses its effectiveness around 15 km.

Instead, using an inhomogeneous depth weighting function (figure 28) we can retrieve information regarding the position at depth of both core and distal ring structures that better fits the above model. In fact, the bottom of the distal ring structure, that should be around 10 km according to Henkel and Reimold (1996, 1998), is recovered very well using an inhomogeneous depth weighting function, while in the homogeneous case we saw that the interpreted structure was still visible at large depths.

In addition, also the core structure is shallower compared to the homogeneous approach and seems more reliable if we compare it with the model of Henkel and Reimold (1996, 1998).

Instead, the inhomogeneous approach presented in this paper leads naturally us to a better solution because it takes into account during the same inversion process of the inhomogeneous nature of the structural index within the entire domain.

How to cite: Vitale, A. and Fedi, M.: Vredefort impact site modelling through inhomogeneous depth weighted inversion., EGU General Assembly 2023, Vienna, Austria, 23–28 Apr 2023, EGU23-10069, https://doi.org/10.5194/egusphere-egu23-10069, 2023.

EGU23-11065 | ECS | Posters on site | GI6.1

The Dynamics of Climate Change Science and Policy in Panama: A Review 

Gustavo Cárdenas-Castillero, Steve Paton, Rodrigo Noriega, and Adriana Calderón

The local studies and reports indicate that the temperature of Panama has increased by approximately 1°C since the 1970s. More evidence shows a constantly rising sea level in the Guna Yala archipelago, coral bleaching on both coasts, and increasingly more frequent and extreme precipitation events throughout Panama. This study includes an analysis of over 400 scientific publications made by researchers from multiple centres and more than 20 Panamanian official reports due to Panama's mandate and duties under the international climate accords. To summarise the results, the studies were gathered according to the climate change effects by Panamanian locations and analysed posteriorly using Rstudio and ArcMAP. The results indicate a significant increase in climate change research beginning in 2007.

This study identified and examined the essential findings per hydroclimatic region, showing the trends, limitations, collaborations, and international contributions. Climate change research in Panama includes some of the longest-term meteorological, hydrological, oceanographic, and biological studies in the neotropics. The most significant number of identified climate change-related studies were conducted, at least in part, in the Barro Colorado Natural Monument located in central Panama. Other frequently used sites include Metropolitan Natural Park, Soberania Park, the Panama Canal Watershed and the Caribbean coast of Colón and Bocas del Toro, primarily due to research conducted by Smithsonian Tropical Research-affiliated investigators. The tropical forests of Panama are some of the bests studied in the world; however, research has been concentrated in a relatively small number of locations and should be expanded to include additional areas to achieve a more complete and comprehensive understanding of climate change will impact Panama in the future.

How to cite: Cárdenas-Castillero, G., Paton, S., Noriega, R., and Calderón, A.: The Dynamics of Climate Change Science and Policy in Panama: A Review, EGU General Assembly 2023, Vienna, Austria, 23–28 Apr 2023, EGU23-11065, https://doi.org/10.5194/egusphere-egu23-11065, 2023.

EGU23-12050 | Orals | GI6.1

Stress field analysis from induced earthquakes caused by deep fluid injection: the 2013 St. Gallen (Switzerland) seismic sequence. 

Bruno Massa, Guido Maria Adinolfi, Vincenzo Convertito, and Raffaella De Matteis

The city of St. Gallen is located in the Molasse Basin of northeast Switzerland. Mesozoic units of the substratum are affected by a fault system hosting a hydrothermal reservoir. In 2013 a deep geothermal drilling project started in an area close to the city. During a phase of reservoir stimulation, a sequence of more than 340 earthquakes was induced with a maximum magnitude ML 3.5. Stress inversion of seismological datasets became an essential tool to retrieve the stress field of active tectonics areas. With this aim, a dataset of the best constrained Fault Plane Solutions (FPSs) was processed in order to qualitatively retrieve stress-fields active in the investigated volume. FPSs were obtained by jointly inverting the long-period spectral-level P/S ratios and the P-wave polarities following a Bayesian approach (BISTROP). Data were preliminarily processed by the Multiple Inverse Method to evaluate the possible dataset heterogeneity and separate homogeneous FPS populations. The resulting dataset was then processed using the Bayesian Right Trihedra Method (BRTM). Considering that hypocentral depths range between 4.1 and 4.6 km b.s.l., in order to emphasize depth-related stresses, we performed a first step of raw stress inversion procedure splitting the data into five subsets, grouping events located inside 100-m depth ranges. Once the presence of stress variations with depth has been excluded, the second step of fine stress inversion procedure was performed on the entire dataset. The stress-inversion procedure highlights an active stress field dominated by a well-constrained NE low-plunging σ3 and a corresponding NW low-plunging σ1. The corresponding Bishop ratio confirms the stability of the retrieved attitudes. Results are in good accordance with the regional stress field derived from regional natural seismicity. Additionally, the retrieved, dominant, stress field is coherent with the regional tectonic setting.

This research has been supported by PRIN-2017 MATISSE project (No. 20177EPPN2).

How to cite: Massa, B., Adinolfi, G. M., Convertito, V., and De Matteis, R.: Stress field analysis from induced earthquakes caused by deep fluid injection: the 2013 St. Gallen (Switzerland) seismic sequence., EGU General Assembly 2023, Vienna, Austria, 23–28 Apr 2023, EGU23-12050, https://doi.org/10.5194/egusphere-egu23-12050, 2023.

EGU23-13693 | ECS | Orals | GI6.1

Assessing the transfer factors (TFs) of contaminants from soil to plants: the case study of Campania region (Southern Italy) 

Lucia Rita Pacifico, Annalise Guarino, Gianfranco Brambilla, Antonio Pizzolante, and Stefano Albanese

The presence of potentially toxic elements (PTEs) derived from anthropogenic sources in soil represents a serious issue for animal and human health. These elements can easily move from the geological compartment to the biological compartment through to the food chain. (Jarup, 2003).

The geochemical knowledge of a territory allows to assess the degree of contamination of the environment, to locate the sources of environmental hazard and, possibly, to manage the anomalous concentrations of the PTEs in environmental matrices with the purpose of eliminating or minimizing their negative impact on the health of living beings. (Reimann et al. 2005).

Several studies have been already carried out to determine the distribution patterns of PTEs in the soil of Campania region (Southern Italy) (De Vivo et al., 2022) but little is known about the transfer processes of contaminants from soils to agricultural products.

In light of above, we present the results of a new study whose purpose was to determine the Transfer Factors (TFs) of PTEs from soil to a series of agricultural products commonly grown in Campania.

Considering the complex geological and geomorphological settings of the region and the diffuse presence of an historical anthropization related to the industry, agriculture, and urbanization, TFs were calculated for a relevant number of fruit and vegetable samples (3731 specimens). They were collected across the whole regional territory to detect differences between analysed species and to highlight the spatial changes in TFs occurring for individual species.

The TFs were calculated starting from the quasi-total (based on Aqua Regia leaching) and bioavailable (based on Ammonium Nitrate leaching) concentrations of PTEs in 7000 and 1500 soil samples, respectively.

Preliminary results show that TFs determined for the various agricultural species vary in space and in amount independently from the original elemental concentrations in soils. High values of TFs are found in areas where PTE concentrations in soil are low and vice versa, thus suggesting that multiple regression and multivariate analyses could be performed to investigate if some additional chemical and physical characteristics of soil (pH, grainsize, OM, etc.) could have a relevant weight on the transfer processes of contaminant from the soil to the plant life.


References

Järup L. 2003. Hazards of heavy metal contamination. Br. Med. Bull. 68, 167–182.

Reimann C., de Caritat P. 2005. Distinguishing between natural and anthropogenic sources for elements in the environment: regional geochemical surveys versus enrichment factors. Science of The Total Environment, Volume 337, Issues 1–3, pages 91-107.

De Vivo B. et al. 2022. Monitoraggio geochimico-ambientale dei suoli e dell'aria della Regione Campania. Piano Campania trasparente. Volume 4. Aracne Editore, Genzano di Roma.

How to cite: Pacifico, L. R., Guarino, A., Brambilla, G., Pizzolante, A., and Albanese, S.: Assessing the transfer factors (TFs) of contaminants from soil to plants: the case study of Campania region (Southern Italy), EGU General Assembly 2023, Vienna, Austria, 23–28 Apr 2023, EGU23-13693, https://doi.org/10.5194/egusphere-egu23-13693, 2023.

EGU23-13853 | Posters on site | GI6.1

Analysis and Modelling of 2009-2013 vs. 2019-2022 Unrest Episodes at Campi Flegrei Caldera 

Raffaele Castaldo, Andrea Barone, De Novellis Vincenzo, Pepe Antonio, Pepe Susi, Solaro Giuseppe, Tizzani Pietro, and Tramelli Anna

Geodetic modelling is a significant procedure for detecting and characterizing unrest and eruption episodes and it represents a valuable tool to infer volume and geometry of volcanic source system.

In this study, we analyse the 2009–2013 and the ongoing 2019-2022 uplift phenomena at Campi Flegrei (CF) caldera in terms of spatial and temporal variations of the stress/strain field. In particular, we investigate the characteristics of the inflating sources responsible of these main deformation unrests occurred in the last twenty years. We separately perform for the two considered periods a 3D stationary Finite Element (FE) modelling of geodetic datasets to retrieve the geometry and location of the deformation sources. The geometry of FE domain takes into account both the topography and the bathymetry of the whole caldera. For what concern the definition of domain elastic parameters, we take into account the Vp/Vs distribution from seismic tomography. In order to optimize the nine model parameters (center coordinates, sferoid axes, dip, strike and over-pressure), we use the statistical random sampling Monte Carlo method by exploiting both geodetic datasets: the DInSAR measurements obtained from the processing of COSMO-SkyMed and Sentinel-1 satellite images. The modelling results for the two analysed period are compared revealing that the best-fit source is a three-axis oblate spheroid ~3.5 km deep, similar to a sill-like body. Furthermore, in order to verify the reliability of the geometry model results, we calculate the Total Horizontal Derivative (THD) of the vertical velocity component and compare it with those performed directly on the two DInSAR dataset.

Finally, we compare the modelled shear stress with the natural seismicity recorded during the 2000-2022 period, highlighting high values of modelled shear stress at depths of about 3.5 km, where high-magnitude earthquakes nucleate.

How to cite: Castaldo, R., Barone, A., Vincenzo, D. N., Antonio, P., Susi, P., Giuseppe, S., Pietro, T., and Anna, T.: Analysis and Modelling of 2009-2013 vs. 2019-2022 Unrest Episodes at Campi Flegrei Caldera, EGU General Assembly 2023, Vienna, Austria, 23–28 Apr 2023, EGU23-13853, https://doi.org/10.5194/egusphere-egu23-13853, 2023.

EGU23-15127 | ECS | Orals | GI6.1

Multiscale magnetic modelling in the ancient abbey of San Pietro in Crapolla 

Luigi Bianco, Maurizio Fedi, and Mauro La Manna

We present a multiscale analysis of magnetic data in the archaeological site of San Pietro in Crapolla (Massa Lubrense, near Naples, Italy). The site consists of the ruins of an ancient abbey. We computed the Wavelet Transform of the Gradiometric measurements and decomposed the data at different scales and positions by a multiresolution analysis, allowing an effective extraction of local anomalies. Modelling of the filtered anomalies was performed by multiscale methods known as “Multiridge analysis” and “DEpth from eXtreme Points (DEXP)”.  The first method analyses a multiscale dataset at the zeroes of the first horizontal and vertical derivatives besides the potential field data themselves (ridges).  The Wavelet Transform Modulus Maxima  lines converged to buried remains. The field, scaled by a power law of the altitude (DEXP transformation) allowed estimates of source depths at its extreme points. The depth estimations for the buried structures obtained from the two methods are very close each other and fairly agree with those from the modelling of GPR anomalies. On the basis of these results, an archaeological excavation followed our indications and brought to light ancient walls.

How to cite: Bianco, L., Fedi, M., and La Manna, M.: Multiscale magnetic modelling in the ancient abbey of San Pietro in Crapolla, EGU General Assembly 2023, Vienna, Austria, 23–28 Apr 2023, EGU23-15127, https://doi.org/10.5194/egusphere-egu23-15127, 2023.

EGU23-15190 | Orals | GI6.1

Synthetic aperture radar burst overlapped interferometry for the analysis of large ground instabilities: Experiments in volcanic regions. 

Antonio Pepe, Andrea Barone, Pietro Mastro, Pietro Tizzani, and Raffaele Castaldo

This work presents an overview of some applications of synthetic aperture radar (SAR) interferometry technology for the detection and analysis of large ground displacements occurring in volcanic areas, with the aim to retrieve the three-dimensional (3-D) ground displacement field (up-down, east-west, north-south). Specifically, the work summarizes and investigates the potential of Bursted Overlapped Interferometry (BOI) that properly combined can allow the retrieval, at different scales of resolution and accuracies, of the north-south components of the ground deformations, which are usually not available considering conventional SAR interferometry techniques. In this context, the almost global coverage and the weekly revisit times of the European Copernicus Sentinel-1 SAR sensors permit nowadays to perform extensive analyses with the aim to assess the accuracy of the BOI techniques. More recently, Spectral Diversity (SD) methods have been exploited for the fine co-registration of SAR data acquired with the Terrain Observation with Progressive Scans (TOPS) mode. In this case, considering that TOPS acquires images in a burst mode, there is an overlap region between consecutive bursts where the Doppler frequency variations is large enough to allow estimating and compensating for, with great accuracy, potential bursts co-registration errors. Additionally, and more importantly, in the case of non-stationary scenarios, it allows detecting the ground displacements occurring along the azimuthal directions (almost aligned along north-south) with centimeter accuracy. This is done by computing the difference between the right and left interferograms, i.e., the burst overlapped interferogram, and relating it to the ongoing deformation signals.

This work aims to apply the BOI technique in selected volcanic and seismic areas to evaluate the impact of this novel technology for the analysis of quantifying, over small, covered regions, the accumulated ground displacements in volcanic areas. In such regions, the interest is on quantifying the accuracy of integrated BOI systems for the retrieval of 3-D displacements. To this aim, we selected as a test site the Galapagos Island and we analyze with BOI the north-south ground displacements. At the next EGU symposium, the results of the BOI analyses will be presented, thus also providing comparative analyses with the results obtained from the use of potential field method applied on the ground displacements in volcanic areas. More specifically, by adopting this technique, we are able to estimate independently the north-south components of the ground displacement by exploiting the harmonic properties of the elasticity field.

How to cite: Pepe, A., Barone, A., Mastro, P., Tizzani, P., and Castaldo, R.: Synthetic aperture radar burst overlapped interferometry for the analysis of large ground instabilities: Experiments in volcanic regions., EGU General Assembly 2023, Vienna, Austria, 23–28 Apr 2023, EGU23-15190, https://doi.org/10.5194/egusphere-egu23-15190, 2023.

EGU23-16132 | ECS | Orals | GI6.1

Multiscale imaging of low-enthalpy geothermal reservoir of the Phlegraean Fields caldera from gravity and resistivity data. 

Maurizio Milano, Giuseppe Cavuoto, Alfonso Corniello, Vincenzo Di Fiore, Maurizio Fedi, Nicola Massarotti, Nicola Pelosi, Michele Punzo, Daniela Tarallo, Gian Paolo Donnarumma, and Marina Iorio

The central‐eastern sector of the Phlegraean Fields caldera, southern Italy, is one of the most intensely studied and monitored volcanic active area of the word. This area reveals typical characters of a high‐ enthalpy geothermal systems. However, recently the presence of two different geothermal reservoirs has been outlined: one located in the central sector dominated by highly active vapours generated by episodic arrival of CO2‐rich magmatic fluids and the other one located in the eastern sector (Agnano zone) characterized by a shallow (400-500 m b.s.l.) still hot reservoir, heated by the upward circulation of deep no magmatic hot vapor.

In this study we present preliminary results deriving from the integration of different geophysical surveys carried out in the Agnano plain area, in the frame of the GEOGRID research project. We acquired high-resolution gravity data along two parallel profiles and we investigated the depth, shape and density contrast of the subsurface structures by the CompactDEXP (CDEXP) method, a multiscale iterative imaging technique based on the DEXP method. The resulting density models, together with DC resistivity and stratigraphic data, outlines the presence of a complex morphology of the Agnano subsoil characterized by a horst-graben structure. The importance of the structural lines identified by geophysical data, is also confirmed by the alignment of correlate outcropping thermal waters.

How to cite: Milano, M., Cavuoto, G., Corniello, A., Di Fiore, V., Fedi, M., Massarotti, N., Pelosi, N., Punzo, M., Tarallo, D., Donnarumma, G. P., and Iorio, M.: Multiscale imaging of low-enthalpy geothermal reservoir of the Phlegraean Fields caldera from gravity and resistivity data., EGU General Assembly 2023, Vienna, Austria, 23–28 Apr 2023, EGU23-16132, https://doi.org/10.5194/egusphere-egu23-16132, 2023.

EGU23-787 | ECS | PICO | CR2.3

Mapping stagnant ice and age in the Dome Fuji region, Antarctica, by combining radar internal layer stratigraphy and flow modeling 

Zhuo Wang, Olaf Eisen, Ailsa Chung, Daniel Steinhage, Frédéric Parrenin, and Johannes Freitag

The Dome Fuji (DF) region in Antarctica is a potential site for holding an ice record older than one million years. Here, we combine the internal airborne radar stratigraphy with a 1-D inverse model to reconstruct the age field of ice in the DF region. As part of the Beyond EPICA - Oldest Ice reconnaissance (OIR), the region around DF was surveyed with a total of 19000 km of radar lines in the 2016/17 Antarctic summer. Internal stratigraphy in this region has now been traced. Through these tracked radar isochrones, we transfer the age-depth scale from DF ice core to the adjacent 500 km2 region. A 1-D inverse model has been applied at each point of the survey to extend the age estimates to deeper regions of the ice sheet where no direct or continuous link of internal stratigraphy to the ice cores is possible, and to construct basal thermal state and accumulation rates. Through the reliability index of each model, we can evaluate the reliability of the 1-D assumption. Mapped age of basal ice and age density imply there might exist promising sites with ice older than 1.5 million years in the DF region. Moreover, the deduced basal state, i.e., melting rates and stagnant ice provide constraints for finding old-ice sites with a cold base. The accumulation rate ranges from 0.014 to 0.038 m a-1 (in ice equivalent) in the DF region, which is also an important criterion for potential old ice.

How to cite: Wang, Z., Eisen, O., Chung, A., Steinhage, D., Parrenin, F., and Freitag, J.: Mapping stagnant ice and age in the Dome Fuji region, Antarctica, by combining radar internal layer stratigraphy and flow modeling, EGU General Assembly 2023, Vienna, Austria, 23–28 Apr 2023, EGU23-787, https://doi.org/10.5194/egusphere-egu23-787, 2023.

EGU23-792 | ECS | PICO | CR2.3

What to watch out for when assimilating ice-cores as regional SMB proxies? 

Marie G. P. Cavitte, Hugues Goosse, Kenichi Matsuoka, Sarah Wauthy, Rahul Dey, Vikram Goel, Jean-Louis Tison, Brice Van Liefferinge, and Thamban Meloth

Ice cores remain the highest resolution proxy for measuring past surface mass balance (SMB) that can be used for model-data comparison. However, there is a clear difference in the spatial resolution of the ice cores, with a surface sample on the order of cm2, and the spatial resolution of models, with at best a surface footprint on the order of a few km2. Comparing ice core SMB records and model SMB outputs directly is therefore not a one-to-one comparison. In addition, it is well known that ice cores, as point measurements, sample very local SMB conditions which can be affected by local wind redistribution of the SMB at the surface.

We set out to answer the question: how representative are ice-cores of regional SMB? For this, we use several ground-penetrating radar (GPR) surveys in East Antarctica, which have co-located ice core drill sites. Most of our sites share a relatively similar climatology, as they are all coastal ice promontories/rises along the Dronning Maud Land coast, with the exception of the Dome Fuji survey on the high plateau in the interior of the continent.

We will show that the comparison of the SMB signals of the GPR and the ice core records allows us to estimate the spatial footprint of the ice cores, and that this spatial footprint varies widely from site to site. We will provide a summary of the spatial and temporal characteristics for each location.

How to cite: Cavitte, M. G. P., Goosse, H., Matsuoka, K., Wauthy, S., Dey, R., Goel, V., Tison, J.-L., Van Liefferinge, B., and Meloth, T.: What to watch out for when assimilating ice-cores as regional SMB proxies?, EGU General Assembly 2023, Vienna, Austria, 23–28 Apr 2023, EGU23-792, https://doi.org/10.5194/egusphere-egu23-792, 2023.

EGU23-2178 | ECS | PICO | CR2.3

Radar-derived ice fabric anisotropy and implications on flow enhancement along the Thwaites Glacier Eastern Shear Margin 

Tun Jan Young, Carlos Martin, Thomas Jordan, Ole Zeising, Olaf Eisen, Poul Christoffersen, David Lilien, and Nicholas Rathmann

Glaciers and ice streams account for the majority of ice mass discharge to the ocean from the Antarctic Ice Sheet, and are bounded by intense bands of shear that separate fast-flowing from slow or stagnant ice, called shear margins. The anisotropy of glacier ice (i.e. a preferred crystal orientation) stemming from high rates of shear at these margins can greatly facilitate fast streaming ice flow, however it is still poorly understood due to a lack of in-situ measurements. If anisotropy is incorporated into numerical ice sheet models at all, it is usually as a simple scalar enhancement factor that represents the "flow law" that governs the model's rheology. Ground-based and airborne radar observations along two transects fully crossing the Eastern Shear Margin of Thwaites Glacier reveal rapid development of highly anisotropic fabric tightly concentrated around a lateral maximum in surface shear strain. These measurements of fabric strength at the centre of the shear margin are indicative of a horizontal pole configuration, which potentially represents ice that is “softened” to shearing in some directions and hardened in others. The resulting flow enhancement revealed by our results suggest that the viscosity of ice is highly variable and regime-dependent, and supports the importance of considering anisotropic flow laws to model the rheology of ice sheets.

How to cite: Young, T. J., Martin, C., Jordan, T., Zeising, O., Eisen, O., Christoffersen, P., Lilien, D., and Rathmann, N.: Radar-derived ice fabric anisotropy and implications on flow enhancement along the Thwaites Glacier Eastern Shear Margin, EGU General Assembly 2023, Vienna, Austria, 23–28 Apr 2023, EGU23-2178, https://doi.org/10.5194/egusphere-egu23-2178, 2023.

Permafrost, the frozen layer beneath a freezing and thawing active layer, is an impermeable frozen soil that persists for multiple years. The gradual thawing of permafrost and thickening of the active layer allows a glimpse into the evolution of the hydraulic processes that shape the periglacial landscape. One question in understanding the governing mechanics within the rapidly evolving periglacial landscape is how water retains within or segregates through the active layer to eventually feed rivers. 

In this exploratory study, we analyze data from multiple periglacial hydraulic catchments over time and characterize their hydraulic response rate to stressors. We test whether deconvolution and demixing of noisy time series can isolate precipitation from thawing permafrost signals in river discharge. We use the Ensemble Rainfall-Runoff (ERRA) script, which is effective in inferring nonstationary and nonlinear responses to precipitation using Runoff Response Distribution (RRD), to further test temperature signatures. Using this tool, we measure the RRD for the same catchments both over the years and over the summer months. We hypothesize that an increase in active layer thickness over years and over summer months will delay the RRD due to an increase in water storage.

By analyzing the parameters that change the RRD of periglacial systems with time, soil moisture content, average seasonal and yearly temperatures, and precipitation, we can begin a systematic understanding of how the active layer modulates hydraulic responses and how the responses may be different from other hydraulic systems.

How to cite: Culha, C. and Kirchner, J.: Characterizing melt water properties in the periglacial active layer through seasonal and yearly variations in catchment hydrology., EGU General Assembly 2023, Vienna, Austria, 23–28 Apr 2023, EGU23-4291, https://doi.org/10.5194/egusphere-egu23-4291, 2023.

EGU23-5504 | PICO | CR2.3

Sensitivity of the mass conservation method to the regularisation scheme 

Fabien Gillet-Chaulet, Eliot Jager, and Mathieu Morlighem

While being one of the most important variables for predicting the future of the ice sheets, observations of ice thickness are only available along flight tracks, separated by a few to a few tens of kilometres. For many applications, these observations need to be interpolated on grids at a much higher resolution than the actual average spacing between tracks.

The mass conservation method is an inverse method that combines the sparse ice thickness data with high resolution surface velocity observations to obtain a high-resolution map of ice thickness that conserves mass and minimizes the departure from observations.  As with any inverse method, the problem is ill-posed and requires some regularisation. The classical approach is to use a Tikhonov regularisation that penalizes the spatial derivatives of the ice thickness and therefore favours smooth solutions with implicit spatial correlation structures. In a Bayesian framework, regularization can be seen as an implicit assumption for the prior probability distribution of the inverted parameter. Other popular geostatistical interpolation algorithms, such as kriging, usually require to parameterize the spatial correlation of the interpolated field using standard correlation functions (e.g., gaussian, exponential, Matèrn).

Here we replace the Tikhonov regularisation term in the mass conservation method  by a term that penalises the departure from a prior, where the error statistics are parametrized with the same standard correlation functions. This makes the regularisation independent from grid spacing and regularisation weights do not need to be adjusted. We present and discuss the sensitivity of the mass conservation method to the regularisation scheme using a suite of synthetic and “true” bed from deglaciated areas and show that prescribing the correct regularisation always provides the most accurate solution.

How to cite: Gillet-Chaulet, F., Jager, E., and Morlighem, M.: Sensitivity of the mass conservation method to the regularisation scheme, EGU General Assembly 2023, Vienna, Austria, 23–28 Apr 2023, EGU23-5504, https://doi.org/10.5194/egusphere-egu23-5504, 2023.

EGU23-6770 | PICO | CR2.3

Greenland ice-stream dynamics: short-lived and agile? 

Olaf Eisen, Steven Franke, Paul D. Bons, Julien Westhoff, Ilka Weikusat, Tobias Binder, Kyra Streng, Daniel Steinhage, Veit Helm, John D. Paden, Graeme Eagles, and Daniela Jansen

Reliable knowledge of ice discharge dynamics for the Greenland ice sheet via its ice streams is essential if we are to understand its stability under future climate scenarios as well as their dynamics in the past, especially when using numerical models for diagnosis and prediction. Currently active ice streams in Greenland have been well mapped using remote-sensing data while past ice-stream paths in what are now deglaciated regions can be reconstructed from the landforms they left behind. However, little is known about possible former and now defunct ice streams in areas still covered by ice. Here we use radio-echo sounding data to decipher the regional ice-flow history of the northeastern Greenland ice sheet on the basis of its internal stratigraphy. By creating a three-dimensional reconstruction of time-equivalent horizons, we map folds deep below the surface that we then attribute to the deformation caused by now-extinct ice streams. We propose that locally this ancient ice-!ow regime was much more focused and reached much farther inland than today’s and was deactivated when the main drainage system was reconfigured and relocated southwards. The insight that major ice streams in Greenland might start, shift or abruptly disappear will affect our approaches to understanding and modelling the past or future response of Earth’s ice sheets to global warming. Such behaviour has to be sufficiently reproduced by numerical models operating on the mid- to longer-term timescales to be considered adequate physical representations of the naturally occuring dynamic behaviour of ice streams.

How to cite: Eisen, O., Franke, S., Bons, P. D., Westhoff, J., Weikusat, I., Binder, T., Streng, K., Steinhage, D., Helm, V., Paden, J. D., Eagles, G., and Jansen, D.: Greenland ice-stream dynamics: short-lived and agile?, EGU General Assembly 2023, Vienna, Austria, 23–28 Apr 2023, EGU23-6770, https://doi.org/10.5194/egusphere-egu23-6770, 2023.

EGU23-6900 | ECS | PICO | CR2.3

Determining Basal Mass Balance of Ice Shelves Using Simulation-Based Inference 

Guy Moss, Vjeran Višnjević, Cornelius Schröder, Jakob Macke, and Reinhard Drews

The ice shelves buttressing the Antarctic ice sheet determine its stability. Over half of all mass loss in Antarctica occurs due to ice melting at the water-ice boundary at the base of ice shelves. Different contemporary methods of estimating the spatial distribution of the melting rates do not produce consistent results, and provide no information about decadal to centennial timescales. We explore a new method to infer the spatial distribution of the basal mass balance (BMB) using the internal stratigraphy which may contain additional information not present in other sources such as ice thickness and surface velocities alone. The method estimates the Bayesian posterior distribution of the BMB,  and provides us with a principled measure of uncertainty in our estimates. 


Our inference procedure is based on simulation-based inference (SBI) [1], a novel machine learning inference method. SBI utilizes artificial neural networks to approximate probability distributions which characterize those parameters that yield data-compatible simulations, without the need of an explicit likelihood function. We demonstrate the validity of our method on a synthetic ice shelf example, and then apply it to Ekström ice shelf, East Antarctica, where we have radar measurements of the internal stratigraphy. The inference procedure relies on a simulator of the dynamics of the ice shelves. For this we use the Shallow Shelf Approximation (SSA) implemented in the Python library Icepack [2], and a time-discretized layer tracing scheme [3].  These detailed simulations, along with available stratigraphic data and the SBI methodology, allows us to compute a spatially-varying posterior distribution of the melting rate. This distribution corroborates existing estimates and extends upon them by quantifying the uncertainty in our inference. This uncertainty should be incorporated in future forecasting of ice shelf dynamics and stability analysis.


[1] Lueckmann et al.: Benchmarking simulation-based inference (2020).

[2] Shapero et al.: icepack: a new glacier flow modeling package in Python, version 1.0. (2021).

[3] Born: Tracer transport in an isochronal ice-sheet model (2017).


How to cite: Moss, G., Višnjević, V., Schröder, C., Macke, J., and Drews, R.: Determining Basal Mass Balance of Ice Shelves Using Simulation-Based Inference, EGU General Assembly 2023, Vienna, Austria, 23–28 Apr 2023, EGU23-6900, https://doi.org/10.5194/egusphere-egu23-6900, 2023.

EGU23-8775 | PICO | CR2.3

Advancements in RUC Snow Model for Implementation in the Regional Application of the Unified Forecasting System (UFS) 

Tatiana Smirnova, Anton Kliewer, Siwei He, and Stan Benjamin

RUC land surface model (LSM) was designed for short-range weather predictions with an emphasis on severe weather. The model has been operational at NCEP since 1998. Currently it is utilized in the operational WRF-based Rapid Refresh (RAP) and High-Resolution Rapid Refresh (HRRR) regional models. Being available to the world WRF community, RUC LSM is also used as a land-surface component in operational weather prediction models in Austria, New Zealand and Switzerland.

At present time, RUC LSM is being tested in the regional application of the UFS-based Rapid Refresh FV3 Standalone (RRFS) model to replace operational RAP and HRRR at NCEP.

RUC LSM has improved and matured over the years. The unique feature of this land-surface model is continuous evolution of soil/snow states within moderately coupled land data assimilation (MCLDA). To avoid possible drifts, this feature requires high skill from RUC LSM as well as accurate atmospheric forcing. Continuous snow cycling includes the following snow state variables: snow cover fraction, snow depth, snow water equivalent and snow temperature. To avoid possible inaccuracies in the location of cycled snow on the ground, snow depth is corrected daily using 4-km IMS snow cover information. Work is also underway to further improve RUC snow model for better surface predictions over snow-covered areas. RUC snow model uses “mosaic” approach to account for subgrid variability of snow cover. Within this approach, snow-covered and snow-free portions of the grid cells are treated separately in the solution of energy and moisture budgets. Thus, snow cover fraction becomes a critical parameter, and modifications to its computation have been developed and tested in the RRFS retrospective experiments. Results from these validation experiments will be presented at the meeting.

How to cite: Smirnova, T., Kliewer, A., He, S., and Benjamin, S.: Advancements in RUC Snow Model for Implementation in the Regional Application of the Unified Forecasting System (UFS), EGU General Assembly 2023, Vienna, Austria, 23–28 Apr 2023, EGU23-8775, https://doi.org/10.5194/egusphere-egu23-8775, 2023.

EGU23-9080 | ECS | PICO | CR2.3

Historical snow and ice temperature compilation documents the recent warming of the Greenland ice sheet 

Baptiste Vandecrux, Robert S. Fausto, Jason E. Box, Federico Covi, Regine Hock, Asa Rennermalm, Achim Heilig, Jakob Abermann, Dirk Van As, Anja Løkkegaard, Xavier Fettweis, Paul C. J. P. Smeets, Peter Kuipers Munneke, Michiel Van Den Broeke, Max Brils, Peter L. Langen, Ruth Mottram, and Andreas P. Ahlstrøm

The Greenland ice sheet mass loss is one of the main sources of contemporary sea-level rise. The mass loss is primarily caused by surface melt and the resulting runoff. During the melt season, the ice sheet’s surface receives energy from sunlight absorption and sensible heating, which subsequently heats the subsurface snow and ice. The energy from the previous melt season can also enhance melting in the following summer as less heating is required to bring the snow and ice to the melting point. Subsurface temperatures are therefore both a result and a driver of the timing and magnitude of surface melt on the ice sheet. We present a dataset of more than 3900 measurements of ice, snow and firn temperature at 10 m depth across the Greenland ice sheet spanning the years from 1912 to 2022. We construct an artificial neural network (ANN) model that takes as input the ERA5 reanalysis monthly near-surface air temperature and snowfall for the 1954-2022 period and train it on our compilation of observed 10-meter temperature. We use our dataset and the ANN to evaluate three broadly used regional climate models (RACMO, MAR and HIRHAM). Our ANN model provides an unprecedented and observation-based description of the recent warming of the ice sheet’s near-surface and our evaluation of the three climate models highlights future development for the models. Overall, these findings improve our understanding of the ice sheet’s response to recent atmospheric warming and will help reduce uncertainties of ice sheet surface mass balance estimates.

How to cite: Vandecrux, B., Fausto, R. S., Box, J. E., Covi, F., Hock, R., Rennermalm, A., Heilig, A., Abermann, J., Van As, D., Løkkegaard, A., Fettweis, X., Smeets, P. C. J. P., Kuipers Munneke, P., Van Den Broeke, M., Brils, M., Langen, P. L., Mottram, R., and Ahlstrøm, A. P.: Historical snow and ice temperature compilation documents the recent warming of the Greenland ice sheet, EGU General Assembly 2023, Vienna, Austria, 23–28 Apr 2023, EGU23-9080, https://doi.org/10.5194/egusphere-egu23-9080, 2023.

EGU23-12495 | ECS | PICO | CR2.3

Radar forward modelling as a precursor for statistical inference 

Leah Sophie Muhle, Guy Moss, A. Clara J. Henry, and Reinhard Drews

Projections of the future development of the Antarctic Ice Sheet still exhibit a large degree of uncertainty due to difficulties in constraining parameters of ice-flow models such as basal boundary conditions. Deriving better estimates of these parameters from radargrams could greatly improve model accuracy, but integration of inferred radar attributes into ice-flow models is not yet widespread.

Here, we develop a radar forward modeling framework that is geared to train a machine learning workflow (likely simulation-based inference) to extract radar attributes such as the internal stratigraphy and basal boundary conditions (e.g., frozen vs. wet) from radar data. The workflow starts with ice-dynamic forward models predicting physically sound stratigraphies and internal/basal temperatures for synthetic flow settings using shallow ice, shallow shelf and higher order ice-flow models. This is then used as input to the radar simulator (here gprMax), which calculates the radar image produced by such a stratigraphy. To do so, we match the synthetic permittivities of the modeled stratigraphy with statistical properties known from ice-core logging data and prescribe temperature dependent attenuation via an Arrhenius relation. gprMax is optimized for acceleration using GPUs which can be efficiently employed when solving the FDTD discretized Maxwell equations. Currently, 200 m wide and 500 m deep sections can be simulated on a single NVIDIA GeForce RTX 2070 Super graphics card within 390 minutes. The runtime can be substantially improved in a HPC environment. In order to obtain radar simulations comparable with observations, we also add system specific noise and contributions from volume scattering with variable surface roughness. Here, we focus on 50 MHz pulse radar for which we have many observational counterparts. However, the workflow is designed to encompass multiple ice-dynamic settings and different radar frequencies.

The application of physical forward models will result in physically meaningful radargrams which are indistinguishable from observations. This provides a tool to create datasets for training machine learning workflows for inference without the limitations of hand-labeled data.

How to cite: Muhle, L. S., Moss, G., Henry, A. C. J., and Drews, R.: Radar forward modelling as a precursor for statistical inference, EGU General Assembly 2023, Vienna, Austria, 23–28 Apr 2023, EGU23-12495, https://doi.org/10.5194/egusphere-egu23-12495, 2023.

EGU23-12553 | ECS | PICO | CR2.3

At the bottom of ice streams: unraveling the physics of sliding onset through a glacier-scale field experiment 

Elisa Mantelli, Reinhard Drews, Olaf Eisen, Daniel Farinotti, Martin Luethi, Laurent Mingo, Dustin Schroeder, and Andreas Vieli

Fast ice stream flow at speeds of hundreds to thousands of meters per year is sustained by sliding at the ice sheet base, whereas slow flow outside of ice streams is characterized by limited-to-no basal sliding. In this sense, the transition from no sliding to significant sliding exerts a key control on ice stream flow. The detailed physical processes that enable the onset of basal sliding are somewhat debated, but laboratory experiments, recent theoretical work, and a handful of direct observations support the notion of sliding initiating below the melting point as a result of regelation and premelting. 

In this contribution we describe a recently funded glacier-scale field experiment that has been designed to advance the understanding of sliding onset physics by testing the hypothesis that sliding starts below the melting point. The experiment will take place at the Grenzgletscher (Swiss Alps), which is known to have a cold-based accumulation region and a temperate-based ablation region. Our work will involve extensive surface geophysics (radio echo sounding, terrestrial radar interferometry, radar thermal tomography) aimed at identifying the sliding onset region. This work will guide the site selection for a subsequent borehole study of englacial deformation that is meant illuminate the relation between sliding velocity and basal temperature. The borehole work will allow us to test systematically the hypothesis that sliding starts below the melting point through an extended region of temperature-dependent sliding, and possibly to advance the formulation of temperature-dependent friction laws that are used to describe the onset of sliding in ice flow models.

The focus of this contribution will be specifically on the experimental design - how it is informed by existing theory and observations, and how it will support theoretical and ice flow modeling advances, at the glacier scale and beyond.

How to cite: Mantelli, E., Drews, R., Eisen, O., Farinotti, D., Luethi, M., Mingo, L., Schroeder, D., and Vieli, A.: At the bottom of ice streams: unraveling the physics of sliding onset through a glacier-scale field experiment, EGU General Assembly 2023, Vienna, Austria, 23–28 Apr 2023, EGU23-12553, https://doi.org/10.5194/egusphere-egu23-12553, 2023.

EGU23-14292 | ECS | PICO | CR2.3

Bias correction of climate models using observations over Antarctica. 

Jeremy Carter, Erick Chacón Montalván, and Amber Leeson

Regional Climate Models (RCM) are the primary source of climate data available for impact studies over Antarctica. These climate-models experience significant, large-scale biases over Antarctica for variables such as snowfall, surface temperature and melt. Correcting for these biases is desirable for impact models being driven by meteorological data that aim to produce optimal estimates of for example surface run-off and ice discharge. Typical approaches to bias correction often neglect the handling of uncertainties in parameter estimates and don’t account for the different supports of climate-model and observed data. Here a fully Bayesian approach using latent Gaussian processes is proposed for bias correction, where parameter uncertainties are propagated through the model. Advantages of this approach are demonstrated by bias-correcting RCM output for near-surface air temperature over Antarctica.

How to cite: Carter, J., Chacón Montalván, E., and Leeson, A.: Bias correction of climate models using observations over Antarctica., EGU General Assembly 2023, Vienna, Austria, 23–28 Apr 2023, EGU23-14292, https://doi.org/10.5194/egusphere-egu23-14292, 2023.

EGU23-15374 | ECS | PICO | CR2.3

Reconstructing accumulation rates of the Greenland ice sheet using dated radiostratigraphy 

Philipp Immanuel Voigt and Andreas Born

The stability of the Greenland ice sheet is poorly constrained even for benchmark periods such as the mid-Holocene or Eemian. Since ice stratigraphy holds a record of both surface mass balance (SMB) and ice dynamics, dated radiostratigraphy offer a potential route to improved reconstructions. Here we explicitly simulate isochrones and employ inverse methods to optimize the solution. The Englacial Layer Simulation Architecture (ELSA) coupled with a thermomechanical ice sheet model computes the isochrones or ice layers, which enable the direct comparison with the radiostratigraphy data. The accumulation rates force ELSA, and are adjusted until the model reproduces the observations within their uncertainties. We deploy the Ensemble Kalman Smoother for the data assimilation. This results in not only the reconstruction of the SMB; an optimized simulation of the ice sheet is obtained by solving the corresponding forward problem. Hence, the contribution to sea level change by Greenland over the same period can also be constrained.

Here we present our initial approach and preliminary results of SMB reconstruction. Future plans and expansions of the work are also presented, involving the study of several model parameters such as basal traction.

How to cite: Voigt, P. I. and Born, A.: Reconstructing accumulation rates of the Greenland ice sheet using dated radiostratigraphy, EGU General Assembly 2023, Vienna, Austria, 23–28 Apr 2023, EGU23-15374, https://doi.org/10.5194/egusphere-egu23-15374, 2023.

This study investigates the reasons for the decrease in the water level of Beysehir Lake and the shrinkage in the lake's surface area in recent years. For this purpose, the lake water level was determined from multi-mission satellite altimeter data, and the lake area was calculated using high-resolution optical satellite images. Data from Copernicus Global Land Service was used for multi-mission satellite altimeter data, and the lake level trend between 1993-2022 was calculated with the least squares method. European Space Agency's (ESA) Sentinel-2 high-resolution optical images were used to determine the change in the lake surface area between 2015 and 2020. These high-resolution optical images were processed with The Sentinel Application Platform (SNAP) software. The Normalized Difference Water Index (NDWI) and Modified Normalized Difference Water Index (MNDWI) were calculated based on processed optical images, and these indexes reflect the changes in water surface area. From the satellite altimeter data, a decreasing trend of 2.5 ± 0.5 cm/yr in the lake water level in the last ten years and shrinkage of approximately 8 km2 in the last 6 years from the satellite images were determined. The possibility of one of the most important reasons being drought was emphasized, and monthly average air temperature data and monthly average precipitation data were obtained from the Turkish General Directorate of Meteorology. With these data, 3- and 12-month Standardized Precipitation Evapotranspiration Index (SPEI) were calculated. Regarding these calculated drought indexes, moderate, extreme, and severe hydrological drought has been determined in the region. According to the analysis, drought is thought to be the most important reason for the decrease in the lake water level and shrinkage in the lake surface area.

Keywords : Geodesy for Climate, Lake Water Level, Satellite Altimetry, In-situ observation, Sentinel-2

How to cite: Erkoç, M. H.: Examination of Causes for Decrease in the Water Level of Beysehir Lake and Shrinkage in the Lake's Surface Area., EGU General Assembly 2023, Vienna, Austria, 23–28 Apr 2023, EGU23-258, https://doi.org/10.5194/egusphere-egu23-258, 2023.

Gravity Recovery and Climate Experiment (GRACE) and GRACE-FollowOn (GFO) satellites can monitor the global spatio-temporal changes in terrestrial water storage anomalies (TWSA) with monthly temporal and ~300 km spatial resolutions. Since these native resolutions may not be adequate for various studies requiring better localization of TWSA signal both in spatial and temporal domains, in recent years, considerable efforts have been devoted to downscaling TWSA to higher resolutions. However, the majority of these studies have focused on spatial downscaling; only a few studies attempted to improve the temporal resolution. Here, we utilized an in-house developed Deep Learning (DL) based model to downscale the monthly GRACE/GFO Mass Concentration (Mascon) TWSA to daily resolution across the Contiguous United States (CONUS). The simulative performance of the DL algorithm is tested by comparing the simulations to independent (non-GRACE) dataset and the land hydrology models. In addition, we assessed the potential of our daily simulations to detect long- and short-term variations in TWSA. The validation results show that our DL-aided simulations do not overestimate or underestimate GRACE/GFO TWSA and can monitor variations in the water cycle at a higher temporal resolution.

How to cite: Uz, M., Akyılmaz, O., and Shum, C.: Deep Learning-aided Temporal Downscaling of Satellite GravimetryTerrestrial Water Storage Anomalies Across the Contiguous United States (CONUS), EGU General Assembly 2023, Vienna, Austria, 23–28 Apr 2023, EGU23-632, https://doi.org/10.5194/egusphere-egu23-632, 2023.

EGU23-1929 | ECS | Posters on site | G3.1

Hydrospheric mass loading for Europe from GNSS vertical displacement and a hydrological model 

Gael Kermarrec, Anna Klos, Henryk Dobslaw, Janusz Bogusz, and Annette Eicker

The interpretation of hydrospheric changes in the context of climate change can be enhanced using Global Navigation Satellite System (GNSS) displacement time series (DTS) combined with the one of a hydrological model. Our methodology is based on a computationally filtering strategy called the Savitzky-Golay filter and applied to selected stations in Europe. We use the GNSS solutions provided by the International GNSS Service (IGS) and, for the first time, the Nevada Geodetic Laboratory (NGL). The new hybrid dataset shows a high correspondence with DTS derived from the Gravity Recovery and Climate Experiment (GRACE) gravity mission but allows the identification of local and station-specific effects. Prior to this analysis, we eliminate various effects such as non-tidal atmospheric and oceanic loadings, glacial isostatic adjustment, barystatic sea-level changes, or thermoelastic deformation from GNSS DTS.

How to cite: Kermarrec, G., Klos, A., Dobslaw, H., Bogusz, J., and Eicker, A.: Hydrospheric mass loading for Europe from GNSS vertical displacement and a hydrological model, EGU General Assembly 2023, Vienna, Austria, 23–28 Apr 2023, EGU23-1929, https://doi.org/10.5194/egusphere-egu23-1929, 2023.

EGU23-2734 | ECS | Orals | G3.1

Reconstructing a new terrestrial water storage deficit index to detect and quantify drought in the Yangtze River Basin 

Xuewen Wan, Nengfang Chao, Ying Hu, Jiangyuan Wang, Zheng Liu, and Kaihui Zou

With the intensification of global climate change, droughts have occurred frequently in the Yangtze River Basin (YRB), which has caused significant impacts on human production, life, and socio-economic development. To reduce the damage caused by drought in the YRB, the drought characteristics must be comprehensively detected and quantified. Here, the spatial and temporal variability of precipitation, runoff, soil moisture, terrestrial water storage, and groundwater in the YRB from the Gravity Recovery and Climate Experiment (GRACE), hydrological and in situ observations were comprehensively estimated by decomposing them into seasonal, subseasonal, trend, and interannual observations. The new weighted GRACE drought standardisation index (WGDSI) was reconstructed using the component contribution ratio and compared with the standardised soil moisture index (SSI), standardised precipitation index (SPI06), and standardisation runoff index (SRI). Additionally, the drought characteristics identified based on observations of the water storage deficit, severity, peak, duration, and recovery time were also quantified using the WGDSI over the YRB. The results indicated that changes in soil moisture, terrestrial water storage, and groundwater in the YRB increased from 2003 to 2019 and mainly based on seasonal and interannual signals. The correlation coefficients between the WGDSI and the SSI, SPI06, and SRI were 0.92, 0.62, and 0.79, respectively, which represented increases of 9%, 14%, and 21% compared to that with the unweighted GRACE drought standardisation index, respectively. The interannual variability of the hydrologic variables was more consistent with drought events in the YRB, which was beneficial for detecting drought. Two serious droughts occurred in the YRB from 2003 to 2019. In 2006, a continuous 7-month-long drought occurred, with a peak at -28.974 km3, severity of -174.767 km3∙month, average drought recovery rate of 0.83 km3/month, and recovery time of 30 months, while in 2011, a continuous 5-month-long drought occurred, with a peak at -18.384 km3, severity of -78.106 km3/month, average drought recovery rate of 0.40 km3/month and recovery time of 39 months. The above results indicate that the WGDSI can be used to monitor and quantify drought over the YRB. The index proposed in this study can be applied to generate new datasets and methods for detecting and quantifying global drought.

How to cite: Wan, X., Chao, N., Hu, Y., Wang, J., Liu, Z., and Zou, K.: Reconstructing a new terrestrial water storage deficit index to detect and quantify drought in the Yangtze River Basin, EGU General Assembly 2023, Vienna, Austria, 23–28 Apr 2023, EGU23-2734, https://doi.org/10.5194/egusphere-egu23-2734, 2023.

EGU23-4048 | ECS | Posters on site | G3.1

Empirical GNSS-derived terrestrial water storage-streamflow relationship in the Sierra Nevada ranges, California 

Nicholas Lau, Ellen Knappe, and Adrian Borsa

One of the most dynamic components of Earth surface mass variability is the constant global redistribution of terrestrial water storage (TWS) across temporal scales of hours to decades. Mass loading and unloading from TWS changes induce instantaneous elastic deformation of the solid earth, producing predominantly vertical transient displacements that are observable by geodetic methods. The global expansion of Global Navigation Satellite Systems (GNSS) networks during the last decade have provided new opportunities of directly estimating changes in TWS at high spatial and temporal resolutions. While contemporary GNSS studies have demonstrated the ability to map regional-scale water storage variability, incorporating these geodetic TWS estimates with in-situ hydrologic measurements can provide further insights on the physical mechanisms underlying the terrestrial water cycle.


In this study, we investigate the potential of using GNSS-derived TWS estimates to infer individual watershed condition along California’s Sierra Nevada, a major water source for urban and agricultural use. Utilizing the dense GNSS network in the western United States, we invert vertical displacements for TWS change at subbasin scale spatial resolution (USGS HUC-8). Joint analysis of our TWS estimates and stream gauge data shows contrasting seasonal behaviours in the northern and southern Sierra Nevada. The snow-dominated southern section exhibits a significant time lag between maximum storage and maximum baseflow from March to May, indicating wet-season decoupling between surface storage and the subsurface reservoirs that drive baseflow. In contrast, the northern section exhibits little to no lag, indicative of persistent surface-to-subsurface coupling, consistent with the higher rain-to-snow ratio in the north. Furthermore, we demonstrate that GNSS-derived TWS estimates can be used to infer watershed antecedent storage conditions, in which interannual variability in summer storage (dry season) influences streamflow recession behaviours during early precipitation season. Continued development of GNSS-based water storage estimates and future assimilation with hydrologic models should provide additional understanding of the water budget and hillslope hydrology in the Sierra Nevada.

How to cite: Lau, N., Knappe, E., and Borsa, A.: Empirical GNSS-derived terrestrial water storage-streamflow relationship in the Sierra Nevada ranges, California, EGU General Assembly 2023, Vienna, Austria, 23–28 Apr 2023, EGU23-4048, https://doi.org/10.5194/egusphere-egu23-4048, 2023.

EGU23-4288 | ECS | Posters on site | G3.1

Quality assessment of the gridded climate indices estimated from GNSS displacements for the European area 

Artur Lenczuk, Anna Klos, and Janusz Bogusz

For more than 30 years, the Global Navigation Satellite System (GNSS) has successfully detected local crust deformations. These changes in deformation are caused, among other things, by changes in Total Water Storage (TWS), which reflect regular changes in the water system, but are also coupled with changes resulting from unexpected climate change. Current water conflicts caused by climate variability, increased human activity, population growth and food demand are leading to an increased importance of monitoring the abundance of the terrestrial hydrosphere. Such monitoring is increasingly being carried out using GNSS observations, mainly due to the impressive number of permanent stations distributed on Earth. However, the distribution of GNSS stations is irregular, and the displacement time series is often incomplete. Moreover, because of systematic errors, consistency of several parameters estimated for nearby GNSS stations may be very low. To eliminate the impact of these errors, but still capture regular changes in the climate system, we estimated drought severity index (DSI) using GNSS displacement time series over Europe, and interpolated these station-based DSI values over European area in a 1 per 1 degree grid. The quality of interpolated GNSS-DSI values has been assessed using four external datasets: (1) the Gravity Recovery and Climate Experiment (GRACE) and GRACE Follow-On (GRACE-FO) data, (2) combination of GRACE/-FO data with the Satellite Laser Ranging (SLR) data, provided by the University of Bonn, (3) combination of SLR data and high-low Satellite-To-Satellite Tracking (hlSST) data, provided by Leibniz University Hannover, and (4) the self-calibrating Palmer Drought Severity Index (scPDSI). The external datasets have low spatial resolution, when compared to station-dependent GNSS-DSI and the scPDSI index is unable to capture several real water changes. Using GNSS displacements for estimated of DSI reduces these limitations. Our results show that GNSS-based DSI is spatially coherent with indicators derived from other datasets and is able to map dry and wet periods occurring over Europe. GNSS-DSI are also able to capture extreme short events not observed by other datasets. We note that the GRACE-DSI values show the least consistency with GNSS-DSI values. We find also that the DSI values estimated from combined GRACE and SLR indices have largest root-mean-square values for Europe. Our results show that GNSS displacements can be applied to study human and/or climate impact on water changes in small spatial and temporal scales, which may be averaged out in the other datasets; this hold the true especially in regions where GNSS stations are densely distributed.

How to cite: Lenczuk, A., Klos, A., and Bogusz, J.: Quality assessment of the gridded climate indices estimated from GNSS displacements for the European area, EGU General Assembly 2023, Vienna, Austria, 23–28 Apr 2023, EGU23-4288, https://doi.org/10.5194/egusphere-egu23-4288, 2023.

EGU23-4554 | ECS | Orals | G3.1 | Highlight

A Detection of the Sea Level Fingerprint of Greenland Ice Sheet Melt 

Sophie Coulson, Sonke Dangendorf, Jerry X. Mitrovica, Mark Tamisiea, Linda Pan, and David Sandwell

Rapid melting of ice sheets and glaciers drives a unique geometry, or fingerprint, of sea-level change, including a sea-level fall in the vicinity of the ice sheet that is an order of magnitude greater than the associated global mean sea-level rise of the melt event. The detection of individual fingerprints has been challenging due to sparse sea surface height measurements at high latitudes and the difficulty of disentangling ocean dynamic variability from the signal. Efforts to date have analyzed sea level records outside the zone of major sea-level fall, where the gradients and amplitudes of the fingerprint signal are significantly lower. We predict the fingerprint of Greenland Ice Sheet (GrIS) melt using new ice mass loss estimates from radar altimetry data and model reconstructions of nearby glaciers, and compare this prediction to an independent, altimetry-derived sea surface height trend corrected for ocean dynamic variability in the region adjacent to the ice sheet. The two fields show consistent gradients across the region, with the expected strong drawdown of the sea surface toward GrIS. A statistically significant correlation between the two fields (p < 0.001) provides the first unambiguous observational detection of the near-field sea level fingerprint of recent GrIS melting in our warming world. This detection provides a robust map of the impact of ice mass flux on global oceans since the early 1990s, and validates theoretical and numerical developments in the sea level modelling community.

How to cite: Coulson, S., Dangendorf, S., Mitrovica, J. X., Tamisiea, M., Pan, L., and Sandwell, D.: A Detection of the Sea Level Fingerprint of Greenland Ice Sheet Melt, EGU General Assembly 2023, Vienna, Austria, 23–28 Apr 2023, EGU23-4554, https://doi.org/10.5194/egusphere-egu23-4554, 2023.

EGU23-5086 | ECS | Orals | G3.1

The global land water storage data set GLWS 2.0: assimilating GRACE and GRACE-FO into a global hydrological model 

Helena Gerdener, Jürgen Kusche, Kerstin Schulze, Petra Döll, and Anna Klos

The satellite mission Gravity Recovery And Climate Experiment (GRACE) provided and its successor GRACE-FollowOn (GRACE-FO) provides a great opportunity to derive observations of the global water cycle from space. The missions have contributed and largely increased our knowledge about various hydrological processes on Earth, for example the melting of glaciers in Greenland or groundwater depletion in India. Nonetheless, the spatial resolution of about 300 km, missing months in the time series and the multi-month gap between GRACE and GRACE-FO complicate or even impede the usage in some applications. Further, separating single storage information, e.g. groundwater, from the GRACE/-FO derived total water storage anomalies (TWSA) is still difficult.

In recent decades, data assimilation techniques were used to downscale and disaggregate the GRACE/-FO TWSA, however, to our knowledge they focus on hydrological instead of geodetic applications, only a few assimilate GRACE/-FO TWSA on a global scale and open access is rare. Therefore, we provide the new Global Land Water Storage (GLWS2.0) data set that offers total water storage anomalies on a 0.5° monthly grid covering the global land except Greenland and Antarctica for the time period 2003 to 2019 without missing months and the GRACE/GRACE-FO gap and will soon be publicly available. GLWS2.0 is derived by assimilating GRACE and GRACE-FO TWSA into the WaterGAP model using the Ensemble Kalman Filter considering uncertainties.

We contrast the GLWS2.0 data with the GRACE/-FO observations and the model simulations in the spatial domain via linear trends, annual amplitudes and non-seasonal TWSA and in the spectral domain via degree variances, c20 coefficients and other representation of spherical harmonics. Worldwide, 1030 GNSS stations are used to validate GLWS2.0 by analyzing the vertical loading at short-term, seasonal and long-term temporal bands and we find that GLWS2.0 agrees better with GNSS than GRACE/-FO. In addition, a good agreement to another global data assimilation product is found, which assimilates GRACE/-FO TWSA into the Catchment Land Surface Model by NASA’s Goddard Space Flight Center.

How to cite: Gerdener, H., Kusche, J., Schulze, K., Döll, P., and Klos, A.: The global land water storage data set GLWS 2.0: assimilating GRACE and GRACE-FO into a global hydrological model, EGU General Assembly 2023, Vienna, Austria, 23–28 Apr 2023, EGU23-5086, https://doi.org/10.5194/egusphere-egu23-5086, 2023.

The Gravity Recovery and Climate Experiment (GRACE) mission has monitored total water storage anomalies (TWSA) globally with unprecedented resolution and accuracy since 2002. However, many applications require a data-based, multi-decadal extended record of TWSA prior to the GRACE period as well as bridging the eleven-months gap between GRACE and its successor GRACE-FO. Statistical and machine-learning 'reconstruction' approaches have been developed to this end, mostly via identifying relations of GRACE-derived TWSA to climate variables, and some regional or global land data sets are now publicly available.

In this contribution, we  compare the two global reconstructions by HUMPHREY AND GUDMUNDSSON (2019) and LI ET AL. (2021) mutually and against output from the the WaterGAP hydrological model from 1979 onwards, against large-scale mass-change derived from geodetic satellite laser ranging from 1992 onwards, and finally against differing GRACE/-FO solutions from 2002 onwards. 

We find that the reconstructions agree surprisingly well in many regions at seasonal and sub-seasonal timescales, even in the pre-GRACE era. We find larger differences at inter-annual timescales which we speculate are in part due to the way reconstructions are trained and in part on which specific GRACE solution they are trained as well as the climatological characteristic of the region. Our comparisons against independent SLR data reveal that reconstructions (only) partially succeed in representing anomalous TWSA for regions that are influenced by large climate modes such as ENSO.

How to cite: Hacker, C.: How realistic are multi-decadal reconstructions of GRACE-like total water storage anomalies?, EGU General Assembly 2023, Vienna, Austria, 23–28 Apr 2023, EGU23-5486, https://doi.org/10.5194/egusphere-egu23-5486, 2023.

EGU23-5889 | ECS | Orals | G3.1

Influence of GIA uncertainty on climate applications from satellite gravimetry 

Lennart Schawohl, Annette Eicker, Meike Bagge, and Henryk Dobslaw

Global coupled climate models are important for predicting future climate conditions. Due to sometimes large and often systematic model uncertainties, it is crucial to evaluate the outcome of model experiments against independent observations. Changes in the distribution and availability of terrestrial water storage (TWS), which can be measured by the satellite gravimetry missions GRACE and GRACE-FO, represent an important part of the climate system. However, the use of satellite gravity data for the evaluation of coupled climate models has only very recently become feasible. Challenges arise, e.g., from the still rather short time series of satellite data and from signal separation issues related to GRACE/-FO observing all mass change including non-water related variations such as glacial isostatic adjustment. Apart from climate model uncertainties, these challenges might be the reason for a disagreement between the direction of linear water storage trends of models and observations in several regions of the world, one of them located in Eastern Canada.

This presentation will highlight the latest results achieved from our ongoing research on climate model evaluation based on the analysis of an ensemble of models from the Coupled Model Intercomparison Project Phase 6 (CMIP6). We will focus on long-term wetting and drying conditions in TWS. Using an ensemble of 52 GIA models that differ in the applied ice history, solid Earth rheology, and numerical code, this presentation will discuss how GIA modeling uncertainty does influence (i) the determination of water storage trends from GRACE/FO data, and (ii) the (dis-)agreement between drying/wetting trends in satellite gravimetry and CMIP6 climate models. We will show that the apparent disagreement between observations and models in highly GIA-affected regions in North America crucially depend on the particular model chosen for reducing the GIA effect from the GRACE satellite data.

How to cite: Schawohl, L., Eicker, A., Bagge, M., and Dobslaw, H.: Influence of GIA uncertainty on climate applications from satellite gravimetry, EGU General Assembly 2023, Vienna, Austria, 23–28 Apr 2023, EGU23-5889, https://doi.org/10.5194/egusphere-egu23-5889, 2023.

EGU23-6919 | ECS | Orals | G3.1

Combined GNSS Reflectometry/Refractometry for Continuous In Situ Surface Mass Balance Estimation on an Antarctic Ice Shelf 

Ladina Steiner, Holger Schmitthüsen, Jens Wickert, and Olaf Eisen

We developed a methodology for deriving automated and continuous specific surface mass balance time series for fast moving parts of ice sheets and shelves (>10m/a) by an accurate and simultaneous estimation of continuous in-situ snow density, snow water equivalent (SWE), and snow deposition and erosion, averaged over an area of several square meters and independent on weather conditions. Reliable in-situ surface mass balance estimates are scarce due to limited spatial and temporal data availability. While surface accumulation can be obtained in various ways, conversion to mass requires knowledge of the snow density, which is more difficult to obtain.

A combined Global Navigation Satellite Systems reflectometry and refractometry (GNSS-RR) approach based on in-situ refracted and reflected GNSS signals is developed. The individual GNSS-RR methods have already been successfully applied on stationary grounds and seasonal snowpacks and are now combined and transferred to moving surfaces like ice sheets. We installed a combined GNSS-RR system in November 2021 on the fast moving (~150m/d), high latitude Ekström ice shelf in the vicinity of the Neumayer III station in Antarctica. Continuous snow accumulation reference data is provided by a laser distance sensor at the same test site and manual density observations. Refracted and reflected GNSS observations from site are post-processed for SWE, snow accumulation, and snow density estimation with a sub-daily temporal resolution. Preliminary results of the first year of data show a high level of agreement with reference observations, calculated from snow accumulation data collected by the laser distance sensor and linearly interpolated monthly snow density observations of the uppermost layer equivalent to the height of snow above the buried antenna.

The deployed devices are geared towards prototype applications for reliable low-cost applications, which will allow large-scale retrieval of surface mass balance for general cryospheric applications, not only on ice sheets or shelves, but also sea ice. Regional climate models, snow modelling, and extensive remote sensing data products will profit from calibration and validation based on the derived field measurements, once such sensors can be deployed on larger scales.

How to cite: Steiner, L., Schmitthüsen, H., Wickert, J., and Eisen, O.: Combined GNSS Reflectometry/Refractometry for Continuous In Situ Surface Mass Balance Estimation on an Antarctic Ice Shelf, EGU General Assembly 2023, Vienna, Austria, 23–28 Apr 2023, EGU23-6919, https://doi.org/10.5194/egusphere-egu23-6919, 2023.

EGU23-7836 | Orals | G3.1

GNSS-derived Precipitable Water Vapor for Climate Monitoring 

Galina Dick, Florian Zus, Jens Wickert, Benjamin Männel, and Markus Bradke

Global Navigation Satellite System (GNSS) is now an established observing system for atmospheric water vapour with high spatiotemporal resolution. Water vapour is under-sampled in the current climate-observing systems and obtaining and exploiting more high-quality humidity observations is essential for climate monitoring.

The Global Climate Observing System (GCOS), supported by the World Meteorological Organization (WMO), is establishing a reference climate observation network, the GCOS Reference Upper Air Network (GRUAN). Currently, this network comprises 30 reference sites worldwide, designed to detect long-term trends of key climate variables such as temperature and humidity in the upper atmosphere. GRUAN observations are required to be of reference quality, with known biases removed and with an associated uncertainty value, based on thorough characterization of all sources of measurement. In support of these goals, GNSS precipitable water (GNSS-PW) measurement has been included as a priority one measurement of the essential climate variable water vapor. The GNSS-PW program produces a nearly continuous reference measurement of PW and is therefore a substantial part of GRUAN.

GFZ contributes to GRUAN with its expertise in processing of ground-based GNSS network data to generate precise PW products. GFZ hosts a central processing facility for the GNSS data and is responsible for the installation of GNSS hardware, data transfer, processing and archiving, as well as derivation of GNSS-PW products according to GRUAN requirements including PW uncertainty estimation. Currently half of the GRUAN sites are equipped with GNSS receivers. GNSS-PW products for GRUAN and the results of validation studies will be presented.


How to cite: Dick, G., Zus, F., Wickert, J., Männel, B., and Bradke, M.: GNSS-derived Precipitable Water Vapor for Climate Monitoring, EGU General Assembly 2023, Vienna, Austria, 23–28 Apr 2023, EGU23-7836, https://doi.org/10.5194/egusphere-egu23-7836, 2023.

EGU23-8001 | ECS | Posters virtual | G3.1

Revisiting the global mean ocean mass budget over 2005-2020 

Anne Barnoud, Julia Pfeffer, Anny Cazenave, Robin Fraudeau, Victor Rousseau, and Michaël Ablain

We investigate the performances of GRACE and GRACE Follow-On satellite gravimetry missions in assessing the ocean mass budget at global scale over 2005-2020. For that purpose, we focus on the last years of the record (2015-2020) when GRACE and GRACE Follow-On faced instrumental problems. We compare the global mean ocean mass estimates from GRACE and GRACE Follow-On to the sum of its contributions from Greenland, Antarctica, land glaciers, terrestrial water storage and atmospheric water content estimated with independent observations. Significant residuals are observed in the global mean ocean mass budget at interannual time scales. Our analyses suggest that the terrestrial water storage variations based on global hydrological model likely contributes to a large part to the misclosure of the global mean ocean mass budget at interannual time scales. We also compare the GRACE-based global mean ocean mass with the altimetry-based global mean sea level corrected for the Argo-based thermosteric contribution (an equivalent of global mean ocean mass). After correcting for the wet troposphere drift of the radiometer on-board the Jason-3 altimeter satellite, we find that mass budget misclosure is reduced but still significant. However, replacing the Argo-based thermosteric component by the ORAS5 ocean reanlaysis or from CERES top of the atmosphere observations leads to closure of the mass budget over the 2015-2020 time span. We conclude that the two most likely sources of error in the global mean ocean mass budget are the thermosteric component based on Argo and the terrestrial water storage contribution based on global hydrological models. The GRACE and GRACE Follow-On data are unlikely to be responsible on their own for the non-closure of the global mean ocean mass budget.

How to cite: Barnoud, A., Pfeffer, J., Cazenave, A., Fraudeau, R., Rousseau, V., and Ablain, M.: Revisiting the global mean ocean mass budget over 2005-2020, EGU General Assembly 2023, Vienna, Austria, 23–28 Apr 2023, EGU23-8001, https://doi.org/10.5194/egusphere-egu23-8001, 2023.

EGU23-8590 | ECS | Posters on site | G3.1

Multi-decadal Satellite Gravity Mission Simulations Comparing Resolving Capabilities of a Long-term Trend in the Global Ocean Heat Content 

Marius Schlaak, Pail Roland, Alejandro Blazquez, Benoit Meyssignac, and Jean-Michel Lemoine

Satellite gravity missions have been almost continuously observing global mass transports for more than two decades. The resulting data record already improved our understanding of large-scale processes of the water cycle and is reaching a timespan, which has significance concerning climate related mass transport signals such as changes in the essential climate variables terrestrial water storage (TWS) and sea level. The observations of the currently flown GRACE-FO mission will be continued by NASA’s Mass Change (MC) Mission and extended to the Mass change And Geosciences International Constellation (MAGIC) by ESA’s Next Generation Gravity Mission (NGGM), setting anticipation for higher spatial and temporal resolution of satellite gravity observations in the near future.

This contribution presents initial results of multi-decadal closed loop simulations of current and future satellite gravity observations, comparing their capabilities to allow a direct estimation of long-term trends in changes of TWS and ocean mass. The observed climate signal is based on components of the TWS, as well as mass change signals of oceans, ice sheets, and glaciers extracted from CMIP6 climate projection following the shared socio-economic pathway scenario. A special focus here is on the long-term trend over the oceans. By subtracting the observed ocean mass change from the overall sea level change, the global ocean heat content can be computed from the steric component of the sea-level rise. The resulting long-term trends are then compared to initial inputs to the simulation to illustrate the difference in performance between current and future satellite gravity constellations.

How to cite: Schlaak, M., Roland, P., Blazquez, A., Meyssignac, B., and Lemoine, J.-M.: Multi-decadal Satellite Gravity Mission Simulations Comparing Resolving Capabilities of a Long-term Trend in the Global Ocean Heat Content, EGU General Assembly 2023, Vienna, Austria, 23–28 Apr 2023, EGU23-8590, https://doi.org/10.5194/egusphere-egu23-8590, 2023.

EGU23-9933 | Posters on site | G3.1

Water Mass Fluxes and Budgets at Catchment-Scale over Europe in the Collaborative Research Cluster 'DETECT' 

Benjamin D. Gutknecht, Anne Springer, and Jürgen Kusche

Terrestrial Water Storage (TWS) is a measure of the total amount of net-accumulated water in all continental storage compartments. The Global Climate Observing System programme (GCOS) has recently approved TWS Anomalies as an Essential Climate Variable (ECV). With GRACE and GRACE-FO we have the ability to look back on an observable that can be interpreted as monthly TWS change since the year 2002. In the continental water mass budget equation, this change balances the water fluxes from precipitation, evapotranspiration and runoff. 

Within the framework of the new Collaborative Research Cluster 1502 'DETECT', we analyse terrestrial/atmospheric and surface water fluxes and associated budget contributions from model simulations, reanalyses and remote sensing observations for all larger river basins in Europe and combine them with catchment-integrating TWS variability. While, as a first step, we are updating previous budget analyses with latest available data sets, the project's central objective is to quantify to what extent regional changes of land and water use contribute to observed budget changes.

In this presentation, we introduce our central objectives and show first results of the latest continuation of catchment-wide water mass flux time-series analysis over Europe. We discuss our budgeting strategies as well as opportunities and hurdles concerning data availability and uncertainties --- also in view of the recently launched SWOT mission and future GRACE successors.

How to cite: Gutknecht, B. D., Springer, A., and Kusche, J.: Water Mass Fluxes and Budgets at Catchment-Scale over Europe in the Collaborative Research Cluster 'DETECT', EGU General Assembly 2023, Vienna, Austria, 23–28 Apr 2023, EGU23-9933, https://doi.org/10.5194/egusphere-egu23-9933, 2023.

EGU23-10758 | Orals | G3.1

Resolving the discrepancy betweenthe seasonal oscillation of Earth's fluid envelope estimated with SLR and that assumed in GRACE 

Donald Argus, Felix Landerer, David Wiese, and Geoffrey Blewitt

For 25 years, geodesists have inferred that the displacement of the "geocenter" estimated from (SLR) satellite laser ranging represents fluctuation of Earth's fluid envelope relative to solid Earth.  However, SLR determines the displacement of the (CN) center of network of geodetic sites relative to the (CM) center of mass of Earth, consisting of solid Earth, the oceans, the atmosphere, and continental water, snow, and ice. Because solid Earth's surface is deforming in elastic response to the changing load of continental water, atmosphere and oceans, CN only roughly approximates the (CE) center of mass of solid Earth.  In this study, estimate the velocity of CM relative to the (CE) center of mass of Earth by first correcting SLR site displacements (estimated by the International Laser Ranging Service 2020) for their elastic response relative to CE produced by fluctuations of continental water, atmosphere and oceans.  We maintain that by correcting for loading displacements relative to CE, we arrive at an estimate of the displacement of CE.  We find that transforming the SLR series from CN to CE reduces the discrepancy between the seasonal oscillation of Earth's fluid envelope estimated by SLR and that assumed by GRACE (using the technique of Sun et al. 2017) by 40 per cent.  In both SLR and GRACE, a total of 0.5 x 10¹⁶ kg of mass moves between hemispheres from southern oceans in August to snow-covered areas in North America and Europe (in particular in Canada and Siberia).  The primary remaining difference between the two techniques is that mass in the northern hemisphere is maximum on February 5 in SLR, 20 days before it is maximum on Feb 25 in GRACE.  Knowing the total transfer of the mass of between hemispheres places a boundary constraint on global models of circulation of water on land and in the oceans and atmospheres (that may be applied to forecasting extreme events such as flooding and drought).

How to cite: Argus, D., Landerer, F., Wiese, D., and Blewitt, G.: Resolving the discrepancy betweenthe seasonal oscillation of Earth's fluid envelope estimated with SLR and that assumed in GRACE, EGU General Assembly 2023, Vienna, Austria, 23–28 Apr 2023, EGU23-10758, https://doi.org/10.5194/egusphere-egu23-10758, 2023.

EGU23-12155 | ECS | Posters on site | G3.1 | Highlight

Mass change of Antarctica from new GRACE/GRACE-FO releases 

Barbara Jenny, Nicolaj Hansen, Tim Jensen, and René Forsberg

An important application of the NASA/GFZ GRACE and GRACE-FO satellites is the derivation of ice mass changes in the arctic regions from the gravity field changes. Looking at climate change, it is important to know how fast the ice caps are melting for global sea level rise estimation and validation of climate models. We use recently released L2 GRACE/GRACE-FO models, including the latest CSR release 6.1, which show major improvement over earlier models, especially for Antarctica, as well as the latest TU Graz models.  We also compare the GRACE results to a new surface mass balance model, and joint high-resolution inversion with ESA’s Earth Explorer CryoSat altimetry data, highlighting areas of dynamic changes and giving a higher resolution on the main mass change areas. The study is a precursor to a project for demonstrating use of Level-1 laser data for glacial change detection.

How to cite: Jenny, B., Hansen, N., Jensen, T., and Forsberg, R.: Mass change of Antarctica from new GRACE/GRACE-FO releases, EGU General Assembly 2023, Vienna, Austria, 23–28 Apr 2023, EGU23-12155, https://doi.org/10.5194/egusphere-egu23-12155, 2023.

EGU23-12215 | Orals | G3.1

Study on combination approaches for hydrological angular momentum determined from climate data 

Jolanta Nastula, Tomasz Kur, Justyna Śliwińska, Małgorzata Wińska, and Aleksander Partyka

Geophysical interpretation of polar motion (PM) and finding the sources of its excitation is an important but challenging task that takes place on the boundary between geodesy and geophysics. Especially the role of hydrological signals in PM excitation is not yet fully understood, mainly because of the lack of agreement between estimates of hydrological angular momentum (HAM) computed from different data sources (e.g., land surface models, global hydrological models, satellite gravity measurements).

The recently observed climate changes affect the global distribution and transport of continental water mass, which may also influence the HAM. Projections of past and future changes in the physical and chemical properties of the atmosphere, ocean, and hydrosphere caused by climate change are delivered by climate models, which are collected and made available to the public in the frame of the sixth phase of the Coupled Model Intercomparison Project (CMIP6). Such models provide many of variables, including variations in soil moisture and snow water storage, which are necessary for HAM computation. However, CMIP6 models differ in terms of initial conditions, physical properties of atmosphere, oceans, hydrosphere, and climate forcing. Such divergences obviously contribute to the differences between various CMIP6-based HAM series.

In this study, we investigate various groups of models according to providing institute, mean of selected models and more sophisticated combinations determined using different methods like e.g., variance components estimation, three cornered hat method. The obtained series are analyzed and evaluated in several spectral bands. The goal of such study is to check whether grouping or combining the models could improve the consistency between CMIP6-based HAM and hydrological signal in geodetically observed PM excitation. To evaluate the combined CMIP6-based HAM series, we compare them with geodetic residuals (GAO) obtained from geodetic angular momentum reduced by atmospheric and oceanic signals, as well as with HAM computed from data from Gravity Recovery and Climate Experiment (GRACE) mission. Generally, the analyses confirm the results obtained from previous studies (Nastula et al. 2022). It is possible to find grouped CMIP6 models that provide HAM series as or more compliant with GAO than HAM determined from GRACE.

How to cite: Nastula, J., Kur, T., Śliwińska, J., Wińska, M., and Partyka, A.: Study on combination approaches for hydrological angular momentum determined from climate data, EGU General Assembly 2023, Vienna, Austria, 23–28 Apr 2023, EGU23-12215, https://doi.org/10.5194/egusphere-egu23-12215, 2023.

EGU23-12349 | Orals | G3.1 | Highlight

ICESat-2 Ice Sheet Mass balance: Going below the surface 

Nicolaj Hansen, Louise S. Sørensen, Giorgio Spada, Daniele Melini, Rene Forsberg, Ruth Mottram, and Sebastian B. Simonsen

We use the land-ice surface height data product (ATL06 release 5) from NASA’s latest satellite laser altimetry, the Ice, Cloud, and Land Elevation Satellite-2 (ICESat-2) to compute surface elevation changes (SEC) from October 2018 to September 2021 over both Antarctica and Greenland. To convert the SEC to mass change we need to remove the non-ice related SEC processes. To remove the signal from the firn compaction, we use an offline surface energy and firn model. The model is driven by outputs from the atmospheric regional climate model HIRHAM5, forced with reanalysis dataset ERA5, and it simulates the physics of the firn pack. The vertical bedrock movement also creates non-ice related signals, the glacial isostatic adjustment has been computed using the ICE-7G model and SELEN4, and the elastic rebound has been computed using a modified version of the REAR code. 

When the SEC are corrected for signals that are not associated with a change in snow or ice mass, we convert to mass change by multiplying the height change with an appropriate density.  The corrected SEC can result from a change in either melt, snow accumulation, or dynamical behavior, this means that the appropriate density depends on which physical processes are driving the observed SEC. In this study, we have made a new density parametrization to convert the volume change into mass change. The density parametrization determines if one should multiply with snow densities (250-350 kg/m³) or ice density (917 kg/m³) based on a number of criteria; the sign of SEC, ice flow velocity, and the altitude of the area.
With our new density parametrization, we get that the Greenland Ice Sheet has lost 237.5±10.3 Gt/year and the grounded Antarctic Ice Sheet has lost -137.6±27.2 Gt/year in the period. These results are in agreement with other mass balance estimates derived with different methods.

How to cite: Hansen, N., Sørensen, L. S., Spada, G., Melini, D., Forsberg, R., Mottram, R., and Simonsen, S. B.: ICESat-2 Ice Sheet Mass balance: Going below the surface, EGU General Assembly 2023, Vienna, Austria, 23–28 Apr 2023, EGU23-12349, https://doi.org/10.5194/egusphere-egu23-12349, 2023.

EGU23-12485 | ECS | Orals | G3.1

Data-Driven and Scaling Factor methods of GRACE leakage correction: Can they be reconciled? 

Vasaw Tripathi, Bramha Dutt Vishwakarma, and Martin Horwath

Time variable satellite gravimetry, realized with the missions GRACE and GRACE-FO, allows for the only global observation of total water storage (TWS) changes. These observations are inherently smoothed due to the upward continuation of the gravity field at the satellite orbits. Additionally, the correlated errors seen as north-south stripes in global maps require further filtering to separate signal from noise. This causes the signal at any region to be biased by signal at neighboring regions, better known as leakage effect. Various methods have been proposed to mitigate leakage and to spatially assign TWS changes at smaller spatial scales than the satellite data is available by using auxiliary information. Unfortunately, there is a large spatio-temporally variable degree of discrepancy in the agreement or the disagreement within these methods, leaving the non-geodetic users of GRACE TWS changes with the complex question of choosing an appropriate method. The scaling factor approach and the Data-Driven Correction (DDC) approach are the most widely used methods. The scaling factor approach uses a numerical model output of TWS changes, whereas the DDC approach uses only GRACE observations to account for leakage.
Tripathi et al., 2022 (10.5194/hess-26-4515-2022) found for the Indus basin, that a newly proposed variant of the scaling factor method, called Frequency-Dependent scaling, using the WaterGAP (Water Global Assessment and Prognosis) hydrology model (WGHM v2.2d), produced results with a striking agreement against the results from the DDC approach. Therefore, this contribution extends the comparison of Frequency-Dependent scaling using WGHM v2.2d against the DDC method for 189 global hydrological basins. We achieved an agreement between the results from both methods well within the uncertainties of GRACE TWS observations for almost 85-90% of the global hydrological basins. Such an agreement can bring a much-needed consolidation in the treatment of leakage effect across the user community. The disagreement in the rest of the basins varies across time scales, such as long-term trends and periodic signals, and is being further analysed.

How to cite: Tripathi, V., Vishwakarma, B. D., and Horwath, M.: Data-Driven and Scaling Factor methods of GRACE leakage correction: Can they be reconciled?, EGU General Assembly 2023, Vienna, Austria, 23–28 Apr 2023, EGU23-12485, https://doi.org/10.5194/egusphere-egu23-12485, 2023.

EGU23-13048 | ECS | Orals | G3.1

Prospects of Space Geodesy to Monitor Atmospheric Moisture and Atmospheric Net-Water Fluxes 

Kyriakos Balidakis, Henryk Dobslaw, Florian Zus, Annette Eicker, Robert Dill, and Jens Wickert

Accurate representation of the time-variable atmospheric state is achieved by assimilating numerous and disparse observations into numerical weather models (NWM). The four-dimensional atmospheric density distribution, a derivative of essential meteorological variables, affect among else how electromagnetic signals propagate through Earth’s atmosphere and how satellites orbit through Earth’s gravity field. Atmospheric refraction to which microwave signals are subjected as they traverse the electrically neutral atmosphere is quantified e.g., during the GNSS data analysis, and holds valuable information about the water vapor distribution in the vicinity of the ground stations. Satellite gravimetry as realized by the GRACE and GRACE-FO missions is sensitive to mass redistribution within Earth’s fluid envelope, including but not limited to the atmosphere and the terrestrail water storage, and also to high-frequency variations stemming from the time-integrated effect of precipitation and evapotranspiration. In this contribution we employ two state-of-the-art meso-beta scale NWM (ECMWF’s latest reanalysis ERA5 and DWD’s operational model ICON-global) as well as ERA5‘s ensemble members to demonstrate that tropospheric mosture distribution and net atmospheric freshwater fluxes are quite uncertain in modern NWM in comparison to other quantities such as hydrostatic atmospheric mass and that certain space geodetic observing systems such as GNSS and GRACE-FO are appropriate tools to monitor them, thus enhancing the accuracy of weather prediction.

How to cite: Balidakis, K., Dobslaw, H., Zus, F., Eicker, A., Dill, R., and Wickert, J.: Prospects of Space Geodesy to Monitor Atmospheric Moisture and Atmospheric Net-Water Fluxes, EGU General Assembly 2023, Vienna, Austria, 23–28 Apr 2023, EGU23-13048, https://doi.org/10.5194/egusphere-egu23-13048, 2023.

EGU23-13524 | Posters on site | G3.1

Unravelling watershed fluxes to detect emerging changes of the water balance 

Roelof Rietbroek, Sedigheh Karimi, and Amin Shakya

In a warming climate, atmospheric water vapour will increase, intensifying the global water cycle. However, this ”wet-get-wetter” and ”dry-get-drier” paradigm does not hold on regional scales and models seem to contradict observations. Furthermore, it is unknown whether modelled atmospheric moisture fluxes, entering and leaving the watersheds, are mass consistent with river discharge and sinks and sources such as aquifers, soil layers and surface waters. Consequently, observational evidence of the changing water cycle components is crucial for scrutinizing models. It is also essential to assess climatic water cycle trends which have far reaching ecological and socio-economic consequences, through the occurrence of heat waves, flooding, forest fires and water availability.

In this contribution, we introduce a 5 year research project, which was recently funded through the Vidi talent scheme programme of the Dutch Research Council. We will explain how we plan to use satellite gravimetry, radar altimetry, in a joint inversion scheme, to estimate water fluxes in and out of the watersheds of the North Sea region, and those of the Greater Horn of Africa. Furthermore, we’ll show how regional sea level change and vertical land motion will be consistently accounted for in the proposed estimation scheme.

How to cite: Rietbroek, R., Karimi, S., and Shakya, A.: Unravelling watershed fluxes to detect emerging changes of the water balance, EGU General Assembly 2023, Vienna, Austria, 23–28 Apr 2023, EGU23-13524, https://doi.org/10.5194/egusphere-egu23-13524, 2023.

EGU23-15762 | Posters on site | G3.1

Reduced order rainfall-discharge model for hydro-climatic data assimilation: a data-driven approach 

Karim Douch, Peyman Saemian, and Nico Sneeuw

Hydro-climatic variables such as precipitation (P), evapotranspiration (ET), terrestrial water storage (TWS) or river discharge define the terrestrial water cycle at local and global scales. The robust detection and quantification of steady trends in these variables require analysing sufficiently long time series of observations. Yet, historical discharge records may suffer from long data gaps or simply be too short; different reanalyses or data-driven models of P and ET often show large discrepancies and the associated uncertainty is not systematically provided. Finally, TWS has been observed only since the launch of GRACE in 2002 and also suffers from dozens of missing epochs.

Here, we present a 3-step approach to consistently reconstruct the historical time series of TWS and discharge at the catchment scale. In the first step, we use in-situ discharge observations and TWS anomaly derived from GRACE(-FO) observations to identify a reduced-order and mass-conserving rainfall-discharge model of the catchment. In the second step, the model is run with different precipitation and evapotranspiration data sets to select the pair P and ET reproducing most accurately the observed discharge and TWS. If necessary, the resulting net water flux (P-ET) is adjusted with a bias to improve the simulation accuracy. lastly, we apply a Bayesian smoother such as the Rauch–Tung–Striebel smoother to estimate TWS and discharge along with their respective uncertainty over the period covered by the P-ET time series. Critical to the proposed approach is the rainfall-discharge model identification. Here, we assume that the observed monthly-averaged discharge at the outlet is primarily driven by the TWS in the upstream catchment. As a consequence, we first estimate a storage-discharge model in the form of a continuous-time differential equation. This equation is subsequently coupled with the water mass balance equation to form the rainfall-discharge model. Remarkably, this final model is estimated independently of any P and ET models.

Finally, we apply the proposed approach to Amazonian and Siberian catchments for a period spanning from 1980 to 2020. In the first case, linear and time-invariant models capture with reasonable accuracy the observed drainage dynamics. In contrast, non-linear or linear and time-variable models are necessary to take correctly into account the temperature-dependent snow and ice accumulation and thaw in the case of Siberian catchments.

How to cite: Douch, K., Saemian, P., and Sneeuw, N.: Reduced order rainfall-discharge model for hydro-climatic data assimilation: a data-driven approach, EGU General Assembly 2023, Vienna, Austria, 23–28 Apr 2023, EGU23-15762, https://doi.org/10.5194/egusphere-egu23-15762, 2023.

EGU23-16296 | ECS | Orals | G3.1 | Highlight

Sea-level change along the South American Atlantic coastline 

Carolina M.L. Camargo, Theo Gerkema, Yochi Okta Andrawina, and Aimée B.A. Slangen

In comparison with the number of tide gauges measuring in-situ sea-level change along the Northern Hermisphere coastlines, the Southern Hemisphere has a poor spatial distribution of stations. For example, along the South American Atlantic coastline, only 12 tide gauges are registered at the Permanent Service for Mean Sea-level (PSMSL), of which only two have been updated in the last three years. While satellite altimetry can be used to provide data in locations where there is no in-situ data, estimating coastal sea-level change using altimetry data is challenging due to the distortion of the satellite signal close to the land. Consequently, sea-level change along the South American Atlantic coastline is still poorly understood. Here, we fill this gap by using coastal altimetry products together with a new network of tide gauges deployed along the coast of Brazil (by the SIMCosta project). Via a sea-level budget analysis, we look at the regional drivers of sea-level change along the coast.


Recently, a large effort has been put towards developing algorithms that improve the accuracy of standard radar altimetry in coastal regions. Here, we compare both a coastal altimetry product (XTRACT/ALES) and a standard altimetry product (from CMEMS) to the local tide gauges. Previous studies have shown that, for some regions, coastal sea level is driven by open ocean sea-level change ( e.g., Dangendorf et al, 2021). Following this approach, we use clusters of coherent sea-level variability (Camargo et al., 2022), extracted with a network detection algorithm (delta-Maps), that extend to the open ocean, as proxies of the drivers of sea-level change along the coast.  The northern part of the study region, covering the Amazon Plateau, has a good match between the coastal altimetry-observed sea-level change and the sum of the drivers. The sum of the drivers and coastal altimetry trends also match, considering the uncertainty bars, for the most southern part, covering the Patagonian Shelf. For the other regions, we find a large difference between the coastal altimetry-observed sea-level change and the sum of the drivers. Thus, it is possible that these regions cover large-scale features, which are not strongly correlated with coastal sea level.


References

Camargo, C. M. L., Riva, R. E. M., Hermans, T. H. J., Schütt, E. M., Marcos, M., Hernandez-Carrasco, I., and Slangen, A. B. A.: Regionalizing the Sea-level Budget With Machine Learning Techniques, EGUsphere [preprint, accepted], https://doi.org/10.5194/egusphere-2022-876, 2022.

Dangendorf, S., Frederikse, T., Chafik, L., Klinck, J. M., Ezer, T., & Hamlington, B. D.: Data-driven reconstruction reveals large-scale ocean circulation control on coastal sea level. Nature Climate Change, 11, 514-520. https://doi.org/10.1038/s41558-021-01046-1, 2021.

How to cite: M.L. Camargo, C., Gerkema, T., Okta Andrawina, Y., and B.A. Slangen, A.: Sea-level change along the South American Atlantic coastline, EGU General Assembly 2023, Vienna, Austria, 23–28 Apr 2023, EGU23-16296, https://doi.org/10.5194/egusphere-egu23-16296, 2023.

EGU23-16692 | ECS | Orals | G3.1

Geodetic sensing of mass variations due to climatic conditions 

Jagat Dwipendra Ray, Swapnali Patar, and Rebarani Mahata

The Earth Surface undergoes continuous deformation due to surface mass variations. These mass variations are primarily caused by the hydrological cycle, snowfall, ice melt and glacial isostatic adjustment (GIA). Modern geodetic sensing techniques like the Global Navigational Satellite System (GNSS) can sense these mass variations with unprecedented accuracy.  Therefore, the GNSS positioning time series provides a unique opportunity to study these mass variations and their causes.

In this study, we have used the GNSS time series from the region of Africa and Antarctica to analyse the mass variations. Conditions like draught and ice melting characterise these two regions. Therefore this current study will look at the signals of these two physical conditions. The results obtained are discussed and analysed.

How to cite: Ray, J. D., Patar, S., and Mahata, R.: Geodetic sensing of mass variations due to climatic conditions, EGU General Assembly 2023, Vienna, Austria, 23–28 Apr 2023, EGU23-16692, https://doi.org/10.5194/egusphere-egu23-16692, 2023.

EGU23-3351 | ECS | Posters on site | G3.3

Validation of Modelled Uplift Rates with Space Geodetic Data 

Meike Bagge, Eva Boergens, Kyriakos Balidakis, Volker Klemann, and Henryk Dobslaw

Models of glacial isostatic adjustment (GIA) simulate the time-delayed viscoelastic response of the solid Earth to surface loading induced mainly by mass redistribution between ice and ocean during the last glacial cycle considering for rotational feedback, floating ice and moving coastlines. These models predict relative sea level change and surface deformation. The GIA component of present-day uplift is responsible for crustal uplift rates of more than 10 mm/year in areas such as Churchill (Canada) and Angermanland (Sweden). As GIA models have several uncertainties, the model output needs to be validated against observational data. Here, we validate displacements predicted by a GIA model code, VILMA-3D, by using space geodetically observed vertical land motion. We have created a GIA model ensemble using geodynamically constrained 3D Earth structures derived from seismic tomography to consider more realistic lateral variations in the GIA response. To validate the modelled uplift rates, we employ a multi-analysis-centre ensemble of GNSS station and geocentre motion coordinate solutions that have been assimilated into the latest international terrestrial reference frame (ITRF2020). Tectonic and weather signatures were reduced in estimating GNSS-derived velocities, and the trend signal is extracted from these GNSS time series with the STL method (seasonal-trend decomposition based on Loess).  Additionally, uplift rates observed within the ITRF2020 of VLBI, DORIS, and SLR are employed in this study. Because the geodetic stations are unevenly distributed, we employ a weighting scheme that involves the network density and the cross-correlation of the stations’ displacement time series. As measures of agreement for global and regional cases, we employ weighted root mean square error (RMSE) and weighted mean absolute error (MAE). With this validation, we determine the GIA model parameters that are most suitable for modelling present-day uplift rates and identify regions with the best and worst agreement.

The results show an agreement between RMSE and MAE for the global case (all stations are considered) and the majority of regional cases, except for the farfield (away from formerly glaciated regions) and for North America. For the global case and for separate regions covered by the major ice sheets during glaciation (North America, Fennoscandia, Antarctica, Greenland), the best fit is performed by the GIA models with 3D Earth structures which show largest lateral variability in viscosity. For the GIA model with the best global fit, the MAE ranges between 0.03 and 0.98 for the respective regions British Isles, Antarctica, farfield, Fennoscandia and North America. In contrast, for the three regions with the lowest amount of observational data, Patagonia, Alaska and Greenland, the MAE is increased to values between 2.07 and 8.63. In general, the MAE ranges between 0.83 and 0.78 for the different GIA models when all stations are considered. Both the RMSE and the MAE show a larger spread between the regions than between the considered GIA models indicating the relevance of also evaluating regional differences in the model performance.

How to cite: Bagge, M., Boergens, E., Balidakis, K., Klemann, V., and Dobslaw, H.: Validation of Modelled Uplift Rates with Space Geodetic Data, EGU General Assembly 2023, Vienna, Austria, 23–28 Apr 2023, EGU23-3351, https://doi.org/10.5194/egusphere-egu23-3351, 2023.

EGU23-4604 | ECS | Posters virtual | G3.3

The importance of underestimated local vertical land motion component in sea-level projections: A case study from the Oka estuary, northern Spain 

Tanghua Li, Ane García-Artola, Jennifer Walker, Alejandro Cearreta, and Benjamin Horton

Vertical land motion (VLM) is an important component in relative sea-level (RSL) projections, especially at regional to local scales and over the short to medium term. However, VLM is difficult to derive because of a lack of long-term instrumental records (e.g., GPS, tide gauge). Geological data offer an alternative, revealing RSL histories over thousands of years that can be compared with glacial isostatic adjustment (GIA) models to isolate VLM.

Here, we present a case study from the Oka estuary, northern Spain. We apply two GIA models for the Atlantic coast of Europe with different ice model inputs (ICE-6G_C and ANU-ICE) but the same 3D Earth model. Both models fit well with the late Holocene RSL data along the Atlantic coast of Europe, with misfit statistics < 1.5, except the Oka estuary region, where both models show notable misfits with misfit statistics > 4.5. The significant misfits of both models in the Oka estuary region are indicative of local subsidence. The nearby GPS (station SOPU) with 15 years records shows a VLM rate of -0.96 ± 0.57 mm/yr (subsiding) compared to -0.15 ± 0.40 mm/yr to -2.48 ± 0.37 mm/yr elsewhere along the Atlantic coast of Europe. The VLM rate of SOPU accounts for the misfit between the GIA models and late Holocene RSL data, which decreases by ~90% from > 4.5 to ~0.5 after the subsidence correction of the late Holocene RSL data. The VLM rate incorporated in IPCC AR6 projections in Oka estuary is ~0.18 mm/yr (uplifting), which is contradictory in direction. Therefore, the projected sea-level rise rate is underestimated by 19 - 25% by 2030, 14 - 20% by 2050 and 9 - 26% by 2100 under the five Shared Socioeconomic Pathway (SSP) scenarios (SSP1-1.9, SSP1-2.6, SSP2-4.5, SSP3-7.0, SSP5-8.5). Our study indicates the importance of considering local/regional VLM component in sea-level projections.

How to cite: Li, T., García-Artola, A., Walker, J., Cearreta, A., and Horton, B.: The importance of underestimated local vertical land motion component in sea-level projections: A case study from the Oka estuary, northern Spain, EGU General Assembly 2023, Vienna, Austria, 23–28 Apr 2023, EGU23-4604, https://doi.org/10.5194/egusphere-egu23-4604, 2023.

EGU23-6911 | ECS | Posters on site | G3.3

Study of the impact of rheologies on GIA modeling 

alexandre boughanemi and anthony mémin

The Antarctic Ice Sheet (AIS) is the largest ice sheet on Earth that has known important mass changes during the last 26 kyrs. These changes deform the Earth and modify its gravity field, a process known as Glacial Isostatic Adjustment (GIA). GIA is directly influenced by the mechanical properties and internal structure of the Earth and is monitored using Global Navigation Satellite System positioning or gravity measurements. However, GIA in Antarctica remains poorly constrained due to the cumulative effect of past and present ice-mass changes, the unknown history of the past ice-mass change, and the uncertainties of the mechanical properties of the Earth. The viscous deformation due to GIA is usually modeled using a Maxwell rheology. However, other geophysical processes employ the Andrade rheology for tidal deformation or Burgers for post-seismic deformation which could result in a more rapid response of the Earth. We investigate the effect of using these different rheologies to model GIA-induced deformation in Antarctica.
We use the Love number and Green functions formalism to compute the radial surface displacements and the gravity changes induced by the past and present day ice-mass changes. We use the elastic properties and the radial structure of the Preliminary Reference Earth Model (PREM) and the viscosity profile VM5a given by Peltier et al., 2015 and a modified version of it to account for the recent results published regarding the present-day ice-mass changes. Deformations are computed for each rheological laws mentioned above using ICE6g deglaciation model and altimetry data from various satellite missions over the period 2002 to 2017 to represent the past and present changes of the AIS, respectively.
We find that the three rheological laws lead to significant discrepancies in the Earth response. The differences are the largest between Maxwell and Burgers rheologies during the 100 -1000 years following the beginning of the surface-mass change. First using a simple deglaciation model, we find that the deformations rates can be 3 times and 1.5 times greater using the Burgers and Andrade rheologies. However, the ratio between the gravity change rate and the displacement rate are similar for all rheologies (less than 5% difference). Results show that using the Andrade and Burgers rheologies can lead to a 5 and 10m difference in the radial displacement with regards to the Maxwell rheology, on a 200 year period after deglaciation using the ICE6g model. Regarding the response to present changes in Antarctica, the largest discrepancies are obtained in regions with the greatest current melting rates, namely Thwaites and Pine Island Glacier in West Antarctica. Using the Burgers and Andrade rheologies lead to deformations rates respectively 6 times and 2 times greater with respect to Maxwell rheology.

How to cite: boughanemi, A. and mémin, A.: Study of the impact of rheologies on GIA modeling, EGU General Assembly 2023, Vienna, Austria, 23–28 Apr 2023, EGU23-6911, https://doi.org/10.5194/egusphere-egu23-6911, 2023.

EGU23-7921 | ECS | Orals | G3.3

Emulating the influence of laterally variable Earth structure in a model of glacial isostatic adjustment 

Ryan Love, Parviz Ajourlou, Soran Parang, Glenn A. Milne, Lev Tarasov, and Konstantin Latychev

At present, exploring the space of rheological parameters in models of glacial isostatic adjustment (GIA) and relative sea level (RSL) which incorporate laterally variable Earth structure is computationally expensive. A single simulation using the Seakon model (Latychev et al., 2005), using contemporary high-performance computing hardware, requires several wall-days & ≈ 1 core-year for one RSL simulation from late Marine Isotope Stage 3 to present day. However, it is well established that the impact from laterally variable mantle viscosity and lithospheric thickness on RSL and GIA is significant (Whitehouse, 2018). We present initial results from using the Tensorflow (Abadi et al.) framework to construct artificial neural networks that emulate the difference in the rate of change of relative sea level and relative radial displacement between model configurations using spherically symmetric (SS) and laterally variable (LV) Earth structures. Using this emulator we can accurately sample the parameter space (≈ 360 realisations of the background (SS) structure) for a given realization of lateral Earth structure (e.g. viscosity variations derived from shear-wave tomographic models) using ≈ 1/10th the amount of parameter vectors as a training set. Average misfits are O(0.1-1%) of the total RSL signal when using the emulator to adjust SS GIA model output to incorporate the impact from LV. We shall report on two case studies which allow us to examine the influence of lateral Earth structure on inferences of background (i.e. global-mean) viscosity. For these case studies, the emulator, in conjunction with a fast SS GIA/RSL model, is used to determine optimal Earth model parameters (elastic lithosphere thickness, upper and lower mantle viscosities) by calculating the model misfits across the parameter space. The first case study uses the regional RSL database of Vacchi et al. (2018) which spans the Canadian Arctic and East Coast with several hundred sea level index points and limiting points for the early to late Holocene. The second case study uses a global database of several thousand contemporary uplift rates derived from GPS data (Schumacher et al., 2018). For the first case study we find two main features from incorporating LV structures compared to the SS configuration: a decrease in the best scoring misfit and a shift of the misfit distribution in the parameter space to favour a reduced upper mantle viscosity and reduced sensitivity to the lower mantle viscosity.

References
Abadi, M., Agarwal, A., Barham, P., et al.: TensorFlow: Large-Scale Machine Learning on Heterogeneous Systems, https://www.tensorflow. org/.
Latychev, K., Mitrovica, J. X., Tromp, J., et al.: Glacial isostatic adjustment on 3-D Earth models: a finite-volume formulation, GJI, 161, 421–444, https://doi.org/10.1111/j.1365-246x.2005.02536.x, 2005.
Schumacher, M., King, M. A., Rougier, J., et al.: A new global GPS data set for testing and improving modelled GIA uplift rates, GJI, 214, 2164–2176, https://doi.org/10.1093/gji/ggy235, 2018.
Vacchi, M., Engelhart, S. E., Nikitina, D., et al.: Postglacial relative sea-level histories along the eastern Canadian coastline, QSR, 201, 124–146, https://doi.org/10.1016/j.quascirev.2018.09.043, 2018.
Whitehouse, P. L.: Glacial isostatic adjustment modelling: historical perspectives, recent advances, and future directions, Earth Surface Dynamics, 6, 401–429, https://doi.org/10.5194/esurf-6-401-2018, 2018.

How to cite: Love, R., Ajourlou, P., Parang, S., Milne, G. A., Tarasov, L., and Latychev, K.: Emulating the influence of laterally variable Earth structure in a model of glacial isostatic adjustment, EGU General Assembly 2023, Vienna, Austria, 23–28 Apr 2023, EGU23-7921, https://doi.org/10.5194/egusphere-egu23-7921, 2023.

EGU23-9405 | ECS | Orals | G3.3

Quantifying the Impact of Modern Ice Mass Loss on Crustal Strain and Seismicity across Greenland and the European Arctic 

Sophie Coulson, Matthew Hoffman, Kelian Dascher-Cousineau, Brent Delbridge, Roland Bürgmann, and Joshua Carmichael

Ice mass loss from the Greenland Ice Sheet and Arctic glaciers has accelerated over the last three decades due to rapid changes in Arctic climate. This loss of ice from glaciated areas and redistribution of water across the global oceans creates a complex spatio-temporal pattern of crustal deformation due to the load changes on Earth’s surface. We test whether the resulting strain perturbations from this deformation are large enough to influence seismic activity in the Arctic on decade to century timescales.


Using new ice-mass-loss estimates from radar altimetry for the Greenland Ice Sheet and model reconstructions of glaciers across the European Arctic, we predict gravitationally self-consistent sea level changes across the Arctic over the last three decades. These surface loads are then used as input for our deformation model, developed to calculate strain at depth within the crust, using a Love number formulation for a spherically symmetric Earth. Our global model captures both the near-field effects directly beneath ice centers and deformation across the sea floor, allowing us to fully quantify the spatio-temporal perturbations to the regional strain field created by glacial isostatic adjustment (GIA) processes. Using declustered earthquake catalogs of Arctic earthquake activity over the last three decades, we search for correlation between the earthquake record and our modelled strain perturbations. In particular, we focus our search along the Mid Atlantic Ridge and beneath Greenland. In the former, small magnitude GIA-related strains enhance or counteract rapid tectonic background loading, while in the latter intra-plate setting, GIA processes likely dominate the crustal strain field.


While correlations over the last three decades may not be statistically definitive, this framework also allows for prediction of crustal strain patterns for future ice sheet scenarios, as ice mass loss from Greenland accelerates, and therefore predictions of the likelihood and potential geographic variability of climate-change-induced seismicity in the future.

How to cite: Coulson, S., Hoffman, M., Dascher-Cousineau, K., Delbridge, B., Bürgmann, R., and Carmichael, J.: Quantifying the Impact of Modern Ice Mass Loss on Crustal Strain and Seismicity across Greenland and the European Arctic, EGU General Assembly 2023, Vienna, Austria, 23–28 Apr 2023, EGU23-9405, https://doi.org/10.5194/egusphere-egu23-9405, 2023.

EGU23-9697 | ECS | Orals | G3.3

Constraints of Relative Sea Level Change on the Late Pleistocene Deglaciation History 

Kaixuan Kang and Shijie Zhong

In this study, we examine the relationships among mantle viscosity, ice models and RSL data. We analyzed two widely used ice models, the ANU and ICE-6G ice models, and found significant difference between these two models, suggesting that significant uncertainties exist in ice models. For six RSL datasets covered both the near- and far-field from published works [Peltier et al., 2015; Lambeck et al., 2014, 2017; Vacchi et al., 2018; Engelhart et al., 2012, 2015], we performed forward GIA modelling using a 1-D compressible Earth model to seek the preferred upper and lower mantle viscosities that fit each of the six RSL datasets, for each of these two ice models. Our calculations show that viscosity in the lower mantle is significantly larger than the upper mantle for almost all the pairs of RSL datasets and ice models, but the RSL datasets for North America and Fennoscandia by Peltier et al., [2015] can be matched similarly well with a large parameter space of upper and lower mantle viscosities, both relatively uniform mantle viscosity and with large increase with depth. The preferred mantle viscosity using the ANU ice model and Lambeck et al. [2017] RSL data for North America is in a good agreement with that by Lambeck et al. [2017].    By using the GIA model with the preferred viscosity structures, we constructed the spatial and temporal distributions of misfit to different RSL datasets, for both the ICE-6G and ANU ice models. The misfit patterns for the ANU and ICE-6G ice models do not differ significantly in North America, although these two ice models differ greatly in North America. However, due to relatively small ice volume in ICE-6G, it fails to explain the far-field RSL data, reflecting the so-called “missing ice” problem. Guided by the spatial and temporal misfit patterns, we made initial attempts to modify ICE-6G by adding more ice to the ice model to improve the fit to far-field RSL data. The three modified ICE-6G ice models we consider all significantly improve far-field RSL data, while maintaining or even improving misfit for near field RSL data. This shows the promise with our method in improving ice models and fit to RSL data.

How to cite: Kang, K. and Zhong, S.: Constraints of Relative Sea Level Change on the Late Pleistocene Deglaciation History, EGU General Assembly 2023, Vienna, Austria, 23–28 Apr 2023, EGU23-9697, https://doi.org/10.5194/egusphere-egu23-9697, 2023.

EGU23-10493 | Orals | G3.3 | Highlight

New GNSS Observations of Crustal Deformation due to Ice Mass Loss in the Amundsen Sea Region, Antarctica 

Terry Wilson, Demián Gómez, Peter Matheny, Michael Bevis, William J. Durkin, Eric Kendrick, Stephanie Konfal, and David Saddler

Twelve continuous GNSS systems are deployed on bedrock across the Amundsen Embayment region, spanning the Pine Island, Thwaites and Pope-Smith-Kohler (PSK) glacial drainage network of the West Antarctic Ice Sheet.  Continuous daily position time series for these sites range from 4 to 12 years, yielding reliable crustal motion velocity solutions at these fast-moving bedrock sites. Remarkably, multiple stations record sustained uplift of 40-50 mm/yr.  Maximum uplift defined by the current distribution of sites is centered on the Pope-Smith-Kohler glaciers, where rapid thinning and grounding line retreat is well documented. Horizontal bedrock displacements, which are particularly sensitive to the location of changing surface mass loads, show a clear radial pattern with motion outward away from upstream portions of the Pope/Smith glaciers. Several modeling studies suggest there is a viscous deformation response to this decadal mass loss. Our modeling, however, shows that elastic deformation response explains nearly the entire measured signal at the PSK region sites. We will present new modeling results and discuss implications for ongoing cryosphere-solid Earth interactions.

How to cite: Wilson, T., Gómez, D., Matheny, P., Bevis, M., Durkin, W. J., Kendrick, E., Konfal, S., and Saddler, D.: New GNSS Observations of Crustal Deformation due to Ice Mass Loss in the Amundsen Sea Region, Antarctica, EGU General Assembly 2023, Vienna, Austria, 23–28 Apr 2023, EGU23-10493, https://doi.org/10.5194/egusphere-egu23-10493, 2023.

EGU23-10574 | Orals | G3.3

GLAC3: Joint glaciological model and visco-elastic earth model history matching of the last glacial cycle: Greenland and Antarctica components 

Lev Tarasov, Benoit Lecavalier, Greg Balco, Claus-Dieter Hillenbrand, Glenn Milne, Dave Roberts, and Sarah Woodroffe

We present the Antarctic and Greenland components of an extensive
history matching for last glacial cycle evolution and regional earth
rheology from glaciological modelling with fully coupled regional
visco-elastic glacio-isostatic adjustment.  Of further distinction is
the accounting for model structural uncertainty. The product is a high
variance set of joint chronologies and earth model parameter vectors
that are not inconsistent with available constraints given
observational and model uncertainties.

Ensemble parameters are from Markov Chain Monte Carlo sampling with
Bayesian artificial neural network emulators.  The glaciological model
is the Glacial Systems Model with hybrid shallow shelf and shallow ice
physics and a coupled energy balance climate model. It includes a much
larger set of ensemble parameters (34 and 38 respectively for
Greenland and Antarctica) than other paleo ice sheet models to
facilitate more complete assessment of past ice sheet evolution
uncertainty. The history matching is against a large curated set of
relative sealevel, vertical velocity, cosmogenic age, and marine
constraints as well as the present-day physical and thermal
configuration of the ice sheet.

The careful assessment of uncertainties, breadth of modelled
processes, and sampling approach has resulted in NROY (not ruled out
yet) chronologies and rheological inferences that contradict previous
more limited model-based reconstructions.  For instance, in contrast
to most previous inferences for the Antarctic contribution to the last
glacial maximum (LGM) low-stand (with inferred values of about 10 m ice
equivalent sea-level (mESL), our NROY set includes chronologies with
LGM contributions of up to 23 mESL.  This result represents a
potentially significant contribution towards addressing the challenge
of LGM missing ice.

How to cite: Tarasov, L., Lecavalier, B., Balco, G., Hillenbrand, C.-D., Milne, G., Roberts, D., and Woodroffe, S.: GLAC3: Joint glaciological model and visco-elastic earth model history matching of the last glacial cycle: Greenland and Antarctica components, EGU General Assembly 2023, Vienna, Austria, 23–28 Apr 2023, EGU23-10574, https://doi.org/10.5194/egusphere-egu23-10574, 2023.

EGU23-10729 | Orals | G3.3

Observations and modelling of GIA in the Ross Sea region, Antarctica 

Stephanie Konfal, Terry Wilson, Pippa Whitehouse, Grace Nield, Tim Hermans, Wouter van der Wal, Michael Bevis, Demián Gómez, and Eric Kendrick

ANET-POLENET (Antarctic Network of the Polar Earth Observing Network) bedrock GNSS sites in the Ross Sea region of Antarctica surround an LGM load center in the Siple region of the Ross Embayment and record crustal motion due to GIA.  Rather than a radial pattern of horizontal motion away from the former load, we instead observe three primary patterns of deformation; 1) motions are reversed towards the load in the southern region of the Transantarctic Mountains (TAM), 2) motions are radially away from the load in the Marie Byrd Land (MBL) region, and 3) an overall gradient in motion is present, with magnitudes progressively increasing from East to West Antarctica.  We investigate the effects of alternative Earth model and ice loading scenarios, with the goal of understanding these distinct patterns of horizontal bedrock motion and their drivers. Using GIA models with a range of 1D Earth models, alternative ice loading scenarios for the Wilkes Subglacial Basin (LGM time scale) and the Siple Coast (centennial and millennial time scales) are explored.  We find that no 1D model, regardless of the Earth model and ice loading scenario used, reproduces all three distinct patterns of observed motion at the same time.  For select ice loading scenarios we also examine the influence of more complex rheology by invoking a boundary in Earth properties beneath the Transantarctic Mountains.  This approach accounts for the strong lateral gradient in Earth properties across the continent by effectively separating East and West Antarctica into two different Earth model profiles.  Some of our GIA models utilizing 3D Earth structure reproduce predicted motions that match all three observed patterns of deformation, and we find that a multiple order magnitude of change in upper mantle viscosity between East and West Antarctica is required to fit the observations. 

How to cite: Konfal, S., Wilson, T., Whitehouse, P., Nield, G., Hermans, T., van der Wal, W., Bevis, M., Gómez, D., and Kendrick, E.: Observations and modelling of GIA in the Ross Sea region, Antarctica, EGU General Assembly 2023, Vienna, Austria, 23–28 Apr 2023, EGU23-10729, https://doi.org/10.5194/egusphere-egu23-10729, 2023.

EGU23-13583 | ECS | Orals | G3.3

A generalised Fourier collocation for fast computation of glacial isostatic adjustment 

Jan Swierczek-Jereczek, Marisa Montoya, Javier Blasco, Jorge Alvarez-Solas, and Alexander Robinson

Glacial isostatic adjustment (GIA) represents an important negative feedback on ice-sheet dynamics. The magnitude and time scale of GIA primarily depend on the upper mantle viscosity and the lithosphere thickness. These parameters have been found to vary strongly over the Antarctic continent, showing ranges of 1018 - 1023 Pa s for the viscosity and 30 - 250 km for the lithospheric thickness. Recent studies show that coupling ice-sheet models to 3D GIA models capturing these spatial dependencies results in substantial differences in the evolution of the Antarctic Ice Sheet compared to the use of 1D GIA models, where the solid-Earth parameters are assumed to depend on the latitude but not on the longitude and the depth. However, 3D GIA models are computationally expensive and sometimes require an iterative coupling for the ice sheet and the solid-Earth solutions to converge. As a consequence, their use remains limited, potentially leading to errors in the simulated ice-sheet response and associated sea-level rise projections. Here, we propose to tackle this problem by generalising the Fourier collocation method for solving GIA proposed by Lingle and Clark (1985) and implemented by Bueler et al. (2007). The method allows for an explicit accounting of the effects of spatially heterogeneous viscosity and lithospheric thicknesses and is computationally very efficient. Thus, for a continental domain at relatively high spatial resolution (256 x 256 grid points) and a 1-year time step, the model runs with speeds of ca. 200 simulation years per second on a single CPU, while keeping the error low compared to 3D GIA models. As the time step is small enough, the need of an iterative coupling method is avoided, thus making the model easy to couple with ice-sheet models.

How to cite: Swierczek-Jereczek, J., Montoya, M., Blasco, J., Alvarez-Solas, J., and Robinson, A.: A generalised Fourier collocation for fast computation of glacial isostatic adjustment, EGU General Assembly 2023, Vienna, Austria, 23–28 Apr 2023, EGU23-13583, https://doi.org/10.5194/egusphere-egu23-13583, 2023.

EGU23-14958 | Posters virtual | G3.3

Effect of transient deformation in southeast Greenland 

Valentina R. Barletta, Andrea Bordoni, and Shfaqat Abbas Khan

Recent studies have shown that in the area of the Kangerlussuaq glacier, a large GPS velocities residual after removing predicted purely elastic deformations caused by present-day ice loss suggests the possibility of a fast rebound to little ice age (LIA) deglaciation. We previously investigated this area with a Maxwell viscoelastic rheology Earth model and compared the model predictions with GPS residual. We found a match for a rather thick lithospheric thickness and a rather low mantle viscosity structure beneath SE-Greenland. In this study we are going to examine the effect of a Burger model: 1) we compare the results with those from the Maxwell model and 2) we estimate if and where the differences can be discriminated with observational data.
Maxwell models describe a steady state mantle deformation and they are the most commonly model used in post glacial rebound problems. Burgers models, instead, describe a time-varying mantle deformation, which include an initial fast transient components followed by a steady-state phase of mantle deformation. This kind of transient deformation would allow to reconcile the Earth rebound caused by the Pleistocene deglaciation and the faster rebound caused by the recent LIA deglaciation.
We then analyze several scenarios of ice retreat in the last 2000 years in the fiord in front of Kangerlussuaq glacier, in view of the difference between the two rheologies.

How to cite: Barletta, V. R., Bordoni, A., and Khan, S. A.: Effect of transient deformation in southeast Greenland, EGU General Assembly 2023, Vienna, Austria, 23–28 Apr 2023, EGU23-14958, https://doi.org/10.5194/egusphere-egu23-14958, 2023.

EGU23-15597 | ECS | Orals | G3.3

Lateral and radial viscosity variations beneath Fennoscandia inferred from seismic and MT observations 

Florence Ramirez, Kate Selway, Clinton Conrad, Maxim Smirnov, and Valerie Maupin

Fennoscandia is continuously uplifting in response to past deglaciation, a process known as glacial isostatic adjustment or GIA. One of the factors that controls the uplift rates is the viscosity of the upper mantle, which is difficult to constrain. Here, we reconstruct the upper mantle viscosity structure of Fennoscandia by inferring temperature and water content from seismic and magnetotelluric (MT) data. Using a 1-D MT model for Fennoscandian cratons together with a global seismic model, we infer an upper mantle viscosity range of ~1019 - 1024 Pa·s for 1 – 10 mm grain size, which encompasses the GIA-constrained viscosities of 1020 - 1021 Pa·s. The associated viscosity uncertainties of our calculation are attributed to the uncertainties associated with the geophysical data and unknown grain size. We can obtain tighter constraints if we assume that the Fennoscandian upper mantle is either a wet harzburgite (1019.2 - 1023.5 Pa·s) or a dry pyrolite (1020.0 - 1023.6 Pa·s) below 250 km, where pyrolite is ~10 times more viscous than harzburgite. Furthermore, assuming a constant grain size of either 1 mm or 10 mm reduces the viscosity range by approximately 2 orders of magnitude. In northwestern Fennoscandia, where a high-resolution 2-D resistivity model is available, the calculated viscosities are ~10 - 100  times lower than those for the Fennoscandian craton because the mantle has a higher water content, and both pyrolite and harzburgite must be wet. Overall, our calculated viscosities for Fennoscandia that are constrained from seismic and MT observations agree with the mantle viscosities constrained from GIA. This suggests that geophysical observations can usefully constrain upper mantle viscosity, and its lateral variations, for other parts of the world without GIA constraints.

How to cite: Ramirez, F., Selway, K., Conrad, C., Smirnov, M., and Maupin, V.: Lateral and radial viscosity variations beneath Fennoscandia inferred from seismic and MT observations, EGU General Assembly 2023, Vienna, Austria, 23–28 Apr 2023, EGU23-15597, https://doi.org/10.5194/egusphere-egu23-15597, 2023.

EGU23-17095 | Posters on site | G3.3

Glaciations of the East Siberian Sea 

Aleksey Amantov, Marina Amantova, Lawrence Cathles, and Willy Fjeldskaar

The existence and nature of Quaternary glaciations of the eastern part of the Arctic basin is very far from being solved, and many think glaciations there may been absent or very local, even at the Last Glacial Maximum.  It is unlikely under the conditions of permafrost and low precipitation during MIS 2, that the glaciers would have produced significant topographic relief.  However, significant ice loads will produce a significant isostatic response.  In the area of the Novosibirsk Islands, Holocene changes in sea level and transitions from continental to marine sedimentation indicate differences in emergence over the course of the transgression  that suggest the melting of significant grounded ice masses (e.g. Anisimov et al., 2009). Shorelines deviate from those expected from the hydroisostatic component. The best-fit isostatic model suggests significant LGM ice accumulation close to the ocean in the area of the Henrietta and Jeannette islands of the De Long archipelago in the East Siberian Sea. The uplift deviations in the Zhokhov island district are best matched for an effective elastic lithosphere thickness Te ~40 km. The ice accumulations close to the shelf-ocean margin in the last glaciation seem to also have occurred in earlier glaciations of the region.

Anisimov, M.A., Ivanova, V.V., Pushina, Z.V., Pitulko, V.V. 2009. Lagoon deposits of Zhokhov Island: age, conditions of formation and significance for paleogeographic reconstructions of the Novosibirsk Islands region // Izvestiya RAS, Geographical Series. No. 5. pp. 107-119.

How to cite: Amantov, A., Amantova, M., Cathles, L., and Fjeldskaar, W.: Glaciations of the East Siberian Sea, EGU General Assembly 2023, Vienna, Austria, 23–28 Apr 2023, EGU23-17095, https://doi.org/10.5194/egusphere-egu23-17095, 2023.

EGU23-17255 | Posters virtual | G3.3

Sensitivity of Antarctic GIA correction for GRACE data to viscoelastic Earth structure 

Yoshiya Irie and Jun'ichi Okuno

Changes in Antarctic ice mass have been observed as gravity changes by the Gravity Recovery and Climate Experiment (GRACE) satellites. The gravity signal includes both the component of the ice mass change and the component of the solid Earth response to surface mass change (Glacial Isostatic Adjustment, GIA). Therefore, estimates of the ice mass change from GRACE data require subtraction of the gravity rates predicted by the GIA model (GIA correction).

Antarctica is characterized by lateral heterogeneity in seismic velocity structure. West Antarctica shows relatively low seismic velocities, suggesting low viscosity regions in the upper mantle. On the other hand, East Antarctica shows relatively high seismic velocities, suggesting a thick lithosphere. Here we investigate the dependence of the GIA correction on lithospheric thickness and upper mantle viscosity.

The GIA correction for the average viscoelastic structure of West Antarctica is nearly identical to that for the average viscoelastic structure of East Antarctica. There is a trade-off between the lithospheric thickness and the upper mantle viscosity. This trade-off may reduce the effect of the lateral variations in the Earth’s viscoelastic structure beneath Antarctica on estimates of Antarctic ice mass change.

How to cite: Irie, Y. and Okuno, J.: Sensitivity of Antarctic GIA correction for GRACE data to viscoelastic Earth structure, EGU General Assembly 2023, Vienna, Austria, 23–28 Apr 2023, EGU23-17255, https://doi.org/10.5194/egusphere-egu23-17255, 2023.

The GRACE (Gravity Recovery and Climate Experiment) satellites measure the Earth’s geopotential, and we can use this data to monitor spatiotemporal mass load changes in Earth's ice sheets. The geopotential measurements are both resolution-limited by the orbital configurations and subject to the complexities of present-day sea level change; for example, when an ice sheet melts, the accompanying migration of water should lead to a systematic bias in GRACE estimates of ice mass loss (Sterenborg et al., 2013). Indeed, using mascons and an iterative approach, Sutterley et al. (2020) found that variations in regional sea level affect ice sheet mass balance estimates in Greenland and in Antarctica by approximately 5%. Here, we use the sea level equation in our inferences of ice-mass loss both to increase the resolution of those inferences and to include the sea-level response in the analysis of GRACE data. We will test the resolution, implementation, accuracy, and impacts of a constrained least squares inversion of GRACE data. We will then investigate how deformation associated with our estimates of ongoing global surface mass change affects Earth-model inferences from geodetic data and Glacial Isostatic Adjustment modeling, with a focus region of Fennoscandia.

How to cite: Powell, E. and Davis, J.: Using the sea level equation to increase the resolution of GRACE inferences: Implications for studies of Fennoscandian GIA, EGU General Assembly 2023, Vienna, Austria, 23–28 Apr 2023, EGU23-17418, https://doi.org/10.5194/egusphere-egu23-17418, 2023.

CL6 – Short Courses

CC BY 4.0